Indicate by check mark whether the registrant is a large accelerated filer, an accelerated filer, a non-accelerated filer, smaller reporting company, or an emerging growth company. See the definitions of “large accelerated filer,” “accelerated filer,” “smaller reporting company,” and “emerging growth company” in Rule 12b-2 of the Exchange Act. (Check one):
Indicate the number of shares outstanding of each of the issuer’s classes of common stock, as of the latest practicable date.
MYLAN N.V. AND SUBSIDIARIES
MYLAN N.V. AND SUBSIDIARIES
MYLAN N.V. AND SUBSIDIARIES
MYLAN N.V. AND SUBSIDIARIES
No significant revisions were made to the methodology used in determining these provisions or the nature of the provisions during the ninethree and six months ended SeptemberJune 30, 2017.2019. Such allowances were $1.92 billion and $2.05 billioncomprised of the following at SeptemberJune 30, 20172019 and December 31, 2016, respectively. Other current liabilities include $808.9 million and $809.0 million at September 30, 2017 and December 31, 2016, respectively, for certain sales allowances and other adjustments that are settled in cash.2018, respectively:
The following table summarizes stock option and SAR (together, “stock awards”) activity:
The Company sponsors various defined benefit pension plans in several countries. Benefits provided generally depend on length of service, pay grade and remuneration levels. The Company maintains two fully frozen defined benefit pension plans in the U.S., and employees in the U.S. and Puerto Rico are generally provided retirement benefits through defined contribution plans.
The Company also sponsors other postretirement benefit plans including plans that provide for postretirement supplemental medical coverage. Benefits from these plans are provided to employees and their spouses and dependents who meet various minimum age and service requirements. In addition, the Company sponsors other plans that provide for life insurance benefits and postretirement medical coverage for certain officers and management employees.
The Company is making the minimum mandatory contributions to its U.S. defined benefit pension plans in the 20172019 plan year. The Company expects to make total benefit payments of approximately $30.4$33.7 million from pension and other postretirement benefit plans.plans in 2019. The Company anticipates making contributions to pension and other postretirement benefit plans of approximately $30.2$29.3 million in 2017.2019.
Prepaid expenses consist primarily of prepaid rent, insurance and other individually insignificant items.
Summarized financial information, in the aggregate, for the Company’s significant equity method investments on a 100% basis for the three and ninesix months ended SeptemberJune 30, 20172019 and 20162018 are as follows:
Additional stock awards and restricted stock awards were outstanding during the three and ninesix months ended SeptemberJune 30, 20172019 and 2016,2018, but were not included in the computation of diluted (loss) earnings per ordinary share for each respective period because the effect would be anti-dilutive. Excluded shares at SeptemberJune 30, 20172019 include certain share-based compensation awards and restricted ordinary shares whose performance conditions had not been fully met. Such excluded shares and anti-dilutive awards represented 8.910.6 million shares and 8.69.7 million shares for the three and ninesix months ended SeptemberJune 30, 2017,2019, respectively and 13.99.2 million shares and 7.38.7 million shares for the three and ninesix months ended SeptemberJune 30, 2016,2018, respectively.
____________
| |
(1) | The reclassifications in the year-to-datereclassification between segments realigns certain prior period relateforeign currency translation amounts to the allocation of goodwill for the Meda acquisition.conform to current year presentation. |
Intangible assets consist of the following components at SeptemberJune 30, 20172019 and December 31, 2016:2018:
|
| | | | | | | | | | | | | |
| (In millions) | Weighted Average Life (Years) | | Original Cost | | Accumulated Amortization | | Net Book Value |
| September 30, 2017 | | | | | | | |
| Amortized intangible assets: | | | | | | | |
| Product rights and licenses | 15 | | $ | 19,193.0 |
| | $ | 4,947.7 |
| | $ | 14,245.3 |
|
| Patents and technologies | 20 | | 116.7 |
| | 112.0 |
| | 4.7 |
|
Other (1) | 6 | | 505.3 |
| | 404.1 |
| | 101.2 |
|
| | | | 19,815.0 |
| | 5,463.8 |
| | 14,351.2 |
|
| In-process research and development | | | 919.3 |
| | — |
| | 919.3 |
|
| | | | $ | 20,734.3 |
| | $ | 5,463.8 |
| | $ | 15,270.5 |
|
| December 31, 2016 | | | | | | | |
| Amortized intangible assets: | | | | | | | |
| Product rights and licenses | 15 | | $ | 16,968.4 |
| | $ | 3,585.7 |
| | $ | 13,382.7 |
|
| Patents and technologies | 20 | | 116.6 |
| | 108.5 |
| | 8.1 |
|
Other (1) | 6 | | 465.9 |
| | 330.0 |
| | 135.9 |
|
| | | | 17,550.9 |
| | 4,024.2 |
| | 13,526.7 |
|
| In-process research and development | | | 921.1 |
| | — |
| | 921.1 |
|
| | | | $ | 18,472.0 |
| | $ | 4,024.2 |
| | $ | 14,447.8 |
|
|
| | | | | | | | | | | | | |
| (In millions) | Weighted Average Life (Years) | | Original Cost | | Accumulated Amortization | | Net Book Value |
| June 30, 2019 | | | | | | | |
Product rights, licenses and other (1) | 15 | | $ | 20,472.3 |
| | $ | 7,985.8 |
| | $ | 12,486.5 |
|
| In-process research and development | | | 244.2 |
| | — |
| | 244.2 |
|
| | | | $ | 20,716.5 |
| | $ | 7,985.8 |
| | $ | 12,730.7 |
|
| December 31, 2018 | | | | | | | |
Product rights, licenses and other (1) | 15 | | $ | 20,264.1 |
| | $ | 7,225.1 |
| | $ | 13,039.0 |
|
| In-process research and development | | | 625.6 |
| | — |
| | 625.6 |
|
| | | | $ | 20,889.7 |
| | $ | 7,225.1 |
| | $ | 13,664.6 |
|
| |
(1) | Represents amortizable intangible assets. Other intangible assets consistconsists principally of customer lists and contractual rights and other contracts.rights. |
In December 2011, the Company completed the acquisition of the exclusive worldwide rights to develop, manufacture and commercialize a generic equivalent to GlaxoSmithKline’s Advair® Diskus and Seretide® Diskus incorporating Pfizer
MYLAN N.V. AND SUBSIDIARIES
Notes to Condensed Consolidated Financial Statements (Unaudited) - Continued
Inc.’s proprietary dry powder inhaler delivery platform (the “respiratory delivery platform”). The Company accounted for this transaction as a purchase of a business and utilized the acquisition method of accounting. In conjunction with the Company’s Generic Drug User Fee Agreement goal date, on March 28, 2017,On January 30, 2019, the Company received a complete response letter fromFDA approval of WixelaTM InhubTM (fluticasone propionate and salmeterol inhalation powder, USP) and the FDA regarding its Abbreviated New Drug Application (“ANDA”) forcommercial launch occurred in February 2019. The Company reclassified the respiratory delivery platform. As of September 30, 2017, the Company has an IPR&D asset of $347.2 million to product rights and licenses during the three months ended March 31, 2019 and began amortizing the asset over its estimated useful life.
As of June 30, 2019, the Company has a related contingent consideration liability of $361.0$247.9 million. During the six months ended June 30, 2019, the Company made $67.5 million in milestone payments. The Company performed an analysis and valuation of the IPR&D asset and the fair value of the related contingent consideration liability using a discounted cash flow model. The model containedcontains certain key assumptions including: the expected product launch date,market share, the number of competitors, the timing of competition and a discount factor based on an industry specific weighted average cost of capital. Based on the analysis performed, the Company determined that the IPR&D asset was not impaired at September 30, 2017. Additionally, norecorded fair value adjustment was required for the contingent considerationadjustments of $24.8 million and $28.9 million, respectively, during the three and six months ended SeptemberJune 30, 2017. In2019 to reduce the second quarter
MYLAN N.V. AND SUBSIDIARIES
Notes to Condensed Consolidated Financial Statements (Unaudited) - Continued
contingent consideration liability resulting in a gain of approximately $88.1 million based upon changes to assumptions relating to the timing of the product launch along with other competitive and market factors.liability. The fair value of the contingent consideration liability was determined based upon detailed valuations employing the income approach which utilized Level 3 inputs, as defined in Note 11 - 12 Financial Instruments and Risk Management. Resolution of the matters with the FDA, marketMarket conditions and other factors may result in significant future changes in the projections and assumptions utilized in the discounted cash flow model, which could lead to material adjustments to the amountsamount recorded for IPR&D and contingent consideration.
During the three and six months ended June 30, 2017,2019, the Company performed its annualrecognized impairment reviewcharges of its IPR&D assets acquired as part of the Topicals Business$40.4 million and recorded an impairment charge in the amount of $13.0$69.9 million, respectively, which hashave been recorded as a component of amortization expense, infor the nine months ended September 30, 2017.impairment of certain finite-lived and IPR&D intangible assets acquired as part of the acquisition of the non-sterile, topicals-focused business of Renaissance Acquisition Holdings, LLC. The impairment chargecharges resulted from the Company’s updated estimate of the fair value of thesecertain assets, which waswere based upon updatedrevised forecasts and future development plans, compared withplans. The impairment testing involved calculating the assigned fair values asvalue of the acquisition date, June 15, 2016. The fair value was determinedassets based upon detailed valuations employing the income approach which utilized Level 3 inputs, as defined in Note 11 - 12 Financial Instruments and Risk Management. These valuations reflect, among other things, the impact of changes to the development programs, the projected development and regulatory time frames and the current competitive environment. Changes in any of the Company’s assumptions may result in a further reduction to the estimated fair values of these IPR&D assets and could result in additional future impairment charges.
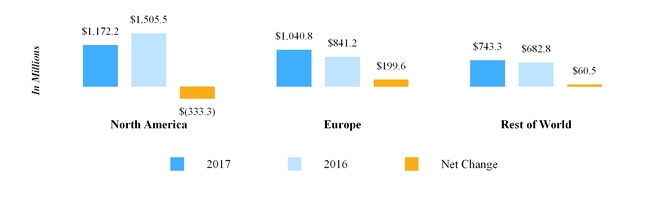
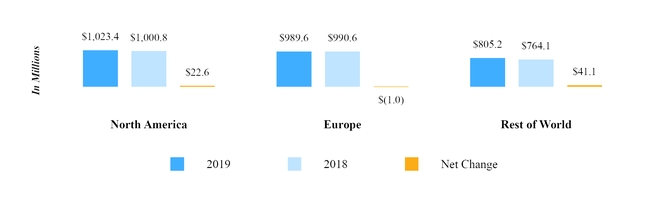
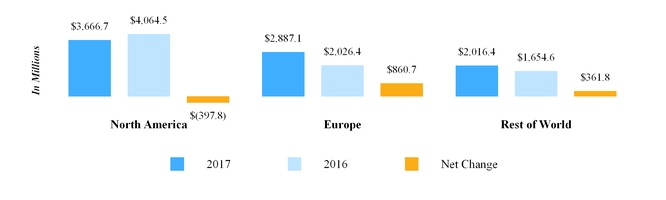
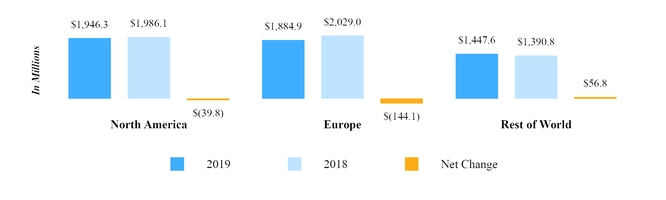
The Company has performed its annual goodwill impairment test as of April 1, 20172019 on a quantitative basis for its four reporting units, North America Generics, North America Specialty,Brands, Europe and Rest of World. In estimating each reporting unit’s fair value, the Company performed an extensive valuation analysis, utilizing both income and market-based approaches, except for the North America Brands reporting unit where the fair value was estimated utilizing the income approach. The determination of the fair value of the reporting units requires the Company to make significant estimates and assumptions that affect the reporting unit’s expected future cash flows. These estimates and assumptions, utilizing Level 3 inputs, primarily include, but are not limited to, market multiples, control premiums, the discount rate, terminal growth rates, operating income before depreciation and amortization, and capital expenditures forecasts.
As of April 1, 2019, the date of our most recent annual impairment test, the allocation of the Company’s total goodwill was as follows: North America Generics $2.89$2.67 billion, North America Specialty $0.35Brands $0.65 billion, Europe $4.30$4.56 billion and Rest of World $1.79$1.72 billion. The
As of April 1, 2019, the Company determined that the fair value of the North America Generics, North America SpecialtyBrands and Rest of World reporting units was substantially in excess of the respective unit’s carrying value. value. However, when compared to the prior year, the fair value of our overall business declined because of our recent operating results, future forecasts and the decline in our share price, including activity subsequent to April 1, 2019.
For the Europe reporting unit, the estimated fair value exceeded its carrying value by approximately $800$900.0 million or 6%7.0%. The excess fair value over the carrying value declined from the prior year primarily as a result of an increase in the discount rate utilized in the income approach from 8.5% to 9.0% and an increase in the estimated tax rate from 22.0% to 24.0%. Additionally, the net assets acquired as part of the Meda acquisition, the majority of which were allocated tofor the Europe reporting unit were included inis consistent with the April 1, 2017result of the Company’s 2018 annual impairment test for the first time.test. As it relates to the income approach for the Europe reporting unit at April 1, 2017,2019, the Company forecasted cash flows for the next 5 years. During the forecast period, the revenue compound annual growth rate was approximately 4%6.5%. A terminal value year was calculated with a 2.0% revenue growth rate applied. The discount rate utilized was 10.5% and the estimated tax rate was 24.0%. Under the market-based approach, we utilized an estimated range of market multiples of 9.08.0 to 10.59.5 times EBITDA plus a control premium of 15%15.0%. If all other assumptions are held constant, a reduction in the terminal value growth rate by 2.0% or an increase in discount rate by 1.5% would result in an impairment charge for the Europe reporting unit.
In estimating each reporting unit’s fair value, the Company performed an extensive valuation analysis, utilizing both income and market-based approaches. The determination of the fair value of the reporting units requires the Companyus to make significant estimates and assumptions that affect the reporting unit’s expected future cash flows. These estimates and assumptions utilizing Level 3 inputs, primarily include, but are not limited to, market multiples, control premiums, the discount rate, terminal growth rates, operating income before depreciation and amortization, and capital expenditures forecasts. Due to the inherent uncertainty involved in making these estimates, actual results could differ from those estimates. In addition, changes in underlying assumptions, especially as it relates to the key assumptions detailed, could have a significant impact on the fair value of the reporting units.
MYLAN N.V. AND SUBSIDIARIES
Notes to Condensed Consolidated Financial Statements (Unaudited) - Continued
Amortization expense, which is classified primarily within cost of sales in the Condensed Consolidated Statementscondensed consolidated statements of Operationsoperations for the three and ninesix months ended SeptemberJune 30, 20172019 and 20162018 totaled:
|
| | | | | | | | | | | | | | | |
| | Three Months Ended | | Six Months Ended |
| | June 30, | | June 30, |
| (In millions) | 2019 | | 2018 | | 2019 | | 2018 |
| Intangible asset amortization expense | $ | 399.2 |
| | $ | 387.4 |
| | $ | 804.7 |
| | $ | 779.7 |
|
| IPR&D intangible asset impairment charges | — |
| | 42.0 |
| | 29.5 |
| | 72.0 |
|
| Finite-lived intangible asset impairment charges | 40.4 |
| | — |
| | 40.4 |
| | — |
|
| Total intangible asset amortization expense (including impairment charges) | $ | 439.6 |
| | $ | 429.4 |
| | $ | 874.6 |
| | $ | 851.7 |
|
|
| | | | | | | | | | | | | | | |
| | Three Months Ended | | Nine Months Ended |
| | September 30, | | September 30, |
| (In millions) | 2017 | | 2016 | | 2017 | | 2016 |
| Intangible asset amortization expense | $ | 369.4 |
| | $ | 364.3 |
| | $ | 1,065.6 |
| | $ | 852.9 |
|
Intangible asset amortization expense over the remainder of 20172019 and for the years ended December 31, 20182020 through 20212023 is estimated to be as follows:
|
| | | |
| (In millions) | |
| 2019 | $ | 785 |
|
| 2020 | 1,465 |
|
| 2021 | 1,386 |
|
| 2022 | 1,315 |
|
| 2023 | 1,153 |
|
|
| | | |
| (In millions) | |
| 2017 | $ | 339 |
|
| 2018 | 1,341 |
|
| 2019 | 1,248 |
|
| 2020 | 1,129 |
|
| 2021 | 1,050 |
|
| |
11.12. | Financial Instruments and Risk Management |
The Company is exposed to certain financial risks relating to its ongoing business operations. The primary financial risks that are managed by using derivative instruments are foreign currency risk and interest rate risk.
Foreign Currency Risk Management
In order to manage certain foreign currency risks, the Company enters into foreign exchange forward contracts to mitigate risk associated with changes in spot exchange rates of mainly non-functional currency denominated assets or liabilities. The foreign exchange forward contracts are measured at fair value and reported as current assets or current liabilities on the Condensed Consolidated Balance Sheetscondensed consolidated balance sheets. Any gains or losses on the foreign exchange forward contracts are recognized in earnings in the period incurred in the Condensed Consolidated Statementscondensed consolidated statements of Operationsoperations.
The Company has also entered into forward contracts to hedge forecasted foreign currency denominated sales from certain international subsidiaries. These contracts are designated as cash flow hedges to manage foreign currency transaction risk and are measured at fair value and reported as current assets or current liabilities on the Condensed Consolidated Balance Sheetscondensed consolidated balance sheets. Any changes in the fair value of designated cash flow hedges are includeddeferred in earnings or deferred through accumulated other comprehensive earnings (“AOCE”), depending on and are reclassified into earnings when the naturehedged item impacts earnings.
Net Investment Hedges
The Company may hedge the foreign currency risk associated with certain net investment positions in foreign subsidiaries by either borrowing directly in foreign currencies and effectivenessdesignating all or a portion of the offset. Any ineffectiveness inforeign currency debt as a cash flow hedging relationship is recognized immediately in earnings inhedge of the Condensed Consolidated Statementsapplicable net investment position or entering into foreign currency swaps that are designated as hedges of Operations.net investments.
During the nine months ended September 30, 2017, theThe Company has designated certain Euro borrowings as a hedge of its investment in certain Euro-functional currency subsidiaries in order to manage foreign currency translation risk. The notional amount of the net investment hedges was €1.9 billion and consisted of €1.0 billion aggregate principal amount of the 2.250% Euro Senior Notes due 2024 (the “2024 Euro Notes”), €750 million aggregate principal amount of 3.125% Euro Senior Notes due 2028 (the “2028 Euro Notes”) and €104 million of the €750 million aggregate principal amount of the 1.250% Euro Senior Notes due 2020 (the “2020 Euro Notes”).
Borrowings designated as net investment hedges are marked to marketmarked-to-market using the current spot exchange rate as of the end of the period, with gains and losses included in the foreign currency translation component of AOCE until the sale or substantial liquidation of the underlying net investments. The Company recorded no ineffectiveness from its net investment hedges for the nine months ended September 30, 2017. In addition, the Company manages the related foreign exchange risk of the €500 million aggregate principal amount of floating rate Senior Notes due 2018 (the “2018 Floating Rate Euro Notes”), €500 million aggregate principal amount of the Floating Rate Senior Notes due 2020 (the “2020 Floating Rate Euro Notes”) and the remaining portion of the 2020 Euro Notesborrowings not designated as net investment hedges through certain Euro denominated financial assets and forward contracts.currency swaps.
MYLAN N.V. AND SUBSIDIARIES
Notes to Condensed Consolidated Financial Statements (Unaudited) - Continued
The following table summarizes the principal amounts of the Company’s outstanding Euro borrowings and the notional amounts of the Euro borrowings designated as net investment hedges:
|
| | | | | | | | | | | | |
| | | | Notional Amount Designated as a Net Investment Hedge |
| (in millions) | | Principal Amount | | June 30,
2019 | | December 31,
2018 |
| 2.250% Euro Senior Notes due 2024 | | € | 1,000.0 |
| | € | 1,000.0 |
| | € | 1,000.0 |
|
| 3.125% Euro Senior Notes due 2028 | | 750.0 |
| | 750.0 |
| | 750.0 |
|
| 1.250% Euro Senior Notes due 2020 | | 750.0 |
| | 104.0 |
| | 104.0 |
|
| 2.125% Euro Senior Notes due 2025 | | 500.0 |
| | 500.0 |
| | 500.0 |
|
| Floating Rate Euro Notes due 2020 | | 500.0 |
| | — |
| | — |
|
| Total | | € | 3,500.0 |
| | € | 2,354.0 |
| | € | 2,354.0 |
|
Interest Rate Risk Management
The Company enters into interest rate swaps in order to manage interest rate risk associated with the Company’s fixed-rate and floating-rate debt. TheseInterest rate swaps that meet specific accounting criteria are accounted for as fair value or cash flow hedges. All derivative instruments used to manage interest rate risk are measured at fair value and reported as current assets or current liabilities in the Condensed Consolidated Balance Sheetscondensed consolidated balance sheets.
Cash Flow Hedging Relationships
The Company’s interest rate swaps designated as cash flow hedges fix the interest rate on a portion of the Company’s variable-rate debt or hedge part of the Company’s interest rate exposure associated with variability in future cash flows attributable to changes in interest rates or foreign currencies. Any changes in fair value are included in earnings or deferred through AOCE, depending on the nature and effectiveness of the offset. Any ineffectiveness in a cash flow hedging relationship is recognized immediately in earnings in the Condensed Consolidated Statements of Operations.
Fair Value Hedging Relationships
The Company’s interest rate swaps designated as For fair value hedges, convert the fixed rate on a portion of the Company’s fixed-rate senior notes to a variable rate. Any changes in the fair value of these derivative instruments, as well asboth the offsettinghedging instrument and the underlying debt obligations are included in interest expense. For cash flow hedges, the change in fair value of the portion ofhedging instrument is deferred through AOCE and is reclassified into earnings when the fixed-rate debt being hedged is included in interest expense.item impacts earnings.
Credit Risk Management
The Company regularly reviews the creditworthiness of its financial counterparties and does not expect to incur a significant loss from the failure of any counterparties to perform under any agreements. The Company is not subject to any obligations to post collateral under derivative instrument contracts. Certain derivative instrument contracts entered into by the Company are governed by master agreements, which contain credit-risk-related contingent features that would allow the counterparties to terminate the contracts early and request immediate payment should the Company trigger an event of default on other specified borrowings. The Company records all derivative instruments on a gross basis in the Condensed Consolidated Balance Sheetscondensed consolidated balance sheets. Accordingly, there are no offsetting amounts that net assets against liabilities.
The Effect of Derivative Instruments on theCondensed Consolidated Balance Sheetscondensed consolidated balance sheets
Fair Values of Derivative Instruments
Derivatives Designated as Hedging Instruments
|
| | | | | | | | | | | |
| | Asset Derivatives |
| | June 30, 2019 | | December 31, 2018 |
| (In millions) | Balance Sheet Location | | Fair Value | | Balance Sheet Location | | Fair Value |
| Interest rate swaps | Prepaid expenses and other current assets | | $ | 24.6 |
| | Prepaid expenses and other current assets | | $ | 3.6 |
|
| Foreign currency forward contracts | Prepaid expenses and other current assets | | 18.0 |
| | Prepaid expenses and other current assets | | — |
|
| Total | | | $ | 42.6 |
| | | | $ | 3.6 |
|
|
| | | | | | | | | | | |
| | Asset Derivatives |
| | September 30, 2017 | | December 31, 2016 |
| (In millions) | Balance Sheet Location | | Fair Value | | Balance Sheet Location | | Fair Value |
| Interest rate swaps | Prepaid expenses and other current assets | | $ | 25.3 |
| | Prepaid expenses and other current assets | | $ | 26.2 |
|
| Foreign currency forward contracts | Prepaid expenses and other current assets | | 43.8 |
| | Prepaid expenses and other current assets | | 21.9 |
|
| Total | | | $ | 69.1 |
| | | | $ | 48.1 |
|
22 |
| | | | | | | | | | | |
| | Liability Derivatives |
| | June 30, 2019 | | December 31, 2018 |
| (In millions) | Balance Sheet Location | | Fair Value | | Balance Sheet Location | | Fair Value |
| Foreign currency forward contracts | Other current liabilities | | — |
| | Other current liabilities | | 12.1 |
|
| Total | | | $ | — |
| | | | $ | 12.1 |
|
MYLAN N.V. AND SUBSIDIARIES
Notes to Condensed Consolidated Financial Statements (Unaudited) - Continued
The Effect of Derivative Instruments on theCondensed Consolidated Balance Sheetscondensed consolidated balance sheets
Fair Values of Derivative Instruments
Derivatives Not Designated as Hedging Instruments
| | | | Asset Derivatives | Asset Derivatives |
| | September 30, 2017 | | December 31, 2016 | June 30, 2019 | | December 31, 2018 |
| (In millions) | Balance Sheet Location | | Fair Value | | Balance Sheet Location | | Fair Value | Balance Sheet Location | | Fair Value | | Balance Sheet Location | | Fair Value |
| Foreign currency forward contracts | Prepaid expenses and other current assets | | $ | 13.4 |
| | Prepaid expenses and other current assets | | $ | 14.0 |
| Prepaid expenses and other current assets | | $ | 11.7 |
| | Prepaid expenses and other current assets | | $ | 30.2 |
|
| Total | | $ | 13.4 |
| | $ | 14.0 |
| | $ | 11.7 |
| | $ | 30.2 |
|
|
| | | | | | | | | | | |
| | Liability Derivatives |
| | June 30, 2019 | | December 31, 2018 |
| (In millions) | Balance Sheet Location | | Fair Value | | Balance Sheet Location | | Fair Value |
| Foreign currency forward contracts | Other current liabilities | | $ | 26.1 |
| | Other current liabilities | | $ | 17.3 |
|
| Total | | | $ | 26.1 |
| | | | $ | 17.3 |
|
|
| | | | | | | | | | | |
| | Liability Derivatives |
| | September 30, 2017 | | December 31, 2016 |
| (In millions) | Balance Sheet Location | | Fair Value | | Balance Sheet Location | | Fair Value |
| Foreign currency forward contracts | Other current liabilities | | $ | 10.1 |
| | Other current liabilities | | $ | 15.3 |
|
| Total | | | $ | 10.1 |
| | | | $ | 15.3 |
|
The Effect of Derivative Instruments on theCondensed Consolidated Statementscondensed consolidated statements of Operationsoperations
Derivatives in Fair Value Hedging Relationships
| | | | Location of Gain (Loss) Recognized in Earnings on Derivatives | | Amount of Gain (Loss) Recognized in Earnings on Derivatives | Location of Gain (Loss) Recognized in Earnings on Derivatives | | Amount of Gain (Loss) Recognized in Earnings on Derivatives |
| (In millions) | | Three Months Ended | | Nine Months Ended | | Three Months Ended | | Six Months Ended |
Location of Gain (Loss) Recognized in Earnings on Derivatives | September 30, | | September 30, | Location of Gain (Loss) Recognized in Earnings on Derivatives | June 30, | | June 30, |
| 2017 | | 2016 | | 2017 | | 2016 | 2019 | | 2018 | | 2019 | | 2018 |
| Interest rate swaps | Interest expense | $ | (2.5 | ) | | $ | (9.7 | ) | | $ | (1.0 | ) | | $ | 30.2 |
| Interest expense | $ | 13.5 |
| | $ | (6.3 | ) | | $ | 21.0 |
| | $ | (22.3 | ) |
| Total | | $ | (2.5 | ) | | $ | (9.7 | ) | | $ | (1.0 | ) | | $ | 30.2 |
| | $ | 13.5 |
| | $ | (6.3 | ) | | $ | 21.0 |
| | $ | (22.3 | ) |
|
| | | | | | | | | | | | | | | | | |
| | Location of Gain (Loss) Recognized in Earnings on Hedged Items | | Amount of Gain (Loss) Recognized in Earnings on Hedged Items |
| (In millions) | | Three Months Ended | | Six Months Ended |
| | June 30, | | June 30, |
| | 2019 | | 2018 | | 2019 | | 2018 |
| 2023 Senior Notes (3.125% coupon) | Interest expense | | $ | (13.5 | ) | | $ | 6.3 |
| | $ | (21.0 | ) | | $ | 22.3 |
|
| Total | | | $ | (13.5 | ) | | $ | 6.3 |
| | $ | (21.0 | ) | | $ | 22.3 |
|
|
| | | | | | | | | | | | | | | | | |
| | Location of Gain (Loss) Recognized in Earnings on Hedged Items | | Amount of Gain (Loss) Recognized in Earnings on Hedged Items |
| (In millions) | | Three Months Ended | | Nine Months Ended |
| | September 30, | | September 30, |
| | 2017 | | 2016 | | 2017 | | 2016 |
| 2023 Senior Notes (3.125% coupon) | Interest expense | | $ | 2.5 |
| | $ | 9.7 |
| | $ | 1.0 |
| | $ | (30.2 | ) |
| Total | | | $ | 2.5 |
| | $ | 9.7 |
| | $ | 1.0 |
| | $ | (30.2 | ) |
The Effect of Derivative Instruments on theCondensed Consolidated Statementscondensed consolidated statements of Comprehensive Earningscomprehensive earnings
Derivatives in Cash Flow Hedging Relationships
|
| | | | | | | | | | | | | | | | |
| | | Amount of Gain (Loss) Recognized in AOCE (Net of Tax) on Derivative |
| | | Three Months Ended | | Six Months Ended |
| | | June 30, | | June 30, |
| (In millions) | | 2019 | | 2018 | | 2019 | | 2018 |
| Foreign currency forward contracts | | $ | 3.8 |
| | $ | (38.7 | ) | | $ | 19.3 |
| | $ | (53.8 | ) |
| Total | | $ | 3.8 |
| | $ | (38.7 | ) | | $ | 19.3 |
| | $ | (53.8 | ) |
|
| | | | | | | | | | | | | | | | |
| | | Amount of Gain (Loss) Recognized in AOCE (Net of Tax) on Derivative (Effective Portion) |
| | | Three Months Ended | | Nine Months Ended |
| | | September 30, | | September 30, |
| (In millions) | | 2017 | | 2016 | | 2017 | | 2016 |
| Foreign currency forward contracts | | $ | (8.8 | ) | | $ | 2.9 |
| | $ | 7.5 |
| | $ | (16.3 | ) |
| Interest rate swaps | | (3.3 | ) | | (0.9 | ) | | (2.0 | ) | | (38.0 | ) |
| Total | | $ | (12.1 | ) | | $ | 2.0 |
| | $ | 5.5 |
| | $ | (54.3 | ) |
MYLAN N.V. AND SUBSIDIARIES
Notes to Condensed Consolidated Financial Statements (Unaudited) - Continued
The Effect of Derivative Instruments on theCondensed Consolidated Statementscondensed consolidated statements of Comprehensive Earningscomprehensive earnings
Derivatives in Net Investment Hedging Relationships
|
| | | | | | | | | | | | | | | | |
| | | Amount of Gain (Loss) Recognized in AOCE
(Net of Tax) on Derivative |
| | | Three Months Ended | | Six Months Ended |
| | | June 30, | | June 30, |
| (In millions) | | 2019 | | 2018 | | 2019 | | 2018 |
| Foreign currency borrowings and forward contracts | | $ | (34.5 | ) | | $ | 119.0 |
| | $ | 20.7 |
| | $ | 59.8 |
|
| Total | | $ | (34.5 | ) | | $ | 119.0 |
| | $ | 20.7 |
| | $ | 59.8 |
|
|
| | | | | | | | | | | | | | | | |
| | | Amount of Gain (Loss) Recognized in AOCE
(Net of Tax) on Derivative
(Effective Portion) |
| | | Three Months Ended | | Nine Months Ended |
| | | September 30, | | September 30, |
| (In millions) | | 2017 | | 2016 | | 2017 | | 2016 |
| Foreign currency borrowings and forward contracts | | $ | (72.1 | ) | | $ | (8.1 | ) | | $ | (203.2 | ) | | $ | (8.1 | ) |
| Total | | $ | (72.1 | ) | | $ | (8.1 | ) | | $ | (203.2 | ) | | $ | (8.1 | ) |
The Effect of Derivative Instruments on theCondensed Consolidated Statementscondensed consolidated statements of Operationsoperations
Derivatives in Cash Flow Hedging Relationships
| | | | Location of Gain (Loss) Reclassified from AOCE into Earnings (Effective Portion) | | Amount of Gain (Loss) Reclassified from AOCE into Earnings (Effective Portion) | Location of Gain (Loss) Reclassified from AOCE into Earnings (Effective Portion) | | Amount of Gain (Loss) Reclassified from AOCE into Earnings |
| | | Three Months Ended | | Nine Months Ended | | Three Months Ended | | Six Months Ended |
| | | September 30, | | September 30, | | June 30, | | June 30, |
| (In millions) | | 2017 | | 2016 | | 2017 | | 2016 | | 2019 | | 2018 | | 2019 | | 2018 |
| Foreign currency forward contracts | Net sales | | $ | 2.0 |
| | $ | (10.7 | ) | | $ | (3.8 | ) | | $ | (34.2 | ) | Net sales | | $ | (1.9 | ) | | $ | 2.4 |
| | $ | (1.6 | ) | | $ | 7.2 |
|
| Interest rate swaps | Interest expense | | (1.9 | ) | | (2.3 | ) | | (5.5 | ) | | (6.6 | ) | Interest expense | | (1.8 | ) | | (1.9 | ) | | (3.6 | ) | | (3.8 | ) |
| Total | | $ | 0.1 |
| | $ | (13.0 | ) | | $ | (9.3 | ) | | $ | (40.8 | ) | | $ | (3.7 | ) | | $ | 0.5 |
| | $ | (5.2 | ) | | $ | 3.4 |
|
|
| | | | | | | | | | | | | | | | | |
| | Location of Gain (Loss) Excluded from the Assessment of Hedge Effectiveness | | Amount of Gain (Loss) Excluded from the Assessment of Hedge Effectiveness |
| | | Three Months Ended | | Nine Months Ended |
| | | September 30, | | September 30, |
| (In millions) | | 2017 | | 2016 | | 2017 | | 2016 |
| Foreign currency forward contracts | Other expense, net | | $ | 3.3 |
| | $ | 8.9 |
| | $ | 6.9 |
| | $ | 26.0 |
|
| Total | | | $ | 3.3 |
| | $ | 8.9 |
| | $ | 6.9 |
| | $ | 26.0 |
|
At SeptemberJune 30, 20172019, the Company expects that approximately $11$36.0 million of pre-tax net gainslosses on cash flow hedges will be reclassified from AOCE into earnings during the next twelve months.
The Effect of Derivative Instruments on theCondensed Consolidated Statementscondensed consolidated statements of Operationsoperations
Derivatives Not Designated as Hedging Instruments
|
| | | | | | | | | | | | | | | | | |
| | Location of Gain (Loss) Recognized in Earnings on Derivatives | | Amount of Gain (Loss) Recognized in Earnings on Derivatives |
| | | Three Months Ended | | Six Months Ended |
| | | June 30, | | June 30, |
| (In millions) | | 2019 | | 2018 | | 2019 | | 2018 |
| Foreign currency option and forward contracts | Other expense, net | | $ | (21.7 | ) | | $ | (16.4 | ) | | $ | (27.5 | ) | | $ | 27.6 |
|
| Total | | | $ | (21.7 | ) | | $ | (16.4 | ) | | $ | (27.5 | ) | | $ | 27.6 |
|
|
| | | | | | | | | | | | | | | | | |
| | Location of Gain (Loss) Recognized in Earnings on Derivatives | | Amount of Gain (Loss) Recognized in Earnings on Derivatives |
| | | Three Months Ended | | Nine Months Ended |
| | | September 30, | | September 30, |
| (In millions) | | 2017 | | 2016 | | 2017 | | 2016 |
| Foreign currency option and forward contracts | Other expense, net | | $ | (43.0 | ) | | $ | (36.8 | ) | | $ | (60.1 | ) | | $ | (98.3 | ) |
| Total | | | $ | (43.0 | ) | | $ | (36.8 | ) | | $ | (60.1 | ) | | $ | (98.3 | ) |
MYLAN N.V. AND SUBSIDIARIES
Notes to Condensed Consolidated Financial Statements (Unaudited) - Continued
Fair Value Measurement
Fair value is based on the price that would be received from the sale of an identical asset or paid to transfer an identical liability in an orderly transaction between market participants at the measurement date. In order to increase consistency and comparability in fair value measurements, a fair value hierarchy has been established that prioritizes observable and unobservable inputs used to measure fair value into three broad levels, which are described below:
| |
| • | Level 1: Quoted prices (unadjusted) in active markets that are accessible at the measurement date for identical assets or liabilities. The fair value hierarchy gives the highest priority to Level 1 inputs. |
| |
| • | Level 2: Observable market-based inputs other than quoted prices in active markets for identical assets or liabilities. |
| |
| • | Level 3: Unobservable inputs are used when little or no market data is available. The fair value hierarchy gives the lowest priority to Level 3 inputs. |
Level 1: Quoted prices (unadjusted) in active markets that are accessible at the measurement date for identical assets or liabilities. The fair value hierarchy gives the highest priority27
MYLAN N.V. AND SUBSIDIARIES
Notes to Level 1 inputs.Condensed Consolidated Financial Statements (Unaudited) - Continued
Level 2: Observable market-based inputs other than quoted prices in active markets for identical assets or liabilities.
Level 3: Unobservable inputs are used when little or no market data is available. The fair value hierarchy gives the lowest priority to Level 3 inputs.
In determining fair value, the Company utilizes valuation techniques that maximize the use of observable inputs and minimize the use of unobservable inputs to the extent possible, as well as considers counterparty credit risk in its assessment of fair value.
Financial assets and liabilities carried at fair value are classified in the tables below in one of the three categories described above:
| | | | September 30, 2017 | June 30, 2019 |
| (In millions) | Level 1 | | Level 2 | | Level 3 | | Total | Level 1 | | Level 2 | | Level 3 | | Total |
| Recurring fair value measurements | | | | | | | | | | | | | | |
| Financial Assets | | | | | | | | | | | | | | |
| Cash equivalents: | | | | | | | | | | | | | | |
| Money market funds | $ | 170.8 |
| | $ | — |
| | $ | — |
| | $ | 170.8 |
| $ | 56.3 |
| | $ | — |
| | $ | — |
| | $ | 56.3 |
|
| Total cash equivalents | 170.8 |
| | — |
| | — |
| | 170.8 |
| 56.3 |
| | — |
| | — |
| | 56.3 |
|
| Trading securities: | | | | | | | | |
| Equity securities — exchange traded funds | 32.7 |
| | — |
| | — |
| | 32.7 |
| |
| Total trading securities | 32.7 |
| | — |
| | — |
| | 32.7 |
| |
| Equity securities: | | | | | | | | |
| Exchange traded funds | | 36.0 |
| | — |
| | — |
| | 36.0 |
|
| Marketable securities | | 0.7 |
| | — |
| | — |
| | 0.7 |
|
| Total equity securities | | 36.7 |
| | — |
| | — |
| | 36.7 |
|
| Available-for-sale fixed income investments: | | | | | | | | | | | | | | |
| Corporate bonds | — |
| | 17.0 |
| | — |
| | 17.0 |
| — |
| | 11.0 |
| | — |
| | 11.0 |
|
| U.S. Treasuries | — |
| | 7.4 |
| | — |
| | 7.4 |
| — |
| | 9.0 |
| | — |
| | 9.0 |
|
| Agency mortgage-backed securities | — |
| | 4.3 |
| | — |
| | 4.3 |
| — |
| | 1.9 |
| | — |
| | 1.9 |
|
| Asset backed securities | — |
| | 1.9 |
| | — |
| | 1.9 |
| — |
| | 3.5 |
| | — |
| | 3.5 |
|
| Other | — |
| | 1.7 |
| | — |
| | 1.7 |
| — |
| | 1.0 |
| | — |
| | 1.0 |
|
| Total available-for-sale fixed income investments | — |
| | 32.3 |
| | — |
| | 32.3 |
| — |
| | 26.4 |
| | — |
| | 26.4 |
|
| Available-for-sale equity securities: | | | | | | | | |
| Marketable securities | 55.3 |
| | — |
| | — |
| | 55.3 |
| |
| Total available-for-sale equity securities | 55.3 |
| | — |
| | — |
| | 55.3 |
| |
| Foreign exchange derivative assets | — |
| | 57.2 |
|
| — |
|
| 57.2 |
| — |
| | 29.7 |
|
| — |
|
| 29.7 |
|
| Interest rate swap derivative assets | — |
| | 25.3 |
| | — |
| | 25.3 |
| — |
| | 24.6 |
| | — |
| | 24.6 |
|
| Total assets at recurring fair value measurement | $ | 258.8 |
|
| $ | 114.8 |
|
| $ | — |
|
| $ | 373.6 |
| $ | 93.0 |
|
| $ | 80.7 |
|
| $ | — |
|
| $ | 173.7 |
|
| Financial Liabilities | | | | | | | | | | | | | | |
| Foreign exchange derivative liabilities | $ | — |
| | $ | 10.1 |
| | $ | — |
| | $ | 10.1 |
| — |
| | 26.1 |
| | — |
| | 26.1 |
|
| Contingent consideration | — |
| | — |
| | 471.1 |
| | 471.1 |
| — |
| | — |
| | 266.7 |
| | 266.7 |
|
| Total liabilities at recurring fair value measurement | $ | — |
| | $ | 10.1 |
| | $ | 471.1 |
| | $ | 481.2 |
| $ | — |
| | $ | 26.1 |
| | $ | 266.7 |
| | $ | 292.8 |
|
MYLAN N.V. AND SUBSIDIARIES
Notes to Condensed Consolidated Financial Statements (Unaudited) - Continued
|
| | | | | | | | | | | | | | | |
| | December 31, 2018 |
| (In millions) | Level 1 | | Level 2 | | Level 3 | | Total |
| Recurring fair value measurements | | | | | | | |
| Financial Assets | | | | | | | |
| Cash equivalents: | | | | | | | |
| Money market funds | $ | 71.0 |
| | $ | — |
| | $ | — |
| | $ | 71.0 |
|
| Total cash equivalents | 71.0 |
| | — |
| | — |
| | 71.0 |
|
| Equity securities: | | | | | | | |
| Exchange traded funds | 31.7 |
| | — |
| | — |
| | 31.7 |
|
| Marketable securities | 0.8 |
| | — |
| | — |
| | 0.8 |
|
| Total equity securities | 32.5 |
| | — |
| | — |
| | 32.5 |
|
| Available-for-sale fixed income investments: | | | | | | | |
| Corporate bonds | — |
| | 9.9 |
| | — |
| | 9.9 |
|
| U.S. Treasuries | — |
| | 9.4 |
| | — |
| | 9.4 |
|
| Agency mortgage-backed securities | — |
| | 1.6 |
| | — |
| | 1.6 |
|
| Asset backed securities | — |
| | 3.2 |
| | — |
| | 3.2 |
|
| Other | — |
| | 0.9 |
| | — |
| | 0.9 |
|
| Total available-for-sale fixed income investments | — |
| | 25.0 |
| | — |
| | 25.0 |
|
| Foreign exchange derivative assets | — |
| | 30.2 |
| | — |
| | 30.2 |
|
| Interest rate swap derivative assets | — |
| | 3.6 |
| | — |
| | 3.6 |
|
| Total assets at recurring fair value measurement | $ | 103.5 |
| | $ | 58.8 |
| | $ | — |
| | $ | 162.3 |
|
| Financial Liabilities | | | | | | | |
| Foreign exchange derivative liabilities | $ | — |
| | $ | 29.4 |
| | $ | — |
| | $ | 29.4 |
|
| Contingent consideration | — |
| | — |
| | 355.3 |
| | 355.3 |
|
| Total liabilities at recurring fair value measurement | $ | — |
| | $ | 29.4 |
| | $ | 355.3 |
| | $ | 384.7 |
|
|
| | | | | | | | | | | | | | | |
| | December 31, 2016 |
| (In millions) | Level 1 | | Level 2 | | Level 3 | | Total |
| Recurring fair value measurements | | | | | | | |
| Financial Assets | | | | | | | |
| Cash equivalents: | | | | | | | |
| Money market funds | $ | 433.7 |
| | $ | — |
| | $ | — |
| | $ | 433.7 |
|
| Total cash equivalents | 433.7 |
| | — |
| | — |
| | 433.7 |
|
| Trading securities: | | | | | | | |
| Equity securities — exchange traded funds | 29.6 |
| | — |
| | — |
| | 29.6 |
|
| Total trading securities | 29.6 |
| | — |
| | — |
| | 29.6 |
|
| Available-for-sale fixed income investments: | | | | | | | |
| Corporate bonds | — |
| | 17.5 |
| | — |
| | 17.5 |
|
| U.S. Treasuries | — |
| | 6.0 |
| | — |
| | 6.0 |
|
| Agency mortgage-backed securities | — |
| | 4.0 |
| | — |
| | 4.0 |
|
| Asset backed securities | — |
| | 1.6 |
| | — |
| | 1.6 |
|
| Other | — |
| | 2.3 |
| | — |
| | 2.3 |
|
| Total available-for-sale fixed income investments | — |
| | 31.4 |
| | — |
| | 31.4 |
|
| Available-for-sale equity securities: | | | | | | | |
| Marketable securities | 52.3 |
| | — |
| | — |
| | 52.3 |
|
| Total available-for-sale equity securities | 52.3 |
| | — |
| | — |
| | 52.3 |
|
| Foreign exchange derivative assets | — |
| | 35.9 |
| | — |
| | 35.9 |
|
| Interest rate swap derivative assets | — |
| | 26.2 |
| | — |
| | 26.2 |
|
| Total assets at recurring fair value measurement | $ | 515.6 |
| | $ | 93.5 |
| | $ | — |
| | $ | 609.1 |
|
| Financial Liabilities | | | | | | | |
| Foreign exchange derivative liabilities | $ | — |
| | $ | 15.3 |
| | $ | — |
| | $ | 15.3 |
|
| Contingent consideration | — |
| | — |
| | 564.6 |
| | 564.6 |
|
| Total liabilities at recurring fair value measurement | $ | — |
| | $ | 15.3 |
| | $ | 564.6 |
| | $ | 579.9 |
|
For financial assets and liabilities that utilize Level 2 inputs, the Company utilizes both direct and indirect observable price quotes, including the LIBORLondon Interbank Offered Rate (“LIBOR”) yield curve, foreign exchange forward prices and bank price quotes. Below is a summary of valuation techniques for Level 1 and Level 2 financial assets and liabilities:
| |
| • | Cash equivalents — valued at observable net asset value prices. |
| |
| • | Equity securities, exchange traded funds — valued at the active quoted market prices from broker or dealer quotations or transparent pricing sources at the reporting date. Unrealized gains and losses attributable to changes in fair value are included in other expense, net, in the condensed consolidated statements of operations. |
| |
| • | Equity securities, marketable securities — valued using quoted stock prices from public exchanges at the reporting date. Unrealized gains and losses attributable to changes in fair value are included in other expense, net, in the condensed consolidated statements of operations. |
| |
| • | Available-for-sale fixed income investments — valued at the quoted market prices from broker or dealer quotations or transparent pricing sources at the reporting date. Unrealized gains and losses attributable to changes in fair value, net of income taxes, are included in accumulated other comprehensive loss as a component of shareholders’ equity. |
| |
| • | Foreign exchange derivative assets and liabilities — valued using quoted forward foreign exchange prices and spot rates at the reporting date. Counterparties to these contracts are highly rated financial institutions. |
| |
| • | Interest rate swap derivative assets and liabilities — valued using the LIBOR/EURIBOR yield curves at the reporting date. Counterparties to these contracts are highly rated financial institutions. |
Cash equivalents — valued at observable net asset value prices.
Trading securities — valued at the active quoted market prices from broker or dealer quotations or transparent pricing sources at the reporting date.
Available-for-sale fixed income investments — valued at the quoted market prices from broker or dealer quotations or transparent pricing sources at the reporting date.
Available-for-sale equity securities — valued using quoted stock prices from public exchanges at the reporting date.
Foreign exchange derivative assets and liabilities — valued using quoted forward foreign exchange prices and spot rates at the reporting date. Counterparties to these contracts are highly rated financial institutions.
Interest rate swap derivative assets and liabilities — valued using the LIBOR/EURIBOR yield curves at the reporting date. Counterparties to these contracts are highly rated financial institutions.
MYLAN N.V. AND SUBSIDIARIES
Notes to Condensed Consolidated Financial Statements (Unaudited) - Continued
Contingent Consideration
The fair value measurement of contingent consideration is determined using Level 3 inputs. The Company’s contingent consideration represents a component of the total purchase consideration for the respiratory delivery platform the acquisition of Agila Specialties Private Limited (“Agila”), the acquisition of certain female healthcare businesses from Famy Care Limited (such businesses “Jai Pharma Limited”), the acquisition of the Topicals Business and certain other acquisitions. The measurement is calculated using unobservable inputs based on the Company’s own assumptions. For the respiratory delivery platform, Jai Pharma Limited, the Topicals Business and certain other acquisitions, significant unobservable inputs in the valuation include the probability and timing of future development and commercial milestones and future profit sharing payments. When valuing the contingent consideration related to the respiratory delivery platform, and Jai Pharma Limited, the value of the obligations areis derived from a probability assessment based on expectations of when certain milestones or profit share payments occur which are discounted using a market rate of return. At SeptemberJune 30, 20172019 and December 31, 2016,2018, discount rates ranging from 0.5%11.0% to 10.0%11.5% were utilized in the valuations. Significant changes in unobservable inputs could result in material changes to the contingent consideration liability.
A rollforward of the activity in the Company’s fair value of contingent consideration from December 31, 20162018 to SeptemberJune 30, 20172019 is as follows:
| | | (In millions) | Current Portion (1) | | Long-Term Portion (2) | | Total Contingent Consideration | Current Portion (1) | | Long-Term Portion (2) | | Total Contingent Consideration |
| Balance at December 31, 2016 | $ | 256.9 |
| | $ | 307.7 |
| | $ | 564.6 |
| |
| Balance at December 31, 2018 | | $ | 158.3 |
| | $ | 197.0 |
| | $ | 355.3 |
|
| Payments | (36.1 | ) | | (0.2 | ) | | (36.3 | ) | (67.5 | ) | | — |
| | (67.5 | ) |
| Reclassifications | (38.5 | ) | | 38.5 |
| | — |
| 6.8 |
| | (6.8 | ) | | — |
|
| Accretion | — |
| | 20.8 |
| | 20.8 |
| — |
| | 7.8 |
| | 7.8 |
|
Fair value adjustments (3) | (62.9 | ) | | (15.1 | ) | | (78.0 | ) | |
| Balance at September 30, 2017 | $ | 119.4 |
| | $ | 351.7 |
| | $ | 471.1 |
| |
Fair value loss (gain) (3) | | 3.5 |
| | (32.4 | ) | | (28.9 | ) |
| Balance at June 30, 2019 | | $ | 101.1 |
| | $ | 165.6 |
| | $ | 266.7 |
|
| |
(1) | Included in other current liabilities on the Condensed Consolidated Balance Sheets.condensed consolidated balance sheets. |
| |
(2) | Included in other long-term obligations on the Condensed Consolidated Balance Sheets.condensed consolidated balance sheets. |
| |
(3) | Included in litigation settlements and other contingencies, net in the Condensed Consolidated Statementscondensed consolidated statements of Operations.operations. |
2017 Significant Changes to Contingent Consideration: During the nine months ended September 30, 2017, the Company recorded a fair value gain of $88.1 million related to the respiratory delivery platform contingent consideration offset by a fair value loss of $9.9 million related to Jai Pharma Limited contingent consideration. In addition, the Company made payments of approximately $12.5 million related to the Agila contingent consideration and payments of approximately $20.0 million related to the Jai Pharma Limited contingent consideration.
Although the Company has not elected the fair value option for other financial assets and liabilities, any future transacted financial asset or liability will be evaluated for the fair value election.
Short-Term Borrowings
|
| | | | | | | |
| (In millions) | June 30,
2019 | | December 31,
2018 |
| Commercial paper notes | $ | 25.0 |
| | $ | — |
|
| Other | 1.2 |
| | 1.9 |
|
| Short-term borrowings | $ | 26.2 |
| | $ | 1.9 |
|
Receivables Facility
On April 25, 2019, the Company entered into an amendment to its $400 million Receivables Facility to extend its expiration date to April 22, 2022.
Under the terms of the Receivables Facility, our subsidiary, MPI, sells certain accounts receivable to Mylan Securitization LLC (“Mylan Securitization”), a wholly-owned special purpose entity which in turn sells a percentage ownership interest in the receivables to financial institutions and commercial paper conduits sponsored by financial institutions. Mylan Securitization’s assets have been pledged to MUFG Bank, Ltd., as agent, in support of its obligations under the Receivables Facility. Any amounts outstanding under the facility are recorded as borrowings and the underlying receivables are included in accounts receivable, net, in the condensed consolidated balance sheets of the Company.
MYLAN N.V. AND SUBSIDIARIES
Notes to Condensed Consolidated Financial Statements (Unaudited) - Continued
Long-Term Debt
A summaryNote Securitization Facility
On April 25, 2019, the Company entered into an additional facility for borrowings up to $200 million (the “Note Securitization Facility”). Under the terms of
long-term debteach of the Receivables Facility and Note Securitization Facility, certain of our accounts receivable secure the amounts borrowed and cannot be used to pay our other debts or liabilities. The amount that we may borrow at a given point in time is
determined based on the amount of qualifying accounts receivable that are present at such point in time. Borrowings outstanding under the Receivables Facility bear interest at a commercial paper rate plus 0.775% and under the Note Securitization Facility at LIBOR plus 0.75% and are included as
follows: |
| | | | | | | | | | |
| (In millions) | Interest Rate as of September 30, 2017 | | September 30,
2017 | | December 31,
2016 |
| Current portion of long-term debt: | | | | | |
| Meda 2.0kr billion Term Loan | | | $ | — |
| | $ | 219.6 |
|
2018 Senior Notes * | 2.600 | % | | 649.8 |
| | — |
|
| Meda Medium Term Notes due 2018 | 2.356 | % | | 72.2 |
| | — |
|
| Other | | | 2.2 |
| | 3.7 |
|
| Deferred financing fees | | | (1.4 | ) | | — |
|
| Current portion of long-term debt | | | $ | 722.8 |
| | $ | 223.3 |
|
| | | | | | |
| Non-current portion of long-term debt: | | | | | |
2016 Term Loans due 2019(a) ** | 2.610 | % | | $ | 100.0 |
| | $ | 1,600.0 |
|
| Meda Medium Term Notes due 2019 | 1.173 | % | | 91.4 |
| | 146.4 |
|
2018 Floating Rate Euro Notes(b) ** | 0.541 | % | | 590.7 |
| | 526.0 |
|
2018 Senior Notes * | 2.600 | % | | — |
| | 649.6 |
|
2018 Senior Notes ** | 3.000 | % | | 499.7 |
| | 499.6 |
|
2019 Senior Notes ** | 2.500 | % | | 999.4 |
| | 999.1 |
|
2019 Senior Notes * | 2.550 | % | | 499.6 |
| | 499.5 |
|
2020 Floating Rate Euro Notes(c) ** | 0.172 | % | | 590.7 |
| | — |
|
2020 Euro Senior Notes ** | 1.250 | % | | 883.1 |
| | 785.7 |
|
2020 Senior Notes ** | 3.750 | % | | 499.9 |
| | 499.9 |
|
2021 Senior Notes ** | 3.150 | % | | 2,248.0 |
| | 2,247.7 |
|
2023 Senior Notes * | 3.125 | % | | 774.4 |
| | 775.3 |
|
2023 Senior Notes * | 4.200 | % | | 498.7 |
| | 498.6 |
|
2024 Euro Senior Notes ** | 2.250 | % | | 1,178.6 |
| | 1,049.2 |
|
2026 Senior Notes ** | 3.950 | % | | 2,234.6 |
| | 2,233.5 |
|
2028 Euro Senior Notes ** | 3.125 | % | | 877.7 |
| | 781.1 |
|
2043 Senior Notes * | 5.400 | % | | 497.1 |
| | 497.0 |
|
2046 Senior Notes ** | 5.250 | % | | 999.8 |
| | 999.8 |
|
| Other | | | 7.2 |
| | 7.1 |
|
| Deferred financing fees | | | (78.2 | ) | | (92.2 | ) |
| Long-term debt | | | $ | 13,992.4 |
| | $ | 15,202.9 |
|
____________ | |
(a)
| The 2016 Term Loans bear interest at LIBOR plus a base rate, which margins can fluctuate based on the Company’s credit ratings. The Company voluntarily prepaid $400 million of the aggregate principal amount of the 2016 Term Loans in the fourth quarter of 2016. An additional $1.50 billion was voluntarily prepaid during the nine months ended September 30, 2017 utilizing proceeds from the issuance of the 2020 Floating Rate Euro Notesa component of short-term borrowings, while the accounts receivable securing these obligations remain as a component of accounts receivable, net, in our condensed consolidated balance sheets. In addition, the agreements governing the Receivables Facility and cash on-hand. |
| |
(b)
| Instrument bears interest at a rate of three-month EURIBOR plus 0.870% per annum, reset quarterly. |
| |
(c)
| Instrument bears interest at a rate of three-month EURIBOR plus 0.50% per annum, reset quarterly. |
| |
*
| Instrument was issued by Mylan Inc. |
| |
**
| Instrument was issued by Mylan N.V. |
For additional information, see Note 8 Debt in Mylan N.V.’s Annual Report filed on Form 10-K for the year ended December 31, 2016, as amended.Securitization Facility contain various customary affirmative and negative covenants, and customary default and termination provisions.
MYLAN N.V. AND SUBSIDIARIES
Notes to Condensed Consolidated Financial Statements (Unaudited) - Continued
Commercial Paper Program
On June 8, 2017,July 27, 2018, the Company established an unsecured commercial paper program (the “CP“Commercial Paper Program”) pursuant to which the CompanyMylan Inc. may issue short-term, unsecured commercial paper notes (the “CP Notes”) that are guaranteed by the Company pursuant to the exemption from registration contained in Section 4(a)(2) of the Securities Act of 1933, as amended. amended (the “Securities Act”), which replaced Mylan N.V.’s previous commercial paper program established on June 8, 2017 (the “Previous Commercial Paper Program”) on substantially identical terms to the Previous Commercial Paper Program. Amounts available under the Commercial Paper Program may be borrowed, repaid and re-borrowed from time to time, with the aggregate principal amount of the commercial paper notes outstanding under the Commercial Paper Program at any time not to exceed $1.65 billion. The net proceeds of issuances of the CP Notes are expected to be used for general corporate purposes. The Company’s 2018 Revolving Facility (as defined below) will be available to pay the CP Notes, if necessary. The maturities of the CP Notes will vary but will not exceed 364 days from the date of issue.
The Company uses net proceeds from its Commercial Paper Program, Receivables Facility and Note Securitization Facility as a source of liquidity for general corporate purposes, including for business development transactions, working capital and share repurchases. Borrowings under the Commercial Paper Program, Receivables Facility and the Note Securitization Facility may vary during a particular period, as a result of fluctuations in working capital requirements and timing of cash receipts.
MYLAN N.V. AND SUBSIDIARIES
Notes to Condensed Consolidated Financial Statements (Unaudited) - Continued
Long-Term Debt
A summary of long-term debt is as follows:
|
| | | | | | | | | | |
| (In millions) | Interest Rate as of June 30, 2019 | | June 30,
2019 | | December 31,
2018 |
| Current portion of long-term debt: | | | | | |
2016 Term Facility (a) ** | 3.705 | % | | $ | 100.0 |
| | $ | 100.0 |
|
2019 Senior Notes ** | 2.500 | % | | — |
| | 549.9 |
|
2020 Floating Rate Euro Notes (b) ** | | | 568.6 |
| | — |
|
| Other | | | 6.3 |
| | 6.2 |
|
| Deferred financing fees | | | (0.9 | ) | | (0.9 | ) |
| Current portion of long-term debt | | | $ | 674.0 |
| | $ | 655.2 |
|
| | | | | | |
| Non-current portion of long-term debt: | | | | | |
2020 Floating Rate Euro Notes (b) ** | | | $ | — |
| | $ | 573.3 |
|
2020 Euro Senior Notes ** | 1.250 | % | | 851.7 |
| | 858.1 |
|
2020 Senior Notes ** | 3.750 | % | | 500.0 |
| | 499.9 |
|
2021 Senior Notes ** | 3.150 | % | | 2,248.9 |
| | 2,248.7 |
|
2023 Senior Notes * | 3.125 | % | | 774.0 |
| | 752.9 |
|
2023 Senior Notes * | 4.200 | % | | 499.0 |
| | 498.9 |
|
2024 Euro Senior Notes ** | 2.250 | % | | 1,135.2 |
| | 1,144.2 |
|
2025 Euro Senior Notes * | 2.125 | % | | 567.5 |
| | 572.0 |
|
2026 Senior Notes ** | 3.950 | % | | 2,237.3 |
| | 2,236.5 |
|
2028 Euro Senior Notes ** | 3.125 | % | | 845.9 |
| | 852.5 |
|
2028 Senior Notes * | 4.550 | % | | 748.3 |
| | 748.2 |
|
2043 Senior Notes * | 5.400 | % | | 497.2 |
| | 497.2 |
|
2046 Senior Notes ** | 5.250 | % | | 999.8 |
| | 999.8 |
|
2048 Senior Notes * | 5.200 | % | | 747.7 |
| | 747.6 |
|
| Other | | | 4.3 |
| | 5.1 |
|
| Deferred financing fees | | | (66.7 | ) | | (73.7 | ) |
| Long-term debt | | | $ | 12,590.1 |
| | $ | 13,161.2 |
|
| |
(a) | The 2016 Term Facility bears interest at LIBOR plus a base rate, which margins can fluctuate based on the Company’s credit ratings. |
| |
(b) | Instrument bears interest at a rate of three-month EURIBOR plus 0.50% per annum, reset quarterly. |
| |
* | Instrument was issued by Mylan Inc. |
| |
** | Instrument was issued by Mylan N.V. |
For additional information, see Note 129 Debt in the Company’s Quarterly Report filed onMylan N.V.’s 2018 Form 10-Q for the quarter ended June 30, 2017. At September 30, 2017, the Company had no amounts outstanding under the CP program.10-K.
2016 Revolving Facility, Receivables2018 Revolving Facility and 2016 Term Facility
At September 30, 2017 and December 31,On November 22, 2016, the Company had no amounts outstanding under the $2.0 billionentered into a revolving credit facility among the Company, as borrower, Mylan Inc., as a guarantor, certain lenders and issuing banks and Bank of America, N.A., as the administrative agent, pursuant to which the Company may obtain extensions of credit in an aggregate principal amount not to exceed $2.0 billion (the “2016 Revolving Facility”). On the same day, the Company entered into a term credit facility among the Company, as borrower, Mylan Inc., as a guarantor, certain lenders and had no short-term borrowings underGoldman Sachs Bank USA, as administrative agent, pursuant to which the $400 million Receivables Facility in the
MYLAN N.V. AND SUBSIDIARIES
Notes to Condensed Consolidated Balance Sheets. At September 30, 2017, the Financial Statements (Unaudited) - Continued
Company had $100has outstanding $100.0 million outstanding under the $2.0 billionin term credit facilityloans (the “2016 Term Facility”). For additional information, see Note 8 Debt at June 30, 2019. On July 27, 2018, the Company entered into a revolving credit facility among Mylan Inc., as borrower, the Company, as a guarantor, certain lenders and issuing banks and Bank of America, N.A., as the administrative agent, which replaced the 2016 Revolving Facility on substantially identical terms to the 2016 Revolving Facility and pursuant to which Mylan Inc. may obtain extensions of credit in an aggregate principal amount not to exceed $2.0 billion (the “2018 Revolving Facility”).
The Company’s 2016 Term Facility and 2018 Revolving Facility each contains customary affirmative covenants for facilities of this type, including among others, covenants pertaining to the Company’s Annual Report fileddelivery of financial statements, notices of default and certain material events, maintenance of corporate existence and rights, property, and insurance and compliance with laws, as well as customary negative covenants for facilities of this type, including limitations on Form 10-K for the year ended December 31, 2016, as amended.incurrence of subsidiary indebtedness, liens, mergers and certain other fundamental changes, investments and loans, acquisitions, transactions with affiliates, payments of dividends and other restricted payments and changes in our lines of business.
The 2016 Term Facility and 20162018 Revolving Facility contain a maximum consolidated leverage ratio financial covenant requiring maintenance of a maximum ratio of 3.75 to 1.00 for consolidated total indebtedness as of the end of any quarter to consolidated EBITDA for the trailing four quarters as defined in the related credit agreements (“leverage ratio”). The
On February 22, 2019, the Company, is in compliance at September 30, 2017.
Followingas a guarantor, and Mylan Inc., as borrower, entered into an amendment (the "Revolving Loan Amendment") to the Meda acquisition (a qualifying acquisition), the leverage ratio changed to 4.25 to 1.00 through June 30, 2017. On November 3, 2017,2018 Revolving Facility. In addition, on February 22, 2019, the Company entered into amendmentsan amendment (the "Term Loan Amendment") to the agreements for the 2016 Term FacilityFacility. The Revolving Loan Amendment and 2016 Revolving Facility to extendthe Term Loan Amendment extended the leverage ratio covenant of 4.25 to 1.00 through the December 31, 20182019 reporting period. The Company is in compliance at June 30, 2019 and expects to remain in compliance for the next twelve months.
Euro Notes
On May 24, 2017, the Company completed its offering of €500 million aggregate principal amount of 2020 Floating Rate Euro Notes. For additional information, see Note 12Debt in the Company’s Quarterly Report filed on Form 10-Q for the quarter ended June 30, 2017.
During the nine months ended September 30, 2017, the Company recorded mark-to-market losses related to the 2018 Floating Rate Euro Notes, 2020 Floating Rate Euro Notes, 2020 Euro Notes, 2024 Euro Notes and 2028 Euro Notes of approximately $64.8 million, $36.2 million, $97.1 million, $129.5 million and $97.1 million, respectively. Refer to Note 11Financial Instruments and Risk Management for further discussion of the foreign currency risk management of these instruments.
Fair Value
At SeptemberJune 30, 20172019 and December 31, 2016,2018, the aggregate fair value of the Company’s 2.600% Senior Notes due 2018, 3.000% Senior Notes due 2018, 2.500% Senior Notes due 2019, 2.550% Senior Notes due 2019, 3.750% Senior Notes due 2020, 3.150% Senior Notes due 2021, 3.125% Senior Notes due 2023, 4.200% Senior Notes due 2023, 3.950% Senior Notes due 2026, 5.400% Senior Notes due 2043 and 5.250% Senior Notes due 2046 (collectively, the “Senior Notes”), 1.250% Euro Senior Notes due 2020, 2.250% Euro Senior Notes due in 2024, 3.125% Euro Senior Notes due in 2028, 2018 Floating Rate Euro Notes and 2020 Floating Rate Euro Notes (collectively, the “Euro Notes”)outstanding notes was approximately $15.0$13.0 billion and $13.2$13.1 billion, respectively. The fair values of the Senior Notes and Euro Notesoutstanding notes were valued at quoted market prices from broker or dealer quotations and were classified as Level 2 in the fair value hierarchy. Based on quoted market rates of interest and maturity schedules of similar debt issues, the fair valuesvalue of the Company’s 2016 Term Loans and the Meda borrowings,Facility determined based on Level 2 inputs, approximate theirapproximates its carrying valuesvalue at SeptemberJune 30, 20172019 and December 31, 2016.2018.
Mandatory minimum repayments remaining on the notional amount of outstanding long-term debt at June 30, 2019 were as follows for each of the periods ending December 31:
29 |
| | | |
| (In millions) | Total |
| 2019 | $ | 100 |
|
| 2020 | 1,922 |
|
| 2021 | 2,250 |
|
| 2022 | — |
|
| 2023 | 1,250 |
|
| Thereafter | 7,808 |
|
| Total | $ | 13,330 |
|
MYLAN N.V. AND SUBSIDIARIES
Notes to Condensed Consolidated Financial Statements (Unaudited) - Continued
Mandatory minimum repayments remaining on the notional amount of outstanding long-term debt at September 30, 2017 are as follows for each of the periods ending December 31:
|
| | | |
| (In millions) | Total |
| 2017 | $ | — |
|
| 2018 | 1,813 |
|
| 2019 | 1,691 |
|
| 2020 | 1,977 |
|
| 2021 | 2,250 |
|
| Thereafter | 7,068 |
|
| Total | $ | 14,799 |
|
| |
13.14. | Comprehensive Earnings |
Accumulated other comprehensive loss, as reflected on the Condensed Consolidated Balance Sheets,condensed consolidated balance sheets, is comprised of the following:
| | | (In millions) | September 30,
2017 | | December 31,
2016 | June 30,
2019 | | December 31,
2018 |
| Accumulated other comprehensive loss: | | | | | | |
| Net unrealized gain on marketable securities, net of tax | $ | 16.6 |
| | $ | 14.5 |
| $ | 0.7 |
| | $ | — |
|
| Net unrecognized gains (losses) and prior service cost related to defined benefit plans, net of tax | 1.4 |
| | (0.5 | ) | |
| Net unrecognized gains and prior service cost related to defined benefit plans, net of tax | | 1.7 |
| | 1.7 |
|
| Net unrecognized losses on derivatives in cash flow hedging relationships, net of tax | (18.8 | ) | | (38.6 | ) | (33.0 | ) | | (53.1 | ) |
| Net unrecognized losses on derivatives in net investment hedging relationships, net of tax | (204.6 | ) | | (1.4 | ) | (110.2 | ) | | (130.9 | ) |
| Foreign currency translation adjustment | (405.8 | ) | | (2,237.7 | ) | (1,400.9 | ) | | (1,259.0 | ) |
| | $ | (611.2 | ) | | $ | (2,263.7 | ) | $ | (1,541.7 | ) | | $ | (1,441.3 | ) |
MYLAN N.V. AND SUBSIDIARIES
Notes to Condensed Consolidated Financial Statements (Unaudited) - Continued
Components of accumulated other comprehensive loss, before tax, consist of the following, for the three and ninesix months endedSeptember June 30, 20172019 and 2016:2018:
|
| | | | | | | | | | | | | | | | | | | | | | | | | | | | | |
| | Three Months Ended September 30, 2017 |
| Gains and Losses on Derivatives in Cash Flow Hedging Relationships | | Gains and Losses on Net Investment Hedges | | Gains and Losses on Marketable Securities | | Defined Pension Plan Items | | Foreign Currency Translation Adjustment | | Totals |
| (In millions) | Foreign Currency Forward Contracts | | Interest Rate Swaps | | Total | | | | | | | | | | |
| Balance at June 30, 2017, net of tax | | | | | $ | (17.1 | ) | | $ | (132.5 | ) | | $ | 22.3 |
| | $ | 0.5 |
| | $ | (828.8 | ) | | $ | (955.6 | ) |
| Other comprehensive (loss) earnings before reclassifications, before tax | | | | | (4.4 | ) | | (72.1 | ) | | (8.9 | ) | | 0.8 |
| | 423.0 |
| | 338.4 |
|
| Amounts reclassified from accumulated other comprehensive earnings (loss), before tax: | | | | | | | | | | | | | | | |
| Loss on foreign exchange forward contracts classified as cash flow hedges, included in net sales | (2.0 | ) | | | | (2.0 | ) | | | | | | | | | | (2.0 | ) |
| Gain on interest rate swaps classified as cash flow hedges, included in interest expense | | | 1.9 |
| | 1.9 |
| | | | | | | | | | 1.9 |
|
| Amortization of prior service costs included in SG&A | | | | | | | | | | | 0.1 |
| | | | 0.1 |
|
| Amortization of actuarial loss included in SG&A | | | | | | | | | | | 0.2 |
| | | | 0.2 |
|
| Net other comprehensive (loss) earnings, before tax | | | | | (4.5 | ) | | (72.1 | ) | | (8.9 | ) | | 1.1 |
| | 423.0 |
| | 338.6 |
|
| Income tax (benefit) provision | | | | | (2.8 | ) | | — |
| | (3.2 | ) | | 0.2 |
| | — |
| | (5.8 | ) |
| Balance at September 30, 2017, net of tax | | | | | $ | (18.8 | ) | | $ | (204.6 | ) | | $ | 16.6 |
| | $ | 1.4 |
| | $ | (405.8 | ) | | $ | (611.2 | ) |
|
| | | | | | | | | | | | | | | | | | | | | | | | | | | | | |
| | Three Months Ended June 30, 2019 |
| Gains and Losses on Derivatives in Cash Flow Hedging Relationships | | Gains and Losses on Net Investment Hedges | | Gains and Losses on Marketable Securities | | Defined Pension Plan Items | | Foreign Currency Translation Adjustment | | Totals |
| (In millions) | Foreign Currency Forward Contracts | | Interest Rate Swaps | | Total | | | | | | | | | | |
| Balance at March 31, 2019, net of tax | | | | | $ | (39.3 | ) | | $ | (75.7 | ) | | $ | 0.4 |
| | $ | 1.6 |
| | $ | (1,597.5 | ) | | $ | (1,710.5 | ) |
| Other comprehensive earnings (loss) before reclassifications, before tax | | | | | 5.7 |
| | (36.3 | ) | | 0.2 |
| | — |
| | 196.6 |
| | 166.2 |
|
| Amounts reclassified from accumulated other comprehensive loss, before tax: | | | | | | | | | | | | | | | — |
|
| Loss on foreign exchange forward contracts classified as cash flow hedges, included in net sales | 1.9 |
| | | | 1.9 |
| | | | | | | | | | 1.9 |
|
| Loss on interest rate swaps classified as cash flow hedges, included in interest expense | | | 1.8 |
| | 1.8 |
| | | | | | | | | | 1.8 |
|
| Amortization of prior service costs included in selling, general and administrative expense (“SG&A”) | | | | | | | | | | | 0.2 |
| | | | 0.2 |
|
| Amortization of actuarial gain included in SG&A | | | | | | | | | | | (0.2 | ) | | | | (0.2 | ) |
| Net other comprehensive earnings (loss), before tax | | | | | 9.4 |
| | (36.3 | ) | | 0.2 |
| | — |
| | 196.6 |
| | 169.9 |
|
| Income tax provision (benefit) | | | | | 3.1 |
| | (1.8 | ) | | (0.1 | ) | | (0.1 | ) | | — |
| | 1.1 |
|
| Balance at June 30, 2019, net of tax | | | | | $ | (33.0 | ) | | $ | (110.2 | ) | | $ | 0.7 |
| | $ | 1.7 |
| | $ | (1,400.9 | ) | | $ | (1,541.7 | ) |
MYLAN N.V. AND SUBSIDIARIES
Notes to Condensed Consolidated Financial Statements (Unaudited) - Continued
|
| | | | | | | | | | | | | | | | | | | | | | | | | | | | | |
| | Six Months Ended June 30, 2019 |
| Gains and Losses on Derivatives in Cash Flow Hedging Relationships | | Gains and Losses on Net Investment Hedges | | Gains and Losses on Marketable Securities | | Defined Pension Plan Items | | Foreign Currency Translation Adjustment | | Totals |
| (In millions) | Foreign Currency Forward Contracts | | Interest Rate Swaps | | Total | | | | | | | | | | |
| Balance at December 31, 2018, net of tax | | | | | $ | (53.1 | ) | | $ | (130.9 | ) | | $ | — |
| | $ | 1.7 |
| | $ | (1,259.0 | ) | | $ | (1,441.3 | ) |
| Other comprehensive earnings (loss) before reclassifications, before tax | | | | | 30.2 |
| | 21.8 |
| | 0.6 |
| | 0.1 |
| | (141.9 | ) | | (89.2 | ) |
| Amounts reclassified from accumulated other comprehensive loss, before tax: | | | | | | | | | | | | | | | |
| Loss on foreign exchange forward contracts classified as cash flow hedges, included in net sales | 1.6 |
| | | | 1.6 |
| | | | | | | | | | 1.6 |
|
| Loss on interest rate swaps classified as cash flow hedges, included in interest expense | | | 3.6 |
| | 3.6 |
| | | | | | | | | | 3.6 |
|
| Amortization of prior service costs included in SG&A | | | | | | | | | | | 0.5 |
| | | | 0.5 |
|
| Amortization of actuarial gain included in SG&A | | | | | | | | | | | (0.4 | ) | | | | (0.4 | ) |
| Net other comprehensive earnings (loss), before tax | | | | | 35.4 |
| | 21.8 |
| | 0.6 |
| | 0.2 |
| | (141.9 | ) | | (83.9 | ) |
| Income tax provision (benefit) | | | | | 11.9 |
| | 1.1 |
| | (0.1 | ) | | — |
| | — |
| | 12.9 |
|
| Cumulative effect of the adoption of new accounting standards | | | | | (3.4 | ) | | — |
| | — |
| | (0.2 | ) | | — |
| | (3.6 | ) |
| Balance at June 30, 2019, net of tax | | | | | $ | (33.0 | ) | | $ | (110.2 | ) | | $ | 0.7 |
| | $ | 1.7 |
| | $ | (1,400.9 | ) | | $ | (1,541.7 | ) |
|
| | | | | | | | | | | | | | | | | | | | | | | | | | | | | |
| | Nine Months Ended September 30, 2017 |
| Gains and Losses on Derivatives in Cash Flow Hedging Relationships | | Gains and Losses on Net Investment Hedges | | Gains and Losses on Marketable Securities | | Defined Pension Plan Items | | Foreign Currency Translation Adjustment | | Totals |
| (In millions) | Foreign Currency Forward Contracts | | Interest Rate Swaps | | Total | | | | | | | | | | |
| Balance at December 31, 2016, net of tax | | | | | $ | (38.6 | ) | | $ | (1.4 | ) | | $ | 14.5 |
| | $ | (0.5 | ) | | $ | (2,237.7 | ) | | $ | (2,263.7 | ) |
| Other comprehensive earnings (loss) before reclassifications, before tax | | | | | 19.9 |
| | (203.2 | ) | | 3.5 |
| | 1.7 |
| | 1,831.9 |
| | 1,653.8 |
|
| Amounts reclassified from accumulated other comprehensive (loss) earnings, before tax: | | | | | | | | | | | | | | | |
| Gain on foreign exchange forward contracts classified as cash flow hedges, included in net sales | 3.8 |
| | | | 3.8 |
| | | | | | | | | | 3.8 |
|
| Gain on interest rate swaps classified as cash flow hedges, included in interest expense | | | 5.5 |
| | 5.5 |
| | | | | | | | | | 5.5 |
|
| Amortization of prior service costs included in SG&A | | | | | | | | | | | 0.2 |
| | | | 0.2 |
|
| Amortization of actuarial loss included in SG&A | | | | | | | | | | | 0.5 |
| | | | 0.5 |
|
| Net other comprehensive earnings (loss), before tax | | | | | 29.2 |
| | (203.2 | ) | | 3.5 |
| | 2.4 |
| | 1,831.9 |
| | 1,663.8 |
|
| Income tax provision | | | | | 9.4 |
| | — |
| | 1.4 |
| | 0.5 |
| | — |
| | 11.3 |
|
| Balance at September 30, 2017, net of tax | | | | | $ | (18.8 | ) | | $ | (204.6 | ) | | $ | 16.6 |
| | $ | 1.4 |
| | $ | (405.8 | ) | | $ | (611.2 | ) |
MYLAN N.V. AND SUBSIDIARIES
Notes to Condensed Consolidated Financial Statements (Unaudited) - Continued
|
| | | | | | | | | | | | | | | | | | | | | | | | | | | | | |
| | Three Months Ended June 30, 2018 |
| Gains and Losses on Derivatives in Cash Flow Hedging Relationships | | Gains and Losses on Net Investment Hedges | | Gains and Losses on Marketable Securities | | Defined Pension Plan Items | | Foreign Currency Translation Adjustment | | Totals |
| (In millions) | Foreign Currency Forward Contracts | | Interest Rate Swaps | | Total | | | | | | | | | | |
| Balance at March 31, 2018, net of tax | | | | | $ | (22.6 | ) | | $ | (299.0 | ) | | $ | (0.2 | ) | | $ | 2.2 |
| | $ | 128.1 |
| | $ | (191.5 | ) |
| Other comprehensive (loss) earnings before reclassifications, before tax | | | | | (61.7 | ) | | 119.1 |
| | 0.3 |
| | 2.7 |
| | (1,088.7 | ) | | (1,028.3 | ) |
| Amounts reclassified from accumulated other comprehensive loss, before tax: | | | | | | | | | | | | | | | |
| Gain on foreign exchange forward contracts classified as cash flow hedges, included in net sales | (2.4 | ) | | | | (2.4 | ) | | | | | | | | | | (2.4 | ) |
| Loss on interest rate swaps classified as cash flow hedges, included in interest expense | | | 1.9 |
| | 1.9 |
| | | | | | | | | | 1.9 |
|
| Amortization of prior service costs included in SG&A | | | | | | | | | | | 0.1 |
| | | | 0.1 |
|
| Amortization of actuarial loss included in SG&A | | | | | | | | | | | — |
| | | | — |
|
| Net other comprehensive (loss) earnings, before tax | | | | | (62.2 | ) | | 119.1 |
| | 0.3 |
| | 2.8 |
| | (1,088.7 | ) | | (1,028.7 | ) |
| Income tax (benefit) provision | | | | | (21.8 | ) | | 0.1 |
| | 0.1 |
| | 0.7 |
| | — |
| | (20.9 | ) |
| Balance at June 30, 2018, net of tax | | | | | $ | (63.0 | ) | | $ | (180.0 | ) | | $ | — |
| | $ | 4.3 |
| | $ | (960.6 | ) | | $ | (1,199.3 | ) |
|
| | | | | | | | | | | | | | | | | | | | | | | | | | | | | |
| | Three Months Ended September 30, 2016 |
| Gains and Losses on Derivatives in Cash Flow Hedging Relationships | | Gains and Losses on Net Investment Hedges | | Gains and Losses on Marketable Securities | | Defined Pension Plan Items | | Foreign Currency Translation Adjustment | | Totals |
| (In millions) | Foreign Currency Forward Contracts | | Interest Rate Swaps | | Total | | | | | | | | | | |
| Balance at June 30, 2016, net of tax | | | | | $ | (46.7 | ) | | $ | — |
| | $ | 6.0 |
| | $ | (15.2 | ) | | $ | (1,375.4 | ) | | $ | (1,431.3 | ) |
| Other comprehensive earnings (loss) before reclassifications, before tax | | | | | 9.8 |
| | (10.4 | ) | | 21.5 |
| | (0.2 | ) | | 290.6 |
| | 311.3 |
|
| Amounts reclassified from accumulated other comprehensive (loss) earnings, before tax: | | | | | | | | | | | | | | | |
| Gain on foreign exchange forward contracts classified as cash flow hedges, included in net sales | 10.7 |
| | | | 10.7 |
| | | | | | | | | | 10.7 |
|
| Gain on interest rate swaps classified as cash flow hedges, included in interest expense | | | 2.3 |
| | 2.3 |
| | | | | | | | | | 2.3 |
|
| Amortization of prior service costs included in SG&A | | | | | | | | | | | — |
| | | | — |
|
| Amortization of actuarial gain included in SG&A | | | | | | | | | | | 0.3 |
| | | | 0.3 |
|
| Net other comprehensive earnings (loss), before tax | | | | | 22.8 |
| | (10.4 | ) | | 21.5 |
| | 0.1 |
| | 290.6 |
| | 324.6 |
|
| Income tax provision (benefit) | | | | | 8.0 |
| | (2.3 | ) | | 8.0 |
| | — |
| | — |
| | 13.7 |
|
| Balance at September 30, 2016, net of tax | | | | | $ | (31.9 | ) | | $ | (8.1 | ) | | $ | 19.5 |
| | $ | (15.1 | ) | | $ | (1,084.8 | ) | | $ | (1,120.4 | ) |
MYLAN N.V. AND SUBSIDIARIES
Notes to Condensed Consolidated Financial Statements (Unaudited) - Continued
|
| | | | | | | | | | | | | | | | | | | | | | | | | | | | | |
| | Six Months Ended June 30, 2018 |
| Gains and Losses on Derivatives in Cash Flow Hedging Relationships | | Gains and Losses on Net Investment Hedges | | Gains and Losses on Marketable Securities | | Defined Pension Plan Items | | Foreign Currency Translation Adjustment | | Totals |
| (In millions) | Foreign Currency Forward Contracts | | Interest Rate Swaps | | Total | | | | | | | | | | |
| Balance at December 31, 2017, net of tax | | | | | $ | (3.7 | ) | | $ | (239.8 | ) | | $ | 10.1 |
| | $ | 6.0 |
| | $ | (133.8 | ) | | $ | (361.2 | ) |
| Other comprehensive (loss) earnings before reclassifications, before tax | | | | | (90.8 | ) | | 59.9 |
| | (0.1 | ) | | (1.8 | ) | | (826.8 | ) | | (859.6 | ) |
| Amounts reclassified from accumulated other comprehensive loss, before tax: | | | | | | | | | | | | | | | |
| Gain on foreign exchange forward contracts classified as cash flow hedges, included in net sales | (7.2 | ) | | | | (7.2 | ) | | | | | | | | | | (7.2 | ) |
| Loss on interest rate swaps classified as cash flow hedges, included in interest expense | | | 3.8 |
| | 3.8 |
| | | | | | | | | | 3.8 |
|
| Amortization of prior service costs included in SG&A | | | | | | | | | | | 0.2 |
| | | | 0.2 |
|
| Amortization of actuarial loss included in SG&A | | | | | | | | | | | 0.1 |
| | | | 0.1 |
|
| Net other comprehensive (loss) earnings, before tax | | | | | (94.2 | ) | | 59.9 |
| | (0.1 | ) | | (1.5 | ) | | (826.8 | ) | | (862.7 | ) |
| Income tax (benefit) provision | | | | | (32.4 | ) | | 0.1 |
| | — |
| | 0.2 |
| | — |
| | (32.1 | ) |
| Cumulative effect of the adoption of new accounting standards | | | | | 2.5 |
| | — |
| | (10.0 | ) | | — |
| | — |
| | (7.5 | ) |
| Balance at June 30, 2018, net of tax | | | | | $ | (63.0 | ) | | $ | (180.0 | ) | | $ | — |
| | $ | 4.3 |
| | $ | (960.6 | ) | | $ | (1,199.3 | ) |
|
| | | | | | | | | | | | | | | | | | | | | | | | | | | | | |
| | Nine Months Ended September 30, 2016 |
| Gains and Losses on Derivatives in Cash Flow Hedging Relationships | | Gains and Losses on Net Investment Hedges | | Gains and Losses on Marketable Securities | | Defined Pension Plan Items | | Foreign Currency Translation Adjustment | | Totals |
| (In millions) | Foreign Currency Forward Contracts | | Interest Rate Swaps | | Total | | | | | | | | | | |
| Balance at December 31, 2015, net of tax | | | | | $ | (18.1 | ) | | $ | — |
| | $ | (1.0 | ) | | $ | (14.9 | ) | | $ | (1,730.3 | ) | | $ | (1,764.3 | ) |
| Other comprehensive (loss) earnings before reclassifications, before tax | | | | | (63.7 | ) | | (10.4 | ) | | 32.5 |
| | (1.2 | ) | | 645.5 |
| | 602.7 |
|
| Amounts reclassified from accumulated other comprehensive (loss) earnings, before tax: | | | | | | | | | | | | | | | |
| Gain on foreign exchange forward contracts classified as cash flow hedges, included in net sales | 34.2 |
| | | | 34.2 |
| | | | | | | | | | 34.2 |
|
| Gain on interest rate swaps classified as cash flow hedges, included in interest expense | | | 6.6 |
| | 6.6 |
| | | | | | | | | | 6.6 |
|
| Amortization of prior service costs included in SG&A | | | | | | | | | | | 0.2 |
| | | | 0.2 |
|
| Amortization of actuarial gain included in SG&A | | | | | | | | | | | 0.7 |
| | | | 0.7 |
|
| Net other comprehensive (loss) earnings, before tax | | | | | (22.9 | ) | | (10.4 | ) | | 32.5 |
| | (0.3 | ) | | 645.5 |
| | 644.4 |
|
| Income tax (benefit) provision | | | | | (9.1 | ) | | (2.3 | ) | | 12.0 |
| | (0.1 | ) | | — |
| | 0.5 |
|
| Balance at September 30, 2016, net of tax | | | | | $ | (31.9 | ) | | $ | (8.1 | ) | | $ | 19.5 |
| | $ | (15.1 | ) | | $ | (1,084.8 | ) | | $ | (1,120.4 | ) |
A summary of the changes in shareholders’ equity for the nine months endedSeptember 30, 2017 and 2016 is as follows:
|
| | | | | | | | | | | |
| (In millions) | Total
Mylan N.V.
Shareholders' Equity | | Noncontrolling Interest | | Total |
| December 31, 2016 | $ | 11,116.2 |
| | $ | 1.4 |
| | $ | 11,117.6 |
|
| Net earnings | 451.7 |
| | — |
| | 451.7 |
|
| Other comprehensive earnings, net of tax | 1,652.5 |
| | — |
| | 1,652.5 |
|
| Stock option activity | 12.8 |
| | — |
| | 12.8 |
|
| Share-based compensation expense | 64.2 |
| | — |
| | 64.2 |
|
| Issuance of restricted stock, net of shares withheld | (5.8 | ) | | — |
| | (5.8 | ) |
| Other | — |
| | (1.4 | ) | | (1.4 | ) |
| September 30, 2017 | $ | 13,291.6 |
| | $ | — |
| | $ | 13,291.6 |
|
MYLAN N.V. AND SUBSIDIARIES
Notes to Condensed Consolidated Financial Statements (Unaudited) - Continued
|
| | | | | | | | | | | |
| (In millions) | Total
Mylan N.V.
Shareholders' Equity | | Noncontrolling Interest | | Total |
| December 31, 2015 | $ | 9,764.4 |
| | $ | 1.4 |
| | $ | 9,765.8 |
|
| Net earnings | 62.5 |
| | — |
| | 62.5 |
|
| Other comprehensive earnings, net of tax | 643.9 |
| | — |
| | 643.9 |
|
| Stock option activity | 11.1 |
| | — |
| | 11.1 |
|
| Share-based compensation expense | 71.1 |
| | — |
| | 71.1 |
|
| Issuance of restricted stock, net of shares withheld | (9.6 | ) | | — |
| | (9.6 | ) |
| Tax benefit of stock option plans | 2.2 |
| | — |
| | 2.2 |
|
| Issuance of ordinary shares to purchase Meda | 1,281.7 |
| | — |
| | 1,281.7 |
|
| Other | — |
| | 0.1 |
| | 0.1 |
|
| September 30, 2016 | $ | 11,827.3 |
| | $ | 1.5 |
| | $ | 11,828.8 |
|
As a result of our acquisition of Meda and the integration of our portfolio across our branded, generics and OTC platforms in all of our regions, effective October 1, 2016, the Company expanded its reportable segments. The Company has three reportable segmentsMylan reports segment information on a geographic basis as follows: basis. This approach reflects the company’s focus on bringing its broad and diversified portfolio of generic, branded generic, brand-name and OTC products to people in markets everywhere. Our North America Europe and Rest of World. Our North America segment is made up ofcomprises our operations in the U.S. and Canada and includes the operations of our previously reported Specialty segment.Canada. Our Europe segment is made up ofencompasses our operations in 35 countries, withinincluding France, Italy, Germany, the region.United Kingdom (“U.K.”) and Spain. Our Rest of World segment is primarily made up ofreflects our operations in more than 120 countries, including Japan, Australia, China, Brazil, Russia, India, Australia, JapanSouth Africa and New Zealand. Also includedcertain markets in our Rest of World segment are our operations in emerging markets, which include countries in Africa (including South Africa) as well as Brazil and other countries throughout Asia and the Middle East. Comparative segment financial information has been recast for prior periods to conform to this revised segment reporting.East and Southeast Asia.
The Company’s chief operating decision maker is the Chief Executive Officer, who evaluates the performance of its segments based on total revenues and segment profitability. Segment profitability represents segment gross profit less direct R&D expenses and direct selling, general and administrative (“SG&A”) expenses.&A. Certain general and administrative and R&D expenses not allocated to the segments, including certain special items, net charges for litigation settlements and other contingencies, amortization of intangible assets, impairment charges and other expenses not directly attributable to the segments and certain intercompany transactions, including eliminations, are reported in Corporate/Other. Additionally, amortizationseparately or outside of intangible assets and other purchase accounting related items, as well as certain other significant special items, are included in Corporate/Other.segment profitability. Items below the earnings from operations line on the Company’s Condensed Consolidated Statementscondensed consolidated statements of Operationsoperations are not presented by segment, since they are excluded from the measure of segment profitability. The Company does not report
MYLAN N.V. AND SUBSIDIARIES
Notes to Condensed Consolidated Financial Statements (Unaudited) - Continued
depreciation expense, total assets and capital expenditures by segment, as such information is not used by the chief operating decision maker.
The accounting policies of the segments are the same as those described in the “SummaryNote 2 Summary of Significant Accounting Policies”Policies included in Mylan N.V.’s Annual Report onthe 2018 Form 10-K, for the year ended December 31, 2016, as amended.and Note 3 Recent Accounting Pronouncements, Adoption of New Accounting Standards included in this Form 10-Q. Intersegment revenues are accounted for at current market values and are eliminated at the consolidated level.
MYLAN N.V. AND SUBSIDIARIES
Notes to Condensed Consolidated Financial Statements (Unaudited) - Continued
Presented in the table below is segment information for the periods identified and a reconciliation of segment information to total consolidated information.
| | | (In millions) | North America | | Europe | | Rest of World | | Corporate / Other | | Consolidated | North America | | Europe | | Rest of World | | Eliminations | | Consolidated |
| Three Months Ended September 30, 2017 | | | | | | | | | | |
| Third party net sales | $ | 1,172.2 |
| | $ | 1,040.8 |
| | $ | 743.3 |
| | $ | — |
| | $ | 2,956.3 |
| |
| Three Months Ended June 30, 2019 | | | | | | | | | | |
| Net sales | | $ | 1,023.4 |
| | $ | 989.6 |
| | $ | 805.2 |
| | $ | — |
| | $ | 2,818.2 |
|
| Other revenue | 20.0 |
| | 8.9 |
| | 1.9 |
| | — |
| | 30.8 |
| 19.1 |
| | 3.8 |
| | 10.4 |
| | — |
| | 33.3 |
|
| Intersegment | 15.5 |
| | 18.4 |
| | 87.7 |
| | (121.6 | ) | | — |
| |
| Intersegment revenue | | 35.1 |
| | 22.3 |
| | 134.8 |
| | (192.2 | ) | | — |
|
| Total | $ | 1,207.7 |
| | $ | 1,068.1 |
| | $ | 832.9 |
| | $ | (121.6 | ) | | $ | 2,987.1 |
| $ | 1,077.6 |
| | $ | 1,015.7 |
| | $ | 950.4 |
| | $ | (192.2 | ) | | $ | 2,851.5 |
|
| | | | | | | | | | | | | | | | | | | |
| Segment profitability | $ | 575.8 |
| | $ | 290.3 |
| | $ | 133.9 |
| | $ | (684.0 | ) | | $ | 316.0 |
| $ | 457.9 |
| | $ | 194.5 |
| | $ | 171.1 |
| | $ | — |
| | $ | 823.5 |
|
| | | | | | | | | | | | | | | | | | | |
| Nine Months Ended September 30, 2017 | | | | | | | | |
| Third party net sales | $ | 3,666.7 |
| | $ | 2,887.1 |
| | $ | 2,016.4 |
| | $ | — |
| | $ | 8,570.2 |
| |
| Intangible asset amortization expense | | | | | | | | | | (399.2 | ) |
| Intangible asset impairment charges | | | | | | | | | | (40.4 | ) |
| Globally managed research and development costs | | | | | | | | | | (49.9 | ) |
| Corporate costs and special items | | | | | | | | | | (217.6 | ) |
| Litigation settlements & other contingencies | | | | | | | | | | (20.9 | ) |
| Earnings from operations | | | | | | | | | | $ | 95.5 |
|
| | | | | | | | | | | |
| Six Months Ended June 30, 2019 | | | | | | | | | | |
| Net sales | | $ | 1,946.3 |
| | $ | 1,884.9 |
| | $ | 1,447.6 |
| | $ | — |
| | $ | 5,278.8 |
|
| Other revenue | 67.3 |
| | 25.0 |
| | 6.3 |
| | — |
| | 98.6 |
| 41.2 |
| | 8.5 |
| | 18.5 |
| | — |
| | 68.2 |
|
| Intersegment | 60.5 |
| | 87.6 |
| | 275.4 |
| | (423.5 | ) | | — |
| |
| Intersegment revenue | | 50.7 |
| | 43.1 |
| | 248.1 |
| | (341.9 | ) | | — |
|
| Total | $ | 3,794.5 |
| | $ | 2,999.7 |
| | $ | 2,298.1 |
| | $ | (423.5 | ) | | $ | 8,668.8 |
| $ | 2,038.2 |
| | $ | 1,936.5 |
| | $ | 1,714.2 |
| | $ | (341.9 | ) | | $ | 5,347.0 |
|
| | | | | | | | | | | | | | | | | | | |
| Segment profitability | $ | 1,810.5 |
| | $ | 776.8 |
| | $ | 437.1 |
| | $ | (2,007.8 | ) | | $ | 1,016.6 |
| $ | 852.4 |
| | $ | 398.6 |
| | $ | 264.9 |
| | $ | — |
| | $ | 1,515.9 |
|
| | | | | | | | | | | |
| Intangible asset amortization expense | | | | | | | | | | (804.7 | ) |
| Intangible asset impairment charges | | | | | | | | | | (69.9 | ) |
| Globally managed research and development costs | | | | | | | | | | (120.5 | ) |
| Corporate costs and special items | | | | | | | | | | (379.7 | ) |
| Litigation settlements & other contingencies | | | | | | | | | | (21.6 | ) |
| Earnings from operations | | | | | | | | | | $ | 119.5 |
|
|
| | | | | | | | | | | | | | | | | | | |
| (In millions) | North America | | Europe | | Rest of World | | Corporate / Other | | Consolidated |
| Three Months Ended September 30, 2016 | | | | | | | | | |
| Third party net sales | $ | 1,505.5 |
| | $ | 841.2 |
| | $ | 682.8 |
| | $ | — |
| | $ | 3,029.5 |
|
| Other revenue | 21.6 |
| | 3.9 |
| | 2.1 |
| | — |
| | 27.6 |
|
| Intersegment | 10.3 |
| | 53.2 |
| | 105.0 |
| | (168.5 | ) | | — |
|
| Total | $ | 1,537.4 |
| | $ | 898.3 |
| | $ | 789.9 |
| | $ | (168.5 | ) | | $ | 3,057.1 |
|
| | | | | | | | | | |
| Segment profitability | $ | 784.7 |
| | $ | 252.6 |
| | $ | 115.6 |
| | $ | (1,283.6 | ) | | $ | (130.7 | ) |
| | | | | | | | | | |
| Nine Months Ended September 30, 2016 | | | | | | | | | |
| Third party net sales | $ | 4,064.5 |
| | $ | 2,026.4 |
| | $ | 1,654.6 |
| | $ | — |
| | $ | 7,745.5 |
|
| Other revenue | 54.3 |
| | 4.5 |
| | 4.8 |
| | — |
| | 63.6 |
|
| Intersegment revenue | 24.5 |
| | 104.0 |
| | 291.9 |
| | (420.4 | ) | | — |
|
| Total | $ | 4,143.3 |
| | $ | 2,134.9 |
| | $ | 1,951.3 |
| | $ | (420.4 | ) | | $ | 7,809.1 |
|
| | | | | | | | | | |
| Segment profitability | $ | 2,141.2 |
| | $ | 495.1 |
| | $ | 221.5 |
| | $ | (2,472.0 | ) | | $ | 385.8 |
|
MYLAN N.V. AND SUBSIDIARIES
Notes to Condensed Consolidated Financial Statements (Unaudited) - Continued
|
| | | | | | | | | | | | | | | | | | | |
| (In millions) | North America | | Europe | | Rest of World | | Eliminations | | Consolidated |
| Three Months Ended June 30, 2018 | | | | | | | | | |
| Net sales | $ | 1,000.8 |
| | $ | 990.6 |
| | $ | 764.1 |
| | $ | — |
| | $ | 2,755.5 |
|
| Other revenue | 42.5 |
| | 2.9 |
| | 7.4 |
| | — |
| | 52.8 |
|
| Intersegment revenue | 23.7 |
| | 25.4 |
| | 103.1 |
| | (152.2 | ) | | — |
|
| Total | $ | 1,067.0 |
| | $ | 1,018.9 |
| | $ | 874.6 |
| | $ | (152.2 | ) | | $ | 2,808.3 |
|
| | | | | | | | | | |
| Segment profitability | $ | 375.4 |
| | $ | 238.1 |
| | $ | 174.0 |
| | $ | — |
| | $ | 787.5 |
|
| | | | | | | | | | |
| Intangible asset amortization expense | | | | | | | | | (387.4 | ) |
| Intangible asset impairment charges | | | | | | | | | (42.0 | ) |
| Globally managed research and development costs | | | | | | | | | (74.8 | ) |
| Corporate costs and special items | | | | | | | | | (150.8 | ) |
| Litigation settlements & other contingencies | | | | | | | | | 46.4 |
|
| Earnings from operations | | | | | | | | | $ | 178.9 |
|
| | | | | | | | | | |
| Six Months Ended June 30, 2018 | | | | | | | | | |
| Net sales | $ | 1,986.1 |
| | $ | 2,029.0 |
| | $ | 1,390.8 |
| | $ | — |
| | $ | 5,405.9 |
|
| Other revenue | 63.6 |
| | 12.4 |
| | 10.9 |
| | — |
| | 86.9 |
|
| Intersegment revenue | 36.0 |
| | 51.0 |
| | 189.8 |
| | (276.8 | ) | | — |
|
| Total | $ | 2,085.7 |
| | $ | 2,092.4 |
| | $ | 1,591.5 |
| | $ | (276.8 | ) | | $ | 5,492.8 |
|
| | | | | | | | | | |
| Segment profitability | $ | 835.3 |
| | $ | 496.3 |
| | $ | 280.6 |
| | $ | — |
| | $ | 1,612.2 |
|
| | | | | | | | | | |
| Intangible asset amortization expense | | | | | | | | | (779.7 | ) |
| Intangible asset impairment charges | | | | | | | | | (72.0 | ) |
| Globally managed research and development costs | | | | | | | | | (151.7 | ) |
| Corporate costs and special items | | | | | | | | | (304.4 | ) |
| Litigation settlements & other contingencies | | | | | | | | | 30.2 |
|
| Earnings from operations | | | | | | | | | $ | 334.6 |
|
The following tables present condensed consolidating financial information for (a) Mylan N.V., the issuer of the 3.000% Senior Notes due 2018, 2.500% Senior Notes due 2019, 3.750% Senior Notes due 2020, 3.150% Senior Notes due 2021, 3.950% Senior Notes due 2026 and 5.250% Senior Notes due 2046 (collectively, the “Mylan N.V. Senior Notes”), which are guaranteed on a senior unsecured basis by Mylan Inc.; (b) Mylan Inc., the issuer of the 2.600% Senior Notes due 2018, 2.550% Senior Notes due 2019, 3.125% Senior Notes due 2023, 4.200% Senior Notes due 2023, and4.550% Senior Notes due 2028, 5.400% Senior Notes due 2043 and 5.200% Senior Notes due 2048 (collectively, the “Mylan Inc. Senior Notes”), which are guaranteed on a senior unsecured basis by Mylan N.V.; and (c) all other subsidiaries of the Company on a combined basis, none of which guarantee the Mylan N.V. Senior Notes or guarantee the Mylan Inc. Senior Notes (“Non-Guarantor Subsidiaries”). The consolidating adjustments primarily relate to eliminations of investments in subsidiaries and intercompany balances and transactions. The condensed consolidating financial statements present investments in subsidiaries using the equity method of accounting.
The following financial information presents the unaudited Condensed Consolidating Statementscondensed consolidating statements of Operationsoperations for the three and ninesix months ended SeptemberJune 30, 20172019 and 2016,2018, the unaudited Condensed Consolidating Statementscondensed consolidating statements of Comprehensive Earningscomprehensive earnings for the three and ninesix months ended SeptemberJune 30, 20172019 and 2016,2018, the unaudited Condensed Consolidating Balance Sheetscondensed consolidating balance sheets as of SeptemberJune 30, 20172019 and December 31, 20162018 and the unaudited Condensed Consolidating Statementscondensed consolidating statements of Cash Flowscash flows for the ninesix months ended SeptemberJune 30, 20172019 and 2016.2018. This unaudited condensed consolidating financial information has been prepared and
MYLAN N.V. AND SUBSIDIARIES
Notes to Condensed Consolidated Financial Statements (Unaudited) - Continued
presented in accordance with SEC Regulation S-X Rule 3-10 “Financial Statements of Guarantors and Issuers of Guaranteed Securities Registered or Being Registered.”
MYLAN N.V. AND SUBSIDIARIES
Notes to Condensed Consolidated Financial Statements (Unaudited) - Continued
UNAUDITED CONDENSED CONSOLIDATING STATEMENT OF OPERATIONS
Three Months Ended SeptemberJune 30, 20172019
| | | (In millions) | Mylan N.V. | | Mylan Inc. | | Guarantor Subsidiaries | | Non-Guarantor Subsidiaries | | Eliminations | | Consolidated | Mylan N.V. | | Mylan Inc. | | Guarantor Subsidiaries | | Non-Guarantor Subsidiaries | | Eliminations | | Consolidated |
| Revenues: | | | | | | | | | | | | | | | | | | | | | | |
| Net sales | $ | — |
| | $ | — |
| | $ | — |
| | $ | 2,956.3 |
| | $ | — |
| | $ | 2,956.3 |
| $ | — |
| | $ | — |
| | $ | — |
| | $ | 2,818.2 |
| | $ | — |
| | $ | 2,818.2 |
|
| Other revenues | — |
| | — |
| | — |
| | 30.8 |
| | — |
| | 30.8 |
| — |
| | — |
| | — |
| | 33.3 |
| | — |
| | 33.3 |
|
| Total revenues | — |
| | — |
| | — |
| | 2,987.1 |
| | — |
| | 2,987.1 |
| — |
| | — |
| | — |
| | 2,851.5 |
| | — |
| | 2,851.5 |
|
| Cost of sales | — |
| | — |
| | — |
| | 1,809.0 |
| | — |
| | 1,809.0 |
| — |
| | — |
| | — |
| | 1,918.9 |
| | — |
| | 1,918.9 |
|
| Gross profit | — |
| | — |
| | — |
| | 1,178.1 |
| | — |
| | 1,178.1 |
| — |
| | — |
| | — |
| | 932.6 |
| | — |
| | 932.6 |
|
| Operating expenses: | | | | | | | | | | | | | | | | | | | | | | |
| Research and development | — |
| | — |
| | — |
| | 182.3 |
| | — |
| | 182.3 |
| — |
| | — |
| | — |
| | 147.6 |
| | — |
| | 147.6 |
|
| Selling, general and administrative | 6.5 |
| | 184.3 |
| | — |
| | 473.8 |
| | — |
| | 664.6 |
| 14.2 |
| | 172.9 |
| | — |
| | 481.5 |
| | — |
| | 668.6 |
|
| Litigation settlements and other contingencies, net | — |
| | 17.0 |
| | — |
| | (1.8 | ) | | — |
| | 15.2 |
| 30.0 |
| | 18.0 |
| | — |
| | (27.1 | ) | | — |
| | 20.9 |
|
| Total operating expenses | 6.5 |
| | 201.3 |
| | — |
| | 654.3 |
| | — |
| | 862.1 |
| 44.2 |
| | 190.9 |
| | — |
| | 602.0 |
| | — |
| | 837.1 |
|
| (Loss) earnings from operations | (6.5 | ) | | (201.3 | ) | | — |
| | 523.8 |
| | — |
| | 316.0 |
| |
| (Loss) Earnings from operations | | (44.2 | ) | | (190.9 | ) | | — |
| | 330.6 |
| | — |
| | 95.5 |
|
| Interest expense | 93.3 |
| | 26.7 |
| | — |
| | 11.8 |
| | — |
| | 131.8 |
| 80.8 |
| | 43.7 |
| | — |
| | 6.7 |
| | — |
| | 131.2 |
|
| Other (income) expense, net | (122.3 | ) | | (44.7 | ) | | — |
| | 171.6 |
| | — |
| | 4.6 |
| (87.2 | ) | | (60.4 | ) | | — |
| | 164.0 |
| | — |
| | 16.4 |
|
| Earnings (loss) before income taxes | 22.5 |
| | (183.3 | ) | | — |
| | 340.4 |
| | — |
| | 179.6 |
| |
| Income tax provision (benefit) | 2.4 |
| | (0.6 | ) | | — |
| | 89.5 |
| | — |
| | 91.3 |
| |
| Earnings of equity interest subsidiaries | 68.2 |
| | 129.9 |
| | — |
| | — |
| | (198.1 | ) | | — |
| |
| Net earnings (loss) | $ | 88.3 |
| | $ | (52.8 | ) | | $ | — |
| | $ | 250.9 |
| | $ | (198.1 | ) | | $ | 88.3 |
| |
| (Loss) Earnings before income taxes | | (37.8 | ) | | (174.2 | ) | | — |
| | 159.9 |
| | — |
| | (52.1 | ) |
| Income tax (benefit) provision | | (8.2 | ) | | 1.8 |
| | — |
| | 122.8 |
| | — |
| | 116.4 |
|
| (Loss) Earnings of equity interest subsidiaries | | (138.9 | ) | | 11.8 |
| | — |
| | — |
| | 127.1 |
| | — |
|
| Net (loss) earnings | | $ | (168.5 | ) | | $ | (164.2 | ) | | $ | — |
| | $ | 37.1 |
| | $ | 127.1 |
| | $ | (168.5 | ) |
MYLAN N.V. AND SUBSIDIARIES
Notes to Condensed Consolidated Financial Statements (Unaudited) - Continued
UNAUDITED CONDENSED CONSOLIDATING STATEMENT OF OPERATIONS
NineSix Months Ended SeptemberJune 30, 20172019
| | | (In millions) | Mylan N.V. | | Mylan Inc. | | Guarantor Subsidiaries | | Non-Guarantor Subsidiaries | | Eliminations | | Consolidated | Mylan N.V. | | Mylan Inc. | | Guarantor Subsidiaries | | Non-Guarantor Subsidiaries | | Eliminations | | Consolidated |
| Revenues: | | | | | | | | | | | | | | | | | | | | | | |
| Net sales | $ | — |
| | $ | — |
| | $ | — |
| | $ | 8,570.2 |
| | $ | — |
| | $ | 8,570.2 |
| $ | — |
| | $ | — |
| | $ | — |
| | $ | 5,278.8 |
| | $ | — |
| | $ | 5,278.8 |
|
| Other revenues | — |
| | — |
| | — |
| | 98.6 |
| | — |
| | 98.6 |
| — |
| | — |
| | — |
| | 68.2 |
| | — |
| | 68.2 |
|
| Total revenues | — |
| | — |
| | — |
| | 8,668.8 |
| | — |
| | 8,668.8 |
| — |
| | — |
| | — |
| | 5,347.0 |
| | — |
| | 5,347.0 |
|
| Cost of sales | — |
| | — |
| | — |
| | 5,180.3 |
| | — |
| | 5,180.3 |
| — |
| | — |
| | — |
| | 3,609.2 |
| | — |
| | 3,609.2 |
|
| Gross profit | — |
| | — |
| | — |
| | 3,488.5 |
| | — |
| | 3,488.5 |
| — |
| | — |
| | — |
| | 1,737.8 |
| | — |
| | 1,737.8 |
|
| Operating expenses: | | | | | | | | | | | | | | | | | | | | | | |
| Research and development | — |
| | — |
| | — |
| | 580.9 |
| | — |
| | 580.9 |
| — |
| | — |
| | — |
| | 320.2 |
| | — |
| | 320.2 |
|
| Selling, general and administrative | 32.4 |
| | 477.6 |
| | — |
| | 1,406.8 |
| | — |
| | 1,916.8 |
| 23.3 |
| | 311.6 |
| | — |
| | 941.6 |
| | — |
| | 1,276.5 |
|
| Litigation settlements and other contingencies, net | — |
| | 17.0 |
| | — |
| | (42.8 | ) | | — |
| | (25.8 | ) | 30.0 |
| | 18.0 |
| | — |
| | (26.4 | ) | | — |
| | 21.6 |
|
| Total operating expenses | 32.4 |
| | 494.6 |
| | — |
| | 1,944.9 |
| | — |
| | 2,471.9 |
| 53.3 |
| | 329.6 |
| | — |
| | 1,235.4 |
| | — |
| | 1,618.3 |
|
| (Loss) earnings from operations | (32.4 | ) | | (494.6 | ) | | — |
| | 1,543.6 |
| | — |
| | 1,016.6 |
| |
| (Loss) Earnings from operations | | (53.3 | ) | | (329.6 | ) | | — |
| | 502.4 |
| | — |
| | 119.5 |
|
| Interest expense | 285.6 |
| | 77.8 |
| | — |
| | 42.9 |
| | — |
| | 406.3 |
| 162.5 |
| | 87.2 |
| | — |
| | 12.7 |
| | — |
| | 262.4 |
|
| Other (income) expense, net | (331.3 | ) | | (161.5 | ) | | — |
| | 527.2 |
| | — |
| | 34.4 |
| (145.3 | ) | | (120.5 | ) | | — |
| | 289.5 |
| | — |
| | 23.7 |
|
| Earnings (loss) before income taxes | 13.3 |
| | (410.9 | ) | | — |
| | 973.5 |
| | — |
| | 575.9 |
| |
| Income tax provision | 1.4 |
| | 5.1 |
| | — |
| | 117.7 |
| | — |
| | 124.2 |
| |
| Earnings of equity interest subsidiaries | 439.8 |
| | 788.8 |
| | — |
| | — |
| | (1,228.6 | ) | | — |
| |
| Net earnings | $ | 451.7 |
| | $ | 372.8 |
| | $ | — |
| | $ | 855.8 |
| | $ | (1,228.6 | ) | | $ | 451.7 |
| |
| (Loss) Earnings before income taxes | | (70.5 | ) | | (296.3 | ) | | — |
| | 200.2 |
| | — |
| | (166.6 | ) |
| Income tax (benefit) provision | | (13.8 | ) | | 3.6 |
| | — |
| | 37.1 |
| | — |
| | 26.9 |
|
| (Loss) Earnings of equity interest subsidiaries | | (136.8 | ) | | 114.4 |
| | — |
| | — |
| | 22.4 |
| | — |
|
| Net (loss) earnings | | $ | (193.5 | ) | | $ | (185.5 | ) | | $ | — |
| | $ | 163.1 |
| | $ | 22.4 |
| | $ | (193.5 | ) |
MYLAN N.V. AND SUBSIDIARIES
Notes to Condensed Consolidated Financial Statements (Unaudited) - Continued
UNAUDITED CONDENSED CONSOLIDATING STATEMENT OF OPERATIONS
Three Months Ended SeptemberJune 30, 20162018
| | | (In millions) | Mylan N.V. | | Mylan Inc. | | Guarantor Subsidiaries | | Non-Guarantor Subsidiaries | | Eliminations | | Consolidated | Mylan N.V. | | Mylan Inc. | | Guarantor Subsidiaries | | Non-Guarantor Subsidiaries | | Eliminations | | Consolidated |
| Revenues: | | | | | | | | | | | | | | | | | | | | | | |
| Net sales | $ | — |
| | $ | — |
| | $ | — |
| | $ | 3,029.5 |
| | $ | — |
| | $ | 3,029.5 |
| $ | — |
| | $ | — |
| | $ | — |
| | $ | 2,755.5 |
| | $ | — |
| | $ | 2,755.5 |
|
| Other revenues | — |
| | — |
| | — |
| | 27.6 |
| | — |
| | 27.6 |
| — |
| | — |
| | — |
| | 52.8 |
| | — |
| | 52.8 |
|
| Total revenues | — |
| | — |
| | — |
| | 3,057.1 |
| | — |
| | 3,057.1 |
| — |
| | — |
| | — |
| | 2,808.3 |
| | — |
| | 2,808.3 |
|
| Cost of sales | — |
| | — |
| | — |
| | 1,773.8 |
| | — |
| | 1,773.8 |
| — |
| | — |
| | — |
| | 1,845.8 |
| | — |
| | 1,845.8 |
|
| Gross profit | — |
| | — |
| | — |
| | 1,283.3 |
| | — |
| | 1,283.3 |
| — |
| | — |
| | — |
| | 962.5 |
| | — |
| | 962.5 |
|
| Operating expenses: | | | | | | | | | | | | | | | | | | | | | | |
| Research and development | — |
| | — |
| | — |
| | 199.1 |
| | — |
| | 199.1 |
| — |
| | — |
| | — |
| | 206.7 |
| | — |
| | 206.7 |
|
| Selling, general and administrative | 43.1 |
| | 134.0 |
| | — |
| | 479.8 |
| | — |
| | 656.9 |
| 9.7 |
| | 119.4 |
| | — |
| | 494.2 |
| | — |
| | 623.3 |
|
| Litigation settlements and other contingencies, net | — |
| | — |
| | — |
| | 558.0 |
| | — |
| | 558.0 |
| — |
| | — |
| | — |
| | (46.4 | ) | | — |
| | (46.4 | ) |
| Total operating expenses | 43.1 |
| | 134.0 |
| | — |
| | 1,236.9 |
| | — |
| | 1,414.0 |
| 9.7 |
| | 119.4 |
| | — |
| | 654.5 |
| | — |
| | 783.6 |
|
| (Loss) earnings from operations | (43.1 | ) | | (134.0 | ) | | — |
| | 46.4 |
| | — |
| | (130.7 | ) | |
| (Loss) Earnings from operations | | (9.7 | ) | | (119.4 | ) | | — |
| | 308.0 |
| | — |
| | 178.9 |
|
| Interest expense | 70.7 |
| | 40.9 |
| | — |
| | 32.8 |
| | — |
| | 144.4 |
| 88.6 |
| | 41.1 |
| | — |
| | 9.5 |
| | — |
| | 139.2 |
|
| Other (income) expense, net | (31.4 | ) | | (102.7 | ) | | — |
| | 184.3 |
| | — |
| | 50.2 |
| (49.6 | ) | | (68.3 | ) | | — |
| | 138.9 |
| | — |
| | 21.0 |
|
| Loss from operations | (82.4 | ) | | (72.2 | ) | | — |
| | (170.7 | ) | | — |
| | (325.3 | ) | |
| Income tax provision (benefit) | — |
| | 8.1 |
| | — |
| | (213.6 | ) | | — |
| | (205.5 | ) | |
| (Loss) earnings of equity interest subsidiaries | (37.4 | ) | | 442.9 |
| | — |
| | — |
| | (405.5 | ) | | — |
| |
| Net (loss) earnings | $ | (119.8 | ) | | $ | 362.6 |
| | $ | — |
| | $ | 42.9 |
| | $ | (405.5 | ) | | $ | (119.8 | ) | |
| (Loss) Earnings before income taxes | | (48.7 | ) | | (92.2 | ) | | — |
| | 159.6 |
| | — |
| | 18.7 |
|
| Income tax (benefit) provision | | (8.0 | ) | | 13.1 |
| | — |
| | (23.9 | ) | | — |
| | (18.8 | ) |
| Earnings of equity interest subsidiaries | | 78.2 |
| | 82.2 |
| | — |
| | — |
| | (160.4 | ) | | — |
|
| Net earnings (loss) | | $ | 37.5 |
| | $ | (23.1 | ) | | $ | — |
| | $ | 183.5 |
| | $ | (160.4 | ) | | $ | 37.5 |
|
MYLAN N.V. AND SUBSIDIARIES
Notes to Condensed Consolidated Financial Statements (Unaudited) - Continued
UNAUDITED CONDENSED CONSOLIDATING STATEMENT OF OPERATIONS
NineSix Months Ended SeptemberJune 30, 20162018
|
| | | | | | | | | | | | | | | | | | | | | | | |
| (In millions) | Mylan N.V. | | Mylan Inc. | | Guarantor Subsidiaries | | Non-Guarantor Subsidiaries | | Eliminations | | Consolidated |
| Revenues: | | | | | | | | | | | |
| Net sales | $ | — |
| | $ | — |
| | $ | — |
| | $ | 5,405.9 |
| | $ | — |
| | $ | 5,405.9 |
|
| Other revenues | — |
| | — |
| | — |
| | 86.9 |
| | — |
| | 86.9 |
|
| Total revenues | — |
| | — |
| | — |
| | 5,492.8 |
| | — |
| | 5,492.8 |
|
| Cost of sales | — |
| | — |
| | — |
| | 3,546.0 |
| | — |
| | 3,546.0 |
|
| Gross profit | — |
| | — |
| | — |
| | 1,946.8 |
| | — |
| | 1,946.8 |
|
| Operating expenses: | | | | | | | | | | | |
| Research and development | — |
| | — |
| | — |
| | 411.6 |
| | — |
| | 411.6 |
|
| Selling, general and administrative | 19.5 |
| | 250.1 |
| | — |
| | 961.2 |
| | — |
| | 1,230.8 |
|
| Litigation settlements and other contingencies, net | — |
| | 7.0 |
| | — |
| | (37.2 | ) | | — |
| | (30.2 | ) |
| Total operating expenses | 19.5 |
| | 257.1 |
| | — |
| | 1,335.6 |
| | — |
| | 1,612.2 |
|
| (Loss) Earnings from operations | (19.5 | ) | | (257.1 | ) | | — |
| | 611.2 |
| | — |
| | 334.6 |
|
| Interest expense | 182.1 |
| | 68.0 |
| | — |
| | 20.8 |
| | — |
| | 270.9 |
|
| Other (income) expense, net | (163.6 | ) | | (126.0 | ) | | — |
| | 324.1 |
| | — |
| | 34.5 |
|
| (Loss) Earnings before income taxes | (38.0 | ) | | (199.1 | ) | | — |
| | 266.3 |
| | — |
| | 29.2 |
|
| Income tax benefit | (15.3 | ) | | (4.6 | ) | | — |
| | (75.5 | ) | | — |
| | (95.4 | ) |
| Earnings of equity interest subsidiaries | 147.3 |
| | 73.9 |
| | — |
| | — |
| | (221.2 | ) | | — |
|
| Net earnings (loss) | $ | 124.6 |
| | $ | (120.6 | ) | | $ | — |
| | $ | 341.8 |
| | $ | (221.2 | ) | | $ | 124.6 |
|
|
| | | | | | | | | | | | | | | | | | | | | | | |
| (In millions) | Mylan N.V. | | Mylan Inc. | | Guarantor Subsidiaries | | Non-Guarantor Subsidiaries | | Eliminations | | Consolidated |
| Revenues: | | | | | | | | | | | |
| Net sales | $ | — |
| | $ | — |
| | $ | — |
| | $ | 7,745.5 |
| | $ | — |
| | $ | 7,745.5 |
|
| Other revenues | — |
| | — |
| | — |
| | 63.6 |
| | — |
| | 63.6 |
|
| Total revenues | — |
| | — |
| | — |
| | 7,809.1 |
| | — |
| | 7,809.1 |
|
| Cost of sales | — |
| | — |
| | — |
| | 4,447.1 |
| | — |
| | 4,447.1 |
|
| Gross profit | — |
| | — |
| | — |
| | 3,362.0 |
| | — |
| | 3,362.0 |
|
| Operating expenses: | | | | | | | | | | | |
| Research and development | — |
| | — |
| | — |
| | 632.2 |
| | — |
| | 632.2 |
|
| Selling, general and administrative | 75.8 |
| | 499.2 |
| | — |
| | 1,212.6 |
| | — |
| | 1,787.6 |
|
| Litigation settlements and other contingencies, net | — |
| | — |
| | — |
| | 556.4 |
| | — |
| | 556.4 |
|
| Total operating expenses | 75.8 |
| | 499.2 |
| | — |
| | 2,401.2 |
| | — |
| | 2,976.2 |
|
| (Loss) earnings from operations | (75.8 | ) | | (499.2 | ) | | — |
| | 960.8 |
| | — |
| | 385.8 |
|
| Interest expense | 115.1 |
| | 126.3 |
| | — |
| | 63.6 |
| | — |
| | 305.0 |
|
| Other expense (income), net | 53.6 |
| | (305.7 | ) | | — |
| | 436.1 |
| | — |
| | 184.0 |
|
| (Loss) earnings before income taxes | (244.5 | ) | | (319.8 | ) | | — |
| | 461.1 |
| | — |
| | (103.2 | ) |
| Income tax provision (benefit) | — |
| | 22.1 |
| | — |
| | (187.8 | ) | | — |
| | (165.7 | ) |
| Earnings of equity interest subsidiaries | 307.0 |
| | 1,055.7 |
| | — |
| | — |
| | (1,362.7 | ) | | — |
|
| Net earnings | $ | 62.5 |
| | $ | 713.8 |
| | $ | — |
| | $ | 648.9 |
| | $ | (1,362.7 | ) | | $ | 62.5 |
|
MYLAN N.V. AND SUBSIDIARIES
Notes to Condensed Consolidated Financial Statements (Unaudited) - Continued
UNAUDITED CONDENSED CONSOLIDATING STATEMENT OF COMPREHENSIVE EARNINGS
Three Months Ended SeptemberJune 30, 20172019
| | | (In millions) | Mylan N.V. | | Mylan Inc. | | Guarantor Subsidiaries | | Non-Guarantor Subsidiaries | | Eliminations | | Consolidated | Mylan N.V. | | Mylan Inc. | | Guarantor Subsidiaries | | Non-Guarantor Subsidiaries | | Eliminations | | Consolidated |
| Net earnings (loss) | $ | 88.3 |
| | $ | (52.8 | ) | | $ | — |
| | $ | 250.9 |
| | $ | (198.1 | ) | | $ | 88.3 |
| |
| Net (loss) earnings | | $ | (168.5 | ) | | $ | (164.2 | ) | | $ | — |
| | $ | 37.1 |
| | $ | 127.1 |
| | $ | (168.5 | ) |
| Other comprehensive earnings (loss), before tax: | | | | | | | | | | | | | | | | | | | | | | |
| Foreign currency translation adjustment | 423.0 |
| | — |
| | — |
| | 423.0 |
| | (423.0 | ) | | 423.0 |
| 196.6 |
| | — |
| | — |
| | 196.6 |
| | (196.6 | ) | | 196.6 |
|
| Change in unrecognized gain and prior service cost related to defined benefit plans | 1.1 |
| | 0.1 |
| | — |
| | 1.2 |
| | (1.3 | ) | | 1.1 |
| — |
| | — |
| | — |
| | — |
| | — |
| | — |
|
| Net unrecognized (loss) gain on derivatives in cash flow hedging relationships | (4.5 | ) | | 1.9 |
| | — |
| | (6.4 | ) | | 4.5 |
| | (4.5 | ) | |
| Net unrecognized gain on derivatives in cash flow hedging relationships | | 9.4 |
| | 1.8 |
| | — |
| | 7.6 |
| | (9.4 | ) | | 9.4 |
|
| Net unrecognized loss on derivatives in net investment hedging relationships | (72.1 | ) | | — |
| | — |
| | — |
| | — |
| | (72.1 | ) | (36.3 | ) | | (7.7 | ) | | — |
| | — |
| | 7.7 |
| | (36.3 | ) |
| Net unrealized loss on marketable securities | (8.9 | ) | | (8.9 | ) | | — |
| | — |
| | 8.9 |
| | (8.9 | ) | |
| Net unrealized gain on marketable securities | | 0.2 |
| | — |
| | — |
| | 0.2 |
| | (0.2 | ) | | 0.2 |
|
| Other comprehensive earnings (loss), before tax | 338.6 |
| | (6.9 | ) | | — |
| | 417.8 |
| | (410.9 | ) | | 338.6 |
| 169.9 |
| | (5.9 | ) | | — |
| | 204.4 |
| | (198.5 | ) | | 169.9 |
|
| Income tax (benefit) provision | (5.8 | ) | | 2.5 |
| | — |
| | (8.0 | ) | | 5.5 |
| | (5.8 | ) | |
| Income tax provision (benefit) | | 1.1 |
| | 1.3 |
| | — |
| | (0.2 | ) | | (1.1 | ) | | 1.1 |
|
| Other comprehensive earnings (loss), net of tax | 344.4 |
| | (9.4 | ) | | — |
| | 425.8 |
| | (416.4 | ) | | 344.4 |
| 168.8 |
| | (7.2 | ) | | — |
| | 204.6 |
| | (197.4 | ) | | 168.8 |
|
| Comprehensive earnings (loss) | $ | 432.7 |
| | $ | (62.2 | ) | | $ | — |
| | $ | 676.7 |
| | $ | (614.5 | ) | | $ | 432.7 |
| $ | 0.3 |
| | $ | (171.4 | ) | | $ | — |
| | $ | 241.7 |
| | $ | (70.3 | ) | | $ | 0.3 |
|
MYLAN N.V. AND SUBSIDIARIES
Notes to Condensed Consolidated Financial Statements (Unaudited) - Continued
UNAUDITED CONDENSED CONSOLIDATING STATEMENT OF COMPREHENSIVE EARNINGS
NineSix Months Ended SeptemberJune 30, 20172019
|
| | | | | | | | | | | | | | | | | | | | | | | |
| (In millions) | Mylan N.V. | | Mylan Inc. | | Guarantor Subsidiaries | | Non-Guarantor Subsidiaries | | Eliminations | | Consolidated |
| Net earnings | $ | 451.7 |
| | $ | 372.8 |
| | $ | — |
| | $ | 855.8 |
| | $ | (1,228.6 | ) | | $ | 451.7 |
|
| Other comprehensive earnings (loss), before tax: | | | | | | | | | | | |
| Foreign currency translation adjustment | 1,831.9 |
| | — |
| | — |
| | 1,831.9 |
| | (1,831.9 | ) | | 1,831.9 |
|
| Change in unrecognized gain and prior service cost related to defined benefit plans | 2.4 |
| | 0.3 |
| | — |
| | 2.1 |
| | (2.4 | ) | | 2.4 |
|
| Net unrecognized gain on derivatives in cash flow hedging relationships | 29.2 |
| | 5.5 |
| | — |
| | 23.7 |
| | (29.2 | ) | | 29.2 |
|
| Net unrecognized loss on derivatives in net investment hedging relationships | (203.2 | ) | | — |
| | — |
| | — |
| | — |
| | (203.2 | ) |
| Net unrealized gain (loss) on marketable securities | 3.5 |
| | 3.7 |
| | — |
| | (0.2 | ) | | (3.5 | ) | | 3.5 |
|
| Other comprehensive earnings, before tax | 1,663.8 |
| | 9.5 |
| | — |
| | 1,857.5 |
| | (1,867.0 | ) | | 1,663.8 |
|
| Income tax provision (benefit) | 11.3 |
| | (3.5 | ) | | — |
| | 14.8 |
| | (11.3 | ) | | 11.3 |
|
| Other comprehensive earnings, net of tax | 1,652.5 |
| | 13.0 |
| | — |
| | 1,842.7 |
| | (1,855.7 | ) | | 1,652.5 |
|
| Comprehensive earnings | $ | 2,104.2 |
| | $ | 385.8 |
| | $ | — |
| | $ | 2,698.5 |
| | $ | (3,084.3 | ) | | $ | 2,104.2 |
|
|
| | | | | | | | | | | | | | | | | | | | | | | |
| (In millions) | Mylan N.V. | | Mylan Inc. | | Guarantor Subsidiaries | | Non-Guarantor Subsidiaries | | Eliminations | | Consolidated |
| Net (loss) earnings | $ | (193.5 | ) | | $ | (185.5 | ) | | $ | — |
| | $ | 163.1 |
| | $ | 22.4 |
| | $ | (193.5 | ) |
| Other comprehensive (loss) earnings, before tax: | | | | | | | | | | | |
| Foreign currency translation adjustment | (141.9 | ) | | — |
| | — |
| | (141.9 | ) | | 141.9 |
| | (141.9 | ) |
| Change in unrecognized gain and prior service cost related to defined benefit plans | 0.2 |
| | 0.1 |
| | — |
| | 0.1 |
| | (0.2 | ) | | 0.2 |
|
| Net unrecognized gain on derivatives in cash flow hedging relationships | 35.4 |
| | 3.6 |
| | — |
| | 31.8 |
| | (35.4 | ) | | 35.4 |
|
| Net unrecognized gain on derivatives in net investment hedging relationships | 21.8 |
| | 4.6 |
| | — |
| | — |
| | (4.6 | ) | | 21.8 |
|
| Net unrealized gain on marketable securities | 0.6 |
| | — |
| | — |
| | 0.6 |
| | (0.6 | ) | | 0.6 |
|
| Other comprehensive (loss) earnings, before tax | (83.9 | ) | | 8.3 |
| | — |
| | (109.4 | ) | | 101.1 |
| | (83.9 | ) |
| Income tax provision (benefit) | 12.9 |
| | (2.0 | ) | | — |
| | 14.9 |
| | (12.9 | ) | | 12.9 |
|
| Other comprehensive (loss) earnings, net of tax | (96.8 | ) | | 10.3 |
| | — |
| | (124.3 | ) | | 114.0 |
| | (96.8 | ) |
| Comprehensive (loss) earnings | $ | (290.3 | ) | | $ | (175.2 | ) | | $ | — |
| | $ | 38.8 |
| | $ | 136.4 |
| | $ | (290.3 | ) |
MYLAN N.V. AND SUBSIDIARIES
Notes to Condensed Consolidated Financial Statements (Unaudited) - Continued
UNAUDITED CONDENSED CONSOLIDATING STATEMENT OF COMPREHENSIVE EARNINGS
Three Months Ended SeptemberJune 30, 20162018
|
| | | | | | | | | | | | | | | | | | | | | | | |
| (In millions) | Mylan N.V. | | Mylan Inc. | | Guarantor Subsidiaries | | Non-Guarantor Subsidiaries | | Eliminations | | Consolidated |
| Net (loss) earnings | $ | (119.8 | ) | | $ | 362.6 |
| | $ | — |
| | $ | 42.9 |
| | $ | (405.5 | ) | | $ | (119.8 | ) |
| Other comprehensive earnings (loss), before tax: | | | | | | | | | | | |
| Foreign currency translation adjustment | 290.6 |
| | 1.5 |
| | — |
| | 289.0 |
| | (290.5 | ) | | 290.6 |
|
| Change in unrecognized gain (loss) and prior service cost related to defined benefit plans | 0.1 |
| | 0.2 |
| | — |
| | (0.1 | ) | | (0.1 | ) | | 0.1 |
|
| Net unrecognized gain on derivatives in cash flow hedging relationships | 22.8 |
| | 2.3 |
| | — |
| | 20.5 |
| | (22.8 | ) | | 22.8 |
|
| Net unrecognized loss on derivatives in net investment hedging relationships | (10.4 | ) | | — |
| | — |
| | (10.4 | ) | | 10.4 |
| | (10.4 | ) |
| Net unrealized gain (loss) on marketable securities | 21.5 |
| | 21.5 |
| | — |
| | (0.1 | ) | | (21.4 | ) | | 21.5 |
|
| Other comprehensive earnings, before tax | 324.6 |
| | 25.5 |
| | — |
| | 298.9 |
| | (324.4 | ) | | 324.6 |
|
| Income tax provision | 13.7 |
| | 8.7 |
| | — |
| | 3.9 |
| | (12.6 | ) | | 13.7 |
|
| Other comprehensive earnings, net of tax | 310.9 |
| | 16.8 |
| | — |
| | 295.0 |
| | (311.8 | ) | | 310.9 |
|
| Comprehensive earnings | $ | 191.1 |
| | $ | 379.4 |
| | $ | — |
| | $ | 337.9 |
| | $ | (717.3 | ) | | $ | 191.1 |
|
|
| | | | | | | | | | | | | | | | | | | | | | | |
| (In millions) | Mylan N.V. | | Mylan Inc. | | Guarantor Subsidiaries | | Non-Guarantor Subsidiaries | | Eliminations | | Consolidated |
| Net earnings (loss) | $ | 37.5 |
| | $ | (23.1 | ) | | $ | — |
| | $ | 183.5 |
| | $ | (160.4 | ) | | $ | 37.5 |
|
| Other comprehensive (loss) earnings, before tax: | | | | | | | | | | | |
| Foreign currency translation adjustment | (1,088.7 | ) | | — |
| | — |
| | (1,088.7 | ) | | 1,088.7 |
| | (1,088.7 | ) |
| Change in unrecognized gain and prior service cost related to defined benefit plans | 2.8 |
| | — |
| | — |
| | 2.8 |
| | (2.8 | ) | | 2.8 |
|
| Net unrecognized (loss) gain on derivatives in cash flow hedging relationships | (62.2 | ) | | 1.9 |
| | — |
| | (64.1 | ) | | 62.2 |
| | (62.2 | ) |
| Net unrecognized gain on derivatives in net investment hedging relationships | 119.1 |
| | 0.6 |
| | — |
| | — |
| | (0.6 | ) | | 119.1 |
|
| Net unrealized gain (loss) on marketable securities | 0.3 |
| | 0.6 |
| | — |
| | (0.3 | ) | | (0.3 | ) | | 0.3 |
|
| Other comprehensive (loss) earnings, before tax | (1,028.7 | ) | | 3.1 |
| | — |
| | (1,150.3 | ) | | 1,147.2 |
| | (1,028.7 | ) |
| Income tax benefit | (20.9 | ) | | (0.4 | ) | | — |
| | (20.5 | ) | | 20.9 |
| | (20.9 | ) |
| Other comprehensive (loss) earnings, net of tax | (1,007.8 | ) | | 3.5 |
| | — |
| | (1,129.8 | ) | | 1,126.3 |
| | (1,007.8 | ) |
| Comprehensive loss | $ | (970.3 | ) | | $ | (19.6 | ) | | $ | — |
| | $ | (946.3 | ) | | $ | 965.9 |
| | $ | (970.3 | ) |
MYLAN N.V. AND SUBSIDIARIES
Notes to Condensed Consolidated Financial Statements (Unaudited) - Continued
UNAUDITED CONDENSED CONSOLIDATING STATEMENT OF COMPREHENSIVE EARNINGS
NineSix Months Ended SeptemberJune 30, 20162018
|
| | | | | | | | | | | | | | | | | | | | | | | |
| (In millions) | Mylan N.V. | | Mylan Inc. | | Guarantor Subsidiaries | | Non-Guarantor Subsidiaries | | Eliminations | | Consolidated |
| Net earnings (loss) | $ | 124.6 |
| | $ | (120.6 | ) | | $ | — |
| | $ | 341.8 |
| | $ | (221.2 | ) | | $ | 124.6 |
|
| Other comprehensive (loss) earnings, before tax: | | | | | | | | | | | |
| Foreign currency translation adjustment | (826.8 | ) | | — |
| | — |
| | (826.8 | ) | | 826.8 |
| | (826.8 | ) |
| Change in unrecognized (loss) gain and prior service cost related to defined benefit plans | (1.5 | ) | | 0.1 |
| | — |
| | (1.6 | ) | | 1.5 |
| | (1.5 | ) |
| Net unrecognized (loss) gain on derivatives in cash flow hedging relationships | (94.2 | ) | | 3.8 |
| | — |
| | (98.0 | ) | | 94.2 |
| | (94.2 | ) |
| Net unrecognized gain on derivatives in net investment hedging relationships | 59.9 |
| | 0.6 |
| | — |
| | — |
| | (0.6 | ) | | 59.9 |
|
| Net unrealized loss on marketable securities | (0.1 | ) | | — |
| | — |
| | (0.1 | ) | | 0.1 |
| | (0.1 | ) |
| Other comprehensive (loss) earnings, before tax | (862.7 | ) | | 4.5 |
| | — |
| | (926.5 | ) | | 922.0 |
| | (862.7 | ) |
| Income tax benefit | (32.1 | ) | | (0.8 | ) | | — |
| | (31.3 | ) | | 32.1 |
| | (32.1 | ) |
| Other comprehensive (loss) earnings, net of tax | (830.6 | ) | | 5.3 |
| | — |
| | (895.2 | ) | | 889.9 |
| | (830.6 | ) |
| Comprehensive loss | $ | (706.0 | ) | | $ | (115.3 | ) | | $ | — |
| | $ | (553.4 | ) | | $ | 668.7 |
| | $ | (706.0 | ) |
|
| | | | | | | | | | | | | | | | | | | | | | | |
| (In millions) | Mylan N.V. | | Mylan Inc. | | Guarantor Subsidiaries | | Non-Guarantor Subsidiaries | | Eliminations | | Consolidated |
| Net earnings | $ | 62.5 |
| | $ | 713.8 |
| | $ | — |
| | $ | 648.9 |
| | $ | (1,362.7 | ) | | $ | 62.5 |
|
| Other comprehensive earnings (loss), before tax: | | | | | | | | | | | |
| Foreign currency translation adjustment | 645.5 |
| | — |
| | — |
| | 645.5 |
| | (645.5 | ) | | 645.5 |
|
| Change in unrecognized (loss) gain and prior service cost related to defined benefit plans | (0.3 | ) | | 0.2 |
| | — |
| | (0.6 | ) | | 0.4 |
| | (0.3 | ) |
| Net unrecognized (loss) gain on derivatives in cash flow hedging relationships | (22.9 | ) | | (49.8 | ) | | — |
| | 26.9 |
| | 22.9 |
| | (22.9 | ) |
| Net unrealized loss on derivatives in net investment hedging relationships | (10.4 | ) | | — |
| | — |
| | (10.4 | ) | | 10.4 |
| | (10.4 | ) |
| Net unrealized gain on marketable securities | 32.5 |
| | 31.5 |
| | — |
| | 0.9 |
| | (32.4 | ) | | 32.5 |
|
| Other comprehensive earnings (loss), before tax | 644.4 |
| | (18.1 | ) | | — |
| | 662.3 |
| | (644.2 | ) | | 644.4 |
|
| Income tax provision (benefit) | 0.5 |
| | (6.8 | ) | | — |
| | 6.3 |
| | 0.5 |
| | 0.5 |
|
| Other comprehensive earnings (loss), net of tax | 643.9 |
| | (11.3 | ) | | — |
| | 656.0 |
| | (644.7 | ) | | 643.9 |
|
| Comprehensive earnings | $ | 706.4 |
| | $ | 702.5 |
| | $ | — |
| | $ | 1,304.9 |
| | $ | (2,007.4 | ) | | $ | 706.4 |
|
MYLAN N.V. AND SUBSIDIARIES
Notes to Condensed Consolidated Financial Statements (Unaudited) - Continued
UNAUDITED CONDENSED CONSOLIDATING BALANCE SHEET
As of SeptemberJune 30, 20172019
| | | (In millions) | Mylan N.V. | | Mylan Inc. | | Guarantor Subsidiaries | | Non-Guarantor Subsidiaries | | Eliminations | | Consolidated | Mylan N.V. | | Mylan Inc. | | Guarantor Subsidiaries | | Non-Guarantor Subsidiaries | | Eliminations | | Consolidated |
| ASSETS | | | | | | | | | | | | | | | | | | | | | | |
| Assets | | | | | | | | | | | | | | | | | | | | | | |
| Current assets: | | | | | | | | | | | | | | | | | | | | | | |
| Cash and cash equivalents | $ | — |
| | $ | 82.2 |
| | $ | — |
| | $ | 532.7 |
| | $ | — |
| | $ | 614.9 |
| $ | — |
| | $ | 20.9 |
| | $ | — |
| | $ | 190.6 |
| | $ | — |
| | $ | 211.5 |
|
| Accounts receivable, net | — |
| | 4.8 |
| | — |
| | 3,215.4 |
| | — |
| | 3,220.2 |
| — |
| | 20.4 |
| | — |
| | 2,683.4 |
| | — |
| | 2,703.8 |
|
| Inventories | — |
| | — |
| | — |
| | 2,548.1 |
| | — |
| | 2,548.1 |
| — |
| | — |
| | — |
| | 2,776.2 |
| | — |
| | 2,776.2 |
|
| Intercompany receivables | 329.2 |
| | 447.8 |
| | — |
| | 12,224.7 |
| | (13,001.7 | ) | | — |
| 482.3 |
| | 530.6 |
| | — |
| | 12,899.4 |
| | (13,912.3 | ) | | — |
|
| Prepaid expenses and other current assets | 9.9 |
| | 250.4 |
| | — |
| | 623.1 |
| | — |
| | 883.4 |
| 4.8 |
| | 99.3 |
| | — |
| | 469.8 |
| | — |
| | 573.9 |
|
| Total current assets | 339.1 |
| | 785.2 |
| | — |
| | 19,144.0 |
| | (13,001.7 | ) | | 7,266.6 |
| 487.1 |
| | 671.2 |
| | — |
| | 19,019.4 |
| | (13,912.3 | ) | | 6,265.4 |
|
| Property, plant and equipment, net | — |
| | 300.7 |
| | — |
| | 2,009.3 |
| | — |
| | 2,310.0 |
| — |
| | 246.8 |
| | — |
| | 1,899.2 |
| | — |
| | 2,146.0 |
|
| Investments in subsidiaries | 19,248.7 |
| | 10,991.2 |
| | — |
| | — |
| | (30,239.9 | ) | | — |
| 18,759.0 |
| | 12,702.4 |
| | — |
| | — |
| | (31,461.4 | ) | | — |
|
| Intercompany notes and interest receivable | 7,832.5 |
| | 10,156.1 |
| | — |
| | 1,722.6 |
| | (19,711.2 | ) | | — |
| 5,502.8 |
| | 10,964.7 |
| | — |
| | 3,079.6 |
| | (19,547.1 | ) | | — |
|
| Intangible assets, net | — |
| | — |
| | — |
| | 15,270.5 |
| | — |
| | 15,270.5 |
| — |
| | — |
| | — |
| | 12,730.7 |
| | — |
| | 12,730.7 |
|
| Goodwill | — |
| | 17.1 |
| | — |
| | 9,967.6 |
| | — |
| | 9,984.7 |
| — |
| | 17.1 |
| | — |
| | 9,675.8 |
| | — |
| | 9,692.9 |
|
| Other assets | 4.4 |
| | 91.5 |
| | — |
| | 891.2 |
| | — |
| | 987.1 |
| — |
| | 75.3 |
| | — |
| | 906.6 |
| | — |
| | 981.9 |
|
| Total assets | $ | 27,424.7 |
| | $ | 22,341.8 |
| | $ | — |
| | $ | 49,005.2 |
| | $ | (62,952.8 | ) | | $ | 35,818.9 |
| $ | 24,748.9 |
| | $ | 24,677.5 |
| | $ | — |
| | $ | 47,311.3 |
| | $ | (64,920.8 | ) | | $ | 31,816.9 |
|
| | | | | | | | | | | | | | | | | | | | | | | |
| LIABILITIES AND EQUITY | | | | | | | | | | | | | | | | | | | | | | |
| Liabilities | | | | | | | | | | | | | | | | | | | | | | |
| Current liabilities: | | | | | | | | | | | | | | | | | | | | | | |
| Trade accounts payable | $ | — |
| | $ | 36.3 |
| | $ | — |
| | $ | 1,239.8 |
| | $ | — |
| | $ | 1,276.1 |
| |
| Accounts payable | | $ | — |
| | $ | 58.1 |
| | $ | — |
| | $ | 1,480.1 |
| | $ | — |
| | $ | 1,538.2 |
|
| Short-term borrowings | — |
| | — |
| | — |
| | — |
| | — |
| | — |
| — |
| | 25.0 |
| | — |
| | 1.2 |
| | — |
| | 26.2 |
|
| Income taxes payable | — |
| | 3.7 |
| | — |
| | 11.1 |
| | — |
| | 14.8 |
| — |
| | — |
| | — |
| | 138.5 |
| | — |
| | 138.5 |
|
| Current portion of long-term debt and other long-term obligations | — |
| | 648.6 |
| | — |
| | 144.4 |
| | — |
| | 793.0 |
| 667.7 |
| | 0.2 |
| | — |
| | 56.5 |
| | — |
| | 724.4 |
|
| Intercompany payables | 650.4 |
| | 12,290.5 |
| | — |
| | 60.8 |
| | (13,001.7 | ) | | — |
| 1,526.7 |
| | 12,238.0 |
| | — |
| | 147.6 |
| | (13,912.3 | ) | | — |
|
| Other current liabilities | 138.0 |
| | 363.3 |
| | — |
| | 2,398.8 |
| | — |
| | 2,900.1 |
| 82.9 |
| | 227.2 |
| | — |
| | 1,822.9 |
| | — |
| | 2,133.0 |
|
| Total current liabilities | 788.4 |
| | 13,342.4 |
| | — |
| | 3,854.9 |
| | (13,001.7 | ) | | 4,984.0 |
| 2,277.3 |
| | 12,548.5 |
| | — |
| | 3,646.8 |
| | (13,912.3 | ) | | 4,560.3 |
|
| Long-term debt | 11,641.3 |
| | 2,252.7 |
| | — |
| | 98.4 |
| | — |
| | 13,992.4 |
| 8,781.0 |
| | 3,804.7 |
| | — |
| | 4.4 |
| | — |
| | 12,590.1 |
|
| Intercompany notes payable | 1,703.4 |
| | 3,296.2 |
| | — |
| | 14,711.6 |
| | (19,711.2 | ) | | — |
| 1,787.8 |
| | 3,069.2 |
| | — |
| | 14,690.1 |
| | (19,547.1 | ) | | — |
|
| Other long-term obligations | — |
| | 58.4 |
| | — |
| | 3,492.5 |
| | — |
| | 3,550.9 |
| — |
| | 64.2 |
| | — |
| | 2,699.5 |
| | — |
| | 2,763.7 |
|
| Total liabilities | 14,133.1 |
| | 18,949.7 |
| | — |
| | 22,157.4 |
| | (32,712.9 | ) | | 22,527.3 |
| 12,846.1 |
| | 19,486.6 |
| | — |
| | 21,040.8 |
| | (33,459.4 | ) | | 19,914.1 |
|
| | | | | | | | | | | | | | | | | | | | | | | |
| Total equity | 13,291.6 |
| | 3,392.1 |
| | — |
| | 26,847.8 |
| | (30,239.9 | ) | | 13,291.6 |
| 11,902.8 |
| | 5,190.9 |
| | — |
| | 26,270.5 |
| | (31,461.4 | ) | | 11,902.8 |
|
| | | | | | | | | | | | | | | | | | | | | | | |
| Total liabilities and equity | $ | 27,424.7 |
| | $ | 22,341.8 |
| | $ | — |
| | $ | 49,005.2 |
| | $ | (62,952.8 | ) | | $ | 35,818.9 |
| $ | 24,748.9 |
| | $ | 24,677.5 |
| | $ | — |
| | $ | 47,311.3 |
| | $ | (64,920.8 | ) | | $ | 31,816.9 |
|
MYLAN N.V. AND SUBSIDIARIES
Notes to Condensed Consolidated Financial Statements (Unaudited) - Continued
UNAUDITED CONDENSED CONSOLIDATING BALANCE SHEET
As of December 31, 20162018
|
| | | | | | | | | | | | | | | | | | | | | | | |
| (In millions) | Mylan N.V. | | Mylan Inc. | | Guarantor Subsidiaries | | Non-Guarantor Subsidiaries | | Eliminations | | Consolidated |
| ASSETS | | | | | | | | | | | |
| Assets | | | | | | | | | | | |
| Current assets: | | | | | | | | | | | |
| Cash and cash equivalents | $ | — |
| | $ | 18.2 |
| | $ | — |
| | $ | 369.9 |
| | $ | — |
| | $ | 388.1 |
|
| Accounts receivable, net | — |
| | 24.3 |
| | — |
| | 2,856.7 |
| | — |
| | 2,881.0 |
|
| Inventories | — |
| | — |
| | — |
| | 2,580.2 |
| | — |
| | 2,580.2 |
|
| Intercompany receivables | 342.9 |
| | 518.7 |
| | — |
| | 13,107.1 |
| | (13,968.7 | ) | | — |
|
| Prepaid expenses and other current assets | 5.6 |
| | 71.3 |
| | — |
| | 441.5 |
| | — |
| | 518.4 |
|
| Total current assets | 348.5 |
| | 632.5 |
| | — |
| | 19,355.4 |
| | (13,968.7 | ) | | 6,367.7 |
|
| Property, plant and equipment, net | — |
| | 259.7 |
| | — |
| | 1,910.5 |
| | — |
| | 2,170.2 |
|
| Investments in subsidiaries | 18,995.9 |
| | 13,129.5 |
| | — |
| | — |
| | (32,125.4 | ) | | — |
|
| Intercompany notes and interest receivable | 6,287.4 |
| | 10,732.6 |
| | — |
| | 2,519.8 |
| | (19,539.8 | ) | | — |
|
| Intangible assets, net | — |
| | — |
| | — |
| | 13,664.6 |
| | — |
| | 13,664.6 |
|
| Goodwill | — |
| | 17.1 |
| | — |
| | 9,730.7 |
| | — |
| | 9,747.8 |
|
| Other assets | 0.3 |
| | 68.9 |
| | — |
| | 715.4 |
| | — |
| | 784.6 |
|
| Total assets | $ | 25,632.1 |
| | $ | 24,840.3 |
| | $ | — |
| | $ | 47,896.4 |
| | $ | (65,633.9 | ) | | $ | 32,734.9 |
|
| | | | | | | | | | | | |
| LIABILITIES AND EQUITY | | | | | | | | | | | |
| Liabilities | | | | | | | | | | | |
| Current liabilities: | | | | | | | | | | | |
| Accounts payable | $ | — |
| | $ | 70.6 |
| | $ | — |
| | $ | 1,546.4 |
| | $ | — |
| | $ | 1,617.0 |
|
| Short-term borrowings | — |
| | — |
| | — |
| | 1.9 |
| | — |
| | 1.9 |
|
| Income taxes payable | — |
| | — |
| | — |
| | 121.5 |
| | — |
| | 121.5 |
|
| Current portion of long-term debt and other long-term obligations | 649.0 |
| | 0.2 |
| | — |
| | 50.6 |
| | — |
| | 699.8 |
|
| Intercompany payables | 1,618.8 |
| | 12,326.4 |
| | — |
| | 23.5 |
| | (13,968.7 | ) | | — |
|
| Other current liabilities | 21.0 |
| | 216.0 |
| | — |
| | 1,910.6 |
| | — |
| | 2,147.6 |
|
| Total current liabilities | 2,288.8 |
| | 12,613.2 |
| | — |
| | 3,654.5 |
| | (13,968.7 | ) | | 4,587.8 |
|
| Long-term debt | 9,370.1 |
| | 3,786.2 |
| | — |
| | 4.9 |
| | — |
| | 13,161.2 |
|
| Intercompany notes payable | 1,806.1 |
| | 3,094.2 |
| | — |
| | 14,639.5 |
| | (19,539.8 | ) | | — |
|
| Other long-term obligations | — |
| | 48.6 |
| | — |
| | 2,770.2 |
| | — |
| | 2,818.8 |
|
| Total liabilities | 13,465.0 |
| | 19,542.2 |
| | — |
| | 21,069.1 |
| | (33,508.5 | ) | | 20,567.8 |
|
| | | | | | | | | | | | |
| Total equity | 12,167.1 |
| | 5,298.1 |
| | — |
| | 26,827.3 |
| | (32,125.4 | ) | | 12,167.1 |
|
| | | | | | | | | | | | |
| Total liabilities and equity | $ | 25,632.1 |
| | $ | 24,840.3 |
| | $ | — |
| | $ | 47,896.4 |
| | $ | (65,633.9 | ) | | $ | 32,734.9 |
|
|
| | | | | | | | | | | | | | | | | | | | | | | |
| (In millions) | Mylan N.V. | | Mylan Inc. | | Guarantor Subsidiaries | | Non-Guarantor Subsidiaries | | Eliminations | | Consolidated |
| ASSETS | | | | | | | | | | | |
| Assets | | | | | | | | | | | |
| Current assets: | | | | | | | | | | | |
| Cash and cash equivalents | $ | 0.3 |
| | $ | 12.3 |
| | $ | — |
| | $ | 986.2 |
| | $ | — |
| | $ | 998.8 |
|
| Accounts receivable, net | — |
| | 12.3 |
| | — |
| | 3,298.6 |
| | — |
| | 3,310.9 |
|
| Inventories | — |
| | — |
| | — |
| | 2,456.4 |
| | — |
| | 2,456.4 |
|
| Intercompany receivables | 215.9 |
| | 416.0 |
| | — |
| | 10,506.6 |
| | (11,138.5 | ) | | — |
|
| Prepaid expenses and other current assets | — |
| | 256.4 |
| | — |
| | 500.0 |
| | — |
| | 756.4 |
|
| Total current assets | 216.2 |
| | 697.0 |
| | — |
| | 17,747.8 |
| | (11,138.5 | ) | | 7,522.5 |
|
| Property, plant and equipment, net | — |
| | 360.3 |
| | — |
| | 1,961.9 |
| | — |
| | 2,322.2 |
|
| Investments in subsidiaries | 15,606.2 |
| | 8,277.8 |
| | — |
| | — |
| | (23,884.0 | ) | | — |
|
| Intercompany notes and interest receivable | 7,952.3 |
| | 9,817.3 |
| | — |
| | 16.7 |
| | (17,786.3 | ) | | — |
|
| Intangible assets, net | — |
| | — |
| | — |
| | 14,447.8 |
| | — |
| | 14,447.8 |
|
| Goodwill | — |
| | 17.1 |
| | — |
| | 9,214.8 |
| | — |
| | 9,231.9 |
|
| Other assets | 5.2 |
| | 51.9 |
| | — |
| | 1,144.7 |
| | — |
| | 1,201.8 |
|
| Total assets | $ | 23,779.9 |
| | $ | 19,221.4 |
| | $ | — |
| | $ | 44,533.7 |
| | $ | (52,808.8 | ) | | $ | 34,726.2 |
|
| | | | | | | | | | | | |
| LIABILITIES AND EQUITY | | | | | | | | | | | |
| Liabilities | | | | | | | | | | | |
| Current liabilities: | | | | | | | | | | | |
| Trade accounts payable | $ | 3.9 |
| | $ | 69.6 |
| | $ | — |
| | $ | 1,274.6 |
| | $ | — |
| | $ | 1,348.1 |
|
| Short-term borrowings | — |
| | — |
| | — |
| | 46.4 |
| | — |
| | 46.4 |
|
| Income taxes payable | — |
| | — |
| | — |
| | 97.7 |
| | — |
| | 97.7 |
|
| Current portion of long-term debt and other long-term obligations | — |
| | 0.2 |
| | — |
| | 289.8 |
| | — |
| | 290.0 |
|
| Intercompany payables | 416.0 |
| | 10,722.5 |
| | — |
| | — |
| | (11,138.5 | ) | | — |
|
| Other current liabilities | 90.9 |
| | 388.8 |
| | — |
| | 2,778.8 |
| | — |
| | 3,258.5 |
|
| Total current liabilities | 510.8 |
| | 11,181.1 |
| | — |
| | 4,487.3 |
| | (11,138.5 | ) | | 5,040.7 |
|
| Long-term debt | 12,151.5 |
| | 2,897.6 |
| | — |
| | 153.8 |
| | — |
| | 15,202.9 |
|
| Intercompany notes payable | — |
| | 3,870.9 |
| | — |
| | 13,915.4 |
| | (17,786.3 | ) | | — |
|
| Other long-term obligations | — |
| | 58.1 |
| | — |
| | 3,306.9 |
| | — |
| | 3,365.0 |
|
| Total liabilities | 12,662.3 |
| | 18,007.7 |
| | — |
| | 21,863.4 |
| | (28,924.8 | ) | | 23,608.6 |
|
| | | | | | | | | | | | |
| Total equity | 11,117.6 |
| | 1,213.7 |
| | — |
| | 22,670.3 |
| | (23,884.0 | ) | | 11,117.6 |
|
| | | | | | | | | | | | |
| Total liabilities and equity | $ | 23,779.9 |
| | $ | 19,221.4 |
| | $ | — |
| | $ | 44,533.7 |
| | $ | (52,808.8 | ) | | $ | 34,726.2 |
|
MYLAN N.V. AND SUBSIDIARIES
Notes to Condensed Consolidated Financial Statements (Unaudited) - Continued
UNAUDITED CONDENSED CONSOLIDATING STATEMENT OF CASH FLOWS
NineSix Months Ended SeptemberJune 30, 20172019
| | | (In millions) | Mylan N.V. | | Mylan Inc. | | Guarantor Subsidiaries | | Non-Guarantor Subsidiaries | | Eliminations | | Consolidated | Mylan N.V. | | Mylan Inc. | | Guarantor Subsidiaries | | Non-Guarantor Subsidiaries | | Eliminations | | Consolidated |
| Cash flows from operating activities: | | | | | | | | | | | | | | | | | | | | | | |
| Net cash (used in) provided by operating activities | $ | (175.1 | ) | | $ | (338.8 | ) | | $ | — |
| | $ | 2,083.2 |
| | $ | — |
| | $ | 1,569.3 |
| $ | (162.9 | ) | | $ | (67.1 | ) | | $ | — |
| | $ | 859.2 |
| | $ | — |
| | $ | 629.2 |
|
| Cash flows from investing activities: | | | | | | | | | | | | | | | | | | | | | | |
| Capital expenditures | — |
| | (31.4 | ) | | — |
| | (125.0 | ) | | — |
| | (156.4 | ) | — |
| | (25.4 | ) | | — |
| | (71.8 | ) | | — |
| | (97.2 | ) |
| Change in restricted cash | — |
| | — |
| | — |
| | 12.6 |
| | — |
| | 12.6 |
| |
| Purchase of marketable securities | — |
| | — |
| | — |
| | (8.9 | ) | | — |
| | (8.9 | ) | |
| Proceeds from the sale of assets | — |
| | — |
| | — |
| | 31.1 |
| | — |
| | 31.1 |
| |
| Purchase of available for sale securities and other investments | | — |
| | — |
| | — |
| | (12.7 | ) | | — |
| | (12.7 | ) |
| Proceeds from the sale of marketable securities | — |
| | — |
| | — |
| | 8.9 |
| | — |
| | 8.9 |
| — |
| | — |
| | — |
| | 12.5 |
| | — |
| | 12.5 |
|
| Cash paid for acquisitions, net | (71.6 | ) | | — |
| | — |
| | — |
| | — |
| | (71.6 | ) | — |
| | — |
| | — |
| | (7.1 | ) | | — |
| | (7.1 | ) |
| Investments in affiliates | — |
| | (21.1 | ) | | — |
| | — |
| | 21.1 |
| | — |
| — |
| | (12.9 | ) | | — |
| | — |
| | 12.9 |
| | — |
|
| Dividends from affiliates | 168.1 |
| | — |
| | — |
| | — |
| | (168.1 | ) | | — |
| 39.4 |
| | — |
| | — |
| | — |
| | (39.4 | ) | | — |
|
| Loans to affiliates | (143.7 | ) | | (364.1 | ) | | — |
| | (2,558.0 | ) | | 3,065.8 |
| | — |
| (99.4 | ) | | — |
| | — |
| | (2,568.3 | ) | | 2,667.7 |
| | — |
|
| Repayments of loans from affiliates | 1,066.4 |
| | 0.3 |
| | — |
| | 943.6 |
| | (2,010.3 | ) | | — |
| 859.8 |
| | — |
| | — |
| | 1,885.6 |
| | (2,745.4 | ) | | — |
|
| Payments for product rights and other, net | — |
| | (0.3 | ) | | — |
| | (558.5 | ) | | — |
| | (558.8 | ) | — |
| | — |
| | — |
| | (129.5 | ) | | — |
| | (129.5 | ) |
| Net cash provided by (used in) investing activities | 1,019.2 |
| | (416.6 | ) | | — |
| | (2,254.2 | ) | | 908.5 |
| | (743.1 | ) | 799.8 |
| | (38.3 | ) | | — |
| | (891.3 | ) | | (104.2 | ) | | (234.0 | ) |
| Cash flows from financing activities: | | | | | | | | | | | | | | | | | | | | | | |
| Payments of financing fees | (8.3 | ) | | (0.4 | ) | | — |
| | — |
| | — |
| | (8.7 | ) | — |
| | (2.0 | ) | | — |
| | (0.1 | ) | | — |
| | (2.1 | ) |
| Change in short-term borrowings, net | — |
| | — |
| | — |
| | (48.3 | ) | | — |
| | (48.3 | ) | — |
| | 25.0 |
| | — |
| | (0.7 | ) | | — |
| | 24.3 |
|
| Proceeds from issuance of long-term debt | 554.5 |
| | — |
| | — |
| | 1.3 |
| | — |
| | 555.8 |
| — |
| | — |
| | — |
| | 5.5 |
| | — |
| | 5.5 |
|
| Payments of long-term debt | (1,500.0 | ) | | — |
| | — |
| | (247.3 | ) | | — |
| | (1,747.3 | ) | (550.0 | ) | | — |
| | — |
| | (5.5 | ) | | — |
| | (555.5 | ) |
| Proceeds from exercise of stock options | 12.8 |
| | — |
| | — |
| | — |
| | — |
| | 12.8 |
| 4.0 |
| | — |
| | — |
| | — |
| | — |
| | 4.0 |
|
| Taxes paid related to net share settlement of equity awards | (7.4 | ) | | — |
| | — |
| | — |
| | — |
| | (7.4 | ) | (8.3 | ) | | — |
| | — |
| | — |
| | — |
| | (8.3 | ) |
| Contingent consideration payments | — |
| | — |
| | — |
| | (10.1 | ) | | — |
| | (10.1 | ) | — |
| | — |
| | — |
| | (38.8 | ) | | — |
| | (38.8 | ) |
| Capital contribution from affiliates | — |
| | — |
| | — |
| | 21.1 |
| | (21.1 | ) | | — |
| — |
| | — |
| | — |
| | 12.9 |
| | (12.9 | ) | | — |
|
| Capital payments to affiliates | — |
| | — |
| | — |
| | (168.1 | ) | | 168.1 |
| | — |
| — |
| | — |
| | — |
| | (39.4 | ) | | 39.4 |
| | — |
|
| Payments on borrowings from affiliates | — |
| | (1,664.4 | ) | | — |
| | (345.9 | ) | | 2,010.3 |
| | — |
| (809.0 | ) | | (1,780.8 | ) | | — |
| | (155.6 | ) | | 2,745.4 |
| | — |
|
| Proceeds from borrowings from affiliates | 104.0 |
| | 2,497.5 |
| | — |
| | 464.3 |
| | (3,065.8 | ) | | — |
| 726.4 |
| | 1,865.9 |
| | — |
| | 75.4 |
| | (2,667.7 | ) | | — |
|
| Other items, net | — |
| | (7.4 | ) | | — |
| | 6.7 |
| | — |
| | (0.7 | ) | — |
| | — |
| | — |
| | (1.0 | ) | | — |
| | (1.0 | ) |
| Net cash (used in) provided by financing activities | (844.4 | ) | | 825.3 |
| | — |
| | (326.3 | ) | | (908.5 | ) | | (1,253.9 | ) | (636.9 | ) | | 108.1 |
| | — |
| | (147.3 | ) | | 104.2 |
| | (571.9 | ) |
| Effect on cash of changes in exchange rates | — |
| | — |
| | — |
| | 43.8 |
| | — |
| | 43.8 |
| — |
| | — |
| | — |
| | 0.1 |
| | — |
| | 0.1 |
|
| Net (decrease) increase in cash and cash equivalents | (0.3 | ) | | 69.9 |
| | — |
| | (453.5 | ) | | — |
| | (383.9 | ) | |
| Cash and cash equivalents — beginning of period | 0.3 |
| | 12.3 |
| | — |
| | 986.2 |
| | — |
| | 998.8 |
| |
| Cash and cash equivalents — end of period | $ | — |
| | $ | 82.2 |
| | $ | — |
| | $ | 532.7 |
| | $ | — |
| | $ | 614.9 |
| |
| Net increase (decrease) in cash, cash equivalents and restricted cash | | — |
| | 2.7 |
| | — |
| | (179.3 | ) | | — |
| | (176.6 | ) |
| Cash, cash equivalents and restricted cash — beginning of period | | — |
| | 18.2 |
| | — |
| | 371.1 |
| | — |
| | 389.3 |
|
| Cash, cash equivalents and restricted cash — end of period | | $ | — |
| | $ | 20.9 |
| | $ | — |
| | $ | 191.8 |
| | $ | — |
| | $ | 212.7 |
|
MYLAN N.V. AND SUBSIDIARIES
Notes to Condensed Consolidated Financial Statements (Unaudited) - Continued
UNAUDITED CONDENSED CONSOLIDATING STATEMENT OF CASH FLOWS
NineSix Months Ended SeptemberJune 30, 20162018
|
| | | | | | | | | | | | | | | | | | | | | | | |
| (In millions) | Mylan N.V. | | Mylan Inc. | | Guarantor Subsidiaries | | Non-Guarantor Subsidiaries | | Eliminations | | Consolidated |
| Cash flows from operating activities: | | | | | | | | | | | |
| Net cash (used in) provided by operating activities | $ | (111.4 | ) | | $ | (644.2 | ) | | $ | — |
| | $ | 1,807.6 |
| | $ | — |
| | $ | 1,052.0 |
|
| Cash flows from investing activities: | | | | | | | | | | | |
| Capital expenditures | — |
| | (11.2 | ) | | — |
| | (64.7 | ) | | — |
| | (75.9 | ) |
| Purchase of available for sale securities and other investments | — |
| | — |
| | — |
| | (44.4 | ) | | — |
| | (44.4 | ) |
| Proceeds from the sale of marketable securities | — |
| | 36.3 |
| | — |
| | 29.0 |
| | — |
| | 65.3 |
|
| Cash paid for acquisitions, net | — |
| | — |
| | — |
| | (63.3 | ) | | — |
| | (63.3 | ) |
| Investments in affiliates | — |
| | (13.2 | ) | | — |
| | — |
| | 13.2 |
| | — |
|
| Dividends from affiliates | 61.0 |
| | — |
| | — |
| | — |
| | (61.0 | ) | | — |
|
| Loans to affiliates | (434.7 | ) | | — |
| | — |
| | (3,739.1 | ) | | 4,173.8 |
| | — |
|
| Repayments of loans from affiliates | 1,689.0 |
| | — |
| | — |
| | 2,867.3 |
| | (4,556.3 | ) | | — |
|
| Payments for product rights and other, net | — |
| | (0.3 | ) | | — |
| | (614.1 | ) | | — |
| | (614.4 | ) |
| Net cash provided by (used in) investing activities | 1,315.3 |
| | 11.6 |
| | — |
| | (1,629.3 | ) | | (430.3 | ) | | (732.7 | ) |
| Cash flows from financing activities: | | | | | | | | | | | |
| Payments of financing fees | — |
| | (18.3 | ) | | — |
| | (0.1 | ) | | — |
| | (18.4 | ) |
| Purchase of ordinary shares | (432.0 | ) | | — |
| | — |
| | — |
| | — |
| | (432.0 | ) |
| Change in short-term borrowings, net | 39.0 |
| | — |
| | — |
| | 140.0 |
| | — |
| | 179.0 |
|
| Proceeds from issuance of long-term debt | 496.5 |
| | 2,079.2 |
| | — |
| | 1.5 |
| | — |
| | 2,577.2 |
|
| Payments of long-term debt | (1,446.5 | ) | | (1,150.0 | ) | | — |
| | (2.1 | ) | | — |
| | (2,598.6 | ) |
| Proceeds from exercise of stock options | 13.7 |
| | — |
| | — |
| | — |
| | — |
| | 13.7 |
|
| Taxes paid related to net share settlement of equity awards | (10.1 | ) | | — |
| | — |
| | — |
| | — |
| | (10.1 | ) |
| Contingent consideration payments | — |
| | — |
| | — |
| | (0.2 | ) | | — |
| | (0.2 | ) |
| Capital contribution from affiliates | — |
| | — |
| | — |
| | 13.2 |
| | (13.2 | ) | | — |
|
| Capital payments to affiliates | — |
| | — |
| | — |
| | (61.0 | ) | | 61.0 |
| | — |
|
| Payments on borrowings from affiliates | (1,173.7 | ) | | (2,772.6 | ) | | — |
| | (610.0 | ) | | 4,556.3 |
| | — |
|
| Proceeds from borrowings from affiliates | 1,309.4 |
| | 2,476.5 |
| | — |
| | 387.9 |
| | (4,173.8 | ) | | — |
|
| Other items, net | — |
| | — |
| | — |
| | (0.5 | ) | | — |
| | (0.5 | ) |
| Net cash (used in) provided by financing activities | (1,203.7 | ) | | 614.8 |
| | — |
| | (131.3 | ) | | 430.3 |
| | (289.9 | ) |
| Effect on cash of changes in exchange rates | — |
| | — |
| | — |
| | (15.1 | ) | | — |
| | (15.1 | ) |
| Net increase (decrease) in cash, cash equivalents and restricted cash | 0.2 |
| | (17.8 | ) | | — |
| | 31.9 |
| | — |
| | 14.3 |
|
| Cash, cash equivalents and restricted cash — beginning of period | — |
| | 23.8 |
| | — |
| | 346.1 |
| | — |
| | 369.9 |
|
| Cash, cash equivalents and restricted cash — end of period | $ | 0.2 |
| | $ | 6.0 |
| | $ | — |
| | $ | 378.0 |
| | $ | — |
| | $ | 384.2 |
|
|
| | | | | | | | | | | | | | | | | | | | | | | |
| (In millions) | Mylan N.V. | | Mylan Inc. | | Guarantor Subsidiaries | | Non-Guarantor Subsidiaries | | Eliminations | | Consolidated |
| Cash flows from operating activities: | | | | | | | | | | | |
| Net cash (used in) provided by operating activities | $ | (1.6 | ) | | $ | 724.7 |
| | $ | — |
| | $ | 974.6 |
| | $ | — |
| | $ | 1,697.7 |
|
| Cash flows from investing activities: | | | | | | | | | | | |
| Capital expenditures | — |
| | (64.8 | ) | | — |
| | (174.7 | ) | | — |
| | (239.5 | ) |
| Change in restricted cash | — |
| | (49.5 | ) | | — |
| | (1.0 | ) | | — |
| | (50.5 | ) |
| Purchase of marketable securities | — |
| | (4.1 | ) | | — |
| | (18.7 | ) | | — |
| | (22.8 | ) |
| Cash paid for Meda’s unconditional deferred payment | — |
| | — |
| | — |
| | (308.0 | ) | | — |
| | (308.0 | ) |
| Proceeds from the sale of marketable securities | — |
| | — |
| | — |
| | 15.8 |
| | — |
| | 15.8 |
|
| Cash paid for acquisitions, net | (5,278.5 | ) | | (931.3 | ) | | — |
| | 58.1 |
| | — |
| | (6,151.7 | ) |
| Settlement of acquisition-related foreign currency derivatives | (128.6 | ) | | — |
| | — |
| | — |
| | — |
| | (128.6 | ) |
| Investments in affiliates | — |
| | (43.6 | ) | | — |
| | — |
| | 43.6 |
| | — |
|
| Dividends from affiliates | 135.6 |
| | — |
| | — |
| | — |
| | (135.6 | ) | | — |
|
| Loans to affiliates | (7,971.9 | ) | | (417.0 | ) | | — |
| | (726.3 | ) | | 9,115.2 |
| | — |
|
| Repayments of loans from affiliates | 6,838.3 |
| | 442.6 |
| | — |
| | 1,031.3 |
| | (8,312.2 | ) | | — |
|
| Payments for product rights and other, net | — |
| | (0.4 | ) | | — |
| | (195.9 | ) | | — |
| | (196.3 | ) |
| Net cash used in investing activities | (6,405.1 | ) | | (1,068.1 | ) | | — |
| | (319.4 | ) | | 711.0 |
| | (7,081.6 | ) |
| Cash flows from financing activities: | | | | | | | | | | | |
| Payments of financing fees | (95.3 | ) | | — |
| | — |
| | — |
| | — |
| | (95.3 | ) |
| Change in short-term borrowings, net | — |
| | — |
| | — |
| | 48.6 |
| | — |
| | 48.6 |
|
| Proceeds from issuance of long-term debt | 6,478.8 |
| | — |
| | — |
| | 41.0 |
| | — |
| | 6,519.8 |
|
| Payments of long-term debt | — |
| | (500.0 | ) | | — |
| | (567.0 | ) | | — |
| | (1,067.0 | ) |
| Proceeds from exercise of stock options | 11.1 |
| | — |
| | — |
| | — |
| | — |
| | 11.1 |
|
| Taxes paid related to net share settlement of equity awards | (12.9 | ) | | — |
| | — |
| | — |
| | — |
| | (12.9 | ) |
| Contingent consideration payments | — |
| | — |
| | — |
| | (15.5 | ) | | — |
| | (15.5 | ) |
| Capital contribution from affiliates | — |
| | — |
| | — |
| | 43.6 |
| | (43.6 | ) | | — |
|
| Capital payments to affiliates | — |
| | — |
| | — |
| | (135.6 | ) | | 135.6 |
| | — |
|
| Payments on borrowings from affiliates | — |
| | (1,361.8 | ) | | — |
| | (6,950.4 | ) | | 8,312.2 |
| | — |
|
| Proceeds from borrowings from affiliates | 25.0 |
| | 1,380.8 |
| | — |
| | 7,709.4 |
| | (9,115.2 | ) | | — |
|
| Acquisition of noncontrolling interest | — |
| | — |
| | — |
| | (1.0 | ) | | — |
| | (1.0 | ) |
| Other items, net | — |
| | (12.9 | ) | | — |
| | 14.5 |
| | — |
| | 1.6 |
|
| Net cash provided by (used in) financing activities | 6,406.7 |
| | (493.9 | ) | | — |
| | 187.6 |
| | (711.0 | ) | | 5,389.4 |
|
| Effect on cash of changes in exchange rates | — |
| | — |
| | — |
| | 15.1 |
| | — |
| | 15.1 |
|
| Net (decrease) increase in cash and cash equivalents | — |
| | (837.3 | ) | | — |
| | 857.9 |
| | — |
| | 20.6 |
|
| Cash and cash equivalents — beginning of period | — |
| | 870.5 |
| | — |
| | 365.5 |
| | — |
| | 1,236.0 |
|
| Cash and cash equivalents — end of period | $ | — |
| | $ | 33.2 |
| | $ | — |
| | $ | 1,223.4 |
| | $ | — |
| | $ | 1,256.6 |
|
MYLAN N.V. AND SUBSIDIARIES
Notes to Condensed Consolidated Financial Statements (Unaudited) - Continued
The following tables provide a reconciliation of cash and cash equivalents, as reported on our unaudited condensed consolidating balance sheets, to cash, cash equivalents and restricted cash, as reported on our unaudited condensed consolidating statements of cash flows (in millions):
|
| | | | | | | | | | | | | | | | | | | | | | | |
| | June 30, 2019 |
| | Mylan N.V. | | Mylan Inc. | | Guarantor Subsidiaries | | Non-Guarantor Subsidiaries | | Eliminations | | Consolidated |
| Cash and cash equivalents | $ | — |
| | $ | 20.9 |
| | $ | — |
| | $ | 190.6 |
| | $ | — |
| | $ | 211.5 |
|
| Restricted cash, included in prepaid expenses and other current assets | — |
| | — |
| | — |
| | 1.2 |
| | — |
| | 1.2 |
|
| Cash, cash equivalents and restricted cash | $ | — |
| | $ | 20.9 |
| | $ | — |
| | $ | 191.8 |
| | $ | — |
| | $ | 212.7 |
|
|
| | | | | | | | | | | | | | | | | | | | | | | |
| | December 31, 2018 |
| | Mylan N.V. | | Mylan Inc. | | Guarantor Subsidiaries | | Non-Guarantor Subsidiaries | | Eliminations | | Consolidated |
| Cash and cash equivalents | $ | — |
| | $ | 18.2 |
| | $ | — |
| | $ | 369.9 |
| | $ | — |
| | $ | 388.1 |
|
| Restricted cash, included in prepaid expenses and other current assets | — |
| | — |
| | — |
| | 1.2 |
| | — |
| | 1.2 |
|
| Cash, cash equivalents and restricted cash | $ | — |
| | $ | 18.2 |
| | $ | — |
| | $ | 371.1 |
| | $ | — |
| | $ | 389.3 |
|
|
| | | | | | | | | | | | | | | | | | | | | | | |
| | June 30, 2018 |
| | Mylan N.V. | | Mylan Inc. | | Guarantor Subsidiaries | | Non-Guarantor Subsidiaries | | Eliminations | | Consolidated |
| Cash and cash equivalents | $ | 0.2 |
| | $ | 6.0 |
| | $ | — |
| | $ | 324.0 |
| | $ | — |
| | $ | 330.2 |
|
| Restricted cash, included in prepaid expenses and other current assets | — |
| | — |
| | — |
| | 54.0 |
| | — |
| | 54.0 |
|
| Cash, cash equivalents and restricted cash | $ | 0.2 |
| | $ | 6.0 |
| | $ | — |
| | $ | 378.0 |
| | $ | — |
| | $ | 384.2 |
|
MYLAN N.V. AND SUBSIDIARIES
Notes to Condensed Consolidated Financial Statements (Unaudited) - Continued
On December 5, 2016, the Company announced a restructuring programs in certain locationsprogram representing initial steps in a series of actions in certain locations that are anticipated to further streamline its operations globally. Since 2015, the Company has made a number of significant acquisitions, and as part of the holistic, global integration of these acquisitions, the Company is focused on how to best optimize and maximize all of its assets across the organization and across all geographies.
Charges for restructuring and ongoing cost reduction initiatives are recorded in the period the Company commits to a restructuring or cost reduction plan, or executes specific actions contemplated by the plan and all criteria for liability recognition have been met.
TheDuring the second quarter of 2018, the Company continuescommenced comprehensive restructuring and remediation activities, which are aimed at reducing the complexity at the Morgantown, West Virginia plant and include the discontinuation and transfer to develop the detailsother manufacturing sites of a number of products, a reduction of the cost reduction initiatives, including workforce actions and other potential restructuring activities beyond the programs announced, including potential shutdown or consolidation of certain operations.extensive process and facility remediation. The continued restructuring actions are expected to be implemented through fiscal yearother than for this plant were substantially complete as of December 31, 2018. In the fourth quarter of 2017, the Company committed to additional actions and now anticipatesWe have incurred total aggregate pre-tax charges for committed restructuring activities ranging between $375.0 million and $450.0 million, inclusive of the 2016 and year to date 2017 restructuring charges of $262.4 million. As additional restructuring activities are undertaken, the Company expects to incur additional costs including employee related costs such as severance and continuation of healthcare and other benefits;approximately $655.4 million through June 30, 2019. During 2019, we have incurred approximately $54.4 million in restructuring expenses for non-cash asset impairments; accelerated depreciation; costs associated with contract terminations; and other closure costs.write-offs at the Morgantown plant. At this time, the expenses related to the additional restructuring activities at the Morgantown, West Virginia plant cannot be reasonably estimated.
The following table summarizes the restructuring charges and the reserve activity from December 31, 20162018 to SeptemberJune 30, 2017:2019:
| | | (In millions) | Employee Related Costs | | Other Exit Costs | | Total | Employee Related Costs | | Other Exit Costs | | Total |
| Balance at December 31, 2016: | $ | 138.6 |
| | $ | 1.6 |
| | $ | 140.2 |
| |
| Charges | 9.6 |
| | 13.5 |
| | 23.1 |
| |
| Reclassifications | (8.3 | ) | | 8.3 |
| | — |
| |
| Balance at December 31, 2018: | | $ | 60.8 |
| | $ | 11.8 |
| | $ | 72.6 |
|
Charges (1) | | 1.8 |
| | 18.1 |
| | 19.9 |
|
| Reclassification due to new leasing standard | | — |
| | (8.1 | ) | | (8.1 | ) |
| Cash payment | (54.2 | ) | | (1.0 | ) | | (55.2 | ) | (26.4 | ) | | (1.4 | ) | | (27.8 | ) |
| Utilization | — |
| | (19.8 | ) | | (19.8 | ) | — |
| | (16.7 | ) | | (16.7 | ) |
| Foreign currency translation | (9.8 | ) | | — |
| | (9.8 | ) | (1.1 | ) | | — |
| | (1.1 | ) |
| Balance at March 31, 2017: | $ | 75.9 |
| | $ | 2.6 |
| | $ | 78.5 |
| |
| Charges | 13.2 |
| | 3.0 |
| | 16.2 |
| |
| Balance at March 31, 2019: | | $ | 35.1 |
| | $ | 3.7 |
| | $ | 38.8 |
|
Charges (1) | | 10.0 |
| | 47.6 |
| | 57.6 |
|
| Cash payment | (32.4 | ) | | (1.9 | ) | | (34.3 | ) | (8.4 | ) | | (3.2 | ) | | (11.6 | ) |
| Utilization | — |
| | (1.8 | ) | | (1.8 | ) | — |
| | (44.5 | ) | | (44.5 | ) |
| Foreign currency translation | (4.4 | ) | | — |
| | (4.4 | ) | 0.6 |
| | (0.1 | ) | | 0.5 |
|
| Balance at June 30, 2017: | $ | 52.3 |
| | $ | 1.9 |
| | $ | 54.2 |
| |
Charges (1) | 20.0 |
| | 53.4 |
| | 73.4 |
| |
| Reclassifications | — |
| | — |
| | — |
| |
| Cash payment | (14.2 | ) | | (0.7 | ) | | (14.9 | ) | |
| Utilization | — |
| | (53.4 | ) | | (53.4 | ) | |
| Foreign currency translation | (3.3 | ) | | — |
| | (3.3 | ) | |
| Balance at September 30, 2017: | $ | 54.8 |
| | $ | 1.2 |
| | $ | 56.0 |
| |
| Balance at June 30, 2019: | | $ | 37.3 |
| | $ | 3.5 |
| | $ | 40.8 |
|
| |
(1) | For the three months ended SeptemberJune 30, 2017,2019, total restructuring charges in North America, Europe and Rest of World and Corporate / Other were approximately $5.6$45.5 million, $16.3 million, $19.1$10.7 million and $32.4$1.4 million, respectively. For the ninesix months ended SeptemberJune 30, 2017,2019, total restructuring charges in North America, Europe and Rest of World and Corporate / Other were approximately $12.8$56.7 million, $32.9 million, $33.7$18.5 million and $33.3$2.3 million, respectively. |
MYLAN N.V. AND SUBSIDIARIES
Notes to Condensed Consolidated Financial Statements (Unaudited) - Continued
At SeptemberJune 30, 20172019 and December 31, 2016,2018, accrued liabilities for restructuring and other cost reduction programs were primarily included in other current liabilities on the condensed consolidated balance sheets.
MYLAN N.V. AND SUBSIDIARIES
Notes to Condensed Consolidated Balance Sheets.Financial Statements (Unaudited) - Continued
| |
| 18. | Collaboration and Licensing Agreements |
We periodically enter into collaboration and licensing agreements with other pharmaceutical companies for the development, manufacture, marketing and/or sale of pharmaceutical products. Our significant collaboration agreements are primarily focused on the development, manufacturing, supply and commercialization of multiple, high-value generic biologic compounds, insulin analog products and respiratory products, among other complex products. Under these agreements, we have future potential milestone payments and co-development expenses payable to third parties as part of our licensing, development and co-development programs. Payments under these agreements generally become due and are payable upon the satisfaction or achievement of certain developmental, regulatory or commercial milestones or as development expenses are incurred on defined projects. Milestone payment obligations are uncertain, including the prediction of timing and the occurrence of events triggering a future obligation and are not reflected as liabilities in the Condensed Consolidated Balance Sheets,condensed consolidated balance sheets, except for milestone and royalty obligations reflected as acquisition related contingent consideration. Refer to Note 1112 Financial Instruments and Risk Management for contingent considerationadditional information. Our potential maximum development milestones not accrued for at June 30, 2019 totaled approximately $476.0 million, which includes the new agreements entered into as described in Note 4 Acquisitions and Other Transactions. We estimate the amounts recorded.that may be paid through the end of 2019 to be approximately $79.0 million. These agreements may also include potential sales-based milestones and call for us to pay a percentage of amounts earned from the sale of the product as a royalty or a profit share. The amounts disclosed do not include sales basedsales-based milestones or royalty obligations on future sales of product as the timing and amount of future sales levels and costs to produce products subject to these obligations is not reasonably estimable. These sales-based milestones or royalty obligations may be significant depending upon the level of commercial sales for each product.
There have been no other significant changes to our collaboration and licensing agreements as disclosed in our Annual Report on2018 Form 10-K for the year ended December 31, 2016, as amended.10-K.
Tax Examinations
The Company is subject to income taxes and tax audits in many jurisdictions. A certain degree of estimation is thus required in recording the assets and liabilities related to income taxes. Tax audits and examinations can involve complex issues, interpretations, and judgments and the resolution of matters that may span multiple years, particularly if subject to litigation or negotiation.
Although the Company believes that adequate provisions have been made for these uncertain tax positions, the Company’s assessment of uncertain tax positions is based on estimates and assumptions that the Company believes are reasonable but the estimates for unrecognized tax benefits and potential tax benefits may not be representative of actual outcomes, and variations from such estimates could materially affect the Company’s financial condition, results of operations or cash flows in the period of resolution, settlement or when the statutes of limitations expire.
Mylan is subject to ongoing U.S. Internal Revenue Service (“IRS”) examinations and is a voluntary participant in the IRS Compliance Assurance Process (“CAP”), which allows Mylan to work collaboratively with the IRS to identify and review tax matters on an ongoing basis. The years 2015, 2016 and 2017 are open years under examination. The years 2012, 2013 and 2014 have one matter open, and a Tax Court petition has been filed regarding the matter and a trial was held in December 2018 and is discussed further below. On February 27, 2015, Mylan N.V. acquired Mylan Inc. and Abbott Laboratories’ (“Abbott”) non-U.S. developed markets specialty and branded generics business (collectively, the “EPD Business Acquisition”). In connection with the EPD Business Acquisition, we entered into intercompany transactions with our affiliates that affect our U.S. tax liability. Mylan N.V. is not incorporated in the U.S. and expects to be treated as a non-U.S. corporation for U.S. federal income tax purposes. As part of our ongoing participation and cooperation in the CAP, we have received and responded to various IRS requests for information about, among other matters, the EPD Business Acquisition, including the interest rates used for intercompany loans and our status as a non-U.S. corporation for U.S. federal income tax purposes, and we have been meeting with the IRS to discuss our respective positions on these matters and potential resolution of them.
During the second quarter, we reached an agreement in principle with the IRS to resolve all issues relating to our positions on the EPD Business Acquisition. Under the agreement, our status as a non-U.S. corporation for U.S. Federal income tax purposes would be confirmed, and we would adjust the interest rates used for intercompany loans. As a result, during the second quarter of 2019, the Company recorded a reserve of approximately $140.0 million as part of its liability for uncertain tax
MYLAN N.V. AND SUBSIDIARIES
Notes to Condensed Consolidated Financial Statements (Unaudited) - Continued
positions, with a net impact to the income tax provision of approximately $129.9 million. We are currently in the process of memorializing a closing agreement with the IRS, which we expect to enter into in the third quarter.
The Company’s major state taxing jurisdictions remain open from fiscal year 2008 through 2018, with several state audits currently in progress. The Company’s major international taxing jurisdictions remain open from 2012 through 2018, some of which are indemnified by Strides Arcolab Limited (“Strides Arcolab”) for tax assessments.
Tax Court Proceedings
The Company's U.S. federal income tax returns for 2007 through 2011 had been subject to proceedings in U.S. Tax Court involving a dispute with the IRS regarding whether the proceeds received by the Company in connection with the 2008 sale of its rights in nebivolol constituted a capital gain or ordinary income. The Company and the IRS filed a joint stipulation of settled issues with the Tax Court that resolved all issues in this dispute and the Tax Court issued the final order closing the case during the three months ended March 31, 2018.
The Company's U.S. federal income tax returns for 2012 through 2014 had been subject to proceedings in U.S. Tax Court involving a dispute with the IRS regarding whether certain costs related to Abbreviated New Drug Applications were eligible to be expensed and deducted immediately or required to be amortized over longer periods. A trial was held in U.S. Tax Court in December 2018. Both parties delivered their final post-trial briefs on June 27, 2019 and are awaiting the court’s final decision.
Accounting for Uncertainty in Income Taxes
The impact of an uncertain tax position that is more likely than not of being sustained upon audit by the relevant taxing authority must be recognized at the largest amount that is more likely than not to be sustained. No portion of an uncertain tax position will be recognized if the position has less than a 50% likelihood of being sustained.
During the six months ended June 30, 2019, primarily due to the settlement in principle reached with the IRS and the expiration of federal and foreign statutes of limitations expirations, the Company increased its net liability for unrecognized tax benefits by approximately $46.1 million. During the six months ended June 30, 2018, as a result of federal and state audits and settlements and expirations of certain state, federal, and foreign statutes of limitations, the Company reduced its liability for unrecognized tax benefits by approximately $86.0 million, which resulted in a net benefit to the income tax provision of approximately $53.0 million.
The Company is involved in various disputes, governmental and/or regulatory inquiries, investigations and proceedings, tax proceedings and litigation matters, both in the U.S. and abroad, that arise from time to time, some of which could result in losses, including damages, fines and/or civil penalties, and/or criminal charges against the Company. These matters are often complex and have outcomes that are difficult to predict. The Company is also party to certain proceedings and litigation matters for which it may be entitled to indemnification under the respective sale and purchase agreements relating to the acquisitions of the former Merck Generics business, Agila Abbott Laboratories’Specialties Private Limited, Abbott’s non-U.S. developed markets specialty and branded generics business, and certain other acquisitions.
While the Company believes that it has meritorious defenses with respect to the claims asserted against it and intends to vigorously defend its position, the process of resolving these matters is inherently uncertain and may develop over a long period of time,, and so it is not possible to predict the ultimate resolution of any such matter. It is possible that an unfavorable resolution of any of the ongoing matters or the inability or denial of Merck KGaA, Strides Arcolab, Abbott, Laboratories, or another indemnitor or insurer to pay an indemnified claim, could have a material effect on the Company’s business, financial condition, results of operations, cash flows and/or ordinary share price.
Some of these governmental inquiries, investigations, proceedings and litigation matters with which the Company is involved are described below, and unless otherwise disclosed,, the Company is unable to predict the outcome of the matter or to provide an estimate of the range of reasonably possible material losses. The Company records accruals for loss contingencies to the extent we conclude it is probable that a liability has been incurred and the amount of the loss can be reasonably estimated. The Company is also involved in other pending proceedings that,for which, in the opinion of the Company based upon facts and circumstances known at the time, either the likelihood of loss is remote or any reasonably possible loss associated with the
MYLAN N.V. AND SUBSIDIARIES
Notes to Condensed Consolidated Financial Statements (Unaudited) - Continued
resolution of such proceedings is not expected to be material to the Company’s business, financial position, results of operations, cash flows and/or ordinary share price. If and when any reasonably possible losses associated with the resolution of such other pending proceedings, in the opinion of the Company, become material, the Company will disclose such matters.
Legal costs are recorded as incurred and are classified in SG&A in the Company’s Condensed Consolidated Statementscondensed consolidated statements of Operations.
MYLAN N.V. AND SUBSIDIARIES
Notes to Condensed Consolidated Financial Statements (Unaudited) - Continued
Lorazepam and Clorazepate
On June 1, 2005, a jury verdict was rendered against Mylan, MPI, and co-defendants Cambrex Corporation and Gyma Laboratories in the U.S. District Court for the District of Columbia in the amount of approximately $12.0 million, which was accrued for by the Company. The jury found that Mylan and its co-defendants willfully violated Massachusetts, Minnesota and Illinois state antitrust laws in connection with active pharmaceutical ingredient supply agreements entered into between the Company and its API supplier (Cambrex) and broker (Gyma) for two drugs, Lorazepam and Clorazepate, in 1997, and subsequent price increases on these drugs in 1998. The case was brought by four health insurers who opted out of earlier class action settlements agreed to by the Company in 2001 and represents the last remaining antitrust claims relating to Mylan’s 1998 price increases for Lorazepam and Clorazepate. Following the verdict, the Company filed a motion for judgment as a matter of law, a motion for a new trial, a motion to dismiss two of the insurers and a motion to reduce the verdict. On December 20, 2006, the Company’s motion for judgment as a matter of law and motion for a new trial were denied and the remaining motions were denied on January 24, 2008. In post-trial filings, the plaintiffs requested that the verdict be trebled and that request was granted on January 24, 2008. On February 6, 2008, a judgment was issued against Mylan and its co-defendants in the total amount of approximately $69.0 million, which, in the case of three of the plaintiffs, reflects trebling of the compensatory damages in the original verdict (approximately $11.0 million in total) and, in the case of the fourth plaintiff, reflects their amount of the compensatory damages in the original jury verdict plus doubling this compensatory damage award as punitive damages assessed against each of the defendants (approximately $58.0 million in total), some or all of which may be subject to indemnification obligations by Mylan. Plaintiffs are also seeking an award of attorneys’ fees and litigation costs in unspecified amounts and prejudgment interest of approximately $8.0 million. The Company and its co-defendants appealed to the U.S. Court of Appeals for the D.C. Circuit and have challenged the verdict as legally erroneous on multiple grounds. The appeals were held in abeyance pending a ruling on the motion for prejudgment interest, which has been granted. Mylan has contested this ruling along with the liability finding and other damages awards as part of its appeal, which was filed in the Court of Appeals for the D.C. Circuit. On January 18, 2011, the Court of Appeals issued a judgment remanding the case to the District Court for further proceedings based on lack of diversity with respect to certain plaintiffs. On June 13, 2011, Mylan filed a certiorari petition with the U.S. Supreme Court requesting review of the judgment of the D.C. Circuit. On October 3, 2011, the certiorari petition was denied. The case is now proceeding before the District Court. On January 14, 2013, following limited court-ordered jurisdictional discovery, the plaintiffs filed a fourth amended complaint containing additional factual averments with respect to the diversity of citizenship of the parties, along with a motion to voluntarily dismiss 775 (of 1,387) self-funded customers whose presence would destroy the District Court’s diversity jurisdiction. The plaintiffs also moved for a remittitur (reduction) of approximately $8.1 million from the full damages award. Mylan’s brief in response to the new factual averments in the complaint was filed on February 13, 2013. On July 29, 2014, the court granted both plaintiffs�� motion to amend the complaint and their motion to dismiss 775 self-funded customers. The Court granted the plaintiffs’ motion for remittitur on August 18, 2017, reducing approximately $9.5 million from the full damages award. The Court entered final judgment on August 30, 2017 in the amount of approximately $67 million (not including post-judgment interest and fees and costs). Mylan filed a notice of appeal on September 15, 2017 with the United States Court of Appeals for the District of Columbia Circuit. The total accrual for this matter at September 30, 2017 is approximately $29 million, which includes a $17 million charge recorded in the third quarter of 2017 as a result of the final judgment.
In connection with the Company’s appeal of the judgment, the Company submitted a surety bond underwritten by a third-party insurance company in the amount of $74.5 million in February 2008. On May 30, 2012, the District Court ordered the amount of the surety bond reduced to $66.6 million.
Pricing and Medicaid Litigation
Dey L.P. (now known as Mylan Specialty L.P. and herein as “Mylan Specialty”), a wholly owned subsidiary of the Company, was named as a defendant in several class actions brought by consumers and third-party payors. Mylan Specialty reached a settlement of these class actions, which was approved by the court and all claims have been dismissed. Additionally, a complaint was filed under seal by a plaintiff on behalf of the United States of America against Mylan Specialty in August 1997. In August 2006, the Government filed its complaint-in-intervention and the case was unsealed in September 2006. The Government asserted that Mylan Specialty was jointly liable with a co-defendant and sought recovery of alleged overpayments, together with treble damages, civil penalties and equitable relief. Mylan Specialty completed a settlement of this action in December 2010. These cases all have generally alleged that Mylan Specialty falsely reported certain price information concerning certain drugs marketed by Mylan Specialty, that Mylan Specialty caused false claims to be made to Medicaid and to Medicare, and that Mylan Specialty caused Medicaid and Medicare to make overpayments on those claims.
MYLAN N.V. AND SUBSIDIARIES
Notes to Condensed Consolidated Financial Statements (Unaudited) - Continued
Under the terms of the purchase agreement with Merck KGaA, Mylan is fully indemnified for the claims in the preceding paragraph and Merck KGaA is entitled to any income tax benefit the Company realizes for any deductions of amounts paid for such pricing litigation. Under the indemnity, Merck KGaA is responsible for all settlement and legal costs, and, as such, these settlements had no impact on the Company’s Consolidated Statements of Operations. At September 30, 2017, the Company has accrued approximately $63.3 million in other current liabilities, which represents its estimate of the remaining amount of anticipated income tax benefits due to Merck KGaA. We are not aware of any outstanding related claims.operations.
Modafinil Antitrust Litigation and FTC Inquiry
Beginning in April 2006, Mylan and four other drug manufacturers were named as defendants in civil lawsuits filed in or transferred to the U.S. District Court for the Eastern District of Pennsylvania (“EDPA”) by a variety of plaintiffs purportedly representing direct and indirect purchasers of the drug modafinil and in a lawsuit filed by Apotex, Inc., a manufacturer of generic drugs. These actions alleged violations of federal antitrust and state laws in connection with the generic defendants’ settlement of patent litigation with Cephalon relating to modafinil. On March 24, 2015, Mylan reached a settlement in principle withhas settled the lawsuits filed by the putative indirect purchasers,direct purchaser class and on November 20, 2015, Mylanretailer opt-out plaintiffs and Apotex and has entered into a settlement agreement with the putative indirect purchasers for approximately $16 million. Plaintiffs have not yet moved for preliminary approval of that settlement. In December 2016, Mylan reached a settlement with the putative direct purchaser class and the retailer opt-out plaintiffs for $165$14.4 million, of which approximately $68.5 million was paid before December 31, 2016. The settlement with the retailer opt-out plaintiffs has been completed. On February 3, 2017, the putative direct purchaser class moved for preliminary approval of the settlement. The direct purchaser class’ motion for preliminary approval of the settlement was denied on August 29, 2017. The parties are engaging in a continuing dialogueis subject to resolve this matter according to the terms of the settlement agreement. On June 8, 2017, Mylan and Apotex agreed to a settlement in principle. The settlement with Apotex has been completed. The Company has also received subpoenas from certain state Attorneys General requesting documents related to the modafinil patent litigation.
On June 29, 2015, the City of Providence, Rhode Island filed suit in the District of Rhode Island against the same parties named as defendants in litigation pending in the Eastern District of Pennsylvania, including Mylan, asserting state law claims based on the same underlying allegations. All defendants, including Mylan, moved to dismiss the suit on October 15, 2015, and the case was subsequently settled.court approval.
On July 10, 2015, the Louisiana Attorney General filed a lawsuit in the 19th Judicial District Court in Louisiana a petition against Mylan and three other drug manufacturers asserting state law claims based on the same underlying allegations as those made in the litigation then pending in the EasternEDPA. On December 8, 2016, the District of Pennsylvania. The petition was filed byCourt dismissed the lawsuit with prejudice, which the State of Louisiana purportedly in its capacity as an indirect purchaser. On May 16, 2016,appealed. The appeals court subsequently remanded the Judiciallawsuit to the District Court deferred Mylan’s declinatory exception of no personal jurisdictionto include certain language in order to make the District Court’s dismissal decision final and its peremptory exception of prescription, and granted in part and denied in part Mylan’s peremptory exceptions of no cause of action and no right of action. On June 30, 2016, the plaintiff filed a supplemental and amended petition. The defendants filed a motion to strike and joint peremptory exceptions to the amended petition. On July 21, 2016, the plaintiff filed in the First Circuit Court of Appeal its application for a supervisory writ regarding the granting of defendant’s exceptions, which the defendants opposed. The appeal was denied on October 31, 2016. On April 20, 2016, the State of Louisiana filed a motion to consolidate the pending action with four other actions against other pharmaceutical manufacturers concerning products not related to modafinil, which Mylan opposed. On June 27, 2016, the Judicial District Court declined to consolidate Mylan’s case with the other four actions, with leave to renew the consolidation request after filing the above-referenced amended petition. On July 21, 2016, the plaintiff filed a motion to reurge consolidation. Subsequently, the action to which plaintiff seeks to join Mylan was stayed, resulting in a stay of the consolidation motion. On December 8, 2016, Mylan’s peremptory exceptions of no cause of action with respect to the supplemental and amended petition were granted in their entirety and with prejudice and judgment was entered. On February 17, 2017, the plaintiff filed in the 19th Judicial District Court a motion for appeal, which the Judicial District Court granted on February 21, 2017. The appeal was lodged with the First Circuit Court of Appeal on April 4, 2017. Briefing on the appeal has been completed and an oral argument was held November 1, 2017.appealable.
On July 28, 2016, United Healthcare filed a complaint against Mylan Inc. and four other drug manufacturers in the United States District Court for the District of Minnesota, asserting state law claims based on the same underlying allegations as those made in the litigation then pending in the Eastern District of Pennsylvania.EDPA. On January 6, 2017, the case was transferred to the Eastern District of Pennsylvania. Mylan filed its answer toEDPA and is still pending. MPI has since been included as an additional party. In July 2019, the complaint on March 31, 2017.
MYLAN N.V. AND SUBSIDIARIES
Notes to Condensed Consolidated Financial Statements (Unaudited) - Continued
parties reached a settlement in principle.
The Company believes that it has strong defenses to these remaining cases. Although it is reasonably possible that the Company may incur additional losses from these matters, any amount cannot be reasonably estimated at this time.
In addition, by letter dated July 11, 2006, Mylan was notified by the U.S. Federal Trade Commission (“FTC”)The Company recorded approximately $18.0 million of an investigation relating to the settlement of the modafinil patent litigation. In its letter, the FTC requested certain information from Mylan, MPI and Mylan Technologies, Inc. pertaining to the patent litigation and the settlement thereof. On March 29, 2007, the FTC issued a subpoena, and on April 26, 2007, the FTC issued a civil investigative demand to Mylan, requesting additional information from the Company relating to the investigation. Mylan has cooperated fully with the government’s investigation and completed all requests for information. On February 13, 2008, the FTC filed a lawsuit against Cephalonexpense in the U.S. District Court for the Districtsecond quarter of Columbia2019 and the case was subsequently transferred to the U.S. District Court for the Eastern District of Pennsylvania. On July 1, 2010, the FTC issued a third party subpoena to Mylan, requesting documents in connection with its lawsuit against Cephalon. Mylan has responded to the subpoena. The lawsuit against Cephalon settled and a Stipulated Order for Permanent Injunction and Equitable Monetary Relief was entered by the Court on June 17, 2015.
The Company has a total accrual of approximately $112.5$32.4 million related to this matter at SeptemberJune 30, 2017,2019, which is included in other current liabilities in the Condensed Consolidated Balance Sheets.condensed consolidated balance sheets.
Pioglitazone
Beginning in December 2013, Mylan, Takeda, and several other drug manufacturers have been named as defendants in civil lawsuits consolidated in the U.S. District Court for the Southern District of New York by plaintiffs which purport to represent direct and indirect purchasers of branded or generic Actos® and Actoplus Met®. These actions allege violations of state and federal competition laws in connection with the defendants’ settlements of patent litigation in 2010 relatingrelated to Actos and Actoplus Met®. Plaintiffs filed an amended complaint on August 22, 2014. Mylan and the other defendants filed motions to dismiss the amended complaint on October 10, 2014. Two additional complaints were subsequently filed by plaintiffs purporting to represent classes of direct purchasers of branded or generic Actos® and Actoplus Met®. On September 23, 2015, the District Court granted defendants’ motionsMylan’s motion to dismiss the indirect purchasers amended complaints with prejudice. The indirect purchasers filed a notice ofpurchasers’ complaint was granted and no appeal on October 22, 2015; however they have since abandoned and dismissed their appeal of the District Court’s dismissal of claims asserted against Mylan. The putative direct purchaser class filed an amended complaint on January 8, 2016. Defendants’ motion to dismiss was filed on January 28, 2016 and the briefing has been completed. The case was stayed pending the resolution of the indirect purchasers’ appeal against the defendants remaining in that case. A decision was issued by the Second Circuit on February 8, 2017, reversing in part and affirming in part, the District Court’s decision as to Mylan. Following the remaining defendants. Following thisappellate decision relating to other defendants, the direct purchasers filed an amended complaint;complaint against Mylan and the other manufacturers. Mylan’s motion to dismiss the amended complaint is pending.
SEC Investigation
On September 10, 2015, Mylan N.V. received a subpoena from the SECSEC’s Division of Enforcement seeking documents with regard to certain related party matters. Mylan is fully cooperating with the SEC.
EpiPen® Auto-Injector and Certain Congressional Matters
Classificationsubsequently received additional requests for information. The SEC’s Division of EpiPen® Auto-Injector and EpiPen Jr® Auto-Injector
In November 2014,Enforcement informed the Company in February 2019 that it had completed its investigation with no recommended further action.
Trade Agreements Act (“TAA”)
On April 9, 2018, a subsidiary of Mylan N.V. received a subpoenacivil investigative demand from the Commercial Litigation Branch of the U.S. Department of Justice (“DOJ”) related to the classification of the EpiPen® Auto-Injectorconcerning its TAA compliance for purposes of the Medicaid Drug Rebate Program.certain products. The Company complied with various information requests received from the DOJ pursuant to the subpoena. The question in the underlying matter was whether EpiPen® Auto-Injector should be classified with the Centers for Medicare and Medicaid Services (“CMS”) as a non-innovator drug under the applicable definition in the Medicaid Rebate statute and subject to the formula that is used to calculate rebates to Medicaid for such drugs. EpiPen® Auto-Injector had been classified with CMS as a non-innovator drug since before Mylan acquired the product in 2007 based on longstanding written guidance from the federal government. Beginning in August 2016, questions regarding the pricing of the EpiPen® Auto-Injector significantly increased and the Company has received or has been the subject of additional inquiries, including with respect to the classification of EpiPen® Auto-Injector for purposes of the Medicaid Drug Rebate Program and certain other federal programs, from committees and members of Congress and from other federal and state governmental agencies.company fully
MYLAN N.V. AND SUBSIDIARIES
Notes to Condensed Consolidated Financial Statements (Unaudited) - Continued
Subsequentcooperated with DOJ. On September 14, 2018, the United States District Court for the Southern District of Ohio unsealed a qui tam lawsuit filed against the Mylan N.V. subsidiary concerning its TAA compliance for the same products identified in DOJ’s civil investigative demand. DOJ has declined to these developments, on October 7, 2016, Mylan agreedintervene in the lawsuit and has closed its investigation. The lawsuit has been stayed and we believe that its claims are without merit and intend to the terms of a $465 million settlement, plus interest, with the DOJ and other government agencies related to the classification of the defend against them vigorously.
EpiPen® Auto-Injector for purposes of the Medicaid Drug Rebate Program (the “Medicaid Drug Rebate Program Settlement”). On August 17, 2017, two of Mylan’s subsidiaries - Mylan Inc. and Mylan Specialty L.P. - signed an agreement with the DOJ and two relators finalizing the $465 million settlement. The settlement agreement provides for resolution of all potential Medicaid rebate liability claims by the federal government, as well as potential claims by certain hospitals and other covered entities that participate in the 340B Drug Pricing Program. The settlement agreement allocates money to the Medicaid programs of all 50 states and establishes a framework for resolving all potential state Medicaid rebate liability claims within 60 days. All 50 states plus the District of Columbia have agreed to the settlement, and therefore, all potential state Medicaid rebate liability claims have been resolved. In connection with the settlement, Mylan Inc. and Mylan Specialty L.P. entered into a Corporate Integrity Agreement (the “CIA”) with the Office of Inspector General of the Department of Health and Human Services (“OIG-HHS”). The CIA has a five-year term and requires, among other things, that an independent review organization annually review various matters relating to the Medicaid Drug Rebate Program. Neither the settlement agreement nor the CIA contains an admission or finding of wrongdoing. In connection with the settlement, Mylan Specialty L.P. has reclassified EpiPen® Auto-Injector as an innovator product for purposes of the Medicaid Drug Rebate Program effective April 1, 2017. The Company recorded an accrual of $465 million related to the settlement during the year ended December 31, 2016 and recorded an additional accrual for interest related to the settlement amount during the nine months ended September 30, 2017.Certain Congressional Matters
Department of Veterans Affairs Request for Information
On June 30, 2017, the Company responded to a request for information from the Department of Veterans Affairs (VA)(“VA”) (acting on behalf of itself and other government agencies) requesting certain historical pricing data related to the EpiPen® Auto-Injector. The Company and the VA are engaged in a continuing dialogue regarding the classification of the EpiPen® Auto-Injector as a covered drug under Section 603 of the Veterans Health Care Act of 1992, Public Law 102-585. The EpiPen® Auto-Injector has been classified as a non covered drug with the VA based upon long standing written guidance from the federal government. The Company is fully cooperating with the VA.
SEC Request for Information/SubpoenaSubpoenas
On October 7, 2016, Mylan received a document request from the SEC’s Division of Enforcement at the SEC seeking communications with CMSthe Centers for Medicare and Medicaid Services and documents concerning Mylan products sold and related to the Medicaid Drug Rebate Program (“MDRP”), and any related complaints. On November 15, 2016, Mylan received a follow-up letter, modifying the initial document request, seeking information on and public disclosures regarding the $465 million Medicaid Drug Rebate Program SettlementCompany’s previously disclosed settlement with the DOJ (“the MDRP Settlement”) and the classification of the EpiPen® Auto-Injector under the Medicaid Drug Rebate Program. On February 6, 2017,MDRP. Mylan subsequently received a subpoena fromsubpoenas and additional requests for information. The Company has been cooperating fully with the SEC staff’s investigation. Following recent discussions, the Company reached an agreement-in-principle in this matter, seeking additional documents. Mylan is fully cooperatingJuly 2019 with the SEC.staff of the Division of Enforcement that would include allegations that the Company violated Sections 17(a)(2) and 17(a)(3) of the Securities Act of 1933 and the reporting, books and records, and internal controls provisions of the Securities Exchange Act of 1934, as amended, and the rules thereunder, and a civil penalty of $30.0 million. Under the settlement, Mylan would neither admit nor deny these allegations. The Company recorded an accrual for this amount for the period ended June 30, 2019. This agreement-in-principle between the staff of the Division of Enforcement and the Company is subject to approval by the SEC and, if approved, would fully resolve the Division of Enforcement’s investigation.
On April 25, 2017, Mylan received a comment letter from the staff of the SEC’s Division of Corporation Finance (“Corporation Finance”) with respect to Mylan’s Annual Report on Form 10-K for the year ended December 31, 2016, requesting information regarding Mylan’s accounting treatment forof the Medicaid Drug Rebate ProgramMDRP Settlement, including with respect to the DOJ.determinations that the settlement amount should be recorded as a charge against earnings in the third quarter of 2016 rather than against any earlier periods, and that the settlement amount should be classified as an expense rather than a reduction of revenue. The Company responded to the comment letter in May 2017 and we will continue to cooperate fullyrespond to any additional correspondence from Corporation Finance. As noted above, the Company has reached an agreement-in-principle with the SEC.staff of the Division of Enforcement concerning the subject matter of Corporation Finance’s comment letter.
FTC Request for Information
On November 18, 2016, Mylan received a request from the FTCU.S. Federal Trade Commission (“FTC”) Bureau of Competition seeking documents and information relating to its preliminary investigation into potential anticompetitive practices relating to epinephrine auto-injectors. Mylan is fully cooperating with the FTC.
MYLAN N.V. AND SUBSIDIARIES
Notes to Condensed Consolidated Financial Statements (Unaudited) - Continued
Federal Securities Litigation
Purported class action complaints were filed in October 2016 against Mylan N.V., Mylan Inc. and certain of their current and former directors and officers (collectively, for purposes of this paragraph, the “defendants”) in the United States District Court for the Southern District of New York (“SDNY”) on behalf of certain purchasers of securities of Mylan N.V. and/or Mylan Inc. on the NASDAQ. The complaints alleged that defendants made false or misleading statements and omissions of purportedly material fact, in violation of federal securities laws, in connection with disclosures relating to Mylan N.V. and Mylan Inc.’s classification of their EpiPen® Auto-Injector as a non-innovator drug for purposes of the Medicaid Drug Rebate Program.MDRP. The complaints sought damages, as well as the plaintiffs’ fees and costs. On March 20, 2017, after the actions were consolidated, a consolidated amended complaint was filed,
MYLAN N.V. AND SUBSIDIARIES
Notes to Condensed Consolidated Financial Statements (Unaudited) - Continued
alleging substantially similar claims and seeking substantially similar relief, but adding allegations that defendants made false or misleading statements and omissions of purportedly material fact in connection with allegedly anticompetitive conduct with respect to EpiPen® Auto-Injector and certain generic drugs, and alleging violations of both federal securities laws (on behalf of a purported class of certain purchasers of securities of Mylan N.V. and/or Mylan Inc. on the NASDAQ) and Israeli securities laws (on behalf of a purported class of certain purchasers of securities of Mylan N.V. on the Tel Aviv Stock Exchange). Defendants’On March 28, 2018, defendants’ motion to dismiss the consolidated amended complaint was granted in part (including the dismissal of claims arising under Israeli securities laws) and denied in part. On July 6, 2018, the plaintiffs filed a second amended complaint, including certain current and former directors and officers and additional allegations in connection with purportedly anticompetitive conduct with respect to EpiPen® Auto-Injector and certain generic drugs. On August 6, 2018, defendants filed a motion to dismiss the second amended complaint, which was granted in part and denied in part on May 30, 2017March 29, 2019. On June 17, 2019, plaintiffs filed a third amended complaint, including certain current and has been fully briefed.former directors and employees/officers and additional allegations in connection with purportedly anticompetitive conduct with respect to certain generic drugs. On February 26, 2019, MYL Litigation Recovery I LLC (an assignee of entities that purportedly purchased stock of Mylan N.V.) filed an additional complaint against Mylan N.V., Mylan Inc., and certain of their current and former directors and officers in the SDNY asserting allegations pertaining to EpiPen® Auto-Injector under the federal securities laws that overlap in part with those asserted in the third amended complaint identified above. MYL Litigation Recovery I LLC’s complaint seeks damages as well as the plaintiff’s costs. On June 5, 2019, defendants filed a motion to dismiss certain of MYL Litigation Recovery I LLC’s claims, which remains pending. We believe that the claims in the consolidated amended complaintthese lawsuits are without merit and intend to defend against them vigorously.
Israeli Securities Litigation
On October 13, 2016, a purported shareholder of Mylan N.V. filed a lawsuit, together with a motion to certify the lawsuit as a class action on behalf of certain Mylan N.V. shareholders on the Tel Aviv Stock Exchange, against Mylan N.V. and four of its directors and officers (collectively, for purposes of this paragraph, the “defendants”) in the Tel Aviv District Court (Economic Division) (the “Friedman Action”). The plaintiff alleges that the defendants made false or misleading statements and omissions of purportedly material fact in Mylan N.V.’s reports to the Tel Aviv Stock Exchange regarding Mylan N.V.’s classification of its EpiPen® Auto-Injector for purposes of the Medicaid Drug Rebate Program,MDRP, in violation of both U.S. and Israeli securities laws, the Israeli Companies Law and the Israeli Torts Ordinance. The plaintiff seeks damages, among other remedies. On January 19, 2017, the Court stayed this case until a final judgment is issued in the securities litigation currently pending in the United States District Court for the Southern District of New York. On April 30, 2017, another purported shareholder of Mylan N.V. filed a separate lawsuit, together with a motion to certify the lawsuit as a class action on behalf of certain Mylan N.V. shareholders on the Tel Aviv Stock Exchange, in the Tel Aviv District Court (Economic Division), alleging substantially similar claims and seeking substantially similar relief against the defendants and other directors and officers of Mylan N.V., but alleging also that this group of defendants made false or misleading statements and omissions of purportedly material fact in connection with allegedly anticompetitive conduct with respect to EpiPen® Auto-Injector and certain generic drugs, and alleging violations of both U.S. federal securities laws and Israeli law.law (the “IEC Fund Action”). On April 10, 2018, the Tel Aviv District Court granted the motion filed by plaintiffs in both the Friedman Action and the IEC Fund Action, voluntarily dismissing the Friedman Action and staying the IEC Fund Action until a judgment is issued in the purported class action securities litigation pending in the U.S. We believe that the claims in these lawsuits are without merit and intend to defend against them vigorously.
EpiPen® Auto-Injector Civil Litigation
Beginning in August 2016, Mylan Specialty L.P. and other Mylan-affiliated entities have been named as defendants in fifteen putative class actions relating to the pricing and/or marketing of the EpiPen® Auto-Injector. The plaintiffs in these cases assert violations of various federal and state antitrust and consumer protection laws, the Racketeer Influenced and Corrupt Organizations Act, (“RICO”), as well as common law claims. Plaintiffs’ claims include purported challenges to the prices charged for the EpiPen® Auto-Injector and/or the marketing of the product in packages containing two auto-injectors, as well as allegedly anti-competitive conduct. A Mylan officer and other non-Mylan affiliated companies were also have been named as defendants in some of the class actions. These lawsuits were filed in the U.S. District Courts for the Northern District of California, Northern District of Illinois, District of Kansas, Eastern District of Michigan, Western District of Washington, District of New Jersey, the Southern District of Alabama,various federal and the Western District of Pennsylvania, as well as the Hamilton County, Ohio Court of Common Pleas (later removed to the Southern District of Ohio). All of these lawsuitsstate courts and have either been dismissed or transferred into a multidistrict litigation (“MDL”) in the U.S. District Court for the District of Kansas and have been consolidated throughconsolidated. Mylan filed a motion to dismiss the filing of anconsolidated amended complaint, on October 17, 2017.which was granted in part and denied in part. On December 7, 2018, the Plaintiffs filed a motion for class certification. This motion remains pending. A trial date has been scheduled for JulyNovember 2020. We believe that the remaining claims in these lawsuits are without merit and intend to defend against them vigorously.
On April 24, 2017, Sanofi-Aventis U.S., LLC (“Sanofi”) filed a lawsuit against Mylan Inc. and Mylan Specialty L.P. in the U.S. District Court for the District of New Jersey. This lawsuit has been transferred into the aforementioned MDL in the U.S. District Court for the District of Kansas.MDL. In this lawsuit, Sanofi alleges exclusive dealings and anti-competitive marketing
MYLAN N.V. AND SUBSIDIARIES
Notes to Condensed Consolidated Financial Statements (Unaudited) - Continued
lawsuit, Sanofi alleges exclusive dealings and anti-competitive marketing practices in violation of the antitrust laws in connection with the sale and marketing of the EpiPen® Auto-Injector. Mylan’sOn November 1, 2018, Sanofi filed a Motion to Dismiss is pending. We believe thatfor a Suggestion of Remand of the claims in this lawsuit are without merit and intendcase to defend against them vigorously.
On September 29, 2017, plaintiffs in a pending putative class action brought against certain pharmacy benefit managers (“PBMs”) defendants in the U.S. District Court for the District of KansasNew Jersey. On January 23, 2019, the Court denied Sanofi’s motion without prejudice. On June 28, 2019, Mylan filed a motion for leave to file an amended complaint that would add Mylan N.V., Mylan Specialty, and Mylan Pharmaceuticals Inc.summary judgment as additional defendants to this case. In the proposed amended complaint, plaintiffs bring claims under the Employee Retirement Income Security Act of 1974 for allegedly knowingly participating in conduct related to the pricing of EpiPen products that plaintiffs assert wasclaims asserted by Sanofi and Sanofi filed both a breach of fiduciary duties by the PBMs. The motion remainsfor partial summary judgment with respect to its claims against Mylan and for summary judgment with respect to Mylan’s counterclaims. These motions remain pending. We believe that theSanofi’s claims in this lawsuit are without merit and intend to defend against them vigorously.
EpiPen® Auto-Injector State AG Investigations
Beginning in August 2016, theThe Company and certain of its affiliated entities have received subpoenas and informal requests from various state attorneys general seeking information and documents relating to the pricing and/or marketing of the EpiPen® Auto-Injector. The Company has cooperated and is fully cooperating with the various state attorneys general.
U.S. Congress/State Requests for Information and Documents
Beginning in August 2016, Mylan has received several requests for information and documents from various Committees of the U.S. Congress and federal and state lawmakers concerning the marketing, distribution and sales of Mylan products. Mylan has cooperated and intends to continue cooperating with federal and state lawmakers as appropriate in response to their requests.
The Company has a total accrual of approximately $228.4$40.0 million related to this matter at SeptemberJune 30, 2017,2019, which is included in other current liabilities in the Condensed Consolidated Balance Sheets. During the three months ended September 30, 2017, the Company made payments of approximately $255.2 million related to this matter. Subsequent to September 30, 2017, the Company made additional payments of approximately $217.5 million, which was accrued for at September 30, 2017.condensed consolidated balance sheets. The Company believes that it has strong defenses to current and future potential civil litigation, as well as governmental investigations and enforcement proceedings, discussed in this “EpiPen® Auto-Injector and Certain Congressional Matters” section of this Note 19 20 Litigation. Although it is reasonably possible that the Company may incur additional losses from these matters, any amount cannot be reasonably estimated at this time. In addition, the Company expects to incur additional legal and other professional service expenses associated with such matters in future periods and will recognize these expenses as services are received. The Company believes that the ultimate amount paid for these services and claims could have a material effect on the Company's business, consolidated financial condition, results of operations, cash flows and/or ordinary share price in future periods.
Opioid Subpoena, Missouri State AG Civil Investigative Demand and Congressional RequestOpioids
On July 27, 2017, Mylan N.V. received a subpoena from the DOJ seeking information relating to opioids manufactured, marketed or sold by Mylan during the period from January 1, 2013 to December 31, 2016. On August 29, 2017, Mylan N.V. received a civil investigative demand from the Attorney General of the State of Missouri seeking information relating to opioids manufactured, marketed or sold by Mylan during the period from January 1, 2010 to the present and related subject matter. Mylan is fully cooperating with these subpoena requests.
Mylan also has responded toalong with other manufacturers, distributors, pharmacies, pharmacy benefit managers, and individual healthcare providers is a letter fromdefendant in more than 700 cases in the ranking member of the U.S. Senate Committee on Homeland SecurityUnited States and Governmental Affairs seeking information relatingCanada filed by various plaintiffs, including counties, cities and other local governmental entities, asserting civil claims related to sales, marketing and/or distribution practices with respect to prescription opioid products. The lawsuits generally seek equitable relief and educational strategiesmonetary damages (including punitive and/or exemplary damages) based on a variety of legal theories, including various statutory and/or common law claims, such as negligence, public nuisance and unjust enrichment. The vast majority of these lawsuits have been consolidated in an MDL in the U.S. District Court for opioid products manufactured by Mylan.
MYLAN N.V. AND SUBSIDIARIES
NotesOhio. Mylan believes that the claims in these lawsuits are without merit and intends to Condensed Consolidated Financial Statements (Unaudited) - Continueddefend against them vigorously.
Drug Pricing Matters
Department of JusticeSubpoena
On December 3, 2015, a subsidiary of Mylan N.V. received a subpoena from the Antitrust Division of the DOJ seeking information relating to the marketing, pricing, and sale of our generic Doxycycline products and any communications with competitors about such products.
MYLAN N.V. AND SUBSIDIARIES
Notes to Condensed Consolidated Financial Statements (Unaudited) - Continued
On September 8, 2016, a subsidiary of Mylan N.V., as well as certain employees and a member of senior management, received subpoenas from the DOJ seeking additional information relating to the marketing, pricing and sale of our generic Cidofovir, Glipizide-metformin, Propranolol and Verapamil products and any communications with competitors about such products. Related search warrants also were executed.
On May 10, 2018, a subsidiary of Mylan N.V. received a civil investigative demand from the Civil Division of the DOJ seeking information relating to the pricing and sale of its generic drug products.
The Company is fully cooperating with the DOJ.
Civil Litigation
On March 2,Beginning in 2016, a putative class action was filed in the United States District Court for the Eastern District of Pennsylvania (“EDPA”) by indirect purchasers against Mylan and severalCompany, along with other manufacturers, has been named as a defendant in lawsuits generally alleging anticompetitive conduct with respect to certain generic doxycycline and digoxin products.drugs. The complaint alleges harm under federal antitrust laws, state antitrust laws, state consumer protection laws and theories of unjust enrichment. Subsequently, additional cases werelawsuits have been filed by putative classes of indirect purchasers, direct purchasers and an indirect reseller. These cases were consolidated in an MDL proceeding in the EDPA. Similar lawsuits were filed by direct and indirect purchasers in the EDPA, the Southern District of New York, the District of Puerto Rico and the District of New Jersey involving Mylan’s and other manufacturer’s pravastatin, divalproex, levothyroxine, propranolol, clomipramine, albuterol, benazepril and amitriptyline products (as well as non-Mylan products clobatesol, desonide, fluocinonide, econazole, lidocaine/prilocaine, glyburide, ursodiol and baclofen). All of the above-referenced lawsuits have also been consolidated in the MDL proceeding in the EDPA. Putative classes of direct purchasers, indirect purchasers, and indirect resellers, as well as individual direct and indirect purchasers. They allege harm under federal and state antitrust laws, state consumer protection laws and unjust enrichment claims. Some of the lawsuits also name Mylan’s President as a defendant and include allegations against him with respect to doxycycline hyclate delayed release. The lawsuits have been consolidated in an MDL proceeding in the EDPA. Defendants filed consolidatedmotions to dismiss certain complaints that each allege anticompetitive conduct with respect to single drug products. On October 16, 2018, the Court denied the motions with respect to the federal law claims. On February 15, 2019, the Court granted in part and denied in part the motions with respect to the state law claims. On February 21, 2019, Defendants filed a motion to dismiss certain complaints that allege anticompetitive conduct with respect to multiple drug products, referenced above on August 15, 2017. Mylan is no longer a named defendant in the pravastatin lawsuits. Defendants’ Motions to Dismiss briefing is ongoing.which remains pending. The Company believes that the claims in these lawsuits are without merit and intends to defend against them vigorously.
A complaint was filed on January 31, 2017 by putative classes of direct and indirect purchasers against Mylan Pharmaceuticals Inc. and other pharmaceutical manufacturers in the United States District Court for the District of Connecticut. Plaintiffs generally allege anticompetitive conduct and RICO violations with respect to, among other things, certain Doxycycline products. This case has been transferred to the above-mentioned MDL. Mylan Pharmaceuticals Inc. believes that the claims in this lawsuit are without merit and intends to defend against them vigorously.
Attorneys General Litigation
On December 21, 2015, the Company received a subpoena and interrogatories from the Connecticut Office of the Attorney General seeking information relating to the marketing, pricing and sale of certain of the Company’s generic products (including Doxycycline)generic doxycycline) and communications with competitors about such products. On December 14, 2016, attorneys general of twenty states filed a complaint in the United States District Court for the District of Connecticut against several generic pharmaceutical drug manufacturers, including Mylan, alleging anticompetitive conduct with respect to, among other things, Doxycycline Hyclate Delayed Release. On March 1, 2017, thedoxycycline hyclate delayed release. The complaint was subsequently amended to add thecertain attorneys general of twenty additional states; the complaint alleges violationalleging violations of federal and state antitrust laws, as well as violationviolations of various states’ consumer protection laws. On July 17, 2017, another complaint containing similar allegations as those contained in the complaints referenced above was filed by four additional states and the District of Columbia. This lawsuit has been transferred to the aforementioned MDL proceeding in the EDPA. On October 31, 2017,June 18, 2018, attorneys general of forty-fiveforty-seven states, the District of Columbia and the Commonwealth of Puerto Rico filed a motion for leave to file a consolidated amended complaint (“proposed amended complaint”) against various drug manufacturers, including Mylan. Mylan is alleged to have engaged in anticompetitive conduct with respect to Doxycycline Hyclate Delayed Release, Doxycycline Monohydrate, Glipizide-Metformin,doxycycline hyclate delayed release, doxycycline monohydrate, glipizide-metformin, and Verapamil.verapamil. The proposed amended complaint also includes claims asserted by attorneys general of thirty-fourthirty-seven states and the Commonwealth of Puerto Rico against certain individuals, including Rajiv Malik,Mylan’s President, of Mylan, with respect to Doxycycline Hyclate Delayed Release.doxycycline hyclate delayed release. The allegations in the proposed amended complaint are similar to those in the previously filed complaints. On February 21, 2019, Defendants filed motions to dismiss the amended complaint’s allegations of anticompetitive conduct with respect to multiple drug products and the ability of the state attorneys general to seek certain forms of relief under federal antitrust law, which remain pending. On May 31, 2019, Defendants filed a motion to dismiss certain state law claims, which remains pending.
On May 10, 2019, attorneys general of forty-three states and the Commonwealth of Puerto Rico filed a new complaint against various drug manufacturers, including Mylan, alleging anticompetitive conduct with respect to additional generic drugs. The Complaint also includes claims asserted by attorneys general of thirty-nine states and the Commonwealth of Puerto Rico against several individuals, including a Mylan sales employee.
We believe that the claims in this lawsuit against Mylan and Rajiv Malikthese lawsuits are without merit and intend to defend against them vigorously.
Valsartan
Mylan N.V., and certain of its subsidiaries, along with numerous other manufacturers, retailers and others, have been named (or plaintiffs are seeking to name certain Mylan entities) as defendants in lawsuits in the United States, Canada and other countries stemming from recalls of valsartan-containing medications. The United States litigation, which is taking place in an
MYLAN N.V. AND SUBSIDIARIES
Notes to Condensed Consolidated Financial Statements (Unaudited) - Continued
Tax Court Proceeding
The Company's U.S. federal income tax returns for 2007 through 2011 have been subject to proceedingsMDL in U.S. Tax Court involving a dispute with the IRS regarding whetherDistrict of New Jersey, includes class action and individual allegations seeking the proceeds received by the Company in connection with the 2008 sale of its rights in nebivolol constituted a capital gain or ordinary income. On May 16, 2017, the Company and the IRS filed a joint stipulation of settled issues with the Tax Court that resolved all issues in this dispute. The final computations resulting from the stipulation are being prepared by the Company and the IRS, and will be filed with the Tax Court. The Company expects that a portion of its unrecognized tax benefits will be reduced as a resultrefund of the resolutionpurchase price and other economic damages allegedly sustained by consumers who purchased valsartan-containing products as well as claims for personal injuries allegedly caused by ingestion of this dispute.the medication. Moreover, Mylan has received requests to indemnify purchasers of Mylan’s active pharmaceutical ingredient and/or finished dose forms of the product. We believe that the claims in these lawsuits are without merit and intend to defend against them vigorously.
European Commission Proceedings
Perindopril
On or around July 8, 2009,9, 2014, the European Commission (the “Commission”) stated that it had initiated antitrust proceedings pursuant to Article 11(6) of Regulation No. 1/2003 and Article 2(1) of Regulation No. 773/2004 to explore possible infringement of Articles 81 and 82 EC and Articles 53 and 54 of the European Economic Area Agreement by Les Laboratoires Servier (“Servier”) as well as possible infringement of Article 81 EC by the Company’s Indian subsidiary, Mylan Laboratories Limited, and four other companies, each of which entered into agreements with Servier relating to the product Perindopril. On July 30, 2012, the Commission issued a Statement of Objections to Servier SAS, Servier Laboratories Limited, Les Laboratories Servier, Adir, Biogaran, Krka, d.d. Novo mesto, Lupin Limited, Mylan Laboratories Limited, Mylan, Niche Generics Limited, Teva UK Limited, Teva Pharmaceutical Industries Ltd., Teva Pharmaceuticals Europe B.V. and Unichem Laboratories Limited. Mylan Inc. and Mylan Laboratories Limited filed responses to the Statement of Objections. On July 9, 2014, the Commission issued a decision finding that Mylan Laboratories Limited and Mylan, as well as theseveral other companies, noted above (with the exception of Adir, a subsidiary of Servier), had violated European Union (“EU”) competition rules relating to the product Perindopril and fined Mylan Laboratories Limited approximately €17.2 million, including approximately €8.0 million jointly and severally with Mylan Inc. The Company paid approximately $21.7 million related to this matter during the fourth quarter of 2014. In September 2014, the Company filed an appeal of the Commission’s decision to the General Court of the European Union.EU. A hearing on the appeal before the General Court of the European UnionEU was held in June 2017 and the Commission’s decision was affirmed. Mylan has appealed the decision to the European Court of Justice (“CJEU”). Mylan has received a decision is pending.notice from an organization representing health insurers in the Netherlands stating an intention to commence follow-on litigation and asserting damages.
Citalopram
On March 19, 2010, Mylan and Generics [U.K.] Limited, a wholly owned subsidiary of the Company, received notice that the Commission had opened proceedings against Lundbeck with respect to alleged unilateral practices and/or agreements related to Citalopram in the European Economic Area. On July 25, 2012 a Statement of Objections was issued to Lundbeck, Merck KGaA, Generics [U.K.] Limited, Arrow, Resolution Chemicals, Xelia Pharmaceuticals, Alpharma, A.L. Industrier and Ranbaxy. Generics [U.K.] Limited filed a response to the Statement of Objections and vigorously defended itself against allegations contained therein. On June 19, 2013, the Commission issued a decision finding that Generics [U.K.] Limited,, (“GUK”) as well as theseveral other companies, noted above, had violated European UnionEU competition rules relating to the product Citalopram and fined Generics [U.K.] LimitedGUK approximately €7.8€7.8 million,, jointly and severally with Merck KGaA. Generics [U.K.] LimitedGUK appealed the Commission’s decision to the General Court of the EU and a hearing took placeEU. The case is currently on October 8, 2015. On September 8, 2016, the General Court dismissed all appeals against the European Commission’s decision. Mylan filed an appeal of the decision on November 18, 2016 to the European Court of Justice.CJEU. The United Kingdom hasU.K. applied and was granted permission to intervene in this proceeding. The Company has accrued approximately $8.8 million and $8.2 million as of September 30, 2017 and December 31, 2016, respectively, related to this matter. Generics [U.K.] LimitedGUK has received notices from NHS Departments across the United KingdomEuropean national health services and health insurers stating an intention to commence follow-on litigation and asserting damages. Generics [U.K.] LimitedThe national health services in England and Wales have instituted litigation against all parties to the Commission’s decision, including GUK.
GUK has also sought indemnification from Merck KGaA with respect to the €7.8 million portion of the fine for which Merck KGaA and Generics [U.K.] LimitedGUK were held jointly and severally liable. Merck KGaA has counterclaimed against Generics [U.K.] LimitedGUK seeking the same indemnification. In June 2018, the Frankfurt Regional Court issued a judgment dismissing GUK claims against Merck KGaA and ordered GUK to indemnify Merck KGaA with respect to the amount for which the parties were held jointly and severally liable. GUK has appealed this decision. The proceedings have been stayed pending the CJEU appeal decision.
The Company has accrued approximately €7.4 million as of each of June 30, 2019 and December 31, 2018 related to this matter. It is reasonably possible that we will incur additional losses above the amount accrued but we cannot estimate a range of such reasonably possible losses at this time. There are no assurances, however, that settlements reached and/or adverse judgments received, if any, will not exceed amounts accrued.
MYLAN N.V. AND SUBSIDIARIES
Notes to Condensed Consolidated Financial Statements (Unaudited) - Continued
U.K. Competition and Markets Authority
Paroxetine
On August 12, 2011, Generics [U.K.] LimitedGUK received notice that the Office of Fair Trading (subsequently changed to the Competition and Markets Authority (the “CMA”)) was openingopened an investigation to explore the possible infringement of the Competition Act 1998 and Articles 101 and 102 of the Treaty on the Functioning of the European Union,EU, with respect to alleged agreements related to Paroxetine. On April 19, 2013, a Statement of Objections was issued to Beecham Group plc, GlaxoSmithKline UK Limited, GlaxoSmithKline plc and SmithKline Beecham Limited (formerly, SmithKline Beecham plc) (together, “GlaxoSmithKline”), Generics [U.K.] Limited, Merck KGaA, Actavis UK Limited (formerly, Alpharma Limited), Xellia Pharmaceuticals ApS (formerly, Alpharma ApS) and Alpharma LLC (formerly, Zoetis Products LLC, Alpharma LLC, and Alpharma Inc.) (together, “Alpharma”), and Ivax LLC (formerly, Ivax Corporation) and Norton Healthcare Limited (which previously traded as Ivax Pharmaceuticals UK) (together, “Ivax”). Generics [U.K.] Limited filed a response to the Statement of Objections, defending itself against the allegations contained therein. The CMA issued a Supplementary Statement of Objections (“SSO”) to the above-referenced parties on October 21, 2014 and a hearing with regard to the SSO took place on December 19, 2014. The CMA issued a decision on February 12, 2016, finding that, GlaxoSmithKline, Generics [U.K.] Limited,GUK, Merck KGaA and Alpharma,other companies were liable for infringing EU and U.K. competition rules. With respect to Merck KGaA and Generics [U.K.] Limited,GUK, the CMA issued a penalty of approximately £5.8 million, for which Merck KGaA is liable for the entire amount; and of that amount Generics [U.K.] LimitedGUK is jointly and severally liable for approximately £2.7 million, which washas been accrued for at Septemberas of June 30, 2017. Generics [U.K.] Limited has appealed the decision.2019. The hearing beforematter is currently on appeal to the Competition Appeals Tribunal, concludedwhich on March 30, 2017 and8, 2018, referred certain questions of law to the parties are presently awaiting a decision.CJEU. The CJEU sought written observations from GUK, which were filed in September 2018. A hearing before the CJEU has been scheduled for September 19, 2019.
Nefopam
MYLAN N.V. AND SUBSIDIARIES
Notes to Condensed Consolidated Financial Statements (Unaudited) - Continued
Italy Investigation
On October 10, 2017,April 18, 2018, certain employees of Mylan N.V.S.p.A. were served with search warrants issued by the Public Prosecutor’s Office in Milan, Italy seeking information concerning interactions with an Italian hospital and Meda Pharmaceuticals Limited received notice that the CMA was opening an investigation to explore the possible infringementsales of the Competition Act 1998 and Article 101 of the Treaty on the Functioning of the European Union, with respect to alleged agreements related to Nefopam, a product from Meda’s portfolio. On October 16, 2017, the CMA issued a notice under Section 26 of the Competition Act 1998 tocertain reimbursable Mylan N.V. and Meda Pharmaceuticals Limited to provide specified information and produce specified documents.S.p.A. drugs. The Company is fully cooperatingassisting its employees in their cooperation with the CMA.investigation.
Product Liability
The Company is involved in a number of product liability lawsuits and claims related to alleged personal injuries arising out of certain products manufactured and/or distributed by the Company, including but not limited to Phenytoin, Alendronate Sodium and Reglan.Company. The Company believes that it has meritorious defenses to these lawsuits and claims and is vigorously defending itself with respectintends to those matters.defend against them vigorously. From time to time, the Company has agreed to settle or otherwise resolve certain lawsuits and claims on terms and conditions that are in the best interests of the Company. The Company has accrued approximately $15.7 million and $10.9 million and $31.5 million at SeptemberJune 30, 20172019 and December 31, 2016,2018, respectively. It is reasonably possible that we will incur additional losses and fees above the amount accrued but we cannot estimate a range of such reasonably possible losses or legal fees related to these claims at this time. There are no assurances, however, that settlements reached and/or adverse judgments received, if any, will not exceed amounts accrued.
Intellectual Property
MPI filed with the FDA a Paragraph IV certification stating that approval of MPI’s ANDA for glatiramer acetate injection, 20 mg/mL will not infringe any valid claim of patents owned or controlled by Teva Pharmaceuticals USA, Inc., Yeda Research and Development Co., or their affiliates (“Plaintiffs”), listed in the FDA’s Orange Book. There are currently no unexpired patents for the product listed in the FDA’s Orange Book. On October 3, 2017, Mylan received final FDA approval and launched its 20 mg/mL glatiramer acetate product in the United States.
MPI filed with the FDA a Paragraph IV certification stating that approval of MPI’s ANDA for glatiramer acetate injection, 40 mg/mL will not infringe any valid claim of patents owned or controlled by the Plaintiffs listed in the FDA’s Orange Book. On October 6, 2014, Plaintiffs filed suit against MPI and Mylan Inc. in the District Court for the District of Delaware seeking monetary damages, injunctive relief, attorneys’ fees, costs and other relief. In February and March 2015, Mylan filed petitions with the Patent Trial and Appeal Board requesting inter partes review of the claims of three asserted patents. On August 24, 2016 and September 1, 2016, respectively, the Patent Trial and Appeal Board issued final written
MYLAN N.V. AND SUBSIDIARIES
Notes to Condensed Consolidated Financial Statements (Unaudited) - Continued
decisions finding all claims of three asserted patents unpatentable as obvious. After Plaintiffs’ requests for reconsideration of those decisions, the Patent Trial and Appeal Board issued revised final written decisions addressing issues raised in the requests for reconsideration and again finding all claims of three asserted patents unpatentable as obvious. On January 30, 2017, the Delaware District Court found, after trial, the asserted claims of the four patents-in-suit invalid as obvious. Plaintiffs have appealed both decisions, and those appeals are pending. On January 17, 2017, Plaintiffs filed suit against Mylan in the District Court for the Northern District of West Virginia asserting claims related to a process patent not listed in the FDA’s Orange Book seeking monetary damages, injunctive relief, attorneys’ fees, costs and other relief. The West Virginia District Court granted Mylan’s request to transfer the case to the Delaware District Court, and the case remains pending. A trial date has been scheduled for October 9, 2018. On October 3, 2017, Mylan received final FDA approval and launched its 40 mg/mL glatiramer acetate product in the United States.
On October 19, 2017, Teva Pharmaceutical Industries Ltd. (“Teva”) commenced an action with the Irish High Court against Mylan Teoranta alleging that Mylan’s glatiramer acetate 40mg/mL product, which is manufactured in Ireland, approved by the FDA and is currently being sold in the U.S., infringes two European patents, EP (IE) 2 949 335 and EP (IE) 3 050 556. Teva is seeking damages and/or an account of profits fromsubsequently dropped its infringement allegation related to the EP (IE) 3 050 556 patent. The matter has now been resolved and Mylan forwill continue its production activities with respect to the alleged infringement. Teva has also requested the Irish High Court to enjoin Mylan Teoranta from making, offering, putting on the market and/or using its glatiramer acetateU.S. 40mg/mL product in Ireland pending final determinationIreland.
On September 22, 2017, Amgen Inc. and Amgen Manufacturing Limited (“Amgen”) sued Mylan Inc., Mylan N.V., Mylan GMBH, and MPI in the Western District of Pennsylvania asserting that Mylan’s Fulphila® infringes U.S. patent numbers 8,273,707 and 9,643,997. On June 4, 2018, the FDA approved Mylan’s Fulphila® (pegfilgrastim-jmdb), a biosimilar to Neulasta® (pegfilgrastim), co-developed with Biocon. In July 2018, Mylan began selling Fulphila®. Amgen is seeking monetary damages, injunctive relief, attorneys’ fees, costs and other relief.
On July 31, 2015, BTG International Ltd., Janssen Biotech, Inc., Janssen Oncology, Inc., and Janssen Research & Development, LLC (“Janssen”) sued Mylan Inc. and MPI, along with numerous other abbreviated new drug application (“ANDA”) applicants, in the District of New Jersey and asserted that Mylan’s and the other ANDA applicants’ abiraterone acetate ANDA products infringe U.S. Patent number 8,822,438 (“’438”).
Mylan and others filed Inter Partes Review (“IPR”) petitions challenging the validity of the action. A hearing on Teva’s Ireland injunction’438 patents’ claims. On January 17, 2018, the U.S. Patent and Trademark Appeal Board (“PTAB”) issued Final Written Decisions in the IPR proceedings finding all claims of the ’438 patent unpatentable as obvious. On October 26, 2018, the district court issued an opinion similarly finding the ’438 patents’ claims invalid as obvious. On October 31, 2018, the FDA approved Mylan’s abiraterone acetate ANDA. Mylan, along with certain other ANDA applicants, began selling their abiraterone acetate ANDA products in November 2018.
Janssen appealed both the district court and IPR decisions to the Federal Circuit. On May 14, 2019, the Federal Circuit affirmed the PTAB’s decision that all claims of the ‘438 patent were unpatentable as obvious. As a result of this finding, the Federal Circuit did not need to consider Janssen’s appeal of the district court decision. Janssen did not seek a further appeal of the decision with the Federal Circuit, but the deadline to request is set for January 2018.review by the Supreme Court has not passed.
The Company has used its business judgment in connection with the decision to launch the 40mg/mL glatiramer acetate, productFulphila® and abiraterone acetate products and has also used its business judgment in certain other situations to decide to market and sell products, in each case based on its belief that the applicable patents are invalid and/or that its products do not infringe, notwithstanding the fact that allegations of patent infringement(s) or other potential third party rights have not been finally resolved by the courts. The risk involved in doing so can be substantial because the remedies available to the owner of a patent for infringement may include, a reasonable royalty on sales or damages measured by the profits lost by the patent owner. If there is a finding of willful infringement, damages may be increased up to three times. Moreover, because of the discount pricing typically involved with bioequivalent products, patented branded products generally realize a substantially higher profit
MYLAN N.V. AND SUBSIDIARIES
Notes to Condensed Consolidated Financial Statements (Unaudited) - Continued
margin than bioequivalentgeneric and biosimilar products. AnMylan intends to defend against any such patent infringement claims vigorously. However, an adverse decision could have an adverse effect that is material to our business, financial condition, results of operations, cash flows and/or ordinary share price.
Celgene
Mylan filed suit in 2014 against Celgene Corporation (“Celgene”) alleging monopolization and restraint of trade in the markets for thalidomide and lenalidomide. Following discovery and summary judgment, the District Court scheduled a trial on Mylan’s claims that had survived pre-trial motion practice for October 2019. In July 2019, the parties resolved the litigation, whereby Mylan will receive $62 million and the case will be dismissed.
Other Litigation
The Company is involved in various other legal proceedings that are considered normal to its business. The Company has approximately $8.8$7.1 million accrued related to these various other legal proceedings at SeptemberJune 30, 2017.2019.
On July 29, 2019, the Company, Pfizer, Inc. ("Pfizer”), Upjohn Inc., a wholly-owned subsidiary of Pfizer ("Upjohn"), and certain other affiliated entities entered into a Business Combination Agreement (the "Business Combination Agreement") pursuant to which the Company will combine with Upjohn in a Reverse Morris Trust transaction (the "Combination"). Upjohn is a global, primarily off-patent branded and generic established medicines business, which includes 20 primarily off-patent solid oral dose legacy brands, such as Lyrica, Lipitor, Celebrex and Viagra, as well as certain generic medicines.
Prior to the Combination and pursuant to a Separation Agreement (the "Separation Agreement"), dated as of July 29, 2019, between Pfizer and Upjohn, Pfizer will, among other things, transfer to Upjohn substantially all of the assets and liabilities comprising Upjohn’s business (the “Separation”) and, thereafter, Pfizer will distribute to Pfizer shareholders all of the issued and outstanding shares of Upjohn (the "Distribution" and, together with the Separation and the Combination, the “Transaction”). The Combination is expected to occur immediately after the Distribution. Following the Combination, it is anticipated that Pfizer’s shareholders will own approximately 57 percent and the Company's ordinary shareholders will own approximately 43 percent of Upjohn's common stock.
Prior to, and as a condition of, the Distribution, Upjohn will make a cash payment to Pfizer equal to $12.0 billion. Upjohn has obtained commitments for the initial financing of the transaction in the form of a bridge loan from certain financial institutions. If Upjohn obtains additional funding by issuing securities or obtaining other loans, the amount of the bridge facility will be correspondingly reduced. The bridge loan is subject to customary terms and conditions including a financial covenant.
The consummation of the Combination is subject to various customary closing conditions, including (i) approval by the Company's ordinary shareholders, (ii) anti-trust approvals in various countries, (iii) completion of the Separation (including the payment of $12 billion of cash by Upjohn to Pfizer) and the Distribution, (iv) confirmation by applicable tax authorities of the intended tax treatment of the transaction, (v) obtaining other regulatory approvals necessary to complete the Combination, and (vi) the absence of any law or order from any court or governmental authority restraining, enjoining or prohibiting the transaction.
ITEM 2. MANAGEMENT’S DISCUSSION AND ANALYSIS OF FINANCIAL CONDITION AND RESULTS OF OPERATIONS
The following discussion and analysis addresses material changes in the financial condition and results of operations of Mylan N.V. and subsidiaries for the periods presented. Unless context requires otherwise, the “Company”, “Mylan”, “our”, or “we” refer to Mylan N.V. and its subsidiaries. This discussion and analysis should be read in conjunction with the Consolidated Financial Statements, the related Notes to Consolidated Financial Statements and Management’s Discussion and Analysis of Financial Condition and Results of Operations included in Mylan N.V.’s Annual Report on Form 10-K for the year ended December 31, 2016,2018, as amended (the “2018 Form 10-K”), the unaudited interim financial statements and related Notes included in Part I — ITEM 1 of this Quarterly Report on Form 10-Q (“Form 10-Q”) and our other Securities and Exchange Commission (the “SEC”) filings and public disclosures. The interim results of operations and comprehensive earnings for the three and ninesix months ended SeptemberJune 30, 20172019, and cash flows for the ninesix months ended SeptemberJune 30, 20172019 are not necessarily indicative of the results to be expected for the full fiscal year or any other future period.
This Form 10-Q contains “forward-looking statements.” These statements are made pursuant to the safe harbor provisions of the Private Securities Litigation Reform Act of 1995. Such forward-looking statements may include, without limitation, statements about the acquisition of Meda AB (publ.) (“Meda”) by Mylan (the “Meda Transaction”), Mylan’s acquisition (the “EPD Transaction”) of Mylan Inc. and Abbott Laboratories’ non-U.S. developed markets specialty and branded generics business (the “EPD Business”)Combination (as defined above), the potentialexpected timetable for completing the Combination, the benefits and synergies of the EPD Transaction and the Meda Transaction,Combination, future opportunities for Mylanthe combined company and products and any other statements regarding Mylan’s and Upjohn’s future operations, anticipated business levels, future earnings, planned activities, anticipated growth, market opportunities, strategies, competition, and other expectations and targets for future periods. These may often be identified by the use of words such as “will,” “may,” “could,” “should,” “would,” “project,” “believe,” “anticipate,” “expect,” “plan,” “estimate,” “forecast,” “potential,” “pipeline,” “intend,” “continue,” “target,” “seek” and variations of these words or comparable words. Because forward-looking statements inherently involve risks and uncertainties, actual future results may differ materially from those expressed or implied by such forward-looking statements. Factors that could cause or contribute to such differences include, but are not limited to: with respect to the Combination, the parties’ ability to meet expectations regarding the timing, completion and accounting and tax treatments of the EPD Transaction and the Meda Transaction;Combination, changes in relevant tax and other laws, the parties’ ability to consummate the Combination, the conditions to the completion of the Combination, including butreceipt of approval of Mylan’s shareholders, not limitedbeing satisfied or waived on the anticipated timeframe or at all, the regulatory approvals required for the Combination not being obtained on the terms expected or on the anticipated schedule or at all, the integration of Mylan and Upjohn being more difficult, time consuming or costly than expected, Mylan’s and Upjohn’s failure to achieve expected or targeted future financial and operating performance and results, the possibility that the combined company may be unable to achieve expected benefits, synergies and operating efficiencies in connection with the Combination within the expected time frames or at all or to successfully integrate Mylan and Upjohn, customer loss and business disruption being greater than expected following the Combination, the retention of key employees being more difficult following the Combination, changes in third-party relationships and changes in the U.S. tax codeeconomic and healthcare and pharmaceutical laws and regulations infinancial conditions of the U.S. and abroad;business of Mylan or Upjohn; actions and decisions of healthcare and pharmaceutical regulators; the integration of the EPD Business and Meda being more difficult, time-consuming, or costly than expected; operating costs, customer loss, and business disruption (including, without limitation, difficulties in maintaining relationships with employees, customers, clients, or suppliers) being greater than expected following the EPD Transaction and the Meda Transaction; the retention of certain key employees of the EPD Business and Meda being difficult; the possibility that Mylan may be unablefailure to achieve expected synergies and operating efficiencies in connection with the EPD Transaction, the Meda Transaction, and the December 2016 announced restructuring program in certain locations, within the expected time-frames or at all and to successfully integrate the EPD Business and Meda; expected or targeted future financial and operating performance and results; the capacityuncertainties regarding future demand, pricing and reimbursement for our or Upjohn’s products; any regulatory, legal, or other impediments to Mylan’s or Upjohn’s ability to bring new products to market, including, but not limited to, where Mylan or Upjohn uses its business judgment and decides to manufacture, market, and/or sell products, directly or through third parties, notwithstanding the fact that allegations of patent infringement(s) have not been finally resolved by the courts (i.e., an “at-risk launch”); any regulatory, legal, or other impediments to Mylan’s ability to bring new products, including but not limited to generic Advair and Glatiramer Acetate Injection 20 mg/mL and 40 mg/mL, to market, including ongoing and unresolved allegations of patent infringement around our launch of Glatiramer Acetate Injection 40 mg/mL;success of clinical trials and Mylan’s or Upjohn’s ability to execute on new product opportunities, including but not limited to generic Advair and Glatiramer Acetate Injection 20 mg/mL and 40 mg/mL;opportunities; any changes in or difficulties with our or Upjohn’s manufacturing facilities, including with respect to remediation and restructuring activities, supply chain or inventory of, and ouror the ability to manufacture and distribute, the EpiPen® Auto-Injector and EpiPen Jr® Auto-Injector (collectively, “EpiPen® Auto-Injector”) to meet anticipated demand; the potential impact of any change in patient access to the EpiPen® Auto-Injector and the introduction of a generic version of the EpiPen® Auto-Injector; the scope, timing, and outcome of any ongoing legal proceedings, including government investigations, and the impact of any such proceedings on our or Upjohn’s financial condition, results of operations, and/or cash flows; the ability to meet expectations regarding the accounting and tax treatments of acquisitions, including Mylan’s acquisition of Mylan Inc. and Abbott Laboratories’ non-U.S. developed markets specialty and branded generics business (the “EPD Business”); changes in relevant tax and other laws, including but not limited to changes in the U.S. tax code and healthcare and pharmaceutical laws and regulations in the U.S. and abroad; any significant breach of data security or data privacy or disruptions to our or Upjohn’s information technology systems; the ability to protect intellectual property and preserve intellectual property rights; the effect of any changes in customer and supplier relationships and customer purchasing patterns; the ability to attract and retain key personnel; changes in third-party relationships; the impact of competition; changes in the economic and financial conditions of the businesses of Mylan; the inherent challenges, risks, and costs in identifying, acquiring, and integrating complementary or strategic acquisitions of other companies, products, or assets being more difficult, time-consuming or costly than anticipated; the possibility that Mylan may be unable to achieve expected synergies and operating efficiencies in achieving anticipated synergies;connection with strategic acquisitions, strategic initiatives or restructuring programs within the expected time-frames or at all; uncertainties and matters beyond the control of management;management, including but not limited to general political and economic conditions and global exchange rates; and inherent uncertainties involved in the estimates and judgments used in the preparation of financial statements, and the providing of estimates of financial measures, in accordance with accounting principles generally accepted in the United States of America (“U.S. GAAP”) and related standards or on an adjusteda
djusted basis. For more detailed information on the risks and uncertainties associated with Mylan’s business activities, see the risks described in Mylan’s Annual Report onthe 2018 Form 10-K, for the year ended December 31, 2016, as amendedthis Form 10-Q and our other
filings with the SEC. You can access Mylan’s filings with the SEC through the SEC website at www.sec.gov or through our website, and Mylan strongly encourages you to do so. Mylan routinely posts information that may be important to investors on our website at investor.mylan.com, and we may use this website address as a means of disclosing material information to the public in a broad, non-exclusionary manner for purposes of the SEC'sSEC’s Regulation Fair Disclosure (Reg FD). The contents of our website are not incorporated by reference in this Report on Form 10-Q and shall not be deemed “filed” under the Securities Exchange Act.Act of 1934, as amended. Mylan undertakes no obligation to update any statements herein for revisions or changes after the filing date of this Form 10-Q.10-Q other than as required by law.
ExecutiveCompany Overview
Mylan is a leading global pharmaceutical company which develops, licenses, manufactures, markets and distributes generic, brand name and over-the-counter (“OTC”) products in a variety of dosage forms and therapeutic categories. Mylan is committed to setting new standards in healthcare by creating better health for a better world, and our mission is to provide the world’s providing 7 billion people access to high quality medicine. To do so, we innovate to satisfy unmet needs; make reliability and service excellenceWe offer a habit; do what’s right, not what’s easy; and impact the future through passionate global leadership.
Mylan offers onegrowing portfolio of the industry’s broadest product portfolios, including generic, brand name and OTC products in a variety of dosage forms and therapeutic categories. The Company’s product portfolio includes more than 7,500 marketed products, globally,including prescription generic, branded generic, brand-name drugs and reaches customersover-the-counter (“OTC”) remedies. We market our products in more than 165 countries and territories. We operateEvery member of our approximately 35,000-strong global workforce is dedicated to delivering better health for a better world.
Over the last several years, Mylan has transformed itself through a clear, consistent and differentiated strategy into a company that is built to last. Fueling that durability is a business model anchored in providing access, Mylan’s core purpose.
Providing access requires that we satisfy the needs of an incredibly diverse global high quality vertically-integrated manufacturing platform around the worldmarketplace whose economic and onepolitical systems, approaches to delivering and paying for healthcare, languages and traditions, and customer and patient requirements vary by location and over time.
With these considerations in mind, we built and scaled our commercial, operational and scientific platforms to meet customers’ evolving needs in ways that are globally consistent and locally sensitive. As a result, not only are we succeeding in expanding people’s access to medicine, we are continually diversifying our business.
This diversification is what drives our durability. Durability allows us to withstand and overcome competitive pressures while continuing to innovate. It also allows us to generate consistent financial results, including reliable cash flows capable of supporting ongoing investments in long-term growth.
Financial Summary
The tables below are a summary of the world’s largest activeCompany’s financial results for the three and six months ended June 30, 2019 compared to the prior year periods:
|
| | | | | | | | | | | | | | |
| | Three Months Ended |
| | June 30, |
| (In millions, except per share amounts) | 2019 | | 2018 | | Change | | % Change |
| Total revenues | $ | 2,851.5 |
| | $ | 2,808.3 |
| | $ | 43.2 |
| | 2 | % |
| Gross profit | 932.6 |
| | 962.5 |
| | (29.9 | ) | | (3 | )% |
| Earnings from operations | 95.5 |
| | 178.9 |
| | (83.4 | ) | | (47 | )% |
| Net (loss) earnings | (168.5 | ) | | 37.5 |
| | (206.0 | ) | | (549 | )% |
| Net (loss) earnings per diluted ordinary share | $ | (0.33 | ) | | $ | 0.07 |
| | $ | (0.40 | ) | | (571 | )% |
| | | | | | | | |
| | Six Months Ended |
| | June 30, |
| (In millions, except per share amounts) | 2019 | | 2018 | | Change | | % Change |
| Total revenues | $ | 5,347.0 |
| | $ | 5,492.8 |
| | $ | (145.8 | ) | | (3 | )% |
| Gross profit | 1,737.8 |
| | 1,946.8 |
| | (209.0 | ) | | (11 | )% |
| Earnings from operations | 119.5 |
| | 334.6 |
| | (215.1 | ) | | (64 | )% |
| Net (loss) earnings | (193.5 | ) | | 124.6 |
| | (318.1 | ) | | (255 | )% |
| Net (loss) earnings per diluted ordinary share | $ | (0.38 | ) | | $ | 0.24 |
| | $ | (0.62 | ) | | (258 | )% |
Certain Market and Industry Factors
As more fully explained in the 2018 Form 10-K, the global pharmaceutical ingredient (“API”) operations. We also operateindustry is a stronghighly competitive and innovative researchhighly regulated industry. As a result, we face a number of industry-specific factors and development (“R&D”) network that has consistently delivered a robust product pipeline, including complex products such as injectables.challenges, which can significantly impact our results. The following discussion highlights some of these key factors and market conditions.
Generic products, particularly in the U.S., generally contribute most significantly to revenues and gross margins at the time of their launch, and even more so in periods of market exclusivity, or in periods of limited generic competition. As such, the timing of new product introductions can have a significant impact on the Company’s financial results. The entrance into the market of additional competition generally has a negative impact on the volume and pricing of the affected products. Additionally, pricing is often affected by factors outside of the Company’s control.
For branded products, the majority of the product’s commercial value is usually realized during the period in which the product has market exclusivity. In the U.S. and some other countries, when market exclusivity expires and generic versions of a product are approved and marketed, there can often be very substantial and rapid declines in the branded product’s sales. OTC products also participate in a competitive environment that includes both branded and private label products. In the OTC space, value is realized through innovation, access and consumer activation.
Certain markets within Europe in which we do business outside of the U.S. have undergone government-imposed price reductions, and further government-imposed price reductions are expected in the future. Such measures, along with the tender systems discussed below, are likely to have a negative impact on sales and gross profit in these markets. However, government initiatives in certain markets that appear to favor generic products could help to mitigate this unfavorable effect by increasing rates of generic substitution and penetration. In France, we remain the generics market leader.
AAdditionally, a number of markets in which we operate in Europeoutside of the U.S. have implemented, or may implement, tender systems for generic pharmaceuticals in an effort to lower prices. Generally speaking, tender systems can have an unfavorable impact on sales and profitability. Under such tender systems, manufacturers submit bids that establish prices for generic pharmaceutical products. Upon winning the tender, the winning company will receive priority placement for a period of time. The tender system often results in companies underbidding one another by proposing low pricing in order to win the tender. The loss of a tender by a third party to whom we supply APIactive pharmaceutical ingredient can also have a negative
impact on our sales and profitability. Sales continue to be negatively affected by the impact of tender systems.
Assystems in Europe, both Australia and Japan have undergone government-imposed price reductions that have had, and could continue to have, a negative impact on sales and gross profit in these markets.
The acquisition of Meda significantly increased our operations and revenues throughout Europe, but particularly in France, Italy, Germany and Sweden. Additionally, through the acquisition, we have significantly expanded and strengthened our presence in emerging markets including China, Southeast Asia and the Middle East. These markets provide opportunities for future growth and expansion and are complemented by Mylan’s historical presence in India, Brazil and certain countries in Africa (including South Africa).countries.
Effective October 1, 2016, the Company expanded its reportable segments and now reports in three segments on a geographic basis as follows: North America, Europe and Rest of World. Comparative segment financial information have been recast for prior periods to conform to this revised segment structure.
From time to time, a limited number of our products may represent a significant portion of our net sales, gross profit and net earnings. Generally, this is due to the timing of new product introductions and the amount, if any, of additional competition in the market. Our top ten products in terms of sales, in the aggregate, represented approximately 23% and 30% of the Company’s net sales for the three months ended September 30, 2017 and 2016, respectively. For the nine months ended September 30, 2017 and 2016, our top ten products in terms of sales, in the aggregate, represented approximately 22% and 30%, respectively.
Recent Developments
In the fourth quarter of 2016,Upjohn Agreement
On July 29, 2019, the Company, Pfizer, Inc. ("Pfizer”), Upjohn Inc., a wholly-owned subsidiary of Pfizer ("Upjohn"), and certain other affiliated entities entered into a Business Combination Agreement (the "Business Combination Agreement") pursuant to which the Company will combine with Upjohn in a Reverse Morris Trust transaction (the "Combination"). Upjohn is a global, primarily off-patent branded and generic established medicines business, which includes 20 primarily off-patent solid oral dose legacy brands, such as Lyrica, Lipitor, Celebrex and Viagra, as well as certain generic medicines.
Prior to the Combination and pursuant to a Separation Agreement (the "Separation Agreement"), dated as of July 29, 2019, between Pfizer and Upjohn, Pfizer will, among other things, transfer to Upjohn substantially all of the assets and liabilities comprising Upjohn’s business (the “Separation”) and, thereafter, Pfizer will distribute to Pfizer shareholders all of the issued and outstanding shares of Upjohn (the "Distribution" and, together with the Separation and the Combination, the “Transaction”). The Combination is expected to occur immediately after the Distribution. Following the Combination, it is anticipated that Pfizer’s shareholders will own approximately 57 percent and the Company's ordinary shareholders will own approximately 43 percent of Upjohn's common stock.
Prior to, and as a condition of, the Distribution, Upjohn will make a cash payment to Pfizer equal to $12.0 billion. Upjohn has obtained commitments for the initial financing of the transaction in the form of a bridge loan from certain financial institutions. If Upjohn obtains additional funding by issuing securities or obtaining other loans, the amount of the bridge facility will be correspondingly reduced. The bridge loan is subject to customary terms and conditions including a financial covenant.
The consummation of the Combination is subject to various customary closing conditions, including (i) approval by the Company's ordinary shareholders, (ii) anti-trust approvals in various countries, (iii) completion of the Separation (including the payment of $12 billion of cash by Upjohn to Pfizer) and the Distribution, (iv) confirmation by applicable tax authorities of the intended tax treatment of the transaction, (v) obtaining other regulatory approvals necessary to complete the Combination, and (vi) the absence of any law or order from any court or governmental authority restraining, enjoining or prohibiting the transaction.
Restructuring Activities
The Company previously announced a restructuring programs in certain locationsprogram representing initial steps in a series of actions in certain locations that are anticipated to further streamline our operations globally. The Company continues to developrestructuring program, other than the detailsadditional restructuring and remediation activities at the Morgantown, West Virginia plant described below, was substantially complete as of the cost reduction initiatives, including workforce actions and other potentialDecember 31, 2018. We have incurred total restructuring activities beyond the programs already announced.related costs of approximately $655.4 million through June 30, 2019. During the three and nine months ended September 30, 2017, the Company recorded pre-tax charges of $73.42019, we have incurred approximately $54.4 million and $112.7 million, respectively. Included within the charges during the nine months ended September 30, 2017 were $64.9 millionin restructuring expenses for non-cash asset impairment charges withwrite-offs at the remaining charges primarily related to severance and employee benefits. For the charges recognized during the three months ended September 30, 2017, $53.4 million were non-cash asset impairment charges and the remaining charges were primarily related to severance and employee benefits. The continued restructuring actions are expected to be implemented through fiscal year 2018. In the fourth quarter of 2017, the Company committed to additional actions and now anticipates total aggregate pre-tax charges for committed restructuring activities ranging between $375.0 million and $450.0 million, inclusiveMorgantown plant. As a result of the 2016 and year to date 2017overall actions taken under the restructuring charges of $262.4 million. In addition,program through June 30, 2019, management believes the potential annual savings from these committed restructuring activities will be between approximately $350.0$400.0 million and $425.0$475.0 million once fully implemented,realized, with the majority of these savings improving operating cash flow.
In April 2018, the U.S. Food and Drug Administration (the “FDA”) completed an inspection at Mylan’s plant in Morgantown, West Virginia and made observations through a Form 483. The Company submitted a comprehensive response to the FDA and committed to a robust improvement plan. In addition, based upon the Company’s recognition of the continued evolution of industry dynamics and regulatory expectations, during the second quarter of 2018, the Company commenced comprehensive restructuring and remediation activities, which are aimed at reducing complexity at the Morgantown plant and include the discontinuation and transfer to other manufacturing sites of a number of products, a reduction of the workforce and extensive process and plant remediation. In the fourth quarter of 2018, the Company received a warning letter related to the previously disclosed observations at the plant. The issues raised in the warning letter are being addressed within the context of the Company’s comprehensive restructuring and remediation activities.
The Morgantown plant continues to supply products for the U.S. market while we execute on and assess the restructuring and remediation activities. However, these activities have led to a temporary disruption in supply of certain products. Importantly, the profitability of the transferred and discontinued products is not proportionate to the reduced volumes of those products as the Company expects that manufacturing costs related to transferred products will be reduced and many of the discontinued products have lower than average gross margins. In addition, as it relates to North America, no significant new
product revenue is forecasted from the Morgantown plant in 2019, and we are forecasting that only five of our top 50 and only one out of the top 10 gross margin generating products will be manufactured in Morgantown in 2019.
For the three and six months ended June 30, 2019, the Company incurred expenses amounting to approximately $93.7 million and $163.4 million, respectively for incremental manufacturing variances, site remediation and restructuring charges related to the Morgantown plant. At this time, the total expenses related to the additional restructuring and remediation activities at the Morgantown plant cannot be reasonably estimated.
Mylan remains committed to maintaining the highest quality manufacturing standards at its facilities around the world and to continuous assessment and improvement in a time of evolving industry dynamics and regulatory expectations.
On August 17, 2017,January 30, 2019, the Company announced that its subsidiaries, Mylan Inc.received FDA approval of WixelaTM InhubTM (fluticasone propionate and Mylan Specialty L.P.salmeterol inhalation powder, USP), signed an agreement with the U.S. Departmentfirst generic of Justice ("DOJ") and two relators finalizing the $465 million settlement, plus interest, with the DOJ and other government agencies related to the classification of the EpiPen® Auto-Injector for purposes of the Medicaid Drug Rebate Program that Mylan had agreed to the terms of on October 7, 2016 (the “Medicaid Drug Rebate Program Settlement”)GlaxoSmithKline’s Advair Diskus®. The settlement resolves claims relating to the classification of EpiPen® Auto-Injector for purposes of the Medicaid Drug Rebate Program.
In October 2017, the Company announced the U.S.commercial launch of the first Glatiramer Acetate Injection 40 mg/mL for 3-times-a-week injection that is an AP-rated substitutable generic version of Teva's Copaxone® 40 mg/mL, as well as Glatiramer Acetate Injection 20 mg/mL for once-daily injection, an AP-rated, substitutable generic version of Teva's Copaxone® 20 mg/mL. These products are indicated for the treatment of patients with relapsing forms of multiple sclerosis (MS), a chronic inflammatory disease of the central nervous system. The Company also announcedWixelaTM InhubTM occurred in October 2017 that its partner, Synthon, received marketing authorization approval in Europe for Glatiramer Acetate Injection 40 mg/mL. Mylan is partnered with Synthon, the developer and supplier of its European Glatiramer Acetate Injection products, and has exclusive distribution and supply rights in certain key European markets.
Financial Summary
The tables below are a summary of the Company’s financial results for the three and nine months ended September 30, 2017 compared to the prior year period:
|
| | | | | | | | | | | | | | |
| | Three Months Ended |
| | September 30, |
| (In millions, except per share amounts) | 2017 | | 2016 | | Change | | % Change |
| Total revenues | $ | 2,987.1 |
| | $ | 3,057.1 |
| | $ | (70.0 | ) | | (2 | )% |
| Gross profit | 1,178.1 |
| | 1,283.3 |
| | (105.2 | ) | | (8 | )% |
| Earnings (loss) from operations | 316.0 |
| | (130.7 | ) | | 446.7 |
| | 342 | % |
| Net earnings (loss) | 88.3 |
| | (119.8 | ) | | 208.1 |
| | 174 | % |
| Diluted earnings per ordinary share | $ | 0.16 |
| | $ | (0.23 | ) | | $ | 0.39 |
| | 170 | % |
|
| | | | | | | | | | | | | | |
| | Nine Months Ended |
| | September 30, |
| (In millions, except per share amounts) | 2017 | | 2016 | | Change | | % Change |
| Total revenues | $ | 8,668.8 |
| | $ | 7,809.1 |
| | $ | 859.7 |
| | 11 | % |
| Gross profit | 3,488.5 |
| | 3,362.0 |
| | 126.5 |
| | 4 | % |
| Earnings from operations | 1,016.6 |
| | 385.8 |
| | 630.8 |
| | 164 | % |
| Net earnings | 451.7 |
| | 62.5 |
| | 389.2 |
| | 623 | % |
| Diluted earnings per ordinary share | $ | 0.84 |
| | $ | 0.12 |
| | $ | 0.72 |
| | 600 | % |
A detailed discussion of the Company’s financial results can be found below in the section titled “Results of Operations.” As part of this discussion, we also report sales performance using the non-GAAP financial measures of “constant currency” third party net sales and total revenues. This measure providesThese measures provide information on the change in net sales and total revenues assuming that foreign currency exchange rates had not changed between the prior and current period. The comparisons presented at constant currency rates reflect comparative local currency sales at the prior year’s foreign exchange rates. We routinely evaluate our third party net sales and total revenues performance at constant currency so that sales results can be viewed without the impact of foreign currency exchange rates, thereby facilitating a period-to-period comparison of our operational activities, and believe that this presentation also provides useful information to investors for the same reason. The following table compares third party net sales on an actual and constant currency basis for each reportable segment and consolidated total revenues on an actual and constant currency basis for the three and nine months ended September 30, 2017 and 2016.
More information about non-GAAP measures used by the Company as part of this discussion, including adjusted cost of sales, adjusted gross margins, adjusted net earnings and adjusted EPS (all of which are defined below) can be found in “Item 2. Management’s Discussion and Analysis of Financial Condition and Results of Operations - Results of Operations - Use of Non-GAAP Financial Measures.”
Results of Operations
Three Months Ended SeptemberJune 30, 20172019 Compared to Three Months Ended SeptemberJune 30, 20162018
| | | | Three Months Ended | Three Months Ended |
| | September 30, | June 30, |
| (In millions) | 2017 | | 2016 | | % Change | | 2017 Currency Impact (1) | | 2017 Constant Currency Revenues | | Constant Currency % Change (2) | 2019 | | 2018 | | % Change | | 2019 Currency Impact (1) | | 2019 Constant Currency Revenues | | Constant Currency % Change (2) |
| Third party net sales | | | | | | | | | | | | |
| Net sales | | | | | | | | | | | | |
North America (3) | $ | 1,172.2 |
| | $ | 1,505.5 |
| | (22 | )% | | $ | (3.1 | ) | | $ | 1,169.1 |
| | (22 | )% | $ | 1,023.4 |
| | $ | 1,000.8 |
| | 2 | % | | $ | 2.2 |
| | $ | 1,025.6 |
| | 2 | % |
Europe (3) | 1,040.8 |
| | 841.2 |
| | 24 | % | | (45.5 | ) | | 995.3 |
| | 18 | % | 989.6 |
| | 990.6 |
| | — | % | | 59.5 |
| | 1,049.1 |
| | 6 | % |
Rest of World (3) | 743.3 |
| | 682.8 |
| | 9 | % | | (6.2 | ) | | 737.1 |
| | 8 | % | 805.2 |
| | 764.1 |
| | 5 | % | | 31.9 |
| | 837.1 |
| | 10 | % |
Total third party net sales (3) | 2,956.3 |
| | 3,029.5 |
| | (2 | )% | | $ | (54.8 | ) | | $ | 2,901.5 |
| | (4 | )% | |
| Total net sales | | 2,818.2 |
| | 2,755.5 |
| | 2 | % | | $ | 93.6 |
| | $ | 2,911.8 |
| | 6 | % |
| | | | | | | | | | | | | | | | | | | | | | | |
| Other third party revenues | 30.8 |
| | 27.6 |
| | 12 | % | | (0.5 | ) | | 30.3 |
| | 10 | % | |
Other revenues (3) | | 33.3 |
| | 52.8 |
| | (37 | )% | | 0.7 |
| | 34.0 |
| | (36 | )% |
Consolidated total revenues | $ | 2,987.1 |
| | $ | 3,057.1 |
| | (2 | )% | | $ | (55.3 | ) | | $ | 2,931.8 |
| | (4 | )% | $ | 2,851.5 |
| | $ | 2,808.3 |
| | 2 | % | | $ | 94.3 |
| | $ | 2,945.8 |
| | 5 | % |
| |
(1) | Currency impact is shown as unfavorable (favorable). |
| |
(2) | The constant currency percentage change is derived by translating third party net sales or revenues for the current period at prior year comparative period exchange rates, and in doing so shows the percentage change from 20172019 constant currency third party net sales or revenues to the corresponding amount in the prior year. |
| |
(3) | Effective October 1, 2016,For the Company expanded its reportable segments as follows:three months ended June 30, 2019, other revenues in North America, Europe, and Rest of World. AsWorld were approximately $19.1 million, $3.8 million, and $10.4 million, respectively. |
| |
(4) | Amounts exclude intersegment revenue that eliminates on a result, the amounts previously reported under the Specialty segment have been recast to North America and amounts related to Brazil are included in Rest of World for all periods presented.consolidated basis. |
Total Revenues
For the current quarter, Mylan reported total revenues of $2.992.85 billion, compared to $3.062.81 billion for the comparable prior year period, representing a decreasean increase of $70.0$43.2 million, or 2%. Total revenues include both net sales and other revenues from third parties. Third party netNet sales for the current quarter were $2.962.82 billion, compared to $3.032.76 billion for the comparable prior year period, representing a decreasean increase of $73.2$62.7 million, or 2%. Other third party revenues for the current quarter were $30.833.3 million, compared to $27.6$52.8 million for the comparable prior year period, an increasea decrease of $3.2$19.5 million.
The decreaseincrease in total revenues was due primarily to a 22% decline in third party net sales included an increase in the North America segment. This result was partially offset by third party net sales growth in the Europe segment of 24%,2% and in the Rest of World segment of 9%5%. The incremental impact on third partyNet sales in the Europe segment were essentially flat when compared to the prior year period. Mylan’s net sales from the acquisition of Meda was approximately $163.6 million. Net sales of existing products and new product introductions decreased in total by approximately $291.6 million. The decrease from existing products was due primarily to lower pricing and, to a lesser extent, lower volumes in the current period. Mylan’s current quarter total revenues were favorablyunfavorably impacted by the effect of foreign currency translation, primarily reflecting changes in the U.S. Dollar as compared to the currencies of Mylan’s subsidiaries in India, the European Union and India, which was partially offset by theAustralia. The unfavorable impact from changes in the Japanese Yen. The favorable impact of foreign currency translation on current quarter total revenuesperiod net sales was approximately $55.3$93.6 million, resulting inor 3%. On a constant currency basis, net sales increased by approximately $156.3 million, or 6%. This increase was primarily driven by new product sales, partially offset by a decrease in constant currency total revenuesnet sales from existing products as a result of lower volumes and, to a lesser extent, pricing.
From time to time, a limited number of our products may represent a significant portion of our net sales, gross profit and net earnings. Generally, this is due to the timing of new product introductions and the amount, if any, of additional competition in the market. Our top ten products in terms of net sales, in the aggregate, represented approximately $125.3 million, or 4%.24% and 22% for the three months ended June 30, 2019 and 2018, respectively. This percentage may fluctuate based upon the timing of new product launches, seasonality and the timing of the discontinuation of products.
Third party netNet sales are derived from our three geographic reporting segments: North America, Europe and Rest of World. The graph below shows third party net sales by segment for the three months ended SeptemberJune 30, 20172019 and 20162018 and the increase (decrease)net change period over period:
North America Segment
Third party net sales from North America decreased by $333.3 million or 22% during the three months ended September 30, 2017 when compared to the prior year period, including the decrease in sales of the EpiPen® Auto-Injector of $245.1 million. Incremental net sales from the acquisition of Meda were approximately $8.2 million in the current quarter. Net sales were negatively impacted in the current quarter due to a decline in sales of existing products as a result of lower pricing and volume, partially offset by new product introductions. As anticipated, our North American generics business experienced higher price erosion than previous quarters, including the impact of the loss of market exclusivity of armodafinil. Sales of the EpiPen® Auto-Injector declined in the current quarter as a result of the impact of the launch of the authorized generic, higher governmental rebates as a result of the Medicaid Drug Rebate Program Settlement, and increased competition. The impact of foreign currency translation on current period third party net sales was less than 1% within North America.
Europe Segment
Third party net sales from Europe increased by $199.6 million or 24% during the three months ended September 30, 2017 when compared to the prior year period. The increase included the result of the incremental net sales from the acquisition of Meda which totaled approximately $117.2 million. The remaining increase in net sales was the result of new product introductions combined with favorable volume and pricing on existing products. The favorable impact of foreign currency translation on current period third party net sales was $45.5 million, or 5% within Europe. Constant currency third party net sales increased by approximately $154.1 million, or 18% when compared to the prior year period.
Rest of World Segment
Third party net sales from Rest of World increased by $60.5 million, or 9% during the three months ended September 30, 2017 when compared to the prior year period. This increase was partially driven by incremental net sales from the acquisition of Meda which totaled approximately $38.2 million. In addition, net sales were positively impacted by new products and increased net sales in emerging markets, which were driven primarily by higher volumes. These increases were partially offset by lower pricing and volumes on existing products from our anti-retroviral (“ARV”) franchise, including active pharmaceutical ingredients. Net sales in Australia increased as a result of sales of new products. Net sales in Japan increased slightly as a result of sales of new products and favorable volumes. Overall, third party net sales from Rest of World were favorably impacted by the effect of foreign currency translation by approximately $6.2 million, or 1% during the three months ended September 30, 2017. Constant currency third party net sales increased by approximately $54.3 million, or 8%.
In addition to third party net sales, the Rest of World segment supplies finished dosage form (“FDF”) generic products and API, primarily from Mylan India, to Mylan subsidiaries in conjunction with the Company’s vertical integration strategy. Intercompany sales related to this strategy were approximately $117.4 million and $133.9 million in the three months ended September 30, 2017 and 2016, respectively. These intercompany sales are eliminated in consolidation and therefore are not included in the consolidated third party net sales.
Cost of Sales and Gross Profit
Cost of sales increased from $1.77 billion for the three months ended September 30, 2016 to $1.81 billion for the three months ended September 30, 2017. Significant components of cost of sales were purchase accounting related amortization of acquired intangible assets, acquisition related costs, restructuring and other special items, which are described further in the section titled Use of Non-GAAP Financial Measures. Gross profit for the three months ended September 30, 2017 was $1.18 billion and gross margins were 39%. For the three months ended September 30, 2016, gross profit was $1.28 billion and gross margins were 42%. Gross margins were negatively impacted in the current quarter by lower gross profit from the sales of existing products in North America, including the EpiPen® Auto-Injector which reduced gross profit by approximately 435 basis points, partially offset by lower purchase accounting amortization by approximately 200 basis points as a result of the prior year amortization of the step-up in the fair value of acquired inventory. Adjusted gross margins were approximately 53% for the three months ended September 30, 2017, compared to approximately 57% for the three months ended September 30, 2016. For the quarter ended September 30, 2017, adjusted gross margins were negatively impacted in the current quarter as a result of lower gross profit from the sales of existing products in North America, including the EpiPen® Auto-Injector which reduced adjusted gross profit by approximately 335 basis points, partially offset by the contributions from acquired businesses and new product introductions.
A reconciliation between cost of sales, as reported under U.S. GAAP, and adjusted cost of sales and adjusted gross margin for the three months ended September 30, 2017 compared to the three months ended September 30, 2016 is as follows:
|
| | | | | | | |
| | Three Months Ended |
| | September 30, |
| (In millions) | 2017 | | 2016 |
| U.S. GAAP cost of sales | $ | 1,809.0 |
| | $ | 1,773.8 |
|
| Deduct: | | | |
| Purchase accounting amortization and other related items | (361.4 | ) | | (421.5 | ) |
| Restructuring related costs | (21.0 | ) | | (9.7 | ) |
| Acquisition related items | 0.2 |
| | (8.5 | ) |
| Other special items | (12.3 | ) | | (12.0 | ) |
| Adjusted cost of sales | $ | 1,414.5 |
| | $ | 1,322.1 |
|
| | | | |
Adjusted gross profit (a) | $ | 1,572.6 |
| | $ | 1,735.0 |
|
| | | | |
Adjusted gross margin (a) | 53 | % | | 57 | % |
____________
| |
(a)
| Adjusted gross profit is calculated as total revenues less adjusted cost of sales. Adjusted gross margin is calculated as adjusted gross profit divided by total revenues. |
Operating Expenses
Research & Development Expense
R&D expense for the three months ended September 30, 2017 was $182.3 million, compared to $199.1 million for the comparable prior year period, a decrease of $16.8 million. This decrease was primarily due to lower expenditures related to the Company’s respiratory programs due to the timing of clinical activities when compared to the prior year period. The decrease was partially offset by the incremental impact of the Meda acquisition of approximately $4.1 million in the current quarter.
Selling, General & Administrative Expense
Selling, general and administrative expense (“SG&A”) for the current quarter was $664.6 million, compared to $656.9 million for the comparable prior year period, an increase of $7.7 million. The increase included additional expense related to the Meda acquisition which increased SG&A by approximately $35.5 million in the current quarter. Partially offsetting this increase were lower acquisition related costs, including consulting and legal costs, and the benefit of integration activities in the current quarter.
Litigation Settlements and Other Contingencies, Net
During the three months ended September 30, 2017 and 2016, the Company recorded a charge, net of $15.2 million and $558.0 million, respectively. The net charge for the three months ended September 30, 2017, consists primarily of an increase to an accrual for an anti-trust related matter. The net charge in the prior year period was primarily related to the Medicaid Drug Rebate Program Settlement and the settlement with Strides Arcolab regarding substantially all outstanding regulatory, warranty and indemnity claims (the “Strides Settlement”) related to the acquisition of Agila Specialties Private Limited (“Agila”).
Interest Expense
Interest expense for the three months ended September 30, 2017 totaled $131.8 million, compared to $144.4 million for the three months ended September 30, 2016, a decrease of $12.6 million. The decrease in the current quarter is primarily due to lower long-term debt balances in relation to the prior year period.
Other Expense, Net
Other expense, net, was $4.6 million in the current quarter, compared to $50.2 million for the comparable prior year period. Other expense, net, includes losses from equity affiliates, foreign exchange gains and losses, interest, and other investment gains and losses. Other expense, net was comprised of the following for the three months ended September 30, 2017 and 2016, respectively:
|
| | | | | | | |
| | Three Months Ended September 30, |
| (In millions) | 2017 | | 2016 |
| Losses from equity affiliates, primarily clean energy investments | $ | 22.4 |
| | $ | 29.7 |
|
| Foreign exchange (gains)/losses, net | (14.9 | ) | | 27.8 |
|
| Other gains, net | (2.9 | ) | | (7.3 | ) |
| Other expense, net | $ | 4.6 |
| | $ | 50.2 |
|
In the prior year period, other expense, net included foreign exchange losses of $27.8 million which included $44.4 million of mark-to-market losses related to the Company’s SEK non-designated foreign currency contracts related to the Meda acquisition partially offset by foreign currency gains.
Income Tax Provision (Benefit)
For the three months ended September 30, 2017, the Company recognized an income tax provision of $91.3 million, compared to an income tax benefit of $205.5 million for the comparable prior year period. The effective tax rate for the three months ended September 30, 2017 versus the comparable prior year period was impacted by the changing mix of income earned in jurisdictions with differing tax rates, and changes in 2017 valuation allowances applied to certain tax attributes. In addition, during the third quarter of 2016, the Company received approvals from the relevant Indian regulatory authorities to legally merge its wholly owned subsidiary, Jai Pharma Limited, into Mylan Laboratories Limited. The merger resulted in the recognition of a deferred tax asset of $150 million for the tax deductible goodwill in excess of the book goodwill with a corresponding benefit to income tax provision for the three months ended September 30, 2016. In addition to the benefit recognized for the merger of the aforementioned entities, the effective tax rate for the three months ended September 30, 2016 was impacted by the accrual for the Medicaid Drug Rebate Program Settlement.
Nine Months Ended September 30, 2017 Compared to Nine Months Ended September 30, 2016
|
| | | | | | | | | | | | | | | | | | | | | |
| | Nine Months Ended |
| | September 30, |
| (In millions) | 2017 | | 2016 | | % Change | | 2017 Currency Impact (1) | | 2017 Constant Currency Revenues | | Constant Currency % Change (2) |
| Third party net sales | | | | | | | | | | | |
North America (3) | $ | 3,666.7 |
| | $ | 4,064.5 |
| | (10 | )% | | $ | (2.3 | ) | | $ | 3,664.4 |
| | (10 | )% |
Europe (3) | 2,887.1 |
| | 2,026.4 |
| | 42 | % | | (2.4 | ) | | 2,884.7 |
| | 42 | % |
Rest of World (3) | 2,016.4 |
| | 1,654.6 |
| | 22 | % | | (27.0 | ) | | 1,989.4 |
| | 20 | % |
Total third party net sales (3) | 8,570.2 |
| | 7,745.5 |
| | 11 | % | | (31.7 | ) | | 8,538.5 |
| | 10 | % |
| | | | | | | | | | | | |
| Other third party revenues | 98.6 |
| | 63.6 |
| | 55 | % | | — |
| | 98.6 |
| | 55 | % |
| Consolidated total revenues | $ | 8,668.8 |
| | $ | 7,809.1 |
| | 11 | % | | $ | (31.7 | ) | | $ | 8,637.1 |
| | 11 | % |
____________ | |
(1)
| Currency impact is shown as unfavorable (favorable). |
| |
(2)
| The constant currency percentage change is derived by translating third party net sales or revenues for the current period at prior year comparative period exchange rates, and in doing so shows the percentage change from 2017 constant currency third party net sales or revenues to the corresponding amount in the prior year. |
| |
(3)
| Effective October 1, 2016, the Company expanded its reportable segments as follows: North America, Europe and Rest of World. As a result, the amounts previously reported under the Specialty segment have been recast to North America and amounts related to Brazil are included in Rest of World for all periods presented. |
Total Revenues
For the nine months ended September 30, 2017, Mylan reported total revenues of $8.67 billion, compared to $7.81 billion for the comparable prior year period, representing an increase of $859.7 million, or 11%. Total revenues include both net sales and other revenues from third parties. Third party net sales for the nine months ended September 30, 2017 were $8.57 billion, compared to $7.75 billion for the comparable prior year period, representing an increase of $824.7 million, or 11%. Other third party revenues for the nine months ended September 30, 2017 were $98.6 million, compared to $63.6 million for the comparable prior year period, an increase of $35.0 million. The increase in other third party revenues was principally the result of an increase in royalty income from arrangements acquired in the Meda acquisition.
The increase in total revenues included third party net sales growth in the Europe segment of 42%, and in the Rest of World segment of 22%. Third party net sales decreased in the North America segment by 10%. Contributing to the overall increase in total revenues were net sales from the acquisitions of Meda and the non-sterile, topicals-focused business (the “Topicals Business”) of Renaissance Acquisition Holdings, LLC of approximately $1.40 billion. This increase was partially offset by a net decrease in net sales from existing products and lower new product introductions of approximately $609.4 million. The decrease from existing products was due primarily to lower pricing and, to a lesser extent, lower volumes in the current period. Mylan’s total revenues were favorably impacted by the effect of foreign currency translation, primarily reflecting changes in the U.S. Dollar as compared to the currencies of Mylan’s subsidiaries in India, Australia, and the European Union, which was partially offset by the unfavorable impact from changes in Japan and the United Kingdom. The favorable impact of foreign currency translation on current year total revenues was approximately $31.7 million. Constant currency total revenue growth for the nine months ended September 30, 2017 was approximately $828.0 million, or 11%.
Third party net sales are derived from our three geographic reporting segments: North America, Europe and Rest of World. The graph below shows third party net sales by segment for the nine months ended September 30, 2017 and 2016 and the increase (decrease) period over period:
North America Segment
Third party netNet sales from North America decreasedincreased by $397.8$22.6 million or 10%2% during the ninethree months ended SeptemberJune 30, 20172019 when compared to the prior year including the decrease inperiod. This increase was primarily driven by new product sales of the EpiPen® Auto-Injector of $523.5 million. Net salespartially offset by lower volumes of existing products decreasedand, to a lesser extent, pricing. New product sales were primarily driven by sales of Fulphila™ (biosimilar to Neulasta®) and the WixelaTM InhubTM. The volume decline from existing products was due to lower pricing and volume. This was partially offset by net sales from the acquisitions of Meda and the Topicals Business, totaling approximately $340.0 million. As anticipated, for the nine months ended September 30, 2017, the U.S. generics products experienced price erosionchanges in the high-single-digits. Sales of the EpiPen® Auto-Injector declined in the nine month period as a result of the impact of the launch of the authorized generic, higher governmental rebates as a result of the Medicaid Drug Rebate Program Settlement, and increased competition.competitive environment. The impact of foreign currency translation on the current period third party net sales was insignificant within North America.
Europe Segment
Third party netNet sales from Europe decreased by $1.0 million during the three months ended June 30, 2019 when compared to the prior year period. This decrease was primarily the result of the unfavorable impact of foreign currency translation of approximately $59.5 million or 6%, and to a lesser extent, pricing on existing products. The unfavorable impact of foreign currency translation was offset by new product sales, including Hulio™ and the TOBI Podhaler®, and higher volumes of existing products. Constant currency net sales increased by $860.7approximately $58.5 million, or 42%6%, when compared to the prior year period.
Rest of World Segment
Net sales from Rest of World increased by $41.1 million, or 5% during the ninethree months ended SeptemberJune 30, 20172019 when compared to the prior year period. This increase was primarily the result of net sales from the acquisition of Meda of approximately $833.2 million during the nine months ended September 30, 2017. Net saleshigher volumes of existing products increased as a result ofprimarily driven by products sold in China and new product sales in Australia and favorable pricing, slightlyemerging markets. These increases were partially offset primarily by lower volume. Overall, the favorableunfavorable impact of foreign currency translation and, to a lesser extent, by lower pricing on current period third party net sales was not significant to the Europe segment.
Rest of World Segment
Third partyexisting products. Overall, net sales from Rest of World were unfavorably impacted by the effect of foreign currency translation by approximately $31.9 million, or 4%. Constant currency net sales increased by $361.8approximately $73.0 million, or 22% during the nine months ended September 30, 201710% when compared to the prior year period. This increase was primarily the result of net sales from the acquisition of Meda totaling approximately $229.2 million. In addition, net sales from existing products increased principally as a result of higher volumes in Australia, emerging markets, and from our ARV franchise. Throughout the segment, sales from new products, particularly from our ARV franchise and in Australia, and higher volumes on existing products more than offset lower pricing. Sales from existing products in Japan were flat as higher volumes were offset by unfavorable pricing. The favorable impact of foreign currency translation was $27.0 million, or 2%. Constant currency third party net sales increased by approximately $334.8 million, or 20%.
In addition to third party net sales, the Rest of World segment also supplies FDF generic products and API, primarily from Mylan India, to Mylan subsidiaries in conjunction with the Company’s vertical integration strategy. Intercompany sales related to this strategy were approximately $331.1 million and $308.3 million in the nine months ended September 30, 2017 and 2016, respectively. These intercompany sales are eliminated in consolidation and are not included in the consolidated third party net sales.
Cost of Sales and Gross Profit
Cost of sales increased from $4.45$1.85 billion for the ninethree months ended SeptemberJune 30, 20162018 to $5.18$1.92 billion for the ninethree months ended SeptemberJune 30, 2017.2019. Cost of sales was primarily impacted by purchase accounting related amortization of acquired intangible assets acquisition related costs, restructuring, and other special items, which are described further in the section titled Use of Non-GAAP Financial Measures. Measures. Gross profit for the ninethree months ended SeptemberJune 30, 20172019 was $3.49 billion$932.6 million and gross margins were 40%33%. For the ninethree months ended SeptemberJune 30, 2016,2018, gross profit was $3.36 billion$962.5 million and gross margins were 43%34%. Gross margins were negatively impacted inby the current periodincremental amortization from product acquisitions and by increased amortization expense as a resultexpenses related to the recall of the acquisitionsValsartan products, each of Meda and the Topicals Businesswhich decreased gross margins by approximately 16250 basis points, lower gross profit from the sales of existing products in North America, including the EpiPen® Auto-Injector which reduced gross profit by approximately 318 basis points, partially offset by the contributions from the acquisitions noted above. Adjusted grosspoints. Gross margins were approximately 53% for the nine months ended September 30, 2017, compared to approximately 56% for the nine months ended September 30, 2016. Adjusted gross margins werealso negatively impacted in the current period as a result of lower gross profit from thefor sales of existing products in North America, including the EpiPen® Auto-Injector which reduced adjusted gross profit by approximately 245 basis points, partially offset by the contributionsimpact from new product sales. In addition, gross margins were negatively affected by approximately 25 basis points as a result of incremental manufacturing expenses, site remediation expenses and incremental restructuring charges incurred during the acquisitions noted above.current period principally as a result of the activities at the Company’s Morgantown plant. Adjusted gross margins were 54% for the three months ended June 30, 2019, compared to 53% for the three months ended June 30, 2018.
A reconciliation between cost of sales, as reported under U.S. GAAP, and adjusted cost of sales and adjusted gross margin for the ninethree months ended SeptemberJune 30, 20172019 compared to the ninethree months ended SeptemberJune 30, 20162018 is as follows:
|
| | | | | | | |
| | Nine Months Ended |
| | September 30, |
| (In millions) | 2017 | | 2016 |
| U.S. GAAP cost of sales | $ | 5,180.3 |
| | $ | 4,447.1 |
|
| Deduct: | | | |
| Purchase accounting amortization and other related items | (1,054.9 | ) | | (914.8 | ) |
| Acquisition related items | (1.9 | ) | | (39.8 | ) |
| Restructuring related costs | (37.3 | ) | | (13.8 | ) |
| Other special items | (39.2 | ) | | (34.1 | ) |
| Adjusted cost of sales | $ | 4,047.0 |
| | $ | 3,444.6 |
|
| | | | |
Adjusted gross profit (a) | $ | 4,621.8 |
| | $ | 4,364.5 |
|
| | | | |
Adjusted gross margin (a) | 53 | % | | 56 | % |
|
| | | | | | | |
| | Three Months Ended |
| | June 30, |
| (In millions) | 2019 | | 2018 |
| U.S. GAAP cost of sales | $ | 1,918.9 |
| | $ | 1,845.8 |
|
| Deduct: | | | |
| Purchase accounting amortization and other related items | (440.0 | ) | | (427.4 | ) |
| Acquisition related items | (1.6 | ) | | (0.8 | ) |
| Restructuring and related costs | (46.3 | ) | | (41.0 | ) |
| Share-based compensation expense | (0.5 | ) | | — |
|
| Other special items | (112.1 | ) | | (64.0 | ) |
| Adjusted cost of sales | $ | 1,318.4 |
| | $ | 1,312.6 |
|
| | | | |
Adjusted gross profit (a) | $ | 1,533.1 |
| | $ | 1,495.7 |
|
| | | | |
Adjusted gross margin (a) | 54 | % | | 53 | % |
____________
| |
(a) | Adjusted gross profit is calculated as total revenues less adjusted cost of sales. Adjusted gross margin is calculated as adjusted gross profit divided by total revenues. |
Operating Expenses
Research & Development Expense
Research and development (“R&D”) expense for the three months ended June 30, 2019 was $147.6 million, compared to $206.7 million for the comparable prior year period, a decrease of $59.1 million. This decrease was primarily due to lower expenditures related to the reprioritization of global programs, and higher payments in the prior year period related to licensing arrangements for products in development.
Selling, General & Administrative Expense
Selling, general and administrative (“SG&A”) expense for the current quarter was $668.6 million, compared to $623.3 million for the comparable prior year period, an increase of $45.3 million. The increase was primarily due to continued investments in selling and marketing activities. Also impacting the quarter was higher share-based compensation expense due to a reduction of approximately $23.5 million in the second quarter of 2018 related to certain performance-based awards and a decrease in bad debt expense of approximately $28.5 million related to a special business interruption event for one customer in the prior year period.
Litigation Settlements and Other Contingencies, Net
During the three months ended June 30, 2019 and 2018, the Company recorded a net charge of $20.9 million and $46.4 million, respectively.
The following table includes the losses/(gains) recognized in litigation settlements and other contingencies, net during the three months ended June 30, 2019 and June 30, 2018:
|
| | | | | | | |
| | Three Months Ended |
| | June 30, |
| (In millions) | 2019 | | 2018 |
| Respiratory delivery platform contingent consideration adjustment | $ | (24.8 | ) | | $ | (32.7 | ) |
| Litigation settlements | 45.7 |
| | (13.7 | ) |
| Total litigation settlements and other contingencies, net | $ | 20.9 |
| | $ | (46.4 | ) |
During the three months ended June 30, 2019, the Company recognized expense of approximately $18.0 million for a settlement in principle related to the modafinil antitrust matter, approximately $30.0 million for a settlement in principle with the SEC in connection with the SEC staff's investigation of the Company's public disclosures regarding its 2016 settlement with the Department of Justice concerning the EpiPen Medicaid Drug Rebate Program, which remains subject to SEC approval. For the three months ended June 30, 2018, the net gains primarily related to the resolution of certain patent infringement matters.
Interest Expense
Interest expense for the three months ended June 30, 2019 totaled $131.2 million, compared to $139.2 million for the three months ended June 30, 2018, a decrease of $8.0 million. The decrease is primarily due to lower average long-term debt balances during the current quarter as compared to the prior year period including the impact of the redemption of the 2018 Senior Notes in the prior year period.
Other Expense, Net
Other expense, net, was $16.4 million for the three months ended June 30, 2019, compared to $21.0 million for the comparable prior year period. Other expense, net includes losses from equity affiliates, foreign exchange gains and losses and interest and dividend income. Other expense, net was comprised of the following for the three months ended June 30, 2019 and 2018, respectively:
|
| | | | | | | |
| | Three Months Ended |
| | June 30, |
| (In millions) | 2019 | | 2018 |
| Losses from equity affiliates, primarily clean energy investments | $ | 16.2 |
| | $ | 22.9 |
|
| Foreign exchange losses/(gains), net | 0.4 |
| | (2.0 | ) |
| Other (gains)/losses, net | (0.2 | ) | | 0.1 |
|
| Other expense, net | $ | 16.4 |
| | $ | 21.0 |
|
Income Tax Provision (Benefit)
For the three months ended June 30, 2019, the Company recognized an income tax provision of $116.4 million, compared to an income tax benefit of $18.8 million for the comparable prior year period, an increase of $135.2 million. During the current quarter, the Company reached a settlement in principle with the Internal Revenue Service ("IRS") to resolve federal tax matters related to the 2015 EPD Business Acquisition, including adjusting the interest rates used for intercompany loans and confirming our status as a non-U.S. corporation for U.S. federal income tax purposes. We are currently in the process of memorializing our closing agreement with the IRS, which we expect to enter into in the third quarter. In the prior year period, income tax benefits of approximately $31.0 million were recognized upon revaluations of certain deferred tax items upon statutory rate changes in certain non-U.S. jurisdictions. Partially offsetting this benefit was a net increase in the reserve for uncertain tax benefits of approximately $11.0 million. Also impacting the current year income tax benefit was the changing mix of income earned in jurisdictions with differing tax rates.
Six Months Ended June 30, 2019 Compared to Six Months Ended June 30, 2018
|
| | | | | | | | | | | | | | | | | | | | | |
| | Six Months Ended |
| | June 30, |
| (In millions) | 2019 | | 2018 | | % Change | | 2019 Currency Impact (1) | | 2019 Constant Currency Revenues | | Constant Currency % Change (2) |
| Net sales | | | | | | | | | | | |
| North America | $ | 1,946.3 |
| | $ | 1,986.1 |
| | (2 | )% | | $ | 4.9 |
| | $ | 1,951.2 |
| | (2 | )% |
| Europe | 1,884.9 |
| | 2,029.0 |
| | (7 | )% | | 137.0 |
| | 2,021.9 |
| | — | % |
| Rest of World | 1,447.6 |
| | 1,390.8 |
| | 4 | % | | 83.7 |
| | 1,531.3 |
| | 10 | % |
| Total net sales | 5,278.8 |
| | 5,405.9 |
| | (2 | )% | | 225.6 |
| | 5,504.4 |
| | 2 | % |
| | | | | | | | | | | | |
Other revenues (3) | 68.2 |
| | 86.9 |
| | (22 | )% | | 1.6 |
| | 69.8 |
| | (20 | )% |
Consolidated total revenues (4) | $ | 5,347.0 |
| | $ | 5,492.8 |
| | (3 | )% | | $ | 227.2 |
| | $ | 5,574.2 |
| | 1 | % |
| |
(1) | Currency impact is shown as unfavorable (favorable). |
| |
(2) | The constant currency percentage change is derived by translating net sales or revenues for the current period at prior year comparative period exchange rates, and in doing so shows the percentage change from 2019 constant currency net sales or revenues to the corresponding amount in the prior year. |
| |
(3) | For the six months ended June 30, 2019, other revenues in North America, Europe, and Rest of World were approximately $41.2 million, $8.5 million, and $18.5 million, respectively. |
| |
(4) | Amounts exclude intersegment revenue that eliminates on a consolidated basis. |
Total Revenues
For the six months ended June 30, 2019, Mylan reported total revenues of $5.35 billion, compared to $5.49 billion for the comparable prior year period, representing a decrease of $145.8 million, or 3%. Total revenues include both net sales and other revenues from third parties. Net sales for the six months ended June 30, 2019 were $5.28 billion, compared to $5.41 billion for the comparable prior year period, representing a decrease of $127.1 million, or 2%. Other revenues for the six months ended June 30, 2019 were $68.2 million, compared to $86.9 million for the comparable prior year period.
The decrease in net sales included a decrease in the Europe segment of 7% and in the North America segment of 2%. These decreases were partially offset by an increase in the Rest of World segment of 4%. Mylan’s net sales were unfavorably impacted by the effect of foreign currency translation, primarily reflecting changes in the U.S. Dollar as compared to the currencies of Mylan’s subsidiaries in India, Australia, and the European Union. The unfavorable impact of foreign currency translation on current year net sales was approximately $225.6 million, or 4%. On a constant currency basis, the increase in net sales was approximately $98.5 million, or 2% for the six months ended June 30, 2019. This increase was primarily driven by new product sales, partially offset by a decrease in net sales from existing products as a result of lower volumes and, to a lesser extent, pricing.
From time to time, a limited number of our products may represent a significant portion of our net sales, gross profit and net earnings. Generally, this is due to the timing of new product introductions and the amount, if any, of additional competition in the market. Our top ten products in terms of net sales, in the aggregate, represented approximately 24% and 19% for the six months ended June 30, 2019 and 2018, respectively. This percentage may fluctuate based upon the timing of new product launches, seasonality and the timing of the discontinuation of products.
Net sales are derived from our three geographic reporting segments: North America, Europe and Rest of World. The graph below shows net sales by segment for the six months ended June 30, 2019 and 2018 and the net change period over period:
North America Segment
Net sales from North America decreased by $39.8 million or 2% during the six months ended June 30, 2019 when compared to the prior year period. This decrease was due primarily to lower volumes of existing products, driven by changes in the competitive environment and the impact of the Morgantown plant remediation activities, and to a lesser extent pricing. These decreases were partially offset by new product sales, including WixelaTM InhubTM and Fulphila™ (biosimilar to Neulasta®). The impact of foreign currency translation on current period net sales was insignificant within North America.
Europe Segment
Net sales from Europe decreased by $144.1 million or 7% during the six months ended June 30, 2019 when compared to the prior year period. This decrease was primarily the result of the unfavorable impact of foreign currency translation of approximately $137.0 million or 7%. Sales of existing products were negatively impacted by lower pricing and, to a lesser extent, volumes, partially offset by new product sales. Constant currency net sales decreased by approximately $7.1 million when compared to the prior year period.
Rest of World Segment
Net sales from Rest of World increased by $56.8 million or 4% during the six months ended June 30, 2019 when compared to the prior year period. This increase was primarily the result of new product sales, primarily in Australia and emerging markets, and higher volumes of existing products. Increased volumes of existing products was primarily driven by the Company’s anti-retroviral therapy franchise. This increase was partially offset primarily by the unfavorable impact of foreign currency translation and, to a lesser extent, by lower pricing on existing products. Overall, net sales from Rest of World were unfavorably impacted by the effect of foreign currency translation of approximately $83.7 million, or 6%. Constant currency net sales increased by approximately $140.5 million or 10% when compared to the prior year period.
Cost of Sales and Gross Profit
Cost of sales increased from $3.55 billion for the six months ended June 30, 2018 to $3.61 billion for the six months ended June 30, 2019. Cost of sales was primarily impacted by purchase accounting related amortization of acquired intangible assets and other special items, which are described further in the section titled Use of Non-GAAP Financial Measures. Gross profit for the six months ended June 30, 2019 was $1.74 billion and gross margins were 33%. For the six months ended June 30, 2018, gross profit was $1.95 billion and gross margins were 35%. Gross margins were negatively affected by approximately 140 basis points as a result of incremental manufacturing expenses, site remediation expenses and incremental restructuring charges incurred during the current period principally as a result of the activities at the Company’s Morgantown plant. In addition, gross margins were negatively impacted as a result of lower gross profit for sales of existing products partially offset by the impact from new product sales. Gross margins were also negatively impacted by approximately 50 basis points related to the incremental amortization from product acquisitions and by approximately 30 basis points for expenses related to the recall of Valsartan products. Adjusted gross margins were 54% for the six months ended June 30, 2019, compared to 53% for the six months ended June 30, 2018.
A reconciliation between cost of sales, as reported under U.S. GAAP, and adjusted cost of sales and adjusted gross margin for the six months ended June 30, 2019 compared to the six months ended June 30, 2018 is as follows:
|
| | | | | | | |
| | Six Months Ended |
| | June 30, |
| (In millions) | 2019 | | 2018 |
| U.S. GAAP cost of sales | $ | 3,609.2 |
| | $ | 3,546.0 |
|
| Deduct: | | | |
| Purchase accounting amortization and other related items | (875.4 | ) | | (848.3 | ) |
| Acquisition related items | (2.1 | ) | | (1.0 | ) |
| Restructuring and related costs | (60.8 | ) | | (45.4 | ) |
| Share-based compensation expense | (0.5 | ) | | — |
|
| Other special items | (197.2 | ) | | (74.0 | ) |
| Adjusted cost of sales | $ | 2,473.2 |
| | $ | 2,577.3 |
|
| | | | |
Adjusted gross profit (a) | $ | 2,873.8 |
| | $ | 2,915.5 |
|
| | | | |
Adjusted gross margin (a) | 54 | % | | 53 | % |
| |
(a) | Adjusted gross profit is calculated as total revenues less adjusted cost of sales. Adjusted gross margin is calculated as adjusted gross profit divided by total revenues. |
Operating Expenses
Research & Development Expense
R&D expense for the ninesix months ended SeptemberJune 30, 20172019 was $580.9$320.2 million, compared to $632.2$411.6 million for the comparable prior year period, a decrease of $51.3$91.4 million. TheThis decrease was primarily due to lower expenditures related to the Company’s respiratoryreprioritization of global programs, and biologics programs due to the timing of clinical activities when compared to the prior year period. Offsetting the decrease was the impact from the acquisitions of Meda and the Topicals Business, which increased R&D expense by approximately $33.9 millionhigher payments in the current year period.
Additionally, during the nine months ended September 30, 2017, the Company entered into a joint development and marketing agreement for a respiratory product resulting in approximately $50 million in R&D expense. In the prior year period the Company made an upfront payment to Momenta Pharmaceuticals, Inc. (“Momenta”) for $45 million related to the Company’s collaboration agreement with Momenta which was entered into on January 8, 2016.
licensing arrangements for products in development.
Selling, General & Administrative Expense
SG&A expense for the ninesix months ended SeptemberJune 30, 20172019 was $1.92$1.28 billion, compared to $1.79$1.23 billion for the comparable prior year period, an increase of $129.2$45.7 million. TheThis increase iswas primarily due primarily to additionalcontinued investment in selling and marketing activities. Also impacting the six-month period was higher share-based compensation expense due to a reduction of approximately $23.5 million in the second quarter of 2018 related to the acquisitionscertain performance-based awards and a decrease in bad debt expense of Meda and the Topicals Business which increased SG&A by approximately $284.0 million. Partially offsetting this increase were lower acquisition$23.3 million related costs, including consulting and legal costs, and the benefit of integration activitiesto a special business interruption event for one customer in the currentprior year period.
Litigation Settlements and Other Contingencies, Net
The following table includes the losses/(gains) recognized in litigation settlements and other contingencies, net during the six months ended June 30, 2019 and June 30, 2018:
|
| | | | | | | |
| | Six Months Ended |
| | June 30, |
| (In millions) | 2019 | | 2018 |
| Respiratory delivery platform contingent consideration adjustment | $ | (28.9 | ) | | $ | (30.0 | ) |
| Litigation settlements | 50.5 |
| | (0.2 | ) |
| Total litigation settlements and other contingencies, net | $ | 21.6 |
| | $ | (30.2 | ) |
During the ninesix months ended SeptemberJune 30, 2017,2019, the Company recorded a net gainrecognized litigation related charges of $25.8approximately $50.5 million whileprimarily related to the matters settled during the ninesecond quarter of 2019. Litigation settlements for the six months ended SeptemberJune 30, 2016, the Company recorded a net charge of $556.4 million, respectively. The net gain recognized during the nine months ended September 30, 2017, consists2018, consisted primarily of a gain of approximately $88.1 million for a fair value adjustment related to the contingent consideration for the exclusive worldwide rights to develop, manufacture and commercialize a generic equivalent to GlaxoSmithKline’s Advair Diskus® and Seretide Diskus® incorporating Pfizer Inc.’s proprietary dry powder inhaler delivery platform (the “respiratory delivery platform”). The fair value adjustment was the result of changes to assumptions relating to the timing of the product launch along with other competitive and market factors. Offsetting this gain were litigation accruals of approximately $52.5 million primarily related to the modafinil settlement, the Medicaid Drug Rebate Program Settlement, an increase to an accrual for an anti-trust related matter, and a fair value loss of $9.9$14.7 million related to contingent consideration for the acquisitiona favorable litigation settlement, which was partially offset by litigation related charges of certain female healthcare businesses from Famy Care Limited (such businesses “Jai Pharma Limited”). The net charge recognized during the nine months ended September 30, 2016 was primarilyapproximately $13.3 million related to the Medicaid Drug Rebate Program Settlementan anti-trust and the Strides Settlement.a patent infringement matter.
Interest Expense
Interest expense for the ninesix months ended SeptemberJune 30, 20172019 totaled $406.3$262.4 million, compared to $305.0$270.9 million for the ninesix months ended SeptemberJune 30, 2016, an increase2018, a decrease of $101.3$8.5 million. The increase in the current yeardecrease is primarily due to approximately $218.1 million of interest relatedlower average long-term debt balances during the current quarter as compared to the issuanceprior year period including the impact of the senior notes in June 2016 and the Euro senior notes issued in November 2016. This increase was partially offset by the repaymentredemption of the 1.800%2018 Senior Notes due 2016 andin the 1.350% Senior Notes due 2016 in June and November of 2016, respectively.prior year period.
Other Expense, Net
Other expense, net was $34.4$23.7 million for the ninesix months ended SeptemberJune 30, 2017,2019, compared to $184.0$34.5 million for the comparable prior year period. Other expense, net includes losses from equity affiliates, foreign exchange gains and losses and interest and dividend income. Other expense, net was comprised of the following for the ninesix months ended SeptemberJune 30, 20172019 and 2016,2018, respectively:
|
| | | | | | | |
| | Nine Months Ended |
| | September 30, |
| (In millions) | 2017 | | 2016 |
| Losses from equity affiliates, primarily clean energy investments | $ | 77.2 |
| | $ | 85.5 |
|
| Foreign exchange (gains)/losses, net | (33.0 | ) | | 81.6 |
|
| Write off of deferred financing fees | — |
| | 33.2 |
|
| Other gains, net | (9.8 | ) | | (16.3 | ) |
| Other expense, net | $ | 34.4 |
| | $ | 184.0 |
|
In the prior year period, other expense, net included foreign exchange losses of $81.6 million which included $128.6 million of unrealized mark-to-market losses related to the Company’s SEK non-designated foreign currency contracts that were entered into to economically hedge the SEK purchase price for the Meda acquisition, partially offset by foreign currency gains and the write off of approximately $33.2 million of financing fees related to the termination of the bridge credit agreement relating to the Meda acquisition.
|
| | | | | | | |
| | Six Months Ended |
| | June 30, |
| (In millions) | 2019 | | 2018 |
| Losses from equity affiliates, primarily clean energy investments | $ | 33.2 |
| | $ | 46.0 |
|
| Foreign exchange gains, net | (4.0 | ) | | (17.6 | ) |
| Other (gains)/losses, net | (5.5 | ) | | 6.1 |
|
| Other expense, net | $ | 23.7 |
| | $ | 34.5 |
|
Income Tax Provision (Benefit)
For the ninesix months ended SeptemberJune 30, 2017,2019, the Company recognized an income tax provision of $124.2$26.9 million, compared to an income taxa benefit of $165.7$95.4 million for the comparable prior year period. Theperiod, an increase of $122.3 million. During the six months ended June 30, 2019, primarily due to the settlement in principle reached with the IRS and the expiration of federal and foreign statutes of limitations, the Company increased its net liability for unrecognized tax benefits by approximately $46.1 million. In the prior year period, as a result of federal and state audits and settlements and expirations of certain state, federal, and foreign statutes of limitations, the Company reduced its liability for unrecognized tax benefits by approximately $86.0 million, which resulted in a net benefit to the income tax provision forof approximately $53.0 million. Also impacting the nine months ended September 30, 2017 versus the comparable priorcurrent year periodincome tax benefit was impacted by the changing mix of income earned in jurisdictions with differing tax rates and deferred tax revaluations for statutory rate changes in 2017 valuation allowances applied to certain tax attributes, statutory releases of certain tax uncertainties, and the revaluation of deferred tax assets and liabilities in countries that changed their statutory corporate tax rate. During the nine months ended September 30, 2016, the Company received approvals from the relevant Indian regulatory authorities to legally merge its wholly owned subsidiary, Jai Pharma Limited, into Mylan Laboratories Limited. The merger resulted in the recognition of a deferred tax asset of $150 million for the tax deductible goodwill in excess of the book goodwill with a corresponding benefit to income tax provision for the nine months ended September 30, 2016. In addition to the benefit recognized for the merger of the aforementioned entities, the effective tax rate for the nine months ended September 30, 2016 was also impacted by the Medicaid Drug Rebate Program Settlement, a changing mix of income earned in jurisdictions with differing tax rates, and statutory releases of certain tax uncertainties.jurisdictions.
Use of Non-GAAP Financial Measures
Whenever the Company uses non-GAAP financial measures, we provide a reconciliation of the non-GAAP financial measures to their most directly comparable U.S. GAAP financial measure. Investors and other readers are encouraged to review the related U.S. GAAP financial measures and the reconciliation of non-GAAP measures to their most directly comparable U.S. GAAP measure and should consider non-GAAP measures only as a supplement to, not as a substitute for or as a superior measure to, measures of financial performance prepared in accordance with U.S. GAAP. Additionally, since these are not measures determined in accordance with U.S. GAAP, non-GAAP financial measures have no standardized meaning across companies, or as prescribed by U.S. GAAP and, therefore, may not be comparable to the calculation of similar measures or measures with the same title used by other companies.
Management uses these measures internally for forecasting, budgeting, measuring its operating performance, and incentive-based awards. In addition, primarilyPrimarily due to acquisitions and other significant events which may impact comparability of our periodic operating results, we believe that an evaluation of our ongoing operations (and comparisons of our current operations with historical and future operations) would be difficult if the disclosure of our financial results was limited to financial measures prepared only in accordance with U.S. GAAP. We believe that non-GAAP financial measures are useful supplemental information for our investors and when considered together with our U.S. GAAP financial measures and the reconciliation to the most directly comparable U.S. GAAP financial measure, provide a more complete understanding of the factors and trends affecting our operations. The financial performance of the Company is measured by senior management, in part, using adjusted metrics as described below, along with other performance metrics. Management’s annual incentive compensation is derived, in part, based on the adjusted EPS (as defined below) metric.
Adjusted Cost of Sales and Adjusted Gross Margin
We use the non-GAAP financial measure “adjusted cost of sales” and the corresponding non-GAAP financial measure “adjusted gross margin.” The principal items excluded from adjusted cost of sales include restructuring, acquisition related and other special items and purchase accounting amortization and other related items, which are described in greater detail below.
Adjusted Net Earnings and Adjusted EPS
Adjusted net earnings (“adjusted earnings”) is a non-GAAP financial measure and provides an alternative view of performance used by management. Management believes that, primarily due to acquisition activity and other significant events, an evaluation of the Company’s ongoing operations (and comparisons of its current operations with historical and future operations) would be difficult if the disclosure of its financial results were limited to financial measures prepared only in accordance with U.S. GAAP. Management believes that adjusted net earnings and adjusted net earnings per diluted share (“adjusted EPS”) are two of the most important internal financial metrics related to the ongoing operating performance of the Company, and are therefore useful to investors and that their understanding of our performance is enhanced by these adjusted measures. Actual internal and forecasted operating results and annual budgets used by management include adjusted net earnings and adjusted EPS.
The significant items excluded from adjusted cost of sales, adjusted net earnings and adjusted EPS include:
Purchase Accounting Amortization and Other Related Items
The ongoing impact of certain amounts recorded in connection with acquisitions of both businesses and assets is excluded from adjusted cost of sales, adjusted net earnings and adjusted EPS. These amounts include the amortization of intangible assets, inventory step-up and intangible asset impairment charges, including in-process research and development. For the acquisition of businesses accounted for under the provisions of the Financial Accounting Standards Board Accounting Standards Codification (“ASC”) Topic 805, these purchase accounting impacts are excluded regardless of the financing method used for the acquisitions, including the use of cash, long-term debt, the issuance of ordinary shares, contingent consideration or any combination thereof.
Upfront and Milestone-Related R&D Expenses
These expenses and payments are excluded from adjusted net earnings and adjusted EPS because they generally occur at irregular intervals and are not indicative of the Company’s ongoing operations. Also included in this adjustment are certain expenses related to the Company’s collaboration agreement with Momenta including certain milestone related costs. Such costs include payments related to Mylan’s future decisions, on a product by product basis, to continue with the development of such product in the collaboration after certain R&D work is performed. Related amounts are excluded from adjusted earnings as Mylan considers such payments as additional upfront buy-in payments for the products.
Accretion of Contingent Consideration Liability and Other Fair Value Adjustments
The impact of changes to the fair value of contingent consideration and accretion expense are excluded from adjusted net earnings and adjusted EPS because they are not indicative of the Company’s ongoing operations due to the variability of the amounts and the lack of predictability as to the occurrence and/or timing and management believes ittheir exclusion is helpful to understanding the underlying, ongoing operational performance of the business.
Share-based Compensation
Beginning in 2019, share-based compensation expense is excluded from adjusted net earnings and adjusted EPS. Our share-based compensation programs have become increasingly weighted toward performance-based compensation, which leads to variability and to a lack of predictability as to the occurrence and/or timing of amounts incurred. As such, management believes the exclusion of such amounts on an ongoing basis is helpful to understanding the underlying operational performance of the business. The impact of share-based compensation was insignificant to the financial results for the year ended December 31, 2018 due primarily to this variability.
Restructuring, Acquisition Related and Other Special Items
Costs related to restructuring, acquisition and integration activities and other actions are excluded from adjusted cost of sales, adjusted net earnings and adjusted EPS, as applicable. These amounts include items such as:
Costs related to formal restructuring programs and actions, including costs associated with facilities to be closed or divested, employee separation costs, impairment charges, accelerated depreciation, incremental manufacturing variances, equipment relocation costs and other restructuring related costs;
Certain acquisition related remediation and integration and planning costs, as well as other costs associated with acquisitions such as advisory and legal fees and certain financing related costs, and other business transformation and/or optimization initiatives, which are not part of a formal restructuring program, including employee separation and post-employment costs;
The pre-tax loss of the Company’s clean energy investments, whose activities qualify for income tax credits under Section 45 of the U.S. Internal Revenue Code of 1986, as amended (the “Code”);amended; only included in adjusted net earnings and adjusted EPS is the net tax effect of the entity’s activities;
The pre-tax mark-to-market gains and losses of the Company’s investments in marketable equity securities historically accounted for as available for sale securities; only included in adjusted net earnings and adjusted EPS are cumulative realized gains and losses;
Other costs, incurred from time to time, related to certain special events or activities that lead to gains or losses, including, but not limited to, incremental manufacturing variances, asset write-downs, or liability adjustments;
Certain costs to further develop and optimize our global enterprise resource planning systems, operations and supply chain.chain; and
The impact of changes related to uncertain tax positions is excluded from adjusted net earnings. In addition, tax adjustments to adjusted earnings are recorded to present items on an after-tax basis consistent with the presentation of adjusted net earnings and adjusted EPS.
The Company has undertaken restructurings and other optimization initiatives of differing types, scope and amount during the covered periods and, therefore, these charges should not be considered non-recurring; however, management excludes these amounts from adjusted net earnings and adjusted EPS because it believes it is helpful to understanding the underlying, ongoing operational performance of the business.
Litigation Settlements, Net
Charges and gains related to legal matters, such as those discussed in the Notes to interim financial statements — Note 19 20 Litigation included in Part I, Item 1 of this Form 10-Q are generally excluded from adjusted net earnings and adjusted EPS. Normal, ongoing defense costs of the Company made in the normal course of our business are not excluded.
Reconciliation of U.S. GAAP Net Earnings to Adjusted Net Earnings and U.S. GAAP EPS to Adjusted EPS
A reconciliation between net earnings and diluted earnings per share, as reported under U.S. GAAP, and adjusted net earnings and adjusted EPS for the periods shown follows:
| | | | Three Months Ended September 30, | | Nine Months Ended September 30, | Three Months Ended June 30, | | Six Months Ended June 30, |
| (In millions, except per share amounts) | 2017 | | 2016 | | 2017 | | 2016 | 2019 | | 2018 | | 2019 | | 2018 |
| U.S. GAAP net earnings and U.S. GAAP EPS | $ | 88.3 |
| | $ | 0.16 |
| | $ | (119.8 | ) | | $ | (0.23 | ) | | $ | 451.7 |
| | $ | 0.84 |
| | $ | 62.5 |
| | $ | 0.12 |
| |
| U.S. GAAP net (loss) earnings and U.S. GAAP EPS | | $ | (168.5 | ) | | $ | (0.33 | ) | | $ | 37.5 |
| | $ | 0.07 |
| | $ | (193.5 | ) | | $ | (0.38 | ) | | $ | 124.6 |
| | $ | 0.24 |
|
Purchase accounting related amortization (primarily included in cost of sales) (a) | 370.7 |
| | | | 427.1 |
| | | | 1,074.9 |
| | | | 931.8 |
| | | 440.0 |
| | | | 430.3 |
| | | | 875.4 |
| | | | 853.7 |
| | |
Litigation settlements, net (b) | 15.2 |
| | | | 468.0 |
| | | | 52.5 |
| | | | 466.4 |
| | | |
| Interest expense (primarily related to clean energy investment financing) | 5.5 |
| | | | 5.5 |
| | | | 19.5 |
| | | | 18.9 |
| | | |
Accretion of contingent consideration liability and other fair value adjustments (c) | 4.9 |
| | | | 100.4 |
| | | | (57.6 | ) | | | | 120.7 |
| | | |
| Litigation settlements and other contingencies, net | | 20.9 |
| | | | (46.4 | ) | | | | 21.6 |
| | | | (30.2 | ) | | |
| Interest expense (primarily clean energy investment financing and accretion of contingent consideration) | | 6.9 |
| | | | 9.2 |
| | | | 14.2 |
| | | | 18.9 |
| | |
| Clean energy investments pre-tax loss | 22.4 |
| | | | 23.8 |
| | | | 66.4 |
| | | | 69.4 |
| | | 16.2 |
| | | | 23.0 |
| | | | 33.2 |
| | | | 46.0 |
| | |
Acquisition related costs (primarily included in SG&A and cost of sales) (d) | 15.2 |
| | | | 110.5 |
| | | | 60.1 |
| | | | 346.7 |
| | | |
Restructuring related costs (e) | 73.4 |
| | | | 24.2 |
| | | | 112.7 |
| | | | 45.1 |
| | | |
Acquisition related costs (primarily included in SG&A) (b) | | 5.5 |
| | | | 10.2 |
| | | | 13.6 |
| | | | 12.5 |
| | |
Restructuring related costs (c) | | 57.6 |
| | | | 76.1 |
| | | | 77.5 |
| | | | 121.5 |
| | |
Share-based compensation expense (d) | | 16.8 |
| | | | — |
| | | | 34.8 |
| | | | — |
| | |
| Other special items included in: | | | | | | | | | | | | | | | | | | | | | | | | | | | | | | |
Cost of sales | 12.3 |
| | | | 12.0 |
| | | | 39.2 |
| | | | 34.1 |
| | | 112.1 |
| | | | 64.0 |
| | | | 197.2 |
| | | | 74.0 |
| | |
Research and development expense (f) | 15.2 |
| | | | 22.0 |
| | | | 90.1 |
| | | | 98.4 |
| | | 27.1 |
| | | | 50.5 |
| | | | 60.2 |
| | | | 97.1 |
| | |
| Selling, general and administrative expense | 4.0 |
| | | | (2.0 | ) | | | | 12.7 |
| | | | 0.3 |
| | | 10.8 |
| | | | 32.1 |
| | | | 24.7 |
| | | | 33.9 |
| | |
Other expense, net | (3.3 | ) | | | | (1.4 | ) | | | | 1.8 |
| | | | 1.3 |
| | | — |
| | | | 6.8 |
| | | | — |
| | | | 24.2 |
| | |
Tax effect of the above items and other income tax related items | (34.1 | ) | | | | (343.9 | ) | | | | (244.5 | ) | | | | (490.5 | ) | | | (12.6 | ) | | | | (141.8 | ) | | | | (204.2 | ) | | | | (329.1 | ) | | |
| Adjusted net earnings and adjusted EPS | $ | 589.7 |
| | $ | 1.10 |
| | $ | 726.4 |
| | $ | 1.38 |
| | $ | 1,679.5 |
| | $ | 3.13 |
| | $ | 1,705.1 |
| | $ | 3.31 |
| $ | 532.8 |
| | $ | 1.03 |
| | $ | 551.5 |
| | $ | 1.07 |
| | $ | 954.7 |
| | $ | 1.85 |
| | $ | 1,047.1 |
| | $ | 2.03 |
|
| Weighted average diluted ordinary shares outstanding | 537.0 |
| | | | 523.6 |
| | | | 537.0 |
| | | | 515.2 |
| | | 516.3 |
| | | | 516.3 |
| | | | 516.5 |
| | | | 516.6 |
| | |
Significant items for the three and ninesix months ended SeptemberJune 30, 20172019 include the following:
| |
(a)(a)
| The increase in purchase accounting related amortization for the nine month period is primarily due to the amortization expense associated with the intangible assets related to the Topicals Businesscertain product rights acquisitions which occurred in 2018 and Meda acquisitions. The decrease in purchase accounting related amortization for the three month period is primarily related to approximately $56 million of inventory step-up amortization related to the Topicals Business and Meda acquisitions in the prior year period.2019. |
| |
(b) | Litigation settlements, net decrease is due to an accrual for the Medicaid Drug Rebate Settlement in the prior year periods. |
| |
(c)
| Change to contingent consideration liability is due to a gain recognized for the fair value adjustment of $88.1 million for the respiratory delivery platform contingent liability included in the nine months ended September 30, 2017. The three and nine months ended September 30, 2016 include approximately $90 million related to the Strides Settlement. |
| |
(d)
| Acquisition related costs incurred in 2016 primarily relate to the acquisition of the Topicals Business (June 2016) and costs related to the Meda acquisition. These costs primarily related to consulting, professional, and legal costs. Acquisition related costs incurred in 2017 consist primarily of transaction costs including legal and consulting fees and integration activities. |
| |
(e)(c)
| Refer to Note 17 Restructuring included in Item 1 in this Form 10-Q. OfFor the total amount,three months ended June 30, 2019, approximately $21.0$46.3 million is included in cost of sales $1.1and $11.3 million is included in SG&A. For the six months ended June 30, 2019, approximately $60.8 million is included in cost of sales, approximately $0.1 million is included in R&D, and $51.3approximately $16.6 million is included in SG&A for the three months ended September 30, 2017. For the nine months ended September 30, 2017, approximately $37.3 million is&A. Refer to Note 17 Restructuring included in costPart I, Item 1 of sales, $2.4 million is included in R&D and $73.0 million is included in SG&A.this Form 10-Q for additional information.
|
| |
(d) | Beginning in 2019, share-based compensation expense is excluded from adjusted net earnings and adjusted EPS. The full year impact for the year ended December 31, 2018 was insignificant. As such, the three and six months ended June 30, 2018 amounts were not added back to U.S. GAAP net earnings. |
| |
(e) | The three months ended June 30, 2019 increased $48.1 million primarily related to the impact of the Valsartan product recall, the termination of a contract and certain other inventory write-offs. The six months ended June 30, 2019 increased $123.2 million for certain incremental manufacturing variances and site remediation activities as a result of the activities at the Company’s Morgantown plant and the items also impacting the change for the three-month period. |
| |
(f) | R&D expense for the three months ended SeptemberJune 30, 20172019 consists primarily of payments for product development arrangements of approximately $23.4 million, which includes $8.0$18.4 million related to Momenta collaboration expense. For the nine months ended September 30, 2017, R&D expense includes an upfront expenseexpansion of approximately $50 million related to a joint development and marketing agreement for a respiratory product, $22.5 million related to Momentathe YUPELRI® |
agreement with Theravance, and the remaining expense relates to on-going collaboration agreements. R&D expense for the six months ended June 30, 2019 consists primarily of payments for product development arrangements of approximately $46.7 million, including $18.4 million for the expansion of the YUPELRI® agreement and other similar smaller agreements.$23.3 million related to non-refundable upfront licensing amounts for a product in development. The remaining expense relates to on-going development collaborations. Refer to Note 4 Acquisitions and Other Transactions included in Part I, Item 1 of this Form 10-Q for additional information. R&D expense for the three months ended June 30, 2018 includes two non-refundable upfront payments totaling approximately $30.5 million for development agreements entered into during the quarter, and the remaining expense relates to on-going collaboration agreements, including Momenta Pharmaceuticals, Inc. For the ninesix months ended SeptemberJune 30, 2016,2018, R&D expense includes a $45$73.5 million upfront payment to Momenta and $15 million of milestone payments to Theravance Biopharma. In addition, included in this amount for the three and nine months ended September 30, 2016 is approximately $9.0 million and $22.3 million, respectively, of R&D expense incurred related to four non-refundable upfront payments for development agreements entered into during the Company’s collaboration with Momenta.prior year period.
| |
(g) | The 2018 amount primarily related to mark-to-market losses of investments in equity securities historically accounted for as available-for-sale securities and the cumulative realized gains on such investments. |
| |
(h) | The impact of changes related to uncertain tax positions is excluded from adjusted earnings. |
Liquidity and Capital Resources
Our primary source of liquidity is net cash provided by operations,operating activities, which was $1.57 billion$629.2 million for the ninesix months ended SeptemberJune 30, 2017.2019. We believe that net cash provided by operating activities and available liquidity will continue to allow us to meet our needs for working capital, capital expenditures and interest and principal payments on debt obligations. Nevertheless, our ability to satisfy our working capital requirements and debt service obligations, or fund planned capital expenditures, will substantially depend upon our future operating performance (which will be affected by prevailing economic conditions), and financial, business and other factors, some of which are beyond our control.
Operating Activities
Net cash provided by operating activities decreased by $128.4$422.8 million to $1.57 billion$629.2 million for the ninesix months ended SeptemberJune 30, 2017,2019, as compared to net cash provided by operating activities of $1.70$1.05 billion for the ninesix months ended SeptemberJune 30, 2016. Cash2018. Net cash provided by operating activities is derived byfrom net (loss) earnings adjusted for non-cash operating items, gains and losses attributed to investing and financing activities and changes in operating assets and liabilities resulting from timing differences between the receipts and payments of cash, including changes in cash primarily reflecting the timing of cash collections from customers, payments to vendors and employees and tax payments in the ordinary course of business.
The net decrease in net cash provided by operating activities was principally due to the following:
a decrease in non-cash itemsnet earnings of $136.7approximately $318.1 million, principally as a result of a decrease in litigation settlements and other contingencies expense,earnings from operations;
a net decrease in non-cash expenses of $603.8 million related to the accrual for the Medicaid Drug Rebate Program Settlement and the Strides Settlement related to the acquisition of Agila recognized$140.9 million;
a net decrease in the prior year periodamount of cash provided by accounts receivable of $280.1 million, reflecting the timing of sales and cash collections; and
a decreasenet increase of $128.6$46.1 million related to unrealized losses on acquisition-related foreign currency derivatives recognized in the prior year periodamount of cash used through changes in inventory balances.
These items were partially offset by increased depreciation and amortization as the following:
a result of acquisitions of $233.4 million and annet increase in the deferred income tax benefitamount of $374.0 million;
a decreasecash provided by changes in other operating assets and liabilities net of $319.6 million, principally a result of payments made of approximately $255.2 million related to the Medicaid Drug Rebate Program Settlement and payments of other accruals;$275.3 million;
a net increasedecrease in the amount of cash used through changes in trade accounts payable of $142.4$59.0 million as a result of the timing of cash payments; and
a net increasedecrease in the amount of cash used through changes in income taxes of $200.6$28.1 million as a result of the level and timing of estimated tax payments made during the current period.
These items were partially offset by the following:
an increase in net earnings for the nine months ended September 30, 2017 of $389.2 million when compared to the prior year period, principally as a result of an increase in earnings from operations;
a net decrease of $248.8 million in the amount of cash used through changes in inventory balances; and
a net increase in the amount of cash provided by accounts receivable, including estimated sales allowances of $32.9 million, reflecting the timing of sales, cash collections and disbursements related to sales allowances.
Investing Activities
CashNet cash used in investing activities was $743.1$234.0 million for the ninesix months ended SeptemberJune 30, 2017,2019, as compared to $7.08 billion$732.7 million for the ninesix months ended SeptemberJune 30, 2016,2018, a net decrease of $6.34 billion.$498.7 million.
In 2017,2019, significant items in investing activities included the following:
cash paid for acquisitions, net totaling approximately $71.6 million related to the acquisition of the remaining non-tendered shares of Meda in the compulsory acquisition proceeding;
payments for product rights and other, net totaling approximately $558.8$129.5 million which included a payment of $50.0 millionprimarily related to the acquisitionacquisitions of intellectual property rights for the Cold-EEZE® brand cold remedy line, payments of $168.0 million related to the acquisition of additional intellectual property rights and marketing authorizations outside of the U.S. and a payment of $277.9 million related to the acquisition of a portfolio of generic product rights in the U.S.;
proceeds from the sale of certain European assets for approximately $31.1 million;
restricted cash decrease of $12.6 million in the current year due to amounts released from escrow for the payment of certain claims related to the Agila Specialties Private Limited (“Agila”) contingent consideration;authorizations; and
capital expenditures, primarily for equipment and facilities, totaling approximately $156.4$97.2 million. While there can be no assurance that current expectations will be realized, capital expenditures for the 20172019 calendar year are expected to be approximately $300$250 million to $350$400 million.
In 2016,2018, significant items in investing activities included the following:
cash paid for acquisitions, net totaling approximately $6.15 billion related to the Company’s acquisitions of Meda and the Topicals Business;
restricted cash increase of approximately $50.5$63.3 million related to amounts deposited in escrowdeferred non-contingent purchase price payments for potential contingent consideration payments in connection with the acquisition of the Topicals Business;Apicore, Inc.;
payments for product rights and other, net totaling approximately $196.3$614.4 million, which included payments of $57.9 million to acquire a marketed pharmaceutical product and $90approximately $575.0 million related to the acquisition ofcommercialized product rights, primarily related to Betadine in certain European intellectual property rightsmarkets and marketing authorizations;other products in certain rest of world markets; and
capital expenditures, primarily for equipment and facilities, totaling approximately $239.5 million;
cash paid for Meda's unconditional deferred payment of approximately $308.0 million; and
cash paid for settlement of acquisition-related foreign currency derivatives of approximately $128.6$75.9 million.
Financing Activities
CashNet cash used in financing activities was $1.25 billion$571.9 million for the ninesix months ended SeptemberJune 30, 2017,2019, as compared to cash provided by financing activities of $5.39 billion$289.9 million for the ninesix months ended SeptemberJune 30, 2016,2018, a net decreaseincrease of $6.64 billion.$282.0 million.
In 2017,2019, significant items in financing activities included the following:
proceedslong-term debt payments of €500approximately $555.5 million consisting primarily of the redemption of $550.0 million principal amount of 2.500% Senior Notes due 2019;
payments totaling approximately $38.8 million (of the $67.5 million) in milestone payments related to Pfizer Inc.’s proprietary dry powder inhaler delivery platform (“the respiratory delivery platform”) contingent consideration. The remaining payments related to the issuancerespiratory delivery platform contingent consideration are included as a component of the 2020 Floating Rate Euro Notes;
voluntarily prepayments of $1.5 billion of the 2016 Term Loansother operating assets and $245 million of the Meda 2.0kr billion Term Loan;liabilities, net within net cash from operating activities; and
a net repayments ofincrease in short-term borrowings of $48.3$24.3 million.
In 2016,2018, significant items in financing activities included the following:
| |
| • | the Company repurchased 9.8 million ordinary shares at a cost of approximately $432.0 million completingthe previously authorized share repurchase program; |
long-term debt proceeds of approximately $2.58 billion primarily related to borrowings of approximately $496.5 million under the 2016 Revolving Facility, proceeds from the April 2018 Senior Notes offering of approximately $1.50 billion and proceeds from the May 2018 Euro Senior Notes offering of approximately €500.0 million;
long-term debt payments of $6.5approximately $2.60 billion which was attributable toconsisting primarily of repayments of borrowings of approximately $496.5 million under the Company’s issuance2016 Revolving Facility, redemptions of $1.00$1.50 billion aggregate principal amount of 2.500%senior notes in connection with the April 2018 Senior Notes due 2019, $2.25 billion aggregateoffering and redemptions of $600.0 million principal amount of 3.150%senior notes in connection with the May 2018 Euro Senior Notes due 2021, $2.25 billion aggregate principal amount of 3.950% Senior Notes due 2026,offering; and $1.00 billion aggregate principal amount of 5.250% Senior Notes due 2046
a net increase in the second quarter of 2016 in anticipation of the completion of the offer to acquire all of the outstanding shares of Meda;
payments of the principal amount of $500.0 million on the 1.800% Senior Notes due 2016 which matured on June 24, 2016 and $567.0 million of Meda’s bank loans;
net short-term borrowings of $48.6 million; and
payments of financing fees which totaled $95.3 million primarily related to a bridge credit agreement related to the Meda acquisition.$179.0 million.
Capital Resources
Our cash and cash equivalents at our non-U.S. operations totaled $516.8$211.5 million at SeptemberJune 30, 2017. A portion2019, and the majority of these funds represented earnings considered to be permanently reinvested to support the growth strategies ofare held by our non-U.S. subsidiaries. The Company anticipates having sufficient U.S. liquidity, including existing borrowing capacity under its revolving credit facility dated as of November 22, 2016 (as amended, supplemented or otherwise modified from time to time, the “20162018 Revolving Facility”), amongFacility, the Company, certain affiliates and subsidiaries of the Company from time to time party thereto as guarantors, each lender from time to time party thereto and Bank of America, N.A., as administrative agent, including the commercial paper program, andCommercial Paper Program, the Receivables Facility (asand the Note Securitization Facility (each as defined below)below other than the 2018 Revolving Facility and the Commercial Paper Program, which are defined in Note 13 Debt in Part I, Item 1 of this Form 10-Q) combined with cash to be generated from operations, to fund foreseeable U.S. cash needs without requiring the repatriation of non-U.S. cash. If these funds are ultimately needed for the Company’s operations in the U.S., the Company may be required to accrue and pay U.S. taxes to repatriate these funds. If funds are needed from the Company’s subsidiaries that do not have an ultimate U.S. parent, the Company will generally not be required to accrue and pay taxes to repatriate these funds because its foreign parent would not be subject to tax on receipt of these distributions.
The Company has access to $2.0 billion under the 20162018 Revolving Facility which also includes a $200 million subfacility for the issuance of letters of credit and a $175 million sublimit for swingline borrowings. As of September 30, 2017, we had $192.1 million available under the $200 million subfacility on our 2016 Revolving Facility for the issuance of letters of credit.matures in 2023. Up to $1.65 billion of the 20162018 Revolving Facility may be used to support future borrowingborrowings under our commercial paper program.
Commercial Paper Program.
In addition to the 20162018 Revolving Facility, MPI,Mylan Pharmaceuticals Inc., a wholly owned subsidiary of the Company, has a $400 million receivables facility (the “Receivables Facility”), which will expire in January 2018. Although from time-to-time,. On April 25, 2019, the available amount ofCompany entered into an amendment to the Receivables Facility may be less than $400 million based on accounts receivable concentration limits and other eligibility requirements. Under the terms of the Receivables Facility, MPI sells certain accounts receivable to Mylan Securitization LLC, a wholly owned special purpose entity which in turn sells a percentage of ownership interest in the receivablesextend its expiration date to financial institutions and commercial paper conduits sponsored by financial institutions.April 22, 2022. As of SeptemberJune 30, 2017,2019, the Company had no amounts outstanding under the Receivables Facility.
On April 25, 2019, we entered into an additional facility for borrowings up to $200 million (the “Note Securitization Facility”). Under the terms of each of the Receivables Facility and Note Securitization Facility, certain of our accounts receivable secure the amounts borrowed and cannot be used to pay our other debts or liabilities. The amount that we may
borrow at a given point in time is determined based on the amount of qualifying accounts receivable that are present at such point in time. Borrowings outstanding under the Receivables Facility bear interest at a commercial paper rate plus 0.775% and under the Note Securitization Facility at London Interbank Offered Rate or LIBOR plus 0.75% and are included as a component of short-term borrowings, while the accounts receivable securing these obligations remain as a component of accounts receivable, net, in our condensed consolidated balance sheets. In addition, the agreements governing the Receivables Facility and Note Securitization Facility contain various customary affirmative and negative covenants, and customary default and termination provisions.
At SeptemberJune 30, 2017,2019, our long-term debt, including the current portion, totaled $13.99$13.26 billion, as compared to $15.20$13.82 billion at December 31, 2016.2018. Total long-term debt is calculated net of deferred financing fees which were $79.6$67.6 million and $92.2$74.6 million at SeptemberJune 30, 20172019 and December 31, 2016,2018, respectively. The decrease in long-term debt was due to the prepayment of a portion of the 2016 Term Loans during the nine months ended September 30, 2017 offset by the issuance of the 2020 Floating Rate Euro Notes. The total long-term debt balance at September 30, 2017 was comprised primarily of $100 million of term loans, $91.4 million of Medium Term Notes acquired from Meda, $12.69 billion of fixed rate senior notes and $1.18 billion of floating rate senior notes. In addition, at September 30, 2017, we had $722.8 million of long-term debt classified as current and payable within the next twelve months, as compared to $223.3 million at December 31, 2016. The increase to the current portion of long-term debt is due to the reclassification of the 2.600% Senior Notes due 2018 which mature in June 2018 offset by the prepayment of the Meda 2.0kr billion Term Loan. In addition to the current portion of long-term debt, the Company has significant debt maturities in the fourth quarter of 2018, as the Floating Rate Euro Notes mature in November 2018 and the 3.000% Senior Notes due 2018 mature in December 2018. The Company intends to utilize available liquidity to fund these repayments.
For additional information regarding our debt and debt agreements refer to Note 1213 Debt in Part I, Item 1 inof this Form 10-Q.
Long-term Debt Maturity
Mandatory minimum repayments remaining on the outstanding notional amount of long-term debt at SeptemberJune 30, 2017 are2019 was as follows for each of the periods ending December 31:
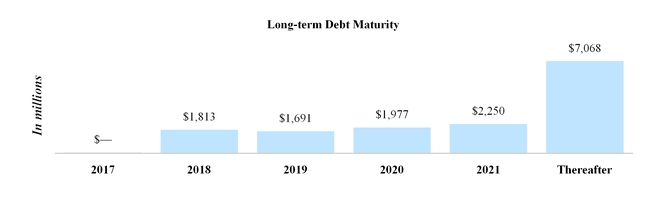
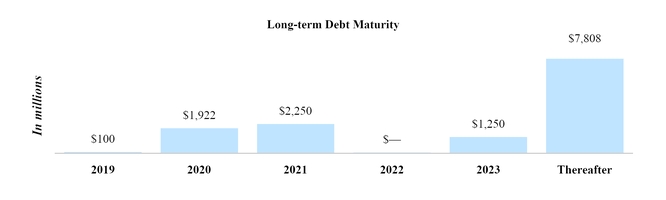
The Company’s term loan credit facility dated as2016 Term Facility (as defined in Note 13 Debt in Part I, Item 1 of November 22, 2016 (as amended, supplemented or otherwise modified from time to time, the “2016 Term Facility”), among the Company, certain affiliatesthis Form 10-Q) and subsidiaries of the Company from time to time party thereto as guarantors, each lender from time to time party thereto and Goldman Sachs Bank USA, as administrative agent and 20162018 Revolving Facility containeach contains customary affirmative covenants for facilities of this type, including among others, covenants pertaining to the delivery of financial statements, notices of default and certain material events, maintenance of corporate existence and rights, property, and insurance and compliance with laws, as well as customary negative covenants for facilities of this type, including limitations on the incurrence of subsidiary indebtedness, liens, mergers and certain other fundamental changes, investments and loans, acquisitions, transactions with affiliates, payments of dividends and other restricted payments and changes in our lines of business.
The 2016 Term Facility and 20162018 Revolving Facility contain a maximum consolidated leverage ratio financial covenant requiring maintenance of a maximum ratio of 3.75 to 1.00 for consolidated total indebtedness as of the end of any quarter to consolidated EBITDA for the trailing four quarters as defined in the related credit agreements (“leverage ratio”). The
On February 22, 2019, the Company, is in compliance at September 30, 2017.
Followingas a guarantor, and Mylan Inc., as borrower, entered into an amendment (the "Revolving Loan Amendment") to the Meda acquisition (a qualifying acquisition), the leverage ratio changed to 4.25 to 1.00 through June 30, 2017. On November 3, 2017,2018 Revolving Facility. In addition, on February 22, 2019, the Company entered into amendmentsan amendment (the "Term Loan Amendment") to the agreements for the 2016 Term FacilityFacility. The Revolving Loan Amendment and 2016
Revolving Facility to extendthe Term Loan Amendment extended the leverage ratio covenant of 4.25 to 1.00 through the December 31, 20182019 reporting period. The Company is in compliance at June 30, 2019 and expects to remain in compliance for the next twelve months.
Business Acquisitions,
Collaboration and Licensing Agreements
We periodically enter into collaboration and licensing agreements with other pharmaceutical companies for the development, manufacture, marketing and/or sale of pharmaceutical products. Our significant collaboration agreements are primarily focused on the development, manufacturing, supply and commercialization of multiple, high-value generic biologic compounds, insulin analog products and respiratory products, among other complex products. Under these agreements, we have future potential milestone payments and co-development expenses payable to third parties as part of our licensing, development and co-development programs. Payments under these agreements generally become due and are payable upon the satisfaction or achievement of certain developmental, regulatory or commercial milestones or as development expenses are incurred on defined projects. Milestone payment obligations are uncertain, including the prediction of timing and the occurrence of events triggering a future obligation and are not reflected as liabilities in the Condensed Consolidated Balance Sheets,condensed consolidated balance sheets, except for milestone and royalty obligations reflected as acquisition related contingent consideration. Refer to Note 12 Financial Instruments and Risk Management in Part I, Item of this Form 10-Q for additional information. Our potential maximum development milestones not accrued for at June 30, 2019 totaled approximately $476.0 million, which includes the new agreements entered into during 2019. We estimate that the amounts that may be paid in the next twelve months to be approximately $79.0 million. These agreements may also include potential sales basedsales-based milestones and call for us to pay a percentage of amounts earned from the sale of the product as a royalty or a profit share. The amounts disclosed do not include sales-based milestones or royalty obligations on future sales of product as the timing and amount of future sales levels and costs to produce products subject to these obligations is not reasonably estimable. These sales basedsales-based milestones or royalty obligations may be significant depending upon the level of commercial sales for each product.
OurWe are contractually obligated to make potential future development, regulatory and commercial milestone, royalty and/or profit sharing payments in conjunction with acquisitions we have entered into with third parties. The most significant contingent paymentof these relates to the potential future consideration related to our December 2011 acquisition of the respiratory delivery platform. These payments are contingent upon the occurrence of certain future events and, given the ultimate success of the respective projects. Given the inherent uncertaintynature of these events, it is unclear when, if ever, we may be required to pay such amounts or pay amounts in excess of those accrued. The Company has also recorded contingent consideration related to the acquisition of the Topicals Business, the acquisition of Jai Pharma Limited, the acquisition of Agila Specialties Private Limited (“Agila”) and certain other acquisitions.amounts. The amount of the contingent consideration recordedliabilities was $471.1 million and $564.6$266.7 million at SeptemberJune 30, 2017 and December 31, 2016, respectively.2019. In addition, the Company expects to incur approximately $25$15 million to $30$20 million of annualnon-cash accretion expense related to the increase in the net present value of the contingent consideration liability.
In conjunction with the Company’s Generic Drug User Fee Agreement goal date, on March 28, 2017, the Company received a complete response letter from the FDA regarding its Abbreviated New Drug Application for the respiratory delivery platform. As of September 30, 2017, the Company has an IPR&D asset of $347.2 million and a related contingent consideration liability of $361.0 million. The Company performed an analysis and valuation of the IPR&D asset and the fair value of the related contingent consideration liability using a discounted cash flow model. The model contained certain key assumptions including: the expected product launch date, the number of competitors, the timing of competition and a discount factor based on an industry specific weighted average cost of capital. Based on the analysis performed, the Company determined that the IPR&D asset was not impaired at September 30, 2017. Additionally, no fair value adjustment was required for the contingent consideration during the three months ended September 30, 2017. In the second quarter of 2017, a fair value adjustment was required for the contingent consideration liability resultingliabilities in a gain of approximately $88.1 million based upon changes to assumptions relating to the timing of the product launch along with other competitive and market factors. The fair value of the contingent consideration liability was determined based upon detailed valuations employing the income approach which utilized Level 3 inputs, as defined in Note 11 - Financial Instruments and Risk Management. Resolution of the matters with the FDA, market conditions and other factors may result in significant future changes in the projections and assumptions utilized in the discounted cash flow model, which could lead to material adjustments to the amounts recorded for IPR&D and contingent consideration.
In October 2017, the Company finalized an agreement to acquire the perpetual license to Betadine in certain European markets. An estimated liability of approximately $300 million for the purchase of these rights was accrued for on the Meda acquisition opening balance sheet. The Company does not expect that a material adjustment to this liability will be necessary upon closing of the transaction in early 2018.
On October 3, 2017, the Company completed the acquisition of a U.S. based developer and manufacturer of API for approximately $189 million, which includes $15 million of contingent payments based on the achievement of certain financial results of the acquired business following the closing of the transaction.
We are actively pursuing, and are currently involved in, joint projects related to the development, distribution and marketing of both generic and branded products. Many of these arrangements provide for payments by us upon the attainment
of specified milestones. While these arrangements help to reduce the financial risk for unsuccessful projects, fulfillment of specified milestones or the occurrence of other obligations may result in fluctuations in cash flows.2019.
Other Commitments
We areThe Company is involved in various disputes, governmental and/or regulatory inquiries, investigations and proceedings, tax proceedings and litigation matters, both in the U.S. and abroad, that arise from time to time, some of which could result in financial losses, including damages, fines and/or othercivil penalties, and/or criminal charges (civil and criminal) against the Company, including the possibility of not being ableCompany. These matters are often complex and have outcomes that are difficult to conduct business in a specific jurisdiction. While it is not possible to predict the outcome of such proceedings, an adverse outcome in any of these proceedings could materially affect our business, financial condition, results of operations, and cash flows and could cause the market value of our ordinary shares to decline. We have approximately $402 million accrued for legal contingencies at September 30, 2017. In October, we paid approximately $217.5 million related to the Medicaid Drug Rebate Program Settlement.predict. The Company is also party to certain proceedings and litigation matters for which it may be entitled to indemnification under the respective sale and purchase agreements relating to the acquisitions of the former Merck Generics business, Agila andSpecialties Private Limited, the EPD Business, and certain other acquisitions. TheWe have approximately $107.0 million accrued for legal contingencies at June 30, 2019.
While the Company believes that it has meritorious defenses with respect to the claims asserted against it and intends to vigorously defend its position, the process of resolving these matters is inherently uncertain and may develop over a long period of time, and so it is not possible to predict the ultimate resolution of any such matter. It is possible that an unfavorable resolution of any of the ongoing matters or the inability or denial of Merck KGaA, Strides Arcolab Limited, Abbott Laboratories, or another indemnitor or insurer to pay on an indemnified claim, could have a material adverse effect on ourthe Company’s business, financial condition, results of operations, cash flows and/or ordinary share price.
In the normal course of business, Mylan periodically enters into employment, legal settlement and other agreements which incorporate indemnification provisions. While the maximum amount to which Mylan may be exposed under such agreements cannot be reasonably estimated, the Company maintains insurance coverage, which management believes will effectively mitigate the Company’s obligations under these indemnification provisions. No amounts have been recorded in the condensed consolidated financial statements with respect to the Company’s obligations under such agreements.
The Company has also entered into employment and other agreements with certain executives and other employees that provide for compensation, retirement and certain other benefits. These agreements provide for severance payments under certain circumstances. Additionally, the Company has split-dollar life insurance agreements with certain retired executives.
We are continuously evaluating the potential acquisition of products, as well as companies, as a strategic part of our future growth. Consequently, we may utilize current cash reserves or incur additional indebtedness to finance any such acquisitions, which could impact future liquidity. In addition, on an ongoing basis, we review our operations including the
evaluation of potential divestitures of products and businesses as part of our future strategy. Any divestitures could impact future liquidity.
Application of Critical Accounting Policies
There have been no changes to the Critical Accounting Policies disclosed in our 2018 Form 10-K. The following discussion supplements our Critical Accounting Policy for Acquisitions, Intangible Assets, Goodwill and Contingent Consideration as it relates to our annual goodwill impairment test.
Goodwill and intangible assets, including IPR&D, are reviewed for impairment annually and/or when events or other changes in circumstances indicate that the carrying amount of the assets may not be recoverable. Impairment of goodwill and indefinite-lived intangibles, including IPR&D, is determined to exist when the fair value is less than the carrying value of the net assets being tested, with any impairment charge being equal to the difference. Impairment of finite-lived intangibles is determined to exist when undiscounted cash flows related to the assets are less than the carrying value of the assets being tested. Future events and decisions may lead to asset impairment and/or related costs.
Goodwill is allocated and evaluated for impairment at the reporting unit level, which is defined as an operating segment or one level below an operating segment. The Company has four reporting units, North America Generics, North America Brands, Europe and Rest of World. As of April 1, 2019, the date of our most recent annual impairment test, the allocation of the Company’s total goodwill was as follows: North America Generics $2.67 billion, North America Brands $0.65 billion, Europe $4.56 billion and Rest of World $1.72 billion.
The Company performed a quantitative impairment analysis for all of its reporting units as of April 1, 2019. The impairment analysis consists of a comparison of the estimated fair value of the individual reporting units with their carrying amount, including goodwill. In estimating each reporting unit’s fair value, we performed extensive valuation analysis utilizing both income and market-based approaches, in our goodwill assessment process. We utilized an average of the two methods in estimating the fair value of the individual reporting units, except for the North America Brands reporting unit where the fair value was estimated utilizing the income approach. The following describes the valuation methodologies used to derive the estimated fair value of the reporting units.
Income Approach: Under this approach, to determine fair value, we discounted the expected future cash flows of each reporting unit. We used a discount rate, which reflected the overall level of inherent risk and the rate of return an outside investor would have expected to earn. To estimate cash flows beyond the final year of our model, we used a terminal value approach. Under this approach, we used EBITDA in the final year of our model, adjusted to estimate a normalized cash flow, applied a perpetuity growth assumption, and discounted by a perpetuity discount factor to determine the terminal value. We incorporated the present value of the resulting terminal value into our estimate of fair value.
Market-Based Approach: The Company also utilizes a market-based approach to estimate fair value, principally utilizing the guideline company method which focuses on comparing our risk profile and growth prospects to a select group of publicly traded companies with reasonably similar guidelines.
As of April 1, 2019, the Company determined that the fair value of the North America Generics, North America Brands and Rest of World reporting units was substantially in excess of the respective unit’s carrying value.However, when compared to the prior year, the fair value of our overall business declined because of our recent operating results, future forecasts and the decline in our share price, including activity subsequent to April 1, 2019.
For the Europe reporting unit, the estimated fair value exceeded its carrying value by approximately $900.0 million or 7.0%. The excess fair value for the Europe reporting unit is consistent with the result of the Company’s 2018 annual impairment test. As it relates to the income approach for the Europe reporting unit at April 1, 2019, the Company forecasted cash flows for the next 5 years. During the forecast period, the revenue compound annual growth rate was approximately 6.5%. A terminal value year was calculated with a 2.0% revenue growth rate applied. The discount rate utilized was 10.5% and the estimated tax rate was 24.0%. Under the market-based approach, we utilized an estimated range of market multiples of 8.0 to 9.5 times EBITDA plus a control premium of 15.0%. If all other assumptions are held constant, a reduction in the terminal value growth rate by 2.0% or an increase in discount rate by 1.5% would result in an impairment charge for the Europe reporting unit.
The determination of the fair value of the reporting units requires us to make significant estimates and assumptions that affect the reporting unit’s expected future cash flows. These estimates and assumptions primarily include, but are not limited to, market multiples, control premiums, the discount rate, terminal growth rates, operating income before depreciation
and amortization, and capital expenditures forecasts. Due to the inherent uncertainty involved in making these estimates, actual results could differ from those estimates. In addition, changes in underlying assumptions, especially as it relates to the key assumptions detailed, could have a significant impact on the fair value of the reporting units.
| |
| ITEM 3. | QUANTITATIVE AND QUALITATIVE DISCLOSURES ABOUT MARKET RISK |
For a discussion of the Company’s market risk, see “Item 7A. Quantitative and Qualitative Disclosures about Market Risk” in Mylan N.V.’s Annual Report filed on Form 10-K for the year ended December 31, 2016,2018, as amended.
| |
| ITEM 4. | CONTROLS AND PROCEDURES |
An evaluation was performed under the supervision and with the participation of the Company’s management, including the Principal Executive Officer and the Principal Financial Officer, of the effectiveness of the design and operation of the Company’s disclosure controls and procedures as of SeptemberJune 30, 2017.2019. Based upon that evaluation, the Principal Executive Officer and the Principal Financial Officer concluded that the Company’s disclosure controls and procedures were effective.
Management has not identified the following changeany changes in the Company’s internal control over financial reporting (“ICFR”) that occurred during the second quarter of 2019 that hashave materially affected, or isare reasonably likely to materially affect, the Company’s ICFR. During the quarter ended September 30, 2017, the Company continued to implement and utilize a new Enterprise Resource Planning (“ERP”) system in certain countries, which, when completed, will handle the business,internal control over financial and administrative processes for the Company. The Company has modified and will continue to modify its internal controls relating to its business and financial processes throughout the entire ERP system implementation, which is expected to progress through the end of 2017. While the Company believes that this new system and the related changes to internal controls will ultimately strengthen its ICFR, there are inherent risks in implementing any new ERP system and the Company will continue to evaluate and test control changes in order to provide certification as of its fiscal year ending December 31, 2017 on the effectiveness of its ICFR.reporting.
PART II — OTHER INFORMATION
For information regarding legal proceedings, refer to Note 19 20 Litigation, in the accompanying Notes to interim financial statements in this Quarterly Report.Form 10-Q.
ThereExcept as set forth below, there have been no material changes in the Company’s risk factors from those disclosed in Mylan’s Annual Report on Form 10-K for the year ended December 31, 2016,2018, as amended.
On November 3, 2017,Mylan, Pfizer and Upjohn may be unable to satisfy the Company entered intoconditions or obtain the approvals required to complete the Combination, and regulatory agencies may delay or impose conditions on approval of the Combination, which may diminish the anticipated benefits of the Combination. Failure to complete the Combination could adversely impact the market price of Mylan shares as well as Mylan’s business and operating results.
The consummation of the Combination is subject to numerous conditions, including the receipt by Pfizer of an amendment (the “Revolving Loan Amendment”)IRS ruling and tax opinion of its tax counsel with respect to the 2016 Revolving Facility. In addition,Combination, the receipt of Mylan shareholder approval for the Combination and other customary conditions. Mylan cannot make any assurances that the Combination will be consummated on November 3, 2017, the Company entered into an amendment (the “Term Loan Amendment”)terms or timeline currently contemplated, or at all.
Completion of the Combination is also conditioned upon the receipt of required government consents and approvals, including required approvals from foreign regulatory agencies. While Mylan, Pfizer and Upjohn intend to pursue vigorously all required governmental approvals and do not know of any reason why they would not be able to obtain the necessary approvals in a timely manner, the requirement to receive these approvals before the consummation of the Combination could delay the completion of the Combination, possibly for a significant period of time after Mylan shareholders have approved the Combination. Any delay in the completion of the Combination could diminish anticipated benefits of the Combination or result in additional transaction costs, loss of revenue or other effects associated with uncertainty about the Combination.
To the extent that the market price of Mylan ordinary shares reflects positive market assumptions that the Combination will be consummated, the price of Mylan ordinary shares may decline if the Combination are not consummated for any reason or in a timely manner. Mylan may also be subject to additional risks if the Combination are not consummated, including:
depending on the reasons for termination of the Business Combination Agreement, the requirement that Mylan pay Pfizer a termination fee of $322 million, or in the situation where Mylan’s shareholders do not approve the Combination and the transaction is terminated, up to $96 million to reimburse Pfizer for its costs;
the fact that substantial costs related to the 2016 Term Facility. Combination, such as legal, accounting, filing, financial advisory and financial printing fees, must be paid regardless of whether the Combination are completed; and
possible negative reactions from our customers, regulators and employees.
The Revolving Loan Amendmentpendency of the Combination could adversely affect Mylan’s business and operations.
Whether the Term Loan Amendment increasedCombination is ultimately consummated or not, its pendency could have a number of negative effects on our current business, including potentially disrupting our regular operations, diverting the maximum consolidated leverage ratioattention of our workforce and management team, or increasing workforce turnover. The completion of the Combination, including for example, obtaining regulatory approvals, will require significant time and attention from 3.75Mylan management and may divert attention from the day-to-day operations of our business. Any uncertainty over the ability of Pfizer, Mylan and Upjohn to 1.00complete the Combination could make it more difficult for Mylan to 4.25retain key employees or attract new talent, or to 1.00 throughpursue business strategies.
Parties with which we have business relationships, either contractual or operational, may experience uncertainty as to the December 31, 2018 reporting periodfuture or desirability of such relationships and may delay or defer certain business decisions, seek alternative relationships with third parties or seek to alter their present business relationships with us. Parties with whom we otherwise may have sought to establish business relationships may seek alternative relationships with third parties. Additionally, we have contracts with
certain customers, suppliers, vendors, distributors, lenders, and other business partners, and these contracts may require us to obtain consent from these other parties in connection with the Combination. Obtaining such consents may be difficult and could impose costs on us, including renegotiating such contracts on terms less favorable to Mylan, which in turn may result in us suffering a loss of potential future revenue, incurring contractual liabilities or losing rights that are material to our business.
The Business Combination Agreement subjects us to restrictions on our business activities and obligates us to generally operate our business in the maximum consolidated leverage ratio financial covenant, which requires maintenance of a maximum ratio of consolidated total indebtedness asordinary course in all material respects consistent with past practice prior to completion of the end of any quarter to consolidated EBITDA for the trailing four quarters (as defined in the 2016 Revolving Facility and 2016 Term Facility). The Company is in compliance with this covenant at September 30, 2017, and expects to remain in compliance for the next twelve months.
The foregoing description does not purport to be complete and its qualified in its entirety by referenceCombination. These restrictions could prevent us from pursuing attractive business opportunities that arise prior to the Revolving Loan Amendmentcompletion of the Combination and Term Loan Amendment, which are attached hereto as Exhibit 10.3outside the ordinary course of business, or otherwise have an adverse effect on our results of operations, cash flows and Exhibit 10.4, respectively,financial position. The Business Combination Agreement also subjects us to restrictions on our ability to pursue alternatives to the Combination and which are incorporated herein by reference.so we might have to forego another strategic transaction that would otherwise have been favorable to Mylan and our shareholders.
|
| |
ITEM 6. EXHIBITS |
| |
| | |
| Settlement Agreement with the U.S. Department of Justice and two relators finalizing the Medicaid drug rebate settlement, dated August 16, 2017, filed as Exhibit 10.1 to the Report on Form 8-K filed with the SEC on August 21, 2017, and incorporated herein by reference.
|
| |
| Corporate Integrity Agreement between the Office of Inspector General of the Department of Health and Human Services and Mylan Inc. and Mylan Specialty L.P., dated August 16, 2017, filed as Exhibit 10.2 to the Report on Form 8-K filed with the SEC on August 21, 2017, and incorporated herein by reference.
|
| |
| Amendment, dated as of September 30, 2017, to the revolving credit facility dated as of November 22, 2016, among the Company, certain affiliates and subsidiaries of the Company from time to time party thereto as guarantors, each lender from time to time party thereto and Bank of America, N.A., as administrative agent. |
| |
| Amendment, dated as of September 30, 2017, to the term loan credit facility dated as of November 22, 2016, among the Company, certain affiliates and subsidiaries of the Company from time to time party thereto as guarantors, each lender from time to time party thereto and Goldman Sachs Bank USA, as administrative agent. |
| |
| Certification of Principal Executive Officer pursuant to Section 302 of the Sarbanes-Oxley Act of 2002. |
| | |
| Certification of Principal Financial Officer pursuant to Section 302 of the Sarbanes-Oxley Act of 2002. |
| | |
| Certification of Principal Executive Officer and Principal Financial Officer pursuant to Section 906 of the Sarbanes-Oxley Act of 2002. |
| | |
| 101.INS | XBRL Instance Document |
| | |
| 101.SCH | XBRL Taxonomy Extension Schema |
| | |
| 101.CAL | XBRL Taxonomy Extension Calculation Linkbase |
| | |
| 101.DEF | XBRL Taxonomy Definition Linkbase |
| | |
| 101.LAB | XBRL Taxonomy Extension Label Linkbase |
| | |
| 101.PRE | XBRL Taxonomy Extension Presentation Linkbase |
| |
SIGNATURES
Pursuant to the requirements of the Securities Exchange Act of 1934, the registrant has duly caused this report to be signed on its behalf by the undersigned thereunto duly authorized.
|
| | |
| | | Mylan N.V. (Registrant) |
| | | |
| | By: | /s/ HEATHER BRESCH |
| | | Heather Bresch |
| | | Chief Executive Officer |
| | | (Principal Executive Officer) |
November 6, 2017July 29, 2019
|
| | |
| | | /s/ KENNETH S. PARKS |
| | | Kenneth S. Parks |
| | | Chief Financial Officer |
| | | (Principal Financial Officer) |
November 6, 2017July 29, 2019