UNITED STATES
SECURITIES AND EXCHANGE COMMISSION
Washington, D.C. 20549
FORM 10-Q
(Mark One)
ý QUARTERLY REPORT PURSUANT TO SECTION 13 OR 15(d) OF THE SECURITIES EXCHANGE ACT OF 1934 For the quarterly period ended September 30, 20172020.
OR
o TRANSITION REPORT PURSUANT TO SECTION 13 OR 15(d) OF THE SECURITIES EXCHANGE ACT OF 1934
For the transition period from__________to __________
Commission file number: 33-92990; 333-216849333-237134
TIAA REAL ESTATE ACCOUNT
(Exact name of registrant as specified in its charter)
NEW YORK
(State or other jurisdiction
of incorporation or organization)
NOT APPLICABLE
(I.R.S. Employer Identification No.)
C/O TEACHERS INSURANCE AND
ANNUITY ASSOCIATION OF AMERICA
730 THIRD AVENUE
NEW YORK, NEW YORK 10017-3206
(Address of principal executive offices, including zip code)
Registrant’s telephone number, including area code: (212) 490-9000
(Former name, former address and former fiscal year, if changed since last report)
Indicate by check mark whether the Registrantregistrant (1) has filed all reports required to be filed by Section 13 or 15(d) of the Securities Exchange Act of 1934 during the preceding 12 months (or for such shorter period that the Registrantregistrant was required to file such reports), and (2) has been subject to such filing requirements for the past 90 days.
YES ý NO o
Indicate by check mark whether the registrant has submitted electronically and posted on its corporate Web site, if any, every Interactive Data File required to be submitted and posted pursuant to Rule 405 of Regulation S-T (§232.405 of this chapter) during the preceding 12 months (or for such shorter period that the registrant was required to submit and post such files).
YES ý NO o
Indicate by check mark whether the registrant is a large accelerated filer, an accelerated filer, a non-accelerated filer, smaller reporting company or an emerging growth company. See the definitions of “large accelerated filer,” “accelerated filer,” “smaller reporting company” and "emerging growth company" in Rule 12b-2 of the Exchange Act.
|
| | | | | | | |
Large accelerated filer o | | Accelerated filer o |
Non-accelerated filer ý (Do not check if a smaller reporting company) | | Smaller Reporting Company o |
| | Emerging Growth Company o |
If an emerging growth company, indicate by check mark if the registrant has elected not to use the extended transition period for complying with any new or revised financial accounting standards provided pursuant to Section 13(a) of the Exchange Act. o
Indicate by check mark whether the registrant is a shell company (as defined in Rule 12b-2 of the Exchange Act).
YES o NO ý
TABLE OF CONTENTS
| | | | | | | | | | | |
| | | Page |
| Part I | Financial Information | | Page |
Part I | Financial Information | |
| Item 1. | Unaudited Consolidated Financial Statements | |
| | | |
| | | 4 |
| | | 5 |
| | | 6 |
| | | 7 |
| | | 24 |
| Item 2. | Management's Discussion and Analysis of the Account's Financial Condition and Results of Operations | 39 |
| Item 3. | Quantitative and Qualitative Disclosures about Market Risk | 59 |
| Item 4. | Controls and Procedures | 60 |
| Part II | Other Information | |
| Item 1. | Legal Proceedings | 61 |
| Item 1A. | Risk Factors | 61 |
| Item 2. | Unregistered Sales of Equity Securities and Use of Proceeds | 61 |
| Item 3. | Defaults Upon Senior Securities | 61 |
| Item 4. | Mine Safety Disclosures | 61 |
| Item 5. | Other Information | 61 |
| Item 6. | Exhibits | 62 |
| Signatures | | 63 |
PART I. FINANCIAL INFORMATION
ITEM 1. UNAUDITED CONSOLIDATED FINANCIAL STATEMENTS
TIAA REAL ESTATE ACCOUNT
CONSOLIDATED STATEMENTS OF ASSETS AND LIABILITIES
(In millions, except per accumulation unit amounts)
| | | | | | | | | | | | | | | | | |
| September 30, | | December 31, |
| 2020 | | 2019 |
| (Unaudited) | | | |
| ASSETS | | | | | |
| Investments, at fair value: | | | | | |
Real estate properties (cost: $14,201.5 and $13,048.5) | $ | 16,715.0 | | | | $ | 15,835.0 | | |
Real estate joint ventures and funds (cost: $5,163.8 and $6,244.4) | 6,348.0 | | | | 7,516.0 | | |
| Marketable securities: | | | | | |
Real estate-related (cost: $634.7 and $686.0) | 662.2 | | (1) | | 825.7 | | (1) |
Other (cost: $690.0 and $4,144.7) | 689.9 | | | | 4,150.2 | | |
Loans receivable (principal: $1,533.0 and $1,504.5) | 1,500.2 | | | | 1,503.1 | | |
Loans receivable with related parties (principal: $69.3 and $69.3) | 69.4 | | | | 69.0 | | |
Total investments (cost: $22,292.3 and $25,697.4) | $ | 25,984.7 | | | | $ | 29,899.0 | | |
| Cash and cash equivalents | 8.0 | | | | 15.1 | | |
| Due from investment manager | 0 | | | | 5.5 | | |
| | | | | |
| Other | 329.8 | | (2) | | 290.3 | | (2) |
| TOTAL ASSETS | $ | 26,322.5 | | | | $ | 30,209.9 | | |
| LIABILITIES | | | | | |
Loans payable, at fair value (principal outstanding: $2,462.6 and $2,338.0) | 2,495.7 | | | | 2,365.0 | | |
| Line of credit, at fair value | 91.0 | | | | 250.0 | | |
| Due to investment manager | 1.8 | | | | 0 | | |
| Accrued real estate property expenses | 265.2 | | | | 225.9 | | |
| Payable for collateral for securities loaned | 2.1 | | | | 25.7 | | |
| | | | | |
| Other | 38.4 | | | | 35.4 | | |
| TOTAL LIABILITIES | $ | 2,894.2 | | | | $ | 2,902.0 | | |
| COMMITMENTS AND CONTINGENCIES | | | | | |
| NET ASSETS | | | | | |
| Accumulation Fund | 22,911.0 | | | | 26,759.1 | | |
| Annuity Fund | 517.3 | | | | 548.8 | | |
| TOTAL NET ASSETS | $ | 23,428.3 | | | | $ | 27,307.9 | | |
| NUMBER OF ACCUMULATION UNITS OUTSTANDING | 52.8 | | | | 60.8 | | |
| NET ASSET VALUE, PER ACCUMULATION UNIT | $ | 434.164 | | | | $ | 440.422 | | |
|
| | | | | | | | | |
| | September 30, | | December 31, |
| | 2017 | | 2016 |
| | (Unaudited) | | | |
| ASSETS | | | | | |
| Investments, at fair value: | | | | | |
Real estate properties
(cost: $12,944.7 and $12,818.1) | $ | 15,654.2 |
| | | $ | 15,452.8 |
| |
Real estate joint ventures and limited partnerships (cost: $4,540.2 and $4,530.4) | 5,816.1 |
| | | 5,759.9 |
| |
| Marketable securities: | | | | | |
Real estate-related
(cost: $889.5 and $883.9) | 1,121.0 |
| (1) | | 1,081.5 |
| (1) |
Other
(cost: $4,293.3 and $4,054.0) | 4,293.4 |
| | | 4,053.8 |
| |
Loans receivable
(cost: $296.5 and $294.8) | 298.8 |
| | | 295.7 |
| |
Total investments
(cost: $22,964.2 and $22,581.2) | 27,183.5 |
| | | 26,643.7 |
| |
| Cash and cash equivalents | 6.8 |
| | | 3.0 |
| |
| Due from investment manager | 4.8 |
| | | 5.9 |
| |
| Other | 227.6 |
| (2) | | 332.6 |
| (2) |
| TOTAL ASSETS | 27,422.7 |
| | | 26,985.2 |
| |
| LIABILITIES | | | | | |
Mortgage loans payable, at fair value (principal outstanding: $2,284.8 and $2,316.5) | 2,311.0 |
| | | 2,332.1 |
| |
| Accrued real estate property expenses | 211.7 |
| | | 202.2 |
| |
| Payable for collateral for securities loaned | 5.6 |
| | | 93.0 |
| |
| Other | 54.6 |
| | | 53.2 |
| |
| TOTAL LIABILITIES | 2,582.9 |
| | | 2,680.5 |
| |
| COMMITMENTS AND CONTINGENCIES |
| | |
| |
| NET ASSETS | | | | | |
| Accumulation Fund | 24,333.5 |
| | | 23,813.5 |
| |
| Annuity Fund | 506.3 |
| | | 491.2 |
| |
| TOTAL NET ASSETS | $ | 24,839.8 |
| | | $ | 24,304.7 |
| |
| NUMBER OF ACCUMULATION UNITS OUTSTANDING | 61.9 |
| | | 62.4 |
| |
| NET ASSET VALUE, PER ACCUMULATION UNIT | $ | 393.257 |
| | | $ | 381.636 |
| |
(1)Includes securities loaned of $5.5$2.0 million at September 30, 20172020 and $91.2$25.2 million at December 31, 2016.2019.
(2) Includes cash collateral for securities loaned of $5.6$2.1 million at September 30, 20172020 and $93.0$25.7 million at December 31, 2016.2019.
See notes to the consolidated financial statements
TIAA REAL ESTATE ACCOUNT
CONSOLIDATED STATEMENTS OF OPERATIONS
(In millions)
(Unaudited)
| | | | | | | | | | | | | | | | | | | | | | | |
| For the Three Months Ended September 30, | | For the Nine Months Ended September 30, |
| 2020 | | 2019 | | 2020 | | 2019 |
| INVESTMENT INCOME | | | | | | | |
| Real estate income, net: | | | | | | | |
| Rental income | $ | 295.0 | | | $ | 282.6 | | | $ | 906.0 | | | $ | 823.6 | |
| Real estate property level expenses and taxes: | | | | | | | |
| Operating expenses | 66.5 | | | 64.5 | | | 196.6 | | | 181.8 | |
| Real estate taxes | 53.3 | | | 46.9 | | | 157.3 | | | 138.9 | |
| Interest expense | 24.1 | | | 27.1 | | | 74.0 | | | 80.1 | |
| Total real estate property level expenses and taxes | 143.9 | | | 138.5 | | | 427.9 | | | 400.8 | |
| Real estate income, net | 151.1 | | | 144.1 | | | 478.1 | | | 422.8 | |
| Income from real estate joint ventures and funds | 33.1 | | | 61.4 | | | 110.5 | | | 170.9 | |
| Interest | 20.7 | | | 43.5 | | | 85.0 | | | 129.7 | |
| Dividends | 6.0 | | | 5.9 | | | 17.1 | | | 17.5 | |
| TOTAL INVESTMENT INCOME | 210.9 | | | 254.9 | | | 690.7 | | | 740.9 | |
| Expenses: | | | | | | | |
| Investment management charges | 16.4 | | | 17.3 | | | 46.6 | | | 53.6 | |
| Administrative charges | 10.9 | | | 12.1 | | | 34.2 | | | 37.6 | |
| Distribution charges | 5.8 | | | 7.5 | | | 18.1 | | | 24.1 | |
| Mortality and expense risk charges | 0.3 | | | 0.3 | | | 0.9 | | | 1.0 | |
| Liquidity guarantee charges | 14.3 | | | 15.3 | | | 45.4 | | | 41.4 | |
| TOTAL EXPENSES | 47.7 | | | 52.5 | | | 145.2 | | | 157.7 | |
| INVESTMENT INCOME, NET | 163.2 | | | 202.4 | | | 545.5 | | | 583.2 | |
| NET REALIZED AND UNREALIZED GAIN (LOSS) ON INVESTMENTS AND LOANS PAYABLE | | | | | | | |
| Net realized gain (loss) on investments: | | | | | | | |
| Real estate properties | (3.0) | | | 300.0 | | | (61.0) | | | 300.0 | |
| Real estate joint ventures and funds | 0 | | | 0 | | | (460.5) | | | (43.7) | |
| Marketable securities | 19.7 | | | 27.5 | | | 41.0 | | | 280.6 | |
| Loans receivable | 0 | | | 0 | | | (1.6) | | | 0 | |
| Net realized gain (loss) on investments | 16.7 | | | 327.5 | | | (482.1) | | | 536.9 | |
| Net change in unrealized appreciation (depreciation) on: | | | | | | | |
| Real estate properties | (89.1) | | | (83.2) | | | (273.0) | | | 161.0 | |
| Real estate joint ventures and funds | (56.7) | | | (138.0) | | | 2.6 | | | (94.3) | |
| Marketable securities | 1.5 | | | 37.3 | | | (120.5) | | | 19.8 | |
| Loans receivable | (9.2) | | | (1.0) | | | (31.4) | | | (3.8) | |
| Loans receivable with related parties | 0.4 | | | (0.4) | | | 0.4 | | | (0.4) | |
| Loans payable | (42.4) | | | (32.1) | | | (6.1) | | | (98.4) | |
| Net change in unrealized depreciation on investments and loans payable | (195.5) | | | (217.4) | | | (428.0) | | | (16.1) | |
| NET REALIZED AND UNREALIZED (LOSS) GAIN ON INVESTMENTS AND LOANS PAYABLE | (178.8) | | | 110.1 | | | (910.1) | | | 520.8 | |
| NET (DECREASE) INCREASE IN NET ASSETS RESULTING FROM OPERATIONS | $ | (15.6) | | | $ | 312.5 | | | $ | (364.6) | | | $ | 1,104.0 | |
|
| | | | | | | | | | | | | | | |
| | For the Three Months Ended September 30, | | For the Nine Months Ended September 30, |
| 2017 | | 2016 | | 2017 | | 2016 |
| INVESTMENT INCOME | | | | | | | |
| Real estate income, net: | | | | | | | |
| Rental income | $ | 267.9 |
| | $ | 257.4 |
| | $ | 791.6 |
| | $ | 755.9 |
|
| Real estate property level expenses and taxes: | | | | | | | |
| Operating expenses | 56.9 |
| | 54.8 |
| | 164.9 |
| | 163.5 |
|
| Real estate taxes | 43.2 |
| | 40.4 |
| | 127.3 |
| | 116.9 |
|
| Interest expense | 22.5 |
| | 22.4 |
| | 67.3 |
| | 63.3 |
|
| Total real estate property level expenses and taxes | 122.6 |
| | 117.6 |
| | 359.5 |
| | 343.7 |
|
| Real estate income, net | 145.3 |
| | 139.8 |
| | 432.1 |
| | 412.2 |
|
| Income from real estate joint ventures and limited partnerships | 60.9 |
| | 33.5 |
| | 154.3 |
| | 111.8 |
|
| Interest | 15.9 |
| | 6.3 |
| | 37.6 |
| | 17.8 |
|
| Dividends | 7.9 |
| | 9.2 |
| | 15.7 |
| | 19.9 |
|
| TOTAL INVESTMENT INCOME | 230.0 |
| | 188.8 |
| | 639.7 |
| | 561.7 |
|
| Expenses: | | | | | | | |
| Investment management charges | 15.5 |
| | 17.6 |
| | 52.9 |
| | 51.8 |
|
| Administrative charges | 14.7 |
| | 17.0 |
| | 46.0 |
| | 48.4 |
|
| Distribution charges | 6.4 |
| | 7.2 |
| | 19.6 |
| | 21.3 |
|
| Mortality and expense risk charges | 0.3 |
| | 0.3 |
| | 0.9 |
| | 0.9 |
|
| Liquidity guarantee charges | 12.5 |
| | 10.2 |
| | 34.5 |
| | 28.1 |
|
| TOTAL EXPENSES | 49.4 |
| | 52.3 |
| | 153.9 |
| | 150.5 |
|
| INVESTMENT INCOME, NET | 180.6 |
| | 136.5 |
| | 485.8 |
| | 411.2 |
|
| NET REALIZED AND UNREALIZED GAIN (LOSS) ON INVESTMENTS AND MORTGAGE LOANS PAYABLE | | | | | | | |
| Net realized gain (loss) on investments: | | | | | | | |
| Real estate properties | 75.2 |
| | 16.4 |
| | 58.4 |
| | 26.5 |
|
| Real estate joint ventures and limited partnerships | (8.6 | ) | | 0.2 |
| | (8.6 | ) | | 0.4 |
|
| Marketable securities | 2.6 |
| | 3.1 |
| | 15.3 |
| | 21.6 |
|
| Net realized gain on investments | 69.2 |
| | 19.7 |
| | 65.1 |
| | 48.5 |
|
| Net change in unrealized appreciation (depreciation) on: | | | | | | | |
| Real estate properties | (9.4 | ) | | 36.9 |
| | 74.8 |
| | 242.2 |
|
| Real estate joint ventures and limited partnerships | 26.9 |
| | 24.3 |
| | 88.7 |
| | 152.3 |
|
| Marketable securities | 2.2 |
| | (26.0 | ) | | 34.2 |
| | 84.2 |
|
| Loans receivable | 1.4 |
| | 0.1 |
| | 1.4 |
| | 0.1 |
|
| Mortgage loans payable | (4.1 | ) | | (29.1 | ) | | (10.6 | ) | | (54.8 | ) |
Net change in unrealized appreciation on investments and mortgage loans payable | 17.0 |
| | 6.2 |
| | 188.5 |
| | 424.0 |
|
| NET REALIZED AND UNREALIZED GAIN ON INVESTMENTS AND MORTGAGE LOANS PAYABLE | 86.2 |
| | 25.9 |
| | 253.6 |
| | 472.5 |
|
| NET INCREASE IN NET ASSETS RESULTING FROM OPERATIONS | $ | 266.8 |
| | $ | 162.4 |
| | $ | 739.4 |
| | $ | 883.7 |
|
See notes to the consolidated financial statements
TIAA REAL ESTATE ACCOUNT
CONSOLIDATED STATEMENTS OF CHANGES IN NET ASSETS
(In millions)
(Unaudited)
| | | | | | | | | | | | | | | | | | | | | | | |
| For the Three Months Ended September 30, | | For the Nine Months Ended September 30, |
| 2020 | | 2019 | | 2020 | | 2019 |
| FROM OPERATIONS | | | | | | | |
| Investment income, net | $ | 163.2 | | | $ | 202.4 | | | $ | 545.5 | | | $ | 583.2 | |
| Net realized gain (loss) on investments | 16.7 | | | 327.5 | | | (482.1) | | | 536.9 | |
| Net change in unrealized depreciation on investments and loans payable | (195.5) | | | (217.4) | | | (428.0) | | | (16.1) | |
| NET CHANGE IN NET ASSETS RESULTING FROM OPERATIONS | (15.6) | | | 312.5 | | | (364.6) | | | 1,104.0 | |
| FROM PARTICIPANT TRANSACTIONS | | | | | | | |
| Premiums | 401.1 | | | 641.6 | | | 1,533.0 | | | 1,990.1 | |
| Annuity payments | (11.8) | | | (11.6) | | | (35.9) | | | (35.0) | |
| Withdrawals and death benefits | (1,158.2) | | | (638.4) | | | (5,012.1) | | | (1,865.0) | |
| NET CHANGE IN NET ASSETS RESULTING FROM PARTICIPANT TRANSACTIONS | (768.9) | | | (8.4) | | | (3,515.0) | | | 90.1 | |
| NET CHANGE IN NET ASSETS | (784.5) | | | 304.1 | | | (3,879.6) | | | 1,194.1 | |
| NET ASSETS | | | | | | | |
| Beginning of period | 24,212.8 | | | 26,732.6 | | | 27,307.9 | | | 25,842.6 | |
| End of period | $ | 23,428.3 | | | $ | 27,036.7 | | | $ | 23,428.3 | | | $ | 27,036.7 | |
|
| | | | | | | | | | | | | | | |
| | For the Three Months Ended September 30, | | For the Nine Months Ended September 30, |
| 2017 | | 2016 | | 2017 | | 2016 |
| FROM OPERATIONS | | | | | | | |
| Investment income, net | $ | 180.6 |
| | $ | 136.5 |
| | $ | 485.8 |
| | $ | 411.2 |
|
| Net realized gain on investments | 69.2 |
| | 19.7 |
| | 65.1 |
| | 48.5 |
|
| Net change in unrealized appreciation on investments and mortgage loans payable | 17.0 |
| | 6.2 |
| | 188.5 |
| | 424.0 |
|
NET INCREASE IN NET ASSETS RESULTING FROM OPERATIONS | 266.8 |
| | 162.4 |
| | 739.4 |
| | 883.7 |
|
| FROM PARTICIPANT TRANSACTIONS | | | | | | | |
| Premiums | 552.4 |
| | 757.8 |
| | 1,980.6 |
| | 2,349.2 |
|
| Annuity payments | (10.8 | ) | | (10.3 | ) | | (32.3 | ) | | (30.3 | ) |
| Withdrawals and death benefits | (777.5 | ) | | (576.6 | ) | | (2,152.6 | ) | | (1,551.1 | ) |
NET INCREASE (DECREASE) IN NET ASSETS RESULTING FROM PARTICIPANT TRANSACTIONS | (235.9 | ) | | 170.9 |
| | (204.3 | ) | | 767.8 |
|
| NET INCREASE IN NET ASSETS | 30.9 |
| | 333.3 |
| | 535.1 |
| | 1,651.5 |
|
| NET ASSETS | | | | | | | |
| Beginning of period | 24,808.9 |
| | 23,678.2 |
| | 24,304.7 |
| | 22,360.0 |
|
| End of period | $ | 24,839.8 |
| | $ | 24,011.5 |
| | $ | 24,839.8 |
| | $ | 24,011.5 |
|
See notes to the consolidated financial statements
TIAA REAL ESTATE ACCOUNT
CONSOLIDATED STATEMENTS OF CASH FLOWS
(In millions)millions, Unaudited)
(Unaudited) | | | | | | | | | | | |
| | For the Nine Months Ended September 30, |
| 2020 | | 2019 |
| CASH FLOWS FROM OPERATING ACTIVITIES | | | |
| Net (decrease) increase in net assets resulting from operations | $ | (364.6) | | | $ | 1,104.0 | |
| Adjustments to reconcile net changes in net assets resulting from operations to net cash provided by operating activities: | | | |
| Net realized loss (gain) on investments | 482.1 | | | (536.9) | |
| Net change in unrealized depreciation on investments and loans payable | 428.0 | | | 16.1 | |
| Purchase of real estate properties | (1,092.7) | | | (491.8) | |
| Capital improvements on real estate properties | (179.7) | | | (219.4) | |
| Proceeds from sale of real estate properties | 350.3 | | | 813.0 | |
| Purchases of long term investments | (852.0) | | | (1,047.2) | |
| Proceeds from long term investments | 1,658.2 | | | 1,145.2 | |
| Purchases and originations of loans receivable | (114.8) | | | (356.9) | |
| Purchases and originations of loans receivable with related parties | 0 | | | (69.3) | |
| Proceeds from sales of loans receivable | 63.0 | | | 0 | |
| Proceeds from payoffs of loans receivable | 20.0 | | | 27.1 | |
| Decrease (Increase) in other investments | 3,447.9 | | | (133.0) | |
| Change in due to (from) investment manager | 7.3 | | | (1.7) | |
| | | |
| | | |
| Increase in other assets | (43.2) | | | (14.9) | |
| Decrease (Increase) in other liabilities | 18.3 | | | (70.4) | |
| NET CASH PROVIDED BY OPERATING ACTIVITIES | 3,828.1 | | | 163.9 | |
| CASH FLOWS FROM FINANCING ACTIVITIES | | | |
| Proceeds from line of credit | 540.0 | | | 0 | |
| Payments on line of credit | (699.0) | | | 0 | |
| Mortgage loan proceeds received | 0 | | | 47.5 | |
| Payments of mortgage loans | (165.0) | | | (290.0) | |
| Premiums | 1,533.0 | | | 1,990.1 | |
| Annuity payments | (35.9) | | | (35.0) | |
| Withdrawals and death benefits | (5,012.1) | | | (1,865.0) | |
| NET CASH USED IN FINANCING ACTIVITIES | (3,839.0) | | | (152.4) | |
| NET (DECREASE) INCREASE IN CASH, CASH EQUIVALENTS AND RESTRICTED CASH | (10.9) | | | 11.5 | |
| CASH, CASH EQUIVALENTS AND RESTRICTED CASH | | | |
| Beginning of period cash, cash equivalents and restricted cash | 40.4 | | | 47.3 | |
| Net (decrease) increase in cash, cash equivalents and restricted cash | (10.9) | | | 11.5 | |
| End of period cash, cash equivalents and restricted cash | $ | 29.5 | | | $ | 58.8 | |
| SUPPLEMENTAL DISCLOSURES: | | | |
| Cash paid for interest | $ | 74.0 | | | $ | 82.2 | |
| Mortgage loan assumed as part of real estate acquisition | $ | 289.6 | | | $ | 110.0 | |
| Loan receivable converted to equity in real estate investment | $ | (1.7) | | | $ | 0 | |
| Loan assignment as part of a real estate disposition | $ | 0 | | | $ | (285.4) | |
The following table provides a reconciliation of cash, cash equivalents and restricted cash reported within the Consolidated Statements of Assets and Liabilities that sum to the total of the same such amounts shown in the Consolidated Statements of Cash Flows (in millions): |
| | | | | | | |
| | For the Nine Months Ended September 30, |
| 2017 | | 2016 |
| CASH FLOWS FROM OPERATING ACTIVITIES | | | |
| Net increase in net assets resulting from operations | $ | 739.4 |
| | $ | 883.7 |
|
| Adjustments to reconcile net changes in net assets resulting from operations to net cash provided by (used in) operating activities: | | | |
| Net realized gain on investments | (65.1 | ) | | (48.5 | ) |
Net change in unrealized appreciation on investments and mortgage loans payable | (188.5 | ) | | (424.0 | ) |
| Purchase of real estate properties | (298.4 | ) | | (378.0 | ) |
| Capital improvements on real estate properties | (95.0 | ) | | (125.2 | ) |
| Proceeds from sale of real estate properties | 340.7 |
| | 152.9 |
|
| Purchases of long term investments | (342.5 | ) | | (1,134.0 | ) |
| Proceeds from long term investments | 376.3 |
| | 51.6 |
|
| Increase in loans receivable | (1.7 | ) | | (69.0 | ) |
| Increase in other investments | (239.3 | ) | | (203.8 | ) |
| Change in due to (from) investment manager | 1.1 |
| | (4.9 | ) |
| (Increase) decrease in other assets | 105.0 |
| | (121.4 | ) |
| Increase (decrease) in other liabilities | (74.5 | ) | | 141.3 |
|
| NET CASH PROVIDED BY (USED IN) OPERATING ACTIVITIES | 257.5 |
| | (1,279.3 | ) |
| CASH FLOWS FROM FINANCING ACTIVITIES | | | |
| Mortgage loan proceeds received | — |
| | 563.5 |
|
| Payments of mortgage loans | (49.4 | ) | | (34.7 | ) |
| Premiums | 1,980.6 |
| | 2,349.2 |
|
| Annuity payments | (32.3 | ) | | (30.3 | ) |
| Withdrawals and death benefits | (2,152.6 | ) | | (1,551.1 | ) |
| NET CASH (USED IN) PROVIDED BY FINANCING ACTIVITIES | (253.7 | ) | | 1,296.6 |
|
| NET INCREASE IN CASH AND CASH EQUIVALENTS | 3.8 |
| | 17.3 |
|
| CASH AND CASH EQUIVALENTS | | | |
| Beginning of period | 3.0 |
| | 11.9 |
|
| End of period | $ | 6.8 |
| | $ | 29.2 |
|
| SUPPLEMENTAL DISCLOSURES: | | | |
| Cash paid for interest | $ | 67.3 |
| | $ | 61.6 |
|
| Debt assumed as part of real estate acquisition | $ | 17.7 |
| | $ | — |
|
| | | | | | | | | | | | | | | |
| | As of September 30, | | |
| 2020 | | 2019 | | | | |
| Cash and cash equivalents | $ | 8.0 | | | $ | 13.6 | | | | | |
Restricted cash(1) | 21.5 | | | 45.2 | | | | | |
| TOTAL CASH, CASH EQUIVALENTS AND RESTRICTED CASH | $ | 29.5 | | | $ | 58.8 | | | | | |
(1) Restricted cash is included within other assets in the Consolidated Statements of Assets and Liabilities.
See notes to the consolidated financial statements
TIAA REAL ESTATE ACCOUNT
NOTES TO THE CONSOLIDATED FINANCIAL STATEMENTS
(Unaudited)
Note 1—Organization and Significant Accounting Policies
Business: The TIAA Real Estate Account (“Account”) is an insurance separate account of Teachers Insurance and Annuity Association of America (“TIAA”) and was established by resolution of TIAA’s Board of Trustees (the “Board”) on February 22, 1995, under the insurance laws of the State of New York, for the purpose of funding variable annuity contracts issued by TIAA. The Account offers individual and group accumulating annuity contracts (with contributions made on a pre-tax or after-tax basis), as well as individual lifetime and term-certain variable payout annuity contracts (including the payment of death benefits to beneficiaries). Investors are entitled to transfer funds to or from the Account, and make withdrawals from the Account on a daily basis, under certain circumstances. Funds invested in the Account for each category of contract are expressed in terms of units, and unit values will fluctuate depending on the Account’s performance.
The investment objective of the Account is to seek favorable long-termtotal returns primarily through the rental income and appreciation of a diversified portfolio of directly held, private real estate investments and real estate-related investments owned by the Account.while offering investors guaranteed, daily liquidity. The Account holds real estate properties directly and through subsidiaries wholly-owned by TIAA for the sole benefit of the Account. The Account also holds limited interests in real estate joint ventures and limited partnerships,funds, as well as investments in loans receivable with commercial real estate properties as underlying collateral. Additionally, the Account invests in real estate-related and non-real estate-related publicly traded securities, cash and other instruments to maintain adequate liquidity levels for operating expenses, capital expenditures and to fund benefit payments (withdrawals, transfers and related transactions).
The Consolidated Financial Statements were prepared in accordance with accounting principles generally accepted in the United States of America ("GAAP"), which requires the use of estimates made by management. Actual results may vary from those estimates and such differences may be material.
The Consolidated Financial Statements of the Account as of September 30, 2020 and for the three and nine months ended September 30, 2020 and 2019 are unaudited and include all adjustments necessary to present a fair statement of results for the interim periods presented. Results of operations for the interim periods are not necessarily indicative of results for the entire year. These Consolidated Financial Statements have been prepared in accordance with the applicable rules and regulations of the Securities and Exchange Commission (“SEC”). Accordingly, certain footnote disclosures normally included in financial statements prepared in accordance with GAAP have been condensed or omitted from this report pursuant to the rules of the SEC. As a result, these Consolidated Financial Statements should be read in conjunction with the audited Consolidated Financial Statements and notes thereto included in the Account’s annual report on Form 10-K for the year ended December 31, 2019.
The following is a summary of the significant accounting policies of the Account.
Basis of Presentation: The accompanying Consolidated Financial Statements include the Account and those subsidiaries wholly-owned by TIAA for the sole benefit of the Account. All significant intercompany accounts and transactions between the Account and such subsidiaries have been eliminated.
The Accumulation Unit Value (“AUV”) used for financial reporting purposes may differ from the AUV used for processing transactions. The AUV used for financial reporting purposes includes security and participant transactions effective through the period end date to which this report relates. Total return is computed based on the AUV used for processing transactions.
Determination of Investments at Fair Value: The Account reports all investments at fair value in accordance with the Financial Accounting Standards Board (“FASB”) Accounting Standards Codification (“ASC”) 946—Financial Services—Investment Companies.Companies ("ASC 946"). Further in accordance with the adoption of the fair value option allowed under ASC 825—Financial Instruments, and at the election of Account management, mortgage loans payable and a line of credit are reported at fair value. The FASB has defined fair value as the price that would be received to sell
an asset or paid to transfer a liability in an orderly transaction between market participants.participants excluding transaction costs.
The following is a description of the valuation methodologies used to determine the fair value of the Account’s investments and investment related mortgage loans payable.
Valuation of Real Estate Properties—Investments in real estate properties are stated at fair value, as determined in accordance with policies and procedures reviewed by the Investment Committee of the Board and in accordance with the responsibilities of the Board as a whole. Accordingly, the Account does not record depreciation. Determination of fair value involves significant levels of judgment because the actual fair value of real estate can be determined only by negotiation between the parties in a sales transaction.
The Account’s primary objective when valuing its real estate investments will beis to produce a valuation that represents a reasonable estimate of the fair value of its investments. Implicit in the Account’s definition of fair value are the consummation of a sale as of a specified date and the passing of title from seller to buyer under conditions whereby:
•Buyer and seller are typicallysimilarly motivated;
•Both parties are well informed or well advised, and acting in what they consider their best interests;
•A reasonable time is allowed for exposure in the open market;
•Payment is made in terms of cash or in terms of financial arrangements comparable thereto; and
•The price represents the normal consideration for the property sold unaffected by special or creative financing or sales concessions granted by anyone associated with the sale.
Property and investment values are affected by, among other things, the availability of capital, occupancy rates, rental rates, and interest and inflation rates. As a result, determining real estate and investment values involves many assumptions. Key inputs and assumptions include rental income and expense amounts, related rental income and expense growth rates, capital expenditures, discount rates and capitalization rates. Valuation techniques include discounted cash flow analysis, prevailing market capitalization rates or multiples applied to earnings from the property, analysis of recent comparable sales transactions, actual sale negotiations and bona fide purchase offers received from third parties. Amounts ultimately realized from each investment may vary significantly from the fair value presented.
Real estate properties owned by the Account are initially valued based on an independent third party appraisal, as reviewed by TIAA’s internal appraisal staff and as applicable by the Account’s independent fiduciaryIndependent Fiduciary, RERC, LLC (the "Independent Fiduciary"), at the time of the closing of the purchase. Such initial valuation may result in a potential unrealized gain or loss reflecting the difference between an investment’s fair value (i.e., exit price) and its cost basis (which is inclusive of transaction costs).
Subsequently, each property is appraised each quarter by an independent third party appraiser, reviewed by TIAA’s internal appraisal staff and as applicable the Account’s independent fiduciary.Independent Fiduciary. In general, the Account obtains appraisals of its real estate properties spread out throughout the quarter, which is intended to result in appraisal adjustments, and thus, adjustments to the valuations of its holdings (to the extent such adjustments are made) that happen regularly throughout each quarter and not on one specific day or month in each period.
Further, management reserves the right to order an appraisal and/or conduct another valuation outside of the normal quarterly process when facts or circumstances at a specific property change. For example, under certain circumstances a valuation adjustment could be made when the account receives a bona fide bid for the sale of a property held within the Account or one of the Account’s joint ventures. Adjustments may be made for events or circumstances indicating an impairment of a tenant’s ability to pay amounts due to the Account under a lease (including due to a bankruptcy filing of that tenant). Alternatively, adjustments may be made to reflect the execution or renewal of a significant lease. Also, adjustments may be made to reflect factors (such as sales values for comparable properties or local employment rate) bearing uniquely on a particular region in which the Account holds properties. TIAA’s internal appraisal staff oversees the entire appraisal process, in conjunction with the Account’s independent fiduciaryIndependent Fiduciary (the independent fiduciaryIndependent Fiduciary is more fully described in the following paragraph). Any differences in the conclusions of TIAA’s internal appraisal staff and the independent appraiser will be reviewed by the independent fiduciary,Independent
Fiduciary, which will make a final determination on the matter (which may include ordering a subsequent independent appraisal).
The independent fiduciary, RERC, LLC, has beenIndependent Fiduciary was initially appointed in March 2006 by a special subcommittee of the Investment Committee of the Board to, among other things, oversee the entire appraisal process. In March 2018, RERC, LLC, was re-appointed as the Account's Independent Fiduciary for a term expiring in February 2021. The independent fiduciaryIndependent Fiduciary must approve all independent appraisers used by the Account. All appraisals are performed in accordance with Uniform Standards of Professional Appraisal Practices, the real estate appraisal industry standards created by The Appraisal Foundation. Real estate appraisals are estimates of property values based on a professional’s opinion. Appraisals of properties held outside of the U.S. are performed in accordance with industry standards commonly applied in the applicable jurisdiction. These independent appraisers are always expected to be MAI-designated members of the Appraisal Institute (or its European equivalent, Royal Institute of Chartered Surveyors) and state certified appraisers from national or regional firms with relevant property type experience and market knowledge. Under the Account’s current procedures, each independent appraisal firm will be rotated off of a particular property at least every three years, although such appraisal firm may perform appraisals of other Account properties subsequent to such rotation.
Also, the independent fiduciaryIndependent Fiduciary may require additional appraisals if factors or events have occurred that could materially change a property’s value (including those identified previously) and such change is not reflected in the quarterly valuation review, or otherwise to ensure that the Account is valued appropriately. The independent fiduciaryIndependent Fiduciary must also approve any valuation change of real estate-related assets where a property’s value changed by more than 6% from the most recent independent annual appraisal, or if the value of the Account would change by more than 4% within any calendar quarter or more than 2% since the prior calendar month. When a real estate property is subject to a mortgage, the property is valued independently of the mortgage and the property and mortgage fair values are reported separately (see Valuation of Mortgage Loans Payable). The independent fiduciaryIndependent Fiduciary reviews and approves all mortgage valuation adjustments before such adjustments are recorded by the Account. The Account continues to use the revised value for each real estate property and mortgage loan payable to calculate the Account’s daily net asset value until the next valuation review or appraisal.
Valuation of Real Estate Joint Ventures—Real estate joint ventures are stated at the fair value of the Account’s ownership interests of the underlying entities. The Account’s ownership interests are valued based on the fair value of the underlying real estate, any related mortgage loans payable, and other factors, such as ownership percentage, ownership rights, buy/sell agreements, distribution provisions and capital call obligations. The fair value of real estate and loans payable held by joint ventures is determined in the same manner described above in Valuation of Real Estate Properties. The Independent Fiduciary reviews and approves all valuation adjustments before such adjustments are recorded by the Account. Upon the disposition of all real estate investments by an investee entity, the Account will continue to state its equity in the remaining net assets of the investee entity during the wind down period, if any, which occurs prior to the dissolution of the investee entity.
Valuation of Real Estate Limited PartnershipsFunds—Limited partnershipReal estate fund interests are stated at the fair value of the Account’s ownership in
the partnership which are recorded based uponreal estate fund. Management uses net asset value information provided by fund managers as a practical expedient to estimate fair value. The Account receives estimates from limited partners on a quarterly basis, and audited information is provided annually. Upon receipt of the changes ininformation, management reviews and determines whether the net asset values provided are an appropriate representation of the limited partnerships as determined from the financial statementsfair value of the limited partnerships when received byAccount's interests in the Account. Prior to the receiptreal estate funds and makes valuation adjustments as necessary. Valuation of the financial statements from the limited partnerships, the Account estimates the value of its interest in good faith and will from time to time seek input from the issuer or the sponsor of the investments. Since market quotations are not readily available, the limited partnership interests are valued at fair value as determined in good faith by managementreal estate funds proceeds under the direction of the Investment Committee of the Board and in accordance with the responsibilities of the Board as a whole.
Valuation of Marketable Securities—Equity securities listed or traded on any national market or exchange are valued at the last sale price as of the close of the principal securities market or exchange on which such securities are traded or, if there is no sale, at the mean of the last bid and asked prices on such market or exchange, exclusive of transaction costs.costs.
Valuation of Debt Securities—Debt securities with readily available market quotations, other than money market instruments, are generally valued at the most recent bid price or the equivalent quoted yield for such securities (or
those of comparable maturity, quality and type). Debt securities for which market quotations are not readily available, are valued at fair value as determined in good faith by management and the Investment Committee of the Board and in accordance with the responsibilities of the Board as a whole.
Short-term investments are valued in the same manner as debt securities, as described above.
Money market instruments are valued at amortized cost, which approximates fair value.
Equity and fixed income securities traded on a foreign exchange or in foreign markets are valued using their closing values under the valuation methods generally accepted in the country where traded, as of the valuation date. This value is converted to U.S. dollars at the exchange rate in effect on the valuation day. Under certain circumstances (for example, if there are significant movements in the U.S. markets and there is an expectation the securities traded on foreign markets will adjust based on such movements when the foreign markets open the next day), the Account may adjust the value of equity or fixed income securities that trade on a foreign exchange or market after the foreign exchange or market has closed.
Valuation of Loans Receivable (i.e., the Account as a creditor)—Loans receivable are stated at fair value and are initially valued at the face amount of the loan funding. Subsequently, loans receivable are valued at least quarterly by TIAA’s internal valuation department based on market factors, such as market interest rates and spreads for comparable loans, the liquidity for loans of similar characteristics, the performance of the underlying collateral (such as the loan-to-valueloan- to-value ratio and the cash flow of the underlying collateral) and the credit quality of the counterparty. The independent
fiduciaryIndependent Fiduciary reviews and approves all loan receivable valuation adjustments before such adjustments are recorded by the Account. The Account continues to use the revised value for each loan receivable to calculate the Account’s daily net asset value until the next valuation review.
Valuation of Mortgage Loans Payable (i.e., the Account as a debtor)—Mortgage or other loans payable, including the Account's line of credit, are stated at fair value. The estimated fair valuesvalue of mortgage loans payable areis generally based on the amount at which the liability could be transferred toin a third partycurrent transaction, exclusive of transaction costs. Mortgage loans payableFair values are valued internally by TIAA’s internal valuation department, as reviewed by the Account’s independent fiduciary, at least quarterlyestimated based on market factors, such as market interest rates and spreads foron comparable loans, the liquidity for loans of similar characteristics, the performance of the underlying collateral (such as the loan-to-value ratio and the cash flow of the underlying collateral), the liquidity for mortgage loans of similar characteristics, the maturity date of the loan, the return demands of the market, and the credit quality of the Account. Different assumptions or changes in future market conditions could significantly affect estimated fair values. At times, the Account may assume debt in connection with the purchase of real estate (including under the Account's line of credit or additional credit facilities). The Independent Fiduciary reviews and approves all valuation adjustments before such adjustments are recorded by the return demands of the market.Account.
See Note 45—Assets and Liabilities Measured at Fair Value on a Recurring Basis for further discussion and disclosure regarding the determination of the fair value of the Account’s investments.
Foreign Currency Transactions and Translation: Portfolio investments and other assets and liabilities denominated in foreign currencies are translated into U.S. dollars at the exchange rates prevailing at the end of the period. Purchases and sales of securities, income receipts and expense payments made in foreign currencies are translated into U.S. dollars at the exchange rates prevailing on the respective dates of the transactions. The effect of any changes in foreign currency exchange rates on portfolio investments and mortgage loans payable are included in net realized and unrealized gains and losses on real estate properties and mortgage loans payable. Net realized gains and losses on foreign currency transactions include disposition of foreign currencies, and currency gains and losses between the accrual and receipt dates of portfolio investment income and between the trade and settlement dates of portfolio investment transactions.
Accumulation and Annuity Funds: The accumulation fund represents the net assets attributable to participants in the accumulation phase of their investment (“Accumulation Fund”). The annuity fund represents the net assets attributable to the participants currently receiving annuity payments (“Annuity Fund”). The net increase or decrease in net assets from investment operations is apportioned between the funds based upon their relative daily net asset values. Once an Account participant begins receiving lifetime annuity income benefits, payment levels cannot be reduced as a result of the Account’s actual mortality experience. In addition, the contracts pursuant to which the Account is offered are required to stipulate the maximum expense charge for all Account level expenses that can be assessed, which is not to exceed 2.5% of average net assets per year. The Account pays a fee to TIAA to assume mortality and expense risks.
Accounting for Investments: The investments held by the Account are accounted for as follows:
Real Estate Properties—Rent from real estate properties consists of all amounts earned under tenant operating leases, including base rent, recoveries of real estate taxes and other expenses and charges for miscellaneous services provided to tenants. Rental income is recognized in accordance with the billing terms of the lease agreements. The Account bears the direct expenses of the real estate properties owned. These expenses include, but are not limited to, fees to local property management companies, property taxes, utilities, maintenance, repairs, insurance, and other operating and administrative costs. An estimate of the net operating income earned from each real estate property is accrued by the Account on a daily basis and such estimates are adjusted when actual operating results are determined.
Real Estate Joint Ventures—The Account has ownership interests in various real estate joint ventures (collectively, the “joint ventures”). The Account records its contributions as increases to its investments in the joint ventures, and distributions from the joint ventures are treated as income within income from real estate joint ventures and limited partnershipsfunds in the Account’s consolidated statementsConsolidated Statements of operations.Operations. Distributions that are identified as returns of capital are
recorded as a reduction to the cost basis of the investment, whereas distributions identified as capital gains or losses are recorded as realized gains or losses. Income distributions from the joint ventures are recorded based on the Account’s proportional interest of the income distributed by the joint ventures. Income earnedand losses incurred but not yet distributed toor realized from the Account by the joint ventures isare recorded as unrealized gains and losses.
Limited PartnershipsReal Estate Funds—The Account has ownership interests in various private real estate funds (primarily limited partnerships) and a private real estate investment trust (collectively, the “limited partnerships”).funds. The Account records its contributions as increases to the investments, and distributions from the investments are treated as income within
income from real estate joint ventures and limited partnershipsfunds in the Account’s consolidated statementsConsolidated Statements of operations.Operations. Distributions that are identified as returns of capital are recorded as a reduction to the cost basis of the investment, whereas distributions identified as capital gains or losses are recorded as realized gains or losses. Unrealized gains and losses are recorded based upon the changes in the net asset values of the limited partnershipsreal estate funds as determined from the financial statements of the limited partnershipsreal estate funds when received by the Account. Prior to the receipt of the financial statements from the limited partnerships,real estate funds, the Account estimates the value of its interest in good faith and will from time to time seek input fromusing information provided by the issuer or the sponsor of the investments.fund managers. Changes in value based on such estimates are recorded by the Account as unrealized gains and losses.
Marketable Securities—Transactions in marketable securities are accounted for as of the date the securities are purchased or sold (trade date). Interest income is recorded as earned. Dividend income is recorded on the ex-dividend date within dividend income. Dividends that are identified as returns of capital are recorded as a reduction to the cost basis of the investment, whereas dividends identified as capital gains or losses are recorded as realized gains or losses. Realized gains and losses on securities transactions are accounted for on the specific identification method.
Loans Receivable—The Account has ownership interests inmay originate, purchase or sell loans receivable. Loans receivable are stated atcollateralized by real estate. The cost basis of originated loans is comprised of the principal balance and direct costs incurred that represent a component of the loan’s reported fair value and are initially valued atvalue. The cost basis of purchased loans consists of the face amountpurchase price of the loan funding. Subsequently,and additional direct costs incurred that represent a component of the loan’s reported fair value. Additional costs incurred by the Account to originate or purchase loans receivable are valued at least quarterly by TIAA’s internal valuation department with changes inthat do not represent a component of a loan’s fair value flowing through unrealized gain (loss).are recorded as expenses in the period incurred. Nonrefundable origination fees paid by borrowers are recognized as interest income once all activities required to execute the loan are completed. Prepayment fees received from the payoff of loans in advance of their maturity date are recognized as interest income on the date the payoff occurs. Interest income from loans receivablein accrual status is recognized usingbased on the effective interest method over the expected lifecurrent coupon rate of the loan. Allloans.
Interest income accruals are suspended when a loan becomes a non-performing loan, defined as a loan more than ninety days in arrears or at any point when management believes the full collection of principal is doubtful. Interest income on non-performing loans receivable heldis recognized only as cash payments are received. Loans can be rehabilitated to date were originated directly byaccrual status once all past due interest has been collected and management believes the Account.full collection of principal is likely.
Realized and Unrealized Gains and Losses—Realized gains and losses are recorded at the time an investment is sold or a distribution is received in relation to an investment sale from a real estate joint venture or limited partnership.fund. Real estate and loan receivable transactions are accounted for as of the date on which the purchase or sale transactions for the real estate properties close (settlement date). The Account recognizes a realized gain on the sale of a real estate propertyan investment to the extent that the contract sales price exceeds the cost-to-date of the propertyinvestment being sold. A realized loss occurs when the cost-to-date exceeds the sales price.
Realized gains and losses from partial sales of non-financial assets are recognized in accordance with ASC 610-20 - Gains and Losses from the Derecognition of Nonfinancial Assets. Realized gains and losses from the sale of financial assets are recognized in accordance with ASC 860 - Transfers and Servicing. Unrealized gains and losses are recorded as the fair values of the Account’s investments are adjusted, and as discussed within the Real Estate Joint Ventures, Real Estate Funds and Loans Receivable sections above.
Unrealized gains and losses are recorded as the fair values of the Account’s investments are adjusted, and as discussed within the Real Estate Joint Ventures and Limited PartnershipsReal Estate Funds sections above.
Net Assets—The Account’s net assets as of the close of each valuation day are valued by taking the sum of:
•the value of the Account’s cash;cash, cash equivalents, and short-term and other debt instruments;
•the value of the Account’s other securities and other non-real estate assets;
•the value of the individual real properties (based on the most recent valuation of that property) and other real estate-related investments owned by the Account;
•an estimate of the net operating income accrued by the Account from its properties, other real estate-related investments and non-real estate-related investments (including short-term marketable securities) since the end of the prior valuation day; and
•actual net operating income earned from the Account’s properties, other real estate-related investments and non-real estate-related investments (but only to the extent any such item of income differs from the estimated income accrued for on such investments),
and then reducing the sum by liabilities held within the Account, including the daily investment management fee, administration and distribution fees, mortality and expense fees, and thefee, liquidity guarantee fee, and certain other expenses attributable to operating the Account. Daily estimates of net operating income are adjusted to reflect actual net operating income on a monthly basis, at which time such adjustments (if any) are reflected in the Account’s unit value.
After the end of every quarter, the Account reconciles the amount of expenses deducted from the Account (which is established in order to approximate the costs that the Account will incur) with the expenses the Account actually incurred. If there is a difference, the Account adds it to or deducts it from the Account in equal daily installments over the remaining days of the following quarter. Material differences may be repaid in the current calendar quarter. The Account’s at cost deductions are based on projections of Account assets and overall expenses, and the size of any
adjusting payments will be directly affected by the difference between management’s projections and the Account’s actual assets or expenses.
Income Variable Interest Entities: Variable interests are financial relationships which expose a reporting entity to the risks and rewards of variability in the entity's assets and operations. When variable interests exist, they are subject to evaluation under the variable interest entity ("VIE") model if any one of the following four characteristics are present: (a) the entity is insufficiently capitalized; (b) the equity holders do not have power to control the activities that most significantly impact the entity's financial performance; (c) the voting rights of the equity holders are not proportionate to their economic interests; or (d) the equity holders are not exposed to the residual losses or benefits that would normally be associated with equity interests.
ASC 810 - Consolidation prohibits a reporting entity that qualifies as an investment company under ASC 946from Securities Lending:consolidating an investee that is not an investment company. This scope exception does not apply to situations in which an investment company has an interest in another investment company. Accordingly, the Account's investments in other investment companies (e.g., real estate funds) are subject to evaluation under the VIE model.
The Account may lend securities to qualified borrowers to generate additional income. When loaning securities,consolidates a VIE if it concludes that the Account retainsis the primary beneficiary of the VIE. The primary beneficiary has both: (i) the power to direct the activities of a VIE that most significantly impact the VIE's economic performance; and (ii) the obligation to absorb losses or the right to receive benefits of owningthat could potentially be significant to the securities, including the economic equivalent of dividends or interest generatedVIE. The following activities have been identified by the securities. Cash collateral received for securitiesAccount as having the most significant impact on loan is maintained exclusively in an interest-bearing deposit account. All income generateda VIE's economic performance:
•control over the ability to acquire and dispose of investments held by the securities lending program is reflected within interest income on entity;
•the consolidated statementsability to kick out a managing entity without cause, either unilaterally or with a group of operations.equity investors;
•the ability to modify the power of the managing entity without its consent; and
•control over the day-to-day decision making of the underlying investments
An equity investor in a VIE may not actively be involved in the significant activities (i.e., it may cede day-to-day decision making to a third party), but if the equity investor has approval rights or some other mechanism to retain ultimate control, the equity investor with these rights would be concluded as having power over the activity. On a quarterly basis, the Account evaluates all involvements with VIEs, including any changes to governing powers of continuing VIEs. The consolidation status of VIEs may change as a result of such continued evaluation. At the
reporting date, the Account was not deemed to be the primary beneficiary of any VIEs. Refer to Note 7—Investments in Real Estate Funds for additional detail.
Cash and Cash Equivalents: Cash and cash equivalents are balances held by the Account in bank deposit accounts which, at times, exceed federally insured limits. The Account’s management monitors these balances to mitigate the exposure of risk due to concentration and has not experienced any losses from such concentration.
Other Assets and Other Liabilities:Other assets and other liabilities consist of operating assets and liabilities utilized and held at each individual real estate property investment. Other assets consist of, amongamongst other items, cash, tenant receivables and prepaid expenses; whereas other liabilities primarily consist of security deposits. Other assets also include cash collateral held for securities on loan.
Federal Income Taxes: Based on provisions of Section 817 of the Internal Revenue Code Section 817,of 1986, as amended, the Account is taxed as a segregated asset account of TIAA and as such, the Account incurs no material federal income tax attributable to the net investment activity of the Account. The Account’s federal income tax return is generally subject to examination for a period of three years after it is filed. State and local tax returns may be subject to examination for an additional period of time depending on the jurisdiction. Management has analyzed the Account’s tax positions taken for all open federal income tax years and has concluded that no provision for federal income tax is required in the Account’s Consolidated Financial Statements.
Restricted Cash: The Account held $41.8 million and $45.8 million as of September 30, 2017 and December 31, 2016, respectively,restricted cash in escrow accounts for security deposits, as required by certain states, as well as for property taxes, insurance, and various other property related matters as required by certain creditors related to outstanding mortgage loans payable collateralized by certain real estate investments. These amounts are recorded within other assets on the consolidated statementsConsolidated Statements of assetsAssets and liabilities.Liabilities. See Note 6—Mortgage 9—Loans Payablefor additional information regarding the Account’s outstanding mortgage loans payable.
Changes in Net Assets: Premiums include premiums paid by existing accumulation unit holders in the Account and transfers into the Account. Withdrawals and death benefits include withdrawals out of the Account which include transfers out of the Account and required minimum distributions.
Due to/from Investment Manager: Due to/from investment manager represents amounts that are to be paid or received by TIAA on behalf of the Account. Amounts generally are paid or received by the Account within one or two business days and no interest is contractually charged on these amounts.
New Accounting Pronouncements: In May 2014,Securities Lending: The Account may lend securities to qualified borrowers to earn additional income. The Account receives cash collateral against the FASB issued Accounting Standard Update 2014-09, Revenue from Contracts with Customers(“ASU 2014-09”). ASU 2014-09 supersedes all existing revenue recognition guidanceloaned securities and establishes a five-step modelmaintains cash collateral in an amount not less than 100% of the market value of loaned securities during the period of the loan; any additional collateral required due to measure and recognize revenue. ASU 2014-09 will be effective for fiscal years beginning after December 15, 2017 andchanges in security values is delivered to the Account plans to adopt the new revenue guidance as of January 1, 2018. The Account has completed its initial scoping for the adoption of ASU 2014-09 and has determined that a limited number of asset management agreements will be in the scope of the new guidance. However, the revenue recognition patterns related to the services performed under the asset management agreements are not expected to be significantly different from the revenue recognition pattern under existing GAAP. For the adoption of ASU 2014-09,next business day. Cash collateral received by the Account is planninginvested exclusively in an interest-bearing deposit account. The value of the loaned securities and the liability to utilizereturn the modified retrospective adoption approach. Management is currentlycash collateral received are reflected in the processConsolidated Statements of evaluatingAssets and Liabilities. When loaning securities, the final impactAccount retains the benefits of owning the securities, including the economic equivalent of dividends or interest generated by the securities. All income generated by the securities lending program is reflected within interest income on the Consolidated Statements of Operations.
Securities lending transactions are for real estate-related equity securities, and the resulting loans are continuous, can be recalled at any time, and have no set maturity. Securities lending income recognized by the Account consists of interest earned on cash collateral and lending fees, net of any rebates to the borrower and compensation to the agent. Such income is reflected within interest income on the Consolidated Statements of Operations. In lending its securities, the Account bears the market risk with respect to the investment of collateral and the risk that the agent may default on its contractual obligations to the Account. The agent bears the risk that the borrower may default on its obligation to return the loaned securities as the agent is contractually obligated to indemnify the Account if at the time of a default by a borrower some or all of the new standard.loan securities have not been returned.
Accounting Pronouncement: In January 2016,March 2020, the FASB issued ASU 2016-1 Financial Instruments (Topic 825)—Recognition and Measurement of Financial Assets and Financial Liabilities (“ASU 2016-1”). This ASU amends, among other items, certain aspects2020-04, Facilitation of the recognition, measurement, presentation,Effects of Reference Rate Reform on Financial Reporting (“ASU 2020-04”). The guidance provides optional expedients and disclosure of financial instruments. These amendments are effectiveexceptions for public business entities for fiscal yearsapplying generally accepted accounting principles to contract modifications and interim periods within those fiscal years beginning after December 15,hedging
2017. Management is currently assessingrelationships, subject to meeting certain criteria, that reference the impact of ASU 2016-1 on the Account’s Consolidated Financial Statements.
In February 2016, the FASB issued ASU 2016-2 Leases (Topic 842) (“ASU 2016-2”London Interbank Offered Rate ("LIBOR") which will supersede Topic 840, Leases. This ASU applies to all entities that enter into a lease. Lessees will be required to report assets and liabilities that arise from leases. Lessor accounting isor another reference rate expected to remain unchanged except in certain circumstances. This ASUbe discontinued. The guidance is effective for public businessall entities for fiscal years beginning after December 15, 2018, including all interim periods within those fiscal years. Management is currently assessing the impact of ASU 2016-2 on the Account’s Consolidated Financial Statements.
In August 2016, the FASB issued Accounting Standards Update 2016-15, Statement of Cash Flows (Topic 230) - Classification of Certain Cash Receipts and Cash Payments (“ASU 2016-15”). ASU 2016-15 clarifies how to present cash receipts and cash payments for certain activity in the Statement of Cash Flows. These amendments are effective for public business entities within those fiscal years beginning after December 15, 2017, and interim periods within those fiscal years and should be applied using a retrospective transition method to each period presented. Management is currently assessing the impact of ASU 2016-15 on the Account's Consolidated Financial Statements.
In November 2016, FASB issued Accounting Standards Update 2016-18, Statement of Cash Flows (Topic 230): Restricted Cash ("ASU 2016-18"). The statement of cash flows should present beginning-of-period and end-of-period total amounts that include cash and restricted cash. Transfers between cash and restricted cash will no longer be presented as operating, investing, or financing activities within the statement of cash flows. ASU 2016-18 is effective for annual financial statements issued for fiscal years beginning after December 15, 2017 and should be applied using a retrospective transition method to each period presented. Management is currently assessing the impact of ASU 2016-18 on the Account's Consolidated Financial Statements.
In March 2017, the FASB issued ASU 2017-05, Other Income-Gains and Losses from the Derecognition of Nonfinancial Assets (Subtopic 610-20): Clarifying the Scope of Asset Derecognition Guidance and Accounting for Partial Sales of Nonfinancial Assets. The amendments in ASU 2017-05 clarify the scope and application of ASC 610-20 on the sale or transfer of nonfinancial assets and in substance nonfinancial assets to noncustomers, including partial sales. ASU 2017-05 is effective for public business entities for annual periods beginning after December 15, 2017, including interim periods within those annual periods. The amendments may be either retrospectively applied to each period presented within the financial statements or by a cumulative-effect adjustment to retained earnings or net assets as of March 12, 2020 through December 31, 2022. Management does not expect the beginning ofguidance to materially impact the fiscal year of adoption. Management is currently assessing the impact of ASU 2017-05 on the Account’s Consolidated Financial Statements.Account.
Note 2—Management Agreements, Arrangements and Related Party Transactions
Investment advisorymanagement, administrative and distribution services are provided to the Account at cost by TIAA. Services provided at cost are paid by the Account on a daily basis based upon projected expenses to be provided to the Account. Payments are adjusted periodically to ensure daily payments are as close as possible to the Account’s actual expenses incurred. Differences between actual expenses and the amounts paid by the Account are reconciled and adjusted quarterly.
Investment management services for the Account are provided by TIAA officers, under the direction and control of the Board, pursuant to investment management procedures adopted by TIAA for the Account. TIAA’s investment management decisions for the Account are subject to review by the Account’s independent fiduciary.Independent Fiduciary. TIAA also provides various portfolio accounting and related services for the Account.
The Account is a party to the Distribution Agreement for the Contracts Funded by the TIAA Real Estate Account (the “Distribution Agreement”), dated January 1, 2008, by and among TIAA, for itself and on behalf of the Account, and TIAA-CREF Individual and Institutional Services, LLC (“Services”),. Services is a direct wholly-owned subsidiary of TIAA, and is registered with the SEC as a broker-dealer and a registered broker-dealerinvestment adviser and is a member of the Financial Industry Regulatory Authority. Pursuant to the Distribution Agreement, Services performs distribution services for the Account which include, among other things, (i) distributingdistribution of annuity contracts issued by TIAA and funded by the Account, (ii) advising existing annuity contract owners in connection with their accumulations and (iii) helping employers implement and manage retirement plans. In addition, TIAA performs administrative functions for the Account, which include, among other things, (i) maintaining accounting records and performing accounting services, (ii) receiving and allocating premiums, (iii) calculating and making annuity payments, (iv) processing withdrawal requests, (v) providing regulatory compliance and reporting services, (vi) maintaining the Account’s records of contract ownership and (vii) otherwise assisting generally in all aspects of the Account’s operations. Both distribution services (pursuant to the Distribution Agreement) and administrative services are provided to the Account by Services and TIAA, as applicable, on an at cost basis.
The Distribution Agreement is terminable by either party upon 60 days written notice and terminates automatically upon any assignment thereof.
In addition to providing the services described above, TIAA charges the Account fees to bear certain mortality and expense risks, and risks with providing the liquidity guarantee (described below). These fees are charged as a percentage of the net assets of the Account. Rates for these fees are established annually.
Once an Account participant begins receiving lifetime annuity income benefits, payment levels cannot be reduced as a result of the Account’s actual mortality experience. As such, mortality and expense risk expenses are contractual charges for TIAA’s assumption of this risk.
TIAA and Services provide investment management, administrative and distribution services at cost. TIAA and Services receive payments fromprovides the Account on a daily basis according to formulas established each year and adjusted periodically with the objective of keeping the payments as close as possible to the Account’s expenses actually incurred. Any differences between actual expenses and the amounts paid by the Account are adjusted quarterly.
TIAA also provides a liquidity guarantee toenabling the Account for a fee, to ensure that sufficienthave funds are available to meet participant redemption, transfer or cash withdrawal requests. The liquidity guarantee is required by the New York State Department of Financial Services and is subject to a prohibited transaction exemption that the Account received in 1996 (96-76) from the U.S. Department of Labor (the “PTE 96-76”). The Account pays TIAA for the risk associated with providing the liquidity guarantee through a daily deduction from the Account’s net assets. Whether the liquidity guarantee is exercised is based on the cash level of the Account from time to time, as well as recent participant withdrawal activity and the Account’s expected working capital, debt service and cash needs, and subject to the oversight of the Independent Fiduciary. If the Account cannot fund participant withdrawal or redemption requests in the event thatfrom the Account’s own cash flowsflow and liquid investments, are insufficient toTIAA will fund such requests. TIAA ensures sufficient funds are available for such transfer and withdrawal requeststhem by purchasing accumulation units issued by the Account (accumulation units that are purchased by TIAA are generally referred to as “liquidity units”). TIAA guarantees that participants can redeem their accumulation units at the accumulation unit value next determined after their transfer or cash withdrawal request is received in good order. Liquidity units owned by TIAA are valued in the same manner as accumulation units owned by the Account’s participants.
Expenses for the services and fees described above are identified as such in the accompanying Consolidated Statements of Operations and are further identified as "Expenses" in Note 11—Financial Highlights.
The Account has loans receivable outstanding with related parties as of September 30, 2020. The loans are with joint ventures in which the Account also has an equity interest. The loans are held at fair value in accordance with the valuation policies described in Note 1—Organization and Significant Accounting Policies. The following table presents the key terms of the Account.loans as of the reporting date (in millions):
To | | | | | | | | | | | | | | | | | | | | | | | | | | | | | | | | | | | | | | | | | | | | |
| | Related Party | | Equity Ownership Interest | | Interest Rate | | Maturity Date | | Fair Value at |
| Principal | | | | | | September 30, 2020 | | December 31, 2019 |
| 2020 | | 2019 | | | | | | |
| | | | | | | | | | | | (Unaudited) | | |
| 36.5 | | | 36.5 | | | MRA Hub 34 Holding, LLC | | 95.00% | | 2.50% + LIBOR | | 9/1/2022 | | $ | 36.5 | | | $ | 36.5 | |
| 32.8 | | | 32.8 | | | THP Student Housing, LLC | | 97.00% | | 3.20% | | 9/1/2024 | | 32.9 | | | 32.5 | |
| TOTAL LOANS RECEIVABLE WITH RELATED PARTIES | | $ | 69.4 | | | $ | 69.0 | |
Note 3—Concentrations of Risk
The outbreak of the extent TIAA owns accumulation units issued pursuant tonovel coronavirus (commonly known as “COVID-19”) and the liquidity guarantee,subsequent global pandemic began significantly impacting the independent fiduciary monitorsU.S. and oversees, among other things, TIAA’s ownership interest inglobal financial markets and economies during the first quarter of 2020. During the second and third quarters of 2020, the Account received multiple requests for rent and may require TIAA to eventually redeem someloan payment relief as a result of its units, particularly whenthe COVID-19 pandemic. Requests have generally been comprised of deferrals, with payments postponed for a brief period (i.e., less than six months) and then repaid over the remaining duration of the contract. As of September 30, 2020, the Account has un-invested cashnot had material exposure to rent concessions, tenant defaults or liquid investments available. TIAA also receives a fee for assuming certain mortalityloan defaults. The duration and expense risks.
extent of COVID-19 over the long-term cannot be reasonably estimated at this time. The expenses forultimate impact of the services noted above that are providedCOVID-19 pandemic and the extent to which the Account by TIAA and Services are identified inCOVID-19 pandemic impacts the accompanying consolidated statementsAccount’s business, results of operations, investments, and cash flows will depend on future developments, which are reflected in Note 7—Financial Highlights.
Note 3—Credit Risk Concentrationshighly uncertain and difficult to predict.
Concentrations of credit risk may arise when a number of properties or tenants are located in a similar geographic region such that the economic conditions of that region could impact tenants’ obligations to meet their contractual obligations or cause the values of individual properties to decline. TheAdditionally, concentrations of risk may arise if any one tenant comprises a significant amount of the Account's rent, or if tenants are concentrated in a particular industry.
As of September 30, 2020, the Account hashad no significant concentrations of tenants as no single tenant hashad annual contract rent that makesmade up more than 3%4% of the rental income of the Account. Moreover, the Account's tenants have no notable concentration present in any one industry. There are 0 significant lease expirations scheduled to occur over the next twelve months.
The Account’s wholly-owned real estate investments and investments in joint ventureventures are located in the United States. The following table represents the diversification of the Account’s portfolio by region and property type as of September 30, 2017:2020 (unaudited):
| | | | | | | | | | | | | | | | | | | | | | | | | | | | | |
Diversification by Fair Value(1) |
| West | | East | | South | | Midwest | | Total |
| Office | 13.4 | % | | 18.8 | % | | 5.5 | % | | 0 | % | | 37.7 | % |
| Apartment | 9.9 | % | | 6.6 | % | | 8.0 | % | | 1.1 | % | | 25.6 | % |
| Retail | 6.6 | % | | 3.7 | % | | 7.6 | % | | 0.8 | % | | 18.7 | % |
| Industrial | 9.5 | % | | 1.7 | % | | 4.8 | % | | 0.5 | % | | 16.5 | % |
Other(2) | 0.5 | % | | 0.4 | % | | 0.6 | % | | 0 | % | | 1.5 | % |
| Total | 39.9 | % | | 31.2 | % | | 26.5 | % | | 2.4 | % | | 100.0 | % |
|
| | | | | | | | | | | | | | |
Diversification by Fair Value(1) |
| | | | | | | | | | |
| | West | | East | | South | | Midwest | | Total |
| Office | 16.1 | % | | 20.7 | % | | 5.6 | % | | — | % | | 42.4 | % |
| Apartment | 8.8 | % | | 8.1 | % | | 4.0 | % | | 0.8 | % | | 21.7 | % |
| Retail | 7.7 | % | | 3.0 | % | | 7.7 | % | | 0.5 | % | | 18.9 | % |
| Industrial | 7.1 | % | | 2.0 | % | | 4.1 | % | | 0.8 | % | | 14.0 | % |
Other(2) | 0.3 | % | | 2.5 | % | | 0.1 | % | | 0.1 | % | | 3.0 | % |
| Total | 40.0 | % | | 36.3 | % | | 21.5 | % | | 2.2 | % | | 100.0 | % |
(1)Wholly-owned properties are represented at fair value and gross of any debt, while joint venture properties are represented at the net equity value.
| |
(1)(2)Represents interests in Storage Portfolio investments, a hotel investment and land. | Wholly-owned properties are represented at fair value and gross of any debt, while joint venture properties are represented at the net equity value. |
| |
(2)
| Represents interest in Storage Portfolio investment and a fee interest encumbered by a ground lease real estate investment. |
Properties in the “West” region are located in: AK, AZ, CA, CO, HI, ID, MT, NM, NV, OR, UT, WA, WYWY.
Properties in the “East” region are located in: CT, DC, DE, KY, MA, MD, ME, NC, NH, NJ, NY, PA, RI, SC, VA, VT, WVWV.
Properties in the “South” region are located in: AL, AR, FL, GA, LA, MS, OK, TN, TXTX.
Properties in the “Midwest” region are located in: IA, IL, IN, KS, MI, MN, MO, ND, NE, OH, SD, WIWI.
Note 4—Leases
The Account’s wholly-owned real estate properties are leased to tenants under operating lease agreements which expire on various dates through 2051. Rental income is recognized in accordance with the billing terms of the lease agreements. The leases do not have material variable payments, material residual value guarantees or material restrictive covenants. Certain leases have the option to extend or terminate at the tenant's discretion, with termination options resulting in additional fees due to the Account. Aggregate minimum annual rentals for wholly-owned real estate investments owned by the Account through the non-cancelable lease term, excluding short-term residential leases, as of September 30, 2020 (unaudited) and December 31, 2019 are as follows (millions):
| | | | | | | | | | | | | | |
| | As of |
| Years Ended | | September 30, 2020 | | December 31, 2019 |
| 2020 | | $ | 164.5 | | (1) | $ | 550.4 | |
| 2021 | | 627.3 | | | 505.0 | |
| 2022 | | 555.6 | | | 442.1 | |
| 2023 | | 479.8 | | | 381.2 | |
| 2024 | | 401.1 | | | 316.6 | |
| Thereafter | | 1,333.7 | | | 1,078.4 | |
| Total | | $ | 3,562.0 | | | $ | 3,273.7 | |
(1) Representative of minimum rents owed for the remaining months of the calendar year ending December 31, 2020.
Certain leases provide for additional rental amounts based upon the recovery of actual operating expenses in excess of specified base amounts, sales volume or contractual increases as defined in the lease agreement. These contractual contingent rentals are not included in the table above.
The Account has ground leases for which the Account is the lessee. The leases do not contain material residual value guarantees or material restrictive covenants. The fair value of right-of-use assets and leases liabilities related to ground leases are reflected on the balance sheet within other assets and other liabilities, respectively.
The fair values and key terms of the right-of-use assets and lease liabilities related to the Account's ground leases are as follows (millions):
| | | | | | | | | | | | | | |
| | As of |
| | September 30, 2020 | | December 31, 2019 |
| | (Unaudited) | | |
| Assets: | | | | |
| Right-of-use assets, at fair value | | $ | 37.5 | | | $ | 25.7 | |
| Liabilities: | | | | |
| Ground lease liabilities, at fair value | | $ | 37.5 | | | $ | 25.7 | |
| | | | | | | | | | | | | | |
| | As of |
| | September 30, 2020 | | December 31, 2019 |
| Key Terms: | | (Unaudited) | | |
| Weighted-average remaining lease term (years) | | 69.0 | | 84.4 |
Weighted-average discount rate(1) | | 7.70 | % | | 6.15 | % |
(1) Discount rates are reflective of the rates utilized during the most recent appraisal of the associated real estate investments.
For the nine months ended September 30, 2020, operating lease costs related to ground leases were $1.6 million. These costs include variable lease costs, which are immaterial. Aggregate future minimum annual payments for ground leases held by the Account are as follows (millions):
| | | | | | | | | | | | | | |
| | As of |
| Years Ended | | September 30, 2020 | | December 31, 2019 |
| | (Unaudited) | | |
2020(1) | | $ | 0.6 | | (1) | $ | 1.2 | |
| 2021 | | 2.3 | | | 1.2 | |
| 2022 | | 2.3 | | | 1.2 | |
| 2023 | | 2.3 | | | 1.2 | |
| 2024 | | 2.3 | | | 1.3 | |
| Thereafter | | 416.0 | | | 375.9 | |
| Total | | $ | 425.8 | | | $ | 382.0 | |
(1) Representative of minimum rents owed for the remaining months of the calendar year ending December 31, 2020.
Note 5—Assets and Liabilities Measured at Fair Value on a Recurring Basis
Valuation Hierarchy: The Account’s fair value measurements are grouped categorically into three levels, as defined by the FASB. The levels are defined as follows:
•Level 1—Valuations using unadjusted1 fair value inputs are quoted prices for assets tradedidentical items in active, liquid and visible markets such as stocks listed on the New York Stock Exchange. Active markets are defined as having the following characteristics for the measured asset or liability: (i) many transactions, (ii) current prices, (iii) price quotes not varying substantially among market makers, (iv) narrow bid/ask spreads and (v) most information regarding the issuer is publicly available. Level 1 assets held by the Account are generally marketable equity securities.stock exchanges.
Level 2—Valuations for assets and liabilities traded in less active, dealer or broker markets. Fair values are primarily obtained from third party pricing services for identical or comparable assets or liabilities. •Level 2 inputs for fair value measurements are inputs other than quoted prices included within Level 1, that are observable information for similar items in active or inactive markets, and appropriately consider counterparty creditworthiness in the valuations.
•Level 3 fair value inputs reflect our best estimate of inputs and assumptions market participants would use in pricing an asset or liability either directly or indirectly. Level 2at the measurement date. The inputs include:
| |
a. | Quoted prices for similar assets or liabilities in active markets; |
| |
b. | Quoted prices for identical or similar assets or liabilities in markets that are not active (that is, markets in which there are few transactions for the asset (or liability), the prices are not current, price quotations vary substantially either over time or among market makers (for example, some brokered markets), or in which little information is released publicly); |
| |
c. | Inputs other than quoted prices that are observable within the market for the asset (or liability) (for example, interest rates and yield curves, implied volatilities, prepayment speeds, loss severities, credit risks, and default rates that are observable at commonly quoted intervals); and |
| |
d. | Inputs that are derived principally from or corroborated by observable market data by correlation or other means (for example, market-corroborated inputs). |
Examples of securities which may be held by the Account and included in Level 2 include certificates of deposit, commercial paper, government agency notes, variable notes, United States Treasury securities, and debt securities.
Level 3—Valuations for assets and liabilities that are derived from other valuation methodologies, including pricing models, discounted cash flow models and similar techniques, and are not based on market exchange, dealer, or broker-traded transactions. Level 3 valuations incorporate certain assumptions and projections that are not observableunobservable in the market and require significant professional judgment in determiningto the fair value assigned to such assets or liabilities. Examples of Level 3 assets and liabilities which may be held by the Account from time to time include investments in real estate, investments in joint ventures, and loans receivable and payable.valuation estimate.
An investment’s categorization within the valuation hierarchy described above is based upon the lowest level of input that is significant to the fair value measurement. The Account’s limited partnershipReal estate fund investments are excluded from the valuation hierarchy, as these investments are fair valued using thetheir net asset value per share as a practical expedient which excludessince market quotations or values from independent pricing services are not readily available. See Note 1—Organization and Significant Accounting Policies for further discussion regarding the investments fromuse of a practical expedient for the valuation hierarchy.of real estate funds.
The Account’s determination of fair value is based upon quoted market prices, where available. If listed prices or quotes are not available, fair value is based upon vendor-provided, evaluated prices or internally developed models that primarily use market-based or independently sourced market data, including interest rate yield curves, market spreads, and currency rates. Valuation adjustments will be made to reflect changes in credit quality, a counterparty’s creditworthiness, the Account’s creditworthiness, liquidity, and other observable and unobservable inputs that are applied consistently over time.
The methods described above are considered to produce fair values that represent a good faithan estimate by management of what an unaffiliated buyer in the marketplace would pay to purchase the asset or would receive to transfer the liability. Since fair value calculations involve significant professional judgment in the application of both observable and unobservable attributes, actual realizable values or future fair values may differ from amounts reported. Furthermore, while the Account believes its valuation methods are appropriate and consistent with other market participants, the use of different methodologies or assumptions to determine the fair value of certain financial instruments, while reasonable, could result in different estimates of fair value at the reporting date. As discussed in Note 1—Organization and Significant
Accounting Policies in more detail, the Account generally obtains independent third party appraisals on a quarterly basis;basis, and there may be circumstances in the interim in which the true realizable value of a property is not reflected in the Account’s daily net asset value calculation or in the Account’s periodic Consolidated Financial Statements. This disparity may be more apparent when the
commercial and/or residential real estate markets experience an overall and possibly dramatic decline (or increase) in property values in a relatively short period of time between appraisals.
The following tables show the major categories of assets and liabilities measured at fair value on a recurring basis as of September 30, 20172020 (unaudited) and December 31, 2016,2019, using unadjusted quoted prices in active markets for identical assets (Level 1); significant other observable inputs (Level 2); and significant unobservable inputs (Level 3); and fair value using the practical expedient (in millions)(millions):
| | | | | | | | | | | | | | | | | | | | | | | | | | | | | | | | |
| Description | | Level 1: Quoted Prices in Active Markets for Identical Assets | | Level 2: Significant Other Observable Inputs | | Level 3: Significant Unobservable Inputs | | Fair Value Using Practical Expedient | | Total at September 30, 2020 |
| Real estate properties | | $ | — | | | $ | — | | | $ | 16,715.0 | | | $ | — | | | $ | 16,715.0 | |
| Real estate joint ventures | | — | | | — | | | 5,993.8 | | | — | | | 5,993.8 | |
| Real estate funds | | — | | | — | | | — | | | 354.2 | | | 354.2 | |
| Marketable securities: | | | | | | | | | | |
| Real estate-related | | 662.2 | | | — | | | — | | | — | | | 662.2 | |
| | | | | | | | | | |
| United States Treasury securities | | — | | | 689.9 | | | — | | | — | | | 689.9 | |
| | | | | | | | | | |
| | | | | | | | | | |
Loans receivable(1) | | — | | | — | | | 1,569.6 | | | — | | | 1,569.6 | |
| Total Investments at September 30, 2020 | | $ | 662.2 | | | $ | 689.9 | | | $ | 24,278.4 | | | $ | 354.2 | | | $ | 25,984.7 | |
| Loans payable | | $ | — | | | $ | — | | | $ | (2,495.7) | | | $ | — | | | $ | (2,495.7) | |
| Line of credit | | $ | — | | | $ | — | | | $ | (91.0) | | | $ | — | | | $ | (91.0) | |
| | | Description | | Level 1: Quoted Prices in Active Markets for Identical Assets | | Level 2: Significant Other Observable Inputs | | Level 3: Significant Unobservable Inputs | | Fair Value Using Practical Expedient | | Total at
September 30, 2017 | Description | | Level 1: Quoted Prices in Active Markets for Identical Assets | | Level 2: Significant Other Observable Inputs | | Level 3: Significant Unobservable Inputs | | Fair Value Using Practical Expedient | | Total at December 31, 2019 |
| Real estate properties | | $ | — |
| | $ | — |
| | $ | 15,654.2 |
| | $ | — |
| | $ | 15,654.2 |
| Real estate properties | | $ | — | | | $ | — | | | $ | 15,835.0 | | | $ | — | | | $ | 15,835.0 | |
| Real estate joint ventures | | — |
| | — |
| | 5,675.4 |
| | — |
| | 5,675.4 |
| Real estate joint ventures | | — | | | — | | | 7,204.2 | | | — | | | 7,204.2 | |
| Limited partnerships | | — |
| | — |
| | — |
| | 140.7 |
| | 140.7 |
| |
| Real estate funds | | Real estate funds | | — | | | — | | | — | | | 311.8 | | | 311.8 | |
| Marketable securities: | | | | | | | | | | | Marketable securities: | |
| Real estate-related | | 1,121.0 |
| | — |
| | — |
| | — |
| | 1,121.0 |
| Real estate-related | | 825.7 | | | — | | | — | | | — | | | 825.7 | |
| Government agency notes | | — |
| | 3,276.1 |
| | — |
| | — |
| | 3,276.1 |
| Government agency notes | | — | | | 259.6 | | | — | | | — | | | 259.6 | |
| United States Treasury securities | | — |
| | 1,017.3 |
| | — |
| | — |
| | 1,017.3 |
| United States Treasury securities | | — | | | 2,589.1 | | | — | | | — | | | 2,589.1 | |
| Loans receivable | | — |
| | — |
| | 298.8 |
| | — |
| | 298.8 |
| |
Total Investments at
September 30, 2017 | | $ | 1,121.0 |
| | $ | 4,293.4 |
| | $ | 21,628.4 |
| | $ | 140.7 |
| | $ | 27,183.5 |
| |
| Mortgage loans payable | | $ | — |
| | $ | — |
| | $ | (2,311.0 | ) | | $ | — |
| | $ | (2,311.0 | ) | |
| Corporate bonds | | Corporate bonds | | — | | | 1,268.3 | | | — | | | — | | | 1,268.3 | |
| Municipal bonds | | Municipal bonds | | — | | | 33.2 | | | — | | | — | | | 33.2 | |
Loans receivable(1) | | Loans receivable(1) | | — | | | — | | | 1,572.1 | | | — | | | 1,572.1 | |
| Total Investments at December 31, 2019 | | Total Investments at December 31, 2019 | | $ | 825.7 | | | $ | 4,150.2 | | | $ | 24,611.3 | | | $ | 311.8 | | | $ | 29,899.0 | |
| Loans payable | | Loans payable | | $ | — | | | $ | — | | | $ | (2,365.0) | | | $ | — | | | $ | (2,365.0) | |
| Line of credit | | Line of credit | | $ | — | | | $ | — | | | $ | (250.0) | | | $ | — | | | $ | (250.0) | |
(1) Amount shown is reflective of loans receivable and loans receivable with related parties.
|
| | | | | | | | | | | | | | | | | | | | |
| Description | | Level 1: Quoted Prices in Active Markets for Identical Assets | | Level 2: Significant Other Observable Inputs | | Level 3: Significant Unobservable Inputs | | Fair Value Using Practical Expedient | | Total at December 31, 2016 |
| Real estate properties | | $ | — |
| | $ | — |
| | $ | 15,452.8 |
| | $ | — |
| | $ | 15,452.8 |
|
| Real estate joint ventures | | — |
| | — |
| | 5,622.4 |
| | — |
| | 5,622.4 |
|
| Limited partnerships | | — |
| | — |
| | — |
| | 137.5 |
| | 137.5 |
|
| Marketable securities: | | | | | | | | | | |
| Real estate-related | | 1,081.5 |
| | — |
| | — |
| | — |
| | 1,081.5 |
|
| Government agency notes | | — |
| | 2,308.9 |
| | — |
| | — |
| | 2,308.9 |
|
| United States Treasury securities | | — |
| | 1,744.9 |
| | — |
| | — |
| | 1,744.9 |
|
| Loans receivable | | — |
| | — |
| | 295.7 |
| | — |
| | 295.7 |
|
| Total Investments at December 31, 2016 | | $ | 1,081.5 |
| | $ | 4,053.8 |
| | $ | 21,370.9 |
| | $ | 137.5 |
| | $ | 26,643.7 |
|
| Mortgage loans payable | | $ | — |
| | $ | — |
| | $ | (2,332.1 | ) | | $ | — |
| | $ | (2,332.1 | ) |
The following tables show the reconciliation of the beginning and ending balances for assets and liabilities measured at fair value on a recurring basis using significant unobservable inputs (Level 3) during the three and nine months ended September 30, 20172020 and 2016 (in millions,2019 (millions, unaudited):
| | | | | | | | | | | | | | | | | | | | | | | | | | | | | | | | | | | | | | |
| | Real Estate
Properties | | Real Estate
Joint Ventures | | Loans
Receivable(3) | | Total
Level 3
Investments | | Loans
Payable | | Line of Credit |
| For the three months ended September 30, 2020 | | | | | | | | | | | | |
| Beginning balance July 1, 2020 | | $ | 16,748.6 | | | $ | 6,024.6 | | | $ | 1,578.2 | | | $ | 24,351.4 | | | $ | (2,457.0) | | | $ | (291.0) | |
| Total realized and unrealized losses included in changes in net assets | | (92.1) | | | (45.6) | | | (8.8) | | | (146.5) | | | (42.4) | | | — | |
Purchases(1) | | 55.4 | | | 15.0 | | | 3.5 | | | 73.9 | | | — | | | — | |
Sales(4) | | 3.1 | | | — | | | — | | | 3.1 | | | — | | | — | |
Settlements(2) | | — | | | (0.2) | | | (3.3) | | | (3.5) | | | 3.7 | | | 200.0 | |
| Ending balance September 30, 2020 | | $ | 16,715.0 | | | $ | 5,993.8 | | | $ | 1,569.6 | | | $ | 24,278.4 | | | $ | (2,495.7) | | | $ | (91.0) | |
| | | | | | | | | | | | | | | | | | | | | | | | | | | | | | | | | | | | | | |
| | Real Estate
Properties | | Real Estate
Joint Ventures | | Loans
Receivable(3) | | Total
Level 3
Investments | | Loans
Payable | | Line of Credit |
| For the nine months ended September 30, 2020 | | | | | | | | | | | | |
| Beginning balance January 1, 2020 | | $ | 15,835.0 | | | $ | 7,204.2 | | | $ | 1,572.1 | | | $ | 24,611.3 | | | $ | (2,365.0) | | | $ | (250.0) | |
| Total realized and unrealized losses included in changes in net assets | | (334.0) | | | (422.1) | | | (32.6) | | | (788.7) | | | (6.1) | | | — | |
Purchases(1) | | 1,564.3 | | | 57.0 | | | 114.8 | | | 1,736.1 | | | (289.6) | | | (540.0) | |
| Sales | | (350.3) | | | — | | | (64.7) | | | (415.0) | | | — | | | — | |
Settlements(2) | | — | | | (845.3) | | | (20.0) | | | (865.3) | | | 165.0 | | | 699.0 | |
| Ending balance September 30, 2020 | | $ | 16,715.0 | | | $ | 5,993.8 | | | $ | 1,569.6 | | | $ | 24,278.4 | | | $ | (2,495.7) | | | $ | (91.0) | |
| | | | | | | | | | | | | | | | | | | | | | | | | | | | | | | | | | | | | | |
| | Real Estate
Properties | | Real Estate
Joint Ventures | | Loans
Receivable(3) | | Total
Level 3
Investments | |
Loans
Payable | | Line of Credit |
| For the three months ended September 30, 2019 | | | | | | | | | | | | |
| Beginning balance July 1, 2019 | | $ | 16,471.9 | | | $ | 6,720.3 | | | $ | 1,105.1 | | | $ | 24,297.3 | | | $ | (2,774.7) | | | $ | — | |
| Total realized and unrealized gains (losses) included in changes in net assets | | 216.8 | | | (131.5) | | | (1.4) | | | 83.9 | | | (32.1) | | | — | |
Purchases(1) | | 126.3 | | | 366.9 | | | 207.2 | | | 700.4 | | | (47.5) | | | — | |
| Sales | | (1,095.3) | | | — | | | — | | | (1,095.3) | | | — | | | — | |
Settlements(2) | | — | | | (0.5) | | | (3.0) | | | (3.5) | | | 565.8 | | | — | |
| Ending balance September 30, 2019 | | $ | 15,719.7 | | | $ | 6,955.2 | | | $ | 1,307.9 | | | $ | 23,982.8 | | | $ | (2,288.5) | | | $ | — | |
| | | | | | | | | | | | | | Real Estate
Properties | | Real Estate
Joint Ventures | | Loans
Receivable(3) | | Total
Level 3
Investments | |
Loans
Payable | | Line of Credit |
| | | Real Estate
Properties | | Real Estate
Joint Ventures | | Loans
Receivable | | Total
Level 3
Investments | | Mortgage
Loans
Payable | |
| For the three months ended September 30, 2017 | | | | | | | | | | | |
| Beginning balance July 1, 2017 | | $ | 15,496.6 |
| | $ | 5,946.8 |
| | $ | 297.3 |
| | $ | 21,740.7 |
| | $ | (2,290.1 | ) | |
| For the nine months ended September 30, 2019 | | For the nine months ended September 30, 2019 | | | | | | | | | | |
| Beginning balance January 1, 2019 | | Beginning balance January 1, 2019 | | $ | 15,531.1 | | | $ | 6,356.6 | | | $ | 913.0 | | | $ | 22,800.7 | | | $ | (2,608.0) | | | $ | — | |
| Total realized and unrealized gains (losses) included in changes in net assets | | 65.8 |
| | 17.6 |
| | 1.4 |
| | 84.8 |
| | (4.1 | ) | Total realized and unrealized gains (losses) included in changes in net assets | | 461.0 | | | (145.1) | | | (4.2) | | | 311.7 | | | (98.4) | | | — | |
Purchases(1) | | 317.1 |
| | 13.1 |
| | 0.1 |
| | 330.3 |
| | (17.7 | ) | Purchases(1) | | 826.0 | | | 750.8 | | | 426.2 | | | 2,003.0 | | | (157.5) | | | — | |
| Sales | | (225.3 | ) | | — |
| | — |
| | (225.3 | ) | | — |
| Sales | | (1,098.4) | | | — | | | — | | | (1,098.4) | | | — | | | — | |
Settlements(2) | | — |
| | (302.1 | ) | | — |
| | (302.1 | ) | | 0.9 |
| Settlements(2) | | — | | | (7.1) | | | (27.1) | | | (34.2) | | | 575.4 | | | — | |
| Ending balance September 30, 2017 | | $ | 15,654.2 |
| | $ | 5,675.4 |
| | $ | 298.8 |
| | $ | 21,628.4 |
| | $ | (2,311.0 | ) | |
| Ending balance September 30, 2019 | | Ending balance September 30, 2019 | | $ | 15,719.7 | | | $ | 6,955.2 | | | $ | 1,307.9 | | | $ | 23,982.8 | | | $ | (2,288.5) | | | $ | — | |
(1)Includes purchases, contributions for joint ventures, capital expenditures, lending for loans receivable and assumption of loans payable.
(2)Includes operating income for real estate joint ventures net of distributions, principal payments and payoffs of loans receivable, and principal payments and extinguishment of loans payable.
(3)Amount shown is reflective of loans receivable and loans receivable with related parties.
(4)Amount shown is inclusive of post closing realized losses.
|
| | | | | | | | | | | | | | | | | | | | |
| | | Real Estate
Properties | | Real Estate
Joint Ventures | | Loans
Receivable | | Total
Level 3
Investments | | Mortgage
Loans
Payable |
| For the nine months ended September 30, 2017 | | | | | | | | | | |
| Beginning balance January 1, 2017 | | $ | 15,452.8 |
| | $ | 5,622.4 |
| | $ | 295.7 |
| | $ | 21,370.9 |
| | $ | (2,332.1 | ) |
| Total realized and unrealized gains (losses) included in changes in net assets | | 133.2 |
| | 80.4 |
| | 1.4 |
| | 215.0 |
| | (10.6 | ) |
Purchases(1) | | 408.9 |
| | 275.6 |
| | 1.7 |
| | 686.2 |
| | (17.7 | ) |
| Sales | | (340.7 | ) | | — |
| | — |
| | (340.7 | ) | | — |
|
Settlements(2) | | — |
| | (303.0 | ) | | — |
| | (303.0 | ) | | 49.4 |
|
| Ending balance September 30, 2017 | | $ | 15,654.2 |
| | $ | 5,675.4 |
| | $ | 298.8 |
| | $ | 21,628.4 |
| | $ | (2,311.0 | ) |
|
| | | | | | | | | | | | | | | | | | | | |
| | | Real Estate
Properties | | Real Estate
Joint Ventures | | Loans
Receivable | | Total
Level 3
Investments | | Mortgage
Loans
Payable |
| For the three months ended September 30, 2016 | | | | | | | | | | |
| Beginning balance July 1, 2016 | | $ | 15,131.3 |
| | $ | 4,238.9 |
| | $ | 100.6 |
| | $ | 19,470.8 |
| | $ | (2,383.2 | ) |
| Total realized and unrealized gains (losses) included in changes in net assets | | 53.3 |
| | 23.9 |
| | 0.1 |
| | 77.3 |
| | (29.1 | ) |
Purchases(1) | | 82.1 |
| | 1,043.4 |
| | 69.0 |
| | 1,194.5 |
| | — |
|
| Sales | | (58.0 | ) | | — |
| | — |
| | (58.0 | ) | | — |
|
Settlements(2) | | — |
| | (0.2 | ) | | — |
| | (0.2 | ) | | 34.2 |
|
| Ending balance September 30, 2016 | | $ | 15,208.7 |
| | $ | 5,306.0 |
| | $ | 169.7 |
| | $ | 20,684.4 |
| | $ | (2,378.1 | ) |
|
| | | | | | | | | | | | | | | | | | | | |
| | | Real Estate
Properties | | Real Estate
Joint Ventures | | Loans
Receivable | | Total
Level 3
Investments | | Mortgage
Loans
Payable |
| For the nine months ended September 30, 2016 | | | | | | | | | | |
| Beginning balance January 1, 2016 | | $ | 14,606.2 |
| | $ | 4,068.4 |
| | $ | 100.6 |
| | $ | 18,775.2 |
| | $ | (1,794.4 | ) |
| Total realized and unrealized gains (losses) included in changes in net assets | | 268.7 |
| | 157.4 |
| | 0.1 |
| | 426.2 |
| | (54.8 | ) |
Purchases(1) | | 486.7 |
| | 1,082.1 |
| | 69.0 |
| | 1,637.8 |
| | (563.5 | ) |
| Sales | | (152.9 | ) | | — |
| | — |
| | (152.9 | ) | | — |
|
Settlements(2) | | — |
| | (1.9 | ) | | — |
| | (1.9 | ) | | 34.6 |
|
| Ending balance September 30, 2016 | | $ | 15,208.7 |
| | $ | 5,306.0 |
| | $ | 169.7 |
| | $ | 20,684.4 |
| | $ | (2,378.1 | ) |
| |
(1)
| Includes purchases, contributions for joint ventures, capital expenditures, lending for loans receivable and debt assumed as part of a real estate transaction. |
| |
(2)
| Includes operating income for real estate joint ventures, net of distributions, and principal payments and extinguishment of mortgage loans payable. |
The following table shows quantitative information about unobservable inputs related to the Level 3 fair value measurements as of September 30, 20172020 (unaudited).
|
| | | | | | | | | | | | | |
| Type | Asset Class | Valuation
Technique(s) | Unobservable
Inputs(1) | Range (Weighted Average) |
| Real Estate Properties and Joint Ventures | Office | Income Approach—Discounted Cash Flow | Discount Rate
Terminal Capitalization Rate | 5.5%5.8% - 9.0% (6.7%) 4.0% - 8.3% (5.5%) |
| | Income Approach—Direct Capitalization | Overall Capitalization Rate | 4.0% - 8.0% (6.5%(5.0%)
|
| Industrial | Income Approach—Discounted Cash Flow | Discount Rate
Terminal Capitalization Rate | 5.2% - 9.0% (6.6%) 4.3% - 7.3% (5.5%(5.4%) |
| | Income Approach—Direct Capitalization | Overall Capitalization Rate | 3.8% - 7.0% (4.8%) |
| IndustrialApartment | Income Approach—Discounted Cash Flow | Discount Rate
Terminal Capitalization Rate | 5.5%5.3% - 8.5% (6.6%7.8% (6.4%)
4.8% 4.3% - 8.3% (5.5%6.8% (5.1%) |
| | Income Approach—Direct Capitalization | Overall Capitalization Rate | 4.0%3.8% - 7.5% (4.9%6.0% (4.6%) |
| ApartmentRetail | Income Approach—Discounted Cash Flow | Discount Rate
Terminal Capitalization Rate | 5.3% - 11.8% (6.8%) 5.0% - 8.0% (6.1%9.4% (5.6%)
3.5% - 6.5% (4.8%) |
| | Income Approach—Direct Capitalization | Overall Capitalization Rate | 3.3%4.0% - 6.0% (4.3%11.5% (5.1%) |
| RetailHotel | Income Approach—Discounted Cash Flow | Discount Rate
Terminal Capitalization Rate | 5.0% - 10.4% (6.4%10.3% (10.3%)
4.3% - 8.8% (5.2% 7.8% (7.8%) |
| | Income Approach—Direct Capitalization | Overall Capitalization Rate | 3.9% - 8.8% (4.6%7.5% (7.5%) |
Mortgage Loans Payable | Office and Industrial | Discounted Cash Flow | Loan to Value Ratio
Equivalency Rate | 38.0%34.5% - 70.0% (44.0%55.4% (45.1%)
3.3% 2.4% - 5.2% (3.7%3.4% (3.0%) |
| | Net Present Value | Loan to Value Ratio
Weighted Average Cost of Capital Risk
Premium Multiple | 38.0%34.5% - 70.0% (44.0%55.4% (45.1%)
1.2 - 1.61.4 (1.3) |
| ApartmentIndustrial | Discounted Cash Flow | Loan to Value Ratio
Equivalency Rate | 28.1%31.4% - 65.6% (41.2%59.2% (52.9%)
2.8% 3.5% - 3.6% (3.2%4.3% (3.6%) |
| | Net Present Value | Loan to Value Ratio
Weighted Average Cost of Capital Risk
Premium Multiple | 28.1%31.4% - 65.6% (41.2%59.2% (52.9%)
1.1 1.2 - 1.5 (1.3)(1.4) |
| RetailApartment | Discounted Cash Flow | Loan to Value Ratio
Equivalency Rate | 18.0%29.8% - 56.2% (32.9%68.7% (47.9%)
2.8% 2.6% - 4.3% (3.6%3.4% (3.0%) |
| | Net Present Value | Loan to Value Ratio
Weighted Average Cost of Capital Risk
Premium Multiple | 18.0%29.8% - 56.2% (32.9%68.7% (47.9%)
1.1 1.2 - 1.6 (1.4) |
| Retail | Discounted Cash Flow | Loan to Value Ratio
Equivalency Rate | 42.0% - 65.1% (46.5%) 2.8% - 3.9% (3.1%) |
| | Net Present Value | Loan to Value Ratio
Weighted Average Cost of Capital Risk Premium Multiple | 42.0% - 65.1% (46.5%) 1.3- 1.6 (1.3) |
| Loans Receivable, including those with related parties | Office | Discounted Cash Flow | Loan to Value Ratio
Equivalency Rate | 49.5% - 91.8% (74.6%) 3.5% - 9.5% (6.4%) |
| Industrial | Discounted Cash Flow | Loan to Value Ratio
Equivalency Rate | 31.2% - 90.2% (61.8%) 4.3% - 12.4% (8.1%) |
| Apartment | Discounted Cash Flow | Loan to Value Ratio
Equivalency Rate | 47.5% - 74.7% (63.5%) 3.2% - 7.0% (4.9%) |
| Retail & Hospitality | Discounted Cash Flow | Loan to Value Ratio
Equivalency Rate | 52.8% - 93.0% (84.7%) 5.3% - 9.3% (6.0%) |
The following table shows quantitative information about unobservable inputs related to the Level 3 fair value measurements as of September 30, 2019 (unaudited).
| | | | | | | | | | | | | | |
| Type | Asset Class | Valuation
Technique(s) | Unobservable Inputs(1) | Range (Weighted Average) |
| Real Estate Properties and Joint Ventures | Office | Income Approach—Discounted Cash Flow | Discount Rate
Terminal Capitalization Rate | 5.5% - 8.5% (6.6%) 4.0% - 7.5% (5.5%) |
| | Income Approach—Direct Capitalization | Overall Capitalization Rate | 3.9% - 7.0% (5.0%) |
| Industrial | Income Approach—Discounted Cash Flow | Discount Rate
Terminal Capitalization Rate | 5.3% - 9.3% (6.7%) 4.3% - 8.3% (5.4%) |
| | Income Approach—Direct Capitalization | Overall Capitalization Rate | 3.9% - 7.8% (4.9%) |
| Apartment | Income Approach—Discounted Cash Flow | Discount Rate
Terminal Capitalization Rate | 5.3% - 7.8% (6.5%) 4.3% - 6.8% (5.1%) |
| | Income Approach—Direct Capitalization | Overall Capitalization Rate | 3.8% - 6.0% (4.6%) |
| Retail | Income Approach—Discounted Cash Flow | Discount Rate
Terminal Capitalization Rate | 5.0% - 11.7% (6.6%) 4.3% - 9.2% (5.4%) |
| | Income Approach—Direct Capitalization | Overall Capitalization Rate | 3.3% - 11.0% (4.9%) |
| Loans Payable | Office and Industrial | Discounted Cash Flow | Loan to Value Ratio
Equivalency Rate | 31.6% - 59.9% (46.6%) 3.2% - 4.4% (3.6%) |
| | Net Present Value | Loan to Value Ratio
Weighted Average Cost of Capital Risk
Premium Multiple | 31.6% - 59.9% (46.6%) 1.2 - 1.4 (1.2)(1.3) |
| Apartment | Discounted Cash Flow | Loan to Value Ratio
Equivalency Rate | 30.5% - 61.2% (47.3%) 3.2% - 3.6% (3.4%) |
| | Net Present Value | Loan to Value Ratio
Weighted Average Cost of Capital Risk
Premium Multiple | 30.5% - 61.2% (47.3%) 1.2 - 1.5 (1.3) |
| Retail | Discounted Cash Flow | Loan to Value Ratio
Equivalency Rate | 32.1% - 63.3% (40.9%) 3.2% - 4.4% (3.6%) |
| | Net Present Value | Loan to Value Ratio
Weighted Average Cost of Capital Risk
Premium Multiple | 32.1% - 63.3% (40.9%) 1.2 - 1.5 (1.3) |
| Loans Receivable | Apartment, Industrial, Office, Retail and Storage | Discounted Cash Flow | Loan to Value Ratio
Equivalency Rate | 60.1%49.7% - 74.5% (73.9%86.2% (75.6%)
4.2% 3.6% - 8.3% (6.2%8.7% (6.8%) |
(1) Equivalency Rate is defined as the prevailing market interest rate used to discount the contractual loan payments.
Real Estate Properties and Joint Ventures: The significant unobservable inputs used in the fair value measurement of the Account’s real estate property and joint venture investments are the selection of certain investment rates (Discount Rate, Terminal Capitalization Rate, and Overall Capitalization Rate). Significant increases (decreases) in any of those inputs in isolation would result in significantly lower (higher) fair value measurements, respectively.
Mortgage Loans Payable: The significant unobservable inputs used in the fair value measurement of the Account’s mortgage loans payable are the loan to value ratios and the selection of certain credit spreads and weighted average cost of capital risk premiums. Significant increases (decreases) in any of those inputs in isolation would result in a significantly lower (higher) fair value, respectively.
Loans Receivable: The significant unobservable inputs used in the fair value measurement of the Account’s loans receivable are the loan to value ratios and the selection of certain credit spreads. Significant increases (decreases) in any of those inputs in isolation would result in a significantly lower (higher) fair value, respectively.
During the nine months ended September 30, 20172020 and 2016,2019, there were no transfers between Levels 1, 2 or 3.
The amount of total net unrealized gains (losses) included in changes in net assets attributable to the change in net unrealized gains (losses) relating to Level 3 investments and mortgage loans payable using significant unobservable inputs still held as of the reporting date is as follows (in millions,(millions, unaudited):
| | | | | | | | | | | | | | | | | | | | | | | | | | | | | |
| Real Estate
Properties | | Real Estate
Joint
Ventures | | Loans Receivable(1) | | Total
Level 3
Investments | |
Loans
Payable |
| For the three months ended September 30, 2020 | $ | (89.1) | | | $ | (10.0) | | | $ | (8.8) | | | $ | (107.9) | | | $ | (42.4) | |
| For the nine months ended September 30, 2020 | $ | (322.0) | | | $ | (328.2) | | | $ | (31.0) | | | $ | (681.2) | | | $ | (6.1) | |
| For the three months ended September 30, 2019 | $ | 183.9 | | | $ | (131.6) | | | $ | (1.4) | | | $ | 50.9 | | | $ | (16.7) | |
| For the nine months ended September 30, 2019 | $ | 428.1 | | | $ | (143.8) | | | $ | (4.2) | | | $ | 280.1 | | | $ | (83.0) | |
|
| | | | | | | | | | | | | | | | | | | |
| | Real Estate Properties | | Real Estate Joint Ventures | | Loans Receivable | | Total Level 3 Investments | | Mortgage Loans Payable |
| For the three months ended September 30, 2017 | $ | 68.0 |
| | $ | 17.9 |
| | $ | 1.4 |
| | $ | 87.3 |
| | $ | (4.1 | ) |
| For the nine months ended September 30, 2017 | $ | 139.0 |
| | $ | 80.7 |
| | $ | 1.4 |
| | $ | 221.1 |
| | $ | (10.6 | ) |
| For the three months ended September 30, 2016 | $ | 53.9 |
| | $ | 23.7 |
| | $ | 0.1 |
| | $ | 77.7 |
| | $ | (29.1 | ) |
| For the nine months ended September 30, 2016 | $ | 270.1 |
| | $ | 157.2 |
| | $ | 0.1 |
| | $ | 427.4 |
| | $ | (54.8 | ) |
As of September 30, 2017, two of the limited partnership investments were in dissolution. Colony Realty Partners LP began liquidation in May 2014, with final dissolution anticipated during 2017. Lion Gables Apartment Fund began liquidation in February 2015 and has sold all of the Fund’s assets. Final dissolution of the entity is anticipated during 2017.
Transwestern Mezzanine Realty Partners III, LLC (“Transwestern”) may engage in liquidation activities in 2017 based on the terms of its partnership agreement. The Account may elect to sell or transfer its ownership units by giving notice and acquiring consent from the management committee of Transwestern, which requires approval by a majority of the members. Redemption of the Account’s interest in Transwestern prior to liquidation is prohibited, unless a supermajority of the members approves the redemption request.
Clarion Gables Multi-Family Trust LP allows redemptions with an advanced notice of three months or more. Redemptions are funded using the partnership’s available cash, which may not immediately be in excess of the redemption amount, and may not be sufficient to fund the redemption amount for several months. The general partner has sole discretion in identifying how much cash is available to process redemptions. The partnership allows the Account to sell its interest in the partnership, subject to the consent and approval of the general partner.
Taconic New York City GP Fund, LP prohibits redemptions in the partnership prior to liquidation. Liquidation of the partnership is estimated to begin no earlier than 2024. The partnership allows the Account to sell its interest in the partnership, subject to the consent and approval of the general partner.
Note 5—6—Investments in Joint Ventures
The Account owns interests in several real estate properties through joint ventures and receives distributions and allocations of profits and losses from the joint ventures based on the Account’s ownership interest in those investments. Several of these joint ventures have mortgage loans payable collateralized by the properties owned by the aforementioned joint ventures. At September 30, 2017,2020, the Account held investments in joint ventures with ownership interest percentages that ranged from 33.3% to 97.5%98.0%. Certain joint ventures are subject to adjusted distribution percentages when earnings in the investment reach a pre-determinedpredetermined threshold. The fair value of the Account’s equity interest in these joint ventures was $5.7 billion and $5.6 billion at September 30, 2017 and December 31, 2016, respectively.
A condensed summary of the results of operations of the joint ventures are shown below (millions, unaudited):
| | | | | | | | | | | | | | | | | | | | | | | |
| | For the Three Months Ended September 30, | | For the Nine Months Ended September 30, |
| 2020 | | 2019 | | 2020 | | 2019 |
| Operating Revenue and Expenses | | | | | | | |
| Revenues | $ | 246.6 | | | $ | 287.7 | | | $ | 782.9 | | | $ | 825.6 | |
| Expenses | 134.8 | | | 151.7 | | | 434.7 | | | 446.4 | |
| Excess of revenues over expenses | $ | 111.8 | | | $ | 136.0 | | | $ | 348.2 | | | $ | 379.2 | |
Note 7—Investments in Real Estate Funds
The Account has ownership interests in real estate funds (each a "Fund", and collectively the "Funds"). The Funds are setup as limited partnerships or entities similar to a limited partnership, and as such, meet the definition of a VIE as the limited partners collectively lack the power, through voting or similar rights, to direct the activities of the Fund that most significantly impact the Fund's economic performance. Management has determined that the Account is not the primary beneficiary for any of the Funds, as the Account lacks the power to direct the activities of each Fund that most significantly impact the respective Fund's economic performance, and the Account further lacks substantive kick-out rights to remove the entity with these powers. Refer to Note 1—Organization and Significant Accounting Policies for a description of the methodology used to determine the primary beneficiary of a VIE.
No financial support (such as loans or financial guarantees) was provided to the Funds during the three and nine months ended September 30, 2020. The Account is contractually obligated to make additional capital contributions in certain Funds in future years. These commitments are identified in Note 13—Commitments and Contingencies.
The carrying amount and maximum exposure to loss relating to unconsolidated VIEs in which the Company holds a variable interest but is not the primary beneficiary were as follows at September 30, 2020 (in millions, unaudited):
| | | | | | | | | | | | | | | | | | | | | | | |
| Fund Name | Carrying Amount | | Maximum Exposure to Loss | | Liquidity Provisions | | Investment Strategy |
| LCS SHIP Venture I, LLC (90.0% Account Interest) | $ | 184.5 | | | $ | 184.5 | | | Redemptions prohibited prior to liquidation. | | To invest in senior housing properties. |
| | | | | Liquidation estimated to begin no earlier than 2025. | |
| | | | | The Account is permitted to sell or transfer its interest in the fund, subject to consent and approval of the manager. | |
| SP V - II, LLC (61.8% Account Interest) | $ | 26.5 | | | $ | 26.5 | | | Redemptions prohibited prior to liquidation. | | To invest in medical office properties in the U.S. |
| | | | | Liquidation estimated to begin no earlier than 2022. | |
| | | | | The Account is permitted to sell or transfer its interest in the fund, subject to consent and approval of the manager. | |
| Taconic New York City GP Fund, LP (60.0% Account Interest) | $ | 31.7 | | | $ | 31.7 | | | Redemptions prohibited prior to liquidation. | | To invest in real estate and real estate-related assets in the New York City metropolitan statistical area ("MSA"). |
| | | | | Liquidation estimated to begin no earlier than 2024. | |
| | | | | The Account is permitted to sell its interest in the fund, subject to consent and approval of the general partner. | |
| Veritas - Trophy VI, LLC (90.4% Account Interest) | $ | 45.1 | | | $ | 45.1 | | | Redemptions prohibited prior to liquidation. | | To invest in multi-family properties primarily in the San Francisco Bay and Los Angeles MSA. |
| | | | | The Account is not permitted to sell or transfer its interest in the fund until August 2022. After this date, the Account can sell or transfer its interest in the fund with the consent and approval of the manager. | |
| | | | | |
| IDR - Core Property Index Fund, LLC (1.9% Account Interest) | $ | 24.7 | | | $ | 24.7 | | | Redemptions are permitted for a full calendar quarter and upon at least 90 days prior written notice, subject to fund availability. | | To invest primarily in open-ended funds that fall within the NFI-ODCE Index and are actively managed. |
| | | | | |
| | | | | The Account is permitted to sell its interest in the fund, subject to consent and approval of the manager. | |
| Townsend Group Value-Add Fund (99.0% Account Interest) | $ | 6.2 | | | $ | 6.2 | | | Redemptions prohibited prior to liquidation. | | To invest in value-add real estate investment opportunities in the U.S. market. |
| | | | | Liquidation estimated to begin no earlier than 2027. | |
| | | | | The Account is prohibited from transferring its interest in the fund without consent by the general partner, which can be withheld in their sole discretion | |
| Silverpeak - REA Alt Inv Fund LP (90.0% Account Interest) | $ | 14.0 | | | $ | 14.0 | | | Redemptions prohibited prior to liquidation. | | To invest in alternative real estate investments primarily in major U.S. metropolitan markets. |
| | | | | Liquidation estimated to begin no earlier than 2028. | |
| | | | | The Account is permitted to sell its interest in the fund to qualified institutional investors, subject to consent and approval of the manager. | |
| Grubb Southeast Real Estate Fund VI, LLC (66.7% Account Interest) | $ | 16.5 | | | $ | 16.5 | | | Redemptions prohibited prior to liquidation. | | To acquire office investments across the Southeast.
|
| | | | | Liquidation estimated to begin no earlier than 2026. | |
| | | | | The Account is not permitted to sell or transfer its interest in the fund until June 2021. After this date, the Account can sell or transfer its interest in the fund with the consent and approval of the manager. | |
|
| | | | | | | | | | | | | | | |
| | For the Three Months Ended September 30, | | For the Nine Months Ended September 30, |
| | 2017 | | 2016 | | 2017 | | 2016 |
| Operating Revenue and Expenses | | |
| | | | |
| Revenues | $ | 218.0 |
| | $ | 190.5 |
| | $ | 645.0 |
| | $ | 509.4 |
|
| Expenses | 108.3 |
| | 94.6 |
| | 315.0 |
| | 259.5 |
|
| Excess of revenues over expenses | $ | 109.7 |
| | $ | 95.9 |
| | $ | 330.0 |
| | $ | 249.9 |
|
| | | | | | | | | | | | | | | | | | | | | | | |
| Fund Name | Carrying Amount | | Maximum Exposure to Loss | | Liquidity Provisions | | Investment Strategy |
| JCR Capital - REA Preferred Equity Parallel Fund (49.2% Account Interest) | $ | 5.0 | | | $ | 5.0 | | | Redemptions prohibited prior to liquidation. | | To invest primarily in multi-family properties. |
| | | | | Liquidation estimated to begin no earlier than 2026. | |
| | | | | The Account is prohibited from transferring its interest in the fund without consent by the general partner, which can be withheld in their sole discretion | |
| | | | | |
| Total | $ | 354.2 | | | $ | 354.2 | | | | | |
Note 6—Mortgage 8—Loans Receivable
The Account’s loan receivable portfolio is primarily comprised of mezzanine loans secured by the borrower’s direct and indirect interests in commercial real estate. Mezzanine loans are subordinate to first mortgages on the underlying real estate collateral. The following property types represent the underlying real estate collateral for the Account's mezzanine loans (in millions):
| | | | | | | | | | | | | | | | | | | | | | | | | | | | | | | | | | | | | | |
| | September 30, 2020 | | December 31, 2019 |
| | (Unaudited) | | | | | | |
| | Principal Outstanding | | Fair Value | | % of Fair Value | | Principal Outstanding | | Fair Value | | % of Fair Value |
Office(1) | | $ | 791.3 | | | $ | 777.5 | | | 49.6 | % | | $ | 769.3 | | | $ | 768.0 | | | 48.8 | % |
| Industrial | | 195.4 | | | 195.4 | | | 12.4 | % | | 199.6 | | | 199.6 | | | 12.7 | % |
| Retail | | 136.1 | | | 133.7 | | | 8.5 | % | | 158.5 | | | 158.5 | | | 10.1 | % |
| Storage | | 82.0 | | | 73.8 | | | 4.7 | % | | 82.0 | | | 82.0 | | | 5.2 | % |
Apartments(1) | | 262.2 | | | 259.3 | | | 16.5 | % | | 229.1 | | | 228.8 | | | 14.6 | % |
| Hotel | | 135.3 | | | 129.9 | | | 8.3 | % | | 135.3 | | | 135.2 | | | 8.6 | % |
| | $ | 1,602.3 | | | $ | 1,569.6 | | | 100.0 | % | | $ | 1,573.8 | | | $ | 1,572.1 | | | 100.0 | % |
(1) Includes loans receivable with related parties.
The Account monitors the risk profile of the loan receivable portfolio with the assistance of a third-party rating service that models the loans and assigns risk ratings based on inputs such as loan-to-value ratios, yields, credit quality of the borrowers, property types of the collateral, geographic and local market dynamics, physical condition of the collateral, and the underlying structure of the loans. Ratings for loans are updated monthly. Assigned ratings can range from AAA to C, with an AAA designation representing debt with the lowest level of credit risk and C representing a greater risk of default or principal loss. Loans that are more than 90 days past due are classified as delinquent and assigned a D rating. Mezzanine debt in good health is typically reflective of a risk rating in the B range (e.g., BBB, BB, or B), as these ratings reflect borrowers' having adequate financial resources to service their financial commitments, but also acknowledging that adverse economic conditions, should they occur, would likely impede on a borrowers' ability to pay.
All borrowers of loans rated C or higher are current as of September 30, 2020. NaN of the Account's loans are currently in forbearance. The forbearance allows for the deferral of the June, July and August 2020 debt service payments. The deferred payments will be repaid in equal installments over the 12 month period from January 9, 2021 to December 9, 2021, at which time the forbearance period will end. Interest income continues to be accrued during the deferral period so long as future collection of the deferred payments are probable.
The following table presents the fair values of the Account's loan portfolio based on the risk ratings as of September 30, 2020 (in millions, unaudited), listed in order of the strength of the risk rating (from strongest to weakest):
| | | | | | | | | | | | | | | | | | | | | | | | | | | | | | | | | | | | | | |
| | September 30, 2020 | | December 31, 2019 |
| | (Unaudited) | | | | | | |
| | Number of Loans | | Fair Value | | % of Fair Value | | Number of Loans | | Fair Value | | % of Fair Value |
| AA | | 0 | | $ | 0 | | | 0 | % | | 1 | | $ | 48.3 | | | 3.1 | % |
| BBB | | 3 | | 86.6 | | | 5.5 | % | | 7 | | 456.1 | | | 29.0 | % |
| BB | | 15 | | 960.0 | | | 61.2 | % | | 13 | | 787.4 | | | 50.1 | % |
| B | | 4 | | 232.8 | | | 14.8 | % | | 3 | | 205.0 | | | 13.0 | % |
| C | | 2 | | 147.0 | | | 9.4 | % | | 0 | | 0 | | | 0 | % |
| D | | 1 | | 73.8 | | | 4.7 | % | | 0 | | 0 | | | 0 | % |
NR(1) | | 2 | | 69.4 | | | 4.4 | % | | 3 | | 75.3 | | | 4.8 | % |
| | 27 | | $ | 1,569.6 | | | 100.0 | % | | 27 | | $ | 1,572.1 | | | 100.0 | % |
(1) "NR" designates loans not assigned an internal credit rating. As of September 30, 2020 and December 31, 2019, this is comprised of 2 loans with related parties. The loans are collateralized by equity interests in real estate investments.
The following table represents loans receivable in nonaccrual status as of September 30, 2020 (in millions, unaudited). Loans are placed in nonaccrual status when a loan is more than 90 days in arrears or at any point when management believes the full collection of principal is doubtful.
| | | | | | | | | | | | | | | | | | | | |
| Aging | | Number of Loans | | Principal Outstanding | | Fair Value |
| Past Due - 90 Days + | | 1 | | $ | 82.0 | | | $ | 73.8 | |
Note 9—Loans Payable
At September 30, 2017,2020, the Account had outstanding mortgage loans payable secured by the following properties (in millions)assets (millions):
| | | | | | | | | | | | | | | | | | | | | | | | | | |
| Property | | Annual Interest Rate and Payment Frequency(2) | | Principal
Amounts Outstanding as of | | Maturity |
| September 30, 2020 | | December 31, 2019 | |
| | | | (Unaudited) | | | | |
| Red Canyon at Palomino Park | | 5.34% paid monthly | | $ | 0 | | | $ | 27.1 | | | August 1, 2020 |
| Green River at Palomino Park | | 5.34% paid monthly | | 0 | | | 33.2 | | | August 1, 2020 |
| Blue Ridge at Palomino Park | | 5.34% paid monthly | | 0 | | | 33.4 | | | August 1, 2020 |
| Ashford Meadows Apartments | | 5.17% paid monthly | | 0 | | | 44.6 | | | August 1, 2020 |
| The Knoll | | 3.98% paid monthly | | 0 | | | 16.4 | | | December 5, 2020 |
| Ascent at Windward | | 3.51% paid monthly | | 34.6 | | | 34.6 | | | January 1, 2022 |
The Palatine(1) | | 4.25% paid monthly | | 74.8 | | | 75.9 | | | January 10, 2022 |
The Forum at Carlsbad(1) | | 4.25% paid monthly | | 84.4 | | | 85.7 | | | March 1, 2022 |
| Fusion 1560 | | 3.42% paid monthly | | 37.4 | | | 37.4 | | | June 10, 2022 |
San Diego Office Portfolio(4) | | 3.62% paid monthly | | 50.7 | | | 48.2 | | | August 15, 2022 |
The Colorado(1) | | 3.69% paid monthly | | 86.8 | | | 88.1 | | | November 1, 2022 |
The Legacy at Westwood(1) | | 3.69% paid monthly | | 44.2 | | | 44.9 | | | November 1, 2022 |
Regents Court(1) | | 3.69% paid monthly | | 37.5 | | | 38.1 | | | November 1, 2022 |
1001 Pennsylvania Avenue(1) | | 3.70% paid monthly | | 315.9 | | | 320.7 | | | June 1, 2023 |
| Biltmore at Midtown | | 3.94% paid monthly | | 36.4 | | | 36.4 | | | July 5, 2023 |
| Cherry Knoll | | 3.78% paid monthly | | 35.3 | | | 35.3 | | | July 5, 2023 |
| Lofts at SoDo | | 3.94% paid monthly | | 35.1 | | | 35.1 | | | July 5, 2023 |
| Pacific City | | 2.00 + LIBOR paid monthly | | 105.0 | | | 0 | | | October 1, 2023 |
Birkdale Village(1) | | 4.30% paid monthly | | 77.5 | | | 0 | | | April 1, 2024 |
| 1401 H Street, NW | | 3.65% paid monthly | | 115.0 | | | 115.0 | | | November 5, 2024 |
The District at La Frontera(1) | | 3.84% paid monthly | | 38.8 | | | 39.3 | | | December 1, 2024 |
The District at La Frontera(1) | | 4.96% paid monthly | | 4.3 | | | 4.4 | | | December 1, 2024 |
| Circa Green Lake | | 3.71% paid monthly | | 52.0 | | | 52.0 | | | March 5, 2025 |
| Union - South Lake Union | | 3.66% paid monthly | | 57.0 | | | 57.0 | | | March 5, 2025 |
| Holly Street Village | | 3.65% paid monthly | | 81.0 | | | 81.0 | | | May 1, 2025 |
Henley at Kingstowne(1) | | 3.60% paid monthly | | 70.6 | | | 71.0 | | | May 1, 2025 |
| 32 South State Street | | 4.48% paid monthly | | 24.0 | | | 24.0 | | | June 6, 2025 |
Vista Station Office Portfolio(1) | | 4.00% paid monthly | | 20.1 | | | 20.5 | | | July 1, 2025 |
| 780 Third Avenue | | 3.55% paid monthly | | 150.0 | | | 150.0 | | | August 1, 2025 |
| 780 Third Avenue | | 3.55% paid monthly | | 20.0 | | | 20.0 | | | August 1, 2025 |
Vista Station Office Portfolio(1) | | 4.20% paid monthly | | 44.0 | | | 44.7 | | | November 1, 2025 |
| 701 Brickell Avenue | | 3.66% paid monthly | | 184.0 | | | 184.0 | | | April 1, 2026 |
| Marketplace at Mill Creek | | 3.82% paid monthly | | 39.6 | | | 0 | | | September 11, 2027 |
| Overlook At King Of Prussia | | 3.82% paid monthly | | 40.8 | | | 0 | | | September 11, 2027 |
| Winslow Bay Commons | | 3.82% paid monthly | | 25.8 | | | 0 | | | September 11, 2027 |
| 1900 K Street, NW | | 3.93% paid monthly | | 163.0 | | | 163.0 | | | April 1, 2028 |
| 99 High Street | | 3.90% paid monthly | | 277.0 | | | 277.0 | | | March 1, 2030 |
| Total Principal Outstanding | | | | $ | 2,462.6 | | | $ | 2,338.0 | | | |
Fair Value Adjustment(3) | | | | 33.1 | | | 27.0 | | | |
| Total Loans Payable | | | | $ | 2,495.7 | | | $ | 2,365.0 | | | |
(1)The mortgage is adjusted monthly for principal payments.
(2)All interest rates are fixed except for Pacific City, which has a variable interest rate based on a spread above the one month London Interbank Offered Rate, as published by ICE Benchmark Administration Limited. Some mortgages held by the Account are structured to begin principal and interest payments after an initial interest only period.
(3)The fair value adjustment consists of the difference (positive or negative) between the principal amount of the outstanding debt and the fair value of the outstanding debt. See Note 1—Organization and Significant Accounting Policies.
(4)The loan is collateralized by a mezzanine loan receivable. The mezzanine loan receivable is collateralized by the property reflected within the table above.
|
| | | | | | | | | | | | |
| Property | | Annual Interest Rate and
Payment Frequency(2) | | Principal
Amounts Outstanding as of | | Maturity |
| September 30, 2017 | | December 31, 2016 | |
| | | | | (Unaudited) | | | | |
The Legend at Kierland(4) (5) | | 4.97% paid monthly | | $ | — |
| | $ | 21.8 |
| | August 1, 2017 |
The Tradition at Kierland(4) (5) | | 4.97% paid monthly | | — |
| | 25.8 |
| | August 1, 2017 |
Mass Court(4) | | 2.88% paid monthly | | 92.6 |
| | 92.6 |
| | September 1, 2019 |
Red Canyon at Palomino Park(4) (6) | | 5.34% paid monthly | | 27.1 |
| | 27.1 |
| | August 1, 2020 |
Green River at Palomino Park(4) (6) | | 5.34% paid monthly | | 33.2 |
| | 33.2 |
| | August 1, 2020 |
Blue Ridge at Palomino Park(4) (6) | | 5.34% paid monthly | | 33.4 |
| | 33.4 |
| | August 1, 2020 |
Ashford Meadows(4) | | 5.17% paid monthly | | 44.6 |
| | 44.6 |
| | August 1, 2020 |
The Knoll(1) (4) | | 3.98% paid monthly | | 17.6 |
| | — |
| | December 5, 2020 |
The Corner(4) | | 4.66% paid monthly | | 105.0 |
| | 105.0 |
| | June 1, 2021 |
The Palatine(1) (4) | | 4.25% paid monthly | | 79.1 |
| | 80.0 |
| | January 10, 2022 |
The Forum at Carlsbad(1) (4) | | 4.25% paid monthly | | 89.2 |
| | 90.0 |
| | March 1, 2022 |
The Colorado(4) | | 3.69% paid monthly | | 91.7 |
| | 91.7 |
| | November 1, 2022 |
The Legacy at Westwood(4) | | 3.69% paid monthly | | 46.7 |
| | 46.7 |
| | November 1, 2022 |
Regents Court(4) | | 3.69% paid monthly | | 39.6 |
| | 39.6 |
| | November 1, 2022 |
The Caruth(4) | | 3.69% paid monthly | | 45.0 |
| | 45.0 |
| | November 1, 2022 |
Fourth & Madison(4) | | 3.75% paid monthly | | 200.0 |
| | 200.0 |
| | June 1, 2023 |
| 1001 Pennsylvania Avenue | | 3.70% paid monthly | | 330.0 |
| | 330.0 |
| | June 1, 2023 |
1401 H Street NW(4) | | 3.65% paid monthly | | 115.0 |
| | 115.0 |
| | November 5, 2024 |
32 South State Street(4) | | 4.48% paid monthly | | 24.0 |
| | 24.0 |
| | June 6, 2025 |
780 Third Avenue(4) | | 3.55% paid monthly | | 150.0 |
| | 150.0 |
| | August 1, 2025 |
780 Third Avenue(4) | | 3.55% paid monthly | | 20.0 |
| | 20.0 |
| | August 1, 2025 |
701 Brickell Avenue(4) | | 3.66% paid monthly | | 184.0 |
| | 184.0 |
| | April 1, 2026 |
55 Second Street(4) (7) | | 3.74% paid monthly | | 137.5 |
| | 137.5 |
| | October 1, 2026 |
| 1900 K Street, NW | | 3.93% paid monthly | | 163.0 |
| | 163.0 |
| | April 1, 2028 |
501 Boylston Street(4) | | 3.70% paid monthly | | 216.5 |
| | 216.5 |
| | April 1, 2028 |
| Total Principal Outstanding | | | | $ | 2,284.8 |
| | $ | 2,316.5 |
| | |
Fair Value Adjustment(3) | | | | 26.2 |
| | 15.6 |
| | |
| Total Mortgage Loans Payable | | | | $ | 2,311.0 |
| | $ | 2,332.1 |
| | |
| |
| The mortgage is adjusted monthly for principal payments. |
| |
(2)
| Interest rates are fixed. Some mortgages held by the Account are structured to begin principal and interest payments after an initial interest only period. |
| |
(3)
| The fair value adjustment consists of the difference (positive or negative) between the principal amount of the outstanding debt and the fair value of the outstanding debt. See Note 1—Organization and Significant Accounting Policies.
|
| |
(4)
| These properties are each owned by separate wholly-owned subsidiaries of TIAA for benefit of the Account. |
| |
(5)
| Mortgage loans on the individual properties in the Kierland Apartment Portfolio were paid off on May 1, 2017. |
| |
(6)
| Represents mortgage loans on these individual properties which are held within the Palomino Park portfolio. |
| |
(7)
| This mortgage is comprised of three individual loans, all with equal recourse, interest rate and maturity. The principal balances by loan are $79.0 million, $45.0 million and $13.5 million. |
Note 7—10—Lines of Credit
The Account has 2 unsecured revolving credit agreements (“Lines of Credit”), each with a maximum total commitment of $500.0 million. Draws against the Lines of Credit can take the form of Eurodollar Loans or Alternate Base Rate Loans (“ABR Loans”). Eurodollar Loans and ABR Loans require a minimum funding of $5.0 million.
Eurodollar Loans are issued for a term of twelve months or less and bear interest during the period (“Interest Period”) at a rate equal to the Adjusted London Interbank Offered Rate (“Adjusted LIBOR”) plus a spread (the “Eurodollar Applicable Rate”), with the spread dependent upon the leverage ratio of the Account. Adjusted LIBOR is calculated by multiplying the Statutory Reserve Rate, as determined by the Federal Reserve Board for Eurodollar liabilities, by LIBOR, as determined by the Intercontinental Exchange on the date of issuance that corresponds to the length of the Interest Period. The Account may prepay Eurodollar Loans at any time during the life of the loan without penalty. The Account is limited to 5 active Eurodollar Loans on each Line of Credit; however, the Account may retire and initiate new Eurodollar Loans without restriction so long as the total number of loans in active status does not exceed the limit.
ABR Loans are issued for a specific length of time and bear interest at a rate equal to the highest rate among the following calculations plus a spread (the "ABR Applicable Rate"), with the spread dependent on the leverage ratio of the Account: (i) the Prime Rate on the date of issuance, with the Prime Rate being defined as the rate of interest last quoted by the Wall Street Journal as the Prime Rate; (ii) the Federal Reserve Bank of New York (“NYFRB”) rate as provided by the NYFRB on the date of issuance plus 0.5%; or (iii) the Adjusted LIBOR rate plus 1.0%. The Account may prepay ABR Loans at any time during the life of the loan without penalty.
For the three and nine months ended September 30, 2020, expenses charged to the Account related to the Lines of Credit were $0.7 million and $2.3 million, respectively. As of September 30, 2020, the Account was in compliance with all covenants required by the Lines of Credit.
The following table provides a summary of the key characteristics of the Lines of Credit as of September 30, 2020:
| | | | | | | | | | | | | | | | | | | | | | | | | | |
| | | Line of Credit I | | | Line of Credit II | | |
| Current Balance (in millions) | | $ | 91.0 | | | $ | 0 | | | |
| Maximum Capacity (in millions) | | $ | 500.0 | | | $ | 500.0 | | | |
| | | | | | | | |
| Inception Date | | September 20, 2018 | | August 18, 2020 | | |
| Maturity Date | | September 20, 2021 | | August 16, 2021 | | |
| Extension Option | | Yes | (1) | No | | |
| | | | | | | | |
| Eurodollar Applicable Rate Range | | 0.85% - 1.05% | | 1.60% - 1.80% | |
| ABR Applicable Rate Range | | 0.85% - 1.05% | | 0.60% - 0.80% | |
Unused Fee (2) | | 0.20% per annum | | 0.25% per annum | |
| | | | | | | | |
| (1) | The line of credit expires on September 20, 2021, with an option to extend for 2 consecutive twelve month terms at the Account’s election. The Account may request an additional $250.0 million in commitments from the Lenders at any time; however, this request is subject to approval at the sole discretion of the Lenders and is not a guarantee that an expansion beyond the original $500.0 million commitment will be granted. | |
| |
| (2) | The Account is charged a fee on the unused portion of the Lines of Credit. |
Note 11—Financial Highlights
Selected condensed financial information for an Accumulation Unit of the Account is presented below. Per Accumulation Unit data is calculated on average units outstanding.
| | | | | | | | | | | | | | | | | | | | | | | |
| For the Nine Months Ended September 30, 2020 | | Years Ended December 31, |
| 2019 | | 2018 | | 2017 |
| (Unaudited) | | | | | | |
| Per Accumulation Unit Data: | | | | | | | |
| Rental income | $ | 15.951 | | | $ | 18.165 | | | $ | 17.757 | | | $ | 17.132 | |
| Real estate property level expenses and taxes | 7.533 | | | 8.734 | | | 8.548 | | | 7.722 | |
| Real estate income, net | 8.418 | | | 9.431 | | | 9.209 | | | 9.410 | |
| Other income | 3.742 | | | 6.752 | | | 6.162 | | | 4.762 | |
| Total income | 12.160 | | | 16.183 | | | 15.371 | | | 14.172 | |
Expense charges(1) | 2.556 | | | 3.439 | | | 3.161 | | | 3.318 | |
| Investment income, net | 9.604 | | | 12.744 | | | 12.210 | | | 10.854 | |
| Net realized and unrealized (loss) gain on investments and loans payable | (15.862) | | | 10.262 | | | 6.877 | | | 5.839 | |
| Net (decrease) increase in Accumulation Unit Value | (6.258) | | | 23.006 | | | 19.087 | | | 16.693 | |
| Accumulation Unit Value: | | | | | | | |
| Beginning of period | 440.422 | | | 417.416 | | | 398.329 | | | 381.636 | |
| End of period | $ | 434.164 | | | $ | 440.422 | | | $ | 417.416 | | | $ | 398.329 | |
Total return(3) | (1.42) | % | | 5.51 | % | | 4.79 | % | | 4.37 | % |
Ratios to Average net assets(2): | | | | | | | |
Expenses(1) | 0.77 | % | | 0.78 | % | | 0.76 | % | | 0.83 | % |
| Investment income, net | 2.89 | % | | 2.90 | % | | 2.95 | % | | 2.72 | % |
Portfolio turnover rate(3): | | | | | | | |
Real estate properties(4) | 5.5 | % | | 7.8 | % | | 11.8 | % | | 2.7 | % |
Marketable securities(5) | 91.1 | % | | 28.7 | % | | 5.1 | % | | 5.7 | % |
| Accumulation Units outstanding at end of period (millions) | 52.8 | | | 60.8 | | | 60.7 | | | 61.3 | |
| Net assets end of period (millions) | $ | 23,428.3 | | | $ | 27,307.9 | | | $ | 25,842.6 | | | $ | 24,942.6 | |
(1)Expense charges per Accumulation Unit and the Ratio of Expenses to average net assets reflect the year to date Account level expenses and exclude real estate property level expenses which are included in real estate income, net.
(2)Percentages for the nine months ended September 30, 2020 are annualized.
(3)Percentages for the nine months ended September 30, 2020 are not annualized.
(4)Real estate investment portfolio turnover rate is calculated by dividing the lesser of purchases or sales of real estate property investments (including contributions to, or return of capital distributions received from, existing real estate joint ventures and fund investments) by the average value of the portfolio of real estate investments held during the period.
(5)Marketable securities portfolio turnover rate is calculated by dividing the lesser of purchases or sales of securities, excluding securities having maturity dates at acquisition of one year or less, by the average value of the portfolio securities held during the period.
|
| | | | | | | | | | | | | | | |
| | For the Nine Months Ended September 30, 2017 | | Years Ended December 31, |
| 2016 | | 2015 | | 2014 |
| | (Unaudited) | | | | | | |
| Per Accumulation Unit Data: | | | | | | | |
| Rental income | $ | 12.737 |
| | $ | 16.433 |
| | $ | 15.538 |
| | $ | 15.862 |
|
| Real estate property level expenses and taxes | 5.784 |
| | 7.534 |
| | 7.319 |
| | 7.788 |
|
| Real estate income, net | 6.953 |
| | 8.899 |
| | 8.219 |
| | 8.074 |
|
| Other income | 3.340 |
| | 3.594 |
| | 3.342 |
| | 3.459 |
|
| Total income | 10.293 |
| | 12.493 |
| | 11.561 |
| | 11.533 |
|
Expense charges(1) | 2.476 |
| | 3.290 |
| | 3.092 |
| | 2.880 |
|
| Investment income, net | 7.817 |
| | 9.203 |
| | 8.469 |
| | 8.653 |
|
| Net realized and unrealized gain on investments and mortgage loans payable | 3.804 |
| | 9.660 |
| | 18.911 |
| | 27.868 |
|
| Net increase in Accumulation Unit Value | 11.621 |
| | 18.863 |
| | 27.380 |
| | 36.521 |
|
| Accumulation Unit Value: | | | | | | | |
| Beginning of period | 381.636 |
| | 362.773 |
| | 335.393 |
| | 298.872 |
|
| End of period | $ | 393.257 |
| | $ | 381.636 |
| | $ | 362.773 |
| | $ | 335.393 |
|
Total return(3) | 3.04 | % | | 5.20 | % | | 8.16 | % | | 12.22 | % |
Ratios to Average net assets(2): | | | | | | | |
Expenses(1) | 0.83 | % | | 0.86 | % | | 0.86 | % | | 0.89 | % |
| Investment income, net | 2.63 | % | | 2.41 | % | | 2.37 | % | | 2.68 | % |
Portfolio turnover rate(3): | | | | | | | |
Real estate properties(4) | 1.6 | % | | 1.3 | % | | 5.7 | % | | 6.5 | % |
Marketable securities(5) | 5.2 | % | | 3.5 | % | | 10.0 | % | | 15.9 | % |
| Accumulation Units outstanding at end of period (in millions) | 61.9 |
| | 62.4 |
| | 60.4 |
| | 57.9 |
|
| Net assets end of period (in millions) | $ | 24,839.8 |
| | $ | 24,304.7 |
| | $ | 22,360.0 |
| | $ | 19,829.0 |
|
| |
| Expense charges per Accumulation Unit and the Ratio of Expenses to average net assets reflect the year to date Account level expenses and exclude real estate property level expenses which are included in real estate income, net. |
| |
(2)
| Percentages for the nine months ended September 30, 2017 are annualized. |
| |
(3)
| Percentages for the nine months ended September 30, 2017 are not annualized. |
| |
(4)
| Real estate investment portfolio turnover rate is calculated by dividing the lesser of purchases or sales of real estate property investments (including contributions to, or return of capital distributions received from, existing joint venture and limited partnership investments) by the average value of the portfolio of real estate investments held during the period. |
| |
(5)
| Marketable securities portfolio turnover rate is calculated by dividing the lesser of purchases or sales of securities, excluding securities having maturity dates at acquisition of one year or less, by the average value of the portfolio securities held during the period. |
Note 8—12—Accumulation Units
Changes in the number of Accumulation Units outstanding were as follows (in millions):
| | | | | | | | | | | |
| For the Nine Months Ended September 30, 2020 | | For the Year Ended December 31, 2019 |
| (Unaudited) | | |
| Outstanding: | | | |
| Beginning of period | 60.8 | | | 60.7 | |
| Credited for premiums | 3.5 | | | 6.2 | |
| Annuity, other periodic payments, withdrawals and death benefits | (11.5) | | | (6.1) | |
| End of period | 52.8 | | | 60.8 | |
|
| | | | | |
| | For the Nine Months Ended September 30, 2017 | | For the Year Ended December 31, 2016 |
| | (Unaudited) | | |
| Outstanding: | | | |
| Beginning of period | 62.4 |
| | 60.4 |
|
| Credited for premiums | 5.1 |
| | 8.2 |
|
| Annuity, other periodic payments, withdrawals and death benefits | (5.6 | ) | | (6.2 | ) |
| End of period | 61.9 |
| | 62.4 |
|
Note 9—13—Commitments and Contingencies
Commitments—TheAs of September 30, 2020 and December 31, 2019, the Account had $32.0 million and $39.0 million of outstandingthe following immediately callable commitments to purchase additional interests in its limited partnershipreal estate funds or provide additional funding through its loans receivable investments as of September 30, 2017 and December 31, 2016, respectively.(in millions):
| | | | | | | | | | | | | | | | | | | | |
| | Commitment Expiration | | September 30, 2020 | | December 31, 2019 |
| | | | (Unaudited) | | |
Real Estate Funds(1) | | | | | |
| Taconic New York City GP Fund | 11/2020 | | $ | 6.0 | | | $ | 11.4 | |
| LCS SHIP Venture I, LLC | 12/2020 | | 28.1 | | | 28.1 | |
| Townsend Strategic Ventures LP | 12/2020 | | 243.8 | | | 250.0 | |
| Silverpeak NRE Fund Co, LLC | 01/2021 | | 86.1 | | | 0 | |
| TREA Flagler Venture, LLC | 02/2021 | | 50.0 | | | 0 | |
| Grubb Southeast Real Estate Fund VI, LLC | 06/2021 | | 82.7 | | | 86.6 | |
| Colony Zeus Partners LP | 09/2021 | | 250.0 | | | 0 | |
| Veritas Trophy VI, LLC(2) | 08/2022 | | 39.2 | | | 35.8 | |
| SP V - II, LLC | 09/2022 | | 73.8 | | | 74.9 | |
| JCR Capital - REA Preferred Equity Parallel Fund | 12/2022 | | 94.5 | | | 100.0 | |
| | | | 954.2 | | | 586.8 | |
Loans Receivable(3) | | | | | |
| SCG Oakland Portfolio Mezzanine | 03/2021 | | $ | 6.7 | | | $ | 7.0 | |
| BREP VIII Industrial Mezzanine | 03/2021 | | 14.4 | | | 14.1 | |
| 311 South Wacker Mezzanine | 06/2021 | | 5.7 | | | 7.6 | |
| Rosemont Towson Mezzanine | 09/2021 | | 1.2 | | | 1.2 | |
| Liberty Park Mezzanine | 11/2021 | | 4.1 | | | 5.0 | |
| San Diego Office Portfolio Senior Loan | 08/2022 | | 7.5 | | | 10.0 | |
| San Diego Office Portfolio Mezzanine | 08/2022 | | 2.5 | | | 3.3 | |
| MRA Hub 34 Holding, LLC | 09/2022 | | 1.5 | | | 1.5 | |
| 1330 Broadway Mezzanine | 09/2022 | | 11.7 | | | 14.0 | |
| Colony New England Hotel Portfolio Senior Loan | 11/2022 | | 14.1 | | | 14.1 | |
| Colony New England Hotel Portfolio Mezzanine | 11/2022 | | 4.7 | | | 4.7 | |
| Exo Apartments Senior Loan | 01/2023 | | 7.1 | | | 7.1 | |
| Exo Apartments Mezzanine | 01/2023 | | 2.4 | | | 2.4 | |
| Five Oak Mezzanine | 03/2023 | | 2.4 | | | 0 | |
| | | | 86.0 | | | 92.0 | |
| | | | | | |
| TOTAL COMMITMENTS | | | $ | 1,040.2 | | | $ | 678.8 | |
(1)Additional capital can be called during the commitment period at any time. The commitment at September 30, 2017 and December 31, 2016period can only be extended by the manager with the consent of the Account. The commitment expiration date is related toreflective of the Taconic New York City GP Fund, LP, in whichmost recent signed agreement between the Account and the fund manager, including any side letter agreements.
(2)The fund manager is granted 18 months from the initial contribution date, August 2019, to make its first capital call. If none have occurred, the Account's commitment will be reduced by $15.0 million. If a capital call occurs during the initial 18 month window, the commitment period will be modified to three years from the first capital call date.
(3)Advances from the Account can be requested during the commitment period at any time. The commitment expiration date is reflective of the most recent signed agreement between the Account and the borrower, including any side letter agreements. Certain loans contain extension clauses on the term of the loan that do not require the Account's prior consent. If elected, the Account's commitment may be extended through the extension term.
Contingencies—In the normal course of business, the Account may be named, from time to time, as a defendantor may be involved in various legal actions, including arbitration, class actions and other litigation.
The Account establishes an accrual for all litigation and regulatory matters when it believes it is probable that a loss has entered into an agreementbeen incurred and the amount of the loss can be reasonably estimated. Once established, accruals are adjusted, as appropriate, in light of additional information. The amount of loss ultimately incurred in relation to provide funding. those matters may be higher or lower than the amounts accrued for those matters.
As of September 30, 2017, $13.0 millionthe date of the commitment has been funded. Once the remaining commitment is funded, the Account anticipates holding a 60%-90% interest in the fund.
Contingencies—The Account is party to various claims and routine litigation arising in the ordinary course of business. Managementthis report, management of the Account does not believe that the results of any such claims or litigation, individually or in the aggregate, will have a material effect on the Account’s business, financial position or results of operations.
Note 10—Securities Lending14—Subsequent Events
The Account may lend securitiesfollowing transactions occurred subsequent to qualified borrowers to earn additional income.September 30, 2020 (in millions, unaudited):
Sales - Properties
| | | | | | | | | | | | | | | | | | | | | | | | | | | | | | | | | | | | | | |
| Property Name | | Sales Date | | Ownership Percentage | | Sector | | Location | | Net Sales Price(1) | | Realized Gain on Sale(2) |
| Colony Industrial Portfolio | | 10/5/2020 | | 100.0% | | Industrial | | Various | | $ | 153.4 | | | $ | 25.1 | |
(1) The Account receives cash collateral againstnet sales price represents the loaned securities and maintains cash collateral in an amount notsales price, less than 100%selling expenses.
(2) Majority of the market value of loaned securities during the period of the loan; any additional collateral required due to changes in security values is delivered to the Account the next business day. Cash collateral received by the Account is invested exclusively in an interest-bearing deposit account. The value of the loaned securities and the liability to return the cash collateral received are reflectedrealized gain has been previously recognized as unrealized gains(losses) in the consolidated statementsAccount's Consolidated Statements of assets and liabilities. Operations.
As of September Transactions - Other
| | | | | | | | | | | | | | | | | | | | |
| Description | | Transaction Date | | Transaction Type | | Transaction Amount |
| Real estate-related marketable securities | | 10/2/2020 | | Sale | | $ | 100.0 | |
| Real estate-related marketable securities | | 10/5/2020 | | Sale | | $ | 100.0 | |
| Line of Credit I | | 10/6/2020 | | Payoff | | $ | 91.0 | |
| Real estate-related marketable securities | | 10/8/2020 | | Sale | | $ | 100.0 | |
| Real estate-related marketable securities | | 11/9/2020 | | Sale | | $ | 200.0 | |
30 2017, securities lending transactions are for real-estate related equity securities, and the resulting loans are continuous, can be recalled at any time, and have no set maturity. Securities lending income recognized by the Account consists of interest earned on cash collateral and lending fees, net of any rebates to the borrower and compensation to the agent. Such income is reflected within interest income on the consolidated statements of operations. In lending its securities, the Account bears the market risk with respect to the investment of collateral and the risk that the agent may default on its contractual obligations to the Account. The agent bears the risk that the borrower may default on its obligation to return the loaned securities as the agent is contractually obligated to indemnify the Account if at the time of a default by a borrower some or all of the loan securities have not been returned.
TIAA REAL ESTATE ACCOUNT
CONSOLIDATED SCHEDULES OF INVESTMENTS
(Dollar values shown in millions)
REAL ESTATE PROPERTIES—57.6%64.3% and 58.0%53.0%
| | | | | | | | | | | | | | | | | | | | | | | | | | |
| Location/Description | | Type | | Fair Value at |
| September 30, 2020 | | December 31, 2019 |
| | | | (Unaudited) | | | |
| Alabama: | | | | | | | | |
| River Ridge | | Retail | | $ | 29.6 | | | | $ | — | | |
| Riverchase Village | | Retail | | 38.3 | | | | 40.3 | | |
| Arizona: | | | | | | | | |
| Camelback Center | | Office | | 50.0 | | | | 49.0 | | |
| Riverside 202 Industrial | | Industrial | | 30.3 | | | | 29.6 | | |
| California: | | | | | | | | |
| 88 Kearny Street | | Office | | 217.3 | | | | 221.0 | | |
| 101 Pacific Coast Highway | | Office | | 94.0 | | | | 96.1 | | |
| 200 Middlefield Road | | Office | | 61.0 | | | | 68.0 | | |
| 30700 Russell Ranch | | Office | | 36.7 | | | | 39.0 | | |
| Allure at Camarillo | | Apartments | | 64.1 | | | | 63.9 | | |
| Almond Avenue | | Land | | 11.6 | | | | 9.5 | | |
| BLVD63 | | Apartments | | 147.0 | | | | 158.0 | | |
| Bridgepointe Shopping Center | | Retail | | 127.0 | | | | 129.0 | | |
| Centre Pointe and Valley View | | Industrial | | 60.4 | | | | 60.7 | | |
| Cerritos Industrial Park | | Industrial | | 166.0 | | | | 164.0 | | |
| Charleston Plaza | | Retail | | 98.0 | | | | 100.0 | | |
| Creekside at Alta Loma | | Apartments | | 84.6 | | | | 85.2 | | |
| Frontera Industrial Business Park | | Industrial | | 95.3 | | | | 90.0 | | |
| Great West Industrial Portfolio | | Industrial | | 208.3 | | | | 203.0 | | |
| Holly Street Village | | Apartments | | 155.1 | | (1) | | 158.1 | | (1) |
| Larkspur Courts | | Apartments | | 145.0 | | | | 155.0 | | |
| Northern CA RA Industrial Portfolio | | Industrial | | 116.9 | | | | 111.9 | | |
| Oakmont IE West Portfolio | | Industrial | | 116.3 | | | | 109.2 | | |
| Oceano at Warner Center | | Apartments | | 91.8 | | | | 94.4 | | |
| Ontario Industrial Portfolio | | Industrial | | 518.7 | | | | 506.9 | | |
| Ontario Mills Industrial Portfolio | | Industrial | | 77.0 | | | | 65.4 | | |
| Otay Mesa Industrial Portfolio | | Industrial | | 36.5 | | | | 33.7 | | |
| Pacific City | | Retail | | 162.1 | | (1) | | — | | |
| Pacific Plaza | | Office | | 111.0 | | | | 112.7 | | |
| Rancho Cucamonga Industrial Portfolio | | Industrial | | 90.8 | | | | 88.3 | | |
| Rancho Del Mar | | Apartments | | 93.7 | | | | 94.7 | | |
| Regents Court | | Apartments | | 103.0 | | (1) | | 105.0 | | (1) |
| Southern CA RA Industrial Portfolio | | Industrial | | 158.2 | | | | 151.8 | | |
| Stella | | Apartments | | 173.0 | | | | 175.1 | | |
| Stevenson Point | | Industrial | | 74.6 | | | | 66.6 | | |
| Terra House | | Apartments | | 141.4 | | | | 146.0 | | |
| The Forum at Carlsbad | | Retail | | 203.0 | | (1) | | 224.0 | | (1) |
| The Legacy at Westwood | | Apartments | | 149.1 | | (1) | | 149.1 | | (1) |
| West Lake North Business Park | | Office | | 58.1 | | | | 62.3 | | |
| Westcreek | | Apartments | | 54.3 | | | | 57.1 | | |
| Westwood Marketplace | | Retail | | 150.0 | | | | 150.0 | | |
| Wilshire Rodeo Plaza | | Office | | 313.1 | | | | 336.4 | | |
| Colorado: | | | | | | | | |
| 1600 Broadway | | Office | | 118.0 | | | | 116.0 | | |
| Palomino Park | | Apartments | | 350.1 | | | | 361.0 | | (1) |
| South Denver Marketplace | | Retail | | 67.2 | | | | 71.2 | | |
TIAA REAL ESTATE ACCOUNT
CONSOLIDATED SCHEDULES OF INVESTMENTS
(Dollar values shown in millions)
|
| | | | | | | | | | | | |
| Location/Description | | Type | | Fair Value at |
| September 30, 2017 | | December 31, 2016 |
| | | | | (Unaudited) | | | |
| Arizona: | | | | | | | | |
| Camelback Center | | Office | | $ | 58.4 |
| | | $ | 56.4 |
| |
| Kierland Apartment Portfolio | | Apartments | | 147.7 |
| | | 127.9 |
| (1) |
| California: | | | | | | | | |
| 55 Second Street | | Office | | 353.1 |
| (1) | | 335.0 |
| (1) |
| 88 Kearny Street | | Office | | 177.6 |
| | | 172.3 |
| |
| 200 Middlefield Road | | Office | | 61.2 |
| | | 60.5 |
| |
| BLVD63 | | Apartments | | 162.0 |
| | | 157.0 |
| |
| Castro Station | | Office | | 163.0 |
| | | 158.2 |
| |
| Centre Pointe and Valley View | | Industrial | | 43.9 |
| | | 42.8 |
| |
| Cerritos Industrial Park | | Industrial | | 140.0 |
| | | 126.3 |
| |
| Charleston Plaza | | Retail | | 93.0 |
| | | 92.0 |
| |
| Great West Industrial Portfolio | | Industrial | | 160.9 |
| | | 166.1 |
| |
| Holly Street Village | | Apartments | | 148.0 |
| | | 146.0 |
| |
| Larkspur Courts | | Apartments | | 141.4 |
| | | 140.5 |
| |
| Northern CA RA Industrial Portfolio | | Industrial | | 87.0 |
| | | 76.7 |
| |
| Oakmont IE West Portfolio | | Industrial | | 87.2 |
| | | 82.7 |
| |
| Oceano at Warner Center | | Apartments | | 89.0 |
| | | 88.3 |
| |
| Ontario Industrial Portfolio | | Industrial | | 397.4 |
| (11) | | 438.0 |
| |
| Ontario Mills Industrial Portfolio | | Industrial | | 55.9 |
| | | 52.0 |
| |
| Pacific Plaza | | Office | | 115.2 |
| | | 115.0 |
| |
| Rancho Cucamonga Industrial Portfolio | | Industrial | | 70.9 |
| (11) | | 174.2 |
| |
| Regents Court | | Apartments | | 95.4 |
| (1) | | 89.9 |
| (1) |
| Southern CA RA Industrial Portfolio | | Industrial | | 136.2 |
| | | 135.0 |
| |
| Stella | | Apartments | | 178.9 |
| | | 173.1 |
| |
| Stevenson Point | | Industrial | | 49.9 |
| | | 49.3 |
| |
| The Forum at Carlsbad | | Retail | | 220.0 |
| (1) | | 221.5 |
| (1) |
| The Legacy at Westwood | | Apartments | | 143.0 |
| (1) | | 142.1 |
| (1) |
| Township Apartments | | Apartments | | 89.8 |
| | | 89.6 |
| |
| West Lake North Business Park | | Office | | 60.4 |
| | | 60.0 |
| |
| Westcreek | | Apartments | | 51.1 |
| | | 48.2 |
| |
| Westwood Marketplace | | Retail | | 131.8 |
| | | 125.0 |
| |
| Wilshire Rodeo Plaza | | Office | | 326.7 |
| | | 320.7 |
| |
| Colorado: | | | | | | | | |
| Palomino Park | | Apartments | | 327.9 |
| (1) | | 314.1 |
| (1) |
| South Denver Marketplace | | Retail | | 72.7 |
| | | 73.0 |
| |
| Connecticut: | | | | | | | | |
| Wilton Woods Corporate Campus | | Office | | 134.0 |
| | | 141.9 |
| |
| Florida: | | | | | | | | |
| 701 Brickell Avenue | | Office | | 362.6 |
| (1) | | 380.7 |
| (1) |
| Broward Industrial Portfolio | | Industrial | | 54.1 |
| | | — |
| |
| Casa Palma | | Apartments | | 95.0 |
| | | 97.0 |
| |
| Orion on Orpington | | Apartments | | 42.1 |
| | | — |
| |
| Publix at Weston Commons | | Retail | | 74.1 |
| | | 73.0 |
| |
| Seneca Industrial Park | | Industrial | | 106.4 |
| | | 102.7 |
| |
| South Florida Apartment Portfolio | | Apartments | | 105.0 |
| | | 104.1 |
| |
| | | | | | | | | | | | | | | | | | | | | | | | | | |
| Location/Description | | Type | | Fair Value at |
| September 30, 2020 | | December 31, 2019 |
| | | | (Unaudited) | | | |
| Connecticut: | | | | | | | | |
| Wilton Woods Corporate Campus | | Office | | $ | 102.1 | | | | $ | 112.1 | | |
| Florida: | | | | | | | | |
| 5 West | | Apartments | | 61.1 | | | | 62.3 | | |
| 701 Brickell Avenue | | Office | | 422.6 | | (1) | | 406.6 | | (1) |
| Boca Arbor Club | | Apartments | | 63.5 | | | | 62.9 | | |
| Broward Industrial Portfolio | | Industrial | | 68.8 | | | | 67.7 | | |
| Casa Palma | | Apartments | | 98.7 | | | | 102.0 | | |
| Cypress Trace | | Retail | | 36.2 | | | | — | | |
| Fusion 1560 | | Apartments | | 74.5 | | (1) | | 84.1 | | (1) |
| Lakepointe at Jacaranda | | Apartments | | 49.1 | | | | 48.8 | | |
| Lofts at SoDo | | Apartments | | 61.0 | | (1) | | 64.7 | | (1) |
| Market Square | | Retail | | 20.3 | | | | — | | |
| Orion on Orpington | | Apartments | | 51.1 | | | | 52.4 | | |
| Publix at Weston Commons | | Retail | | 69.5 | | | | 74.5 | | |
| Seneca Industrial Park | | Industrial | | 127.6 | | | | 126.7 | | |
| Shoppes at Lake Mary | | Retail | | 18.9 | | | | — | | |
| Sole at Brandon | | Apartments | | 75.4 | | | | 79.0 | | |
| Sole at City Center | | Apartments | | 101.1 | | | | — | | |
| The Manor Apartments | | Apartments | | 48.1 | | | | 51.5 | | |
| The Manor at Flagler Village | | Apartments | | 132.1 | | | | 138.1 | | |
| The Residences at the Village of Merrick Park | | Apartments | | 69.5 | | | | 72.3 | | |
| Weston Business Center | | Industrial | | 79.3 | | | | 75.0 | | |
| Georgia: | | | | | | | | |
| Ascent at Windward | | Apartments | | 69.0 | | (1) | | 68.4 | | (1) |
| Atlanta Industrial Portfolio | | Industrial | | 40.5 | | | | 41.0 | | |
| Biltmore at Midtown | | Apartments | | 73.6 | | (1) | | 73.5 | | (1) |
| Eisenhower Crossing | | Retail | | 13.4 | | | | — | | |
| Fayette Pavilion | | Retail | | 101.3 | |
| | — | | |
| Glen Lake | | Apartments | | 56.8 | | | | 55.3 | | |
| Heritage Pavilion | | Retail | | 40.5 | |
| | — | | |
| Marketplace at Mill Creek | | Retail | | 76.4 | | (1) | | — | | |
| Newnan Pavilion | | Retail | | 40.2 | | | | — | | |
| Shawnee Ridge Industrial Portfolio | | Industrial | | 99.8 | | | | 99.9 | | |
| Woodstock Square | | Retail | | 32.0 | |
| | — | | |
| Illinois: | | | | | | | | |
| 32 South State Street | | Retail | | 48.4 | | (1) | | 51.4 | | (1) |
| 803 Corday | | Apartments | | 92.5 | | | | 93.8 | | |
| Chicago Caleast Industrial Portfolio | | Industrial | | 86.3 | | | | 85.6 | | |
| Chicago Industrial Portfolio | | Industrial | | 33.1 | | | | 30.1 | | |
| Village Crossing | | Retail | | 143.5 | |
| | — | | |
| Maryland: | | | | | | | | |
| Cherry Knoll | | Apartments | | 57.7 | | (1) | | 60.1 | | (1) |
| Landover Logistics Center | | Industrial | | 47.7 | | | | 44.7 | | |
| The Shops at Wisconsin Place | | Retail | | 63.7 | | | | 65.6 | | |
| Massachusetts: | | | | | | | | |
| 99 High Street | | Office | | 545.2 | | (1) | | 543.7 | | (1) |
| 350 Washington | | Retail | | 124.0 | | | | 134.0 | | |
| Fort Point Creative Exchange Portfolio | | Office | | 265.0 | | | | 275.0 | | |
TIAA REAL ESTATE ACCOUNT
CONSOLIDATED SCHEDULES OF INVESTMENTS
(Dollar values shown in millions)
|
| | | | | | | | | | | | |
| Location/Description | | Type | | Fair Value at |
| September 30, 2017 | | December 31, 2016 |
| | | | | (Unaudited) | | | |
| The Manor Apartments | | Apartments | | 52.8 |
| | | 53.6 |
| |
| The Manor at Flagler Village | | Apartments | | 148.0 |
| | | 150.8 |
| |
| The Residences at the Village of Merrick Park | | Apartments | | 75.0 |
| | | 74.1 |
| |
| Urban Centre | | Office | | 138.8 |
| | | 121.4 |
| |
| Weston Business Center | | Industrial | | 92.8 |
| | | 92.7 |
| |
| Georgia: | | | | | | | | |
| Atlanta Industrial Portfolio | | Industrial | | 31.6 |
| (6) | | 62.8 |
| |
| Shawnee Ridge Industrial Portfolio | | Industrial | | 89.6 |
| | | 86.7 |
| |
| Illinois: | | | | | | | | |
| 32 South State Street | | Retail | | 47.7 |
| (1) | | 46.5 |
| (1) |
| 803 Corday | | Apartments | | 92.5 |
| | | — |
| |
| Chicago Caleast Industrial Portfolio | | Industrial | | 80.3 |
| | | 81.8 |
| |
| Chicago Industrial Portfolio | | Industrial | | 96.6 |
| | | 85.5 |
| |
| Maryland: | | | | | | | | |
| Landover Logistics Center | | Industrial | | 43.1 |
| | | 39.8 |
| |
| The Shops at Wisconsin Place | | Retail | | 91.0 |
| | | 92.8 |
| |
| Massachusetts: | | | | | | | | |
| 99 High Street | | Office | | 504.0 |
| | | 514.1 |
| |
| 501 Boylston Street | | Office | | 506.3 |
| (1) | | 490.3 |
| (1) |
| Fort Point Creative Exchange Portfolio | | Office | | 217.9 |
| | | 223.0 |
| |
| Northeast RA Industrial Portfolio | | Industrial | | 40.2 |
| | | 41.3 |
| |
| One Beeman Road | | Industrial | | 33.7 |
| | | — |
| |
| Minnesota: | | | | | | | | |
| The Bridges | | Apartments | | 62.1 |
| | | — |
| |
| The Knoll | | Apartments | | 33.3 |
| (1) | | — |
| |
| New Jersey: | | | | | | | | |
| 200 Milik Street | | Industrial | | 52.1 |
| | | 51.2 |
| |
| Marketfair | | Retail | | 105.0 |
| | | 104.2 |
| |
| Amazon Distribution Center | | Industrial | | 110.0 |
| | | 101.0 |
| |
| South River Road Industrial | | Industrial | | 87.2 |
| | | 71.9 |
| |
| New York: | | | | | | | | |
| 21 Penn Plaza | | Office | | 266.3 |
| | | 275.2 |
| |
| 250 North 10th Street | | Apartments | | 166.0 |
| | | 162.0 |
| |
| 425 Park Avenue | | Ground Lease | | 454.0 |
| | | 450.0 |
| |
| 430 West 15th Street | | Office | | 140.5 |
| | | 116.1 |
| |
| 780 Third Avenue | | Office | | 429.0 |
| (1) | | 425.0 |
| (1) |
| 837 Washington Street | | Office | | 209.0 |
| | | 215.0 |
| |
| The Colorado | | Apartments | | 256.0 |
| (1) | | 258.1 |
| (1) |
| The Corner | | Apartments | | 253.1 |
| (1) | | 250.0 |
| (1) |
| Oregon: | | | | | | | | |
| The Cordelia | | Apartments | | 49.0 |
| | | 50.0 |
| |
| Pennsylvania: | | | | | | | | |
| 1619 Walnut Street | | Retail | | 23.4 |
| | | 23.4 |
| |
| The Pepper Building | | Apartments | | — |
| | | 52.9 |
| |
| South Carolina: | | | | | | | | |
| Greene Crossing | | Apartments | | 65.8 |
| | | 65.8 |
| |
| Tennessee: | | | | | | | | |
| Southside at McEwen | | Retail | | 48.2 |
| | | 48.8 |
| |
| | | | | | | | | | | | | | | | | | | | | | | | | | |
| Location/Description | | Type | | Fair Value at |
| September 30, 2020 | | December 31, 2019 |
| | | | (Unaudited) | | | |
| Northeast RA Industrial Portfolio | | Industrial | | $ | 44.2 | | | | $ | 43.5 | | |
| One Beeman Road | | Industrial | | 35.8 | | | | 34.6 | | |
| Minnesota: | | | | | | | | |
| The Bridges | | Apartments | | 66.0 | | | | 67.2 | | |
| The Knoll | | Apartments | | 37.2 | | | | 37.3 | | (1) |
| New Jersey: | | | | | | | | |
| 10 New Maple Avenue | | Industrial | | 21.5 | | | | 21.9 | | |
| 200 Milik Street | | Industrial | | 57.6 | | | | 56.4 | | |
| Marketfair | | Retail | | 101.1 | | | | 106.2 | | |
| South River Road Industrial | | Industrial | | 133.2 | | | | 133.5 | | |
| New York: | | | | | | | | |
| 21 Penn Plaza | | Office | | 310.4 | | | | 334.9 | | |
| 250 North 10th Street | | Apartments | | — | | | | 138.1 | | |
| 780 Third Avenue | | Office | | 373.5 | | (1) | | 389.1 | | (1) |
| 837 Washington Street | | Office | | 211.0 | | | | 232.0 | | |
| The Colorado | | Apartments | | 247.0 | | (1) | | 259.0 | | (1) |
| North Carolina: | | | | | | | | |
| Alexander Place | | Retail | | 40.0 | | | | — | | |
| Birkdale Village | | Retail | | 113.6 | | (1) | | — | | |
| Birkdale Village - Residential | | Apartments | | 71.7 | | | | — | | |
| Centric Gateway | | Apartments | | 72.7 | | | | 75.0 | | |
| Winslow Bay Commons | | Retail | | 47.0 | | (1) | | — | | |
| Oregon: | | | | | | | | |
| The Cordelia | | Apartments | | 41.1 | | | | 43.2 | | |
| Pennsylvania: | | | | | | | | |
| 1619 Walnut Street | | Retail | | 22.5 | | | | 23.0 | | |
| Overlook at King of Prussia | | Retail | | 60.4 | | (1) | | — | | |
| Rhode Island: | | | | | | | | |
| Warwick Shopping Center | | Retail | | 17.9 | | | | — | | |
| South Carolina: | | | | | | | | |
| Columbiana Station | | Retail | | 46.7 | |
| | — | | |
| Greene Crossing | | Apartments | | 80.5 | | | | 79.7 | | |
| Tennessee: | | | | | | | | |
| Bellevue Place | | Retail | | 8.6 | | | | — | | |
| Pavilion at Turkey Creek | | Retail | | 51.3 | | | | — | | |
| Southside at McEwen | | Retail | | 47.9 | | | | 49.2 | | |
| Town and Country | | Retail | | 30.7 | | | | — | | |
| Texas: | | | | | | | | |
| 3131 McKinney | | Office | | 38.6 | | | | 46.4 | | |
| Beltway North Commerce Center | | Industrial | | — | | | | 30.2 | | |
| Carrington Park | | Apartments | | 66.0 | | | | 67.3 | | |
| Churchill on the Park | | Apartments | | 71.8 | | | | 73.0 | | |
| Cliffs at Barton Creek | | Apartments | | 45.6 | | | | 47.2 | | |
| Dallas Industrial Portfolio | | Industrial | | 254.1 | | | | 237.9 | | |
| District on La Frontera | | Apartments | | 71.7 | | (1) | | 76.6 | | (1) |
| Houston Apartment Portfolio | | Apartments | | 157.7 | | | | 162.3 | | |
| Lincoln Centre | | Office | | 434.2 | | | | 413.2 | | |
| Lincoln Centre - Hilton Dallas | | Hotel | | 66.0 | | | | 76.5 | | |
| Northwest Houston Industrial Portfolio | | Industrial | | 75.0 | | | | 77.2 | | |
TIAA REAL ESTATE ACCOUNT
CONSOLIDATED SCHEDULES OF INVESTMENTS
(Dollar values shown in millions)
| | | Location/Description | | Type | | Fair Value at | Location/Description | | Type | | Fair Value at |
| September 30, 2017 | | December 31, 2016 | September 30, 2020 | | December 31, 2019 |
| | | (Unaudited) | | | | | | | | (Unaudited) | | |
| Texas: | | | | | | |
| Beltway North Commerce Center | | Industrial | | 19.2 |
| | 19.5 |
| | |
| Cliffs at Barton Creek | | Apartments | | 45.7 |
| | 45.8 |
| | |
| Dallas Industrial Portfolio | | Industrial | | 210.5 |
| | 201.3 |
| | |
| Houston Apartment Portfolio | | Apartments | | 159.3 |
| | 159.3 |
| | |
| Lincoln Centre | | Office | | 353.0 |
| | 347.0 |
| | |
| Northwest Houston Industrial Portfolio | | Industrial | | 70.0 |
| | 68.2 |
| | |
| Park 10 Distribution | | Industrial | | 10.3 |
| | 11.3 |
| | Park 10 Distribution | | Industrial | | $ | 12.0 | | | $ | 11.1 | | |
| Park Creek Apartments | | Park Creek Apartments | | Apartments | | 42.8 | | | — | | |
| Pinnacle Industrial Portfolio | | Industrial | | 53.4 |
| | 52.8 |
| | Pinnacle Industrial Portfolio | | Industrial | | 68.7 | | | 66.7 | | |
| Pinto Business Park | | Industrial | | 130.8 |
| | 134.2 |
| | Pinto Business Park | | Industrial | | 153.9 | | | 154.1 | | |
| The Caruth | | Apartments | | 82.7 |
| (1) | | 84.3 |
| (1) | |
| The Maroneal | | Apartments | | 54.5 |
| | 52.1 |
| | The Maroneal | | Apartments | | 55.6 | | | 56.4 | | |
| Utah: | | Utah: | |
| Vista Station Office Portfolio | | Vista Station Office Portfolio | | Office | | 115.9 | | (1) | | 115.4 | | (1) |
| Virginia: | | | | | | Virginia: | |
| 8270 Greensboro Drive | | Office | | 47.3 |
| | 47.6 |
| | 8270 Greensboro Drive | | Office | | 45.8 | | | 49.6 | | |
| Ashford Meadows Apartments | | Apartments | | 106.6 |
| (1) | | 107.2 |
| (1) | Ashford Meadows Apartments | | Apartments | | 102.2 | | | 105.3 | | (1) |
| Creeks at Virginia Center | | Creeks at Virginia Center | | Retail | | 47.4 | | | — | | |
| Henley at Kingstowne | | Henley at Kingstowne | | Apartments | | 103.1 | | (1) | | 103.0 | | (1) |
| Plaza America | | Retail | | 115.0 |
| | 109.0 |
| | Plaza America | | Retail | | 96.7 | | | 113.3 | | |
| The Ellipse at Ballston | | Office | | 84.4 |
| | 79.8 |
| | The Ellipse at Ballston | | Office | | 79.5 | | | 82.2 | | |
| The Palatine | | Apartments | | 121.1 |
| (1) | | 130.9 |
| (1) | The Palatine | | Apartments | | 123.0 | | (1) | | 128.0 | | (1) |
| Washington: | | | | | | Washington: | |
| Circa Green Lake | | Apartments | | 94.4 |
| | 92.5 |
| | Circa Green Lake | | Apartments | | 97.0 | | (1) | | 102.0 | | (1) |
| Fourth and Madison | | Office | | 527.0 |
| (1) | | 521.0 |
| (1) | |
| Millennium Corporate Park | | Office | | 182.1 |
| | 190.1 |
| | |
| Northwest RA Industrial Portfolio | | Industrial | | 38.2 |
| | 31.7 |
| | Northwest RA Industrial Portfolio | | Industrial | | 49.5 | | | 49.7 | | |
| Pacific Corporate Park | | Industrial | | 44.5 |
| | 42.0 |
| | Pacific Corporate Park | | Industrial | | 64.5 | | | 62.5 | | |
| Prescott Wallingford Apartments | | Apartments | | 62.0 |
| | 58.8 |
| | Prescott Wallingford Apartments | | Apartments | | 67.4 | | | 70.6 | | |
| Rainier Corporate Park | | Industrial | | 114.7 |
| | 104.0 |
| | Rainier Corporate Park | | Industrial | | 167.3 | | | 161.3 | | |
| Regal Logistics Campus | | Industrial | | 97.8 |
| | 83.1 |
| | Regal Logistics Campus | | Industrial | | 131.0 | | | 121.0 | | |
| Union - South Lake Union | | Apartments | | 109.1 |
| | 105.3 |
| | Union - South Lake Union | | Apartments | | 109.0 | | (1) | | 115.0 | | (1) |
| Washington DC: | | | | | | |
| Washington D.C.: | | Washington D.C.: | |
| 1001 Pennsylvania Avenue | | Office | | 810.0 |
| (1) | | 810.0 |
| (1) | 1001 Pennsylvania Avenue | | Office | | 798.5 | | (1) | | 798.4 | | (1) |
| 1401 H Street, NW | | Office | | 203.1 |
| (1) | | 230.0 |
| (1) | 1401 H Street, NW | | Office | | 223.4 | | (1) | | 211.4 | | (1) |
| 1900 K Street, NW | | Office | | 330.2 |
| (1) | | 335.0 |
| (1) | 1900 K Street, NW | | Office | | 344.2 | | (1) | | 335.4 | | (1) |
| Mass Court | | Apartments | | 171.0 |
| (1) | | 169.0 |
| (1) | Mass Court | | Apartments | | 166.1 | | | 169.0 | | |
| Mazza Gallerie | | Retail | | — |
| | 78.0 |
| | |
| The Ashton | | Apartments | | 38.5 |
| | 39.2 |
| | The Ashton | | Apartments | | 29.8 | | | 30.6 | | |
| The Louis at 14th | | Apartments | | 175.0 |
| | 183.2 |
| | The Louis at 14th | | Apartments | | 160.1 | | | 164.2 | | |
| The Woodley | | Apartments | | 191.0 |
| | 203.0 |
| | The Woodley | | Apartments | | — | | | 180.3 | | |
| Various: | | Various: | |
| Colony Industrial Portfolio | | Colony Industrial Portfolio | | Industrial | | 160.2 | | (3) | | 135.9 | | (3) |
| TOTAL REAL ESTATE PROPERTIES | | | | | | TOTAL REAL ESTATE PROPERTIES | | |
| (Cost $12,944.7 and $12,818.1) | | $ | 15,654.2 |
| | | $ | 15,452.8 |
| | |
| (Cost $14,201.5 and $13,048.5) | | (Cost $14,201.5 and $13,048.5) | | $ | 16,715.0 | | | | $ | 15,835.0 | | |
REAL ESTATE JOINT VENTURES AND LIMITED PARTNERSHIPS—21.4%FUNDS—24.5% and 21.6%25.1%
REAL ESTATE JOINT VENTURES—20.9%23.1% and 21.1%24.1%
| | | | | | | | | | | | | | | | | | | | | | | | | | |
| Location/Description | | Type | | Fair Value at |
| September 30, 2020 | | December 31, 2019 |
| | | | (Unaudited) | | | |
| California: | | | | | | |
CA—Colorado Center LP
Colorado Center (50% Account Interest) | | Office | | $ | 356.4 | | (2) | | $ | 384.5 | | (2) |
PC Borrower, LLC
Pacific City (70% Account Interest) | | Retail | | — | | | | 62.2 | | (2) |
TREA GM Industrial Road Investor Member LLC
150 Industrial Road (98% Account Interest) | | Office | | 99.5 | | | | 98.0 | | |
TIAA REAL ESTATE ACCOUNT
CONSOLIDATED SCHEDULES OF INVESTMENTS
(Dollar values shown in millions)
| | | Location/Description | | Type | | Fair Value at | Location/Description | | Type | | Fair Value at |
| September 30, 2017 | | December 31, 2016 | September 30, 2020 | | December 31, 2019 |
| | | (Unaudited) | | | | | | | | (Unaudited) | | |
| California: | | | | | |
CA—Colorado Center LP Colorado Center (50% Account Interest) | | Office | | $ | 355.1 |
| (2) | | $ | 567.8 |
| | |
PC Borrower, LLC Pacific City (70% Account Interest) | | Retail | | 133.8 |
| | 128.5 |
| | |
TREA 9625 Towne Center, LLC
9625 Towne Centre Drive (49.9% Account Interest) | | TREA 9625 Towne Center, LLC
9625 Towne Centre Drive (49.9% Account Interest) | | Office | | $ | 59.6 | | | $ | 53.1 | | |
TREA Campus Pointe 1, LLC
Campus Pointe 1 (45% Account Interest) | | Office | | 139.4 |
| | 137.5 |
| | TREA Campus Pointe 1, LLC
Campus Pointe 1 (45% Account Interest) | | Office | | 170.3 | | | 163.5 | | |
TREA Campus Pointe 2, LLC
Campus Pointe 2 (43.16% Account Interest) | | Office | | 104.2 |
| | 85.7 |
| | |
TREA Campus Pointe 2 & 3, LLC
Campus Pointe 2 & 3 (45% Account Interest) | | TREA Campus Pointe 2 & 3, LLC
Campus Pointe 2 & 3 (45% Account Interest) | | Office (5) | | 146.9 | | | 143.6 | | |
TREA Campus Pointe 4, LLC
Campus Pointe 4 (45% Account Interest) | | TREA Campus Pointe 4, LLC
Campus Pointe 4 (45% Account Interest) | | Office | | 10.4 | | | 9.6 | | |
TREA Campus Pointe 5, LLC
Campus Pointe 5 (45% Account Interest) | | TREA Campus Pointe 5, LLC
Campus Pointe 5 (45% Account Interest) | | Office | | 41.3 | | | 37.4 | | |
ARE-SD Regions NO. 58, LLC
Campus Pointe 6 (45% Account Interest) | | ARE-SD Regions NO. 58, LLC
Campus Pointe 6 (45% Account Interest) | | Office | | 125.5 | | | 116.6 | | |
T-C 1500 Owens, LLC 1500 Owens Street (49.9% Account Interest) | | Office | | 77.0 |
| | 74.8 |
| | T-C 1500 Owens, LLC
1500 Owens Street (49.9% Account Interest) | | Office | | 84.5 | | | 81.5 | | |
TREA JP Venture Fairfield LLC
Fairfield Tolenas Development (95% Account Interest) | | TREA JP Venture Fairfield LLC
Fairfield Tolenas Development (95% Account Interest) | | Land | | 9.4 | | | — | | |
T-C Foundry Square II Venture LLC Foundry Square II (50.1% Account Interest) | | Office | | 257.4 |
| | 200.1 |
| (2) | T-C Foundry Square II Venture LLC
Foundry Square II (50.1% Account Interest) | | Office | | 323.2 | | | 318.4 | | |
T-C Illinois Street, LLC 409-499 Illinois Street (40% Account Interest) | | Office | | 206.3 |
| | 196.8 |
| | T-C Illinois Street, LLC
409-499 Illinois Street (40% Account Interest) | | Office | | 247.9 | | | 237.5 | | |
Valencia Town Center Associates LP Valencia Town Center (50% Account Interest) | | Retail | | 137.5 |
| (2) | | 128.0 |
| (2) | Valencia Town Center Associates LP
Valencia Town Center (50% Account Interest) | | Retail | | 114.6 | | (2) | | 136.4 | | (2) |
| Florida: | | | | | Florida: | | | | |
Florida Mall Associates, Ltd The Florida Mall (50% Account Interest) | | Retail | | 754.8 |
| (2) | | 755.8 |
| (2) | Florida Mall Associates, Ltd
The Florida Mall (50% Account Interest) | | Retail | | 672.1 | | (2) | | 748.3 | | (2) |
TREA Florida Retail, LLC Florida Retail Portfolio (80% Account Interest) | | Retail | | 150.0 |
| | 147.6 |
| | TREA Florida Retail, LLC
Florida Retail Portfolio (80% Account Interest) | | Retail | | 156.8 | | | 158.4 | | |
West Dade County Associates Miami International Mall (50% Account Interest) | | Retail | | 164.2 |
| (2) | | 161.1 |
| (2) | West Dade County Associates
Miami International Mall (50% Account Interest) | | Retail | | 110.1 | | (2) | | 157.5 | | (2) |
| Maryland: | | | | | Maryland: | | | | |
WP Project Developer The Shops at Wisconsin Place (33.33% Account Interest) | | Retail | | 21.0 |
| | 19.4 |
| | WP Project Developer
The Shops at Wisconsin Place (33.33% Account Interest) | | Retail | | 27.1 | | | 29.9 | | |
| Massachusetts: | | | | | Massachusetts: | | | | |
One Boston Place REIT One Boston Place (50.25% Account Interest) | | Office | | 238.8 |
| | 224.2 |
| | One Boston Place REIT
One Boston Place (50.25% Account Interest) | | Office | | 243.6 | | | 246.8 | | |
T-C 225 Binney, LLC 225 Binney Street (70% Account Interest) | | Office | | 195.7 |
| | 194.9 |
| | T-C 225 Binney, LLC
225 Binney Street (70% Account Interest) | | Office | | 232.0 | | | 231.5 | | |
T-C 501 Boylston Street Member, LLC
501 Boylston (50.1% Account Interest) | | T-C 501 Boylston Street Member, LLC
501 Boylston (50.1% Account Interest) | | Office | | 204.7 | | (2) | | 206.9 | | (2) |
| Nevada: | | | | | | Nevada: | |
Fashion Show Holding I, LLC Fashion Show (50% Account Interest) | | Retail | | 837.9 |
| (2) | | 839.1 |
| (2) | Fashion Show Holding I, LLC
Fashion Show (50% Account Interest) | | Retail | | 578.5 | | (2) | | 706.9 | | (2) |
| New York: | | | | | New York: | | | | |
401 West 14th Street, LLC 401 West 14th Street (42.19% Account Interest) | | Retail | | 45.5 |
| (2) | | 41.1 |
| (2) | 401 West 14th Street, LLC
401 West 14th Street (42.19% Account Interest) | | Retail | | 31.3 | | (2) | | 44.8 | | (2) |
440 Ninth Avenue Owner, LLC
440 Ninth Avenue (88.52% Account Interest) | | 440 Ninth Avenue Owner, LLC
440 Ninth Avenue (88.52% Account Interest) | | Office | | 129.6 | | (2) | | 133.1 | | (2) |
817 Broadway Owner, LLC 817 Broadway (61.46% Account Interest) | | Office | | 23.3 |
| (2) | | 20.8 |
| (2) | 817 Broadway Owner, LLC
817 Broadway (61.46% Account Interest) | | Office | | 23.5 | | (2) | | 33.7 | | (2) |
MRA Hub 34 Holding, LLC The Hub (95% Account Interest) | | Office | | 57.1 |
| (2) | | 54.9 |
| (2) | MRA Hub 34 Holding, LLC
The Hub (95% Account Interest) | | Office | | 78.3 | | (2) | | 74.8 | | (2) |
RGM 42, LLC MiMA (70% Account Interest) | | Apartments | | 188.0 |
| (2) | | 194.7 |
| (2) | RGM 42, LLC
MiMA (70% Account Interest) | | Apartments | | 101.9 | | (2) | | 113.0 | | (2) |
TREA 35th Street LIC Investor Member, LLC Commerce LIC (97.5% Account Interest) | | Industrial | | 57.9 |
| | — |
| | |
| Tennessee: | | | | | |
West Town Mall, LLC West Town Mall (50% Account Interest) | | Retail | | 137.1 |
| (2) | | 154.4 |
| (2) | |
TIAA REAL ESTATE ACCOUNT
CONSOLIDATED SCHEDULES OF INVESTMENTS
(Dollar values shown in millions)
|
| | | | | | | | | | | | |
| Location/Description | | Type | | Fair Value at |
| September 30, 2017 | | December 31, 2016 |
| | | | | (Unaudited) | | | |
| Texas: | | | | | | |
Four Oaks Venture LP Four Oaks Place LP (51% Account Interest) | | Office | | 341.6 |
| (2) | | 342.3 |
| (2) |
| Washington: | | | | | | |
T-C REA 400 Fairview Investor, LLC 400 Fairview (90% Account Interest) | | Office | | 262.4 |
| | | 243.6 |
| |
| Various: | | | | | | |
DDRTC Core Retail Fund, LLC DDR Joint Venture (85% Account Interest) | | Retail | | 615.8 |
| (2,3) | | 552.8 |
| (2,3) |
Storage Portfolio I, LLC Storage Portfolio (75% Account Interest) | | Storage | | 173.6 |
| (2,3) | | 156.5 |
| (2,3) |
TOTAL REAL ESTATE JOINT VENTURES (Cost $4,399.3 and $4,393.2) | | | | $ | 5,675.4 |
| | | $ | 5,622.4 |
| |
| | | | | | | | | |
| | | | | | | | | |
| LIMITED PARTNERSHIPS—0.5% and 0.5% | | | | |
| Clarion Gables Multi-Family Trust LP (8.407% Account Interest) | | $ | 124.9 |
| | | $ | 121.6 |
| |
| Colony Realty Partners LP (5.27% Account Interest) | | — |
| | | 3.1 |
| (10) |
| Lion Gables Apartment Fund (18.46% Account Interest) | | — |
| | | 0.2 |
| (5) |
| Taconic New York City GP Fund, LP (60% Account Interest) | | 11.0 |
| | | 4.8 |
| |
| Transwestern Mezz Realty Partners III, LLC (11.708% Account Interest) | | 4.8 |
| | | 7.8 |
| |
TOTAL LIMITED PARTNERSHIPS (Cost $140.9 and $137.2) | | | | $ | 140.7 |
| | | $ | 137.5 |
| |
TOTAL REAL ESTATE JOINT VENTURES AND LIMITED PARTNERSHIPS (Cost $4,540.2 and $4,530.4) | | $ | 5,816.1 |
| | | $ | 5,759.9 |
| |
| | | | | | | | | | | | | | | | | | | | | | | | | | |
| Location/Description | | Type | | Fair Value at |
| September 30, 2020 | | December 31, 2019 |
| | | | (Unaudited) | | | |
| North Carolina: | | | | | | | | |
| CC 101 North Tryon, LLC 101 N. Tryon Street (85% Account Interest) | | Office | | $ | 57.9 | | (2) | | $ | 47.9 | | (2) |
| Tennessee: | | | | | | |
West Town Mall, LLC
West Town Mall (50% Account Interest) | | Retail | | 122.3 | | (2) | | 144.0 | | (2) |
| Texas: | | | | | | |
Four Oaks Venture LP
Four Oaks Place LP (51% Account Interest) | | Office | | 341.7 | | (2) | | 352.8 | | (2) |
TREA I-35 Logistics Investor Member, LLC
I-35 Logistics Center (95% Account Interest) | | Land | | 25.9 | | | | 6.9 | | |
| Washington: | | | | | | | | |
TREA 4th and Madison Investor Member, LLC
Fourth and Madison (51% Account Interest) | | Office | | 170.5 | | (2) | | 167.3 | | (2) |
| Various: | | | | | | |
DDRTC Core Retail Fund, LLC
SITE Centers Joint Venture (85% Account Interest) | | Retail | | — | | | | 878.0 | | (2,3) |
Simpson Housing LLP
Simpson Housing Portfolio (80% Account Interest) | | Apartments | | 429.4 | | (2,3) | | 431.2 | | (2,3) |
THP Student Housing, LLC
THP Student Housing Portfolio (97% Account Interest) | | Apartments | | 188.9 | | (2,3) | | 186.8 | | (2,3) |
Storage Portfolio I, LLC
Storage Portfolio I (66.02% Account Interest) | | Storage | | 96.4 | | (2,3) | | 93.6 | | (2,3) |
Storage Portfolio II, LLC
Storage Portfolio II (90% Account Interest) | | Storage | | 129.2 | | (2,3) | | 130.5 | | (2,3) |
Storage Portfolio III, LLC
Storage Portfolio III (90% Account Interest) | | Storage | | 52.6 | | (3) | | 37.3 | | (3) |
TOTAL REAL ESTATE JOINT VENTURES (Cost $4,818.0 and $5,971.1) | | | | $ | 5,993.8 | | | | $ | 7,204.2 | | |
| | | | | | | | |
| REAL ESTATE FUNDS—1.4% and 1.0% | | | | |
| LCS SHIP Venture I, LLC (90.0% Account Interest) | | $ | 184.5 | | | | $ | 216.1 | | |
| Veritas - Trophy VI, LLC (90.4% Account Interest) | | 45.1 | | | | 4.2 | | |
| Taconic New York City GP Fund, LP (60.0% Account Interest) | | 31.7 | | | | 29.8 | | |
| SP V - II, LLC (61.8% Account Interest) | | 26.5 | | | | 23.3 | | |
| IDR - Core Property Index Fund, LLC (1.9% Account Interest) | | 24.7 | | | | 25.0 | | |
| Townsend Group Value-Add Fund (99.0% Account Interest) | | | | 6.2 | | | | — | | |
| Silverpeak - REA Alt Inv Fund LP (90.0% Account Interest) | | | | 14.0 | | | | — | | |
| Grubb Southeast Real Estate Fund VI, LLC (66.7% Account Interest) | | 16.5 | | | | 13.4 | | |
| JCR Capital (49.2% Account Interest) | | 5.0 | | | | — | | |
TOTAL REAL ESTATE FUNDS (Cost $345.8 and $273.3) | | | | $ | 354.2 | | | | $ | 311.8 | | |
TOTAL REAL ESTATE JOINT VENTURES AND FUNDS (Cost $5,163.8 and $6,244.4) | | $ | 6,348.0 | | | | $ | 7,516.0 | | |
TIAA REAL ESTATE ACCOUNT
CONSOLIDATED SCHEDULES OF INVESTMENTS
(Dollar values shown in millions)
MARKETABLE SECURITIES—19.9%5.2% and 19.3%16.7%
REAL ESTATE-RELATED MARKETABLE SECURITIES—4.1%2.5% and 4.1%2.8%
| | | | | | | | | | | | | | | | | | | | | | | | | | | | | | | | |
| Shares | | Issuer | | Fair Value at |
| September 30, 2020 | | December 31, 2019 |
| 2020 | | 2019 | |
| | | | | | (Unaudited) | | | |
| 25,073 | | | 25,333 | | | Acadia Realty Trust | | $ | 0.3 | | | | $ | 0.7 | | |
| 72,132 | | | 77,213 | | | Agree Realty Corporation | | 4.6 | | | | 5.4 | | |
| 21,307 | | | 20,424 | | | Alexander & Baldwin, Inc. | | 0.2 | | | | 0.4 | | |
| 633 | | | 635 | | | Alexander's, Inc. | | 0.2 | | | | 0.2 | | |
| 93,551 | | | 114,902 | | | Alexandria Real Estate Equities, Inc. | | 15.0 | | | | 18.6 | | |
| 14,876 | | | 14,387 | | | American Assets Trust, Inc. | | 0.4 | | | | 0.7 | | |
| 40,698 | | | 40,898 | | | American Campus Communities, Inc. | | 1.4 | | | | 1.9 | | |
| 32,275 | | | 31,822 | | | American Financial Trust, Inc. | | 0.2 | | | | 0.4 | | (7) |
| 288,780 | | | 241,918 | | | American Homes 4 Rent | | 8.2 | | | | 6.3 | | |
| 261,881 | | | 298,037 | | | American Tower Corp. | | 63.3 | | | | 68.5 | | |
| 171,575 | | | 247,312 | | | Americold Realty Trust | | 6.1 | | | | 8.7 | | |
| 44,017 | | | 44,204 | | | Apartment Investment and Management Company | | 1.5 | | | | 2.3 | | |
| 62,320 | | | 62,827 | | | Apple Hospitality Inc. | | 0.6 | | | | 1.0 | | |
| 16,581 | | | 15,666 | | | Armada Hoffler Properties Inc. | | 0.2 | | | | 0.3 | | |
| — | | | 26,793 | | | Ashford Hospitality Trust, Inc. | | — | | | | 0.1 | | |
| 77,855 | | | 106,486 | | | Avalonbay Communities, Inc. | | 11.6 | | | | 22.3 | | |
| 6,887 | | | 7,650 | | | Bluerock Residential Growth, Inc. | | 0.1 | | | | 0.1 | | |
| 93,143 | | | 106,065 | | | Boston Properties, Inc. | | 7.5 | | | | 14.6 | | |
| — | | | 8,938 | | | Braemar Hotels & Resorts, Inc. | | — | | | | 0.1 | | |
| 50,095 | | | 52,132 | | | Brandywine Realty Trust | | 0.5 | | | | 0.8 | | |
| 142,974 | | | 88,801 | | | Brixmore Property Group Inc | | 1.7 | | | | 1.9 | | |
| 13,576 | | | 19,539 | | | Brookfield Property REIT | | 0.2 | | (7) | | 0.4 | | |
| 59,447 | | | 27,796 | | | Camden Property Trust | | 5.3 | | | | 2.9 | | |
| 28,242 | | | 28,420 | | | CareTrust REIT Inc. | | 0.5 | | | | 0.6 | | |
| 14,406 | | | 14,592 | | | Catchmark Timber Trust, Inc. | | 0.1 | | | | 0.2 | | |
| — | | | 50,454 | | | CBL & Associates Properties, Inc. | | — | | | | 0.1 | | (7) |
| — | | | 25,522 | | | Cedar Shopping Centers, Inc. | | — | | | | 0.1 | | |
| 13,700 | | | 13,659 | | | Chatham Lodging Trust | | 0.1 | | | | 0.3 | | |
| 13,872 | | | 15,789 | | | City Office REIT Inc. | | 0.1 | | | | 0.2 | | |
| 5,720 | | | 5,192 | | | Clipper Realty, Inc. | | — | | | | 0.1 | | |
| 143,518 | | | 492,974 | | | Colony Capital, Inc. | | 0.4 | | | | 2.3 | | |
| 33,852 | | | 34,825 | | | Columbia Property Trust Inc. | | 0.4 | | | | 0.7 | | |
| 6,229 | | | 5,492 | | | Community Healthcare Trust, Inc. | | 0.3 | | | | 0.2 | | |
| 35,356 | | | 35,462 | | | CoreCivic, Inc. | | 0.3 | | | | 0.6 | | |
| 4,974 | | | 3,830 | | | Corenergy Infrastructure Trust, Inc. | | — | | | | 0.2 | | |
| 11,604 | | | 11,903 | | | Corepoint Lodging, Inc. | | 0.1 | | | | 0.1 | | |
| 11,984 | | | 11,149 | | | CoreSite Realty Corporation | | 1.4 | | | | 1.3 | | |
| 33,373 | | | 33,505 | | | Corporate Office Properties Trust | | 0.8 | | | | 1.0 | | |
| 44,005 | | | 43,565 | | | Cousins Properties, Inc. | | 1.3 | | | | 1.8 | | |
| 221,349 | | | 248,664 | | | Crown Castle International Corporation | | 36.8 | | | | 35.3 | | |
| 57,436 | | | 57,474 | | | Cubesmart | | 1.9 | | | | 1.8 | | |
| 67,494 | | | 60,485 | | | CyrusOne Inc. | | 4.7 | | | | 4.0 | | |
| 59,040 | | | 59,944 | | | DiamondRock Hospitality Company | | 0.3 | | | | 0.7 | | |
| 153,741 | | | 94,906 | | | Digital Realty Trust, Inc. | | 22.6 | | | | 11.4 | | |
| 70,104 | | | — | | | Diversified Healthcare Trust | | 0.2 | | | | — | | |
| 49,461 | | | 49,622 | | | Douglas Emmett, Inc. | | 1.2 | | | | 2.2 | | |
| 215,078 | | | 244,465 | | | Duke Realty Corporation | | 7.9 | | | | 8.5 | | |
TIAA REAL ESTATE ACCOUNT
CONSOLIDATED SCHEDULES OF INVESTMENTS
(Dollar values shown in millions)
|
| | | | | | | | | | | | | | | | |
| Shares | | Issuer | | Fair Value at |
| September 30, 2017 | | December 31, 2016 |
| 2017 | | 2016 | |
| | | | | | | (Unaudited) | | | |
| 82,202 |
| | 84,437 |
| | Acadia Realty Trust | | $ | 2.3 |
| | | $ | 2.8 |
| |
| 28,294 |
| | 26,717 |
| | Agree Realty Corporation | | 1.4 |
| | | 1.2 |
| |
| 2,132 |
| | 2,132 |
| | Alexander's, Inc. | | 0.9 |
| | | 0.9 |
| |
| 92,255 |
| | 83,175 |
| | Alexandria Real Estate Equities, Inc. | | 11.0 |
| | | 9.2 |
| |
| 48,980 |
| | — |
| | Altisource Residential Corp. | | 0.5 |
| | | — |
| |
| 40,188 |
| | 41,010 |
| | American Assets Trust, Inc. | | 1.6 |
| | | 1.8 |
| |
| 133,888 |
| | 138,467 |
| | American Campus Communities, Inc. | | 5.9 |
| | | 6.9 |
| |
| — |
| | 6,347 |
| | American Farmland Company | | — |
| | | 0.1 |
| |
| 239,344 |
| | 233,916 |
| | American Homes 4 Rent | | 5.2 |
| | | 4.9 |
| |
| 421,695 |
| | 443,315 |
| | American Tower Corp. | | 57.6 |
| | | 46.8 |
| |
| 155,985 |
| | 163,592 |
| | Apartment Investment and Management Company | | 6.8 |
| | | 7.4 |
| |
| 210,602 |
| | 223,733 |
| | Apple Hospitality Inc. | | 4.0 |
| | | 4.5 |
| |
| 47,395 |
| | 38,282 |
| | Armada Hoffler Properties Inc. | | 0.7 |
| | | 0.6 |
| |
| 27,462 |
| | 27,631 |
| | Ashford Hospitality Prime Inc. | | 0.3 |
| | | 0.4 |
| |
| 75,865 |
| | 96,553 |
| | Ashford Hospitality Trust, Inc. | | 0.5 |
| | | 0.7 |
| |
| 137,335 |
| | 143,728 |
| | Avalonbay Communities, Inc. | | 24.5 |
| | | 25.5 |
| |
| 24,509 |
| | 21,354 |
| | Bluerock Residential Growth, Inc. | | 0.3 |
| | | 0.3 |
| |
| 153,602 |
| | 160,997 |
| | Boston Properties, Inc. | | 18.9 |
| | | 20.3 |
| |
| 172,155 |
| | 183,336 |
| | Brandywine Realty Trust | | 3.0 |
| | | 3.0 |
| |
| 305,457 |
| | 319,555 |
| | Brixmore Property Group Inc | | 5.7 |
| | | 7.8 |
| |
| 90,816 |
| | 91,727 |
| | Camden Property Trust | | 8.3 |
| | | 7.7 |
| |
| — |
| | 89,419 |
| | Care Capital Properties, Inc. | | — |
| | | 2.2 |
| |
| 76,188 |
| | 64,966 |
| | CareTrust REIT Inc. | | 1.5 |
| | | 1.0 |
| |
| 39,488 |
| | 43,788 |
| | Catchmark Timber Trust, Inc. | | 0.5 |
| | | 0.5 |
| |
| 167,957 |
| | 178,895 |
| | CBL & Associates Properties, Inc. | | 1.4 |
| (9) | | 2.1 |
| |
| 92,124 |
| | 92,124 |
| | Cedar Shopping Centers, Inc. | | 0.5 |
| | | 0.6 |
| |
| 39,759 |
| | 39,759 |
| | Chatham Lodging Trust | | 0.8 |
| | | 0.8 |
| |
| 58,946 |
| | 63,363 |
| | Chesapeake Lodging Trust | | 1.6 |
| | | 1.6 |
| |
| 15,330 |
| | — |
| | Clipper Realty, Inc. | | 0.2 |
| (9) | | — |
| |
| 541,689 |
| | — |
| | Colony Northstar, Inc. | | 6.8 |
| | | — |
| |
| — |
| | 50,961 |
| | Colony Starwood Homes | | — |
| | | 1.5 |
| |
| 122,581 |
| | 130,704 |
| | Columbia Property Trust Inc. | | 2.7 |
| | | 2.8 |
| |
| — |
| | 161,499 |
| | Communication Sales & Leasing, Inc. | | — |
| | | 4.1 |
| |
| 17,855 |
| | 13,231 |
| | Community Healthcare Trust, Inc. | | 0.5 |
| | | 0.3 |
| |
| 117,713 |
| | 117,878 |
| | CoreCivic, Inc. | | 3.2 |
| | | 2.9 |
| |
| 12,695 |
| | 12,695 |
| | Corenergy Infrastructure Trust, Inc. | | 0.4 |
| (9) | | 0.4 |
| |
| 33,863 |
| | 35,452 |
| | CoreSite Realty Corporation | | 3.8 |
| | | 2.8 |
| |
| 99,369 |
| | 98,668 |
| | Corporate Office Properties Trust | | 3.3 |
| | | 3.1 |
| |
| 414,681 |
| | 358,876 |
| | Cousins Properties Incorporated | | 3.9 |
| | | 3.1 |
| |
| 401,185 |
| | 378,286 |
| | Crown Castle International Corporation | | 40.1 |
| | | 32.8 |
| |
| 180,122 |
| | 189,128 |
| | Cubesmart | | 4.7 |
| | | 5.1 |
| |
| 86,428 |
| | 80,245 |
| | CyrusOne Inc. | | 5.1 |
| | | 3.6 |
| |
| 92,007 |
| | 95,203 |
| | DCT Industrial Trust, Inc. | | 5.3 |
| | | 4.6 |
| |
| 308,806 |
| | 326,844 |
| | DDR Corp | | 2.8 |
| | | 5.0 |
| |
| 198,919 |
| | 211,566 |
| | DiamondRock Hospitality Company | | 2.2 |
| | | 2.4 |
| |
| 203,672 |
| | 166,911 |
| | Digital Realty Trust, Inc. | | 24.1 |
| | | 16.4 |
| |
| | | | | | | | | | | | | | | | | | | | | | | | | | | | | | | | |
| Shares | | Issuer | | Fair Value at |
| September 30, 2020 | | December 31, 2019 |
| 2020 | | 2019 | |
| | | | | | (Unaudited) | | | |
| 23,594 | | | 22,034 | | | Easterly Government Properties, Inc. | | $ | 0.5 | | | | $ | 0.5 | | |
| 34,924 | | | 41,238 | | | EastGroup Properties, Inc. | | 4.5 | | | | 5.5 | | |
| 43,479 | | | 44,235 | | | Empire State Realty Trust | | 0.3 | | | | 0.6 | | |
| 21,944 | | | 23,023 | | | EPR Properties | | 0.6 | | | | 1.6 | | |
| 56,313 | | | 60,851 | | | Equinix Inc. | | 42.8 | | | | 35.5 | | |
| 247,605 | | | 256,618 | | | Equity Lifestyle Properties, Inc. | | 15.2 | | | | 18.1 | | |
| 220,359 | | | 283,999 | | | Equity Residential | | 11.3 | | | | 23.0 | | |
| 40,399 | | | 188,894 | | | Essential Properties Realty | | 0.7 | | | | 4.7 | | |
| 30,746 | | | 54,492 | | | Essex Property Trust, Inc. | | 6.2 | | | | 16.4 | | |
| 76,604 | | | 107,410 | | | Extra Space Storage, Inc. | | 8.2 | | | | 11.3 | | |
| 7,718 | | | 8,142 | | | Farmland Partners, Inc. | | 0.1 | | (7) | | 0.1 | | |
| 22,373 | | | 66,222 | | | Federal Realty Investment Trust | | 1.6 | | | | 8.5 | | |
| 37,527 | | | 37,538 | | | First Industrial Realty Trust, Inc. | | 1.5 | | | | 1.6 | | |
| 20,802 | | | 20,389 | | | Four Corners Property Trust | | 0.5 | | | | 0.6 | | |
| 30,706 | | | 30,896 | | | Franklin Street Properties Corp. | | 0.1 | | | | 0.3 | | |
| 14,805 | | | 14,739 | | | Front Yard Residential Corp. | | 0.1 | | | | 0.2 | | |
| 197,372 | | | 180,230 | | | Gaming and Leisure Properties, Inc. | | 7.3 | | | | 7.8 | | |
| 58,800 | | | 160,000 | | | GDS Holdings LTD ADR | | 4.8 | | | | 4.0 | | (7) |
| 34,822 | | | 35,427 | | | GEO Group Inc./The | | 0.4 | | | | 0.6 | | |
| 9,977 | | | 9,933 | | | Getty Realty Corp. | | 0.3 | | | | 0.3 | | |
| 9,944 | | | 9,121 | | | Gladstone Commercial Corporation | | 0.2 | | | | 0.2 | | |
| 5,607 | | | 6,226 | | | Gladstone Land Corporation | | 0.1 | | | | 0.1 | | |
| 12,135 | | | 9,380 | | | Global Medical REIT, Inc. | | 0.2 | | | | 0.1 | | |
| 26,651 | | | 26,663 | | | Global Net Lease, Inc. | | 0.4 | | | | 0.5 | | |
| 39,943 | | | 39,221 | | | Healthcare Realty Trust Inc. | | 1.2 | | | | 1.3 | | |
| 107,725 | | | 60,957 | | | Healthcare Trust of America | | 2.8 | | | | 1.8 | | |
| 406,778 | | | 496,493 | | | Healthpeak Properties, Inc. | | 11.0 | | | | 17.1 | | |
| 10,062 | | | 10,385 | | | Hersha Hospitality Trust | | 0.1 | | | | 0.2 | | |
| 58,079 | | | 30,535 | | | Highwoods Properties, Inc. | | 1.9 | | | | 1.5 | | |
| 13,400 | | | — | | | Hilton Worldwide Holdings | | 1.1 | | | | — | | |
| 391,981 | | | 661,737 | | | Host Hotels & Resorts, Inc. | | 4.2 | | | | 12.3 | | |
| 44,652 | | | 275,440 | | | Hudson Pacific Properties, Inc. | | 1.0 | | | | 10.4 | | |
| 28,014 | | | 26,784 | | | Independence Realty Trust, Inc. | | 0.3 | | | | 0.4 | | |
| 19,191 | | | 19,292 | | | Industrial Logics Properties | | 0.4 | | | | 0.4 | | |
| — | | | 134,775 | | | Interxion Holding NV | | — | | | | 7.0 | | |
| 3,791 | | | 3,467 | | | Investors Real Estate Trust | | 0.2 | | | | 0.3 | | |
| 550,440 | | | 559,204 | | | Invitation Homes, Inc. | | 15.4 | | | | 16.8 | | |
| 85,040 | | | 84,852 | | | Iron Mountain Inc. | | 2.3 | | | | 2.7 | | |
| 15,700 | | | 163,782 | | | iShares Dow Jones US Real Estate Index Fund | | 1.3 | | | | 15.2 | | (7) |
| 36,211 | | | 36,559 | | | JBG Smith Properties | | 1.0 | | | | 1.5 | | |
| 6,583 | | | — | | | Jernigan Capital Inc. | | 0.1 | | | | — | | |
| 67,058 | | | 95,936 | | | Kilroy Realty Corporation | | 3.5 | | | | 8.0 | | |
| 181,606 | | | 120,171 | | | Kimco Realty Corporation | | 2.0 | | | | 2.5 | | |
| 24,550 | | | 24,663 | | | Kite Realty Group Trust | | 0.3 | | | | 0.5 | | |
| 43,653 | | | 25,456 | | | Lamar Advertising Corporation | | 2.9 | | | | 2.3 | | |
| 23,500 | | | — | | | Las Vegas Sands Corporation | | 1.1 | | | | — | | |
| 80,643 | | | 71,595 | | | Lexington Realty Trust | | 0.8 | | | | 0.8 | | |
| — | | | 46,357 | | | Liberty Property Trust | | — | | | | 2.8 | | |
| 13,865 | | | 13,885 | | | Life Storage, Inc. | | 1.5 | | | | 1.5 | | |
| 11,494 | | | 11,718 | | | LTC Properties, Inc. | | 0.4 | | | | 0.5 | | |
TIAA REAL ESTATE ACCOUNT
CONSOLIDATED SCHEDULES OF INVESTMENTS
(Dollar values shown in millions)
|
| | | | | | | | | | | | | | | | |
| Shares | | Issuer | | Fair Value at |
| September 30, 2017 | | December 31, 2016 |
| 2017 | | 2016 | |
| | | | | | | (Unaudited) | | | |
| 144,167 |
| | 146,715 |
| | Douglas Emmett, Inc. | | $ | 5.7 |
| | | $ | 5.4 |
| |
| 355,455 |
| | 371,513 |
| | Duke Realty Corporation | | 10.2 |
| | | 9.9 |
| |
| — |
| | 79,039 |
| | DuPont Fabros Technology, Inc. | | — |
| | | 3.5 |
| |
| 38,107 |
| | 38,107 |
| | Easterly Government Properties, Inc. | | 0.8 |
| | | 0.8 |
| |
| 32,984 |
| | 34,448 |
| | EastGroup Properties, Inc. | | 2.9 |
| | | 2.5 |
| |
| 73,142 |
| | 76,609 |
| | Education Realty Trust, Inc. | | 2.6 |
| | | 3.2 |
| |
| 125,679 |
| | 128,313 |
| | Empire State Realty Trust | | 2.6 |
| | | 2.6 |
| |
| 62,943 |
| | 66,086 |
| | EPR Properties | | 4.4 |
| | | 4.7 |
| |
| 77,532 |
| | 74,499 |
| | Equinix Inc. | | 34.6 |
| | | 26.6 |
| |
| 120,619 |
| | 132,412 |
| | Equity Commonwealth | | 3.7 |
| | | 4.0 |
| |
| 81,386 |
| | 81,207 |
| | Equity Lifestyle Properties, Inc. | | 6.9 |
| | | 5.9 |
| |
| — |
| | 97,735 |
| | Equity One, Inc. | | — |
| | | 3.0 |
| |
| 355,638 |
| | 378,516 |
| | Equity Residential | | 23.4 |
| | | 24.4 |
| |
| 39,142 |
| | 39,142 |
| | Escrow Winthrop Realty Trust | | 0.3 |
| | | 0.3 |
| |
| 65,165 |
| | 68,928 |
| | Essex Property Trust, Inc. | | 16.6 |
| | | 16.0 |
| |
| 121,584 |
| | 123,598 |
| | Extra Space Storage, Inc. | | 9.7 |
| | | 9.5 |
| |
| 33,146 |
| | 20,247 |
| | Farmland Partners, Inc. | | 0.3 |
| (9) | | 0.2 |
| (9) |
| 72,018 |
| | 75,390 |
| | Federal Realty Investment Trust | | 8.9 |
| | | 10.7 |
| |
| — |
| | 146,636 |
| | FelCor Lodging Trust Incorporated | | — |
| | | 1.2 |
| |
| 117,988 |
| | 122,078 |
| | First Industrial Realty Trust, Inc. | | 3.6 |
| | | 3.4 |
| |
| 62,454 |
| | 62,454 |
| | First Potomac Realty Trust | | 0.7 |
| | | 0.7 |
| |
| 242,943 |
| | 247,510 |
| | Forest City Realty Trust A | | 6.2 |
| | | 5.2 |
| |
| 62,347 |
| | 62,347 |
| | Four Corners Property Trust | | 1.6 |
| | | 1.3 |
| |
| 105,457 |
| | 105,457 |
| | Franklin Street Properties Corp. | | 1.1 |
| | | 1.4 |
| |
| 200,306 |
| | 215,403 |
| | Gaming and Leisure Properties, Inc. | | 7.4 |
| | | 6.6 |
| |
| 616,628 |
| | 528,439 |
| | General Growth Properties, Inc. | | 12.8 |
| | | 13.2 |
| |
| 121,553 |
| | 75,332 |
| | GEO Group, Inc./The | | 3.3 |
| | | 2.7 |
| |
| 32,335 |
| | 27,304 |
| | Getty Realty Corp. | | 0.9 |
| | | 0.7 |
| |
| 27,842 |
| | 24,752 |
| | Gladstone Commercial Corporation | | 0.6 |
| | | 0.5 |
| |
| 7,822 |
| | — |
| | Gladstone Land Corporation | | 0.1 |
| | | — |
| |
| 14,323 |
| | 14,323 |
| | Global Medical REIT, Inc. | | 0.1 |
| (9) | | 0.1 |
| (9) |
| 66,375 |
| | 169,785 |
| | Global Net Lease, Inc. | | 1.5 |
| | | 1.3 |
| |
| 93,766 |
| | 74,542 |
| | Government Properties Income Trust | | 1.8 |
| | | 1.4 |
| |
| 150,155 |
| | 439,336 |
| | Gramercy Property Trust Inc. | | 4.5 |
| | | 4.0 |
| |
| 468,228 |
| | 488,199 |
| | HCP, Inc. | | 13.0 |
| | | 14.5 |
| |
| 121,482 |
| | 121,172 |
| | Healthcare Realty Trust Inc. | | 3.9 |
| | | 3.7 |
| |
| 197,648 |
| | 148,194 |
| | Healthcare Trust of America | | 5.9 |
| | | 4.3 |
| |
| 38,921 |
| | 38,921 |
| | Hersha Hospitality Trust | | 0.7 |
| | | 0.8 |
| |
| 100,544 |
| | 105,127 |
| | Highwoods Properties, Inc. | | 5.2 |
| | | 5.4 |
| |
| 162,463 |
| | 172,557 |
| | Hospitality Properties Trust | | 4.6 |
| | | 5.5 |
| |
| 730,412 |
| | 784,264 |
| | Host Hotels & Resorts, Inc. | | 13.5 |
| | | 14.8 |
| |
| 156,033 |
| | 130,545 |
| | Hudson Pacific Properties, Inc. | | 5.2 |
| | | 4.5 |
| |
| 70,772 |
| | 64,154 |
| | Independence Realty Trust, Inc. | | 0.7 |
| | | 0.6 |
| |
| 130,841 |
| | 130,841 |
| | Investors Real Estate Trust | | 0.8 |
| | | 0.9 |
| |
| 87,831 |
| | — |
| | Invitation Homes | | 2.0 |
| | | — |
| |
| 262,389 |
| | 251,283 |
| | Iron Mountain Inc. | | 10.2 |
| | | 8.2 |
| |
| 1,500,000 |
| | 1,500,000 |
| | iShares Dow Jones US Real Estate Index Fund | | 119.8 |
| | | 115.4 |
| (9) |
| 86,089 |
| | — |
| | JBG Smith Properties | | 2.9 |
| | | — |
| |
| 96,468 |
| | 96,739 |
| | Kilroy Realty Corporation | | 6.9 |
| | | 7.1 |
| |
| | | | | | | | | | | | | | | | | | | | | | | | | | | | | | | | |
| Shares | | Issuer | | Fair Value at |
| September 30, 2020 | | December 31, 2019 |
| 2020 | | 2019 | |
| | | | | | (Unaudited) | | | |
| 25,596 | | | 25,783 | | | Mack-Cali Realty Corporation | | $ | 0.3 | | | | $ | 0.6 | | |
| 9,400 | | | — | | | Marriott Internationsl | | 0.9 | | | | — | | |
| 225,132 | | | 152,801 | | | Medical Properties Trust, Inc. | | 4.0 | | | | 3.2 | | |
| 266,400 | | | 220,000 | | | Megaport, LTD | | 3.1 | | | | 1.7 | | |
| 78,400 | | | 85,000 | | | MGM Growth Properties, L.L.C. | | 2.2 | | | | 2.6 | | |
| 66,600 | | | — | | | MGM Resorts International | | 1.4 | | | | — | | |
| 92,586 | | | 103,823 | | | Mid-America Apartment Communities, Inc. | | 10.7 | | | | 13.7 | | |
| 28,064 | | | 27,502 | | | Monmouth Real Estate Investment Corporation | | 0.4 | | | | 0.4 | | |
| 12,719 | | | 12,615 | | | National Health Investors, Inc. | | 0.8 | | | | 1.0 | | |
| 50,917 | | | 50,907 | | | National Retail Properties, Inc. | | 1.8 | | | | 2.7 | | |
| 18,309 | | | 17,663 | | | National Storage Affiliates Trust | | 0.6 | | | | 0.6 | | |
| 24,224 | | | 24,918 | | | New Senior Investment Group | | 0.1 | | | | 0.2 | | |
| 6,412 | | | 5,632 | | | Nexpoint Residential Trust, Inc. | | 0.3 | | | | 0.3 | | |
| 215,500 | | | — | | | NEXTDC LTD | | 1.9 | | | | — | | |
| 14,139 | | | 14,200 | | | Office Properties Income Trust, Inc. | | 0.3 | | | | 0.5 | | |
| 145,294 | | | 64,786 | | | Omega Healthcare Investors, Inc. | | 4.4 | | | | 2.7 | | |
| 4,669 | | | 4,628 | | | One Liberty Properties, Inc. | | 0.1 | | | | 0.1 | | |
| 78,036 | | | 42,727 | | | Outfront Media Inc. | | 1.1 | | | | 1.1 | | |
| 56,251 | | | 58,127 | | | Paramount Group Inc. | | 0.4 | | | | 0.8 | | |
| 245,999 | | | 71,359 | | | Park Hotels & Resorts, Inc. | | 2.5 | | | | 1.8 | | |
| 65,974 | | | 38,713 | | | Pebblebrook Hotel Trust | | 0.8 | | | | 1.0 | | (7) |
| — | | | 20,665 | | | Pennsylvania Real Estate Investment Trust | | — | | | | 0.1 | | |
| 61,538 | | | 55,271 | | | Physicians Realty Trust | | 1.1 | | | | 1.0 | | |
| 37,307 | | | 37,274 | | | Piedmont Office Realty Trust, Inc. | | 0.5 | | | | 0.8 | | |
| 4,353 | | | 3,863 | | | Plymouth Industrial REIT, Inc. | | 0.1 | | | | 0.1 | | |
| 19,371 | | | 19,688 | | | Potlatch Corporation | | 0.8 | | | | 0.9 | | |
| 14,060 | | | 13,220 | | | Preferred Apartment Communities, Inc. | | 0.1 | | | | 0.2 | | |
| 481,188 | | | 472,201 | | | ProLogis | | 48.3 | | | | 42.1 | | |
| 5,942 | | | 5,958 | | | PS Business Parks, Inc. | | 0.7 | | | | 1.0 | | |
| 81,548 | | | 82,126 | | | Public Storage, Inc. | | 18.2 | | | | 17.5 | | |
| 36,153 | | | 105,041 | | | QTS Realty Trust, Inc. | | 2.3 | | | | 5.7 | | |
| 39,104 | | | 38,741 | | | Rayonier, Inc. | | 1.0 | | | | 1.3 | | |
| 203,950 | | | 197,129 | | | Realty Income Corporation | | 12.4 | | | | 14.4 | | |
| 159,800 | | | 159,520 | | | Regency Centers Corporation | | 6.1 | | | | 10.1 | | |
| 33,743 | | | 33,519 | | | Retail Opportunity Investment | | 0.4 | | | | 0.6 | | |
| 63,396 | | | 63,727 | | | Retail Properties of America | | 0.4 | | | | 0.9 | | |
| 4,850 | | | 4,440 | | | Retail Value, Inc. | | 0.1 | | | | 0.2 | | |
| 299,126 | | | 282,611 | | | Rexford Industrial Realty Inc. | | 13.7 | | | | 12.8 | | |
| 48,523 | | | 50,071 | | | RLJ Lodging Trust | | 0.4 | | | | 0.9 | | |
| 23,850 | | | 23,246 | | | RPT Realty | | 0.1 | | | | 0.3 | | |
| 14,916 | | | 13,660 | | | Ryman Hospitality Properties | | 0.5 | | | | 1.2 | | |
| 178,227 | | | 167,181 | | | Sabra Health Care REIT Inc. | | 2.5 | | | | 3.6 | | |
| 5,111 | | | 3,168 | | | Safe Hold, Inc. | | 0.3 | | (7) | | 0.1 | | |
| 3,527 | | | 3,537 | | | Saul Centers, Inc. | | 0.1 | | | | 0.2 | | |
| 68,913 | | | 76,914 | | | SBA Communications Corporation | | 21.8 | | | | 18.5 | | |
| — | | | 70,465 | | | Senior Housing Properties Trust | | — | | | | 0.6 | | |
| 48,468 | | | 48,715 | | | Service Properties Trust | | 0.4 | | | | 1.2 | | |
| 188,182 | | | 200,628 | | | Simon Property Group, Inc. | | 12.2 | | | | 29.9 | | |
| 154,971 | | | 394,633 | | | Site Centers Corporation | | 1.1 | | | | 5.5 | | |
| 62,444 | | | 115,766 | | | SL Green Realty Corp. | | 2.9 | | (7) | | 10.6 | | |
TIAA REAL ESTATE ACCOUNT
CONSOLIDATED SCHEDULES OF INVESTMENTS
(Dollar values shown in millions)
|
| | | | | | | | | | | | | | | | |
| Shares | | Issuer | | Fair Value at |
| September 30, 2017 | | December 31, 2016 |
| 2017 | | 2016 | |
| | | | | | | (Unaudited) | | | |
| 413,143 |
| | 446,152 |
| | Kimco Realty Corporation | | $ | 8.1 |
| | | $ | 11.2 |
| |
| 82,157 |
| | 86,474 |
| | Kite Realty Group Trust | | 1.7 |
| | | 2.0 |
| |
| 82,861 |
| | 86,839 |
| | Lamar Advertising Corporation | | 5.7 |
| | | 5.8 |
| |
| 113,248 |
| | 118,625 |
| | LaSalle Hotel Properties | | 3.3 |
| | | 3.6 |
| |
| 233,615 |
| | 246,697 |
| | Lexington Realty Trust | | 2.4 |
| | | 2.7 |
| |
| 147,200 |
| | 154,875 |
| | Liberty Property Trust | | 6.0 |
| | | 6.1 |
| |
| 45,893 |
| | 48,870 |
| | Life Storage, Inc. | | 3.8 |
| | | 4.2 |
| |
| 39,429 |
| | 41,261 |
| | LTC Properties, Inc. | | 1.9 |
| | | 1.9 |
| |
| 91,244 |
| | 93,046 |
| | Mack-Cali Realty Corporation | | 2.2 |
| | | 2.7 |
| |
| 29,800 |
| | 23,475 |
| | Medequities Realty Trust, Inc. | | 0.4 |
| | | 0.3 |
| |
| 362,242 |
| | 337,220 |
| | Medical Properties Trust, Inc. | | 4.8 |
| | | 4.1 |
| |
| 113,412 |
| | 118,873 |
| | Mid-America Apartment Communities, Inc. | | 12.1 |
| | | 11.6 |
| |
| 71,720 |
| | 69,038 |
| | Monmouth Real Estate Investment Corporation | | 1.2 |
| | | 1.1 |
| |
| — |
| | 175,519 |
| | Monogram Residential Trust Inc. | | — |
| | | 1.9 |
| |
| 39,678 |
| | 38,542 |
| | National Health Investors, Inc. | | 3.1 |
| | | 2.9 |
| |
| 148,742 |
| | 154,142 |
| | National Retail Properties, Inc. | | 6.2 |
| | | 6.8 |
| |
| 44,249 |
| | 44,249 |
| | National Storage Affiliates Trust | | 1.1 |
| | | 1.0 |
| |
| 83,324 |
| | 83,324 |
| | New Senior Investment Group | | 0.8 |
| | | 0.8 |
| |
| — |
| | 175,401 |
| | New York REIT | | — |
| | | 1.8 |
| |
| 17,140 |
| | 17,140 |
| | Nexpoint Residential Trust, Inc. | | 0.4 |
| | | 0.4 |
| |
| 54,554 |
| | 59,329 |
| | NorthStar Realty Europe Corp. | | 0.7 |
| | | 0.7 |
| |
| — |
| | 189,799 |
| | NorthStar Realty Finance Corp. | | — |
| | | 2.9 |
| |
| 194,823 |
| | 181,435 |
| | Omega Healthcare Investors, Inc. | | 6.2 |
| (9) | | 5.7 |
| |
| 16,324 |
| | 16,324 |
| | One Liberty Properties, Inc. | | 0.4 |
| | | 0.4 |
| |
| 138,381 |
| | 144,614 |
| | Outfront Media Inc. | | 3.5 |
| | | 3.6 |
| |
| 198,430 |
| | 157,741 |
| | Paramount Group Inc. | | 3.2 |
| | | 2.5 |
| |
| 144,718 |
| | — |
| | Park Hotels & Resorts, Inc. | | 4.0 |
| | | — |
| |
| 42,820 |
| | 45,533 |
| | Parkway Properties, Inc. | | 1.0 |
| | | 1.0 |
| |
| 68,431 |
| | 75,815 |
| | Pebblebrook Hotel Trust | | 2.5 |
| (9) | | 2.3 |
| |
| 69,866 |
| | 69,866 |
| | Pennsylvania Real Estate Investment Trust | | 0.7 |
| (9) | | 1.3 |
| |
| 178,281 |
| | 141,267 |
| | Physicians Realty Trust | | 3.2 |
| | | 2.7 |
| |
| 144,783 |
| | 153,053 |
| | Piedmont Office Realty Trust, Inc. | | 2.9 |
| | | 3.2 |
| |
| 40,092 |
| | 39,487 |
| | Potlatch Corporation | | 2.0 |
| | | 1.6 |
| |
| 30,894 |
| | 25,352 |
| | Preferred Apartment Communities, Inc. | | 0.6 |
| | | 0.4 |
| |
| 526,083 |
| | 549,455 |
| | ProLogis | | 33.4 |
| | | 29.0 |
| |
| 19,639 |
| | 20,916 |
| | PS Business Parks, Inc. | | 2.6 |
| | | 2.4 |
| |
| 147,591 |
| | 152,197 |
| | Public Storage, Inc. | | 31.6 |
| | | 34.0 |
| |
| 47,384 |
| | 47,125 |
| | QTS Realty Trust, Inc. | | 2.5 |
| | | 2.3 |
| |
| 96,479 |
| | 98,883 |
| | Quality Care Properties | | 1.5 |
| | | 1.5 |
| |
| 78,232 |
| | 82,342 |
| | Ramco-Gershenson Properties Trust | | 1.0 |
| | | 1.4 |
| |
| 127,625 |
| | 129,796 |
| | Rayonier, Inc. | | 3.7 |
| | | 3.4 |
| |
| 272,317 |
| | 270,184 |
| | Realty Income Corporation | | 15.6 |
| | | 15.5 |
| |
| 149,168 |
| | 109,616 |
| | Regency Centers Corporation | | 9.3 |
| | | 7.6 |
| |
| 107,617 |
| | 113,887 |
| | Retail Opportunity Investment | | 2.0 |
| | | 2.4 |
| |
| 230,343 |
| | 247,302 |
| | Retail Properties of America | | 3.0 |
| | | 3.8 |
| |
| 70,011 |
| | 67,197 |
| | Rexford Industrial Realty Inc. | | 2.0 |
| | | 1.6 |
| |
| 169,181 |
| | 131,026 |
| | RLJ Lodging Trust | | 3.7 |
| | | 3.2 |
| |
| 44,005 |
| | 50,994 |
| | Ryman Hospitality Properties | | 2.7 |
| | | 3.2 |
| |
| 173,736 |
| | 68,440 |
| | Sabra Health Care REIT Inc. | | 3.8 |
| | | 1.7 |
| |
| | | | | | | | | | | | | | | | | | | | | | | | | | | | | | | | |
| Shares | | Issuer | | Fair Value at |
| September 30, 2020 | | December 31, 2019 |
| 2020 | | 2019 | |
| | | | | | (Unaudited) | | | |
| 50,179 | | | 29,513 | | | Spirit Realty Capital Inc. | | $ | 1.7 | | | | $ | 1.5 | | |
| 44,309 | | | 39,632 | | | Stag Industrial, Inc. | | 1.4 | | | | 1.3 | | |
| 135,689 | | | 228,776 | | | STORE Capital Corporation | | 3.7 | | | | 8.5 | | |
| 30,564 | | | 30,813 | | | Summit Hotel Properties, Inc. | | 0.2 | | | | 0.4 | | |
| 125,070 | | | 123,951 | | | Sun Communities, Inc. | | 17.6 | | | | 18.6 | | |
| 63,544 | | | 66,821 | | | Sunstone Hotel Investors, L.L.C. | | 0.5 | | (7) | | 0.9 | | (7) |
| 26,770 | | | 27,198 | | | Tanger Factory Outlet Centers, Inc. | | 0.2 | | | | 0.4 | | |
| 31,238 | | | 39,475 | | | Taubman Centers, Inc. | | 1.0 | | | | 1.2 | | |
| 113,712 | | | 139,538 | | | Terreno Realty Corporation | | 6.2 | | | | 7.6 | | |
| 87,283 | | | 42,266 | | | The Macerich Company | | 0.6 | | (7) | | 1.1 | | (7) |
| 87,107 | | | 86,400 | | | UDR, Inc. | | 2.8 | | | | 4.0 | | |
| 10,834 | | | 10,668 | | | UMH Properties, Inc. | | 0.1 | | | | 0.2 | | |
| 112,027 | | | 150,082 | | | UNITI Group, Inc. | | 1.2 | | | | 1.2 | | (7) |
| 3,794 | | | 3,816 | | | Universal Health Realty Income Trust | | 0.2 | | | | 0.4 | | |
| 34,307 | | | 34,264 | | | Urban Edge Properties | | 0.3 | | | | 0.7 | | |
| 8,790 | | | 8,803 | | | Urstadt Biddle Properties, Inc. | | 0.1 | | | | 0.2 | | |
| 15,700 | | | 85,000 | | | Vanguard Real Estate ETF | | 1.2 | | (7) | | 7.9 | | |
| 259,633 | | | 190,949 | | | Ventas, Inc. | | 10.9 | | | | 11.0 | | |
| 321,061 | | | 318,132 | | | VEREIT, Inc. | | 2.1 | | | | 2.9 | | |
| 397,575 | | | 377,486 | | | Vici Properties, Inc. | | 9.3 | | | | 9.6 | | |
| 96,868 | | | 51,469 | | | Vornado Realty Trust | | 3.3 | | | | 3.4 | | |
| 54,997 | | | 55,611 | | | Washington Prime Group, Inc. | | 0.1 | | (7) | | 0.2 | | (7) |
| 24,389 | | | 23,876 | | | Washington Real Estate Investment Trust | | 0.5 | | | | 0.7 | | |
| 36,058 | | | 36,198 | | | Weingarten Realty Investors | | 0.6 | | | | 1.1 | | |
| 288,574 | | | 300,767 | | | Welltower Inc. | | 15.9 | | | | 24.5 | | |
| 456,736 | | | 386,918 | | | Weyerhaeuser Company | | 13.0 | | | | 11.7 | | |
| 11,775 | | | 11,404 | | | Whitestone Real Estate Investment Trust B | | 0.1 | | | | 0.2 | | |
| 69,680 | | | 50,897 | | | WP Carey Inc. | | 4.5 | | | | 4.1 | | |
| 11,800 | | | — | | | Wynn Resorts LTD | | 0.8 | | | | — | | |
| 33,491 | | | 33,741 | | | Xenia Hotels & Resorts, Inc. | | 0.3 | | | | 0.7 | | |
| | | | | | | | | | |
TOTAL REAL ESTATE-RELATED MARKETABLE SECURITIES
(Cost $634.7 and $686.0) | | $ | 662.2 | | | | $ | 825.7 | | |
|
| | | | | | | | | | | | | | | | |
| Shares | | Issuer | | Fair Value at |
| September 30, 2017 | | December 31, 2016 |
| 2017 | | 2016 | |
| | | | | | | (Unaudited) | | | |
| 11,006 |
| | — |
| | Safety Income and Growth, Inc. | | $ | 0.2 |
| | | $ | — |
| |
| 11,082 |
| | 14,267 |
| | Saul Centers, Inc. | | 0.7 |
| | | 0.9 |
| |
| 119,786 |
| | — |
| | SBA Communications Corporation | | 17.3 |
| | | — |
| |
| 63,334 |
| | 71,466 |
| | Select Income Real Estate Investment Trust | | 1.5 |
| | | 1.8 |
| |
| 235,142 |
| | 248,749 |
| | Senior Housing Properties Trust | | 4.6 |
| | | 4.7 |
| |
| — |
| | 36,820 |
| | Silver Bay Realty Trust Corp. | | — |
| | | 0.6 |
| |
| 310,266 |
| | 329,687 |
| | Simon Property Group, Inc. | | 50.0 |
| | | 58.6 |
| |
| 96,162 |
| | 106,453 |
| | SL Green Realty Corp. | | 9.7 |
| | | 11.4 |
| |
| 483,394 |
| | 483,032 |
| | Spirit Realty Capital Inc. | | 4.1 |
| | | 5.2 |
| |
| 91,969 |
| | 78,649 |
| | Stag Industrial, Inc. | | 2.5 |
| | | 1.9 |
| |
| 126,762 |
| | — |
| | Starwood Waypoint Homes | | 4.6 |
| | | — |
| |
| 170,571 |
| | 162,012 |
| | STORE Capital Corporation | | 4.2 |
| | | 4.0 |
| |
| 101,582 |
| | 88,627 |
| | Summit Hotel Properties, Inc. | | 1.6 |
| | | 1.4 |
| |
| 75,320 |
| | 68,173 |
| | Sun Communities, Inc. | | 6.5 |
| | | 5.2 |
| |
| 223,998 |
| | 227,526 |
| | Sunstone Hotel Investors, Inc. | | 3.6 |
| | | 3.5 |
| |
| 93,587 |
| | 100,862 |
| | Tanger Factory Outlet Centers, Inc. | | 2.3 |
| | | 3.6 |
| |
| 59,024 |
| | 63,335 |
| | Taubman Centers, Inc. | | 2.9 |
| | | 4.7 |
| |
| 50,869 |
| | 48,484 |
| | Terreno Realty Corporation | | 1.8 |
| | | 1.4 |
| |
| 136,929 |
| | 150,999 |
| | The Macerich Company | | 7.5 |
| | | 10.7 |
| |
| 50,411 |
| | 50,411 |
| | Tier Inc. | | 1.0 |
| | | 0.9 |
| |
| 265,245 |
| | 280,233 |
| | UDR, Inc. | | 10.1 |
| | | 10.2 |
| |
| 30,879 |
| | 27,329 |
| | UMH Properties, Inc. | | 0.5 |
| | | 0.4 |
| |
| 165,032 |
| | — |
| | UNITI Group, Inc. | | 2.4 |
| | | — |
| |
| 13,049 |
| | 14,676 |
| | Universal Health Realty Income Trust | | 1.0 |
| | | 1.0 |
| |
| 97,222 |
| | 93,500 |
| | Urban Edge Properties | | 2.3 |
| | | 2.6 |
| |
| 31,959 |
| | 31,959 |
| | Urstadt Biddle Properties, Inc. | | 0.7 |
| | | 0.8 |
| |
| 353,728 |
| | 371,296 |
| | Ventas, Inc. | | 23.0 |
| | | 23.2 |
| |
| 975,362 |
| | 1,012,629 |
| | VEREIT, Inc. | | 8.1 |
| | | 8.6 |
| |
| 172,179 |
| | 177,780 |
| | Vornado Realty Trust | | 13.2 |
| | | 18.6 |
| |
| 185,508 |
| | 193,859 |
| | Washington Prime Group, Inc. | | 1.5 |
| | | 2.0 |
| |
| 76,866 |
| | 78,200 |
| | Washington Real Estate Investment Trust | | 2.5 |
| | | 2.6 |
| |
| 119,216 |
| | 120,820 |
| | Weingarten Realty Investors | | 3.8 |
| | | 4.3 |
| |
| 365,663 |
| | 380,425 |
| | Welltower Inc. | | 25.7 |
| | | 25.5 |
| |
| 744,863 |
| | 783,938 |
| | Weyerhaeuser Company | | 25.3 |
| | | 23.6 |
| |
| 38,883 |
| | 32,110 |
| | Whitestone Real Estate Investment Trust B | | 0.5 |
| | | 0.5 |
| |
| 105,577 |
| | 95,234 |
| | WP Carey Inc. | | 7.1 |
| | | 5.6 |
| |
| 107,316 |
| | 113,720 |
| | Xenia Hotels & Resorts Inc. | | 2.3 |
| | | 2.2 |
| |
TOTAL REAL ESTATE-RELATED MARKETABLE SECURITIES
(Cost $889.5 and $883.9) | | $ | 1,121.0 |
| | | $ | 1,081.5 |
| |
TIAA REAL ESTATE ACCOUNT
CONSOLIDATED SCHEDULES OF INVESTMENTS
(Dollar values shown in millions)
OTHER MARKETABLE SECURITIES—15.8%2.7% and 15.2%13.9%
U.S. GOVERNMENT AGENCY NOTES—12.1%0.0% and 8.7%0.7% | | | | | | | | | | | | | | | | | | Issuer | | Yield(4) | | Maturity
Date | | Fair Value at |
| Principal | Principal | | Issuer | | Yield(4) | | Maturity Date | | Fair Value at | Principal | September 30, 2020 | | December 31, 2019 |
| September 30, 2017 | | December 31, 2016 | |
| 2017 | | 2016 | | |
| 2020 | | 2020 | | 2019 | | Issuer | | Yield(4) | | Maturity
Date | | September 30, 2020 | | December 31, 2019 |
| | | | | | (Unaudited) | | | | | | |
| $ | — |
| | $ | 22.0 |
| | Fannie Mae Discount Notes | | 0.416% | | 2/1/2017 | | $ | — |
| | $ | 22.0 |
| — | | | $ | 65.4 | | | $ | — | | | $ | 65.5 | |
| — | — |
| | 42.0 |
| | Fannie Mae Discount Notes | | 0.366% - 0.482% | | 3/1/2017 | | — |
| | 42.0 |
| — | | | 50.0 | | | Federal Home Loan Bank | | 1.700% | | 12/20/2021 | | — | | | 50.0 | |
| — | — |
| | 10.0 |
| | Fannie Mae Discount Notes | | 0.427% | | 3/3/2017 | | — |
| | 10.0 |
| — | | | 4.8 | | | Federal Home Loan Bank Discount Notes | | 1.521%-1.572% | | 1/6/2020 | | — | | | 4.8 | |
| — | — |
| | 20.0 |
| | Fannie Mae Discount Notes | | 0.427% | | 3/6/2017 | | — |
| | 20.0 |
| — | | | 21.2 | | | Federal Home Loan Bank Discount Notes | | 1.680% | | 1/10/2020 | | — | | | 21.2 | |
| — | — |
| | 20.0 |
| | Fannie Mae Discount Notes | | 0.406% | | 3/13/2017 | | — |
| | 20.0 |
| — | | | 26.0 | | | Federal Home Loan Bank Discount Notes | | 1.700% | | 1/15/2020 | | — | | | 26.0 | |
| — | — |
| | 30.3 |
| | Fannie Mae Discount Notes | | 0.406% | | 3/27/2017 | | — |
| | 30.3 |
| — | | | 43.0 | | | Federal Home Loan Bank Discount Notes | | 1.575%-1.593% | | 1/31/2020 | | — | | | 42.9 | |
| — |
| | 25.0 |
| | Fannie Mae Discount Notes | | 0.406% | | 3/28/2017 | | — |
| | 25.0 |
| |
| — |
| | 30.0 |
| | Fannie Mae Discount Notes | | 0.518% | | 4/18/2017 | | — |
| | 29.9 |
| |
| — |
| | 24.0 |
| | Fannie Mae Discount Notes | | 0.483% - 0.579% | | 4/19/2017 | | — |
| | 24.0 |
| |
| — |
| | 31.5 |
| | Fannie Mae Discount Notes | | 0.447% - 0.539% | | 5/1/2017 | | — |
| | 31.5 |
| |
| — |
| | 49.9 |
| | Fannie Mae Discount Notes | | 0.518% | | 5/2/2017 | | — |
| | 49.9 |
| |
| — |
| | 39.9 |
| | Fannie Mae Discount Notes | | 0.539% | | 5/5/2017 | | — |
| | 39.9 |
| |
| 34.9 |
| | — |
| | Fannie Mae Discount Notes | | 0.987% | | 10/2/2017 | | 34.9 |
| | — |
| |
| 47.1 |
| | — |
| | Fannie Mae Discount Notes | | 1.017% - 1.038% | | 10/11/2017 | | 47.1 |
| | — |
| |
| 35.1 |
| | — |
| | Fannie Mae Discount Notes | | 1.027% | | 10/12/2017 | | 35.1 |
| | — |
| |
| 33.6 |
| | — |
| | Fannie Mae Discount Notes | | 1.017% | | 10/13/2017 | | 33.6 |
| | — |
| |
| 37.1 |
| | — |
| | Fannie Mae Discount Notes | | 1.017% - 1.037% | | 10/19/2017 | | 37.1 |
| | — |
| |
| 15.1 |
| | — |
| | Fannie Mae Discount Notes | | 1.038% | | 10/23/2017 | | 15.1 |
| | — |
| |
| 20.0 |
| | — |
| | Fannie Mae Discount Notes | | 1.038% | | 10/25/2017 | | 20.0 |
| | — |
| |
| 40.0 |
| | — |
| | Fannie Mae Discount Notes | | 1.038% | | 10/27/2017 | | 40.0 |
| | — |
| |
| 35.0 |
| | — |
| | Fannie Mae Discount Notes | | 0.996% | | 10/30/2017 | | 35.0 |
| | — |
| |
| 75.1 |
| | — |
| | Fannie Mae Discount Notes | | 0.996% - 1.006% | | 11/1/2017 | | 75.0 |
| | — |
| |
| 10.0 |
| | — |
| | Fannie Mae Discount Notes | | 0.985% | | 11/3/2017 | | 10.0 |
| | — |
| |
| 24.6 |
| | — |
| | Fannie Mae Discount Notes | | 1.048% | | 11/6/2017 | | 24.5 |
| | — |
| |
| 5.0 |
| | — |
| | Fannie Mae Discount Notes | | 1.048% | | 11/9/2017 | | 5.0 |
| | — |
| |
| 75.0 |
| | — |
| | Fannie Mae Discount Notes | | 1.058% | | 11/20/2017 | | 74.9 |
| | — |
| |
| 75.0 |
| | — |
| | Fannie Mae Discount Notes | | 1.058% | | 11/21/2017 | | 74.9 |
| | — |
| |
| 30.0 |
| | — |
| | Fannie Mae Discount Notes | | 1.058% | | 11/22/2017 | | 30.0 |
| | — |
| |
| 20.0 |
| | — |
| | Fannie Mae Discount Notes | | 1.007% | | 11/24/2017 | | 20.0 |
| | — |
| |
| 25.0 |
| | — |
| | Fannie Mae Discount Notes | | 1.042% | | 12/20/2017 | | 24.9 |
| | — |
| |
| 40.0 |
| | — |
| | Fannie Mae Discount Notes | | 1.063% | | 1/11/2018 | | 40.0 |
| | — |
| |
| 30.0 |
| | — |
| | Fannie Mae Discount Notes | | 1.038% | | 1/22/2018 | | 29.9 |
| | — |
| |
| 46.2 |
| | — |
| | Fannie Mae Discount Notes | | 1.038% | | 1/23/2018 | | 46.0 |
| | — |
| |
| 35.1 |
| | — |
| | Fannie Mae Discount Notes | | 1.038% | | 1/24/2018 | | 35.0 |
| | — |
| |
| — |
| | 19.9 |
| | Farmer Mac Discount Notes | | 0.682% | | 6/1/2017 | | — |
| | 19.9 |
| |
| — |
| | 15.5 |
| | Federal Farm Credit Bank Discount Notes | | 0.376% - 0.381% | | 2/22/2017 | | — |
| | 15.5 |
| |
| — |
| | 34.7 |
| | Federal Home Loan Bank Discount Notes | | 0.304% - 0.355% | | 1/3/2017 | | — |
| | 34.7 |
| |
| — |
| | 40.0 |
| | Federal Home Loan Bank Discount Notes | | 0.345% | | 1/4/2017 | | — |
| | 40.0 |
| |
| — |
| | 29.2 |
| | Federal Home Loan Bank Discount Notes | | 0.355% - 0.447% | | 1/6/2017 | | — |
| | 29.2 |
| |
| — |
| | 7.1 |
| | Federal Home Loan Bank Discount Notes | | 0.299% - 0.345% | | 1/9/2017 | | — |
| | 7.1 |
| |
| — |
| | 25.0 |
| | Federal Home Loan Bank Discount Notes | | 0.325% | | 1/10/2017 | | — |
| | 25.0 |
| |
| — |
| | 50.0 |
| | Federal Home Loan Bank Discount Notes | | 0.304% - 0.396% | | 1/11/2017 | | — |
| | 50.0 |
| |
| — |
| | 33.0 |
| | Federal Home Loan Bank Discount Notes | | 0.365% - 0.396% | | 1/12/2017 | | — |
| | 33.0 |
| |
| — |
| | 50.0 |
| | Federal Home Loan Bank Discount Notes | | 0.386% | | 1/13/2017 | | — |
| | 50.0 |
| |
| — |
| | 36.0 |
| | Federal Home Loan Bank Discount Notes | | 0.345% | | 1/17/2017 | | — |
| | 36.0 |
| |
| — |
| | 42.1 |
| | Federal Home Loan Bank Discount Notes | | 0.294% - 0.365% | | 1/18/2017 | | — |
| | 42.1 |
| |
TOTAL U.S. GOVERNMENT AGENCY NOTES (Cost $— and $210.2) | | TOTAL U.S. GOVERNMENT AGENCY NOTES (Cost $— and $210.2) | | $ | — | | | $ | 210.4 | |
FOREIGN GOVERNMENT AGENCY NOTES— 0.0% and 0.2%
|
| | | | | | | | | | | | | | | | | | | | |
| Principal | | Issuer | | Yield(4) | | Maturity Date | | Fair Value at |
| September 30, 2017 | | December 31, 2016 |
| 2017 | | 2016 | |
| | | | | | | | | | | (Unaudited) | | |
| $ | — |
| | $ | 20.0 |
| | Federal Home Loan Bank Discount Notes | | 0.284% | | 1/20/2017 | | $ | — |
| | $ | 20.0 |
|
| — |
| | 50.0 |
| | Federal Home Loan Bank Discount Notes | | 0.335% | | 1/23/2017 | | — |
| | 50.0 |
|
| — |
| | 47.0 |
| | Federal Home Loan Bank Discount Notes | | 0.345% | | 1/24/2017 | | — |
| | 47.0 |
|
| — |
| | 34.8 |
| | Federal Home Loan Bank Discount Notes | | 0.304% - 0.360% | | 1/25/2017 | | — |
| | 34.8 |
|
| — |
| | 45.0 |
| | Federal Home Loan Bank Discount Notes | | 0.294% - 0.406% | | 1/27/2017 | | — |
| | 45.0 |
|
| — |
| | 25.0 |
| | Federal Home Loan Bank Discount Notes | | 0.416% | | 1/30/2017 | | — |
| | 25.0 |
|
| — |
| | 34.7 |
| | Federal Home Loan Bank Discount Notes | | 0.467% - 0.497% | | 2/1/2017 | | — |
| | 34.7 |
|
| — |
| | 42.0 |
| | Federal Home Loan Bank Discount Notes | | 0.406% | | 2/3/2017 | | — |
| | 42.0 |
|
| — |
| | 15.0 |
| | Federal Home Loan Bank Discount Notes | | 0.416% | | 2/7/2017 | | — |
| | 15.0 |
|
| — |
| | 10.2 |
| | Federal Home Loan Bank Discount Notes | | 0.376% | | 2/10/2017 | | — |
| | 10.2 |
|
| — |
| | 50.0 |
| | Federal Home Loan Bank Discount Notes | | 0.386% - 0.487% | | 2/17/2017 | | — |
| | 50.0 |
|
| — |
| | 30.0 |
| | Federal Home Loan Bank Discount Notes | | 0.365% | | 2/21/2017 | | — |
| | 30.0 |
|
| — |
| | 30.0 |
| | Federal Home Loan Bank Discount Notes | | 0.437% | | 2/22/2017 | | — |
| | 30.0 |
|
| — |
| | 50.0 |
| | Federal Home Loan Bank Discount Notes | | 0.396% | | 2/24/2017 | | — |
| | 50.0 |
|
| — |
| | 20.0 |
| | Federal Home Loan Bank Discount Notes | | 0.533% | | 2/27/2017 | | — |
| | 20.0 |
|
| — |
| | 10.1 |
| | Federal Home Loan Bank Discount Notes | | 0.518% | | 3/3/2017 | | — |
| | 10.1 |
|
| — |
| | 15.0 |
| | Federal Home Loan Bank Discount Notes | | 0.523% | | 3/6/2017 | | — |
| | 15.0 |
|
| — |
| | 30.0 |
| | Federal Home Loan Bank Discount Notes | | 0.538% | | 3/8/2017 | | — |
| | 30.0 |
|
| — |
| | 45.8 |
| | Federal Home Loan Bank Discount Notes | | 0.447% - 0.574% | | 3/10/2017 | | — |
| | 45.8 |
|
| — |
| | 20.0 |
| | Federal Home Loan Bank Discount Notes | | 0.543% | | 3/14/2017 | | — |
| | 20.0 |
|
| — |
| | 40.5 |
| | Federal Home Loan Bank Discount Notes | | 0.528% - 0.579% | | 3/17/2017 | | — |
| | 40.5 |
|
| — |
| | 49.9 |
| | Federal Home Loan Bank Discount Notes | | 0.538% | | 3/20/2017 | | — |
| | 49.9 |
|
| — |
| | 36.1 |
| | Federal Home Loan Bank Discount Notes | | 0.533% | | 3/22/2017 | | — |
| | 36.1 |
|
| — |
| | 28.0 |
| | Federal Home Loan Bank Discount Notes | | 0.427% - 0.518% | | 3/23/2017 | | — |
| | 28.0 |
|
| — |
| | 40.0 |
| | Federal Home Loan Bank Discount Notes | | 0.528% | | 3/24/2017 | | — |
| | 40.0 |
|
| — |
| | 25.0 |
| | Federal Home Loan Bank Discount Notes | | 0.548% | | 3/28/2017 | | — |
| | 25.0 |
|
| — |
| | 31.0 |
| | Federal Home Loan Bank Discount Notes | | 0.558% | | 3/29/2017 | | — |
| | 31.0 |
|
| — |
| | 6.4 |
| | Federal Home Loan Bank Discount Notes | | 0.477% | | 3/31/2017 | | — |
| | 6.4 |
|
| — |
| | 49.9 |
| | Federal Home Loan Bank Discount Notes | | 0.559% | | 4/17/2017 | | — |
| | 49.9 |
|
| — |
| | 26.0 |
| | Federal Home Loan Bank Discount Notes | | 0.548% - 0.605% | | 4/19/2017 | | — |
| | 26.0 |
|
| — |
| | 20.1 |
| | Federal Home Loan Bank Discount Notes | | 0.488% | | 4/28/2017 | | — |
| | 20.1 |
|
| — |
| | 25.0 |
| | Federal Home Loan Bank Discount Notes | | 0.538% - 0.600% | | 5/5/2017 | | — |
| | 25.0 |
|
| — |
| | 37.2 |
| | Federal Home Loan Bank Discount Notes | | 0.558% - 0.641% | | 5/12/2017 | | — |
| | 37.2 |
|
| 27.1 |
| | — |
| | Federal Home Loan Bank Discount Notes | | 1.015% | | 10/5/2017 | | 27.1 |
| | — |
|
| 30.8 |
| | — |
| | Federal Home Loan Bank Discount Notes | | 0.968% | | 10/6/2017 | | 30.8 |
| | — |
|
| 40.1 |
| | — |
| | Federal Home Loan Bank Discount Notes | | 1.020% - 1.053% | | 10/10/2017 | | 40.1 |
| | — |
|
| 4.0 |
| | — |
| | Federal Home Loan Bank Discount Notes | | 1.049% | | 10/13/2017 | | 4.0 |
| | — |
|
| 88.3 |
| | — |
| | Federal Home Loan Bank Discount Notes | | 1.020% - 1.025% | | 10/16/2017 | | 88.3 |
| | — |
|
| 44.2 |
| | — |
| | Federal Home Loan Bank Discount Notes | | 1.063% | | 10/18/2017 | | 44.1 |
| | — |
|
| 39.6 |
| | — |
| | Federal Home Loan Bank Discount Notes | | 1.008% - 1.039% | | 10/20/2017 | | 39.6 |
| | — |
|
| 30.1 |
| | — |
| | Federal Home Loan Bank Discount Notes | | 1.031% - 1.049% | | 10/23/2017 | | 30.0 |
| | — |
|
| 42.2 |
| | — |
| | Federal Home Loan Bank Discount Notes | | 1.013% | | 10/24/2017 | | 42.1 |
| | — |
|
| 23.2 |
| | — |
| | Federal Home Loan Bank Discount Notes | | 1.036% - 1.048% | | 10/25/2017 | | 23.2 |
| | — |
|
| 10.2 |
| | — |
| | Federal Home Loan Bank Discount Notes | | 1.041% | | 10/27/2017 | | 10.1 |
| | — |
|
| 37.1 |
| | — |
| | Federal Home Loan Bank Discount Notes | | 1.048% | | 10/30/2017 | | 37.1 |
| | — |
|
| 34.5 |
| | — |
| | Federal Home Loan Bank Discount Notes | | 1.019% - 1.041% | | 11/1/2017 | | 34.4 |
| | — |
|
| 43.2 |
| | — |
| | Federal Home Loan Bank Discount Notes | | 1.048% | | 11/2/2017 | | 43.1 |
| | — |
|
| 50.0 |
| | — |
| | Federal Home Loan Bank Discount Notes | | 1.024% - 1.031% | | 11/3/2017 | | 50.0 |
| | — |
|
|
| | | | | | | | | | | | | | | | | | | | |
| Principal | | Issuer | | Yield(4) | | Maturity Date | | Fair Value at |
| September 30, 2017 | | December 31, 2016 |
| 2017 | | 2016 | |
| | | | | | | | | | | (Unaudited) | | |
| $ | 58.2 |
| | $ | — |
| | Federal Home Loan Bank Discount Notes | | 1.031% - 1.048% | | 11/7/2017 | | $ | 58.1 |
| | $ | — |
|
| 50.0 |
| | — |
| | Federal Home Loan Bank Discount Notes | | 1.031% - 1.069% | | 11/8/2017 | | 49.9 |
| | — |
|
| 61.0 |
| | — |
| | Federal Home Loan Bank Discount Notes | | 1.030% - 1.068% | | 11/9/2017 | | 60.9 |
| | — |
|
| 33.6 |
| | — |
| | Federal Home Loan Bank Discount Notes | | 1.079% | | 11/10/2017 | | 33.6 |
| | — |
|
| 42.3 |
| | — |
| | Federal Home Loan Bank Discount Notes | | 1.032% - 1.079% | | 11/13/2017 | | 42.3 |
| | — |
|
| 51.9 |
| | — |
| | Federal Home Loan Bank Discount Notes | | 1.068% - 1.079% | | 11/14/2017 | | 51.9 |
| | — |
|
| 43.4 |
| | — |
| | Federal Home Loan Bank Discount Notes | | 1.068% - 1.109% | | 11/15/2017 | | 43.4 |
| | — |
|
| 40.0 |
| | — |
| | Federal Home Loan Bank Discount Notes | | 1.068% | | 11/16/2017 | | 40.0 |
| | — |
|
| 66.4 |
| | — |
| | Federal Home Loan Bank Discount Notes | | 1.068% - 1.069% | | 11/17/2017 | | 66.3 |
| | — |
|
| 15.2 |
| | — |
| | Federal Home Loan Bank Discount Notes | | 1.069% | | 11/27/2017 | | 15.2 |
| | — |
|
| 40.0 |
| | — |
| | Federal Home Loan Bank Discount Notes | | 1.110% | | 11/28/2017 | | 39.9 |
| | — |
|
| 30.0 |
| | — |
| | Federal Home Loan Bank Discount Notes | | 1.068% | | 11/29/2017 | | 30.0 |
| | — |
|
| 36.9 |
| | — |
| | Federal Home Loan Bank Discount Notes | | 1.047% - 1.069% | | 12/1/2017 | | 36.9 |
| | — |
|
| 40.0 |
| | — |
| | Federal Home Loan Bank Discount Notes | | 1.110% | | 12/5/2017 | | 39.9 |
| | — |
|
| 20.3 |
| | — |
| | Federal Home Loan Bank Discount Notes | | 1.110% | | 12/6/2017 | | 20.2 |
| | — |
|
| 40.0 |
| | — |
| | Federal Home Loan Bank Discount Notes | | 1.100% | | 12/8/2017 | | 39.9 |
| | — |
|
| 20.0 |
| | — |
| | Federal Home Loan Bank Discount Notes | | 1.068% | | 12/11/2017 | | 20.0 |
| | — |
|
| 40.0 |
| | — |
| | Federal Home Loan Bank Discount Notes | | 1.079% | | 12/12/2017 | | 39.9 |
| | — |
|
| 44.3 |
| | — |
| | Federal Home Loan Bank Discount Notes | | 1.067% - 1.074% | | 12/15/2017 | | 44.2 |
| | — |
|
| 15.2 |
| | — |
| | Federal Home Loan Bank Discount Notes | | 1.079% | | 12/18/2017 | | 15.1 |
| | — |
|
| 25.1 |
| | — |
| | Federal Home Loan Bank Discount Notes | | 1.079% | | 12/19/2017 | | 25.0 |
| | — |
|
| 28.5 |
| | — |
| | Federal Home Loan Bank Discount Notes | | 1.058% - 1.074% | | 12/20/2017 | | 28.4 |
| | — |
|
| 30.0 |
| | — |
| | Federal Home Loan Bank Discount Notes | | 1.074% | | 12/22/2017 | | 29.9 |
| | — |
|
| 30.0 |
| | — |
| | Federal Home Loan Bank Discount Notes | | 1.069% | | 12/26/2017 | | 29.9 |
| | — |
|
| 30.0 |
| | — |
| | Federal Home Loan Bank Discount Notes | | 1.069% | | 12/27/2017 | | 29.9 |
| | — |
|
| 25.0 |
| | — |
| | Federal Home Loan Bank Discount Notes | | 1.069% | | 12/29/2017 | | 24.9 |
| | — |
|
| 20.2 |
| | — |
| | Federal Home Loan Bank Discount Notes | | 1.069% | | 1/2/2018 | | 20.1 |
| | — |
|
| 40.0 |
| | — |
| | Federal Home Loan Bank Discount Notes | | 1.079% | | 1/3/2018 | | 39.9 |
| | — |
|
| 40.0 |
| | — |
| | Federal Home Loan Bank Discount Notes | | 1.068% | | 1/5/2018 | | 39.9 |
| | — |
|
| 40.0 |
| | — |
| | Federal Home Loan Bank Discount Notes | | 1.068% | | 1/8/2018 | | 39.9 |
| | — |
|
| 33.0 |
| | — |
| | Federal Home Loan Bank Discount Notes | | 1.058% | | 1/9/2018 | | 32.9 |
| | — |
|
| 20.0 |
| | — |
| | Federal Home Loan Bank Discount Notes | | 1.068% | | 1/10/2018 | | 19.9 |
| | — |
|
| 10.0 |
| | — |
| | Federal Home Loan Bank Discount Notes | | 1.089% | | 1/12/2018 | | 10.0 |
| | — |
|
| 38.1 |
| | — |
| | Federal Home Loan Bank Discount Notes | | 1.068% | | 1/16/2018 | | 38.0 |
| | — |
|
| 30.0 |
| | — |
| | Federal Home Loan Bank Discount Notes | | 1.094% | | 1/17/2018 | | 29.9 |
| | — |
|
| 30.2 |
| | — |
| | Federal Home Loan Bank Discount Notes | | 1.063% | | 1/19/2018 | | 30.1 |
| | — |
|
| 38.0 |
| | — |
| | Federal Home Loan Bank Discount Notes | | 1.063% | | 1/25/2018 | | 37.8 |
| | — |
|
| 36.1 |
| | — |
| | Federal Home Loan Bank Discount Notes | | 1.063% | | 1/26/2018 | | 36.0 |
| | — |
|
| 19.2 |
| | — |
| | Federal Home Loan Bank Discount Notes | | 1.069% | | 1/29/2018 | | 19.1 |
| | — |
|
| 37.1 |
| | — |
| | Federal Home Loan Bank Discount Notes | | 1.069% | | 2/9/2018 | | 37.0 |
| | — |
|
| 2.2 |
| | — |
| | Federal Home Loan Bank Discount Notes | | 1.161% | | 3/2/2018 | | 2.1 |
| | — |
|
| — |
| | 16.1 |
| | Freddie Mac Discount Notes | | 0.345% | | 1/9/2017 | | — |
| | 16.1 |
|
| — |
| | 25.0 |
| | Freddie Mac Discount Notes | | 0.335% | | 1/10/2017 | | — |
| | 25.0 |
|
| — |
| | 30.0 |
| | Freddie Mac Discount Notes | | 0.391% | | 1/20/2017 | | — |
| | 30.0 |
|
| — |
| | 13.1 |
| | Freddie Mac Discount Notes | | 0.426% | | 1/30/2017 | | — |
| | 13.1 |
|
| — |
| | 40.0 |
| | Freddie Mac Discount Notes | | 0.447% | | 2/6/2017 | | — |
| | 40.0 |
|
| — |
| | 36.9 |
| | Freddie Mac Discount Notes | | 0.436% - 0.457% | | 2/7/2017 | | — |
| | 36.9 |
|
| — |
| | 44.2 |
| | Freddie Mac Discount Notes | | 0.360% | | 2/8/2017 | | — |
| | 44.2 |
|
|
| | | | | | | | | | | | | | | | | | | | |
| Principal | | Issuer | | Yield(4) | | Maturity Date | | Fair Value at |
| September 30, 2017 | | December 31, 2016 |
| 2017 | | 2016 | |
| | | | | | | | | | | (Unaudited) | | |
| $ | — |
| | $ | 25.0 |
| | Freddie Mac Discount Notes | | 0.360% | | 2/10/2017 | | $ | — |
| | $ | 25.0 |
|
| — |
| | 40.0 |
| | Freddie Mac Discount Notes | | 0.365% | | 2/13/2017 | | — |
| | 40.0 |
|
| — |
| | 30.0 |
| | Freddie Mac Discount Notes | | 0.376% | | 2/14/2017 | | — |
| | 30.0 |
|
| — |
| | 20.0 |
| | Freddie Mac Discount Notes | | 0.467% | | 2/21/2017 | | — |
| | 20.0 |
|
| — |
| | 27.0 |
| | Freddie Mac Discount Notes | | 0.386% | | 2/27/2017 | | — |
| | 27.0 |
|
| — |
| | 15.0 |
| | Freddie Mac Discount Notes | | 0.401% | | 3/3/2017 | | — |
| | 15.0 |
|
| — |
| | 35.2 |
| | Freddie Mac Discount Notes | | 0.406% | | 3/7/2017 | | — |
| | 35.2 |
|
| — |
| | 14.0 |
| | Freddie Mac Discount Notes | | 0.411% | | 3/14/2017 | | — |
| | 14.0 |
|
| — |
| | 50.0 |
| | Freddie Mac Discount Notes | | 0.427% | | 3/21/2017 | | — |
| | 49.9 |
|
| — |
| | 18.0 |
| | Freddie Mac Discount Notes | | 0.600% | | 4/21/2017 | | — |
| | 18.0 |
|
| — |
| | 39.9 |
| | Freddie Mac Discount Notes | | 0.457% | | 5/3/2017 | | — |
| | 39.9 |
|
| — |
| | 22.9 |
| | Freddie Mac Discount Notes | | 0.483% | | 5/4/2017 | | — |
| | 22.9 |
|
| 45.2 |
| | — |
| | Freddie Mac Discount Notes | | 0.997% | | 10/3/2017 | | 45.2 |
| | — |
|
| 42.2 |
| | — |
| | Freddie Mac Discount Notes | | 0.997% | | 10/4/2017 | | 42.2 |
| | — |
|
| 40.0 |
| | — |
| | Freddie Mac Discount Notes | | 1.013% | | 10/16/2017 | | 40.0 |
| | — |
|
| 37.1 |
| | — |
| | Freddie Mac Discount Notes | | 1.013% | | 10/17/2017 | | 37.1 |
| | — |
|
| 10.5 |
| | — |
| | Freddie Mac Discount Notes | | 1.005% | | 10/20/2017 | | 10.5 |
| | — |
|
| 42.5 |
| | — |
| | Freddie Mac Discount Notes | | 1.001% - 1.028% | | 10/26/2017 | | 42.5 |
| | — |
|
| 15.0 |
| | — |
| | Freddie Mac Discount Notes | | 1.079% | | 11/6/2017 | | 15.0 |
| | — |
|
| 15.0 |
| | — |
| | Freddie Mac Discount Notes | | 1.006% | | 11/10/2017 | | 15.0 |
| | — |
|
| 30.0 |
| | — |
| | Freddie Mac Discount Notes | | 1.027% | | 11/27/2017 | | 30.0 |
| | — |
|
| 12.5 |
| | — |
| | Freddie Mac Discount Notes | | 1.036% | | 12/1/2017 | | 12.5 |
| | — |
|
| 51.1 |
| | — |
| | Freddie Mac Discount Notes | | 1.027% - 1.074% | | 12/4/2017 | | 51.0 |
| | — |
|
| 15.0 |
| | — |
| | Freddie Mac Discount Notes | | 1.043% | | 12/6/2017 | | 15.0 |
| | — |
|
| 20.4 |
| | — |
| | Freddie Mac Discount Notes | | 1.064% | | 12/11/2017 | | 20.4 |
| | — |
|
| 40.0 |
| | — |
| | Freddie Mac Discount Notes | | 1.064% | | 12/13/2017 | | 39.9 |
| | — |
|
| 40.0 |
| | — |
| | Freddie Mac Discount Notes | | 1.063% | | 12/14/2017 | | 39.9 |
| | — |
|
| 25.0 |
| | — |
| | Freddie Mac Discount Notes | | 1.101% | | 2/2/2018 | | 24.9 |
| | — |
|
| 30.0 |
| | — |
| | Freddie Mac Discount Notes | | 1.101% | | 2/5/2018 | | 29.9 |
| | — |
|
| 25.0 |
| | — |
| | Freddie Mac Discount Notes | | 1.090% | | 2/6/2018 | | 24.9 |
| | — |
|
| 20.1 |
| | — |
| | Freddie Mac Discount Notes | | 1.100% | | 2/7/2018 | | 20.0 |
| | — |
|
TOTAL GOVERNMENT AGENCY NOTES (Cost $3,276.0 and $2,309.0) | | $ | 3,276.1 |
| | $ | 2,308.9 |
|
| | | | | | | | | | | | | | | | | | | | | | | | | | | | | | | | | | | | | | |
| Principal | | Issuer | | Yield(4) | | Maturity
Date | | Fair Value at |
| September 30, 2020 | | December 31, 2019 |
| 2020 | | 2019 | |
| | | | | | | | | | (Unaudited) | | |
| $ | — | | | $ | 49.3 | | | Japan Bank for International Cooperation | | 1.625% | | 10/17/2022 | | $ | — | | | $ | 48.9 | |
| — | | | 0.2 | | | Korea Development Bank | | 1.908% | | 10/1/2022 | | — | | | 0.3 | |
TOTAL FOREIGN GOVERNMENT AGENCY NOTES (Cost $— and $49.5) | $ | — | | | $ | 49.2 | |
UNITED STATES TREASURY SECURITIES—3.7%2.7% and 6.5%8.7%
| | | | | | | | | | | | | | | | | | | | | | | | | | | | | | | | | | | | | | | | | |
| Principal | | Issuer | | Yield / Coupon Rate(4) | | | Maturity
Date | | Fair Value at |
| September 30, 2020 | | December 31, 2019 |
| 2020 | | 2019 | |
| | | | | | | | | | | (Unaudited) | | |
| $ | — | | | $ | 11.9 | | | United States Treasury Bills | | 1.540% | | | 1/2/2020 | | $ | — | | | $ | 11.9 | |
| — | | | 40.0 | | | United States Treasury Bills | | 1.537% | | | 1/14/2020 | | — | | | 40.0 | |
| — | | | 238.3 | | | United States Treasury Bills | | 1.530% | | | 1/21/2020 | | — | | | 238.3 | |
| — | | | 10.1 | | | United States Treasury Bills | | 1.629% | | | 1/23/2020 | | — | | | 10.1 | |
| — | | | 26.1 | | | United States Treasury Bills | | 1.526% | | | 1/30/2020 | | — | | | 26.1 | |
| — | | | 39.9 | | | United States Treasury Bills | | 1.538% | | | 2/4/2020 | | — | | | 39.9 | |
| — | | | 20.0 | | | United States Treasury Bills | | 1.550% | | | 2/6/2020 | | — | | | 20.0 | |
| — | | | 149.7 | | | United States Treasury Bills | | 1.503% | | | 2/11/2020 | | — | | | 149.8 | |
| — | | | 49.9 | | | United States Treasury Bills | | 1.575% | | | 2/13/2020 | | — | | | 49.9 | |
| — | | | 13.0 | | | United States Treasury Bills | | 1.554% | | | 2/20/2020 | | — | | | 13.0 | |
| — | | | 49.9 | | | United States Treasury Bills | | 1.583% | | | 2/27/2020 | | — | | | 49.9 | |
| — | | | 46.1 | | | United States Treasury Bills | | 1.515% | | | 3/5/2020 | | — | | | 46.1 | |
| — | | | 54.5 | | | United States Treasury Bills | | 1.576% | | | 3/12/2020 | | — | | | 54.5 | |
| — | | | 44.8 | | | United States Treasury Bills | | 1.780% | | | 3/19/2020 | | — | | | 44.9 | |
| — | | | 38.9 | | | United States Treasury Bills | | 1.515% | | | 4/2/2020 | | — | | | 38.8 | |
| 62.0 | | | — | | | United States Treasury Bills | | 0.213% | | | 10/8/2020 | | 62.0 | | | — | |
| 61.0 | | | — | | | United States Treasury Bills | | 0.111% | | | 10/22/2020 | | 61.0 | | | — | |
| 86.5 | | | — | | | United States Treasury Bills | | 0.097% | | | 11/5/2020 | | 86.5 | | | — | |
| 34.5 | | | — | | | United States Treasury Bills | | 0.101% | | | 11/19/2020 | | 34.5 | | | — | |
| 100.0 | | | — | | | United States Treasury Bills | | 0.098% | | | 12/17/2020 | | 100.0 | | | — | |
TIAA REAL ESTATE ACCOUNT
CONSOLIDATED SCHEDULES OF INVESTMENTS
(Dollar values shown in millions)
| | | Principal | Principal | | Issuer | | Yield(4) | | Maturity Date | | Fair Value at | Principal | | Issuer | | Yield / Coupon Rate(4) | | Maturity
Date | | Fair Value at |
| September 30, 2017 | | December 31, 2016 | September 30, 2020 | | December 31, 2019 |
| 2017 | | 2016 | | |
| 2020 | | 2020 | | 2019 | | Issuer | | Yield / Coupon Rate(4) | | Maturity
Date | | September 30, 2020 | | December 31, 2019 |
| | | | | | | | | | (Unaudited) | | | | | | |
| $ | — |
| | $ | 35.9 |
| | United States Treasury Bills | | 0.345% - 0.369% | | 1/5/2017 | | $ | — |
| | $ | 35.9 |
| 84.0 | | | $ | — | | | $ | 84.0 | | | $ | — | |
| 80.0 | | 80.0 | | | — | | | United States Treasury Cash Management Bill | | 0.115% | | 12/15/2020 | | 80.0 | | | — | |
| 50.0 | | 50.0 | | | — | | | United States Treasury Cash Management Bill | | 0.097% | | 1/5/2021 | | 50.0 | | | — | |
| 132.0 | | 132.0 | | | — | | | United States Treasury Cash Management Bill | | 0.108% | | 1/12/2021 | | 131.9 | | | — | |
| — | — |
| | 47.9 |
| | United States Treasury Bills | | 0.423% - 0.428% | | 1/19/2017 | | — |
| | 48.0 |
| — | | | 99.8 | | | United States Treasury Notes | | 1.375% | | 5/31/2020 | | — | | | 99.9 | |
| — | — |
| | 36.1 |
| | United States Treasury Bills | | 0.371% - 0.401% | | 1/26/2017 | | — |
| | 36.1 |
| — | | | 100.4 | | | United States Treasury Notes | | 2.625% | | 7/31/2020 | | — | | | 100.6 | |
| — | — |
| | 60.1 |
| | United States Treasury Bills | | 0.363% - 0.423% | | 2/2/2017 | | ��� |
| | 60.1 |
| — | | | 249.5 | | | United States Treasury Notes | | 1.500% | | 8/15/2020 | | — | | | 249.8 | |
| — | — |
| | 75.0 |
| | United States Treasury Bills | | 0.315% - 0.426% | | 2/9/2017 | | — |
| | 75.0 |
| — | | | 653.1 | | | United States Treasury Notes | | 2.625% | | 8/15/2020 | | — | | | 653.9 | |
| — | — |
| | 48.0 |
| | United States Treasury Bills | | 0.325% - 0.437% | | 2/16/2017 | | — |
| | 48.0 |
| — | | | 100.8 | | | United States Treasury Notes | | 2.250% | | 4/30/2021 | | — | | | 100.8 | |
| — | — |
| | 48.0 |
| | United States Treasury Bills | | 0.448% - 0.473% | | 2/23/2017 | | — |
| | 48.0 |
| — | | | 199.4 | | | United States Treasury Notes | | 1.625% | | 6/30/2021 | | — | | | 200.0 | |
| — | — |
| | 36.0 |
| | United States Treasury Bills | | 0.368% - 0.477% | | 3/2/2017 | | — |
| | 36.0 |
| — | | | 99.9 | | | United States Treasury Notes | | 1.750% | | 7/31/2021 | | — | | | 100.2 | |
| — | — |
| | 48.7 |
| | United States Treasury Bills | | 0.386% - 0.518% | | 3/9/2017 | | — |
| | 48.7 |
| — | | | 49.6 | | | United States Treasury Notes | | 1.250% | | 10/31/2021 | | — | | | 49.7 | |
| — | — |
| | 59.9 |
| | United States Treasury Bills | | 0.406% - 0.481% | | 3/16/2017 | | — |
| | 60.0 |
| — | | | 100.0 | | | United States Treasury Notes | | 1.750% | | 7/15/2022 | | — | | | 100.3 | |
| — | — |
| | 129.0 |
| | United States Treasury Bills | | 0.380% - 0.533% | | 3/23/2017 | | — |
| | 129.0 |
| — | | | 100.7 | | | United States Treasury Notes | | 1.875% | | 7/31/2022 | | — | | | 100.7 | |
| — |
| | 25.9 |
| | United States Treasury Bills | | 0.396% - 0.518% | | 3/30/2017 | | — |
| | 25.9 |
| |
| — |
| | 58.9 |
| | United States Treasury Bills | | 0.411% - 0.509% | | 4/6/2017 | | — |
| | 58.9 |
| |
| — |
| | 130.8 |
| | United States Treasury Bills | | 0.518% - 0.529% | | 4/13/2017 | | — |
| | 130.8 |
| |
| — |
| | 49.9 |
| | United States Treasury Bills | | 0.514% - 0.559% | | 4/20/2017 | | — |
| | 49.9 |
| |
| — |
| | 48.2 |
| | United States Treasury Bills | | 0.554% - 0.781% | | 4/27/2017 | | — |
| | 48.2 |
| |
| — |
| | 49.9 |
| | United States Treasury Bills | | 0.514% | | 5/4/2017 | | — |
| | 49.9 |
| |
| — |
| | 42.0 |
| | United States Treasury Bills | | 0.601% - 0.623% | | 5/11/2017 | | — |
| | 42.0 |
| |
| — |
| | 30.1 |
| | United States Treasury Bills | | 0.584% - 0.620% | | 5/18/2017 | | — |
| | 30.1 |
| |
| — |
| | 32.0 |
| | United States Treasury Bills | | 0.587% | | 6/8/2017 | | — |
| | 32.0 |
| |
| — |
| | 74.8 |
| | United States Treasury Bills | | 0.541% - 0.654% | | 7/20/2017 | | — |
| | 74.7 |
| |
| — |
| | 86.7 |
| | United States Treasury Bills | | 0.574% - 0.591% | | 8/17/2017 | | — |
| | 86.6 |
| |
| — |
| | 34.8 |
| | United States Treasury Bills | | 0.696% - 0.934% | | 9/14/2017 | | — |
| | 34.8 |
| |
| 30.0 |
| | — |
| | United States Treasury Bills | | 0.943% | | 10/5/2017 | | 30.0 |
| | — |
| |
| 0.8 |
| | — |
| | United States Treasury Bills | | 0.956% | | 10/12/2017 | | 0.8 |
| | — |
| |
| 20.0 |
| | — |
| | United States Treasury Bills | | 1.017% | | 11/24/2017 | | 20.0 |
| | — |
| |
| 50.0 |
| | — |
| | United States Treasury Bills | | 0.998% | | 11/30/2017 | | 49.9 |
| | — |
| |
| 49.0 |
| | — |
| | United States Treasury Bills | | 0.768% | | 12/7/2017 | | 48.9 |
| | — |
| |
| 50.0 |
| | — |
| | United States Treasury Bills | | 1.090% | | 12/21/2017 | | 49.9 |
| | — |
| |
| 97.0 |
| | — |
| | United States Treasury Bills | | 1.099% - 1.100% | | 12/28/2017 | | 96.7 |
| | — |
| |
| 50.0 |
| | — |
| | United States Treasury Bills | | 1.084% | | 1/4/2018 | | 49.9 |
| | — |
| |
| 40.0 |
| | — |
| | United States Treasury Bills | | 1.114% | | 1/18/2018 | | 39.9 |
| | — |
| |
| 71.0 |
| | — |
| | United States Treasury Bills | | 1.132% | | 1/25/2018 | | 70.8 |
| | — |
| |
| 36.0 |
| | — |
| | United States Treasury Bills | | 1.106% | | 2/1/2018 | | 35.9 |
| | — |
| |
| 93.0 |
| | — |
| | United States Treasury Bills | | 1.075% - 1.077% | | 2/8/2018 | | 92.6 |
| | — |
| |
| 98.0 |
| | — |
| | United States Treasury Bills | | 1.106% - 1.122% | | 2/22/2018 | | 97.6 |
| | — |
| |
| 81.0 |
| | — |
| | United States Treasury Bills | | 1.060% - 1.117% | | 3/1/2018 | | 80.6 |
| | — |
| |
| — |
| | 69.9 |
| | United States Treasury Notes | | 0.431% - 0.451% | | 1/31/2017 | | — |
| | 69.9 |
| |
| — |
| | 46.9 |
| | United States Treasury Notes | | 0.441% - 0.471% | | 2/15/2017 | | — |
| | 47.0 |
| |
| — |
| | 49.7 |
| | United States Treasury Notes | | 0.502% | | 2/28/2017 | | — |
| | 49.7 |
| |
| — |
| | 50.0 |
| | United States Treasury Notes | | 0.542% | | 3/15/2017 | | — |
| | 50.0 |
| |
| — |
| | 50.0 |
| | United States Treasury Notes | | 0.515% | | 3/31/2017 | | — |
| | 50.0 |
| |
| — |
| | 69.6 |
| | United States Treasury Notes | | 0.550% - 0.621% | | 5/31/2017 | | — |
| | 69.6 |
| |
| — |
| | 40.1 |
| | United States Treasury Notes | | 0.580% | | 6/15/2017 | | — |
| | 40.1 |
| |
| — |
| | 50.0 |
| | United States Treasury Notes | | 0.586% | | 6/30/2017 | | — |
| | 50.0 |
| |
| — |
| | 30.0 |
| | United States Treasury Notes | | 0.668% - 0.710% | | 7/31/2017 | | — |
| | 30.0 |
| |
| 50.0 |
| | — |
| | United States Treasury Notes | | 0.768% | | 10/31/2017 | | 50.0 |
| | — |
| |
| TOTAL UNITED STATES TREASURY SECURITIES (Cost $690.0 and $2,586.3) | | TOTAL UNITED STATES TREASURY SECURITIES (Cost $690.0 and $2,586.3) | | $ | 689.9 | | | $ | 2,589.1 | |
CORPORATE BOND SECURITIES—0.0% and 4.2%
| | | | | | | | | | | | | | | | | | | | | | | | | | | | | | | | | | | | | | | | | | | | |
| Principal | | Issuer | | Coupon Rate | | Credit Rating(8) | | Maturity
Date | | Fair Value at |
| September 30, 2020 | | December 31, 2019 |
| 2020 | | 2019 | |
| | | | | | | | | | | | (Unaudited) | | |
| $ | — | | | $ | 11.5 | | | Air Lease Corporation | | 2.250% | | BBB | | 1/15/2023 | | $ | — | | | $ | 11.5 | |
| — | | | 13.8 | | | American Honda Finance | | 1.700% | | A | | 9/9/2021 | | — | | | 13.7 | |
| — | | | 19.7 | | | American Honda Finance | | 2.050% | | A | | 1/10/2023 | | — | | | 19.7 | |
| — | | | 27.7 | | | Apple, Inc. | | 1.700% | | AA+ | | 9/11/2022 | | — | | | 27.7 | |
| — | | | 29.2 | | | Banco Santander SA | | 3.500% | | A- | | 4/11/2022 | | — | | | 30.0 | |
| — | | | 12.0 | | | Bank of America Corporation | | 2.369% | | A- | | 7/21/2021 | | — | | | 12.0 | |
| — | | | 21.6 | | | Bank of America Corporation | | 2.503% | | A- | | 10/21/2022 | | — | | | 21.8 | |
| — | | | 29.5 | | | Bank of New York Mellon Corporation | | 1.950% | | A | | 8/23/2022 | | — | | | 29.6 | |
| — | | | 8.1 | | | BB+T Corporation | | 2.150% | | A- | | 2/1/2021 | | — | | | 8.1 | |
| — | | | 3.5 | | | Berkshire Hathaway Energy | | 2.400% | | A- | | 2/1/2020 | | — | | | 3.5 | |
| — | | | 10.0 | | | Boeing Co. | | 1.650% | | BBB | | 10/30/2020 | | — | | | 10.0 | |
| — | | | 28.9 | | | Boeing Co. | | 2.300% | | BBB | | 8/1/2021 | | — | | | 29.0 | |
| — | | | 10.9 | | | BPCE SA | | 2.750% | | A+ | | 12/2/2021 | | — | | | 11.0 | |
| — | | | 8.0 | | | Canadian National Railway | | 2.400% | | A | | 2/3/2020 | | — | | | 8.0 | |
| — | | | 21.8 | | | Capital One, NA | | 2.150% | | BBB+ | | 9/6/2022 | | — | | | 21.8 | |
| — | | | 4.8 | | | Caterpillar Financial Service | | 1.850% | | A | | 9/4/2020 | | — | | | 4.7 | |
| — | | | 42.5 | | | Caterpillar Financial Service | | 1.299% | | A | | 3/8/2021 | | — | | | 42.6 | |
| — | | | 12.0 | | | Centerpoint Energy Resource | | 4.500% | | BBB+ | | 1/15/2021 | | — | | | 12.2 | |
| — | | | 32.9 | | | Citigroup, Inc. | | 2.312% | | BBB+ | | 11/4/2022 | | — | | | 32.9 | |
| — | | | 27.0 | | | Columbia Pipeline Group | | 3.300% | | A3 | | 6/1/2020 | | — | | | 27.1 | |
| — | | | 24.5 | | | Diageo Capital PLC | | 4.828% | | A- | | 7/15/2020 | | — | | | 24.9 | |
| — | | | 19.6 | | | DTE Energy Corporation | | 2.250% | | BBB | | 11/1/2022 | | — | | | 19.6 | |
| — | | | 34.5 | | | Exxon Mobil Corporation | | 1.902% | | AA+ | | 8/16/2022 | | — | | | 34.7 | |
| — | | | 14.0 | | | Fifth Third Bank | | 2.875% | | BBB+ | | 7/27/2020 | | — | | | 14.1 | |
TIAA REAL ESTATE ACCOUNT
CONSOLIDATED SCHEDULES OF INVESTMENTS
(Dollar values shown in millions)
|
| | | | | | | | | | | | | | | | | | | | | |
| Principal | | Issuer | | Yield(4) | | Maturity Date | | Fair Value at |
| September 30, 2017 | | December 31, 2016 |
| 2017 | | 2016 | |
| | | | | | | | | | | | (Unaudited) | | |
| $ | 21.1 |
| | $ | — |
| | United States Treasury Notes | | 0.812% - 0.935% | | | 11/30/2017 | | $ | 21.0 |
| | $ | — |
|
| 5.0 |
| | — |
| | United States Treasury Notes | | 0.997% | | | 12/15/2017 | | 5.0 |
| | — |
|
| 50.0 |
| | — |
| | United States Treasury Notes | | 1.148% - 1.180% | | | 1/31/2018 | | 49.9 |
| | — |
|
| 40.0 |
| | — |
| | United States Treasury Notes | | 1.175% - 1.184% | | | 2/15/2018 | | 40.0 |
| | — |
|
| 48.0 |
| | — |
| | United States Treasury Notes | | 1.200% | | | 2/28/2018 | | 47.9 |
| | — |
|
| 40.0 |
| | — |
| | United States Treasury Notes | | 1.179% | | | 3/15/2018 | | 40.0 |
| | — |
|
TOTAL UNITED STATES TREASURY SECURITIES (Cost $1,017.3 and $1,745.0) | | $ | 1,017.3 |
| | $ | 1,744.9 |
|
TOTAL OTHER MARKETABLE SECURITIES (Cost $4,293.3 and $4,054.0) | | $ | 4,293.4 |
| | $ | 4,053.8 |
|
TOTAL MARKETABLE SECURITIES (Cost $5,182.8 and $4,937.9) | | | | $ | 5,414.4 |
| | $ | 5,135.3 |
|
| |
| LOANS RECEIVABLE—1.1% and 1.1% | | | | Fair Value at |
| | | | | Borrower | | Interest Rate(7) | | | Maturity Date | | September 30, 2017 | | December 31, 2016 |
| | | | | | | | | | | | (Unaudited) |
| | |
| | | | | DJM Capital Partners(8) | | 4.200% | | | 7/1/2018 | | $ | 34.0 |
| | $ | 32.3 |
|
| | | | | Simply Self Storage Portfolio | | 8.250% | | | 9/6/2021 | | 37.6 |
| | 37.6 |
|
| | | | | State Street Financial Center Junior Mezz | | 6.500% | | | 11/10/2021 | | 125.2 |
| | 125.2 |
|
| | | | | Charles River Plaza North | | 6.080% | | | 4/6/2029 | | 102.0 |
| | 100.6 |
|
TOTAL LOANS RECEIVABLE (Cost $296.5 and $294.8) | | | | $ | 298.8 |
| | $ | 295.7 |
|
TOTAL INVESTMENTS (Cost $22,964.2 and $22,581.2) | | | | $ | 27,183.5 |
| | $ | 26,643.7 |
|
| |
(1)
| The investment has a mortgage loan payable outstanding, as indicated in Note 6. |
| |
(2)
| The fair value reflects the Account’s interest in the joint venture and is net of debt. |
| |
(3)
| Properties within this investment are located throughout the United States. |
| |
(4)
| Yield represents the annualized yield. |
| |
(5)
| The assets held in this investment were liquidated on February 18, 2015. |
| |
(6)
| A partial disposition of assets held by the portfolio was completed on February 1, 2017. |
| |
(7)
| Represents fixed interest rate. |
| |
(8)
| This loan has the option to increase the principal balance up to $35.0 million and includes a one year extension option at a 5.0% annual interest-only rate. |
| |
(9)
| All or a portion of these securities are out on loan. The aggregate value of securities on loan is $5.5 million as of September 30, 2017. |
| |
(10)
| The assets held in this investment were in liquidation as of May 2014, with final dissolution in 2017. |
| |
(11)
| A partial disposition of assets held by the portfolio was completed on August 17, 2017. |
| | | | | | | | | | | | | | | | | | | | | | | | | | | | | | | | | | | | | | | | | | | | |
| Principal | | Issuer | | Coupon Rate | | Credit Rating(8) | | Maturity
Date | | Fair Value at |
| September 30, 2020 | | December 31, 2019 |
| 2020 | | 2019 | |
| | | | | | | | | | | | (Unaudited) | | |
| $ | — | | | $ | 5.0 | | | Fifth Third Bank | | 2.250% | | A- | | 6/14/2021 | | $ | — | | | $ | 5.0 | |
| — | | | 4.0 | | | General Dynamics Corporation | | 2.875% | | A | | 5/11/2020 | | — | | | 4.0 | |
| — | | | 2.3 | | | Georgia Power Company | | 2.000% | | A- | | 3/30/2020 | | — | | | 2.3 | |
| — | | | 15.0 | | | Georgia Power Company | | 2.000% | | A- | | 9/8/2020 | | — | | | 15.0 | |
| — | | | 8.0 | | | Georgia Power Company | | 2.400% | | A- | | 4/1/2021 | | — | | | 8.0 | |
| — | | | 7.5 | | | Goldman Sachs Group, Inc. | | 2.600% | | BBB+ | | 4/23/2020 | | — | | | 7.5 | |
| — | | | 12.2 | | | Goldman Sachs Group, Inc. | | 2.600% | | BBB+ | | 12/27/2020 | | — | | | 12.2 | |
| — | | | 25.0 | | | Goldman Sachs Group, Inc. | | 2.350% | | BBB+ | | 11/15/2021 | | — | | | 25.1 | |
| — | | | 10.5 | | | HSBC Bank USA, NA | | 4.875% | | A | | 8/24/2020 | | — | | | 10.7 | |
| — | | | 11.7 | | | John Deere Capital Corporation | | 1.950% | | A | | 6/13/2022 | | — | | | 11.7 | |
| — | | | 25.0 | | | JP Morgan Chase Bank, NA | | 2.604% | | A+ | | 2/1/2021 | | — | | | 25.0 | |
| — | | | 20.0 | | | JP Morgan Chase Bank, NA | | 3.086% | | A+ | | 4/26/2021 | | — | | | 20.1 | |
| — | | | 65.0 | | | Mitsubishi UFJ Financial Group | | 2.190% | | A- | | 9/13/2021 | | — | | | 65.2 | |
| — | | | 9.2 | | | Morgan Stanley | | 2.650% | | BBB+ | | 1/27/2020 | | — | | | 9.2 | |
| — | | | 20.0 | | | Morgan Stanley | | 2.800% | | BBB+ | | 6/16/2020 | | — | | | 20.1 | |
| — | | | 8.3 | | | Morgan Stanley | | 2.500% | | BBB+ | | 4/21/2021 | | — | | | 8.4 | |
| — | | | 7.0 | | | Morgan Stanley | | 2.625% | | BBB+ | | 11/17/2021 | | — | | | 7.1 | |
| — | | | 18.4 | | | MPLX LP | | 1.899% | | BBB | | 9/9/2021 | | — | | | 18.5 | |
| — | | | 20.0 | | | MUFG Union Bank, NA | | 2.100% | | A | | 12/9/2022 | | — | | | 20.0 | |
| — | | | 50.8 | | | Nextera Energy Capital | | 2.403% | | BBB+ | | 9/1/2021 | | — | | | 51.2 | |
| — | | | 20.0 | | | Occidental Petroleum Corporation | | 2.854% | | BBB | | 2/8/2021 | | — | | | 20.1 | |
| — | | | 14.9 | | | Occidental Petroleum Corporation | | 2.600% | | BBB | | 8/13/2021 | | — | | | 15.0 | |
| — | | | 31.1 | | | Occidental Petroleum Corporation | | 2.700% | | BBB | | 8/15/2022 | | — | | | 31.4 | |
| — | | | 35.0 | | | Omnicom GP/Omnicom CAP | | 4.450% | | BBB+ | | 8/15/2020 | | — | | | 35.5 | |
| — | | | 20.0 | | | Oracle Corporation | | 1.900% | | A+ | | 9/15/2021 | | — | | | 20.0 | |
| — | | | 11.6 | | | Paccar Financial Corporation | | 2.000% | | A+ | | 9/26/2022 | | — | | | 11.7 | |
| — | | | 19.3 | | | Paypal Holdings, Inc. | | 2.200% | | BBB+ | | 9/26/2022 | | — | | | 19.4 | |
| — | | | 20.0 | | | PNC Bank, NA | | 2.315% | | A | | 12/9/2022 | | — | | | 20.0 | |
| — | | | 20.0 | | | PNC Bank, NA | | 2.028% | | A | | 12/9/2022 | | — | | | 20.0 | |
| — | | | 20.0 | | | Skandinaviska Enskilda | | 1.875% | | A+ | | 9/13/2021 | | — | | | 19.9 | |
| — | | | 5.0 | | | Sumitomo Mitsui Financial Group | | 2.934% | | A- | | 3/9/2021 | | — | | | 5.1 | |
| — | | | 5.0 | | | Sumitomo Mitsui Financial Group | | 2.058% | | A- | | 7/14/2021 | | — | | | 5.0 | |
| — | | | 101.4 | | | Swedish Export Credit | | 1.625% | | AA+ | | 11/14/2022 | | — | | | 101.0 | |
| — | | | 23.0 | | | The Walt Disney Company | | 1.830% | | A | | 9/1/2021 | | — | | | 23.1 | |
| — | | | 17.1 | | | Toronto Dominion Bank | | 2.500% | | AA- | | 12/14/2020 | | — | | | 17.2 | |
| — | | | 14.5 | | | Toronto Dominion Bank | | 2.170% | | A | | 3/17/2021 | | — | | | 14.5 | |
| — | | | 10.0 | | | Toronto Dominion Bank | | 1.900% | | A | | 12/1/2022 | | — | | | 10.0 | |
| — | | | 20.0 | | | United Technologies Corporation | | 1.900% | | BBB+ | | 5/4/2020 | | — | | | 20.0 | |
| — | | | 12.8 | | | Wells Fargo Bank, NA | | 3.325% | | A+ | | 7/23/2021 | | — | | | 12.9 | |
| — | | | 30.0 | | | Wells Fargo Bank, NA | | 2.082% | | A+ | | 9/9/2022 | | — | | | 30.0 | |
| | | | | | | | | | | | | | |
| | | | | | | | | | | | | | |
| | | | | | | | | | | | | | |
| | | | | | | | | | | | | | |
| | | | | | | | | | | | | | |
| | | | | | | | | | | | | | |
| | | | | | | | | | | | | | |
| | | | | | | | | | | | | | |
TOTAL CORPORATE BOND SECURITIES (Cost $— and $1,265.4) | | $ | — | | | $ | 1,268.3 | |
TIAA REAL ESTATE ACCOUNT
CONSOLIDATED SCHEDULES OF INVESTMENTS
(Dollar values shown in millions)
MUNICIPAL BOND SECURITIES—0.0% and 0.1%
| | | | | | | | | | | | | | | | | | | | | | | | | | | | | | | | | | | | | | | | | | | | |
| Principal | | | | | | | | | | Fair Value at |
| Issuer | | Coupon Rate | | Credit Rating(8) | | Maturity
Date | | September 30, 2020 | | December 31, 2019 |
| 2020 | | 2019 | |
| | | | | | | | | | | | (Unaudited) | | |
| $ | — | | | $ | 0.7 | | | Broward County Florida Airport System Revenue | | 1.844% | | A+ | | 10/1/2020 | | $ | — | | | $ | 0.6 | |
| — | | | 0.6 | | | Broward County Florida Airport System Revenue | | 1.874% | | A+ | | 10/1/2021 | | — | | | 0.5 | |
| — | | | 0.6 | | | Broward County Florida Airport System Revenue | | 1.936% | | A+ | | 10/1/2022 | | — | | | 0.6 | |
| — | | | 2.0 | | | California State Health Facilities Financing Authority | | 1.896% | | AA- | | 6/1/2021 | | — | | | 2.0 | |
| — | | | 1.0 | | | California State Health Facilities Financing Authority | | 1.893% | | AA- | | 6/1/2022 | | — | | | 1.0 | |
| — | | | 1.3 | | | Colorado State Health Facilities Authority HOS | | 2.075% | | A+ | | 11/1/2020 | | — | | | 1.2 | |
| — | | | 0.8 | | | Colorado State Health Facilities Authority HOS | | 2.185% | | A+ | | 11/1/2021 | | — | | | 0.8 | |
| — | | | 1.1 | | | Colorado State Health Facilities Authority HOS | | 2.237% | | A+ | | 11/1/2022 | | — | | | 1.1 | |
| — | | | 0.8 | | | Florida State Municipal Power Agency | | 1.966% | | A2 | | 10/1/2020 | | — | | | 0.8 | |
| — | | | 1.1 | | | Florida State Municipal Power Agency | | 1.986% | | A2 | | 10/1/2021 | | — | | | 1.2 | |
| — | | | 1.0 | | | Florida State Municipal Power Agency | | 2.064% | | A2 | | 10/1/2022 | | — | | | 1.0 | |
| — | | | 0.6 | | | Hamilton County Ohio Healthcare Facilities | | 2.135% | | AA | | 6/1/2020 | | — | | | 0.6 | |
| — | | | 0.9 | | | Harris County Texas Cultural Education Facilities | | 2.015% | | AA- | | 5/15/2020 | | — | | | 0.9 | |
| — | | | 1.3 | | | Harris County Texas Cultural Education Facilities | | 2.065% | | AA- | | 5/15/2021 | | — | | | 1.3 | |
| — | | | 1.3 | | | Harris County Texas Cultural Education Facilities | | 2.102% | | AA- | | 5/15/2022 | | — | | | 1.3 | |
| — | | | 0.5 | | | Indiana State Finance Authority | | 2.242% | | AA- | | 3/1/2020 | | — | | | 0.5 | |
| — | | | 1.1 | | | Lansing Michigan Board of Water and Light Utility System | | 1.952% | | AA- | | 7/1/2022 | | — | | | 1.2 | |
| — | | | 7.1 | | | Massachusetts State Water Resources | | 1.661% | | AA+ | | 8/1/2020 | | — | | | 7.1 | |
| — | | | 1.2 | | | Massachusetts State Water Resources | | 1.702% | | AA+ | | 8/1/2021 | | — | | | 1.2 | |
| — | | | 2.9 | | | Massachusetts State Water Resources | | 1.734% | | AA+ | | 8/1/2022 | | — | | | 2.9 | |
| — | | | 0.3 | | | Matanuska-Susitna Borough Alaska | | 2.016% | | AA+ | | 3/1/2023 | | — | | | 0.3 | |
| — | | | 0.5 | | | Midland County Texas Fresh Water Supply | | 1.872% | | AA- | | 9/15/2021 | | — | | | 0.5 | |
| — | | | 0.5 | | | Midland County Texas Fresh Water Supply | | 1.910% | | AA- | | 9/15/2022 | | — | | | 0.5 | |
| — | | | 0.2 | | | Park Creek Metropolitan District Revenue | | 2.292% | | AA | | 12/1/2022 | | — | | | 0.2 | |
| — | | | 0.2 | | | Stockton California Public Financing Authority | | 1.942% | | AA | | 10/1/2020 | | — | | | 0.2 | |
| — | | | 0.2 | | | Stockton California Public Financing Authority | | 2.048% | | AA | | 10/1/2021 | | — | | | 0.2 | |
| — | | | 0.1 | | | Stockton California Public Financing Authority | | 2.145% | | AA | | 10/1/2022 | | — | | | 0.1 | |
| — | | | 0.7 | | | Texas State University System Revenue Finance | | 1.760% | | Aa2 | | 3/15/2020 | | — | | | 0.7 | |
TIAA REAL ESTATE ACCOUNT
CONSOLIDATED SCHEDULES OF INVESTMENTS
(Dollar values shown in millions)
| | | | | | | | | | | | | | | | | | | | | | | | | | | | | | | | | | | | | | | | | | | | |
| Principal | | | | | | | | | | Fair Value at |
| Issuer | | Coupon Rate | | Credit Rating(8) | | Maturity
Date | | September 30, 2020 | | December 31, 2019 |
| 2020 | | 2019 | |
| | | | | | | | | | | | (Unaudited) | | |
| $ | — | | | $ | 0.5 | | | Texas State University System Revenue Finance | | 1.810% | | Aa2 | | 3/15/2021 | | $ | — | | | $ | 0.5 | |
| — | | | 1.7 | | | Texas State University System Revenue Finance | | 1.839% | | Aa2 | | 3/15/2022 | | — | | | 1.7 | |
| — | | | 0.5 | | | University of Akron | | 1.976% | | A1 | | 1/1/2021 | | — | | | 0.5 | |
TOTAL MUNICIPAL BOND SECURITIES (Cost $— and $33.3) | | $ | — | | | $ | 33.2 | |
TOTAL OTHER MARKETABLE SECURITIES (Cost $690.0 and $4,144.7) | | $ | 689.9 | | | $ | 4,150.2 | |
TOTAL MARKETABLE SECURITIES (Cost $1,324.7 and $4,830.7) | | $ | 1,352.1 | | | $ | 4,975.9 | |
LOANS RECEIVABLE—5.7% and 5.0%
| | | | | | | | | | | | | | | | | | | | | | | | | | | | | | | | | | | | | | | | | | | | |
| | Borrower | | Property Type | | Interest Rate(6) | | Maturity Date | | Fair Value at |
| Principal | | | | | | September 30, 2020 | | December 31, 2019 |
| 2020 | | 2019 | | | | | | |
| | | | | | | | | | | | (Unaudited) | | |
| $ | — | | | $ | 6.3 | | | DJM Capital Partners Mezzanine | | Retail | | 5.00% | | 3/9/2020 | | $ | — | | | $ | 6.3 | |
| 54.1 | | | 53.8 | | | SCG Oakland Portfolio | | Office | | 4.25% + LIBOR | | 3/1/2021 | | 54.1 | | | 53.8 | |
| — | | | 20.0 | | | Crest at Las Colinas Station Mezzanine | | Apartments | | 5.11% + LIBOR | | 5/10/2021 | | — | | | 20.0 | |
| 89.5 | | | 87.5 | | | 311 South Wacker Mezzanine | | Office | | 4.70% + LIBOR | | 6/7/2021 | | 86.0 | | | 86.8 | |
| 60.0 | | | 60.0 | | | River North Point Junior Mezzanine | | Office | | 4.30% + LIBOR | | 7/9/2021 | | 59.0 | | | 60.0 | |
| 76.1 | | | 92.2 | | | Blackstone RioCan Retail Portfolio Mezzanine | | Retail | | 4.65% + LIBOR | | 7/9/2021 | | 73.7 | | | 92.2 | |
| 60.0 | | | 60.0 | | | SoNo Collection Mezzanine | | Retail | | 6.75% + LIBOR | | 8/6/2021 | | 60.0 | | | 60.0 | |
| 124.7 | | | 128.6 | | | Project Glacier Mezzanine | | Industrial | | 4.40% + LIBOR | | 10/9/2021 | | 124.7 | | | 128.6 | |
| 15.6 | | | 14.7 | | | Liberty Park Mezzanine | | Office | | 6.08% | | 11/9/2021 | | 15.6 | | | 14.7 | |
| 125.0 | | | 125.0 | | | State Street Financial Center Mezzanine | | Office | | 0.065 | | 11/10/2021 | | 124.6 | | | 124.4 | |
| 20.0 | | | 20.0 | | | Modera Observatory Park Mezzanine | | Apartments | | 4.34% + LIBOR | | 6/10/2022 | | 19.6 | | | 20.0 | |
| 16.9 | | | 16.2 | | | San Diego Office Portfolio Mezzanine | | Office | | 2.45% + LIBOR | | 8/9/2022 | | 15.8 | | | 16.1 | |
| 50.7 | | | 48.2 | | | San Diego Office Portfolio Senior Loan | | Office | | 2.45% + LIBOR | | 8/9/2022 | | 51.2 | | | 48.2 | |
| 20.8 | | | 20.8 | | | Rosemont Towson Mezzanine | | Apartments | | 4.15% + LIBOR | | 9/9/2022 | | 20.6 | | | 20.8 | |
| 33.8 | | | 33.8 | | | Colony New England Hotel Portfolio Mezzanine | | Hotel | | 2.80% + LIBOR | | 11/9/2022 | | 30.5 | | | 33.8 | |
| 101.4 | | | 101.4 | | | Colony New England Hotel Portfolio Senior Loan | | Hotel | | 2.80% + LIBOR | | 11/9/2022 | | 99.4 | | | 101.4 | |
| 33.9 | | | 33.9 | | | Exo Apartments Mezzanine | | Apartments | | 2.30% + LIBOR | | 1/9/2023 | | 31.8 | | | 33.9 | |
| 101.6 | | | 101.6 | | | Exo Apartments Senior Loan | | Apartments | | 2.30% + LIBOR | | 1/9/2023 | | 103.1 | | | 101.6 | |
| 13.3 | | | — | | | Five Oak Mezzanine | | Office | | 2.35% + LIBOR | | 4/9/2023 | | 13.3 | | | — | |
| 29.8 | | | 27.5 | | | 1330 Broadway Mezzanine | | Office | | 5.01% + LIBOR | | 8/10/2023 | | 29.3 | | | 27.5 | |
| 82.0 | | | 82.0 | | | Great Value Storage Portfolio Mezzanine | | Storage | | 7.88% | | 12/6/2023 | | 73.8 | | | 82.0 | |
| 85.0 | | | 85.0 | | | Park Avenue Tower Mezzanine | | Office | | 4.35% + LIBOR | | 3/9/2024 | | 85.0 | | | 85.0 | |
TIAA REAL ESTATE ACCOUNT
CONSOLIDATED SCHEDULES OF INVESTMENTS
(Dollar values shown in millions)
| | | | | | | | | | | | | | | | | | | | | | | | | | | | | | | | | | | | | | | | | | | | |
| | Borrower | | Property Type | | Interest Rate(6) | | Maturity Date | | Fair Value at |
| Principal | | | | | | September 30, 2020 | | December 31, 2019 |
| 2020 | | 2019 | | | | | | |
| $ | 70.7 | | | $ | 71.0 | | | BREP VIII Industrial Loan Facility Mezzanine | | Industrial | | 5.00% + LIBOR | | 3/9/2026 | | $ | 70.7 | | | $ | 71.0 | |
| 20.0 | | | 20.0 | | | Aspen Lake Office Portfolio Mezzanine | | Office | | 8.25% | | 3/10/2028 | | 20.0 | | | 20.0 | |
| 95.0 | | | 95.0 | | | Merritt on the River Office Portfolio Mezzanine | | Office | | 8.00% | | 8/1/2028 | | 87.0 | | | 95.0 | |
| 100.0 | | | 100.0 | | | Charles River Plaza North Mezzanine | | Office | | 6.08% | | 4/6/2029 | | 100.0 | | | 100.0 | |
| 53.0 | | | — | | | Sol y Luna | | Apartments | | 6.55% | | 1/6/2030 | | 51.4 | | | — | |
TOTAL LOANS RECEIVABLE (Cost $1,533.0 and $1,504.5) | | | | | $ | 1,500.2 | | | $ | 1,503.1 | |
LOANS RECEIVABLE WITH RELATED PARTIES—0.3% and 0.2%
| | | | | | | | | | | | | | | | | | | | | | | | | | | | | | | | | | | | | | | | | | | | |
| | Related Party | | Property Type | | Interest Rate(6) | | Maturity Date | | Fair Value at |
| Principal | | | | | | September 30, 2020 | | December 31, 2019 |
| 2020 | | 2019 | | | | | | |
| | | | | | | | | | | | (Unaudited) | | |
| $ | 36.5 | | | $ | 36.5 | | | MRA Hub 34 Holding, LLC | | Office | | 2.50% + LIBOR | | 9/1/2022 | | $ | 36.5 | | | $ | 36.5 | |
| 32.8 | | | 32.8 | | | THP Student Housing, LLC | | Apartment | | 3.20% | | 9/1/2024 | | 32.9 | | | 32.5 | |
TOTAL LOANS RECEIVABLE WITH RELATED PARTIES (Cost $69.3 and $69.3) | | | | | $ | 69.4 | | | $ | 69.0 | |
TOTAL INVESTMENTS (Cost $22,292.3 and $25,697.4) | | | | | $ | 25,984.7 | | | $ | 29,899.0 | |
(1)The investment has a loan payable outstanding, as indicated in Note 9—Loans Payable.
(2)The fair value reflects the Account’s interest in the joint venture and is net of debt.
(3)Properties within this investment are located throughout the United States.
(4)For zero-coupon securities issued at a discount or premium to par, yield represents the annualized yield to maturity. For all other securities, the coupon rate is presented.
(5)A portion of this investment consists of land currently under development.
(6)Fixed interest rate loans are represented with a single rate. Variable interest rate loans are presented with their base spread and the corresponding index rate. All variable interest loans currently held by the Account use the one month LIBOR rate on U.S. dollar deposits as the index rate, as published by ICE Benchmark Administration Limited.
(7)All or a portion of these securities are out on loan. The aggregate value of securities on loan September 30, 2020 and December 31, 2019 were $2.1 million and $25.2 million, respectively.
(8)Credit ratings are sourced from S&P Global Ratings ("S&P"), Moody's Investors Services or Fitch Ratings, Inc. Ratings for sold bonds reflect the credit rating as of the last reporting period.
ITEM 2. MANAGEMENT’S DISCUSSION AND ANALYSIS OF FINANCIAL CONDITION AND RESULTS OF OPERATIONS
The following discussion and analysis of the Account’s financial condition and results of operations should be read together with the consolidated financial statementsConsolidated Financial Statements and notes contained in this report and with consideration to the sub-section entitled “Forward-Looking Statements,” which begins below, and the section of the Account’s Annual Report on Form 10-K for the year ended December 31, 20162019 (the “Form 10-K”) entitled “Item 1A. Risk Factors.” The past performance of the Account is not indicative of future results.
Forward-looking Statements
Some statements in this Form 10-Q which are not historical facts may be “forward-looking statements” within the meaning of Section 27A of the Securities Act of 1933, Section 21E of the Securities Exchange Act of 1934 and the Private Securities Litigation Reform Act of 1995. Forward-looking statements include statements about management’s expectations, beliefs, intentions or strategies for the future, include the assumptions and beliefs underlying these forward-looking statements, and are based on current expectations, estimates and projections about the real estate industry, domestic and global economic conditions, including conditions in the credit and capital markets, the sectors, and markets in which the Account invests and operates, and the transactions described in this Form 10-Q. While management believes the assumptions underlying any of its forward-looking statements and information to be reasonable, such information may be subject to uncertainties and may involve certain risks which may be difficult to predict and are beyond management’s control. These risks and uncertainties could cause actual results to differ materially from those contained in any forward-looking statement. These risks and uncertainties include, but are not limited to, the risks associated with the following:
•General Risks of Acquiring and Owning Real Estate:Property. The risks associated with acquiring and owning real property, including general economic and real estate market conditions, the availability of, and economic cost associated with, financing the Account’s properties, the risk that the Account’s properties become too concentrated (whether by geography, sector or by tenant mix), competition for acquiring real estate properties, leasing risk (including tenant defaults) and the risk of uninsured losses at properties (including due to terrorism, natural disasters, and acts of violence);
•COVID-19 Risks. In response to the ongoing COVID-19 pandemic, governmental authorities throughout the world, including the United States, have continued to take significant measures to inhibit the spread of the disease. Such ongoing measures include prohibiting people from congregating in heavily populated areas, instituting localized quarantines, restricting nonessential travel, issuing “stay-at-home” orders, closing schools, and most notably, restricting the types of businesses that may continue to operate. While some of these restrictions were eased in the third quarter of 2020, many such restrictions continue to remain and have had an adverse impact on economic and market conditions across the United States during the third quarter. It is possible that public health officials and governmental authorities in the markets in which we own properties may impose additional restrictions, or slow the lifting of existing restrictions, in an effort to further slow the spread of the COVID-19 pandemic or address any rise in infection rates. Such officials may also relax or revoke existing restrictions too quickly, which could, in either case, exacerbate the continued severity of adverse impacts of the pandemic on the economy. The COVID-19 pandemic, including these responsive measures, will likely have an adverse effect on the Account. For example, the negative impact of the COVID-19 pandemic on our tenants may include an immediate reduction in cash flow available to pay rent under our leases which, in turn, could adversely affect our own liquidity, and there can be no guarantee that additional liquidity will be readily available or available on favorable terms and could result in the Account exercising the liquidity guarantee. Moreover, the market volatility and economic uncertainty surrounding the COVID-19 pandemic may negatively impact our liquid investments, such as those in real estate investment trusts ("REIT") securities and mortgage backed securities ("MBS"). These and other consequences of the COVID-19 pandemic are expected to have an adverse effect on the Account’s business and results of operations;
•General Risks of Selling Real Estate:Estate Investments. The risk that the sales price of a property might differ, perhaps significantly, from its estimated or appraised value, leading to losses or reduced profits to the Account, the risk that the Account might not be able to sell a property at a particular time for a price which management believes represents its fair or full value, the risk of a lack of availability of financing (for potential purchasers of the Account’s properties), risks associated with disruptions in the credit and capital markets, and the risk that
the Account may be required to make significant expenditures before the Account is able to market and/or sell a property;
Valuation:•Valuation and Appraisal Risk. The risks associated with property valuations, including the fact that appraisals can be subjective in a number of respects and the fact that the Account’s appraisals are generally obtained on a quarterly basis and there may be periods in between appraisals of a property during which the value attributed to the property for purposes of the Account’s daily accumulation unit value may be more or less than the actual realizable value of the property;
Borrowing:•Borrowing Risk. Risks associated with financing the Account’s properties, including the risk of default on loans secured by the Account’s properties (which could lead to foreclosure), the risk of default under unsecured lines of credit or credit facilities underwritten by third-party lenders, the risk associated with high loan to valueloan-to-value ratios on the Account’s properties (including the fact that the Account may have limited, or nozero net value in such a property), the risk that significant sums of cash could be required to make principal and interest payments on the loans and the risk that the Account may not have the ability to obtain financing or refinancing on favorable terms (or at all), which may be aggravated by general disruptions in credit and capital markets;
Participant Transactions•Investment and Cash Management:Management Risks Associated with Participant Transactions. Investment risk associated with participant transactions, in particular that (i) significant net participant transfers out of the Account may impair our ability to pursue or consummate new investment opportunities that are otherwise attractive to the Account and/ or may result in sales of real estate-related assets to generate liquidity, (ii) significant net participant transfers into the Account may result, on a temporary basis, in our cash holdings and/or holdings in liquid realnon-real estate-related investments exceeding our long-term targeted holding levels
and (iii) high levels of cash and liquid non-real estate-related investments in the Account during times of appreciating real estate values can impair the Account’s overall return;
•Joint Venture Investments:Investment Risk. The risks associated with joint ventures organized as limited partnerships or limited liability companies, as applicable,and real estate funds, including the risk that a co-venturer or fund manager may have interests or goals inconsistent with thosethat of the Account, the risk that a co-venturer or fund manager may have financial difficulties, and the risk that the Account may have limited rights with respect to operation of the property and transfer of the Account’s interest;
•Real Estate Regulatory Matters:Risk. Uncertainties associated with environmental liability and regulations and other governmental regulatory matters such as zoning laws, rent control laws, and property taxes;
Foreign Investments:•Environmental Risk. The risks associated with purchasing, owningthat the Account may be liable for damage to the environment or injury to individuals caused by hazardous substances used or found on its properties. Federal and disposing foreignstate environmental laws may also impose restrictions on the manner in which a property may be used, impose significant costs for environmental clean-up relating to certain real property investments (primarily(including remediating contaminated property), and require the Account to acquire third-party insurance related to environmental risks, all of which could adversely impact the Account’s investment returns;
•Uninsurable Loss Risk. Certain catastrophic losses (e.g., from earthquakes, wars, terrorist acts, nuclear accidents, hurricanes, tsunamis, high winds, wildfires, inland or coastal floods, rising sea levels or environmental or industrial hazards or accidents) may be uninsurable or so expensive to insure against that it is economically disadvantageous for the Account to buy insurance to cover such losses. In such an event, the catastrophic losses could adversely impact the Account’s investment returns;
•Physical Climate Change Related Financial Risk. Many of the Account’s commercial real estate properties),assets are located within geographical regions in the United States and foreign jurisdictions that currently are, and in the future will continue to be, adversely impacted by increasingly severe and adverse weather conditions across the globe, including, among others, earthquakes, hurricanes, tsunamis, high winds, wildfires, inland or coastal flooding, and rising sea levels. Any resulting losses from such climate-related changes and hazards could adversely impact the Account’s investment returns;
•Global Economic Risks. National and regional economies and financial markets have become increasingly interconnected, which has increased the probability that conditions in one country, region or market might adversely impact issuers in a different country, region or market. Events such as war, terrorism, natural and environmental disasters and the spread of infectious illnesses, pandemics or other public health emergencies may adversely affect the global economy and the securities, local commercial real estate markets and issuers in which the Account invests. Recent examples of such events include the COVID-19 pandemic that was first
detected in Wuhan, China in December 2019 and has since spread worldwide, resulting in government imposed shutdowns across the globe. These events have and could continue to reduce consumer demand and economic output, result in market closure, travel restrictions or quarantines, and generally have a significant impact on the economy, and, as a result, have an adverse effect on the Account’s business;
•ESG Criteria Risk. The risks that the Account’s utilization of environmental, social and governance ("ESG") criteria in its commercial real estate underwriting may result in the Account foregoing some commercial real estate market opportunities that could be beneficial to the Account. Consequently, the Account may underperform other investment vehicles that do not utilize such ESG criteria in selecting portfolio properties;
•Foreign Real Property Investment Risk. Foreign commercial real properties, foreign real estate loans, and foreign debt investments may experience unique risks such as changes in currency exchange rates, imposition of market controls or currency exchange controls, seizure, expropriation or nationalization of assets, political, risk, the risk associated with currency fluctuations (whether hedgedsocial or not),diplomatic events or unrest, regulatory and taxation risks and risks of enforcing judgments;
Conflicts of Interest: Conflicts of interest associated with TIAAenforcing judgments in foreign countries that could cause the Account to lose money. The risks described above often increase in countries with emerging markets;
•Risk of Investing in REIT Securities. Investments in REIT securities are subject to many of the same general risks associated with direct real property ownership. In particular, equity REITs may be affected by changes in the value of the underlying properties owned by the entity, while mortgage REITs may be affected by the quality of any credit extended. In addition to these risks, because REIT investments are securities and generally publicly traded, they may be exposed to market risk and potentially significant price volatility due to changing conditions in the financial markets and, in particular, changes in overall interest rates, regardless of the value of the underlying real estate such REIT may own;
•Risks of Mortgage-Backed Securities. The Account from time to time has invested in mortgage-backed securities and may in the future invest in such securities. Mortgage-backed securities, such as commercial mortgage-backed securities ("CMBS") and residential mortgage-backed securities ("RMBS"), are subject to many of the same general risks inherent in real estate investing, making mortgage loans and investing in debt securities. The underlying mortgage loans may experience defaults, are subject to prepayment risk or extension risk and are highly sensitive to changes in interest rates, liquidity of the secondary market, economic conditions impacting financial institutions and the credit markets generally, and changes in governmental policies impacting Fannie Mae and Freddie Mac and/or U.S. Government programs related to mortgages that may be implemented in the future;
•Risks of Investing in Mortgage Loans and Related Investments. Because the Account’s investment strategy includes investments in mortgage loans (i.e., the Account serving as investment manager oflender), the Account will be subject to the risks inherent in making mortgage loans, including, among others, (i) borrower default, bankruptcy and providerinsolvency that results in the Account being unable to recover some or all of its original investment, (ii) mechanic’s or tax liens that may have priority over the liquidity guarantee atAccount’s security interest, (iii) a deterioration in the same time as TIAAfinancial condition of tenants, (iv) changes in interest rates for the Account’s variable-rate mortgage loans and its affiliates are serving as an investment manager to other real estate accountsdebt instruments that may increase or funds, including conflicts associated with satisfying its fiduciary duties to all such accounts and funds associated with purchasing, selling and leasing of properties;
Required Property Sales: Thedecrease the investment’s yield, (v) the risk that if TIAA were to own too largeborrowers pay off their mortgage loans earlier or later than expected resulting in a percentagedecline in income, and (vii) the costs of hedging strategies for domestic and foreign loans or securities that may increase the Account’s accumulation units through funding the liquidity guarantee (as determined by the independent fiduciary), the independent fiduciary could require the salestransactions costs and reduce its performance;
•Risks of properties to reduce TIAA’s ownership interest, which sales could occur at times and at prices that depress the sale proceeds to the Account;
U.S. Government and Government Agency Securities:Securities.Risks associated with investment securities issued by U.S. governmentGovernment agencies and U.S. government-sponsoredGovernment-sponsored entities, including the risk that the issuer may not have their securities backed by the full faith and credit of the U.S. government,Government, which could adversely affect the pricing and value of such securities. Such securities are also subject market movements, regulatory changes, changes in political or economic conditions or downgrades or threatened downgrades of the credit rating for U.S. Government obligations generally that transaction activity may fluctuate significantly from time to time, which could negatively impact the value of the securities and the Account’s ability to dispose of athe security at a favorable time;time. U.S. Government securities generally present limited credit risk compared to other types of debt securities but are not free from risk;
•Risks of Corporate Obligations. The Account’s investment in corporate obligations (such as commercial paper and other types of corporate debt) may be subject to general dislocations in the finance or credit markets, fluctuations in transaction activity that could impair the Account’s ability to dispose of a corporate debt security
at a favorable time, and the risk that the credit quality of the corporate issuer will deteriorate, any of which could have a negative impact on the value of the investment; and
•Risks of Liquid, AssetsFixed-Income Investments and Securities:Other Securities. Risks associated with investments in liquid, fixed-income investments and real estate-related liquid assets (which could include, from time to time, registered or unregistered real estate investment trust (“REIT”)REIT securities and commercial mortgage-backed securities (“CMBS”))CMBS), and non-real estate-related liquid assets, including:
Financial/credit risk—Risks•Issuer Risk (Financial risk)-The risk that the issuer will not be able to pay principal and interest when due or that the issuer’s earnings will fall;
•Credit Risk (a type of Issuer Risk)-The risk that the issuer of fixed-income investments may not be able or willing to meet interest or principal payments when the payments become due;
•Credit Spread Risk-The risk that credit spreads (i.e., the difference in yield between securities that is due to differences in each security’s respective credit quality) may increase when market participants believe that bonds or other fixed-income securities generally have a greater risk of default, which could result in a decline in the market values of the Account’s debt or other fixed-income securities;
•Market volatility risk—Volatility, Liquidity and Valuation Risk (types of Market Risk)-The risk that the changing conditions in financial markets may cause the Account’s investments to experience price volatility;
•Interest rate volatility risk—Rate Risk (a type of Market Risk)-The risk that interest rate volatility may affect the Account’s current income from an investment;investment or the pricing of that investment. In general, changing interest rates could have unpredictable effects on the markets and may expose markets to heightened volatility;
Deposit/money•Downgrade Risk-The risk that securities are subsequently downgraded should TIAA and/or rating agencies believe the issuer’s business outlook or creditworthiness has deteriorated;
•Income Volatility Risk-The risk that the level of current income from a portfolio of fixed-income investments may decline in certain interest rate environments;
•Call Risk-The risk that, during periods of falling interest rates, an issuer may call (or repay) a fixed-income security prior to maturity, resulting in a decline in the Account’s income;
•Prepayment Risk-The risk that, during periods of falling interest rates, borrowers may pay off their loans sooner than expected, forcing the Account to reinvest the unanticipated proceeds at lower interest rates and resulting in a decline in income;
•Extension Risk-The risk that, during periods of rising interest rates, borrowers may pay off their mortgage and other loans later than expected, preventing the Account from reinvesting principal proceeds at higher interest rates and resulting in less income than potentially available;
•U.S. Government Securities Risk-Securities issued by the U.S. Government or one of its agencies or instrumentalities may receive varying levels of support from the U.S. Government, which could affect the Account’s ability to recover should they default. To the extent the Account invests significantly in securities issued or guaranteed by the U.S. Government or its agencies or instrumentalities, any market risk—Risksmovements, regulatory changes or changes in political or economic conditions that affect the securities of the U.S. Government or its agencies or instrumentalities in which the Account invests may negatively impact the Account’s performance;
•State and Municipal Investment Risk-The risk that events affecting states and municipalities, including severe financial difficulties and continued budget deficits, may adversely impact the Account’s investments and its performance;
•Foreign Securities Risk-Foreign securities investments may experience unique risks such as changes in currency exchange rates, imposition of market controls or currency exchange controls, seizure, expropriation or nationalization of assets, and political, social or diplomatic events or unrest that could cause the Account to lose money. The risks described above often increase in countries with emerging markets;
•Emerging and Frontier Markets Risk-The risk of foreign investment often increases in countries with emerging markets. For example, these countries may have more unstable governments than developed countries, and their economies may be based on only a few industries. Because their financial markets may be very small, share prices of financial instruments in emerging market countries may be volatile and difficult to determine. Financial instruments of issuers in these countries may be less liquid than
those of issuers in more developed countries. In addition, foreign investments are subject to a variety of special restrictions in many emerging market countries. Frontier markets are those emerging markets that are considered to be among the smallest, least mature and least liquid, and as a result, the risks of investing in emerging markets are magnified in frontier markets;
•Fixed-Income Foreign Investment Risk-Investment in fixed-income securities or financial instruments of foreign issuers involves increased risks due to adverse issuer, political, regulatory, currency, market or economic developments. These developments may impact the ability of a foreign debt issuer to make timely and ultimate payments on its debt obligations to the Account or impair the Account’s ability to enforce its rights against the foreign debt issuer. These risks are heightened in emerging or developing markets. Foreign fixed-income investments may also be less liquid and more difficult to value than fixed-income investments in U.S. issuers;
•Sovereign Debt Risk-The risk that the issuer of non-U.S. sovereign debt or the governmental authorities that control the repayment of such debt may be unable or unwilling, due to social, political or economic factors, to repay principal or interest when due, resulting in losses to the Account;
•Supranational Debt Risk-The risk that the issuer of multinational or supranational foreign debt (e.g., the European Union or the International Monetary Fund (IMF)) that controls the repayment of such debt may be unable or unwilling, due to social, political or economic factors such as the sudden or gradual disintegration of the multinational or supranational organization, to repay principal or interest when due, resulting in losses to the Account;
•Active Management Risk-The risk that the Account’s investment strategy, investment selection or trading execution may cause the Account to underperform relative to a comparison index or accounts or issuers with similar investment objectives;
•Currency Risk-The risk that foreign (non-U.S.) currencies may decline in value relative to the U.S. dollar and adversely affect the value of the Account’s investments in foreign currencies, securities denominated in foreign currencies or derivative instruments that provide exposure to foreign currencies;
•Derivatives Risk-The risks associated with investing in derivatives and other types of hedging strategies may be different and greater than the risks associated with directly investing in the underlying securities and other instruments. The Account may use futures, options, or forwards, and the Account may also use more complex derivatives such as swaps that might present liquidity, credit and counterparty risk. When investing in derivatives, the Account may lose more than the principal amount invested;
•Currency Management Strategies Risk-Currency management strategies, including the use of forward currency contracts and other derivatives, may substantially change the Account’s exposure to currencies and currency exchange rates and could result in losses to the Account if currencies do not perform as anticipated;
•Counterparty and Third Party Risk-The Account’s transactions involving a counterparty to a derivative or other instrument, or to a third party responsible for servicing the instrument, are subject to the credit risk of the counterparty or third party, and to the counterparty’s or third party’s ability to perform in accordance with the terms of the transaction;
•Regulation S and Rule 144A Securities Risk-The risk that SEC Regulation S and Rule 144A securities may be less liquid, and have less disclosure and investor protections, than publicly traded securities. Such securities may involve a high degree of business and financial risk and may result in losses to the Account;
•Illiquid Investments Risk-The risk that illiquid investments may be difficult for the Account to sell for the value at which they are carried, if at all, or at any price within the desired time frame; and
•Deposit/Money Market Risk-The risk that the Account could experience losses if banks fail.
More detailed discussions of certain of these risk factors are contained in the section of the Form 10-K entitled “Item 1A. Risk Factors” and "Part II, Item 1A, Risk Factors" in this section belowReport and also in the section below entitled “Quantitative and Qualitative Disclosures About Market Risk.” These risks could cause actual results to differ materially from historical experience or management’s present expectations.
Caution should be taken not to place undue reliance on management’s forward-looking statements, which represent management’s views only as of the date that this report is filed. Neither management nor the Account undertake any obligation to update publicly or revise any forward-looking statement, whether as a result of new information, changed assumptions, future events or otherwise.
Commercial real estate market statistics discussed in this section are obtained by the Account from sources that management considers reliable, but some of the data are preliminary for the period ended September 30, 20172020 and may be subsequently revised. Prior period data may have been adjusted to reflect updated calculations. Investors should not rely exclusively on the data presented below in forming a judgment regarding the current or prospective performance of the commercial real estate market generally.
ABOUT THE TIAA REAL ESTATE ACCOUNT
The Account was established, under the laws of New York, in February 1995 as an insurancea separate account of TIAA and interests in the Account were first offered to eligible participants on October 2, 1995. The Account offers individual and group accumulating annuity contracts (with contributions made on a pre-tax or after-tax basis), as well as individual lifetime and term-certain variable payout annuity contracts (including the payment of death benefits to beneficiaries). Investors are entitled to transfer funds to or from the Account under certain circumstances. Funds invested in the Account for each category of contract are expressed in terms of units, and unit values will fluctuate depending on the Account’s performance.
Investment Objective and Strategy
The Account seeks to generate favorable long-termtotal returns primarily through the rental income and appreciation of real estate anda diversified portfolio of directly held, private real estate investments owned by the Account. The Account will also invest in non-realand real estate-related publicly traded securities and short-term higher quality liquid investments, that are easily converted to cash to enable the Account to meet participant redemption requests, purchase or improve properties, or cover other expense needs.while offering investors guaranteed, daily liquidity.
Real Estate-Related Investments. The Account intends to have between 75% and 85% of its net assets invested directly in real estate or real estate-related investments with the goal of producing favorable long-term returns primarily through rental income and appreciation. These investments may consist of:
•Direct ownership interests in domestic and foreign real estate;
•Direct ownership of real estate through interests in joint ventures; or
•Indirect interests in real estate through real estate-related securities, such as:
◦public and/or privately placed, domestic and foreign, registered and unregistered equity investments in REITs, which investments may consist of registered or unregistered common or preferred stock interests;
◦private real estate limited partnerships and limited liability companies;companies (collectively, "real estate funds");
◦investments in equity or debt securities of domestic and foreign companies whose operations involve real estate (i.e.(i.e., that primarily own, develop or manage real estate) which may not be REITs; and
◦domestic or foreign loans, including conventional commercial mortgage loans, participating mortgage loans, secured domestic and foreign (including U.K.) mezzanine loans, subordinated loans and collateralized mortgage obligations, including CMBS and other similar investments.
The Account’s principal investment strategy is to purchase direct ownership interests in income-producing real estate, primarily office, industrial, retail and multi-family residential properties. The Account is targeted to hold between 65% and 80%85% of the Account’s net assets in such direct ownership interests at any time. Historically, approximately 70% of the Account’s net assets have been comprised of such direct ownership interests in real estate.interests.
In addition, while the Account is authorized to hold up to 25% of its net assets in liquid real estate-related securities, such asincluding publicly traded REITs and CMBS, managementCMBS. Management intends that the Account will not hold more than 10% of its net assets in such securities on a long-term basis. Traditionally, less than 10% of the Account’s net assets have been comprised of interests in these securities; although, the Account has recently held approximately 10% of its net assets in equity REIT securities at times. In addition, under the Account’s current investment guidelines, the Account is authorized to hold up to 10% of its net assets in CMBS. As of September 30, 2017,2020, publicly traded REIT securities comprised approximately 4.5%2.8% of the Account’s net assets, and the Account held no CMBS as of such date.
Non-Real Estate-Related Investments.In making commercial real estate investments within the Account, TIAA seeks to make investments that are suitable from a financial perspective and whose activities are generally consistent with industry recognized ESG criteria. The Account intends to promote awareness of these criteria to its joint venture partners, vendors and other stakeholders in connection with portfolio related activity involving commercial real estate transactions. TIAA
believes awareness, and, as appropriate, implementation of ESG criteria in commercial real estate holdings is beneficial to total long-term returns for the Account. In its evaluation of commercial real estate opportunities, the Account will take ESG considerations into account as part of the financial assessment of a commercial real estate portfolio asset, and not to achieve a desired outcome or as an investment qualification or screen. Ultimately, the Account will make an investment decision that incorporates ESG criteria only to the extent that the criteria is reasonably expected to enhance the ability to achieve desired returns for the Account.
Liquid, Fixed-Income Investments. The Account will invest the remaining portion of its assets (targeted to be between 15% and 25% of its net assets) in publicly traded,the following types of liquid, fixed income investments; namely:
Short-term government-related instruments, including •U.S. Treasury bills;or U.S. Government agency securities;
Long-term government-related•Intermediate-term or long-term government related instruments, such as bond or other fixed-income securities issued by U.S. governmentGovernment agencies, U.S. States or municipalities or U.S. government sponsored entities;Government-sponsored entities as well as foreign governments and their agencies (including those in emerging markets) and supranational or multinational organizations (e.g., the European Union);
Short-term non-government-related instruments, such as money market instruments and commercial paper;
Long-term non-government-related•Intermediate-term or long-term non-government related instruments, such as corporate debt securities or asset-backed securities (“ABS”) issued by domestic or foreign entities, including domestic or foreign mezzanine or other debt, MBS, RMBS, debt securities of foreign governments, and collateralized debt (“CDO”), collateralized bond (“CBO”) and collateralized loan (“CLO”) obligations, but only if such non-government related instruments are investment-grade securities;
•Money market instruments and other cash equivalents. These will usually be high-quality, short-term debt instruments, including U.S. Government or government agency securities, commercial paper, certificates of deposit, bankers’ acceptances, repurchase agreements, interest-bearing time deposits, and corporate debt securities; and
Stock of•To a limited extent, privately issued (or non-publicly traded) debt securities, including Rule 144A securities, issued by domestic and foreign companies that do not primarily own or manage real estate.estate, but only if such domestic and foreign privately issued debt securities are investment-grade securities.
However, from time to time, theThe Account’s non-real estate-related liquid, fixed-income investments may comprise less than 15% (and possibly less than 10%) of its assets (on a net basis and/or a gross basis), especially during and immediately following periods of significant net participant outflows, in particular due to significant participant transfer activity.outflows. In addition, the Account, from time to time and on a temporary basis, may hold in excess of 25% of its net assets in non-real estate-related liquid, fixed-income investments, particularly during times of significant inflows into the Account and/or a lack of attractive real estate-related investments available in the market.
Liquid Securities.Securities Generally. Primarily due to management’s need to manage fluctuations in cash flows, in particular during and immediately following periods of significant participant net transfer activity into or out of the Account, the Account may, on a temporary basis (i) exceed the upper end of its targeted holdings (currently 35% of the Account’s net assets) in liquid securities of all types, including both publicly traded non-real estate-related liquid investments and liquid real estate-related securities, such as REITs, ABS, RMBS, CMBS and CMBS,MBS, or (ii) be below the low end of its targeted holdings in such liquid securities (currently 15% of the Account’s net assets).
The portion of the Account’s net assets invested in liquid investments of all types may exceed the upper end of its target, for example, if (i) the Account receives a large inflow of money in a short period of time, in particular due to significant participant transfer activity into the Account, (ii) the Account receives significant proceeds from sales or financings of direct real estate assets, (iii) there is a lack of attractive direct real estate investments available on the market, and/or (iv) the Account anticipates more near-term cash needs, including to apply to acquire or improve direct real estate investments, pay expenses or repay indebtedness.
Foreign Investments.Investments. The Account from time to time willmay also make foreign real estate and foreign real estate-related investments and foreign liquid, fixed-income investments. Under the Account’s investment guidelines, investments in direct foreign real estate and real estate loans, together with foreign real estate-related securities and foreign non-real estate-related liquid, fixed-income investments may not comprise more than 25% of the Account’s net assets. However, management doesn't intend such foreign investments, in the aggregate, to exceed 10% of the Account's net assets. As of September 30, 2017,2020, the Account did not hold any foreign real estate investments.
In managing any domestic or foreign mezzanine debt or other domestic or foreign loans or securities, the Account may enter into certain derivatives transactions (including forward currency contracts and swaps, futures contracts, put and call options and other hedging transactions) in order to hedge against the risks of exchange rate uncertainties, interest rate uncertainties and foreign currency or market fluctuations impacting the Account’s domestic or foreign investments. The Account does not intend to speculate in such transactions.
THIRD QUARTER 20172020 U.S. ECONOMIC AND COMMERCIAL REAL ESTATE OVERVIEW
The Account invests primarily in high-quality, core real estate in order to meet its investment objective of obtaining favorable long-term returns through rental income and the appreciation of its real estate holdings.
Economic Overview and Outlook
Key U.S. economic indicators and their near-term outlook are summarized in the table below. According to the “advance estimate” from the Bureau of Economic Analysis, U.S. Gross Domestic Product (“GDP”) increased at a 3.0% annual rate during third quarter as compared to 3.1% during the second quarter. Inventory accumulation, trade, and consumer spending contributed to growth, although the pace of spending moderated. Several major hurricanes made landfall in the U.S. during the quarter, causing significant damage. The overall impact on third quarter GDP was not quantified, but the hurricanes likely caused some disruption to economic production in several states. The storms ended an 83 month streak of job gains when employment fell by 33,000 jobs in September, most of which was concentrated in the leisure and hospitality sector. As a result, the Bureau of Labor Statistics reported that the pace of job growth moderated during the third quarter when 274,000 jobs were added as compared to 562,000 during second quarter. The unemployment rate decreased to end the third quarter at 4.2%.
Economic Indicators*
| | | | | 2016 | | 1Q 2017 | 2Q 2017 | 3Q 2017 | | Forecast | |
| | 2017 | | 2018 | |
| Key Macro Economic Indicators* | | Key Macro Economic Indicators* | Actuals | | | Forecast |
| 2Q20 | | 3Q20 | | 2020 | | 2021 |
Economy(1) | | Economy(1) | | | | |
| Gross Domestic Product ("GDP") | | 1.5% | | 1.2% | 3.1% | 3.0% | | 2.2% | | 2.4% | Gross Domestic Product ("GDP") | (31.4)% | | 33.1% | | | (3.9)% | | 3.8% |
| Employment Growth (Thousands) | | 2,240 | | 498 | 562 | 274 | | 2,100 | | 1,800 | |
Employment Growth (Contraction) (3) | | Employment Growth (Contraction) (3) | (13,281) | | 3,926 | | | (703) | | 300 |
| Unemployment Rate | | 4.9% | | 4.5% | 4.4% | 4.2% | | 4.4% | | 4.1% | Unemployment Rate | 11.1% | | 7.9% | | | 9.1% | | 7.6% |
Interest Rates(2) | | Interest Rates(2) | | | |
| 10 Year Treasury | | 1.8% | | 2.4% | 2.3% | 2.2% | | 2.3% | | 2.8% | 10 Year Treasury | 0.7% | | 0.7% | | | 0.8% | | 1.1% |
Sources: Blue Chip Economic Indicators, Blue Chip Financial Forecasts,Bloomberg, BEA, Bureau of Labor Statistics, Federal Reserve and Moody’s Analytics
| |
* | Data subject to revision |
| |
(1)
| *Data subject to revision (1)GDP growth rates are annual rates. Quarterly unemployment rates are the reported value for the final month of the quarter while annual values represent a twelve-month average. |
| |
(2)
| Treasury rates are an average over the stated period. |
The Federal Open Market Committee (“FOMC”) voted in September to maintain the target range for the federal funds rate at 1.0%final month of the quarter while annual values represent a twelve-month average.
(2)Treasury rates are an average over the stated period.
(3)Values presented in thousands.
In the aftermath of the worst economic quarter in U.S. history, the third quarter of 2020 was a story of recovery. Most U.S. states adopted a phased approach in their attempt to 1.25% “in viewminimize the spread of realized and expected labor market conditions and inflation”, as indicatedthe virus in the September meeting minutes.second and third quarters of 2020, allowing sectors with lower comparative risk to reopen first. The committee expectsphased approach has slowed the rate of spread among the population, reducing the risk of a return to full economic shutdown, but it has also served to limit the economic recovery. Most states continue to have strict occupancy limits, restrictions on large gatherings, and mask mandates are frequently required when congregating indoors.
Multiple vaccine candidates currently under development provide some optimism that the spread of the virus can be better mitigated in 2021 if one or more of these candidates prove successful. Moreover, more experience with the virus has standardized treatments and improved patient outcomes. The continuation of the U.S. economic conditionsrecovery will be highly dependent on the success or failure of these efforts. Restrictions on occupancy as previously described are likely to persist until the spread of the virus is controlled, or the severity of its symptoms more effectively treated. In addition to the uncertainty of the extent of the COVID-19 pandemic's longevity, the U.S. presidential election in November 2020 is an additional variable that will weigh heavily on the fourth quarter of 2020.
The U.S. unemployment rate rebounded consistent with the reopening of the U.S. economy, ending at 7.9% for the third quarter. Certain sectors such as hospitality, tourism and certain retail remain significantly challenged by the pandemic and will continue to evolve in a manner that will warrant gradual rate increases. The FOMC is widely expected to raise the federal funds rate target range by 25 basis points at the December meeting.
Despite damage endured by recent hurricanes and related distortions in September’s economic data, the U.S. economy has demonstrated consistent momentum and GDP is expected to increase at above-trend rates through next year. Blue Chip economists expect GDP to increase at a 2.2% rate for all of 2017 and at a 2.4% rate in 2018. The loss of jobs in September was largely associated with business disruptions from recent hurricanes; and employment growth is expected to resumebe such in the coming months. GDP and employment growth of this magnitude is supportive of ongoingContinued improvement in commercial real estate market conditions.the unemployment rate will be contingent on the reopening phases continuing to progress. The economic impact of the COVID-19 pandemic has been especially pronounced on lower-income families. Elementary and secondary students returning to the classroom in some states is a positive development, as lower-income workers may have limited alternative options in regards to childcare. The U.S. Congress may pass additional stimulus to assist American workers, but such stimulus will not occur until after the presidential election. The Federal Reserve has maintained that interest rates are highly unlikely to increase in 2021, and are likely to stay at their current level through 2023.
Real Estate Market Conditions and Outlook
CommercialSince February 2020, commercial real estate conditions remained relatively steady during the third quarter of 2017. Tenant demand was generally strong enough to support modest vacancy rate improvements in the office and industrial sectors while apartment and retail market conditions softened. Transaction activity continued to weaken compared to 2016 levels. Real Capital Analytics (“RCA”) reported that sales of office, industrial, retail, and multi-family properties totaled $102.2 billion during third quarter 2017, a 5.1% decline from third quarter 2016. Property pricingprices have fallen 10%, as calculated by the Green Street Advisor Commercial Property Price Index (“CPPI”CPPI") increased 1.0%. Declines have been uneven across sectors due to the disproportionate impact of the COVID-19 pandemic. Sectors highly dependent on social interaction, such as retail, hospitality, and amusements have been most severely impacted, as government restrictions paired with consumer caution has caused demand to sharply decline. Real estate transaction volume is down approximately 36% year-to-date when compared to 2019. Transactions in 2020 have been concentrated in two sectors which comprise more than 60% of total volume, apartments and industrial.
The Account continues to benefit from its ample liquidity resources, which allow the Account to weather economic downturns without liquidating properties at suboptimal pricing.
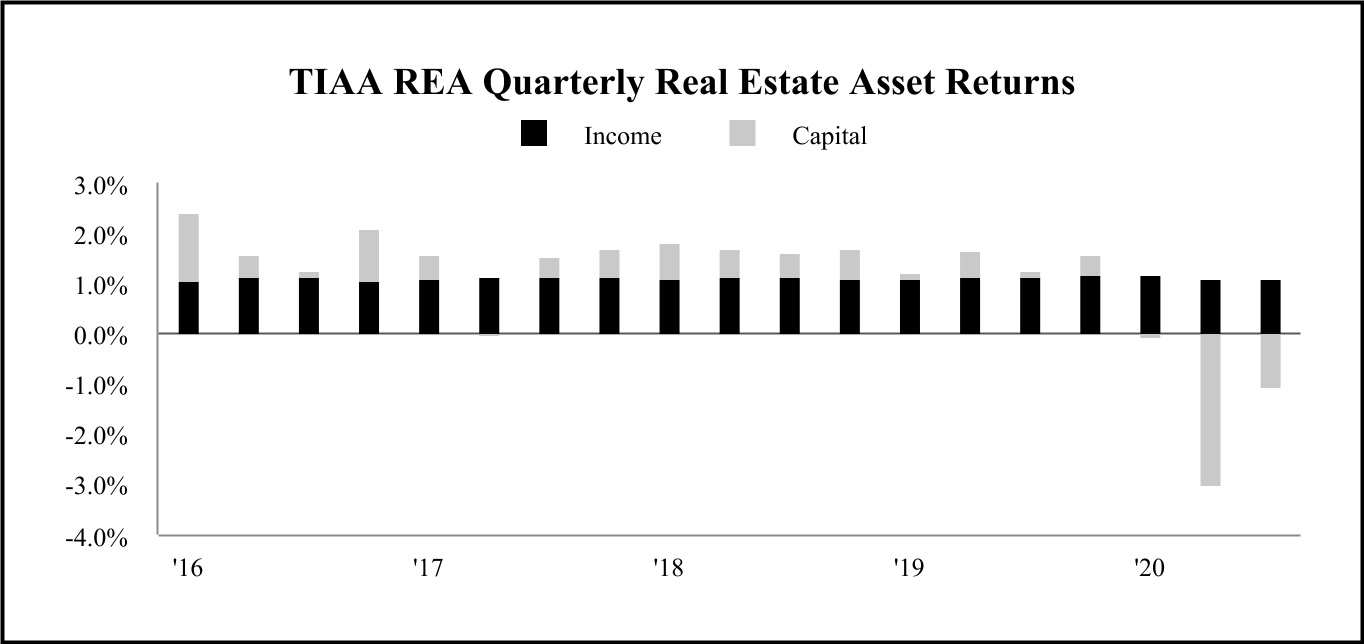
During the second and third quarters of 2020, the Account received approximately 1,050 requests from tenants for rent relief as a result of the COVID-19 pandemic, with an aggregate exposure of $47.8 million of rental income. Relief requests have been almost exclusively rent deferrals, with rent postponed for a brief period (i.e., less than six months) and then repaid over the remaining duration of the lease. Requests are evaluated on a case-by-case basis, with the likelihood of future collection of the deferred balance a key consideration during the evaluation process. As of September 30, 2020, the Account did not have material exposure to tenant defaults or rent concessions. The Account did record modest increases to its allowances for uncollectible rent in the third quarter, on a year-over-year basis. During 2017, property pricing has been essentially flat as modest increasesmost notably among properties within the retail sector. Refer to the Account's Results of Operations for additional commentary in cap rates have largely offset income growth.regards to these increases.
For the quarter ending September 30, 2017, the NCREIF Fund Index Open-End Diversified Core Equity (“NFI-ODCE”) Equal Weight total return, net of fees was 1.68%. The NFI-ODCE is a leveraged fund-level return index which includes property investments at ownership share, cash balances, and other investments. The Account's real estate assets generated a 1.51% total return during the third quarter of 2017. Total returns were positive for the 30th consecutive quarter, but at this stage in the cycle, income is the primary driver of returns.
Occupancy in the Account’s properties averaged 91.1% leased during the third quarter of 2017 as compared with 91.4% during second quarter.
Data for the Account’s top five markets in terms of market value as of September 30, 20172020 are provided below. TheseThe five markets presented below represent nearly half43.1% of the Account’s total real estate portfolio. Across all markets, the Account’s properties are 90.5% leased.
| | | | | | | | | | | | | | |
Top 5 Metro Areas by Fair Market Value(1) | Account % Leased Fair Value Weighted(2) | Number of Property Investments | Metro Area Fair Value as a % of Total RE Portfolio(3) | Metro Area Fair Value as a % of Total Investments |
| Washington-Arlington-Alexandria, DC-VA-MD-WV | 82.7% | 17 | 11.1% | 9.7% |
| Los Angeles-Long Beach-Anaheim, CA | 94.1% | 16 | 10.2% | 8.9% |
| Boston-Cambridge-Newton, MA-NH | 89.0% | 8 | 7.6% | 6.6% |
| New York-Newark-Jersey City, NY-NJ-PA | 78.1% | 12 | 7.6% | 6.6% |
| San Francisco-Oakland-Hayward, CA | 91.2% | 10 | 6.6% | 5.8% |
|
| | | | |
| Top 5 Metro Areas by Fair Market Value | Account % Leased Fair Value Weighted* | Number of Property Investments | Metro Area Fair Value as a % of Total RE Portfolio** | Metro Area Fair Value as a % of Total Investments |
| New York-Jersey City-White Plains, NY-NJ | 93.3% | 16 | 13.1% | 10.3% |
| Washington-Arlington-Alexandria, DC-VA-MD-WV | 86.4% | 13 | 11.4% | 9.0% |
| Los Angeles-Long Beach-Glendale, CA | 86.5% | 12 | 8.9% | 7.0% |
| Boston, MA | 91.6% | 5 | 7.1% | 5.5% |
| Seattle-Bellevue-Everett, WA | 91.8% | 6 | 5.8% | 4.6% |
| |
* | Weighted by fair value, which differs from the calculations provided for market comparisons to CBRE-EA data and are used here to reflect the fair value of the Account’s monetary investments in those markets. |
| |
** | Wholly-owned properties are represented at fair value and gross of any debt, while joint venture properties are represented at the net equity value. |
(2)Weighted by fair value, which differs from the calculations provided for market comparisons to CBRE-EA data and are used here to reflect the fair value of the Account’s monetary investments in those markets.
(3)Wholly-owned properties are represented at fair value and gross of any debt, while joint venture properties are represented at the net equity value.
Office
Finance and professional & business services have been the traditional driversThe impact of the demandCOVID-19 pandemic remains an open question on the future of the office sector. While many states have opened sufficiently to allow employees back into physical offices, many companies are moving cautiously in returning employees to the office. Companies are continuing to invest in telecommuting options as a result of the pandemic, and the investments made in infrastructure to facilitate remote work (e.g., new hardware, additional data storage) will persist after the pandemic subsides. Companies may require less space due to a reduced on-site employee presence, but companies may also require additional space to better facilitate open-office concepts that incorporate distancing between employees. Lessors that are positioned to provide flexible options to lessees will be best suited to navigate the post-pandemic leasing environment. Moreover, additional capital investment from lessors may be necessary to reposition office spaces to suit the changing needs of companies.
As of September 30, 2020, the Account's rents from office tenants were not materially affected, but the duration of the COVID-19 pandemic remains unknown. Tenants requesting rent relief have generally requested rent deferrals for a limited period of time (i.e., less than six months), with the unpaid rent to be paid over the duration of the remaining lease. If the severity of the COVID-19 pandemic persists throughout 2020 and into 2021, the likelihood that tenants may request additional rent deferrals, rent concessions or default increases. Additionally, if tenants vacate due to lease expirations, redeployment of the vacated space may be challenging in the near term due to unfavorable leasing conditions.
Vacancy nationwide increased from 13.0% in the second quarter of 2020 to 14.0% in the third quarter, as reported by CBRE-EA. New construction effectively stalled with the arrival of the COVID-19 pandemic, but the completion of construction already underway has continued to deliver new supply into a weak leasing environment. The new supply was the main driver behind the national vacancy increase. The vacancy rate of the Account’s office space. The financial services sector added 29,000 jobs duringportfolio increased to 14.1% in the third quarter of 20172020, as compared to 41,000 during the second quarter. The professional and business services sector, which includes many facets of technology-related employment, added 99,000 jobs as compared to 140,000 previously. Although job growth in both sectors moderated compared to second quarter, labor market conditions were strong enough to support a decline12.8% in the national office vacancy rate to 12.9%, as reportedprior quarter, driven primarily by CB Richard Ellis Econometric Advisors (“CBRE-EA”). Several high-tech markets including San Francisco, Seattle, Austin, Nashville, Raleigh, and New York maintained single-digit vacancy rates.
Market vacancy rates as reported by CBRE-EA decreased or remained steady in all five of the Account’s top office markets during the third quarter of 2017. The vacancy rate for the Account’s office portfolio, however, increased to average 15.1% during the third quarter, from 14.8%scheduled lease expirations, most notably in the second quarter. The loss of a public sector tenant in one of the Account’s properties in Washington, DC contributed to the rise in vacancy in thatBoston metro area. The above-average vacancy rate in the Account’s New York propertiesmetro area is reflective of repositioning activity atdriven by two properties whichcurrently undergoing redevelopment to increase the long term value of the properties. The vacancy rate in the New York metro will likely keep the vacancy rateremain elevated over the near term. A new lease was recently signed at oneterm as legacy tenants fully vacate the properties and redevelopment efforts continue.
| | | | | | | | | | | | | | | | | | | | | | | | | | | | | | | | | | | | | | |
| | | | | | Account Square
Foot Weighted
Average Vacancy | | Market Vacancy(2) |
Top 5 Office Metropolitan Areas(1) | | Total Sector
by Metro Area
($M) | | % of Total
Investments | | Q3 2020 | | Q2 2020 | | Q3 2020 | | Q2 2020 |
| Account / Nation | | | | | | 14.1 | % | | 12.8 | % | | 14.0 | % | | 13.0 | % |
| Washington-Arlington-Alexandria, DC-VA-MD-WV | | $ | 1,491.3 | | | 5.7 | % | | 12.4 | % | | 12.8 | % | | 15.8 | % | | 15.2 | % |
| Boston-Cambridge-Newton, MA-NH | | 1,490.5 | | | 5.7 | % | | 12.7 | % | | 10.8 | % | | 10.4 | % | | 9.6 | % |
| New York-Newark-Jersey City, NY-NJ-PA | | 1,126.3 | | | 4.3 | % | | 36.3 | % | | 32.4 | % | | 10.6 | % | | 9.2 | % |
| San Francisco-Oakland-Hayward, CA | | 1,033.2 | | | 4.0 | % | | 4.3 | % | | 2.4 | % | | 10.1 | % | | 8.0 | % |
| Los Angeles-Long Beach-Anaheim, CA | | 821.6 | | | 3.2 | % | | 4.7 | % | | 4.7 | % | | 14.3 | % | | 12.9 | % |
(1)The table above has been standardized to depict metropolitan statistical area ("MSA") definitions. Prior iterations of this table presented metropolitan divisions, which represent a subset of the Account’s large assets in Los Angeles, which should bring the vacancy rate down in subsequent quarters.larger MSA.
|
| | | | | | | | | | | | | | | | | | | |
| | | | | | | Account Square
Foot Weighted
Average Vacancy | | Market
Vacancy* |
| Top 5 Office Metropolitan Areas | | Total Sector
by Metro Area
($M) | | % of Total
Investments | | 2017 Q3 | | 2017 Q2 | | 2017 Q3 | | 2017 Q2 |
| Account / Nation | | | | | | 15.1 | % | | 14.8 | % | | 12.9 | % | | 13.0 | % |
| Washington-Arlington-Alexandria, DC-VA-MD-WV | | $ | 1,475.0 |
| | 5.4 | % | | 16.5 | % | | 13.7 | % | | 15.4 | % | | 15.6 | % |
| Boston, MA | | 1,467.0 |
| | 5.4 | % | | 10.9 | % | | 11.3 | % | | 9.8 | % | | 9.8 | % |
| San Francisco-Redwood City-South San Francisco, CA | | 1,132.6 |
| | 4.2 | % | | 8.3 | % | | 6.6 | % | | 7.1 | % | | 7.4 | % |
| New York-Jersey City-White Plains, NY-NJ | | 1,125.2 |
| | 4.1 | % | | 22.5 | % | | 20.0 | % | | 9.4 | % | | 9.5 | % |
| Los Angeles-Long Beach-Glendale, CA | | 742.2 |
| | 2.7 | % | | 27.0 | % | | 27.6 | % | | 13.6 | % | | 13.7 | % |
(2)Source: CBRE-EA. Market vacancy is defined as the percentage of space vacant. The Account’s vacancy is defined as the square foot-weighted percentage of unleased space.
Industrial
Industrial market conditions are influenced by GDP growth and consumer spending. Growing e-commerce sales in particular have boosted warehouse demand. During the third quarter, CBRE-EA reported that the national industrial availability rate decreased to 7.7% after ending the second quarter at 7.8%. With supply beginning to increase, industrial market conditions may fluctuate between modest improvements and a general flattening in availability at this point in the cycle.
The average availability rate of the Account’s industrial properties increased to 9.7% in the third quarter of 2017 from 8.2% during the second quarter. Availability rates in three of the Account’s top five industrial markets were near or well below their respective market averages. Several tenants vacated space in one of the Account’s Los Angeles properties, causing the average vacancy to rise in that area. One tenant downsized a significant amount of space in one of the Account’s Tacoma properties, contributing to the vacancy rise there, but a new tenant has since signed a lease to backfill the vacant space.
|
| | | | | | | | | | | | | | | | | | | |
| | | | | | | Account Square
Foot Weighted
Average Vacancy | | Market
Vacancy* |
| Top 5 Industrial Metropolitan Areas | | Total Sector
by Metro Area
($M) | | % of Total
Investments | | 2017 Q3 | | 2017 Q2 | | 2017 Q3 | | 2017 Q2 |
| Account / Nation | | | | | | 9.7 | % | | 8.2 | % | | 7.7 | % | | 7.8 | % |
| Riverside-San Bernardino-Ontario, CA | | $ | 772.2 |
| | 2.8 | % | | 0.0 | % | | 0.0 | % | | 6.2 | % | | 6.4 | % |
| Los Angeles-Long Beach-Glendale, CA | | 320.1 |
| | 1.2 | % | | 9.0 | % | | 5.1 | % | | 4.2 | % | | 3.9 | % |
| New York-Jersey City-White Plains, NY-NJ | | 307.2 |
| | 1.1 | % | | 2.4 | % | | 3.2 | % | | 7.2 | % | | 7.0 | % |
| Tacoma-Lakewood, WA | | 295.2 |
| | 1.1 | % | | 7.3 | % | | 4.1 | % | | 4.7 | % | | 4.7 | % |
| Dallas-Plano-Irving, TX | | 263.9 |
| | 1.0 | % | | 4.7 | % | | 6.1 | % | | 8.0 | % | | 8.1 | % |
Market availability is the percentage of space available for rent. Account vacancy is the square foot-weighted percentage of unleased space.
Note—CBRE-EA considers Tacoma partIndustrial
The industrial sector continues to demonstrate resiliency through the COVID-19 pandemic. The pandemic has accelerated consumers' long-term shift to e-commerce, and this shift has allowed demand for industrial space to remain stable. When compared against the other three core real estate sectors, the industrial sector is best positioned to weather the economic uncertainty caused by the COVID-19 pandemic. Investors continue to view the sector favorably, as reflected in the outsized weighting of industrial assets in sales transactions closed in 2020.
As of September 30, 2020, the Account's rents from industrial tenants were not materially affected, but the duration of the SeattleCOVID-19 pandemic remains unknown. Tenants requesting rent relief have generally requested rent deferrals for a limited period of time (i.e., less than six months), with the unpaid rent to be paid over the duration of the remaining lease. If the severity of the COVID-19 pandemic persists throughout 2020 and into 2021, the likelihood that tenants may request additional rent deferrals, rent concessions or default increases. Additionally, if tenants vacate due to lease expirations, redeployment of the vacated space may be challenging in the near term due to unfavorable leasing conditions, though demand for industrial market.space has been relatively steady throughout the pandemic.
The national industrial availability rate of 7.6% in the third quarter of 2020 was steady with the prior quarter as reported by CBRE-EA.Vacancies are highest in geographic locations with significant exposure to oil and gas (e.g,. Houston, Dallas). The average vacancy rate of the Account’s industrial properties increased to 9.1% in the third quarter of 2020 from 6.5% in the previous quarter, primarily driven by a scheduled lease expiration at a property in the Riverside-San Bernardino-Ontario metro area. The property is well positioned in the local market, and management expects to redeploy the space relatively quickly due to healthy demand.
| | | | | | | | | | | | | | | | | | | | | | | | | | | | | | | | | | | | | | |
| | | | | | Account Square
Foot Weighted
Average Vacancy | | Market Vacancy(2) |
Top 5 Industrial Metropolitan Areas(1) | | Total Sector
by Metro Area
($M) | | % of Total
Investments | | Q3 2020 | | Q2 2020 | | Q3 2020 | | Q2 2020 |
| Account / Nation | | | | | | 9.1 | % | | 6.5 | % | | 7.6 | % | | 7.6 | % |
| Riverside-San Bernardino-Ontario, CA | | $ | 1,011.1 | | | 3.9 | % | | 13.8 | % | | 0.0 | % | | 5.8 | % | | 6.0 | % |
| Seattle-Tacoma-Bellevue, WA | | 412.3 | | | 1.6 | % | | 2.9 | % | | 3.3 | % | | 6.0 | % | | 5.5 | % |
| Los Angeles-Long Beach-Anaheim, CA | | 384.6 | | | 1.5 | % | | 5.7 | % | | 5.9 | % | | 5.3 | % | | 5.5 | % |
| Dallas-Fort Worth-Arlington, TX | | 350.3 | | | 1.3 | % | | 4.9 | % | | 7.9 | % | | 8.0 | % | | 8.6 | % |
| Miami-Fort Lauderdale-West Palm Beach, FL | | 275.7 | | | 1.1 | % | | — | % | | 0.6 | % | | 8.0 | % | | 7.7 | % |
(1)The table above has been standardized to depict MSA definitions. Prior iterations of this table presented metropolitan divisions, which represent a subset of the larger MSA.
(2)Source: CBRE-EA. Market vacancy rates reflectis the Seattle-Tacoma total.percentage of space available for rent. Account vacancy is the square foot-weighted percentage of unleased space.
Multi-Family
Apartment demand is generated fromdriven by a combination of economic and demographic forces including job growth, household formations, and changes in the U.S. homeownership rate. The recovery of the U.S. unemployment rate (from 11.1% at the end of the second quarter to 7.9% at the end of the third quarter) is an encouraging development for the ongoing health of the sector, especially as stimulus programs from the federal government expire. The emergency increase of $600 per week to those collecting unemployment benefits expired in late July. An executive order was issued shortly thereafter, providing a $300 federal supplement to unemployment benefits, but funding for the order was limited and has been substantially exhausted. Additional stimulus efforts by the U.S. Congress, if any, are unlikely to occur until after the completion of the presidential election in November.
As of September 30, 2020, the Account's rents from multifamily tenants were not materially affected, but the duration of the COVID-19 pandemic remains unknown. If the severity of the COVID-19 pandemic persists throughout 2020 and into 2021, the likelihood that tenants may request rent deferrals, rent concessions or default increases. Additionally, if tenants vacate due to lease expirations, redeployment of the vacated space may be challenging in the near term due to unfavorable leasing conditions. Rent concessions for new tenants have moderately increased in recent months, most notably among luxury apartments in densely populated metro areas, as the pandemic has cooled demand for these units.
The national apartment vacancy rate increaseddeclined from 4.7% in the second quarter of 2020 to 4.6% during4.3% in the third quarter, of 2017 as compared to 4.5% during third quarter 2016. CBRE-EA is expecting market conditions to continue to softenreported by RealPage. The COVID-19 pandemic has impacted the sector unevenly, with apartments in low density areas seeing demand increase or hold steady, but apartments in higher density areas seeing more tempered demand. Student housing properties are likewise challenged by the pandemic, as new supply is delivered tomany universities utilize remote learning options for the market. Over the next year, the supply pipeline is expected to peak and market conditions should begin to stabilize.
2020-2021 school year. The vacancy rate of the Account’s multi-familyapartment properties fellincreased to 6.4% during8.5% in the third quarter of 2020 as compared to 7.0%7.9% in the secondprior quarter. As shownModest increases in vacancies in the followingWashington and Los Angeles metro areas are attributed to normal lease expirations paired with a competitive leasing environment to redeploy the vacant units.
| | | | | | | | | | | | | | | | | | | | | | | | | | | | | | | | | | | | | | |
| | | | | | Account Units Weighted
Average Vacancy | | Market Vacancy(2) |
Top 5 Apartment Metropolitan Areas(1) | | Total Sector
by Metro Area
($M) | | % of Total
Investments | | Q3 2020 | | Q2 2020 | | Q3 2020 | | Q2 2020 |
| Account / Nation | | | | | | 8.5 | % | | 7.9 | % | | 4.3 | % | | 4.7 | % |
| Washington-Arlington-Alexandria, DC-VA-MD-WV | | $ | 742.0 | | | 2.9 | % | | 7.6 | % | | 6.6 | % | | 4.7 | % | | 4.3 | % |
| Los Angeles-Long Beach-Anaheim, CA | | 686.1 | | | 2.6 | % | | 8.9 | % | | 7.6 | % | | 4.5 | % | | 4.7 | % |
| Miami-Fort Lauderdale-West Palm Beach, FL | | 562.1 | | | 2.2 | % | | 8.3 | % | | 10.8 | % | | 5.0 | % | | 5.0 | % |
| Denver-Aurora-Lakewood, CO | | 413.7 | | | 1.6 | % | | 7.1 | % | | 7.2 | % | | 4.7 | % | | 5.4 | % |
| New York-Newark-Jersey City, NY-NJ-PA | | 348.9 | | | 1.3 | % | | 1.3 | % | | 1.3 | % | | 3.0 | % | | 2.5 | % |
(1)The table average vacancy rates in the Account’s top five apartment markets are at or above their comparable market averages. Strong leasing activity at onehas been standardized to depict MSA definitions. Prior iterations of this table presented metropolitan divisions, which represent a subset of the Account’s properties in New York improved vacancy to market average. The delivery and lease-up of several new projects in the local sub-market impacted vacancy in the Account’s properties in Denver. The Account’s properties in Fort Lauderdale benefited from increased leasing activity during the end of the summer while the overall market experienced significant deliveries.larger MSA.
|
| | | | | | | | | | | | | | | | | | | |
| | | | | | | Account Units
Foot Weighted
Average Vacancy | | Market
Vacancy* |
| Top 5 Apartment Metropolitan Areas | | Total Sector
by Metro Area
($M) | | % of Total
Investments | | 2017 Q3 | | 2017 Q2 | | 2017 Q3 | | 2017 Q2 |
| Account / Nation | | | | | | 6.4 | % | | 7.0 | % | | 4.6 | % | | 4.6 | % |
| New York-Jersey City-White Plains, NY-NJ | | $ | 863.1 |
| | 3.2 | % | | 3.1 | % | | 4.8 | % | | 3.1 | % | | 3.2 | % |
| Washington-Arlington-Alexandria, DC-VA-MD-WV | | 803.2 |
| | 3.0 | % | | 8.2 | % | | 8.6 | % | | 4.7 | % | | 4.5 | % |
| Los Angeles-Long Beach-Glendale, CA | | 558.9 |
| | 2.1 | % | | 6.2 | % | | 5.9 | % | | 4.0 | % | | 3.9 | % |
| Denver-Aurora-Lakewood, CO | | 327.9 |
| | 1.2 | % | | 7.7 | % | | 5.3 | % | | 4.9 | % | | 5.2 | % |
| Fort Lauderdale-Pompano Beach-Deerfield Beach, FL | | 295.9 |
| | 1.1 | % | | 8.3 | % | | 12.3 | % | | 6.0 | % | | 5.6 | % |
(2)Source: RealPage. Market vacancy is the percentage of units vacant. The Account’s vacancy is the percentage of unleased units.
Retail
Preliminary dataWhile all core real estate sectors have been negatively impacted by the COVID-19 pandemic to some degree, the impact to the retail sector has been especially pronounced. Retailers have attempted to find alternative ways to deliver products to customers through e-commerce solutions, but retail is still highly dependent on customer traffic in stores to generate revenue. Most states have reopened sufficiently to allow for customer traffic to return, but some consumers remain hesitant to venture into enclosed spaces, and most states still maintain strict occupancy limits. Traditional retail was facing ongoing challenges from e-commerce platforms long before the U.S. Census Bureau indicate thatCOVID-19 pandemic, and the pandemic has accelerated the shift in consumers' preferences from brick-and-mortar retail sales excluding motor vehicles and parts increased 1.0% from second to digital storefronts. The third quarter saw a number of retailers announce bankruptcy, as declines in revenue have not been commensurate with declines in expenses. Additional bankruptcies are a continued risk as the COVID-19 pandemic persists, especially among retailers with unsustainable debt obligations.
As of September 30, 2020, the Account's rents from retail tenants were not materially affected, but the duration of the COVID-19 pandemic remains unknown. Requests for rent relief were more common among retail tenants than other sectors. Tenants requesting rent relief have generally requested rent deferrals for a limited period of time (i.e., less than six months), with the unpaid rent to be paid over the duration of the remaining lease. If the severity of the COVID-19 pandemic persists throughout 2020 and 4.1% on a year-over-year basisinto 2021, the likelihood that tenants may request additional rent deferrals, rent concessions or default increases. Additionally, if tenants vacate due to lease expirations, redeployment of the vacated space may be challenging in the third quarter. Retail market conditionsnear term due to unfavorable leasing conditions. Collections of rent from retail tenants not in deferral have been challenged by rising onlinenotably improved since the second quarter of 2020, but near-term economic prospects for retailers remain especially challenging. The Account is closely monitoring the collectability of accrued rental income and adjusting its allowances for uncollectible rent as needed.
The Account's retail sales, bankruptciesportfolio is composed primarily of high-end lifestyle shopping centers and store closings, but national availability rates have generally held steadyregional malls in large metropolitan or modestly declined since 2011. However, CBRE-EA data indicates that the nationaltourist centers. The retail availability rateportfolio is managed to minimize significant exposure to any single retailer. The Account has over 1,100 retailers across its portfolio, with its largest retail exposure comprising less than 3.5% of total retail rentable area. The Account’s retail vacancy increased to 10.2%6.9% in the third quarter of 2020 from 10.1%6.5% in the second quarter. CBRE-EA notedprior quarter driven by scheduled lease expirations.
| | | | | | | | | | | | | | | | | | | | | | | | | | | | | | | | | | | | | | |
| | | | | | Account Units Weighted
Average Vacancy | | Market
Vacancy(1) |
| | Total Exposure
($M) | | % of Total Investments | | Q3 2020 | | Q2 2020 | | Q3 2020 | | Q2 2020 |
| All Retail | | | | | | 6.9 | % | | 6.5 | % | | 9.4 | % | | 9.0 | % |
| Lifestyle & Mall | | $ | 2,154.5 | | | 8.3 | % | | 7.1 | % | | 6.5 | % | | 6.5 | % | | 5.8 | % |
| Neighborhood, Community & Strip | | 1,479.7 | | | 5.7 | % | | 6.7 | % | | 6.7 | % | | 9.4 | % | | 9.0 | % |
Power Center(2) | | 613.8 | | | 2.4 | % | | 6.5 | % | | 5.3 | % | | 7.3 | % | | 7.1 | % |
(1)Source: CBRE-EA. Market vacancy is defined as the percentage of space available for rent. The Account’s vacancy is the square foot-weighted percentage of unleased space.
(2)The Power Center designation is reserved for properties with three or more anchor units. Anchor units are leased to large retailers such as department stores, home improvement stores and warehouse clubs. Properties with the Neighborhood, Community and Strip designation consist of two or less anchor units.
Hotel
The impact of the COVID-19 pandemic on the hospitality sector has been especially severe among hotels that an
increasing trend couldcater primarily to business travelers. Business travel has been curtailed significantly, with travel limited primarily to those who must travel for essential reasons. Business travel is likely to continue to be significantly depressed in the coming quarters.months, with businesses shifting to virtual meetings and conferences. Leisure travel has partially recovered domestically, benefiting from the inability of American travelers to travel overseas. All hotel operators are faced with rising costs from measures taken to mitigate the spread of the Account’s retail investments have vacancy rates below 10.0%, which is reflectivevirus, and few operators are experiencing increases in revenue to offset those costs. The duration and severity of the overall high qualityCOVID-19 pandemic remains unknown, and its significant impact on travel increases the likelihood that hotel revenues and occupancy rates will continue to be challenged over the near term.
The Account's exposure to the hospitality sector is limited to one hotel in the Dallas metro area. The hotel is located in a business park in the Dallas metro area and caters largely to business travelers. Key metrics to track hotel performance include occupancy, the average daily rate ("ADR") and revenue per available room ("RevPAR"). For the quarter ended September 30, 2020, occupancy of the retail portfolio.property increased to 24.8% as compared to 8.1% in the previous quarter. ADR and RevPAR were $115.86 and $28.70, respectively, for the third quarter of 2020, as compared to $105.86 and $8.62, respectively, in the prior quarter.
Outlook
The real estate cycle is indeed mature; moderation of returns has occurred and is to be expected. Cycles do not end simply because of longevity, however. Imbalances in one or more segments of the economy are typically the cause, and none are currently evident. Property market conditions have generally remained stable. Regional conditions have varied depending on their economic drivers, but U.S. real estate markets on the whole are largely well-balanced.
Economists expect GDP growth of 2.2% in 2017 and 2.4% in 2018. Job growth is expected to moderate, but remain strong enough to bring the unemployment rate down further. Interest rates are expected to rise at a gradual pace throughout the rest of 2017 and 2018. The biggest risk to the US economy is exogenous. The geopolitical landscape has increased uncertainty. Expected cuts in U.S. personal and corporate tax rates appear increasingly unlikely to occur in 2017. Nonetheless, if domestic economic conditions approximate economist expectations, real estate market conditions should remain healthy into 2018.
INVESTMENTS
As of September 30, 2017,2020, the Account hadheld 87.4% of its total net assets of $24.8 billion, a 2.2% increase from December 31, 2016. The increaseinvestments in the Account’s net assets was primarily driven by net investment income and appreciation in value of the Account’s investments.
As of September 30, 2017, the Account owned a total of 134 real estate investments (109 of which were wholly-owned, 25 of which were held in joint ventures). Theand real estate portfolio included 38 officejoint ventures. The Account also held investments (including 12 held in joint ventures), 34 industrialloans receivable, including those with related parties, representing 6.0% of total investments, (including one held in a joint venture), 39 apartmentU.S. Treasury securities representing 2.7% of total investments, (including one held in a joint venture), 21 retailreal estate-related equity securities representing 2.5%of total investments (including ten held in joint ventures), one 75% owned joint venture interest in a portfolio of storage facilities, and one leasehold interest encumbered by a ground lease. Of the real estate investments, 33 are subject to debt (including 13 joint venture investments).funds representing 1.4% of total investments.
The outstanding principal on mortgage loans payable on the Account’s wholly-owned real estate portfolio as of September 30, 20172020 was $2.3$2.5 billion. The Account’s proportionate share of outstanding principal on mortgage loans payable within its joint venture investments was $2.2$2.9 billion, which is netted against the underlying properties when determining the joint venture investment’s fair value presented on the consolidated schedulesConsolidated Schedules of investments. When the mortgage loans payable within the joint venture investments are considered, totalInvestments. Total outstanding principal on the Account’s portfolio as of September 30, 20172020, inclusive of loans payable within the joint venture investments and $0.1 billion of loans outstanding on Line of Credit I, was $4.5$5.5 billion, which represented a loan to valueloan-to-value ratio of 15.2%18.7%. The Account has no Account-level debt.
At September 30, 2017, the Account held 78.5% of its total investments in real estate and real estate joint ventures. The Account also held investments in government agency notes representing 12.1% of total investments, real estate-related equity securities representing 4.1% of total investments, U.S. Treasury securities representing 3.7% of total investments, loans receivable representing 1.1% of total investments, and real estate limited partnerships representing 0.5% of total investments.
Management believes that the Account’s real estate portfolio is diversified by location and property type. The Account’s largest investment, Fashion Show located in Las Vegas, NV, represented 3.9% of total real estate investments and 3.1% of total investments. As discussed in the Account’s prospectus, the Account does not intend to buy and sell its real estate investments simply to make short-term profits. Rather, the Account’s general strategy in selling real estate investments is to dispose of those assets that management believes (i) have maximized in value, (ii) have underperformed or face deteriorating property-specific or market conditions, (iii) need significant capital infusions in the future, (iv) are appropriate to dispose of in order to remain consistent with the Account’s intent to diversify the Account by property type and geographic location (including reallocating the Account’s exposure to or away from certain property types in certain geographic locations), or (v) otherwise do
not satisfy the investment objectives of the Account. Management, from time to time, will evaluate the need to manage liquidity in the Account as part of its analysis as to whether to undertake a particular asset sale. The Account couldmay reinvest any sale proceeds that it does not need to pay operating expenses or to meet debt service or redemption requests (e.g.(e.g., participant withdrawals or benefit payments).
The following table lists the Account's ten largest investments as of September 30, 2017.2020. For information regarding the Account's diversification of real estate assets by region and property type, see Note 3—Credit Risk Concentrations.Concentrations of Risk.
| | | | | | | | | | | | | | | | | | | | | | | | | | | | | | | | | | | | | | | | | | | | | | | | | | | | | | | | |
| Ten Largest Real Estate Investments |
| Property Investment Name | | Ownership Percentage | | City | | State | | Type | | Gross Real Estate Fair Value(1) | | Debt Fair Value(2) | | Net Real Estate Fair Value(3) | | Property as a
% of Total
Real Estate
Portfolio(4) | | Property as a
% of Total
Investments(5) |
| Fashion Show | | 50% | | Las Vegas | | NV | | Retail | | $ | 982.6 | | | $ | 426.7 | | | $ | 555.9 | | | 3.9% | | 3.4% |
| The Florida Mall | | 50% | | Orlando | | FL | | Retail | | 811.6 | | | 154.4 | | | 657.2 | | | 3.2% | | 2.8% |
| Simpson Housing Portfolio | | 80% | | Various | | U.S.A. | | Apartment | | 803.0 | | | 383.4 | | | 419.6 | | | 3.1% | | 2.8% |
| 1001 Pennsylvania Avenue | | 100% | | Washington | | D.C. | | Office | | 798.4 | | | 319.7 | | | 478.7 | | | 3.1% | | 2.8% |
| Colorado Center | | 50% | | Santa Monica | | CA | | Office | | 618.0 | | | 279.7 | | | 338.3 | | | 2.4% | | 2.1% |
| 99 High Street | | 100% | | Boston | | MA | | Office | | 545.2 | | | 288.0 | | | 257.2 | | | 2.1% | | 1.9% |
| Ontario Industrial Portfolio | | 100% | | Ontario | | CA | | Industrial | | 518.7 | | | — | | | 518.7 | | | 2.0% | | 1.8% |
| Lincoln Centre | | 100% | | Dallas | | TX | | Office | | 434.2 | | | — | | | 434.2 | | | 1.7% | | 1.5% |
| 701 Brickell Avenue | | 100% | | Miami | | FL | | Office | | 422.6 | | | 182.9 | | | 239.7 | | | 1.7% | | 1.5% |
| Four Oaks Place | | 51% | | Houston | | TX | | Office | | 421.5 | | | 85.4 | | | 336.1 | | | 1.7% | | 1.5% |
(1)The Account's share of the fair value of the property investment, gross of debt.
(2)Debt fair values are presented at the Account's ownership interest.
(3)The Account's share of the fair value of the property investment, net of debt.
(4)Total real estate portfolio is the aggregate fair value of the Account's wholly-owned properties and the properties held within a joint venture, gross of debt.
(5)Total investments are the aggregate fair value of all investments held by the Account, gross of debt. Total investments, as calculated within this table, will vary from total investments, as calculated in the Account's Consolidated Schedule of Investments, as joint venture investments are presented in the Consolidated Schedules of Investments at their net equity position in accordance with previously defined GAAP.
|
| | | | | | | | | | | | | | | | | | |
| Ten Largest Real Estate Investments |
| Property Investment Name | | City | | State | | Type | | Fair Value
(in millions)(1) | | Property as a
% of Total
Real Estate
Portfolio | | Property as a
% of Total
Investments |
| Fashion Show | | Las Vegas | | NV | | Retail | | $ | 837.9 |
| | (2) | | 3.9 | % | | 3.1 | % |
| 1001 Pennsylvania Avenue | | Washington | | DC | | Office | | 810.0 |
| | (3) | | 3.8 | % | | 3.0 | % |
| The Florida Mall | | Orlando | | FL | | Retail | | 754.8 |
| | (4) | | 3.5 | % | | 2.8 | % |
| DDR | | Various | | USA | | Retail | | 615.8 |
| | (5) | | 2.9 | % | | 2.3 | % |
| Fourth and Madison | | Seattle | | WA | | Office | | 527.0 |
| | (6) | | 2.5 | % | | 1.9 | % |
| 501 Boylston Street | | Boston | | MA | | Office | | 506.3 |
| | (7) | | 2.4 | % | | 1.9 | % |
| 99 High Street | | Boston | | MA | | Office | | 504.0 |
| |
| | 2.4 | % | | 1.9 | % |
| 425 Park Avenue | | New York | | NY | | Ground Lease | | 454.0 |
| | | | 2.1 | % | | 1.7 | % |
| 780 Third Avenue | | New York | | NY | | Office | | 429.0 |
| | (8) | | 2.0 | % | | 1.6 | % |
| Ontario Industrial Portfolio | | Ontario | | CA | | Industrial | | 397.4 |
| |
| | 1.9 | % | | 1.5 | % |
| |
(1)
| Fair Value as reported in the September 30, 2017 Consolidated Schedules of Investments. Investments owned 100% by the Account are reported based on fair value. Investments in joint ventures are reported at net equity value on a fair value basis, and are presented at the Account's ownership interest. |
| |
(2)
| Fashion Show is held in a joint venture with General Growth Properties, in which the Account holds 50% interest, and is presented net of debt. As of September 30, 2017, this debt had a fair value of $431.5 million. |
| |
(3)
| 1001 Pennsylvania Avenue is presented gross of debt. The value of the Account's interest less the fair value of leverage is $475.4 million. |
| |
(4)
| The Florida Mall is held in a joint venture with Simon Property Group, L.P., in which the Account hold a 50% interest, and is presented net of debt. As of September 30, 2017, this debt had a fair value of $175.6 million. |
| |
(5)
| DDR Joint Venture, in which the Account holds an 85% interest, consists of 24 retail properties located in 11 states and is presented net of debt. As of September 30, 2017, this debt had a fair value of $606.5 million. |
| |
(6)
| Fourth and Madison is presented gross of debt. The value of the Account's interest less the fair value of leverage is $324.8 million. |
| |
(7)
| 501 Boylston Street is presented gross of debt. The value of the Account's interest less the fair value of leverage is $292.5 million. |
| |
(8)
| 780 Third Avenue is presented gross of debt. The value of the Account's interest less the fair value of leverage is $258.4 million. |
Results of Operations
Three months ended September 30, 2020 compared to three months ended September 30, 2019
Net Investment Income
The following table shows the results of operations for the three months ended September 30, 2020 and 2019 and the dollar and percentage changes for those periods (dollars in millions, unaudited).
| | | | | | | | | | | | | | | | | | | | | | | | | | |
| | | For the Three Months Ended September 30, | | Change |
| 2020 | | 2019 | | $ | | % |
| INVESTMENT INCOME | | | | | | | | |
| Real estate income, net: | | | | | | | | |
| Rental income | | $ | 295.0 | | | $ | 282.6 | | | $ | 12.4 | | | 4.4 | % |
| Real estate property level expenses: | | | | | | | | |
| Operating expenses | | 66.5 | | | 64.5 | | | 2.0 | | | 3.1 | % |
| Real estate taxes | | 53.3 | | | 46.9 | | | 6.4 | | | 13.6 | % |
| Interest expense | | 24.1 | | | 27.1 | | | (3.0) | | | (11.1) | % |
| Total real estate property level expenses | | 143.9 | | | 138.5 | | | 5.4 | | | 3.9 | % |
| Real estate income, net | | 151.1 | | | 144.1 | | | 7.0 | | | 4.9 | % |
| Income from real estate joint ventures and funds | | 33.1 | | | 61.4 | | | (28.3) | | | (46.1) | % |
| Interest | | 20.7 | | | 43.5 | | | (22.8) | | | (52.4) | % |
| Dividends | | 6.0 | | | 5.9 | | | 0.1 | | | 1.7 | % |
| TOTAL INVESTMENT INCOME | | 210.9 | | | 254.9 | | | (44.0) | | | (17.3) | % |
| Expenses: | | | | | | | | |
| Investment management charges | | 16.4 | | | 17.3 | | | (0.9) | | | (5.2) | % |
| Administrative charges | | 10.9 | | | 12.1 | | | (1.2) | | | (9.9) | % |
| Distribution charges | | 5.8 | | | 7.5 | | | (1.7) | | | (22.7) | % |
| Mortality and expense risk charges | | 0.3 | | | 0.3 | | | — | | | — | % |
| Liquidity guarantee charges | | 14.3 | | | 15.3 | | | (1.0) | | | (6.5) | % |
| TOTAL EXPENSES | | 47.7 | | | 52.5 | | | (4.8) | | | (9.1) | % |
| INVESTMENT INCOME, NET | | $ | 163.2 | | | $ | 202.4 | | | $ | (39.2) | | | (19.4) | % |
The following table illustrates and compares rental income, operating expenses and real estate taxes for properties held by the Account for the three months ended September 30, 2020 and 2019. The comparative increases or decreases associated with the acquisition and disposition of properties made in either period is compared to "same property" (dollars in millions, unaudited).
| | | | | | | | | | | | | | | | | | | | | | | | | | | | | | | | | | | | | | | | | | | | | | | |
| | | Rental Income | | Operating Expenses | | Real Estate Taxes |
| Change | | | Change | | | Change |
| 2020 | 2019 | $ | % | | 2020 | 2019 | $ | % | | 2020 | 2019 | $ | % |
| Same Property | | $ | 244.3 | | $ | 249.9 | | $ | (5.6) | | (2.2) | % | | $ | 55.7 | | $ | 58.0 | | $ | (2.3) | | (4.0) | % | | $ | 44.6 | | $ | 43.1 | | $ | 1.5 | | 3.5 | % |
| Properties Acquired | | 48.8 | | 6.6 | | 42.2 | | N/M | | 10.9 | | 1.3 | | 9.6 | | N/M | | 8.4 | | 1.1 | | 7.3 | | N/M |
| Properties Sold | | 1.9 | | 26.1 | | (24.2) | | N/M | | (0.1) | | 5.2 | | (5.3) | | N/M | | 0.3 | | 2.7 | | (2.4) | | N/M |
| Impact of Properties Acquired/Sold | | 50.7 | | 32.7 | | 18.0 | | N/M | | 10.8 | | 6.5 | | 4.3 | | N/M | | 8.7 | | 3.8 | | 4.9 | | N/M |
| Total Property Portfolio | | $ | 295.0 | | $ | 282.6 | | $ | 12.4 | | 4.4 | % | | $ | 66.5 | | $ | 64.5 | | $ | 2.0 | | 3.1 | % | | $ | 53.3 | | $ | 46.9 | | $ | 6.4 | | 13.6 | % |
N/M—Not meaningful
Rental Income:
Rental income increased by $12.4 million, or 4.4%, due to net acquisition activity. Income from properties held in both periods declined $5.6 million, or 2.2%, primarily due to increases in allowances for uncollectible rent, most notably among the retail and office portfolios. The rising allowances are a direct consequence of financial pressures caused by the COVID-19 pandemic, as certain tenants are at greater risk of bankruptcy or default. The Account is closely monitoring the collectability of accrued rent and adjusting allowances as needed.
Rent relief requested by lessees in 2020 has generally been in the form of rent deferrals, with payments delayed for a limited period of time and subsequently repaid over the life of the lease. Rental income continues to be accrued during the deferral period so long as future collection of the deferred rent is probable. The Account has not had material exposure to rent concessions or lease defaults for tenants impacted by the COVID-19 pandemic for the three months ended September 30, 2020.
Operating Expenses:
Operating expenses increased $2.0 million, or 3.1%, primarily driven by net acquisition activity. Operating expenses among properties held in both periods were down $2.5 million, attributed to decreases in certain discretionary costs as a result of the COVID-19 pandemic. These declining costs, which include expenses such as marketing and maintenance, were most notable among properties within the office sector.
Real Estate Taxes:
Real estate taxes increased $6.4 million, or 13.6%, due primarily to net acquisition activity.
Interest Expense:
Interest expense decreased $3.0 million, or 11.1%, as a result of a lower average interest rates on outstanding principal balances of loans payable, as compared to the same period in 2019.
Income from Real Estate Joint Ventures and Funds:
Income from real estate joint ventures and funds decreased $28.3 million, or 46.1%, which is primarily attributed to the full acquisition of the DDRTC Core Retail Fund LLC in the first quarter of 2020 (changing the balance sheet classification from joint venture to wholly-owned) paired with an overall decline in income from multiple retail joint ventures.
Interest and Dividend Income:
Interest income decreased $22.8 million due to the reduction of short-term securities held by the Account. Dividend income increased $0.1 million, remaining relatively flat as compared to the same period in 2019.
Expenses:
Investment management, administrative and distribution costs are charged to the Account associated with managing the Account. Investment management charges are comprised primarily of fixed components, but fluctuate based on the size of the Account’s portfolio of investments, whereas administrative and distribution charges are comprised of more variable components that generally correspond with movements in net assets. Both distribution services (pursuant to the Distribution Agreement) and administrative services are provided to the Account by Services and TIAA, as applicable, on an at cost basis. These expenses decreased $3.8 million from the comparable period of 2019, primarily attributed to lower expenses for real estate asset management services and other expense reduction measures undertaken by TIAA.
Mortality and expense risk and liquidity guarantee expenses are contractual charges to the Account from TIAA for TIAA’s assumption of these risks and provision of the liquidity guarantee. The rate for these charges is established annually and are charged at a fixed rate based on the Account’s net assets. Mortality and expense risk expenses remained unchanged between the comparative periods. Liquidity guarantee expenses decreased $1.0 million as a result of the decline in average net assets.
Net Realized and Unrealized Gains and Losses on Investments and Loans Payable
The following table shows the net realized and unrealized gains and losses on investments and loans payable for the three months ended September 30, 2020 and 2019 and the dollar and percentage changes for those periods (dollars in millions, unaudited).
| | | | | | | | | | | | | | | | | | | | | | | | | | |
| | For the Three Months Ended September 30, | | Change |
| 2020 | | 2019 | | $ | | % |
| NET REALIZED AND UNREALIZED GAIN (LOSS) ON INVESTMENTS AND LOANS PAYABLE | | | | | | | | |
| Net realized gain (loss) on investments: | | | | | | | | |
| Real estate properties | | $ | (3.0) | | | $ | 300.0 | | | $ | (303.0) | | | N/M |
| | | | | | | | |
| Marketable securities | | 19.7 | | | 27.5 | | | (7.8) | | | (28.4) | |
| | | | | | | | |
| Total realized gain on investments: | | 16.7 | | | 327.5 | | | (310.8) | | | N/M |
| Net change in unrealized appreciation (depreciation) on: | | | | | | | | |
| Real estate properties | | (89.1) | | | (83.2) | | | (5.9) | | | 7.1 | |
| Real estate joint ventures and funds | | (56.7) | | | (138.0) | | | 81.3 | | | (58.9) | |
| Marketable securities | | 1.5 | | | 37.3 | | | (35.8) | | | (96.0) | |
| Loans receivable | | (9.2) | | | (1.0) | | | (8.2) | | | N/M |
| Loans receivable with related parties | | 0.4 | | | (0.4) | | | 0.8 | | | N/M |
| Loans payable | | (42.4) | | | (32.1) | | | (10.3) | | | 32.1 | % |
| Net change in unrealized depreciation on investments and loans payable | | (195.5) | | | (217.4) | | | 21.9 | | | (10.1) | |
| NET REALIZED AND UNREALIZED (LOSS) GAIN ON INVESTMENTS AND LOANS PAYABLE | | $ | (178.8) | | | $ | 110.1 | | | $ | (288.9) | | | N/M |
N/M—Not meaningful
Real Estate Properties:
Wholly-owned real estate investments experienced net realized and unrealized losses of $92.1 million during the third quarter of 2020, compared to $216.8 million of unrealized gains during the comparable period of 2019. Net losses in the third quarter were driven by uncertainty in the real estate market due to concerns about occupancy, market rents, and other unfavorable consequences stemming from the COVID-19 pandemic, with the largest declines observed in the office and retail sectors in the Eastern and Western regions.
Real Estate Joint Ventures and Funds:
Real estate joint ventures and funds experienced unrealized losses of $56.7 million during the third quarter of 2020, compared to $138.0 million of unrealized losses during the comparable period of 2019. Net losses in the third quarter of 2020 were primarily driven by the Account's retail joint venture investments. Market rents in the retail sector are declining and are likely to continue over the near term.
Marketable Securities:
The Account’s marketable securities experienced net realized and unrealized gains of $21.2 million during the third quarter of 2020 compared to net realized and unrealized gains of $64.8 million during the comparable period of 2019, primarily attributed sales of securities and the performance of the Account's real-estate related securities. The performance of the Account's REIT portfolio was in line with comparable REIT-based indexes, notably the FTSE NAREIT All Equity Index, in both periods. U.S. Treasuries, government agency notes and corporate bonds had a nominal impact in both periods due to the short and intermediate-term nature of these investments, respectively.
Loans Receivable, including those with related parties:
Loans receivable, including loans receivable with related parties, experienced net realized and unrealized losses of $8.8 million during the third quarter of 2020 compared to a $1.4 million unrealized loss during the comparable period of 2019. Net losses are attributed to uncertainty caused by the COVID-19 pandemic, most notably mezzanine
loans collateralized by office properties, which are seeing a decline in occupancy and market rents that fall below current contract rents. Declining property values result in higher loan-to-value ratios, which have an unfavorable impact on valuation. The Account has not had material exposure to delinquencies or loan defaults from borrowers impacted by the COVID-19 pandemic as of September 30, 2020.
Loans Payable:
Loans payable experienced unrealized losses of $42.4 million in the third quarter of 2020, compared to a $32.1 million unrealized loss during the comparable period of 2019. During the third quarter of 2020, credit spreads narrowed resulting in overall unrealized losses for the period.
Results of Operations
Nine months ended September 30, 20172020 compared to nine months ended September 30, 20162019
Net Investment Income
The following table shows the results of operations for the nine months ended September 30, 20172020 and 20162019 and the dollar and percentage changes for those periods (dollars in millions, unaudited).
| | | | | | | | | | | | | | | | | | | | | | | | | | |
| | | For the Nine Months Ended September 30, | | Change |
| 2020 | | 2019 | | $ | | % |
| INVESTMENT INCOME | | | | | | | | |
| Real estate income, net: | | | | | | | | |
| Rental income | | $ | 906.0 | | | $ | 823.6 | | | $ | 82.4 | | | 10.0 | % |
| Real estate property level expenses: | | | | | | | | |
| Operating expenses | | 196.6 | | | 181.8 | | | 14.8 | | | 8.1 | % |
| Real estate taxes | | 157.3 | | | 138.9 | | | 18.4 | | | 13.2 | % |
| Interest expense | | 74.0 | | | 80.1 | | | (6.1) | | | (7.6) | % |
| Total real estate property level expenses | | 427.9 | | | 400.8 | | | 27.1 | | | 6.8 | % |
| Real estate income, net | | 478.1 | | | 422.8 | | | 55.3 | | | 13.1 | % |
| Income from real estate joint ventures and funds | | 110.5 | | | 170.9 | | | (60.4) | | | (35.3) | % |
| Interest | | 85.0 | | | 129.7 | | | (44.7) | | | (34.5) | % |
| Dividends | | 17.1 | | | 17.5 | | | (0.4) | | | (2.3) | % |
| TOTAL INVESTMENT INCOME | | 690.7 | | | 740.9 | | | (50.2) | | | (6.8) | % |
| Expenses: | | | | | | | | |
| Investment management charges | | 46.6 | | | 53.6 | | | (7.0) | | | (13.1) | % |
| Administrative charges | | 34.2 | | | 37.6 | | | (3.4) | | | (9.0) | % |
| Distribution charges | | 18.1 | | | 24.1 | | | (6.0) | | | (24.9) | % |
| Mortality and expense risk charges | | 0.9 | | | 1.0 | | | (0.1) | | | (10.0) | % |
| Liquidity guarantee charges | | 45.4 | | | 41.4 | | | 4.0 | | | 9.7 | % |
| TOTAL EXPENSES | | 145.2 | | | 157.7 | | | (12.5) | | | (7.9) | % |
| INVESTMENT INCOME, NET | | $ | 545.5 | | | $ | 583.2 | | | $ | (37.7) | | | (6.5) | % |
|
| | | | | | | | | | | | | | | |
| | | For the Nine Months Ended September 30, | | Change |
| 2017 | | 2016 | | $ | | % |
| INVESTMENT INCOME | | | | | | | | |
| Real estate income, net: | | | | | | | | |
| Rental income | | $ | 791.6 |
| | $ | 755.9 |
| | $ | 35.7 |
| | 4.7 | % |
| Real estate property level expenses: | | | | | | | | |
| Operating expenses | | 164.9 |
| | 163.5 |
| | 1.4 |
| | 0.9 | % |
| Real estate taxes | | 127.3 |
| | 116.9 |
| | 10.4 |
| | 8.9 | % |
| Interest expense | | 67.3 |
| | 63.3 |
| | 4.0 |
| | 6.3 | % |
| Total real estate property level expenses | | 359.5 |
| | 343.7 |
| | 15.8 |
| | 4.6 | % |
| Real estate income, net | | 432.1 |
| | 412.2 |
| | 19.9 |
| | 4.8 | % |
| Income from real estate joint ventures and limited partnerships | | 154.3 |
| | 111.8 |
| | 42.5 |
| | 38.0 | % |
| Interest | | 37.6 |
| | 17.8 |
| | 19.8 |
| | N/M |
|
| Dividends | | 15.7 |
| | 19.9 |
| | (4.2 | ) | | (21.1 | )% |
| TOTAL INVESTMENT INCOME | | 639.7 |
| | 561.7 |
| | 78.0 |
| | 13.9 | % |
| Expenses: | | | | | | | | |
| Investment management charges | | 52.9 |
| | 51.8 |
| | 1.1 |
| | 2.1 | % |
| Administrative charges | | 46.0 |
| | 48.4 |
| | (2.4 | ) | | (5.0 | )% |
| Distribution charges | | 19.6 |
| | 21.3 |
| | (1.7 | ) | | (8.0 | )% |
| Mortality and expense risk charges | | 0.9 |
| | 0.9 |
| | — |
| | — | % |
| Liquidity guarantee charges | | 34.5 |
| | 28.1 |
| | 6.4 |
| | 22.8 | % |
| TOTAL EXPENSES | | 153.9 |
| | 150.5 |
| | 3.4 |
| | 2.3 | % |
| INVESTMENT INCOME, NET | | $ | 485.8 |
| | $ | 411.2 |
| | $ | 74.6 |
| | 18.1 | % |
| | | | | | | | | | | | | | | | | | | | | | | | | | | | | | | | | | | | | | | | | | | | | | | |
| | | Rental Income | | Operating Expenses | | Real Estate Taxes |
| Change | | | Change | | | Change |
| 2020 | 2019 | $ | % | | 2020 | 2019 | $ | % | | 2020 | 2019 | $ | % |
| Same Property | | $ | 755.0 | | $ | 730.9 | | $ | 24.1 | | 3.3 | % | | $ | 162.2 | | $ | 162.8 | | $ | (0.6) | | (0.4) | % | | $ | 133.7 | | $ | 128.3 | | $ | 5.4 | | 4.2 | % |
| Properties Acquired | | 144.1 | | 8.4 | | 135.7 | | N/M | | 33.6 | | 1.6 | | 32.0 | | N/M | | 22.8 | | 1.3 | | 21.5 | | N/M |
| Properties Sold | | 6.9 | | 84.3 | | (77.4) | | N/M | | 0.8 | | 17.4 | | (16.6) | | N/M | | 0.8 | | 9.3 | | (8.5) | | N/M |
| Impact of Properties Acquired/Sold | | 151.0 | | 92.7 | | 58.3 | | N/M | | 34.4 | | 19.0 | | 15.4 | | N/M | | 23.6 | | 10.6 | | 13.0 | | N/M |
| Total Property Portfolio | | $ | 906.0 | | $ | 823.6 | | $ | 82.4 | | 10.0 | % | | $ | 196.6 | | $ | 181.8 | | $ | 14.8 | | 8.1 | % | | $ | 157.3 | | $ | 138.9 | | $ | 18.4 | | 13.2 | % |
N/M—Not meaningful
Rental Income:
Rental income increased $35.7by $82.4 million, or 4.7%10.0%, primarily due to net acquisitions coupledacquisition activity paired with increased occupancyscheduled rent step-ups for properties held in the retail and apartment sectors and reduced leasing incentives in the industrial and retail sectors.
Operating Expenses:
Operating expenses increased $1.4 million, or 0.9%, primarily due to net acquisitions.
Real Estate Taxes:
Real estate taxes increased $10.4 million, or 8.9%, primarily due to net real estate acquisitions coupled with higher property tax assessments resulting from increases in property valuesboth comparative periods, most notably across the office and apartment sectors.industrial sector. Market rents in the office, industrial and multifamily sectors were trending upward for several consecutive quarters prior to the pandemic. Market rents have leveled or declined since March 2020, with decreases most significant among the retail sector. A notable offset to the overall increase in rental income were higher allowances for uncollectible rent recorded in the third quarter of 2020, most notably among the retail and office portfolios. The rising allowances are a direct consequence of financial pressures caused by the COVID-19 pandemic, as certain tenants are at greater risk of bankruptcy or default. The Account is closely monitoring the collectability of accrued rent and adjusting allowances as needed.
Interest Expense:
Interest expense increased $4.0 million, or 6.3%, due to higher average outstanding principal balancesRent relief requested by lessees through the nine months ended September 30, 2017,2020 has generally been in the form of rent deferrals, with payments delayed for a limited period of time and subsequently repaid over the life of the lease. Rental income continues to be accrued during the deferral period so long as future collection of the deferred rent is probable. The Account has not had material exposure to rent concessions or lease defaults for tenants impacted by the COVID-19 pandemic for the nine months ended September 30, 2020.
Operating Expenses:
Operating expenses increased $14.8 million, or 8.1%, primarily driven by net acquisition activity.
Real Estate Taxes:
Real estate taxes increased $18.4 million, or 13.2%, primarily driven by net acquisition activity paired with rising tax values of properties across the portfolio, most notably in the office sector.
Interest Expense:
Interest expense decreased $6.1 million, or 7.6%, as a result of lower average interest rates on outstanding principal balances on loans payable, as compared to the same period in 2016.2019.
Income from Real Estate Joint Ventures and Limited Partnerships:Funds:
Income from real estate joint ventures and limited partnerships increased $42.5funds decreased $60.4 million, or 38.0%35.3%, as a resultwhich is primarily attributed to the full acquisition of net acquisitions and higher distributions, primarilythe DDRTC Core Retail Fund LLC in the first quarter of 2020 (changing the balance sheet classification from a joint venture that holds a largeto wholly-owned) paired with an overall decline in income from multiple retail property in Las Vegas, Nevada.joint ventures.
Interest and Dividend Income:
Interest income increased $19.8decreased $44.7 million primarily due to interest income earned on a larger loan receivable portfoliosignificant decrease in 2017 as compared to the same period in 2016.Account's short-term security portfolio. Dividend income decreased $4.2$0.4 million, when comparedconsistent with a reduction in the size of the real-estate related securities portfolio from the comparative period.
Expenses:
Investment management, administrative and distribution costs are charged to the same period in 2016 due to lower dividend yieldsAccount associated with managing the Account. Investment management charges are comprised primarily of fixed components, but fluctuate based on the Account's real-estate relatedsecurities.
Expenses:
Expense ratios, as a percentagesize of average net assets, for investment advisory,the Account’s portfolio of investments, whereas administrative and distribution charges were 0.48% and 0.52% for the nine month period ended September 30, 2017 and 2016, respectively. Costs decreasing slightly period over period, coupled with an increase in average net assets, reduced the overall expense ratio. These costs have fixed andare comprised of more variable components the latter of whichthat generally correspond with movements in net assets. Both distribution services (pursuant to the levelDistribution Agreement) and administrative services are provided to the Account by Services and TIAA, as applicable, on an at cost basis. These expenses decreased $16.4 million from the comparable period of the Account’s net assets under2019, primarily attributed to lower expenses for real estate asset management services and other cost drivers.expense reduction measures undertaken by TIAA.
Mortality and expense risk and liquidity guarantee chargesexpenses are contractual charges to the Account from TIAA for TIAA’s assumption of these risks and provision of the liquidity guarantee. The ratesrate for these charges wereis established effective May 1, 2017, for the twelve month period ending April 30, 2018,annually and are charged at a fixed rate based on the Account’s net assets. Mortality and expense risk expenses decreased $0.1 million due to a decline in the Account's average net assets between the comparative periods. Liquidity guarantee expenses increased $4.0 million as a result of the four basis point increase to the expense charge for the liquidity guarantee which was effective August 1, 2019, partially offset by the decline in average net assets.
Net Realized and Unrealized Gains and Losses on Investments and Mortgage Loans Payable
The following table shows the net realized and unrealized gains and losses on investments and mortgage loans payable for the nine months ended September 30, 20172020 and 20162019 and the dollar and percentage changes for those periods (dollars in millions, unaudited).
|
| | | | | | | | | | | | | | | |
| | | For the Nine Months Ended September 30, | | Change |
| 2017 | | 2016 | | $ | | % |
| NET REALIZED AND UNREALIZED GAIN (LOSS) ON INVESTMENTS AND MORTGAGE LOANS PAYABLE | | | | | | | | |
| Net realized gain (loss) on investments: | | | | | | | | |
| Real estate properties | | $ | 58.4 |
| | $ | 26.5 |
| | $ | 31.9 |
| | N/M |
|
| Real estate joint ventures and limited partnerships | | (8.6 | ) | | 0.4 |
| | (9.0 | ) | | N/M |
|
| Marketable securities | | 15.3 |
| | 21.6 |
| | (6.3 | ) | | (29.2 | )% |
| Total realized gain on investments: | | 65.1 |
| | 48.5 |
| | 16.6 |
| | 34.2 | % |
| Net change in unrealized appreciation (depreciation) on: | | | | | | | | |
| Real estate properties | | 74.8 |
| | 242.2 |
| | (167.4 | ) | | (69.1 | )% |
| Real estate joint ventures and limited partnerships | | 88.7 |
| | 152.3 |
| | (63.6 | ) | | (41.8 | )% |
| Marketable securities | | 34.2 |
| | 84.2 |
| | (50.0 | ) | | (59.4 | )% |
| Loans receivable | | 1.4 |
| | 0.1 |
| | 1.3 |
| | N/M |
|
| Mortgage loans payable | | (10.6 | ) | | (54.8 | ) | | 44.2 |
| | (80.7 | )% |
| Net change in unrealized appreciation on investments and mortgage loans payable | | 188.5 |
| | 424.0 |
| | (235.5 | ) | | (55.5 | )% |
| NET REALIZED AND UNREALIZED GAIN ON INVESTMENTS AND MORTGAGE LOANS PAYABLE | | $ | 253.6 |
| | $ | 472.5 |
| | $ | (218.9 | ) | | (46.3 | )% |
| | | | | | | | | | | | | | | | | | | | | | | | | | |
| | For the Nine Months Ended September 30, | | Change |
| 2020 | | 2019 | | $ | | % |
| NET REALIZED AND UNREALIZED GAIN (LOSS) ON INVESTMENTS AND LOANS PAYABLE | | | | | | | | |
| Net realized gain (loss) on investments: | | | | | | | | |
| Real estate properties | | $ | (61.0) | | | $ | 300.0 | | | $ | (361.0) | | | N/M |
| Real estate joint ventures and funds | | (460.5) | | | (43.7) | | | (416.8) | | | N/M |
| Marketable securities | | 41.0 | | | 280.6 | | | (239.6) | | | N/M |
| Loans receivable | | (1.6) | | | — | | | (1.6) | | | N/M |
| Total realized (loss) gain on investments: | | (482.1) | | | 536.9 | | | (1,019.0) | | | N/M |
| Net change in unrealized appreciation (depreciation) on: | | | | | | | | |
| Real estate properties | | (273.0) | | | 161.0 | | | (434.0) | | | N/M |
| Real estate joint ventures and funds | | 2.6 | | | (94.3) | | | 96.9 | | | (102.8) | % |
| Marketable securities | | (120.5) | | | 19.8 | | | (140.3) | | | N/M |
| Loans receivable | | (31.4) | | | (3.8) | | | (27.6) | | | N/M |
| Loans receivable with related parties | | 0.4 | | | (0.4) | | | 0.8 | | | N/M |
| Loans payable | | (6.1) | | | (98.4) | | | 92.3 | | | N/M |
| Net change in unrealized depreciation on investments and loans payable | | (428.0) | | | (16.1) | | | (411.9) | | | N/M |
| NET REALIZED AND UNREALIZED (LOSS) GAIN ON INVESTMENTS AND LOANS PAYABLE | | $ | (910.1) | | | $ | 520.8 | | | $ | (1,430.9) | | | N/M |
N/M—Not meaningful
Real Estate Properties, Joint Ventures and Limited Partnerships:
Net realized gains in the Account are primarily attributed to the disposition of wholly-owned real estate properties. See the Recent Transactions section herein for additional disclosure regarding the sale of the Account’s real estate property investments.
Real Estate Properties:
Wholly-owned real estate investments experienced net realized and unrealized gainslosses of $133.2$334.0 million during the first nine months of 20172020 compared to $268.7$461.0 million of net realized and unrealized gains during the comparable period of 2016. While the rate of appreciation has slowed2019. Net losses in 2017, the Account continues to see appreciation across most of its sectors. Appreciation for the nine months ended September 30, 2017 was largely concentrated among the Account's industrial sector, especially2020, were driven by uncertainty in the Westernreal estate market due to concerns about occupancy, market rents, and other unfavorable consequences stemming from the COVID-19 pandemic. While depreciation was present across all real estate sectors, the largest declines were observed within the office and retail sectors in the Eastern region. Strong tenant demand for industrial space in California has been the primary driver of this appreciation.
Real Estate Joint Ventures and Limited Partnerships:Funds:
Real estate joint ventures and limited partnershipsfunds experienced net realized and unrealized gainslosses of $80.1$457.9 million during the first nine months of 2017, compared2020. Net losses are primarily attributed to $152.7 million during the comparable period of 2016. While the rate of appreciation has slowed in 2017, the Account continues to see modest appreciation across most sectorsfull acquisition of the Account's joint venture portfolio. The strongest appreciation for the nine months ended September 30, 2017 was among the Account's office investmentsDDRTC Core Retail Fund LLC in the Western region. Appreciation from joint venture regional malls in the Southern region was especially strong in 2016; the absencefirst quarter of this same appreciation in 2017 due to moderating market conditions was a significant driver of the overall decline from the prior year.2020.
Marketable Securities:
The Account’s marketable securities experienced net realized and unrealized gainslosses of $49.5$79.5 million during the first nine months of 20172020, compared to $105.8net realized and unrealized gains of $300.4 million during the comparable period of 2016.2019, primarily attributed to the performance of the Account's real-estate related securities. The markets for REITsperformance of the Account's REIT portfolio was in the U.S. increased 6.0% as measured byline with comparable REIT-based indexes, notably the FTSE NAREIT All Equity REITs Index, during the nine month period ended September 30, 2017, compared to a increase of 12.3% in the same period of 2016. Appreciation on the Account's real estate related equity securities moved in line with the market movements. Additionally, as of September 30, 2017, the Account held $4.3 billion of investments inboth periods. U.S. Treasuries, government agency notes and U.S. Treasury securities, whichcorporate bonds had a nominal changesimpact in both periods due to the short-termshort and intermediate-term nature of these investments.investments, respectively.
Mortgage Loans Payable:Receivable, including those with related parties:
MortgageLoans receivable, including loans payablereceivable with related parties, experienced net realized and unrealized losses of $10.6$32.6 million during the first nine months 2017of 2020 compared to a $4.2 million unrealized losses of $54.8 millionloss during the comparable period of 2016.2019. Net losses are attributed to uncertainty caused by the COVID-19 pandemic, as the market has growing concern that cash flow from real estate collateral will be insufficient to cover debt service, most notably mezzanine loans collateralized by retail, office, and hospitality properties. The lowerAccount has not had material exposure to delinquencies or loan defaults for borrowers impacted by the COVID-19 pandemic as of September 30, 2020.
Loans Payable:
Loans payable experienced unrealized losses forof $6.1 million during the first nine months ended September 30, 2017, were consistent with the directional movement of Treasury rates during the comparable period.
Results of Operations
Three months ended September 30, 20172020, compared to three months ended September 30, 2016
Net Investment Income
The following table shows the results of operations for the three months ended September 30, 2017 and 2016 and the dollar and percentage changes for those periods (dollars in millions, unaudited).
|
| | | | | | | | | | | | | | | |
| | | For the Three Months Ended September 30, | | Change |
| 2017 | | 2016 | | $ | | % |
| INVESTMENT INCOME | | | | | | | | |
| Real estate income, net: | | | | | | | | |
| Rental income | | $ | 267.9 |
| | $ | 257.4 |
| | $ | 10.5 |
| | 4.1 | % |
| Real estate property level expenses: | | | |
| |
| |
|
| Operating expenses | | 56.9 |
| | 54.8 |
| | 2.1 |
| | 3.8 | % |
| Real estate taxes | | 43.2 |
| | 40.4 |
| | 2.8 |
| | 6.9 | % |
| Interest expense | | 22.5 |
| | 22.4 |
| | 0.1 |
| | 0.4 | % |
| Total real estate property level expenses | | 122.6 |
| | 117.6 |
| | 5.0 |
| | 4.3 | % |
| Real estate income, net | | 145.3 |
| | 139.8 |
| | 5.5 |
| | 3.9 | % |
| Income from real estate joint ventures and limited partnerships | | 60.9 |
| | 33.5 |
| | 27.4 |
| | 81.8 | % |
| Interest | | 15.9 |
| | 6.3 |
| | 9.6 |
| | N/M |
|
| Dividends | | 7.9 |
| | 9.2 |
| | (1.3 | ) | | (14.1 | )% |
| TOTAL INVESTMENT INCOME | | 230.0 |
| | 188.8 |
| | 41.2 |
| | 21.8 | % |
| Expenses: | | | |
| |
| |
|
| Investment management charges | | 15.5 |
| | 17.6 |
| | (2.1 | ) | | (11.9 | )% |
| Administrative charges | | 14.7 |
| | 17.0 |
| | (2.3 | ) | | (13.5 | )% |
| Distribution charges | | 6.4 |
| | 7.2 |
| | (0.8 | ) | | (11.1 | )% |
| Mortality and expense risk charges | | 0.3 |
| | 0.3 |
| | — |
| | — | % |
| Liquidity guarantee charges | | 12.5 |
| | 10.2 |
| | 2.3 |
| | 22.5 | % |
| TOTAL EXPENSES | | 49.4 |
| | 52.3 |
| | (2.9 | ) | | (5.5 | )% |
| INVESTMENT INCOME, NET | | $ | 180.6 |
| | $ | 136.5 |
| | $ | 44.1 |
| | 32.3 | % |
Rental Income:
Rental income increased $10.5a $98.4 million or 4.1%, primarily due to net real estate acquisitions.
Operating Expenses:
Operating expenses increased $2.1 million, or 3.8%, attributed mainly to net real estate acquisitions.
Real Estate Taxes:
Real estate taxes increased $2.8 million, or 6.9%, primarily due to net real estate acquisitions and rising tax value of properties in the portfolio.
Interest Expense:
Interest expense increased $0.1 million, or 0.4%, remaining relatively flat, due to minimal movement in average outstanding principal as compared tounrealized loss during the comparable period of 2016.
Income from Real Estate Joint Ventures and Limited Partnerships:
Income from real estate joint ventures and limited partnerships increased $27.4 million, or 81.8%, for the three2019. The first six months ended September 30, 2017, when comparedof 2020 had unrealized gains, attributed to widening credit spreads in response to the same period of 2016, due to net acquisitions and increased distributions received from a joint venture investment that holds a retail portfolio.
Interest and Dividend Income:
Interest income increased $9.6 million primarily due to interest income earned on a larger loan receivable portfolio in 2017 as compared tomarket instability introduced by the same period inCOVID-19 pandemic, most notably at the previous year. Dividend income decreased $1.3 million when compared to the same period of 2016. Yields were consistent with the sizebeginning of the REIT portfolio in each respective quarter.
Expenses:
Expense ratios, as a percentage of average net assets, for investment advisory, administrative and distribution charges were 0.15% and 0.18% for the three month periods ended September 30, 2017 and 2016, respectively. Costs decreasing period over period, coupled with an increase in average net assets, reduced the overall expense ratio. These costs have fixed and variable components, the latter of which generally correspond to the level of the Account’s net assets under management and other cost drivers.
Mortality and expense risk and liquidity guarantee charges are contractual charges to the Account from TIAA for TIAA’s assumption of these risks and provision of the guarantee. The rates for these charges were established effective May 1, 2017, for the twelve month period ending April 30, 2018, and are charged based on the Account’s net assets.
Net Realized and Unrealized Gains and Losses on Investments and Mortgage Loans Payable
The following table shows the net realized and unrealized gains and losses on investments and mortgage loans payable for the three months endedSeptember 30, 2017 and 2016 and the dollar and percentage changes for those periods (dollars in millions, unaudited).
|
| | | | | | | | | | | | | | | |
| | | For the Three Months Ended September 30, | | Change |
| 2017 | | 2016 | | $ | | % |
| NET REALIZED AND UNREALIZED GAIN (LOSS) ON INVESTMENTS AND MORTGAGE LOANS PAYABLE | | | | | | | | |
| Net realized gain (loss) on investments: | | | | | | | | |
| Real estate properties | | $ | 75.2 |
| | $ | 16.4 |
| | $ | 58.8 |
| | N/M |
|
| Real estate joint ventures and limited partnerships | | (8.6 | ) | | 0.2 |
| | (8.8 | ) | | N/M |
|
| Marketable securities | | 2.6 |
| | 3.1 |
| | (0.5 | ) | | (16.1 | )% |
| Total realized gain on investments: | | 69.2 |
| | 19.7 |
| | 49.5 |
| | N/M |
|
| Net change in unrealized appreciation (depreciation) on: | | | | | | | | |
| Real estate properties | | (9.4 | ) | | 36.9 |
| | (46.3 | ) | | N/M |
|
| Real estate joint ventures and limited partnerships | | 26.9 |
| | 24.3 |
| | 2.6 |
| | 10.7 | % |
| Marketable securities | | 2.2 |
| | (26.0 | ) | | 28.2 |
| | N/M |
|
| Loans receivable | | 1.4 |
| | 0.1 |
| | 1.3 |
| | N/M |
|
| Mortgage loans payable | | (4.1 | ) | | (29.1 | ) | | 25.0 |
| | (85.9 | )% |
| Net change in unrealized appreciation on investments and mortgage loans payable | | 17.0 |
| | 6.2 |
| | 10.8 |
| | N/M |
|
| NET REALIZED AND UNREALIZED GAIN ON INVESTMENTS AND MORTGAGE LOANS PAYABLE | | $ | 86.2 |
| | $ | 25.9 |
| | $ | 60.3 |
| | N/M |
|
N/M—Not meaningful
Real Estate Properties:
Wholly-owned real estate investments experienced net realized and unrealized gains of $65.8 millionpandemic. However, during the third quarter of 2017, compared to $53.3 million during the comparable period of 2016, mostly attributed to gains realized from the sale of wholly-owned properties and appreciation among the Account's industrial properties2020, credit spreads narrowed resulting in the Western region. Strong tenant demand for industrial space in California has been the primary driver of this appreciation.
Real Estate Joint Ventures and Limited Partnerships:
Real estate joint ventures and limited partnerships experienced net realized and unrealized gains of $18.3 million during the third quarter of 2017, compared to gains of $24.5 million during the comparable period of 2016. The joint venture portfolio experienced positive appreciation during the third quarter of 2017, primarily due to increased occupancy and a decrease in lease concessions at one of the Account's joint venture office properties in California. The Account recorded similar appreciation in the comparable quarter of 2016, driven by similar factors within the Account's joint venture retail properties.
Marketable Securities:
The Account’s marketable securities experienced net realized and unrealized gains of $4.8 million during the third quarter of 2017 compared to losses of $22.9 million during the comparable period of 2016. The markets for REITs in the U.S. increased 1.1% as measured by the FTSE NAREIT All Equity REITs Index during the three month period ended September 30, 2017, compared to a decrease of 1.2% in the same period of 2016. Appreciation on the Account's real estate related equity securities moved in line with the market movements. Additionally, as of September 30, 2017, the Account held $4.3 billion of investments in government agency notes and U.S. Treasury securities, which had nominal changes due to the short-term nature of these investments.
Mortgage Loans Payable:
Mortgage loans payable experiencedoverall unrealized losses of $4.1 million duringfor the third quarter of 2017 compared to $29.1 million during the comparable period of 2016. The unrealized losses were consistent with the directional movement of Treasury rates during the comparable period.
Liquidity and Capital Resources
As of September 30, 20172020 and December 31, 2016,2019, the Account’s cash and cash equivalents and non-real estate-related marketable securities had a value of $4.3$0.7 billionand $4.14.2 billion representing 17.3%3.0% and 16.7%15.2% of the Account’s net assets at such dates, respectively.
Participant Flows: Nine months ended September 30, 2017 compared to nine months ended September 30, 2016
During the nine months ended September 30, 2017, the Account received $2.0 billion in premiums from participants offset by participant outflows of $2.2 billion in annuity payments and withdrawals and death benefits. During the nine months ended September 30, 2016, the Account received $2.3 billion in premiums from participants offset by participant outflows of $1.6 billion in annuity payments and withdrawals and death benefits.
Net Income and Marketable SecuritiesDebt Outstanding
The Account’s net investment income continues to be an additionalis a source of liquidity for the Account. Net investment income was $485.8$545.5 million for the nine months ended September 30, 2017,2020, as compared to $411.2$583.2 million for the comparable period of 2016.2019. The increase in total net investment income is described more fully in the Results of Operations section.
AsThe Account has $1.0 billion in two unsecured lines of credit which had $909 million of availability as of September 30, 2017, cash and cash equivalents, along with real estate-related and non-real estate related marketable securities comprised 21.8%2020, accessible as needed to fund the Account's near-term investment objectives, as further described in Note 10—Lines of the Account’s net assets. The Account’s real estate-related marketable securities primarily consist of publicly traded REITs. The Account’s liquid assets continue to be available to purchase suitable real estate properties, meet the Account’s debt obligations, expense needs, and participant redemption requests (i.e., participant withdrawals or benefit payments).Credit.
The Account may from time to time borrow money and assume or obtain a mortgage on a property to make leveraged real estate investments. Also, to meet any short-term cash needs, the Account may obtain a line of credit that may be unsecured and/or contain terms that may require the Account to secure the loan with one or more of its properties.
The Account is authorized to borrow money in accordance with its investment guidelines. Under the Account’s current investment guidelines, the Account’s loan to value ratio (as described below) is to be maintained at or below 30% (measured at the time of incurrence and after giving effect thereto). Such incurrences of debt from time to time may include:
•placing new debt on properties;
•refinancing outstanding debt;
•assuming debt on acquired properties or interests in the Account’s properties; and/or
long term extensions of•extending the maturity date of outstanding debt.debt; and/or
In calculating this limit, only the Account’s actual percentage interest in any borrowings is included, and not that percentage interest held by any joint venture partner. Further, the Account may only borrow up to 70% of the then-current value of a property, although construction loans may be for 100% of the costs incurred in developing a property. At the time the Account (or a joint venture in which the Account is a partner) enters into a revolving•an unsecured line of credit for the purpose of calculating the loan to value ratio, management deems the maximum amount which may be drawn under that line ofor credit as fully incurred, regardless of whether the maximum amount available has been drawn from time to time.facility.
As of September 30, 2017,2020, the Account’s loan-to-value ratio ofwas 18.7%. The Account's loan-to-value ratio at any time is based on the outstanding principal amount of debt (inclusive ofto the Account’s proportionate share of debt held within its joint venture investments) toAccount's total gross asset value, (i.e., a “loan to value ratio”) was 15.2%.and excludes leverage, if any, employed by REITs and real estate funds in which the Account invests. The Account intends to maintain its loan to value ratio at or below 30% (this ratio iswill be measured at the time of any debt incurrence and will be assessed after giving effect thereto).thereto. The Account’s total gross asset value, for these purposes, is equal to the total fair value of the Account’s assets (including the fair value of the Account’s interest in joint ventures), with no reduction associated with any indebtedness on such assets. In calculating outstanding indebtedness, we include only the Account’s actual percentage interest in any borrowings on a joint venture investment and not that of any joint venture partner. Also, at the time the Account (or a joint venture in which the Account is a partner) enters into a revolving or other line of credit, management includes only amounts outstanding when calculating outstanding indebtedness.
The Account may only borrow up to 70% of the then-current value of a property, although construction loans may be for 100% of costs incurred in developing the property. Except for construction loans, any mortgage loans on a property will be non-recourse to the Account, meaning that if there is a default on a loan in respect to a specific property, the lender will have recourse to (i.e., be able to foreclose on) only the property encumbered (or the joint venture owning the property), or to other specific Account properties that may have been pledged as security for the defaulted loan, but not to any other assets of the Account. When possible, the Account will seek to have loans mature at varying times to limit the risks of borrowing.
As of September 30, 2017,2020, there are no mortgage obligations secured by real estate investments wholly-owned by the Account maturing within the next twelve months. The Account has sufficient liquidity in the form of cash and cash equivalents and securities to meet its current mortgage obligations.
In times of high net inflow activity, in particular during times of high net participant transfer inflows, management may determine to apply a portion of such cash flows to make prepayments of indebtedness prior to scheduled maturity, which would have the effect of reducing the Account’s loan to value ratio.
Recent Transactions
The following describes property transactions by the Accountoccurring during the third quarter of 2017.2020 related to real estate properties, real estate joint ventures, real estate funds, loans receivable, and loans payable. Except as noted, the expenses for operating the properties purchased are either borne or reimbursed, in whole or in part, by the property tenants, although the terms vary under each lease. Dollar amounts are shown in millions.
PurchasesTransactions - Other
The Bridges—Minneapolis, MN | | | | | | | | | | | | | | | | | | | | |
| Description | | Transaction Date | | Transaction Type | | Transaction Amount |
| Real estate-related marketable securities | | 09/16/2020 | | Sale | | $ | 200.0 | |
| Line of Credit I | | 09/18/2020 | | Paydown | | $ | 200.0 | |
On July 13, 2017, the Account acquired a student housing complex located near the University of Minnesota for $60.9 million.
The Knoll—Minneapolis, MN
On July 13, 2017, the Account acquired a student housing complex located near the University of Minnesota for $14.8 million, which is net of a $17.7 million mortgage loan the Account assumed with the property, as further discussed in the Financings section.
803 Corday—Naperville, IL
On August 10, 2017, the Account purchased a multi-family property located in Naperville, Illinois for $92.9 million.
DDR Joint Venture—Village Crossing: Phase I - Niles, IL
On September 7, 2017, the DDR joint venture investment, in which the Account holds an 85% interest, purchased a retail property located in Niles, Illinois for $44.4 million (the Account’s share).
Broward Industrial Portfolio—Various, FL
On September 19, 2017, the Account purchased an investment portfolio consisting of four industrial properties located in the Miami/Fort Lauderdale metro area for $54.1 million.
Orion on Orpington—Orlando, FL
On September 21, 2017, the Account purchased a student housing complex located near the University of Central Florida for $42.3 million.
Sales
Ontario Industrial Portfolio: Inland Empire Industrial Portfolio—Various, CA
On August 17, 2017, the Account sold an industrial portfolio held within its Ontario Industrial Portfolio located in various parts of California for a net sales price of $66.0 million, resulting in a realized gain of $20.9 million, the majority of which has been previously recognized as unrealized gains in the Account’s consolidated statements of operations. The Account’s cost basis in the property at the date of the sale was $45.1 million.
Rancho Cucamonga Industrial Portfolio: Inland Empire Industrial Portfolio—Various, CA
On August 17, 2017, the Account sold an industrial portfolio held within its Rancho Cucamonga Industrial Portfolio located in various parts of California for a net sales price of $104.8 million, resulting in a realized gain of $56.0 million, the majority of which has been previously recognized as unrealized gains in the Account’s consolidated statements of operations. The Account’s cost basis in the property at the date of the sale was $48.8 million.
The Pepper Building—Philadelphia, PA
On September 15, 2017, the Account sold this multi-family property located in Philadelphia, Pennsylvania for a net sales price of $51.7 million, realizing a loss of $1.7 million from the sale, the majority of which has been previously recognized as unrealized losses in the Account’s consolidated statements of operations. The Account’s cost basis in the property at the date of the sale was $53.4 million.
DDR Joint Venture: McFarland Plaza—Tuscaloosa, AL
On September 18, 2017, the DDR joint venture investment, in which the Account holds an 85% interest, sold a retail property located in Tuscaloosa, Alabama for a net sales price of $14.7 million (the Account’s share), which is gross of a $7.4 million mortgage loan extinguished during the sale of the property, as further discussed in the Financings section. The sale resulted in a realized loss of $8.9 million, the majority of which has been previously recognized as unrealized gains in the Account’s consolidated statements of operations. The Account’s cost basis in the property at the date of the sale was $23.6 million.
Financings
The Knoll—Minneapolis, MN
On July 13, 2017, concurrent with the purchase of a student housing complex located near the University of Minnesota, the Account assumed a $17.7 million mortgage loan. The loan has an interest rate of 3.98%, matures on December 5, 2020, and is adjusted monthly for principal payments.
Colorado Center—Santa Monica, CA
On August 1, 2017, Colorado Center joint venture investment, in which the Account holds a 50% interest, entered into a new mortgage loan with a principal amount of $275.0 million (the Account’s share). The debt has an interest rate of 3.563%, maturing August 9, 2027 and is interest only.
DDR Joint Venture—Various, USA
On August 14, 2017, the DDR joint venture investment, in which the Account holds an 85% interest, entered into a new mortgage loan secured by three retail properties with a principal amount totaling $90.3 million (the Account's share). The debt has an interest rate of 3.82%, maturing on September 11, 2027 and is interest only.
DDR Joint Venture: McFarland Plaza—Tuscaloosa, AL
On September 18, 2017, the DDR joint venture investment, in which the Account holds an 85% interest, extinguished $7.4 million of outstanding mortgage debt (the Account’s share) concurrent with the sale of a retail property located in Tuscaloosa, Alabama.
Critical Accounting Policies
Management’s discussion and analysis of the Account’s financial condition and results of operations is based on the Account’s consolidated interim financial statements,Consolidated Interim Financial Statements, which have been prepared by management in accordance with GAAP. The preparation of the Account’s financial statements in conformity with GAAP requires management to make estimates and assumptions that affect the financial statements and disclosures. Some of these estimates and assumptions require application of difficult, subjective, and/or complex judgments about the effect of matters that are inherently uncertain and that may change in subsequent periods. Management evaluates its estimates and assumptions on an ongoing basis. Management bases its estimates on historical experience and on various other assumptions that it believes to be reasonable under the circumstances, the results of which form the basis for making judgments about the carrying values of assets and liabilities of the Account that are not readily apparent from other sources. Actual results may differ from these estimates under different assumptions or conditions.
In the Account’s Annual Report on Form 10-K for the year ended December 31, 2016,2019, management identified the critical accounting policies which affect its significant estimates and assumptions used in preparing the Account’s financial statements. Certain of these accounting policies are described in Note 1—Organization and Significant Accounting Policies in this Form 10-Q.
There have been no material changes to these accounting policies tofrom those disclosed in our 2016the Account's Annual Report on Form 10-K.10-K for the year ended December 31, 2019.
ITEM 3. QUANTITATIVE AND QUALITATIVE DISCLOSURES ABOUT MARKET RISK
The Account’s real estate holdings, including real estate joint venture, limited partnershipsventures, funds and loans receivable, which, as of September 30, 2017,2020, represented 80.1% 94.8%of the Account’s total investments, expose the Account to a variety of risks. These risks include, but are not limited to:
•General Real Estate Risk—The risk that the Account’s property values or rental and occupancy rates could go down due to general economic conditions, a weak market for real estate generally and/or in specific locations where the Account may own property, including, among other reasons, as a result of an epidemic, pandemic or other health-related issue in one or more markets where the Account owns property, disruptions in the credit and/or capital markets, or changingchanges in supply and demand for certain types of properties;
•Appraisal Risk—The risk that the sale price of an Account property (i.e.(i.e., the value that would be determined by negotiations between independent parties) might differ substantially from its estimated or appraised value, leading to losses or reduced profits to the Account upon sale;
•Risk Relating to Property Sales—The risk that the Account might not be able to sell a property at a particular time for its full value, particularly in a poor market. This might make it difficult to raise cash quickly and also could lead to Account losses;
•Risks of Borrowing—The risk that interest rate changes may impact Account returns if the Account takes out a mortgage on a property, buys a property subject to a mortgage or holds a property subject to a mortgage, and hedging against such interest rate changes, if undertaken by the Account, may entail additional costs and be unsuccessful; and
•Foreign Currency Risk—The risk that the value of the Account’s foreign investments, related debt, or rental income could increase or decrease due to changes in foreign currency exchange rates or foreign currency exchange control regulations, and hedging against such currency changes, if undertaken by the Account, may entail additional costs and be unsuccessful.
The Account believes the diversification of its real estate portfolio, both geographically and by sector, along with its quarterly valuation procedure, helps manage the real estate and appraisal risks described above.
As of September 30, 2017, 19.9%2020, 5.2% of the Account’s total investments were comprised of marketable securities. Marketable securities include high-quality debt instruments (i.e.(i.e., U.S. government agency notes)notes and corporate bond securities) and REIT securities. The consolidated scheduleAccount's Consolidated Statements of investments for the AccountInvestments sets forth the general financial terms of these instruments, along with their fair values, as determined in accordance with procedures described earlier in the Critical Accounting Policies section above and in Note 1—1–Organization and Significant
Accounting Policies to the Account’s Consolidated Financial Statements included herewith. As of the date of this report, the Account does not invest in derivative financial investments, nor does the Account engage in any hedging activity, although it may do so in selected circumstances in the future.
RisksThe Account is also exposed to a variety of risks associated with investments in real estate-related liquid assets (which could include, from time to time, REIT securities and CMBS), and non-real estate-related liquid assets, including financial/credit risk, market volatility risk, interest rate volatility risk and deposit/money market risk. These risks have been heightened as a result of the COVID-19 pandemic.
•Financial/Credit Risk—The risk, for debt securities, that the issuer will not be able to pay principal and interest when due (and/or declare bankruptcy or be subject to receivership) and, for equity securities such as common or preferred stock, that the issuer’s current earnings will fall or that its overall financial soundness will decline, reducing the security’s value.
•Market Volatility Risk—The risk that the Account’s investments will experience price volatility due to changing conditions in the financial markets regardless of the credit quality or financial condition of the underlying issuer. This risk is particularly acute to the extent the Account holds equity securities, which have experienced significant short-term price volatility over the past year. Also, to the extent the Account holds debt securities, changes in overall interest rates can cause price fluctuations.
•Interest Rate Volatility—The risk that interest rate volatility may affect the Account’s current income from an investment.
•Deposit/Money Market Risk—The risk that, to the extent the Account’s cash held in bank deposit accounts exceeds federally insured limits as to that bank, the Account could experience losses if banks fail. The Account does not believe it has exposure to significant concentration of deposit risk. In addition, there is some risk that investments held in money market accounts can suffer losses.
In addition, to the extent the Account were to hold mortgage-backed securitiesMBS (including commercial mortgage-backed securities)CMBS) these securities are subject to prepayment risk or extension risk (i.e.(i.e., the risk that borrowers will repay the loans earlier or later than anticipated). If the underlying mortgage assets experience faster than anticipated repayments of principal, the Account could fail to recoup some or all of its initial investment in these securities, since the original price paid by the Account was based in part on assumptions regarding the receipt of interest payments. If the underlying mortgage assets are repaid later than anticipated, the Account could lose the opportunity to reinvest the anticipated cash flows at a time when interest rates might be rising. The rate of prepayment depends on a variety of geographic, social and other functions, including prevailing market interest rates and general economic factors. The fair value of these securities is also highly sensitive to changes in interest rates. Note that the potential for appreciation, which could otherwise be expected to result from a decline in interest rates, may be limited by any increased prepayments. These securities may be harder to sell than other securities.
In addition to these risks, real estate equity securities (such as REIT stockssecurities and mortgage-backed securities)MBS) would be subject to many of the same general risks inherent in real estate investing, making mortgage loans and investing in debt securities. For more information on the risks associated with all of the Account’s investments, see the "Risk Factors" section of the Account’s most recent prospectus.
ITEM 4. CONTROLS AND PROCEDURES
(a) The registrant maintains a system of disclosure controls and procedures that are designed to provide reasonable assurance that information required to be disclosed in the registrant’s reports under the Securities Exchange Act of 1934, as amended (the “Exchange Act”), is recorded, processed, summarized and reported within the time periods specified in the SEC’s rules and forms, and that such information is accumulated and communicated to management, including TIAA’s Executive Vice President, Institutional Investment & Endowment Servicesand Chief Product Officer of TIAA Financial Solutions (Principal Executive Officer (“PEO”)) and TIAA’s Senior Executive Vice President, Chief Accounting Officer and Chief Financial OfficerCorporate Controller (Principal Financial and Accounting Officer (“PFO”)), as appropriate, to allow timely decisions regarding required disclosure.
Under the supervision and participation of the registrant’s management, including the registrant’s PEO and PFO, the registrant conducted an evaluation of the effectiveness of the registrant’s disclosure controls and procedures as
defined in Rule 13a-15(e) under the Exchange Act as of September 30, 2017.2020. Based upon management’s review, the PEO and PFO concluded that the registrant’s disclosure controls and procedures provide reasonable assurance that material information required to be included in the Account's periodic reports is recorded, processed, summarized and reported within the time periods specified in the relevant SEC rules and forms.
(b) Changes in internal control over financial reporting. There have been no changes in the registrant’s internal control over financial reporting that occurred during the registrant’s last fiscal quarter that materially affected, or are reasonably likely to materially affect, the registrant’s internal control over financial reporting.
PART II. OTHER INFORMATION
ITEM 1. LEGAL PROCEEDINGS.
In the normal course of business, the Account may be named, from time to time, as a defendantor may be involved in various legal actions, including arbitration, class actions and other litigation.
The Account establishes an accrual for all litigation and regulatory matters when it believes it is partyprobable that a loss has been incurred and the amount of the loss can be reasonably estimated. Once established, accruals are adjusted, as appropriate, in light of additional information. The amount of loss ultimately incurred in relation to various claims and routine litigation arising inthose matters may be higher or lower than the ordinary courseamounts accrued for those matters.
As of business. Managementthe date of this report, management of the Account does not believe that the results of any such claims or litigation, individually or in the aggregate, will have a material effect on the Account’s business, financial position or results of operations.
ITEM 1A. RISK FACTORS.
There have been no material changes from the Account’s risk factors as previously reported in the Account’s Annual Report on Form 10-K for the year ended December 31, 2016.2019 and the Account's Quarterly Report on Form 10-Q for the quarter ended June 30, 2020.
ITEM 2. UNREGISTERED SALES OF EQUITY SECURITIES AND USE OF PROCEEDS.
Not applicable.
ITEM 3. DEFAULTS UPON SENIOR SECURITIES.
Not applicable.
ITEM 4. MINE SAFETY DISCLOSURES.
Not applicable.
ITEM 5. OTHER INFORMATION.
The Code of Ethics for TIAA’s senior financial officers, including its principal executive officer, principal financial officer, principal accounting officer, or controller, and persons performing similar functions, has been filed as an exhibit to the Account’s Annual Report on Form 10-K for the year ended December 31, 2016 and can also be found on the following web site, http://www.tiaa.org/public/prospectuses/index.html.Not applicable.
ITEM 6. EXHIBITS
|
| | | | | | | |
| (1) | (A) | |
| (3) | (A) | |
| (B) | |
| (4) | (A) | |
| (B) | |
| (C) | |
| (D) | |
| (E) | |
| (E) | |
| (F) | |
| (F) | |
| | |
(10) | (A)(G) | |
| (H) | |
| (I) | |
| (J) | |
| | |
| (K) | |
| (L) | |
| | |
| (10) | (A) | |
| (B) | |
| (C) | |
| | |
| | |
| (101) | | The following financial information from the Quarterly Report on Form 10-Q for the period ended September 30, 2017,2020 (Unaudited), formatted in XBRL (Extensible Business Reporting Language): (i) the Consolidated Statements of Assets and Liabilities as of September 30, 2020 (Unaudited), (ii) the Consolidated Statements of Operations for the three and nine months ended September 30, 2020 and 2019 (Unaudited) , (iii) the Consolidated Statements of Changes in Net Assets for the three and nine months ended September 30, 2020 and 2019 (Unaudited), (iv) the Consolidated Statements of Cash Flows for the nine months ended September 30, 2020 and 2019 (Unaudited), and (v) the Notes to the Consolidated Financial Statements.Statements (Unaudited).** |
| |
** | Furnished electronically herewith. |
| |
(1)*Filed herewith. **Furnished electronically herewith.
(1)Previously filed and incorporated herein by reference to Exhibit 1(A) to the Account’s Registration Statement on Form S-1, filed with the Commission on March 15, 2013 (File No. 333-187309). (2)Previously filed and incorporated herein by reference to Exhibit 3(A) to the Account’s Registration Statement on Form S-1, filed with the Commission on April 22, 2015 (File No. 333-202583). (3)Previously filed and incorporated herein by reference to Exhibit 3(B) to the Account’s Registration Statement on Form S-1, filed with the Commission on April 22, 2015 (File No. 333-202583). (4)Previously filed and incorporated herein by reference to the Account’s Post-Effective Amendment No. 2 to the Registration Statement on Form S-1, filed with the Commission on April 30, 1996 (File No. 33-92990). (5)Previously filed and incorporated herein by reference to Exhibit 4(A) to the Account’s Post-Effective Amendment No. 1 to the Registration Statement on Form S-1, filed with the Commission on May 2, 2005 (File No. 333-121493). (6)Previously filed and incorporated herein by reference to the Account’s Pre-Effective Amendment No. 1 to the Registration Statement on Form S-1, filed with the Commission on April 29, 2004 (File No. 333-113602). (7)Previously filed and incorporated by reference to Exhibit 4(C) to the Account’s Quarterly Report on Form 10-Q for the quarter ended September 30, 2010 and filed with the Commission on November 12, 2010 (File No. 33-92990). (8)Previously filed and incorporated herein by reference to Exhibit 10(B) to the Account's Annual Report on Form 10-K for the fiscal year ended December 31, 2012 and filed with the Commission on March 14, 2013 (File No. 33-92990). (9)Previously filed and incorporated herein by reference to Exhibit 4(D)(1) and 4(D)(2) to the Account’s Registration Statement on Form S-1, filed with the Commission on March 21, 2017 (File No. 333-216849). (10)Previously filed and incorporated herein by reference to Exhibit 4(E)(1) and 4(E)(2) to the Account’s Registration Statement on Form S-1, filed with the Commission on March 21, 2017 (File No. 333-216849). (11)Previously filed and incorporated herein by reference to Exhibit 4(F)(1) and 4(F)(2) to the Account’s Registration Statement on Form S-1, filed with the Commission on March 21, 2017 (File No. 333-216849). (12)Previously filed and incorporated herein by reference to Exhibit 4(G) to the Account’s Annual Report on Form 10-K, filed with the Commission on March 15, 2018 (File No. 333-216849). (13)Previously filed and incorporated herein by reference to Exhibit 4(H) to the Account’s Annual Report on Form 10-K, filed with the Commission on March 15, 2018 (File No. 333-216849). (14)Previously filed and incorporated herein by reference to Exhibit 4(I) to the Account’s Annual Report on Form 10-K, filed with the Commission on March 15, 2018 (File No. 333-216849). (15)Previously filed and incorporated herein by reference to Exhibit 10.1 to the Account’s Current Report on Form 8-K, filed with the Commission on March 1, 2018 (File No. 33-92990). (16)Previously filed and incorporated herein by reference to Exhibit 4(J)(1) and 4(J)(2) to the Account’s Current Report on Form 10-K, filed with the Commission on March 14, 2019 (File No. 33-92990). (17)Previously filed and incorporated herein by reference to Exhibit 4(K) to the Account’s Current Report on Form 10-K, filed with the Commission on March 14, 2019 (File No. 33-92990). (18)Previously filed and incorporated herein by reference to Exhibit 4(L)(1) and 4(L)(2) to the Account's Current Report on Form 10-K, filed with the Commission on March 12, 2020 (File No. 33-92990). (19)Previously filed and incorporated herein by reference to Account's Current Report on Form 8-K, filed with the Commission on September 24, 2020 (File No. 33-92990).
| Previously filed and incorporated herein by reference to Exhibit 1(A) to the Account’s Registration Statement on Form S-1, filed with the Commission on March 15, 2013 (File No. 333-187309). |
| |
(2)
| Previously filed and incorporated herein by reference to Exhibit 3(A) to the Account’s Registration Statement on Form S-1, filed with the Commission on April 22, 2015 (File No. 333-202583). |
| |
(3)
| Previously filed and incorporated herein by reference to Exhibit 3(B) to the Account’s Registration Statement on Form S-1, filed with the Commission on April 22, 2015 (File No. 333-202583). |
| |
(4)
| Previously filed and incorporated herein by reference to the Account’s Post-Effective Amendment No. 2 to the Registration Statement on Form S-1, filed with the Commission on April 30, 1996 (File No. 33-92990). |
| |
(5)
| Previously filed and incorporated herein by reference to the Account’s Post-Effective Amendment No. 1 to the Registration Statement on Form S-1, filed with the Commission on May 2, 2005 (File No. 333-121493). |
| |
(6)
| Previously filed and incorporated herein by reference to the Account’s Pre-Effective Amendment No. 1 to the Registration Statement on Form S-1, filed with the Commission on April 29, 2004 (File No. 333-113602). |
| |
(7)
| Previously filed and incorporated by reference to Exhibit 4(C) to the Account’s Quarterly Report on Form 10-Q for the quarter ended September 30, 2010, filed with the Commission on November 12, 2010 (File No. 33-92990). |
| |
(8)
| Previously filed and incorporated herein by reference to Exhibit 10.1 to the Account’s Current Report on Form 8-K, filed with the Commission on February 6, 2015 (File No. 33-92990). |
| |
(9)
| Previously filed and incorporated herein by reference to Exhibit 10(D) to the Account’s Annual Report on Form 10-K for the fiscal year ended December 31, 2012, filed with the Commission on March 14, 2013 (File No. 33-92990). |
| |
(10)
| Previously filed and incorporated herein by reference to Exhibit 4(D)(1) and 4(D)(2) to the Account’s Registration Statement on Form S-1, filed with the Commission on March 21, 2017 (File No. 333-216849). |
| |
(11)
| Previously filed and incorporated herein by reference to Exhibit 4(E)(1) and 4(E)(2) to the Account’s Registration Statement on Form S-1, filed with the Commission on March 21, 2017 (File No. 333-216849). |
| |
(12)
| Previously filed and incorporated herein by reference to Exhibit 4(F)(1) and 4(F)(2) to the Account’s Registration Statement on Form S-1, filed with the Commission on March 21, 2017 (File No. 333-216849). |
SIGNATURES
Pursuant to the requirements of the Securities Exchange Act of 1934, as amended, the registrant, TIAA Real Estate Account, has duly caused this Report to be signed on its behalf by the undersigned, thereunto duly authorized, in New York, New York, on the 7th10thday of November 2017.
| | | | | | | | | | | |
| TIAA REAL ESTATE ACCOUNT |
| | | |
| TIAA REAL ESTATE ACCOUNT |
| By: | | | |
| By: | | TEACHERS INSURANCE AND ANNUITY ASSOCIATION OF AMERICA |
| | | |
November 7, 201710, 2020 | By: | | /s/ Carol W. Deckbar |
| | | Carol W. Deckbar
Executive Vice President, Institutional Investment & Endowment Services
Chief Product Officer of TIAA Financial Solutions, Teachers Insurance and Annuity Association of America
(Principal Executive Officer)
|
| | | |
November 7, 201710, 2020 | By: | | /s/ Virginia M. WilsonAustin P. Wachter |
| | | Virginia M. Wilson
Austin P. Wachter
Senior Executive Vice President, Chief Accounting Officer and Chief Financial Officer, Corporate Controller of Teachers Insurance and Annuity Association of America (Principal (Principal Financial and Accounting Officer)
|