Note 5—6—Investments in Joint Ventures
The Account owns interests in several real estate properties through joint ventures and receives distributions and allocations of profits and losses from the joint ventures based on the Account’s ownership interest in those investments. Several of these joint ventures have mortgage loans payable collateralized by the properties owned by the aforementioned joint ventures. At SeptemberJune 30, 2017,2022, the Account held investments in joint ventures with ownership interest percentages that ranged from 33.3%21.0% to 97.5%98.5%. Certain joint ventures are subject to adjusted distribution percentages when earnings in the investment reach a pre-determinedpredetermined threshold. The fair value of the Account’s equity interest in these joint ventures was $5.7 billion and $5.6 billion at September 30, 2017 and December 31, 2016, respectively.
A condensed summary of the results of operations of the joint ventures are shown below (in millions, unaudited)(millions):
| For the Three Months Ended June 30, 2022 | For the Six Months Ended June 30, | ||||||||||||||||||||||
| 2022 | 2021 | 2022 | 2021 | ||||||||||||||||||||
| Operating Revenue and Expenses | |||||||||||||||||||||||
| Revenues | $ | 288.1 | $ | 249.4 | $558.0 | $501.1 | |||||||||||||||||
| Expenses | 163.6 | 136.1 | 331.0 | 279.1 | |||||||||||||||||||
| Excess of revenues over expenses | $ | 124.5 | $ | 113.3 | $227.0 | $222.0 | |||||||||||||||||
| For the Three Months Ended September 30, | For the Nine Months Ended September 30, | ||||||||||||||
| 2017 | 2016 | 2017 | 2016 | ||||||||||||
| Operating Revenue and Expenses | |||||||||||||||
| Revenues | $ | 218.0 | $ | 190.5 | $ | 645.0 | $ | 509.4 | |||||||
| Expenses | 108.3 | 94.6 | 315.0 | 259.5 | |||||||||||
| Excess of revenues over expenses | $ | 109.7 | $ | 95.9 | $ | 330.0 | $ | 249.9 | |||||||
Note 6—Mortgage 7—Investments in Real Estate Funds
The Account has ownership interests in real estate funds (each a “Fund”, and collectively the “Funds”). The Funds are set up as limited partnerships or entities similar to a limited partnership, and as such, meet the definition of a VIE as the limited partners collectively lack the power, through voting or similar rights, to direct the activities of the Fund that most significantly impact the Fund's economic performance. Management has determined that the Account is not the primary beneficiary for any of the Funds, as the Account lacks the power to direct the activities of each Fund that most significantly impact the respective Fund's economic performance, and the Account further lacks substantive kick-out rights to remove the entity with these powers. Refer to Note 1—Organization and Significant Accounting Policies of the Account's 2021 Form 10-K for a description of the methodology used to determine the primary beneficiary of a VIE.
No financial support (such as loans or financial guarantees) was provided to the Funds during the six months ended June 30, 2022. The Account is contractually obligated to make additional capital contributions in certain Funds in future years. These commitments are included in the maximum exposure to loss presented below.
The carrying amount and maximum exposure to loss relating to unconsolidated VIEs in which the Account holds a variable interest but is not the primary beneficiary were as follows at June 30, 2022 (in millions):
| Fund Name | Carrying Amount | Maximum Exposure to Loss | Liquidity Provisions | Investment Strategy | |||||||||||||||||||
| LCS SHIP Venture I, LLC (90.0% Account Interest) | $ | 223.7 | $ | 223.7 | Redemptions prohibited prior to liquidation. | To invest in senior housing properties. | |||||||||||||||||
| Liquidation estimated to begin no earlier than 2025. | |||||||||||||||||||||||
| The Account is permitted to sell or transfer its interest in the fund, subject to consent and approval of the manager. | |||||||||||||||||||||||
| Veritas - Trophy VI, LLC (90.4% Account Interest) | $ | 81.3 | $ | 99.9 | Redemptions prohibited prior to liquidation. | To invest in multi-family properties primarily in the San Francisco Bay and Los Angeles metropolitan statistical area ("MSA"). | |||||||||||||||||
| The Account is not permitted to sell or transfer its interest in the fund until August 2022. After this date, the Account can sell or transfer its interest in the fund with the consent and approval of the manager. | |||||||||||||||||||||||
17
| Fund Name | Carrying Amount | Maximum Exposure to Loss | Liquidity Provisions | Investment Strategy | |||||||||||||||||||
| SP V - II, LLC (61.8% Account Interest) | $ | 104.6 | $ | 115.0 | Redemptions prohibited prior to liquidation. | To invest in medical office properties in the U.S. | |||||||||||||||||
| Liquidation estimated to begin no earlier than 2022. | |||||||||||||||||||||||
| The Account is permitted to sell or transfer its interest in the fund, subject to consent and approval of the manager. | |||||||||||||||||||||||
| Taconic New York City GP Fund, LP (60.0% Account Interest) | $ | 27.5 | $ | 31.7 | Redemptions prohibited prior to liquidation. | To invest in real estate and real estate-related assets in the New York City MSA. | |||||||||||||||||
| Liquidation estimated to begin no earlier than 2024. | |||||||||||||||||||||||
| The Account is permitted to sell its interest in the fund, subject to consent and approval of the general partner. | |||||||||||||||||||||||
| Silverpeak NRE FundCo LLC (90.0% Account Interest) | $ | 74.3 | $ | 104.0 | Redemptions prohibited prior to liquidation. | To invest in alternative real estate investments primarily in major U.S. metropolitan markets. | |||||||||||||||||
| Liquidation estimated to begin no earlier than 2028. | |||||||||||||||||||||||
| The Account is permitted to sell its interest in the fund to qualified institutional investors, subject to consent and approval of the manager. | |||||||||||||||||||||||
| IDR - Core Property Index Fund, LLC (1.4% Account Interest) | $ | 43.4 | $ | 43.4 | Redemptions are permitted for a full calendar quarter and upon at least 90 days prior written notice, subject to fund availability. | To invest primarily in open-ended funds that fall within the NFI-ODCE Index and are actively managed. | |||||||||||||||||
| The Account is permitted to sell its interest in the fund, subject to consent and approval of the manager. | |||||||||||||||||||||||
| Townsend Group Value-Add Fund (99.0% Account Interest) | $ | 160.5 | $ | 250.2 | Redemptions prohibited prior to liquidation. | To invest in value-add real estate investment opportunities in the U.S. market. | |||||||||||||||||
| Liquidation estimated to begin no earlier than 2027. | |||||||||||||||||||||||
| The Account is prohibited from transferring its interest in the fund without consent by the general partner, which can be withheld in their sole discretion | |||||||||||||||||||||||
| Flagler REA Healthcare Properties Partnership (90.0% Account Interest) | $ | 23.5 | $ | 24.7 | Redemptions prohibited prior to liquidation. | To acquire healthcare properties within the top 50 MSA's in the U.S. | |||||||||||||||||
| Liquidation estimated to begin no earlier than 2025. | |||||||||||||||||||||||
| The Account is permitted to transfer its interest in the fund to a qualified institutional investor, subject to the right first offer by the partner, following the one year anniversary of the fund launch. | |||||||||||||||||||||||
| Grubb Southeast Real Estate Fund VI, LLC (66.7% Account Interest) | $ | 19.1 | $ | 19.1 | Redemptions prohibited prior to liquidation. | To acquire office investments across the Southeast. | |||||||||||||||||
| Liquidation estimated to begin no earlier than 2026. | |||||||||||||||||||||||
| The Account is permitted to sell or transfer its interest in the fund with the consent and approval of the manager. | |||||||||||||||||||||||
| Silverpeak NRE FundCo 2 LLC (90.0% Account Interest) | $ | 81.7 | $ | 113.8 | Redemptions prohibited prior to liquidation. | To invest in value-add real estate investment opportunities in the top 25 major U.S. metropolitan markets. | |||||||||||||||||
| The Account is permitted to sell its interest in the fund to qualified institutional investors, subject to consent and approval of the manager. | |||||||||||||||||||||||
18
| Fund Name | Carrying Amount | Maximum Exposure to Loss | Liquidity Provisions | Investment Strategy | |||||||||||||||||||
| JCR Capital - REA Preferred Equity Parallel Fund (31.1% Account Interest) | $ | 44.2 | $ | 100.3 | Redemptions prohibited prior to liquidation. | To invest primarily in multi-family properties. | |||||||||||||||||
| Liquidation estimated to begin no earlier than 2026. | |||||||||||||||||||||||
| The Account is prohibited from transferring its interest in the fund without consent by the general partner, which can be withheld in their sole discretion | |||||||||||||||||||||||
| Silverpeak NRE FundCo 3 LLC (90.0% Account Interest) | $ | 23.2 | $ | 100.0 | Redemptions prohibited prior to liquidation. | To invest in value-add real estate investment opportunities in the top 25 major U.S. metropolitan markets. | |||||||||||||||||
| The Account is permitted to sell its interest in the fund to qualified institutional investors, subject to consent and approval of the manager. | |||||||||||||||||||||||
| Total | $ | 907.0 | $ | 1,225.8 | |||||||||||||||||||
Note 8—Loans Receivable
The Account’s loan receivable portfolio is primarily comprised of mezzanine loans secured by the borrower’s direct and indirect interests in commercial real estate. Mezzanine loans are subordinate to first mortgages on the underlying real estate collateral. The following property types represent the underlying real estate collateral for the Account's mezzanine loans (in millions):
| June 30, 2022 | December 31, 2021 | |||||||||||||||||||||||||||||||||||||
| Principal Outstanding | Fair Value | % of Fair Value | Principal Outstanding | Fair Value | % of Fair Value | |||||||||||||||||||||||||||||||||
Office(1) | $ | 873.6 | $ | 781.2 | 50.1 | % | $ | 862.4 | $ | 853.4 | 57.2 | % | ||||||||||||||||||||||||||
Apartments(1) | 256.8 | 255.4 | 16.4 | % | 253.3 | 252.0 | 16.9 | % | ||||||||||||||||||||||||||||||
| Industrial | 131.6 | 131.6 | 8.5 | % | 161.4 | 161.3 | 10.8 | % | ||||||||||||||||||||||||||||||
| Hotel | 125.3 | 125.3 | 8.0 | % | 125.3 | 125.3 | 8.4 | % | ||||||||||||||||||||||||||||||
| Retail | 264.6 | 264.6 | 17.0 | % | 101.7 | 100.6 | 6.7 | % | ||||||||||||||||||||||||||||||
| $ | 1,651.9 | $ | 1,558.1 | 100.0 | % | $ | 1,504.1 | $ | 1,492.6 | 100.0 | % | |||||||||||||||||||||||||||
(1) Includes loans receivable with related parties.
The Account monitors the risk profile of the loan receivable portfolio with the assistance of a third-party rating service that models the loans and assigns risk ratings based on inputs such as loan-to-value ratios, yields, credit quality of the borrowers, property types of the collateral, geographic and local market dynamics, physical condition of the collateral, and the underlying structure of the loans. Ratings for loans are updated monthly. Assigned ratings can range from AAA to C, with an AAA designation representing debt with the lowest level of credit risk and C representing a greater risk of default or principal loss. Loans that are more than 90 days past due are classified as delinquent and assigned a D rating. Mezzanine debt in good health is typically reflective of a risk rating in the B range (e.g., BBB, BB, or B), as these ratings reflect borrowers' having adequate financial resources to service their financial commitments, but also acknowledging that adverse economic conditions, should they occur, would likely impede on a borrowers' ability to pay.
All borrowers of loans rated C or higher are current as of June 30, 2022.
19
The following table presents the fair values of the Account's loan portfolio based on the risk ratings as of June 30, 2022 (in millions), listed in order of the strength of the risk rating (from strongest to weakest):
| June 30, 2022 | December 31, 2021 | |||||||||||||||||||||||||||||||||||||
| Number of Loans | Fair Value | % of Fair Value | Number of Loans | Fair Value | % of Fair Value | |||||||||||||||||||||||||||||||||
| AA | — | — | — | % | 1 | 62.6 | 4.2 | % | ||||||||||||||||||||||||||||||
| AA- | 1 | 33.7 | 2.2 | % | — | — | — | % | ||||||||||||||||||||||||||||||
| A | 2 | 192.4 | 12.3 | % | 4 | 248.5 | 16.6 | % | ||||||||||||||||||||||||||||||
| A- | 3 | 104.5 | 6.7 | % | — | — | — | % | ||||||||||||||||||||||||||||||
| BBB+ | 2 | 14.1 | 0.9 | % | — | — | — | % | ||||||||||||||||||||||||||||||
| BBB | 3 | 262.1 | 16.8 | % | 6 | 374.7 | 25.1 | % | ||||||||||||||||||||||||||||||
| BBB- | 1 | 46.3 | 3.0 | % | — | — | — | % | ||||||||||||||||||||||||||||||
| BB+ | 5 | 197.7 | 12.7 | % | — | — | — | % | ||||||||||||||||||||||||||||||
| BB | 4 | 155.3 | 10.0 | % | 10 | 437.8 | 29.3 | % | ||||||||||||||||||||||||||||||
| BB- | 1 | 33.9 | 2.2 | % | — | — | — | % | ||||||||||||||||||||||||||||||
| B+ | 2 | 138.0 | 8.9 | % | — | — | — | % | ||||||||||||||||||||||||||||||
| B | 2 | 56.2 | 3.6 | % | 5 | 144.3 | 9.7 | % | ||||||||||||||||||||||||||||||
| B- | 1 | 30.6 | 2.0 | % | — | — | — | % | ||||||||||||||||||||||||||||||
| C | 3 | 223.4 | 14.3 | % | 2 | 154.8 | 10.4 | % | ||||||||||||||||||||||||||||||
NR(1) | 3 | 69.9 | 4.4 | % | 3 | 69.9 | 4.7 | % | ||||||||||||||||||||||||||||||
| 33 | $ | 1,558.1 | 100.0 | % | 31 | $ | 1,492.6 | 100.0 | % | |||||||||||||||||||||||||||||
(1) "NR" designates loans not assigned an internal credit rating. As of June 30, 2022 and December 31, 2021, this is comprised of 3 loans with related parties. The loans are collateralized by equity interests in real estate investments.
20
Note 9—Loans Payable
At SeptemberJune 30, 2017,2022, the Account had outstanding mortgage loans payable secured by the following propertiesassets (in millions):
| Property | Annual Interest Rate and Payment Frequency(2) | Principal Amounts Outstanding as of | Maturity | |||||||||||||||||||||||
| June 30, 2022 | December 31, 2021 | |||||||||||||||||||||||||
Fusion 1560(5) | 3.42% paid monthly | $ | — | $ | 37.4 | June 10, 2022 | ||||||||||||||||||||
San Diego Office Portfolio(4) | 3.62% paid monthly | 52.3 | 51.4 | August 15, 2022 | ||||||||||||||||||||||
The Colorado(1) | 3.69% paid monthly | 83.7 | 84.7 | November 1, 2022 | ||||||||||||||||||||||
The Legacy at Westwood(1) | 3.69% paid monthly | 42.7 | 43.2 | November 1, 2022 | ||||||||||||||||||||||
Regents Court(1) | 3.69% paid monthly | 36.2 | 36.6 | November 1, 2022 | ||||||||||||||||||||||
1001 Pennsylvania Avenue(1) | 3.70% paid monthly | 304.7 | 308.1 | June 1, 2023 | ||||||||||||||||||||||
| Biltmore at Midtown | 3.94% paid monthly | 36.4 | 36.4 | July 5, 2023 | ||||||||||||||||||||||
| Cherry Knoll | 3.78% paid monthly | 35.3 | 35.3 | July 5, 2023 | ||||||||||||||||||||||
| Lofts at SoDo | 3.94% paid monthly | 35.1 | 35.1 | July 5, 2023 | ||||||||||||||||||||||
| Pacific City | 2.00% + LIBOR paid monthly | 105.0 | 105.0 | October 1, 2023 | ||||||||||||||||||||||
The Stratum(4) | 2.45% paid monthly | 40.0 | 39.8 | May 9, 2024 | ||||||||||||||||||||||
Spring House Innovation Park(4) | 1.25% + LIBOR paid monthly | 45.7 | 40.5 | July 9, 2024 | ||||||||||||||||||||||
| 1401 H Street NW | 3.65% paid monthly | 115.0 | 115.0 | November 5, 2024 | ||||||||||||||||||||||
The District on La Frontera(1) | 3.84% paid monthly | 37.4 | 37.8 | December 1, 2024 | ||||||||||||||||||||||
The District on La Frontera(1) | 4.96% paid monthly | 4.2 | 4.2 | December 1, 2024 | ||||||||||||||||||||||
| Circa Green Lake | 3.71% paid monthly | 52.0 | 52.0 | March 5, 2025 | ||||||||||||||||||||||
| Union - South Lake Union | 3.66% paid monthly | 57.0 | 57.0 | March 5, 2025 | ||||||||||||||||||||||
| Holly Street Village | 3.65% paid monthly | 81.0 | 81.0 | May 1, 2025 | ||||||||||||||||||||||
Henley at Kingstowne(1) | 3.60% paid monthly | 68.4 | 69.1 | May 1, 2025 | ||||||||||||||||||||||
| 32 South State Street | 4.48% paid monthly | 24.0 | 24.0 | June 6, 2025 | ||||||||||||||||||||||
Vista Station Office Portfolio(1) | 4.00% paid monthly | 18.9 | 19.3 | July 1, 2025 | ||||||||||||||||||||||
| 780 Third Avenue | 3.55% paid monthly | 150.0 | 150.0 | August 1, 2025 | ||||||||||||||||||||||
| 780 Third Avenue | 3.55% paid monthly | 20.0 | 20.0 | August 1, 2025 | ||||||||||||||||||||||
Reserve at Chino Hills(4) | 1.50% + LIBOR paid monthly | 70.7 | 68.2 | August 9, 2025 | ||||||||||||||||||||||
Vista Station Office Portfolio(1) | 4.20% paid monthly | 42.4 | 42.9 | November 1, 2025 | ||||||||||||||||||||||
Sixth & Main(4) | 1.87% + LIBOR paid monthly | 40.8 | 40.4 | November 9, 2025 | ||||||||||||||||||||||
701 Brickell Avenue(1) | 3.66% paid monthly | 180.3 | 182.0 | April 1, 2026 | ||||||||||||||||||||||
| Marketplace at Mill Creek | 3.82% paid monthly | 39.6 | 39.6 | September 11, 2027 | ||||||||||||||||||||||
| Overlook At King Of Prussia | 3.82% paid monthly | 40.8 | 40.8 | September 11, 2027 | ||||||||||||||||||||||
| Winslow Bay | 3.82% paid monthly | 25.8 | 25.8 | September 11, 2027 | ||||||||||||||||||||||
1900 K Street, NW(1) | 3.93% paid monthly | 162.5 | 163.0 | April 1, 2028 | ||||||||||||||||||||||
| 99 High Street | 3.90% paid monthly | 277.0 | 277.0 | March 1, 2030 | ||||||||||||||||||||||
| Total Principal Outstanding | $ | 2,324.9 | $ | 2,362.6 | ||||||||||||||||||||||
Fair Value Adjustment(3) | (31.9) | 17.9 | ||||||||||||||||||||||||
| Total Loans Payable | $ | 2,293.0 | $ | 2,380.5 | ||||||||||||||||||||||
(1)The mortgage is adjusted monthly for principal payments.
(2)All interest rates are fixed except for Pacific City, Spring House Innovations Park, Reserve at Chino Hills and Sixth & Main, which have variable interest rates based on a spread above the one month London Interbank Offered Rate, as published by ICE Benchmark Administration Limited. Some mortgages held by the Account are structured to begin principal and interest payments after an initial interest only period.
(3)The fair value adjustment consists of the difference (positive or negative) between the principal amount of the outstanding debt and the fair value of the outstanding debt. See Note 1—Organization and Significant Accounting Policies of the Account's 2021 Form 10-K.
(4)The loan is collateralized by a mezzanine loan receivable. The mezzanine loan receivable is collateralized by the property reflected within the table above.
(5)The principal amount of the outstanding debt was paid off during the first quarter of 2022.
21
| Property | Annual Interest Rate and Payment Frequency(2) | Principal Amounts Outstanding as of | Maturity | |||||||||
| September 30, 2017 | December 31, 2016 | |||||||||||
| (Unaudited) | ||||||||||||
The Legend at Kierland(4) (5) | 4.97% paid monthly | $ | — | $ | 21.8 | August 1, 2017 | ||||||
The Tradition at Kierland(4) (5) | 4.97% paid monthly | — | 25.8 | August 1, 2017 | ||||||||
Mass Court(4) | 2.88% paid monthly | 92.6 | 92.6 | September 1, 2019 | ||||||||
Red Canyon at Palomino Park(4) (6) | 5.34% paid monthly | 27.1 | 27.1 | August 1, 2020 | ||||||||
Green River at Palomino Park(4) (6) | 5.34% paid monthly | 33.2 | 33.2 | August 1, 2020 | ||||||||
Blue Ridge at Palomino Park(4) (6) | 5.34% paid monthly | 33.4 | 33.4 | August 1, 2020 | ||||||||
Ashford Meadows(4) | 5.17% paid monthly | 44.6 | 44.6 | August 1, 2020 | ||||||||
The Knoll(1) (4) | 3.98% paid monthly | 17.6 | — | December 5, 2020 | ||||||||
The Corner(4) | 4.66% paid monthly | 105.0 | 105.0 | June 1, 2021 | ||||||||
The Palatine(1) (4) | 4.25% paid monthly | 79.1 | 80.0 | January 10, 2022 | ||||||||
The Forum at Carlsbad(1) (4) | 4.25% paid monthly | 89.2 | 90.0 | March 1, 2022 | ||||||||
The Colorado(4) | 3.69% paid monthly | 91.7 | 91.7 | November 1, 2022 | ||||||||
The Legacy at Westwood(4) | 3.69% paid monthly | 46.7 | 46.7 | November 1, 2022 | ||||||||
Regents Court(4) | 3.69% paid monthly | 39.6 | 39.6 | November 1, 2022 | ||||||||
The Caruth(4) | 3.69% paid monthly | 45.0 | 45.0 | November 1, 2022 | ||||||||
Fourth & Madison(4) | 3.75% paid monthly | 200.0 | 200.0 | June 1, 2023 | ||||||||
| 1001 Pennsylvania Avenue | 3.70% paid monthly | 330.0 | 330.0 | June 1, 2023 | ||||||||
1401 H Street NW(4) | 3.65% paid monthly | 115.0 | 115.0 | November 5, 2024 | ||||||||
32 South State Street(4) | 4.48% paid monthly | 24.0 | 24.0 | June 6, 2025 | ||||||||
780 Third Avenue(4) | 3.55% paid monthly | 150.0 | 150.0 | August 1, 2025 | ||||||||
780 Third Avenue(4) | 3.55% paid monthly | 20.0 | 20.0 | August 1, 2025 | ||||||||
701 Brickell Avenue(4) | 3.66% paid monthly | 184.0 | 184.0 | April 1, 2026 | ||||||||
55 Second Street(4) (7) | 3.74% paid monthly | 137.5 | 137.5 | October 1, 2026 | ||||||||
| 1900 K Street, NW | 3.93% paid monthly | 163.0 | 163.0 | April 1, 2028 | ||||||||
501 Boylston Street(4) | 3.70% paid monthly | 216.5 | 216.5 | April 1, 2028 | ||||||||
| Total Principal Outstanding | $ | 2,284.8 | $ | 2,316.5 | ||||||||
Fair Value Adjustment(3) | 26.2 | 15.6 | ||||||||||
| Total Mortgage Loans Payable | $ | 2,311.0 | $ | 2,332.1 | ||||||||
Note 10—Line of Credit
The Account has a senior revolving unsecured line of credit with a syndicate of third-party bank lenders, including JPMorgan Chase Bank, N.A. (“Credit Agreement”) with a maximum total commitment of $500.0 million. Draws against the Credit Agreement can take the form of Eurodollar Loans or Alternate Base Rate Loans (“ABR Loans”). Eurodollar Loans and ABR Loans require a minimum funding of $5.0 million.
Eurodollar Loans are issued for a term of twelve months or less and bear interest during the period (“Interest Period”) at a rate equal to the Adjusted London Interbank Offered Rate (“Adjusted LIBOR”) plus a spread (the “Eurodollar Applicable Rate”), with the spread dependent upon the leverage ratio of the Account. Adjusted LIBOR is calculated by multiplying the Statutory Reserve Rate, as determined by the Federal Reserve Board for Eurodollar liabilities, by LIBOR, as determined by the Intercontinental Exchange on the date of issuance that corresponds to the length of the Interest Period. The Account may prepay Eurodollar Loans at any time during the life of the loan without penalty. The Account is limited to 5 active Eurodollar Loans on the Credit Agreement; however, the Account may retire and initiate new Eurodollar Loans without restriction so long as the total number of loans in active status does not exceed the limit.
ABR Loans are issued for a specific length of time and bear interest at a rate equal to the highest rate among the following calculations plus a spread (the "ABR Applicable Rate"), with the spread dependent on the leverage ratio of the Account: (i) the Prime Rate on the date of issuance, with the Prime Rate being defined as the rate of interest last quoted by the Wall Street Journal as the Prime Rate; (ii) the Federal Reserve Bank of New York (“NYFRB”) rate as provided by the NYFRB on the date of issuance plus 0.5%; or (iii) the Adjusted LIBOR rate plus 1.0%. The Account may prepay ABR Loans at any time during the life of the loan without penalty.
As of June 30, 2022, the Account was in compliance with all covenants required by the Credit Agreement.
The following table provides a summary of the key characteristics of the Credit Agreement as of June 30, 2022:
| Current Balance (in millions) | $ | 500.0 | |||||||||||||
| Maximum Capacity (in millions) | $ | 500.0 | |||||||||||||
| Inception Date | September 20, 2018 | ||||||||||||||
| Maturity Date | September 20, 2022 | (1) | |||||||||||||
| Extension Option | Yes | (1) | |||||||||||||
| Eurodollar Applicable Rate Range | 0.85% - 1.05% | ||||||||||||||
| ABR Applicable Rate Range | 0.85% - 1.05% | ||||||||||||||
Unused Fee (2) | 0.20% per annum | ||||||||||||||
(1) On July 16, 2021, the Account exercised its option to extend the commitment terms until September 20, 2022, with 1 consecutive twelve month extension option remaining. The Account may request an additional $250.0 million in commitments from the lenders at any time; however, this request is subject to approval at the sole discretion of the lenders and is not a guarantee that an expansion beyond the original $500.0 million commitment will be granted. | |||||||||||||||
(2) | |||||||||||||||
Note 7—11—Senior Notes Payable
On June 10, 2022, the Account entered into a note purchase agreement with certain qualified institutional investors. Under the note purchase agreement, the Account issued $500.0 million of debt securities, in the form of Series A senior notes and Series B senior notes (the "Notes"). The Account may be obligated to repay the Notes at par, plus accrued and unpaid interest to, but not including, the date of repayment. The Account may also prepay the Notes in whole or in part at any time, or from time to time, at the Account's option at par plus accrued interest to the prepayment date and, if prepaid on or before 90 days prior to the applicable maturity date, a make-whole premium.
As of June 30, 2022, the Account was in compliance with all covenants required by the note purchase agreement.
The following table provides a summary of the key characteristics of the outstanding Notes, as of June 30, 2022:
22
| Principal (in millions) | Interest Rate | Maturity Date | |||||||||||||||
| Series A | $ | 300.0 | 3.24% | June 10, 2029 | |||||||||||||
| Series B | $ | 200.0 | 3.35% | June 10, 2032 | |||||||||||||
Note 12—Financial Highlights
Selected condensed financial information for an Accumulation Unit of the Account is presented below. Per Accumulation Unit data is calculated on average units outstanding.
| For the Six Months Ended June 30, 2022 | Years Ended December 31, | ||||||||||||||||||||||
| 2021 | 2020 | 2019 | |||||||||||||||||||||
| Per Accumulation Unit Data: | |||||||||||||||||||||||
| Rental income | $ | 11.505 | $ | 22.672 | $ | 21.145 | $ | 18.165 | |||||||||||||||
| Real estate property level expenses and taxes | 5.380 | 10.731 | 10.067 | 8.734 | |||||||||||||||||||
| Real estate income, net | 6.125 | 11.941 | 11.078 | 9.431 | |||||||||||||||||||
| Other income | 2.948 | 5.474 | 4.980 | 6.752 | |||||||||||||||||||
| Total income | 9.073 | 17.415 | 16.058 | 16.183 | |||||||||||||||||||
Expense charges(1) | 2.313 | 3.987 | 3.562 | 3.439 | |||||||||||||||||||
| Investment income, net | 6.760 | 13.428 | 12.496 | 12.744 | |||||||||||||||||||
| Net realized and unrealized gain (loss) on investments and debt | 48.948 | 64.615 | (16.196) | 10.262 | |||||||||||||||||||
| Net increase (decrease) in Accumulation Unit Value | 55.708 | 78.043 | (3.700) | 23.006 | |||||||||||||||||||
| Accumulation Unit Value: | |||||||||||||||||||||||
| Beginning of period | 514.765 | 436.722 | 440.422 | 417.416 | |||||||||||||||||||
| End of period | $ | 570.473 | $ | 514.765 | $ | 436.722 | $ | 440.422 | |||||||||||||||
Total return(3) | 10.82 | % | 17.87 | % | (0.84) | % | 5.51 | % | |||||||||||||||
Ratios to Average net assets(2): | |||||||||||||||||||||||
Expenses(1) | 0.84 | % | 0.84 | % | 0.81 | % | 0.78 | % | |||||||||||||||
| Investment income, net | 2.46 | % | 2.82 | % | 2.85 | % | 2.90 | % | |||||||||||||||
Portfolio turnover rate(3): | |||||||||||||||||||||||
Real estate properties(4) | 3.2 | % | 7.6 | % | 7.1 | % | 7.8 | % | |||||||||||||||
Marketable securities(5) | 2.2 | % | — | % | 113.4 | % | 28.7 | % | |||||||||||||||
| Accumulation Units outstanding at end of period (millions) | 54.0 | 53.4 | 52.0 | 60.8 | |||||||||||||||||||
| Net assets end of period (millions) | $ | 31,448.8 | $ | 28,072.0 | $ | 23,243.9 | $ | 27,307.9 | |||||||||||||||
(1)Expense charges per Accumulation Unit and the Ratio of Expenses to average net assets reflect the year-to-date Account level expenses and exclude real estate property level expenses which are included in real estate income, net.
(2)Percentages for the six months ended June 30, 2022 are annualized.
(3)Percentages for the six months ended June 30, 2022 are not annualized.
(4)Real estate investment portfolio turnover rate is calculated by dividing the lesser of purchases or sales of real estate property investments (including contributions to, or return of capital distributions received from, existing real estate joint ventures and fund investments) by the average value of the portfolio of real estate investments held during the period.
(5)Marketable securities portfolio turnover rate is calculated by dividing the lesser of purchases or sales of securities, excluding securities having maturity dates at acquisition of one year or less, by the average value of the portfolio securities held during the period.
23
| For the Nine Months Ended September 30, 2017 | Years Ended December 31, | ||||||||||||||
| 2016 | 2015 | 2014 | |||||||||||||
| (Unaudited) | |||||||||||||||
| Per Accumulation Unit Data: | |||||||||||||||
| Rental income | $ | 12.737 | $ | 16.433 | $ | 15.538 | $ | 15.862 | |||||||
| Real estate property level expenses and taxes | 5.784 | 7.534 | 7.319 | 7.788 | |||||||||||
| Real estate income, net | 6.953 | 8.899 | 8.219 | 8.074 | |||||||||||
| Other income | 3.340 | 3.594 | 3.342 | 3.459 | |||||||||||
| Total income | 10.293 | 12.493 | 11.561 | 11.533 | |||||||||||
Expense charges(1) | 2.476 | 3.290 | 3.092 | 2.880 | |||||||||||
| Investment income, net | 7.817 | 9.203 | 8.469 | 8.653 | |||||||||||
| Net realized and unrealized gain on investments and mortgage loans payable | 3.804 | 9.660 | 18.911 | 27.868 | |||||||||||
| Net increase in Accumulation Unit Value | 11.621 | 18.863 | 27.380 | 36.521 | |||||||||||
| Accumulation Unit Value: | |||||||||||||||
| Beginning of period | 381.636 | 362.773 | 335.393 | 298.872 | |||||||||||
| End of period | $ | 393.257 | $ | 381.636 | $ | 362.773 | $ | 335.393 | |||||||
Total return(3) | 3.04 | % | 5.20 | % | 8.16 | % | 12.22 | % | |||||||
Ratios to Average net assets(2): | |||||||||||||||
Expenses(1) | 0.83 | % | 0.86 | % | 0.86 | % | 0.89 | % | |||||||
| Investment income, net | 2.63 | % | 2.41 | % | 2.37 | % | 2.68 | % | |||||||
Portfolio turnover rate(3): | |||||||||||||||
Real estate properties(4) | 1.6 | % | 1.3 | % | 5.7 | % | 6.5 | % | |||||||
Marketable securities(5) | 5.2 | % | 3.5 | % | 10.0 | % | 15.9 | % | |||||||
| Accumulation Units outstanding at end of period (in millions) | 61.9 | 62.4 | 60.4 | 57.9 | |||||||||||
| Net assets end of period (in millions) | $ | 24,839.8 | $ | 24,304.7 | $ | 22,360.0 | $ | 19,829.0 | |||||||
Note 8—13—Accumulation Units
Changes in the number of Accumulation Units outstanding were as follows (in millions):
| For the Six Months Ended June 30, 2022 | For the Year Ended December 31, 2021 | ||||||||||
| Outstanding: | |||||||||||
| Beginning of period | 53.4 | 52.0 | |||||||||
| Credited for premiums | 3.1 | 6.4 | |||||||||
| Annuity, other periodic payments, withdrawals and death benefits | (2.5) | (5.0) | |||||||||
| End of period | 54.0 | 53.4 | |||||||||
| For the Nine Months Ended September 30, 2017 | For the Year Ended December 31, 2016 | ||||
| (Unaudited) | |||||
| Outstanding: | |||||
| Beginning of period | 62.4 | 60.4 | |||
| Credited for premiums | 5.1 | 8.2 | |||
| Annuity, other periodic payments, withdrawals and death benefits | (5.6 | ) | (6.2 | ) | |
| End of period | 61.9 | 62.4 | |||
Note 9—14—Commitments and Contingencies
Commitments—TheAs of June 30, 2022 and December 31, 2021, the Account had $32.0 million and $39.0 million of outstandingthe following immediately callable commitments to purchase additional interests in its limited partnershipreal estate funds or provide additional funding through its loans receivable investments as of September 30, 2017 and December 31, 2016, respectively.(in millions):
| Commitment Expiration | June 30, 2022 | December 31, 2021 | ||||||||||||||||||
Real Estate Funds(1) | ||||||||||||||||||||
| Veritas Trophy VI, LLC | 08/2022 | $ | 18.6 | $ | 20.6 | |||||||||||||||
| SP V - II, LLC | 09/2022 | 10.4 | 12.9 | |||||||||||||||||
| JCR Capital - REA Preferred Equity Parallel Fund | 12/2022 | 56.1 | 75.3 | |||||||||||||||||
| Silverpeak NRE FundCo 2 LLC | 12/2022 | 32.1 | 43.7 | |||||||||||||||||
| Silverpeak NRE FundCo LLC | 12/2022 | 29.7 | 37.3 | |||||||||||||||||
| Silverpeak NRE FundCo 3 LLC | 6/2023 | 76.8 | — | |||||||||||||||||
| Taconic New York City GP Fund | 11/2023 | 4.2 | 4.2 | |||||||||||||||||
| Flagler - REA Healthcare Properties Partnership | 02/2025 | 1.2 | 1.2 | |||||||||||||||||
| Townsend Group Value-Add Fund | 12/2026 | 89.7 | 125.9 | |||||||||||||||||
| $ | 318.8 | $ | 321.1 | |||||||||||||||||
Loans Receivable(2) | ||||||||||||||||||||
| BREP VIII Industrial Mezzanine | 03/2022 | $ | — | $ | 22.4 | |||||||||||||||
| 311 South Wacker Mezzanine | 08/2022 | 2.2 | 2.2 | |||||||||||||||||
| San Diego Office Portfolio Senior Loan | 08/2022 | 5.9 | 6.8 | |||||||||||||||||
| San Diego Office Portfolio Mezzanine | 08/2022 | 2.0 | 2.2 | |||||||||||||||||
| MRA Hub 34 Holding, LLC | 08/2022 | 1.4 | 1.5 | |||||||||||||||||
| 1330 Broadway Mezzanine | 09/2022 | 10.9 | 10.9 | |||||||||||||||||
| Liberty Park Mezzanine | 11/2022 | 2.6 | 2.6 | |||||||||||||||||
| Colony New England Hotel Portfolio Senior Loan | 11/2022 | 14.1 | 14.1 | |||||||||||||||||
| Colony New England Hotel Portfolio Mezzanine | 11/2022 | 4.7 | 4.7 | |||||||||||||||||
| Exo Apartments Mezzanine | 01/2023 | 2.4 | 2.4 | |||||||||||||||||
| SCG Oakland Portfolio Mezzanine | 03/2023 | 5.4 | 6.1 | |||||||||||||||||
| Five Oak Mezzanine | 03/2023 | 1.6 | 1.6 | |||||||||||||||||
| 5 Points Towers Mezzanine | 03/2024 | 3.7 | 4.2 | |||||||||||||||||
| The Stratum Senior Loan | 05/2024 | 1.7 | 2.0 | |||||||||||||||||
| The Stratum Mezzanine | 05/2024 | 0.6 | 0.7 | |||||||||||||||||
| Spring House Innovation Park Senior Loan | 07/2024 | 31.7 | 38.0 | |||||||||||||||||
| Spring House Innovation Park Mezzanine | 07/2024 | 10.6 | 12.7 | |||||||||||||||||
| Project Sonic Senior Loan | 06/2025 | 3.9 | — | |||||||||||||||||
24
| Commitment Expiration | June 30, 2022 | December 31, 2021 | ||||||||||||||||||
| Project Sonic Mezzanine | 06/2025 | 1.3 | — | |||||||||||||||||
| One Biscayne Tower Senior Loan | 07/2025 | 31.8 | — | |||||||||||||||||
| One Biscayne Tower Mezzanine | 07/2025 | 10.6 | — | |||||||||||||||||
| The Reserve at Chino Hills | 08/2025 | 16.8 | 20.0 | |||||||||||||||||
| Sixth and Main Senior Loan | 11/2025 | 6.5 | 6.9 | |||||||||||||||||
| Sixth and Main Mezzanine | 11/2025 | 3.6 | 3.7 | |||||||||||||||||
| $ | 176.0 | $ | 165.7 | |||||||||||||||||
| TOTAL COMMITMENTS | $ | 494.8 | $ | 486.8 | ||||||||||||||||
(1)Additional capital can be called during the commitment period at any time. The commitment at September 30, 2017 and December 31, 2016period can only be extended by the manager with the consent of the Account. The commitment expiration date is related toreflective of the Taconic New York City GP Fund, LP, in whichmost recent signed agreement between the Account and the fund manager, including any side letter agreements.
(2)Advances from the Account can be requested during the commitment period at any time. The commitment expiration date is reflective of the most recent signed agreement between the Account and the borrower, including any side letter agreements. Certain loans contain extension clauses on the term of the loan that do not require the Account's prior consent. If elected, the Account's commitment may be extended through the extension term.
Contingencies—In the normal course of business, the Account may be named, from time to time, as a defendantor may be involved in various legal actions, including arbitration, class actions and other litigation.
The Account establishes an accrual for all litigation and regulatory matters when it believes it is probable that a loss has entered into an agreementbeen incurred and the amount of the loss can be reasonably estimated. Once established, accruals are adjusted, as appropriate, in light of additional information. The amount of loss ultimately incurred in relation to provide funding. those matters may be higher or lower than the amounts accrued for those matters.
As of September 30, 2017, $13.0 millionthe date of the commitment has been funded. Once the remaining commitment is funded, the Account anticipates holding a 60%-90% interest in the fund.
25
TIAA REAL ESTATE ACCOUNT
CONDENSED CONSOLIDATED SCHEDULES OF INVESTMENTS
(Dollar values shown in an amount not less than 100%millions)
| REAL ESTATE PROPERTIES | ||||||||||||||||||||||||||
| Location/Sector | June 30, 2022 | December 31, 2021 | ||||||||||||||||||||||||
| Fair Value | % of Net Assets | Fair Value | % of Net Assets | |||||||||||||||||||||||
| Alabama | ||||||||||||||||||||||||||
| Retail | 58.9 | 0.2 | % | 61.8 | 0.2 | % | ||||||||||||||||||||
| $ | 58.9 | 0.2 | % | $ | 61.8 | 0.2 | % | |||||||||||||||||||
| Arizona | ||||||||||||||||||||||||||
| Industrial | 52.5 | 0.2 | % | 33.3 | 0.1 | % | ||||||||||||||||||||
| Office | 63.0 | 0.2 | % | 55.0 | 0.2 | % | ||||||||||||||||||||
Other(1) | 4.0 | — | % | — | — | % | ||||||||||||||||||||
| $ | 119.5 | 0.4 | % | $ | 88.3 | 0.3 | % | |||||||||||||||||||
| California | ||||||||||||||||||||||||||
| Apartments | 1,780.7 | 5.7 | % | 1,759.2 | 6.3 | % | ||||||||||||||||||||
| Industrial | 3,890.8 | 12.4 | % | 2,939.8 | 10.5 | % | ||||||||||||||||||||
| Office | 704.7 | 2.2 | % | 771.1 | 2.7 | % | ||||||||||||||||||||
| Retail | 443.2 | 1.4 | % | 507.1 | 1.8 | % | ||||||||||||||||||||
| $ | 6,819.4 | 21.7 | % | $ | 5,977.2 | 21.3 | % | |||||||||||||||||||
| Colorado | ||||||||||||||||||||||||||
| Office | 110.0 | 0.3 | % | 108.0 | 0.4 | % | ||||||||||||||||||||
| Retail | — | — | % | 69.5 | 0.2 | % | ||||||||||||||||||||
| $ | 110.0 | 0.3 | % | $ | 177.5 | 0.6 | % | |||||||||||||||||||
| Connecticut | ||||||||||||||||||||||||||
| Office | 72.2 | 0.2 | % | 73.7 | 0.3 | % | ||||||||||||||||||||
| $ | 72.2 | 0.2 | % | $ | 73.7 | 0.3 | % | |||||||||||||||||||
| Florida | ||||||||||||||||||||||||||
| Apartments | 1,283.2 | 4.1 | % | 1,074.5 | 3.8 | % | ||||||||||||||||||||
| Industrial | 673.6 | 2.1 | % | 452.5 | 1.6 | % | ||||||||||||||||||||
| Office | 504.6 | 1.6 | % | 490.3 | 1.8 | % | ||||||||||||||||||||
| Retail | 160.2 | 0.5 | % | 153.4 | 0.5 | % | ||||||||||||||||||||
Other(1) | — | — | % | 55.2 | 0.2 | % | ||||||||||||||||||||
| $ | 2,621.6 | 8.3 | % | $ | 2,225.9 | 7.9 | % | |||||||||||||||||||
| Georgia | ||||||||||||||||||||||||||
| Apartments | 447.8 | 1.4 | % | 393.1 | 1.4 | % | ||||||||||||||||||||
| Industrial | 251.7 | 0.8 | % | 193.0 | 0.7 | % | ||||||||||||||||||||
| Retail | 270.9 | 0.9 | % | 242.8 | 0.9 | % | ||||||||||||||||||||
| $ | 970.4 | 3.1 | % | $ | 828.9 | 3.0 | % | |||||||||||||||||||
| Illinois | ||||||||||||||||||||||||||
| Apartments | 126.1 | 0.4 | % | 120.0 | 0.4 | % | ||||||||||||||||||||
| Industrial | 175.6 | 0.6 | % | 149.6 | 0.5 | % | ||||||||||||||||||||
| Retail | 203.1 | 0.6 | % | 196.7 | 0.7 | % | ||||||||||||||||||||
Other(1) | 5.6 | — | % | — | — | % | ||||||||||||||||||||
| $ | 510.4 | 1.6 | % | $ | 466.3 | 1.6 | % | |||||||||||||||||||
| Indiana | ||||||||||||||||||||||||||
| Industrial | 120.0 | 0.4 | % | 115.0 | 0.4 | % | ||||||||||||||||||||
| $ | 120.0 | 0.4 | % | $ | 115.0 | 0.4 | % | |||||||||||||||||||
| Maryland | ||||||||||||||||||||||||||
| Apartments | 93.1 | 0.3 | % | 73.1 | 0.3 | % | ||||||||||||||||||||
| Industrial | 69.3 | 0.2 | % | 67.7 | 0.2 | % | ||||||||||||||||||||
26
TIAA REAL ESTATE ACCOUNT
CONDENSED CONSOLIDATED SCHEDULES OF INVESTMENTS
(Dollar values shown in millions)
| REAL ESTATE PROPERTIES | ||||||||||||||||||||||||||
| Location/Sector | June 30, 2022 | December 31, 2021 | ||||||||||||||||||||||||
| Fair Value | % of Net Assets | Fair Value | % of Net Assets | |||||||||||||||||||||||
| Retail | 77.8 | 0.3 | % | 73.5 | 0.3 | % | ||||||||||||||||||||
| $ | 240.2 | 0.8 | % | $ | 214.3 | 0.8 | % | |||||||||||||||||||
| Massachusetts | ||||||||||||||||||||||||||
| Apartments | 59.7 | 0.2 | % | — | — | % | ||||||||||||||||||||
| Industrial | 159.4 | 0.5 | % | 127.0 | 0.5 | % | ||||||||||||||||||||
| Office | 736.0 | 2.3 | % | 736.7 | 2.6 | % | ||||||||||||||||||||
| Retail | 128.1 | 0.4 | % | 125.0 | 0.4 | % | ||||||||||||||||||||
| $ | 1,083.2 | 3.4 | % | $ | 988.7 | 3.5 | % | |||||||||||||||||||
| Minnesota | ||||||||||||||||||||||||||
| Apartments | 109.7 | 0.4 | % | 107.9 | 0.4 | % | ||||||||||||||||||||
| Industrial | 161.3 | 0.5 | % | — | — | % | ||||||||||||||||||||
| $ | 271.0 | 0.9 | % | $ | 107.9 | 0.4 | % | |||||||||||||||||||
| New Jersey | ||||||||||||||||||||||||||
| Industrial | 413.1 | 1.3 | % | 306.4 | 1.1 | % | ||||||||||||||||||||
| Retail | 92.3 | 0.3 | % | 96.1 | 0.3 | % | ||||||||||||||||||||
| $ | 505.4 | 1.6 | % | $ | 402.5 | 1.4 | % | |||||||||||||||||||
| New York | ||||||||||||||||||||||||||
| Apartments | 266.2 | 0.8 | % | 260.2 | 0.9 | % | ||||||||||||||||||||
| Office | 900.4 | 2.9 | % | 890.0 | 3.2 | % | ||||||||||||||||||||
| $ | 1,166.6 | 3.7 | % | $ | 1,150.2 | 4.1 | % | |||||||||||||||||||
| North Carolina | ||||||||||||||||||||||||||
| Apartments | 80.9 | 0.3 | % | 79.4 | 0.3 | % | ||||||||||||||||||||
| Retail | 92.1 | 0.3 | % | 89.4 | 0.3 | % | ||||||||||||||||||||
| $ | 173.0 | 0.6 | % | $ | 168.8 | 0.6 | % | |||||||||||||||||||
| Oregon | ||||||||||||||||||||||||||
| Apartments | 43.7 | 0.1 | % | 38.9 | 0.1 | % | ||||||||||||||||||||
| $ | 43.7 | 0.1 | % | $ | 38.9 | 0.1 | % | |||||||||||||||||||
| Pennsylvania | ||||||||||||||||||||||||||
| Retail | 71.8 | 0.2 | % | 70.8 | 0.3 | % | ||||||||||||||||||||
| $ | 71.8 | 0.2 | % | $ | 70.8 | 0.3 | % | |||||||||||||||||||
| Rhode Island | ||||||||||||||||||||||||||
| Retail | — | — | % | 12.5 | — | % | ||||||||||||||||||||
| $ | — | — | % | $ | 12.5 | — | % | |||||||||||||||||||
| South Carolina | ||||||||||||||||||||||||||
| Apartments | 92.0 | 0.3 | % | 89.2 | 0.3 | % | ||||||||||||||||||||
| Retail | 50.3 | 0.2 | % | 48.2 | 0.2 | % | ||||||||||||||||||||
| $ | 142.3 | 0.5 | % | $ | 137.4 | 0.5 | % | |||||||||||||||||||
| Tennessee | ||||||||||||||||||||||||||
| Apartments | 44.1 | 0.1 | % | — | — | % | ||||||||||||||||||||
| Industrial | 76.0 | 0.2 | % | 70.8 | 0.3 | % | ||||||||||||||||||||
| Retail | 146.9 | 0.5 | % | 132.3 | 0.5 | % | ||||||||||||||||||||
| $ | 267.0 | 0.8 | % | $ | 203.1 | 0.8 | % | |||||||||||||||||||
| Texas | ||||||||||||||||||||||||||
| Apartments | 706.5 | 2.2 | % | 622.7 | 2.2 | % | ||||||||||||||||||||
| Industrial | 967.8 | 3.1 | % | 733.0 | 2.6 | % | ||||||||||||||||||||
| Office | 623.6 | 2.0 | % | 583.1 | 2.1 | % | ||||||||||||||||||||
Other(1) | 100.0 | 0.3 | % | 98.1 | 0.4 | % | ||||||||||||||||||||
27
TIAA REAL ESTATE ACCOUNT
CONDENSED CONSOLIDATED SCHEDULES OF INVESTMENTS
(Dollar values shown in millions)
| REAL ESTATE PROPERTIES | ||||||||||||||||||||||||||
| Location/Sector | June 30, 2022 | December 31, 2021 | ||||||||||||||||||||||||
| Fair Value | % of Net Assets | Fair Value | % of Net Assets | |||||||||||||||||||||||
| $ | 2,397.9 | 7.6 | % | $ | 2,036.9 | 7.3 | % | |||||||||||||||||||
| Utah | ||||||||||||||||||||||||||
| Office | 125.4 | 0.4 | % | 124.5 | 0.4 | % | ||||||||||||||||||||
| $ | 125.4 | 0.4 | % | $ | 124.5 | 0.4 | % | |||||||||||||||||||
| Virginia | ||||||||||||||||||||||||||
| Apartments | 425.7 | 1.4 | % | 392.6 | 1.4 | % | ||||||||||||||||||||
| Office | 119.2 | 0.4 | % | 122.5 | 0.4 | % | ||||||||||||||||||||
| Retail | 163.9 | 0.5 | % | 154.7 | 0.6 | % | ||||||||||||||||||||
| $ | 708.8 | 2.3 | % | $ | 669.8 | 2.4 | % | |||||||||||||||||||
| Washington | ||||||||||||||||||||||||||
| Apartments | 347.0 | 1.1 | % | 330.5 | 1.2 | % | ||||||||||||||||||||
| Industrial | 615.8 | 2.0 | % | 509.2 | 1.8 | % | ||||||||||||||||||||
| $ | 962.8 | 3.1 | % | $ | 839.7 | 3.0 | % | |||||||||||||||||||
| Washington D.C. | ||||||||||||||||||||||||||
| Apartments | 358.7 | 1.1 | % | 347.6 | 1.2 | % | ||||||||||||||||||||
| Office | 1,368.4 | 4.4 | % | 1,375.7 | 4.9 | % | ||||||||||||||||||||
| $ | 1,727.1 | 5.5 | % | $ | 1,723.3 | 6.1 | % | |||||||||||||||||||
| TOTAL REAL ESTATE PROPERTIES | ||||||||||||||||||||||||||
| (Cost: $14,395.8 and $14,163.2) | $ | 21,288.6 | 67.7 | % | $ | 18,903.9 | 67.3 | % | ||||||||||||||||||
| REAL ESTATE JOINT VENTURES | ||||||||||||||||||||||||||
| Location/Sector | June 30, 2022 | December 31, 2021 | ||||||||||||||||||||||||
| Fair Value | % of Net Assets | Fair Value | % of Net Assets | |||||||||||||||||||||||
| California | ||||||||||||||||||||||||||
| Office | 1,492.6 | 4.7 | % | 1,582.9 | 5.6 | % | ||||||||||||||||||||
| Retail | 53.6 | 0.2 | % | 92.4 | 0.3 | % | ||||||||||||||||||||
| Industrial | 69.0 | 0.2 | % | 59.0 | 0.2 | % | ||||||||||||||||||||
| $ | 1,615.2 | 5.1 | % | $ | 1,734.3 | 6.1 | % | |||||||||||||||||||
| Florida | ||||||||||||||||||||||||||
| Retail | 659.5 | 2.1 | % | 826.8 | 3.0 | % | ||||||||||||||||||||
| $ | 659.5 | 2.1 | % | $ | 826.8 | 3.0 | % | |||||||||||||||||||
| Maryland | ||||||||||||||||||||||||||
| Retail | 17.5 | 0.1 | % | 15.7 | 0.1 | % | ||||||||||||||||||||
Other(1) | 9.7 | — | % | 6.5 | — | % | ||||||||||||||||||||
| $ | 27.2 | 0.1 | % | $ | 22.2 | 0.1 | % | |||||||||||||||||||
| Massachusetts | ||||||||||||||||||||||||||
| Office | 470.0 | 1.5 | % | 458.0 | 1.6 | % | ||||||||||||||||||||
| $ | 470.0 | 1.5 | % | $ | 458.0 | 1.6 | % | |||||||||||||||||||
| Nevada | ||||||||||||||||||||||||||
| Retail | 580.1 | 1.9 | % | 557.8 | 2.0 | % | ||||||||||||||||||||
| $ | 580.1 | 1.9 | % | $ | 557.8 | 2.0 | % | |||||||||||||||||||
| New York | ||||||||||||||||||||||||||
| Apartments | 50.3 | 0.2 | % | 114.7 | 0.4 | % | ||||||||||||||||||||
| Industrial | 84.3 | 0.3 | % | 82.3 | 0.3 | % | ||||||||||||||||||||
| Office | 192.2 | 0.6 | % | 148.3 | 0.5 | % | ||||||||||||||||||||
| Retail | 34.0 | 0.1 | % | 31.2 | 0.1 | % | ||||||||||||||||||||
| $ | 360.8 | 1.2 | % | $ | 376.5 | 1.3 | % | |||||||||||||||||||
28
TIAA REAL ESTATE ACCOUNT
CONDENSED CONSOLIDATED SCHEDULES OF INVESTMENTS
(Dollar values shown in millions)
| REAL ESTATE JOINT VENTURES | ||||||||||||||||||||||||||
| Location/Sector | June 30, 2022 | December 31, 2021 | ||||||||||||||||||||||||
| Fair Value | % of Net Assets | Fair Value | % of Net Assets | |||||||||||||||||||||||
| North Carolina | ||||||||||||||||||||||||||
| Office | 63.6 | 0.2 | % | 47.4 | 0.2 | % | ||||||||||||||||||||
| Retail | 139.6 | 0.5 | % | 127.7 | 0.5 | % | ||||||||||||||||||||
Other(1) | 30.0 | 0.1 | % | — | — | % | ||||||||||||||||||||
| $ | 233.2 | 0.8 | % | $ | 175.1 | 0.7 | % | |||||||||||||||||||
| Phoenix | ||||||||||||||||||||||||||
Other(1) | 9.9 | — | % | — | — | % | ||||||||||||||||||||
| $ | 9.9 | — | % | $ | — | — | % | |||||||||||||||||||
| South Carolina | ||||||||||||||||||||||||||
| Apartments | 59.0 | 0.2 | % | 58.7 | 0.2 | % | ||||||||||||||||||||
| $ | 59.0 | 0.2 | % | $ | 58.7 | 0.2 | % | |||||||||||||||||||
| Summerville | ||||||||||||||||||||||||||
Other(1) | 6.7 | — | % | — | — | % | ||||||||||||||||||||
| $ | 6.7 | — | % | $ | — | — | % | |||||||||||||||||||
| Tennessee | ||||||||||||||||||||||||||
| Retail | 222.7 | 0.7 | % | 116.6 | 0.5 | % | ||||||||||||||||||||
| $ | 222.7 | 0.7 | % | $ | 116.6 | 0.5 | % | |||||||||||||||||||
| Texas | ||||||||||||||||||||||||||
| Industrial | 52.9 | 0.2 | % | 50.6 | 0.2 | % | ||||||||||||||||||||
| Office | 357.6 | 1.1 | % | 347.4 | 1.2 | % | ||||||||||||||||||||
Other(1) | 8.3 | — | % | — | — | % | ||||||||||||||||||||
| $ | 418.8 | 1.3 | % | $ | 398.0 | 1.4 | % | |||||||||||||||||||
| Washington | ||||||||||||||||||||||||||
| Office | 162.2 | 0.5 | % | 164.3 | 0.6 | % | ||||||||||||||||||||
| $ | 162.2 | 0.5 | % | $ | 164.3 | 0.6 | % | |||||||||||||||||||
Various(2) | ||||||||||||||||||||||||||
| Apartments | 1,107.4 | 3.5 | % | 938.6 | 3.3 | % | ||||||||||||||||||||
| Office | 484.1 | 1.5 | % | 406.4 | 1.5 | % | ||||||||||||||||||||
Other(1) | 1,187.1 | 3.8 | % | 902.7 | 3.2 | % | ||||||||||||||||||||
| $ | 2,778.6 | 8.8 | % | $ | 2,247.7 | 8.0 | % | |||||||||||||||||||
| Foreign | ||||||||||||||||||||||||||
Other(3) | 39.0 | 0.1 | % | 39.9 | 0.1 | % | ||||||||||||||||||||
| $ | 39.0 | 0.1 | % | $ | 39.9 | 0.1 | % | |||||||||||||||||||
| TOTAL REAL ESTATE JOINT VENTURES | ||||||||||||||||||||||||||
| (Cost: $5,648.1 and $5,497.9) | $ | 7,642.9 | 24.3 | % | $ | 7,175.9 | 25.6 | % | ||||||||||||||||||
(1)Represents investments outside of the market value of loaned securities duringAccount's core sectors such as storage portfolios, hotels and land.
(2)Properties within these investments are located throughout the periodUnited States.
(3)Property is located outside of the loan; any additional collateral required due to changes in security values is delivered to the Account the next business day. Cash collateral received by the Account is invested exclusively in an interest-bearing deposit account. The value of the loaned securities and the liability to return the cash collateral received are reflected in the consolidated statements of assets and liabilities. United States.
29
TIAA REAL ESTATE PROPERTIES—57.6% and 58.0%ACCOUNT
CONDENSED CONSOLIDATED SCHEDULES OF INVESTMENTS
(Dollar values shown in millions)
| MARKETABLE SECURITIES | ||||||||||||||||||||||||||
| June 30, 2022 | December 31, 2021 | |||||||||||||||||||||||||
| Fair Value | % of Net Assets | Fair Value | % of Net Assets | |||||||||||||||||||||||
| Corporate bonds | 580.4 | 1.8 | % | 551.8 | 2.0 | % | ||||||||||||||||||||
| U.S. government agency notes | 1,505.0 | 4.8 | % | 864.1 | 3.1 | % | ||||||||||||||||||||
| Foreign government agency notes | 17.0 | 0.1 | % | 7.6 | — | % | ||||||||||||||||||||
| U.S. treasury securities | 621.6 | 2.0 | % | 784.3 | 2.8 | % | ||||||||||||||||||||
| TOTAL MARKETABLE SECURITIES | ||||||||||||||||||||||||||
| (Cost: $2,771.7 and $2,217.0) | $ | 2,724.0 | 8.7 | % | $ | 2,207.8 | 7.9 | % | ||||||||||||||||||
| TOTAL REAL ESTATE FUNDS | ||||||||||||||||||||||||||
| (Cost: $781.5 and $692.9) | $ | 907.0 | 2.9 | % | $ | 811.5 | 2.9 | % | ||||||||||||||||||
| TOTAL REAL ESTATE OPERATING BUSINESS | ||||||||||||||||||||||||||
| (Cost: $352.5 and $251.6) | $ | 628.0 | 2.0 | % | $ | 326.3 | 1.2 | % | ||||||||||||||||||
| TOTAL LOANS RECEIVABLE | ||||||||||||||||||||||||||
| (Cost: ($1,582.0 and $1,434.3) | $ | 1,488.2 | 4.7 | % | $ | 1,422.7 | 5.1 | % | ||||||||||||||||||
| TOTAL LOANS RECEIVABLE WITH RELATED PARTIES | ||||||||||||||||||||||||||
| (Cost: $69.9 and $69.8) | $ | 69.9 | 0.2 | % | $ | 69.9 | 0.2 | % | ||||||||||||||||||
| TOTAL INVESTMENTS | ||||||||||||||||||||||||||
| (Cost: $25,601.5 and $24,326.7) | $ | 34,748.6 | 110.5 | % | $ | 30,918.0 | 110.2 | % | ||||||||||||||||||
30
| Location/Description | Type | Fair Value at | ||||||||||
| September 30, 2017 | December 31, 2016 | |||||||||||
| (Unaudited) | ||||||||||||
| Arizona: | ||||||||||||
| Camelback Center | Office | $ | 58.4 | $ | 56.4 | |||||||
| Kierland Apartment Portfolio | Apartments | 147.7 | 127.9 | (1) | ||||||||
| California: | ||||||||||||
| 55 Second Street | Office | 353.1 | (1) | 335.0 | (1) | |||||||
| 88 Kearny Street | Office | 177.6 | 172.3 | |||||||||
| 200 Middlefield Road | Office | 61.2 | 60.5 | |||||||||
| BLVD63 | Apartments | 162.0 | 157.0 | |||||||||
| Castro Station | Office | 163.0 | 158.2 | |||||||||
| Centre Pointe and Valley View | Industrial | 43.9 | 42.8 | |||||||||
| Cerritos Industrial Park | Industrial | 140.0 | 126.3 | |||||||||
| Charleston Plaza | Retail | 93.0 | 92.0 | |||||||||
| Great West Industrial Portfolio | Industrial | 160.9 | 166.1 | |||||||||
| Holly Street Village | Apartments | 148.0 | 146.0 | |||||||||
| Larkspur Courts | Apartments | 141.4 | 140.5 | |||||||||
| Northern CA RA Industrial Portfolio | Industrial | 87.0 | 76.7 | |||||||||
| Oakmont IE West Portfolio | Industrial | 87.2 | 82.7 | |||||||||
| Oceano at Warner Center | Apartments | 89.0 | 88.3 | |||||||||
| Ontario Industrial Portfolio | Industrial | 397.4 | (11) | 438.0 | ||||||||
| Ontario Mills Industrial Portfolio | Industrial | 55.9 | 52.0 | |||||||||
| Pacific Plaza | Office | 115.2 | 115.0 | |||||||||
| Rancho Cucamonga Industrial Portfolio | Industrial | 70.9 | (11) | 174.2 | ||||||||
| Regents Court | Apartments | 95.4 | (1) | 89.9 | (1) | |||||||
| Southern CA RA Industrial Portfolio | Industrial | 136.2 | 135.0 | |||||||||
| Stella | Apartments | 178.9 | 173.1 | |||||||||
| Stevenson Point | Industrial | 49.9 | 49.3 | |||||||||
| The Forum at Carlsbad | Retail | 220.0 | (1) | 221.5 | (1) | |||||||
| The Legacy at Westwood | Apartments | 143.0 | (1) | 142.1 | (1) | |||||||
| Township Apartments | Apartments | 89.8 | 89.6 | |||||||||
| West Lake North Business Park | Office | 60.4 | 60.0 | |||||||||
| Westcreek | Apartments | 51.1 | 48.2 | |||||||||
| Westwood Marketplace | Retail | 131.8 | 125.0 | |||||||||
| Wilshire Rodeo Plaza | Office | 326.7 | 320.7 | |||||||||
| Colorado: | ||||||||||||
| Palomino Park | Apartments | 327.9 | (1) | 314.1 | (1) | |||||||
| South Denver Marketplace | Retail | 72.7 | 73.0 | |||||||||
| Connecticut: | ||||||||||||
| Wilton Woods Corporate Campus | Office | 134.0 | 141.9 | |||||||||
| Florida: | ||||||||||||
| 701 Brickell Avenue | Office | 362.6 | (1) | 380.7 | (1) | |||||||
| Broward Industrial Portfolio | Industrial | 54.1 | — | |||||||||
| Casa Palma | Apartments | 95.0 | 97.0 | |||||||||
| Orion on Orpington | Apartments | 42.1 | — | |||||||||
| Publix at Weston Commons | Retail | 74.1 | 73.0 | |||||||||
| Seneca Industrial Park | Industrial | 106.4 | 102.7 | |||||||||
| South Florida Apartment Portfolio | Apartments | 105.0 | 104.1 | |||||||||
| Location/Description | Type | Fair Value at | ||||||||||
| September 30, 2017 | December 31, 2016 | |||||||||||
| (Unaudited) | ||||||||||||
| The Manor Apartments | Apartments | 52.8 | 53.6 | |||||||||
| The Manor at Flagler Village | Apartments | 148.0 | 150.8 | |||||||||
| The Residences at the Village of Merrick Park | Apartments | 75.0 | 74.1 | |||||||||
| Urban Centre | Office | 138.8 | 121.4 | |||||||||
| Weston Business Center | Industrial | 92.8 | 92.7 | |||||||||
| Georgia: | ||||||||||||
| Atlanta Industrial Portfolio | Industrial | 31.6 | (6) | 62.8 | ||||||||
| Shawnee Ridge Industrial Portfolio | Industrial | 89.6 | 86.7 | |||||||||
| Illinois: | ||||||||||||
| 32 South State Street | Retail | 47.7 | (1) | 46.5 | (1) | |||||||
| 803 Corday | Apartments | 92.5 | — | |||||||||
| Chicago Caleast Industrial Portfolio | Industrial | 80.3 | 81.8 | |||||||||
| Chicago Industrial Portfolio | Industrial | 96.6 | 85.5 | |||||||||
| Maryland: | ||||||||||||
| Landover Logistics Center | Industrial | 43.1 | 39.8 | |||||||||
| The Shops at Wisconsin Place | Retail | 91.0 | 92.8 | |||||||||
| Massachusetts: | ||||||||||||
| 99 High Street | Office | 504.0 | 514.1 | |||||||||
| 501 Boylston Street | Office | 506.3 | (1) | 490.3 | (1) | |||||||
| Fort Point Creative Exchange Portfolio | Office | 217.9 | 223.0 | |||||||||
| Northeast RA Industrial Portfolio | Industrial | 40.2 | 41.3 | |||||||||
| One Beeman Road | Industrial | 33.7 | — | |||||||||
| Minnesota: | ||||||||||||
| The Bridges | Apartments | 62.1 | — | |||||||||
| The Knoll | Apartments | 33.3 | (1) | — | ||||||||
| New Jersey: | ||||||||||||
| 200 Milik Street | Industrial | 52.1 | 51.2 | |||||||||
| Marketfair | Retail | 105.0 | 104.2 | |||||||||
| Amazon Distribution Center | Industrial | 110.0 | 101.0 | |||||||||
| South River Road Industrial | Industrial | 87.2 | 71.9 | |||||||||
| New York: | ||||||||||||
| 21 Penn Plaza | Office | 266.3 | 275.2 | |||||||||
| 250 North 10th Street | Apartments | 166.0 | 162.0 | |||||||||
| 425 Park Avenue | Ground Lease | 454.0 | 450.0 | |||||||||
| 430 West 15th Street | Office | 140.5 | 116.1 | |||||||||
| 780 Third Avenue | Office | 429.0 | (1) | 425.0 | (1) | |||||||
| 837 Washington Street | Office | 209.0 | 215.0 | |||||||||
| The Colorado | Apartments | 256.0 | (1) | 258.1 | (1) | |||||||
| The Corner | Apartments | 253.1 | (1) | 250.0 | (1) | |||||||
| Oregon: | ||||||||||||
| The Cordelia | Apartments | 49.0 | 50.0 | |||||||||
| Pennsylvania: | ||||||||||||
| 1619 Walnut Street | Retail | 23.4 | 23.4 | |||||||||
| The Pepper Building | Apartments | — | 52.9 | |||||||||
| South Carolina: | ||||||||||||
| Greene Crossing | Apartments | 65.8 | 65.8 | |||||||||
| Tennessee: | ||||||||||||
| Southside at McEwen | Retail | 48.2 | 48.8 | |||||||||
| Location/Description | Type | Fair Value at | ||||||||||
| September 30, 2017 | December 31, 2016 | |||||||||||
| (Unaudited) | ||||||||||||
| Texas: | ||||||||||||
| Beltway North Commerce Center | Industrial | 19.2 | 19.5 | |||||||||
| Cliffs at Barton Creek | Apartments | 45.7 | 45.8 | |||||||||
| Dallas Industrial Portfolio | Industrial | 210.5 | 201.3 | |||||||||
| Houston Apartment Portfolio | Apartments | 159.3 | 159.3 | |||||||||
| Lincoln Centre | Office | 353.0 | 347.0 | |||||||||
| Northwest Houston Industrial Portfolio | Industrial | 70.0 | 68.2 | |||||||||
| Park 10 Distribution | Industrial | 10.3 | 11.3 | |||||||||
| Pinnacle Industrial Portfolio | Industrial | 53.4 | 52.8 | |||||||||
| Pinto Business Park | Industrial | 130.8 | 134.2 | |||||||||
| The Caruth | Apartments | 82.7 | (1) | 84.3 | (1) | |||||||
| The Maroneal | Apartments | 54.5 | 52.1 | |||||||||
| Virginia: | ||||||||||||
| 8270 Greensboro Drive | Office | 47.3 | 47.6 | |||||||||
| Ashford Meadows Apartments | Apartments | 106.6 | (1) | 107.2 | (1) | |||||||
| Plaza America | Retail | 115.0 | 109.0 | |||||||||
| The Ellipse at Ballston | Office | 84.4 | 79.8 | |||||||||
| The Palatine | Apartments | 121.1 | (1) | 130.9 | (1) | |||||||
| Washington: | ||||||||||||
| Circa Green Lake | Apartments | 94.4 | 92.5 | |||||||||
| Fourth and Madison | Office | 527.0 | (1) | 521.0 | (1) | |||||||
| Millennium Corporate Park | Office | 182.1 | 190.1 | |||||||||
| Northwest RA Industrial Portfolio | Industrial | 38.2 | 31.7 | |||||||||
| Pacific Corporate Park | Industrial | 44.5 | 42.0 | |||||||||
| Prescott Wallingford Apartments | Apartments | 62.0 | 58.8 | |||||||||
| Rainier Corporate Park | Industrial | 114.7 | 104.0 | |||||||||
| Regal Logistics Campus | Industrial | 97.8 | 83.1 | |||||||||
| Union - South Lake Union | Apartments | 109.1 | 105.3 | |||||||||
| Washington DC: | ||||||||||||
| 1001 Pennsylvania Avenue | Office | 810.0 | (1) | 810.0 | (1) | |||||||
| 1401 H Street, NW | Office | 203.1 | (1) | 230.0 | (1) | |||||||
| 1900 K Street, NW | Office | 330.2 | (1) | 335.0 | (1) | |||||||
| Mass Court | Apartments | 171.0 | (1) | 169.0 | (1) | |||||||
| Mazza Gallerie | Retail | — | 78.0 | |||||||||
| The Ashton | Apartments | 38.5 | 39.2 | |||||||||
| The Louis at 14th | Apartments | 175.0 | 183.2 | |||||||||
| The Woodley | Apartments | 191.0 | 203.0 | |||||||||
| TOTAL REAL ESTATE PROPERTIES | ||||||||||||
| (Cost $12,944.7 and $12,818.1) | $ | 15,654.2 | $ | 15,452.8 | ||||||||
| Location/Description | Type | Fair Value at | ||||||||||
| September 30, 2017 | December 31, 2016 | |||||||||||
| (Unaudited) | ||||||||||||
| California: | ||||||||||||
CA—Colorado Center LP Colorado Center (50% Account Interest) | Office | $ | 355.1 | (2) | $ | 567.8 | ||||||
PC Borrower, LLC Pacific City (70% Account Interest) | Retail | 133.8 | 128.5 | |||||||||
| TREA Campus Pointe 1, LLC Campus Pointe 1 (45% Account Interest) | Office | 139.4 | 137.5 | |||||||||
| TREA Campus Pointe 2, LLC Campus Pointe 2 (43.16% Account Interest) | Office | 104.2 | 85.7 | |||||||||
T-C 1500 Owens, LLC 1500 Owens Street (49.9% Account Interest) | Office | 77.0 | 74.8 | |||||||||
T-C Foundry Square II Venture LLC Foundry Square II (50.1% Account Interest) | Office | 257.4 | 200.1 | (2) | ||||||||
T-C Illinois Street, LLC 409-499 Illinois Street (40% Account Interest) | Office | 206.3 | 196.8 | |||||||||
Valencia Town Center Associates LP Valencia Town Center (50% Account Interest) | Retail | 137.5 | (2) | 128.0 | (2) | |||||||
| Florida: | ||||||||||||
Florida Mall Associates, Ltd The Florida Mall (50% Account Interest) | Retail | 754.8 | (2) | 755.8 | (2) | |||||||
TREA Florida Retail, LLC Florida Retail Portfolio (80% Account Interest) | Retail | 150.0 | 147.6 | |||||||||
West Dade County Associates Miami International Mall (50% Account Interest) | Retail | 164.2 | (2) | 161.1 | (2) | |||||||
| Maryland: | ||||||||||||
WP Project Developer The Shops at Wisconsin Place (33.33% Account Interest) | Retail | 21.0 | 19.4 | |||||||||
| Massachusetts: | ||||||||||||
One Boston Place REIT One Boston Place (50.25% Account Interest) | Office | 238.8 | 224.2 | |||||||||
T-C 225 Binney, LLC 225 Binney Street (70% Account Interest) | Office | 195.7 | 194.9 | |||||||||
| Nevada: | ||||||||||||
Fashion Show Holding I, LLC Fashion Show (50% Account Interest) | Retail | 837.9 | (2) | 839.1 | (2) | |||||||
| New York: | ||||||||||||
401 West 14th Street, LLC 401 West 14th Street (42.19% Account Interest) | Retail | 45.5 | (2) | 41.1 | (2) | |||||||
817 Broadway Owner, LLC 817 Broadway (61.46% Account Interest) | Office | 23.3 | (2) | 20.8 | (2) | |||||||
MRA Hub 34 Holding, LLC The Hub (95% Account Interest) | Office | 57.1 | (2) | 54.9 | (2) | |||||||
RGM 42, LLC MiMA (70% Account Interest) | Apartments | 188.0 | (2) | 194.7 | (2) | |||||||
TREA 35th Street LIC Investor Member, LLC Commerce LIC (97.5% Account Interest) | Industrial | 57.9 | — | |||||||||
| Tennessee: | ||||||||||||
West Town Mall, LLC West Town Mall (50% Account Interest) | Retail | 137.1 | (2) | 154.4 | (2) | |||||||
| Location/Description | Type | Fair Value at | ||||||||||
| September 30, 2017 | December 31, 2016 | |||||||||||
| (Unaudited) | ||||||||||||
| Texas: | ||||||||||||
Four Oaks Venture LP Four Oaks Place LP (51% Account Interest) | Office | 341.6 | (2) | 342.3 | (2) | |||||||
| Washington: | ||||||||||||
T-C REA 400 Fairview Investor, LLC 400 Fairview (90% Account Interest) | Office | 262.4 | 243.6 | |||||||||
| Various: | ||||||||||||
DDRTC Core Retail Fund, LLC DDR Joint Venture (85% Account Interest) | Retail | 615.8 | (2,3) | 552.8 | (2,3) | |||||||
Storage Portfolio I, LLC Storage Portfolio (75% Account Interest) | Storage | 173.6 | (2,3) | 156.5 | (2,3) | |||||||
TOTAL REAL ESTATE JOINT VENTURES (Cost $4,399.3 and $4,393.2) | $ | 5,675.4 | $ | 5,622.4 | ||||||||
| LIMITED PARTNERSHIPS—0.5% and 0.5% | ||||||||||||
| Clarion Gables Multi-Family Trust LP (8.407% Account Interest) | $ | 124.9 | $ | 121.6 | ||||||||
| Colony Realty Partners LP (5.27% Account Interest) | — | 3.1 | (10) | |||||||||
| Lion Gables Apartment Fund (18.46% Account Interest) | — | 0.2 | (5) | |||||||||
| Taconic New York City GP Fund, LP (60% Account Interest) | 11.0 | 4.8 | ||||||||||
| Transwestern Mezz Realty Partners III, LLC (11.708% Account Interest) | 4.8 | 7.8 | ||||||||||
TOTAL LIMITED PARTNERSHIPS (Cost $140.9 and $137.2) | $ | 140.7 | $ | 137.5 | ||||||||
TOTAL REAL ESTATE JOINT VENTURES AND LIMITED PARTNERSHIPS (Cost $4,540.2 and $4,530.4) | $ | 5,816.1 | $ | 5,759.9 | ||||||||
| Shares | Issuer | Fair Value at | ||||||||||||||
| September 30, 2017 | December 31, 2016 | |||||||||||||||
| 2017 | 2016 | |||||||||||||||
| (Unaudited) | ||||||||||||||||
| 82,202 | 84,437 | Acadia Realty Trust | $ | 2.3 | $ | 2.8 | ||||||||||
| 28,294 | 26,717 | Agree Realty Corporation | 1.4 | 1.2 | ||||||||||||
| 2,132 | 2,132 | Alexander's, Inc. | 0.9 | 0.9 | ||||||||||||
| 92,255 | 83,175 | Alexandria Real Estate Equities, Inc. | 11.0 | 9.2 | ||||||||||||
| 48,980 | — | Altisource Residential Corp. | 0.5 | — | ||||||||||||
| 40,188 | 41,010 | American Assets Trust, Inc. | 1.6 | 1.8 | ||||||||||||
| 133,888 | 138,467 | American Campus Communities, Inc. | 5.9 | 6.9 | ||||||||||||
| — | 6,347 | American Farmland Company | — | 0.1 | ||||||||||||
| 239,344 | 233,916 | American Homes 4 Rent | 5.2 | 4.9 | ||||||||||||
| 421,695 | 443,315 | American Tower Corp. | 57.6 | 46.8 | ||||||||||||
| 155,985 | 163,592 | Apartment Investment and Management Company | 6.8 | 7.4 | ||||||||||||
| 210,602 | 223,733 | Apple Hospitality Inc. | 4.0 | 4.5 | ||||||||||||
| 47,395 | 38,282 | Armada Hoffler Properties Inc. | 0.7 | 0.6 | ||||||||||||
| 27,462 | 27,631 | Ashford Hospitality Prime Inc. | 0.3 | 0.4 | ||||||||||||
| 75,865 | 96,553 | Ashford Hospitality Trust, Inc. | 0.5 | 0.7 | ||||||||||||
| 137,335 | 143,728 | Avalonbay Communities, Inc. | 24.5 | 25.5 | ||||||||||||
| 24,509 | 21,354 | Bluerock Residential Growth, Inc. | 0.3 | 0.3 | ||||||||||||
| 153,602 | 160,997 | Boston Properties, Inc. | 18.9 | 20.3 | ||||||||||||
| 172,155 | 183,336 | Brandywine Realty Trust | 3.0 | 3.0 | ||||||||||||
| 305,457 | 319,555 | Brixmore Property Group Inc | 5.7 | 7.8 | ||||||||||||
| 90,816 | 91,727 | Camden Property Trust | 8.3 | 7.7 | ||||||||||||
| — | 89,419 | Care Capital Properties, Inc. | — | 2.2 | ||||||||||||
| 76,188 | 64,966 | CareTrust REIT Inc. | 1.5 | 1.0 | ||||||||||||
| 39,488 | 43,788 | Catchmark Timber Trust, Inc. | 0.5 | 0.5 | ||||||||||||
| 167,957 | 178,895 | CBL & Associates Properties, Inc. | 1.4 | (9) | 2.1 | |||||||||||
| 92,124 | 92,124 | Cedar Shopping Centers, Inc. | 0.5 | 0.6 | ||||||||||||
| 39,759 | 39,759 | Chatham Lodging Trust | 0.8 | 0.8 | ||||||||||||
| 58,946 | 63,363 | Chesapeake Lodging Trust | 1.6 | 1.6 | ||||||||||||
| 15,330 | — | Clipper Realty, Inc. | 0.2 | (9) | — | |||||||||||
| 541,689 | — | Colony Northstar, Inc. | 6.8 | — | ||||||||||||
| — | 50,961 | Colony Starwood Homes | — | 1.5 | ||||||||||||
| 122,581 | 130,704 | Columbia Property Trust Inc. | 2.7 | 2.8 | ||||||||||||
| — | 161,499 | Communication Sales & Leasing, Inc. | — | 4.1 | ||||||||||||
| 17,855 | 13,231 | Community Healthcare Trust, Inc. | 0.5 | 0.3 | ||||||||||||
| 117,713 | 117,878 | CoreCivic, Inc. | 3.2 | 2.9 | ||||||||||||
| 12,695 | 12,695 | Corenergy Infrastructure Trust, Inc. | 0.4 | (9) | 0.4 | |||||||||||
| 33,863 | 35,452 | CoreSite Realty Corporation | 3.8 | 2.8 | ||||||||||||
| 99,369 | 98,668 | Corporate Office Properties Trust | 3.3 | 3.1 | ||||||||||||
| 414,681 | 358,876 | Cousins Properties Incorporated | 3.9 | 3.1 | ||||||||||||
| 401,185 | 378,286 | Crown Castle International Corporation | 40.1 | 32.8 | ||||||||||||
| 180,122 | 189,128 | Cubesmart | 4.7 | 5.1 | ||||||||||||
| 86,428 | 80,245 | CyrusOne Inc. | 5.1 | 3.6 | ||||||||||||
| 92,007 | 95,203 | DCT Industrial Trust, Inc. | 5.3 | 4.6 | ||||||||||||
| 308,806 | 326,844 | DDR Corp | 2.8 | 5.0 | ||||||||||||
| 198,919 | 211,566 | DiamondRock Hospitality Company | 2.2 | 2.4 | ||||||||||||
| 203,672 | 166,911 | Digital Realty Trust, Inc. | 24.1 | 16.4 | ||||||||||||
| Shares | Issuer | Fair Value at | ||||||||||||||
| September 30, 2017 | December 31, 2016 | |||||||||||||||
| 2017 | 2016 | |||||||||||||||
| (Unaudited) | ||||||||||||||||
| 144,167 | 146,715 | Douglas Emmett, Inc. | $ | 5.7 | $ | 5.4 | ||||||||||
| 355,455 | 371,513 | Duke Realty Corporation | 10.2 | 9.9 | ||||||||||||
| — | 79,039 | DuPont Fabros Technology, Inc. | — | 3.5 | ||||||||||||
| 38,107 | 38,107 | Easterly Government Properties, Inc. | 0.8 | 0.8 | ||||||||||||
| 32,984 | 34,448 | EastGroup Properties, Inc. | 2.9 | 2.5 | ||||||||||||
| 73,142 | 76,609 | Education Realty Trust, Inc. | 2.6 | 3.2 | ||||||||||||
| 125,679 | 128,313 | Empire State Realty Trust | 2.6 | 2.6 | ||||||||||||
| 62,943 | 66,086 | EPR Properties | 4.4 | 4.7 | ||||||||||||
| 77,532 | 74,499 | Equinix Inc. | 34.6 | 26.6 | ||||||||||||
| 120,619 | 132,412 | Equity Commonwealth | 3.7 | 4.0 | ||||||||||||
| 81,386 | 81,207 | Equity Lifestyle Properties, Inc. | 6.9 | 5.9 | ||||||||||||
| — | 97,735 | Equity One, Inc. | — | 3.0 | ||||||||||||
| 355,638 | 378,516 | Equity Residential | 23.4 | 24.4 | ||||||||||||
| 39,142 | 39,142 | Escrow Winthrop Realty Trust | 0.3 | 0.3 | ||||||||||||
| 65,165 | 68,928 | Essex Property Trust, Inc. | 16.6 | 16.0 | ||||||||||||
| 121,584 | 123,598 | Extra Space Storage, Inc. | 9.7 | 9.5 | ||||||||||||
| 33,146 | 20,247 | Farmland Partners, Inc. | 0.3 | (9) | 0.2 | (9) | ||||||||||
| 72,018 | 75,390 | Federal Realty Investment Trust | 8.9 | 10.7 | ||||||||||||
| — | 146,636 | FelCor Lodging Trust Incorporated | — | 1.2 | ||||||||||||
| 117,988 | 122,078 | First Industrial Realty Trust, Inc. | 3.6 | 3.4 | ||||||||||||
| 62,454 | 62,454 | First Potomac Realty Trust | 0.7 | 0.7 | ||||||||||||
| 242,943 | 247,510 | Forest City Realty Trust A | 6.2 | 5.2 | ||||||||||||
| 62,347 | 62,347 | Four Corners Property Trust | 1.6 | 1.3 | ||||||||||||
| 105,457 | 105,457 | Franklin Street Properties Corp. | 1.1 | 1.4 | ||||||||||||
| 200,306 | 215,403 | Gaming and Leisure Properties, Inc. | 7.4 | 6.6 | ||||||||||||
| 616,628 | 528,439 | General Growth Properties, Inc. | 12.8 | 13.2 | ||||||||||||
| 121,553 | 75,332 | GEO Group, Inc./The | 3.3 | 2.7 | ||||||||||||
| 32,335 | 27,304 | Getty Realty Corp. | 0.9 | 0.7 | ||||||||||||
| 27,842 | 24,752 | Gladstone Commercial Corporation | 0.6 | 0.5 | ||||||||||||
| 7,822 | — | Gladstone Land Corporation | 0.1 | — | ||||||||||||
| 14,323 | 14,323 | Global Medical REIT, Inc. | 0.1 | (9) | 0.1 | (9) | ||||||||||
| 66,375 | 169,785 | Global Net Lease, Inc. | 1.5 | 1.3 | ||||||||||||
| 93,766 | 74,542 | Government Properties Income Trust | 1.8 | 1.4 | ||||||||||||
| 150,155 | 439,336 | Gramercy Property Trust Inc. | 4.5 | 4.0 | ||||||||||||
| 468,228 | 488,199 | HCP, Inc. | 13.0 | 14.5 | ||||||||||||
| 121,482 | 121,172 | Healthcare Realty Trust Inc. | 3.9 | 3.7 | ||||||||||||
| 197,648 | 148,194 | Healthcare Trust of America | 5.9 | 4.3 | ||||||||||||
| 38,921 | 38,921 | Hersha Hospitality Trust | 0.7 | 0.8 | ||||||||||||
| 100,544 | 105,127 | Highwoods Properties, Inc. | 5.2 | 5.4 | ||||||||||||
| 162,463 | 172,557 | Hospitality Properties Trust | 4.6 | 5.5 | ||||||||||||
| 730,412 | 784,264 | Host Hotels & Resorts, Inc. | 13.5 | 14.8 | ||||||||||||
| 156,033 | 130,545 | Hudson Pacific Properties, Inc. | 5.2 | 4.5 | ||||||||||||
| 70,772 | 64,154 | Independence Realty Trust, Inc. | 0.7 | 0.6 | ||||||||||||
| 130,841 | 130,841 | Investors Real Estate Trust | 0.8 | 0.9 | ||||||||||||
| 87,831 | — | Invitation Homes | 2.0 | — | ||||||||||||
| 262,389 | 251,283 | Iron Mountain Inc. | 10.2 | 8.2 | ||||||||||||
| 1,500,000 | 1,500,000 | iShares Dow Jones US Real Estate Index Fund | 119.8 | 115.4 | (9) | |||||||||||
| 86,089 | — | JBG Smith Properties | 2.9 | — | ||||||||||||
| 96,468 | 96,739 | Kilroy Realty Corporation | 6.9 | 7.1 | ||||||||||||
| Shares | Issuer | Fair Value at | ||||||||||||||
| September 30, 2017 | December 31, 2016 | |||||||||||||||
| 2017 | 2016 | |||||||||||||||
| (Unaudited) | ||||||||||||||||
| 413,143 | 446,152 | Kimco Realty Corporation | $ | 8.1 | $ | 11.2 | ||||||||||
| 82,157 | 86,474 | Kite Realty Group Trust | 1.7 | 2.0 | ||||||||||||
| 82,861 | 86,839 | Lamar Advertising Corporation | 5.7 | 5.8 | ||||||||||||
| 113,248 | 118,625 | LaSalle Hotel Properties | 3.3 | 3.6 | ||||||||||||
| 233,615 | 246,697 | Lexington Realty Trust | 2.4 | 2.7 | ||||||||||||
| 147,200 | 154,875 | Liberty Property Trust | 6.0 | 6.1 | ||||||||||||
| 45,893 | 48,870 | Life Storage, Inc. | 3.8 | 4.2 | ||||||||||||
| 39,429 | 41,261 | LTC Properties, Inc. | 1.9 | 1.9 | ||||||||||||
| 91,244 | 93,046 | Mack-Cali Realty Corporation | 2.2 | 2.7 | ||||||||||||
| 29,800 | 23,475 | Medequities Realty Trust, Inc. | 0.4 | 0.3 | ||||||||||||
| 362,242 | 337,220 | Medical Properties Trust, Inc. | 4.8 | 4.1 | ||||||||||||
| 113,412 | 118,873 | Mid-America Apartment Communities, Inc. | 12.1 | 11.6 | ||||||||||||
| 71,720 | 69,038 | Monmouth Real Estate Investment Corporation | 1.2 | 1.1 | ||||||||||||
| — | 175,519 | Monogram Residential Trust Inc. | — | 1.9 | ||||||||||||
| 39,678 | 38,542 | National Health Investors, Inc. | 3.1 | 2.9 | ||||||||||||
| 148,742 | 154,142 | National Retail Properties, Inc. | 6.2 | 6.8 | ||||||||||||
| 44,249 | 44,249 | National Storage Affiliates Trust | 1.1 | 1.0 | ||||||||||||
| 83,324 | 83,324 | New Senior Investment Group | 0.8 | 0.8 | ||||||||||||
| — | 175,401 | New York REIT | — | 1.8 | ||||||||||||
| 17,140 | 17,140 | Nexpoint Residential Trust, Inc. | 0.4 | 0.4 | ||||||||||||
| 54,554 | 59,329 | NorthStar Realty Europe Corp. | 0.7 | 0.7 | ||||||||||||
| — | 189,799 | NorthStar Realty Finance Corp. | — | 2.9 | ||||||||||||
| 194,823 | 181,435 | Omega Healthcare Investors, Inc. | 6.2 | (9) | 5.7 | |||||||||||
| 16,324 | 16,324 | One Liberty Properties, Inc. | 0.4 | 0.4 | ||||||||||||
| 138,381 | 144,614 | Outfront Media Inc. | 3.5 | 3.6 | ||||||||||||
| 198,430 | 157,741 | Paramount Group Inc. | 3.2 | 2.5 | ||||||||||||
| 144,718 | — | Park Hotels & Resorts, Inc. | 4.0 | — | ||||||||||||
| 42,820 | 45,533 | Parkway Properties, Inc. | 1.0 | 1.0 | ||||||||||||
| 68,431 | 75,815 | Pebblebrook Hotel Trust | 2.5 | (9) | 2.3 | |||||||||||
| 69,866 | 69,866 | Pennsylvania Real Estate Investment Trust | 0.7 | (9) | 1.3 | |||||||||||
| 178,281 | 141,267 | Physicians Realty Trust | 3.2 | 2.7 | ||||||||||||
| 144,783 | 153,053 | Piedmont Office Realty Trust, Inc. | 2.9 | 3.2 | ||||||||||||
| 40,092 | 39,487 | Potlatch Corporation | 2.0 | 1.6 | ||||||||||||
| 30,894 | 25,352 | Preferred Apartment Communities, Inc. | 0.6 | 0.4 | ||||||||||||
| 526,083 | 549,455 | ProLogis | 33.4 | 29.0 | ||||||||||||
| 19,639 | 20,916 | PS Business Parks, Inc. | 2.6 | 2.4 | ||||||||||||
| 147,591 | 152,197 | Public Storage, Inc. | 31.6 | 34.0 | ||||||||||||
| 47,384 | 47,125 | QTS Realty Trust, Inc. | 2.5 | 2.3 | ||||||||||||
| 96,479 | 98,883 | Quality Care Properties | 1.5 | 1.5 | ||||||||||||
| 78,232 | 82,342 | Ramco-Gershenson Properties Trust | 1.0 | 1.4 | ||||||||||||
| 127,625 | 129,796 | Rayonier, Inc. | 3.7 | 3.4 | ||||||||||||
| 272,317 | 270,184 | Realty Income Corporation | 15.6 | 15.5 | ||||||||||||
| 149,168 | 109,616 | Regency Centers Corporation | 9.3 | 7.6 | ||||||||||||
| 107,617 | 113,887 | Retail Opportunity Investment | 2.0 | 2.4 | ||||||||||||
| 230,343 | 247,302 | Retail Properties of America | 3.0 | 3.8 | ||||||||||||
| 70,011 | 67,197 | Rexford Industrial Realty Inc. | 2.0 | 1.6 | ||||||||||||
| 169,181 | 131,026 | RLJ Lodging Trust | 3.7 | 3.2 | ||||||||||||
| 44,005 | 50,994 | Ryman Hospitality Properties | 2.7 | 3.2 | ||||||||||||
| 173,736 | 68,440 | Sabra Health Care REIT Inc. | 3.8 | 1.7 | ||||||||||||
| Shares | Issuer | Fair Value at | ||||||||||||||
| September 30, 2017 | December 31, 2016 | |||||||||||||||
| 2017 | 2016 | |||||||||||||||
| (Unaudited) | ||||||||||||||||
| 11,006 | — | Safety Income and Growth, Inc. | $ | 0.2 | $ | — | ||||||||||
| 11,082 | 14,267 | Saul Centers, Inc. | 0.7 | 0.9 | ||||||||||||
| 119,786 | — | SBA Communications Corporation | 17.3 | — | ||||||||||||
| 63,334 | 71,466 | Select Income Real Estate Investment Trust | 1.5 | 1.8 | ||||||||||||
| 235,142 | 248,749 | Senior Housing Properties Trust | 4.6 | 4.7 | ||||||||||||
| — | 36,820 | Silver Bay Realty Trust Corp. | — | 0.6 | ||||||||||||
| 310,266 | 329,687 | Simon Property Group, Inc. | 50.0 | 58.6 | ||||||||||||
| 96,162 | 106,453 | SL Green Realty Corp. | 9.7 | 11.4 | ||||||||||||
| 483,394 | 483,032 | Spirit Realty Capital Inc. | 4.1 | 5.2 | ||||||||||||
| 91,969 | 78,649 | Stag Industrial, Inc. | 2.5 | 1.9 | ||||||||||||
| 126,762 | — | Starwood Waypoint Homes | 4.6 | — | ||||||||||||
| 170,571 | 162,012 | STORE Capital Corporation | 4.2 | 4.0 | ||||||||||||
| 101,582 | 88,627 | Summit Hotel Properties, Inc. | 1.6 | 1.4 | ||||||||||||
| 75,320 | 68,173 | Sun Communities, Inc. | 6.5 | 5.2 | ||||||||||||
| 223,998 | 227,526 | Sunstone Hotel Investors, Inc. | 3.6 | 3.5 | ||||||||||||
| 93,587 | 100,862 | Tanger Factory Outlet Centers, Inc. | 2.3 | 3.6 | ||||||||||||
| 59,024 | 63,335 | Taubman Centers, Inc. | 2.9 | 4.7 | ||||||||||||
| 50,869 | 48,484 | Terreno Realty Corporation | 1.8 | 1.4 | ||||||||||||
| 136,929 | 150,999 | The Macerich Company | 7.5 | 10.7 | ||||||||||||
| 50,411 | 50,411 | Tier Inc. | 1.0 | 0.9 | ||||||||||||
| 265,245 | 280,233 | UDR, Inc. | 10.1 | 10.2 | ||||||||||||
| 30,879 | 27,329 | UMH Properties, Inc. | 0.5 | 0.4 | ||||||||||||
| 165,032 | — | UNITI Group, Inc. | 2.4 | — | ||||||||||||
| 13,049 | 14,676 | Universal Health Realty Income Trust | 1.0 | 1.0 | ||||||||||||
| 97,222 | 93,500 | Urban Edge Properties | 2.3 | 2.6 | ||||||||||||
| 31,959 | 31,959 | Urstadt Biddle Properties, Inc. | 0.7 | 0.8 | ||||||||||||
| 353,728 | 371,296 | Ventas, Inc. | 23.0 | 23.2 | ||||||||||||
| 975,362 | 1,012,629 | VEREIT, Inc. | 8.1 | 8.6 | ||||||||||||
| 172,179 | 177,780 | Vornado Realty Trust | 13.2 | 18.6 | ||||||||||||
| 185,508 | 193,859 | Washington Prime Group, Inc. | 1.5 | 2.0 | ||||||||||||
| 76,866 | 78,200 | Washington Real Estate Investment Trust | 2.5 | 2.6 | ||||||||||||
| 119,216 | 120,820 | Weingarten Realty Investors | 3.8 | 4.3 | ||||||||||||
| 365,663 | 380,425 | Welltower Inc. | 25.7 | 25.5 | ||||||||||||
| 744,863 | 783,938 | Weyerhaeuser Company | 25.3 | 23.6 | ||||||||||||
| 38,883 | 32,110 | Whitestone Real Estate Investment Trust B | 0.5 | 0.5 | ||||||||||||
| 105,577 | 95,234 | WP Carey Inc. | 7.1 | 5.6 | ||||||||||||
| 107,316 | 113,720 | Xenia Hotels & Resorts Inc. | 2.3 | 2.2 | ||||||||||||
| TOTAL REAL ESTATE-RELATED MARKETABLE SECURITIES (Cost $889.5 and $883.9) | $ | 1,121.0 | $ | 1,081.5 | ||||||||||||
| Principal | Issuer | Yield(4) | Maturity Date | Fair Value at | ||||||||||||||||
| September 30, 2017 | December 31, 2016 | |||||||||||||||||||
| 2017 | 2016 | |||||||||||||||||||
| (Unaudited) | ||||||||||||||||||||
| $ | — | $ | 22.0 | Fannie Mae Discount Notes | 0.416% | 2/1/2017 | $ | — | $ | 22.0 | ||||||||||
| — | 42.0 | Fannie Mae Discount Notes | 0.366% - 0.482% | 3/1/2017 | — | 42.0 | ||||||||||||||
| — | 10.0 | Fannie Mae Discount Notes | 0.427% | 3/3/2017 | — | 10.0 | ||||||||||||||
| — | 20.0 | Fannie Mae Discount Notes | 0.427% | 3/6/2017 | — | 20.0 | ||||||||||||||
| — | 20.0 | Fannie Mae Discount Notes | 0.406% | 3/13/2017 | — | 20.0 | ||||||||||||||
| — | 30.3 | Fannie Mae Discount Notes | 0.406% | 3/27/2017 | — | 30.3 | ||||||||||||||
| — | 25.0 | Fannie Mae Discount Notes | 0.406% | 3/28/2017 | — | 25.0 | ||||||||||||||
| — | 30.0 | Fannie Mae Discount Notes | 0.518% | 4/18/2017 | — | 29.9 | ||||||||||||||
| — | 24.0 | Fannie Mae Discount Notes | 0.483% - 0.579% | 4/19/2017 | — | 24.0 | ||||||||||||||
| — | 31.5 | Fannie Mae Discount Notes | 0.447% - 0.539% | 5/1/2017 | — | 31.5 | ||||||||||||||
| — | 49.9 | Fannie Mae Discount Notes | 0.518% | 5/2/2017 | — | 49.9 | ||||||||||||||
| — | 39.9 | Fannie Mae Discount Notes | 0.539% | 5/5/2017 | — | 39.9 | ||||||||||||||
| 34.9 | — | Fannie Mae Discount Notes | 0.987% | 10/2/2017 | 34.9 | — | ||||||||||||||
| 47.1 | — | Fannie Mae Discount Notes | 1.017% - 1.038% | 10/11/2017 | 47.1 | — | ||||||||||||||
| 35.1 | — | Fannie Mae Discount Notes | 1.027% | 10/12/2017 | 35.1 | — | ||||||||||||||
| 33.6 | — | Fannie Mae Discount Notes | 1.017% | 10/13/2017 | 33.6 | — | ||||||||||||||
| 37.1 | — | Fannie Mae Discount Notes | 1.017% - 1.037% | 10/19/2017 | 37.1 | — | ||||||||||||||
| 15.1 | — | Fannie Mae Discount Notes | 1.038% | 10/23/2017 | 15.1 | — | ||||||||||||||
| 20.0 | — | Fannie Mae Discount Notes | 1.038% | 10/25/2017 | 20.0 | — | ||||||||||||||
| 40.0 | — | Fannie Mae Discount Notes | 1.038% | 10/27/2017 | 40.0 | — | ||||||||||||||
| 35.0 | — | Fannie Mae Discount Notes | 0.996% | 10/30/2017 | 35.0 | — | ||||||||||||||
| 75.1 | — | Fannie Mae Discount Notes | 0.996% - 1.006% | 11/1/2017 | 75.0 | — | ||||||||||||||
| 10.0 | — | Fannie Mae Discount Notes | 0.985% | 11/3/2017 | 10.0 | — | ||||||||||||||
| 24.6 | — | Fannie Mae Discount Notes | 1.048% | 11/6/2017 | 24.5 | — | ||||||||||||||
| 5.0 | — | Fannie Mae Discount Notes | 1.048% | 11/9/2017 | 5.0 | — | ||||||||||||||
| 75.0 | — | Fannie Mae Discount Notes | 1.058% | 11/20/2017 | 74.9 | — | ||||||||||||||
| 75.0 | — | Fannie Mae Discount Notes | 1.058% | 11/21/2017 | 74.9 | — | ||||||||||||||
| 30.0 | — | Fannie Mae Discount Notes | 1.058% | 11/22/2017 | 30.0 | — | ||||||||||||||
| 20.0 | — | Fannie Mae Discount Notes | 1.007% | 11/24/2017 | 20.0 | — | ||||||||||||||
| 25.0 | — | Fannie Mae Discount Notes | 1.042% | 12/20/2017 | 24.9 | — | ||||||||||||||
| 40.0 | — | Fannie Mae Discount Notes | 1.063% | 1/11/2018 | 40.0 | — | ||||||||||||||
| 30.0 | — | Fannie Mae Discount Notes | 1.038% | 1/22/2018 | 29.9 | — | ||||||||||||||
| 46.2 | — | Fannie Mae Discount Notes | 1.038% | 1/23/2018 | 46.0 | — | ||||||||||||||
| 35.1 | — | Fannie Mae Discount Notes | 1.038% | 1/24/2018 | 35.0 | — | ||||||||||||||
| — | 19.9 | Farmer Mac Discount Notes | 0.682% | 6/1/2017 | — | 19.9 | ||||||||||||||
| — | 15.5 | Federal Farm Credit Bank Discount Notes | 0.376% - 0.381% | 2/22/2017 | — | 15.5 | ||||||||||||||
| — | 34.7 | Federal Home Loan Bank Discount Notes | 0.304% - 0.355% | 1/3/2017 | — | 34.7 | ||||||||||||||
| — | 40.0 | Federal Home Loan Bank Discount Notes | 0.345% | 1/4/2017 | — | 40.0 | ||||||||||||||
| — | 29.2 | Federal Home Loan Bank Discount Notes | 0.355% - 0.447% | 1/6/2017 | — | 29.2 | ||||||||||||||
| — | 7.1 | Federal Home Loan Bank Discount Notes | 0.299% - 0.345% | 1/9/2017 | — | 7.1 | ||||||||||||||
| — | 25.0 | Federal Home Loan Bank Discount Notes | 0.325% | 1/10/2017 | — | 25.0 | ||||||||||||||
| — | 50.0 | Federal Home Loan Bank Discount Notes | 0.304% - 0.396% | 1/11/2017 | — | 50.0 | ||||||||||||||
| — | 33.0 | Federal Home Loan Bank Discount Notes | 0.365% - 0.396% | 1/12/2017 | — | 33.0 | ||||||||||||||
| — | 50.0 | Federal Home Loan Bank Discount Notes | 0.386% | 1/13/2017 | — | 50.0 | ||||||||||||||
| — | 36.0 | Federal Home Loan Bank Discount Notes | 0.345% | 1/17/2017 | — | 36.0 | ||||||||||||||
| — | 42.1 | Federal Home Loan Bank Discount Notes | 0.294% - 0.365% | 1/18/2017 | — | 42.1 | ||||||||||||||
| Principal | Issuer | Yield(4) | Maturity Date | Fair Value at | ||||||||||||||||
| September 30, 2017 | December 31, 2016 | |||||||||||||||||||
| 2017 | 2016 | |||||||||||||||||||
| (Unaudited) | ||||||||||||||||||||
| $ | — | $ | 20.0 | Federal Home Loan Bank Discount Notes | 0.284% | 1/20/2017 | $ | — | $ | 20.0 | ||||||||||
| — | 50.0 | Federal Home Loan Bank Discount Notes | 0.335% | 1/23/2017 | — | 50.0 | ||||||||||||||
| — | 47.0 | Federal Home Loan Bank Discount Notes | 0.345% | 1/24/2017 | — | 47.0 | ||||||||||||||
| — | 34.8 | Federal Home Loan Bank Discount Notes | 0.304% - 0.360% | 1/25/2017 | — | 34.8 | ||||||||||||||
| — | 45.0 | Federal Home Loan Bank Discount Notes | 0.294% - 0.406% | 1/27/2017 | — | 45.0 | ||||||||||||||
| — | 25.0 | Federal Home Loan Bank Discount Notes | 0.416% | 1/30/2017 | — | 25.0 | ||||||||||||||
| — | 34.7 | Federal Home Loan Bank Discount Notes | 0.467% - 0.497% | 2/1/2017 | — | 34.7 | ||||||||||||||
| — | 42.0 | Federal Home Loan Bank Discount Notes | 0.406% | 2/3/2017 | — | 42.0 | ||||||||||||||
| — | 15.0 | Federal Home Loan Bank Discount Notes | 0.416% | 2/7/2017 | — | 15.0 | ||||||||||||||
| — | 10.2 | Federal Home Loan Bank Discount Notes | 0.376% | 2/10/2017 | — | 10.2 | ||||||||||||||
| — | 50.0 | Federal Home Loan Bank Discount Notes | 0.386% - 0.487% | 2/17/2017 | — | 50.0 | ||||||||||||||
| — | 30.0 | Federal Home Loan Bank Discount Notes | 0.365% | 2/21/2017 | — | 30.0 | ||||||||||||||
| — | 30.0 | Federal Home Loan Bank Discount Notes | 0.437% | 2/22/2017 | — | 30.0 | ||||||||||||||
| — | 50.0 | Federal Home Loan Bank Discount Notes | 0.396% | 2/24/2017 | — | 50.0 | ||||||||||||||
| — | 20.0 | Federal Home Loan Bank Discount Notes | 0.533% | 2/27/2017 | — | 20.0 | ||||||||||||||
| — | 10.1 | Federal Home Loan Bank Discount Notes | 0.518% | 3/3/2017 | — | 10.1 | ||||||||||||||
| — | 15.0 | Federal Home Loan Bank Discount Notes | 0.523% | 3/6/2017 | — | 15.0 | ||||||||||||||
| — | 30.0 | Federal Home Loan Bank Discount Notes | 0.538% | 3/8/2017 | — | 30.0 | ||||||||||||||
| — | 45.8 | Federal Home Loan Bank Discount Notes | 0.447% - 0.574% | 3/10/2017 | — | 45.8 | ||||||||||||||
| — | 20.0 | Federal Home Loan Bank Discount Notes | 0.543% | 3/14/2017 | — | 20.0 | ||||||||||||||
| — | 40.5 | Federal Home Loan Bank Discount Notes | 0.528% - 0.579% | 3/17/2017 | — | 40.5 | ||||||||||||||
| — | 49.9 | Federal Home Loan Bank Discount Notes | 0.538% | 3/20/2017 | — | 49.9 | ||||||||||||||
| — | 36.1 | Federal Home Loan Bank Discount Notes | 0.533% | 3/22/2017 | — | 36.1 | ||||||||||||||
| — | 28.0 | Federal Home Loan Bank Discount Notes | 0.427% - 0.518% | 3/23/2017 | — | 28.0 | ||||||||||||||
| — | 40.0 | Federal Home Loan Bank Discount Notes | 0.528% | 3/24/2017 | — | 40.0 | ||||||||||||||
| — | 25.0 | Federal Home Loan Bank Discount Notes | 0.548% | 3/28/2017 | — | 25.0 | ||||||||||||||
| — | 31.0 | Federal Home Loan Bank Discount Notes | 0.558% | 3/29/2017 | — | 31.0 | ||||||||||||||
| — | 6.4 | Federal Home Loan Bank Discount Notes | 0.477% | 3/31/2017 | — | 6.4 | ||||||||||||||
| — | 49.9 | Federal Home Loan Bank Discount Notes | 0.559% | 4/17/2017 | — | 49.9 | ||||||||||||||
| — | 26.0 | Federal Home Loan Bank Discount Notes | 0.548% - 0.605% | 4/19/2017 | — | 26.0 | ||||||||||||||
| — | 20.1 | Federal Home Loan Bank Discount Notes | 0.488% | 4/28/2017 | — | 20.1 | ||||||||||||||
| — | 25.0 | Federal Home Loan Bank Discount Notes | 0.538% - 0.600% | 5/5/2017 | — | 25.0 | ||||||||||||||
| — | 37.2 | Federal Home Loan Bank Discount Notes | 0.558% - 0.641% | 5/12/2017 | — | 37.2 | ||||||||||||||
| 27.1 | — | Federal Home Loan Bank Discount Notes | 1.015% | 10/5/2017 | 27.1 | — | ||||||||||||||
| 30.8 | — | Federal Home Loan Bank Discount Notes | 0.968% | 10/6/2017 | 30.8 | — | ||||||||||||||
| 40.1 | — | Federal Home Loan Bank Discount Notes | 1.020% - 1.053% | 10/10/2017 | 40.1 | — | ||||||||||||||
| 4.0 | — | Federal Home Loan Bank Discount Notes | 1.049% | 10/13/2017 | 4.0 | — | ||||||||||||||
| 88.3 | — | Federal Home Loan Bank Discount Notes | 1.020% - 1.025% | 10/16/2017 | 88.3 | — | ||||||||||||||
| 44.2 | — | Federal Home Loan Bank Discount Notes | 1.063% | 10/18/2017 | 44.1 | — | ||||||||||||||
| 39.6 | — | Federal Home Loan Bank Discount Notes | 1.008% - 1.039% | 10/20/2017 | 39.6 | — | ||||||||||||||
| 30.1 | — | Federal Home Loan Bank Discount Notes | 1.031% - 1.049% | 10/23/2017 | 30.0 | — | ||||||||||||||
| 42.2 | — | Federal Home Loan Bank Discount Notes | 1.013% | 10/24/2017 | 42.1 | — | ||||||||||||||
| 23.2 | — | Federal Home Loan Bank Discount Notes | 1.036% - 1.048% | 10/25/2017 | 23.2 | — | ||||||||||||||
| 10.2 | — | Federal Home Loan Bank Discount Notes | 1.041% | 10/27/2017 | 10.1 | — | ||||||||||||||
| 37.1 | — | Federal Home Loan Bank Discount Notes | 1.048% | 10/30/2017 | 37.1 | — | ||||||||||||||
| 34.5 | — | Federal Home Loan Bank Discount Notes | 1.019% - 1.041% | 11/1/2017 | 34.4 | — | ||||||||||||||
| 43.2 | — | Federal Home Loan Bank Discount Notes | 1.048% | 11/2/2017 | 43.1 | — | ||||||||||||||
| 50.0 | — | Federal Home Loan Bank Discount Notes | 1.024% - 1.031% | 11/3/2017 | 50.0 | — | ||||||||||||||
| Principal | Issuer | Yield(4) | Maturity Date | Fair Value at | ||||||||||||||||
| September 30, 2017 | December 31, 2016 | |||||||||||||||||||
| 2017 | 2016 | |||||||||||||||||||
| (Unaudited) | ||||||||||||||||||||
| $ | 58.2 | $ | — | Federal Home Loan Bank Discount Notes | 1.031% - 1.048% | 11/7/2017 | $ | 58.1 | $ | — | ||||||||||
| 50.0 | — | Federal Home Loan Bank Discount Notes | 1.031% - 1.069% | 11/8/2017 | 49.9 | — | ||||||||||||||
| 61.0 | — | Federal Home Loan Bank Discount Notes | 1.030% - 1.068% | 11/9/2017 | 60.9 | — | ||||||||||||||
| 33.6 | — | Federal Home Loan Bank Discount Notes | 1.079% | 11/10/2017 | 33.6 | — | ||||||||||||||
| 42.3 | — | Federal Home Loan Bank Discount Notes | 1.032% - 1.079% | 11/13/2017 | 42.3 | — | ||||||||||||||
| 51.9 | — | Federal Home Loan Bank Discount Notes | 1.068% - 1.079% | 11/14/2017 | 51.9 | — | ||||||||||||||
| 43.4 | — | Federal Home Loan Bank Discount Notes | 1.068% - 1.109% | 11/15/2017 | 43.4 | — | ||||||||||||||
| 40.0 | — | Federal Home Loan Bank Discount Notes | 1.068% | 11/16/2017 | 40.0 | — | ||||||||||||||
| 66.4 | — | Federal Home Loan Bank Discount Notes | 1.068% - 1.069% | 11/17/2017 | 66.3 | — | ||||||||||||||
| 15.2 | — | Federal Home Loan Bank Discount Notes | 1.069% | 11/27/2017 | 15.2 | — | ||||||||||||||
| 40.0 | — | Federal Home Loan Bank Discount Notes | 1.110% | 11/28/2017 | 39.9 | — | ||||||||||||||
| 30.0 | — | Federal Home Loan Bank Discount Notes | 1.068% | 11/29/2017 | 30.0 | — | ||||||||||||||
| 36.9 | — | Federal Home Loan Bank Discount Notes | 1.047% - 1.069% | 12/1/2017 | 36.9 | — | ||||||||||||||
| 40.0 | — | Federal Home Loan Bank Discount Notes | 1.110% | 12/5/2017 | 39.9 | — | ||||||||||||||
| 20.3 | — | Federal Home Loan Bank Discount Notes | 1.110% | 12/6/2017 | 20.2 | — | ||||||||||||||
| 40.0 | — | Federal Home Loan Bank Discount Notes | 1.100% | 12/8/2017 | 39.9 | — | ||||||||||||||
| 20.0 | — | Federal Home Loan Bank Discount Notes | 1.068% | 12/11/2017 | 20.0 | — | ||||||||||||||
| 40.0 | — | Federal Home Loan Bank Discount Notes | 1.079% | 12/12/2017 | 39.9 | — | ||||||||||||||
| 44.3 | — | Federal Home Loan Bank Discount Notes | 1.067% - 1.074% | 12/15/2017 | 44.2 | — | ||||||||||||||
| 15.2 | — | Federal Home Loan Bank Discount Notes | 1.079% | 12/18/2017 | 15.1 | — | ||||||||||||||
| 25.1 | — | Federal Home Loan Bank Discount Notes | 1.079% | 12/19/2017 | 25.0 | — | ||||||||||||||
| 28.5 | — | Federal Home Loan Bank Discount Notes | 1.058% - 1.074% | 12/20/2017 | 28.4 | — | ||||||||||||||
| 30.0 | — | Federal Home Loan Bank Discount Notes | 1.074% | 12/22/2017 | 29.9 | — | ||||||||||||||
| 30.0 | — | Federal Home Loan Bank Discount Notes | 1.069% | 12/26/2017 | 29.9 | — | ||||||||||||||
| 30.0 | — | Federal Home Loan Bank Discount Notes | 1.069% | 12/27/2017 | 29.9 | — | ||||||||||||||
| 25.0 | — | Federal Home Loan Bank Discount Notes | 1.069% | 12/29/2017 | 24.9 | — | ||||||||||||||
| 20.2 | — | Federal Home Loan Bank Discount Notes | 1.069% | 1/2/2018 | 20.1 | — | ||||||||||||||
| 40.0 | — | Federal Home Loan Bank Discount Notes | 1.079% | 1/3/2018 | 39.9 | — | ||||||||||||||
| 40.0 | — | Federal Home Loan Bank Discount Notes | 1.068% | 1/5/2018 | 39.9 | — | ||||||||||||||
| 40.0 | — | Federal Home Loan Bank Discount Notes | 1.068% | 1/8/2018 | 39.9 | — | ||||||||||||||
| 33.0 | — | Federal Home Loan Bank Discount Notes | 1.058% | 1/9/2018 | 32.9 | — | ||||||||||||||
| 20.0 | — | Federal Home Loan Bank Discount Notes | 1.068% | 1/10/2018 | 19.9 | — | ||||||||||||||
| 10.0 | — | Federal Home Loan Bank Discount Notes | 1.089% | 1/12/2018 | 10.0 | — | ||||||||||||||
| 38.1 | — | Federal Home Loan Bank Discount Notes | 1.068% | 1/16/2018 | 38.0 | — | ||||||||||||||
| 30.0 | — | Federal Home Loan Bank Discount Notes | 1.094% | 1/17/2018 | 29.9 | — | ||||||||||||||
| 30.2 | — | Federal Home Loan Bank Discount Notes | 1.063% | 1/19/2018 | 30.1 | — | ||||||||||||||
| 38.0 | — | Federal Home Loan Bank Discount Notes | 1.063% | 1/25/2018 | 37.8 | — | ||||||||||||||
| 36.1 | — | Federal Home Loan Bank Discount Notes | 1.063% | 1/26/2018 | 36.0 | — | ||||||||||||||
| 19.2 | — | Federal Home Loan Bank Discount Notes | 1.069% | 1/29/2018 | 19.1 | — | ||||||||||||||
| 37.1 | — | Federal Home Loan Bank Discount Notes | 1.069% | 2/9/2018 | 37.0 | — | ||||||||||||||
| 2.2 | — | Federal Home Loan Bank Discount Notes | 1.161% | 3/2/2018 | 2.1 | — | ||||||||||||||
| — | 16.1 | Freddie Mac Discount Notes | 0.345% | 1/9/2017 | — | 16.1 | ||||||||||||||
| — | 25.0 | Freddie Mac Discount Notes | 0.335% | 1/10/2017 | — | 25.0 | ||||||||||||||
| — | 30.0 | Freddie Mac Discount Notes | 0.391% | 1/20/2017 | — | 30.0 | ||||||||||||||
| — | 13.1 | Freddie Mac Discount Notes | 0.426% | 1/30/2017 | — | 13.1 | ||||||||||||||
| — | 40.0 | Freddie Mac Discount Notes | 0.447% | 2/6/2017 | — | 40.0 | ||||||||||||||
| — | 36.9 | Freddie Mac Discount Notes | 0.436% - 0.457% | 2/7/2017 | — | 36.9 | ||||||||||||||
| — | 44.2 | Freddie Mac Discount Notes | 0.360% | 2/8/2017 | — | 44.2 | ||||||||||||||
| Principal | Issuer | Yield(4) | Maturity Date | Fair Value at | ||||||||||||||||
| September 30, 2017 | December 31, 2016 | |||||||||||||||||||
| 2017 | 2016 | |||||||||||||||||||
| (Unaudited) | ||||||||||||||||||||
| $ | — | $ | 25.0 | Freddie Mac Discount Notes | 0.360% | 2/10/2017 | $ | — | $ | 25.0 | ||||||||||
| — | 40.0 | Freddie Mac Discount Notes | 0.365% | 2/13/2017 | — | 40.0 | ||||||||||||||
| — | 30.0 | Freddie Mac Discount Notes | 0.376% | 2/14/2017 | — | 30.0 | ||||||||||||||
| — | 20.0 | Freddie Mac Discount Notes | 0.467% | 2/21/2017 | — | 20.0 | ||||||||||||||
| — | 27.0 | Freddie Mac Discount Notes | 0.386% | 2/27/2017 | — | 27.0 | ||||||||||||||
| — | 15.0 | Freddie Mac Discount Notes | 0.401% | 3/3/2017 | — | 15.0 | ||||||||||||||
| — | 35.2 | Freddie Mac Discount Notes | 0.406% | 3/7/2017 | — | 35.2 | ||||||||||||||
| — | 14.0 | Freddie Mac Discount Notes | 0.411% | 3/14/2017 | — | 14.0 | ||||||||||||||
| — | 50.0 | Freddie Mac Discount Notes | 0.427% | 3/21/2017 | — | 49.9 | ||||||||||||||
| — | 18.0 | Freddie Mac Discount Notes | 0.600% | 4/21/2017 | — | 18.0 | ||||||||||||||
| — | 39.9 | Freddie Mac Discount Notes | 0.457% | 5/3/2017 | — | 39.9 | ||||||||||||||
| — | 22.9 | Freddie Mac Discount Notes | 0.483% | 5/4/2017 | — | 22.9 | ||||||||||||||
| 45.2 | — | Freddie Mac Discount Notes | 0.997% | 10/3/2017 | 45.2 | — | ||||||||||||||
| 42.2 | — | Freddie Mac Discount Notes | 0.997% | 10/4/2017 | 42.2 | — | ||||||||||||||
| 40.0 | — | Freddie Mac Discount Notes | 1.013% | 10/16/2017 | 40.0 | — | ||||||||||||||
| 37.1 | — | Freddie Mac Discount Notes | 1.013% | 10/17/2017 | 37.1 | — | ||||||||||||||
| 10.5 | — | Freddie Mac Discount Notes | 1.005% | 10/20/2017 | 10.5 | — | ||||||||||||||
| 42.5 | — | Freddie Mac Discount Notes | 1.001% - 1.028% | 10/26/2017 | 42.5 | — | ||||||||||||||
| 15.0 | — | Freddie Mac Discount Notes | 1.079% | 11/6/2017 | 15.0 | — | ||||||||||||||
| 15.0 | — | Freddie Mac Discount Notes | 1.006% | 11/10/2017 | 15.0 | — | ||||||||||||||
| 30.0 | — | Freddie Mac Discount Notes | 1.027% | 11/27/2017 | 30.0 | — | ||||||||||||||
| 12.5 | — | Freddie Mac Discount Notes | 1.036% | 12/1/2017 | 12.5 | — | ||||||||||||||
| 51.1 | — | Freddie Mac Discount Notes | 1.027% - 1.074% | 12/4/2017 | 51.0 | — | ||||||||||||||
| 15.0 | — | Freddie Mac Discount Notes | 1.043% | 12/6/2017 | 15.0 | — | ||||||||||||||
| 20.4 | — | Freddie Mac Discount Notes | 1.064% | 12/11/2017 | 20.4 | — | ||||||||||||||
| 40.0 | — | Freddie Mac Discount Notes | 1.064% | 12/13/2017 | 39.9 | — | ||||||||||||||
| 40.0 | — | Freddie Mac Discount Notes | 1.063% | 12/14/2017 | 39.9 | — | ||||||||||||||
| 25.0 | — | Freddie Mac Discount Notes | 1.101% | 2/2/2018 | 24.9 | — | ||||||||||||||
| 30.0 | — | Freddie Mac Discount Notes | 1.101% | 2/5/2018 | 29.9 | — | ||||||||||||||
| 25.0 | — | Freddie Mac Discount Notes | 1.090% | 2/6/2018 | 24.9 | — | ||||||||||||||
| 20.1 | — | Freddie Mac Discount Notes | 1.100% | 2/7/2018 | 20.0 | — | ||||||||||||||
TOTAL GOVERNMENT AGENCY NOTES (Cost $3,276.0 and $2,309.0) | $ | 3,276.1 | $ | 2,308.9 | ||||||||||||||||
| Principal | Issuer | Yield(4) | Maturity Date | Fair Value at | |||||||||||||||||
| September 30, 2017 | December 31, 2016 | ||||||||||||||||||||
| 2017 | 2016 | ||||||||||||||||||||
| (Unaudited) | |||||||||||||||||||||
| $ | — | $ | 35.9 | United States Treasury Bills | 0.345% - 0.369% | 1/5/2017 | $ | — | $ | 35.9 | |||||||||||
| — | 47.9 | United States Treasury Bills | 0.423% - 0.428% | 1/19/2017 | — | 48.0 | |||||||||||||||
| — | 36.1 | United States Treasury Bills | 0.371% - 0.401% | 1/26/2017 | — | 36.1 | |||||||||||||||
| — | 60.1 | United States Treasury Bills | 0.363% - 0.423% | 2/2/2017 | ��� | 60.1 | |||||||||||||||
| — | 75.0 | United States Treasury Bills | 0.315% - 0.426% | 2/9/2017 | — | 75.0 | |||||||||||||||
| — | 48.0 | United States Treasury Bills | 0.325% - 0.437% | 2/16/2017 | — | 48.0 | |||||||||||||||
| — | 48.0 | United States Treasury Bills | 0.448% - 0.473% | 2/23/2017 | — | 48.0 | |||||||||||||||
| — | 36.0 | United States Treasury Bills | 0.368% - 0.477% | 3/2/2017 | — | 36.0 | |||||||||||||||
| — | 48.7 | United States Treasury Bills | 0.386% - 0.518% | 3/9/2017 | — | 48.7 | |||||||||||||||
| — | 59.9 | United States Treasury Bills | 0.406% - 0.481% | 3/16/2017 | — | 60.0 | |||||||||||||||
| — | 129.0 | United States Treasury Bills | 0.380% - 0.533% | 3/23/2017 | — | 129.0 | |||||||||||||||
| — | 25.9 | United States Treasury Bills | 0.396% - 0.518% | 3/30/2017 | — | 25.9 | |||||||||||||||
| — | 58.9 | United States Treasury Bills | 0.411% - 0.509% | 4/6/2017 | — | 58.9 | |||||||||||||||
| — | 130.8 | United States Treasury Bills | 0.518% - 0.529% | 4/13/2017 | — | 130.8 | |||||||||||||||
| — | 49.9 | United States Treasury Bills | 0.514% - 0.559% | 4/20/2017 | — | 49.9 | |||||||||||||||
| — | 48.2 | United States Treasury Bills | 0.554% - 0.781% | 4/27/2017 | — | 48.2 | |||||||||||||||
| — | 49.9 | United States Treasury Bills | 0.514% | 5/4/2017 | — | 49.9 | |||||||||||||||
| — | 42.0 | United States Treasury Bills | 0.601% - 0.623% | 5/11/2017 | — | 42.0 | |||||||||||||||
| — | 30.1 | United States Treasury Bills | 0.584% - 0.620% | 5/18/2017 | — | 30.1 | |||||||||||||||
| — | 32.0 | United States Treasury Bills | 0.587% | 6/8/2017 | — | 32.0 | |||||||||||||||
| — | 74.8 | United States Treasury Bills | 0.541% - 0.654% | 7/20/2017 | — | 74.7 | |||||||||||||||
| — | 86.7 | United States Treasury Bills | 0.574% - 0.591% | 8/17/2017 | — | 86.6 | |||||||||||||||
| — | 34.8 | United States Treasury Bills | 0.696% - 0.934% | 9/14/2017 | — | 34.8 | |||||||||||||||
| 30.0 | — | United States Treasury Bills | 0.943% | 10/5/2017 | 30.0 | — | |||||||||||||||
| 0.8 | — | United States Treasury Bills | 0.956% | 10/12/2017 | 0.8 | — | |||||||||||||||
| 20.0 | — | United States Treasury Bills | 1.017% | 11/24/2017 | 20.0 | — | |||||||||||||||
| 50.0 | — | United States Treasury Bills | 0.998% | 11/30/2017 | 49.9 | — | |||||||||||||||
| 49.0 | — | United States Treasury Bills | 0.768% | 12/7/2017 | 48.9 | — | |||||||||||||||
| 50.0 | — | United States Treasury Bills | 1.090% | 12/21/2017 | 49.9 | — | |||||||||||||||
| 97.0 | — | United States Treasury Bills | 1.099% - 1.100% | 12/28/2017 | 96.7 | — | |||||||||||||||
| 50.0 | — | United States Treasury Bills | 1.084% | 1/4/2018 | 49.9 | — | |||||||||||||||
| 40.0 | — | United States Treasury Bills | 1.114% | 1/18/2018 | 39.9 | — | |||||||||||||||
| 71.0 | — | United States Treasury Bills | 1.132% | 1/25/2018 | 70.8 | — | |||||||||||||||
| 36.0 | — | United States Treasury Bills | 1.106% | 2/1/2018 | 35.9 | — | |||||||||||||||
| 93.0 | — | United States Treasury Bills | 1.075% - 1.077% | 2/8/2018 | 92.6 | — | |||||||||||||||
| 98.0 | — | United States Treasury Bills | 1.106% - 1.122% | 2/22/2018 | 97.6 | — | |||||||||||||||
| 81.0 | — | United States Treasury Bills | 1.060% - 1.117% | 3/1/2018 | 80.6 | — | |||||||||||||||
| — | 69.9 | United States Treasury Notes | 0.431% - 0.451% | 1/31/2017 | — | 69.9 | |||||||||||||||
| — | 46.9 | United States Treasury Notes | 0.441% - 0.471% | 2/15/2017 | — | 47.0 | |||||||||||||||
| — | 49.7 | United States Treasury Notes | 0.502% | 2/28/2017 | — | 49.7 | |||||||||||||||
| — | 50.0 | United States Treasury Notes | 0.542% | 3/15/2017 | — | 50.0 | |||||||||||||||
| — | 50.0 | United States Treasury Notes | 0.515% | 3/31/2017 | — | 50.0 | |||||||||||||||
| — | 69.6 | United States Treasury Notes | 0.550% - 0.621% | 5/31/2017 | — | 69.6 | |||||||||||||||
| — | 40.1 | United States Treasury Notes | 0.580% | 6/15/2017 | — | 40.1 | |||||||||||||||
| — | 50.0 | United States Treasury Notes | 0.586% | 6/30/2017 | — | 50.0 | |||||||||||||||
| — | 30.0 | United States Treasury Notes | 0.668% - 0.710% | 7/31/2017 | — | 30.0 | |||||||||||||||
| 50.0 | — | United States Treasury Notes | 0.768% | 10/31/2017 | 50.0 | — | |||||||||||||||
| Principal | Issuer | Yield(4) | Maturity Date | Fair Value at | |||||||||||||||||
| September 30, 2017 | December 31, 2016 | ||||||||||||||||||||
| 2017 | 2016 | ||||||||||||||||||||
| (Unaudited) | |||||||||||||||||||||
| $ | 21.1 | $ | — | United States Treasury Notes | 0.812% - 0.935% | 11/30/2017 | $ | 21.0 | $ | — | |||||||||||
| 5.0 | — | United States Treasury Notes | 0.997% | 12/15/2017 | 5.0 | — | |||||||||||||||
| 50.0 | — | United States Treasury Notes | 1.148% - 1.180% | 1/31/2018 | 49.9 | — | |||||||||||||||
| 40.0 | — | United States Treasury Notes | 1.175% - 1.184% | 2/15/2018 | 40.0 | — | |||||||||||||||
| 48.0 | — | United States Treasury Notes | 1.200% | 2/28/2018 | 47.9 | — | |||||||||||||||
| 40.0 | — | United States Treasury Notes | 1.179% | 3/15/2018 | 40.0 | — | |||||||||||||||
TOTAL UNITED STATES TREASURY SECURITIES (Cost $1,017.3 and $1,745.0) | $ | 1,017.3 | $ | 1,744.9 | |||||||||||||||||
TOTAL OTHER MARKETABLE SECURITIES (Cost $4,293.3 and $4,054.0) | $ | 4,293.4 | $ | 4,053.8 | |||||||||||||||||
TOTAL MARKETABLE SECURITIES (Cost $5,182.8 and $4,937.9) | $ | 5,414.4 | $ | 5,135.3 | |||||||||||||||||
| LOANS RECEIVABLE—1.1% and 1.1% | Fair Value at | ||||||||||||||||||||
| Borrower | Interest Rate(7) | Maturity Date | September 30, 2017 | December 31, 2016 | |||||||||||||||||
| (Unaudited) | |||||||||||||||||||||
DJM Capital Partners(8) | 4.200% | 7/1/2018 | $ | 34.0 | $ | 32.3 | |||||||||||||||
| Simply Self Storage Portfolio | 8.250% | 9/6/2021 | 37.6 | 37.6 | |||||||||||||||||
| State Street Financial Center Junior Mezz | 6.500% | 11/10/2021 | 125.2 | 125.2 | |||||||||||||||||
| Charles River Plaza North | 6.080% | 4/6/2029 | 102.0 | 100.6 | |||||||||||||||||
TOTAL LOANS RECEIVABLE (Cost $296.5 and $294.8) | $ | 298.8 | $ | 295.7 | |||||||||||||||||
TOTAL INVESTMENTS (Cost $22,964.2 and $22,581.2) | $ | 27,183.5 | $ | 26,643.7 | |||||||||||||||||
ITEM 2. MANAGEMENT’S DISCUSSION AND ANALYSIS OF FINANCIAL CONDITION AND RESULTS OF OPERATIONS
The following discussion and analysis of the Account’s financial condition and results of operations should be read together with the consolidated financial statementsConsolidated Financial Statements and notes contained in this report and with consideration to the sub-section entitled “Forward-Looking Statements,” which begins below, and the section entitled “Item 1A. Risk Factors,” of the Account’sAccount's Annual Report on Form 10-K for the year ended December 31, 20162021, filed with the Securities and Exchange Commission on March 10, 2022 (the “Form 10-K”"Form 10-K") entitled “Item 1A. Risk Factors.”, as such risk factors may be updated in Item 1A of this Form 10-Q or in subsequent reports. The past performance of the Account is not indicative of future results.
Forward-looking Statements
Some statements in this Form 10-Q which are not historical facts may be “forward-looking statements” within the meaning of Section 27A of the Securities Act of 1933, Section 21E of the Securities Exchange Act of 1934 and the Private Securities Litigation Reform Act of 1995. Forward-looking statements include statements about management’s expectations, beliefs, intentions or strategies for the future, include the assumptions and beliefs underlying these forward-looking statements, and are based on current expectations, estimates and projections about the real estate industry, domestic and global economic conditions, including conditions in the credit and capital markets, the sectors, and markets in which the Account invests and operates, and the transactions described in this Form 10-Q. While management believes the assumptions underlying any of its forward-looking statements and information to be reasonable, such information may be subject to uncertainties and may involve certain risks which may be difficult to predict and are beyond management’s control. These risks and uncertainties could cause actual results to differ materially from those contained in any forward-looking statement. These risks and uncertainties include, but are not limited to, the risks associated with the following:
•Acquiring, owning and Owning Real Estate: The risks associated with acquiring and owningselling real property and real estate investments, including risks related to general economic and real estate market conditions, the availability of, and economic cost associated with, financing the Account’s properties, the risk that the Account’s properties become too concentrated (whether by geography, sector or by tenant mix), competition for acquiring real estate properties, leasing risk (including tenant defaults) and the risk of uninsured losses at properties (including due to terrorism, natural disasters, and acts of violence);
and (iii) high levels of cash and liquid non-real estate-related investments in the Account during times of appreciating real estate values can impair the Account’s overall return;
•Joint Venture Investments: The risks associated with joint ventures organized as limited partnerships or limited liability companies, as applicable,and real estate funds, including the risk that a co-venturer may have interests or goals inconsistent with those of the Account, that a co-venturer may have financial difficulties, and the risk that the Account may havegave limited rights with respect to operation of the property and transfer of the Account’s interest;
joint venture or that a co-venturer or fund manager may have financial difficulties;•Certain catastrophic losses that may be uninsurable, as well as risks related to climate-related changes and hazards, which could adversely impact the Account’s investment returns;
•The utilization of ESG criteria in its commercial real estate properties), includingunderwriting may result in the Account foregoing some commercial real estate market opportunities and subsequently underperforming relative to other investment vehicles that do not utilize such ESG criteria in selecting portfolio properties;
31
•Especially with respect to countries with emerging market, foreign commercial real properties, foreign real estate loans, foreign debt investments and foreign securities investments may experience unique risks such as changes in currency exchange rates, imposition of market controls or currency exchange controls, seizure, expropriation or nationalization of assets, political, risk, the risk associated with currency fluctuations (whether hedgedsocial or not),diplomatic events or unrest, regulatory and taxation risks and risks of enforcing judgments;
•Investments in REITs, including changes in the value of the Account and providerunderlying properties or by the quality of any credit extended, as well as exposure to market risk due to changing conditions in the liquidity guarantee atfinancial markets;
•Investments in mortgage-backed securities, which are subject to the same time as TIAA and its affiliates are serving as an investment manager to otherrisks inherent in real estate accounts or funds, including conflicts associated with satisfying its fiduciary dutiesinvesting, making mortgage loans and investing in debt securities. For example, the underlying mortgage loans may experience defaults, are subject to all such accountsprepayment risks and funds associated with purchasing, selling and leasing of properties;
are sensitive to economic conditions impacting the credit markets generally;•Investment securities issued by U.S. governmentGovernment agencies and U.S. government-sponsoredGovernment-sponsored entities, including the risk that the issuer may not have their securities backed by the full faith and credit of the U.S. government, and that transaction activity may fluctuate significantly from time to time,Government, which could negatively impactadversely affect the pricing and value of the securities and the Account’s ability to dispose of a security at a favorable time; and
such securities;•the changing conditions in financial markets may cause the Account’s investments or interest rates to experience price volatility;
•the level of current income from a portfolio of fixed-income investments may decline in certain interest rate volatilityenvironments;
•during periods of falling interest rates, an issuer may call (or repay) a fixed-income security prior to maturity, or pay off their loans sooner than expected, resulting in a decline in income;
•during periods of rising interest rates, borrowers may pay off their mortgage and other loans later than expected, preventing the Account from reinvesting principal proceeds at higher interest rates;
•securities issued by the U.S. Government or one of its agencies or instrumentalities may receive varying levels of support from the U.S. Government, which could affect the Account’s current income from an investment;ability to recover should they default;
•events affecting states and municipalities, including severe financial difficulties, may adversely impact the Account’s investments and its performance;
•the inability to receive the principal or interest collectable on multinational or supranational foreign debt;
•the Account’s investment decisions may cause the Account to underperform relative to others in the marketplace;
•foreign (non-U.S.) currencies may decline in value relative to the U.S. dollar and adversely affect the value of the Account’s investments impacted by foreign currencies;
32
•investments in derivatives and other types of hedging strategies may result in the Account losing more than the principal amount invested;
•currency management strategies may substantially change the Account’s exposure to currencies and currency exchange rates and could result in losses to the Account;
•transactions involving a counterparty to a derivative or other instrument, or to a third party responsible for servicing the instrument, are subject to the credit risk of the counterparty or third party;
•SEC Rule 144A securities may be less liquid and have less investor protections than publicly traded securities;
•illiquid investments may be difficult for the Account to sell for the value at which they are carried; and
•the Account could experience losses if banks fail.fail;
•Conflicts of interests associated with TIAA serving as investment manager of the Account and provider of the liquidity guarantee while also serving as an investment manager to other real estate accounts or funds;
•Lending securities, which has the Account bear the market risk with respect to the investment of collateral or a portion of the income generated by interest paid by the securities lending agent on the cash collateral balance; and
•The Account’s requirement to sell property in the event that TIAA owns too large of a percentage of the Account’s accumulation units, which sales could occur at a time or price that is not optimal for the Account’s returns.
More detailed discussions of certain of these risk factors are contained in the section of the Form 10-K entitled “Item 1A. Risk Factors” and "Part II, Item 1A, Risk Factors" in this section belowReport and also in the section below entitled “Quantitative and Qualitative Disclosures About Market Risk.” These risks could cause actual results to differ materially from historical experience or management’s present expectations.
Caution should be taken not to place undue reliance on management’s forward-looking statements, which represent management’s views only as of the date that this report is filed. Neither management nor the Account undertake any obligation to update publicly or revise any forward-looking statement, whether as a result of new information, changed assumptions, future events or otherwise.
Commercial real estate market statistics discussed in this section are obtained by the Account from sources that management considers reliable, but some of the data are preliminary for the period ended SeptemberJune 30, 20172022 and may be subsequently revised. Prior period data may have been adjusted to reflect updated calculations. Investors should not rely exclusively on the data presented below in forming a judgment regarding the current or prospective performance of the commercial real estate market generally.
ABOUT THE TIAA REAL ESTATE ACCOUNT
The Account was established, under the laws of New York, in February 1995 as an insurancea separate account of TIAA and interests in the Account were first offered to eligible participantscontract owners on October 2, 1995. The Account offers individual and group accumulating annuity contracts (with contributions made on a pre-tax or after-tax basis), as well as individual lifetime and term-certain variable payout annuity contracts (including the payment of death benefits to beneficiaries). Investors are entitled to transfer funds to or from the Account under certain circumstances. Funds invested in the Account for each category of contract are expressed in terms of units, and unit values will fluctuate depending on the Account’s performance.
Investment Objective and Strategy
The Account seeks to generate favorable long-termtotal returns primarily through the rental income and appreciation of real estate anda diversified portfolio of directly held, private real estate investments owned by the Account. The Account will also invest in non-realand real estate-related publicly traded securities and short-term higher quality liquid investments, that are easily converted to cash to enable the Account to meet participant redemption requests, purchase or improve properties, or cover other expense needs.while offering investors guaranteed, daily liquidity.
Real Estate-Related Investments. The Account intends to have between 75% and 85% of its net assets invested directly in real estate or real estate-related investments with the goal of producing favorable long-term returns primarily through rental income and appreciation. These investments may consist of:
33
•Direct ownership interests in domestic and foreign real estate;
•Direct ownership of real estate through interests in joint ventures; or
•Indirect interests in real estate through real estate-related securities, such as:
◦public and/or privately placed, domestic and foreign, registered and unregistered equity investments in REITs, which investments may consist of registered or unregistered common or preferred stock interests;
◦private real estate limited partnerships and limited liability companies;companies (collectively, "real estate funds");
◦investments in equity or debt securities of domestic and foreign companies whose operations involve real estate (i.e.(i.e., that primarily own, develop or manage real estate) which may not be REITs; and
◦domestic or foreign loans, including conventional commercial mortgage loans, participating mortgage loans, secured domestic and foreign (including U.K.) mezzanine loans, subordinated loans and collateralized mortgage obligations, including CMBS and other similar investments.
The Account’s principal investment strategy is to purchase direct ownership interests in income-producing real estate, primarily office, industrial, retail and multi-family residential properties. The Account is targeted to hold between 65% and 80%85% of the Account’s net assets in such direct ownership interests at any time. Historically, approximately 70% of the Account’s net assets have been comprised of such direct ownership interests in real estate.interests.
In addition, while the Account is authorized to hold up to 25% of its net assets in liquid real estate-related securities, such asincluding publicly traded REITs and CMBS, managementCMBS. Management intends that the Account will not hold more than 10% of its net assets in such securities on a long-term basis. Traditionally, less than 10%As of June 30, 2022, the Account did not hold any publicly traded REIT securities or CMBS.
In making commercial real estate investments within the Account, TIAA seeks to make investments that are suitable from a financial perspective and whose activities are generally consistent with industry recognized ESG criteria. The Account intends to promote awareness of these criteria to its joint venture partners, vendors and other stakeholders in connection with portfolio related activity involving commercial real estate transactions. TIAA believes awareness, and, as appropriate, implementation of ESG criteria in commercial real estate holdings is beneficial to total long-term returns for the Account. In its evaluation of commercial real estate opportunities, the Account will take ESG considerations into account as part of the Account’s net assets have been comprisedfinancial assessment of interests in these securities; although,a commercial real estate portfolio asset, and not to achieve a desired outcome or as an investment qualification or screen. Ultimately, the Account has recently held approximately 10% of its net assets in equity REIT securities at times. In addition, underwill make an investment decision that incorporates ESG criteria only to the Account’s current investment guidelines,extent that the Accountcriteria is authorizedreasonably expected to hold upenhance the ability to 10% of its net assets in CMBS. As of September 30, 2017, REIT securities comprised approximately 4.5% ofachieve desired returns for the Account’s net assets, and the Account held no CMBS as of such date.Account.
•Money market instruments and other cash equivalents. These will usually be high-quality, short-term debt instruments, including U.S. Government or government agency securities, commercial paper, certificates of deposit, bankers’ acceptances, repurchase agreements, interest-bearing time deposits, and corporate debt securities; and
34
Liquid Securities.Securities Generally. Primarily due to management’s need to manage fluctuations in cash flows, in particular during and immediately following periods of significant participantcontract owner net transfer activity into or out of the Account, the Account may, on a temporary basis (i) exceed the upper end of its targeted holdings (currently 35% of the Account’s net assets) in liquid securities of all types, including both publicly traded non-real estate-related liquid investments and liquid real estate-related securities, such as REITs, ABS, RMBS, CMBS and CMBS,MBS, or (ii) be below the low end of its targeted holdings in such liquid securities (currently 15% of the Account’s net assets).
The portion of the Account’s net assets invested in liquid investments of all types may exceed the upper end of its target, for example, if (i) the Account receives a large inflow of money in a short period of time, in particular due to significant participantcontract owner transfer activity into the Account, (ii) the Account receives significant proceeds from sales or financings of direct real estate assets, (iii) there is a lack of attractive direct real estate investments available on the market, and/or (iv) the Account anticipates more near-term cash needs, including to apply to acquire or improve direct real estate investments, pay expenses or repay indebtedness.
Foreign Investments.Investments. The Account from time to time willmay also make foreign real estate and foreign real estate-related investments and foreign liquid, fixed-income investments. Under the Account’s investment guidelines, investments in direct foreign real estate and real estate loans, together with foreign real estate-related securities and foreign non-real estate-related liquid, fixed-income investments may not comprise more than 25% of the Account’s net assets. However, management doesn't intend such foreign investments, in the aggregate, to exceed 10% of the Account's net assets. As of SeptemberJune 30, 2017,2022, the Account did not hold anyfair value of the Account's foreign real estate investments.
investments was $39.0 million.
SECOND QUARTER 20172022 U.S. ECONOMIC AND COMMERCIAL REAL ESTATE OVERVIEW
The Account invests primarily in high-quality, core real estate in order to meet its investment objective of obtaining favorable long-term returns through rental income and the appreciation of its real estate holdings.
Economic Overview and Outlook
| Key Macro Economic Indicators* | Actuals | Forecast | ||||||||||||||||||||||||
| 2021 | 2Q 2022 | 2022 | 2023 | |||||||||||||||||||||||
Economy(1) | ||||||||||||||||||||||||||
| Gross Domestic Product ("GDP") | 5.7% | (0.9)% | 2.5% | 1.6% | ||||||||||||||||||||||
Employment Growth (2) | 549 | 375 | 337 | 125 | ||||||||||||||||||||||
| Unemployment Rate | 5.4% | 3.6% | 3.7% | 3.9% | ||||||||||||||||||||||
Interest Rates(3) | ||||||||||||||||||||||||||
| 10 Year Treasury | 1.5% | 3.0% | 3.3% | 3.1% | ||||||||||||||||||||||
| 2016 | 1Q 2017 | 2Q 2017 | 3Q 2017 | Forecast | ||||||
| 2017 | 2018 | |||||||||
Economy(1) | ||||||||||
| Gross Domestic Product ("GDP") | 1.5% | 1.2% | 3.1% | 3.0% | 2.2% | 2.4% | ||||
| Employment Growth (Thousands) | 2,240 | 498 | 562 | 274 | 2,100 | 1,800 | ||||
| Unemployment Rate | 4.9% | 4.5% | 4.4% | 4.2% | 4.4% | 4.1% | ||||
Interest Rates(2) | ||||||||||
| 10 Year Treasury | 1.8% | 2.4% | 2.3% | 2.2% | 2.3% | 2.8% | ||||
Sources: Blue Chip Economic Indicators, Blue Chip Financial Forecasts,Bloomberg, BEA, Bureau of Labor Statistics (“BLS”), Federal Reserve and Moody’s Analytics
*Data subject to revision (1)GDP growth rates are annual rates. Quarterly unemployment rates are the reported value |
(2)Values presented in thousands. Forecast values represent average monthly employment growth in the respective periods.
(3)Treasury rates are an average over the stated period.
35
Economic patterns have been abnormal for the past two years but are slowly reverting to pre-pandemic form. Countries and sectors are normalizing at different rates, creating market turbulence and contradicting economic forecasts. Significant moderation in inflation is expected over the next 18 months as financial conditions tighten and economic growth slows in the world's largest economies; however, a mild recession is certainly not out of the question. U.S. GDP is projected to have increased by 1% quarter-over-quarter (seasonally adjusted annualized rate) in the second quarter of 2022 and 2.2% year-over-year. The economy added over one million jobs in the second quarter of 2022, according to the nonfarm payroll measurement from the U.S. Bureau of Labor Statistics, bringing the unemployment rate at 1.0%down to 1.25% “in view3.6% as of realizedJune 2022.
Consumer spending is supporting growth in the developed world, with many countries still benefiting from pandemic-era pent-up demand and expectedexcess savings. Jobs have returned quickly, and wages are rising about as fast as prices, yet consumers have never reported feeling more pessimistic. Sentiment surveys register lower readings today than even amid the 2008 financial crisis. At the same time, however, consumer spending growth is keeping pace with inflation. Rising net worth and job security will be far more significant predictors of consumer behavior than general sentiment.
Geopolitical strife, such as the continuing military conflict between Russia and Ukraine, has contributed to persistent energy and food cost increases. This affects every consumer, but higher-income households and wealthier countries are relatively insulated from the direct consequences. Some emerging markets may soon be susceptible to acute food shortages and even social unrest unless supplies replenish and price increases relent. The U.S. will have a narrower base of consumption growth this year as fewer households meaningfully increase their real spending.
Every economic data point is being refracted through the prism of how central banks will respond to higher inflation. This puts the labor market, conditionsa leading inflation indicator because wages play a significant role in determining prices, at the center of our attention for the balance of 2022. News of job or pay freezes sounds negative, but they are necessary to slow the rapid pace of aggregate demand growth, rebalance the economy and inflation”, as indicatedallow policymakers to take their feet off the brakes. While a lot more central bank rate hikes lie ahead, a modest softening in employment data can help ensure that central banks don't wholly halt economic expansion.
In June 2022, the September meeting minutes. The committee expects that economic conditions will continue to evolveU.S. Federal Reserve (“Fed”) met in a manner that will warrant gradualparticularly chaotic period for financial markets and delivered a 75 basis point (bps) interest rate increases.hike. The FOMC is widely expected to raise the federal funds rate target range by 25 basis pointsnow stands at 1.50% - 1.75%, and it seems certain to travel higher at the Decembernext meeting. Inflation has not moderated as much as the Fed or the market expected it to over the year's first five months. This is mainly because the ongoing war in Ukraine has increased the prices of goods and services sensitive to food and energy costs, such as gasoline and core services like airfares.
bit further.
Real Estate Market Conditions and Outlook
Real estate has produced strong returns over the last few years but has only priced in the effects of higher inflation and monetary policy tightening to a limited extent. Commercial real estate conditions remained(“CRE”) investments have been relatively steady duringinsulated from recent market volatility over the third quarter of 2017. Tenant demand was generally strong enough to support modest vacancy rate improvementspast two quarters, but CRE appreciation may be negative in the short term and have values correct due to upward pressure on capitalization rates. Some properties in strongly performing sectors, such as the housing, industrial, and storage sectors, will however continue to benefit from high-income growth as rolling leases are marked-up to account for higher rents.
The retail and office and industrial sectors while apartment and retail market conditions softened. Transaction activityhave continued to weaken comparedunderperform due to 2016 levels.changes in structural demand initially caused by the pandemic, and contractionary economic drivers, such as decreases in office-using employment and consumer spending. Values in cyclical sectors, such as lodging and gaming, and sectors with the strongest appreciation over the last year, such as industrial, self storage, and life science, may correct in the short term due to capitalization rate expansion. However, properties that transport and store real assets, such as warehouses and cold-storage properties,
36
could be more inflation-resistant and insulated from short-term volatility. Additionally, apartment properties, particularly affordable properties, may outperform due to a decrease in mortgage demand, which will support the rental market. According to Real Capital Analytics, (“RCA”) reported that salesU.S. real estate transaction volumes are up 17% year-to-year as of office,June 2022. Over the past year, apartments and industrial retail,have captured approximately 63% of total U.S. transaction volumes, illustrating the strong investor interest in these two property types.
The Account earned a net 5.11% return in the second quarter of 2022 and multi-family properties totaled $102.2 billion during third quarter 2017, a 5.1% decline23.04% over the last year. The strong performance resulted from third quarter 2016. Property pricing as calculated bymaterially positive appreciation within the Green Street Advisor Commercial Property Price Index (“CPPI”)industrial, housing, and alternative real estate sectors over both periods. Favorable borrowing costs and attractive supply and demand fundamentals resulted in increased 1.0% duringinvestor demand, which was the third quarter on a year-over-year basis. During 2017, property pricing has been essentially flat as modest increases in capdominant contributor to appreciation; however, current market conditions and rising interest rates have largely offset income growth.reduced investor appetite in these sectors. As of June 30, 2022, the Account's leverage position was 17.2%. This low level of leverage and ability to access financing at attractive rates allows the Account to opportunistically deploy capital during periods of market volatility when other funds may focus on shoring up balance sheets. The Account expects to continue to seek opportunities that improve portfolio diversification throughout 2022 by selling lower productivity assets and acquiring assets with higher growth potential and economic resiliency.
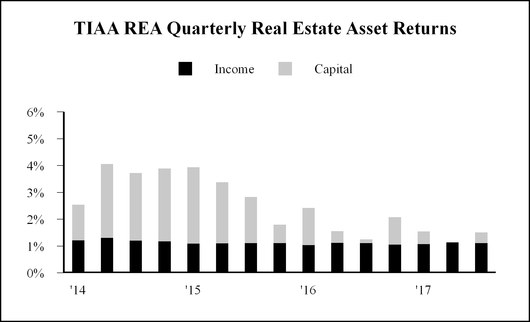
Top 5 Metro Areas by Fair Market Value(1) | Account % Leased Fair Value Weighted(2) | Number of Property Investments | Metro Area Fair Value as a % of Total RE Portfolio(3) | Metro Area Fair Value as a % of Total Investments | ||||||||||
| Los Angeles-Long Beach-Anaheim, CA | 85.2% | 23 | 10.1% | 8.4% | ||||||||||
| Washington-Arlington-Alexandria, DC-VA-MD-WV | 84.5% | 18 | 9.4% | 7.8% | ||||||||||
| Riverside-San Bernardino-Ontario, CA | 100.0% | 7 | 9.4% | 7.8% | ||||||||||
| New York-Newark-Jersey City, NY-NJ-PA | 85.2% | 14 | 6.8% | 5.6% | ||||||||||
| Miami-Fort Lauderdale-West Palm Beach, FL | 95.2% | 14 | 6.7% | 5.6% | ||||||||||
| Top 5 Metro Areas by Fair Market Value | Account % Leased Fair Value Weighted* | Number of Property Investments | Metro Area Fair Value as a % of Total RE Portfolio** | Metro Area Fair Value as a % of Total Investments |
| New York-Jersey City-White Plains, NY-NJ | 93.3% | 16 | 13.1% | 10.3% |
| Washington-Arlington-Alexandria, DC-VA-MD-WV | 86.4% | 13 | 11.4% | 9.0% |
| Los Angeles-Long Beach-Glendale, CA | 86.5% | 12 | 8.9% | 7.0% |
| Boston, MA | 91.6% | 5 | 7.1% | 5.5% |
| Seattle-Bellevue-Everett, WA | 91.8% | 6 | 5.8% | 4.6% |
(2)Weighted by fair value, which differs from the calculations provided for market comparisons to CoStar and RealPage data and are used here to reflect the fair value of the Account’s monetary investments in those markets.
(3)Wholly-owned properties are represented at fair value and gross of any debt, while joint venture properties are represented at the net equity value.
Office
Vacancy nationwide remained relatively flat with a slight increase from 12.2% in the first quarter of 2017 as compared2022 to 41,000 during12.3% in the second quarter. The professional and business services sector, which includes many facetsquarter of technology-related employment, added 99,000 jobs as compared to 140,000 previously. Although job growth in both sectors moderated compared to second quarter, labor market conditions were strong enough to support a decline in the national office vacancy rate to 12.9%,2022, as reported by CB Richard Ellis Econometric Advisors (“CBRE-EA”). Several high-techCoStar. Vacancy rates have remained high in large downtown markets, including San Francisco, Seattle, Austin, Nashville, Raleigh, andsuch as New York maintained single-digit vacancy rates.
37
As of June 30, 2022, the Account's rents from office tenants were not materially affected by the COVID-19 pandemic, but the duration of the Account’s large assets in Los Angeles, which should bringeffects of the vacancy rate down in subsequent quarters.
| Account Square Foot Weighted Average Vacancy | Market Vacancy* | ||||||||||||||||||
| Top 5 Office Metropolitan Areas | Total Sector by Metro Area ($M) | % of Total Investments | 2017 Q3 | 2017 Q2 | 2017 Q3 | 2017 Q2 | |||||||||||||
| Account / Nation | 15.1 | % | 14.8 | % | 12.9 | % | 13.0 | % | |||||||||||
| Washington-Arlington-Alexandria, DC-VA-MD-WV | $ | 1,475.0 | 5.4 | % | 16.5 | % | 13.7 | % | 15.4 | % | 15.6 | % | |||||||
| Boston, MA | 1,467.0 | 5.4 | % | 10.9 | % | 11.3 | % | 9.8 | % | 9.8 | % | ||||||||
| San Francisco-Redwood City-South San Francisco, CA | 1,132.6 | 4.2 | % | 8.3 | % | 6.6 | % | 7.1 | % | 7.4 | % | ||||||||
| New York-Jersey City-White Plains, NY-NJ | 1,125.2 | 4.1 | % | 22.5 | % | 20.0 | % | 9.4 | % | 9.5 | % | ||||||||
| Los Angeles-Long Beach-Glendale, CA | 742.2 | 2.7 | % | 27.0 | % | 27.6 | % | 13.6 | % | 13.7 | % | ||||||||
| Account Square Foot Weighted Average Vacancy | Market Vacancy(2) | |||||||||||||||||||||||||||||||||||||
Top 5 Office Metropolitan Areas(1) | Total Sector by Metro Area ($M) | % of Total Investments | Q2 2022 | Q1 2022 | Q2 2022 | Q1 2022 | ||||||||||||||||||||||||||||||||
| 19.2 | % | 18.0 | % | 12.3 | % | 12.2 | % | |||||||||||||||||||||||||||||||
| Washington-Arlington-Alexandria, DC-VA-MD-WV | $ | 1,487.6 | 4.3 | % | 17.4 | % | 15.3 | % | 15.1 | % | 14.7 | % | ||||||||||||||||||||||||||
| Boston-Cambridge-Newton, MA-NH | 1,206.1 | 3.5 | % | 17.7 | % | 21.6 | % | 9.1 | % | 9.0 | % | |||||||||||||||||||||||||||
| New York-Newark-Jersey City, NY-NJ-PA | 1,105.6 | 3.2 | % | 25.7 | % | 30.7 | % | 12.9 | % | 12.3 | % | |||||||||||||||||||||||||||
| Los Angeles-Long Beach-Anaheim, CA | 973.3 | 2.8 | % | 18.8 | % | 17.7 | % | 13.5 | % | 13.6 | % | |||||||||||||||||||||||||||
| San Diego-Carlsbad, CA | 788.4 | 2.3 | % | 2.7 | % | 2.7 | % | 10.5 | % | 11.2 | % | |||||||||||||||||||||||||||
(1)The average availability rate of the Account’s industrial properties increasedtable above has been standardized to 9.7% in the third quarter of 2017 from 8.2% during the second quarter. Availability rates in three of the Account’s top five industrial markets were near or well below their respective market averages. Several tenants vacated space in one of the Account’s Los Angeles properties, causing the averagedepict MSA definitions.
(2)Source: CoStar. Market vacancy to rise in that area. One tenant downsized a significant amount of space in one of the Account’s Tacoma properties, contributing to the vacancy rise there, but a new tenant has since signed a lease to backfill the vacant space.
| Account Square Foot Weighted Average Vacancy | Market Vacancy* | ||||||||||||||||||
| Top 5 Industrial Metropolitan Areas | Total Sector by Metro Area ($M) | % of Total Investments | 2017 Q3 | 2017 Q2 | 2017 Q3 | 2017 Q2 | |||||||||||||
| Account / Nation | 9.7 | % | 8.2 | % | 7.7 | % | 7.8 | % | |||||||||||
| Riverside-San Bernardino-Ontario, CA | $ | 772.2 | 2.8 | % | 0.0 | % | 0.0 | % | 6.2 | % | 6.4 | % | |||||||
| Los Angeles-Long Beach-Glendale, CA | 320.1 | 1.2 | % | 9.0 | % | 5.1 | % | 4.2 | % | 3.9 | % | ||||||||
| New York-Jersey City-White Plains, NY-NJ | 307.2 | 1.1 | % | 2.4 | % | 3.2 | % | 7.2 | % | 7.0 | % | ||||||||
| Tacoma-Lakewood, WA | 295.2 | 1.1 | % | 7.3 | % | 4.1 | % | 4.7 | % | 4.7 | % | ||||||||
| Dallas-Plano-Irving, TX | 263.9 | 1.0 | % | 4.7 | % | 6.1 | % | 8.0 | % | 8.1 | % | ||||||||
Industrial
The industrial sector saw record-breaking activity in the Seattle-Tacoma total.first half of 2022. The pandemic has accelerated consumers' long-term shift to e-commerce, and this shift has caused demand for industrial space to rise to unprecedented levels. Construction of industrial properties is also at a record high as developers try to keep up with the demand but timing of delivery remains uncertain as supply chain issues are creating challenges.
The national industrial availability rate for the second quarter of 2022 was 3.9%, which is the lowest level ever recorded, as compared to 4.1% during the prior quarter, as reported by CoStar. The average vacancy rate of the industrial properties held by the Account increased from 3.9% in the first quarter of 2022 to 8.0% in the second quarter of 2022. The increase is due to the Account purchasing two newly developed industrial portfolios in the Dallas-Fort Worth area that are currently in their lease-up period.
As of June 30, 2022, the Account's rents from industrial tenants were not materially affected by the COVID-19 pandemic, but the duration of the effects of the COVID-19 pandemic remain unknown. Tenants requesting rent relief have generally requested rent deferrals for a limited period of time (i.e., less than six months), with the unpaid rent to be paid over the duration of the remaining lease. Additionally, if tenants vacate due to lease expirations, redeployment of the vacated space may be challenging in the near term due to unfavorable leasing conditions, though demand for industrial space has been relatively steady throughout the pandemic.
38
| Account Square Foot Weighted Average Vacancy | Market Vacancy(2) | |||||||||||||||||||||||||||||||||||||
Top 5 Industrial Metropolitan Areas(1) | Total Sector by Metro Area ($M) | % of Total Investments | Q2 2022 | Q1 2022 | Q2 2022 | Q1 2022 | ||||||||||||||||||||||||||||||||
| Account / Nation | 8.0 | % | 3.9 | % | 3.9 | % | 4.1 | % | ||||||||||||||||||||||||||||||
| Riverside-San Bernardino-Ontario, CA | $ | 2,598.4 | 7.5 | % | — | % | — | % | 1.6 | % | 1.5 | % | ||||||||||||||||||||||||||
| Los Angeles-Long Beach-Anaheim, CA | 752.4 | 2.2 | % | 2.9 | % | 1.6 | % | 1.8 | % | 1.6 | % | |||||||||||||||||||||||||||
| Dallas-Fort Worth-Arlington, TX | 616.9 | 1.8 | % | 10.0 | % | — | % | 5.6 | % | 5.8 | % | |||||||||||||||||||||||||||
| Seattle-Tacoma-Bellevue, WA | 615.8 | 1.8 | % | — | % | — | % | 4.2 | % | 3.9 | % | |||||||||||||||||||||||||||
| Miami-Fort Lauderdale-West Palm Beach, FL | 515.9 | 1.5 | % | — | % | 1.2 | % | 2.8 | % | 3.0 | % | |||||||||||||||||||||||||||
(1)The table above has been standardized to depict MSA definitions.
(2)Source: CoStar. Market vacancy is the percentage of space available for rent. Account vacancy is the square foot-weighted percentage of unleased space. Market vacancy rates are subject to change.
Multi-Family
demand for apartments. The vacancy rate of the Account’s multi-familyapartment properties fellincreased slightly to 6.4% during6.9% in the thirdsecond quarter of 2022 as compared to 7.0%6.4% in the second quarter. prior quarter driven by expiring leases at several student housing properties.
As shownof June 30, 2022, the Account's rents from multifamily tenants were not materially affected by the COVID-19 pandemic, but the duration of the effects of the COVID-19 pandemic remain unknown. Additionally, if tenants vacate due to lease expirations, redeployment of the vacated space may be challenging in the followingnear term due to unfavorable leasing conditions. Rent concessions for new and existing tenants have moderately increased in recent months in an effort to generate and keep occupancy.
| Account Units Weighted Average Vacancy | Market Vacancy(2) | |||||||||||||||||||||||||||||||||||||
Top 5 Apartment Metropolitan Areas(1) | Total Sector by Metro Area ($M) | % of Total Investments | Q2 2022 | Q1 2022 | Q2 2022 | Q1 2022 | ||||||||||||||||||||||||||||||||
| Account / Nation | 6.9 | % | 6.4 | % | 3.2 | % | 2.5 | % | ||||||||||||||||||||||||||||||
| Washington-Arlington-Alexandria, DC-VA-MD-WV | $ | 877.4 | 2.5 | % | 7.0 | % | 8.4 | % | 3.4 | % | 2.6 | % | ||||||||||||||||||||||||||
| Los Angeles-Long Beach-Anaheim, CA | 876.4 | 2.5 | % | 5.6 | % | 6.2 | % | 2.7 | % | 2.1 | % | |||||||||||||||||||||||||||
| Miami-Fort Lauderdale-West Palm Beach, FL | 771.2 | 2.2 | % | 6.8 | % | 6.4 | % | 1.5 | % | 1.5 | % | |||||||||||||||||||||||||||
| Atlanta-Sandy Springs-Roswell, GA | 447.8 | 1.3 | % | 8.5 | % | 11.9 | % | 4.3 | % | 3.1 | % | |||||||||||||||||||||||||||
| San Diego-Carlsbad, CA | 401.2 | 1.2 | % | 4.2 | % | 2.7 | % | 1.7 | % | 1.3 | % | |||||||||||||||||||||||||||
(1)The table average vacancy rates in the Account’s top five apartment markets are at or above their comparable market averages. Strong leasing activity at one of the Account’s properties in New York improved vacancyhas been standardized to market average. The delivery and lease-up of several new projects in the local sub-market impacted vacancy in the Account’s properties in Denver. The Account’s properties in Fort Lauderdale benefited from increased leasing activity during the end of the summer while the overall market experienced significant deliveries.depict MSA definitions.
| Account Units Foot Weighted Average Vacancy | Market Vacancy* | ||||||||||||||||||
| Top 5 Apartment Metropolitan Areas | Total Sector by Metro Area ($M) | % of Total Investments | 2017 Q3 | 2017 Q2 | 2017 Q3 | 2017 Q2 | |||||||||||||
| Account / Nation | 6.4 | % | 7.0 | % | 4.6 | % | 4.6 | % | |||||||||||
| New York-Jersey City-White Plains, NY-NJ | $ | 863.1 | 3.2 | % | 3.1 | % | 4.8 | % | 3.1 | % | 3.2 | % | |||||||
| Washington-Arlington-Alexandria, DC-VA-MD-WV | 803.2 | 3.0 | % | 8.2 | % | 8.6 | % | 4.7 | % | 4.5 | % | ||||||||
| Los Angeles-Long Beach-Glendale, CA | 558.9 | 2.1 | % | 6.2 | % | 5.9 | % | 4.0 | % | 3.9 | % | ||||||||
| Denver-Aurora-Lakewood, CO | 327.9 | 1.2 | % | 7.7 | % | 5.3 | % | 4.9 | % | 5.2 | % | ||||||||
| Fort Lauderdale-Pompano Beach-Deerfield Beach, FL | 295.9 | 1.1 | % | 8.3 | % | 12.3 | % | 6.0 | % | 5.6 | % | ||||||||
(2)Source: RealPage. Market vacancy is the percentage of units vacant. The Account’s vacancy is the percentage of unleased units. Market vacancy rates are subject to change.
39
Retail
Retail tenants requesting rent relief have generally requested rent deferrals for a limited period of time (i.e., less than six months), with the unpaid rent to be paid over the duration of the remaining lease. The duration of the effects of the COVID-19 pandemic remain unknown; the Account is closely monitoring the collectability of accrued rental income and adjusting its allowances for uncollectible rent as needed.
| Account Units Weighted Average Vacancy | Market Vacancy* | |||||||||||||||||||||||||||||||||||||
| Total Exposure ($M) | % of Total Investments | Q2 2022 | Q1 2022 | Q2 2022 | Q1 2022 | |||||||||||||||||||||||||||||||||
| All Retail | 10.5 | % | 10.8 | % | 4.4 | % | 4.5 | % | ||||||||||||||||||||||||||||||
| Lifestyle & Mall | $ | 1,693.9 | 4.9 | % | 14.1 | % | 14.0 | % | 6.9 | % | 7.2 | % | ||||||||||||||||||||||||||
| Neighborhood, Community & Strip | 1,387.2 | 4.0 | % | 6.9 | % | 7.3 | % | 6.3 | % | 6.4 | % | |||||||||||||||||||||||||||
| Power Center** | 472.1 | 1.4 | % | 10.8 | % | 15.2 | % | 4.9 | % | 5.2 | % | |||||||||||||||||||||||||||
*Source: CoStar. Market vacancy is defined as the percentage of space available for rent. The Account’s retail investments havevacancy is the square foot-weighted percentage of unleased space. Market vacancy rates below 10.0%, whichare subject to change.
**The Power Center designation is reflectivereserved for properties with three or more anchor units. Anchor units are leased to large retailers such as department stores, home improvement stores, and warehouse clubs. Properties with the Neighborhood, Community and Strip designation consist of two or less anchor units.
Hotel
The impact of the overall high quality of the retail portfolio.
The biggest riskAccount's exposure to the US economyhospitality sector is exogenous.limited to one hotel in the Dallas metro area. The geopolitical landscape hashotel is located in a business park in the Dallas metro area and caters largely to business travelers. Key metrics to track hotel performance include occupancy, the average daily rate (“ADR”) and revenue per available room (“RevPAR”). For the quarter ended June 30, 2022, occupancy of the property increased uncertainty. Expected cutsto 51.6%, as compared to 35.5% in U.S. personalthe previous quarter. ADR and corporate tax rates appear increasingly unlikelyRevPAR were $132.54 and $109.58, respectively, for the second quarter of 2022, as compared to occur$126.66 and $69.03, respectively, in 2017. Nonetheless, if domestic economic conditions approximate economist expectations, real estate market conditions should remain healthy into 2018.the prior quarter.
40
INVESTMENTS
As of SeptemberJune 30, 2017,2022, the Account hadheld 83.3% of its total net assets of $24.8 billion, a 2.2% increase from December 31, 2016. The increaseinvestments in the Account’s net assets was primarily driven by net investment income and appreciation in value of the Account’s investments.
The outstanding principal on mortgage loans payable on the Account’s wholly-owned real estate portfolio as of SeptemberJune 30, 20172022 was $2.3$2.1 billion. The Account’s proportionate share of outstanding principal on mortgage loans payable within its joint venture investments was $2.2$3.3 billion, which is netted against the underlying properties when determining the joint venture investment’s fair value presented on the consolidated schedulesConsolidated Schedules of investments. When the mortgage loans payable within the joint venture investments are considered, totalInvestments. Total outstanding principal on the Account’s portfolio as of SeptemberJune 30, 20172022, inclusive of loans payable within the joint venture investments, $249.5 million in loans collateralized by a loan receivable, $500.0 million outstanding on the Account's line of credit and $500.0 million in senior notes payable, was $4.5$6.6 billion, which represented a loan to valueloan-to-value ratio of 15.2%17.2%. The Account has no Account-level debt.
Management believes that the Account’s real estate portfolio is diversified by location and property type. The Account’s largest investment, Fashion Show located in Las Vegas, NV, represented 3.9% of total real estate investments and 3.1% of total investments. As discussed in the Account’s prospectus, the Account does not intend to buy and sell its real estate investments simply to make short-term profits. Rather, the Account’s general strategy in selling real estate investments is to dispose of those assets that management believes (i) have maximized in value, (ii) have underperformed or face deteriorating property-specific or market conditions, (iii) need significant capital infusions in the future, (iv) are appropriate to dispose of in order to remain consistent with the Account’s intent to diversify the Account by property type and geographic location (including reallocating the Account’s exposure to or away from certain property types in certain geographic locations), or (v) otherwise do not satisfy the investment objectives of the Account. Management, from time to time, will evaluate the need to manage liquidity in the Account as part of its analysis as to whether to undertake a particular asset sale. The Account couldmay reinvest any sale proceeds that it does not need to pay operating expenses or to meet debt service or redemption requests (e.g.(e.g., participantcontract owner withdrawals or benefit payments).
The following table lists the Account's ten largest investments as of SeptemberJune 30, 2017.2022. For information regarding the Account's diversification of real estate assets by region and property type, see Note 3—Credit Risk Concentrations.Concentrations of Risk.
| Ten Largest Real Estate Investments | ||||||||||||||||||||||||||||||||||||||||||||||||||||||||
| Property Investment Name | Ownership Percentage | City | State | Type | Gross Real Estate Fair Value(1) | Debt Fair Value(2) | Net Real Estate Fair Value(3) | Property as a % of Total Real Estate Portfolio(4) | Property as a % of Total Investments(5) | |||||||||||||||||||||||||||||||||||||||||||||||
| Ontario Industrial Portfolio | 100% | Ontario | CA | Industrial | $ | 1,335.0 | $ | — | $ | 1,335.0 | 4.1% | 3.5% | ||||||||||||||||||||||||||||||||||||||||||||
| Simpson Housing Portfolio | 80% | Various | U.S.A. | Apartment | 1,101.2 | 388.8 | 712.4 | 3.4% | 2.9% | |||||||||||||||||||||||||||||||||||||||||||||||
| Fashion Show | 50% | Las Vegas | NV | Retail | 985.4 | 414.4 | 571.0 | 3.1% | 2.6% | |||||||||||||||||||||||||||||||||||||||||||||||
| 1001 Pennsylvania Avenue | 100% | Washington | DC | Office | 804.4 | 304.7 | 499.7 | 2.5% | 2.1% | |||||||||||||||||||||||||||||||||||||||||||||||
| The Florida Mall | 50% | Orlando | FL | Retail | 737.5 | 298.6 | 438.9 | 2.3% | 2.0% | |||||||||||||||||||||||||||||||||||||||||||||||
| Colorado Center | 50% | Santa Monica | CA | Office | 634.2 | 262.3 | 371.9 | 2.0% | 1.7% | |||||||||||||||||||||||||||||||||||||||||||||||
| Lincoln Centre | 100% | Dallas | TX | Office | 574.7 | — | 574.7 | 1.8% | 1.5% | |||||||||||||||||||||||||||||||||||||||||||||||
| Storage Portfolio II | 90% | Various | U.S.A. | Storage | 544.8 | 172.5 | 372.3 | 1.7% | 1.4% | |||||||||||||||||||||||||||||||||||||||||||||||
| 99 High Street | 100% | Boston | MA | Office | 529.8 | 261.5 | 268.3 | 1.7% | 1.4% | |||||||||||||||||||||||||||||||||||||||||||||||
| 701 Brickell Avenue | 100% | Miami | FL | Office | 504.6 | 176.9 | 327.7 | 1.6% | 1.4% | |||||||||||||||||||||||||||||||||||||||||||||||
(1)The Account's share of the fair value of the property investment, gross of debt.
(2)Debt fair values are presented at the Account's ownership interest.
(3)The Account's share of the fair value of the property investment, net of debt.
41
| Ten Largest Real Estate Investments | ||||||||||||||||||
| Property Investment Name | City | State | Type | Fair Value (in millions)(1) | Property as a % of Total Real Estate Portfolio | Property as a % of Total Investments | ||||||||||||
| Fashion Show | Las Vegas | NV | Retail | $ | 837.9 | (2) | 3.9 | % | 3.1 | % | ||||||||
| 1001 Pennsylvania Avenue | Washington | DC | Office | 810.0 | (3) | 3.8 | % | 3.0 | % | |||||||||
| The Florida Mall | Orlando | FL | Retail | 754.8 | (4) | 3.5 | % | 2.8 | % | |||||||||
| DDR | Various | USA | Retail | 615.8 | (5) | 2.9 | % | 2.3 | % | |||||||||
| Fourth and Madison | Seattle | WA | Office | 527.0 | (6) | 2.5 | % | 1.9 | % | |||||||||
| 501 Boylston Street | Boston | MA | Office | 506.3 | (7) | 2.4 | % | 1.9 | % | |||||||||
| 99 High Street | Boston | MA | Office | 504.0 | 2.4 | % | 1.9 | % | ||||||||||
| 425 Park Avenue | New York | NY | Ground Lease | 454.0 | 2.1 | % | 1.7 | % | ||||||||||
| 780 Third Avenue | New York | NY | Office | 429.0 | (8) | 2.0 | % | 1.6 | % | |||||||||
| Ontario Industrial Portfolio | Ontario | CA | Industrial | 397.4 | 1.9 | % | 1.5 | % | ||||||||||
(5)Total investments are the aggregate fair value of all investments held by the Account, gross of debt. Total investments, as calculated within this table, will vary from total investments, as calculated in the Account's Schedule of Investments, as joint venture investments are presented in the Schedule of Investments at their net equity position in accordance with U.S. Generally Accepted Accounting Principals ("GAAP").
Results of Operations
Net Investment Income
The following table shows the results of operations for the ninethree months ended SeptemberJune 30, 20172022 and 20162021 and the dollar and percentage changes for those periods (dollars in millions, unaudited)millions).
| For the Three Months Ended June 30, | Change | |||||||||||||||||||||||||
| 2022 | 2021 | $ | % | |||||||||||||||||||||||
| INVESTMENT INCOME | ||||||||||||||||||||||||||
| Real estate income, net: | ||||||||||||||||||||||||||
| Rental income | $ | 314.1 | $ | 305.3 | $ | 8.8 | 2.9 | % | ||||||||||||||||||
| Real estate property level expenses: | ||||||||||||||||||||||||||
| Operating expenses | 71.1 | 63.6 | 7.5 | 11.8 | % | |||||||||||||||||||||
| Real estate taxes | 50.3 | 51.9 | (1.6) | (3.1) | % | |||||||||||||||||||||
| Interest expense | 21.3 | 23.6 | (2.3) | (9.7) | % | |||||||||||||||||||||
| Total real estate property level expenses | 142.7 | 139.1 | 3.6 | 2.6 | % | |||||||||||||||||||||
| Real estate income, net | 171.4 | 166.2 | 5.2 | 3.1 | % | |||||||||||||||||||||
| Income from real estate joint ventures | 42.5 | 49.3 | (6.8) | (13.8) | % | |||||||||||||||||||||
| Income from real estate funds | 5.5 | 2.5 | 3.0 | N/M | ||||||||||||||||||||||
| Interest | 22.3 | 20.8 | 1.5 | 7.2 | % | |||||||||||||||||||||
| TOTAL INVESTMENT INCOME | 241.7 | 238.8 | 2.9 | 1.2 | % | |||||||||||||||||||||
| Expenses: | ||||||||||||||||||||||||||
| Investment management charges | 21.4 | 16.3 | 5.1 | 31.3 | % | |||||||||||||||||||||
| Administrative charges | 8.9 | 11.7 | (2.8) | (23.9) | % | |||||||||||||||||||||
| Distribution charges | 5.0 | 5.6 | (0.6) | (10.7) | % | |||||||||||||||||||||
| Mortality and expense risk charges | 0.1 | 0.3 | (0.2) | (66.7) | % | |||||||||||||||||||||
| Liquidity guarantee charges | 22.4 | 14.5 | 7.9 | 54.5 | % | |||||||||||||||||||||
| TOTAL EXPENSES | 57.8 | 48.4 | 9.4 | 19.4 | % | |||||||||||||||||||||
| INVESTMENT INCOME, NET | $ | 183.9 | $ | 190.4 | $ | (6.5) | (3.4) | % | ||||||||||||||||||
The following table illustrates and compares rental income, operating expenses and real estate taxes for properties held by the Account for the three months ended June 30, 2022 and 2021. The comparative increases or decreases associated with the acquisition and disposition of properties made in either period is compared to "same property" (dollars in millions).
| Rental Income | Operating Expenses | Real Estate Taxes | |||||||||||||||||||||||||||||||||||||||||||||
| Change | Change | Change | |||||||||||||||||||||||||||||||||||||||||||||
| 2022 | 2021 | $ | % | 2022 | 2021 | $ | % | 2022 | 2021 | $ | % | ||||||||||||||||||||||||||||||||||||
| Same Property | $ | 299.1 | $ | 284.0 | $ | 15.1 | 5.3 | % | $ | 67.9 | $ | 59.2 | $ | 8.7 | 14.7 | % | $ | 47.7 | $ | 48.1 | $ | (0.4) | (0.8) | % | |||||||||||||||||||||||
| Properties Acquired | 9.7 | 0.1 | 9.6 | N/M | 1.9 | — | 1.9 | N/M | 1.5 | — | 1.5 | N/M | |||||||||||||||||||||||||||||||||||
| Properties Sold | 5.3 | 21.2 | (15.9) | (75.0) | % | 1.3 | 4.4 | (3.1) | (70.5) | % | 1.1 | 3.8 | (2.7) | (71.1) | % | ||||||||||||||||||||||||||||||||
| Impact of Properties Acquired/Sold | 15.0 | 21.3 | (6.3) | (29.6) | % | 3.2 | 4.4 | (1.2) | (27.3) | % | 2.6 | 3.8 | (1.2) | (31.6) | % | ||||||||||||||||||||||||||||||||
| Total Property Portfolio | $ | 314.1 | $ | 305.3 | $ | 8.8 | 2.9 | % | $ | 71.1 | $ | 63.6 | $ | 7.5 | 11.8 | % | $ | 50.3 | $ | 51.9 | $ | (1.6) | (3.1) | % | |||||||||||||||||||||||
42
| For the Nine Months Ended September 30, | Change | ||||||||||||||
| 2017 | 2016 | $ | % | ||||||||||||
| INVESTMENT INCOME | |||||||||||||||
| Real estate income, net: | |||||||||||||||
| Rental income | $ | 791.6 | $ | 755.9 | $ | 35.7 | 4.7 | % | |||||||
| Real estate property level expenses: | |||||||||||||||
| Operating expenses | 164.9 | 163.5 | 1.4 | 0.9 | % | ||||||||||
| Real estate taxes | 127.3 | 116.9 | 10.4 | 8.9 | % | ||||||||||
| Interest expense | 67.3 | 63.3 | 4.0 | 6.3 | % | ||||||||||
| Total real estate property level expenses | 359.5 | 343.7 | 15.8 | 4.6 | % | ||||||||||
| Real estate income, net | 432.1 | 412.2 | 19.9 | 4.8 | % | ||||||||||
| Income from real estate joint ventures and limited partnerships | 154.3 | 111.8 | 42.5 | 38.0 | % | ||||||||||
| Interest | 37.6 | 17.8 | 19.8 | N/M | |||||||||||
| Dividends | 15.7 | 19.9 | (4.2 | ) | (21.1 | )% | |||||||||
| TOTAL INVESTMENT INCOME | 639.7 | 561.7 | 78.0 | 13.9 | % | ||||||||||
| Expenses: | |||||||||||||||
| Investment management charges | 52.9 | 51.8 | 1.1 | 2.1 | % | ||||||||||
| Administrative charges | 46.0 | 48.4 | (2.4 | ) | (5.0 | )% | |||||||||
| Distribution charges | 19.6 | 21.3 | (1.7 | ) | (8.0 | )% | |||||||||
| Mortality and expense risk charges | 0.9 | 0.9 | — | — | % | ||||||||||
| Liquidity guarantee charges | 34.5 | 28.1 | 6.4 | 22.8 | % | ||||||||||
| TOTAL EXPENSES | 153.9 | 150.5 | 3.4 | 2.3 | % | ||||||||||
| INVESTMENT INCOME, NET | $ | 485.8 | $ | 411.2 | $ | 74.6 | 18.1 | % | |||||||
Rental Income:
Rental income increased $35.7by $8.8 million, or 4.7%2.9%, primarily duewhen compared to net acquisitions coupled with increased occupancy in the retailsecond quarter of 2021, driven by increases across the industrial and apartment sectors due to reductions in bad debt expenses and reduced leasing incentivesdecreases in rent concessions. The Account's hotel property also experienced an increase in income which can be attributed to an increase in occupancy driven by convention activity, which was previously stifled by the industrial and retail sectors.restrictions placed on the hotel industry due to the COVID-19 pandemic.
Operating Expenses:
Operating expenses increased $1.4$7.5 million, or 0.9%11.8%, primarily duewhen compared to net acquisitions.the second quarter of 2021.The increase is attributed to increases in repair and maintenance costs, as well as utility costs, across all sectors.
Real Estate Taxes:
Real estate taxes increased $10.4decreased $1.6 million, or 8.9%3.1%, primarily due to net real estate acquisitions coupled with higher property tax assessments resulting from increases in property values across the office and apartment sectors.
Interest Expense:
Interest expense decreased $2.3 million, or 9.7%, when compared to the same period in 2021, as a result of lower average interest rates and outstanding principal balances on loans payable.
Income from Real Estate Joint Ventures and Limited Partnerships:Ventures:
Income from real estate joint ventures and limited partnerships increased $42.5 million, or 38.0%, as a result of net acquisitions and higher distributions, primarily from a joint venture that holds a large retail property in Las Vegas, Nevada.
Income from Real Estate Funds:
Income from real estate funds increased $3.0 million when compared to the same period in 2021, primarily as a result of the increase in investments in real estate funds and the purchase of additional interests pursuant to existing commitments.
Interest Income:
Interest income increased $1.5 million in comparison to the same period of 2021, due to lower dividend yieldsan increase in the Account's loans receivable.
Expenses:
Investment management, administrative and distribution costs charged to the Account are associated with managing the Account. Investment management charges are comprised primarily of fixed components, but fluctuate based on the Account's real-estate relatedsecurities.
Mortality and expense risk and liquidity guarantee chargesexpenses are contractual charges to the Account from TIAA for TIAA’s assumption of these risks and provision of the liquidity guarantee. The ratesrate for these charges wereis established effective May 1, 2017, for the twelve month period ending April 30, 2018,annually and are charged at a fixed rate based on the Account’s net assets. Mortality and expense risk expenses decreased between the comparative periods due to a decrease in the mortality and expense risk charge. Liquidity guarantee expenses were $7.9 million higher than the comparable period of 2021 as a result of a higher liquidity guarantee expense charge and higher average net assets.
Net Realized and Unrealized Gains and Losses on Investments and Mortgage Loans PayableDebt
The following table shows the net realized and unrealized gains and losses on investments and mortgage loans payabledebt for the ninethree months ended SeptemberJune 30, 20172022 and 20162021 and the dollar and percentage changes for those periods (dollars in millions, unaudited)millions).
43
| For the Nine Months Ended September 30, | Change | ||||||||||||||
| 2017 | 2016 | $ | % | ||||||||||||
| NET REALIZED AND UNREALIZED GAIN (LOSS) ON INVESTMENTS AND MORTGAGE LOANS PAYABLE | |||||||||||||||
| Net realized gain (loss) on investments: | |||||||||||||||
| Real estate properties | $ | 58.4 | $ | 26.5 | $ | 31.9 | N/M | ||||||||
| Real estate joint ventures and limited partnerships | (8.6 | ) | 0.4 | (9.0 | ) | N/M | |||||||||
| Marketable securities | 15.3 | 21.6 | (6.3 | ) | (29.2 | )% | |||||||||
| Total realized gain on investments: | 65.1 | 48.5 | 16.6 | 34.2 | % | ||||||||||
| Net change in unrealized appreciation (depreciation) on: | |||||||||||||||
| Real estate properties | 74.8 | 242.2 | (167.4 | ) | (69.1 | )% | |||||||||
| Real estate joint ventures and limited partnerships | 88.7 | 152.3 | (63.6 | ) | (41.8 | )% | |||||||||
| Marketable securities | 34.2 | 84.2 | (50.0 | ) | (59.4 | )% | |||||||||
| Loans receivable | 1.4 | 0.1 | 1.3 | N/M | |||||||||||
| Mortgage loans payable | (10.6 | ) | (54.8 | ) | 44.2 | (80.7 | )% | ||||||||
| Net change in unrealized appreciation on investments and mortgage loans payable | 188.5 | 424.0 | (235.5 | ) | (55.5 | )% | |||||||||
| NET REALIZED AND UNREALIZED GAIN ON INVESTMENTS AND MORTGAGE LOANS PAYABLE | $ | 253.6 | $ | 472.5 | $ | (218.9 | ) | (46.3 | )% | ||||||
| For the Three Months Ended June 30, | Change | |||||||||||||||||||||||||
| 2022 | 2021 | $ | % | |||||||||||||||||||||||
| NET REALIZED AND UNREALIZED GAIN (LOSS) ON INVESTMENTS AND DEBT | ||||||||||||||||||||||||||
| Net realized gain (loss) on investments: | ||||||||||||||||||||||||||
| Real estate properties | $ | 37.9 | $ | 199.8 | $ | (161.9) | (81.0) | % | ||||||||||||||||||
| Real estate joint ventures | (37.8) | (0.1) | (37.7) | N/M | ||||||||||||||||||||||
| Marketable securities | (0.3) | — | (0.3) | N/M | ||||||||||||||||||||||
| Loans receivable | — | (13.4) | 13.4 | N/M | ||||||||||||||||||||||
| Total realized (loss) gain on investments: | (0.2) | 186.3 | (186.5) | N/M | ||||||||||||||||||||||
| Net change in unrealized gain (loss) on: | ||||||||||||||||||||||||||
| Real estate properties | 939.7 | 404.2 | 535.5 | N/M | ||||||||||||||||||||||
| Real estate joint ventures | 277.1 | 99.8 | 177.3 | N/M | ||||||||||||||||||||||
| Real estate funds | 16.3 | 0.3 | 16.0 | N/M | ||||||||||||||||||||||
| Real estate operating business | 140.4 | 22.1 | 118.3 | N/M | ||||||||||||||||||||||
| Foreign currency exchange on forward contracts | 1.6 | — | 1.6 | N/M | ||||||||||||||||||||||
| Marketable securities | (9.9) | (0.3) | (9.6) | N/M | ||||||||||||||||||||||
| Loans receivable | (83.2) | 5.4 | (88.6) | N/M | ||||||||||||||||||||||
| Loans payable | 46.1 | 10.5 | 35.6 | N/M | ||||||||||||||||||||||
| Senior notes payable | 13.8 | — | 13.8 | N/M | ||||||||||||||||||||||
| Net change in unrealized gain on investments and debt | 1,341.9 | 542.0 | 799.9 | N/M | ||||||||||||||||||||||
| NET REALIZED AND UNREALIZED GAIN ON INVESTMENTS AND DEBT | $ | 1,341.7 | $ | 728.3 | $ | 613.4 | 84.2 | % | ||||||||||||||||||
N/M—Not meaningful
Real Estate Properties:
Wholly-owned real estate investments experienced net realized and unrealized gains of $133.2$977.6 million during the first nine monthssecond quarter of 20172022, compared to $268.7$604.0 million of net realized and unrealized gains during the comparable period of 2016.2021. While the rate of appreciation has slowed in 2017, the Account continues to seesaw appreciation across mostvarious real estate sectors in the second quarter of its sectors. Appreciation for the nine months ended September 30, 2017 was largely concentrated among the Account's2022, unrealized gains were primarily driven by industrial sector, especiallyand multi-family properties in the Western region. Strong tenant demand for industrial space in California has been the primary driver of this appreciation.and Southern regions due to increased average market and contract rents.
Real Estate Joint Ventures and Limited Partnerships:Ventures:
Real estate joint ventures and limited partnerships experienced net realized and unrealized gains of $80.1$239.3 million during the first nine monthssecond quarter of 2017,2022, compared to $152.7$99.7 million during the second quarter of 2021. Net gains were seen across the joint venture investment portfolio in the second quarter of 2022. The Account's joint venture investments in storage facilities, which saw a large increase in appreciation, reflective of capitalization rate compression in the self-storage industry, as well as a multi-family portfolio with properties located through out the United States and a large multi-family investment in New York, were the largest contributors to the gains.
Real Estate Funds:
Real estate funds experienced unrealized gains of $16.3 million during the second quarter of 2022, compared to $0.3 million net unrealized gains during the second quarter of 2021. Unrealized gains in the second quarter of 2022 were driven by favorable valuations of two of the Account's funds.
Real Estate Operating Business:
The Account's real estate operating business experienced unrealized gains of $140.4 million during the second quarter of 2022, compared to $22.1 million of unrealized gains during the second quarter of 2021. Unrealized gains in the second quarter of 2022 were primarily attributed to favorable projected cash flows and industry share price growth due to a recapitalization of the business.
44
Marketable Securities:
The Account's marketable securities positions experienced net realized and unrealized losses of $10.2 million in the second quarter of 2022. The current period losses are the result of the short and intermediate-term nature of the Account's U.S. Treasuries, government agency notes and corporate bond holdings, paired with a nominal fluctuation in U.S. Treasury rates during the quarter.
Loans Receivable, including those with related parties:
Loans receivable, including those with related parties, experienced unrealized losses of $83.2 million during the second quarter of 2022 compared to a $8.0 million of net realized and unrealized losses during the comparable period of 2016. While the rate2021. The current period losses are attributed to an unfavorable valuation of appreciation has slowedone loan collateralized by an office property located in 2017, the Account continues to see modest appreciation across most sectors of the Account's joint venture portfolio. The strongest appreciation for the nine months ended September 30, 2017 was among the Account's office investments in the Western region. Appreciation from joint venture regional malls in the Southern region was especially strong in 2016; the absence of this same appreciation in 2017 due to moderating market conditions was a significant driver of the overall decline from the prior year.Chicago, Illinois.
Six months 2017ended June 30, 2022 compared to unrealized losses of $54.8 million during the comparable period of 2016. The lower unrealized losses for the ninesix months ended SeptemberJune 30, 2017, were consistent with the directional movement of Treasury rates during the comparable period.
Net Investment Income
The following table shows the results of operations for the threesix months ended September June 30, 20172022 and 20162021 and the dollar and percentage changes for those periods (dollars in millions, unaudited)millions).
45
| For the Three Months Ended September 30, | Change | For the Six Months Ended June 30, | Change | ||||||||||||||||||||||||||||||||||||||
| 2017 | 2016 | $ | % | 2022 | 2021 | $ | % | ||||||||||||||||||||||||||||||||||
| INVESTMENT INCOME | INVESTMENT INCOME | ||||||||||||||||||||||||||||||||||||||||
| Real estate income, net: | Real estate income, net: | ||||||||||||||||||||||||||||||||||||||||
| Rental income | $ | 267.9 | $ | 257.4 | $ | 10.5 | 4.1 | % | Rental income | $ | 617.8 | $ | 594.1 | $ | 23.7 | 4.0 | % | ||||||||||||||||||||||||
| Real estate property level expenses: | Real estate property level expenses: | ||||||||||||||||||||||||||||||||||||||||
| Operating expenses | 56.9 | 54.8 | 2.1 | 3.8 | % | Operating expenses | 144.7 | 132.6 | 12.1 | 9.1 | % | ||||||||||||||||||||||||||||||
| Real estate taxes | 43.2 | 40.4 | 2.8 | 6.9 | % | Real estate taxes | 102.0 | 106.7 | (4.7) | (4.4) | % | ||||||||||||||||||||||||||||||
| Interest expense | 22.5 | 22.4 | 0.1 | 0.4 | % | Interest expense | 42.2 | 46.5 | (4.3) | (9.2) | % | ||||||||||||||||||||||||||||||
| Total real estate property level expenses | 122.6 | 117.6 | 5.0 | 4.3 | % | Total real estate property level expenses | 288.9 | 285.8 | 3.1 | 1.1 | % | ||||||||||||||||||||||||||||||
| Real estate income, net | 145.3 | 139.8 | 5.5 | 3.9 | % | Real estate income, net | 328.9 | 308.3 | 20.6 | 6.7 | % | ||||||||||||||||||||||||||||||
| Income from real estate joint ventures and limited partnerships | 60.9 | 33.5 | 27.4 | 81.8 | % | ||||||||||||||||||||||||||||||||||||
| Income from real estate joint ventures | Income from real estate joint ventures | 103.0 | 92.2 | 10.8 | 11.7 | % | |||||||||||||||||||||||||||||||||||
| Income from real estate funds | Income from real estate funds | 11.5 | 4.7 | 6.8 | N/M | ||||||||||||||||||||||||||||||||||||
| Interest | 15.9 | 6.3 | 9.6 | N/M | Interest | 43.0 | 40.7 | 2.3 | 5.7 | % | |||||||||||||||||||||||||||||||
| Dividends | 7.9 | 9.2 | (1.3 | ) | (14.1 | )% | |||||||||||||||||||||||||||||||||||
| Other | Other | 0.8 | — | 0.8 | N/M | ||||||||||||||||||||||||||||||||||||
| TOTAL INVESTMENT INCOME | 230.0 | 188.8 | 41.2 | 21.8 | % | TOTAL INVESTMENT INCOME | 487.2 | 445.9 | 41.3 | 9.3 | % | ||||||||||||||||||||||||||||||
| Expenses: | Expenses: | ||||||||||||||||||||||||||||||||||||||||
| Investment management charges | 15.5 | 17.6 | (2.1 | ) | (11.9 | )% | Investment management charges | 43.9 | 33.5 | 10.4 | 31.0 | % | |||||||||||||||||||||||||||||
| Administrative charges | 14.7 | 17.0 | (2.3 | ) | (13.5 | )% | Administrative charges | 22.4 | 26.5 | (4.1) | (15.5) | % | |||||||||||||||||||||||||||||
| Distribution charges | 6.4 | 7.2 | (0.8 | ) | (11.1 | )% | Distribution charges | 12.3 | 13.9 | (1.6) | (11.5) | % | |||||||||||||||||||||||||||||
| Mortality and expense risk charges | 0.3 | 0.3 | — | — | % | Mortality and expense risk charges | 0.5 | 0.6 | (0.1) | (16.7) | % | ||||||||||||||||||||||||||||||
| Liquidity guarantee charges | 12.5 | 10.2 | 2.3 | 22.5 | % | Liquidity guarantee charges | 45.1 | 28.4 | 16.7 | 58.8 | % | ||||||||||||||||||||||||||||||
| TOTAL EXPENSES | 49.4 | 52.3 | (2.9 | ) | (5.5 | )% | TOTAL EXPENSES | 124.2 | 102.9 | 21.3 | 20.7 | % | |||||||||||||||||||||||||||||
| INVESTMENT INCOME, NET | $ | 180.6 | $ | 136.5 | $ | 44.1 | 32.3 | % | INVESTMENT INCOME, NET | $ | 363.0 | $ | 343.0 | $ | 20.0 | 5.8 | % | ||||||||||||||||||||||||
The following table illustrates and compares rental income, operating expenses and real estate taxes for properties held by the Account for the six months ended June 30, 2022 and 2021. The comparative increases or decreases associated with the acquisition and disposition of properties made in either period is compared to "same property" (dollars in millions).
| Rental Income | Operating Expenses | Real Estate Taxes | |||||||||||||||||||||||||||||||||||||||||||||
| Change | Change | Change | |||||||||||||||||||||||||||||||||||||||||||||
| 2022 | 2021 | $ | % | 2022 | 2021 | $ | % | 2022 | 2021 | $ | % | ||||||||||||||||||||||||||||||||||||
| Same Property | $ | 586.5 | $ | 547.6 | $ | 38.9 | 7.1 | % | $ | 138.3 | $ | 122.9 | $ | 15.4 | 12.5 | % | $ | 96.7 | $ | 98.8 | $ | (2.1) | (2.1) | % | |||||||||||||||||||||||
| Properties Acquired | 17.8 | 0.1 | 17.7 | N/M | 3.3 | — | 3.3 | N/M | 2.6 | — | 2.6 | N/M | |||||||||||||||||||||||||||||||||||
| Properties Sold | 13.5 | 46.4 | (32.9) | (70.9) | % | 3.1 | 9.7 | (6.6) | (68.0) | % | 2.7 | 7.9 | (5.2) | (65.8) | % | ||||||||||||||||||||||||||||||||
| Impact of Properties Acquired/Sold | 31.3 | 46.5 | (15.2) | (32.7) | % | 6.4 | 9.7 | (3.3) | (34.0) | % | 5.3 | 7.9 | (2.6) | (32.9) | % | ||||||||||||||||||||||||||||||||
| Total Property Portfolio | $ | 617.8 | $ | 594.1 | $ | 23.7 | 4.0 | % | $ | 144.7 | $ | 132.6 | $ | 12.1 | 9.1 | % | $ | 102.0 | $ | 106.7 | $ | (4.7) | (4.4) | % | |||||||||||||||||||||||
N/M—Not meaningful
Rental Income:
Rental income increased $10.5by $23.7 million, or 4.1%4.0%, primarilywhen compared to the first half of 2021, driven by increases across the industrial and apartment sectors due to net real estate acquisitions.reductions in bad debt expenses and decreases in rent concessions. The Account's hotel property also experienced an increase in income which can be attributed to an increase in occupancy and convention activity.
46
Operating Expenses:
Operating expenses increased $2.1$12.1 million, or 3.8%9.1%, when compared to the first half of 2021.The increase is attributed mainly to net real estate acquisitions.increases in repair and maintenance costs, as well as utility costs in the office and apartment sectors. The Account's hotel property also saw a large increase in operating expenses as occupancy increased.
Real Estate Taxes:
Real estate taxes increased $2.8decreased $4.7 million, or 6.9%4.4%, primarilywhen compared to the same period in 2021, due to net real estate acquisitions and rising tax value of propertiesslight decreases in property taxes across the portfolio.office sector.
Interest Expense:
Interest expense increased $0.1decreased $4.3 million, or 0.4%9.2%, remaining relatively flat, due to minimal movement in average outstanding principal aswhen compared to the comparablesame period in 2021, as a result of 2016.lower average interest rates on the Account's outstanding principal balance of loans payable.
Income from Real Estate Joint Ventures and Limited Partnerships:Ventures:
Income from real estate joint ventures and limited partnerships increased $27.4 million, or 81.8%, for the three months ended September 30, 2017, when compared to the same period of 2016, due to net acquisitions and increased distributions received from a joint venture investment that holds a retail portfolio.
Income from Real Estate Funds:
Income from real estate funds increased $6.8 million, when compared to the same period in 2021, due to increased dividends received from one of the funds.
Interest Income:
Interest income increased moderately in comparison to the same period of 2021. The increase was driven by the increase in the Account' marketable securities holdings period-over-period, particularly government agency notes and corporate bonds.
Expenses:
Investment management, administrative and distribution costs charged to the Account are associated with managing the Account. Investment management charges are comprised primarily of fixed components, but fluctuate based on the size of the REITAccount’s portfolio in each respective quarter.
Mortality and expense risk and liquidity guarantee chargesexpenses are contractual charges to the Account from TIAA for TIAA’s assumption of these risks and provision of the liquidity guarantee. The ratesrate for these charges wereis established effective May 1, 2017, for the twelve month period ending April 30, 2018,annually and are charged at a fixed rate based on the Account’s net assets. Mortality and expense risk expenses remained relatively unchanged between the comparative periods. Liquidity guarantee expenses were $16.7 million higher than the comparable period of 2021 as a result of a higher liquidity guarantee expense charge and higher average net assets.
Net Realized and Unrealized Gains and Losses on Investments and Mortgage Loans PayableDebt
The following table shows the net realized and unrealized gains and losses on investments and mortgage loans payabledebt for the threesix months endedSeptember June 30, 20172022 and 20162021 and the dollar and percentage changes for those periods (dollars in millions, unaudited)millions).
47
| For the Three Months Ended September 30, | Change | ||||||||||||||
| 2017 | 2016 | $ | % | ||||||||||||
| NET REALIZED AND UNREALIZED GAIN (LOSS) ON INVESTMENTS AND MORTGAGE LOANS PAYABLE | |||||||||||||||
| Net realized gain (loss) on investments: | |||||||||||||||
| Real estate properties | $ | 75.2 | $ | 16.4 | $ | 58.8 | N/M | ||||||||
| Real estate joint ventures and limited partnerships | (8.6 | ) | 0.2 | (8.8 | ) | N/M | |||||||||
| Marketable securities | 2.6 | 3.1 | (0.5 | ) | (16.1 | )% | |||||||||
| Total realized gain on investments: | 69.2 | 19.7 | 49.5 | N/M | |||||||||||
| Net change in unrealized appreciation (depreciation) on: | |||||||||||||||
| Real estate properties | (9.4 | ) | 36.9 | (46.3 | ) | N/M | |||||||||
| Real estate joint ventures and limited partnerships | 26.9 | 24.3 | 2.6 | 10.7 | % | ||||||||||
| Marketable securities | 2.2 | (26.0 | ) | 28.2 | N/M | ||||||||||
| Loans receivable | 1.4 | 0.1 | 1.3 | N/M | |||||||||||
| Mortgage loans payable | (4.1 | ) | (29.1 | ) | 25.0 | (85.9 | )% | ||||||||
| Net change in unrealized appreciation on investments and mortgage loans payable | 17.0 | 6.2 | 10.8 | N/M | |||||||||||
| NET REALIZED AND UNREALIZED GAIN ON INVESTMENTS AND MORTGAGE LOANS PAYABLE | $ | 86.2 | $ | 25.9 | $ | 60.3 | N/M | ||||||||
| For the Six Months Ended June 30, | Change | |||||||||||||||||||||||||
| 2022 | 2021 | $ | % | |||||||||||||||||||||||
| NET REALIZED AND UNREALIZED GAIN (LOSS) ON INVESTMENTS AND DEBT | ||||||||||||||||||||||||||
| Net realized gain (loss) on investments: | ||||||||||||||||||||||||||
| Real estate properties | $ | 29.5 | $ | 202.8 | $ | (173.3) | N/M | |||||||||||||||||||
| Real estate joint ventures | 13.1 | (0.1) | 13.2 | N/M | ||||||||||||||||||||||
| Marketable securities | (1.3) | — | (1.3) | N/M | ||||||||||||||||||||||
| Loans receivable | — | (14.1) | 14.1 | N/M | ||||||||||||||||||||||
| Total realized gain on investments: | 41.3 | 188.6 | (147.3) | (78.1) | % | |||||||||||||||||||||
| Net change in unrealized gain (loss) on: | ||||||||||||||||||||||||||
| Real estate properties | 2,152.1 | 692.0 | 1,460.1 | N/M | ||||||||||||||||||||||
| Real estate joint ventures | 349.0 | 154.2 | 194.8 | N/M | ||||||||||||||||||||||
| Real estate funds | 6.9 | 4.2 | 2.7 | 64.3 | % | |||||||||||||||||||||
| Real estate operating business | 200.8 | 22.1 | 178.7 | N/M | ||||||||||||||||||||||
| Foreign currency exchange on forward contracts | 1.6 | — | 1.6 | N/M | ||||||||||||||||||||||
| Marketable securities | (38.5) | (0.3) | (38.2) | N/M | ||||||||||||||||||||||
| Loans receivable | (82.2) | 18.7 | (100.9) | N/M | ||||||||||||||||||||||
| Loans payable | 49.8 | 14.0 | 35.8 | N/M | ||||||||||||||||||||||
| Senior notes payable | 13.8 | — | 13.8 | N/M | ||||||||||||||||||||||
| Net change in unrealized gain on investments and debt | 2,653.3 | 904.9 | 1,748.4 | N/M | ||||||||||||||||||||||
| NET REALIZED AND UNREALIZED GAIN ON INVESTMENTS AND DEBT | $ | 2,694.6 | $ | 1,093.5 | $ | 1,601.1 | N/M | |||||||||||||||||||
Real Estate Properties:
Wholly-owned real estate investments experienced net realized and unrealized gains of $65.8 million$2.2 billion during the third quarterfirst six months of 2017,2022, compared to $53.3$894.8 million of net realized and unrealized gains during the comparable period of 2016, mostly attributed to2021. While the Account saw appreciation across various real estate sectors in the first half of 2022, unrealized gains realized from the sale of wholly-owned properties and appreciation among the Account'swere primarily driven by industrial properties in the Western region. Strong tenant demand for industrial spaceand Southern region, as well as multi-family properties in California has been the primary driverSouth, due to increased average market and contract rents, reflective of this appreciation.increased demand.
Real Estate Joint Ventures and Limited Partnerships:Ventures:
Real estate joint ventures and limited partnerships experienced net realized and unrealized gains of $18.3$362.1 million during the third quarterfirst six months of 2017,2022, compared to $154.1 million during the first six months of 2021. Net gains in the first half of 2022 were primarily driven by the Account's joint venture investments in storage facilities, which saw a large increase in appreciation, reflective of capitalization rate compression in the self-storage industry. Multi-family joint venture investments also contributed to the increase in unrealized gains as narrowing vacancy rates and increased market rents increased investor demand.
Real Estate Funds:
Real estate funds experienced unrealized gains of $24.5$6.9 million during the first six months of 2022, compared to unrealized gains of $4.2 million during the first six months of 2021. Current gains are a result of favorable valuations for six of the Account's fund investments.
Real Estate Operating Business:
The Account's real estate operating business experienced unrealized gains of $200.8 million during the first six months of 2022 compared to $22.1 million during the comparable period of 2016. The joint venture portfolio experienced positive appreciation during the third quarter of 2017,2021. Unrealized gains were primarily attributed to favorable projected cash flows and industry share price growth due to increased occupancy and a decrease in lease concessions at onerecapitalization of the Account's joint venture office properties in California. The Account recorded similar appreciation in the comparable quarter of 2016, driven by similar factors within the Account's joint venture retail properties.business.
48
Marketable Securities:
The Account’sAccount's marketable securities positions experienced unrealized losses of $39.8 million in the first six months of 2022, as compared to losses of $0.3 million in the first half of 2021. The higher current period losses are the result of the short and intermediate-term nature of the Account's U.S. Treasuries, government agency notes and corporate bond holdings, paired with a nominal fluctuation in U.S. Treasury rates during the period.
Loans Receivable, including those with related parties:
Loans receivable, including those with related parties, experienced unrealized losses of $82.2 million during the first six months of 2022 compared to $4.6 million of net realized and unrealized gains of $4.8 million during the third quarter of 2017 compared to losses of $22.9 million during the comparable period of 2016. The markets for REITs2021. Net losses in the U.S. increased 1.1% as measuredfirst six months of 2022 are attributed to an unfavorable valuation of one loan collateralized by the FTSE NAREIT All Equity REITs Index during the three month period ended September 30, 2017, compared to a decrease of 1.2%an office property located in the same period of 2016. Appreciation on the Account's real estate related equity securities moved in line with the market movements. Additionally, as of September 30, 2017, the Account held $4.3 billion of investments in government agency notes and U.S. Treasury securities, which had nominal changes due to the short-term nature of these investments.Chicago, Illinois.
Senior Notes Payable:
Senior notes payable experienced unrealized gains of $13.8 million in the directional movementsecond quarter of Treasury rates during the comparable period.2022.
Liquidity and Capital Resources
As of SeptemberJune 30, 20172022 and December 31, 2016,2021, the Account’s cash and cash equivalents and non-real estate-related marketable securities had a value of $4.3$2.8 billionand $4.12.2 billion representing 17.3%8.8% and 16.7%7.9% of the Account’s net assets at such dates, respectively.
Net Income and Debt Outstanding
The Account has a $500.0 million unsecured line of credit, accessible as needed to fund the Account's near-term investment objectives, as further described in Note 10—Line of Credit. As of June 30, 2022, the Account's line of credit was fully drawn.
On June 10, 2022, the Account issued $500.0 million of debt securities, as further described in Note 11—Senior Notes Payable.
The Account may from time to time borrow money and assume or obtain a mortgage on a property to make leveraged real estate investments. Also, to meet any short-term cash needs, the Account may obtain a line of credit that may be unsecured and/or contain terms that may require the Account to secure the loan with one or more of its properties.
The Account is authorized to borrow money in accordance with its investment guidelines. Under the Account’s current investment guidelines, the Account’s loan to value ratio (as described below) is to be maintained at or below 30% (measured at the time of incurrence and after giving effect thereto). Such incurrencesincurrence of debt from time to time may include:
•placing new debt on properties;
•refinancing outstanding debt;
•assuming debt on acquired properties or interests in the Account’s properties; and/or
•the purposeissuance of calculating the loan to value ratio, management deems the maximum amount which may be drawn under that line of credit as fully incurred, regardless of whether the maximum amount available has been drawn from time to time.debt securities.
49
As of SeptemberJune 30, 2017,2022, the Account’s loan-to-value ratio ofwas 17.2%. The Account's loan-to-value ratio at any time is based on the outstanding principal amount of debt (inclusive ofto the Account’s proportionate share of debt held within its joint venture investments) toAccount's total gross asset value, (i.e., a “loan to value ratio”) was 15.2%.and excludes leverage, if any, employed by REITs and real estate funds in which the Account invests. The Account intends to maintain its loan to value ratio at or below 30% (this ratio iswill be measured at the time of any debt incurrence and will be assessed after giving effect thereto).thereto. The Account’s total gross asset value, for these purposes, is equal to the total fair value of the Account’s assets (including the fair value of the Account’s interest in joint ventures), with no reduction associated with any indebtedness on such assets. In calculating outstanding indebtedness, we include only the Account’s actual percentage interest in any borrowings on a joint venture investment and not that of any joint venture partner. Also, at the time the Account (or a joint venture in which the Account is a partner) enters into a revolving or other line of credit, management includes only amounts outstanding when calculating outstanding indebtedness.
The Account may borrow up to 70% of the then-current value of a property, although construction loans may be for 100% of costs incurred in developing the property. Except for construction loans, any mortgage loans on a property will be non-recourse to the Account. For this purpose, non-recourse means that if there is a default on a loan in respect to a specific property, the lender will have recourse to (i.e., be able to foreclose on) only the property encumbered (or the joint venture owning the property), or to other specific Account properties that may have been pledged as security for the defaulted loan, but not to any other assets of the Account. Currently, TIAA, on behalf of the Account, maintains a senior revolving unsecured line of credit with a syndicate of third-party bank lenders, including JPMorgan Chase Bank, N.A. (the “Credit Agreement”). The Account may use the proceeds of borrowings under the Credit Agreement for funding general organizational purposes of the Account in the ordinary course of business, including financing certain real estate portfolio investments. The Account may enter into additional unsecured lines of credit, credit facilities and term bank loans underwritten by one or more third-party lenders. In addition, from time to time, the Account may, if permitted by applicable insurance laws, borrow capital for operating or other needs by offering debt securities
As of SeptemberJune 30, 2017,2022, there are nofive mortgage obligations, totaling $519.6 million, secured by real estate investments wholly-owned by the Account maturingthat mature within the next twelve months. The Account has sufficient liquidity in the form of cash and cash equivalents and securities to meet its current mortgage obligations.
50
Recent Transactions
The following describes property transactions by the Accountoccurring during the thirdsecond quarter of 2017.2022 related to real estate properties, real estate joint ventures, real estate funds, loans receivable, and loans payable. Except as noted, the expenses for operating the properties purchased are either borne or reimbursed, in whole or in part, by the property tenants, although the terms vary under each lease. Dollar amounts are shown in millions.
Real Estate Properties and Joint Ventures
Purchases
| Property Name | Transaction Date | Ownership Percentage | Sector | Location | Net Purchase Price(1) | |||||||||||||||||||||||||||
| 12 South Apartments | 04/12/2022 | 100.00% | Apartments | Nashville , TN | $ | 44.0 | ||||||||||||||||||||||||||
Storage Portfolio IV(2) | 04/21/2022 | 90.00% | Storage | Maricopa , AZ | $ | 24.6 | ||||||||||||||||||||||||||
| Empire Business Park | 04/28/2022 | 100.00% | Land | Peoria, AZ | $ | 4.1 | ||||||||||||||||||||||||||
Storage Portfolio IV(2) | 05/12/2022 | 90.00% | Storage | Pearland , TX | $ | 15.4 | ||||||||||||||||||||||||||
| Minneaoplis Core Portfolio (Northpark VI) | 05/13/2022 | 100.00% | Industrial | Brooklyn Park, MN | $ | 17.0 | ||||||||||||||||||||||||||
| Orchards Apartments | 05/20/2022 | 100.00% | Apartments | Marlborough, MA | $ | 59.3 | ||||||||||||||||||||||||||
| Jackson Shaw Portfolio - Parc 20 | 05/27/2022 | 100.00% | Industrial | Various, TX | $ | 52.7 | ||||||||||||||||||||||||||
| Jackson Shaw Portfolio - 46 Ranch | 05/27/2022 | 100.00% | Industrial | Various, TX | $ | 19.3 | ||||||||||||||||||||||||||
| Lennar MFPV Cane Bay Phase | 06/03/2022 | 90.00% | Land | Summerville, SC | $ | 5.2 | ||||||||||||||||||||||||||
| Monee Development | 06/06/2022 | 100.00% | Industrial | Monee, IL | $ | 5.8 | ||||||||||||||||||||||||||
Storage Portfolio IV(2) | 06/09/2022 | 90.00% | Storage | Houston , TX | $ | 13.4 | ||||||||||||||||||||||||||
| Lennar MFPV Cave Creek | 06/10/2022 | 90.00% | Land | Phoenix, AZ | $ | 6.9 | ||||||||||||||||||||||||||
355 W 52nd Street(3) | 06/14/2022 | 95.00% | Office | New York, NY | $ | 45.6 | ||||||||||||||||||||||||||
(1) The Bridges—Minneapolis, MNnet purchase price represents the purchase price and closing costs.
(3) Property held in Niles, Illinois for $44.4 million (the Account’s share).
Sales
| Property Name | Transaction Date | Ownership Percentage | Sector | Location | Net Sales Price(1) | Realized Gain (Loss) on Sale(2) | ||||||||||||||||||||||||||||||||
MiMa - Partial Sale(3) | 05/09/2022 | 70.00% | Multifamily - Retail | New York, NY | $ | 79.8 | $ | (37.8) | ||||||||||||||||||||||||||||||
| Oceano | 05/23/2022 | 100.00% | Multifamily | Woodland Hills, CA | $ | 112.5 | $ | 26.8 | ||||||||||||||||||||||||||||||
| 200 Middlefield | 06/09/2022 | 100.00% | Office | Menlo Park, CA | $ | 62.1 | $ | 11.1 | ||||||||||||||||||||||||||||||
(2) Majority of $66.0 million, resulting in athe realized gain of $20.9 million, the majority of which(loss) has been previously recognized as unrealized gains (losses) in the Account’s consolidated statementsAccount's Consolidated Statements of operations.Operations.
(3) The Account’s cost basisAccount sold a portion of it's interest in the RGM 42, LLC joint venture, which holds the property atknown as MiMA, effectively reducing the date of the sale was $45.1 million.
Real Estate Fund
Purchase
| Fund Name | Date of Initial Capital Contribution | Amount of Initial Capital Contribution | Total Commitment | |||||||||||||||||
| Silverpeak NRE REA FundCo III | 05/25/2022 | $ | 5.8 | $ | 100.0 | |||||||||||||||
51
Loans Receivable
Purchases
| Description | Transaction Date | Interest Rate | Sector | Maturity Date | Amount | |||||||||||||||||||||||||||
| Project Sonic Senior Note | 05/13/2022 | 2.75% + SOFR | Industrial | 06/09/2025 | $ | 101.2 | ||||||||||||||||||||||||||
| Project Sonic Mezzanine | 05/13/2022 | 2.75% + SOFR | Industrial | 06/09/2025 | $ | 30.4 | ||||||||||||||||||||||||||
| One Biscayne Tower Senior Note | 06/27/2022 | 3.75% + SOFR | Retail | 07/09/2025 | $ | 131.8 | ||||||||||||||||||||||||||
| One Biscayne Tower Mezzanine | 06/27/2022 | 3.75% + SOFR | Retail | 07/09/2025 | $ | 39.1 | ||||||||||||||||||||||||||
Financings
| Description | Principal | Interest Rate | Issuance date | Maturity Date | |||||||||||||||||||
| Series A - Senior Notes | $ | 300.0 | 3.24% | 06/10/2022 | 06/10/2029 | ||||||||||||||||||
| Series B - Senior Notes | $ | 200.0 | 3.35% | 06/10/2022 | 06/10/2032 | ||||||||||||||||||
Debt Payoff
| Description | Transaction Date | Interest Rate | Sector | Maturity Date | Amount | |||||||||||||||||||||||||||
| West Town Mall | 06/29/2022 | 4.37% | Retail | 07/01/2022 | $ | 101.2 | ||||||||||||||||||||||||||
Critical Accounting PoliciesEstimates
Management’s discussion and analysis of the Account’s financial condition and results of operations is based on the
Account’s consolidated interim financial statements,Consolidated Financial Statements, which have been prepared by management in accordance with GAAP. The preparation of the Account’s financial statements in conformity with GAAP requires management to make estimates and assumptions that affect the financial statementsreported amounts of assets, liabilities, income and disclosures. Someexpenses. Management considers the valuation of these estimatesreal estate properties and assumptions require applicationvaluation of difficult, subjective, and/or complex judgments about the effect of matters that are inherently uncertain and that may change in subsequent periods. Management evaluates its estimates and assumptions on an ongoing basis. Management bases its estimates on historical experience and on various other assumptions that it believesreal estate joint ventures to be reasonable undercritical accounting estimates because they involve a significant level of estimation uncertainty and have a material impact on the circumstances, theAccount’s financial condition and results of which formoperations.
There have been no material changes to the basis for making judgments aboutAccount's critical accounting policies described in the carrying values of assets and liabilities of the Account that are not readily apparent from other sources. Actual results may differ from these estimates under different assumptions or conditions.
52
ITEM 3. QUANTITATIVE AND QUALITATIVE DISCLOSURES ABOUT MARKET RISK
The Account’s real estate holdings, including real estate joint venture, limited partnershipsventures, funds, an operating business and loans receivable, including those with related parties, which, as of SeptemberJune 30, 2017,2022, represented 80.1% 92.2%of the Account’s total investments, expose the Account to a variety of risks. These risks include, but are not limited to:
•General Real Estate Risk—The risk that the Account’s property values or rental and occupancy rates could go down due to general economic conditions, a weak market for real estate generally and/or in specific locations where the Account may own property, including, among other reasons, as a result of an epidemic, pandemic or other health-related issue in one or more markets where the Account owns property, disruptions in the credit and/or capital markets, or changingchanges in supply and demand for certain types of properties;
•Appraisal Risk—The risk that the sale price of an Account property (i.e.(i.e., the value that would be determined by negotiations between independent parties) might differ substantially from its estimated or appraised value, leading to losses or reduced profits to the Account upon sale;
•Risk Relating to Property Sales—The risk that the Account might not be able to sell a property at a particular time for its full value, particularly in a poor market. This might make it difficult to raise cash quickly and also could lead to Account losses;
•Risks of Borrowing—The risk that interest rate changes may impact Account returns if the Account borrows against a credit facility, takes out a mortgage on a property, buys a property subject to a mortgage or holds a property subject to a mortgage, and hedging against such interest rate changes, if undertaken by the Account, may entail additional costs and be unsuccessful; and
•Foreign Currency Risk—The risk that the value of the Account’s foreign investments, related debt, or rental income could increase or decrease due to changes in foreign currency exchange rates or foreign currency exchange control regulations, and hedging against such currency changes, if undertaken by the Account, may entail additional costs and be unsuccessful.
The Account believes the diversification of its real estate portfolio, both geographically and by sector, along with its quarterly valuation procedure, helps manage the real estate and appraisal risks described above.
As of SeptemberJune 30, 2017, 19.9%2022, 7.8% of the Account’s total investments were comprised of marketable securities. Marketable securities include high-quality debt instruments (i.e.(i.e., U.S. government agency notes)notes and corporate bond securities) and, when applicable, REIT securities. The consolidated scheduleAccount's Consolidated Statements of investments for the AccountInvestments sets forth the general financial terms of these instruments, along with their fair values, as determined in accordance with procedures described earlier in the Critical Accounting Policies section above and in Note 1—1–Organization and Significant Accounting Policies to the Account’s Consolidated Financial Statements included herewith. As of the dateAccount's 2021 Form 10-K.
During the first quarter of this report,2022, the Account does not invest in derivative financial investments, nor does the Account engage in any hedging activity, although it may do so in selected circumstances in the future.began using currency forward contracts to hedge foreign currency risks.
Risks associated with investments in real estate-related liquid assets (which could include, from time to time, REIT securities and CMBS), and non-real estate-related liquid assets, including financial/credit risk, market volatility risk, interest rate volatility risk and deposit/money market risk.include the following:
•Financial/Credit Risk—The risk, for debt securities, that the issuer will not be able to pay principal and interest when due (and/or declare bankruptcy or be subject to receivership) and, for equity securities such as common or preferred stock, that the issuer’s current earnings will fall or that its overall financial soundness will decline, reducing the security’s value.
•Market Volatility Risk—The risk that the Account’s investments will experience price volatility due to changing conditions in the financial markets regardless of the credit quality or financial condition of the underlying issuer. This risk is particularly acute to the extent the Account holds equity securities, which have experienced significant short-term price volatility over the past year. Also, to the extent the Account holds debt securities, changes in overall interest rates can cause price fluctuations.
•Interest Rate Volatility—The risk that interest rate volatility may affect the Account’s current income from an investment.
•Deposit/Money Market Risk—The risk that, to the extent the Account’s cash held in bank deposit accounts exceeds federally insured limits as to that bank, the Account could experience losses if banks fail. The Account
53
does not believe it has exposure to significant concentration of deposit risk. In addition, there is some risk that investments held in money market accounts can suffer losses.
In addition, to the extent the Account were to hold mortgage-backed securitiesMBS (including commercial mortgage-backed securities)CMBS) these securities are subject to prepayment risk or extension risk (i.e.(i.e., the risk that borrowers will repay the loans earlier or later than anticipated). If the underlying mortgage assets experience faster than anticipated repayments of principal, the Account could fail to recoup some or all of its initial investment in these securities, since the original price paid by the Account was based in part on assumptions regarding the receipt of interest payments. If the underlying mortgage assets are repaid later than anticipated, the Account could lose the opportunity to reinvest the anticipated cash flows at a time when interest rates might be rising. The rate of prepayment depends on a variety of geographic, social and other functions, including prevailing market interest rates and general economic factors. The fair value of these securities is also highly sensitive to changes in interest rates. Note that the potential for appreciation, which could otherwise be expected to result from a decline in interest rates, may be limited by any increased prepayments. These securities may be harder to sell than other securities.
In addition to these risks, real estate equity securities (such as REIT stockssecurities and mortgage-backed securities)MBS) would be subject to many of the same general risks inherent in real estate investing, making mortgage loans and investing in debt securities. For more information on the risks associated with all of the Account’s investments, see Item 1A. Risk Factors, of the Account’s most recent prospectus.Account's Annual Report on Form 10-K for the year ended December 31, 2021, file with the Securities and Exchange Commission on March 10, 2022, as such risk factors may be updated in Item 1A of this Form 10-Q or in subsequent reports.
ITEM 4. CONTROLS AND PROCEDURES
(a) The registrant maintains a system of disclosure controls and procedures that are designed to provide reasonable assurance that information required to be disclosed in the registrant’s reports under the Securities Exchange Act of 1934, as amended (the “Exchange Act”), is recorded, processed, summarized and reported within the time periods specified in the SEC’s rules and forms, and that such information is accumulated and communicated to management, including TIAA’s Executive Vice President, Institutional Investment & Endowment Services (Principalthe registrant’s Principal Executive Officer (“PEO”)) and TIAA’s Senior Executive Vice President and Chief Financial Officer (Principalthe Principal Financial Officer (“PFO”)), as appropriate, to allow timely decisions regarding required disclosure.
Under the supervision and participation of the registrant’s management, including the registrant’s PEO and PFO, the registrant conducted an evaluation of the effectiveness of the registrant’s disclosure controls and procedures as defined in Rule 13a-15(e) under the Exchange Act as of SeptemberJune 30, 2017.2022. Based upon management’s review, the PEO and PFO concluded that the registrant’s disclosure controls and procedures, as of the end of the period covered by this report, were effective to provide reasonable assurance that material information required to be included in the Account's periodic reports is recorded, processed, summarized and reported within the time periods specified in the relevant SEC rules and forms.
(b) Changes in internal control over financial reporting. There have been no changes in the registrant’s internal control over financial reporting that occurred during the registrant’s last fiscal quarter that materially affected, or are reasonably likely to materially affect, the registrant’s internal control over financial reporting.
54
PART II. OTHER INFORMATION
ITEM 1. LEGAL PROCEEDINGS.
In the normal course of business, the Account may be named, from time to time, as a defendantor may be involved in various legal actions, including arbitration, class actions and other litigation.
The Account establishes an accrual for all litigation and regulatory matters when it believes it is partyprobable that a loss has been incurred and the amount of the loss can be reasonably estimated. Once established, accruals are adjusted, as appropriate, in light of additional information. The amount of loss ultimately incurred in relation to various claims and routine litigation arising inthose matters may be higher or lower than the ordinary courseamounts accrued for those matters.
As of business. Managementthe date of this report, management of the Account does not believe that the results of any such claims or litigation, individually or in the aggregate, will have a material effect on the Account’s business, financial position or results of operations.
ITEM 1A. RISK FACTORS.
The Account is exposed to risks related to increases in market lease rates and inflation, as previously reportedincome from leases in the commercial space (i.e., office, industrial and retail) is an important source of the Account’s cash flow from operations. Although most of the Account’s commercial tenant leases have contractual periodic rent escalation clauses, such clauses are not typically tied to the Consumer Price Index (“CPI”). These rent escalation clauses typically escalate rent by a set percentage per year or on a cumulative amount over a set number of years during the term of the lease. At lease expiration, a commercial rental property either reverts to then applicable market rental rates or there is typically a contractual provision, if a tenant has the option to do so, where the option rent is escalated by the previous contractual amount or it would set to some market-based rental rate or a set percentage of the market-based rate. Such contractual provisions in the Account’s Annual Reportcommercial leases are designed to mitigate the risk of inflation and unexpected increases in market lease rates; however, such contractual provisions may, if not accurately predicted or structured, fail to adequately protect the Account from the impact of inflation or unexpected increases in market lease rates. If the Account becomes subject to below-market lease rates on Form 10-Ka significant number of its commercial properties, and the Account’s operating and other expenses for such rental properties are increasing faster than anticipated, the year ended December 31, 2016.Account’s business, financial condition, results of operations, cash flow or its ability to satisfy debt service obligations could be materially adversely affected.
ITEM 2. UNREGISTERED SALES OF EQUITY SECURITIES AND USE OF PROCEEDS.
Not applicable.
ITEM 3. DEFAULTS UPON SENIOR SECURITIES.
Not applicable.
ITEM 4. MINE SAFETY DISCLOSURES.
Not applicable.
ITEM 5. OTHER INFORMATION.
55
ITEM 6. EXHIBITS
| (1) | (A) | |||||||
| (3) | (A) | |||||||
| (B) | ||||||||
| (4) | (A) | |||||||
| (B) | ||||||||
| (C) | ||||||||
| (D) | ||||||||
| (E) | ||||||||
| (F) | ||||||||
| (H) | ||||||||
| (I) | ||||||||
| (J) | ||||||||
| (K) | ||||||||
| (L) | ||||||||
| (M) | ||||||||
| (N) | ||||||||
| (O) | ||||||||
| (P) | ||||||||
| (Q) | ||||||||
| (10) | (A) | |||||||
| (B) | ||||||||
| (C) | ||||||||
| (101) | The following financial information from the Quarterly Report on Form 10-Q for the period ended | |||||||
56 *Filed herewith. **Furnished electronically herewith. (1)Previously filed and incorporated herein by reference to Exhibit 1(A) to the Account’s Registration Statement on Form S-1, filed with the Commission on March 15, 2013 (File No. 333-187309). (2)Previously filed and incorporated herein by reference to Exhibit 3(A) to the Account’s Registration Statement on Form S-1, filed with the Commission on April 22, 2015 (File No. 333-202583). (3)Previously filed and incorporated herein by reference to Exhibit 3(B) to the Account’s Registration Statement on Form S-1, filed with the Commission on April 22, 2015 (File No. 333-202583). (4)Previously filed and incorporated herein by reference to the Account’s Post-Effective Amendment No. 2 to the Registration Statement on Form S-1, filed with the Commission on April 30, 1996 (File No. 33-92990). (5)Previously filed and incorporated herein by reference to Exhibit 4(A) to the Account’s Post-Effective Amendment No. 1 to the Registration Statement on Form S-1, filed with the Commission on May 2, 2005 (File No. 333-121493). (6)Previously filed and incorporated herein by reference to the Account’s Pre-Effective Amendment No. 1 to the Registration Statement on Form S-1, filed with the Commission on April 29, 2004 (File No. 333-113602). (7)Previously filed and incorporated by reference to Exhibit 4(C) to the Account’s Quarterly Report on Form 10-Q for the quarter ended September 30, 2010 and filed with the Commission on November 12, 2010 (File No. 33-92990). (8)Previously filed and incorporated herein by reference to Exhibit 10(B) to the Account's Annual Report on Form 10-K for the fiscal year ended December 31, 2012 and filed with the Commission on March 14, 2013 (File No. 33-92990). (9)Previously filed and incorporated herein by reference to Exhibit 4(D)(1) and 4(D)(2) to the Account’s Registration Statement on Form S-1, filed with the Commission on March 21, 2017 (File No. 333-216849). (10)Previously filed and incorporated herein by reference to Exhibit 4(E)(1) and 4(E)(2) to the Account’s Registration Statement on Form S-1, filed with the Commission on March 21, 2017 (File No. 333-216849). (11)Previously filed and incorporated herein by reference to Exhibit 4(F)(1) and 4(F)(2) to the Account’s Registration Statement on Form S-1, filed with the Commission on March 21, 2017 (File No. 333-216849). (12)Previously filed and incorporated herein by reference to Exhibit 4(G) to the Account’s Annual Report on Form 10-K, filed with the Commission on March 15, 2018 (File No. 333-216849). (13)Previously filed and incorporated herein by reference to Exhibit 4(H) to the Account’s Annual Report on Form 10-K, filed with the Commission on March 15, 2018 (File No. 333-216849). (14)Previously filed and incorporated herein by reference to Exhibit 4(I) to the Account’s Annual Report on Form 10-K, filed with the Commission on March 15, 2018 (File No. 333-216849). (15)Previously filed and incorporated by reference to Exhibit 10.1 to the Account's Current Report on Form 8-K, filed with the Commission on February 16, 2022 (File No. 33-92990). (16)Previously filed and incorporated herein by reference to Exhibit 4(J)(1) and 4(J)(2) to the Account’s Current Report on Form 10-K, filed with the Commission on March 14, 2019 (File No. 33-92990). (17)Previously filed and incorporated herein by reference to Exhibit 4(K) to the Account’s Current Report on Form 10-K, filed with the Commission on March 14, 2019 (File No. 33-92990). (18)Previously filed and incorporated herein by reference to Exhibit 4(L)(1) and 4(L)(2) to the Account's Current Report on Form 10-K, filed with the Commission on March 12, 2020 (File No. 33-92990). (19)Previously filed and incorporated herein by reference to Exhibit 4(M) to the Account’s Current Report on Form 10-K, filed with the Commission on March 11, 2021 (File No. 33-92990). (20)Previously filed and incorporated herein by reference to Exhibit 4(N) to the Account’s Current Report on Form 10-K, filed with the Commission on March 11, 2021 (File No. 33-92990). (21)Previously filed and incorporated herein by reference to Exhibit 4(O) to the Account’s Current Report on Form 10-K, filed with the Commission on March 11, 2021 (File No. 33-92990). (22)Previously filed and incorporated herein by reference to Exhibit 4(P) to the Account’s Current Report on Form 10-K, filed with the Commission on March 11, 2021 (File No. 33-92990). (23)Previously filed and incorporated herein by reference to Exhibit 4(Q) to the Account’s Current Report on Form 10-K, filed with the Commission on March 11, 2021 (File No. 33-92990). 57 |
SIGNATURES
Pursuant to the requirements of the Securities Exchange Act of 1934, as amended, the registrant, TIAA Real Estate Account, has duly caused this Report to be signed on its behalf by the undersigned, thereunto duly authorized, in New York, New York, on the 7th5thday of November, 2017.
August 2022.
| TIAA REAL ESTATE ACCOUNT | |||||||||||
| By: | |||||||||||
| TEACHERS INSURANCE AND ANNUITY ASSOCIATION OF AMERICA | |||||||||||
| By: | /s/ | ||||||||||
Christine E. Dugan Executive Vice President and Product General Manager –Institutional Lifetime Income, Teachers Insurance and Annuity Association of America | |||||||||||
| By: | /s/ | ||||||||||
Senior Corporate Controller of Teachers Insurance and Annuity Association of America | |||||||||||
58