UNITED STATES
SECURITIES AND EXCHANGE COMMISSION
Washington, D.C. 20549
_______________________________________
FORM 10-Q
_______________________________________
|
| |
ý☒ | QUARTERLY REPORT PURSUANT TO SECTION 13 OR 15(d) OF THE SECURITIES EXCHANGE ACT OF 1934 |
For the quarterly period ended March 31, 20192020
OR
|
| |
o☐ | TRANSITION REPORT PURSUANT TO SECTION 13 OR 15(d) OF THE SECURITIES EXCHANGE ACT OF 1934 |
For the transition period from to
Commission File No. 1-13881
_________________________________________________
MARRIOTT INTERNATIONAL, INC.
(Exact name of registrant as specified in its charter)
_______________________________________ |
| | | | | | |
| Delaware | | 52-2055918 |
(State or other jurisdiction of incorporation or organization) | | (IRS Employer Identification No.) |
| | | | | | | |
10400 Fernwood Road | | Bethesda | | Maryland | | 20817 |
| (Address of principal executive offices) | | 20817
(Zip Code) |
(301) (301) 380-3000
(Registrant’s telephone number, including area code)
Securities registered pursuant to Section 12(b) of the Act: |
| | | | |
| Title of Each Class | | Trading Symbol(s) | | Name of Each Exchange on Which Registered |
| Class A Common Stock, $0.01 par value | | MAR | | Nasdaq Global Select Market |
| Class A Common Stock, $0.01 par value | | MAR | | Chicago Stock Exchange |
Indicate by check mark whether the registrant (1) has filed all reports required to be filed by Section 13 or 15(d) of the Securities Exchange Act of 1934 during the preceding 12 months (or for such shorter period that the registrant was required to file such reports), and (2) has been subject to such filing requirements for the past 90 days. Yes ý No ¨
Indicate by check mark whether the registrant has submitted electronically every Interactive Data File required to be submitted pursuant to Rule 405 of Regulation S-T during the preceding 12 months (or for such shorter period that the registrant was required to submit such files). Yes ý No ¨
Indicate by check mark whether the registrant is a large accelerated filer, an accelerated filer, a non-accelerated filer, a smaller reporting company, or an emerging growth company. See the definitions of “large accelerated filer,” “accelerated filer,” “smaller reporting company,” and “emerging growth company” in Rule 12b-2 of the Exchange Act.
|
| | | | | | |
| Large accelerated filer | | ý | | Accelerated filer | | ¨ |
| Non-accelerated filer | | ¨ | | Smaller Reporting Company | | ¨☐ |
| | | | | Emerging growth company | | ¨☐ |
If an emerging growth company, indicate by check mark if the registrant has elected not to use the extended transition period for complying with any new or revised financial accounting standards provided pursuant to Section 13(a) of the Exchange Act. ¨ |
Indicate by checkmark whether the registrant is a shell company (as defined in Rule 12b-2 of the Exchange Act). Yes ¨☐ No ý
Securities registered pursuant to Section 12(b) of the Act: |
| | | | |
Title of Each Class | | Trading Symbol(s) | | Name of Each Exchange on Which Registered |
Class A Common Stock, $0.01 par value | | MAR | | Nasdaq Global Select Market
Chicago Stock Exchange
|
Indicate the number of shares outstanding of each of the issuer’s classes of common stock, as of the latest practicable date: 332,988,834324,255,928 shares of Class A Common Stock, par value $0.01 per share, outstanding at April 30, 2019.2020.
MARRIOTT INTERNATIONAL, INC.
FORM 10-Q TABLE OF CONTENTS
|
| | |
| | | Page No. |
| | | |
| Part I. | | |
| | | |
| Item 1. | | |
| | | |
| | | |
| | | |
| | | |
| | | |
| | | |
| | | |
| | | |
| | | |
| | | |
| | | |
| Item 2. | | |
| | | |
| | | |
| | | |
| Item 3. | | |
| | | |
| Item 4. | | |
| | | |
| Part II. | | |
| | | |
| Item 1. | | |
| | | |
| Item 1A. | | |
| | | |
| Item 2. | | |
|
|
|
| Item 6. | | |
| | | |
| | | |
PART I – FINANCIAL INFORMATION
Item 1.Financial Statements
MARRIOTT INTERNATIONAL, INC.
CONDENSED CONSOLIDATED STATEMENTS OF INCOME
($ in millions, except per share amounts)
(Unaudited)
| | | | Three Months Ended | Three Months Ended |
| | March 31, 2019 | | March 31, 2018 | March 31, 2020 |
| March 31, 2019 |
| REVENUES | | | | | | |
| Base management fees | $ | 282 |
| | $ | 273 |
| $ | 214 |
| | $ | 282 |
|
| Franchise fees | 450 |
| | 417 |
| 415 |
| | 450 |
|
| Incentive management fees | 163 |
| | 155 |
| — |
| | 163 |
|
| Gross fee revenues | 895 |
| | 845 |
| 629 |
| | 895 |
|
| Contract investment amortization | (14 | ) | | (18 | ) | (25 | ) | | (14 | ) |
| Net fee revenues | 881 |
| | 827 |
| 604 |
| | 881 |
|
| Owned, leased, and other revenue | 375 |
| | 406 |
| 280 |
| | 375 |
|
| Cost reimbursement revenue | 3,756 |
| | 3,776 |
| 3,797 |
| | 3,756 |
|
| | 5,012 |
| | 5,009 |
| 4,681 |
| | 5,012 |
|
| OPERATING COSTS AND EXPENSES | | | | | | |
| Owned, leased, and other-direct | 325 |
| | 336 |
| 272 |
| | 325 |
|
| Depreciation, amortization, and other | 54 |
| | 54 |
| 150 |
| | 54 |
|
| General, administrative, and other | 222 |
| | 247 |
| 270 |
| | 222 |
|
| Merger-related costs and charges | 9 |
| | 34 |
| |
| Merger-related costs and (recoveries) charges | | (2 | ) | | 9 |
|
| Reimbursed expenses | 3,892 |
| | 3,808 |
| 3,877 |
| | 3,892 |
|
| | 4,502 |
| | 4,479 |
| 4,567 |
| | 4,502 |
|
| OPERATING INCOME | 510 |
| | 530 |
| 114 |
| | 510 |
|
| Gains and other income, net | 5 |
| | 59 |
| |
| (Losses) gains and other income, net | | (4 | ) | | 5 |
|
| Interest expense | (97 | ) | | (75 | ) | (93 | ) | | (97 | ) |
| Interest income | 6 |
| | 5 |
| 6 |
| | 6 |
|
| Equity in earnings | 8 |
| | 13 |
| |
| Equity in (losses) earnings | | (4 | ) | | 8 |
|
| INCOME BEFORE INCOME TAXES | 432 |
| | 532 |
| 19 |
| | 432 |
|
| Provision for income taxes | (57 | ) | | (112 | ) | |
| Benefit (provision) for income taxes | | 12 |
| | (57 | ) |
| NET INCOME | $ | 375 |
| | $ | 420 |
| $ | 31 |
| | $ | 375 |
|
| EARNINGS PER SHARE | | | | | | |
| Earnings per share - basic | $ | 1.10 |
| | $ | 1.17 |
| $ | 0.10 |
| | $ | 1.10 |
|
| Earnings per share - diluted | $ | 1.09 |
| | $ | 1.16 |
| $ | 0.09 |
| | $ | 1.09 |
|
See Notes to Condensed Consolidated Financial Statements.
MARRIOTT INTERNATIONAL, INC.
CONDENSED CONSOLIDATED STATEMENTS OF COMPREHENSIVE INCOME
($ in millions)
(Unaudited)
| | | | Three Months Ended | Three Months Ended |
| | March 31, 2019 | | March 31, 2018 | March 31, 2020 | | March 31, 2019 |
| Net income | $ | 375 |
| | $ | 420 |
| $ | 31 |
| | $ | 375 |
|
| Other comprehensive (loss) income: | | | | | | |
| Foreign currency translation adjustments | 33 |
| | 152 |
| (383 | ) | | 33 |
|
| Derivative instrument adjustments, net of tax | (1 | ) | | (3 | ) | |
| Reclassification of (income) loss, net of tax | (1 | ) | | 13 |
| |
| Derivative instrument adjustments and other, net of tax | | 13 |
| | (1 | ) |
| Reclassification of gains, net of tax | | (8 | ) | | (1 | ) |
| Total other comprehensive (loss) income, net of tax | 31 |
| | 162 |
| (378 | ) | | 31 |
|
| Comprehensive income | $ | 406 |
| | $ | 582 |
| |
| Comprehensive (loss) income | | $ | (347 | ) | | $ | 406 |
|
See Notes to Condensed Consolidated Financial Statements.
MARRIOTT INTERNATIONAL, INC.
CONDENSED CONSOLIDATED BALANCE SHEETS
($ in millions)
| | | | (Unaudited) | | | (Unaudited) | | |
| | March 31,
2019 | | December 31,
2018 | March 31,
2020 | | December 31,
2019 |
| ASSETS | | | | | | |
| Current assets | | | | | | |
| Cash and equivalents | $ | 258 |
| | $ | 316 |
| $ | 1,760 |
| | $ | 225 |
|
| Accounts and notes receivable, net | 2,218 |
| | 2,133 |
| 2,068 |
| | 2,395 |
|
| Prepaid expenses and other | 259 |
| | 257 |
| 213 |
| | 252 |
|
| Assets held for sale | | 8 |
| | 255 |
|
| | 2,735 |
| | 2,706 |
| 4,049 |
| | 3,127 |
|
| Property and equipment, net | 1,961 |
| | 1,956 |
| 1,854 |
| | 1,904 |
|
| Intangible assets | | | | | | |
| Brands | 5,959 |
| | 5,790 |
| 5,839 |
| | 5,954 |
|
| Contract acquisition costs and other | 2,643 |
| | 2,590 |
| 2,647 |
| | 2,687 |
|
| Goodwill | 9,053 |
| | 9,039 |
| 8,901 |
| | 9,048 |
|
| | 17,655 |
| | 17,419 |
| 17,387 |
| | 17,689 |
|
| Equity method investments | 584 |
| | 732 |
| 562 |
| | 577 |
|
| Notes receivable, net | 124 |
| | 125 |
| 144 |
| | 117 |
|
| Deferred tax assets | 171 |
| | 171 |
| 155 |
| | 154 |
|
| Operating lease assets | 979 |
| | — |
| 782 |
| | 888 |
|
| Other noncurrent assets | 537 |
| | 587 |
| 616 |
| | 595 |
|
| | $ | 24,746 |
| | $ | 23,696 |
| $ | 25,549 |
| | $ | 25,051 |
|
| LIABILITIES AND SHAREHOLDERS’ EQUITY | | | | |
| LIABILITIES AND SHAREHOLDERS’ (DEFICIT) EQUITY | | | | |
| Current liabilities | | | | | | |
| Current portion of long-term debt | $ | 231 |
| | $ | 833 |
| $ | 1,664 |
| | $ | 977 |
|
| Accounts payable | 745 |
| | 767 |
| 828 |
| | 720 |
|
| Accrued payroll and benefits | 1,039 |
| | 1,345 |
| 1,211 |
| | 1,339 |
|
| Liability for guest loyalty program | 2,625 |
| | 2,529 |
| 1,550 |
| | 2,258 |
|
| Accrued expenses and other | 1,208 |
| | 963 |
| 1,263 |
| | 1,383 |
|
| | 5,848 |
| | 6,437 |
| 6,516 |
| | 6,677 |
|
| Long-term debt | 10,025 |
| | 8,514 |
| 10,569 |
| | 9,963 |
|
| Liability for guest loyalty program | 2,888 |
| | 2,932 |
| 4,294 |
| | 3,460 |
|
| Deferred tax liabilities | 441 |
| | 485 |
| 212 |
| | 290 |
|
| Deferred revenue | 743 |
| | 731 |
| 862 |
| | 840 |
|
| Operating lease liabilities | 889 |
| | — |
| 846 |
| | 882 |
|
| Other noncurrent liabilities | 2,309 |
| | 2,372 |
| 2,270 |
| | 2,236 |
|
| Shareholders’ equity | | | | |
| Shareholders’ (deficit) equity | | | | |
| Class A Common Stock | 5 |
| | 5 |
| 5 |
| | 5 |
|
| Additional paid-in-capital | 5,706 |
| | 5,814 |
| 5,711 |
| | 5,800 |
|
| Retained earnings | 9,219 |
| | 8,982 |
| 9,504 |
| | 9,644 |
|
| Treasury stock, at cost | (12,967 | ) | | (12,185 | ) | (14,501 | ) | | (14,385 | ) |
| Accumulated other comprehensive loss | (360 | ) | | (391 | ) | (739 | ) | | (361 | ) |
| | 1,603 |
| | 2,225 |
| (20 | ) | | 703 |
|
| | $ | 24,746 |
| | $ | 23,696 |
| $ | 25,549 |
| | $ | 25,051 |
|
See Notes to Condensed Consolidated Financial Statements.
MARRIOTT INTERNATIONAL, INC.
CONDENSED CONSOLIDATED STATEMENTS OF CASH FLOWS
($ in millions)
(Unaudited)
| | | | Three Months Ended | Three Months Ended |
| | March 31, 2019 | | March 31, 2018 | March 31, 2020 | | March 31, 2019 |
| OPERATING ACTIVITIES | | | | | | |
| Net income | $ | 375 |
| | $ | 420 |
| $ | 31 |
| | $ | 375 |
|
| Adjustments to reconcile to cash provided by operating activities: | | | | | | |
| Depreciation, amortization, and other | 68 |
| | 73 |
| 175 |
| | 68 |
|
| Share-based compensation | 40 |
| | 42 |
| 41 |
| | 40 |
|
| Income taxes | (7 | ) | | 24 |
| (71 | ) | | (7 | ) |
| Liability for guest loyalty program | 52 |
| | 208 |
| 126 |
| | 52 |
|
| Contract acquisition costs | (56 | ) | | (29 | ) | (39 | ) | | (56 | ) |
| Merger-related charges | (10 | ) | | (16 | ) | (12 | ) | | (10 | ) |
| Working capital changes | (401 | ) | | (98 | ) | 245 |
| | (401 | ) |
| Gain on asset dispositions | (4 | ) | | (60 | ) | — |
| | (4 | ) |
| Other | 94 |
| | 111 |
| 18 |
| | 94 |
|
| Net cash provided by operating activities | 151 |
| | 675 |
| 514 |
| | 151 |
|
| INVESTING ACTIVITIES | | | | | | |
| Capital expenditures | (66 | ) | | (64 | ) | (59 | ) | | (66 | ) |
| Dispositions | 2 |
| | 108 |
| 260 |
| | 2 |
|
| Loan advances | — |
| | (12 | ) | (32 | ) | | — |
|
| Loan collections | 4 |
| | 5 |
| 4 |
| | 4 |
|
| Other | (28 | ) | | 12 |
| (8 | ) | | (28 | ) |
| Net cash (used in) provided by investing activities | (88 | ) | | 49 |
| |
| Net cash provided by (used in) investing activities | | 165 |
| | (88 | ) |
| FINANCING ACTIVITIES | | | | | | |
| Commercial paper/Credit Facility, net | 665 |
| | 627 |
| 1,317 |
| | 665 |
|
| Issuance of long-term debt | 841 |
| | — |
| — |
| | 841 |
|
| Repayment of long-term debt | (603 | ) | | (13 | ) | (66 | ) | | (603 | ) |
| Issuance of Class A Common Stock | 5 |
| | 4 |
| — |
| | 5 |
|
| Dividends paid | (139 | ) | | (118 | ) | (156 | ) | | (139 | ) |
| Purchase of treasury stock | (797 | ) | | (815 | ) | (150 | ) | | (797 | ) |
| Share-based compensation withholding taxes | (95 | ) | | (95 | ) | (95 | ) | | (95 | ) |
| Net cash used in financing activities | (123 | ) | | (410 | ) | |
| (DECREASE) INCREASE IN CASH, CASH EQUIVALENTS, AND RESTRICTED CASH | (60 | ) | | 314 |
| |
| Net cash provided by (used in) financing activities | | 850 |
| | (123 | ) |
| INCREASE (DECREASE) IN CASH, CASH EQUIVALENTS, AND RESTRICTED CASH | | 1,529 |
| | (60 | ) |
CASH, CASH EQUIVALENTS, AND RESTRICTED CASH, beginning of period (1) | 360 |
| | 429 |
| 253 |
| | 360 |
|
CASH, CASH EQUIVALENTS, AND RESTRICTED CASH, end of period (1) | $ | 300 |
| | $ | 743 |
| $ | 1,782 |
| | $ | 300 |
|
| |
(1) | The 20192020 amounts include beginning restricted cash of $44$28 million at December 31, 2018,2019, and ending restricted cash of $42$22 million at March 31, 2019,2020, which we present in the “Prepaid expenses and other” and “Other noncurrent assets” captions of our Balance Sheets. |
See Notes to Condensed Consolidated Financial Statements.
MARRIOTT INTERNATIONAL, INC.
NOTES TO CONDENSED CONSOLIDATED FINANCIAL STATEMENTS
(Unaudited)
NOTE 1. BASIS OF PRESENTATION
The condensed consolidated financial statements present the results of operations, financial position, and cash flows of Marriott International, Inc. and subsidiaries (referred to in this report as “we,” “us,” “Marriott,” or “the Company”). In order to make this report easier to read, we also refer throughout to (i) our Condensed Consolidated Financial Statements as our “Financial Statements,” (ii) our Condensed Consolidated Statements of Income as our “Income Statements,” (iii) our Condensed Consolidated Balance Sheets as our “Balance Sheets,” (iv) our Condensed Consolidated Statements of Cash Flows as our “Statements of Cash Flows,” (v) our properties, brands, or markets in the United States (“U.S.”) and Canada as “North America” or “North American,” and (vi) our properties, brands, or markets in our Caribbean and Latin America region, Europe, and Middle East and Africa regions as “Other International,”segment, and together with those in our Asia Pacific segment, as “International.” In addition, references throughout to numbered “Footnotes”“Notes” refer to the numbered Notes in these Notes to Condensed Consolidated Financial Statements, unless otherwise noted.stated.
These Financial Statements have not been audited. We have condensed or omitted certain information and footnote disclosures normally included in financial statements presented in accordance with U.S. generally accepted accounting principles (“GAAP”). The financial statements in this report should be read in conjunction with the consolidated financial statements and notes thereto in our Annual Report on Form 10-K for the fiscal year ended December 31, 20182019 (“2018 2019 Form 10-K”10-K”). Certain terms not otherwise defined in this Form 10-Q have the meanings specified in our 2018 2019 Form 10-K.10-K.
Preparation of financial statements that conform with GAAP requires management to make estimates and assumptions that affect the reported amounts of assets and liabilities as of the date of the financial statements, the reported amounts of revenues and expenses during the reporting periods, and the disclosures of contingent liabilities. The uncertainty created by the coronavirus and efforts to contain it (“COVID-19”) has made such estimates more difficult and subjective. Accordingly, ultimate results could differ from those estimates.
The accompanying Financial Statements reflect all normal and recurring adjustments necessary to present fairly our financial position as of March 31, 20192020 and December 31, 2018,2019, the results of our operations for the three months ended March 31, 20192020 and March 31, 2018,2019, and cash flows for the three months ended March 31, 20192020 and March 31, 2018. As described in Part II, Item 8 of our 2018 Form 10-K, in the 2018 fourth quarter, we identified errors related to our Loyalty Program, which resulted in the understatement of cost reimbursement revenue, net of reimbursed expenses. We presented revised information for the 2018 first, second, and third quarters in our 2018 Form 10-K, and the accompanying Income Statement for the three months ended March 31, 2018 reflects the revised information.2019. Interim results may not be indicative of fiscal year performance because of seasonal and short-term variations.variations, as well as the impact of COVID-19. We have eliminated all material intercompany transactions and balances between entities consolidated in these Financial Statements.
The accompanying Financial Statements also reflect our adoption of ASU 2016-02. See the “New Accounting Standards Adopted” caption below for additional information.
New Accounting Standards Adopted
Accounting Standards Update (“ASU”) No. 2016-022016-13 - “Leases”“Financial Instruments-Credit Losses” (Topic 842)326).
ASU 2016-02 introduces a lessee model2016-13 requires the use of an impairment methodology that brings substantially all leases ontoreflects an estimate of expected credit losses, measured over the balance sheet. Under the standard, a lessee recognizescontractual life of an instrument, based on its balance sheet a lease liabilityinformation about past events, current conditions, and a right-of-use asset for most leases, including operating leases. The new standard also distinguishes leases as either finance leases or operating leases. This distinction affects how leases are measured and presented in the income statement and statementforecasts of cash flows.future economic conditions. We adopted ASU 2016-022016-13 in the 20192020 first quarter using the modified retrospective transition method. Our accountingUpon adoption, we increased our allowance for finance leases remained substantially unchanged. Adoption of the standard resultedcredit losses in the recording“Accounts and notes receivable, net” caption of $1,013our Balance Sheets by $19 million, of operating lease assets and $1,053from $82 million of operating lease liabilities, as ofat December 31, 2019 to $101 million at January 1, 2019.2020. We did not adjustalso recorded a $4 million decrease in the “Deferred tax liabilities” caption of our prior periodBalance Sheets and a $15 million cumulative-effect adjustment to retained earnings on our Balance Sheets. Adoption
In the 2020 first quarter, we further increased our allowance for credit losses by $78 million, primarily due to the negative economic impact caused by COVID-19 and our estimate of the standard did not impact our Income Statements or our Statements of Cash Flows.future economic conditions. The allowance for credit losses was $178 million at March 31, 2020.
WhenNOTE 2. DISPOSITIONS
In the 2020 first quarter, we adopted ASU 2016-02, we applied the package of practical expedients allowed by the standard, and therefore, we did not reassess:
Whether any expired or existing contracts are or contain leases under the new definition;
The lease classificationsold a North America property for any expired or existing leases; or
Whether previously capitalized costs$268 million. We will continue to qualify as initial direct costs.
See Footnote 7. Leases for disclosures required by ASU 2016-02.operate the hotel under a long-term management agreement.
2. ACQUISITIONS
In the 2019 first quarter, we accelerated our option to acquire our partner’s remaining interests in two joint ventures. As a result of the transaction, we recognized an indefinite-lived brand asset for AC Hotels by Marriott of $156 million and management and franchise contract assets, with a weighted-average term of 24 years, totaling $34 million.
NOTE 3. EARNINGS PER SHARE
The table below presents the reconciliation of the earnings and number of shares used in our calculations of basic and diluted earnings per share:
|
| | | | | | | |
| | Three Months Ended |
| (in millions, except per share amounts) | March 31, 2020 | | March 31, 2019 |
| Computation of Basic Earnings Per Share | | | |
| Net income | $ | 31 |
| | $ | 375 |
|
| Shares for basic earnings per share | 325.4 |
| | 339.6 |
|
| Basic earnings per share | $ | 0.10 |
| | $ | 1.10 |
|
| Computation of Diluted Earnings Per Share | | | |
| Net income | $ | 31 |
| | $ | 375 |
|
| Shares for basic earnings per share | 325.4 |
| | 339.6 |
|
| Effect of dilutive securities | | | |
| Share-based compensation | 2.0 |
| | 3.2 |
|
| Shares for diluted earnings per share | 327.4 |
| | 342.8 |
|
| Diluted earnings per share | $ | 0.09 |
| | $ | 1.09 |
|
|
| | | | | | | |
| | Three Months Ended |
| (in millions, except per share amounts) | March 31, 2019 | | March 31, 2018 |
| Computation of Basic Earnings Per Share | | | |
| Net income | $ | 375 |
| | $ | 420 |
|
| Shares for basic earnings per share | 339.6 |
| | 358.4 |
|
| Basic earnings per share | $ | 1.10 |
| | $ | 1.17 |
|
| Computation of Diluted Earnings Per Share | | | |
| Net income | $ | 375 |
| | $ | 420 |
|
| Shares for basic earnings per share | 339.6 |
| | 358.4 |
|
| Effect of dilutive securities | | | |
| Share-based compensation | 3.2 |
| | 4.9 |
|
| Shares for diluted earnings per share | 342.8 |
| | 363.3 |
|
| Diluted earnings per share | $ | 1.09 |
| | $ | 1.16 |
|
NOTE 4. SHARE-BASED COMPENSATION
RSUs and PSUs
We granted 1.51.6 million restricted stock units (“RSUs”) during the 20192020 first quarter to certain officers and key employees, and those units vest generally over four years in equal annual installments commencing one year after the grant date. We also granted 0.1 million performance-based RSUs (“PSUs”) in the 20192020 first quarter to certain executive officers, which are earned, subject to continued employment and the satisfaction of certain performance conditions based on achievement of pre-established targets for gross room openings, active Marriott Bonvoy™ loyalty member penetration,growth, and adjusted operating income growth over, or at the end of, a three-year performance period. RSUs, including PSUs, granted in the 20192020 first quarter had a weighted average grant-date fair value of $117.$112 per unit.
We recorded share-based compensation expense for RSUs and PSUs of $38 million in the 20192020 first quarter and $39$38 million in the 20182019 first quarter. Deferred compensation costs for unvested awards for RSUs and PSUs totaled $314$318 million at March 31, 20192020 and $167$176 million at December 31, 2018.2019.
NOTE 5. INCOME TAXES
Our effective tax rate decreasedwas a benefit of 63.5 percent for the 2020 first quarter compared to a provision of 13.2 percent for the 2019 first quarter from 21.1 percent for the 2018 first quarter,quarter. The decrease in our effective tax rate was primarily due to the prior year tax expense incurred for uncertain tax positions relating to legacy-Starwood operations, the prior year state income tax expense due to a change in our position regarding the future remittancemore favorable impact from stock based compensation as a percentage of accumulated earnings of non-U.S. subsidiaries, prior year tax on dispositions, and increased earnings in jurisdictions with lower tax rates. The decrease was partially offset by the 2018 release of tax reserves due to the completion of certain examinations.pre-tax book income.
We paid cash for income taxes, net of refunds, of $59 million in the 2020 first quarter and $64 million in the 2019 first quarter and $88 million in the 2018 first quarter.
NOTE 6. COMMITMENTS AND CONTINGENCIES
Guarantees
We present the maximum potential amount of our future guarantee fundings and the carrying amount of our liability for our debt service, operating profit, and other guarantees (excluding contingent purchase obligations) for which we are the primary obligor at March 31, 20192020 in the following table:
|
| | | | | | | | |
($ in millions) Guarantee Type | | Maximum Potential Amount of Future Fundings | | Recorded Liability for Guarantees |
| Debt service | | $ | 53 |
| | $ | 6 |
|
| Operating profit | | 225 |
| | 153 |
|
| Other | | 14 |
| | 3 |
|
| | | $ | 292 |
| | $ | 162 |
|
|
| | | | | | | | |
($ in millions) Guarantee Type | | Maximum Potential Amount of Future Fundings | | Recorded Liability for Guarantees |
| Debt service | | $ | 116 |
| | $ | 15 |
|
| Operating profit | | 195 |
| | 98 |
|
| Other | | 9 |
| | 1 |
|
| | | $ | 320 |
| | $ | 114 |
|
Contingent Purchase Obligation
Sheraton Grand Chicago. We granted the owner a one-time right, exercisable in 2022, to require us to purchase the leasehold interest in the land and the hotel for $300 million in cash (the “put option”). If the owner exercises the put option, we have the option to purchase, at the same time the put transaction closes, the underlying fee simple interest in the underlying land for an additional $200 million in cash. We accounted for the put option as a guarantee, and our recorded liability at March 31, 20192020 was $57 million.
Starwood Data Security Incident
Description of Event
On November 30, 2018, we announced a data security incident involving unauthorized access to the Starwood reservations database (the “Data Security Incident”). Working with leading security experts, we determined that there was unauthorized access to the Starwood network since 2014 and that an unauthorized party had copied information from the Starwood reservations database and taken steps towards removing it. While our forensic review of the incident is now complete, certain data analytics work continues. We have completed the planned phase out of the operation of the The Starwood reservations database effective as of the end of 2018is no longer used for business operations.
Expenses and Insurance Recoveries
Inthe 2020 first quarter, we recorded $15 million of expenses and $17 million of accrued insurance recoveries, and in the 2019 first quarter, we recorded $44 million of expenses related to the Data Security Incident and $46 million of accrued insurance recoveries, which we recordedrelated to the Data Security Incident. We received insurance recoveries of $24 million in either the “Reimbursed expenses” or “Merger-related costs2020 first quarter and charges” captions of our Income Statements.$40 million in the 2019 first quarter. Expenses in the 2020 first quarter primarily included customer care and legal costs. We recognize insurance recoveries when they are probable of receipt and present them in our Income Statements in the same caption as the related loss,expense, up to the amount of total lossexpense incurred in prior and current periods.
We present expenses and insurance recoveries related to the Data Security Incident in either the “Reimbursed expenses” or “Merger-related costs and (recoveries) charges” captions of our Income Statements.
Litigation, Claims, and Government Investigations
To date,Following our announcement of the Data Security Incident, approximately 100 lawsuits have beenwere filed by consumers and others against us in U.S. federal, U.S. state and Canadian courts related to the Data Security Incident.incident. All but one of the U.S. cases have been consolidated and transferred to the U.S. District Court for the District of Maryland, pursuant to orders of the U.S. Judicial Panel on Multidistrict Litigation (the “MDL”). The vast majority of theseplaintiffs in the U.S. and Canadian cases, are putative consumer class actions, in which the plaintiffs, who generally purport to represent various classes of consumers, generally claim to have been harmed by alleged actions and/or omissions by the Company in connection with the Data Security Incident and assert a variety of common law and statutory claims seeking monetary damages, injunctive relief, costs and
attorneys’ fees, and other related relief. All ofAmong the U.S. cases have been consolidated and transferred toin the U.S. District Court for the District of Maryland, pursuant to orders of the U.S. Judicial Panel on Multidistrict Litigation (MDL). In addition,MDL proceeding is a putative class action lawsuit that was filed against us and certain of our current officers and directors on December 1, 2018, alleging violations of the federal securities laws in connection with statements regarding our cybersecurity systems and controls, and seeking certification of a class of affected persons, unspecified monetary damages, costs and attorneys’ fees, and other related relief. TwoThe MDL proceeding also includes 2 shareholder derivative complaints that were also filed on February 26, 2019 and March 15, 2019, respectively, against the Company, certain of its officers and certain of the members of our Board of Directors, alleging, among other claims, breach of fiduciary duty, corporate waste, unjust enrichment, mismanagement and violations of the federal securities laws, and seeking unspecified monetary damages and restitution, changes to the Company’s corporate governance and internal procedures, costs and attorneys’ fees, and other related relief. These cases are also covered byA third shareholder derivative complaint was filed in the Delaware Court of Chancery on December 3, 2019 against the Company and certain of its officers and certain current and former members of our Board of Directors, alleging claims and seeking relief generally similar to the claims made and relief sought in the other two derivative cases. This case will not be consolidated with the MDL order.proceeding. We dispute the allegations in the lawsuits described above and intend to defendare vigorously defending against such claims. We have filed motions to dismiss several of these cases, some of which have been denied, but the cases generally remain at an early stage. There has been some consolidation of the Canadian cases, with 5 cases now pending across 5 provinces, and we expect there could be further consolidation in the future. In addition, in April 2019, we received a letter purportedly on behalf of a shareholder of the Company (also one of the named plaintiffs in the putative securities class action described above) demanding that our Board of Directors take action against the Company’s current and certain former officers and directors to recover damages for alleged breaches of fiduciary duties and related claims arising from the Data Security Incident. The Board of Directors has constituted a demand review committee to investigate the claims made in the demand letter, and the committee has retained independent counsel to assist with the investigation. The committee’s investigation is ongoing.
In addition, numerous U.S. federal, U.S. state and foreign governmental authorities are investigating, or otherwise seeking information and/or documents related to, the Data Security Incident and related matters, including Attorneys General offices from all 50 states and the District of Columbia, the Federal Trade Commission, the Securities and Exchange Commission, certain committees of the U.S. Senate and House of Representatives, the Information Commissioner’s Office in the United Kingdom (“ICO”(the “ICO”) as lead supervisory authority in the European Economic Area, and regulatory authorities in various other jurisdictions. FollowingIn July 2019, the ICO issued a formal notice of intent under the U.K. Data Protection Act 2018 proposing a fine in the amount of £99 million against the Company in relation to the Data Security Incident (the “Proposed ICO Fine”). In late August 2019, we submitted a written response to the ICO notified us that it had opened an investigation intovigorously defending our position, and we have continued to engage with the Company’s online privacy policy and related practices and an investigation into the Company’s handling of data subject access requests. These investigations are separate from the ICO’s investigation related toICO regarding the Data Security Incident. Incident and Proposed ICO Fine. We mutually agreed with the ICO to an extension of the regulatory process until September 30, 2020 and the ICO proceeding is ongoing. Our accrual for this loss contingency, which we present in the “Accrued expenses and other” caption of our Balance Sheets, of $65 million at December 31, 2019, remained unchanged at March 31, 2020.
While we believe it is reasonably possible that we may incur additional losses associated with the above described proceedings and investigations related to the Data Security Incident, it is not possible to estimate the amount of loss or range of loss, if any, in excess of the amounts already incurred that might result from adverse judgments, settlements, fines, penalties, or other resolution of these proceedings and investigations based on the current stage of these proceedings and investigations, the absence of specific allegations as to alleged damages, the uncertainty as to the certification of a class or classes and the size of any certified class, if applicable, and/or the lack of resolution of significant factual and legal issues.
7. NOTE 7. LEASES
We enter into operating and finance leases primarily for hotels, offices, and equipment. Most leases have initial terms of up to 20 years, and contain one or more renewals at our option, generally for five- or 10-year periods. We have generally not included these renewal periods in the lease term as it is not reasonably certain that we will exercise the renewal option. In addition, our leases generally contain fixed and variable components. The variable components of leases of land or building facilities are primarily based on operating performance of the leased property. Our lease agreements may also include non-lease components, such as common area maintenance, which we combine with the lease component to account for both as a single lease component. We calculate the present value of future payments using a discount rate equal to our incremental borrowing rate.
The following table details the composition of lease expense for the 2019 first quarter:
|
| | | | |
| | | Three Months Ended |
| ($ in millions) | | March 31, 2019 |
Operating lease cost | | $ | 45 |
|
| Variable lease cost | | 27 |
|
The following tables presentpresents our future minimum lease payments and additional information about our lease obligations as of March 31, 2019:2020:
|
| | | | | | | |
| ($ in millions) | Operating Leases | | Finance Leases |
2020, remaining | $ | 135 |
| | $ | 10 |
|
| 2021 | 171 |
| | 13 |
|
| 2022 | 166 |
| | 13 |
|
| 2023 | 115 |
| | 13 |
|
| 2024 | 106 |
| | 14 |
|
| Thereafter | 570 |
| | 151 |
|
| Total minimum lease payments | $ | 1,263 |
| | $ | 214 |
|
| Less: Amount representing interest | (280 | ) | | (58 | ) |
Present value of minimum lease payments | $ | 983 |
| | $ | 156 |
|
| | | | |
Current (1) | 137 |
| | 6 |
|
Noncurrent (2) | 846 |
| | 150 |
|
| | $ | 983 |
| | $ | 156 |
|
|
| | | | | | | |
| ($ in millions) | Operating Leases | | Finance Leases |
2019, remaining | $ | 132 |
| | $ | 10 |
|
| 2020 | 161 |
| | 13 |
|
| 2021 | 142 |
| | 13 |
|
| 2022 | 136 |
| | 13 |
|
| 2023 | 107 |
| | 13 |
|
| Thereafter | 665 |
| | 165 |
|
| Total minimum lease payments | $ | 1,343 |
| | $ | 227 |
|
| Less: Amount representing interest | (323 | ) | | (65 | ) |
Present value of minimum lease payments | $ | 1,020 |
| | $ | 162 |
|
| |
(1) | Operating leases recorded in the “Accrued expenses and other” and finance leases recorded in the “Current portion of long-term debt” captions of our Balance Sheets. |
| |
(2) | Operating leases recorded in the “Operating lease liabilities” and finance leases recorded in the “Long-term debt” captions of our Balance Sheets. |
As of March 31, 2019,2020, we had entered into an agreement that we expect to account for as an operating lease with a 20-year term for our new headquarters office, which is not reflected in our Balance Sheets or in the table above as the lease has not commenced.
|
| | |
| March 31, 2019 |
Weighted Average Remaining Lease Term (in years) | |
Operating leases | 11 |
|
Finance leases | 15 |
|
Weighted Average Discount Rate | |
Operating leases | 5.0 | % |
Finance leases | 4.4 | % |
The following table detailsIn the classification2020 first quarter, we recorded impairment charges of lease liabilities$74 million for right-of-use assets and $16 million for property and equipment, including leasehold improvements, in the “Depreciation, amortization, and other” caption of our Balance Sheets:
|
| | | | | |
| ($ in millions) | Caption | | March 31, 2019 |
| Operating lease liabilities | | | |
| Current | Accrued expenses and other | | $ | 131 |
|
| Noncurrent | Operating lease liabilities | | 889 |
|
| | | | $ | 1,020 |
|
| Finance lease liabilities | | | |
| Current | Current portion of long-term debt | | $ | 6 |
|
| Noncurrent | Long-term debt | | 156 |
|
| | | | $ | 162 |
|
The following table presents supplementalIncome Statements relating to the impact of COVID-19 on several North America leased hotels. We determined that we may not be able to fully recover the carrying amount of these North America hotel leases after evaluating the assets for recovery due to declines in market performance and future cash flow information forprojections. We estimated the 2019 first quarter:
|
| | | | |
| | | Three Months Ended |
| ($ in millions) | | March 31, 2019 |
| Cash paid for amounts included in the measurement of lease liabilities: | | |
| Operating cash outflows for operating leases | | $ | 44 |
|
| Operating cash outflows for finance leases | | 2 |
|
| Financing cash outflows for finance leases | | 1 |
|
NOTE 8. LONG-TERM DEBT
We provide detail on our long-term debt balances, net of discounts, premiums, and debt issuance costs, in the following table at the end of the 20192020 first quarter and year-end 2018:2019:
|
| | | | | | | |
| | At Period End |
| ($ in millions) | March 31,
2020 | | December 31,
2019 |
| Senior Notes: | | | |
Series L Notes, interest rate of 3.3%, face amount of $350, maturing September 15, 2022
(effective interest rate of 3.4%) | 349 |
| | 349 |
|
Series M Notes, interest rate of 3.4%, face amount of $350, maturing October 15, 2020
(effective interest rate of 3.6%) | 350 |
| | 349 |
|
Series N Notes, interest rate of 3.1%, face amount of $400, maturing October 15, 2021
(effective interest rate of 3.4%) | 399 |
| | 398 |
|
Series O Notes, interest rate of 2.9%, face amount of $450, maturing March 1, 2021
(effective interest rate of 3.1%) | 449 |
| | 449 |
|
Series P Notes, interest rate of 3.8%, face amount of $350, maturing October 1, 2025
(effective interest rate of 4.0%) | 346 |
| | 346 |
|
Series Q Notes, interest rate of 2.3%, face amount of $750, maturing January 15, 2022
(effective interest rate of 2.5%) | 747 |
| | 747 |
|
Series R Notes, interest rate of 3.1%, face amount of $750, maturing June 15, 2026
(effective interest rate of 3.3%) | 744 |
| | 744 |
|
Series U Notes, interest rate of 3.1%, face amount of $291, maturing February 15, 2023
(effective interest rate of 3.1%) | 291 |
| | 291 |
|
Series V Notes, interest rate of 3.8%, face amount of $318, maturing March 15, 2025
(effective interest rate of 2.8%) | 332 |
| | 332 |
|
Series W Notes, interest rate of 4.5%, face amount of $278, maturing October 1, 2034
(effective interest rate of 4.1%) | 291 |
| | 291 |
|
Series X Notes, interest rate of 4.0%, face amount of $450, maturing April 15, 2028 (effective interest rate of 4.2%) | 444 |
| | 444 |
|
Series Y Notes, floating rate, face amount of $550, maturing December 1, 2020 (effective interest rate of 2.2% at March 31, 2020) | 549 |
| | 549 |
|
Series Z Notes, interest rate of 4.2%, face amount of $350, maturing December 1, 2023 (effective interest rate of 4.4%) | 348 |
| | 347 |
|
Series AA Notes, interest rate of 4.7%, face amount of $300, maturing December 1, 2028 (effective interest rate of 4.8%) | 297 |
| | 297 |
|
Series BB Notes, floating rate, face amount of $300, maturing March 8, 2021 (effective interest rate of 1.6% at March 31, 2020) | 299 |
| | 299 |
|
Series CC Notes, interest rate of 3.6%, face amount of $550, maturing April 15, 2024 (effective interest rate of 3.9%) | 591 |
| | 564 |
|
Series DD Notes, interest rate of 2.1%, face amount of $550, maturing October 3, 2022 (effective interest rate of 2.4%) | 561 |
| | 543 |
|
| | | | |
| Commercial paper | 2,011 |
| | 3,197 |
|
| Credit Facility | 2,500 |
| | — |
|
| Finance lease obligations | 156 |
| | 157 |
|
| Other | 179 |
| | 247 |
|
| | $ | 12,233 |
| | $ | 10,940 |
|
| Less: Current portion of long-term debt | (1,664 | ) | | (977 | ) |
| | $ | 10,569 |
| | $ | 9,963 |
|
|
| | | | | | | |
| | At Period End |
| ($ in millions) | March 31,
2019 | | December 31,
2018 |
| Senior Notes: | | | |
Series K Notes, interest rate of 3.0%, face amount of $600, matured March 1, 2019
(effective interest rate of 4.4%) | $ | — |
| | $ | 600 |
|
Series L Notes, interest rate of 3.3%, face amount of $350, maturing September 15, 2022
(effective interest rate of 3.4%) | 349 |
| | 349 |
|
Series M Notes, interest rate of 3.4%, face amount of $350, maturing October 15, 2020
(effective interest rate of 3.6%) | 349 |
| | 349 |
|
Series N Notes, interest rate of 3.1%, face amount of $400, maturing October 15, 2021
(effective interest rate of 3.4%) | 398 |
| | 397 |
|
Series O Notes, interest rate of 2.9%, face amount of $450, maturing March 1, 2021
(effective interest rate of 3.1%) | 448 |
| | 448 |
|
Series P Notes, interest rate of 3.8%, face amount of $350, maturing October 1, 2025
(effective interest rate of 4.0%) | 345 |
| | 345 |
|
Series Q Notes, interest rate of 2.3%, face amount of $750, maturing January 15, 2022
(effective interest rate of 2.5%) | 745 |
| | 745 |
|
Series R Notes, interest rate of 3.1%, face amount of $750, maturing June 15, 2026
(effective interest rate of 3.3%) | 744 |
| | 743 |
|
Series T Notes, interest rate of 7.2%, face amount of $181, maturing December 1, 2019
(effective interest rate of 2.3%) | 186 |
| | 188 |
|
Series U Notes, interest rate of 3.1%, face amount of $291, maturing February 15, 2023
(effective interest rate of 3.1%) | 291 |
| | 291 |
|
Series V Notes, interest rate of 3.8%, face amount of $318, maturing March 15, 2025
(effective interest rate of 2.8%) | 334 |
| | 335 |
|
Series W Notes, interest rate of 4.5%, face amount of $278, maturing October 1, 2034
(effective interest rate of 4.1%) | 292 |
| | 292 |
|
Series X Notes, interest rate of 4.0%, face amount of $450, maturing April 15, 2028 (effective interest rate of 4.2%) | 443 |
| | 443 |
|
Series Y Notes, floating rate, face amount of $550, maturing December 1, 2020 (effective interest rate of 3.2% at March 31, 2019) | 548 |
| | 547 |
|
Series Z Notes, interest rate of 4.2%, face amount of $350, maturing December 1, 2023 (effective interest rate of 4.4%) | 347 |
| | 347 |
|
Series AA Notes, interest rate of 4.7%, face amount of $300, maturing December 1, 2028 (effective interest rate of 4.8%) | 297 |
| | 297 |
|
Series BB Notes, floating rate, face amount of $300, maturing March 8, 2021 (effective interest rate of 3.2% at March 31, 2019) | 298 |
| | — |
|
Series CC Notes, interest rate of 3.6%, face amount of $550, maturing April 15, 2024 (effective interest rate of 3.9%) | 550 |
| | — |
|
| | | | |
| Commercial paper | 2,911 |
| | 2,245 |
|
| Credit Facility | — |
| | — |
|
| Finance lease obligations | 162 |
| | 163 |
|
| Other | 219 |
| | 223 |
|
| | $ | 10,256 |
| | $ | 9,347 |
|
| Less: Current portion of long-term debt | (231 | ) | | (833 | ) |
| | $ | 10,025 |
| | $ | 8,514 |
|
We paid cash for interest, net of amounts capitalized, of $63 million in the 2020 first quarter and $70 million in the 2019 first quarter and $51 million in the 2018 first quarter.
We are party to a multicurrency revolving credit agreement (the(as amended, the “Credit Facility”) that provides for up to $4$4.5 billion of aggregate effective borrowings to support our commercial paper program and general corporate needs, including working capital, capital expenditures, share repurchases, letters of credit, and acquisitions. Borrowings under the Credit Facility generally bear interest at LIBOR (the London Interbank Offered Rate) plus a spread based
on our public debt rating. We also pay quarterly fees on the Credit Facility at a rate based on our public debt rating. While anyWe classify outstanding borrowings under the Credit Facility and outstanding commercial paper borrowings and/or borrowings under our Credit Facility generally have short-term maturities, we classify the outstanding borrowings as
long-term based on our ability and intent to refinance the outstanding borrowings on a long-term basis. The Credit Facility expires on June 10, 2021. See28, 2024.
We borrowed $2.5 billion under the “Cash RequirementsCredit Facility in late March 2020 and Our Credit Facility” caption lateranother $2.0 billion in this reportearly April 2020, resulting in the “Liquidity and Capital Resources” section of Item 2 below for further information on our Credit Facility being fully drawn as of April 2, 2020, with a total of $4.5 billion outstanding. On May 1, 2020, we repaid $1.25 billion, reducing the total outstanding borrowings under the Credit Facility to $3.25 billion as of May 1, 2020. Our borrowings under the Credit Facility were to increase our cash position and available borrowing capacity at March 31, 2019.preserve financial flexibility in light of the impact on global markets resulting from COVID-19. Remaining proceeds from the Credit Facility borrowings may be used to repay commercial paper when it matures and for general corporate or other purposes permitted by the Credit Facility.
In April 2020, we entered into an amendment to the 2019Credit Facility. The amendment waives the quarterly-tested leverage covenant in the Credit Facility through and including the first quarter of 2021 (which waiver period may end sooner at our election), adjusts the required leverage levels for the covenant when it is re-imposed at the end of the waiver period, and imposes a new monthly-tested liquidity covenant for the duration of the waiver period. The amendment also makes certain other amendments to the terms of the Credit Facility, including increasing the interest and fees payable on the Credit Facility for the duration of the period during which the waiver of the leverage covenant remains in effect, tightening certain existing covenants, and imposing additional covenants for the duration of the waiver period. These covenant changes include tightening the lien covenant and the covenant on dividends, share repurchases and distributions, and imposing new covenants limiting asset sales, investments and discretionary capital expenditures.
In April 2020, we issued $300 million$1.6 billion aggregate principal amount of LIBOR plus 0.6505.750 percent Series BBEE Notes due March 8, 2021May 1, 2025 (the “Series BB Notes”) and $550 million aggregate principal amount of 3.600 percent Series CC Notes due April 15, 2024 (the “Series CCEE Notes”). We will pay interest on the Series BBEE Notes in March, June, September,on May 1 and DecemberNovember 1 of each year, commencing in June 2019, and will pay interest on the Series CC Notes in April and October of each year, commencing in October 2019.November 1, 2020. We received net proceeds of approximately $841 million$1.581 billion from the offering of the Series BB Notes and Series CCEE Notes, after deducting the underwriting discount and estimated expenses, which were made available for general corporate purposes, which may include working capital, capital expenditures, acquisitions, stock repurchases, or repayment of outstanding commercial paper or other borrowings.purposes.
NOTE 9. FAIR VALUE OF FINANCIAL INSTRUMENTS
We believe that the fair values of our current assets and current liabilities approximate their reported carrying amounts. We present the carrying values and the fair values of noncurrent financial assets and liabilities that qualify as financial instruments, determined under current guidance for disclosures on the fair value of financial instruments, in the following table:
|
| | | | | | | | | | | | | | | |
| | March 31, 2020 | | December 31, 2019 |
| ($ in millions) | Carrying Amount | | Fair Value | | Carrying Amount | | Fair Value |
| Senior, mezzanine, and other loans | $ | 144 |
| | $ | 138 |
| | $ | 117 |
| | $ | 112 |
|
| Total noncurrent financial assets | $ | 144 |
| | $ | 138 |
| | $ | 117 |
| | $ | 112 |
|
| | | | | | | | |
| Senior Notes | $ | (5,740 | ) | | $ | (5,316 | ) | | $ | (6,441 | ) | | $ | (6,712 | ) |
| Commercial paper / Credit Facility | (4,511 | ) | | (4,511 | ) | | (3,197 | ) | | (3,197 | ) |
| Other long-term debt | (168 | ) | | (156 | ) | | (174 | ) | | (179 | ) |
| Other noncurrent liabilities | (177 | ) | | (177 | ) | | (196 | ) | | (196 | ) |
| Total noncurrent financial liabilities | $ | (10,596 | ) | | $ | (10,160 | ) | | $ | (10,008 | ) | | $ | (10,284 | ) |
|
| | | | | | | | | | | | | | | |
| | March 31, 2019 | | December 31, 2018 |
| ($ in millions) | Carrying Amount | | Fair Value | | Carrying Amount | | Fair Value |
| Senior, mezzanine, and other loans | $ | 124 |
| | $ | 120 |
| | $ | 125 |
| | $ | 116 |
|
| Total noncurrent financial assets | $ | 124 |
| | $ | 120 |
| | $ | 125 |
| | $ | 116 |
|
| | | | | | | | |
| Senior Notes | $ | (6,778 | ) | | $ | (6,828 | ) | | $ | (5,928 | ) | | $ | (5,794 | ) |
| Commercial paper | (2,911 | ) | | (2,911 | ) | | (2,245 | ) | | (2,245 | ) |
| Other long-term debt | (180 | ) | | (183 | ) | | (184 | ) | | (182 | ) |
| Other noncurrent liabilities | (152 | ) | | (152 | ) | | (153 | ) | | (153 | ) |
| Total noncurrent financial liabilities | $ | (10,021 | ) | | $ | (10,074 | ) | | $ | (8,510 | ) | | $ | (8,374 | ) |
In the 2020 first quarter, we determined that the carrying value of our Credit Facility borrowings approximated fair value because they bear interest at a market rate. See Note 13. Fair Value of Financial Instruments and the “Fair Value Measurements” caption of FootnoteNote 2. Summary of Significant Accounting Policies of our 20182019 Form 10-K for more information on the input levels we use in determining fair value.
NOTE 10. ACCUMULATED OTHER COMPREHENSIVE LOSS AND SHAREHOLDERS’ EQUITY
The following tables detail the accumulated other comprehensive loss activity for the 20192020 first quarter and 20182019 first quarter:
|
| | | | | | | | | | | |
| ($ in millions) | Foreign Currency Translation Adjustments | | Derivative Instrument and Other Adjustments | | Accumulated Other Comprehensive Loss |
| Balance at year-end 2019 | $ | (368 | ) | | $ | 7 |
| | $ | (361 | ) |
Other comprehensive (loss) income before reclassifications (1) | (383 | ) | | 13 |
| | (370 | ) |
| Reclassification of gains | — |
| | (8 | ) | | (8 | ) |
| Net other comprehensive loss | (383 | ) | | 5 |
| | (378 | ) |
| Balance at March 31, 2020 | $ | (751 | ) | | $ | 12 |
| | $ | (739 | ) |
|
| | | | | | | | | | | | | | | |
| ($ in millions) | Foreign Currency Translation Adjustments | | Derivative Instrument Adjustments | | Pension and Postretirement Adjustments | | Accumulated Other Comprehensive Loss |
| Balance at year-end 2018 | $ | (403 | ) | | $ | 8 |
| | $ | 4 |
| | $ | (391 | ) |
Other comprehensive income (loss) before reclassifications (1) | 33 |
| | (1 | ) | | — |
| | 32 |
|
| Reclassification of income | — |
| | (1 | ) | | — |
| | (1 | ) |
| Net other comprehensive income (loss) | 33 |
| | (2 | ) | | — |
| | 31 |
|
| Balance at March 31, 2019 | $ | (370 | ) | | $ | 6 |
| | $ | 4 |
| | $ | (360 | ) |
|
| | | | | | | | | | | |
| ($ in millions) | Foreign Currency Translation Adjustments | | Derivative Instrument and Other Adjustments | | Accumulated Other Comprehensive Loss |
| Balance at year-end 2018 | $ | (403 | ) | | $ | 12 |
| | $ | (391 | ) |
Other comprehensive (loss) income before reclassifications (1) | 33 |
| | (1 | ) | | 32 |
|
| Reclassification of losses | — |
| | (1 | ) | | (1 | ) |
| Net other comprehensive (loss) income | 33 |
| | (2 | ) | | 31 |
|
| Balance at March 31, 2019 | $ | (370 | ) | | $ | 10 |
| | $ | (360 | ) |
|
| | | | | | | | | | | | | | | | | | | |
| ($ in millions) | Foreign Currency Translation Adjustments | | Derivative Instrument Adjustments | | Available-For-Sale Securities Unrealized Adjustments | | Pension and Postretirement Adjustments | | Accumulated Other Comprehensive Loss |
| Balance at year-end 2017 | $ | (23 | ) | | $ | (10 | ) | | $ | 4 |
| | $ | 12 |
| | $ | (17 | ) |
Other comprehensive income (loss) before reclassifications (1) | 152 |
| | (3 | ) | | — |
| | — |
| | 149 |
|
| Reclassification of losses | 9 |
| | 4 |
| | — |
| | — |
| | 13 |
|
| Net other comprehensive income | 161 |
| | 1 |
| | — |
| | — |
| | 162 |
|
| Adoption of ASU 2016-01 | — |
| | — |
| | (4 | ) | | — |
| | (4 | ) |
| Balance at March 31, 2018 | $ | 138 |
| | $ | (9 | ) | | $ | — |
| | $ | 12 |
| | $ | 141 |
|
| |
(1) | Other comprehensive (loss) income before reclassifications for foreign currency translation adjustments includes intra-entity foreign currency transactions that are of a long-term investment nature, which resulted in a gaingains of $11 million for the 2020 first quarter and $8 million for the 2019 first quarter and loss of $36 million for the 2018 first quarter. |
The following table detailstables detail the changes in common shares outstanding and shareholders’ (deficit) equity for the 20192020 first quarter and 20182019 first quarter:
| | | (in millions, except per share amounts) | (in millions, except per share amounts) | | | (in millions, except per share amounts) | | |
Common Shares Outstanding | Common Shares Outstanding | | | Total | | Class A Common Stock | | Additional Paid-in- Capital | | Retained Earnings | | Treasury Stock, at Cost | | Accumulated Other Comprehensive Loss | Common Shares Outstanding | | | Total | | Class A Common Stock | | Additional Paid-in-Capital | | Retained Earnings | | Treasury Stock, at Cost | | Accumulated Other Comprehensive Loss |
| 339.1 |
| | Balance at year-end 2018 | $ | 2,225 |
| | $ | 5 |
| | $ | 5,814 |
| | $ | 8,982 |
| | $ | (12,185 | ) | | $ | (391 | ) | |
| 324.0 | |
| | Balance at year-end 2019 | $ | 703 |
| | $ | 5 |
| | $ | 5,800 |
| | $ | 9,644 |
| | $ | (14,385 | ) | | $ | (361 | ) |
| — |
| | Adoption of ASU 2016-02 | 1 |
| | — |
| | — |
| | 1 |
| | — |
| | — |
|
| | Adoption of ASU 2016-13 | (15 | ) | | — |
| | — |
| | (15 | ) | | — |
| | — |
|
| — |
| | Net income | 375 |
| | — |
| | — |
| | 375 |
| | — |
| | — |
|
| | Net income | 31 |
| | — |
| | — |
| | 31 |
| | — |
| | — |
|
| — |
| | Other comprehensive income | 31 |
| | — |
| | — |
| | — |
| | — |
| | 31 |
|
| | Other comprehensive income | (378 | ) | | — |
| | — |
| | — |
| | — |
| | (378 | ) |
| — |
| | Dividends ($0.41 per share) | (139 | ) | | — |
| | — |
| | (139 | ) | | — |
| | — |
|
| | Dividends ($0.48 per share) | (156 | ) | | — |
| | — |
| | (156 | ) | | — |
| | — |
|
| 1.7 |
| | Share-based compensation plans | (62 | ) | | — |
| | (108 | ) | | — |
| | 46 |
| | — |
| |
| (6.7 | ) | | Purchase of treasury stock | (828 | ) | | — |
| | — |
| | — |
| | (828 | ) | | — |
| |
| 334.1 |
| | Balance at March 31, 2019 | $ | 1,603 |
| | $ | 5 |
| | $ | 5,706 |
| | $ | 9,219 |
| | $ | (12,967 | ) | | $ | (360 | ) | |
| 1.2 | |
| | Share-based compensation plans | (55 | ) | | — |
| | (89 | ) | | — |
| | 34 |
| | — |
|
| (1.0 | | ) | | Purchase of treasury stock | (150 | ) | | — |
| | — |
| | — |
| | (150 | ) | | — |
|
| 324.2 | |
| | Balance at March 31, 2020 | (20 | ) | | 5 |
| | 5,711 |
| | 9,504 |
| | (14,501 | ) | | (739 | ) |
|
| | | | | | | | | | | | | | | | | | | | |
| (in millions, except per share amounts) | | |
Common Shares Outstanding | | | Total | | Class A Common Stock | | Additional Paid-in-Capital | | Retained Earnings | | Treasury Stock, at Cost | | Accumulated Other Comprehensive Loss |
| 339.1 |
| | Balance at year-end 2018 (as adjusted) | 2,225 |
| | 5 |
| | 5,814 |
| | 8,982 |
| | (12,185 | ) | | (391 | ) |
| — |
| | Adoption of ASU 2016-02 | 1 |
| | — |
| | — |
| | 1 |
| | — |
| | — |
|
| — |
| | Net income | 375 |
| | — |
| | — |
| | 375 |
| | — |
| | — |
|
| — |
| | Other comprehensive income | 31 |
| | — |
| | — |
| | — |
| | — |
| | 31 |
|
| — |
| | Dividends ($0.41 per share) | (139 | ) | | — |
| | — |
| | (139 | ) | | — |
| | — |
|
| 1.7 |
| | Share-based compensation plans | (62 | ) | | — |
| | (108 | ) | | — |
| | 46 |
| | — |
|
| (6.7 | ) | | Purchase of treasury stock | (828 | ) | | — |
| | — |
| | — |
| | (828 | ) | | — |
|
| 334.1 |
| | Balance at March 31, 2019 | 1,603 |
| | 5 |
| | 5,706 |
| | 9,219 |
| | (12,967 | ) | | (360 | ) |
|
| | | | | | | | | | | | | | | | | | | | | | | | | | |
| (in millions, except per share amounts) | | |
Common Shares Outstanding | | | Total | | Class A Common Stock | | Additional Paid-in- Capital | | Retained Earnings | | Treasury Stock, at Cost | | Accumulated Other Comprehensive Loss |
| 359.1 |
| | Balance at year-end 2017 (as previously reported) | $ | 3,731 |
| | $ | 5 |
| | $ | 5,770 |
| | $ | 7,391 |
| | $ | (9,418 | ) | | $ | (17 | ) |
| — |
| | Adoption of ASU 2014-09 | (149 | ) | | — |
| | — |
| | (149 | ) | | — |
| | — |
|
| 359.1 |
| | Balance at year-end 2017 (as adjusted) | 3,582 |
| | 5 |
| | 5,770 |
| | 7,242 |
| | (9,418 | ) | | (17 | ) |
| — |
| | Adoption of ASU 2016-01 | — |
| | — |
| | — |
| | 4 |
| | — |
| | (4 | ) |
| — |
| | Adoption of ASU 2016-16 | 372 |
| | — |
| | — |
| | 372 |
| | — |
| | — |
|
| — |
| | Net income | 420 |
| | — |
| | — |
| | 420 |
| | — |
| | — |
|
| — |
| | Other comprehensive income | 162 |
| | — |
| | — |
| | — |
| | — |
| | 162 |
|
| — |
| | Dividends ($0.33 per share) | (118 | ) | | — |
| | — |
| | (118 | ) | | — |
| | — |
|
| 1.3 |
| | Share-based compensation plans | (48 | ) | | — |
| | (85 | ) | | — |
| | 37 |
| | — |
|
| (5.6 | ) | | Purchase of treasury stock | (782 | ) | | — |
| | — |
| | — |
| | (782 | ) | | — |
|
| 354.8 |
| | Balance at March 31, 2018 | $ | 3,588 |
| | $ | 5 |
| | $ | 5,685 |
| | $ | 7,920 |
| | $ | (10,163 | ) | | $ | 141 |
|
NOTE 11. CONTRACTS WITH CUSTOMERS
Our current and noncurrent Loyalty Program liability increased by $52$126 million, to $5,513$5,844 million at March 31, 20192020, from $5,461$5,718 million at December 31, 2018,2019, primarily reflecting an increase in points earned by members, partially offset by deferred$462 million of revenue of $543 million that we recognized in the 2020 first quarter, that was deferred as of December 31, 2019. The current portion of our Loyalty Program liability decreased compared to December 31, 2019 due to lower estimated redemptions in the short-term as a result of COVID-19.
In May 2020, we signed amendments to the existing agreements for our U.S.-issued co-brand credit cards associated with our Loyalty Program. These amendments provided the Company with $920 million of cash from the prepayment of certain future revenues, the early payment of a previously committed signing bonus, and the pre-purchase of Marriott Bonvoy points and other consideration. We will record the cash receipts in the deferred revenue and liability for guest loyalty program captions on our Balance Sheet. We will recognize revenue related to the license of our intellectual property as the credit cards are used and revenue related to the points and free night certificates as the points and free night certificates are redeemed. See the “Loyalty Program” caption of Note 2 of our 2019 Form 10-K for more information on our performance obligations.
We did not recognize incentive management fees in the 2020 first quarter.quarter because there is significant uncertainty as to whether we will be entitled to such fees on a full year basis due to the impact of COVID-19 on future hotel performance.
NOTE 12. BUSINESS SEGMENTS
We areBeginning in the 2020 first quarter, we modified our segment structure due to a diversified global lodging company with operationschange in the way management evaluates results and allocates resources within the Company, resulting in the following reportable businessoperating segments:
North American Full-Service, which includes our Luxury and Premium brands located in the U.S. and Canada;
North American Limited-Service, which includes our Select brands located in the U.S. and Canada; and
America; Asia Pacific, which includes all brand tiers in our Asia Pacific region.
The following; Europe, Middle East and Africa (“EMEA”); and Caribbean and Latin America (“CALA”). Our CALA operating segments dosegment does not meet the applicable accounting criteria for separate disclosure as a reportable business segments: Caribbean and Latin America, Europe, and Middle East and Africa.segment. We present these operating segments together as “Other International”revised the prior period amounts shown in the tables below.below to conform to our current presentation.
We evaluate the performance of our operating segments using “segment profits” which is based largely on the results of the segment without allocating corporate expenses, income taxes, indirect general, administrative, and other expenses, or merger-related costs and recoveries/charges. We assign gains and losses, equity in earnings or losses from our joint ventures, and direct general, administrative, and other expenses to each of our segments. “Unallocated corporate” represents“Unallocated corporate and other” includes a portion of our revenues, including license fees we receive from our credit card programs, and fees from vacation ownership licensing agreements, revenues and expenses for our Loyalty Program, general, administrative, and other expenses, merger-related costs and recoveries/charges, equity in earnings or losses, and other gains or losses that we do not allocate to our segments.segments as well as results of our CALA operating segment.
Our President and Chief Executive Officer, who is our chief operating decision maker, monitors assets for the consolidated company but does not use assets by operating segment when assessing performance or making operating segment resource allocations.
Segment Revenues
The following tables present our revenues disaggregated by segment and major revenue stream for the three months ended March 31, 2020 first quarter and 2019 and March 31, 2018:first quarter:
| | | | Three Months Ended March 31, 2019 | Three Months Ended March 31, 2020 |
| ($ in millions) | North American Full-Service | | North American Limited-Service | | Asia Pacific | | Other International | | Total | North America | | Asia Pacific | | EMEA | | Total |
| Gross fee revenues | $ | 316 |
| | $ | 212 |
| | $ | 118 |
| | $ | 129 |
| | $ | 775 |
| $ | 406 |
| | $ | 32 |
| | $ | 46 |
| | $ | 484 |
|
| Contract investment amortization | (8 | ) | | (3 | ) | | — |
| | (3 | ) | | (14 | ) | (19 | ) | | (1 | ) | | (4 | ) | | (24 | ) |
| Net fee revenues | 308 |
| | 209 |
| | 118 |
| | 126 |
| | 761 |
| 387 |
| | 31 |
| | 42 |
| | 460 |
|
| Owned, leased, and other revenue | 147 |
| | 31 |
| | 41 |
| | 144 |
| | 363 |
| 102 |
| | 31 |
| | 91 |
| | 224 |
|
| Cost reimbursement revenue | 2,850 |
| | 529 |
| | 111 |
| | 259 |
| | 3,749 |
| 3,331 |
| | 107 |
| | 211 |
| | 3,649 |
|
| Total segment revenue | $ | 3,305 |
| | $ | 769 |
| | $ | 270 |
| | $ | 529 |
| | $ | 4,873 |
| |
| Unallocated corporate | | | | | | | | | 139 |
| |
| Total reportable segment revenue | | $ | 3,820 |
| | $ | 169 |
| | $ | 344 |
| | $ | 4,333 |
|
| Unallocated corporate and other | | | | | | | | 348 |
|
| Total revenue | | | | | | | | | $ | 5,012 |
| | | | | | | $ | 4,681 |
|
| | | | Three Months Ended March 31, 2018 | Three Months Ended March 31, 2019 |
| ($ in millions) | North American Full-Service | | North American Limited-Service | | Asia Pacific | | Other International | | Total | North America | | Asia Pacific | | EMEA | | Total |
| Gross fee revenues | $ | 299 |
| | $ | 196 |
| | $ | 117 |
| | $ | 122 |
| | $ | 734 |
| $ | 528 |
| | $ | 118 |
| | $ | 84 |
| | $ | 730 |
|
| Contract investment amortization | (11 | ) | | (3 | ) | | — |
| | (4 | ) | | (18 | ) | (11 | ) | | — |
| | (2 | ) | | (13 | ) |
| Net fee revenues | 288 |
| | 193 |
| | 117 |
| | 118 |
| | 716 |
| 517 |
| | 118 |
| | 82 |
| | 717 |
|
| Owned, leased, and other revenue | 155 |
| | 33 |
| | 47 |
| | 158 |
| | 393 |
| 178 |
| | 41 |
| | 122 |
| | 341 |
|
| Cost reimbursement revenue | 2,856 |
| | 514 |
| | 111 |
| | 251 |
| | 3,732 |
| 3,379 |
| | 111 |
| | 214 |
| | 3,704 |
|
| Total segment revenue | $ | 3,299 |
| | $ | 740 |
| | $ | 275 |
| | $ | 527 |
| | $ | 4,841 |
| |
| Unallocated corporate | | | | | | | | | 168 |
| |
| Total reportable segment revenue | | $ | 4,074 |
| | $ | 270 |
| | $ | 418 |
| | $ | 4,762 |
|
| Unallocated corporate and other | | | | | | | | 250 |
|
| Total revenue | | | | | | | | | $ | 5,009 |
| | | | | | | $ | 5,012 |
|
Segment Profits and Losses
|
| | | | | | | |
| | Three Months Ended |
| ($ in millions) | March 31, 2020 | | March 31, 2019 |
| North America | $ | 158 |
| | $ | 491 |
|
| Asia Pacific | (10 | ) | | 103 |
|
| EMEA | (37 | ) | | 57 |
|
| Unallocated corporate and other | (5 | ) | | (128 | ) |
| Interest expense, net of interest income | (87 | ) | | (91 | ) |
| Income taxes | 12 |
| | (57 | ) |
| Net Income | $ | 31 |
| | $ | 375 |
|
|
| | | | | | | |
| | Three Months Ended |
| ($ in millions) | March 31, 2019 | | March 31, 2018 |
| North American Full-Service | $ | 289 |
| | $ | 277 |
|
| North American Limited-Service | 202 |
| | 182 |
|
| Asia Pacific | 103 |
| | 112 |
|
| Other International | 95 |
| | 159 |
|
| Unallocated corporate | (166 | ) | | (128 | ) |
| Interest expense, net of interest income | (91 | ) | | (70 | ) |
| Income taxes | (57 | ) | | (112 | ) |
| Net Income | $ | 375 |
| | $ | 420 |
|
Item 2.Management’s Discussion and Analysis of Financial Condition and Results of Operations
Forward-Looking StatementsCautionary Statement
All statements in this report are made as of the date this Form 10-Q is filed with the U.S. Securities and Exchange Commission (the “SEC”). We undertake no obligation to publicly update or revise these statements, whether as a result of new information, future events or otherwise. We make forward-looking statements in Management’s Discussion and Analysis of Financial Condition and Results of Operations and elsewhere in this report based on the beliefs and assumptions of our management and on information currently available to us.us through the date this Form 10-Q is filed with the SEC. Forward-looking statements include information aboutrelated to the expected effects on our possible or assumed future resultsbusiness of operations, which follow underCOVID-19, including the headings “Businessperformance of the company’s hotels; RevPAR, occupancy, booking and Overview,” “Liquiditycancellation trends; the nature and Capital Resources,”impact of contingency plans and cost and investment reductions; our liquidity expectations; other statements throughout this report that are preceded by, followed by, or that include the words “believes,” “expects,” “anticipates,” “intends,” “plans,” “estimates,” or similar expressions.expressions; and similar statements concerning anticipated future events and expectations that are not historical facts.
Any numberWe caution you that these statements are not guarantees of future performance and are subject to numerous evolving risks and uncertainties could cause actual resultsthat we may not be able to differ materially from those we express in our forward-looking statements,accurately predict or assess, including the risks and uncertainties we describe below and other factors we describe from time to time in our periodic filings with the U.S. SecuritiesSEC. Risks that could affect our results of operations, liquidity and Exchange Commission (the “SEC”). We therefore caution you not to rely unduly on any forward-looking statement. The forward-looking statementscapital resources, and other aspects of our business discussed in this report speak only asForm 10-Q include the duration and scope of COVID-19, including whether and to what extent a resurgence of the datevirus could occur after the pandemic initially subsides; its short and longer-term impact on the demand for travel, transient and group business, and levels of this report,consumer confidence; actions governments, businesses and individuals take in response to the pandemic, including limiting or banning travel and/or in-person gatherings; the impact of the pandemic and actions taken in response to the pandemic on global and regional economies, travel, and economic activity, including the duration and magnitude of its impact on unemployment rates and consumer discretionary spending; the ability of our owners and franchisees to successfully navigate the impacts of COVID-19; the pace of recovery when the pandemic subsides; general economic uncertainty in key global markets and a worsening of global economic conditions or low levels of economic growth; the effects of steps we undertake no obligationand our property owners and franchisees take to update reduce operating costs and/or revise any forward-looking statement, whether dueenhance certain health and cleanliness protocols at our hotels; competitive conditions in the lodging industry; relationships with clients and property owners; the availability of capital to new information, future developments, or otherwise.
finance hotel growth and refurbishment; the extent to which we experience adverse effects from data security incidents; and changes in tax laws in countries in which we earn significant income. In addition, see the “Item 1A. Risk Factors” caption in the “Part II-OTHER INFORMATION” section of this report.
COVID-19, and the volatile regional and global economic conditions stemming from it, and additional or unforeseen effects from the COVID-19 pandemic, could also give rise to or aggravate the other risk factors that we identify under the “Item 1A. Risk Factors” caption in the “Part II-OTHER INFORMATION” section of this report, which in turn could materially adversely affect our business, financial condition, liquidity, results of operations (including revenues and profitability) and/or stock price. Further, COVID-19 may also affect our operating and financial results in a manner that is not presently known to us or that we currently do not consider to present significant risks to our operations.
BUSINESS AND OVERVIEW
We are a worldwide operator, franchisor, and licensor of hotel, residential, and timeshare properties in 131 countries and territories under 30 brands at the end of the 20192020 first quarter. Under our asset-light business model, we typically manage or franchise hotels, rather than own them. We discuss our operations in the following reportable business segments: North American Full-Service, North American Limited-Service, and America; Asia Pacific. Our ; and Europe, Middle East and Africa and (“EMEA”). Our Caribbean and Latin America (“CALA”) operating segments dosegment does not individually meet the criteria for separate disclosure as a reportable segments.
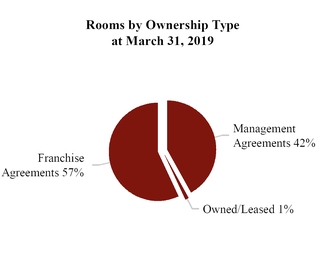
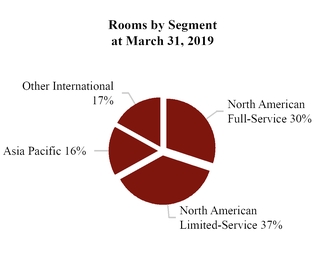
We earn base management fees and in many cases incentive management fees from the properties that we manage, and we earn franchise fees on the properties that others operate under franchise agreements with us. In most markets, base management and franchise fees typically consist of a percentage of property-level revenue, or
certain property-level revenue in the case of franchise fees, while incentive management fees typically consist of a percentage of net house profit after a specified owner return. InFor our hotels in the Middle East and Africa and in the Asia Pacific regions,region, incentive management fees typically consist of a percentage of gross operating profit without adjustment for a specified owner return. Net house profit is calculated as gross operating profit (also referred to as “house profit,” which we discuss under the “Performance Measures” section below)profit”) less non-controllable expenses such as property insurance, real estate taxes, and capital spending reserves.
Our emphasis on long-term management contracts and franchising tends to provide more stable earnings in periods of economic softness, while adding new hotels to our system generates growth, typically with little or no investment by the Company. This strategy has driven substantial growth while minimizing financial leverage and risk in a cyclical industry. In addition, we believe minimizing our capital investments and adopting a strategy of recycling our investments maximizes and maintains our financial flexibility.
We remain focused on doing the things that we do well; that is, selling rooms, taking care of our guests, and making sure we control costs both at company-operated properties and at the corporate level (“above-property”). We provide our guests new and memorable experiences through our portfolio of brands, innovative technology, personalized guest recognition, and access to travel experiences through our Marriott Bonvoy Moments program. Our brands remain strong due to our skilled management teams, dedicated associates, superior guest service with an emphasis on guest and associate satisfaction, significant distribution, Loyalty Program, multichannel reservation systems, and desirable property amenities. We strive to effectively leverage our size and broad distribution. We believe that Marriott Bonvoy™ (our “Loyalty Program”) generates substantial repeat business that might otherwise go to competing hotels, and we strategically market to its large and growing member base to generate revenue.
We, along with owners and franchisees, continue to invest in our brands by means of new, refreshed, and reinvented properties, new room and public space designs, and enhanced amenities, technology offerings, and guest experiences. We address, through various means, hotels in our system that do not meet our standards. We continue to enhance the appeal of our proprietary, information-rich, and easy-to-use websites, and of our associated mobile smartphone applications, through functionality and service improvements.
Our profitability, as well as that of owners and franchisees, has benefited from our approach to property-level and above-property productivity. Managed properties in our system continue to maintain tight cost controls. We also control above-property costs, some of which we allocate to hotels, by remaining focused on systems, processing, and support areas.
Starwood Data Security Incident
On November 30, 2018, we announced a data security incident involving unauthorized access to the Starwood reservations database (the “Data Security Incident”). We have completed the planned phase out of the operation of theThe Starwood reservations database effective asis no longer used for business operations.
In July 2019, the ICO issued a formal notice of intent under the endU.K. Data Protection Act 2018 proposing a fine in the amount of 2018.
To date, we have not seen a meaningful impact on demand as a result of£99 million against the Company in relation to the Data Security Incident.Incident (the “Proposed ICO Fine”). We mutually agreed with the ICO to an extension of the regulatory process until September 30, 2020 and the ICO proceeding is ongoing. Our accrual for this loss contingency, which we present in the “Accrued expenses and other” caption of our Balance Sheets, of $65 million at December 31, 2019, remained unchanged at March 31, 2020. See Note 6 for additional information.
We are currently unable to estimate the range of total possible financial impact to the Company from the Data Security Incident.Incident in excess of the expenses already incurred. However, we do not believe this incident will impact our long-term financial health. Although we maintainour insurance program includes coverage designed to limit our exposure to losses such as those related to the Data Security Incident, that insurance may not be sufficient or available to cover all of our expenses or other losses (including fines)fines and penalties) related to the Data Security Incident. We expect thatAs we expected, the cost of such insurance willincreased for our current policy period, and the cost of such insurance could continue to increase significantly.for future policy periods. We expect to incur significant expenses associated with the Data Security Incident in future periods, primarily related to legal proceedings and regulatory investigations (including fines)possible fines and penalties), increased expenses and capital investments for ITinformation technology and information security customer care,and data privacy, and increased expenses for insurance, compliance activities and to meet increased legal and regulatory requirements. See Footnote 6. Commitments and ContingenciesNote 6 for information related to expenses incurred in the 2020 first quarter and 2019 first quarter, insurance recoveries, and legal proceedings and governmental investigations related to the Data Security Incident.
Acquisition of Starwood Hotels & Resorts Worldwide
On September 23, 2016 (the “Merger Date”), we completed the acquisition of Starwood Hotels & Resorts Worldwide, LLC, formerly known as Starwood Hotels & Resorts Worldwide, Inc. (“Starwood”), through a series of
transactions (the “Starwood Combination”), after which Starwood became an indirect wholly-owned subsidiary of the Company.
PerformanceMeasures
We believe Revenue per Available Room (“RevPAR”), which we calculate by dividing room sales for comparable properties by room nights available for the period, is a meaningful indicator of our performance because it measures the period-over-period change in room revenues for comparable properties. RevPAR may not be comparable to similarly titled measures, such as revenues, and should not be viewed as necessarily correlating with our fee revenue. We also believe occupancy and average daily rate (“ADR”), which are components of calculating RevPAR, are meaningful indicators of our performance. Occupancy, which we calculate by dividing occupied rooms by total rooms available (including rooms in hotels temporarily closed due to issues related to COVID-19), measures the utilization of a property’s available capacity. ADR, which we calculate by dividing property room revenue by total rooms sold, measures average room price and is useful in assessing pricing levels. Comparisons to the prior year period are on a constant U.S. dollar basis. We calculate constant dollar statistics by applying exchange rates for the current period to the prior comparable period.
We define our comparable properties as our properties that were open and operating under one of our brands since the beginning of the last full calendar year (since January 1, 20182019 for the current period) and have not, in either the current or previous year: (i) undergone significant room or public space renovations or expansions, (ii) been converted between company-operated and franchised, or (iii) sustained substantial property damage or business interruption.interruption, with the exception of properties closed or otherwise experiencing interruptions related to COVID-19, which we continue to classify as comparable.
We also believe company-operated house profit margin, which is
Impact of COVID-19
COVID-19 had a significant impact on the ratio of property-level gross operating profit to total property-level revenue, is a meaningful indicatortravel industry and on our business, as reflected in the discussion of our performance because this ratio measures our overall ability asresults of operations below, which has continued into the operator to produce property-level profits by generating sales and controlling the operating expenses over which we have the most direct control. House profit includes room, food and beverage, and other revenue and the related expenses including payroll and benefits expenses, as well as repairs and maintenance, utility, general and administrative, and sales and marketing expenses. House profit does not include the impact of management fees, furniture, fixtures and equipment replacement reserves, insurance, taxes, or other fixed expenses.
Business Trends
2020 second quarter. Our 20192020 first quarter results reflectedgot off to a year-over-year increase in the number of properties in our system, favorable demand for our brands in many markets around the world, and generally favorable economic conditions.solid start. For the threefirst two months ended March 31, 2019, comparable worldwide systemwide RevPAR increased 1.1 percent to $110.16, ADR increased 1.5 percent on a constant dollar basis to $160.24, and occupancy decreased 0.3 percentage points to 68.7 percent,of the year compared to the same period ain the prior year, ago.
comparable systemwide constant dollar RevPAR grew 3.2 percent worldwide, excluding the Asia Pacific region where COVID-19 was already impacting results. As the pandemic accelerated around the world, worldwidecomparable systemwide constant dollar RevPAR fell sharply. In March 2020, worldwide comparable systemwide constant dollar RevPAR decreased approximately 60 percent compared to the prior year period, reflecting declines of 57 percent in North America, RevPAR increased74 percent in Asia Pacific (with declines of 83 percent in Greater China and 68 percent in the 2019rest of the region), 66 percent in EMEA (with declines of 71 percent in Europe and 56 percent in MEA), and 57 percent in CALA. As of May 8, 2020, approximately 25 percent of our worldwide hotels were temporarily closed.
As a result, our fee revenue and revenue from owned and leased properties declined during the 2020 first quarter, driven by higher group demand, partiallyand we expect greater declines for the 2020 second quarter. We did not recognize incentive management fees in the 2020 first quarter because there is significant uncertainty as to whether we will be entitled to such fees on a full year basis due to the shiftimpact of COVID-19 on future hotel performance.
Greater China, where COVID-19 first started to have an impact in Easter timing.late January, experienced improving RevPAR growth was partially constrained by new lodging supplytrends through March and into April, with occupancy rising from less than 10 percent in certain markets, the partial shutdownmid-February to roughly 25 percent in April, as quarantine measures and travel restrictions eased and workers returned to their jobs. The number of the U.S. federal government in January 2019, and hurricane recovery demand in 2018. In our Asia Pacific segment in the 2019 first quarter, RevPAR growth was driven by India, Indonesia, Japan, and most marketsclosed hotels in Greater China but was partially constrained by lower demanddeclined from over 90 hotels in South Korea, Thailand,mid-February to four hotels on May 8, 2020.
In the rest of the world, occupancy and Hainan Island. Our Europe region experienced higher demand in the 2019 first quarter, led by the U.K. and Spain, partially constrained by lower demand in France dueRevPAR are beginning to demonstrations in Paris.In our Middle East and Africa region,stabilize at low levels. For April 2020, comparable systemwide constant dollar RevPAR declined due90 percent worldwide compared to ongoing geopoliticalthe prior year period, reflecting declines of 90 percent in North America, 93 percent in EMEA (including 98 percent in Europe), 90 percent in Asia Pacific excluding Greater China, and economic instability96 percent in CALA.
We continue to engage with our customers to navigate through this crisis. We have experienced historically high levels of cancellations for stays through the first half of this year and supply growth inlow levels of bookings, though many group customers are tentatively rebooking for later dates.
We have taken substantial measures to mitigate the Middle East, partially offset by RevPAR growth in Africa. RevPAR grew acrossnegative financial and operational impacts for our Caribbeanhotel owners and Latin America region, driven by higher ADR, but was partially constrained by lower demand in Mexico, particularly in resort markets.
For our company-operated properties,own business. Business contingency plans have been implemented around the world, and we continue to focus on enhancing property-level house profit marginsadjust these in response to the global situation. At the corporate level, our actions to date have reduced the current monthly run rate of corporate general and making productivity improvements. In the 2019 first quarter,administrative costs by approximately 30 percent compared to the 2018 first quarter, North American company-operated house profit margins at comparable properties increasedmonthly costs initially budgeted for 2020, excluding bad debt expense.
At the property level, we continue to work with owners and franchisees to lower their immediate cash outlays. The steps we have taken include deferring renovations, certain hotel initiatives and brand standard audits for hotel owners and franchisees; reducing by 3050 percent the amount of certain reimbursed expense that we charge for certain systemwide programs and services and offering a delay in payment for April and May; and supporting owners and franchisees who are working with their lenders to utilize furniture, fixtures, and equipment (FF&E) reserves to meet working capital needs.
We also remain focused on significantly lowering the reimbursed expenses we incur on behalf of our owners and franchisees to provide centralized programs and services such as the Loyalty Program, reservations, marketing and sales, which we generally collect through cost reimbursement revenue on the basis points, primarily reflectingof hotel revenue initiatives, procurement savings,or program usage. Given the significant decline in hotel-level revenues and increased productivity. International company-operated house profit margins decreasedoccupancy seen to date and anticipated to continue to an extent and for a duration we cannot reasonably predict, we have implemented plans that we estimate could reduce these centralized, system-funded reimbursed expenses by 30 basis points, primarily dueapproximately two-thirds compared to RevPAR declinesthe monthly costs initially budgeted for 2020.
As a result of additional reductions in our Middle Eastanticipated corporate and Africa region, partially offset by margin improvementssystem spending, we expect to eliminate or defer approximately 45 percent of the $700 to $800 million in our Asia Pacific segment and Caribbean and Latin America region.2020 investment spending that we had originally
forecast in February 2020. We continue to review our investment spending plans for 2020 and may identify/pursue additional reductions, particularly in funding obligations related to new unit openings that may be delayed until 2021. Finally, as previously announced, we suspended share repurchases and cash dividends.
The impact of COVID-19 on the company remains fluid, as does our corporate and property-level response, and we expect to continue to assess and may implement additional measures to adapt our operations and plans as we evaluate the implications of COVID-19 on our business. We expect the impact of COVID-19 to be material for a duration we cannot reasonably predict. The overall operational and financial impact is highly dependent on the breadth and duration of COVID-19, including the potential occurrence of additional waves of the pandemic, and could be affected by other factors we are not currently able to predict.
System Growth and Pipeline
During the 2019 first quarter, we added 114 properties (18,842 rooms) while 15 properties (2,693 rooms) exited our system, increasing our total properties to 7,003 (1,332,826 rooms). Approximately 42 percent of added rooms are located outside North America, and16 percent of the room additions are conversions from competitor brands.
Since the end of the 2018 first quarter, we added 508 properties (84,192 rooms), while 93 properties (17,518 rooms) exited our system.
At the end of the 2020 first quarter, our system had 7,420 properties (1,391,700 rooms), compared to 7,349 properties (1,380,921 rooms) at year-end 2019 and 7,003 properties (1,332,826 rooms) at the end of the 2019 first quarter. COVID-19 will likely result in significantly lower new room openings than we had budgeted for 2020.
At the end of the 2020 first quarter, we had approximately 475,000nearly 516,000 rooms in our development pipeline, which includes hotel rooms under construction, hotel rooms under signed contracts, and approximately 25,000more than 24,000 hotel rooms approved for development but not yet under signed contracts. ApproximatelyOver 230,000 rooms in our development pipeline were under construction at the end of the 2020 first quarter. Over half of the rooms in our development pipeline are outside North America.
Properties and Rooms
At March 31, 2019,2020, we operated, franchised, and licensed the following properties and rooms:
| | | | Managed | | Franchised/Licensed | | Owned/Leased | | Total | Managed | | Franchised/Licensed | | Owned/Leased | | Total |
| | Properties | | Rooms | | Properties | | Rooms | | Properties | | Rooms | | Properties | | Rooms | Properties | | Rooms | | Properties | | Rooms | | Properties | | Rooms | | Properties | | Rooms |
| North American Full-Service | 407 |
| | 183,246 |
| | 716 |
| | 205,315 |
| | 9 |
| | 5,275 |
| | 1,132 |
| | 393,836 |
| |
| North American Limited-Service | 411 |
| | 64,889 |
| | 3,536 |
| | 410,974 |
| | 20 |
| | 3,006 |
| | 3,967 |
| | 478,869 |
| |
| North America | | 819 |
| | 246,830 |
| | 4,523 |
| | 651,935 |
| | 26 |
| | 6,483 |
| | 5,368 |
| | 905,248 |
|
| Asia Pacific | 621 |
| | 181,552 |
| | 103 |
| | 27,982 |
| | 2 |
| | 410 |
| | 726 |
| | 209,944 |
| 665 |
| | 191,261 |
| | 123 |
| | 32,124 |
| | 2 |
| | 410 |
| | 790 |
| | 223,795 |
|
| Other International | 596 |
| | 129,882 |
| | 461 |
| | 89,588 |
| | 32 |
| | 8,410 |
| | 1,089 |
| | 227,880 |
| |
| EMEA | | 498 |
| | 110,321 |
| | 382 |
| | 69,294 |
| | 25 |
| | 5,738 |
| | 905 |
| | 185,353 |
|
| CALA | | 121 |
| | 23,782 |
| | 132 |
| | 27,751 |
| | 13 |
| | 3,016 |
| | 266 |
| | 54,549 |
|
| Timeshare | — |
| | — |
| | 89 |
| | 22,297 |
| | — |
| | — |
| | 89 |
| | 22,297 |
| — |
| | — |
| | 91 |
| | 22,755 |
| | — |
| | — |
| | 91 |
| | 22,755 |
|
| Total | 2,035 |
| | 559,569 |
| | 4,905 |
| | 756,156 |
| | 63 |
| | 17,101 |
| | 7,003 |
| | 1,332,826 |
| 2,103 |
|
| 572,194 |
|
| 5,251 |
|
| 803,859 |
|
| 66 |
|
| 15,647 |
|
| 7,420 |
|
| 1,391,700 |
|
Segment and BrandLodging Statistics
The following tables present RevPAR, occupancy, and ADR statistics for comparable properties. Systemwide statistics include data from our franchised properties, in addition to our company-operated properties.
|
| | | | | | | | | | | | | | | | | | | | |
| Comparable Company-Operated Properties |
| | Three Months Ended March 31, 2019 and Change vs. Three Months Ended March 31, 2018 |
| | RevPAR | | Occupancy | | Average Daily Rate |
| | 2019 | | vs. 2018 | | 2019 | | vs. 2018 | | 2019 | | vs. 2018 |
North American Luxury (1) | $ | 285.63 |
| | 1.7 | % | | 75.9 | % | | (2.2 | )% | pts. | | $ | 376.42 |
| | 4.8 | % |
North American Upper Upscale (2) | $ | 140.91 |
| | 1.1 | % | | 72.3 | % | | (0.4 | )% | pts. | | $ | 194.99 |
| | 1.7 | % |
North American Full-Service (3) | $ | 166.02 |
| | 1.3 | % | | 72.9 | % | | (0.7 | )% | pts. | | $ | 227.76 |
| | 2.3 | % |
North American Limited-Service (4) | $ | 102.02 |
| | (1.5 | )% | | 69.4 | % | | (2.1 | )% | pts. | | $ | 147.06 |
| | 1.6 | % |
North American - All (5) | $ | 145.70 |
| | 0.7 | % | | 71.8 | % | | (1.2 | )% | pts. | | $ | 203.00 |
| | 2.3 | % |
| Greater China | $ | 83.19 |
| | 2.7 | % | | 64.8 | % | | 1.6 | % | pts. | | $ | 128.45 |
| | 0.2 | % |
| Rest of Asia Pacific | $ | 130.59 |
| | 4.2 | % | | 75.9 | % | | 2.8 | % | pts. | | $ | 172.08 |
| | 0.4 | % |
| Asia Pacific | $ | 103.41 |
| | 3.5 | % | | 69.5 | % | | 2.1 | % | pts. | | $ | 148.77 |
| | 0.4 | % |
| Caribbean & Latin America | $ | 160.09 |
| | 3.2 | % | | 66.9 | % | | 0.1 | % | pts. | | $ | 239.19 |
| | 3.0 | % |
| Europe | $ | 113.76 |
| | 1.2 | % | | 64.9 | % | | (0.1 | )% | pts. | | $ | 175.28 |
| | 1.4 | % |
| Middle East & Africa | $ | 117.53 |
| | (4.1 | )% | | 70.3 | % | | 1.6 | % | pts. | | $ | 167.16 |
| | (6.3 | )% |
International - All (6) | $ | 112.69 |
| | 1.4 | % | | 68.4 | % | | 1.4 | % | pts. | | $ | 164.67 |
| | (0.6 | )% |
Worldwide (7) | $ | 129.19 |
| | 1.0 | % | | 70.1 | % | | 0.1 | % | pts. | | $ | 184.28 |
| | 0.9 | % |
|
| | | | | | | | | | | | | | | | | | | | |
| Comparable Company-Operated Properties |
| | Three Months Ended March 31, 2020 and Change vs. Three Months Ended March 31, 2019 |
| | RevPAR | | Occupancy | | Average Daily Rate |
| | 2020 | | vs. 2019 | | 2020 | | vs. 2019 | | 2020 | | vs. 2019 |
| North America | $ | 117.00 |
| | (21.8 | )% | | 56.8 | % | | (15.1 | )% | pts. | | $ | 206.15 |
| | (1.0 | )% |
| Asia Pacific | $ | 56.24 |
| | (43.3 | )% | | 38.2 | % | | (28.4 | )% | pts. | | $ | 147.12 |
| | (1.1 | )% |
| CALA | $ | 130.13 |
| | (19.2 | )% | | 54.3 | % | | (11.7 | )% | pts. | | $ | 239.59 |
| | (1.8 | )% |
| Europe | $ | 84.07 |
| | (25.0 | )% | | 48.4 | % | | (15.9 | )% | pts. | | $ | 173.56 |
| | (0.5 | )% |
| Middle East & Africa | $ | 88.71 |
| | (19.6 | )% | | 58.6 | % | | (10.5 | )% | pts. | | $ | 151.37 |
| | (5.3 | )% |
EMEA (1) | $ | 86.17 |
| | (22.6 | )% | | 53.1 | % | | (13.4 | )% | pts. | | $ | 162.43 |
| | (3.0 | )% |
International - All (2) | $ | 74.16 |
| | (32.0 | )% | | 45.4 | % | | (21.1 | )% | pts. | | $ | 163.28 |
| | (0.4 | )% |
Worldwide (3) | $ | 94.61 |
| | (26.3 | )% | | 50.8 | % | | (18.2 | )% | pts. | | $ | 186.13 |
| | 0.1 | % |
|
| | | | | | | | | | | | | | | | | | | | |
| Comparable Systemwide Properties |
| | Three Months Ended March 31, 2019 and Change vs. Three Months Ended March 31, 2018 |
| | RevPAR | | Occupancy | | Average Daily Rate |
| | 2019 | | vs. 2018 | | 2019 | | vs. 2018 | | 2019 | | vs. 2018 |
North American Luxury (1) | $ | 265.03 |
| | 2.4 | % | | 75.2 | % | | (1.7 | )% | pts. | | $ | 352.26 |
| | 4.8 | % |
North American Upper Upscale (2) | $ | 125.83 |
| | 1.7 | % | | 69.4 | % | | (0.5 | )% | pts. | | $ | 181.24 |
| | 2.3 | % |
North American Full-Service (3) | $ | 139.49 |
| | 1.8 | % | | 70.0 | % | | (0.6 | )% | pts. | | $ | 199.27 |
| | 2.6 | % |
North American Limited-Service (4) | $ | 90.87 |
| | (0.3 | )% | | 68.9 | % | | (1.0 | )% | pts. | | $ | 131.87 |
| | 1.1 | % |
North American - All (5) | $ | 111.69 |
| | 0.8 | % | | 69.4 | % | | (0.8 | )% | pts. | | $ | 161.00 |
| | 2.0 | % |
| Greater China | $ | 82.43 |
| | 2.9 | % | | 64.3 | % | | 1.8 | % | pts. | | $ | 128.17 |
| | — | % |
| Rest of Asia Pacific | $ | 126.88 |
| | 3.6 | % | | 74.6 | % | | 2.0 | % | pts. | | $ | 170.09 |
| | 0.8 | % |
| Asia Pacific | $ | 104.12 |
| | 3.3 | % | | 69.3 | % | | 1.9 | % | pts. | | $ | 150.18 |
| | 0.5 | % |
| Caribbean & Latin America | $ | 122.49 |
| | 3.6 | % | | 65.2 | % | | (0.1 | )% | pts. | | $ | 187.89 |
| | 3.8 | % |
| Europe | $ | 100.24 |
| | 2.2 | % | | 63.5 | % | | 0.2 | % | pts. | | $ | 157.73 |
| | 1.9 | % |
| Middle East & Africa | $ | 111.78 |
| | (3.7 | )% | | 69.4 | % | | 1.6 | % | pts. | | $ | 160.99 |
| | (5.9 | )% |
International - All (6) | $ | 106.24 |
| | 1.9 | % | | 67.1 | % | | 1.1 | % | pts. | | $ | 158.23 |
| | 0.2 | % |
Worldwide (7) | $ | 110.16 |
| | 1.1 | % | | 68.7 | % | | (0.3 | )% | pts. | | $ | 160.24 |
| | 1.5 | % |
|
| | | | | | | | | | | | | | | | | | | | |
| Comparable Systemwide Properties |
| | Three Months Ended March 31, 2020 and Change vs. Three Months Ended March 31, 2019 |
| | RevPAR | | Occupancy | | Average Daily Rate |
| | 2020 | | vs. 2019 | | 2020 | | vs. 2019 | | 2020 | | vs. 2019 |
| North America | $ | 89.64 |
| | (19.5 | )% | | 56.7 | % | | (12.4 | )% | pts. | | $ | 158.14 |
| | (1.8 | )% |
| Asia Pacific | $ | 58.62 |
| | (41.5 | )% | | 39.5 | % | | (27.5 | )% | pts. | | $ | 148.44 |
| | (0.8 | )% |
| CALA | $ | 100.18 |
| | (19.8 | )% | | 52.2 | % | | (12.2 | )% | pts. | | $ | 191.80 |
| | (1.0 | )% |
| Europe | $ | 73.76 |
| | (24.6 | )% | | 47.5 | % | | (15.3 | )% | pts. | | $ | 155.19 |
| | (0.4 | )% |
| Middle East & Africa | $ | 84.72 |
| | (19.6 | )% | | 58.3 | % | | (10.3 | )% | pts. | | $ | 145.32 |
| | (5.4 | )% |
EMEA (1) | $ | 77.38 |
| | (22.9 | )% | | 51.1 | % | | (13.6 | )% | pts. | | $ | 151.47 |
| | (2.3 | )% |
International - All (2) | $ | 71.80 |
| | (30.4 | )% | | 46.1 | % | | (19.6 | )% | pts. | | $ | 155.77 |
| | (0.9 | )% |
Worldwide (3) | $ | 84.51 |
| | (22.5 | )% | | 53.6 | % | | (14.5 | )% | pts. | | $ | 157.55 |
| | (1.5 | )% |
| |
(1) | Includes JW Marriott, The Ritz-Carlton, W Hotels, The Luxury Collection, St. Regis,Europe and EDITIONMiddle East & Africa. |
| |
(2) | Includes Marriott HotelsAsia Pacific,Sheraton, Westin, Renaissance, Autograph Collection, Delta Hotels, Gaylord Hotels,CALA, and Le Méridien. Systemwide also includes Tribute Portfolio.EMEA. |
| |
(3) | Includes North American Luxury and North American Upper Upscale. |
| |
(4)
| Includes Courtyard, Residence Inn, Fairfield by Marriott, SpringHill Suites, TownePlace Suites, Four Points, Aloft, Element, and AC Hotels by Marriott. Systemwide also includes Moxy.
|
| |
(5)
| Includes North American Full-Service and North American Limited-Service.
|
| |
(6)
| Includes Asia Pacific, Caribbean & Latin America Europe, and Middle East & Africa.
|
| |
(7)
| Includes North American - All and International - All.
|
CONSOLIDATED RESULTS
The followingOur results declined in the 2020 first quarter compared to the 2019 first quarter primarily due to the impact of COVID-19. See the “Impact of COVID-19” section above for more information about the impact to our business during the 2020 first quarter and to date, and the discussion presents anbelow for additional analysis of our consolidated results of operations for the 20192020 first quarter compared to the 20182019 first quarter.
| | | | Three Months Ended | Three Months Ended |
| ($ in millions) | March 31, 2019 | | March 31, 2018 | | Change 2019 vs. 2018 | March 31, 2020 | | March 31, 2019 | | Change 2020 vs. 2019 |
| Base management fees | $ | 282 |
| | $ | 273 |
| | $ | 9 |
| | 3 | % | $ | 214 |
| | $ | 282 |
| | $ | (68 | ) | | (24 | )% |
| Franchise fees | 450 |
| | 417 |
| | 33 |
| | 8 | % | 415 |
| | 450 |
| | (35 | ) | | (8 | )% |
| Incentive management fees | 163 |
| | 155 |
| | 8 |
| | 5 | % | — |
| | 163 |
| | (163 | ) | | (100 | )% |
| Gross fee revenues | 895 |
| | 845 |
| | 50 |
| | 6 | % | 629 |
| | 895 |
| | (266 | ) | | (30 | )% |
| Contract investment amortization | (14 | ) | | (18 | ) | | (4 | ) | | (22 | )% | (25 | ) | | (14 | ) | | 11 |
| | 79 | % |
| Net fee revenues | $ | 881 |
| | $ | 827 |
| | $ | 54 |
| | 7 | % | $ | 604 |
| | $ | 881 |
| | $ | (277 | ) | | (31 | )% |
First Quarter
The $9 million increasedecrease in base management fees primarily reflected $7 million from unit growth.
The $33 million increase inand franchise fees primarily reflected $19lower RevPAR due to a decrease in demand resulting from COVID-19.The decrease in franchise fees was partially offset by $15 million from unit growth, $4 million of higher branding fees, and $4 million from AC Hotels by Marriott properties whose fees were previously presented in the “Equity in earnings” caption of our Income Statements.growth.
The $8 million increase inWe did not recognize incentive management fees primarily reflected higher profits at North American Full-Service managed hotels.in the 2020 first quarter because there is significant uncertainty as to whether we will be entitled to such fees on a full year basis due to the impact of COVID-19 on future hotel performance.
| | | | Three Months Ended | Three Months Ended |
| ($ in millions) | March 31, 2019 | | March 31, 2018 | | Change 2019 vs. 2018 | March 31, 2020 | | March 31, 2019 | | Change 2020 vs. 2019 |
| Owned, leased, and other revenue | $ | 375 |
| | $ | 406 |
| | $ | (31 | ) | | (8 | )% | $ | 280 |
| | $ | 375 |
| | $ | (95 | ) | | (25 | )% |
| Owned, leased, and other - direct expenses | 325 |
| | 336 |
| | (11 | ) | | (3 | )% | 272 |
| | 325 |
| | (53 | ) | | (16 | )% |
| | $ | 50 |
| | $ | 70 |
| | $ | (20 | ) | | (29 | )% | $ | 8 |
| | $ | 50 |
| | $ | (42 | ) | | (84 | )% |
First Quarter
Owned, leased, and other revenue, net of direct expenses decreased by $20 million, primarily due to $21 million of lower termination fees and $6 million of lowerdemand at our owned and leased profits attributable to properties under renovation, partially offset by $9 million of profits attributable to the Sheraton Grand Phoenix, which we purchased in June 2018.hotels resulting from COVID-19.
| | | | Three Months Ended | Three Months Ended | |
| ($ in millions) | March 31, 2019 | | March 31, 2018 | | Change 2019 vs. 2018 | March 31, 2020 | | March 31, 2019 | | Change 2020 vs. 2019 | |
| Cost reimbursement revenue | $ | 3,756 |
| | $ | 3,776 |
| | $ | (20 | ) | | (1 | )% | $ | 3,797 |
| | $ | 3,756 |
| | $ | 41 |
| | 1 | % | |
| Reimbursed expenses | 3,892 |
| | 3,808 |
| | 84 |
| | 2 | % | 3,877 |
| | 3,892 |
| | (15 | ) | | — | % | |
| | $ | (136 | ) | | $ | (32 | ) | | $ | (104 | ) | | 325 | % | $ | (80 | ) | | $ | (136 | ) | | $ | 56 |
| | (41 | )% | |
Cost reimbursement revenue, net of reimbursed expenses, varies due to temporary timing differences between the costs we incur for centralized programs and services and the related reimbursementsreimbursements we receive from hotel owners and franchisees. Over the long term, our centralized programs and services are not designed to impact our economics, either positively or negatively.
First Quarter
Cost reimbursement revenue,The lower deficit in cost reimbursements (reimbursed expenses, net of reimbursedcost reimbursement revenue) primarily reflects the performance of the Loyalty Program, which had lower program expenses decreased by $104 million,and redemptions.
|
| | | | | | | | | | | | | | |
| | Three Months Ended |
| ($ in millions) | March 31, 2020 | | March 31, 2019 | | Change 2020 vs. 2019 |
| Depreciation, amortization, and other | $ | 150 |
| | $ | 54 |
| | $ | 96 |
| | 178 | % |
| General, administrative, and other | 270 |
| | 222 |
| | 48 |
| | 22 | % |
| Merger-related costs and (recoveries) charges | (2 | ) | | 9 |
| | (11 | ) | | (122 | )% |
First Quarter
Depreciation, amortization, and other expenses increased primarily due to lower Loyalty Program revenues net of expenses.
|
| | | | | | | | | | | | | | |
| | Three Months Ended |
| ($ in millions) | March 31, 2019 | | March 31, 2018 | | Change 2019 vs. 2018 |
| Depreciation, amortization, and other | $ | 54 |
| | $ | 54 |
| | $ | — |
| | — | % |
| General, administrative, and other | 222 |
| | 247 |
| | (25 | ) | | (10 | )% |
| Merger-related costs and charges | 9 |
| | 34 |
| | (25 | ) | | (74 | )% |
First Quarteroperating lease impairment charges, which we discuss in Note 7.
General, administrative, and other expenses decreased by $25 million,increased primarily due to $35a $58 million expensedincrease in 2018our allowance for the company-funded supplemental retirement savings plan contributionscredit losses and $7 million of lower foreign exchange losses, partially offset by $5$18 million of higher administrative costs and $5 million of higher bad debt expenses.
Merger-related costs and charges decreased by $25 million, primarily due to lower integration costs.
Non-Operating Income (Expense) |
| | | | | | | | | | | | | | |
| | Three Months Ended |
| ($ in millions) | March 31, 2019 | | March 31, 2018 | | Change 2019 vs. 2018 |
| Gains and other income, net | $ | 5 |
| | $ | 59 |
| | $ | (54 | ) | | (92 | )% |
| Interest expense | (97 | ) | | (75 | ) | | 22 |
| | 29 | % |
| Interest income | 6 |
| | 5 |
| | 1 |
| | 20 | % |
| Equity in earnings | 8 |
| | 13 |
| | (5 | ) | | (38 | )% |
First Quarter
Gains and other income, net decreased by $54 million,guarantee reserves primarily due to the 2018 gains on our property sales ($53 million).
Interest expense increasednegative economic impact of COVID-19, partially offset by $22$16 million primarilyof lower administrative costs due to higher interest on Senior Note issuances, net of maturities ($15 million) and higher commercial paper interest rates ($6 million).our cost reduction measures.
Non-Operating Income (Expense) |
| | | | | | | | | | | | | | |
| | Three Months Ended |
| ($ in millions) | March 31, 2020 | | March 31, 2019 | | Change 2020 vs. 2019 |
| (Losses) gains and other income, net | $ | (4 | ) | | $ | 5 |
| | $ | (9 | ) | | (180 | )% |
| Interest expense | (93 | ) | | (97 | ) | | (4 | ) | | (4 | )% |
| Interest income | 6 |
| | 6 |
| | — |
| | — | % |
| Equity in (losses) earnings | (4 | ) | | 8 |
| | (12 | ) | | (150 | )% |
Income Taxes
| | | | Three Months Ended | Three Months Ended |
| ($ in millions) | March 31, 2019 | | March 31, 2018 | | Change 2019 vs. 2018 | March 31, 2020 | | March 31, 2019 | | Change 2020 vs. 2019 |
| Provision for income taxes | $ | (57 | ) | | $ | (112 | ) | | $ | (55 | ) | | (49 | )% | |
| Benefit (provision) for income taxes | | $ | 12 |
| | $ | (57 | ) | | $ | (69 | ) | | (121 | )% |
First Quarter
Provision for income taxes decreased by $55 million, primarily due to the prior year tax expense incurred for uncertain tax positions relating to legacy-Starwood operations ($30 million), the prior year state income tax expense due to a change in our position regarding the future remittance of accumulated earnings of non-U.S. subsidiaries ($27 million), prior year tax expense on dispositions ($14 million), lower operating income ($967 million), and increased earnings in jurisdictions with lowerthe current year tax ratesbenefit from the operating lease impairment charges ($723 million). The decrease was partially offset by higher tax expense resulting from finalizing prior years’ returns ($8 million) and lower tax deductions for share-based payments ($7 million).
BUSINESS SEGMENTS
Our segment results declined in the prior year release of tax reserves2020 first quarter compared to the 2019 first quarter primarily due to the completionimpact of certain examinations ($34 million).
BUSINESS SEGMENTS
The followingCOVID-19. See the “Impact of COVID-19” section above for more information about the impact to our business during the 2020 first quarter and to date and the discussion presents anbelow for additional analysis of the operating results of our reportable business segments: segments.
|
| | | | | | | | | | | | | | |
| | Three Months Ended |
| ($ in millions) | March 31, 2020 | | March 31, 2019 | | Change 2020 vs. 2019 |
| North America | | | | | | | |
| Segment revenues | $ | 3,820 |
| | $ | 4,074 |
| | $ | (254 | ) | | (6 | )% |
| Segment profits | 158 |
| | 491 |
| | (333 | ) | | (68 | )% |
| Asia Pacific | | | | | | | |
| Segment revenues | 169 |
| | 270 |
| | (101 | ) | | (37 | )% |
| Segment (losses) profits | (10 | ) | | 103 |
| | (113 | ) | | (110 | )% |
| EMEA | | | | | | | |
| Segment revenues | 344 |
| | 418 |
| | (74 | ) | | (18 | )% |
| Segment (losses) profits | (37 | ) | | 57 |
| | (94 | ) | | (165 | )% |
North American Full-Service, North American Limited-Service, and Asia Pacific, for the 2019 first quarter compared to the 2018 first quarter. See Footnote 12. Business Segments for other information about each segment, including revenues and a reconciliation ofAmerica segment profits to net income.
North American Full-Service
Since the end of the 2018 first quarter, across our North American Full-Service segment, we added 42 properties (10,610 rooms), and 16 properties (5,357 rooms) left our system. |
| | | | | | | | | | | | | | |
| | Three Months Ended |
| ($ in millions) | March 31, 2019 | | March 31, 2018 | | Change 2019 vs. 2018 |
| Segment revenues | $ | 3,305 |
| | $ | 3,299 |
| | $ | 6 |
| | — | % |
| Segment profits | $ | 289 |
| | $ | 277 |
| | $ | 12 |
| | 4 | % |
First Quarter
North American Full-Service segment profits increased by $12 million,decreased primarily due to the following:
$11$122 million of higher base managementlower gross fee revenues (primarily reflecting lower RevPAR and franchise fees, primarily reflecting $7net house profits, partially offset by $15 million from unit growth and $5 million from RevPAR growth;
$6 million of higher incentive management fees, primarily driven by higher profits at managed hotels;
$6growth), $29 million of lower owned, leased, and other revenue, net of direct expenses, primarily reflecting $16 million of lower termination fees, partially offset by $9 million of profits attributable to the Sheraton Grand Phoenix, which we purchased in June 2018; and
$3$92 million of higher cost reimbursement revenue, net of reimbursed expenses.
North American Limited-Service
Since the end of the 2018 first quarter, across our North American Limited-Service segment, we added 287 properties (34,908 rooms)depreciation, amortization, and other expenses (primarily reflecting operating lease impairment charges), and 41 properties (3,580 rooms) left our system. |
| | | | | | | | | | | | | | |
| | Three Months Ended |
| ($ in millions) | March 31, 2019 | | March 31, 2018 | | Change 2019 vs. 2018 |
| Segment revenues | $ | 769 |
| | $ | 740 |
| | $ | 29 |
| | 4 | % |
| Segment profits | $ | 202 |
| | $ | 182 |
| | $ | 20 |
| | 11 | % |
First Quarter
North American Limited-Service segment profits increased by $20 million, primarily due to the following:
$14 million of higher base management and franchise fees, primarily reflecting $12 million from unit growth; and
$6 million of higher cost reimbursement revenue, net of reimbursed expenses.
Asia Pacific
Since the end of the 2018 first quarter, across our Asia Pacific segment, we added 88 properties (21,177 rooms), and 11 properties (3,448 rooms) left our system.
|
| | | | | | | | | | | | | | |
| | Three Months Ended |
| ($ in millions) | March 31, 2019 | | March 31, 2018 | | Change 2019 vs. 2018 |
| Segment revenues | $ | 270 |
| | $ | 275 |
| | $ | (5 | ) | | (2 | )% |
| Segment profits | $ | 103 |
| | $ | 112 |
| | $ | (9 | ) | | (8 | )% |
First Quarter
Asia Pacific segment profits decreased by $9 million, primarily due to the following:
$4 million of lower cost reimbursement revenue, net of reimbursed expenses;
$3$52 million of higher general, administrative, and other expenses (primarily reflecting higher allowance for credit losses and reserves for guarantee funding), and $27 million of lower cost reimbursement revenue, net of reimbursed expenses. The decline in North America comparable systemwide RevPAR was driven by a 12.4 percentage point decrease in comparable systemwide occupancy due to lower demand resulting from COVID-19. At the end of the 2020 first quarter, we had 5,368 properties (905,248 rooms) in North America, representing a net increase of 269 properties (5 percent) compared to the end of the 2019 first quarter.
Asia Pacific segment results decreased primarily due to higher bad debt expenses;$86 million of lower gross fee revenues (primarily reflecting lower RevPAR and net house profits) and $12 million of lower cost reimbursement revenue, net of reimbursed expenses. The decline in Asia Pacific comparable systemwide RevPAR was driven by a 27.5 percentage point decrease in comparable systemwide occupancy due to lower demand resulting from COVID-19. At the end of the 2020 first quarter, we had 790 properties (223,795 rooms) in Asia Pacific, representing a net increase of 64 properties (9 percent) compared to the end of the 2019 first quarter.
$1EMEA segment results decreased primarily due to $38 million of lower gross fee revenues (primarily reflecting lower RevPAR and net house profits), $18 million of lower owned, leased, and other revenue, net of direct expenses, $24 million of lower cost reimbursement revenue, net of reimbursed expenses, and $11 million of higher base managementgeneral, administrative, and franchise fees,other expenses (primarily reflecting higher allowance for credit losses). The decline in EMEA comparable systemwide RevPAR was driven by a comparable systemwide occupancy decrease of 13.6 percentage points and ADR decrease of 2.3 percentage points due to $5 millionlower demand resulting from RevPAR and unit growth, partially offset by $3 million fromCOVID-19. At the end of the 2020 first quarter, we had 905 properties (185,353 rooms) in EMEA, representing a net unfavorable exchange rates.increase of 60 properties (7 percent) compared to the end of the 2019 first quarter.
SHARE-BASED COMPENSATION
See Footnote 4. Share-Based CompensationNote 4 for more information.
NEW ACCOUNTING STANDARDS
See Footnote 1. Basis of PresentationNote 1 for information on our adoption of new accounting standards.
LIQUIDITY AND CAPITAL RESOURCES
Cash RequirementsOur long-term financial objectives include diversifying our financing sources, optimizing the mix and maturity of our long-term debt, and reducing our working capital. At the end of the 2020 first quarter, our long-term debt had a weighted average interest rate of 2.7 percent and a weighted average maturity of approximately 4.7 years. Including the effect of interest rate swaps, the ratio of fixed-rate long-term debt to total long-term debt was 0.5 to 1.0 at the end of the 2020 first quarter.
In response to the negative impact COVID-19 had on our cash from operations in our 2020 first quarter, which we expect to continue to be negatively impacted, we have taken, and are continuing to take, numerous actions to increase liquidity and strengthen our financial position, which include:
| |
| • | Taking actions to substantially reduce our corporate general and administrative costs, reimbursed expenses we incur on behalf of our owners and franchisees, and our investment spending, as we discuss under the “Impact of COVID-19” section above; |
Suspending share repurchases and dividends until conditions improve;
Drawing under the Credit Facility, as we discuss under the “Sources of Liquidity-Our Credit Facility” section below;
Amending the Credit Facility to, among other things, waive the quarterly-tested leverage covenant in the Credit Facility through and including the first quarter of 2021, as we discuss under the “Sources of Liquidity-Our Credit Facility” section below;
Entering into a commitment letter (the “Commitment Letter”) providing for a 364-day senior unsecured revolving credit facility in an aggregate principal amount of $1.5 billion, which we subsequently terminated, as we discuss under the “Sources of Liquidity-364-Day Credit Facility” section below;
Issuing $1.6 billion aggregate principal amount of 5.750 percent Series EE Notes due May 1, 2025, as we discuss under the “Sources of Liquidity-Series EE Notes” section below; and
| |
| • | Raising $920 million of cash by entering into amendments to the existing agreements for our U.S.-issued co-brand credit cards, which we discuss in the “Co-brand Credit Card Agreements” section below. |
We monitor the status of the capital markets and regularly evaluate the effect that changes in capital market conditions may have on our ability to fund our liquidity needs. We currently believe the Credit Facility, our cash on hand, and our access to capital markets remain adequate to meet our liquidity requirements.
Sources of Liquidity
Our Credit Facility
We are party to a multicurrency revolving credit agreement (the “Credit Facility”) thatOur Credit Facility provides for up to $4$4.5 billion of aggregate effective borrowings to support our commercial paper program and general corporate needs, including working capital, capital expenditures, share repurchases, letters of credit, and acquisitions.needs. Borrowings under the Credit Facility generally bear interest at LIBOR (the London Interbank Offered Rate) plus a spread based on our public debt rating. We also pay quarterly fees on the Credit Facility at a rate based on our public debt rating. While anyWe classify outstanding borrowings under the Credit Facility and outstanding commercial paper borrowings and/or borrowings under our Credit Facility generally have short-term maturities, we classify the outstanding borrowings as long-term based on our ability and intent to refinance the outstanding borrowings on a long-term basis. The Credit Facility expires on June 10, 2021.28, 2024.
We borrowed $2.5 billion under the Credit Facility in late March and another $2.0 billion in early April 2020, resulting in the Credit Facility being fully drawn as of April 2, 2020, with a total of $4.5 billion outstanding. On May 1, 2020, we repaid $1.25 billion, reducing the total outstanding borrowings under the Credit Facility to $3.25 billion as of May 1, 2020. Our borrowings under the Credit Facility were to increase our cash position and preserve financial flexibility in light of the impact on global markets resulting from COVID-19. Remaining proceeds from the Credit Facility borrowings may be used to repay commercial paper when it matures and for general corporate or other purposes permitted by the Credit Facility.
The Credit Facility contains certain covenants, including a single financial covenant that limits our maximum leverage (consistingLeverage Ratio (as defined in the Credit Facility, and generally consisting of the ratio of Adjusted Total Debt to EBITDA, each as defined in the Credit Facility)Facility, and subject to not more than 4additional adjustments as described therein). On April 13, 2020, we entered into an amendment to 1.the Credit Facility (the “Credit Facility Amendment”) under which the covenant governing the permitted Leverage Ratio is waived through and including the first quarter of 2021 (which waiver period may end sooner at our election), and the required leverage levels for such covenant are adjusted once re-imposed at the end of the waiver period (starting at 5.50 to 1.00 when the leverage test is first re-imposed and gradually stepping down to 4.00 to 1.00 over the succeeding seven fiscal quarters, as further described in the Credit Facility). The Credit Facility defines EBITDA as net income less cost reimbursement revenue, plus reimbursed expenses, plusAmendment also imposes a monthly-tested minimum liquidity covenant for the sumduration of interest expense, income taxes, depreciation, amortization, and non-recurring non-cash charges.
the period the Leverage Ratio is waived. Our outstanding public debt does not contain a corresponding financial covenantcovenants or a requirement that we maintain certain financial ratios. We currently satisfy the applicable covenants in our Credit Facility, and public debt instruments, including the leverageliquidity covenant under the Credit Facility.
The Credit Facility and do not expectAmendment also makes certain other amendments to the covenants will restrict our ability to meet our anticipated borrowing and guarantee levels or increase those levels should we decide to do so in the future.
We believeterms of the Credit Facility, including increasing the interest and our access to capital markets, together with cashfees payable on the Credit Facility for the duration of the period during which the waiver of the leverage covenant remains in effect, tightening certain existing covenants and imposing additional covenants for the duration of the waiver period, including restricting dividends and share repurchases.
364-Day Credit Facility
On April 13, 2020, we expect to generate from operations, remain adequate to meet our short-termalso entered into the Commitment Letter providing for a 364-day senior unsecured revolving credit facility in an aggregate principal amount of $1.5 billion, the closing and long-term liquidity requirements, finance our long-term growth plans, meetfunding of which was contingent on the negotiation of definitive documentation and satisfaction of customary conditions (the “364-Day Credit Facility”). The Commitment Letter provided that the available aggregate principal amount of the 364-Day Credit Facility would generally be reduced by new debt service,issuances (including senior notes), equity issuances and fulfill other cash requirements.
We issue commercial paperasset sales, in the U.S. We do not have purchase commitments from buyers for our commercial paper; therefore, our ability to issue commercial paper iseach case subject to market demand.certain exceptions. The Series EE Notes offering described below substantially reduced the amount of commitments under the Commitment Letter, and on April 24, 2020, we elected to terminate the Commitment Letter in its entirety.
Series EE Notes
On April 16, 2020, we issued $1.6 billion aggregate principal amount of 5.750 percent Series EE Notes due May 1, 2025. We reserve unused capacity under our Credit Facilitywill pay interest on the Series EE Notes in May and November of each year, commencing in November 2020. We received net proceeds of approximately $1.581 billion from the offering of the Series EE Notes, after deducting the underwriting discount and estimated expenses, which were made available for general corporate purposes.
Commercial Paper
Due to repay outstanding commercial paper borrowings ifrecent demand constraints in the commercial paper market is not
availableand changes to us for any reason when outstanding borrowings mature. We do not expect that fluctuations in the demand for commercial paper will affect our liquidity, given our borrowing capacity under the Credit Facility.
At March 31, 2019, our available borrowing capacity amounted to $1,340 million and reflected borrowing capacity of $1,082 million under our Credit Facility and our cash balance of $258 million. We calculated that borrowing capacity by taking $4 billion of effective aggregate bank commitments under our Credit Facility and subtracting $2,918 million of outstanding commercial paper (there being no outstanding letters of credit under our Credit Facility).
We monitor the statusratings as a result of the capital markets and regularly evaluate the effect that changes in capital market conditions may haveimpact of COVID-19 on our ability to execute our announced growth plans and fund our liquidity needs. We expect to continue meeting part of our financing and liquidity needs primarily throughbusiness, we currently are not issuing commercial paper borrowings, issuances of Senior Notes, and access to long-term committed credit facilities. If conditions in the lodging industry deteriorate, or if disruptions in the capital markets take place as they did in the immediate aftermath of both the 2008 worldwide financial crisis and the events of September 11, 2001,paper. As a result, we may be unable to place some or all of our commercial paper on a temporary or extended basis and may have had to rely more on borrowings under the Credit Facility and issuance of senior notes, which we believe will be adequate to fundcarry higher interest costs than our liquidity needs, including repayment of debt obligations, but which may carry a higher cost thanoutstanding commercial paper. Since we continueWe expect to have ample flexibilitybe able to satisfy existing commercial paper maturities through our available cash resources, access to capital markets or borrowing capacity under the Credit Facility’s covenants,Facility.
Co-brand Credit Card Agreements
In May 2020, we expect that undrawn bank commitments undersigned amendments to the Credit Facilityexisting agreements for our U.S.-issued co-brand credit cards associated with our Loyalty Program. These amendments provided the Company with $920 million of cash from the prepayment of certain future revenues, the early payment of a previously committed signing bonus, and the pre-purchase of Marriott Bonvoy points and other consideration. We will remain available to us even if business conditions were to deteriorate markedly.record the cash receipts in the deferred revenue and liability for guest loyalty program captions on our Balance Sheet.
Our financial objectives include diversifying our financing sources, optimizing the mix and maturityUses of our long-term debt, and reducing our working capital. At the end of the 2019 first quarter, our long-term debt had a weighted average interest rate of 3.3 percent and a weighted average maturity of approximately 4.4 years. The ratio of fixed-rate long-term debt to total long-term debt was 0.6 to 1.0 at the end of the 2019 first quarter.Cash
Cash, cash equivalents, and restricted cash totaled $300$1,782 million at March 31, 20192020, a decreasean increase of $60$1,529 million from year-end 20182019, primarily reflecting Credit Facility borrowings ($2,500 million), net cash provided by operating activities ($514 million), and dispositions ($260 million). The following cash outflows partially offset these cash inflows: commercial paper repayments, net of borrowings ($1,183 million), dividend payments ($156 million), purchase of treasury stock ($797150 million), dividend payments ($139 million), financing outflows for employee share-based compensation withholding taxes ($95 million), and capital expenditures ($66 million). The following cash inflows partially offset these cash outflows: higher commercial paper borrowings ($665 million), long-term debt issuances, net of repayments ($23866 million), and net cash provided by operating activities ($151 million)capital expenditures ($59 million). Net cash provided by operating activities in the 2019 first quarter includesAs a net cash outflow from working capital changes of $401 million, primarily due to a net outflow for accrued payroll and benefits of $297 million, driven by the timing of paymentresult of the company’s matchadditional Credit Facility borrowings, Series EE Notes issuance, and amendments to our co-brand credit card agreements described under “Sources of prior year retirement savings plan contributions and the payment of the 2018 supplemental retirement savings plan contributions.Liquidity” above, our cash position has changed significantly since March 31, 2020.
Our ratio of current assets to current liabilities was0.50.6 to 1.0 at the end of the 20192020 first quarter. We minimize working capital through cash management, strict credit-granting policies, and aggressive collection efforts. We also have significant borrowing capacity under our Credit Facility should we need additional working capital.
Capital Expenditures
We made capital expenditures of $59 million in the 2020 first quarter and $66 million in the 2019 first quarter and $64quarter. We currently expect to eliminate or defer approximately 45 percent of the $700 to $800 million in the 2018 first quarter, an increase of $2 million.2020 investment spending that we had originally forecast in February 2020. We expectcontinue to review our investment spending on capital expendituresplans for 2020 and other investments will total approximately $600 millionmay identify/pursue additional reductions, particularly in funding obligations related to $800 million for the 2019 full year, including contract acquisition costs, equity and other investments, loan advances, and various capital expenditures (including approximately $225 million for maintenance capital spending).
Over time, we have sold hotels, both completed and under development, subject to long-term management agreements. The ability of third-party purchasers to raise the debt and equity capital necessary to acquire such properties depends in part on the perceived risks in the lodging industry and other constraints inherent in the capital markets. We monitor the status of the capital markets and regularly evaluate the potential impact of changes in capital market conditions on our business operations. In the Starwood Combination, we acquired various hotels and joint venture interests in various hotels, many of which we have sold or are seeking to sell, and in 2018, we acquired the Sheraton Grand Phoenix, which we expect to renovate and sell subject to a long-term management agreement. We also expect to continue making selective and opportunistic investments to add units to our lodging business, whichnew unit openings that may include property acquisitions, new construction, loans, guarantees, and noncontrolling equity
investments. Over time, we seek to minimize capital invested in our business through asset sales subject to long-term management or franchise agreements.be delayed until 2021.
Share Repurchases
We purchased 6.71 million shares of our common stock during the 20192020 first quarter at an average price of $124.16$145.42 per share. As of March 31, 20192020, 29.017.4 million shares remained available for repurchase under Board approved authorizations. For additional information, see “Issuer“Issuer Purchases of Equity Securities”Securities” in Part II, Item 2. We do not anticipate repurchasing additional shares until business conditions improve, and are prohibited from doing so for the duration of the waiver period under our Credit Facility, with certain exceptions.
Dividends
On February 15, 2019,14, 2020, our Board of Directors declared a quarterly cash dividend of $0.41$0.48 per share which we paid March 29, 2019 to shareholders of record on February 28, 2020, which we paid on March 1, 2019.31, 2020. We do not anticipate declaring further cash dividends until business conditions improve, and are prohibited from doing so for the duration of the waiver period under our Credit Facility.
Contractual Obligations and Off-Balance Sheet Arrangements
As of the end of the 20192020 first quarter, there have been no significant changes to our “Contractual Obligations” table, “Other Commitments” table, or “Letters of Credit” paragraph in Part II, Item 7, “Management’s Discussion and Analysis of Financial Condition and Results of Operations,” of our 20182019 Form 10-K, other than thosethe changes in debt described below.
Total debt increased $909 million to $10,256 million at March 31, 2019 from $9,347 million at December 31, 2018, reflecting the issuance of our Series BB and CC Notes and higher commercial paper borrowings, partially offset by the maturity of our Series K Notes.above.See Footnote 8. Long-Term DebtNote 8 for more information on our total debt atdebt.
At March 31, 2019.2020, future Transition Tax payments under the 2017 Tax Act totaled $447 million.
CRITICAL ACCOUNTING POLICIES AND ESTIMATES
Our preparation of financial statements in accordance with GAAP requires management to make estimates and assumptions that affect reported amounts and related disclosures. We have discussed those policies and estimates
that we believe are critical and require the use of complex judgment in their application in our 20182019 Form 10-K. Since the date of our 20182019 Form 10-K, we have made no material changes to our critical accounting policies or the methodologies or assumptions that we apply under them.
Item 3.Quantitative and Qualitative Disclosures About Market Risk
OurThe following table presents the scheduled maturities and the total fair value as of March 31, 2020 for our financial instruments that are impacted by market risks:
|
| | | | | | | | | | | | | | | | | | | | | | | | | | | | | | | |
| | Maturities by Period | | | | |
| ($ in millions) | 2020 | | 2021 | | 2022 | | 2023 | | 2024 | | There- after | | Total Carrying Amount | | Total Fair Value |
Assets - Maturities represent expected principal receipts, fair values represent assets. |
| Fixed-rate notes receivable | $ | 2 |
| | $ | 4 |
| | $ | 2 |
| | $ | 2 |
| | $ | 2 |
| | $ | 29 |
| | $ | 41 |
| | $ | 41 |
|
| Average interest rate | | | | | | | | | | | | | 0.90 | % | | |
| Floating-rate notes receivable | $ | 1 |
| | $ | 28 |
| | $ | 52 |
| | $ | 1 |
| | $ | 7 |
| | $ | 20 |
| | $ | 109 |
| | $ | 103 |
|
| Average interest rate | | | | | | | | | | | | | 4.62 | % | | |
Liabilities - Maturities represent expected principal payments, fair values represent liabilities. |
| Fixed-rate debt | $ | (357 | ) | | $ | (859 | ) | | $ | (1,108 | ) | | $ | (687 | ) | | $ | (14 | ) | | $ | (2,542 | ) | | $ | (5,567 | ) | | $ | (5,243 | ) |
| Average interest rate | | | | | | | | | | | | | 3.97 | % | | |
| Floating-rate debt | $ | (549 | ) | | $ | (299 | ) | | $ | (561 | ) | | $ | — |
| | $ | (5,101 | ) | | $ | — |
| | $ | (6,510 | ) | | $ | (6,397 | ) |
| Average interest rate | | | | | | | | | | | | | 1.91 | % | | |
See Item 7A. Quantitative and Qualitative Disclosures About Market Risk in our 2019 Form 10-K for more information on our exposure to market risk has not materially changed since December 31, 2018.risk.
Item 4.Controls and Procedures
Disclosure Controls and Procedures
As of the end of the period covered by this quarterly report, we evaluated, under the supervision and with the participation of our management, including our Chief Executive Officer and Chief Financial Officer, the effectiveness of our disclosure controls and procedures (as such term is defined in Rules 13a-15(e) and 15d-15(e) of the Securities Exchange Act of 1934 (the “Exchange Act”)). Management necessarily applied its judgment in assessing the costs and benefits of those controls and procedures, which by their nature, can provide only reasonable assurance about management’s control objectives. You should note that the design of any system of controls is based in part upon certain assumptions about the likelihood of future events, and we cannot assure you that any design will succeed in achieving its stated goals under all potential future conditions, regardless of how remote. Based upon this evaluation, our Chief Executive Officer and the Chief Financial Officer concluded that our disclosure controls and procedures were not effective because of the previously reported material weakness in internal control over financial reporting, which we describe in Part II, Item 9A of our 2018 2019 Form 10-K.10-K.
Remediation of Material Weakness
We continue to implement our remediation plan for the previously reported material weakness in internal control over financial reporting, described in Part II, Item 9A of our 2018 Form 10-K, which includes steps to
increase dedicated personnel, improve reporting processes, and enhance related supporting technology. We are committed to maintaining a strong internal control environment and implementing measures designed to help ensure that control deficiencies contributing to the material weakness are remediated as soon as possible. We have made progress towards remediation and continue to implement our remediation plan for the previously reported material weakness in internal control over financial reporting, described in Part II, Item 9A of our 2019 Form 10-K, which includes steps to increase dedicated personnel, improve reporting processes, design and implement new controls and enhance related supporting technology. We will consider the material weakness remediated after the applicable controls operate for a sufficient period of time, and management has concluded, through testing, that the controls are operating effectively.
Changes in Internal Control Over Financial Reporting
On January 1, 2019, we adopted ASU 2016-02. Upon adoption, we implemented changes in internal control over financial reporting related to the development of new accounting policies, lease recognition processes, review control procedures, and financial statement disclosures.
Other than the changes related to our remediation efforts and ASU 2016-02 described above, we made no changes in internal control over financial reporting during the 20192020 first quarter that materially affected, or are reasonably likely to materially affect, our internal control over financial reporting.
PART II – OTHER INFORMATION
Item 1.Legal Proceedings
See the information under the ““Starwood Data Security Incident - Litigation, Claims, and Government Investigations” caption in Footnote 6. Commitments and Contingencies,Note 6, which we incorporate here by reference.
From time to time, we are also subject to other legal proceedings and claims in the ordinary course of business, including adjustments proposed during governmental examinations of the various tax returns we file. While management presently believes that the ultimate outcome of these proceedings, individually and in aggregate, will not materially harm our financial position, cash flows, or overall trends in results of operations, legal proceedings are inherently uncertain, and unfavorable rulings could, individually or in aggregate, have a material adverse effect on our business, financial condition, or operating results.
Item 1A.Risk Factors
Risks and Uncertainties
We are subject to various risks that make an investment in our securities risky. The events and consequences discussed in these risk factors could, in circumstances we may or may not be able to accurately predict, recognize, or control, have a negativematerial adverse effect on us or onour business, growth, reputation, prospects, financial condition, operating results (including components of our financial condition. You should understand thatresults), cash flows, liquidity, and stock price. In addition, these risks could cause results to differ materially from those we express in forward-looking statements contained in this report or in other Company communications. These risk factors do not identify all risks that we face; our operations could also be affected by factors, events, or uncertainties that are not presently known to us or that we currently do not consider to present significant risks to our operations. Because there is no way to determine in advance whether, or to what extent, any present uncertainty will ultimately impact our business, you should give equal weight to each of the following:
Risks Relating to COVID-19
COVID-19 has had a material detrimental impact on our business, financial results and liquidity, and such impact could worsen and last for an unknown period of time.
The global spread of COVID-19 is complex and rapidly-evolving, with governments, public institutions and other organizations imposing or recommending, and businesses and individuals implementing, restrictions on various activities or other actions to combat its spread, such as restrictions and bans on travel or transportation, limitations on the size of gatherings, closures of work facilities, schools, public buildings and businesses, cancellation of events, including sporting events, conferences and meetings, and quarantines and lock-downs. COVID-19 and its consequences have dramatically reduced travel and demand for hotel rooms, which has and will continue to impact our business, operations, and financial results. The extent to which COVID-19 impacts our business, operations, and financial results, including the duration and magnitude of such effects, will depend on numerous evolving factors that we may not be able to accurately predict or assess, including the duration and scope of COVID-19 (including whether and to what extent a resurgence of the virus could occur after the pandemic initially subsides); the negative impact it has on global and regional economies and economic activity, including the duration and magnitude of its impact on unemployment rates and consumer discretionary spending; its short and longer-term impact on the demand for travel, transient and group business, and levels of consumer confidence; the ability of our owners and franchisees to successfully navigate the impacts of COVID-19; actions governments, businesses and individuals take in response to the pandemic, including quarantines and lock-downs, and limiting or banning travel and/or in person gatherings; and how quickly economies, travel activity, and demand for lodging recovers after the pandemic subsides.
COVID-19 has subjected our business, operations and financial condition to a number of risks, including, but not limited to, those discussed below:
| |
| • | Risks Related to Revenue: COVID-19 has negatively impacted, and will in the future negatively impact to an extent we are unable to predict, our revenues from managed and franchised hotels, which are primarily based on hotels’ revenues or profits. In addition, COVID-19 and its impact on global and regional economies, and the hospitality industry in particular, has made it difficult for hotel owners and franchisees to obtain financing on attractive terms, or at all. Combined with the significant decline in revenues for most hotels, this increases the probability that owners and franchisees will be unable to fund working capital and to service, repay or refinance indebtedness. This may cause hotel owners or franchisees to declare bankruptcy or cause lenders to declare a default, accelerate the related debt, or foreclose on the property. Such bankruptcies, sales or foreclosures could, in some cases, result in the termination of our management or franchise agreements and eliminate our anticipated income and cash flows, which could negatively affect our results of operations. Hotel owners or franchisees in bankruptcy may not have sufficient assets to pay us termination fees, other unpaid fees or reimbursements we are owed under their agreements with us. Even if hotel owners or franchisees do not declare bankruptcy, they may be unable or unwilling to pay us amounts that we are entitled to on a timely basis or at all, which would adversely affect our liquidity. If a significant number of hotels exit our system as a result of COVID-19, whether as a result of an owner or franchisee bankruptcy, failure to pay amounts owed to us, a negotiated termination, or otherwise, our revenues and liquidity could be adversely affected. COVID-19 could also materially impact other non-hotel related sources of revenues for us, including for example our fees from our co-brand credit card arrangements. To the extent COVID-19 significantly impacts spending patterns of co-brand cardholders or acquisition of new co-brand cardholders, we will receive lower fees and less funding from the financial institutions party to our co-brand card arrangements. Also, we could be required to test our intangible assets or goodwill for impairments due to reduced revenues or cash flows. |
| |
| • | Risks Related to Owned and Leased Hotels: COVID-19 and its impact on travel has reduced demand at nearly all hotels, including our owned and leased hotels. As a result, most of our owned and leased properties are not generating revenue sufficient to meet operating expenses, which is adversely affecting our income and could in the future more significantly adversely affect the value of our owned and leased properties, potentially requiring us to recognize significant additional non-cash impairment charges to our results of operations. |
| |
| • | Risks Related to Operations: Because of the significant decline in the demand for hotel rooms, we have taken steps to reduce operating costs and improve efficiency, including furloughing a substantial number of our personnel and implementing reduced work weeks for other personnel. Such steps, and further changes we may make in the future to reduce costs for us or our hotel owners or franchisees, may negatively impact guest loyalty, owner preference, or our ability to attract and retain associates, and our reputation and market share may suffer as a result. For example, if our furloughed personnel do not return to work with us when COVID-19 subsides, including because they find new jobs during the furlough, we may experience operational challenges that impact guest loyalty, owner preference, and our market share, which could limit our ability to grow and expand our business and could reduce our profits. Further, reputational damage from, and the financial impact of, reduced work weeks could lead associates to depart the Company and could make it harder for us or the managers of our franchised properties to recruit new associates in the future. In addition, if we or our hotel owners or franchisees are unable to access capital to make physical improvements to our hotels, the quality of our hotels may suffer, which may negatively impact our reputation and guest loyalty, and our market share may suffer as a result. We have received demands or requests from labor unions that represent our associates and may face additional demands, whether in the course of our periodic renegotiation of our collective bargaining agreements or otherwise, for additional compensation, healthcare benefits or other terms as a result of COVID-19 that could increase costs, and we could experience labor disputes or disruptions as we continue to implement our COVID-19 mitigation plans. COVID-19 could also negatively affect our internal control over financial and other reporting, as many of our personnel are on furlough, and our remaining personnel are on reduced work weeks and largely required to work from home. Accordingly, new processes, procedures and controls could be required to respond to changes in our business environment. |
| |
| • | Risks Related to Expenses: COVID-19 may cause us to incur additional expenses. For example, depending on the length of the furloughs, we may need to make severance payments to some of our furloughed associates, even if we intend to have the associates return to work in the future. Also, if a hotel closes and has employees covered by an underfunded multi-employer pension plan, we may need to pay a withdrawal liability to the plan if we do not continue making sufficient contributions to the plan for other covered hotels, and we may be unable to collect reimbursement from the hotel owner. In addition, COVID-19 could make it more likely that we have to fund shortfalls in operating profit under our agreements with some hotel owners beyond the additional guarantee reserves that we recorded in the 2020 first quarter. COVID-19 also makes it more likely our hotel owners or franchisees will default on loans we have made to them or will fail to reimburse us for any payments we make to third-party lenders to whom we made financial guarantees for the timely repayment of all or a portion of the hotel owners’ or franchisees’ debt related to hotels that we manage or franchise. Our ability to recover loans and guarantee advances from hotel operations or from owners or franchisees through the proceeds of hotel sales, refinancing of debt or otherwise may also affect our ability to recycle and raise new capital. Even in situations where we are not obligated to provide funding to hotel owners, franchisees or joint ventures, we may choose to provide financial or other types of support to certain of these parties, which could materially increase our expenses. While governments have and may continue to implement various stimulus and relief programs, it is uncertain whether and to what extent we or our hotel owners or franchisees will be eligible to participate in such programs, whether conditions or restrictions imposed under such programs will be acceptable, and whether such programs will be effective in avoiding or sufficiently mitigating the impacts of COVID-19. As a result of COVID-19, we could experience other short or longer-term impacts on our costs, for example, related to enhanced health and hygiene requirements, such as our recently announced multi-pronged platform to elevate cleanliness standards and hospitality norms to respond to the new health and safety challenges presented by COVID-19. |
| |
| • | Risks Related to Growth: Our growth may also be harmed by COVID-19. Many current and prospective hotel owners and franchisees are finding it difficult or impossible to obtain hotel financing on commercially viable terms. If COVID-19 or general economic weakness causes further deterioration in the capital markets for hotels, some projects that are in construction or development, including a few in which we have minority equity investments, may be unable to draw on existing financing commitments, and replacement financing may not be available or may only be available on less favorable terms. COVID-19 is also causing construction delays due to government restrictions on non-essential activities and shortages of supplies caused by supply chain interruptions. As a result, some of the properties in our development pipeline will not enter our system when we anticipated, or at all, and the rate at which new hotels enter our pipeline may significantly decrease. Delays, increased costs and other impediments to restructuring projects under development will reduce our ability to realize fees, recover loans and guarantee advances, or realize returns on equity investments from such projects. In addition, to the extent that existing hotels exit our system as a result of COVID-19, the overall growth of our system could be negatively impacted. |
| |
| • | Risks Related to Funding: We have made significant borrowings under our $4.5 billion Credit Facility to increase our cash position and preserve financial flexibility in light of the impact on global markets resulting from COVID-19. In addition, on April 16, 2020, we completed our offering of the Series EE Notes. Accordingly, our long-term debt has increased substantially since December 31, 2019 and it could increase further. The increase in our level of debt may adversely affect our financial and operating activities or ability to incur additional debt. In addition, as a result of the risks described above, we may be required to raise additional capital, and our access to and cost of financing will depend on, among other things, global economic conditions, conditions in the global financing markets, the availability of sufficient amounts of financing, our prospects, our credit ratings, and the outlook for the hotel industry as a whole. As a result of COVID-19, some credit agencies have downgraded our credit ratings. If our credit ratings were to be further downgraded, or general market conditions were to ascribe higher risk to our credit rating levels, our industry, or our Company, our access to capital and the cost of debt financing will be further negatively impacted. The interest rate we pay on many of our existing debt instruments, including the Credit Facility and our Series EE Notes, is affected by our credit ratings. Accordingly, a downgrade may cause our cost of borrowing to further increase. Additionally, certain of our existing commercial |
agreements may require us to post or increase collateral in the event of further downgrades. In addition, the terms of future debt agreements could include more restrictive covenants, or require incremental collateral, which may further restrict our business operations or cause future financing to be unavailable due to our covenant restrictions then in effect. Also, if we are unable to comply with the covenants under our Credit Facility, the lenders under our Credit Facility will have the right to terminate their commitments thereunder and declare the outstanding loans thereunder to be immediately due and payable. A default under our Credit Facility could trigger a cross-default, acceleration or other consequences under other indebtedness, financial instruments or agreements to which we are a party. There is no guarantee that debt financings will be available in the future to fund our obligations, or will be available on terms consistent with our expectations. Additionally, the impact of COVID-19 on the financial markets is expected to adversely impact our ability to raise funds through equity financings.
COVID-19, and the volatile regional and global economic conditions stemming from COVID-19, as well as reactions to future pandemics or resurgences of COVID-19, could also give rise to, aggravate or affect our ability to allocate resources to mitigating the other risk factors that we identify below, which in turn could materially adversely affect our business, financial condition, liquidity, results of operations (including revenues and profitability) and/or stock price. Further, COVID-19 may also affect our operating and financial results in a manner that is not presently known to us or that we currently do not consider to present significant risks to our operations.
Risks Relating to Our Industry
Our industry is highly competitive, which may impact our ability to compete successfully for guests with other hotel properties and home sharing or rental services. We operate in markets that contain many competitors. Each of our hotel brands and our home rental offering competes with major hotel chains, regional hotel chains, independent hotels, and home sharing and rental services across national and international venues. Our ability to remain competitive and attract and retain business and leisure travelers depends on our success in distinguishing the quality, value, and efficiency of our lodging products and services, including our Loyalty Program, direct booking channels, and consumer-facing technology platforms and services, from those offered by others. If we cannot compete successfully in these areas, our operating margins could contract, our market share could decrease, and our earnings could decline. Further, new lodging supply in individual markets could have a negative impact on the hotel industry and hamper our ability to increase room rates or occupancy in those markets.
Economic downturns and other global, national, and regional conditions could further impact our financial results and growth. Weak economic conditions in one or more parts of the world,Because we conduct our business on a global platform, changes in oil prices and currency values, disruptions inglobal, national, or regional or global economies, generally and the travel business in particular that might result from changing governmental policies (including in areas such as trade, travel, immigration, healthcare, and related issues,issues), and geopolitical conditions impact our activities. Our business is impacted by decreases in travel resulting from weak economic conditions, changes in energy prices and currency values, political instability, heightened travel security measures, travel advisories, disruptions in some areas,air travel, and the uncertaintyconcerns over how long any ofdisease, violence, war, or terrorism. As discussed in “Risks Relating to COVID-19”, our performance has been materially affected by these conditions could continue, could have a negative impact on the lodging industry. Because of such uncertainty, we continue to experience weakened demand for our hotel rooms in some markets. Our future financial results and growth could be further harmedmaterially affected if these conditions worsen, arise in the future, or constrained if economicextend longer than anticipated, or thesein other conditions worsen.circumstances that we are not able to predict or mitigate. Even after COVID-19 subsides, our business, markets, growth prospects and business model could be materially impacted or altered.
In addition, U.S. government travel and travel associated with U.S. government operations are also a significant part of our business, and this aspect of our business has suffered and could in the futurewhich can suffer due to U.S. federal spending cuts, or government hiring restrictions, and any furtheror other spending limitations that may result from presidential or congressional action or inaction, including for example, a U.S. federal government shutdown, such as the partial shutdown that occurred in December 2018 and January 2019.
Risks Relating to Our Integration of Starwood
The continued diversion of resources and management’s attention to the integration of Starwood could still adversely affect our day-to-day business. While the integration of Starwood is largely complete, integration-related matters still place a significant burden on our management and internal resources and may continue to do so for some time, which could have adverse effects on our business or financial results.
Some of the anticipated benefits of combining Starwood and Marriott may still not be realized. We decided to acquire Starwood with the expectation that the Starwood Combination would result in various benefits. Although we have already achieved substantial benefits, others remain subject to several uncertainties, including whether we can achieve certain revenue synergies.
Integration could also involve unexpected costs. Disruptions of each legacy company’s ongoing businesses, processes, and systems could adversely affect the combined company. We have encountered challenges in harmonizing our different reservations and other systems, our Loyalty Program, and other business practices, and we may encounter additional or increased challenges related to integration. Because of these or other factors, we cannot assure you when or that we will be able to fully realize additional benefits from the Starwood Combination in the form of enhancing revenues or achieving other operating efficiencies, cost savings, or benefits, or that challenges encountered with our harmonization efforts will not have adverse effects on our business or reputation.
Program changes associated with our integration efforts could have a negative effect on guest preference or behavior. Our integration efforts involved significant changes to certain of our guest programs and services, including our Loyalty Program, co-branded credit card arrangements, and consumer-facing technology platforms and services. While we believe such changes enhance these programs and services for our guests and will drive guest preference and satisfaction, these changes remain subject to various uncertainties, including whether the changes could be negatively perceived by certain guests and consumers, could affect guest preference or could alter reservation, spending or other guest or consumer behavior, all of which could adversely affect our market share, reputation, business, financial condition, or results of operations.
Risks Relating to Our Business
Operational Risks
Premature termination of our management or franchise agreements could hurt our financial performance. Our hotel management and franchise agreements may be subject to premature termination in certain circumstances, such as the bankruptcy of a hotel owner or franchisee, the failure of the hotel owner or franchisee to comply with its
payment or other obligations under the agreement, a failure under some agreements to meet specified financial or performance criteria that are subject to the risks described in this section, which we fail or elect not to cure.cure, or in certain limited cases, other negotiated contractual termination rights. Some courts have also applied agency law principles and related fiduciary standards to managers of third-party hotel properties, including us (or have interpreted hotel management agreements to be “personal services contracts”). Property owners may assert the right to terminate management agreements even where the agreements provide otherwise, and some courts have upheld such assertions about our management agreements and may do so in the future. IfWhen terminations occur for these or other reasons, we may need to enforce our right to damages for breach of contract and related claims, which may cause us to incur significant legal fees and expenses. AnyWe may have difficulty collecting damages from the hotel owner or franchisee, and any damages we ultimately collect could be less than the projected future value of the fees and other amounts we would have otherwise collected under the management or franchise agreement. As a result of COVID-19, we may determine that it is in our best interest to agree with hotel owners or franchisees to a negotiated early termination of certain management and franchise agreements. A significant loss of agreements due to premature terminations could hurt our financial performance or our ability to grow our business.
Our lodging operations are subject to global, national, and regional conditions. Because we conduct our business on a global platform, changes in global and regional economies and governmental policies impact our activities. In recent years, decreases in travel resulting from weak economic conditions and the heightened travel security measures resulting from the threat of further terrorism have hurt our business. Our future performance could be similarly affected by the economic and political environment in each of our operating regions, the resulting unknown pace of both business and leisure travel, and any future incidents or changes in those regions.
The growing significance of our operations outside of the U.S. makes us increasingly susceptible to the risks of doing business internationally, which could lower our revenues, increase our costs, reduce our profits, disrupt our business, or damage our reputation. More than a thirdA significant number of the rooms in our system are located outside of the U.S. and its territories. We expect thatterritories, and our international operations, and resulting revenues, willcould continue to grow. This increasingly exposes us to the challenges and risks of doing business outside the U.S., many of which are outside of our control, and which could materially reduce our revenues or profits, materially increase our costs, result in significant liabilities or sanctions, significantly disrupt our business, or significantly damage our reputation. These challenges include: (1) compliance with complex and changing laws, regulations and government policies that may impact our operations, such as foreign ownership
restrictions, import and export controls, trade restrictions, and trade restrictions;health and safety requirements; (2) compliance with U.S. and foreign laws that affect the activities of companies abroad, such as competition laws, cybersecurity and privacy laws, currency regulations, and other laws affecting dealings with certain nations; (3) the difficulties involved in managing an organization doing business in many different countries; (4) uncertainties as to the enforceability of contract and intellectual property rights under local laws; (5) rapid changes in government policy, political or civil unrest, acts of terrorism, war, pandemics or other health emergencies, border control measures or other travel restrictions, or the threat of international boycotts or U.S. anti-boycott legislation; and (6) currency exchange rate fluctuations, which may impact the results and cash flows of our international operations.
Any failure by our international operations to comply with anti-corruption laws or trade sanctions could increase our costs, reduce our profits, limit our growth, harm our reputation, or subject us to broader liability. We are subject to restrictions imposed by the U.S. Foreign Corrupt Practices Act and anti-corruption laws and regulations of other countries applicable to our operations, such as the UKU.K. Bribery Act. Anti-corruption laws and regulations generally prohibit companies and their intermediaries from making certain payments to government officials or other persons in order to influence official acts or decisions or to obtain or retain business. These laws also require us to maintain adequate internal controls and accurate books and records. We have properties in many parts of the world where corruption is common, and our compliance with anti-corruption laws may potentially conflict with local customs and practices. The compliance programs, internal controls and policies we maintain and enforce to promote compliance with applicable anti-bribery and anti-corruption laws may not prevent our associates, contractors, or agents from acting in ways prohibited by these laws and regulations. We are also subject to trade sanctions administered by the U.S. Office of Foreign Assets Control and the U.S. Department of Commerce, and authorities in other countries where we do business. Our compliance programs and internal controls also may not prevent conduct that is prohibited under these rules. The U.S. or other countries may impose additional sanctions at any time against any country in which or with whom we do business. Depending on the nature of the sanctions imposed, our operations in the relevant country could be restricted or otherwise adversely affected. Any violations of anti-corruption laws and regulations or trade sanctions could result in significant civil and criminal penalties, reduce our profits, disrupt or have a material adverse effect on our business, damage our reputation, or result in lawsuits or regulatory actions being brought against the Company or its officers or directors. In addition, the operation of these laws or an imposition of further restrictions in these areas could increase our cost of
operations, reduce our profits or cause us to forgo development opportunities, or cease operations in certain countries, that would otherwise support growth.
Exchange rate fluctuations and foreign exchange hedging arrangements could result in significant foreign currency gains and losses and affect our business results. We earn revenues and incur expenses in foreign currencies as part of our operations outside of the U.S. Accordingly, fluctuations in currency exchange rates may significantly increase the amount of U.S. dollars required for foreign currency expenses or significantly decrease the U.S. dollars we receive from foreign currency revenues. We are also exposed to currency translation risk because the results of our non-U.S. business are generally reported in local currency, which we then translate to U.S. dollars for inclusion in our Financial Statements. As a result, changes between the foreign exchange rates and the U.S. dollar affect the amounts we record for our foreign assets, liabilities, revenues and expenses, and could have a negative effect on our financial results. We expect that our exposure to foreign currency exchange rate fluctuations will grow as the relative contribution of our non-U.S. operations increases. We enter into foreign exchange hedging agreements with financial institutions to reduce exposures to some of the principal currencies in which we receive management and franchise fees, but these efforts may not be successful. These hedging agreements also do not cover all currencies in which we do business, do not eliminate foreign currency risk entirely for the currencies that they do cover, and involve costs and risks of their own in the form of transaction costs, credit requirements and counterparty risk.
Some of our management agreements and related contracts require us to make payments to owners if the hotels do not achieve specified levels of operating profit. Some of our contracts with hotel owners require that we fund shortfalls if the hotels do not attain specified levels of operating profit. We may not be able to recover any fundings of such performance guarantees, which could lower our profits and reduce our cash flows.
Our new programs and new branded products may not be successful. We cannot assure you that new or newly acquired brands, such as those we acquired as a result of the Starwood Combination, our investments in PlacePass
and the joint venture with Alibaba, our Homes & Villas by Marriott International home rental offering, or any other new programs or products we have recently launched or may launch in the future, will be accepted by hotel owners, potential franchisees, or the traveling public or other guests. We also cannot be certain that we will recover the costs we incurred in developing or acquiring the brands or any new programs or products, or that those brands, programs, or products will be successful. In addition, some of our new or newly acquired brands involve or may involve cooperation and/or consultation with one or more third parties, including some shared control over product design and development, sales and marketing, and brand standards. Disagreements with these third parties could slow the development of these brands and/or impair our ability to take actions we believe to be advisable for the success and profitability of such brands. Our home rental offering relies on third-party property management companies to provide sufficient inventory that meets our criteria and to service guests in accordance with our standards, and challenges or disagreements related to these arrangements could impact the growth and success of this offering.
Risks relating to natural or man-made disasters, contagious disease, terrorist activity, andviolence, or war could reducehave reduced the demand for lodging, which mayhas adversely affectaffected our revenues. So We have seen a decline in travel and reduced demand for lodging due to so called “Acts of God,” such as hurricanes, earthquakes, tsunamis, floods, volcanic activity, wildfires, and other natural disasters, as well as man-made disasters and the potential spread of contagious diseases in locations where we own, manage, or franchise significant properties and areas of the world from which we draw a large number of guests, haveand these circumstances could continue or worsen in the past caused and could in the future cause a decline in business or leisure travel and reduce demand for lodging to an extent and for durations that we are not able to predict. Actual or threatened war, terrorist activity, political unrest, civil or civilgeopolitical strife, and other geopolitical uncertaintyacts of violence could have a similar effect. AnyAs with the effects we have already experienced from the COVID-19 situation, any one or more of these events may reduce the overall demand for lodging, or limit the prices that we can obtain, bothor increase our operating costs, all of which could adversely affect our profits. If a terrorist event or other incident of violence were to involve one or more of our branded properties, demand for our properties in particular could suffer, which could further hurt our revenues and profits.
Disagreements with owners of hotels that we manage or franchise may result in litigation or delay implementation of product or service initiatives. Consistent with our focus on management and franchising, we own very few of our lodging properties. The nature of our responsibilities under our management agreements to manage each hotel and enforce the standards required for our brands under both management and franchise agreements may be subject to interpretation and will from time to time give rise to disagreements, which may include disagreements over the need for or payment for new product, service or systems initiatives, the timing and amount of capital investments, and reimbursement for certainoperating costs, system initiatives and costs.costs, or other amounts. Such disagreements may be more likely when hotel returns are weaker.in the current environment. We seek to resolve any disagreements to develop and maintain positive relations with current and potential hotel owners, franchisees, and joint venture partners, but we cannot always do so. Failure to resolve such disagreements has resulted inlitigation, and could do so in the future. If any such litigation results in an adverse judgment, settlement, or court order, we could suffer significant losses, our profits could be reduced, or our future ability to operate our business could be constrained.
Our business depends on the quality and reputation of our companyCompany and our brands, and any deterioration could adversely impact our market share, reputation, business, financial condition, or results of operations. Certain events, including those that may be beyond our control, could affect the reputation of one or more of our properties or more generally impact the reputation of our brands. Many other factors also can influence our reputation and the value of our brands, including service, food quality and safety, safety of our guests and associates, our approach to health and cleanliness, availability and management of scarce natural resources, supply chain management, diversity, human rights, and support for local communities. Reputational value is also based on perceptions, and broad access to social media makes it easy for anyone to provide public feedback that can influence perceptions of us, our brands and our hotels, and it may be difficult to control or effectively manage negative publicity, regardless of whether it is accurate. While reputations may take decades to build, negative incidents can quickly erode trust and confidence, particularly if they result in adverse mainstream and social media publicity, governmental investigations or penalties, or litigation. Negative incidents could lead to tangible adverse effects on our business, including lost sales, boycotts, reduced enrollment and/or participation in our Loyalty Program, disruption of access to our websites and reservation systems, loss of development opportunities, or associate retention and recruiting difficulties. Any material decline in the reputation or perceived quality of our brands or corporate image could affect our market share, reputation, business, financial condition, or results of operations. The Data Security Incident could have a negative impact on our reputation, our corporate image and our relationship with our guests.
If our brands, goodwill or other intangible assets become impaired, we may be required to record significant non-cash charges to earnings. As of March 31, 2019,2020, we had $17.7$17.4 billion of goodwill and other intangible assets. We review goodwill and indefinite-lived intangible assets for impairment annually or whenever events or circumstances indicate impairment may have occurred. Estimated fair values of our brands or reporting units could change if, for example, there are changes in the business climate, unanticipated changes in the competitive environment, adverse legal or regulatory actions or developments, changes in guests’ perception and the reputation of our brands, or changes in interest rates, operating cash flows, or market capitalization. Because of the significance of our goodwill and other intangible assets, any future impairment of these assets could require material non-cash charges to our results of operations, which could have a material adverse effect on our financial condition and results of operations.
Actions by our franchisees and licensees or others could adversely affect our image and reputation. We franchise and license many of our brand names and trademarks to third parties for lodging, timeshare, residential, and our credit card programs. Under the terms of their agreements with us, our franchisees and licenseesthese parties interact directly with guests and other third partiesothers under our brand and trade names. Our home rental offering also involves direct engagement between third-party property management companies and our guests. If these franchisees, licensees, or other companiesthird parties fail to maintain or act in accordance with applicable brand standards; experience operational problems, including any data breachincident involving guest information;information or a circumstance involving guest or associate health or safety; or project a brand image inconsistent with ours, our image and reputation could suffer. Although our agreements with these parties provide us with recourse and remedies in the event of a breach, by the franchisee, licensee, or other company, including termination of the agreements under certain circumstances, it could be expensive or time consuming for us to pursue such remedies. We also cannot assure you that in every instance a court would ultimately enforce our contractual termination rights or that we could collect any awarded damages from the defaulting franchisee, licensee, or other company.party.
Collective bargaining activity and strikes could disrupt our operations, increase our labor costs, and interfere with the ability of our management to focus on executing our business strategies. A significant number of associates at our managed, leased, and owned hotels are covered by collective bargaining agreements. If relationships with our organized associates or the unions that represent them become adverse, the properties we operate could experience labor disruptions such as strikes, lockouts, boycotts, and public demonstrations, as we saw in the fourth quarter of 2018. Although we completed contract negotiations for 43 unionized hotels in 2018 following multi-week strikes by our associates at many of those hotels, a number of additionalNumerous collective bargaining agreements are expectedtypically subject to be negotiated in 2019.negotiation each year, and our past ability to resolve such negotiations does not mean that we will resolve future negotiations without strikes, disruptions, or on terms that we consider reasonable. Labor disputes and disruptions have in the past, and could in the future, result in adverse publicity and adversely affect operations and revenues at affected hotels. In addition, labor disputes and disruptions could harm our relationship with our associates, result in increased regulatory inquiries and enforcement by governmental authorities, harm our relationships with our guests and customers, divert management attention, and reduce customer demand for our services, all of which could have an adverse effect on our reputation, business, financial condition, or results of operations.
Labor regulation and the negotiation of new or existing collective bargaining agreements could lead to higher wage and benefit costs, changes in work rules that raise operating expenses, legal costs, and limitations on our ability or the ability of our third-party property owners to take cost saving measures during economic downturns. We do not have the ability to control the negotiations of collective bargaining agreements covering unionized labor employed by our third-party property owners and franchisees. Increased unionization of our workforce, new labor legislation or changes in regulations could disrupt our operations, reduce our profitability or interfere with the ability of our management to focus on executing our business strategies.
If we cannot attract and retain talented associates, or if we lose the services of senior executives, our business could suffer. We compete with other companies both within and outside of our industry for talented personnel. If we cannot recruit, train, develop, and retain sufficient numbers of talented associates, we could experience increased associate turnover, decreased guest satisfaction, low morale, inefficiency, or internal control failures. Insufficient numbers of talented associates could also limit our ability to grow and expand our businesses. A shortage of skilled labor could also result in higher wages that would increase our labor costs, which could reduce our profits. In addition, the efforts and abilities of our senior executives are important elements of maintaining our competitive
position and driving future growth, and if we lose the services of one or more of our senior executives, we could experience challenges executing our business strategies or other adverse effects on our business. The impact of COVID-19 on the hospitality industry and employment actions that we and others in the hospitality industry have taken in response to COVID-19 may adversely affect our ability to attract and retain associates and executives in the future.
Damage to, or losses involving, properties that we own, manage, or franchise may not be covered by insurance, or the cost of such insurance could increase. Marriott requires We require comprehensive property and liability insurance policies for our managed, leased, and owned properties with coverage features and insured limits that we believe are customary. We require managed hotel owners to procure such coverage or we procure such coverage on their behalf. We also require our franchisees to maintain similar levels of insurance. Market forces beyond our control may nonetheless limit the scope of the insurance coverage we, our hotel owners, or our franchisees can obtain, or our or their ability to obtain coverage at reasonable rates. Certain types of losses, generally of a catastrophic nature, such as earthquakes, hurricanes and floods, terrorist acts, pandemics or liabilities that result from breaches in the security of information systems, may result in high deductibles, low limits, or may be uninsurable or the cost of obtaining insurance may be unacceptably high. As a result, we, our hotel owners, and our franchisees may not be successful in obtaining insurance without increases in cost or decreases in coverage levels, or may not be successful in obtaining insurance at all. For example, in 2018, 2019 and 20192020 substantial increases in property insurance costs occurred due to the severe and widespread damage caused by the 2017 Atlantic hurricane season and other natural disasters coupled with continued large global losses in the property market in 2018, and we expect substantial increases in cyber insurance coststhe following two years. Also, due to the Data Security Incident and the state of the cyber insurance market generally, the costs for our cyber insurance increased for our policy period beginning in the 2019 third quarter, and the Data Security Incident. In addition,cost of such insurance could continue to increase for future policy periods. Further, in the event of a substantial loss, the insurance coverage we, our hotel owners, or our franchisees carry may not be sufficient to pay the full market value or replacement cost of any lost investment or in some cases could result in certain losses being totally uninsured. As a result, our revenues and profits could be adversely affected, and for properties we own or lease, we could lose some or all of anythe capital that we have invested in a property, as well as the anticipated future revenue from the property and we could remain obligated for guarantees, debt, or other financial obligations for the property.obligations.
Development and Financing Risks
While we are predominantly a manager and franchisor of hotel properties, our hotel owners depend on capital to buy, develop, and improve hotels, and our hotel owners may be unable to access capital when necessary. Both we and current and potential hotel owners must periodically spend money to fund new hotel investments, as well as to refurbish and improve existing hotels. The availability of funds for new investments and improvement of existing hotels by our current and potential hotel owners depends in large measure on capital markets and liquidity factors, over which we exert little control. Obtaining financing on attractive terms has been, and may in the future be further, constrained by the capital markets for hotel and real estate investments. In addition, owners of existing hotels that we franchise or manage may have difficulty meeting required debt service payments or refinancing loans at maturity.
Our growth strategy depends upon third-party owners/operators, and future arrangements with these third parties may be less favorable. Our growth strategy for adding lodging facilities entails entering into and maintaining various arrangements with property owners. The terms of our management agreements and franchise agreements for each of our lodging facilities are influenced by contract terms offered by our competitors, among other things. We cannot assure you that any of our current arrangements will continue or that we will be able to enter into future collaborations, renew agreements, or enter into new agreements in the future on terms that are as favorable to us as those that exist today.
Our ability to grow our management and franchise systems is subject to the range of risks associated with real estate investments. Our ability to sustain continued growth through management or franchise agreements for new hotels and the conversion of existing facilities to managed or franchised Marriott brands is affected, and may potentially be limited, by a variety of factors influencing real estate development generally. These include site availability, financing availability, planning, zoning and other local approvals, and other limitations that may be imposed by market and submarket factors, such as projected room occupancy and rate, changes in growth in demand compared to projected supply, territorial restrictions in our management and franchise agreements, costs of construction, and demand for construction resources.resources, and other disruptive conditions in global, regional, or local markets.
Our development and renovation activities expose us to project cost, completion, and resale risks. We occasionally develop, or acquire and renovate hotel and residential properties, both directly and through partnerships, joint ventures, and other business structures with third parties. As demonstrated by the impairment
charges that we recorded in 2014 and 2015 in connection with our development and construction of three EDITION hotels and residences, our ongoing involvement in the development of propertiesThis presents a number of risks, including that: (1) any future weakness in the capital markets maylimit our ability, or that of third parties with whom we do business,partner, to raise capital for completion of projects that have commenced or for development of future properties;projects; (2) properties that we develop or renovate could become less attractive due to decreases in demand for hotel and residential properties, market absorption or oversupply, with the result that we may not be able to sell such properties for a profit or at the prices or selling pacetime we anticipate, potentially requiringor we may be required to record additional changes in our pricing strategy that could result in furtherimpairment charges; and (3) construction delays or cost overruns, including those due to shortages or increased costs of skilled labor and/or materials, lender financial defaults, or so called “Acts of God” such as earthquakes, hurricanes, floods, or fires may increase overall project costs or resultcosts. We could face similar risks to the extent we undertake development activities again in project cancellations; and (4) we may be unable to recover development costs we incur for any projects that we do not pursue to completion.the future.
Our owned properties and other real estate investments subject us to numerous risks. Although we had relatively fewWe have a number of owned and leased properties, at the end of 2019 first quarter, such propertieswhich are subject to the risks that generally relate to investments in real property. While we have sold manyWe may seek to sell some of these properties in recent years and we are actively pursuing additional sales,over time; however, equity real estate investments can be difficult to sell quickly and weCOVID-19 has disrupted the transaction markets for hospitality assets. We may not be able to do socomplete asset sales at prices we find acceptable, or at all. Moreover, the investment returns available from equity investments in real estate depend in large part on the amount of income earned and capital appreciation generated, if any, by the related properties, and the expenses incurred. A variety of other factors also affect income from properties and real estate values, including local market conditions and new supply of hotels, availability and costs of staffing, governmental regulations, insurance, zoning, tax and eminent domain laws, interest rate levels, and the availability of financing. For example, new or existing real estate zoning or tax laws can make it more expensive and/to acquire, develop, or time-consuming to develop real property operate and/or expand, modify, or renovate hotels. When interest rates increase, the cost of acquiring, developing, expanding, or renovating real property increases and real property values may decrease as the number of potential buyers decreases. Similarly, as financing becomes less available, it becomes more difficult both to acquire and to sell real property. Finally, under eminent domain laws, governments can take real property, sometimes for less compensation than the owner believes the property is worth. Despite our asset-light strategy, ourOur real estate properties have been, and could in the future be, impacted by any of these factors, resulting in a material adverse impact on our results of operations or financial condition. If our properties docontinue to not generate revenue sufficient to meet operating expenses, including needed capital expenditures, our income could be further adversely affected.affected and we could be required to record additionalsignificant non-cash impairment charges to our results of operations.
Development and other investing activities that involve our co-investment with third parties may result in disputes and may decrease our ability to manage risk. We have from time to time invested, and may continue to invest, in partnerships, joint ventures, and other business structures involving our co-investment with third parties. These investments generally include some form of shared control over the development of the asset or operations of the business and create added risks, including the possibility that other investors in such ventures could become
bankrupt or otherwise lack the financial resources to meet their obligations, could have or develop business interests, policies, or objectives that are inconsistent with ours, could take action without our approval (or, conversely, prevent us from taking action without our partner’s approval), or could make requests contrary to our policies or objectives. Should a venture partner become bankrupt we could become liable for our partner’s share of the venture’s liabilities. Actions by a co-venturer might subject the assets owned by the venture or partnership to additional risk, such as increased project costs, project delays, or operational difficulties following project completion. Disagreements with our venture partners may result in litigation. These risks may be more likely to occur in difficult business environments.environments like we are currently experiencing. We cannot assure you that our investments through partnerships or joint ventures will be successful in light of these risks.
Risks associated with development and sale of residential properties associated with our lodging properties or brands may reduce our profits. We participate, through licensing agreements or directly or through noncontrolling interests, in the development and sale of residential properties associated with our brands, including residences and condominiums under many of our luxury and premium brand names and trademarks. Such projects pose further risks beyond those generally associated with our lodging business, which may reduce our profits or compromise our brand equity, including risks that (1) weakness in residential real estate and demand generally may reduce our profits and could make it more difficult to convince future development partners of the value added by our brands;
(2) increases in interest rates, reductions in mortgage availability or the tax benefits of mortgage financing or residential ownership generally, or increases in the costs of residential ownership could prevent potential customers from buying residential products or reduce the prices they are willing to pay; and (3) residential construction may be subject to warranty and liability claims or claims related to purchaser deposits, and the costs of resolving such claims may be significant.
Some hotel openings in our development pipeline and approved projects may be delayed or not result in new hotels, which could adversely affect our growth prospects. We report a significant number of hotels in our development pipeline, including hotels under construction and under signed contracts, as well as hotels approved for development but not yet under contract. The eventual opening of such pipeline hotels and, in particular, the approved hotels that are not yet under contract, is subject to numerous risks, including the risks described above in some cases the owner’s or developer’srisk factors entitled “Our ability to obtain adequate financing or governmental or regulatory approvals, increasedgrow our management and franchise systems is subject to the range of risks associated with real estate investments” and “COVID-19 has had a material detrimental impact on our business, financial results and liquidity, and such impact could worsen and last for an unknown period of time; Risks Related to Growth.” We have seen construction costs or changes in lodging supply dynamics in individual markets. Competitiontimelines for pipeline hotels lengthen due to competition for skilled construction labor and disruption in the supply chain for materials hasand these circumstances could continue or worsen in the past and could in the future cause construction timelines for pipeline hotels to lengthen.future. Accordingly, we cannot assure you that all of our development pipeline will result in new hotels entering our system, or that those hotels will open when we anticipate.
If we incur lossesLosses on loans or loan guarantees that we have made to third parties impact our profits could decline. profits. At times, we make loans for hotel development, acquisition or renovation expenditures when we enter into or amend management or franchise agreements. From time to time we also provide third-party lenders with financial guarantees for the timely repayment of all or a portion of debt related to hotels that we manage or franchise, generally subject to an obligation that the owner reimburse us for any fundings. We could suffer losses if hotel owners or franchisees default on loans that we provide or fail to reimburse us for loan guarantees that we have funded.
If owners of hotels that we manage or franchise cannot repay or refinance mortgage loans secured by their properties, our revenues and profits could decrease and our business could be harmed. The owners of many of our managed or franchised properties have pledged their hotels as collateral for mortgage loans that they entered into when those properties were purchased or refinanced. If those owners cannot repay or refinance maturing indebtedness on favorable terms or at all, the lenders could declare a default, accelerate the related debt, and repossessforeclose on the property. Such sales or repossessionsforeclosures could, in some cases, result in the termination of our management or franchise agreements and eliminate our anticipated income and cash flows, which could negatively affect our results of operations.
Changes affecting the availability of the London Interbank Offered Rate (“LIBOR”) may have consequences that we cannot yet reasonably predict. We are a party to various agreements and other instruments where obligations by or to us are calculated based on or otherwise dependent on LIBOR. In July 2017, the U.K. Financial Conduct
Authority announced that it intends to stop persuading or compelling banks to submit rates for calculation of LIBOR after 2021. As a result, LIBOR may perform differently than in the past and may ultimately cease to be utilized or to exist, either before or after 2021. Alternative benchmark rate(s) may replace LIBOR and could affect our agreements that rely on LIBOR, not all of which contain alternative rate provisions. Certain of our agreements rely on LIBOR and, at this time, it is not possible for us to predict the effect of any changes to LIBOR, any phase out of LIBOR, or any establishment of alternative benchmark rates. There is uncertainty about how we, the financial markets, applicable law and the courts will address the replacement of LIBOR with alternative rates on contracts that do not include alternative rate provisions. In addition, any changes to benchmark rates may have an uncertain impact on our cost of funds, our receipts or payments under agreements that rely on LIBOR, and the valuation of derivative or other contracts to which we are a party, any of which could impact our results of operations and cash flows.
Technology, Information Protection, and Privacy Risks
A failure to keep pace with developments in technology could impair our operations or competitive position. The lodging industry continues to demand the use of sophisticated technology and systems, including those used for our reservation, revenue management, property management, human resources and payroll systems, our Loyalty Program, and technologies we make available to our guests and for our associates. These technologies and systems must be refined, updated, and/or replaced with more advanced systems on a regular basis, and our business could suffer if we cannot do that as quickly or effectively as our competitors or within budgeted costs and time frames. We also may not achieve the benefits that we anticipate from any new technology or system, and a failure to do so could result in higher than anticipated costs or could impair our operating results.
An increase in the use of third-party Internet services to book online hotel reservations could adversely impact our business. Some of our hotel rooms are booked through Internet travel intermediaries such as Expedia.com®, Priceline.com®, Booking.com™, Travelocity.com®, and Orbitz.com®, as well as lesser-known online travel service providers. These intermediaries initially focused on leisure travel, but now also provide offerings for corporate travel and group meetings. Although our Best Rate Guarantee and Member Rate programs have helped limit guest preference shift to intermediaries and greatly reduced the ability of intermediaries to undercut the published rates at our hotels, intermediaries continue to use a variety of aggressive online marketing methods to attract guests, including the purchase by certain companies of trademarked online keywords such as “Marriott” from Internet search engines such as Google®, Bing®, Yahoo®, and Baidu® to steer guests toward their websites (a practice that has been challenged by various trademark owners in federal court). Although we have successfully limited these practices through contracts with key online intermediaries, the number of intermediaries and related companies that
drive traffic to intermediaries’ websites is too large to permit us to eliminate this risk entirely. Our business and profitability could be harmed ifto the extent that online intermediaries succeed in significantly shifting loyalties from our lodging brands to their travel services, diverting bookings away from our direct online channels, or through their fees, increase the overall cost of Internet bookings for our hotels. In addition, if we are not able to negotiate new agreements on satisfactory terms when our existing contracts with intermediaries (which generally have 2- to 3- year terms) come up for renewal, our business and prospects could be negatively impacted in a number of ways. For example, if newly negotiated agreements are on terms less favorable to our hotels than the expiring agreements, or if we are not able to negotiate new agreements and our hotels no longer appear on intermediary websites, our bookings could decline, our profits (and the operating profits of hotels in our system) could decline, and customers and owners may be less attracted to our brands. We may not be able to recapture or offset any such loss of business through actions we take to enhance our direct marketing and reservation channels or to rely on other channels or other intermediary websites.
We are exposed to risks and costs associated with protecting the integrity and security of company,Company, associate, and guest data.In the operation of our business, we collect, store, use, and transmit large volumes of data regarding associates, guests, customers, owners, licensees, franchisees, and our own business operations, including credit card numbers, reservation and loyalty data, and other personal information, in various information systems that we maintain and in systems maintained by third parties, including our owners, franchisees, licensees, and service providers. The integrity and protection of this data is critical to our business. If this data is inaccurate or incomplete, we could make faulty decisions.
Our guests and associates also have a high expectation that we, as well as our owners, franchisees, licensees, and service providers, will adequately protect and appropriately use their personal information. The information,
security, and privacy requirements imposed by laws and governmental regulation, our contractual obligations, and the requirements of the payment card industry are also increasingly demanding in the U.S., the European Union, Asia, and other jurisdictions where we operate. Our systems and the systems maintained or used by our owners, franchisees, licensees, and service providers may not be able to satisfy these changing legal and regulatory requirements and associate and guest expectations, or may require significant additional investments or time to do so. We may incur significant additional costs to meet these requirements, obligations, and expectations, and in the event of alleged or actual noncompliance we may experience increased operating costs, increased exposure to fines and litigation, and increased risk of damage to our reputation and brand.
The Data Security Incident, and other information security incidents, could have numerous adverse effects on our business. As a result of the Data Security Incident, we are a party to numerous lawsuits, primarily putative class actions, brought by consumers and others in the U.S. and Canada, one securities class action lawsuit in the U.S., and twothree shareholder derivative lawsuits in the U.S. We may be named as a party in additional lawsuits and other claims may be asserted by or on behalf of guests, customers, hotel owners, shareholders or others seeking monetary damages or other relief.relief related to the Data Security Incident. A number of federal, state and foreign governmental authoritieshave also made inquiries, opened investigations, or requested information and/or documents related to the Data Security Incident, including under various data protection and privacy regulations, such as the European Union’s General Data Protection Regulation. Responding to and resolving these lawsuits, claims andand/or investigations could result in material remedial and other expenses which may not be covered by insurance, including fines.any fines imposed by the Information Commissioner’s Office in the United Kingdom (the “ICO”), as discussed in Note 6, or by regulatory authorities in various other jurisdictions. Governmental authorities investigating or seeking information about the Data Security Incident also may seek to impose undertakings, injunctive relief, consent decrees, or other civil or criminal penalties, which could, among other things, materially increase our data security costs or otherwise require us to alter how we operate our business. Card issuers or payment card networks may seek to attribute losses or other expenses to the Data Security Incident, and we cannot currently determine to what extent those losses and expenses may be our legal responsibility. Significant management time and Company resources have been, and may continue to be, devoted to the Data Security Incident. TheFuture publicity or developments related to the Data Security Incident, and publicity related to itincluding as a result of subsequent reports or regulatory actions or developments, could have a range of other adverse effects on our business or prospects, including causing or contributing to loss of consumer confidence, reduced consumer demand, reduced enrollment and/or participation in our Loyalty Program, loss of development opportunities, and associate retention and recruiting difficulties. These expenses and other adverse effects could have a material effect on our market share, reputation, business, financial condition, or results of operations. Although we maintain insuranceInsurance coverage designed to limit our exposure to losses such as those related to the Data Security Incident that insurance may not be sufficient or available to cover all of our expenses or other losses
(including fines) (including the final amount of the Proposed ICO Fine and any other fines or penalties) related to the Data Security Incident. Further, as a result of the Data Security Incident and market forces beyond our control, relevant insurance coverage may not be available in the future on commercially reasonable terms or at all.
Our remediation effortsIn addition, two lawsuits have been filed against us related to, the Data Security Incident will be costly and may not be effective. Following the Data Security Incident, we implemented additional technical measures on our network designed to contain and remove the threats identified during our investigation, secure the Starwood reservations database, and monitor for any further unauthorized activity. We also accelerated ongoing security enhancements to our network. We have incurred costs in connection with these remediation efforts to date, and we could incur additional significant costs as we take further steps designed to prevent unauthorized access to our network. The technical measures we have takenvarious governmental authorities are based on our investigation of the causes of the Data Security Incident, but additional measures may be needed to prevent a similar incident in the future and such measures may not be sufficient to prevent other types of incidents. We cannot assure you that all potential causes ofinvestigating or seeking information about, the incident we announced on March 31, 2020 involving information for up to approximately 5.2 million guests that we believe may have been identified and remediated and will not occur again.improperly accessed through an application using the login credentials of two franchise employees at a franchise property (the “Unauthorized Application Access Incident”). The Unauthorized Application Access Incident or publicity related to it could negatively affect our business or reputation.
Additional cybersecurity incidents could have adverse effects on our business. The Data Security Incident was significant, went undetected for a long period of time, and could have numerous adverse effects on our business, as discussed above. If we experience additional cybersecurity incidents or fail to detect and appropriately respond to additional cybersecurity incidents, the severity of the adverse effects on our business could be magnified. We have implemented security measures to safeguard our systems and data, and we intend to continue implementing additional measures in the future, but, as withwe have seen in the Data Security Incident,past, our measures may not be sufficient to maintain the confidentiality, security, or availability of the data we collect, store, and use to operate our business. Measures taken by our service providers or our owners, franchisees, licensees, andother business partners or their service providers also may not be sufficient. Efforts to hack or circumvent security measures, efforts to gain unauthorized access to, exploit or disrupt the operation or integrity of our data or systems, failures of systems or software to operate as designed or intended, viruses, “ransomware” or other malware, “phishing” or other types of business emailcommunications compromises, operator error, or inadvertent releases of data have impacted, and may in the future impact, our information systems and records or those of our owners, franchisees, licensees, other business partners, or service providers. Our reliance on computer, Internet-based, and mobile systems and communications, and the frequency and sophistication of efforts by third parties to gain unauthorized access or prevent authorized access to such systems, have greatly increased in recent years. We have experienced cyber-attacks,cyberattacks, attempts to disrupt access to our systems and data, and attempts to affect the operation or integrity of our data or systems, and the frequency and sophistication of such efforts could continue to increase. In addition to the consequences of the Data Security Incident discussed above, anyAny additional significant theft of, unauthorized access to, compromise or loss of,
loss of access to, or fraudulent use of guest, associate, owner, franchisee, licensee, or companyCompany data could adversely impact our reputation and could result in legal, regulatory and other consequences, including remedial and other expenses, fines, or litigation. Depending on the nature and scope of the event, future compromises in the security of our information systems or those of our owners, franchisees, licensees, other business partners, or service providers or other future disruptions inor compromises of data servicesor systems could lead to an interruption in or other adverse effects on the operation of our systems or those of our owners, franchisees, licensees, other business partners, or service providers, resulting in operational inefficiencies and a loss of profits, and could result in negative publicity and other adverse effects on our business, including lost sales, loss of consumer confidence, boycotts, reduced enrollment and/or participation in our Loyalty Program, litigation, loss of development opportunities, or associate satisfaction, retention and recruiting difficulties, all of which could materially affect our market share, reputation, business, financial condition, or results of operations.
Because we have experienced cybersecurity incidents in the past, additional incidents or the failure to detect and appropriately respond to additional incidents could magnify the severity of the adverse effects on our business. The techniques used to obtain unauthorized access, disable or degrade service, or sabotage information systems change frequently, can be difficult to detect for long periods of time, and can involve difficult or prolonged assessment or remediation periods even once detected, which could also magnify the severity of these adverse effects. In addition, althoughWe cannot assure you that all potential causes of past significant incidents have been identified and remediated; additional measures may be needed to prevent significant incidents in the future. The steps we take may not be sufficient to prevent future significant incidents and as a result, such incidents may occur again. Although we carry cyber/privacy liabilitycyber insurance that is designed to protect us against certain losses related to cyber risks, that insurance coverage may not be sufficient to cover all expenses or other losses (including fines) or all types of claims that may arise in connection with cyber-attacks,cyberattacks, security compromises, and other related incidents, and until we renew our current policy and a new policy period begins, our policy coverage limits will be reduced by the amount of claims paid related to the Data Security Incident.incidents. Furthermore, in the future such insurance may not be available on commercially reasonable terms, or at all.
Changes in privacy and data security laws could increase our operating costs, increase our exposure to fines and litigation, and adversely affect our ability to market our products effectively. We are subject to numerous, complex, and frequently changing laws, regulations, and contractual obligations designed to protect personal
information, including in the U.S., the European Union, Asia, and other jurisdictions. Non-U.S. data privacy and data security laws, various U.S. federal and state laws (such as the California Consumer Privacy Act and the New York Shield Act), payment card industry security standards, and other information privacy and security standards are all applicable to us. Significant legislative or regulatory changes could be adopted in the future, including in reaction to the Data Security Incident or data breaches experienced by other companies. Compliance with changes in applicable data privacy laws and regulations (such as the California Consumer Privacy Act and the New York Shield Act) and contractual obligations, including responding to investigations into our compliance, may restrict our business operations, increase our operating costs, increase our exposure to fines and litigation in the event of alleged non-compliance, and adversely affect our reputation. Following the Data Security Incident, the Information Commissioner’s Office in the United Kingdom (“ICO”) notified us that it hadICO and certain other regulators also opened an investigationinvestigations into our online privacy policypractices, including the representations in our privacy policies and related practices and an investigation into the Company’s handling of data subject accesshow we handle individual rights requests. These investigations are separate from the ICO’s investigation specifically related to the Data Security Incident. As a result of these investigations, we could be exposed to significant fines and remediation costs in addition to any imposed as a result of the Data Security Incident, and adverse publicity related to the investigations could adversely affect our reputation.
Additionally, we rely on a variety of direct marketing techniques, including email marketing, online advertising, and postal mailings. Any further restrictions in laws such as the CANSPAM Act, and various U.S. state laws (such as the California Consumer Privacy Act and the New York Shield Act), or new federal or state laws on marketing and solicitation or international privacy, e-privacy, and anti-spam laws that govern these activities could adversely affect the continuing effectiveness of email, online advertising, and postal mailing techniques and could force further changes in our marketing strategy. If this occurs, we may not be able to develop adequate alternative marketing strategies, which could impact the amount and timing of our sales of certain products. We also obtain access to potential guests and customers from travel service providers or other companies with whom we have substantial relationships, and we market to some individuals on these lists directly or by including our marketing message in the other companies’ marketing materials. If access to these lists were to be prohibited or otherwise restricted, our ability to develop new guests and customers and introduce them to our products could be impaired.
Any disruption in the functioning of our reservation systems could adversely affect our performance and results. We manage global reservation systems that communicate reservations to our hotels from individuals who book reservations directly with us online, through our mobile apps, through our telephone call centers, or through intermediaries like travel agents, Internet travel websites, and other distribution channels. The cost, speed, accuracy and efficiency of our reservation systems are critical aspects of our business and are important considerations for hotel owners when choosing our brands. Our business may suffer if we fail to maintain, upgrade, or prevent disruption to our reservation systems. Disruptions in or changes to our reservation systems could result in a disruption to our business and the loss of important data.
Other Risks
Ineffective internal control over financial reporting could result in errors in our financial statements, reduce investor confidence, and adversely impact our stock price. As discussed in Part II, Item 8 “Management’s Report on Internal Control Over Financial Reporting”9A “Controls and Procedures” of our 2018 2019 Form 10-K, in the 2018 fourth quarter, we identified a material weakness in internal control related to our accounting for our Loyalty Program, which resulted in errors in our previously issued financial statements for the 2018 first, second, and third quarters. Internal controls related to the implementation of ASU 2014-09 and the accounting for our Loyalty Program are important to accurately reflect our financial position and results of operations in our financial reports. We are in the process of remediating the material weaknessweakness. If the additional controls and responding to requests from the SEC for documents and information related to these matters. Ifprocesses that we are unablehave implemented while we work to remediate the material weakness in an appropriate and timely manner,are not sufficient, or if we identify additional control deficiencies that individually or together constitute significant deficiencies or material weaknesses, our ability to accurately record, process, and report financial information and consequently, our ability to prepare financial statements within required time periods, could be adversely affected. Failure to properly remediate the material weakness or the discovery of additional control deficiencies could result in violations of applicable securities laws, stock exchange listing requirements, and the covenants under our debt agreements, subject us to litigation and investigations, negatively affect investor confidence in our financial statements, and adversely impact our stock price and ability to access capital markets.
Changes in laws and regulations could reduce our profits or increase our costs. We are subject to a wide variety of laws, regulations, and policies in jurisdictions around the world, including those for financial reporting, taxes, healthcare, cybersecurity, privacy, climate change, and the environment. Changes to such laws, regulations, or policies could reduce our profits. We also anticipate that many of the jurisdictions where we do business will continue to review taxes and other revenue raising measures, and any resulting changes could impose new restrictions, costs, or prohibitions on our current practices or reduce our profits. In particular, governments may revise tax laws, regulations, or official interpretations in ways that could significantly impact us, and other modifications could reduce the profits that we can effectively realize from our operations or could require costly changes to those operations or the way in which they are structured.
We could be subject to additional tax liabilities. We are subject to a variety of taxes in the U.S. (federal, state, and state)local) and numerous foreign jurisdictions. We may recognize additional tax expense and be subject to additional tax liabilities due to changes in laws, regulations, administrative practices, principles, and interpretations related to tax, including changes to the global tax framework, competition, and other laws and accounting rules in various jurisdictions. Such changes could come about as a result of economic, political, and other conditions.
Our tax expense and liabilities mayare also be affected by other factors, such as changes in our business operations, acquisitions, investments, entry into new businesses and geographies, intercompany transactions, the relative amount of our foreign earnings, losses incurred in jurisdictions for which we are not able to realize related tax benefits, the applicability of special tax regimes, changes in foreign currency exchange rates, changes in our stock price, and changes in our deferred tax assets and liabilities and their valuation. Significant judgment is required in evaluating and estimating our tax expense and liabilities. In the ordinary course of our business, there are many transactions and calculations for which the ultimate tax determination is uncertain. For example, the legislation known as the U.S. Tax Cuts and Jobs Act of 2017 (the “2017 Tax Act”) requires complex computations to be performed that were not previously required by U.S. tax law, significant judgments to be made in interpretation of the provisions of the 2017 Tax Act, significant estimates in calculations, and the preparation and analysis of information not previously relevant or regularly produced. The U.S. Treasury Department, the U.S. Internal Revenue Service, and other standard-setting bodies will continue to interpret or issue guidance on how provisions of the 2017 Tax Act will be applied or otherwise administered. As future guidance is issued, we may make adjustments to amounts that we have previously recorded that may materially impact our financial statements in the period in which the adjustments are made.
We are also currently subject to tax controversies in various jurisdictions, and these jurisdictions may assess additional tax liabilities against us. Developments in an audit, investigation, or other tax controversy could have a material effect on our operating results or cash flows in the period or periods for which that development occurs, as well as for prior and subsequent periods. We regularly assess the likelihood of an adverse outcome resulting from
these proceedings to determine the adequacy of our tax accruals. Although we believe our tax estimates are reasonable, the final outcome of audits, investigations, and any other tax controversies could be materially different from our historical tax accruals.
Delaware law and our governing corporate documents contain, and our Board of Directors could implement, anti-takeover provisions that could deter takeover attempts. Under the Delaware business combination statute, a shareholder holding 15 percent or more of our outstanding voting stock could not acquire us without Board of Director consent for at least three years after the date the shareholder first held 15 percent or more of the voting stock. Our governing corporate documents also, among other things, require supermajority votes for mergers and similar transactions. In addition, our Board of Directors could, without shareholder approval, implement other anti-takeover defenses, such as a shareholder rights plan.
Item 2.Unregistered Sales of Equity Securities and Use of Proceeds
| |
| (a) | Unregistered Sale of Securities |
None.
None.
| |
| (c) | Issuer Purchases of Equity Securities |
|
| | | | | | | | | | | | | |
| (in millions, except per share amounts) | | | | | | | | |
| Period | | Total Number of Shares Purchased | | Average Price per Share | | Total Number of Shares Purchased as Part of Publicly Announced Plans or Programs (1) | | Maximum Number of Shares That May Yet Be Purchased Under the Plans or Programs (1) |
| January 1, 2019 - January 31, 2019 | | — |
| | $ | — |
| | — |
| | 10.7 |
|
| February 1, 2019 - February 28, 2019 | | 2.4 |
| | $ | 126.31 |
| | 2.4 |
| | 33.3 |
|
| March 1, 2019 - March 31, 2019 | | 4.3 |
| | $ | 122.97 |
| | 4.3 |
| | 29.0 |
|
|
| | | | | | | | | | | | | |
| (in millions, except per share amounts) | | | | | | | | |
| Period | | Total Number of Shares Purchased | | Average Price per Share | | Total Number of Shares Purchased as Part of Publicly Announced Plans or Programs (1) | | Maximum Number of Shares That May Yet Be Purchased Under the Plans or Programs (1) |
| January 1, 2020 - January 31, 2020 | | 0.8 |
| | $ | 145.14 |
| | 0.8 |
| | 17.6 |
|
| February 1, 2020 - February 29, 2020 | | 0.2 |
| | $ | 146.26 |
| | 0.2 |
| | 17.4 |
|
| March 1, 2020 - March 31, 2020 | | — |
| | $ | — |
| | — |
| | 17.4 |
|
| |
(1) | On November 9, 2017 and February 15, 2019, we announced that our Board of Directors increased our common stock repurchase authorization by 30 million shares and 25 million shares, respectively.shares. As of March 31, 2019, 29.02020, 17.4 million shares remained available for repurchase under Board approved authorizations. We repurchase shares in the open market and in privately negotiated transactions. We do not anticipate repurchasing additional shares until business conditions improve, and are prohibited from doing so for the duration of the waiver period under our Credit Facility, with certain exceptions. |
Item 6.Exhibits
We have not filed as exhibits certain instruments defining the rights of holders of the long-term debt of Marriott pursuant to Item 601(b)(4)(iii) of Regulation S-K promulgated under the Exchange Act, because the amount of debt authorized and outstanding under each such instrument does not exceed 10 percent of the total assets of the Company and its consolidated subsidiaries. The Company agrees to furnish a copy of any such instrument to the Commission upon request.
|
| | | | |
Exhibit No. | | Description | | Incorporation by Reference (where a report is indicated below, that document has been previously filed with the SEC and the applicable exhibit is incorporated by reference thereto) |
| 3.1 | | Restated Certificate of Incorporation. | | |
| | | |
| 3.2 | | Amended and Restated Bylaws. | | |
| | | | | |
10.110 | | FormFirst Amendment, dated as of MI SharesApril 13, 2020, to the Fifth Amended and Restated Credit Agreement for the Marriott International, Inc. Stockwith Bank of America, N.A., as administrative agent, and Cash Incentive Plan (March 2019).certain banks, dated as of June 28, 2019. | | |
| | | | |
10.2 | | Form of Retention Executive Restricted Stock Unit Agreement for the Marriott International, Inc. Stock and Cash Incentive Plan (March 2019). | | |
| | | | |
10.3 | | Form of Stock Appreciation Rights Agreement for the Marriott International, Inc. Stock and Cash Incentive Plan (March 2019). | | |
| | | | |
10.4 | | Form of Performance Share Unit Award Agreement for the Marriott International, Inc. Stock and Cash Incentive Plan (March 2019). | | |
| | | | | |
| 31.1 | | Certification of Chief Executive Officer Pursuant to Rule 13a-14(a). | | |
| | | |
| 31.2 | | Certification of Chief Financial Officer Pursuant to Rule 13a-14(a). | | |
| | | |
| 32 | | Section 1350 Certifications. | | |
| | |
| 101 | | The following financial statements from Marriott International, Inc.’s Quarterly Report on Form 10-Q for the quarter ended March 31, 2020, formatted in Inline XBRL: (i) the Condensed Consolidated Statements of Income; (ii) the Condensed Consolidated Statements of Comprehensive Income; (iii) the Condensed Consolidated Balance Sheets; and (iv) the Condensed Consolidated Statements of Cash Flows. | | Submitted electronically with this report. |
| | | | |
| 101.INS | | XBRL Instance Document.Document - the instance document does not appear in the interactive data file because its XBRL tags are embedded within the Inline XBRL document. | | Submitted electronically with this report. |
| | | |
| 101.SCH | | XBRL Taxonomy Extension Schema Document. | | Submitted electronically with this report. |
| | | |
| 101.CAL | | XBRL Taxonomy Calculation Linkbase Document. | | Submitted electronically with this report. |
| | | |
| 101.DEF | | XBRL Taxonomy Extension Definition Linkbase Document. | | Submitted electronically with this report. |
| | | |
| 101.LAB | | XBRL Taxonomy Label Linkbase Document. | | Submitted electronically with this report. |
| | | |
| 101.PRE | | XBRL Taxonomy Presentation Linkbase Document. | | Submitted electronically with this report. |
| | | | |
| 104 | | The cover page from Marriott International, Inc.’s Quarterly Report on Form 10-Q for the quarter ended March 31, 2020, formatted in Inline XBRL (included as Exhibit 101). | | Submitted electronically with this report. |
We have submitted electronically the following documents formatted in XBRL (Extensible Business Reporting Language) as Exhibit 101 to this report: (i) the Condensed Consolidated Statements of Income for the three months ended March 31, 2019 and March 31, 2018; (ii) the Condensed Consolidated Statements of Comprehensive Income for the three months ended March 31, 2019 and March 31, 2018; (iii) the Condensed Consolidated Balance Sheets at March 31, 2019 and December 31, 2018; and (iv) the Condensed Consolidated Statements of Cash Flows for the three months ended March 31, 2019 and March 31, 2018.
SIGNATURE
Pursuant to the requirements of the Securities Exchange Act of 1934, the registrant has duly caused this report to be signed on its behalf by the undersigned thereunto duly authorized.
|
|
| MARRIOTT INTERNATIONAL, INC. |
1011th day of May, 20192020
|
|
| /s/ Bao Giang Val Bauduin |
| Bao Giang Val Bauduin |
Controller and Chief Accounting Officer
(Duly Authorized Officer) |