0001176948 srt:ParentCompanyMember srt:ReportableLegalEntitiesMember us-gaap:AdministrativeServiceMember 2018-01-01 2018-06-30
UNITED STATES
SECURITIES AND EXCHANGE COMMISSION
Washington, D.C. 20549
FORM 10-Q
|
| | | | |
| ☒ | QUARTERLY REPORT PURSUANT TO SECTION 13 OR 15(d) OF THE SECURITIES EXCHANGE ACT OF 1934 |
For the quarterly period ended June 30, 20192020
OR
|
| | | | |
| ☐ | TRANSITION REPORT PURSUANT TO SECTION 13 OR 15(d) OF THE SECURITIES EXCHANGE ACT OF 1934 |
For the transition period from to
Commission File No. 001-36429
ARES MANAGEMENT CORPORATION
(Exact name of Registrant as specified in its charter) |
| | | | |
| Delaware | 80-0962035 |
(State or other jurisdiction of
incorporation or organization)
| (I.R.S. Employer
Identification Number)
|
2000 Avenue of the Stars,, 12th 12th Floor,, Los Angeles,, CA90067
(Address of principal executive office) (Zip Code)
(310) 201‑4100(310) 201-4100
(Registrant’s telephone number, including area code)
N/A
(Former name, former address and former fiscal year, if changed since last report)
Securities registered pursuant to Section 12(b) of the Act: |
| | | | | | | |
| Title of each class | Trading Symbol(s) | Name of each exchange on which registered |
| Class A common stock, par value $0.01 per share | ARES | New York Stock Exchange |
| 7.00% Series A Preferred Stock, par value $0.01 per share | ARES.PRA | New York Stock Exchange |
Indicate by check mark whether the registrant (1) has filed all reports required to be filed by Section 13 or 15(d) of the Securities Exchange Act of 1934 during the preceding 12 months (or for such shorter period that the registrant was required to file such reports), and (2) has been subject to such filing requirements for the past 90 days: Yes x No ¨
Indicate by check mark whether the registrant has submitted electronically every Interactive Data File required to be submitted pursuant to Rule 405 of Regulation S‑TS-T (§232.405 of this chapter) during the preceding 12 months (or for such shorter period that the registrant was required to submit such files). Yes x No ¨
Indicate by check mark whether the registrant is a large accelerated filer, an accelerated filer, a non‑acceleratednon-accelerated filer, a smaller reporting company, or an emerging growth company. See definitions of “large accelerated filer,” “accelerated filer,” “smaller reporting company.” and “emerging growth company” in Rule 12b‑212b-2 of the Exchange Act.
|
| | | | | | | | | | | | | | | | | | | | | | | | | | | | |
| Large Accelerated Filer | x | Accelerated Filer | ☐ | Non‑AcceleratedNon-Accelerated Filer | ☐ | Smaller Reporting Company | ☐ | Emerging Growth Company | ☐ |
If an emerging growth company, indicate by check mark if the registrant has elected not to use the extended transition period for complying with any new or revised financial accounting standards provided pursuant to Section 13(a) of the Exchange Act. ¨
Indicate by check mark whether the registrant is a shell company (as defined in Rule 12b‑212b-2 of the Exchange Act). Yes ☐ No x
As of July 29, 2019August 3, 2020 there were 107,486,372143,209,884 of the registrant’s shares of Class A common stock outstanding, 1,000 shares of the registrant's Class B common stock outstanding, and 1 share114,798,404 of the registrant's Class C common stock outstanding.
TABLE OF CONTENTS
Cautionary Note Regarding Forward‑LookingForward-Looking Statements
This report contains forward‑lookingforward-looking statements within the meaning of Section 27A of the Securities Act of 1933, as amended (the “Securities Act”), and Section 21E of the Securities Exchange Act of 1934, as amended (the “Exchange Act”), which reflect our current views with respect to, among other things, future events, operations and financial performance. You can identify these forward‑lookingforward-looking statements by the use of forward‑lookingforward-looking words such as “outlook,” “believes,” “expects,” “potential,” “continues,” “may,” “will,” “should,” “seeks,” “approximately,” “predicts,” “intends,” “plans,” “estimates,” “anticipates” or the negative version of those words, other comparable words or other statements that do not relate to historical or factual matters. The forward‑lookingforward-looking statements are based on our beliefs, assumptions and expectations of our future performance, taking into account all information currently available to us. Such forward‑lookingforward-looking statements are subject to various risks and uncertainties and assumptions relating to our operations, financial results, financial condition, business prospects, growth strategy and liquidity. Some of these factors are described in this report and in our Annual reportReport on Form 10-K for the year ended December 31, 2018,2019, under the headings “Management’s Discussion and Analysis of Financial Condition and Results of Operations” and “Risk Factors.”Factors”. These factors should not be construed as exhaustive and should be read in conjunction with the risk factors and other cautionary statements that are included in this report and in our other periodic filings. If one or more of these or other risks or uncertainties materialize, or if our underlying assumptions prove to be incorrect, our actual results may vary materially from those indicated in these forward‑lookingforward-looking statements. New risks and uncertainties arise over time, and it is not possible for us to predict those events or how they may affect us. Therefore, you should not place undue reliance on these forward‑lookingforward-looking statements. Any forward‑lookingforward-looking statement speaks only as of the date on which it is made. We do not undertake any obligation to publicly update or review any forward‑lookingforward-looking statement, whether as a result of new information, future developments or otherwise, except as required by law. For a discussion of risks resulting from the coronavirus (“COVID-19”) pandemic and the impact on the U.S. and global economy, along with the oil and gas market disruption, see “Item 1A. Risk Factors” in this Quarterly Report on Form 10-Q.
References in this Quarterly Report on Form 10-Q to the “Ares Operating Group” refer to, collectively, Ares Holdings L.P. (“Ares Holdings”), Ares Offshore Holdings L.P. (“Ares Offshore”) and Ares Investments L.P. (“Ares Investments”). References in this Quarterly Report on Form 10-Q to an “Ares Operating Group Unit” or an “AOG Unit” refer to, collectively, a partnership unit in each of the Ares Operating Group entities. The use of any defined term in this report to mean more than one entities, persons, securities or other items collectively is solely for convenience of reference and in no way implies that such entities, persons, securities or other items are one indistinguishable group. For example, notwithstanding the use of the defined terms “Ares,” “we” and “our” in this report to refer to Ares Management Corporation and its subsidiaries, each subsidiary of Ares Management Corporation is a standalone legal entity that is separate and distinct from Ares Management Corporation and any of its other subsidiaries.
Under generally accepted accounting principles in the United States (“GAAP”), we are required to consolidate (a) entities other than limited partnerships and entities similar to limited partnerships in which we hold a majority voting interest or have majority ownership and control over the operational, financial and investing decisions of that entity, including Ares‑affiliatesAres-affiliates and affiliated funds and co‑investmentco-investment entities, for which we are presumed to have controlling financial interests, and (b) entities that we concluded are variable interest entities (“VIEs”), including limited partnerships and collateralized loan obligations, for which we are deemed to be the primary beneficiary. When an entity is consolidated, we reflect the assets, liabilities, revenues, expenses and cash flows of the entity in our consolidated financial statements on a gross basis, subject to eliminations from consolidation, including the elimination of the management fees, performance income and other fees that we earn from the entity. However, the presentation of performance related compensation and other expenses associated with generating such revenues is not affected by the consolidation process. In addition, as a result of the consolidation process, the net income attributable to third‑partythird-party investors in consolidated entities is presented as net income attributable to non‑controllingnon-controlling interests in Consolidated Funds in our Condensed Consolidated Statements of Operations. We also consolidate joint ventures that we have established with third-party investors for strategic distribution partnerships. The results of these entities are reflected on a gross basis in the consolidated financial statements, subject to eliminations from consolidation, and net income attributable to third-party investors in the consolidated joint ventures is included in net income attributable to non-controlling interests in Ares Operating Group entities.
In this quarterly reportQuarterly Report on Form 10-Q, in addition to presenting our results on a consolidated basis in accordance with GAAP, we present revenues, expenses and other results on a (i) “segment basis,” which deconsolidates these entitiesthe consolidated funds and removes the proportional results attributable to third-party investors in the consolidated joint ventures, and therefore shows the results of our reportable segments without giving effect to the consolidation of thethese entities and (ii) “Unconsolidated Reporting“unconsolidated reporting basis,” which shows the results of our reportable segments on a combined segment basis together with our Operations Management Group. In addition to our threereportable segments, we have an Operations Management Group (the “OMG”) that. The OMG consists of shared resource groups to support our reportable segments by providing infrastructure and administrative support in the areas of accounting/finance, operations, information technology, strategy and relationship management, legal, compliance and human resources. The OMG’s expenses are not allocated to our three reportable segments but we consider the cost
structure of the OMG when evaluating our financial performance. This information constitutes non‑GAAPnon-GAAP financial information within the meaning of Regulation G, as promulgated by the SEC. Our management uses this information to assess the performance of our reportable segments and ourthe OMG, and we believe that this information enhances the ability of shareholders to analyze our performance. For more information, see “Notes to the Condensed Consolidated Financial Statements - Note 14. Segment Reporting.”
Glossary
When used in this report, unless the context otherwise requires:
•“ARCC Part I Fees” refers to a quarterly performance income on the net investment income of Ares Capital Corporation (NASDAQ: ARCC) (“ARCC”). Such fees from ARCC are classified as management fees as they are paid quarterly, predictable and recurring in nature, are not subject to contingent repayment and are typically cash settledgenerally cash-settled each quarter;quarter, unless subject to a payment deferral;
•“ARCC Part II Fees” refers to fees that are paid in arrears as of the end of each calendar year when the cumulative aggregate realized capital gains exceed the cumulative aggregate realized capital losses and aggregate unrealized capital depreciation, less the aggregate amount of ARCC Part II Fees paid in all prior years since inception;
•“Ares”, “the Company”the “Company”, “we”, “us” and “our” refer to (i) Ares Management Corporation and its subsidiaries following the Conversion and (ii) Ares Management, L.P. and its subsidiaries prior to the Conversion;subsidiaries;
•“Ares Operating Group Unit” or an “AOG Unit” refers to, collectively, a partnership unit in each of the Ares Operating Group entities;
•“assets under management” or “AUM” refers to the assets we manage. For our funds other than CLOs, our AUM represents the sum of the net asset value ("NAV") of such funds, the drawn and undrawn debt (at the fund‑levelfund-level including amounts subject to restrictions) and uncalled committed capital (including commitments to funds that have yet to commence their investment periods). NAV refers to the fair value of the assets of a fund less the liabilities of the fund. For our funds that are CLOs, our AUM is equal to initial principal amounts adjusted for paydowns;
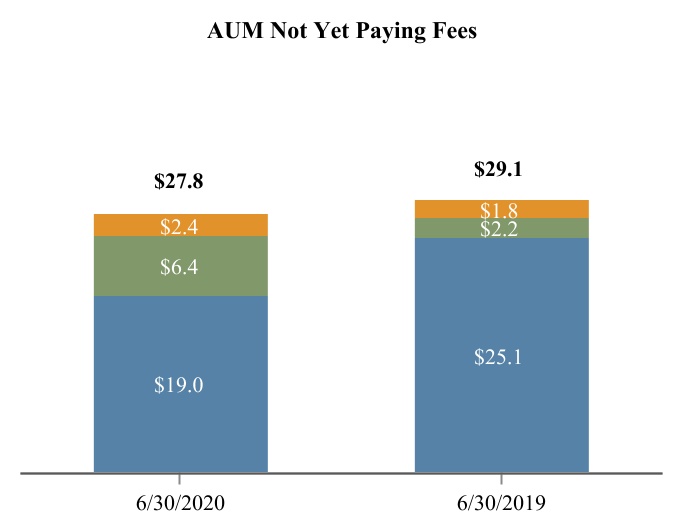
•“AUM not yet paying fees” (also referred to as "shadow AUM") refers to AUM that is not currently paying fees and is eligible to earn management fees upon deployment;
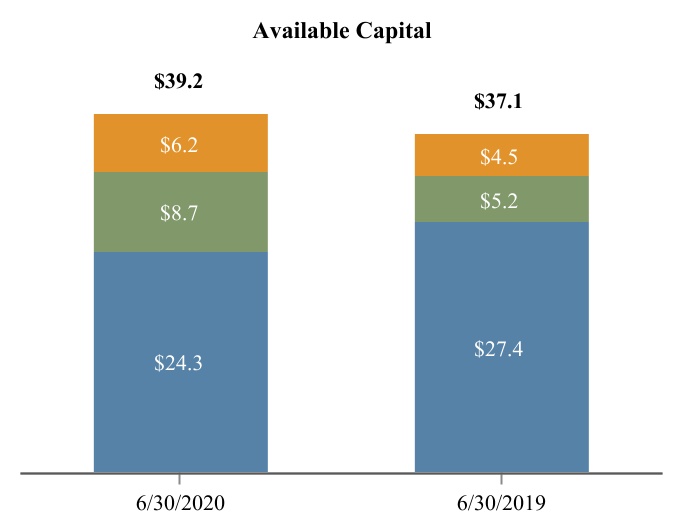
•“available capital” (also referred to as “dry powder”) is comprised of uncalled committed capital and undrawn amounts under credit facilities and may include AUM that may be canceled or not otherwise available to invest;
•“Class B membership interests” refers to the interests that were retained by the former owners of Crestline Denali Capital LLC and represent the financial interests in the subordinated notes of the CLOs;
•“CLOs” refers to “our funds” that are structured as collateralized loan obligations;
“Conversion” refers to our conversion effective November 26, 2018 from a Delaware limited partnership named Ares Management, L.P. into a Delaware corporation named Ares Management Corporation;
•“Consolidated Funds” refers collectively to certain Ares‑affiliatedAres-affiliated funds, related co‑investmentco-investment entities and certain CLOs that are required under GAAP to be consolidated in our consolidated financial statements;
“Co‑Founders” refers to Michael Arougheti, David Kaplan, John Kissick, Antony Ressler and Bennett Rosenthal;
•“Credit Facility” refers to the revolving credit facility of the Ares Operating Group;
•“effective management fee rate” represents the annualized fees divided by the average fee paying AUM for the period, excluding the impact of one-time catch-up fees;
•“fee paying AUM” or “FPAUM” refers to the AUM from which we directly earn management fees. Fee paying AUMFPAUM is equal to the sum of all the individual fee bases of our funds that directly contribute to our management fees;
•“fee related earnings” or “FRE”, a non-GAAP measure, is used to assess core operating performance by determining whether recurring revenue, primarily consisting of management fees, is sufficient to cover operating expenses and to generate profits. FRE differs from income before taxes computed in accordance with GAAP as it excludes performance income, performance related compensation, investment income from our Consolidated Funds and non-consolidated funds and certain other items that we believe are not indicative of our core operating performance;
•“GAAP” refers to accounting principles generally accepted in the United States of America;
•“Holdco Members” refers to Michael Arougheti, David Kaplan, Antony Ressler, Bennett Rosenthal, Ryan Berry, R. Kipp deVeer and Michael McFerran;
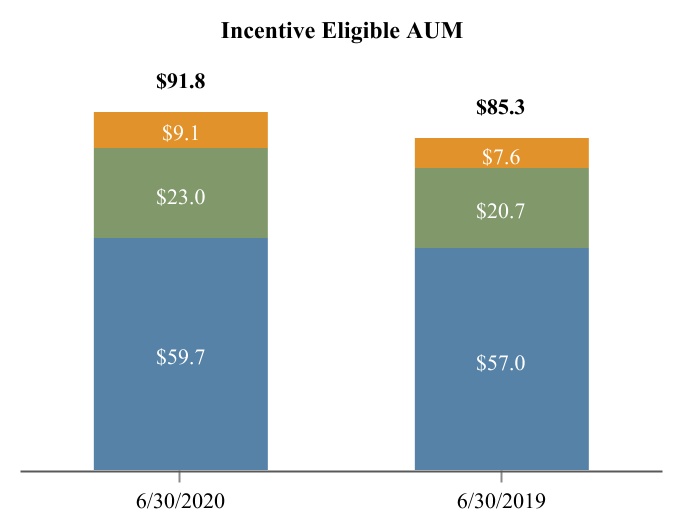
•“Incentive eligible AUM” or “IEAUM” refers to the AUM of our funds from which performance income may be generated, regardless of whether or not they are currently generating performance income. It generally represents the NAV plus uncalled equity or total assets plus uncalled debt, as applicable, of our funds for which we are entitled to receive a performance income, excluding capital committed by us and our professionals (from which we generally do not earn performance income). With respect to ARCC's AUM, only ARCC Part II Fees may be generated from IEAUM;
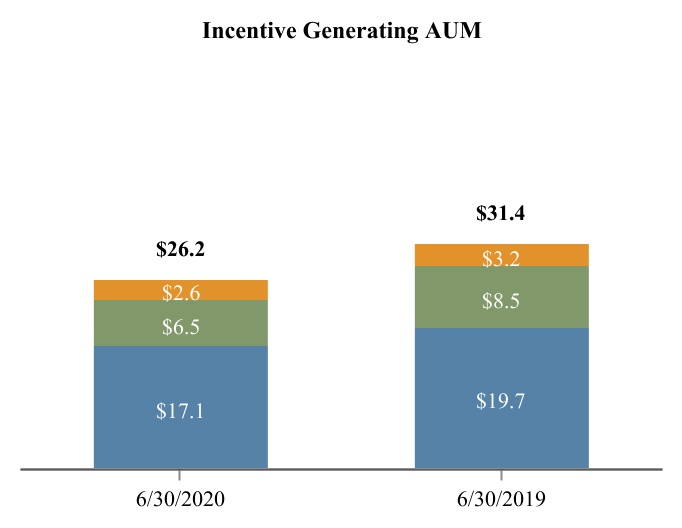
•“Incentive generating AUM” or “IGAUM” refers to the AUM of our funds that are currently generating performance income on a realized or unrealized basis, performance income.basis. It generally represents the NAV or total assets of our funds, as applicable, for which we are entitled to receive performance income, excluding capital committed by us and our professionals (from which we generally do not earn performance income). With respect to ARCC's AUM,ARCC is only included in IGAUM when ARCC Part II Fees may be generated from IGAUM;are being generated;
•“management fees” refers to fees we earn for advisory services provided to our funds, which are generally based on a defined percentage of fair value of assets, total commitments, invested capital, net asset value, net investment income, total assets or par value of the investment portfolios managed by us and also include ARCC Part I Fees that are classified as management fees as they are predictable and recurring in nature, not subject to contingent repayment and generally cash‑settled each quarter;Fees;
•“net inflows of capital” refers to net new commitments during the period, including equity and debt commitments and gross inflows into our open-ended managed accounts and sub-advised accounts, as well as new debt and equity offeringsissuances by our publicly traded vehicles minus redemptions from our open-ended funds, managed accounts and sub-advised accounts;
•“net performance income” refers to performance income net of performance related compensation. Performance related compensation which is the portion of the performance income earned from certain funds that is payable to our professionals;
•“our funds” refers to the funds, alternative asset companies, co-investment vehicles and other entities and accounts that are managed or co‑managedco-managed by the Ares Operating Group, and which are structured to pay fees. It also includes funds managed by Ivy Hill Asset Management, L.P., a wholly owned portfolio company of ARCC and a registered investment adviser;
•“performance income” refers to income we earn based on the performance of a fund that is generally based on certain specific hurdle rates as defined in the fund’s investment management or partnership agreements and may be either an incentive fee or carried interest;
•“permanent capital” refers to capital of our funds that do not have redemption provisions or a requirement to return capital to investors upon exiting the investments made with such capital, except as required by applicable law. Such funds currently consist of ARCC, Ares Commercial Real Estate Corporation (“ACRE”) and Ares Dynamic Credit Allocation Fund, Inc. (“ARDC”). Such funds may be required, or elect, to return all or a portion of capital gains and investment income;
“performance income” refers to income we earn based on the performance of a fund, that is generally based on certain specific hurdle rates as defined in the fund’s investment management or partnership agreements and may be either an incentive fee or carried interest;
•“realized income” or “RI”, a non-GAAP measure, is an operating metric used by management to evaluate performance of the business based on operating performance and the contribution of each of the business segments to that performance, while removing the fluctuations of unrealized income and expense,losses, which may or may not be eventually realized at the levels presented and whose realizations depend more on future outcomes than current business operations. RI differs from net income by excluding (a) income tax expense, (b) operating results of our Consolidated Funds, (c) depreciation and amortization expense, (d) the effects of changes arising from corporate actions, (e) unrealized gains and losses related to performance income and investment performance and (f) certain other items that we believe are not indicative of our operating performance. Changes arising from corporate actions include equity-based compensation expenses, the amortization of intangible assets, transaction
costs associated with mergers, acquisitions and capital transactions, underwriting costs and expenses incurred in connection with corporate reorganization.reorganization;
•“SEC” refers to the Securities and Exchange Commission;
•“Senior Notes” or the "AFC Notes" refers to senior notes issued by a wholly owned subsidiary of Ares Holdings;
"Series A Preferred Stock"Stock” refers to the preferred stock, $0.01 par value per share, of the Company designated as 7.00% Series A Preferred Stock; and
•“Term Loans”2024 Senior Notes” refers to term loans heldsenior notes issued by a wholly owned subsidiariessubsidiary of Ares Management LLC (“AM LLC”).Holdings in October 2014 with a maturity in October 2024; and
•“2030 Senior Notes” refers to senior notes issued by a wholly owned subsidiary of Ares Holdings in June 2020 with a maturity in June 2030.
References in this Quarterly Report on Form 10-Q to (1) “common shares” and “preferred shares” refer to shares of our Class A common stock and the Series A Preferred Stock, respectively, previously outstanding prior to our Conversion and (2) “common shareholders” and “preferred shareholders” refer to holders of shares of our Class A common stock and shares of the Series A Preferred Stock, respectively, prior to our Conversion.
Many of the terms used in this report, including AUM, FPAUM, FRE and RI, may not be comparable to similarly titled measures used by other companies. In addition, our definitions of AUM and FPAUM are not based on any definition of AUM or FPAUM that is set forth in the agreements governing the investment funds that we manage and may differ from definitions of AUM or FPAUM set forth in other agreements to which we are a party or definitions used by the SEC or other regulatory bodies. Further, FRE and RI are not measures of performance calculated in accordance with GAAP. We use FRE and RI as measures of operating performance, not as measures of liquidity. FRE and RI should not be considered in isolation or as substitutes for operating income, net income, operating cash flows, or other income or cash flow statement data prepared in accordance with GAAP. The use of FRE and RI without consideration of related GAAP measures is not adequate due to the adjustments described above. Our management compensates for these limitations by using FRE and RI as supplemental measures to our GAAP results. We present these measures to provide a more complete understanding of our performance as our management measures it. Amounts and percentages throughout this report may reflect rounding adjustments and consequently totals may not appear to sum.
PART I—FINANCIAL INFORMATION
Item 1. Financial Statements
Ares Management Corporation
Condensed Consolidated Statements of Financial Condition
(Amounts in Thousands, Except Share Data)
| | | | | | | | | | | |
| As of June 30, | | As of December 31, |
| | 2020 | | 2019 |
| (unaudited) | | |
| Assets | | | |
| Cash and cash equivalents | $ | 890,040 | | | $ | 138,384 | |
| Investments (includes accrued carried interest of $1,003,827 and $1,134,967 at June��30, 2020 and December 31, 2019, respectively) | 1,479,487 | | | 1,663,664 | |
| Due from affiliates | 258,126 | | | 268,099 | |
| Other assets | 368,696 | | | 341,293 | |
| Right-of-use operating lease assets | 140,041 | | | 143,406 | |
| Assets of Consolidated Funds: | | | |
| Cash and cash equivalents | 258,400 | | | 606,321 | |
| Investments, at fair value | 10,005,632 | | | 8,727,947 | |
| Due from affiliates | 7,201 | | | 6,192 | |
| Receivable for securities sold | 276,692 | | | 88,809 | |
| Other assets | 35,642 | | | 30,081 | |
| Total assets | $ | 13,719,957 | | | $ | 12,014,196 | |
| Liabilities | | | |
| Accounts payable, accrued expenses and other liabilities | $ | 104,017 | | | $ | 88,173 | |
| Accrued compensation | 123,123 | | | 37,795 | |
| Due to affiliates | 61,025 | | | 71,445 | |
| Performance related compensation payable | 715,181 | | | 829,764 | |
| Debt obligations | 642,474 | | | 316,609 | |
| Operating lease liabilities | 164,521 | | | 168,817 | |
| Liabilities of Consolidated Funds: | | | |
| Accounts payable, accrued expenses and other liabilities | 60,975 | | | 61,857 | |
| Payable for securities purchased | 449,169 | | | 500,146 | |
| CLO loan obligations, at fair value | 9,228,687 | | | 7,973,748 | |
| Fund borrowings | 167,037 | | | 107,244 | |
| Total liabilities | 11,716,209 | | | 10,155,598 | |
| Commitments and contingencies | | | |
| Non-controlling interest in Consolidated Funds | 506,201 | | | 618,020 | |
| Non-controlling interest in Ares Operating Group entities | 552,490 | | | 472,288 | |
| Stockholders' Equity | | | |
| Series A Preferred Stock, $0.01 par value, 1,000,000,000 shares authorized (12,400,000 shares issued and outstanding at June 30, 2020 and December 31, 2019) | 298,761 | | | 298,761 | |
| Class A common stock, $0.01 par value, 1,500,000,000 shares authorized (135,335,943 shares and 115,242,028 shares issued and outstanding at June 30, 2020 and December 31, 2019, respectively) | 1,353 | | | 1,152 | |
| | | |
| Class B common stock, $0.01 par value, 1,000 shares authorized (1,000 shares issued and outstanding at June 30, 2020 and December 31, 2019) | — | | | — | |
| Class C common stock, $0.01 par value, 499,999,000 shares authorized (114,798,404 shares and 1 share issued and outstanding at June 30, 2020 and December 31, 2019, respectively) | 1,148 | | | — | |
| Additional paid-in-capital | 800,077 | | | 525,244 | |
| Retained earnings | (145,045) | | | (50,820) | |
| Accumulated other comprehensive loss, net of tax | (11,237) | | | (6,047) | |
| Total stockholders' equity | 945,057 | | | 768,290 | |
| Total equity | 2,003,748 | | | 1,858,598 | |
| Total liabilities, non-controlling interests and equity | $ | 13,719,957 | | | $ | 12,014,196 | |
|
| | | | | | | |
| | As of June 30, | | As of December 31, |
| | 2019 | | 2018 |
| | (unaudited) | | |
| Assets | |
| | |
|
| Cash and cash equivalents | $ | 247,220 |
| | $ | 110,247 |
|
| Investments (includes accrued carried interest of $1,071,954 and $841,079, at June 30, 2019 and December 31, 2018, respectively) | 1,566,042 |
| | 1,326,137 |
|
| Due from affiliates | 234,081 |
| | 199,377 |
|
| Other assets | 358,091 |
| | 377,651 |
|
| Right-of-use operating lease assets | 152,579 |
| | — |
|
| Assets of Consolidated Funds: | | | |
| Cash and cash equivalents | 376,328 |
| | 384,644 |
|
| Investments, at fair value | 7,926,615 |
| | 7,673,165 |
|
| Due from affiliates | 15,888 |
| | 17,609 |
|
| Receivable for securities sold | 76,993 |
| | 42,076 |
|
| Other assets | 25,912 |
| | 23,786 |
|
| Total assets | $ | 10,979,749 |
| | $ | 10,154,692 |
|
| Liabilities | | | |
| Accounts payable, accrued expenses and other liabilities | $ | 76,838 |
| | $ | 83,221 |
|
| Accrued compensation | 114,936 |
| | 29,389 |
|
| Due to affiliates | 65,527 |
| | 82,411 |
|
| Performance related compensation payable | 772,592 |
| | 641,737 |
|
| Debt obligations | 566,277 |
| | 480,952 |
|
| Right-of-use operating lease liabilities | 179,192 |
| | — |
|
| Liabilities of Consolidated Funds: | | | |
| Accounts payable, accrued expenses and other liabilities | 75,647 |
| | 83,876 |
|
| Payable for securities purchased | 369,465 |
| | 471,390 |
|
| CLO loan obligations, at fair value | 7,030,841 |
| | 6,678,091 |
|
| Fund borrowings | 126,110 |
| | 209,284 |
|
| Total liabilities | 9,377,425 |
| | 8,760,351 |
|
| Commitments and contingencies |
| |
|
| Non-controlling interest in Consolidated Funds | 613,943 |
| | 503,637 |
|
| Non-controlling interest in Ares Operating Group entities | 352,882 |
| | 302,780 |
|
| Stockholders' Equity | | | |
| Series A Preferred Stock, $0.01 par value, 1,000,000,000 shares authorized (12,400,000 shares issued and outstanding at June 30, 2019 and December 31, 2018) | 298,761 |
| | 298,761 |
|
| Class A common stock, $0.01 par value, 1,500,000,000 shares authorized (107,458,309 shares and 101,594,095 shares issued and outstanding at June 30, 2019 and at December 31, 2018, respectively) | 1,075 |
| | 1,016 |
|
| Class B common stock, $0.01 par value, 1,000 shares authorized (1,000 shares issued and outstanding at June 30, 2019 and at December 31, 2018) | — |
| | — |
|
| Class C common stock, $0.01 par value, 499,999,000 shares authorized (1 share issued and outstanding at June 30, 2019 and at December 31, 2018) | — |
| | — |
|
| Additional paid-in-capital | 379,789 |
| | 326,007 |
|
| Retained earnings | (35,247 | ) | | (29,336 | ) |
| Accumulated other comprehensive loss, net of tax | (8,879 | ) | | (8,524 | ) |
| Total stockholders' equity | 635,499 |
| | 587,924 |
|
| Total equity | 1,602,324 |
| | 1,394,341 |
|
| Total liabilities, non-controlling interests and equity | $ | 10,979,749 |
| | $ | 10,154,692 |
|
See accompanying notes to the condensed consolidated financial statements.
Ares Management Corporation
Condensed Consolidated Statements of Operations
(Amounts in Thousands, Except Share Data)
(unaudited)
| | | | | | | | | | | | | | | | | | | | | | | | | |
| | Three months ended June 30, | | | | Six months ended June 30, | | | | |
| | 2020 | | 2019 | | 2020 | | 2019 | | |
| Revenues | | | | | | | | | |
| Management fees (includes ARCC Part I Fees of $41,306, $85,229 and $39,157, $77,550 for the three and six months ended June 30, 2020 and 2019, respectively) | $ | 266,867 | | | $ | 237,846 | | | $ | 530,716 | | | $ | 462,505 | | | |
| Carried interest allocation | 303,278 | | | 119,712 | | | 72,402 | | | 317,005 | | | |
| Incentive fees | 331 | | | 10,220 | | | (2,918) | | | 27,035 | | | |
| Principal investment income (loss) | 23,645 | | | 5,844 | | | (3,078) | | | 34,603 | | | |
| Administrative, transaction and other fees | 8,637 | | | 11,200 | | | 19,045 | | | 20,871 | | | |
| Total revenues | 602,758 | | | 384,822 | | | 616,167 | | | 862,019 | | | |
| Expenses | | | | | | | | | |
| Compensation and benefits | 185,131 | | | 162,170 | | | 365,215 | | | 319,016 | | | |
| Performance related compensation | 237,108 | | | 92,688 | | | 69,209 | | | 249,208 | | | |
| General, administrative and other expenses | 58,084 | | | 65,416 | | | 120,415 | | | 116,603 | | | |
| | | | | | | | | |
| Expenses of Consolidated Funds | 3,244 | | | 15,427 | | | 10,687 | | | 19,981 | | | |
| Total expenses | 483,567 | | | 335,701 | | | 565,526 | | | 704,808 | | | |
| Other income (expense) | | | | | | | | | |
| Net realized and unrealized gains (losses) on investments | 290 | | | 521 | | | (7,744) | | | 3,997 | | | |
| Interest and dividend income | 1,978 | | | 1,652 | | | 3,768 | | | 3,496 | | | |
| Interest expense | (6,082) | | | (5,793) | | | (11,388) | | | (11,382) | | | |
| Other income, net | 2,181 | | | 4,797 | | | 7,645 | | | 300 | | | |
| Net realized and unrealized gains (losses) on investments of Consolidated Funds | 83,522 | | | (116) | | | (171,239) | | | 4,248 | | | |
| Interest and other income of Consolidated Funds | 116,314 | | | 102,206 | | | 229,539 | | | 195,390 | | | |
| Interest expense of Consolidated Funds | (76,297) | | | (68,005) | | | (156,538) | | | (132,917) | | | |
| Total other income (expense) | 121,906 | | | 35,262 | | | (105,957) | | | 63,132 | | | |
| Income (loss) before taxes | 241,097 | | | 84,383 | | | (55,316) | | | 220,343 | | | |
| Income tax expense | 24,421 | | | 9,505 | | | 3,805 | | | 23,889 | | | |
| Net income (loss) | 216,676 | | | 74,878 | | | (59,121) | | | 196,454 | | | |
| Less: Net income (loss) attributable to non-controlling interests in Consolidated Funds | 85,186 | | | 8,346 | | | (81,220) | | | 25,970 | | | |
| Less: Net income (loss) attributable to non-controlling interests in Ares Operating Group entities | 75,119 | | | 34,393 | | | (3,236) | | | 93,396 | | | |
| Net income attributable to Ares Management Corporation | 56,371 | | | 32,139 | | | 25,335 | | | 77,088 | | | |
| Less: Series A Preferred Stock dividends paid | 5,425 | | | 5,425 | | | 10,850 | | | 10,850 | | | |
| Net income attributable to Ares Management Corporation Class A common stockholders | $ | 50,946 | | | $ | 26,714 | | | $ | 14,485 | | | $ | 66,238 | | | |
| Net income per share of Class A common stock: | | | | | | | | | |
| Basic | $ | 0.36 | | | $ | 0.24 | | | $ | 0.08 | | | $ | 0.60 | | | |
| Diluted | $ | 0.35 | | | $ | 0.23 | | | $ | 0.08 | | | $ | 0.58 | | | |
| Weighted-average shares of Class A common stock: | | | | | | | | | |
| Basic | 133,639,194 | | | 105,188,966 | | | 126,002,867 | | | 104,054,035 | | | |
| Diluted | 146,904,357 | | | 116,603,887 | | | 126,002,867 | | | 113,657,864 | | | |
|
| | | | | | | | | | | | | | | |
| | Three Months Ended June 30, | | Six Months Ended June 30, |
| | 2019 | | 2018 | | 2019 | | 2018 |
| Revenues | | | | | | | |
| Management fees (includes ARCC Part I Fees of $39,157, $77,550 and $29,866, $58,283 for the three and six months ended June 30, 2019 and 2018, respectively) | $ | 237,846 |
| | $ | 194,032 |
| | $ | 462,505 |
| | $ | 383,547 |
|
| Carried interest allocation | 119,712 |
| | (13,444 | ) | | 317,005 |
| | 40,685 |
|
| Incentive fees | 10,220 |
| | 7,740 |
| | 27,035 |
| | 12,811 |
|
| Principal investment income | 5,844 |
| | 1,871 |
| | 34,603 |
| | 6,780 |
|
| Administrative, transaction and other fees | 11,200 |
| | 13,964 |
| | 20,871 |
| | 26,429 |
|
| Total revenues | 384,822 |
| | 204,163 |
| | 862,019 |
| | 470,252 |
|
| Expenses | | | | | | | |
| Compensation and benefits | 162,170 |
| | 138,992 |
| | 319,016 |
| | 273,631 |
|
| Performance related compensation | 92,688 |
| | (13,005 | ) | | 249,208 |
| | 12,873 |
|
| General, administrative and other expenses | 65,416 |
| | 59,918 |
| | 116,603 |
| | 104,368 |
|
| Expenses of Consolidated Funds | 15,427 |
| | 35,112 |
| | 19,981 |
| | 36,428 |
|
| Total expenses | 335,701 |
| | 221,017 |
| | 704,808 |
| | 427,300 |
|
| Other income (expense) | | | | | | | |
| Net realized and unrealized gain on investments | 521 |
| | 3,267 |
| | 3,997 |
| | 2,428 |
|
| Interest and dividend income | 1,652 |
| | 2,356 |
| | 3,496 |
| | 5,703 |
|
| Interest expense | (5,793 | ) | | (6,076 | ) | | (11,382 | ) | | (12,945 | ) |
| Other income (expense), net | 4,797 |
| | (1,987 | ) | | 300 |
| | (2,298 | ) |
| Net realized and unrealized gain (loss) on investments of Consolidated Funds | (116 | ) | | 34,487 |
| | 4,248 |
| | 21,402 |
|
| Interest and other income of Consolidated Funds | 102,206 |
| | 92,633 |
| | 195,390 |
| | 157,055 |
|
| Interest expense of Consolidated Funds | (68,005 | ) | | (56,754 | ) | | (132,917 | ) | | (101,179 | ) |
| Total other income | 35,262 |
| | 67,926 |
| | 63,132 |
| | 70,166 |
|
| Income before taxes | 84,383 |
| | 51,072 |
| | 220,343 |
|
| 113,118 |
|
| Income tax expense | 9,505 |
| | 36,903 |
| | 23,889 |
| | 24,528 |
|
| Net income | 74,878 |
| | 14,169 |
| | 196,454 |
| | 88,590 |
|
| Less: Net income attributable to non-controlling interests in Consolidated Funds | 8,346 |
| | 9,882 |
| | 25,970 |
| | 10,249 |
|
| Less: Net income attributable to non-controlling interests in Ares Operating Group entities | 34,393 |
| | 16,062 |
| | 93,396 |
| | 49,168 |
|
| Net income (loss) attributable to Ares Management Corporation | 32,139 |
| | (11,775 | ) | | 77,088 |
|
| 29,173 |
|
| Less: Series A Preferred Stock dividends paid | 5,425 |
| | 5,425 |
| | 10,850 |
| | 10,850 |
|
| Net income (loss) attributable to Ares Management Corporation Class A common stockholders | $ | 26,714 |
| | $ | (17,200 | ) | | $ | 66,238 |
|
| $ | 18,323 |
|
| Net income (loss) attributable to Ares Management Corporation per share of Class A common stock: | | | | | | | |
| Basic | $ | 0.24 |
| | $ | (0.20 | ) | | $ | 0.60 |
| | $ | 0.16 |
|
| Diluted | $ | 0.23 |
| | $ | (0.20 | ) | | $ | 0.58 |
| | $ | 0.16 |
|
Weighted-average shares of Class A common stock:(1) | | | | | | | |
| Basic | 105,188,966 |
| | 98,037,252 |
| | 104,054,035 |
| | 91,861,946 |
|
| Diluted | 116,603,887 |
| | 98,037,252 |
| | 113,657,864 |
| | 91,861,946 |
|
Dividend declared and paid per share of Class A common stock(1) | $ | 0.32 |
| | $ | 0.37 |
| | $ | 0.64 |
| | $ | 0.77 |
|
(1) Three and six months ended June 30, 2018 represents common units.
Substantially all revenue is earned from affiliated funds of the Company. See accompanying notes to the condensed consolidated financial statements.
Ares Management Corporation
Condensed Consolidated Statements of Comprehensive Income
(Amounts in Thousands)
(unaudited)
|
| | | | | | | | | | | | | | | |
| | Three Months Ended June 30, | | Six Months Ended June 30, |
| | 2019 | | 2018 | | 2019 | | 2018 |
| Net income | $ | 74,878 |
| | $ | 14,169 |
| | $ | 196,454 |
| | $ | 88,590 |
|
| Other comprehensive income: | | | | | | | |
| Foreign currency translation adjustments, net of tax | (1,991 | ) | | (12,377 | ) | | (907 | ) | | (6,892 | ) |
| Total comprehensive income | 72,887 |
| | 1,792 |
| | 195,547 |
| | 81,698 |
|
| Less: Comprehensive income attributable to non-controlling interests in Consolidated Funds | 9,852 |
| | 4,193 |
| | 25,817 |
| | 7,735 |
|
| Less: Comprehensive income attributable to non-controlling interests in Ares Operating Group entities | 32,535 |
| | 12,131 |
| | 92,997 |
| | 47,340 |
|
| Comprehensive income (loss) attributable to Ares Management Corporation | $ | 30,500 |
|
| $ | (14,532 | ) | | $ | 76,733 |
| | $ | 26,623 |
|
| | | | | | | | | | | | | | | | | | | | | | | | | | |
| Three months ended June 30, | | | | Six months ended June 30, | | | | | |
| | 2020 | | 2019 | | 2020 | | 2019 | | | |
| | | | | | | | | | |
| Net income (loss) | $ | 216,676 | | | $ | 74,878 | | | $ | (59,121) | | | $ | 196,454 | | | | |
| Other comprehensive income (loss): | | | | | | | | | | |
| Foreign currency translation adjustments, net of tax | 2,687 | | | (1,991) | | | (11,521) | | | (907) | | | | |
| Total comprehensive income (loss) | 219,363 | | | 72,887 | | | (70,642) | | | 195,547 | | | | |
| Less: Comprehensive income (loss) attributable to non-controlling interests in Consolidated Funds | 88,315 | | | 9,852 | | | (82,778) | | | 25,817 | | | | |
| Less: Comprehensive income (loss) attributable to non-controlling interests in Ares Operating Group entities | 75,065 | | | 32,535 | | | (8,009) | | | 92,997 | | | | |
| Comprehensive income attributable to Ares Management Corporation | $ | 55,983 | | | $ | 30,500 | | | $ | 20,145 | | | $ | 76,733 | | | | |
See accompanying notes to the condensed consolidated financial statements.
Ares Management Corporation
Condensed Consolidated Statements of Changes in Equity
(Amounts in Thousands)
(unaudited)
| | | | | | | | | | | | | | | | | | | | | | | | | | | | | | | | | | | | | | | | | | | | | | | | | | | | | |
| Series A Preferred Stock | | Class A Common Stock | | Class C Common Stock | | Additional Paid-in-Capital | | Retained Earnings | | Accumulated Other Comprehensive Income (loss) | | Non-Controlling Interest in Ares Operating Group Entities | | Non-Controlling Interest in Consolidated Funds | | Total Equity |
| Balance at December 31, 2019 | $ | 298,761 | | | $ | 1,152 | | | $ | — | | | $ | 525,244 | | | $ | (50,820) | | | $ | (6,047) | | | $ | 472,288 | | | $ | 618,020 | | | $ | 1,858,598 | |
| Consolidation and deconsolidation of funds, net | — | | | — | | | — | | | — | | | — | | | — | | | — | | | (3,882) | | | (3,882) | |
| Changes in ownership interests and related tax benefits | — | | | 40 | | | — | | | (196,670) | | | — | | | — | | | 122,551 | | | — | | | (74,079) | |
| Issuances of common stock | — | | | 121 | | | 1,152 | | | 382,061 | | | — | | | — | | | — | | | — | | | 383,334 | |
| Capital contributions | — | | | — | | | — | | | — | | | — | | | — | | | 42,012 | | | 133,265 | | | 175,277 | |
| Dividends/Distributions | (5,425) | | | — | | | — | | | — | | | (51,090) | | | — | | | (55,748) | | | (13,492) | | | (125,755) | |
| Net loss | 5,425 | | | — | | | — | | | — | | | (36,461) | | | — | | | (78,355) | | | (166,406) | | | (275,797) | |
| Currency translation adjustment, net of tax | — | | | — | | | — | | | — | | | — | | | (4,802) | | | (4,719) | | | (4,687) | | | (14,208) | |
| Equity compensation | — | | | — | | | — | | | 16,420 | | | — | | | — | | | 16,137 | | | — | | | 32,557 | |
| Stock option exercises | — | | | 11 | | | — | | | 19,540 | | | — | | | — | | | — | | | — | | | 19,551 | |
| Balance at March 31, 2020 | 298,761 | | | 1,324 | | | 1,152 | | | 746,595 | | | (138,371) | | | (10,849) | | | 514,166 | | | 562,818 | | | 1,975,596 | |
| Consolidation and deconsolidation of funds, net | — | | | — | | | — | | | — | | | — | | | — | | | — | | | 1,475 | | | 1,475 | |
| Changes in ownership interests and related tax benefits | — | | | 4 | | | (4) | | | (9,702) | | | — | | | — | | | 9,796 | | | — | | | 94 | |
| Expenses incurred upon issuance of common stock | — | | | — | | | — | | | (181) | | | — | | | — | | | — | | | — | | | (181) | |
| Capital contributions | — | | | — | | | — | | | — | | | — | | | — | | | 229 | | | (9,570) | | | (9,341) | |
| Dividends/Distributions | (5,425) | | | — | | | — | | | — | | | (57,620) | | | — | | | (59,949) | | | (136,837) | | | (259,831) | |
| Net income | 5,425 | | | — | | | — | | | — | | | 50,946 | | | — | | | 75,119 | | | 85,186 | | | 216,676 | |
| Currency translation adjustment, net of tax | — | | | — | | | — | | | — | | | — | | | (388) | | | (54) | | | 3,129 | | | 2,687 | |
| Equity compensation | — | | | — | | | — | | | 15,500 | | | — | | | — | | | 13,183 | | | — | | | 28,683 | |
| Stock option exercises | — | | | 25 | | | — | | | 47,865 | | | — | | | — | | | — | | | — | | | 47,890 | |
| Balance at June 30, 2020 | $ | 298,761 | | | $ | 1,353 | | | $ | 1,148 | | | $ | 800,077 | | | $ | (145,045) | | | $ | (11,237) | | | $ | 552,490 | | | $ | 506,201 | | | $ | 2,003,748 | |
|
| | | | | | | | | | | | | | | | | | | | | | | | | | | | | | | |
| | Series A Preferred Stock | | Class A Common Stock | | Additional Paid-in-Capital | | Retained Earnings | | Accumulated
Other
Comprehensive
Income (loss) | | Non-Controlling
Interest in
Ares Operating
Group Entities | | Non-Controlling
Interest in Consolidated
Funds | | Total
Equity |
| Balance at December 31, 2018 | $ | 298,761 |
| | $ | 1,016 |
| | $ | 326,007 |
| | $ | (29,336 | ) | | $ | (8,524 | ) | | $ | 302,780 |
| | $ | 503,637 |
| | $ | 1,394,341 |
|
| Relinquished with deconsolidation of funds | — |
| | — |
| | — |
| | — |
| | — |
| | — |
| | (55 | ) | | (55 | ) |
| Changes in ownership interests and related tax benefits | — |
| | 15 |
| | (6,339 | ) | | — |
| | — |
| | (12,073 | ) | | — |
| | (18,397 | ) |
| Contributions | — |
| | — |
| | — |
| | — |
| | — |
| | 1,876 |
| | 54,035 |
| | 55,911 |
|
| Dividends/Distributions | (5,425 | ) | | — |
| | — |
| | (35,367 | ) | | — |
| | (40,112 | ) | | (20,736 | ) | | (101,640 | ) |
| Net income | 5,425 |
| | — |
| | — |
| | 39,524 |
| | — |
| | 59,003 |
| | 17,624 |
| | 121,576 |
|
| Currency translation adjustment | — |
| | — |
| | — |
| | — |
| | 1,284 |
| | 1,459 |
| | (1,659 | ) | | 1,084 |
|
| Equity compensation | — |
| | — |
| | 12,637 |
| | — |
| | — |
| | 14,367 |
| | — |
| | 27,004 |
|
| Balance at March 31, 2019 | 298,761 |
| | 1,031 |
| | 332,305 |
| | (25,179 | ) | | (7,240 | ) | | 327,300 |
| | 552,846 |
| | 1,479,824 |
|
| Changes in ownership interests and related tax benefits | — |
| | 5 |
| | (32,128 | ) | | — |
| | — |
| | 20,615 |
| | — |
| | (11,508 | ) |
| Repurchases of Class A common stock | — |
| | (4 | ) | | (10,445 | ) | | — |
| | — |
| | — |
| | — |
| | (10,449 | ) |
| Contributions | — |
| | — |
| | — |
| | — |
| | — |
| | — |
| | 61,464 |
| | 61,464 |
|
| Dividends/Distributions | (5,425 | ) | | — |
| | — |
| | (36,782 | ) | | — |
| | (40,103 | ) | | (10,219 | ) | | (92,529 | ) |
| Net income | 5,425 |
| | — |
| | — |
| | 26,714 |
| | — |
| | 34,393 |
| | 8,346 |
| | 74,878 |
|
| Currency translation adjustment | — |
| | — |
| | — |
| | — |
| | (1,639 | ) | | (1,858 | ) | | 1,506 |
| | (1,991 | ) |
| Equity compensation | — |
| | — |
| | 11,306 |
| | — |
| | — |
| | 12,535 |
| | — |
| | 23,841 |
|
| Stock option exercises | — |
| | 43 |
| | 78,751 |
| | — |
| | — |
| | — |
| | — |
| | 78,794 |
|
| Balance at June 30, 2019 | $ | 298,761 |
| | $ | 1,075 |
| | $ | 379,789 |
| | $ | (35,247 | ) | | $ | (8,879 | ) | | $ | 352,882 |
| | $ | 613,943 |
| | $ | 1,602,324 |
|
See accompanying notes to the condensed consolidated financial statements.
Ares Management Corporation
Condensed Consolidated Statements of Changes in Equity
(Amounts in Thousands)
(unaudited)
| | | | | | | | | | | | | | | | | | | | | | | | | | | | | | | | | | | | | | | | | | | | | | | | | | |
| | Series A Preferred Stock | | Class A Common Stock | | Additional Paid-in-Capital | | Retained Earnings | | Accumulated Other Comprehensive Income (loss) | | Non-Controlling Interest in Ares Operating Group Entities | | Non-Controlling Interest in Consolidated Funds | | Total Equity |
| Balance at December 31, 2018 | | $ | 298,761 | | | $ | 1,016 | | | $ | 326,007 | | | $ | (29,336) | | | $ | (8,524) | | | $ | 302,780 | | | $ | 503,637 | | | $ | 1,394,341 | |
| Relinquished with deconsolidation of funds | | — | | | — | | | — | | | — | | | — | | | — | | | (55) | | | (55) | |
| Changes in ownership interests and related tax benefits | | — | | | 15 | | | (6,339) | | | — | | | — | | | (12,073) | | | — | | | (18,397) | |
| Contributions | | — | | | — | | | — | | | — | | | — | | | 1,876 | | | 54,035 | | | 55,911 | |
| Dividends/Distributions | | (5,425) | | | — | | | — | | | (35,367) | | | — | | | (40,112) | | | (20,736) | | | (101,640) | |
| Net income | | 5,425 | | | — | | | — | | | 39,524 | | | — | | | 59,003 | | | 17,624 | | | 121,576 | |
| Currency translation adjustment, net of tax | | — | | | — | | | — | | | — | | | 1,284 | | | 1,459 | | | (1,659) | | | 1,084 | |
| Equity compensation | | — | | | — | | | 12,637 | | | — | | | — | | | 14,367 | | | — | | | 27,004 | |
| Balance at March 31, 2019 | | 298,761 | | | 1,031 | | | 332,305 | | | (25,179) | | | (7,240) | | | 327,300 | | | 552,846 | | | 1,479,824 | |
| Changes in ownership interests and related tax benefits | | — | | | 5 | | | (32,128) | | | — | | | — | | | 20,615 | | | — | | | (11,508) | |
| Repurchases of Class A common stock | | — | | | (4) | | | (10,445) | | | — | | | — | | | — | | | — | | | (10,449) | |
| Contributions | | — | | | — | | | — | | | — | | | — | | | — | | | 61,464 | | | 61,464 | |
| Dividends/Distributions | | (5,425) | | | — | | | — | | | (36,782) | | | — | | | (40,103) | | | (10,219) | | | (92,529) | |
| Net income | | 5,425 | | | — | | | — | | | 26,714 | | | — | | | 34,393 | | | 8,346 | | | 74,878 | |
| Currency translation adjustment, net of tax | | — | | | — | | | — | | | — | | | (1,639) | | | (1,858) | | | 1,506 | | | (1,991) | |
| Equity compensation | | — | | | — | | | 11,306 | | | — | | | — | | | 12,535 | | | — | | | 23,841 | |
| Stock option exercises | | — | | | 43 | | | 78,751 | | | — | | | — | | | — | | | — | | | 78,794 | |
| Balance at June 30, 2019 | | 298,761 | | | 1,075 | | | 379,789 | | | (35,247) | | | (8,879) | | | 352,882 | | | 613,943 | | | 1,602,324 | |
| Changes in ownership interests and related tax benefits | | — | | | 1 | | | (94,004) | | | — | | | — | | | 95,212 | | | — | | | 1,209 | |
| | | | | | | | | | | | | | | | |
| Contributions | | — | | | 70 | | | 206,635 | | | — | | | — | | | — | | | 49,391 | | | 256,096 | |
| Dividends/Distributions | | (5,425) | | | — | | | — | | | (36,967) | | | — | | | (48,970) | | | (34,620) | | | (125,982) | |
| Net income | | 5,425 | | | — | | | — | | | 27,906 | | | — | | | 42,636 | | | 15,908 | | | 91,875 | |
| Currency translation adjustment, net of tax | | — | | | — | | | — | | | — | | | (2,131) | | | (2,352) | | | (4,946) | | | (9,429) | |
| Equity compensation | | — | | | — | | | 10,816 | | | — | | | — | | | 11,577 | | | — | | | 22,393 | |
| Stock option exercises | | — | | | 1 | | | 4,295 | | | — | | | — | | | — | | | — | | | 4,296 | |
| Balance at September 30, 2019 | | 298,761 | | | 1,147 | | | 507,531 | | | (44,308) | | | (11,010) | | | 450,985 | | | 639,676 | | | 1,842,782 | |
| | | | | | | | | | | | | | | | |
| Changes in ownership interests and related tax benefits | | — | | | 1 | | | (1,505) | | | — | | | — | | | 1,587 | | | — | | | 83 | |
| Contributions | | — | | | — | | | — | | | — | | | — | | | — | | | 7,961 | | | 7,961 | |
| Dividends/Distributions | | (5,425) | | | — | | | — | | | (39,552) | | | — | | | (45,814) | | | (30,707) | | | (121,498) | |
| Net income | | 5,425 | | | — | | | — | | | 33,040 | | | — | | | 48,184 | | | (2,174) | | | 84,475 | |
| Currency translation adjustment, net of tax | | — | | | — | | | — | | | — | | | 4,963 | | | 5,431 | | | 3,264 | | | 13,658 | |
| Equity compensation | | — | | | — | | | 11,801 | | | — | | | — | | | 11,915 | | | — | | | 23,716 | |
| Stock option exercises | | — | | | 4 | | | 7,417 | | | — | | | — | | | — | | | — | | | 7,421 | |
| Balance at December 31, 2019 | | $ | 298,761 | | | $ | 1,152 | | | $ | 525,244 | | | $ | (50,820) | | | $ | (6,047) | | | $ | 472,288 | | | $ | 618,020 | | | $ | 1,858,598 | |
|
| | | | | | | | | | | | | | | | | | | | | | | | | | | | | | | | | | | | | | | | |
| | Preferred
Equity | | Series A Preferred Stock | | Shareholders'
Equity | | Class A Common Stock | | Additional Paid-in-Capital | | Retained Earnings | | Accumulated
Other
Comprehensive
Income (loss) | | Non-Controlling
Interest in
Ares Operating
Group Entities | | | Non-Controlling
Interest in Consolidated
Funds | | Total
Equity |
| Balance at December 31, 2017 | $ | 298,761 |
| | $ | — |
| | $ | 279,065 |
| | $ | — |
| | $ | — |
| | $ | — |
| | $ | (4,208 | ) | | $ | 358,186 |
| | | $ | 528,488 |
| | $ | 1,460,292 |
|
| Cumulative effect of the adoption of ASC 606 | — |
| | — |
| | (10,827 | ) | | — |
| | — |
| | — |
| | — |
| | (17,117 | ) | | | 5,333 |
| | (22,611 | ) |
| As adjusted balance at January 1, 2018 | 298,761 |
| | — |
| | 268,238 |
| | — |
| | — |
| | — |
| | (4,208 | ) | | 341,069 |
| | | 533,821 |
| | 1,437,681 |
|
| Adoption of ASU 2018-02 | — |
| | — |
| | 1,202 |
| | — |
| | — |
| | — |
| | (1,202 | ) | | — |
| | | — |
| | — |
|
| Changes in ownership interests and related tax benefits | — |
| | — |
| | (8,351 | ) | | — |
| | — |
| | — |
| | — |
| | 18,810 |
| | | — |
| | 10,459 |
|
| Contributions | — |
| | — |
| | 105,441 |
| | — |
| | — |
| | — |
| | — |
| | — |
| | | 8,000 |
| | 113,441 |
|
| Dividends/Distributions | (5,425 | ) | | — |
| | (33,103 | ) | | — |
| | — |
| | — |
| | — |
| | (58,677 | ) | | | (983 | ) | | (98,188 | ) |
| Net income | 5,425 |
| | — |
| | 35,523 |
| | — |
| | — |
| | — |
| | — |
| | 33,106 |
| | | 367 |
| | 74,421 |
|
| Currency translation adjustment | — |
| | — |
| | — |
| | — |
| | — |
| | — |
| | 1,409 |
| | 2,103 |
| | | 3,175 |
| | 6,687 |
|
| Equity compensation | — |
| | — |
| | 8,285 |
| | — |
| | — |
| | — |
| | — |
| | 12,409 |
| | | — |
| | 20,694 |
|
| Balance at March 31, 2018 | 298,761 |
| | — |
| | 377,235 |
| | — |
| | — |
| | — |
| | (4,001 | ) | | 348,820 |
| | | 544,380 |
| | 1,565,195 |
|
| Changes in ownership interests and related tax benefits | — |
| | — |
| | 15,816 |
| | — |
| | — |
| | — |
| | — |
| | (4,711 | ) | | | — |
| | 11,105 |
|
| Contributions | — |
| | — |
| | 842 |
| | — |
| | — |
| | — |
| | — |
| | 764 |
| | | 62,990 |
| | 64,596 |
|
| Dividends/Distributions | (5,425 | ) | | — |
| | (36,640 | ) | | — |
| | — |
| | — |
| | — |
| | (53,174 | ) | | | (34,346 | ) | | (129,585 | ) |
| Net income | 5,425 |
| | — |
| | (17,200 | ) | | — |
| | — |
| | — |
| | — |
| | 16,062 |
| | | 9,882 |
| | 14,169 |
|
| Currency translation adjustment | — |
| | — |
| | — |
| | — |
| | — |
| | — |
| | (2,757 | ) | | (3,931 | ) | | | (5,689 | ) | | (12,377 | ) |
| Equity compensation | — |
| | — |
| | 9,928 |
| | — |
| | — |
| | — |
| | — |
| | 12,218 |
| | | — |
| | 22,146 |
|
| Balance at June 30, 2018 | 298,761 |
| | — |
| | 349,981 |
| | — |
| | — |
| | — |
| | (6,758 | ) | | 316,048 |
| | | 577,217 |
| | 1,535,249 |
|
| Changes in ownership interests and related tax benefits | — |
| | — |
| | (34,678 | ) | | — |
| | — |
| | — |
| | — |
| | 3,499 |
| | | — |
| | (31,179 | ) |
| Contributions | — |
| | — |
| | — |
| | — |
| | — |
| | — |
| | — |
| | 917 |
| | | — |
| | 917 |
|
| Dividends/Distributions | (5,425 | ) | | — |
| | (34,667 | ) | | — |
| | — |
| | — |
| | — |
| | (30,928 | ) | | | (11,466 | ) | | (82,486 | ) |
| Net income | 5,425 |
| | — |
| | 10,485 |
| | — |
| | — |
| | — |
| | — |
| | 18,133 |
| | | 13,169 |
| | 47,212 |
|
| Currency translation adjustment | — |
| | — |
| | — |
| | — |
| | — |
| | — |
| | (645 | ) | | (774 | ) | | | (500 | ) | | (1,919 | ) |
| Equity compensation | — |
| | — |
| | 10,600 |
| | — |
| | — |
| | — |
| | — |
| | 12,925 |
| | | — |
| | 23,525 |
|
| Balance at September 30, 2018 | 298,761 |
| | — |
| | 301,721 |
| | — |
| | — |
| | — |
| | (7,403 | ) | | 319,820 |
| | | 578,420 |
| | 1,491,319 |
|
| Consolidation of a new fund | — |
| | — |
| | — |
| | — |
| | — |
| | — |
| | — |
| | — |
| | | 42,942 |
| | 42,942 |
|
| Changes in ownership interests and related tax benefits | — |
| | — |
| | 501 |
| | — |
| | 9,140 |
| | — |
| | — |
| | (1,237 | ) | | | — |
| | 8,404 |
|
| Contributions | — |
| | — |
| | — |
| | — |
| | — |
| | — |
| | — |
| | 1,447 |
| | | 19 |
| | 1,466 |
|
| Dividends/Distributions | — |
| | (5,425 | ) | | (91 | ) | | — |
| | — |
| | (30,348 | ) | | — |
| | (35,018 | ) | | | (112,915 | ) | | (183,797 | ) |
| Net income | — |
| | 5,425 |
| | 5,500 |
| | — |
| | — |
| | 1,012 |
| | — |
| | 7,306 |
| | | (2,906 | ) | | 16,337 |
|
| Currency translation adjustment | — |
| | — |
| | — |
| | — |
| | — |
| | — |
| | (1,121 | ) | | (1,335 | ) | | | (1,923 | ) | | (4,379 | ) |
| Equity compensation | — |
| | — |
| | 7,432 |
| | — |
| | 2,820 |
| | — |
| | — |
| | 11,797 |
| | | — |
| | 22,049 |
|
| Reclassifications resulting from conversion to a corporation | (298,761 | ) | | 298,761 |
| | (315,063 | ) | | 1,016 |
| | 314,047 |
| | — |
| | — |
| | — |
| | | — |
| | — |
|
| Balance at December 31, 2018 | $ | — |
| | $ | 298,761 |
| | $ | — |
| | $ | 1,016 |
| | $ | 326,007 |
| | $ | (29,336 | ) | | $ | (8,524 | ) | | $ | 302,780 |
| | | $ | 503,637 |
| | $ | 1,394,341 |
|
See accompanying notes to the condensed consolidated financial statements.
Ares Management Corporation
Condensed Consolidated Statements of Cash Flows
(Amounts in Thousands)
(unaudited)
| | | | | Six months ended June 30, | |
| | | | 2020 | | 2019 | |
| Cash flows from operating activities: | | Cash flows from operating activities: | | | | |
| Net income (loss) | | Net income (loss) | $ | (59,121) | | | $ | 196,454 | | |
| Adjustments to reconcile net income (loss) to net cash used in operating activities | | Adjustments to reconcile net income (loss) to net cash used in operating activities | 128,836 | | | 48,114 | | |
| | | | For the Six Months Ended June 30, | |
| | 2019 | | 2018 | |
| Cash flows from operating activities: | | | | |
| Net income | $ | 196,454 |
| | $ | 88,590 |
| |
| Adjustments to reconcile net income to net cash used in operating activities | 48,114 |
| | 225,963 |
| |
| Adjustments to reconcile net income to net cash used in operating activities allocable to non-controlling interests in Consolidated Funds | (1,360,106 | ) | | (1,634,788 | ) | |
| | Adjustments to reconcile net income (loss) to net cash used in operating activities allocable to non-controlling interests in Consolidated Funds | | Adjustments to reconcile net income (loss) to net cash used in operating activities allocable to non-controlling interests in Consolidated Funds | (496,873) | | | (1,360,106) | | |
| | Cash flows due to changes in operating assets and liabilities | (12,824 | ) | | 66,969 |
| Cash flows due to changes in operating assets and liabilities | 114,974 | | | (12,824) | | |
| Cash flows due to changes in operating assets and liabilities allocable to non-controlling interests in Consolidated Funds | (162,950 | ) | | (34,335 | ) | |
| | Cash flows due to changes in operating assets and liabilities allocable to non-controlling interest in Consolidated Funds: | | Cash flows due to changes in operating assets and liabilities allocable to non-controlling interest in Consolidated Funds: | 161,345 | | | (162,950) | | |
| | Net cash used in operating activities | (1,291,312 | ) | | (1,287,601 | ) | Net cash used in operating activities | (150,839) | | | (1,291,312) | | |
| Cash flows from investing activities: | |
| | |
| Cash flows from investing activities: | | | | |
| Purchase of furniture, equipment and leasehold improvements, net | (5,653 | ) | | (7,126 | ) | Purchase of furniture, equipment and leasehold improvements, net | (8,080) | | | (5,653) | | |
| Acquisitions | | Acquisitions | (35,844) | | | — | | |
| Net cash used in investing activities | (5,653 | ) | | (7,126 | ) | Net cash used in investing activities | (43,924) | | | (5,653) | | |
| Cash flows from financing activities: | |
| | |
| Cash flows from financing activities: | | | | |
| Proceeds from issuance of common shares | — |
| | 105,333 |
| |
| Net proceeds from issuance of Class A common stock | | Net proceeds from issuance of Class A common stock | 383,154 | | | — | | |
| Proceeds from credit facility | 235,000 |
| | 325,000 |
| Proceeds from credit facility | 790,000 | | | 235,000 | | |
| Proceeds from term notes | — |
| | 44,050 |
| |
| Proceeds from senior notes | | Proceeds from senior notes | 399,084 | | | — | | |
| Repayments of credit facility | (150,000 | ) | | (410,000 | ) | Repayments of credit facility | (860,000) | | | (150,000) | | |
| Repayments of term loans | — |
| | (206,089 | ) | |
| | Dividends and distributions | (152,364 | ) | | (181,594 | ) | Dividends and distributions | (224,407) | | | (152,364) | | |
| Series A Preferred Stock dividends and distributions | (10,850 | ) | | (10,850 | ) | |
| Series A Preferred Stock dividends | | Series A Preferred Stock dividends | (10,850) | | | (10,850) | | |
| | Repurchases of Class A common stock | (10,449 | ) | | — |
| Repurchases of Class A common stock | — | | | (10,449) | | |
| Stock option exercises | 78,794 |
| | 950 |
| Stock option exercises | 67,441 | | | 78,794 | | |
| | Taxes paid related to net share settlement of equity awards | (31,424 | ) | | (17,225 | ) | Taxes paid related to net share settlement of equity awards | (74,335) | | | (31,424) | | |
| | Other financing activities | (3,258 | ) | | 764 |
| Other financing activities | (1,889) | | | (3,258) | | |
| Allocable to non-controlling interests in Consolidated Funds: | |
| | |
| Allocable to non-controlling interests in Consolidated Funds: | | | |
| Contributions from non-controlling interests in Consolidated Funds | 115,499 |
| | 70,990 |
| Contributions from non-controlling interests in Consolidated Funds | 123,695 | | | 115,499 | | |
| Distributions to non-controlling interests in Consolidated Funds | (30,955 | ) | | (35,329 | ) | Distributions to non-controlling interests in Consolidated Funds | (150,329) | | | (30,955) | | |
| Borrowings under loan obligations by Consolidated Funds | 1,934,087 |
| | 2,206,816 |
| Borrowings under loan obligations by Consolidated Funds | 608,355 | | | 1,934,087 | | |
| Repayments under loan obligations by Consolidated Funds | (528,955 | ) | | (599,801 | ) | Repayments under loan obligations by Consolidated Funds | (87,689) | | | (528,955) | | |
| Net cash provided by financing activities | 1,445,125 |
| | 1,293,015 |
| Net cash provided by financing activities | 962,230 | | | 1,445,125 | | |
| Effect of exchange rate changes | (11,187 | ) | | 8,231 |
| Effect of exchange rate changes | (15,811) | | | (11,187) | | |
| Net change in cash and cash equivalents | 136,973 |
|
| 6,519 |
| Net change in cash and cash equivalents | 751,656 | | | 136,973 | | |
| Cash and cash equivalents, beginning of period | 110,247 |
| | 118,929 |
| Cash and cash equivalents, beginning of period | 138,384 | | | 110,247 | | |
| Cash and cash equivalents, end of period | $ | 247,220 |
| | $ | 125,448 |
| Cash and cash equivalents, end of period | $ | 890,040 | | | $ | 247,220 | | |
|
See accompanying notes to the condensed consolidated financial statements.
Ares Management Corporation
Notes to the Unaudited Condensed Consolidated Financial Statements (Continued)
(Dollars in Thousands, Except Share Data and As Otherwise Noted)
1. ORGANIZATION
Ares Management Corporation ("the Company"(the “Company”), a Delaware corporation, together with its subsidiaries, is a leading global alternative investment manager operating three integrated businesses across Credit, Private Equity and Real Estate. Information about segments should be read together with Note 14, “Segment"Note 14. Segment Reporting.” Subsidiaries of the Company serve as the general partners and/or investment managers to various investment funds and managed accounts within each investment group (the “Ares Funds”). SuchThese subsidiaries provide investment advisory services to the Ares Funds in exchange for management fees. Ares is managed and operated by its Board of Directors and Executive Management Committee. Unless the context requires otherwise, references to “Ares” or the “Company” refer to Ares Management, L.P., together with its subsidiaries prior to November 26, 2018 and thereafter to Ares Management Corporation, together with its subsidiaries.
The accompanying unaudited financial statements include the condensed consolidated results of the Company and its subsidiaries. The Company is a holding company, and the Company’s soleCompany's assets areinclude equity interests in Ares Holdings Inc. (“AHI”), Ares Offshore Holdings, Ltd., and Ares AI Holdings L.P. In this quarterly report, the following of the Company’s subsidiaries are collectively referred to as the “Ares Operating Group” or “AOG”: Ares Offshore Holdings L.P. (“Ares Offshore”), Ares Holdings L.P. (“Ares Holdings”), and Ares Investments L.P.L.P (“Ares Investments”). The Company, indirectly through its wholly owned subsidiaries, is the general partner of each of the Ares Operating Group entities. The Company operates and controls all of the businesses and affairs of and conducts all of its material business activities through the Ares Operating Group.
Non-Controlling Interests in Ares Operating Group Entities
On February 21, 2020, the Company completed its acquisition of the Class A membership interests (the “Class A membership interests”) in Crestline Denali Capital LLC (“Crestline Denali”). The Class A membership interests entitle the Company to the fees associated with managing 7 collateral management contracts. The Class B membership interests of Crestline Denali (the “Class B membership interests”) were retained by the former owners of Crestline Denali and represent the financial interests in the subordinated notes of the collateralized loan obligations.
The non-controlling interests in Ares Operating Group (“AOG”)AOG entities represent a component of equity and net income attributable to the owners of the Ares Operating Group Units (“AOG Units”) that are not held directly or indirectly by the Company. These owners consist predominantly of Ares Owners Holdings L.P. but also include other strategic distribution partnerships with whom the Company has established joint ventures. In connection with the Company's control over Crestline Denali, the Company also consolidates investments and financial results that are attributable to the Class B membership interests to which the Company has no economic rights or obligations. Equity and income (loss) attributable to the Class B membership interests is included within non-controlling interests in AOG entities. Non-controlling interests in AOG entities are adjusted for contributions to and distributions from AOG during the reporting period and are allocated income from the AOG entities based on their historical ownership percentage for the proportional number of days in the reporting period.
2. SUMMARY OF SIGNIFICANT ACCOUNTING POLICIES
Basis of Presentation
The accompanying condensed consolidated financial statements are prepared in accordance with the generally accepted accounting principles in the United States (“GAAP”) for interim financial information and instructions to the Quarterly Report on Form 10-Q. The condensed consolidated financial statements, including these notes, are unaudited and exclude some of the disclosures required in annual financial statements. Management believes it has made all necessary adjustments so that the condensed consolidated financial statements are presented fairly and that estimates made in preparing its condensed consolidated financial statements are reasonable and prudent, and that all such adjustments are of a normal recurring nature. The operating results presented for interim periods are not necessarily indicative of the results that may be expected for any other interim period or for the entire year. These condensed consolidated financial statements should be read in conjunction with the audited consolidated financial statements included in the Annual Report on Form 10-K for the year ended December 31, 20182019 filed with the SEC.Securities and Exchange Commission (“SEC”).
The condensed consolidated financial statements includeAs of June 30, 2020, the accounts and activitiesimpact of the AOG entities, their consolidated subsidiariesoutbreak of the coronavirus pandemic (“COVID-19”) continues to unfold. As a result, management's estimates and certain Consolidated Funds.All intercompany balancesassumptions may be subject to a higher degree of variability and transactions have been eliminated upon consolidation.
The Company has reclassified certain prior period amounts to conform tovolatility that may result in material differences from the current year presentation.
Adoption of ASC 842
Effective January 1, 2019, the Company adopted the Financial Accounting Standards Board (“FASB”) Topic 842 (“ASC 842”), Leases. The Company adopted ASC 842 under the modified retrospective approach using the practical expedient provided for within paragraph 842-10-65-1; therefore, the presentation of prior year periods has not been adjusted. No cumulative effect of initially adopting ASC 842 as an adjustment to the opening balance of components of equity as of January 1, 2019 was necessary as the recognition of the right-of-use operating lease assets equaled the corresponding lease liabilities. The amount established in conjunction with the implementation was consistent with the amount previously disclosed.
Ares Management Corporation
Notes to the Unaudited Condensed Consolidated Financial Statements (Continued)
(Dollars in Thousands, Except Share Data and As Otherwise Noted)
The condensed consolidated financial statements include the accounts and activities of the AOG entities, their consolidated subsidiaries and certain Consolidated Funds. All intercompany balances and transactions have been eliminated upon consolidation.
The Company has entered into operatingreclassified certain prior period amounts to conform to the current year presentation.
Cash and finance leases for corporate officesCash Equivalents
Cash and certain equipment and makes the determination if an arrangement constitutes a lease at inception. Operating leases are included in right-of-use operating lease assets and right-of-use operating lease liabilities in the Company's Condensed Consolidated Statements of Financial Condition. Finance leases are included in accounts payable, accrued expenses and other liabilities in the Condensed Consolidated Statements of Financial Condition. Leases with an initial term of 12 months or less are not recorded on the Condensed Consolidated Statements of Financial Condition.
Right-of-use leases assets represent the Company's right to use an underlying assetcash equivalents for the lease termCompany includes investments with maturities at purchase of less than three months, money market funds and right-of-use lease liabilities representdemand deposits. Cash and cash equivalents held at Consolidated Funds represents cash that, although not legally restricted, is not available to support the Company's obligation to make lease payments arising from the lease. Operating lease right-of-use assets and liabilities are recognized at commencement date based on the present value of lease payments over the lease term. As mostgeneral liquidity needs of the Company's leases do not provide an implicit rate,Company, as the use of such amounts is generally limited to the activities of the Consolidated Funds.
At June 30, 2020 and December 31, 2019, the Company uses the its incremental borrowing rate based on the information available at commencement datehad cash balances with financial institutions in determining the present valueexcess of lease payments.Federal Deposit Insurance Corporation insured limits. The Company usesmonitors the implicit rate when readily determinable. The right-of-use operating lease asset also includes any lease prepayments and excludes lease incentives. Lease terms may include options to extend or terminate the lease when it is reasonably certain that the company will exercise that option. Lease expense is primarily recognized on a straight-line basis over the lease term. The Company has lease agreements with lease and non-lease components, which are generally accounted for separately. However, for certain equipment leases where the non-lease components are not material, the Company account for the lease and non-lease components as a single lease component.credit standing of these financial institutions.
Recent Accounting Pronouncements
The Company considers the applicability and impact of all accounting standard updates ("ASU"(“ASU”) issued.issued by the Financial Accounting Standards Board (“FASB”). ASUs not listed below were assessed and either determined to be not applicable or expected to have minimal impact on its condensed consolidated financial statements.
In May 2016,December 2019, the FASB issued ASU 2016-13,2019-12, Financial Instruments - Credit LossesIncome Taxes (Topic 326)740): MeasurementSimplifying the Accounting for Income Taxes. The amendments in this update simplify the accounting for income taxes by removing certain exceptions to the general principles in Topic 740. The amendments also improve consistent application of Credit Losses on Financial Instruments. The objectiveand simplify GAAP for other areas of the guidance inTopic 740 by clarifying and amending existing guidance. ASU 2016-13 is to allow entities to recognize estimated credit losses in the period that the change in valuation occurs. ASU 2016-13 requires an entity to present financial assets measured on an amortized cost basis on the balance sheet net of an allowance for credit losses. Available for sale and held to maturity debt securities are also required to be held net of an allowance for credit losses. The guidance should be applied using a modified retrospective approach. ASU 2016-132019-12 is effective for public entities for annual reporting periods beginning after December 15, 2019 and interim periods within those reporting periods. Early adoption is permitted for annual and quarterly reporting periods beginning after December 15, 2018. In April and May 2019, ASU 2019-04, Codification Improvements to Topic 326, Financial Instruments-Credit Losses, Topic 815, Derivatives and Hedging, and Topic 825, Financial Instruments and ASU 2019-05, Financial Instruments-Credit Losses (Topic 326): Targeted Transition Relief, were issued to provide clarification to previously issued credit losses guidance (ASU 2016-13) that has not yet been implemented. These updates are required to be adopted with ASU 2016-13. The Company is currently evaluating the impact of these pronouncements on its condensed consolidated financial statements.
In August 2018, the FASB issued ASU 2018-15, Intangibles-Goodwill and Other-Internal-Use Software (Subtopic 350-40): Customer’s Accounting for Implementation Costs Incurred in a Cloud Computing Arrangement That Is a Service Contract (a consensus of the FASB Emerging Issues Task Force). ASU 2018-15 amends ASC 350-40 to address a customer’s accounting for implementation costs incurred in a cloud computing arrangement that is a service contract. This ASU aligns the accounting for costs incurred to implement a cloud computing arrangement that is a service arrangement with the guidance on capitalizing costs associated with developing or obtaining internal-use software. Specifically, ASU 2018-15 amends ASC 350 to include in its scope implementation costs of a cloud computing arrangement that is a service contract and clarifies that a customer should apply ASC 350-40 to determine which implementation costs should be capitalized in a cloud computing arrangement that is considered a service contract. The accounting for the service element of a hosting arrangement that is a service contract is not affected by these amendments. In addition, this ASU states that a cloud computing arrangement that is a service contract does not give rise to a recognizable intangible asset because it is an executory service contract. Consequently, any costs incurred to implement a cloud computing arrangement that is a service contract would not be capitalized as an intangible asset since they do not form part of an intangible asset but instead would be characterized in the financial statements in the same manner as other service costs and assets related to service contracts such as prepaid expense. That is, these costs would be capitalized as part of the service contract and the related amortization would be consistent with the ongoing periodic costs of the underlying cloud computing arrangement. ASU 2018-15 is effective for public entities for annual reporting periods beginning after December 15, 20192020 and interim periods within those reporting periods, with early adoption permitted. The guidance mayamendments in this update related to separate financial statements of legal entities that are not subject to tax should be applied on a retrospective basis for all periods presented. The amendments related to changes in ownership of foreign equity method investments or foreign subsidiaries should be applied on a modified retrospective basis through a cumulative-effect adjustment to retained earnings as of the beginning of the fiscal year of adoption. The amendments related to franchise taxes that are partially based on income should be applied on either prospectivelya retrospective basis for all periods presented or retrospectively.a modified retrospective basis through a cumulative-effect adjustment to retained earnings as of the beginning of the fiscal year of adoption. All other amendments should be applied on a prospective basis. The Company is currently evaluating the impact of this guidance on its condensed consolidated financial statements.
In January 2020, the FASB issued ASU 2020-01, Investments—Equity Securities (Topic 321), Investments—Equity Method and Joint Ventures (Topic 323), and Derivatives and Hedging (Topic 815). The amendments in this update clarify certain interactions between the guidance to account for certain equity securities under Topic 321, the guidance to account for investments under the equity method of accounting in Topic 323, and the guidance in Topic 815, which could change how an entity accounts for an equity security under the measurement alternative or a forward contract or purchased option to purchase securities that, upon settlement of the forward contract or exercise of the purchased option, would be accounted for under the equity method of accounting or the fair value option in accordance with Topic 825, Financial Instruments. These amendments improve current GAAP by reducing diversity in practice and increasing comparability of the accounting for these interactions. ASU 2020-01 is effective for public entities for annual reporting periods beginning after December 15, 2020 and interim periods within those reporting periods, with early adoption permitted. The amendments in this update should be applied on a prospective basis. The Company is currently evaluating the impact of this guidance on its condensed consolidated financial statements.
In March 2020, the FASB issued ASU 2020-04, Reference Rate Reform (Topic 848). The amendments in this update provide optional expedients and exceptions for applying generally accepted accounting principles to contracts, hedging relationships, and other transactions affected by reference rate reform if certain criteria are met. The amendments in this update apply only to contracts, hedging relationships, and other transactions that reference the London Interbank Offered Rate ("LIBOR") or another reference rate expected to be discontinued because of reference rate reform. An entity may elect to adopt the amendments for contract modifications as of any date from the beginning of an interim period that includes or is subsequent
Ares Management Corporation
Notes to the Unaudited Condensed Consolidated Financial Statements (Continued)
(Dollars in Thousands, Except Share Data and As Otherwise Noted)
In October 2018,to March 12, 2020, or prospectively from a date within an interim period that includes or is subsequent to March 12, 2020, up to the FASB issueddate that the financial statements are available to be issued. An entity may elect to apply the amendments in ASU 2018-17, Consolidation (Topic 810): Targeted Improvements2020-04 to Related Party Guidance for Variable Interest Entities. ASU 2018-17, amends ASC 810eligible hedging relationships existing as of the beginning of the interim period that includes March 12, 2020 and to address whether indirect interests held through related parties in common control arrangements shouldnew eligible hedging relationships entered into after the beginning of the interim period that includes March 12, 2020. The one-time election to sell, transfer, or both sell and transfer debt securities classified as held-to-maturity may be considered on a proportional basis for determining whether fees paid to decision makers and service providers are variable interests. This is consistent with how indirect interests held through related parties under common control are considered for determining whether a reporting entity must consolidate a VIE. For example, if a decision maker or service provider owns a 20 percent interest in a related party and that related party owns a 40 percent interest in the legal entity being evaluated, the decision maker’s or service provider’s indirect interest in the VIE held through the related party under common control should be considered the equivalent of an eight percent direct interest for determining whether its fees are variable interests. ASU 2018-17 is effective for public entities for annual reporting periods beginningmade at any time after March 12, 2020 but no later than December 15, 2019 and interim periods within those reporting periods, with early adoption permitted. The guidance should be applied retrospectively.31, 2022. The Company is currently evaluating the impact of this guidance on its condensed consolidated financial statements.
3. GOODWILL AND INTANGIBLE ASSETS
Finite Lived Intangible Assets, Net
The following table summarizes the carrying value, net of accumulated amortization, forof the Company's intangible assets that are included within other assets in the Condensed Consolidated Statements of Financial Condition:
| | | | | | | | | | | | | | | | | |
| Weighted Average Amortization Period as of June 30, 2020 | | As of June 30, | | As of December 31, |
| | | 2020 | | 2019 |
| Management contracts | 6.1 years | | $ | 42,547 | | | $ | 12,498 | |
| Client relationships | 8.0 years | | 6,341 | | | 6,341 | |
| Trade name | 2.0 years | | 378 | | | 378 | |
| Intangible assets | | | 49,266 | | | 19,217 | |
| Less: accumulated amortization | | | (9,230) | | | (11,242) | |
| Intangible assets, net | | | $ | 40,036 | | | $ | 7,975 | |
|
| | | | | | | | | |
| | Weighted Average Amortization Period as of June 30, 2019 | | As of June 30, | | As of December 31, |
| | | 2019 | | 2018 |
| Management contracts | 2.6 years | | $ | 12,498 |
| | $ | 42,335 |
|
| Client relationships | 9.0 years | | 38,600 |
| | 38,600 |
|
| Trade name | 3.0 years | | 3,200 |
| | 3,200 |
|
| Intangible assets | | | 54,298 |
|
| 84,135 |
|
| Less: accumulated amortization | | | (25,287 | ) | | (52,701 | ) |
| Intangible assets, net | | | $ | 29,011 |
|
| $ | 31,434 |
|
In connection with the acquisition of 7 collateral management agreements during the first quarter of 2020, the Company allocated $34.7 million of the $35.8 million purchase price to the fair value of the collateral management contracts. The acquired management contracts had a weighted average amortization period of 6.6 years.
Amortization expense associated with intangible assets was $1.2$1.6 million and $3.3$1.2 million for the three months ended June 30, 20192020 and 2018,2019, respectively, and $2.4$2.6 million and $6.6$2.4 million for the six months ended June 30, 20192020 and 2018,2019, respectively, and is presented within general, administrative and other expenses within the Condensed Consolidated Statements of Operations. During the first quarter of 2019,2020, the Company removed $29.8$4.7 million of intangible assets that were fully amortized.
Goodwill
The following table summarizes the carrying value of the Company's goodwill assets that are included within other assets in the Condensed Consolidated Statements of Financial Condition:
| | | | | | | | | | | | | | | | | | | | | | | |
| Credit Group | | Private
Equity Group | | Real
Estate Group | | Total |
| | | | | | | |
| | | | | | | |
| Balance as of December 31, 2019 | $ | 32,196 | | | $ | 58,600 | | | $ | 53,059 | | | $ | 143,855 | |
| Foreign currency translation | — | | | — | | | (121) | | | (121) | |
| Balance as of June 30, 2020 | $ | 32,196 | | | $ | 58,600 | | | $ | 52,938 | | | $ | 143,734 | |
|
| | | | | | | | | | | | | | | |
| | Credit | | Private
Equity | | Real
Estate | | Total |
| Balance as of December 31, 2018 | $ | 32,196 |
| | $ | 58,600 |
| | $ | 52,990 |
|
| $ | 143,786 |
|
| Foreign currency translation | — |
| | — |
| | (7 | ) | | (7 | ) |
| Balance as of June 30, 2019 | $ | 32,196 |
| | $ | 58,600 |
| | $ | 52,983 |
| | $ | 143,779 |
|
There was no0 impairment of goodwill recorded during the six months ended June 30, 20192020 and 2018.2019. The impact of foreign currency translation is reflected within other comprehensive income.
Ares Management Corporation
Notes to the Unaudited Condensed Consolidated Financial Statements (Continued)
(Dollars in Thousands, Except Share Data and As Otherwise Noted)
4. INVESTMENTS
The Company’s investments are comprised of the following:
| | | | | | | | | | | | | | | | | | | | | | | |
| | | | | Percentage of total investments as of | | |
| June 30, | | December 31, | | June 30, | | December 31, |
| 2020 | | 2019 | | 2020 | | 2019 |
| Equity method investments: | | | | | | | |
Equity method private investment partnership interests - principal (1) | $ | 372,790 | | | $ | 390,407 | | | 25.2 | % | | 23.5 | % |
Equity method - carried interest (1) | 1,003,827 | | | 1,134,967 | | | 67.8 | | | 68.2 | |
| Equity method private investment partnership interests and other (held at fair value) | 20,311 | | | 51,528 | | | 1.4 | | | 3.1 | |
| Equity method private investment partnership interests and other | 14,272 | | | 16,536 | | | 0.9 | | | 1.0 | |
| Total equity method investments | 1,411,200 | | | 1,593,438 | | | 95.3 | | | 95.8 | |
Collateralized loan obligations (2) | 19,135 | | | 22,265 | | | 1.3 | | | 1.3 | |
| Other fixed income | 48,220 | | | 46,918 | | | 3.3 | | | 2.8 | |
| Collateralized loan obligations and other fixed income, at fair value | 67,355 | | | 69,183 | | | 4.6 | | | 4.1 | |
| Common stock, at fair value | 932 | | | 1,043 | | | 0.1 | | | 0.1 | |
| Total investments | $ | 1,479,487 | | | $ | 1,663,664 | | | | | |
| | | | | | | |
|
| | | | | | | | | | | | | |
| | | | Percentage of total investments as of |
| | June 30, | | December 31, | | June 30, | | December 31, |
| | 2019 | | 2018 | | 2019 | | 2018 |
| Private Investment Partnership Interests and Other: | | | | | | | |
| Equity method private investment partnership interests - principal (1) | $ | 364,109 |
| | $ | 357,655 |
| | 23.3 | % | | 27.0 | % |
| Equity method - carried interest (1) | 1,071,954 |
| | 841,079 |
| | 68.4 | % | | 63.4 | % |
| Equity method private investment partnership interests and other (held at fair value) | 48,785 |
| | 46,450 |
| | 3.1 | % | | 3.5 | % |
| Equity method private investment partnership interests and other | 15,969 |
| | 18,845 |
| | 1.0 | % | | 1.4 | % |
| Total private investment partnership interests and other | 1,500,817 |
|
| 1,264,029 |
| | 95.8 | % | | 95.3 | % |
| Collateralized loan obligations | 26,241 |
| | 20,824 |
| | 1.7 | % | | 1.6 | % |
| Other fixed income | 37,810 |
| | 40,000 |
| | 2.4 | % | | 3.0 | % |
| Collateralized loan obligations and other fixed income, at fair value | 64,051 |
| | 60,824 |
| | 4.1 | % | | 4.6 | % |
| Common stock, at fair value | 1,174 |
| | 1,284 |
| | 0.1 | % | | 0.1 | % |
| Total investments | $ | 1,566,042 |
|
| $ | 1,326,137 |
|
|
|
|
|
|
|
| |
(1) | Investment or portion of the investment is denominated in foreign currency and is translated into U.S. dollars at each reporting date. |
(1)Investment or portion of the investment is denominated in foreign currency and is translated into U.S. dollars at each reporting date.
(2)As of June 30, 2020, includes $2.7 million of collateralized loan obligations that are attributable to the Crestline Denali Class B membership interests.
Equity Method Investments
The Company’s equity method investments include investments that are not consolidated but over which the Company exerts significant influence. The Company evaluates each of its equity method investments to determine if any were significant as defined by guidance from the SEC. As of and for the three and six months ended June 30, 20192020 and 2018,2019, no individual equity method investment held by the Company met the significance criteria.
The Company recognized a net gainsgain and net loss related to its equity method investments of $5.4$21.7 million and $3.8$7.2 million for the three and six months ended June 30, 20192020, respectively, and 2018, respectively,net gains of $5.4 million and $34.5 million and $7.3 million for the three and six months ended June 30, 2019, and 2018, respectively. The net gains and losses were included within principal investment income, net realized and unrealized gaingains on investments, and interest and dividend income within the Condensed Consolidated Statements of Operations.
With respect to the Company's equity method investments, the material assets are expected to generate either long-term capital appreciation and or interest income while the material liabilities are debt instruments collateralized by, or related to, the financing of the assets and net income is materially comprised of the changes in fair value of these net assets.
Ares Management Corporation
Notes to the Unaudited Condensed Consolidated Financial Statements (Continued)
(Dollars in Thousands, Except Share Data and As Otherwise Noted)
Investments of the Consolidated Funds
Investments held in the Consolidated Funds are summarized below:
| | | | | | | | | | | | | | | | | | | | | | | |
| Fair Value at | | | | Percentage of total investments as of | | |
| June 30, | | December 31, | | June 30, | | December 31, |
| 2020 | | 2019 | | 2020 | | 2019 |
| Fixed income investments: | | | | | | | |
| Bonds | $ | 299,459 | | | $ | 212,376 | | | 3.0 | % | | 2.4 | % |
| Loans | 9,347,656 | | | 8,062,740 | | | 93.4 | | | 92.4 | |
| Investments in CLO warehouse | — | | | 44,435 | | | — | | | 0.5 | |
| Total fixed income investments | 9,647,115 | | | 8,319,551 | | | 96.4 | | | 95.3 | |
| Equity securities | 45,881 | | | 112,384 | | | 0.5 | | | 1.3 | |
| Partnership interests | 312,636 | | | 296,012 | | | 3.1 | | | 3.4 | |
| Total investments, at fair value | $ | 10,005,632 | | | $ | 8,727,947 | | | | | |
|
| | | | | | | | | | | | | |
| | Fair value at | | Fair value as a percentage of total investments as of |
| | June 30, | | December 31, | | June 30, | | December 31, |
| | 2019 | | 2018 | | 2019 | | 2018 |
| Fixed income investments: | | | | | | | |
| Bonds | $ | 201,792 |
| | $ | 318,499 |
| | 2.6 | % | | 4.3 | % |
| Loans | 7,229,083 |
| | 6,886,749 |
| | 91.2 | % | | 89.8 | % |
| Collateralized loan obligations | 35,260 |
| | — |
| | 0.4 | % | | — | % |
| Total fixed income investments | 7,466,135 |
| | 7,205,248 |
| | 94.2 | % | | 94.1 | % |
| Equity securities | 166,623 |
| | 196,470 |
| | 2.1 | % | | 2.4 | % |
| Partnership interests | 293,857 |
| | 271,447 |
| | 3.7 | % | | 3.5 | % |
| Total investments, at fair value | $ | 7,926,615 |
| | $ | 7,673,165 |
| | | | |
At June 30, 2020 and December 31, 2019, no single issuer or investment, including derivative instruments and underlying portfolio investments of the Consolidated Funds, had a fair value that exceeded 5.0% of the Company’s total assets.
5. FAIR VALUE
Fair Value Measurements
GAAP establishes a hierarchal disclosure framework that prioritizes the inputs used in measuring financial instruments at fair value into three levels based on their market price observability. Market price observability is affected by a number of factors, including the type of instrument and the characteristics specific to the instrument. Financial instruments with readily available quoted prices from an active market or for which fair value can be measured based on actively quoted prices generally have a higher degree of market price observability and a lesser degree of judgment inherent in measuring fair value.
Financial assets and liabilities measured and reported at fair value are classified as follows:
| |
• | •Level I—Quoted prices in active markets for identical instruments. •Level II—Quoted prices for similar instruments in active markets; quoted prices for identical or similar instruments in inactive markets; and model-derived valuations with directly or indirectly observable significant inputs. Level II inputs include prices in markets with few transactions, non-current prices, prices for which little public information exists or prices that vary substantially over time or among brokered market makers. Other inputs include interest rates, yield curves, volatilities, prepayment risks, loss severities, credit risks and default rates. •—Quoted prices in active markets for identical instruments. |
| |
• | Level II—Quoted prices for similar instruments in active markets; quoted prices for identical or similar instruments in inactive markets; and model‑derived valuations with directly or indirectly observable significant inputs. Level II inputs include prices in markets with few transactions, non-current prices, prices for which little public information exists or prices that vary substantially over time or among brokered market makers. Other inputs include interest rates, yield curves, volatilities, prepayment risks, loss severities, credit risks and default rates.
|
| |
• | Level III—Valuations that rely on one or more significant unobservable inputs. These inputs reflect the Company’s assessment of the assumptions that market participants would use to value the instrument based on the best information available. |
In some instances, an instrument may fall into more than one level of the fair value hierarchy. In such instances, the instrument’s level within the fair value hierarchy is based on the lowest of the three levels (with Level III being the lowest) that is significant to the fair value measurement. The Company’s assessment of the significance of an input requires judgment and considers factors specific to the instrument. The Company accounts for the transfer of assets into or out of each fair value hierarchy level as of the beginning of the reporting period.
Ares Management Corporation
Notes to the Unaudited Condensed Consolidated Financial Statements (Continued)
(Dollars in Thousands, Except Share Data and As Otherwise Noted)
Fair Value of Financial Instruments Held by the Company and Consolidated Funds
The tables below summarize the financial assets and financial liabilities measured at fair value for the Company and the Consolidated Funds as of June 30, 2019:2020:
| | | | | | | | | | | | | | | | | | | | | | | | | | | | | | | | |
| Financial Instruments of the Company | | Level I | | Level II | | Level III | | Investments
Measured
at NAV | | Total |
| Assets, at fair value | | | | | | | | | | |
| Investments: | | | | | | | | | | |
| Collateralized loan obligations and other fixed income | | $ | — | | | $ | — | | | $ | 67,355 | | | $ | — | | | $ | 67,355 | |
| Common stock and other equity securities | | — | | | 932 | | | 14,704 | | | — | | | 15,636 | |
| Partnership interests | | — | | | — | | | 2,575 | | | 3,032 | | | 5,607 | |
| Total investments, at fair value | | — | | | 932 | | | 84,634 | | | 3,032 | | | 88,598 | |
| Derivatives-foreign exchange contracts | | — | | | 4,719 | | | — | | | — | | | 4,719 | |
| Total assets, at fair value | | $ | — | | | $ | 5,651 | | | $ | 84,634 | | | $ | 3,032 | | | $ | 93,317 | |
| Liabilities, at fair value | | | | | | | | | | |
| Derivatives-foreign exchange contracts | | $ | — | | | $ | (128) | | | $ | — | | | $ | — | | | $ | (128) | |
| Total liabilities, at fair value | | $ | — | | | $ | (128) | | | $ | — | | | $ | — | | | $ | (128) | |
| | | | | | | | | | | | | | | | | | | | | | | | | | |
| Financial Instruments of the Consolidated Funds | | Level I | | Level II | | Level III | | Total |
| Assets, at fair value | | | | | | | | |
| Investments: | | | | | | | | |
| Fixed income investments: | | | | | | | | |
| Bonds | | $ | — | | | $ | 299,459 | | | $ | — | | | $ | 299,459 | |
| Loans | | — | | | 8,761,369 | | | 586,287 | | | 9,347,656 | |
| | | | | | | | |
| Total fixed income investments | | — | | | 9,060,828 | | | 586,287 | | | 9,647,115 | |
| Equity securities | | 3,622 | | | — | | | 42,259 | | | 45,881 | |
| Partnership interests | | — | | | — | | | 312,636 | | | 312,636 | |
| Total investments, at fair value | | 3,622 | | | 9,060,828 | | | 941,182 | | | 10,005,632 | |
| | | | | | | | |
| | | | | | | | |
| Derivatives-asset swaps-other | | — | | | — | | | 1,599 | | | 1,599 | |
| | | | | | | | |
| Total assets, at fair value | | $ | 3,622 | | | $ | 9,060,828 | | | $ | 942,781 | | | $ | 10,007,231 | |
| Liabilities, at fair value | | | | | | | | |
| | | | | | | | |
| | | | | | | | |
| Derivatives-asset swaps-other | | — | | | — | | | (197) | | | (197) | |
| | | | | | | | |
| Loan obligations of CLOs | | — | | | (9,228,687) | | | — | | | (9,228,687) | |
| Total liabilities, at fair value | | $ | — | | | $ | (9,228,687) | | | $ | (197) | | | $ | (9,228,884) | |
|
| | | | | | | | | | | | | | | | | | | | |
| Financial Instruments of the Company | | Level I | | Level II | | Level III | | Investments
Measured
at NAV | | Total |
| Assets, at fair value | | | | | | | | | | |
| Investments: | | | | | | | | | | |
| Collateralized loan obligations and other fixed income | | $ | — |
| | $ | — |
| | $ | 64,051 |
| | $ | — |
| | $ | 64,051 |
|
| Common stock and other equity securities | | 137 |
| | 1,037 |
| | 12,397 |
| | — |
| | 13,571 |
|
| Partnership interests | | — |
| | — |
| | 35,192 |
| | 1,196 |
| | 36,388 |
|
| Total investments, at fair value | | 137 |
|
| 1,037 |
|
| 111,640 |
|
| 1,196 |
|
| 114,010 |
|
| Derivatives—foreign exchange contracts | | — |
| | 1,890 |
| | — |
| | — |
| | 1,890 |
|
| Total assets, at fair value | | $ | 137 |
|
| $ | 2,927 |
|
| $ | 111,640 |
|
| $ | 1,196 |
|
| $ | 115,900 |
|
| Liabilities, at fair value | | | | | | | | | | |
| Derivatives—foreign exchange contracts | | $ | — |
| | $ | (610 | ) | | $ | — |
| | $ | — |
| | $ | (610 | ) |
| Total liabilities, at fair value | | $ | — |
|
| $ | (610 | ) |
| $ | — |
|
| $ | — |
|
| $ | (610 | ) |
|
| | | | | | | | | | | | | | | | |
| Financial Instruments of the Consolidated Funds | | Level I | | Level II | | Level III | | Total |
| Assets, at fair value | | | | | | | | |
| Investments: | | | | | | | | |
| Fixed income investments: | | | | | | | | |
| Bonds | | $ | — |
| | $ | 201,792 |
| | $ | — |
| | $ | 201,792 |
|
| Loans | | — |
| | 6,954,671 |
| | 274,412 |
| | 7,229,083 |
|
| Collateralized loan obligations | | — |
| | 35,260 |
| | — |
| | 35,260 |
|
| Total fixed income investments | | — |
|
| 7,191,723 |
|
| 274,412 |
|
| 7,466,135 |
|
| Equity securities | | 34,891 |
| | — |
| | 131,732 |
| | 166,623 |
|
| Partnership interests | | — |
| | — |
| | 293,857 |
| | 293,857 |
|
| Total investments, at fair value | | 34,891 |
|
| 7,191,723 |
|
| 700,001 |
|
| 7,926,615 |
|
| Derivatives: | | | | | | | | |
| Foreign exchange contracts | | — |
| | 342 |
| | — |
| | 342 |
|
| Asset swaps - other | | — |
| | — |
| | 705 |
| | 705 |
|
| Total assets, at fair value | | $ | 34,891 |
|
| $ | 7,192,065 |
|
| $ | 700,706 |
|
| $ | 7,927,662 |
|
| Liabilities, at fair value | | | | | | | | |
| Foreign exchange contracts | | $ | — |
| | $ | (345 | ) | | $ | — |
| | $ | (345 | ) |
| Asset swaps - other | | — |
| | — |
| | (647 | ) | | (647 | ) |
| Loan obligations of CLOs | | — |
| | (7,030,841 | ) | | — |
| | (7,030,841 | ) |
| Total liabilities, at fair value | | $ | — |
|
| $ | (7,031,186 | ) |
| $ | (647 | ) |
| $ | (7,031,833 | ) |
Ares Management Corporation
Notes to the Unaudited Condensed Consolidated Financial Statements (Continued)
(Dollars in Thousands, Except Share Data and As Otherwise Noted)
The tables below summarize the financial assets and financial liabilities measured at fair value for the Company and the Consolidated Funds as of December 31, 2018:2019:
| | | | | | | | | | | | | | | | | | | | | | | | | | | | | | | | |
| Financial Instruments of the Company | | Level I | | Level II | | Level III | | Investments
Measured
at NAV | | Total |
| Assets, at fair value | | | | | | | | | | |
| Investments: | | | | | | | | | | |
| Collateralized loan obligations and other fixed income | | $ | — | | | $ | — | | | $ | 69,183 | | | $ | — | | | $ | 69,183 | |
| Common stock and other equity securities | | — | | | 1,043 | | | 14,704 | | | — | | | 15,747 | |
| Partnership interests | | — | | | — | | | 35,192 | | | 1,632 | | | 36,824 | |
| Total investments, at fair value | | — | | | 1,043 | | | 119,079 | | | 1,632 | | | 121,754 | |
| Derivatives-foreign exchange contracts | | — | | | 4,023 | | | — | | | — | | | 4,023 | |
| Total assets, at fair value | | $ | — | | | $ | 5,066 | | | $ | 119,079 | | | $ | 1,632 | | | $ | 125,777 | |
| Liabilities, at fair value | | | | | | | | | | |
| Derivatives-foreign exchange contracts | | $ | — | | | $ | (113) | | | $ | — | | | $ | — | | | $ | (113) | |
| Total liabilities, at fair value | | $ | — | | | $ | (113) | | | $ | — | | | $ | — | | | $ | (113) | |
|
| | | | | | | | | | | | | | | | | | | | |
| Financial Instruments of the Company | | Level I | | Level II | | Level III | | Investments
Measured
at NAV | | Total |
| Assets, at fair value | | | | | | | | | | |
| Investments: | | | | | | | | | | |
| Collateralized loan obligations and other fixed income | | $ | — |
| | $ | — |
| | $ | 60,824 |
| | $ | — |
| | $ | 60,824 |
|
| Common stock and other equity securities | | 280 |
| | 1,004 |
| | 10,397 |
| | — |
| | 11,681 |
|
| Partnership interests | | — |
| | — |
| | 35,192 |
| | 861 |
| | 36,053 |
|
| Total investments, at fair value | | 280 |
|
| 1,004 |
|
| 106,413 |
|
| 861 |
|
| 108,558 |
|
| Derivatives-foreign exchange contracts | | — |
| | 1,066 |
| | — |
| | — |
| | 1,066 |
|
| Total assets, at fair value | | $ | 280 |
|
| $ | 2,070 |
|
| $ | 106,413 |
|
| $ | 861 |
|
| $ | 109,624 |
|
| Liabilities, at fair value | | |
| | |
| | |
| | |
| | |
|
| Derivatives—foreign exchange contracts | | $ | — |
| | $ | (869 | ) | | $ | — |
| | $ | — |
| | $ | (869 | ) |
| Total liabilities, at fair value | | $ | — |
|
| $ | (869 | ) |
| $ | — |
|
| $ | — |
|
| $ | (869 | ) |
|
| | | | | | | | | | | | | | | | |
| Financial Instruments of the Consolidated Funds | | Level I | | Level II | | Level III | | Total |
| Assets, at fair value | | | | | | | | |
| Investments: | | | | | | | | |
| Fixed income investments: | | | | | | | | |
| Bonds | | $ | — |
| | $ | 316,850 |
| | $ | 1,649 |
| | $ | 318,499 |
|
| Loans | | — |
| | 6,340,440 |
| | 546,309 |
| | 6,886,749 |
|
| Total fixed income investments | | — |
|
| 6,657,290 |
|
| 547,958 |
|
| 7,205,248 |
|
| Equity securities | | 45,718 |
| | — |
| | 150,752 |
| | 196,470 |
|
| Partnership interests | | — |
| | — |
| | 271,447 |
| | 271,447 |
|
| Total investments, at fair value | | 45,718 |
|
| 6,657,290 |
|
| 970,157 |
|
| 7,673,165 |
|
| Derivatives: | | | | | | | | |
| Foreign exchange contracts | | — |
| | 1,881 |
| | — |
| | 1,881 |
|
| Asset swaps - other | | — |
| | — |
| | 1,328 |
| | 1,328 |
|
| Total derivative assets, at fair value | | — |
|
| 1,881 |
|
| 1,328 |
|
| 3,209 |
|
| Total assets, at fair value | | $ | 45,718 |
|
| $ | 6,659,171 |
|
| $ | 971,485 |
|
| $ | 7,676,374 |
|
| Liabilities, at fair value | | | | | | | | |
| Foreign exchange contracts | | $ | — |
| | $ | (1,864 | ) | | $ | — |
| | (1,864 | ) |
| Asset swaps - other | | — |
| | — |
| | (648 | ) | | (648 | ) |
| Loan obligations of CLOs | | — |
| | (6,678,091 | ) | | — |
| | (6,678,091 | ) |
| Total liabilities, at fair value | | $ | — |
|
| $ | (6,679,955 | ) |
| $ | (648 | ) |
| $ | (6,680,603 | ) |
| | | | | | | | | | | | | | | | | | | | | | | | | | |
| Financial Instruments of the Consolidated Funds | | Level I | | Level II | | Level III | | Total |
| Assets, at fair value | | | | | | | | |
| Investments: | | | | | | | | |
| Fixed income investments: | | | | | | | | |
| Bonds | | $ | — | | | $ | 207,966 | | | $ | 4,410 | | | $ | 212,376 | |
| Loans | | — | | | 7,728,014 | | | 334,726 | | | 8,062,740 | |
| Investments in CLO warehouse | | — | | | 44,435 | | | — | | | 44,435 | |
| Total fixed income investments | | — | | | 7,980,415 | | | 339,136 | | | 8,319,551 | |
| Equity securities | | 26,396 | | | — | | | 85,988 | | | 112,384 | |
| Partnership interests | | — | | | — | | | 296,012 | | | 296,012 | |
| Total investments, at fair value | | 26,396 | | | 7,980,415 | | | 721,136 | | | 8,727,947 | |
| | | | | | | | |
| Derivatives-foreign exchange contracts | | — | | | 667 | | | — | | | 667 | |
| | | | | | | | |
| | | | | | | | |
| Total assets, at fair value | | $ | 26,396 | | | $ | 7,981,082 | | | $ | 721,136 | | | $ | 8,728,614 | |
| Liabilities, at fair value | | | | | | | | |
| Derivatives: | | | | | | | | |
| Foreign exchange contracts | | $ | — | | | $ | (670) | | | $ | — | | | $ | (670) | |
| Asset swaps-other | | — | | | — | | | (4,106) | | | (4,106) | |
| Total derivative liabilities, at fair value | | — | | | (670) | | | (4,106) | | | (4,776) | |
| Loan obligations of CLOs | | — | | | (7,973,748) | | | — | | | (7,973,748) | |
| Total liabilities, at fair value | | $ | — | | | $ | (7,974,418) | | | $ | (4,106) | | | $ | (7,978,524) | |
Ares Management Corporation
Notes to the Unaudited Condensed Consolidated Financial Statements (Continued)
(Dollars in Thousands, Except Share Data and As Otherwise Noted)
The following tables set forth a summary of changes in the fair value of the Level III measurements for the three months ended June 30, 2020:
| | | | | | | | | | | | | | | | | | | | | | | | | | | |
| | Level III Assets | | | | | | | |
| Level III Assets of the Company | | Equity Securities | | Fixed Income | | Partnership Interests | | Total | |
| Balance, beginning of period | | $ | 14,704 | | | $ | 65,344 | | | $ | 2,575 | | | $ | 82,623 | | |
| | | | | | | | | |
| | | | | | | | | |
Purchases(1) | | — | | | 659 | | | — | | | 659 | | |
Sales/settlements(2) | | — | | | (287) | | | — | | | (287) | | |
| Realized and unrealized appreciation, net | | — | | | 1,639 | | | — | | | 1,639 | | |
| Balance, end of period | | $ | 14,704 | | | $ | 67,355 | | | $ | 2,575 | | | $ | 84,634 | | |
| Increase in net unrealized appreciation included in earnings related to financial assets still held at the reporting date | | $ | — | | | $ | 1,639 | | | $ | — | | | $ | 1,639 | | |
| | | | | | | | | | | | | | | | | | | | | | | | | | | | | | | | |
| Level III Net Assets of Consolidated Funds | | Equity Securities | | Fixed Income | | Partnership
Interests | | Derivatives, Net | | Total |
| Balance, beginning of period | | $ | 42,752 | | | $ | 1,279,557 | | | $ | 307,025 | | | $ | 19 | | | $ | 1,629,353 | |
| | | | | | | | | | |
| Transfer in | | — | | | 84,059 | | | — | | | — | | | 84,059 | |
| Transfer out | | (5) | | | (681,913) | | | — | | | — | | | (681,918) | |
Purchases(1) | | 264 | | | 78,694 | | | 56,000 | | | — | | | 134,958 | |
Sales/settlements(2) | | (449) | | | (217,217) | | | (56,000) | | | (51) | | | (273,717) | |
| Amortized discounts/premiums | | — | | | 815 | | | — | | | 106 | | | 921 | |
| Realized and unrealized appreciation (depreciation), net | | (303) | | | 42,292 | | | 5,611 | | | 1,328 | | | 48,928 | |
| Balance, end of period | | $ | 42,259 | | | $ | 586,287 | | | $ | 312,636 | | | $ | 1,402 | | | $ | 942,584 | |
| Increase (decrease) in net unrealized appreciation/depreciation included in earnings related to financial assets still held at the reporting date | | $ | (228) | | | $ | 36,263 | | | $ | 5,611 | | | $ | 1,268 | | | $ | 42,914 | |
(1)Purchases include paid-in-kind interest and securities received in connection with restructuring.
(2)Sales/settlements include distributions, principal redemptions and securities disposed of in connection with restructurings.
Ares Management Corporation
Notes to the Unaudited Condensed Consolidated Financial Statements (Continued)
(Dollars in Thousands, Except Share Data and As Otherwise Noted)
The following tables set forth a summary of changes in the fair value of the Level III measurements for the three months ended June 30, 2019:
| | | | | | | | | | | | | | | | | | | | | | | | | | |
| | Level III Assets | | | | | | |
| Level III Assets of the Company | | Equity Securities | | Fixed Income | | Partnership Interests | | Total |
| Balance, beginning of period | | $ | 10,397 | | | $ | 67,190 | | | $ | 35,192 | | | $ | 112,779 | |
| Deconsolidation of fund | | — | | | 1,883 | | | — | | | 1,883 | |
| | | | | | | | |
Purchases(1) | | 2,000 | | | — | | | — | | | 2,000 | |
Sales/settlements(2) | | — | | | (6,206) | | | — | | | (6,206) | |
| Realized and unrealized appreciation, net | | — | | | 1,184 | | | — | | | 1,184 | |
| Balance, end of period | | $ | 12,397 | | | $ | 64,051 | | | $ | 35,192 | | | $ | 111,640 | |
| Increase in net unrealized appreciation included in earnings related to financial assets still held at the reporting date | | $ | — | | | $ | 1,818 | | | $ | — | | | $ | 1,818 | |
|
| | | | | | | | | | | | | | | | |
| | | Level III Assets |
| Level III Assets of the Company | | Equity Securities | | Fixed Income | | Partnership
Interests | | Total |
| Balance, beginning of period | | $ | 10,397 |
| | $ | 67,190 |
| | $ | 35,192 |
| | $ | 112,779 |
|
| Deconsolidation of fund | | — |
| | 1,883 |
| | — |
| | 1,883 |
|
| Purchases(1) | | 2,000 |
| | — |
| | — |
| | 2,000 |
|
| Sales/settlements(2) | | — |
| | (6,206 | ) | | — |
| | (6,206 | ) |
| Realized and unrealized appreciation, net | | — |
| | 1,184 |
| | — |
| | 1,184 |
|
| Balance, end of period | | $ | 12,397 |
| | $ | 64,051 |
|
| $ | 35,192 |
|
| $ | 111,640 |
|
| Increase in net unrealized appreciation included in earnings related to financial assets still held at the reporting date | | $ | — |
| | $ | 1,818 |
| | $ | — |
| | $ | 1,818 |
|
| | | | | | | | | | | | | | | | | | | | | | | | | | | | | | | | |
| Level III Net Assets of Consolidated Funds | | Equity Securities | | Fixed Income | | Partnership Interests | | Derivatives, Net | | Total |
| Balance, beginning of period | | $ | 159,032 | | | $ | 564,304 | | | $ | 283,059 | | | $ | (3,031) | | | $ | 1,003,364 | |
| Deconsolidation of fund | | (10,325) | | | (115,711) | | | — | | | — | | | (126,036) | |
| Transfer in | | — | | | 29,438 | | | — | | | — | | | 29,438 | |
| Transfer out | | — | | | (261,674) | | | — | | | — | | | (261,674) | |
Purchases(1) | | 110 | | | 113,708 | | | 4,000 | | | — | | | 117,818 | |
Sales/settlements(2) | | (51) | | | (56,530) | | | (2,000) | | | (555) | | | (59,136) | |
| Amortized discounts/premiums | | — | | | (345) | | | — | | | 171 | | | (174) | |
| Realized and unrealized appreciation (depreciation), net | | (17,034) | | | 1,222 | | | 8,798 | | | 3,473 | | | (3,541) | |
| Balance, end of period | | $ | 131,732 | | | $ | 274,412 | | | $ | 293,857 | | | $ | 58 | | | $ | 700,059 | |
| Increase (decrease) in net unrealized appreciation/depreciation included in earnings related to financial assets still held at the reporting date | | $ | (17,031) | | | $ | (389) | | | $ | 8,798 | | | $ | 2,865 | | | $ | (5,757) | |
(1)Purchases include paid-in-kind interest and securities received in connection with restructurings.
(2)Sales/settlements include distributions, principal redemptions and securities disposed of in connection with restructurings.
|
| | | | | | | | | | | | | | | | | | | | |
| Level III Assets of Consolidated Funds | | Equity Securities | | Fixed Income | | Partnership
Interests | | Derivatives, Net | | Total |
| Balance, beginning of period | | $ | 159,032 |
| | $ | 564,304 |
| | $ | 283,059 |
| | $ | (3,031 | ) | | $ | 1,003,364 |
|
| Deconsolidation of fund | | (10,325 | ) | | (115,711 | ) | | — |
| | — |
| | (126,036 | ) |
| Transfer in | | — |
| | 29,438 |
| | — |
| | — |
| | 29,438 |
|
| Transfer out | | — |
| | (261,674 | ) | | — |
| | — |
| | (261,674 | ) |
| Purchases(1) | | 110 |
| | 113,708 |
| | 4,000 |
| | — |
| | 117,818 |
|
| Sales/settlements(2) | | (51 | ) | | (56,530 | ) | | (2,000 | ) | | (555 | ) | | (59,136 | ) |
| Amortized discounts/premiums | | — |
| | (345 | ) | | — |
| | 171 |
| | (174 | ) |
| Realized and unrealized appreciation (depreciation), net | | (17,034 | ) | | 1,222 |
| | 8,798 |
| | 3,473 |
| | (3,541 | ) |
| Balance, end of period | | $ | 131,732 |
|
| $ | 274,412 |
|
| $ | 293,857 |
|
| $ | 58 |
|
| $ | 700,059 |
|
| Increase (decrease) in net unrealized appreciation/depreciation included in earnings related to financial assets still held at the reporting date | | $ | (17,031 | ) | | $ | (389 | ) | | $ | 8,798 |
| | $ | 2,865 |
| | $ | (5,757 | ) |
22
| |
(1) | Purchases include paid‑in‑kind interest and securities received in connection with restructurings. |
| |
(2) | Sales/settlements include distributions, principal redemptions and securities disposed of in connection with restructurings. |
Ares Management Corporation
Notes to the Unaudited Condensed Consolidated Financial Statements (Continued)
(Dollars in Thousands, Except Share Data and As Otherwise Noted)
The following tables set forth a summary of changes in the fair value of the Level III measurements for the six months ended June 30, 2019: |
| | | | | | | | | | | | | | | | |
| | | Level III Assets |
| Level III Assets of the Company | | Equity Securities | | Fixed Income | | Partnership
Interests | | Total |
| Balance, beginning of period | | $ | 10,397 |
| | $ | 60,824 |
| | $ | 35,192 |
| | $ | 106,413 |
|
| Deconsolidation of fund | | — |
| | 10,021 |
| | — |
| | 10,021 |
|
| Purchases(1) | | 2,000 |
| | 2,146 |
| | — |
| | 4,146 |
|
| Sales/settlements(2) | | — |
| | (11,169 | ) | | — |
| | (11,169 | ) |
| Realized and unrealized appreciation, net | | — |
| | 2,229 |
| | — |
| | 2,229 |
|
| Balance, end of period | | $ | 12,397 |
| | $ | 64,051 |
| | $ | 35,192 |
| | $ | 111,640 |
|
| Increase in net unrealized appreciation included in earnings related to financial assets still held at the reporting date | | $ | — |
| | $ | 2,479 |
| | $ | — |
| | $ | 2,479 |
|
|
| | | | | | | | | | | | | | | | | | | | |
| Level III Assets of Consolidated Funds | | Equity Securities | | Fixed Income | | Partnership
Interests | | Derivatives, Net | | Total |
| Balance, beginning of period | | $ | 150,752 |
| | $ | 547,958 |
| | $ | 271,447 |
| | $ | 680 |
| | $ | 970,837 |
|
| Deconsolidation of fund | | (10,325 | ) | | (174,593 | ) | | — |
| | — |
| | (184,918 | ) |
| Transfer in | | — |
| | 41,245 |
| | — |
| | — |
| | 41,245 |
|
| Transfer out | | — |
| | (247,573 | ) | | — |
| | — |
| | (247,573 | ) |
| Purchases(1) | | 10,882 |
| | 238,870 |
| | 8,000 |
| | — |
| | 257,752 |
|
| Sales/settlements(2) | | (5,137 | ) | | (136,329 | ) | | (2,000 | ) | | (581 | ) | | (144,047 | ) |
| Amortized discounts/premiums | | — |
| | (37 | ) | | — |
| | 22 |
| | (15 | ) |
| Realized and unrealized appreciation (depreciation), net | | (14,440 | ) | | 4,871 |
| | 16,410 |
| | (63 | ) | | 6,778 |
|
| Balance, end of period | | $ | 131,732 |
|
| $ | 274,412 |
|
| $ | 293,857 |
|
| $ | 58 |
|
| $ | 700,059 |
|
| Increase (decrease) in net unrealized appreciation/depreciation included in earnings related to financial assets still held at the reporting date | | $ | (14,442 | ) | | $ | 1,114 |
| | $ | 16,410 |
| | $ | (49 | ) | | $ | 3,033 |
|
| |
(1) | Purchases include paid‑in‑kind interest and securities received in connection with restructurings. |
| |
(2) | Sales/settlements include distributions, principal redemptions and securities disposed of in connection with restructurings. |
Ares Management Corporation
Notes to the Unaudited Condensed Consolidated Financial Statements (Continued)
(Dollars in Thousands, Except Share Data and As Otherwise Noted)
The following tables set forth a summary of changes in the fair value of the Level III measurements for the three months ended June 30, 2018:
|
| | | | | | | | | | | | |
| | | Level III Assets |
| Level III Assets of the Company | | Fixed Income | | Partnership
Interests | | Total |
| Balance, beginning of period | | $ | 242,984 |
| | $ | 44,769 |
| | $ | 287,753 |
|
| Sales/settlements(2) | | (219,744 | ) | | — |
| | (219,744 | ) |
| Realized and unrealized appreciation (depreciation), net | | (1,115 | ) | | 2,450 |
| | 1,335 |
|
| Balance, end of period | | $ | 22,125 |
| | $ | 47,219 |
| | $ | 69,344 |
|
| Increase (decrease) in net unrealized appreciation/depreciation included in earnings related to financial assets still held at the reporting date | | $ | (100 | ) | | $ | 2,450 |
| | $ | 2,350 |
|
|
| | | | | | | | | | | | | | | | | | | | |
| Level III Assets of Consolidated Funds | | Equity Securities | | Fixed Income | | Partnership Interests | | Derivatives, Net | | Total |
| Balance, beginning of period | | $ | 160,422 |
| | $ | 240,763 |
| | $ | 252,700 |
| | $ | 86 |
| | $ | 653,971 |
|
| Transfer in | | — |
| | 94,776 |
| | — |
| | — |
| | 94,776 |
|
| Transfer out | | — |
| | (68,328 | ) | | — |
| | — |
| | (68,328 | ) |
| Purchases(1) | | — |
| | 273,879 |
| | 6,000 |
| | — |
| | 279,879 |
|
| Sales/settlements(2) | | — |
| | (57,206 | ) | | — |
| | (17 | ) | | (57,223 | ) |
| Amortized discounts/premiums | | — |
| | (9 | ) | | — |
| | (21 | ) | | (30 | ) |
| Realized and unrealized appreciation (depreciation), net | | 24,161 |
| | (1,500 | ) | | (7,092 | ) | | 182 |
| | 15,751 |
|
| Balance, end of period | | $ | 184,583 |
| | $ | 482,375 |
| | $ | 251,608 |
| | $ | 230 |
| | $ | 918,796 |
|
| Increase (decrease) in net unrealized appreciation/depreciation included in earnings related to financial assets still held at the reporting date | | $ | (2,090 | ) | | $ | (3,785 | ) | | $ | — |
| | $ | 134 |
| | $ | (5,741 | ) |
| |
(1) | Purchases include paid‑in‑kind interest and securities received in connection with restructurings. |
| |
(2) | Sales/settlements include distributions, principal redemptions and securities disposed of in connection with restructurings. |
Ares Management Corporation
Notes to the Unaudited Condensed Consolidated Financial Statements (Continued)
(Dollars in Thousands, Except Share Data and As Otherwise Noted)
The following tables set forth a summary of changes in the fair value of the Level III measurements for the six months ended June 30, 2018:2020:
| | | | | | | | | | | | | | | | | | | | | | | | | | | |
| | Level III Assets | | | | | | | |
| Level III Assets of the Company | | Equity Securities | | Fixed Income | | Partnership Interests | | Total | |
| Balance, beginning of period | | $ | 14,704 | | | $ | 69,183 | | | $ | 35,192 | | | $ | 119,079 | | |
| | | | | | | | | |
Additions(1) | | — | | | 3,686 | | | — | | | 3,686 | | |
Purchases(2) | | — | | | 1,301 | | | — | | | 1,301 | | |
Sales/settlements(3) | | — | | | (688) | | | (32,430) | | | (33,118) | | |
| Realized and unrealized depreciation, net | | — | | | (6,127) | | | (187) | | | (6,314) | | |
| Balance, end of period | | $ | 14,704 | | | $ | 67,355 | | | $ | 2,575 | | | $ | 84,634 | | |
| Increase (decrease) in net unrealized appreciation/depreciation included in earnings related to financial assets still held at the reporting date | | $ | — | | | $ | (5,092) | | | $ | 5,511 | | | $ | 419 | | |
|
| | | | | | | | | | | | |
| | | Level III Assets |
| Level III Assets of the Company | | Fixed Income | | Partnership
Interests | | Total |
| Balance, beginning of period | | $ | 195,158 |
| | $ | 44,769 |
| | $ | 239,927 |
|
| Deconsolidation of fund | | 78 |
| | — |
| | 78 |
|
| Purchases(1) | | 48,731 |
| | — |
| | 48,731 |
|
| Sales/settlements(2) | | (220,571 | ) | | — |
| | (220,571 | ) |
| Realized and unrealized appreciation (depreciation), net | | (1,271 | ) | | 2,450 |
| | 1,179 |
|
| Balance, end of period | | $ | 22,125 |
| | $ | 47,219 |
| | $ | 69,344 |
|
| Increase (decrease) in net unrealized appreciation/depreciation included in earnings related to financial assets still held at the reporting date | | $ | (829 | ) | | $ | 2,450 |
| | $ | 1,621 |
|
| | | | | | | | | | | | | | | | | | | | | | | | | | | | | | | | |
| Level III Net Assets of Consolidated Funds | | Equity Securities | | Fixed Income | | Partnership
Interests | | Derivatives, Net | | Total |
| Balance, beginning of period | | $ | 85,988 | | | $ | 339,136 | | | $ | 296,012 | | | $ | (4,106) | | | $ | 717,030 | |
Additions(1) | | (635) | | | 392,672 | | | — | | | — | | | 392,037 | |
| | | | | | | | | | |
| Transfer in | | — | | | 258,014 | | | — | | | — | | | 258,014 | |
| Transfer out | | (5) | | | (346,163) | | | — | | | — | | | (346,168) | |
Purchases(2) | | 393 | | | 200,643 | | | 64,000 | | | — | | | 265,036 | |
Sales/settlements(3) | | (681) | | | (218,523) | | | (56,000) | | | (1,318) | | | (276,522) | |
| Amortized discounts/premiums | | — | | | 1,098 | | | — | | | 150 | | | 1,248 | |
| Realized and unrealized appreciation (depreciation), net | | (42,801) | | | (40,590) | | | 8,624 | | | 6,676 | | | (68,091) | |
| Balance, end of period | | $ | 42,259 | | | $ | 586,287 | | | $ | 312,636 | | | $ | 1,402 | | | $ | 942,584 | |
| Increase (decrease) in net unrealized appreciation/depreciation included in earnings related to financial assets still held at the reporting date | | $ | (42,811) | | | $ | (40,533) | | | $ | 8,624 | | | $ | 5,321 | | | $ | (69,399) | |
|
| | | | | | | | | | | | | | | | | | | | |
| Level III Assets of Consolidated Funds | | Equity Securities | | Fixed Income | | Partnership Interests | | Derivatives, Net | | Total |
| Balance, beginning of period | | $ | 162,577 |
| | $ | 267,889 |
| | $ | 232,332 |
| | $ | 904 |
| | $ | 663,702 |
|
| Deconsolidation of fund | | — |
| | (233 | ) | | — |
| | — |
| | (233 | ) |
| Transfer in | | — |
| | 95,450 |
| | — |
| | — |
| | 95,450 |
|
| Transfer out | | — |
| | (73,777 | ) | | — |
| | — |
| | (73,777 | ) |
| Purchases(1) | | — |
| | 313,462 |
| | 16,000 |
| | — |
| | 329,462 |
|
| Sales/settlements(2) | | — |
| | (117,503 | ) | | — |
| | (194 | ) | | (117,697 | ) |
| Amortized discounts/premiums | | — |
| | 35 |
| | — |
| | (14 | ) | | 21 |
|
| Realized and unrealized appreciation (depreciation), net | | 22,006 |
| | (2,948 | ) | | 3,276 |
| | (466 | ) | | 21,868 |
|
| Balance, end of period | | $ | 184,583 |
| | $ | 482,375 |
| | $ | 251,608 |
| | $ | 230 |
| | $ | 918,796 |
|
| Increase (decrease) in net unrealized appreciation/depreciation included in earnings related to financial assets still held at the reporting date | | $ | (12,211 | ) | | $ | (1,671 | ) | | $ | 3,276 |
| | $ | (566 | ) | | $ | (11,172 | ) |
(1)Additions relate to the net increase from consolidation of new funds or entities. For Consolidated Funds, additions are also offset by the deconsolidation of a fund.
(2)Purchases include paid-in-kind interest and securities received in connection with restructuring.
(3)Sales/settlements include distributions, principal redemptions and securities disposed of in connection with restructurings.
Ares Management Corporation
Notes to the Unaudited Condensed Consolidated Financial Statements (Continued)
(Dollars in Thousands, Except Share Data and As Otherwise Noted)
The following tables set forth a summary of changes in the fair value of the Level III measurements for the six months ended June 30, 2019:
| | | | | | | | | | | | | | | | | | | | | | | | | | |
| | Level III Assets | | | | | | |
| Level III Assets of the Company | | Equity Securities | | Fixed Income | | Partnership Interests | | Total |
| Balance, beginning of period | | $ | 10,397 | | | $ | 60,824 | | | $ | 35,192 | | | $ | 106,413 | |
| Deconsolidation of fund | | — | | | 10,021 | | | — | | | 10,021 | |
| | | | | | | | |
Purchases(1) | | 2,000 | | | 2,146 | | | — | | | 4,146 | |
Sales/settlements(2) | | — | | | (11,169) | | | — | | | (11,169) | |
| Realized and unrealized appreciation, net | | — | | | 2,229 | | | — | | | 2,229 | |
| Balance, end of period | | $ | 12,397 | | | $ | 64,051 | | | $ | 35,192 | | | $ | 111,640 | |
| Increase in net unrealized appreciation included in earnings related to financial assets still held at the reporting date | | $ | — | | | $ | 2,479 | | | $ | — | | | $ | 2,479 | |
| | | | | | | | | | | | | | | | | | | | | | | | | | | | | | | | |
| Level III Net Assets of Consolidated Funds | | Equity Securities | | Fixed Income | | Partnership Interests | | Derivatives, Net | | Total |
| Balance, beginning of period | | $ | 150,752 | | | $ | 547,958 | | | $ | 271,447 | | | $ | 680 | | | $ | 970,837 | |
| Deconsolidation of fund | | (10,325) | | | (174,593) | | | — | | | — | | | (184,918) | |
| Transfer in | | — | | | 41,245 | | | — | | | — | | | 41,245 | |
| Transfer out | | — | | | (247,573) | | | — | | | — | | | (247,573) | |
Purchases(1) | | 10,882 | | | 238,870 | | | 8,000 | | | — | | | 257,752 | |
Sales/settlements(2) | | (5,137) | | | (136,329) | | | (2,000) | | | (581) | | | (144,047) | |
| Amortized discounts/premiums | | — | | | (37) | | | — | | | 22 | | | (15) | |
| Realized and unrealized appreciation (depreciation), net | | (14,440) | | | 4,871 | | | 16,410 | | | (63) | | | 6,778 | |
| Balance, end of period | | $ | 131,732 | | | $ | 274,412 | | | $ | 293,857 | | | $ | 58 | | | $ | 700,059 | |
| Increase (decrease) in net unrealized appreciation/depreciation included in earnings related to financial assets still held at the reporting date | | $ | (14,442) | | | $ | 1,114 | | | $ | 16,410 | | | $ | (49) | | | $ | 3,033 | |
| |
(1) | Purchases include paid‑in‑kind interest and securities received in connection with restructurings. |
| |
(2) | Sales/settlements include distributions, principal redemptions and securities disposed of in connection with restructurings. |
(1)Purchases include paid-in-kind interest and securities received in connection with restructurings.
(2)Sales/settlements include distributions, principal redemptions and securities disposed of in connection with restructurings.
The Company recognizes transfers between the levels as of the beginning of the period. Transfers out of Level III were generally attributable to certain investments that experienced a more significant level of market activity during the period and thus were valued using observable inputs either from independent pricing services or multiple brokers. Transfers into Level III were generally attributable to certain investments that experienced a less significant level of market activity during the period and thus were only able to obtain one or fewer quotes from a broker or independent pricing service.
Ares Management Corporation
Notes to the Unaudited Condensed Consolidated Financial Statements (Continued)
(Dollars in Thousands, Except Share Data and As Otherwise Noted)
The following table summarizes the quantitative inputs and assumptions used for the Company’s and the Consolidated Funds' Level III measurements as of June 30, 2019:
|
| | | | | | | | | |
| Level III Measurements of the Company | Fair Value | | Valuation Technique(s) | | Significant Unobservable Input(s) | | Range |
| Assets | | | | | | | |
| Equity securities | $ | 12,397 |
| | Transaction price(1) | | N/A | | N/A |
| Partnership interests | 35,192 |
| | Discounted cash flow | | Discount rate | | 8.0% |
| Collateralized loan obligations | 26,241 |
| | Broker quotes and/or 3rd party pricing services | | N/A | | N/A |
| Other fixed income | 37,810 |
| | Other | | N/A | | N/A |
| Total | $ | 111,640 |
| | | | | | |
|
| | | | | | | | | | | |
| Level III Measurements of the Consolidated Funds | Fair Value | | Valuation Technique(s) | | Significant Unobservable Input(s) | | Range | | Weighted
Average |
| Assets | | | | | | | | | |
| Equity securities | | | | | | | | | |
| | $ | 609 |
| | Enterprise value market multiple analysis | | EBITDA multiple(2) | | 8.7x - 22.4x | | 13.2x |
| | 74,241 |
| | Other | | Net income multiple | | 36.1x - 40.0x | | 37.8x |
| |
|
| |
| | Illiquidity discount | | 25.0% | | 25.0% |
| | 56,882 |
| | Transaction price(1) | | N/A | | N/A | | N/A |
| Partnership interest | 293,857 |
| | Discounted cash flow | | Discount rate | | 21.4% | | 21.4% |
| Fixed income securities | | | | | | | | | |
| | 191,789 |
| | Broker quotes and/or 3rd party pricing services | | N/A | | N/A | | N/A |
| | 82,623 |
| | Income approach | | Yield | | 5.0% - 13.2% | | 8.9% |
| Derivative instruments | 705 |
| | Broker quotes and/or 3rd party pricing services | | N/A | | N/A | | N/A |
| Total assets | $ | 700,706 |
| | | | | | | | |
| Liabilities | | | | | | | | | |
| Derivatives instruments | $ | (647 | ) | | Broker quotes and/or 3rd party pricing services | | N/A | | N/A | | N/A |
| Total liabilities | $ | (647 | ) | | | | | | | | |
| | | | | | | | | | | | | | | | | | | | | | | | | | |
| Level III Measurements of the Company | | Fair Value | | Valuation Technique(s) | | Significant Unobservable Input(s) | | Range |
| Assets | | | | | | | | |
| Equity securities | | $ | 14,704 | | | Transaction price(1) | | N/A | | N/A |
| Partnership interests | | 2,575 | | | Other | | N/A | | N/A |
| | | | | | | | |
| Collateralized loan obligations | | 19,135 | | | Broker quotes and/or 3rd party pricing services | | N/A | | N/A |
| Other fixed income | | 48,220 | | | Other | | N/A | | N/A |
| Total | | $ | 84,634 | | | | | | | |
| | | | | | | | | | | | | | | | | | | | | | | | | | | | | | | | |
| Level III Measurements of the Consolidated Funds | | Fair Value | | Valuation Technique(s) | | Significant Unobservable Input(s) | | Range | | Weighted Average |
| Assets | | | | | | | | | | |
| Equity securities | | | | | | | | | | |
| | $ | 136 | | | Market approach | | EBITDA multiple(2) | | 5.4x - 18.0x | | 8.8x |
| | 40,096 | | | Other | | Net income multiple | | 27.5x | | 27.5x |
| | | | | | Illiquidity discount | | 25.0% | | 25.0% |
| | 27 | | | Broker quotes and/or 3rd party pricing services | | N/A | | N/A | | N/A |
| | | 2,000 | | | Transaction price(1) | | N/A | | N/A | | N/A |
| Partnership interest | | 312,636 | | | Discounted cash flow | | Discount rate | | 16.1% | | 16.1% |
| Fixed income securities | | | | | | | | | | |
| | 493,686 | | | Broker quotes and/or 3rd party pricing services | | N/A | | N/A | | N/A |
| | 1,846 | | | Market approach | | EBITDA multiple | | 7.8x | | 7.8x |
| | 90,755 | | | Income approach | | Yield | | 2.8% - 36.9% | | 8.2% |
| Derivative instruments | | 1,599 | | | Broker quotes and/or 3rd party pricing services | | N/A | | N/A | | N/A |
| Total assets | | $ | 942,781 | | | | | | | | | |
| Liabilities | | | | | | | | | | |
| Derivatives instruments | | $ | (197) | | | Broker quotes and/or 3rd party pricing services | | N/A | | N/A | | N/A |
| Total liabilities | | $ | (197) | | | | | | | | | |
| |
(1) | Transaction price consists of securities recently purchased or restructured. The Company determined that there was no change to the valuation based on the underlying assumptions used at the closing of such transactions. |
| |
(2) | “EBITDA” in the table above is a non-GAAP financial measure and refers to earnings before interest, tax, depreciation and amortization. |
Ares Management Corporation
Notes to the Unaudited Condensed Consolidated Financial Statements (Continued)
(Dollars in Thousands, Except Share Data and As Otherwise Noted)
The following table summarizes the quantitative inputs and assumptions used for the Company’s and the Consolidated Funds' Level III measurements as of December 31, 2018:2019:
| | | | | | | | | | | | | | | | | | | | | | | | | | |
| Level III Measurements of the Company | | Fair Value | | Valuation Technique(s) | | Significant Unobservable Input(s) | | Range |
| Assets | | | | | | | | |
| Equity securities | | $ | 14,704 | | | Transaction price(1) | | N/A | | N/A |
| Partnership interests | | 32,661 | | | Transaction price(1) | | N/A | | N/A |
| | 2,531 | | | Other | | N/A | | N/A |
| Collateralized loan obligations | | 22,265 | | | Broker quotes and/or 3rd party pricing services | | N/A | | N/A |
| Other fixed income | | 46,918 | | | Other | | N/A | | N/A |
| Total | | $ | 119,079 | | | | | | | |
|
| | | | | | | | | |
| Level III Measurements of the Company | Fair Value | | Valuation Technique(s) | | Significant Unobservable Input(s) | | Range |
| Assets | | | | | | | |
| Equity securities | $ | 10,397 |
| | Transaction price(1) | | N/A | | N/A |
| Partnership interests | 35,192 |
| | Discounted cash flow | | Discount rate | | 8.0% |
| Collateralized loan obligations | 20,824 |
| | Broker quotes and/or 3rd party pricing services | | N/A | | N/A |
| Other fixed income | 40,000 |
| | Other | | N/A | | N/A |
| Total | $ | 106,413 |
| | | | | | |
| | | | | | | | | | | | | | | | | | | | | | | | | | | | | | | | |
| Level III Measurements of the Consolidated Funds | | Fair Value | | Valuation Technique(s) | | Significant Unobservable Input(s) | | Range | | Weighted Average |
| Assets | | | | | | | | | | |
| Equity securities | | | | | | | | | | |
| | $ | 431 | | | Market approach | | EBITDA multiple(2) | | 8.2x - 21.3x | | 16.1x |
| | 40,745 | | | Other | | Net income multiple | | 36.2x | | 36.2x |
| | | | | | Illiquidity discount | | 25.0% | | 25.0% |
| | | 44,812 | | | Transaction price(1) | | N/A | | N/A | | N/A |
| Partnership interests | | 296,012 | | | Discounted cash flow | | Discount rate | | 19.6% | | 19.6% |
| Fixed income securities | | | | | | | | | | |
| | 271,919 | | | Broker quotes and/or 3rd party pricing services | | N/A | | N/A | | N/A |
| | 67,217 | | | Income approach | | Yield | | 4.8% - 14.3% | | 9.7% |
| | | | | | | | | | |
| Total assets | | $ | 721,136 | | | | | | | | | |
| Liabilities | | | | | | | | | | |
| Derivatives instruments | | $ | (4,106) | | | Broker quotes and/or 3rd party pricing services | | N/A | | N/A | | N/A |
| Total liabilities | | $ | (4,106) | | | | | | | | | |
|
| | | | | | | | | | | |
| Level III Measurements of the Consolidated Funds | Fair Value | | Valuation Technique(s) | | Significant Unobservable Input(s) | | Range | | Weighted Average |
| Assets | | | | | | | | | |
| Equity securities | | | | | | | | | |
| | $ | 23,871 |
| | Enterprise value market multiple analysis | | EBITDA multiple(2) | | 7.2x - 22.9x | | 7.7x |
| | 41,562 |
| | Other | | Net income multiple | | 38.8x | | 38.8x |
| |
|
| | | | Illiquidity discount | | 25.0% | | 25.0% |
| | 271,447 |
| | Discounted cash flow | | Discount rate | | 20.8% | | 20.8% |
| | 85,319 |
| | Transaction price(1) | | N/A | | N/A | | N/A |
| Fixed income securities |
|
| | | | | |
| |
|
| | 441,368 |
| | Broker quotes and/or 3rd party pricing services | | N/A | | N/A | | N/A |
| | 106,590 |
| | Income approach | | Yield | | 1.0% - 14.8% | | 9.6% |
| Derivative instruments | 1,328 |
| | Broker quotes and/or 3rd party pricing services | | N/A | | N/A | | N/A |
| Total assets | $ | 971,485 |
| | | | | | | | |
| Liabilities | | | | | | | | | |
| Derivatives instruments | $ | (648 | ) | | Broker quotes and/or 3rd party pricing services | | N/A | | N/A | | N/A |
| Total liabilities | $ | (648 | ) | | | | | | | | |
| |
(1) | Transaction price consists of securities purchased or restructured. The Company determined that there has been no change to the valuation based on the underlying assumptions used at the closing of such transactions. |
| |
(2) | “EBITDA” in the table above is a non-GAAP financial measure and refers to earnings before interest, tax, depreciation and amortization. |
(1)Transaction price consists of securities purchased or restructured. The Company determined that there has been no change to the valuation based on the underlying assumptions used at the closing of such transactions.
(2)“EBITDA” in the table above is a non-GAAP financial measure and refers to earnings before interest, tax, depreciation and amortization.
The Company has an insurance-related investment in a private fund managed by a third party that is valued using net asset value (“NAV”)NAV per share. The terms and conditions of this fund do not allow for redemptions without certain events or approvals that are outside the Company's control. This investment had a fair value of $1.2$3.0 million and $0.8$1.6 million as of June 30, 20192020 and December 31, 2018,2019, respectively. The Company has no0 unfunded commitments for this investment.
Ares Management Corporation
Notes to the Unaudited Condensed Consolidated Financial Statements (Continued)
(Dollars in Thousands, Except Share Data and As Otherwise Noted)
6. DERIVATIVE FINANCIAL INSTRUMENTS
In the normal course of business, the Company and the Consolidated Funds are exposed to certain risks relating to their ongoing operations and use various types of derivative instruments primarily to mitigate against credit and foreign exchange risk. The derivative instruments are not designated as hedging instruments under the accounting standards for derivatives and hedging. The Company recognizes all of its derivative instruments at fair value as either assets or liabilities in the Condensed Consolidated Statements of Financial Condition within other assets or accounts payable, accrued expenses and other liabilities, respectively. These amounts may be offset to the extent that there is a legal right to offset and if elected by management.
The following tables identify the fair value and notional amounts of derivative contracts by major product type on a gross basis for the Company and the Consolidated Funds asFunds:
| | | | | | | | | | | | | | | | | | | | | | | | | | | | | | | | | | | | | | | | | | | | | | | | | | |
| | As of June 30, 2020 | | | | | | | | As of December 31, 2019 | | | | | | |
| | Assets | | | | Liabilities | | | | Assets | | | | Liabilities | | |
| The Company | | Notional(1) | | Fair Value | | Notional(1) | | Fair Value | | Notional(1) | | Fair Value | | Notional(1) | | Fair Value |
| Foreign exchange contracts | | $ | 56,555 | | | $ | 4,719 | | | $ | 2,124 | | | $ | 128 | | | $ | 67,930 | | | $ | 4,023 | | | $ | 10,846 | | | $ | 113 | |
Total derivatives, at fair value(2) | | $ | 56,555 | | | $ | 4,719 | | | $ | 2,124 | | | $ | 128 | | | $ | 67,930 | | | $ | 4,023 | | | $ | 10,846 | | | $ | 113 | |
| | | | | | | | | | | | | | | | | | | | | | | | | | | | | | | | | | | | | | | | | | | | | | | | | | |
| | As of June 30, 2020 | | | | | | | | As of December 31, 2019 | | | | | | |
| | Assets | | | | Liabilities | | | | Assets | | | | Liabilities | | |
| Consolidated Funds | | Notional(1) | | Fair Value | | Notional(1) | | Fair Value | | Notional(1) | | Fair Value | | Notional(1) | | Fair Value |
| Foreign exchange contracts | | $ | — | | | $ | — | | | $ | — | | | $ | — | | | $ | 667 | | | $ | 667 | | | $ | 667 | | | $ | 670 | |
| Asset swap - other | | 6,883 | | | 1,599 | | | 424 | | | 197 | | | — | | | — | | | 7,640 | | | 4,106 | |
Total derivatives, at fair value(3) | | $ | 6,883 | | | $ | 1,599 | | | $ | 424 | | | $ | 197 | | | $ | 667 | | | $ | 667 | | | $ | 8,307 | | | $ | 4,776 | |
(1)Represents the total contractual amount of derivative assets and liabilities outstanding.
(2)As of June 30, 20192020 and December 31, 2018:2019, the Company had the right to, but elected not to, offset an immaterial amount of its derivative liabilities.
(3)As of June 30, 2020 and December 31, 2019, the Consolidated Funds offset $0.4 million and $0.1 million of their derivative assets and liabilities, respectively.
|
| | | | | | | | | | | | | | | | | | | | | | | | | | | | | | | | |
| | | As of June 30, 2019 | | As of December 31, 2018 |
| | | Assets | | Liabilities | | Assets | | Liabilities |
| The Company | | Notional(1) | | Fair Value | | Notional(1) | | Fair Value | | Notional(1) | | Fair Value | | Notional(1) | | Fair Value |
| Foreign exchange contracts | | $ | 37,667 |
| | $ | 1,890 |
| | $ | 75,252 |
| | $ | 610 |
| | $ | 33,026 |
| | $ | 1,066 |
| | $ | 27,140 |
| | $ | 869 |
|
| Total derivatives, at fair value(2) | | $ | 37,667 |
| | $ | 1,890 |
| | $ | 75,252 |
| | $ | 610 |
| | $ | 33,026 |
| | $ | 1,066 |
| | $ | 27,140 |
| | $ | 869 |
|
|
| | | | | | | | | | | | | | | | | | | | | | | | | | | | | | | | |
| | | As of June 30, 2019 | | As of December 31, 2018 |
| | | Assets | | Liabilities | | Assets | | Liabilities |
| Consolidated Funds | | Notional(1) | | Fair Value | | Notional(1) | | Fair Value | | Notional(1) | | Fair Value | | Notional(1) | | Fair Value |
| Foreign exchange contracts | | $ | 342 |
| | $ | 342 |
| | $ | 342 |
| | $ | 345 |
| | $ | 1,881 |
| | $ | 1,881 |
| | $ | 1,881 |
| | $ | 1,864 |
|
| Asset swap - other | | 4,830 |
| | 705 |
| | 2,292 |
| | 647 |
| | 5,226 |
| | 1,328 |
| | 2,605 |
| | 648 |
|
| Total derivatives, at fair value(3) | | $ | 5,172 |
|
| $ | 1,047 |
|
| $ | 2,634 |
|
| $ | 992 |
|
| $ | 7,107 |
|
| $ | 3,209 |
|
| $ | 4,486 |
|
| $ | 2,512 |
|
| |
(1) | Represents the total contractual amount of derivative assets and liabilities outstanding. |
| |
(2) | As of June 30, 2019 and December 31, 2018, the Company had the right to, but elected not to, offset $0.6 million and $0.9 million of its derivative liabilities, respectively. |
| |
(3) | As of June 30, 2019 and December 31, 2018, the Consolidated Funds offset $10.6 million and $5.7 million of their derivative assets and liabilities, respectively. |
Ares Management Corporation
Notes to the Unaudited Condensed Consolidated Financial Statements (Continued)
(Dollars in Thousands, Except Share Data and As Otherwise Noted)
7. DEBT
The following table summarizes the Company’s and its subsidiaries’ debt obligations:
| | | | | | | | | | | | | | | | | | | | | | | | | | | | | | | | | | | | | | | | | |
| | | | | | | As of June 30, 2020 | | | | As of December 31, 2019 | | |
| Debt Origination Date | | Maturity | | Original Borrowing Amount | | Carrying
Value | | Interest Rate | | Carrying
Value | | Interest Rate |
Credit Facility(1) | Revolver | | 3/30/2025 | | N/A | | $ | — | | | —% | | $ | 70,000 | | | 3.06% |
2024 Senior Notes(2) | 10/8/2014 | | 10/8/2024 | | $ | 250,000 | | | 246,943 | | | 4.21 | | 246,609 | | | 4.21 |
2030 Senior Notes(3) | 6/15/2020 | | 6/15/2030 | | 400,000 | | | 395,531 | | | 3.28 | | — | | | — |
| Total debt obligations | | | | | | | $ | 642,474 | | | | | $ | 316,609 | | | |
|
| | | | | | | | | | | | | | | | | | | |
| | | | | | | | As of June 30, 2019 | | As of December 31, 2018 |
| | Debt Origination Date | | Maturity | | Original Borrowing Amount | | Carrying
Value | | Interest Rate | | Carrying
Value | | Interest Rate |
| Credit Facility(1) | Revolver | | 3/21/2024 | | N/A |
| | $ | 320,000 |
| | 3.69% | | $ | 235,000 |
| | 4.00% |
| Senior Notes(2) | 10/8/2014 | | 10/8/2024 | | $ | 250,000 |
| | 246,277 |
| | 4.21% | | 245,952 |
| | 4.21% |
| Total debt obligations | | | | | | | $ | 566,277 |
| | | | $ | 480,952 |
| | |
| |
(1) | The AOG entities are borrowers under the Credit Facility, which provides a $1.065 billion revolving line of credit. It has a variable interest rate based on LIBOR or a base rate plus an applicable margin with an unused commitment fee paid quarterly, which is subject to change with the Company’s underlying credit agency rating. On March 21, 2019,(1)The AOG entities are borrowers under the Credit Facility, which provides a $1.065 billion revolving line of credit. It has a variable interest rate based on LIBOR or a base rate plus an applicable margin with an unused commitment fee paid quarterly, which is subject to change with the Company’s underlying credit agency rating. On March 30, 2020, the Company amended the Credit Facility to, among other things, extend the maturity date from February 2022 to March 2024 to March 2025 and to reduce borrowing costs on the drawn and undrawn amounts. As of June 30, 2019, base rate loans bear interest calculated based on the base rate plus 0.25% and the LIBOR rate loans bear interest calculated based on LIBOR plus 1.25%. The unused commitment fee is 0.15% per annum. There is a base rate and LIBOR floor of zero. |
| |
(2) | The Senior Notes were issued in October 2014 by Ares Finance Co. LLC, a subsidiary of the Company, at 98.268% of the face amount with interest paid semi-annually. The Company may redeem the Senior Notes prior to maturity, subject to the terms of the indenture.
|
As of June 30, 2019,2020, base rate loans bear interest calculated based on the base rate plus 0.25% and the LIBOR rate loans bear interest calculated based on LIBOR plus 1.25%. The unused commitment fee is 0.13% per annum. There is a base rate and LIBOR floor of 0.
(2)The 2024 Senior Notes were issued in October 2014 by Ares Finance Co. LLC, an indirect subsidiary of the Company, at 98.27% of the face amount with interest paid semi-annually. The Company may redeem the 2024 Senior Notes prior to maturity, subject to the terms of the indenture governing the 2024 Notes.
(3)The 2030 Senior Notes were issued in June 2020 by Ares Finance Co. II LLC, an indirect subsidiary of the Company, at 99.77% of the face amount with interest paid semi-annually. The Company may redeem the 2030 Senior Notes prior to maturity, subject to the terms of the indenture governing the 2030 Notes.
As of June 30, 2020, the Company and its subsidiaries were in compliance with all covenants under the debt obligations.
The Company typically incurs and pays debt issuance costs when entering into a new debt obligation or when amending an existing debt agreement. Debt issuance costs related to the Company's2024 and 2030 Senior Notes (the “Senior Notes”) are recorded as a reduction of the corresponding debt obligation, and debt issuance costs related to the Credit Facility are included in other assets in the Condensed Consolidated Statements of Financial Condition. All debt issuance costs are amortized over the remaining term of the related obligation.
The following table presents the activity of the Company's debt issuance costs:
| | | | | | | | | | | | | | | |
| Credit Facility | | Senior Notes | | | | |
| | | | | | | |
| | | | | | | |
| | | | | | | |
| | | | | | | |
| Unamortized debt issuance costs as of December 31, 2019 | $ | 5,255 | | | $ | 1,102 | | | | | |
| Debt issuance costs incurred | 1,217 | | | 3,586 | | | | | |
| Amortization of debt issuance costs | (626) | | | (146) | | | | | |
| | | | | | | |
| Unamortized debt issuance costs as of June 30, 2020 | $ | 5,846 | | | $ | 4,542 | | | | | |
|
| | | | | | | |
| | Credit Facility | | Senior Notes |
| Unamortized debt issuance costs as of December 31, 2018 | $ | 4,972 |
| | $ | 1,334 |
|
| Debt issuance costs incurred | 1,521 |
| | — |
|
| Amortization of debt issuance costs | (677 | ) | | (116 | ) |
| Unamortized debt issuance costs as of June 30, 2019 | $ | 5,816 |
| | $ | 1,218 |
|
Loan Obligations of the Consolidated CLOs
Loan obligations of the Consolidated Funds that are CLOs ("(“Consolidated CLOs"CLOs”) represent amounts due to holders of debt securities issued by the Consolidated CLOs. The Company measures the loan obligations of the Consolidated CLOs using the fair value of the financial assets of its Consolidated CLOs.
Ares Management Corporation
Notes to the Unaudited Condensed Consolidated Financial Statements (Continued)
(Dollars in Thousands, Except Share Data and As Otherwise Noted)
As of June 30, 2019 and December 31, 2018, theThe following loan obligations were outstanding and classified as liabilities of the Consolidated CLOs:
| | | | | | | | | | | | | | | | | | | | | | | | | | | | | | | | | | | |
| As of June 30, 2020 | | | | | | As of December 31, 2019 | | | | |
| Loan Obligations | | Fair Value of Loan Obligations | | Weighted
Average
Remaining Maturity
In Years | | Loan
Obligations | | Fair Value of Loan Obligations | | Weighted Average Remaining Maturity In Years |
Senior secured notes(1) | $ | 9,528,637 | | | $ | 9,003,995 | | | 10.5 | | $ | 7,738,337 | | | $ | 7,700,038 | | | 11.0 |
Subordinated notes(2) | 541,324 | | | 224,692 | | | 10.6 | | 449,877 | | | 273,710 | | | 11.0 |
| Total loan obligations of Consolidated CLOs | $ | 10,069,961 | | | $ | 9,228,687 | | | | | $ | 8,188,214 | | | $ | 7,973,748 | | | |
|
| | | | | | | | | | | | | | | | | | | |
| | As of June 30, 2019 | | As of December 31, 2018 |
| | Loan Obligations | | Fair Value of Loan Obligations | | Weighted
Average
Remaining Maturity
In Years | | Loan
Obligations | | Fair Value of Loan Obligations | | Weighted Average Remaining Maturity In Years |
| Senior secured notes(1) | $ | 6,879,407 |
| | $ | 6,789,415 |
| | 11.14 | | $ | 6,642,616 |
| | $ | 6,391,643 |
| | 10.94 |
| Subordinated notes(2) | 383,443 |
| | 241,426 |
| | 11.20 | | 455,333 |
| | 286,448 |
| | 11.21 |
| Total loan obligations of Consolidated CLOs | $ | 7,262,850 |
| | $ | 7,030,841 |
| | | | $ | 7,097,949 |
| | $ | 6,678,091 |
| | |
| |
(1) | Original borrowings under the senior secured notes totaled $6.9 billion, with various maturity dates ranging from July 2028 to April 2032. The weighted average interest rate as of June 30, 2019 was 3.56%. |
| |
(2) | Original borrowings under the subordinated notes totaled $383.4 million, with various maturity dates ranging from July 2028 to April 2032. The notes do not have contractual interest rates, instead holders of the notes receive distributions from the excess cash flows generated by each Consolidated CLO. |
(1)Original borrowings under the senior secured notes totaled $9.5 billion, with various maturity dates ranging from July 2028 to October 2032. The weighted average interest rate as of June 30, 2020 was 2.42%.
(2)Original borrowings under the subordinated notes totaled $541.3 million, with various maturity dates ranging from July 2028 to October 2032. The notes do not have contractual interest rates, instead holders of the notes receive distributions from the excess cash flows generated by each Consolidated CLO.
Loan obligations of the Consolidated CLOs are collateralized by the assets held by the Consolidated CLOs, consisting of cash and cash equivalents, corporate loans, corporate bonds and other securities. The assets of one Consolidated CLO may not be used to satisfy the liabilities of another Consolidated CLO. Loan obligations of the Consolidated CLOs include floating rate notes, deferrable floating rate notes, revolving lines of credit and subordinated notes. Amounts borrowed under the notes are repaid based on available cash flows subject to priority of payments under each Consolidated CLO’s governing documents. Based on the terms of these facilities, the creditors of the facilities have no recourse to the Company.
Credit Facilities of the Consolidated Funds
Certain Consolidated Funds maintain credit facilities to fund investments between capital drawdowns. These facilities generally are collateralized by the unfunded capital commitments of the Consolidated Funds’ limited partners, bear an annual commitment fee based on unfunded commitments and contain various affirmative and negative covenants and reporting obligations, including restrictions on additional indebtedness, liens, margin stock, affiliate transactions, dividends and distributions, release of capital commitments and portfolio asset dispositions. The creditors of these facilities have no recourse to the Company and only have recourse to a subsidiary of the Company to the extent the debt is guaranteed by such subsidiary. Credit facilities of the Consolidated Funds are reflected at cost in the Condensed Consolidated Statements of Financial Condition. As of June 30, 20192020 and December 31, 2018,2019, the Consolidated Funds were in compliance with all covenants under such credit facilities.
The Consolidated Funds had the following revolving bank credit facilities and term loan outstanding:
| | | | | | | | | | | | | | | | | | | | | | | | | | | | | | | | | | | | | | | | | | | | |
| | | | | | As of June 30, 2020 | | | | | As of December 31, 2019 | | | |
| Consolidated Funds' Debt Facilities | | Maturity Date | | Total Capacity | | Outstanding Loan(1) | | Effective Rate | | | Outstanding Loan(1) | | Effective Rate | |
| Credit Facilities: | | | | | | | | | | | | | | |
| | 3/5/2021 | | $ | 71,500 | | | $ | 71,500 | | | 1.59% | | | $ | 71,500 | | | 3.14% | |
| | 6/30/2021 | | 112,365 | | | 63,663 | | | 1.00 | (2) | | — | | | N/A | (2) |
| | 1/1/2023 | | 18,000 | | | 17,909 | | | 1.95 | | | 17,550 | | | 3.44 | |
| | 7/15/2028 | | 75,000 | | | 13,500 | | | 4.16 | | | 17,000 | | | 4.75 | |
| Revolving Term Loan | | 2/9/2022 | | 1,900 | | | 465 | | | 8.03 | | | 1,194 | | | 7.70 | |
| Total borrowings of Consolidated Funds | | | | | | $ | 167,037 | | | | | | $ | 107,244 | | | | |
(1)The fair values of the borrowings approximate the carrying value as the interest rate on the borrowings is a floating rate.
(2)The effective rate is based on the three month EURIBOR or 0, whichever is higher, plus a spread of 1.00%.
Ares Management Corporation
Notes to the Unaudited Condensed Consolidated Financial Statements (Continued)
(Dollars in Thousands, Except Share Data and As Otherwise Noted)
The Consolidated Funds had the following revolving bank credit facilities and term loan outstanding as of June 30, 2019 and December 31, 2018:
|
| | | | | | | | | | | | | | | | | | | |
| | | | | | | As of June 30, 2019 | | As of December 31, 2018 | |
| Consolidated Funds' Debt Facilities | | Maturity Date | | Total Capacity | | Outstanding Loan(1) | | Effective Rate | | Outstanding Loan(1) | | Effective Rate | |
| Credit Facilities: | | | | | | | | | | | | | |
| | | 1/1/2023 | | $ | 18,000 |
| | $ | 16,153 |
| | 4.00% | | $ | 14,953 |
| | 3.98% | |
| | | 12/29/2019(2) | | 28,033 |
| | 28,033 |
| | 1.55% | (3) | 43,624 |
| | 1.55% | (3) |
| | | 3/7/2020 | | 71,500 |
| | 71,500 |
| | 3.47% | | 71,500 |
| | 3.47% | |
| | | 6/30/2021 | | 200,375 |
| | — |
| | N/A | | 38,844 |
| | 1.00% | (3) |
| | | 7/15/2028 | | 75,000 |
| | 9,000 |
| | 4.75% | | 39,000 |
| | 4.75% | |
| Revolving Term Loan | | 1/31/2022 | | 1,900 |
| | 1,424 |
| | 8.07% | | 1,363 |
| | 8.07% | |
| Total borrowings of Consolidated Funds | | | | | | $ | 126,110 |
| | | | $ | 209,284 |
| | | |
| |
(1) | The fair values of the borrowings approximate the carrying value as the interest rate on the borrowings is a floating rate. |
| |
(2) | On June 27, 2019, one of the Consolidated Funds amended the Credit Facility to, among other things, extend the maturity date from June 2019 to December 2019 and to reduce the facility size from €40.0 million to €24.6 million. |
| |
(3) | The effective rate is based on the three month EURIBOR or zero, whichever is higher, plus an applicable margin. |
8. COMMITMENTS AND CONTINGENCIES
Indemnification Arrangements
Consistent with standard business practices in the normal course of business, the Company enters into contracts that contain indemnities for affiliates of the Company, persons acting on behalf of the Company or such affiliates and third parties. The terms of the indemnities vary from contract to contract and the Company’s maximum exposure under these arrangements cannot be determined and has not been recorded in the Condensed Consolidated Statements of Financial Condition. As of June 30, 2019,2020, the Company has not had prior claims or losses pursuant to these contracts and expects the risk of loss to be remote.
Commitments
As of June 30, 20192020 and December 31, 2018,2019, the Company had aggregate unfunded commitments to invest in funds it manages or to support certain strategic initiatives of $304.1$632.4 million and $267.6$387.4 million, respectively.
ARCC Fee Waiver
In conjunction with ARCC's acquisition of American Capital, Ltd. (“ACAS”), the Company agreed to waive up to $10 million per quarter of ARCC's Part I Fees for ten calendar quarters, which began in the second quarter of 2017. ARCC Part I Fees will only be waived to the extent they are paid. The maximum amount of fees that may be waived in a quarter is $10 million, and if ARCC Part I Fees are less than $10 million in any single quarter, the shortfall will not carry over to subsequent quarters. As of June 30, 2019, there is one remaining quarter as part of the fee waiver agreement, with a maximum of $10 million in potential waivers. ARCC Part I Fees are reported net of the fee waiver.
Performance Income
Performance income is affected by changes in the fair values of the underlying investments in the funds that we advise. Valuations, on an unrealized basis, can be significantly affected by a variety of external factors including, but not limited to, public equity market volatility, industry trading multiples and interest rates. Generally, if at the termination of a fund (and increasingly at interim points in the life of a fund), the fund has not achieved investment returns that (in most cases) exceed the preferred return threshold or (in all cases) the general partner receives net profits over the life of the fund in excess of its allocable share under the applicable partnership agreement, the Company will be obligated to repay carried interest that was received by the Company in excess of the amounts to which the Company is entitled. This contingent obligation is normally reduced by income taxes paid by the Company related to its carried interest.
Senior professionals of the Company who have received carried interest distributions are responsible for funding their proportionate share of any contingent repayment obligations. However, the governing agreements of certain of the Company's funds provide that if a current or former professional does not fund his or her respective share for such fund, then the Company may have to fund additional amounts beyond what was received in carried interest, although the Company will generally retain the right to pursue any remedies under such governing agreements against those carried interest recipients who fail to fund their obligations.
At June 30, 20192020 and December 31, 2018,2019, if the Company assumed all existing investments were worthless, the amount of performance income subject to potential repayment, net of tax distributions, which may differ from the recognition of revenue, would have
Ares Management Corporation
Notes to the Unaudited Condensed Consolidated Financial Statements (Continued)
(Dollars in Thousands, Except Share Data and As Otherwise Noted)
been approximately $401.0$271.9 million and $469.0$233.4 million, respectively, of which approximately $297.5$208.4 million and $351.9$175.1 million, respectively, is reimbursable to the Company by certain professionals who are the recipients of such performance income. Management believes the possibility of all of the investments becoming worthless is remote. As of June 30, 20192020 and December 31, 2018,2019, if the funds were liquidated at their fair values, there would be $0.6 million and $0.4 million, respectively, of repayment obligations, so the Company recorded a0 contingent repayment liability as of each respective period that is presented on a gross basis within accrued carried interest within investments and performance related compensation payable on the Company's Condensed Consolidated Statements of Financial Condition.obligation or liability.
Litigation
From time to time, the Company is named as a defendant in legal actions relating to transactions conducted in the ordinary course of business. Although there can be no assurance of the outcome of such legal actions, in the opinion of management, the Company does not have a potential liability related to any current legal proceeding or claim that would individually or in the aggregate materially affect its results of operations, financial condition or cash flows.
Leases
The Company leases office space and certain office equipment. The Company's leases have remaining lease terms of one to 11 years. The tables below present certain supplemental quantitative disclosures regarding the Company's leases as of and for the period ending June 30, 2019:
|
| | | | | | |
| | | Classification | | As of June 30, 2019 |
| Operating lease assets | | Right-of-use operating lease assets | | $ | 152,579 |
|
| Finance lease assets | | Other assets(1) | | 1,313 |
|
| Total lease assets | | | | $ | 153,892 |
|
| | | | | |
| Operating lease liabilities | | Right-of-use operating lease liabilities | | $ | 179,192 |
|
| Finance lease obligations | | Accounts payable, accrued expenses and other liabilities | | 1,009 |
|
| Total lease liabilities | | | | $ | 180,201 |
|
(1)Finance lease assets are recorded net of accumulated amortization of $0.4 million as of June 30, 2019.
|
| | | | | | | | | | |
| | | Classification | | Three months ended June 30, 2019 | | Six months ended June 30, 2019 |
| Operating lease expense | | General, administrative and other expenses | | $ | 7,211 |
| | $ | 14,149 |
|
| Finance lease expense: | | | | | | |
| Amortization of finance lease assets | | General, administrative and other expenses | | 78 |
| | 105 |
|
| Interest on finance lease liabilities | | Interest expense | | 8 |
| | 21 |
|
| Total lease expense | | | | $ | 7,297 |
| | $ | 14,275 |
|
|
| | | | | | | | |
| Maturity of lease liabilities | | Operating Leases | | Finance Leases |
| 2019 | | $ | 16,006 |
| | $ | 32 |
|
| 2020 | | 29,516 |
| | 356 |
|
| 2021 | | 28,627 |
| | 356 |
|
| 2022 | | 30,067 |
| | 321 |
|
| 2023 | | 26,923 |
| | — |
|
| After 2023 | | 74,530 |
| | — |
|
| Total future payments | | 205,669 |
| | 1,065 |
|
| Less: interest | | 26,477 |
| | 56 |
|
| Total lease liabilities | | $ | 179,192 |
| | $ | 1,009 |
|
Ares Management Corporation
Notes to the Unaudited Condensed Consolidated Financial Statements (Continued)
(Dollars in Thousands, Except Share Data and As Otherwise Noted)
The Company leases office space and certain office equipment. The Company's leases have remaining lease terms of one to 10 years. The tables below present certain supplemental quantitative disclosures regarding the Company's leases:
| | | | | | | | | | | | | | | | | | | | |
| | | | As of June 30, | | As of December 31, |
| | Classification | | 2020 | | 2019 |
| Operating lease assets | | Right-of-use operating lease assets | | $ | 140,041 | | | $ | 143,406 | |
| Finance lease assets | | Other assets(1) | | 1,630 | | | 1,787 | |
| Total lease assets | | | | $ | 141,671 | | | $ | 145,193 | |
| | | | | | |
| Operating lease liabilities | | Operating lease liabilities | | $ | 164,521 | | | $ | 168,817 | |
| Finance lease obligations | | Accounts payable, accrued expenses and other liabilities | | 1,349 | | | 1,651 | |
| Total lease liabilities | | | | $ | 165,870 | | | $ | 170,468 | |
|
| | | |
Lease term and discount rate | | As of June 30, 2019 |
Weighted-average remaining lease terms (in years): | | |
Operating leases | | 6.9 |
|
Finance leases | | 2.8 |
|
Weighted-average discount rate: | |
|
Operating leases | | 4.00 | % |
Finance leases | | 3.43 | % |
(1) Finance lease assets are recorded net of accumulated amortization of $0.8 million and $0.6 million as of June 30, 2020 and December 31, 2019, respectively.
|
| | | | |
| Other information | | Six months ended June 30, 2019 |
| Cash paid for amounts included in the measurement of lease liabilities | | |
| Operating cash flows from operating leases | | $ | 15,313 |
|
| Operating cash flows from finance leases | | 52 |
|
| Financing cash flows from finance leases | | 264 |
|
| Leased assets obtained in exchange for new finance lease liabilities | | 114 |
|
| Leased assets obtained in exchange for new operating lease liabilities | | 47,866 |
|
| | | | | | | | | | | | | | | | | | | | | | | | | | | | | | | | | | |
| | | | Three months ended June 30, | | | | Six months ended June 30, | | | | |
| | Classification | | 2020 | | 2019 | | 2020 | | 2019 | | |
| Operating lease expense | | General, administrative and other expenses | | $ | 7,805 | | | $ | 7,211 | | | $ | 15,437 | | | $ | 14,149 | | | |
| Finance lease expense: | | | | | | | | | | | | |
| Amortization of finance lease assets | | General, administrative and other expenses | | 125 | | | 78 | | | 219 | | | 105 | | | |
| Interest on finance lease liabilities | | Interest expense | | 11 | | | 8 | | | 22 | | | 21 | | | |
| Total lease expense | | | | $ | 7,941 | | | $ | 7,297 | | | $ | 15,678 | | | $ | 14,275 | | | |
| | | | | | | | | | | | | | |
| Other information | | Six months ended June 30, 2020 | | Six months ended June 30, 2019 |
| Cash paid for amounts included in the measurement of lease liabilities: | | | | |
| Operating cash flows for operating leases | | $ | 16,055 | | | $ | 15,313 | |
| Operating cash flows for finance leases | | 42 | | | 52 | |
| Financing cash flows for finance leases | | 366 | | | 264 | |
| Leased assets obtained in exchange for new finance lease liabilities | | — | | | 114 | |
| Leased assets obtained in exchange for new operating lease liabilities | | 9,647 | | | 47,866 | |
| | | | | | | | | | | | | | |
| | As of June 30, | | As of December 31, |
| Lease term and discount rate | | 2020 | | 2019 |
| Weighted-average remaining lease terms (in years): | | | | |
| Operating leases | | 6.1 | | 6.5 |
| Finance leases | | 3.1 | | 3.3 |
| Weighted-average discount rate: | | | | |
| Operating leases | | 3.97 | % | | 4.00 | % |
| Finance leases | | 3.26 | % | | 3.39 | % |
Ares Management Corporation
Notes to the Unaudited Condensed Consolidated Financial Statements (Continued)
(Dollars in Thousands, Except Share Data and As Otherwise Noted)
| | | | | | | | | | | | | | |
| Maturity of lease liabilities | | Operating Leases | | Finance Leases |
| 2020 | | $ | 15,264 | | | $ | 102 | |
| 2021 | | 30,316 | | | 516 | |
| 2022 | | 31,497 | | | 485 | |
| 2023 | | 28,016 | | | 158 | |
| 2024 | | 25,184 | | | 156 | |
| After 2024 | | 55,531 | | | 6 | |
| Total future payments | | 185,808 | | | 1,423 | |
| Less: interest | | 21,287 | | | 74 | |
| Total lease liabilities | | $ | 164,521 | | | $ | 1,349 | |
| | | | |
9. RELATED PARTY TRANSACTIONS
Substantially all of the Company’s revenue is earned from its affiliates, including management fees, carried interest allocation, incentive fees, principal investment income and administrative expense reimbursements. The related accounts receivable are included within due from affiliates within the Condensed Consolidated Statements of Financial Condition, except that accrued carried interest allocations and incentive fees receivable, which are predominantly due from affiliated funds, are presented separately within investments and other assets, respectively, within the Condensed Consolidated Statements of Financial Condition.
The Company has investment management agreements with Ares Funds that it manages. In accordance with these agreements, these Ares Funds may bear certain operating costs and expenses which are initially paid by the Company and subsequently reimbursed by the Ares Funds.
The Company also has entered into agreements to be reimbursed for its expenses incurred for providing administrative services to certain related parties, including ARCC, ACRE, ARDC, Ivy Hill Asset Management, L.P., ACF FinCo I L.P,L.P. and CION Ares Diversified Credit Fund.
Employees and other related parties may be permitted to participate in co-investment vehicles that generally invest in Ares funds alongside fund investors. Participation is limited by law to individuals who qualify under applicable securities laws. These co-investment vehicles generally do not require these individuals to pay management or performance income.
Performance income the Company earns from the funds can be distributed to professionals or their related entities on a current basis, subject, in the case of carried interest programs, to repayment by the subsidiary of the Company that acts as general partner of the relevant fund in the event that certain specified return thresholds are not ultimately achieved. The professionals have personally guaranteed, subject to certain limitations, the obligations of these subsidiaries in respect of this general partner obligation. Such guarantees are several, and not joint, and are limited to distributions received by the relevant recipient.
Ares Management Corporation
Notes to the Unaudited Condensed Consolidated Financial Statements (Continued)
(Dollars in Thousands, Except Share Data and As Otherwise Noted)
The Company considers its professionals and non-consolidated funds to be affiliates. Amounts due from and to affiliates were composed of the following:
| | | | | | | | | | | |
| | As of June 30, | | As of December 31, |
| | 2020 | | 2019 |
| Due from affiliates: | | | |
| Management fees receivable from non-consolidated funds | $ | 204,249 | | | $ | 203,554 | |
| Payments made on behalf of and amounts due from non-consolidated funds and employees | 53,877 | | | 64,545 | |
| Due from affiliates—Company | $ | 258,126 | | | $ | 268,099 | |
| Amounts due from portfolio companies and non-consolidated funds | $ | 7,201 | | | $ | 6,192 | |
| Due from affiliates—Consolidated Funds | $ | 7,201 | | | $ | 6,192 | |
| Due to affiliates: | | | |
| Management fee rebate payable to non-consolidated funds | $ | 2,580 | | | $ | 2,420 | |
| Management fees received in advance | 5,714 | | | 3,012 | |
| Tax receivable agreement liability | 36,443 | | | 26,542 | |
| Undistributed carried interest and incentive fees | 8,450 | | | 28,086 | |
| Payments made by non-consolidated funds on behalf of and payable by the Company | 7,838 | | | 11,385 | |
| Due to affiliates—Company | $ | 61,025 | | | $ | 71,445 | |
| | | |
| | | |
|
| | | | | | | |
| | As of June 30, | | As of December 31, |
| | 2019 | | 2018 |
| Due from affiliates: | | | |
| Management fees receivable from non-consolidated funds | $ | 174,668 |
| | $ | 151,455 |
|
| Payments made on behalf of and amounts due from non-consolidated funds and employees | 59,413 |
| | 47,922 |
|
| Due from affiliates—Company | $ | 234,081 |
| | $ | 199,377 |
|
| Amounts due from portfolio companies and non-consolidated funds | $ | 15,888 |
| | $ | 17,609 |
|
| Due from affiliates—Consolidated Funds | $ | 15,888 |
| | $ | 17,609 |
|
| Due to affiliates: | |
| | |
|
| Management fee rebate payable to non-consolidated funds | $ | 2,125 |
| | $ | 2,105 |
|
| Management fees received in advance | 3,724 |
| | 5,491 |
|
| Tax receivable agreement liability | 24,927 |
| | 24,927 |
|
| Undistributed carried interest and incentive fees | 25,700 |
| | 31,162 |
|
| Payments made by non-consolidated funds on behalf of and payable by the Company | 9,051 |
| | 18,726 |
|
| Due to affiliates—Company | $ | 65,527 |
| | $ | 82,411 |
|
Due from Ares Funds and Portfolio Companies
In the normal course of business, the Company pays certain expenses on behalf of Consolidated Funds and non-consolidated funds for which it is reimbursed. Amounts advanced on behalf of Consolidated Funds are eliminated in consolidation. Certain expenses initially paid by the Company, primarily professional services, travel and other costs associated with particular portfolio company holdings, are subject to reimbursement by the portfolio companies. The
ARCC Fee Waiver
In conjunction with ARCC's acquisition of American Capital, Ltd., the Company reimbursed ARCC approximately $0.6agreed to waive up to $10.0 million for certain recurring rent and utilities incurred by ARCC during the firstper quarter of 2018. In addition, inARCC's Part I Fees for ten calendar quarters, which began with the second quarter of 2017 and ended with the third quarter of 2019. ARCC Part I Fees are reported net of the fee waiver. For the three and six months ended June 30, 2018,2019, the Company reimbursed ARCC approximately $2.2 million, $3.0 million, $3.2waived $10.0 million and $2.9$20.0 million, of rent and utilities for the years ended 2017, 2016, 2015 and 2014, respectively, for an aggregate reimbursement to ARCC of $11.8 million. Beginning April 1, 2018, the Company directly incurs these expenses.respectively.
ARCC Investment Advisory and Management Agreement
In connection with ARCC's board approval of the modification of the asset coverage requirement applicable to senior securities from 200% to 150% effective on June 21, 2019, the investment advisory and management agreement was amended effective June 6, 2019 to reduce the annual base management fee paid to the Company from 1.5% to 1.0% on all assets financed using leverage over 1.0 times debt to equity.
10. INCOME TAXES
Effective March 1, 2018, the Company elected to be treated as a corporation for U.S. federal and state income tax purposes (the “Tax Election”). Upon the effectiveness of this election, all earnings are subject to U.S. federal, state and local income taxes and certain of its foreign subsidiaries are subject to foreign income taxes (for which a foreign tax credit can generally offset U.S. corporate taxes imposed on the same income). Prior to March 1, 2018, a substantial portion of the Company's share of carried interest and investment income flowed through to investors without being subject to corporate level income taxes. Consequently, the Company did not reflect a provision for income taxes on such income except those for foreign, state and local income taxes incurred at the entity level. Beginning March 1, 2018, the Company's share of unrealized gains and income items became subject to U.S. corporate tax.
Ares Management Corporation
Notes to the Unaudited Condensed Consolidated Financial Statements (Continued)
(Dollars in Thousands, Except Share Data and As Otherwise Noted)
The Company’s income tax provision includes corporate income taxes and other entity level income taxes, as well as income taxes incurred by certain affiliated funds that are consolidated in these financial statements. For the three and six months ended June 30, 2020, the Company recorded income tax expense of $24.4 million and $3.8 million, respectively. For the three and six months ended June 30, 2019, the Company recorded income tax expense of $9.5 million and $23.9 million, respectively. For the three and six monthsended June 30, 2018, the Company recorded income tax expense of $36.9 million and $24.5 million, respectively. In connection with its election to be taxed as a corporation effective March 1, 2018, the Company recorded a significant one-time deferred tax liability arising from the embedded net unrealized gains of both carried interest and the investment portfolio that were not previously subject to corporate taxes.
The Company’s effective income tax rate is dependent on many factors, including the estimated nature and amounts of income and expenses allocated to the non-controlling interests without being subject to federal, state and local income taxes at the corporate level. Additionally, the Company’s effective tax rate is influenced by the amount of income tax provision recorded for any affiliated funds and co-investment entities that are consolidated in the Company's condensed consolidated financial statements. For the three and six months ended June 30, 2020 and 2019, the Company recorded its interim income tax provision utilizing the estimated annual effective tax rate. In 2018, the Company utilized the discrete effective tax rate method to calculate its interim income tax provision since the conversion to a U.S. corporation for tax purposes occurred in an interim period.
The income tax effects of temporary differences give rise to significant portions of deferred tax assets and liabilities, which are presented on a net basis. As of June 30, 20192020 and December 31, 2018,2019, the Company recorded a net deferred tax asset of $42.4$70.2 million and $42.1$46.4 million, respectively, within other assets in the Condensed Consolidated Statements of Financial Condition.
The Company files its tax returns as prescribed by the tax laws of the jurisdictions in which it operates. In the normal course of business, the Company is subject to examination by U.S. federal, state, local and foreign tax authorities. With limited
Ares Management Corporation
Notes to the Unaudited Condensed Consolidated Financial Statements (Continued)
(Dollars in Thousands, Except Share Data and As Otherwise Noted)
exceptions, the Company is no longer subject to income tax audits by taxing authorities for any years prior to 2015.2016. Although the outcome of tax audits is always uncertain, the Company does not believe the outcome of any future audit will have a material adverse effect on the Company’s condensed consolidated financial statements.
11. EARNINGS PER SHARE
Basic earnings per share of Class A common stock is computed by using the two-class method. Diluted earnings per share of Class A common stock is computed using the more dilutive method of either the two-class method or the treasury stock method. For the six months ended June 30, 2020, the two-class method was the more dilutive method. For the three months ended June 30, 2020 and three and six months ended June 30, 2019, the treasury stock method was the more dilutive method.
For the three and six months ended June 30, 2018,2020 and 2019, the two-class method was the more dilutive method.
The computation of diluteddilutive earnings per share for the three and six months ended June 30, 2019 and 2018 excludes the following options, restricted units and AOG Units, as their effect would have been anti-dilutive:
|
| | | | | | | | | | | |
| | For the Three Months Ended
June 30, | | For the Six Months Ended
June 30, |
| | 2019 | | 2018 | | 2019 | | 2018 |
| Options | 9,841,385 |
| | 19,111,390 |
| | 10,788,784 |
| | 19,471,589 |
|
| Restricted units | 9,172,641 |
| | 15,271,381 |
| | 10,036,334 |
| | 15,811,964 |
|
| AOG Units | 116,831,583 |
| | 120,231,237 |
| | 116,913,353 |
| | 124,211,007 |
|
| | | | | | | | | | | | | | | | | | | | | | | | | |
| Three months ended June 30, | | | | Six months ended June 30, | | | | |
| 2020 | | 2019 | | 2020 | | 2019 | | |
| | | | | | | | | |
| Restricted units | 616 | | | — | | | — | | | 59 | | | |
| AOG Units | 115,103,668 | | | 116,831,583 | | | — | | | 116,913,353 | | | |
| | | | | | | | | |
The following table presents the computation of basic and diluted earnings per common share:
| | | | | | | | | | | | | | | | | | | | | | | | | |
| Three months ended June 30, | | | | Six months ended June 30, | | | | |
| 2020 | | 2019 | | 2020 | | 2019 | | |
| Basic earnings per share of Class A common stock: | | | | | | | | | |
| Net income attributable to Ares Management Corporation Class A common stockholders | $ | 50,946 | | | $ | 26,714 | | | $ | 14,485 | | | $ | 66,238 | | | |
| Distributions on unvested restricted units | (2,667) | | | (1,886) | | | (4,955) | | | (3,693) | | | |
| | | | | | | | | |
| Net income available to Class A common stockholders | $ | 48,279 | | | $ | 24,828 | | | $ | 9,530 | | | $ | 62,545 | | | |
| Basic weighted-average shares of Class A common stock | 133,639,194 | | | 105,188,966 | | | 126,002,867 | | | 104,054,035 | | | |
| Basic earnings per share of Class A common stock | $ | 0.36 | | | $ | 0.24 | | | $ | 0.08 | | | $ | 0.60 | | | |
| | | | | | | | | |
| Diluted earnings per share of Class A common stock: | | | | | | | | | |
| Net income available to Class A common stockholders | $ | 50,946 | | | $ | 26,714 | | | $ | 14,485 | | | $ | 66,238 | | | |
| Distributions on unvested restricted units | — | | | — | | | (4,955) | | | — | | | |
| Net income attributable to Ares Management Corporation Class A common stockholders | $ | 50,946 | | | $ | 26,714 | | | $ | 9,530 | | | $ | 66,238 | | | |
| Effect of dilutive shares: | | | | | | | | | |
| Restricted units | 8,135,584 | | | 7,212,754 | | | — | | | 6,349,061 | | | |
| Options | 5,129,579 | | | 4,202,167 | | | — | | | 3,254,768 | | | |
| | | | | | | | | |
| Diluted weighted-average shares of Class A common stock | 146,904,357 | | | 116,603,887 | | | 126,002,867 | | | 113,657,864 | | | |
| Diluted earnings per share of Class A common stock | $ | 0.35 | | | $ | 0.23 | | | $ | 0.08 | | | $ | 0.58 | | | |
| | | | | | | | | |
| Dividend declared and paid per Class A common stock | $ | 0.40 | | | $ | 0.32 | | | $ | 0.80 | | | $ | 0.64 | | | |
12. EQUITY COMPENSATION
Equity Incentive Plan
Equity-based compensation is granted under the Company's 2014 Equity Incentive Plan, most recently amended on November 26, 2018 (the "Equity Incentive Plan"). The total number of shares available to be issued under the Equity Incentive Plan resets based on a formula defined in the Equity Incentive Plan and may increase on January 1 of each year. On January 1, 2020, the total number of shares available for issuance under the Equity Incentive Plan reset to 37,528,029 shares, and as of June 30, 2020, 34,114,071 shares remain available for issuance.
Ares Management Corporation
Notes to the Unaudited Condensed Consolidated Financial Statements (Continued)
(Dollars in Thousands, Except Share Data and As Otherwise Noted)
The following table presents the computation of basic and diluted earnings per share:
|
| | | | | | | | | | | | | | | |
| | For the Three Months Ended
June 30, | | For the Six Months Ended
June 30, |
| | 2019 | | 2018 | | 2019 | | 2018 |
| Net income (loss) attributable to Ares Management Corporation Class A common stockholders | $ | 26,714 |
| | $ | (17,200 | ) | | $ | 66,238 |
| | $ | 18,323 |
|
| Distributions on participating unvested restricted units | (1,886 | ) | | (1,970 | ) | | (3,693 | ) | | (3,877 | ) |
| Net income (loss) available to Class A common stockholders | $ | 24,828 |
| | $ | (19,170 | ) | | $ | 62,545 |
| | $ | 14,446 |
|
| Basic weighted-average shares of Class A common stock | 105,188,966 |
|
| 98,037,252 |
|
| 104,054,035 |
|
| 91,861,946 |
|
| Basic earnings (loss) per share of Class A common stock | $ | 0.24 |
| | $ | (0.20 | ) | | $ | 0.60 |
| | $ | 0.16 |
|
| Net income (loss) attributable to Ares Management Corporation Class A common stockholders | $ | 26,714 |
| | $ | (17,200 | ) | | $ | 66,238 |
| | $ | 18,323 |
|
| Distributions on unvested restricted units | — |
| | (1,970 | ) | | — |
| | (3,877 | ) |
| Net income (loss) available to Class A common stockholders | $ | 26,714 |
| | $ | (19,170 | ) | | $ | 66,238 |
| | $ | 14,446 |
|
| Effect of dilutive shares: | | | | | | | |
| Restricted units | 7,212,754 |
| | — |
| | 6,349,061 |
| | — |
|
| Options | 4,202,167 |
| | — |
| | 3,254,768 |
| | — |
|
| Diluted weighted-average shares of Class A common stock | 116,603,887 |
|
| 98,037,252 |
|
| 113,657,864 |
|
| 91,861,946 |
|
| Diluted earnings (loss) per share of Class A common stock | $ | 0.23 |
| | $ | (0.20 | ) | | $ | 0.58 |
| | $ | 0.16 |
|
| Dividends declared and paid per Class A common stock | $ | 0.32 |
|
| $ | 0.37 |
|
| $ | 0.64 |
|
| $ | 0.77 |
|
12. EQUITY COMPENSATION
Equity Incentive Plan
In 2014, the Company adopted the 2014 Equity Incentive Plan, as amended and restated on March 1, 2018 and as further amended and restated effective November 26, 2018 (the “Equity Incentive Plan”). Based on a formula as defined in the Equity Incentive Plan, the total number of shares available to be issued under the Equity Incentive Plan resets and may increase on January 1 each year. Accordingly, on January 1, 2019, the total number of shares available for issuance under the Equity Incentive Plan reset to 32,792,005 shares, and as of June 30, 2019, 29,536,100 shares remain available for issuance.
Generally, unvested phantom shares, restricted units and options are forfeited upon termination of employment in accordance with the Equity Incentive Plan. The Company recognizes forfeitures as a reversal of previously recognized compensation expense in the period the forfeiture occurs.
Equity-based compensation expense, net of forfeitures, recorded by the Company is included in the following table:
|
| | | | | | | | | | | | | | | |
| | For the Three Months Ended
June 30, | | For the Six Months Ended
June 30, |
| | 2019 | | 2018 | | 2019 | | 2018 |
| Restricted units | $ | 21,783 |
| | $ | 18,516 |
| | $ | 44,796 |
| | $ | 36,547 |
|
| Restricted units with a market condition | 901 |
| | — |
| | 1,791 |
| | — |
|
| Options | 1,157 |
| | 3,630 |
| | 4,258 |
| | 6,293 |
|
| Phantom shares | 188 |
| | 361 |
| | 736 |
| | 754 |
|
| Equity-based compensation expense | $ | 24,029 |
| | $ | 22,507 |
| | $ | 51,581 |
| | $ | 43,594 |
|
| | | | | | | | | | | | | | | | | | | | | | | | | | | |
| Three months ended June 30, | | | | Six months ended June 30, | | | | | | |
| | 2020 | | 2019 | | 2020 | | 2019 | | | | |
| Restricted units | $ | 28,386 | | | $ | 21,783 | | | $ | 56,768 | | | $ | 44,796 | | | | | |
| Restricted units with a market condition | 297 | | | 901 | | | 4,429 | | | 1,791 | | | | | |
| Options | — | | | 1,157 | | | 43 | | | 4,258 | | | | | |
| Phantom shares | — | | | 188 | | | — | | | 736 | | | | | |
| Equity-based compensation expense | $ | 28,683 | | | $ | 24,029 | | | $ | 61,240 | | | $ | 51,581 | | | | | |
Restricted Units
Each restricted unit represents an unfunded, unsecured right of the holder to receive a share of the Company's Class A common stock on a specific date. The restricted units generally vest and are settled in shares of Class A common stock either (i) at a rate of one‑thirdone-third per year, beginning on the third anniversary of the grant date, (ii) in their entirety on the fifth anniversary of the
Ares Management Corporation
Notes to the Unaudited Condensed Consolidated Financial Statements (Continued)
(Dollars in Thousands, Except Share Data and As Otherwise Noted)
grant date, (iii) at a rate of one quarter per year, beginning on either the first or second anniversary of the grant date or the holder's employment commencement date, or (iv) at a rate of one third per year, beginning on the first anniversary of the grant date in each case generally subject to the holder’s continued employment as of the applicable vesting date (subject to accelerated vesting upon certain qualifying terminations of employment)employment or retirement eligibility provisions). Compensation expense associated with restricted units is recognized on a straight-line basis over the requisite service period of the award.
The holders of restricted units, other than the market condition awards described below, generally have the right to receive as current compensation an amount in cash equal to (i) the amount of any dividend paid with respect to a share of Class A common stock multiplied by (ii) the number of restricted units held at the time such dividends are declared (“Dividend Equivalent”). During the six months ended June 30, 2019,2020, the Company declared dividends of $0.32 and $0.32$0.40 per share to Class A common stockholders at the close of business on March 15, 201917, 2020 and June 14, 2019, respectively.16, 2020. For the three and six months ended June 30, 2019,2020, Dividend Equivalents were made to the holders of restricted units in the aggregate amount of $5.2$6.5 million and $10.8$12.9 million, respectively, which are presented as dividends within the Condensed Consolidated Statements of Changes in Equity. When units are forfeited, the cumulative amount of dividend equivalents previously paid is reclassified to compensation and benefits expense in the Condensed Consolidated Statements of Operations.
The following table presents unvested restricted units' activity during the six months ended June 30, 2019:activity:
| | | | | | | | | | | | | |
| | Restricted Units | | Weighted Average Grant Date Fair Value Per Unit | | |
| Balance - January 1, 2020 | 16,810,473 | | | $ | 20.07 | | | |
| Granted | 3,653,779 | | | 36.47 | | | |
| Vested | (3,945,510) | | | 19.22 | | | |
| Forfeited | (216,209) | | | 21.73 | | | |
| Balance - June 30, 2020 | 16,302,533 | | | $ | 23.92 | | | |
|
| | | | | | |
| | Restricted Units | | Weighted Average Grant Date Fair Value Per Unit |
| Balance - January 1, 2019 | 16,255,475 |
| | $ | 19.21 |
|
| Granted | 3,881,203 |
| | 20.01 |
|
| Vested | (3,534,621 | ) | | 17.92 |
|
| Forfeited | (216,662 | ) | | 19.21 |
|
| Balance - June 30, 2019 | 16,385,395 |
| | $ | 19.68 |
|
The total compensation expense expected to be recognized in all future periods associated with the restricted units is approximately $229.0$275.4 million as of June 30, 20192020 and is expected to be recognized over the remaining weighted average period of 3.083.1 years.
Restricted Unit Awards with a Market Condition
The following table presents the unvested market condition awards' activity during the six months ended June 30, 2019:
|
| | | | | | |
| | Market Condition Awards Units | | Weighted Average
Grant Date Fair
Value Per Unit |
| Balance - January 1, 2019 | 1,333,334 |
| | $ | 9.30 |
|
| Granted | — |
| | — |
|
| Vested | — |
| | — |
|
| Forfeited | — |
| | — |
|
| Balance - June 30, 2019 | 1,333,334 |
| | $ | 9.30 |
|
The total compensation expense expected to be recognized in all future periods associated with the market condition awards is approximately $9.1 million as of June 30, 2019 and is expected to be recognized over the remaining weighted average period of 2.66 years.
Ares Management Corporation
Notes to the Unaudited Condensed Consolidated Financial Statements (Continued)
(Dollars in Thousands, Except Share Data and As Otherwise Noted)
The following table presents the unvested market condition awards' activity:
| | | | | | | | | | | |
| | Market Condition Awards Units | | Weighted Average
Grant Date Fair
Value Per Unit |
| Balance - January 1, 2020 | 1,333,334 | | | $ | 9.30 | |
| Granted | — | | | — | |
| Vested | (666,667) | | | 10.92 | |
| Forfeited | — | | | — | |
| Balance - June 30, 2020 | 666,667 | | | $ | 7.68 | |
For the six months ended June 30, 2020, the market-priced vesting condition was met for one of the tranches of the market condition awards and compensation expense of $3.7 million was accelerated. The total compensation expense expected to be recognized in all future periods associated with the market condition awards is approximately $2.8 million as of June 30, 2020 and is expected to be recognized over the remaining weighted average period of 2.4 years.
Options
A summary of options activity during the six months ended June 30, 20192020 is presented below:
| | | | | | | | | | | | | | | | | | | | | | | |
| | Options | | Weighted Average Exercise Price | | Weighted Average Remaining Life (in years) | | Aggregate Intrinsic Value |
| Balance - January 1, 2020 | 13,426,870 | | | $ | 18.99 | | | 4.3 | | $ | 224,260 | |
| Granted | — | | | — | | | — | | | — | |
| Exercised | (3,747,461) | | | 18.99 | | | — | | | — | |
| Expired | — | | | — | | | — | | | — | |
| Forfeited | — | | | — | | | — | | | — | |
| Balance - June 30, 2020 | 9,679,409 | | | $ | 18.99 | | | 3.8 | | $ | 200,497 | |
| Exercisable at June 30, 2020 | 9,679,409 | | | $ | 18.99 | | | 3.8 | | $ | 200,497 | |
|
| | | | | | | | | | | | | |
| | Options | | Weighted Average Exercise Price | | Weighted Average Remaining Life (in years) | | Aggregate Intrinsic Value |
| Balance - January 1, 2019 | 18,741,504 |
| | $ | 18.99 |
| | 4.88 |
| | $ | — |
|
| Exercised | (4,289,316 | ) | | 19.00 |
| | — |
| | — |
|
| Expired | (366,366 | ) | | 19.00 |
| | — |
| | — |
|
| Forfeited | (42,270 | ) | | 19.00 |
| | — |
| | — |
|
| Balance - June 30, 2019 | 14,043,552 |
| | $ | 18.99 |
| | 4.75 |
| | $ | 100,858 |
|
| Exercisable at June 30, 2019 | 13,933,735 |
| | $ | 18.99 |
| | 4.74 |
| | $ | 100,015 |
|
Net cash proceeds from exercises of stock options were $78.8$71.2 million for the six months ended June 30, 2019.2020. The Company realized tax benefits of approximately $3.3$8.7 million from those exercises.
Phantom Shares
A summary of unvested phantom shares' activity during the six months ended June 30, 2019 is presented below:
|
| | | | | | | |
| | | Phantom Shares | | Weighted Average
Grant Date Fair
Value Per Share |
| Balance - January 1, 2019 | | 66,287 |
| | $ | 19.00 |
|
| Vested | | (61,502 | ) | | 19.00 |
|
| Forfeited | | (4,785 | ) | | 19.00 |
|
| Balance - June 30, 2019 | | — |
| | $ | — |
|
During the six months ended June 30, 2019 the Company paid $1.5 million to settle vested phantom shares.
13. EQUITY
Common Stock
The Company completed its conversion from a Delaware limited partnership to a Delaware corporation (the "Conversion") effective on November 26, 2018. Prior to the Conversion, common shares represented limited partnership interests in the Company. The holders of common shares were entitled to participate pro rata in distributions from the Company and to exercise the rights or privileges that were available to common shareholders under the Company’s limited partnership agreement. The common shareholders had limited voting rights and had no right to remove the Company’s general partner, Ares Management GP LLC, or, except in limited circumstances, to elect the directors of the general partner.
Since the Conversion on November 26, 2018, the Company's common stock consists of Class A, Class B, and Class C common stock. As a result of the Conversion on November 26, 2018, (i) each outstanding common share representing limited partner interests in the Company before the Conversion converted into one issued and outstanding, fully paid and nonassessable share of Class Anon-voting common stock, each $0.01 par value per share, of the Company, (ii) the general partner share of the Company before the Conversion converted into 1,000 issued and outstanding, fully paid and nonassessable shares of Class B common stock, $0.01 par value per share, of the Company and (iii) the special voting share of the Company before the Conversion converted into one issued and outstanding, fully paid and nonassessable share, of Class C common stock, $0.01 par value per share, of the Company.
Ares Management Corporation
Notes to the Unaudited Condensed Consolidated Financial Statements (Continued)
(Dollars in Thousands, Except Share Data and As Otherwise Noted)
share. The Class B common stock and Class C common stock are non-economic and holders are not entitled to (i) dividends from the Company or (ii)to receive any assets of the Company in the event of any dissolution, liquidation or winding up of the Company. Ares Management GP LLC is the sole holder of the Class B common stock and Ares Voting LLC (“Ares Voting”) is the sole holder of the Class C common stock.
In February 2019, the Company's board of directors authorized the repurchase of up to $150 million of shares of Class
A common stock. Under this stock repurchase program, shares may be repurchased from time to time in open market purchases,
privately negotiated transactions or otherwise, including in reliance on Rule 10b5-1 of the Securities Act. In February 2020, the board of directors approved the renewal of the program and reset the repurchase amount back to $150 million. The renewed program is scheduled to expire in February 2020.March 2021. Repurchases under the program, if any, will depend on the prevailing market conditions and other factors. During the three andsix months ended June 30, 2020, the Company did not repurchase any shares as part of the stock repurchase program. During the six months ended June 30, 2019, the Company repurchased 0.4 million shares as part of the stock repurchase program at a total cost of $10.4 million.
Ares Management Corporation
Notes to the Unaudited Condensed Consolidated Financial Statements (Continued)
(Dollars in Thousands, Except Share Data and As Otherwise Noted)
On March 31, 2020, the Company issued and sold 12,130,540 shares of new Class A common stock in a private offering (the “Offering”) to Sumitomo Mitsui Banking Corporation (“SMBC”) in connection with a share purchase agreement. The Company received $383.8 million in gross proceeds and incurred approximately $0.7 million of expenses in connection with the Offering. The expenses have been recorded as a reduction in the proceeds received and are presented on a net basis together with contributions in additional paid-in-capital within the Condensed Consolidated Statements of Changes in Equity. In connection with the Offering, the Company approved the amendment to its certificate of incorporation to, among other things, establish a new series of non-voting common stock, par value $0.01 per share, that has the same economic rights as the Class A common stock. SMBC may exchange all or a portion of the Class A common stock for an equivalent amount of the newly established non-voting common stock pursuant to certain terms set forth in an investor rights agreement entered into between the Company and SMBC. As of June 30, 2019,2020, the amount remaining available for repurchases underCompany had authorized 500,000,000 shares of the program was $139.6 million.non-voting common stock with no shares issued. To satisfy a condition related to the Offering, the Company also issued 115,199,620 shares of its Class C common stock to Ares Voting on March 30, 2020. The issuance of the Class C units did not change the aggregate voting power of Ares Voting and Ares Voting will continue to be entitled to the number of votes equal to the number of AOG Units held of record by each Ares Operating Group limited partner, other than the Company and its subsidiaries, that does not own a share of Class C common stock.
The following table presents the changes in each class of common stock:
| | | | | | | | | | | | | | | | | | | | | | | |
| Class A Common Stock | | Class B Common Stock | | Class C Common Stock | | Total |
| Balance - January 1, 2020 | 115,242,028 | | | 1,000 | | | 1 | | | 115,243,029 | |
| Issuance of stock | 12,130,540 | | | — | | | 115,199,620 | | | 127,330,160 | |
Exchanges of AOG Units (1) | 1,777,639 | | | — | | | (401,217) | | | 1,376,422 | |
| Stock option exercises, net of shares withheld for tax | 3,599,504 | | | — | | | — | | | 3,599,504 | |
| | | | | | | |
| Vesting of restricted stock awards, net of shares withheld for tax | 2,586,232 | | | — | | | — | | | 2,586,232 | |
| Balance Outstanding - June 30, 2020 | 135,335,943 | | | 1,000 | | | 114,798,404 | | | 250,135,347 | |
(1) Effective March 30, 2020, Class C common stock for the six months ended June 30, 2019:activity represents redemptions to correspond with exchanges of AOG Units.
|
| | | | | | | | | | | |
| | Class A Common Stock | | Class B Common Stock | | Class C Common Stock | | Total |
| Balance - January 1, 2019 | 101,594,095 |
| | 1,000 |
| | 1 |
| | 101,595,096 |
|
| Exchanges of AOG Units | 97,493 |
| | — |
| | — |
| | 97,493 |
|
| Stock option exercises | 4,168,449 |
| | — |
| | — |
| | 4,168,449 |
|
| Repurchases of stock | (400,000 | ) | | — |
| | — |
| | (400,000 | ) |
| Vesting of restricted stock awards | 1,998,272 |
| | — |
| | — |
| | 1,998,272 |
|
| Balance outstanding - June 30, 2019 | 107,458,309 |
| | 1,000 |
| | 1 |
| | 107,459,310 |
|
The following table presents each partner's AOG Units and corresponding ownership interest in each of the Ares Operating Group entities, as of June 30, 2019 and December 31, 2018, as well as its daily average ownership of AOG Units in each of the Ares Operating Group entities for the three and six months ended June 30, 2019 and 2018.entities:
|
| | | | | | | | | | | | | | | | | | | | | | | | |
| | | | | | | | | | | Daily Average Ownership |
| | | As of June 30, 2019 | | As of December 31, 2018 | | For the Three Months Ended June 30, | | For the Six Months Ended June 30, |
| | | AOG Units | | Direct Ownership Interest | | AOG Units | | Direct Ownership Interest | | 2019 | | 2018 | | 2019 | | 2018 |
| Ares Management Corporation | | 107,458,309 |
| | 47.94 | % | | 101,594,095 |
| | 46.47 | % | | 47.38 | % | | 44.92 | % | | 47.09 | % | | 42.51 | % |
| Ares Owners Holding L.P. | | 116,707,849 |
| | 52.06 | % | | 117,019,274 |
| | 53.53 | % | | 52.62 | % | | 53.82 | % | | 52.91 | % | | 54.4 | % |
| Affiliate of Alleghany Corporation | | — |
| | — | % | | — |
| | — | % | | — | % | | 1.26 | % | | — | % | | 3.09 | % |
| Total | | 224,166,158 |
| | 100.00 | % | | 218,613,369 |
| | 100.00 | % | | | | | | | | |
| | | | | | | | | | | | | | | | | | | | | | | | | | | | | | | | | | | | | | | | | | | | | | | | | | | | |
| | | | | | | | | Daily Average Ownership | | | | | | | | | |
| | As of June 30, 2020 | | | | As of December 31, 2019 | | | | Three months ended June 30, | | | | Six months ended
June 30, | | | | |
| | AOG Units | | Direct Ownership Interest | | AOG Units | | Direct Ownership Interest | | 2020 | | 2019 | | 2020 | | 2019 | | |
| Ares Management Corporation | | 135,335,943 | | | 54.11 | % | | 115,242,028 | | | 49.70 | % | | 53.73 | % | | 47.38 | % | | 52.13 | % | | 47.09 | % | | |
| Ares Owners Holding L.P. | | 114,798,404 | | | 45.89 | | | 116,641,833 | | | 50.30 | | | 46.27 | | | 52.62 | | | 47.87 | | | 52.91 | | | |
| | | | | | | | | | | | | | | | | | |
| Total | | 250,134,347 | | | 100.00 | % | | 231,883,861 | | | 100.00 | % | | | | | | | | | | |
Preferred Stock
In connection with the Conversion on November 26, 2018, each 7.00% Series A preferred share of the Company before the Conversion was converted into one share of 7.00% Series A Preferred Stock, $0.01 par value per share of the Company. As of June 30, 20192020 and December 31, 2018,2019, the Company had 12,400,000 shares of the Series A Preferred Stock outstanding. When, as and if declared by the Company’s board of directors, dividends on the Series A Preferred Stock are payable quarterly at a rate per annum equal to 7.00%. The Series A Preferred Stock may be redeemed at the Company’s option, in whole or in part, at any time on or after June 30, 2021, at a price per share of $25.00.
14. SEGMENT REPORTING
The Company operates through its distinct operating segments that are summarized below:
Credit Group: The Credit Group manages credit strategies across the liquid and illiquid spectrum, including syndicated loans, high yield bonds, multi-asset credit, alternative credit investments and direct lending. The syndicated loans
Ares Management Corporation
Notes to the Unaudited Condensed Consolidated Financial Statements (Continued)
(Dollars in Thousands, Except Share Data and As Otherwise Noted)
14. SEGMENT REPORTING
The Company operates through its three distinct operating segments. During the six months ended June 30, 2019, the Company reclassified certain expenses from OMGstrategy focuses on evaluating individual credit opportunities related primarily to its operating segments. The Company has modified historical results to conform with its current presentation.
The Company’s three operating segments are:
Credit Group: The Company’s Credit Group is a leading manager of credit strategies across the non-investment grade credit universe in the U.S.senior secured loans and Europe,primarily target first lien secured debt, with approximately $105.5 billion of AUM and 170 funds as of June 30, 2019. The Credit Group offers a range of credit strategies across the liquid and illiquid spectrum, including syndicatedsecondary focus on second lien loans, mezzanine loans, high yield bonds credit opportunities, alternative credit investments and U.S. and European direct lending. The Credit Group provides solutions for traditional fixed income investors seeking to access the syndicated loans and high yield bond markets and capitalizes on opportunities across traded corporate credit. It additionally provides investors access to directly originated fixed and floating rate credit assets and the ability to capitalize on illiquidity premiums across the credit spectrum. The Credit Group’s syndicated loans strategy focuses on liquid, traded non-investment grade secured loans to corporate borrowers.unsecured loans. The high yield bond strategy seeks to deliver a diversified portfolio of liquid, traded non-investment grade corporate bonds, including secured, unsecured and subordinated debt instruments. Credit opportunitiesMulti-asset credit is a “go anywhere” strategy seekingdesigned to capitalize onoffer investors a flexible solution to global credit investing by tactical allocation between multiple asset classes in various market inefficiencies and relative value opportunities across the capital structure.conditions. The alternative credit strategy seeks to capitalize on asset-focused investment opportunities that fall outside of traditional, well-defined markets such as corporate debt, real estate and private equity. AlternativeThe alternative credit strategy emphasizes downside protection and capital preservation through a focus on investments include certain structural features designedthat tend to protect value and minimize loss such asshare the following key attributes: asset security, seniority, covenants, structural protections and cash flow prioritization. These investments include asset-backed securities, specialty assets, real assets, and structured credit.velocity. The Company hasdirect lending strategy is one of the largest self-originating direct lending platforms inlenders to the U.S. and European markets and has a multi-channel origination strategy designed to address a broad set of investment opportunities in the middle markets, providing one-stop financing solutions for small-to-medium sized companies, which the Company believes are increasingly underserved by traditional lenders. The Company provides investors access to these capabilities through several vehicles, including commingled funds, separately managed accounts and a publicly traded vehicle. The Credit Group conducts itsmarket. U.S. direct lending activities primarilyare managed through ARCC, the largesta publicly traded business development company, as of June 30, 2019, by both market capitalization and total assets. In addition, the Credit Group manages a commercial finance business that provides asset-based and cash flow loans to small and middle-market companies,ARCC, as well as asset-based facilitiesthrough private funds. The group maintains a flexible investment strategy with the capability to specialty finance companies. The Credit Group’s European direct lending platform is one of the most significant participantsinvest in the European middle-market, focusing on self-originated investmentsfirst lien senior secured loans (including “unitranche” loans which are loans that combine senior and mezzanine debt, generally in illiquid middle-market credits.a first lien position), second lien senior secured loans, mezzanine debt and non-control equity co-investments in middle market companies and power generation projects.
Private Equity Group:The Company’s Private Equity Group has approximately $24.7 billion of AUM as of June 30, 2019,manages investment strategies broadly categorizing its investment strategiescategorized as corporate private equity, infrastructure and power, special opportunities, and energy opportunities. As of June 30, 2019 the group managed five corporate private equity commingled funds focused on North America and Europe and three focused on greater China, five commingled funds and six related co-investment vehicles focused on infrastructure and power, three commingled special opportunities funds and the Company's first energy opportunities fund. In its North American and European flexible capital corporate private equity strategy, the Company targets opportunistic majority or shared-control investments in businesses with strong franchises and attractive growth opportunities in North America and Europe. The infrastructure and power strategy targets infrastructure-related assets across the power generation, transmission, midstream sectors and renewables seeking attractive risk-adjusted equity returns with current cash flow and capital appreciation. The special opportunities strategy seeks to invest opportunistically across a broad spectrum of distressed or mispriced investments, including corporate debt, rescue capital, private asset-backed investments, post-reorganization securities and non-performing portfolios. The energy opportunities strategy targets investments in the energy industry where its flexible capital can provide attractive risk-adjusted returns while mitigating commodity risk.
Real Estate Group: The Company’s Real Estate Group manages comprehensive real estate equity and debt strategies, with approximately $11.9 billion of AUM across 45 funds as of June 30, 2019.strategies. Real Estate equity strategies focus on applying hands-on value creation initiatives to mismanaged and capital-starved assets, as well as new development, ultimately selling stabilized assets back into the market. The Real Estate Group manages both a value-add strategy and an opportunistic strategy. The value-add strategy seeks to create value by buying assets at attractive valuations and through active asset management of income-producing properties across the U.S. and Western Europe. The opportunistic strategy focuses on manufacturing core assets through development, redevelopment and fixing distressed capital structures across major properties in the U.S. and Europe. The Company’s debt strategies leverage the Real Estate Group’s diverse sources of capital to directly originate and manage commercial mortgage
Ares Management Corporation
Notes to the Unaudited Condensed Consolidated Financial Statements (Continued)
(Dollars in Thousands, Except Share Data and As Otherwise Noted)
investments on properties that range from stabilized to requiring hands-on value creation. In addition to managing private debt funds, the Real Estate Group makes debt investments through a publicly traded commercial mortgage REIT, ACRE.
The Company has an OMG that consists of shared resource groups to support the Company’s operating segments by providing infrastructure and administrative support in the areas of accounting/finance, operations, information technology, strategy and relationship management, legal, compliance and human resources. Additionally, the OMG provides services to certain of the Company’s investment companies and partnerships, which reimburse the OMG for expenses equal to the costs of services provided. The OMG’s expenses are not allocated to the Company’s three reportable segments but the Company does consider the cost structure of the OMG when evaluating its financial performance.
Non-GAAPSegment Profit Measures: These measures supplement and should be considered in addition to, and not in lieu of, the Condensed Consolidated Statements of Operations prepared in accordance with GAAP.
Fee related earnings (“FRE”), a non-GAAP measure, is used to assess core operating performance by determining whether recurring revenue, primarily consisting of management fees, is sufficient to cover operating expenses and to generate profits. FRE differs from income before taxes computed in accordance with GAAP as it excludes performance income, performance related compensation, investment income from the Consolidated Funds and non-consolidated funds and certain other items that the Company believes are not indicative of its core operating performance.
Realized income (“RI”), a non-GAAP measure, is an operating metric used by management to evaluate performance of the business based on operating performance and the contribution of each of the business segments to that performance, while removing the
Ares Management Corporation
Notes to the Unaudited Condensed Consolidated Financial Statements (Continued)
(Dollars in Thousands, Except Share Data and As Otherwise Noted)
fluctuations of unrealized income and expenses, which may or may not be eventually realized at the levels presented and whose realizations depend more on future outcomes than current business operations. RI differs from net income by excluding (a) income tax expense, (b) operating results of the Consolidated Funds, (c) depreciation and amortization expense, (d) the effects of changes arising from corporate actions, (e) unrealized gains and losses related to performance income and investment performance and (f) certain other items that the Company believes are not indicative of operating performance. Changes arising from corporate actions include equity-based compensation expenses, the amortization of intangible assets, transaction costs associated with mergers, acquisitions and capital transactions, underwriting costs and expenses incurred in connection with corporate reorganization. Beginning in 2018, placement fees are no longer excluded from RI but are amortized to match the period over which management fees are recognized. Management believes RI is a more appropriate metric to evaluate the Company's current business operations.
Management makes operating decisions and assesses the performance of each of the Company’s business segments based on financial and operating metrics and other data that is presented before giving effect to the consolidation of any of the Consolidated Funds. Consequently, all segment data excludes the assets, liabilities and operating results related to the Consolidated Funds and non‑consolidatednon-consolidated funds.
| | | | | | | | | | | | | | | | | | | | | | | | | | | | | | | | | | | |
| Credit Group | | Private Equity Group | | Real
Estate Group | | Total
Segments | | OMG | | Total |
| Management fees (Credit Group includes ARCC Part I Fees of $41,306) | $ | 200,788 | | | $ | 53,396 | | | $ | 23,488 | | | $ | 277,672 | | | $ | — | | | $ | 277,672 | |
| Other fees | 4,101 | | | 30 | | | 7 | | | 4,138 | | | — | | | 4,138 | |
| Compensation and benefits | (76,765) | | | (22,126) | | | (12,735) | | | (111,626) | | | (36,939) | | | (148,565) | |
| General, administrative and other expenses | (12,524) | | | (4,448) | | | (3,263) | | | (20,235) | | | (16,053) | | | (36,288) | |
| Fee related earnings | 115,600 | | | 26,852 | | | 7,497 | | | 149,949 | | | (52,992) | | | 96,957 | |
| Performance income—realized | — | | | 44,318 | | | 307 | | | 44,625 | | | — | | | 44,625 | |
| Performance related compensation—realized | (112) | | | (36,741) | | | (191) | | | (37,044) | | | — | | | (37,044) | |
| Realized net performance income (loss) | (112) | | | 7,577 | | | 116 | | | 7,581 | | | — | | | 7,581 | |
| Investment income—realized | — | | | 8,045 | | | 964 | | | 9,009 | | | — | | | 9,009 | |
| Interest and other investment income (expense) —realized | 6,629 | | | 487 | | | 920 | | | 8,036 | | | (253) | | | 7,783 | |
| Interest expense | (2,336) | | | (2,247) | | | (1,355) | | | (5,938) | | | (144) | | | (6,082) | |
| Realized net investment income (loss) | 4,293 | | | 6,285 | | | 529 | | | 11,107 | | | (397) | | | 10,710 | |
| Realized income | $ | 119,781 | | | $ | 40,714 | | | $ | 8,142 | | | $ | 168,637 | | | $ | (53,389) | | | $ | 115,248 | |
| | | | | | | | | | | |
Ares Management Corporation
Notes to the Unaudited Condensed Consolidated Financial Statements (Continued)
(Dollars in Thousands, Except Share Data and As Otherwise Noted)
The following table presents the financial results for the Company’s operating segments, as well as the OMG, for the three months ended June 30, 2019:
| | | | | | | | | | | | | | | | | | | | | | | | | | | | | | | | | | | |
| Credit Group | | Private Equity Group | | Real
Estate Group | | Total
Segments | | OMG | | Total |
| Management fees (Credit Group includes ARCC Part I Fees of $39,157) | $ | 172,347 | | | $ | 52,162 | | | $ | 21,770 | | | $ | 246,279 | | | $ | — | | | $ | 246,279 | |
| Other fees | 3,939 | | | — | | | 672 | | | 4,611 | | | — | | | 4,611 | |
| Compensation and benefits | (64,965) | | | (21,291) | | | (11,928) | | | (98,184) | | | (33,994) | | | (132,178) | |
| General, administrative and other expenses | (13,381) | | | (4,912) | | | (3,523) | | | (21,816) | | | (19,874) | | | (41,690) | |
| Fee related earnings | 97,940 | | | 25,959 | | | 6,991 | | | 130,890 | | | (53,868) | | | 77,022 | |
| Performance income—realized | 15,959 | | | 18,369 | | | 1,666 | | | 35,994 | | | — | | | 35,994 | |
| Performance related compensation—realized | (9,564) | | | (14,696) | | | (969) | | | (25,229) | | | — | | | (25,229) | |
| Realized net performance income | 6,395 | | | 3,673 | | | 697 | | | 10,765 | | | — | | | 10,765 | |
| Investment income (loss)—realized | (310) | | | 1,030 | | | 1,546 | | | 2,266 | | | — | | | 2,266 | |
| Interest and other investment income (expense) —realized | 4,631 | | | 3,318 | | | 2,119 | | | 10,068 | | | (17) | | | 10,051 | |
| Interest expense | (1,908) | | | (2,436) | | | (1,050) | | | (5,394) | | | (399) | | | (5,793) | |
| Realized net investment income (loss) | 2,413 | | | 1,912 | | | 2,615 | | | 6,940 | | | (416) | | | 6,524 | |
| Realized income | $ | 106,748 | | | $ | 31,544 | | | $ | 10,303 | | | $ | 148,595 | | | $ | (54,284) | | | $ | 94,311 | |
| | | | | | | | | | | |
|
| | | | | | | | | | | | | | | | | | | | | | | |
| | Credit Group | | Private Equity Group | | Real
Estate Group | | Total
Segments | | OMG | | Total |
| Management fees (Credit Group includes ARCC Part I Fees of $39,157) | $ | 172,347 |
| | $ | 52,162 |
| | $ | 21,770 |
| | $ | 246,279 |
| | $ | — |
| | $ | 246,279 |
|
| Other fees | 3,939 |
| | — |
| | 672 |
| | 4,611 |
| | — |
| | 4,611 |
|
| Compensation and benefits | (64,965 | ) | | (21,291 | ) | | (11,928 | ) | | (98,184 | ) | | (33,994 | ) | | (132,178 | ) |
| General, administrative and other expenses | (13,381 | ) | | (4,912 | ) | | (3,523 | ) | | (21,816 | ) | | (19,874 | ) | | (41,690 | ) |
| Fee related earnings | 97,940 |
|
| 25,959 |
|
| 6,991 |
| | 130,890 |
| | (53,868 | ) | | 77,022 |
|
| Performance income—realized | 15,959 |
| | 18,369 |
| | 1,666 |
| | 35,994 |
| | — |
| | 35,994 |
|
| Performance related compensation—realized | (9,564 | ) | | (14,696 | ) | | (969 | ) | | (25,229 | ) | | — |
| | (25,229 | ) |
| Realized net performance income | 6,395 |
| | 3,673 |
| | 697 |
| | 10,765 |
| | — |
| | 10,765 |
|
| Investment income (loss)—realized | (310 | ) | | 1,030 |
| | 1,546 |
| | 2,266 |
| | — |
| | 2,266 |
|
| Interest and other investment income (expense) —realized | 4,631 |
| | 3,318 |
| | 2,119 |
| | 10,068 |
| | (17 | ) | | 10,051 |
|
| Interest expense | (1,908 | ) | | (2,436 | ) | | (1,050 | ) | | (5,394 | ) | | (399 | ) | | (5,793 | ) |
| Realized net investment income (loss) | 2,413 |
| | 1,912 |
| | 2,615 |
| | 6,940 |
| | (416 | ) | | 6,524 |
|
| Realized income | $ | 106,748 |
| | $ | 31,544 |
| | $ | 10,303 |
| | $ | 148,595 |
| | $ | (54,284 | ) | | $ | 94,311 |
|
The following table presents the financial results for the Company’s operating segments, as well as the OMG, for the three months ended June 30, 2018:
|
| | | | | | | | | | | | | | | | | | | | | | | |
| | Credit Group | | Private Equity Group | | Real
Estate Group | | Total
Segments | | OMG | | Total |
| Management fees (Credit Group includes ARCC Part I Fees of $29,866) | $ | 135,848 |
| | $ | 49,318 |
| | $ | 17,138 |
| | $ | 202,304 |
| | $ | — |
| | $ | 202,304 |
|
| Other fees | 6,877 |
| | 337 |
| | 7 |
| | 7,221 |
| | — |
| | 7,221 |
|
| Compensation and benefits | (52,271 | ) | | (18,672 | ) | | (8,768 | ) | | (79,711 | ) | | (30,680 | ) | | (110,391 | ) |
| General, administrative and other expenses | (11,294 | ) | | (4,175 | ) | | (2,391 | ) | | (17,860 | ) | | (19,236 | ) | | (37,096 | ) |
| Fee related earnings | 79,160 |
| | 26,808 |
| | 5,986 |
| | 111,954 |
| | (49,916 | ) | | 62,038 |
|
| Performance income—realized | 41,672 |
| | 80,415 |
| | 521 |
| | 122,608 |
| | — |
| | 122,608 |
|
| Performance related compensation—realized | (23,577 | ) | | (64,311 | ) | | 7 |
| | (87,881 | ) | | — |
| | (87,881 | ) |
| Realized net performance income | 18,095 |
| | 16,104 |
| | 528 |
| | 34,727 |
| | — |
| | 34,727 |
|
| Investment income (loss)—realized | 595 |
| | 9,016 |
| | (250 | ) | | 9,361 |
| | 798 |
| | 10,159 |
|
| Interest and other investment income—realized | 3,035 |
| | 2,920 |
| | 667 |
| | 6,622 |
| | 584 |
| | 7,206 |
|
| Interest expense | (3,596 | ) | | (1,440 | ) | | (452 | ) | | (5,488 | ) | | (588 | ) | | (6,076 | ) |
| Realized net investment income (loss) | 34 |
| | 10,496 |
| | (35 | ) | | 10,495 |
| | 794 |
| | 11,289 |
|
| Realized income | $ | 97,289 |
| | $ | 53,408 |
| | $ | 6,479 |
| | $ | 157,176 |
| | $ | (49,122 | ) | | $ | 108,054 |
|
Ares Management Corporation
Notes to the Unaudited Condensed Consolidated Financial Statements (Continued)
(Dollars in Thousands, Except Share Data and As Otherwise Noted)
The following table presents the financial results for the Company’s operating segments, as well as the OMG, for the six months ended June 30, 2020:
| | | | | | | | | | | | | | | | | | | | | | | | | | | | | | | | | | | |
| Credit Group | | Private Equity Group | | Real
Estate Group | | Total
Segments | | OMG | | Total |
| Management fees (Credit Group includes ARCC Part I Fees of $85,229) | $ | 398,225 | | | $ | 105,553 | | | $ | 47,672 | | | $ | 551,450 | | | $ | — | | | $ | 551,450 | |
| Other fees | 7,159 | | | 140 | | | 711 | | | 8,010 | | | — | | | 8,010 | |
| Compensation and benefits | (147,690) | | | (41,722) | | | (25,148) | | | (214,560) | | | (73,365) | | | (287,925) | |
| General, administrative and other expenses | (27,837) | | | (10,081) | | | (6,198) | | | (44,116) | | | (37,358) | | | (81,474) | |
| Fee related earnings | 229,857 | | | 53,890 | | | 17,037 | | | 300,784 | | | (110,723) | | | 190,061 | |
| Performance income—realized | 9,016 | | | 160,472 | | | 26,907 | | | 196,395 | | | — | | | 196,395 | |
| Performance related compensation—realized | (8,011) | | | (129,665) | | | (17,361) | | | (155,037) | | | — | | | (155,037) | |
| Realized net performance income | 1,005 | | | 30,807 | | | 9,546 | | | 41,358 | | | — | | | 41,358 | |
| Investment income (loss)—realized | (843) | | | 19,515 | | | 2,254 | | | 20,926 | | | (5,698) | | | 15,228 | |
| Interest and other investment income (expense) —realized | 11,204 | | | 1,299 | | | 1,716 | | | 14,219 | | | (85) | | | 14,134 | |
| Interest expense | (4,051) | | | (3,890) | | | (2,326) | | | (10,267) | | | (1,121) | | | (11,388) | |
| Realized net investment income (loss) | 6,310 | | | 16,924 | | | 1,644 | | | 24,878 | | | (6,904) | | | 17,974 | |
| Realized income | $ | 237,172 | | | $ | 101,621 | | | $ | 28,227 | | | $ | 367,020 | | | $ | (117,627) | | | $ | 249,393 | |
| | | | | | | | | | | |
The following table presents the financial results for the Company’s operating segments, as well as the OMG, for the six months ended June 30, 2019:
| | | | | | | | | | | | | | | | | | | | | | | | | | | | | | | | | | | |
| Credit Group | | Private Equity Group | | Real Estate Group | | Total
Segments | | OMG | | Total |
| Management fees (Credit Group includes ARCC Part I Fees of $77,550) | $ | 335,313 | | | $ | 103,558 | | | $ | 40,420 | | | $ | 479,291 | | | $ | — | | | $ | 479,291 | |
| Other fees | 7,005 | | | — | | | 681 | | | 7,686 | | | — | | | 7,686 | |
| Compensation and benefits | (125,313) | | | (42,487) | | | (21,212) | | | (189,012) | | | (66,655) | | | (255,667) | |
| General, administrative and other expenses | (26,886) | | | (8,969) | | | (6,655) | | | (42,510) | | | (40,506) | | | (83,016) | |
| Fee related earnings | 190,119 | | | 52,102 | | | 13,234 | | | 255,455 | | | (107,161) | | | 148,294 | |
| Performance income—realized | 37,884 | | | 62,492 | | | 4,191 | | | 104,567 | | | — | | | 104,567 | |
| Performance related compensation—realized | (22,227) | | | (49,993) | | | (2,226) | | | (74,446) | | | — | | | (74,446) | |
| Realized net performance income | 15,657 | | | 12,499 | | | 1,965 | | | 30,121 | | | — | | | 30,121 | |
| Investment income—realized | 548 | | | 11,966 | | | 5,026 | | | 17,540 | | | — | | | 17,540 | |
| Interest and other investment income (expense) —realized | 7,536 | | | 3,612 | | | 3,224 | | | 14,372 | | | (2) | | | 14,370 | |
| Interest expense | (3,807) | | | (4,611) | | | (2,169) | | | (10,587) | | | (795) | | | (11,382) | |
| Realized net investment income (loss) | 4,277 | | | 10,967 | | | 6,081 | | | 21,325 | | | (797) | | | 20,528 | |
| Realized income | $ | 210,053 | | | $ | 75,568 | | | $ | 21,280 | | | $ | 306,901 | | | $ | (107,958) | | | $ | 198,943 | |
| | | | | | | | | | | |
|
| | | | | | | | | | | | | | | | | | | | | | | |
| | Credit Group | | Private Equity Group | | Real
Estate Group | | Total
Segments | | OMG | | Total |
| Management fees (Credit Group includes ARCC Part I Fees of $77,550) | $ | 335,313 |
| | $ | 103,558 |
| | $ | 40,420 |
| | $ | 479,291 |
| | $ | — |
| | $ | 479,291 |
|
| Other fees | 7,005 |
| | — |
| | 681 |
| | 7,686 |
| | — |
| | 7,686 |
|
| Compensation and benefits | (125,313 | ) | | (42,487 | ) | | (21,212 | ) | | (189,012 | ) | | (66,655 | ) | | (255,667 | ) |
| General, administrative and other expenses | (26,886 | ) | | (8,969 | ) | | (6,655 | ) | | (42,510 | ) | | (40,506 | ) | | (83,016 | ) |
| Fee related earnings | 190,119 |
| | 52,102 |
| | 13,234 |
| | 255,455 |
| | (107,161 | ) | | 148,294 |
|
| Performance income—realized | 37,884 |
| | 62,492 |
| | 4,191 |
| | 104,567 |
| | — |
| | 104,567 |
|
| Performance related compensation—realized | (22,227 | ) | | (49,993 | ) | | (2,226 | ) | | (74,446 | ) | | — |
| | (74,446 | ) |
| Realized net performance income | 15,657 |
| | 12,499 |
| | 1,965 |
| | 30,121 |
| | — |
| | 30,121 |
|
| Investment income—realized | 548 |
| | 11,966 |
| | 5,026 |
| | 17,540 |
| | — |
| | 17,540 |
|
| Interest and other investment income (expense) —realized | 7,536 |
| | 3,612 |
| | 3,224 |
| | 14,372 |
| | (2 | ) | | 14,370 |
|
| Interest expense | (3,807 | ) | | (4,611 | ) | | (2,169 | ) | | (10,587 | ) | | (795 | ) | | (11,382 | ) |
| Realized net investment income (loss) | 4,277 |
| | 10,967 |
| | 6,081 |
| | 21,325 |
| | (797 | ) | | 20,528 |
|
| Realized income | $ | 210,053 |
| | $ | 75,568 |
| | $ | 21,280 |
| | $ | 306,901 |
| | $ | (107,958 | ) | | $ | 198,943 |
|
The following table presents the financial results for the Company’s operating segments, as well as the OMG, for the six months ended June 30, 2018:
|
| | | | | | | | | | | | | | | | | | | | | | | |
| | Credit Group | | Private Equity Group | | Real
Estate Group | | Total
Segments | | OMG | | Total |
| Management fees (Credit Group includes ARCC Part I Fees of $58,283) | $ | 267,614 |
| | $ | 99,205 |
| | $ | 32,311 |
| | $ | 399,130 |
| | $ | — |
| | $ | 399,130 |
|
| Other fees | 12,607 |
| | 677 |
| | 10 |
| | 13,294 |
| | — |
| | 13,294 |
|
| Compensation and benefits | (102,965 | ) | | (37,871 | ) | | (16,407 | ) | | (157,243 | ) | | (60,872 | ) | | (218,115 | ) |
| General, administrative and other expenses | (21,148 | ) | | (8,216 | ) | | (4,823 | ) | | (34,187 | ) | | (37,627 | ) | | (71,814 | ) |
| Fee related earnings | 156,108 |
| | 53,795 |
| | 11,091 |
| | 220,994 |
| | (98,499 | ) | | 122,495 |
|
| Performance income—realized | 46,743 |
| | 84,813 |
| | 14,159 |
| | 145,715 |
| | — |
| | 145,715 |
|
| Performance related compensation—realized | (26,665 | ) | | (67,871 | ) | | (8,214 | ) | | (102,750 | ) | | — |
| | (102,750 | ) |
| Realized net performance income | 20,078 |
| | 16,942 |
| | 5,945 |
| | 42,965 |
| | — |
| | 42,965 |
|
| Investment income—realized | 1,366 |
| | 9,687 |
| | 3,100 |
| | 14,153 |
| | 1,636 |
| | 15,789 |
|
| Interest and other investment income—realized | 6,224 |
| | 2,979 |
| | 884 |
| | 10,087 |
| | 1,736 |
| | 11,823 |
|
| Interest expense | (8,269 | ) | | (2,668 | ) | | (872 | ) | | (11,809 | ) | | (1,136 | ) | | (12,945 | ) |
| Realized net investment income (loss) | (679 | ) | | 9,998 |
| | 3,112 |
| | 12,431 |
| | 2,236 |
| | 14,667 |
|
| Realized income | $ | 175,507 |
| | $ | 80,735 |
| | $ | 20,148 |
| | $ | 276,390 |
| | $ | (96,263 | ) | | $ | 180,127 |
|
Ares Management Corporation
Notes to the Unaudited Condensed Consolidated Financial Statements (Continued)
(Dollars in Thousands, Except Share Data and As Otherwise Noted)
The following table presents the components of the Company’s operating segments’ revenue, expenses and realized net investment income:
| | | | For the Three Months Ended
June 30, | | For the Six Months Ended
June 30, | | Three months ended June 30, | | | Six months ended June 30, | |
| | 2019 | | 2018 | | 2019 | | 2018 | | 2020 | | 2019 | | 2020 | | 2019 | |
| Segment revenues | | | | | | | | Segment revenues | | | | | | | | |
| Management fees (includes ARCC Part I Fees of $39,157, $77,550 and $29,866, $58,283 for the three and six months ended June 30, 2019 and 2018, respectively) | $ | 246,279 |
| | $ | 202,304 |
| | $ | 479,291 |
| | $ | 399,130 |
| |
| Management fees (includes ARCC Part I Fees of $41,306, $85,229 and $39,157, $77,550 for the three and six months ended June 30, 2020 and 2019, respectively) | | Management fees (includes ARCC Part I Fees of $41,306, $85,229 and $39,157, $77,550 for the three and six months ended June 30, 2020 and 2019, respectively) | $ | 277,672 | | | $ | 246,279 | | | $ | 551,450 | | | $ | 479,291 | | |
| Other fees | 4,611 |
| | 7,221 |
| | 7,686 |
| | 13,294 |
| Other fees | 4,138 | | | 4,611 | | | 8,010 | | | 7,686 | | |
| Performance income—realized | 35,994 |
| | 122,608 |
| | 104,567 |
| | 145,715 |
| Performance income—realized | 44,625 | | | 35,994 | | | 196,395 | | | 104,567 | | |
| Total segment revenues | $ | 286,884 |
| | $ | 332,133 |
| | $ | 591,544 |
| | $ | 558,139 |
| Total segment revenues | $ | 326,435 | | | $ | 286,884 | | | $ | 755,855 | | | $ | 591,544 | | |
| Segment expenses | | | | | | | | Segment expenses | | | | | | | | |
| Compensation and benefits | $ | 98,184 |
| | $ | 79,711 |
| | $ | 189,012 |
| | $ | 157,243 |
| Compensation and benefits | $ | 111,626 | | | $ | 98,184 | | | $ | 214,560 | | | $ | 189,012 | | |
| General, administrative and other expenses | 21,816 |
| | 17,860 |
| | 42,510 |
| | 34,187 |
| General, administrative and other expenses | 20,235 | | | 21,816 | | | 44,116 | | | 42,510 | | |
| Performance related compensation—realized | 25,229 |
| | 87,881 |
| | 74,446 |
| | 102,750 |
| Performance related compensation—realized | 37,044 | | | 25,229 | | | 155,037 | | | 74,446 | | |
| Total segment expenses | $ | 145,229 |
| | $ | 185,452 |
| | $ | 305,968 |
| | $ | 294,180 |
| Total segment expenses | $ | 168,905 | | | $ | 145,229 | | | $ | 413,713 | | | $ | 305,968 | | |
| Segment realized net investment income | | | | | | | | Segment realized net investment income | | | | | | | | |
| Investment income—realized | $ | 2,266 |
| | $ | 9,361 |
| | $ | 17,540 |
| | $ | 14,153 |
| Investment income—realized | $ | 9,009 | | | $ | 2,266 | | | $ | 20,926 | | | $ | 17,540 | | |
| Interest and other investment income- realized | 10,068 |
| | 6,622 |
| | 14,372 |
| | 10,087 |
| |
| Interest and other investment income —realized | | Interest and other investment income —realized | 8,036 | | | 10,068 | | | 14,219 | | | 14,372 | | |
| Interest expense | (5,394 | ) | | (5,488 | ) | | (10,587 | ) | | (11,809 | ) | Interest expense | (5,938) | | | (5,394) | | | (10,267) | | | (10,587) | | |
| Total segment realized net investment income | $ | 6,940 |
| | $ | 10,495 |
| | $ | 21,325 |
| | $ | 12,431 |
| Total segment realized net investment income | $ | 11,107 | | | $ | 6,940 | | | $ | 24,878 | | | $ | 21,325 | | |
The following table reconciles the Company's consolidated revenues to segment revenue:
| | | | | | | | | | | | | | | | | | | | | | | | | |
| Three months ended June 30, | | | | Six months ended June 30, | | | | |
| 2020 | | 2019 | | 2020 | | 2019 | | |
| Total consolidated revenue | $ | 602,758 | | | $ | 384,822 | | | $ | 616,167 | | | $ | 862,019 | | | |
| Performance (income) loss-unrealized | (257,303) | | | (98,662) | | | 130,354 | | | (245,237) | | | |
| Management fees of Consolidated Funds eliminated in consolidation | 11,380 | | | 8,735 | | | 21,882 | | | 17,148 | | | |
| | | | | | | | | |
| Incentive fees of Consolidated Funds eliminated in consolidation | (25) | | | 4,750 | | | (70) | | | 5,184 | | | |
| Administrative, transaction and other fees of Consolidated Funds eliminated in consolidation | 4,484 | | | — | | | 7,801 | | | — | | | |
Administrative fees(1) | (8,838) | | | (6,602) | | | (18,499) | | | (13,204) | | | |
| | | | | | | | | |
Performance income (loss) reclass (2) | (1,656) | | | (26) | | | (3,373) | | | 580 | | | |
| Principal investment (income) loss, net of eliminations | (23,645) | | | (5,844) | | | 3,078 | | | (34,603) | | | |
| Net income of non-controlling interests in consolidated subsidiaries | (720) | | | (289) | | | (1,485) | | | (343) | | | |
| Total consolidation adjustments and reconciling items | (276,323) | | | (97,938) | | | 139,688 | | | (270,475) | | | |
| Total segment revenue | $ | 326,435 | | | $ | 286,884 | | | $ | 755,855 | | | $ | 591,544 | | | |
|
| | | | | | | | | | | | | | | |
| | For the Three Months Ended
June 30, | | For the Six Months Ended
June 30, |
| | 2019 | | 2018 | | 2019 | | 2018 |
| Total consolidated revenue | $ | 384,822 |
| | $ | 204,163 |
| | $ | 862,019 |
| | $ | 470,252 |
|
| Performance income-unrealized | (98,662 | ) | | 124,343 |
| | (245,237 | ) | | 89,225 |
|
| Management fees of Consolidated Funds eliminated in consolidation | 8,735 |
| | 8,272 |
| | 17,148 |
| | 15,583 |
|
| Incentive fees of Consolidated Funds eliminated in consolidation | 4,750 |
| | 4,000 |
| | 5,184 |
| | 4,000 |
|
| Principal investment income of Consolidated Funds eliminated in consolidation | (4,265 | ) | | 12,851 |
| | (3,132 | ) | | 10,650 |
|
| Administrative fees(1) | (6,602 | ) | | (6,770 | ) | | (13,204 | ) | | (13,182 | ) |
| Performance income reclass(2) | (26 | ) | | (31 | ) | | 580 |
| | (1,006 | ) |
| Principal investment income | (1,579 | ) | | (14,722 | ) | | (31,471 | ) | | (17,430 | ) |
| Net (revenue) expense of non-controlling interests in consolidated subsidiaries | (289 | ) | | 27 |
| | (343 | ) | | 47 |
|
| Total consolidation adjustments and reconciling items | (97,938 | ) | | 127,970 |
| | (270,475 | ) | | 87,887 |
|
| Total segment revenue | $ | 286,884 |
| | $ | 332,133 |
| | $ | 591,544 |
| | $ | 558,139 |
|
| |
(1) | Represents administrative fees that are presented in administrative, transaction and other fees in the Company’s Condensed Consolidated Statements of Operations and are netted against the respective expenses for segment reporting. |
| |
(2) | Related to performance income for AREA Sponsor Holdings LLC, an investment pool. Changes in value of this investment are reflected within net realized and unrealized gain (loss) on investments in the Company’s Condensed Consolidated Statements of Operations. |
Ares Management Corporation
Notes to the Unaudited Condensed Consolidated Financial Statements (Continued)
(Dollars in Thousands, Except Share Data and As Otherwise Noted)
The following table reconciles the Company's consolidated expenses to segment expenses:
| | | | | | | | | | | | | | | | | | | | | | | | | |
| Three months ended June 30, | | | | Six months ended June 30, | | | | |
| 2020 | | 2019 | | 2020 | | 2019 | | |
| Total consolidated expenses | $ | 483,567 | | | $ | 335,701 | | | $ | 565,526 | | | $ | 704,808 | | | |
| Performance related compensation-unrealized | (200,064) | | | (67,459) | | | 85,828 | | | (174,762) | | | |
| Expenses of Consolidated Funds added in consolidation | (14,601) | | | (28,912) | | | (32,500) | | | (42,313) | | | |
| Expenses of Consolidated Funds eliminated in consolidation | 11,357 | | | 13,485 | | | 21,813 | | | 22,332 | | | |
Administrative fees(1) | (8,838) | | | (6,602) | | | (18,499) | | | (13,204) | | | |
| OMG expenses | (52,992) | | | (53,868) | | | (110,723) | | | (107,161) | | | |
| Acquisition and merger-related expense | (2,841) | | | (4,207) | | | (5,956) | | | (5,980) | | | |
| Equity compensation expense | (28,683) | | | (24,029) | | | (61,240) | | | (51,581) | | | |
| Deferred placement fees | (10,320) | | | (12,432) | | | (15,735) | | | (12,953) | | | |
| Depreciation and amortization expense | (6,319) | | | (5,221) | | | (11,861) | | | (11,045) | | | |
| | | | | | | | | |
| Expense of non-controlling interests in consolidated subsidiaries | (1,361) | | | (1,227) | | | (2,940) | | | (2,173) | | | |
| Total consolidation adjustments and reconciling items | (314,662) | | | (190,472) | | | (151,813) | | | (398,840) | | | |
| Total segment expenses | $ | 168,905 | | | $ | 145,229 | | | $ | 413,713 | | | $ | 305,968 | | | |
|
| | | | | | | | | | | | | | | |
| | For the Three Months Ended
June 30, | | For the Six Months Ended
June 30, |
| | 2019 | | 2018 | | 2019 | | 2018 |
| Total consolidated expenses | $ | 335,701 |
| | $ | 221,017 |
| | $ | 704,808 |
| | $ | 427,300 |
|
| Performance related compensation-unrealized | (67,459 | ) | | 100,886 |
| | (174,762 | ) | | 89,877 |
|
| Expenses of Consolidated Funds added in consolidation | (28,912 | ) | | (47,382 | ) | | (42,313 | ) | | (56,011 | ) |
| Expenses of Consolidated Funds eliminated in consolidation | 13,485 |
| | 12,270 |
| | 22,332 |
| | 19,583 |
|
| Administrative fees(1) | (6,602 | ) | | (6,770 | ) | | (13,204 | ) | | (13,182 | ) |
| OMG expenses | (53,868 | ) | | (49,916 | ) | | (107,161 | ) | | (98,499 | ) |
| Acquisition and merger-related expense | (4,207 | ) | | (47 | ) | | (5,980 | ) | | 272 |
|
| Equity compensation expense | (24,029 | ) | | (22,507 | ) | | (51,581 | ) | | (43,594 | ) |
| Unamortized placement fees | (12,432 | ) | | (1,852 | ) | | (12,953 | ) | | (3,516 | ) |
| Depreciation and amortization expense | (5,221 | ) | | (7,711 | ) | | (11,045 | ) | | (14,887 | ) |
| Other expense(2) | — |
| | (11,836 | ) | | — |
| | (11,836 | ) |
| Expense of non-controlling interests in consolidated subsidiaries | (1,227 | ) | | (700 | ) | | (2,173 | ) | | (1,327 | ) |
| Total consolidation adjustments and reconciling items | (190,472 | ) | | (35,565 | ) | | (398,840 | ) | | (133,120 | ) |
| Total segment expenses | $ | 145,229 |
| | $ | 185,452 |
| | $ | 305,968 |
| | $ | 294,180 |
|
| |
(1) | (1)Represents administrative fees that are presented in administrative, transaction and other fees in the Company’s Condensed Consolidated Statements of Operations and are netted against the respective expenses for segment reporting. |
| |
(2) | 2018 period includes $11.8 million payment to ARCC for rent and utilities for the years ended 2017, 2016, 2015 and 2014, and the first quarter of 2018. |
The following table reconciles the Company's consolidated other income toCompany’s Condensed Consolidated Statements of Operations and are netted against the respective expenses for segment realized net investment income:reporting.
|
| | | | | | | | | | | | | | | |
| | For the Three Months Ended
June 30, | | For the Six Months Ended
June 30, |
| | 2019 | | 2018 | | 2019 | | 2018 |
| Total consolidated other income | $ | 35,262 |
| | $ | 67,926 |
| | $ | 63,132 |
| | $ | 70,166 |
|
| Investment (income) loss - unrealized | 7,618 |
| | (1,382 | ) | | (8,565 | ) | | 4,269 |
|
| Interest and other investment (income) loss - unrealized | (4,628 | ) | | 1,373 |
| | 350 |
| | 1,296 |
|
| Other expense from Consolidated Funds added in consolidation, net | (33,008 | ) | | (69,193 | ) | | (64,215 | ) | | (76,445 | ) |
| Other (income) expense from Consolidated Funds eliminated in consolidation, net | 282 |
| | (993 | ) | | (90 | ) | | (534 | ) |
| OMG other income | (188 | ) | | (3,699 | ) | | (158 | ) | | (6,467 | ) |
| Performance income reclass(1) | 26 |
| | 31 |
| | (580 | ) | | 1,006 |
|
| Principal investment income | 1,579 |
| | 14,722 |
| | 31,471 |
| | 17,430 |
|
| Other expense, net | 2 |
| | 1,718 |
| | 1 |
| | 1,725 |
|
| Other income of non-controlling interests in consolidated subsidiaries | (5 | ) | | (8 | ) | | (21 | ) | | (15 | ) |
| Total consolidation adjustments and reconciling items | (28,322 | ) | | (57,431 | ) | | (41,807 | ) | | (57,735 | ) |
| Total segment realized net investment income | $ | 6,940 |
| | $ | 10,495 |
| | $ | 21,325 |
| | $ | 12,431 |
|
| |
(1) | Related to performance income for AREA Sponsor Holdings LLC. Changes in value of this investment are reflected within net realized and unrealized gain (loss) on investments in the Company’s Consolidated Statements of Operations. |
Ares Management Corporation
Notes to the Unaudited Condensed Consolidated Financial Statements (Continued)
(Dollars in Thousands, Except Share Data and As Otherwise Noted)
The following table reconciles the Company's consolidated other income to segment realized net investment income:
| | | | | | | | | | | | | | | | | | | | | | | | | |
| Three months ended June 30, | | | | Six months ended June 30, | | | | |
| 2020 | | 2019 | | 2020 | | 2019 | | |
| Total consolidated other income (expense) | $ | 121,906 | | | $ | 35,262 | | | $ | (105,957) | | | $ | 63,132 | | | |
| Investment (income) loss—unrealized | (23,704) | | | 7,618 | | | 81,890 | | | (8,565) | | | |
| Interest and other investment (income) loss—unrealized | (3,979) | | | (4,628) | | | (8,940) | | | 350 | | | |
| Other (income) loss from Consolidated Funds added in consolidation, net | (109,394) | | | (33,008) | | | 88,851 | | | (64,215) | | | |
| Other (income) loss from Consolidated Funds eliminated in consolidation, net | (4,189) | | | 282 | | | (8,008) | | | (90) | | | |
| OMG other (income) expense | (102) | | | (188) | | | 1,039 | | | (158) | | | |
Performance (income) loss reclass(1) | 1,656 | | | 26 | | | 3,373 | | | (580) | | | |
| Principal investment income (loss) | 32,957 | | | 1,579 | | | (43,031) | | | 31,471 | | | |
| Other expense, net | 347 | | | 2 | | | 369 | | | 1 | | | |
| Other (income) loss of non-controlling interests in consolidated subsidiaries | (4,391) | | | (5) | | | 15,292 | | | (21) | | | |
| Total consolidation adjustments and reconciling items | (110,799) | | | (28,322) | | | 130,835 | | | (41,807) | | | |
| Total segment realized net investment income | $ | 11,107 | | | $ | 6,940 | | | $ | 24,878 | | | $ | 21,325 | | | |
(1)Related to performance income for AREA Sponsor Holdings LLC. Changes in value of this investment are reflected within net realized and unrealized gains (losses) on investments in the Company’s Condensed Consolidated Statements of Operations.
The following table presents the reconciliation of income before taxes as reported in the Condensed Consolidated Statements of Operations to segment results of RI and FRE:
| | | | | | | | | | | | Three months ended June 30, | | | Six months ended June 30, | |
| | For the Three Months Ended
June 30, | | For the Six Months Ended
June 30, | | 2020 | | 2019 | | 2020 | | 2019 | |
| | 2019 | | 2018 | | 2019 | | 2018 | |
| Income before taxes | $ | 84,383 |
| | $ | 51,072 |
| | $ | 220,343 |
| | $ | 113,118 |
| |
| Income (loss) before taxes | | Income (loss) before taxes | $ | 241,097 | | | $ | 84,383 | | | $ | (55,316) | | | $ | 220,343 | | |
| Adjustments: | | | | | | | | Adjustments: | | |
| Depreciation and amortization expense | 5,221 |
| | 7,711 |
| | 11,045 |
| | 14,887 |
| Depreciation and amortization expense | 6,319 | | | 5,221 | | | 11,861 | | | 11,045 | | |
| Equity compensation expense | 24,029 |
| | 22,507 |
| | 51,581 |
| | 43,594 |
| Equity compensation expense | 28,683 | | | 24,029 | | | 61,240 | | | 51,581 | | |
| Acquisition and merger-related expense | 4,207 |
| | 47 |
| | 5,980 |
| | (272 | ) | Acquisition and merger-related expense | 3,188 | | | 4,207 | | | 6,325 | | | 5,980 | | |
| Unamortized placement fees | 12,432 |
| | 1,852 |
| | 12,953 |
| | 3,516 |
| |
| Deferred placement fees | | Deferred placement fees | 10,320 | | | 12,432 | | | 15,735 | | | 12,953 | | |
| OMG expense, net | 53,680 |
| | 46,217 |
| | 107,003 |
| | 92,032 |
| OMG expense, net | 52,890 | | | 53,680 | | | 111,762 | | | 107,003 | | |
| Other expense, net(1) | 2 |
| | 13,554 |
| | 1 |
| | 13,561 |
| |
| Expense of non-controlling interests in consolidated subsidiaries | 933 |
| | 719 |
| | 1,809 |
| | 1,359 |
| |
| Income before taxes of non-controlling interests in Consolidated Funds, net of eliminations | (8,079 | ) | | (9,951 | ) | | (25,124 | ) | | (10,318 | ) | |
| Total performance income - unrealized | (98,662 | ) | | 124,343 |
| | (245,237 | ) | | 89,225 |
| |
| Other expense, net | | Other expense, net | — | | | 2 | | | — | | | 1 | | |
| Net (income) expense of non-controlling interests in consolidated subsidiaries | | Net (income) expense of non-controlling interests in consolidated subsidiaries | (3,750) | | | 933 | | | 16,747 | | | 1,809 | | |
| (Income) loss before taxes of non-controlling interests in Consolidated Funds, net of eliminations | | (Income) loss before taxes of non-controlling interests in Consolidated Funds, net of eliminations | (85,188) | | | (8,079) | | | 81,190 | | | (25,124) | | |
| Total performance (income) loss-unrealized | | Total performance (income) loss-unrealized | (257,303) | | | (98,662) | | | 130,354 | | | (245,237) | | |
| Total performance related compensation - unrealized | 67,459 |
| | (100,886 | ) | | 174,762 |
| | (89,877 | ) | Total performance related compensation - unrealized | 200,064 | | | 67,459 | | | (85,828) | | | 174,762 | | |
| Total investment (income) loss - unrealized | 2,990 |
| | (9 | ) | | (8,215 | ) | | 5,565 |
| |
| Total investment (income) loss-unrealized | | Total investment (income) loss-unrealized | (27,683) | | | 2,990 | | | 72,950 | | | (8,215) | | |
| Realized income | 148,595 |
| | 157,176 |
| | 306,901 |
| | 276,390 |
| Realized income | 168,637 | | | 148,595 | | | 367,020 | | | 306,901 | | |
| Total performance income - realized | (35,994 | ) | | (122,608 | ) | | (104,567 | ) | | (145,715 | ) | Total performance income - realized | (44,625) | | | (35,994) | | | (196,395) | | | (104,567) | | |
| Total performance related compensation - realized | 25,229 |
| | 87,881 |
| | 74,446 |
| | 102,750 |
| Total performance related compensation - realized | 37,044 | | | 25,229 | | | 155,037 | | | 74,446 | | |
| Total investment income - realized | (6,940 | ) | | (10,495 | ) | | (21,325 | ) | | (12,431 | ) | Total investment income - realized | (11,107) | | | (6,940) | | | (24,878) | | | (21,325) | | |
| Fee related earnings | $ | 130,890 |
| | $ | 111,954 |
|
| $ | 255,455 |
| | $ | 220,994 |
| Fee related earnings | $ | 149,949 | | | $ | 130,890 | | | $ | 300,784 | | | $ | 255,455 | | |
| |
(1) | 2018 period includes $11.8 million payment to ARCC for rent and utilities for the years ended 2017, 2016, 2015 and 2014, and the first quarter of 2018. |
Ares Management Corporation
Notes to the Unaudited Condensed Consolidated Financial Statements (Continued)
(Dollars in Thousands, Except Share Data and As Otherwise Noted)
15. CONSOLIDATION
Investments in Consolidated Variable Interest Entities
The Company consolidates entities in which the Company has a variable interest and as the general partner or investment manager, has both the power to direct the most significant activities and a potentially significant economic interest. Investments in the consolidated VIEs are reported at fair value and represent the Company’s maximum exposure to loss.
Investments in Non-Consolidated Variable Interest Entities
The Company holds interests in certain VIEs that are not consolidated as the Company is not the primary beneficiary. The Company's interest in such entities generally is in the form of direct equity interests, fixed fee arrangements or both. The maximum exposure to loss represents the potential loss of assets by the Company relating to these non-consolidated entities. Investments in the non-consolidated VIEs are carried at fair value.
The Company's interests in consolidated and non-consolidated VIEs, as presented in the Condensed Consolidated Statements of Financial Condition, and its respective maximum exposure to loss relating to non-consolidated VIEs are as follows:
|
| | | | | | | |
| | As of June 30, | | As of December 31, |
| | 2019 | | 2018 |
| Maximum exposure to loss attributable to the Company's investment in non-consolidated VIEs | $ | 224,154 |
| | $ | 222,477 |
|
| Maximum exposure to loss attributable to the Company's investment in consolidated VIEs | 197,296 |
| | 186,455 |
|
| Assets of consolidated VIEs | 8,421,736 |
| | 8,141,280 |
|
| Liabilities of consolidated VIEs | 7,634,429 |
| | 7,479,383 |
|
|
| | | | | | | | | | | | | | | |
| | For the Three Months Ended
June 30, | | For the Six Months Ended
June 30, |
| | 2019 | | 2018 | | 2019 | | 2018 |
| Net income attributable to non-controlling interests related to consolidated VIEs | $ | 8,346 |
| | $ | 9,882 |
| | $ | 25,970 |
| | $ | 10,249 |
|
| | | | | | | | | | | |
| As of June 30, | | As of December 31, |
| 2020 | | 2019 |
Maximum exposure to loss attributable to the Company's investment in non-consolidated VIEs(1) | $ | 252,564 | | | $ | 260,520 | |
Maximum exposure to loss attributable to the Company's investment in consolidated VIEs(1) | 151,144 | | | 181,856 | |
| Assets of consolidated VIEs | 10,575,113 | | | 9,454,572 | |
| Liabilities of consolidated VIEs | 9,960,904 | | | 8,679,869 | |
(1)As of June 30, 2020 and December 31, 2019, the Company's maximum exposure of loss for CLO securities was equal to the cumulative fair value of our capital interest in CLOs that are managed and totaled $79.5 million and $104.7 million, respectively.
| | | | | | | | | | | | | | | | | | | | | | | | | |
| Three months ended June 30, | | | | Six months ended June 30, | | | | |
| 2020 | | 2019 | | 2020 | | 2019 | | |
| Net income (loss) attributable to non-controlling interests related to consolidated VIEs | $ | 85,186 | | | $ | 8,346 | | | $ | (81,220) | | | $ | 25,970 | | | |
Ares Management Corporation
Notes to the Unaudited Condensed Consolidated Financial Statements (Continued)
(Dollars in Thousands, Except Share Data and As Otherwise Noted)
Consolidating Schedules
The following supplemental financial information illustrates the consolidating effects of the Consolidated Funds on the Company's financial condition, as of June 30, 2019 and December 31, 2018 and results from operations for the three and six months ended June 30, 2019 and 2018. cash flows:
| | | | | | | | | | | | | | | | | | | | | | | |
| | As of June 30, 2020 | | | | | | |
| | Consolidated
Company
Entities | | Consolidated
Funds | | Eliminations | | Consolidated |
| Assets | | | | | | | |
| Cash and cash equivalents | $ | 890,040 | | | $ | — | | | $ | — | | | $ | 890,040 | |
| Investments (includes $1,003,827 of accrued carried interest) | 1,630,631 | | | — | | | (151,144) | | | 1,479,487 | |
| Due from affiliates | 278,480 | | | — | | | (20,354) | | | 258,126 | |
| Other assets | 368,696 | | | — | | | — | | | 368,696 | |
| Right-of-use operating lease assets | 140,041 | | | — | | | — | | | 140,041 | |
| Assets of Consolidated Funds | | | | | | | |
| Cash and cash equivalents | — | | | 258,400 | | | — | | | 258,400 | |
| Investments, at fair value | — | | | 9,997,178 | | | 8,454 | | | 10,005,632 | |
| Due from affiliates | — | | | 7,201 | | | — | | | 7,201 | |
| Receivable for securities sold | — | | | 276,692 | | | — | | | 276,692 | |
| Other assets | — | | | 35,642 | | | — | | | 35,642 | |
| Total assets | $ | 3,307,888 | | | $ | 10,575,113 | | | $ | (163,044) | | | $ | 13,719,957 | |
| Liabilities | | | | | | | |
| Accounts payable, accrued expenses and other liabilities | $ | 104,017 | | | $ | — | | | $ | — | | | $ | 104,017 | |
| Accrued compensation | 123,123 | | | — | | | — | | | 123,123 | |
| Due to affiliates | 61,025 | | | — | | | — | | | 61,025 | |
| Performance related compensation payable | 715,181 | | | — | | | — | | | 715,181 | |
| Debt obligations | 642,474 | | | — | | | — | | | 642,474 | |
| | | | | | | |
| Operating lease liabilities | 164,521 | | | — | | | — | | | 164,521 | |
| Liabilities of Consolidated Funds | | | | | | | |
| Accounts payable, accrued expenses and other liabilities | — | | | 60,975 | | | — | | | 60,975 | |
| Due to affiliates | — | | | 11,900 | | | (11,900) | | | — | |
| Payable for securities purchased | — | | | 449,169 | | | — | | | 449,169 | |
| CLO loan obligations, at fair value | — | | | 9,271,823 | | | (43,136) | | | 9,228,687 | |
| Fund borrowings | — | | | 167,037 | | | — | | | 167,037 | |
| Total liabilities | 1,810,341 | | | 9,960,904 | | | (55,036) | | | 11,716,209 | |
| Commitments and contingencies | | | | | | | |
| Non-controlling interest in Consolidated Funds | — | | | 614,209 | | | (108,008) | | | 506,201 | |
| Non-controlling interest in Ares Operating Group entities | 552,490 | | | — | | | — | | | 552,490 | |
| Stockholders' Equity | | | | | | | |
| Series A Preferred Stock, $0.01 par value, 1,000,000,000 shares authorized (12,400,000 shares issued and outstanding) | 298,761 | | | — | | | — | | | 298,761 | |
| Class A common stock, $0.01 par value, 1,500,000,000 shares authorized (135,335,943 shares issued and outstanding) | 1,353 | | | — | | | — | | | 1,353 | |
| | | | | | | |
| Class B common stock, $0.01 par value,1,000 shares authorized (1,000 shares issued and outstanding) | — | | | — | | | — | | | — | |
| Class C common stock, $0.01 par value, 499,999,000 shares authorized (114,798,404 shares issued and outstanding) | 1,148 | | | — | | | — | | | 1,148 | |
| Additional paid-in-capital | 800,077 | | | — | | | — | | | 800,077 | |
| Retained earnings | (145,045) | | | — | | | — | | | (145,045) | |
| Accumulated other comprehensive loss, net of tax | (11,237) | | | — | | | — | | | (11,237) | |
| Total stockholders' equity | 945,057 | | | — | | | — | | | 945,057 | |
| Total equity | 1,497,547 | | | 614,209 | | | (108,008) | | | 2,003,748 | |
| Total liabilities, non-controlling interests and equity | $ | 3,307,888 | | | $ | 10,575,113 | | | $ | (163,044) | | | $ | 13,719,957 | |
|
| | | | | | | | | | | | | | | |
| | As of June 30, 2019 |
| | Consolidated
Company
Entities | | Consolidated
Funds | | Eliminations | | Consolidated |
| Assets | |
| | |
| | |
| | |
|
| Cash and cash equivalents | $ | 247,220 |
| | $ | — |
| | $ | — |
| | $ | 247,220 |
|
| Investments (includes $1,071,954 of accrued carried interest) | 1,763,338 |
| | — |
| | (197,296 | ) | | 1,566,042 |
|
| Due from affiliates | 242,515 |
| | — |
| | (8,434 | ) | | 234,081 |
|
| Other assets | 358,091 |
| | — |
| | — |
| | 358,091 |
|
| Right-of-use operating lease assets | 152,579 |
| | — |
| | — |
| | 152,579 |
|
| Assets of Consolidated Funds | |
| | |
| | |
| |
|
|
| Cash and cash equivalents | — |
| | 376,328 |
| | — |
| | 376,328 |
|
| Investments, at fair value | — |
| | 7,926,615 |
| | — |
| | 7,926,615 |
|
| Due from affiliates | — |
| | 15,888 |
| | — |
| | 15,888 |
|
| Receivable for securities sold | — |
| | 76,993 |
| | — |
| | 76,993 |
|
| Other assets | — |
| | 25,912 |
| | — |
| | 25,912 |
|
| Total assets | $ | 2,763,743 |
| | $ | 8,421,736 |
| | $ | (205,730 | ) | | $ | 10,979,749 |
|
| Liabilities | |
| | |
| | |
| | |
|
| Accounts payable, accrued expenses and other liabilities | $ | 76,838 |
| | $ | — |
| | $ | — |
| | $ | 76,838 |
|
| Accrued compensation | 114,936 |
| | — |
| | — |
| | 114,936 |
|
| Due to affiliates | 65,527 |
| | — |
| | — |
| | 65,527 |
|
| Performance related compensation payable | 772,592 |
| | — |
| | — |
| | 772,592 |
|
| Debt obligations | 566,277 |
| | — |
| | — |
| | 566,277 |
|
| Right-of-use operating lease liabilities | 179,192 |
| | — |
| | — |
| | 179,192 |
|
| Liabilities of Consolidated Funds | |
| | |
| | |
| |
|
|
| Accounts payable, accrued expenses and other liabilities | — |
| | 75,647 |
| | — |
| | 75,647 |
|
| Due to affiliates | — |
| | 8,434 |
| | (8,434 | ) | | — |
|
| Payable for securities purchased | — |
| | 369,465 |
| | — |
| | 369,465 |
|
| CLO loan obligations, at fair value | — |
| | 7,054,773 |
| | (23,932 | ) | | 7,030,841 |
|
| Fund borrowings | — |
| | 126,110 |
| | — |
| | 126,110 |
|
| Total liabilities | 1,775,362 |
| | 7,634,429 |
| | (32,366 | ) | | 9,377,425 |
|
| Commitments and contingencies |
|
| |
|
| |
|
| |
|
|
| Non-controlling interest in Consolidated Funds | — |
| | 787,307 |
| | (173,364 | ) | | 613,943 |
|
| Non-controlling interest in Ares Operating Group entities | 352,882 |
| | — |
| | — |
| | 352,882 |
|
| Stockholders' Equity | | | | | | | |
| Series A Preferred Stock, $0.01 par value, 1,000,000,000 shares authorized (12,400,000 shares issued and outstanding) | 298,761 |
| | — |
| | — |
| | 298,761 |
|
| Class A common stock, $0.01 par value, 1,500,000,000 shares authorized (107,458,309 shares issued and outstanding) | 1,075 |
| | — |
| | — |
| | 1,075 |
|
| Class B common stock, $0.01 par value, 1,000 shares authorized (1,000 shares issued and outstanding) | — |
| | — |
| | — |
| | — |
|
| Class C common stock, $0.01 par value, 499,999,000 shares authorized (1 share issued and outstanding) | — |
| | — |
| | — |
| | — |
|
| Additional paid-in-capital | 379,789 |
| | — |
| | — |
| | 379,789 |
|
| Retained earnings | (35,247 | ) | | — |
| | — |
| | (35,247 | ) |
| Accumulated other comprehensive loss, net of tax | (8,879 | ) | | — |
| | — |
| | (8,879 | ) |
| Total stockholders' equity | 635,499 |
| | — |
| | — |
| | 635,499 |
|
| Total equity | 988,381 |
|
| 787,307 |
|
| (173,364 | ) |
| 1,602,324 |
|
| Total liabilities, non-controlling interests and equity | $ | 2,763,743 |
|
| $ | 8,421,736 |
|
| $ | (205,730 | ) |
| $ | 10,979,749 |
|
Ares Management Corporation
Notes to the Unaudited Condensed Consolidated Financial Statements (Continued)
(Dollars in Thousands, Except Share Data and As Otherwise Noted)
|
| | | | | | | | | | | | | | | |
| | As of December 31, 2018 |
| | Consolidated
Company
Entities | | Consolidated
Funds | | Eliminations | | Consolidated |
| Assets | | | |
| | |
| | |
|
| Cash and cash equivalents | $ | 110,247 |
| | $ | — |
| | $ | — |
| | $ | 110,247 |
|
| Investments (includes $841,079 of accrued carried interest) | 1,512,592 |
| | — |
| | (186,455 | ) | | 1,326,137 |
|
| Due from affiliates | 207,924 |
| | — |
| | (8,547 | ) | | 199,377 |
|
| Other assets | 377,651 |
| | — |
| | — |
| | 377,651 |
|
| Assets of Consolidated Funds | |
| | |
| | |
| |
|
|
| Cash and cash equivalents | — |
| | 384,644 |
| | — |
| | 384,644 |
|
| Investments, at fair value | — |
| | 7,673,165 |
| | — |
| | 7,673,165 |
|
| Due from affiliates | — |
| | 17,609 |
| | — |
| | 17,609 |
|
| Receivable for securities sold | — |
| | 42,076 |
| | — |
| | 42,076 |
|
| Other assets | — |
| | 23,786 |
| | — |
| | 23,786 |
|
| Total assets | $ | 2,208,414 |
|
| $ | 8,141,280 |
|
| $ | (195,002 | ) |
| $ | 10,154,692 |
|
| Liabilities | | | |
| | |
| | |
|
| Accounts payable, accrued expenses and other liabilities | $ | 83,221 |
| | $ | — |
| | $ | — |
| | $ | 83,221 |
|
| Accrued compensation | 29,389 |
| | — |
| | — |
| | 29,389 |
|
| Due to affiliates | 82,411 |
| | — |
| | — |
| | 82,411 |
|
| Performance related compensation payable | 641,737 |
| | — |
| | — |
| | 641,737 |
|
| Debt obligations | 480,952 |
| | — |
| | — |
| | 480,952 |
|
| Liabilities of Consolidated Funds | | | |
| | |
| |
|
|
| Accounts payable, accrued expenses and other liabilities | — |
| | 83,876 |
| | — |
| | 83,876 |
|
| Due to affiliates | — |
| | 8,547 |
| | (8,547 | ) | | — |
|
| Payable for securities purchased | — |
| | 471,390 |
| | — |
| | 471,390 |
|
| CLO loan obligations | — |
| | 6,706,286 |
| | (28,195 | ) | | 6,678,091 |
|
| Fund borrowings | — |
| | 209,284 |
| | — |
| | 209,284 |
|
| Total liabilities | 1,317,710 |
|
| 7,479,383 |
|
| (36,742 | ) |
| 8,760,351 |
|
| Commitments and contingencies |
|
| |
|
| |
|
| |
|
|
| Non-controlling interest in Consolidated Funds | — |
| | 661,897 |
| | (158,260 | ) | | 503,637 |
|
| Non-controlling interest in Ares Operating Group entities | 302,780 |
| | — |
| | — |
| | 302,780 |
|
| Stockholders' Equity | | | | | | | |
| Series A Preferred Stock, $0.01 par value, 1,000,000,000 shares authorized (12,400,000 units issued and outstanding) | 298,761 |
| | — |
| | — |
| | 298,761 |
|
| Class A common stock, $0.01 par value, 1,500,000,000 shares authorized (101,594,095 shares issued and outstanding) | 1,016 |
| | — |
| | — |
| | 1,016 |
|
| Class B common stock, $0.01 par value, 1,000 shares authorized (1,000 shares issued and outstanding) | — |
| | — |
| | — |
| | — |
|
| Class C common stock, $0.01 par value, 499,999,000 shares authorized (1 share issued and outstanding) | — |
| | — |
| | — |
| | — |
|
| Additional paid-in-capital | 326,007 |
| | — |
| | — |
| | 326,007 |
|
| Retained earnings | (29,336 | ) | | — |
| | — |
| | (29,336 | ) |
| Accumulated other comprehensive loss, net of taxes | (8,524 | ) | | — |
| | — |
| | (8,524 | ) |
| Total stockholders' equity | 587,924 |
| | — |
| | — |
| | 587,924 |
|
| Total equity | 890,704 |
| | 661,897 |
| | (158,260 | ) | | 1,394,341 |
|
| Total liabilities, non-controlling interests and equity | $ | 2,208,414 |
| | $ | 8,141,280 |
| | $ | (195,002 | ) | | $ | 10,154,692 |
|
| | | | | | | | | | | | | | | | | | | | | | | |
| | As of December 31, 2019 | | | | | | |
| | Consolidated
Company
Entities | | Consolidated
Funds | | Eliminations | | Consolidated |
| Assets | | | | | | | |
| Cash and cash equivalents | $ | 138,384 | | | $ | — | | | $ | — | | | $ | 138,384 | |
| Investments (includes $1,134,967 of accrued carried interest) | 1,845,520 | | | — | | | (181,856) | | | 1,663,664 | |
| Due from affiliates | 282,197 | | | — | | | (14,098) | | | 268,099 | |
| Other assets | 343,674 | | | — | | | (2,381) | | | 341,293 | |
| Right-of-use operating lease assets | 143,406 | | | — | | | — | | | 143,406 | |
| Assets of Consolidated Funds | | | | | | | |
| Cash and cash equivalents | — | | | 606,321 | | | — | | | 606,321 | |
| Investments, at fair value | — | | | 8,723,169 | | | 4,778 | | | 8,727,947 | |
| Due from affiliates | — | | | 6,192 | | | — | | 6,192 | |
| Receivable for securities sold | — | | | 88,809 | | | — | | 88,809 | |
| Other assets | — | | | 30,081 | | | — | | 30,081 | |
| Total assets | $ | 2,753,181 | | | $ | 9,454,572 | | | $ | (193,557) | | | $ | 12,014,196 | |
| Liabilities | | | | | | | |
| Accounts payable, accrued expenses and other liabilities | $ | 88,173 | | | $ | — | | | $ | — | | | $ | 88,173 | |
| Accrued compensation | 37,795 | | | — | | | — | | | 37,795 | |
| Due to affiliates | 71,445 | | | — | | | — | | | 71,445 | |
| Performance related compensation payable | 829,764 | | | — | | | — | | | 829,764 | |
| Debt obligations | 316,609 | | | — | | | — | | | 316,609 | |
| Operating lease liabilities | 168,817 | | | — | | | — | | | 168,817 | |
| Liabilities of Consolidated Funds | | | | | | | |
| Accounts payable, accrued expenses and other liabilities | — | | | 61,857 | | | — | | | 61,857 | |
| Due to affiliates | — | | | 11,700 | | | (11,700) | | | — | |
| Payable for securities purchased | — | | | 500,146 | | | — | | | 500,146 | |
| CLO loan obligations | — | | | 7,998,922 | | | (25,174) | | | 7,973,748 | |
| Fund borrowings | — | | | 107,244 | | | — | | | 107,244 | |
| Total liabilities | 1,512,603 | | | 8,679,869 | | | (36,874) | | | 10,155,598 | |
| Commitments and contingencies | | | | | | | |
| Non-controlling interest in Consolidated Funds | — | | | 774,703 | | | (156,683) | | | 618,020 | |
| Non-controlling interest in Ares Operating Group entities | 472,288 | | | — | | | — | | | 472,288 | |
| Stockholders' Equity | | | | | | | |
| Series A Preferred Stock, $0.01 par value, 1,000,000,000 shares authorized (12,400,000 shares issued and outstanding) | 298,761 | | | — | | | — | | | 298,761 | |
| Class A common stock, $0.01 par value, 1,500,000,000 shares authorized (115,242,028 shares issued and outstanding) | 1,152 | | | — | | | — | | | 1,152 | |
| Class B common stock, $0.01 par value, 1,000 shares authorized (1,000 shares issued and outstanding) | — | | | — | | | — | | | — | |
| Class C common stock, $0.01 par value, 499,999,000 shares authorized (1 share issued and outstanding) | — | | | — | | | — | | | — | |
| Additional paid-in-capital | 525,244 | | | — | | | — | | | 525,244 | |
| Retained earnings | (50,820) | | | — | | | — | | | (50,820) | |
| Accumulated other comprehensive loss, net of tax | (6,047) | | | — | | | — | | | (6,047) | |
| Total stockholders' equity | 768,290 | | | — | | | — | | | 768,290 | |
| Total equity | 1,240,578 | | | 774,703 | | | (156,683) | | | 1,858,598 | |
| Total liabilities, non-controlling interests and equity | $ | 2,753,181 | | | $ | 9,454,572 | | | $ | (193,557) | | | $ | 12,014,196 | |
Ares Management Corporation
Notes to the Unaudited Condensed Consolidated Financial Statements (Continued)
(Dollars in Thousands, Except Share Data and As Otherwise Noted)
| | | | | | | | | | | | | | | | | | | | | | | |
| | Three Months Ended June 30, 2020 | | | | | | |
| | Consolidated
Company
Entities | | Consolidated
Funds | | Eliminations | | Consolidated |
| Revenues | | | | | | | |
| Management fees (includes ARCC Part I Fees of $41,306) | $ | 278,247 | | | $ | — | | | $ | (11,380) | | | $ | 266,867 | |
| Carried interest allocation | 303,278 | | | — | | | — | | | 303,278 | |
| Incentive fees | 306 | | | — | | | 25 | | | 331 | |
| Principal investment income | 32,957 | | | — | | | (9,312) | | | 23,645 | |
| Administrative, transaction and other fees | 13,121 | | | — | | | (4,484) | | | 8,637 | |
| Total revenues | 627,909 | | | — | | | (25,151) | | | 602,758 | |
| Expenses | | | | | | | |
| Compensation and benefits | 185,131 | | | — | | | — | | | 185,131 | |
| Performance related compensation | 237,108 | | | — | | | — | | | 237,108 | |
| General, administrative and other expense | 58,084 | | | — | | | — | | | 58,084 | |
| Expenses of the Consolidated Funds | — | | | 14,601 | | | (11,357) | | | 3,244 | |
| Total expenses | 480,323 | | | 14,601 | | | (11,357) | | | 483,567 | |
| Other income (expense) | | | | | | | |
| Net realized and unrealized gains on investments | 8,032 | | | — | | | (7,742) | | | 290 | |
| Interest and dividend income | 3,898 | | | — | | | (1,920) | | | 1,978 | |
| Interest expense | (6,082) | | | — | | | — | | | (6,082) | |
| Other income, net | 2,475 | | | — | | | (294) | | | 2,181 | |
| Net realized and unrealized gains on investments of the Consolidated Funds | — | | | 71,497 | | | 12,025 | | | 83,522 | |
| Interest and other income of the Consolidated Funds | — | | | 116,314 | | | — | | | 116,314 | |
| Interest expense of the Consolidated Funds | — | | | (78,417) | | | 2,120 | | | (76,297) | |
| Total other income | 8,323 | | | 109,394 | | | 4,189 | | | 121,906 | |
| Income before taxes | 155,909 | | | 94,793 | | | (9,605) | | | 241,097 | |
| Income tax expense | 24,419 | | | 2 | | | — | | | 24,421 | |
| Net income | 131,490 | | | 94,791 | | | (9,605) | | | 216,676 | |
| Less: Net income attributable to non-controlling interests in Consolidated Funds | — | | | 94,791 | | | (9,605) | | | 85,186 | |
| Less: Net income attributable to non-controlling interests in Ares Operating Group entities | 75,119 | | | — | | | — | | | 75,119 | |
| Net income attributable to Ares Management Corporation | 56,371 | | | — | | | — | | | 56,371 | |
| Less: Series A Preferred Stock dividends paid | 5,425 | | | — | | | — | | | 5,425 | |
| Net income attributable to Ares Management Corporation Class A common stockholders | $ | 50,946 | | | $ | — | | | $ | — | | | $ | 50,946 | |
|
| | | | | | | | | | | | | | | |
| | For the Three Months Ended June 30, 2019 |
| | Consolidated
Company Entities | | Consolidated
Funds | | Eliminations | | Consolidated |
| Revenues | |
| | |
| | |
| | |
|
| Management fees (includes ARCC Part I Fees of $39,157) | $ | 246,581 |
| | $ | — |
| | $ | (8,735 | ) | | $ | 237,846 |
|
| Carried interest allocation | 119,712 |
| | — |
| | — |
| | 119,712 |
|
| Incentive fees | 14,970 |
| | — |
| | (4,750 | ) | | 10,220 |
|
| Principal investment income | 1,579 |
| | — |
| | 4,265 |
| | 5,844 |
|
| Administrative, transaction and other fees | 11,200 |
| | — |
| | — |
| | 11,200 |
|
| Total revenues | 394,042 |
|
| — |
|
| (9,220 | ) |
| 384,822 |
|
| Expenses | |
| | |
| | |
| | |
| Compensation and benefits | 162,170 |
| | — |
| | — |
| | 162,170 |
|
| Performance related compensation | 92,688 |
| | — |
| | — |
| | 92,688 |
|
| General, administrative and other expense | 65,416 |
| | — |
| | — |
| | 65,416 |
|
| Expenses of the Consolidated Funds | — |
| | 28,912 |
| | (13,485 | ) | | 15,427 |
|
| Total expenses | 320,274 |
|
| 28,912 |
|
| (13,485 | ) |
| 335,701 |
|
| Other income (expense) | |
| | |
| | |
| | |
| Net realized and unrealized gain on investments | 927 |
| | — |
| | (406 | ) | | 521 |
|
| Interest and dividend income | 2,324 |
| | — |
| | (672 | ) | | 1,652 |
|
| Interest expense | (5,793 | ) | | — |
| | — |
| | (5,793 | ) |
| Other income, net | 5,078 |
| | — |
| | (281 | ) | | 4,797 |
|
| Net realized and unrealized loss on investments of the Consolidated Funds | — |
| | (486 | ) | | 370 |
| | (116 | ) |
| Interest and other income of the Consolidated Funds | — |
| | 102,206 |
| | — |
| | 102,206 |
|
| Interest expense of the Consolidated Funds | — |
| | (68,712 | ) | | 707 |
| | (68,005 | ) |
| Total other income | 2,536 |
|
| 33,008 |
|
| (282 | ) |
| 35,262 |
|
| Income before taxes | 76,304 |
|
| 4,096 |
|
| 3,983 |
|
| 84,383 |
|
| Income tax expense (benefit) | 9,772 |
| | (267 | ) | | — |
| | 9,505 |
|
| Net income | 66,532 |
|
| 4,363 |
|
| 3,983 |
|
| 74,878 |
|
| Less: Net income attributable to non-controlling interests in Consolidated Funds | — |
| | 4,363 |
| | 3,983 |
| | 8,346 |
|
| Less: Net income attributable to non-controlling interests in Ares Operating Group entities | 34,393 |
| | — |
| | — |
| | 34,393 |
|
| Net income attributable to Ares Management Corporation | 32,139 |
|
| — |
|
| — |
|
| 32,139 |
|
| Less: Series A Preferred Stock dividends paid | 5,425 |
| | — |
| | — |
| | 5,425 |
|
| Net income attributable to Ares Management Corporation Class A common stockholders | $ | 26,714 |
|
| $ | — |
|
| $ | — |
|
| $ | 26,714 |
|
Ares Management Corporation
Notes to the Unaudited Condensed Consolidated Financial Statements (Continued)
(Dollars in Thousands, Except Share Data and As Otherwise Noted)
| | | | | | | | | | | | | | | | | | | | | | | |
| | Three Months Ended June 30, 2019 | | | | | | |
| | Consolidated
Company
Entities | | Consolidated
Funds | | Eliminations | | Consolidated |
| Revenues | | | | | | | |
| Management fees (includes ARCC Part I Fees of $39,157) | $ | 246,581 | | | $ | — | | | $ | (8,735) | | | $ | 237,846 | |
| Carried interest allocation | 119,712 | | | — | | | — | | | 119,712 | |
| Incentive fees | 14,970 | | | — | | | (4,750) | | | 10,220 | |
| Principal investment income | 1,579 | | | — | | | 4,265 | | | 5,844 | |
| Administrative, transaction and other fees | 11,200 | | | — | | | — | | | 11,200 | |
| Total revenues | 394,042 | | | — | | | (9,220) | | | 384,822 | |
| Expenses | | | | | | | |
| Compensation and benefits | 162,170 | | | — | | | — | | | 162,170 | |
| Performance related compensation | 92,688 | | | — | | | — | | | 92,688 | |
| General, administrative and other expense | 65,416 | | | — | | | — | | | 65,416 | |
| Expenses of the Consolidated Funds | — | | | 28,912 | | | (13,485) | | | 15,427 | |
| Total expenses | 320,274 | | | 28,912 | | | (13,485) | | | 335,701 | |
| Other income (expense) | | | | | | | |
| Net realized and unrealized gains on investments | 927 | | | — | | | (406) | | | 521 | |
| Interest and dividend income | 2,324 | | | — | | | (672) | | | 1,652 | |
| Interest expense | (5,793) | | | — | | | — | | | (5,793) | |
| Other income, net | 5,078 | | | — | | | (281) | | | 4,797 | |
| Net realized and unrealized losses on investments of the Consolidated Funds | — | | | (486) | | | 370 | | | (116) | |
| Interest and other income of the Consolidated Funds | — | | | 102,206 | | | — | | | 102,206 | |
| Interest expense of the Consolidated Funds | — | | | (68,712) | | | 707 | | | (68,005) | |
| Total other income | 2,536 | | | 33,008 | | | (282) | | | 35,262 | |
| Income before taxes | 76,304 | | | 4,096 | | | 3,983 | | | 84,383 | |
| Income tax expense (benefit) | 9,772 | | | (267) | | | — | | | 9,505 | |
| Net income | 66,532 | | | 4,363 | | | 3,983 | | | 74,878 | |
| Less: Net income attributable to non-controlling interests in Consolidated Funds | — | | | 4,363 | | | 3,983 | | | 8,346 | |
| Less: Net income attributable to non-controlling interests in Ares Operating Group entities | 34,393 | | | — | | | — | | | 34,393 | |
| Net income attributable to Ares Management Corporation | 32,139 | | | — | | | — | | | 32,139 | |
| Less: Series A Preferred Stock dividends paid | 5,425 | | | — | | | — | | | 5,425 | |
| Net income attributable to Ares Management Corporation Class A common stockholders | $ | 26,714 | | | $ | — | | | $ | — | | | $ | 26,714 | |
|
| | | | | | | | | | | | | | | |
| | For the Three Months Ended June 30, 2018 |
| | Consolidated
Company
Entities | | Consolidated
Funds | | Eliminations | | Consolidated |
| Revenues | |
| | |
| | |
| | |
|
| Management fees (includes ARCC Part I Fees of $29,866) | $ | 202,304 |
| | $ | — |
| | $ | (8,272 | ) | | $ | 194,032 |
|
| Carried interest allocation | (13,444 | ) | | | | — |
| | (13,444 | ) |
| Incentive fees | 11,740 |
| | | | (4,000 | ) | | 7,740 |
|
| Principal investment income | 14,722 |
| | — |
| | (12,851 | ) | | 1,871 |
|
| Administrative, transaction and other fees | 13,964 |
| | — |
| | — |
| | 13,964 |
|
| Total revenues | 229,286 |
|
| — |
|
| (25,123 | ) |
| 204,163 |
|
| Expenses | | | | | | | |
| Compensation and benefits | 138,992 |
| | — |
| | — |
| | 138,992 |
|
| Performance related compensation | (13,005 | ) | | — |
| | — |
| | (13,005 | ) |
| General, administrative and other expense | 59,918 |
| | — |
| | — |
| | 59,918 |
|
| Expenses of the Consolidated Funds | — |
| | 47,382 |
| | (12,270 | ) | | 35,112 |
|
| Total expenses | 185,905 |
|
| 47,382 |
|
| (12,270 | ) |
| 221,017 |
|
| Other income (expense) | | | | | | | |
| Net realized and unrealized loss on investments | 4,438 |
| | — |
| | (1,171 | ) | | 3,267 |
|
| Interest and dividend income | 2,356 |
| | — |
| | — |
| | 2,356 |
|
| Interest expense | (6,076 | ) | | — |
| | — |
| | (6,076 | ) |
| Other expense, net | (2,978 | ) | | — |
| | 991 |
| | (1,987 | ) |
| Net realized and unrealized gain on investments of the Consolidated Funds | — |
| | 33,819 |
| | 668 |
| | 34,487 |
|
| Interest and other income of the Consolidated Funds | — |
| | 92,633 |
| | — |
| | 92,633 |
|
| Interest expense of the Consolidated Funds | — |
| | (57,259 | ) | | 505 |
| | (56,754 | ) |
| Total other income (expense) | (2,260 | ) | | 69,193 |
| | 993 |
| | 67,926 |
|
| Income before taxes | 41,121 |
|
| 21,811 |
|
| (11,860 | ) |
| 51,072 |
|
| Income tax expense | 36,834 |
| | 69 |
| | — |
| | 36,903 |
|
| Net income | 4,287 |
| | 21,742 |
| | (11,860 | ) | | 14,169 |
|
| Less: Net income attributable to non-controlling interests in Consolidated Funds | — |
| | 21,742 |
| | (11,860 | ) | | 9,882 |
|
| Less: Net income attributable to non-controlling interests in Ares Operating Group entities | 16,062 |
| | — |
| | — |
| | 16,062 |
|
| Net loss attributable to Ares Management L.P. | (11,775 | ) |
| — |
|
| — |
|
| (11,775 | ) |
| Less: Preferred equity dividends paid | 5,425 |
| | — |
| | — |
| | 5,425 |
|
| Net loss attributable to Ares Management L.P. common shareholders | $ | (17,200 | ) |
| $ | — |
|
| $ | — |
|
| $ | (17,200 | ) |
Ares Management Corporation
Notes to the Unaudited Condensed Consolidated Financial Statements (Continued)
(Dollars in Thousands, Except Share Data and As Otherwise Noted)
| | | | | | | | | | | | | | | | | | | | | | | |
| | Six Months Ended June 30, 2020 | | | | | | |
| | Consolidated
Company
Entities | | Consolidated
Funds | | Eliminations | | Consolidated |
| Revenues | | | | | | | |
| Management fees (includes ARCC Part I Fees of $85,229) | $ | 552,598 | | | $ | — | | | $ | (21,882) | | | $ | 530,716 | |
| Carried interest allocation | 72,402 | | | — | | | — | | | 72,402 | |
| Incentive fees | (2,988) | | | — | | | 70 | | | (2,918) | |
| Principal investment income | (43,031) | | | — | | | 39,953 | | | (3,078) | |
| Administrative, transaction and other fees | 26,846 | | | — | | | (7,801) | | | 19,045 | |
| Total revenues | 605,827 | | | — | | | 10,340 | | | 616,167 | |
| Expenses | | | | | | | |
| Compensation and benefits | 365,215 | | | — | | | — | | | 365,215 | |
| Performance related compensation | 69,209 | | | — | | | — | | | 69,209 | |
| General, administrative and other expense | 120,415 | | | — | | | — | | | 120,415 | |
| Expenses of the Consolidated Funds | — | | | 32,500 | | | (21,813) | | | 10,687 | |
| Total expenses | 554,839 | | | 32,500 | | | (21,813) | | | 565,526 | |
| Other income (expense) | | | | | | | |
| Net realized and unrealized losses on investments | (27,663) | | | — | | | 19,919 | | | (7,744) | |
| Interest and dividend income | 6,500 | | | — | | | (2,732) | | | 3,768 | |
| Interest expense | (11,388) | | | — | | | — | | | (11,388) | |
| Other income, net | 7,437 | | | — | | | 208 | | | 7,645 | |
| Net realized and unrealized losses on investments of the Consolidated Funds | — | | | (158,676) | | | (12,563) | | | (171,239) | |
| Interest and other income of the Consolidated Funds | — | | | 229,539 | | | — | | | 229,539 | |
| Interest expense of the Consolidated Funds | — | | | (159,714) | | | 3,176 | | | (156,538) | |
| Total other expense | (25,114) | | | (88,851) | | | 8,008 | | | (105,957) | |
| Income (loss) before taxes | 25,874 | | | (121,351) | | | 40,161 | | | (55,316) | |
| Income tax expense | 3,775 | | | 30 | | | — | | | 3,805 | |
| Net income (loss) | 22,099 | | | (121,381) | | | 40,161 | | | (59,121) | |
| Less: Net loss attributable to non-controlling interests in Consolidated Funds | — | | | (121,381) | | | 40,161 | | | (81,220) | |
| Less: Net loss attributable to non-controlling interests in in Ares Operating Group entities | (3,236) | | | — | | | — | | | (3,236) | |
| Net income attributable to Ares Management Corporation | 25,335 | | | — | | | — | | | 25,335 | |
| Less: Series A Preferred Stock dividends paid | 10,850 | | | — | | | — | | | 10,850 | |
| Net income attributable to Ares Management Corporation Class A common stockholders | $ | 14,485 | | | $ | — | | | $ | — | | | $ | 14,485 | |
|
| | | | | | | | | | | | | | | |
| | For the Six Months Ended June 30, 2019 |
| | Consolidated
Company Entities | | Consolidated
Funds | | Eliminations | | Consolidated |
| Revenues | |
| | |
| | |
| | |
|
| Management fees (includes ARCC Part I Fees of $77,550) | $ | 479,653 |
| | $ | — |
| | $ | (17,148 | ) | | $ | 462,505 |
|
| Carried interest allocation | 317,005 |
| | — |
| | — |
| | 317,005 |
|
| Incentive fees | 32,219 |
| | — |
| | (5,184 | ) | | 27,035 |
|
| Principal investment income | 31,471 |
| | — |
| | 3,132 |
| | 34,603 |
|
| Administrative, transaction and other fees | 20,871 |
| | — |
| | — |
| | 20,871 |
|
| Total revenues | 881,219 |
| | — |
| | (19,200 | ) | | 862,019 |
|
| Expenses | |
| | |
| | |
| | |
| Compensation and benefits | 319,016 |
| | — |
| | — |
| | 319,016 |
|
| Performance related compensation | 249,208 |
| | — |
| | — |
| | 249,208 |
|
| General, administrative and other expense | 116,603 |
| | — |
| | — |
| | 116,603 |
|
| Expenses of the Consolidated Funds | — |
| | 42,313 |
| | (22,332 | ) | | 19,981 |
|
| Total expenses | 684,827 |
| | 42,313 |
| | (22,332 | ) | | 704,808 |
|
| Other income (expense) | |
| | |
| | |
| | |
| Net realized and unrealized gain on investments | 5,351 |
| | — |
| | (1,354 | ) | | 3,997 |
|
| Interest and dividend income | 4,648 |
| | — |
| | (1,152 | ) | | 3,496 |
|
| Interest expense | (11,382 | ) | | — |
| | — |
| | (11,382 | ) |
| Other income, net | 210 |
| | — |
| | 90 |
| | 300 |
|
| Net realized and unrealized gain on investments of the Consolidated Funds | — |
| | 3,262 |
| | 986 |
| | 4,248 |
|
| Interest and other income of the Consolidated Funds | — |
| | 195,390 |
| | — |
| | 195,390 |
|
| Interest expense of the Consolidated Funds | — |
| | (134,437 | ) | | 1,520 |
| | (132,917 | ) |
| Total other income (expense) | (1,173 | ) | | 64,215 |
| | 90 |
| | 63,132 |
|
| Income before taxes | 195,219 |
| | 21,902 |
| | 3,222 |
| | 220,343 |
|
| Income tax expense (benefit) | 24,735 |
| | (846 | ) | | — |
| | 23,889 |
|
| Net income | 170,484 |
| | 22,748 |
| | 3,222 |
| | 196,454 |
|
| Less: Net income attributable to non-controlling interests in Consolidated Funds | — |
| | 22,748 |
| | 3,222 |
| | 25,970 |
|
| Less: Net income attributable to non-controlling interests in Ares Operating Group entities | 93,396 |
| | — |
| | — |
| | 93,396 |
|
| Net income attributable to Ares Management Corporation | 77,088 |
| | — |
| | — |
| | 77,088 |
|
| Less: Series A Preferred Stock dividends paid | 10,850 |
| | — |
| | — |
| | 10,850 |
|
| Net income attributable to Ares Management Corporation Class A common stockholders | $ | 66,238 |
| | $ | — |
| | $ | — |
| | $ | 66,238 |
|
Ares Management Corporation
Notes to the Unaudited Condensed Consolidated Financial Statements (Continued)
(Dollars in Thousands, Except Share Data and As Otherwise Noted)
|
| | | | | | | | | | | | | | | |
| | For the Six Months Ended June 30, 2018 |
| | Consolidated
Company Entities | | Consolidated
Funds | | Eliminations | | Consolidated |
| Revenues | |
| | |
| | |
| | |
|
| Management fees (includes ARCC Part I Fees of $58,283) | $ | 399,130 |
| | $ | — |
| | $ | (15,583 | ) | | $ | 383,547 |
|
| Carried interest allocation | 40,685 |
| | — |
| | — |
| | 40,685 |
|
| Incentive fees | 16,811 |
| | — |
| | (4,000 | ) | | 12,811 |
|
| Principal investment income | 17,430 |
| | — |
| | (10,650 | ) | | 6,780 |
|
| Administrative, transaction and other fees | 26,429 |
| | — |
| | — |
| | 26,429 |
|
| Total revenues | 500,485 |
| | — |
| | (30,233 | ) | | 470,252 |
|
| Expenses | | | | | | | |
| Compensation and benefits | 273,631 |
| | — |
| | — |
| | 273,631 |
|
| Performance related compensation | 12,873 |
| | — |
| | — |
| | 12,873 |
|
| General, administrative and other expense | 104,368 |
| | — |
| | — |
| | 104,368 |
|
| Expenses of the Consolidated Funds | — |
| | 56,011 |
| | (19,583 | ) | | 36,428 |
|
| Total expenses | 390,872 |
| | 56,011 |
| | (19,583 | ) | | 427,300 |
|
| Other income (expense) | | | | | | | |
| Net realized and unrealized gain on investments | 3,260 |
| | — |
| | (832 | ) | | 2,428 |
|
| Interest and dividend income | 5,703 |
| | — |
| | — |
| | 5,703 |
|
| Interest expense | (12,945 | ) | | — |
| | — |
| | (12,945 | ) |
| Other expense, net | (2,831 | ) | | — |
| | 533 |
| | (2,298 | ) |
| Net realized and unrealized gain on investments of the Consolidated Funds | — |
| | 21,367 |
| | 35 |
| | 21,402 |
|
| Interest and other income of the Consolidated Funds | — |
| | 157,055 |
| | — |
| | 157,055 |
|
| Interest expense of the Consolidated Funds | — |
| | (101,977 | ) | | 798 |
| | (101,179 | ) |
| Total other income (expense) | (6,813 | ) | | 76,445 |
| | 534 |
| | 70,166 |
|
| Income before taxes | 102,800 |
| | 20,434 |
| | (10,116 | ) | | 113,118 |
|
| Income tax expense | 24,459 |
| | 69 |
| | — |
| | 24,528 |
|
| Net income | 78,341 |
| | 20,365 |
| | (10,116 | ) | | 88,590 |
|
| Less: Net income attributable to non-controlling interests in Consolidated Funds | — |
| | 20,365 |
| | (10,116 | ) | | 10,249 |
|
| Less: Net income attributable to non-controlling interests in Ares Operating Group entities | 49,168 |
| | — |
| | — |
| | 49,168 |
|
| Net income attributable to Ares Management L.P. | 29,173 |
| | — |
| | — |
| | 29,173 |
|
| Less: Preferred equity dividends paid | 10,850 |
| | — |
| | — |
| | 10,850 |
|
| Net income attributable to Ares Management L.P. common shareholders | $ | 18,323 |
| | $ | — |
| | $ | — |
| | $ | 18,323 |
|
| | | | | | | | | | | | | | | | | | | | | | | |
| | Six Months Ended June 30, 2019 | | | | | | |
| | Consolidated
Company
Entities | | Consolidated
Funds | | Eliminations | | Consolidated |
| Revenues | | | | | | | |
| Management fees (includes ARCC Part I Fees of $77,550) | $ | 479,653 | | | $ | — | | | $ | (17,148) | | | $ | 462,505 | |
| Carried interest allocation | 317,005 | | | — | | | — | | | 317,005 | |
| Incentive fees | 32,219 | | | — | | | (5,184) | | | 27,035 | |
| Principal investment income | 31,471 | | | — | | | 3,132 | | | 34,603 | |
| Administrative, transaction and other fees | 20,871 | | | — | | | — | | | 20,871 | |
| Total revenues | 881,219 | | | — | | | (19,200) | | | 862,019 | |
| Expenses | | | | | | | |
| Compensation and benefits | 319,016 | | | — | | | — | | | 319,016 | |
| Performance related compensation | 249,208 | | | — | | | — | | | 249,208 | |
| General, administrative and other expense | 116,603 | | | — | | | — | | | 116,603 | |
| Expenses of the Consolidated Funds | — | | | 42,313 | | | (22,332) | | | 19,981 | |
| Total expenses | 684,827 | | | 42,313 | | | (22,332) | | | 704,808 | |
| Other income (expense) | | | | | | | |
| Net realized and unrealized gains on investments | 5,351 | | | — | | | (1,354) | | | 3,997 | |
| Interest and dividend income | 4,648 | | | — | | | (1,152) | | | 3,496 | |
| Interest expense | (11,382) | | | — | | | — | | | (11,382) | |
| Other income, net | 210 | | | — | | | 90 | | | 300 | |
| Net realized and unrealized gains on investments of the Consolidated Funds | — | | | 3,262 | | | 986 | | | 4,248 | |
| Interest and other income of the Consolidated Funds | — | | | 195,390 | | | — | | | 195,390 | |
| Interest expense of the Consolidated Funds | — | | | (134,437) | | | 1,520 | | | (132,917) | |
| Total other income (expense) | (1,173) | | | 64,215 | | | 90 | | | 63,132 | |
| Income before taxes | 195,219 | | | 21,902 | | | 3,222 | | | 220,343 | |
| Income tax (benefit) expense | 24,735 | | | (846) | | | — | | | 23,889 | |
| Net income | 170,484 | | | 22,748 | | | 3,222 | | | 196,454 | |
| Less: Net income attributable to non-controlling interests in Consolidated Funds | — | | | 22,748 | | | 3,222 | | | 25,970 | |
| Less: Net income attributable to non-controlling interests in Ares Operating Group entities | 93,396 | | | — | | | — | | | 93,396 | |
| Net income attributable to Ares Management Corporation | 77,088 | | | — | | | — | | | 77,088 | |
| Less: Series A Preferred Stock dividends paid | 10,850 | | | — | | | — | | | 10,850 | |
| Net income attributable to Ares Management Corporation Class A common stockholders | $ | 66,238 | | | $ | — | | | $ | — | | | $ | 66,238 | |
Ares Management Corporation
Notes to the Unaudited Condensed Consolidated Financial Statements (Continued)
(Dollars in Thousands, Except Share Data and As Otherwise Noted)
| | | | | | | | | | | | | | | | | | | | | | | |
| | Six Months Ended June 30, 2020 | | | | | | |
| | Consolidated
Company
Entities | | Consolidated
Funds | | Eliminations | | Consolidated |
| Cash flows from operating activities: | | | | | | | |
| Net income (loss) | $ | 22,099 | | | $ | (121,381) | | | $ | 40,161 | | | $ | (59,121) | |
| Adjustments to reconcile net income to net cash used in operating activities | 197,873 | | | | | (69,037) | | | 128,836 | |
| | | | | | | |
| | | | | | | |
| | | | | | | |
| | | | | | | |
| | | | | | | |
| | | | | | | |
| | | | | | | |
| Adjustments to reconcile net loss to net cash used in operating activities allocable to non-controlling interests in Consolidated Funds | | | (510,528) | | | 13,655 | | | (496,873) | |
| | | | | | | |
| | | | | | | |
| | | | | | | |
| | | | | | | |
| | | | | | | |
| Cash flows due to changes in operating assets and liabilities | 111,099 | | | | | 3,875 | | | 114,974 | |
| | | | | | | |
| | | | | | | |
| | | | | | | |
| | | | | | | |
| | | | | | | |
| Cash flows due to changes in operating assets and liabilities allocable to non-controlling interest in Consolidated Funds: | | | (190,501) | | | 351,846 | | | 161,345 | |
| | | | | | | |
| | | | | | | |
| | | | | | | |
| | | | | | | |
| Net cash provided by (used in) operating activities | 331,071 | | | (822,410) | | | 340,500 | | | (150,839) | |
| Cash flows from investing activities: | | | | | | | |
| Purchase of furniture, equipment and leasehold improvements, net | (8,080) | | | — | | | — | | | (8,080) | |
| Acquisitions | (35,844) | | | — | | | — | | | (35,844) | |
| Net cash used in investing activities | (43,924) | | | — | | | — | | | (43,924) | |
| Cash flows from financing activities: | | | | | | | |
| Net proceeds from issuance of Class A common stock | 383,154 | | | — | | | — | | | 383,154 | |
| Proceeds from credit facility | 790,000 | | | — | | | — | | | 790,000 | |
| Proceeds from senior notes | 399,084 | | | — | | | — | | | 399,084 | |
| Repayments of credit facility | (860,000) | | | — | | | — | | | (860,000) | |
| | | | | | | |
| Dividends and distributions | (224,407) | | | — | | | — | | | (224,407) | |
| Series A Preferred Stock dividends | (10,850) | | | — | | | — | | | (10,850) | |
| | | | | | | |
| | | | | | | |
| Stock option exercises | 67,441 | | | — | | | — | | | 67,441 | |
| | | | | | | |
| Taxes paid related to net share settlement of equity awards | (74,335) | | | — | | | — | | | (74,335) | |
| | | | | | | |
| Other financing activities | (1,889) | | | — | | | — | | | (1,889) | |
| Allocable to non-controlling interests in Consolidated Funds: | | | | | | | |
| Contributions from non-controlling interests in Consolidated Funds | — | | | 138,700 | | | (15,005) | | | 123,695 | |
| Distributions to non-controlling interests in Consolidated Funds | — | | | (172,755) | | | 22,426 | | | (150,329) | |
| Borrowings under loan obligations by Consolidated Funds | — | | | 608,355 | | | — | | | 608,355 | |
| Repayments under loan obligations by Consolidated Funds | — | | | (87,689) | | | — | | | (87,689) | |
| Net cash provided by financing activities | 468,198 | | | 486,611 | | | 7,421 | | | 962,230 | |
| Effect of exchange rate changes | (3,689) | | | (12,122) | | | — | | | (15,811) | |
| Net change in cash and cash equivalents | 751,656 | | | (347,921) | | | 347,921 | | | 751,656 | |
| Cash and cash equivalents, beginning of period | 138,384 | | | 606,321 | | | (606,321) | | | 138,384 | |
| Cash and cash equivalents, end of period | $ | 890,040 | | | $ | 258,400 | | | $ | (258,400) | | | $ | 890,040 | |
| | | | | | | |
| | | | | | | |
| | | | | | | |
| | | | | | | |
| | | | | | | |
| | | | | | | |
| | | | | | | |
| | | | | | | |
| | | | | | | |
Ares Management Corporation
Notes to the Unaudited Condensed Consolidated Financial Statements (Continued)
(Dollars in Thousands, Except Share Data and As Otherwise Noted)
| | | | | | | | | | | | | | | | | | | | | | | |
| | Six Months Ended June 30, 2019 | | | | | | |
| | Consolidated
Company
Entities | | Consolidated
Funds | | Eliminations | | Consolidated |
| Cash flows from operating activities: | | | | | | | |
| Net income | $ | 170,484 | | | $ | 22,748 | | | $ | 3,222 | | | $ | 196,454 | |
| Adjustments to reconcile net income to net cash used in operating activities | 37,274 | | | — | | | 10,840 | | | 48,114 | |
| | | | | | | |
| | | | | | | |
| | | | | | | |
| | | | | | | |
| | | | | | | |
| | | | | | | |
| | | | | | | |
| Adjustments to reconcile net income to net cash used in operating activities allocable to non-controlling interests in Consolidated Funds | — | | | (1,444,622) | | | 84,516 | | | (1,360,106) | |
| | | | | | | |
| | | | | | | |
| | | | | | | |
| | | | | | | |
| | | | | | | |
| Cash flows due to changes in operating assets and liabilities | (12,712) | | | — | | | (112) | | | (12,824) | |
| | | | | | | |
| | | | | | | |
| | | | | | | |
| | | | | | | |
| | | | | | | |
| Cash flows due to changes in operating assets and liabilities allocable to non-controlling interest in Consolidated Funds: | — | | | (171,377) | | | 8,427 | | | (162,950) | |
| | | | | | | |
| | | | | | | |
| | | | | | | |
| | | | | | | |
| Net cash provided by (used in) operating activities | 195,046 | | | (1,593,251) | | | 106,893 | | | (1,291,312) | |
| Cash flows from investing activities: | | | | | | | |
| Purchase of furniture, equipment and leasehold improvements, net | (5,653) | | | — | | | — | | | (5,653) | |
| | | | | | | |
| Net cash used in investing activities | (5,653) | | | — | | | — | | | (5,653) | |
| Cash flows from financing activities: | | | | | | | |
| | | | | | | |
| Proceeds from credit facility | 235,000 | | | — | | | — | | | 235,000 | |
| | | | | | | |
| Repayments of credit facility | (150,000) | | | — | | | — | | | (150,000) | |
| Dividends and distributions | (152,364) | | | — | | | — | | | (152,364) | |
| Series A Preferred Stock dividends | (10,850) | | | — | | | — | | | (10,850) | |
| Repurchases of Class A common stock | (10,449) | | | — | | | — | | | (10,449) | |
| Stock option exercises | 78,794 | | | — | | | — | | | 78,794 | |
| Taxes paid related to net share settlement of equity awards | (31,424) | | | — | | | — | | | (31,424) | |
| Other financing activities | (3,258) | | | — | | | — | | | (3,258) | |
| Allocable to non-controlling interests in Consolidated Funds: | | | | | | | |
| Contributions from non-controlling interests in Consolidated Funds | — | | | 223,520 | | | (108,021) | | | 115,499 | |
| Distributions to non-controlling interests in Consolidated Funds | — | | | (35,149) | | | 4,194 | | | (30,955) | |
| Borrowings under loan obligations by Consolidated Funds | — | | | 1,938,858 | | | (4,771) | | | 1,934,087 | |
| Repayments under loan obligations by Consolidated Funds | — | | | (538,976) | | | 10,021 | | | (528,955) | |
| Net cash provided by (used in) financing activities | (44,551) | | | 1,588,253 | | | (98,577) | | | 1,445,125 | |
| Effect of exchange rate changes | (7,869) | | | (3,318) | | | — | | | (11,187) | |
| Net change in cash and cash equivalents | 136,973 | | | (8,316) | | | 8,316 | | | 136,973 | |
| Cash and cash equivalents, beginning of period | 110,247 | | | 384,644 | | | (384,644) | | | 110,247 | |
| Cash and cash equivalents, end of period | $ | 247,220 | | | $ | 376,328 | | | $ | (376,328) | | | $ | 247,220 | |
| | | | | | | |
| | | | | | | |
| | | | | | | |
| | | | | | | |
| | | | | | | |
| | | | | | | |
| | | | | | | |
Ares Management Corporation
Notes to the Unaudited Condensed Consolidated Financial Statements (Continued)
(Dollars in Thousands, Except Share Data and As Otherwise Noted)
16. SUBSEQUENT EVENTS
The Company evaluated all events or transactions that occurred after June 30, 20192020 through the date the condensed consolidated financial statements were issued. During this period, the Company had the following material subsequent events that require disclosure:
In July 2019,2020, the Company's board of directors declared a quarterly dividend of $0.32$0.40 per share of Class A common stock payable on September 30, 20192020 to common stockholders of record at the close of business on September 16, 2019.2020.
In July 2019,2020, the Company's board of directors declared a quarterly dividend of $0.4375 per share of Series A Preferred Stock payable on September 30, 20192020 to preferred stockholders of record at the close of business on September 15, 2019. As September 15, 2019 falls on a Sunday, the effective record date for the dividend will be Friday, September 13, 2019.2020.
Item 2. Management’s Discussion Andand Analysis oOff Financial Condition Andand Results Ofof Operations
Ares Management Corporation is a Delaware corporation, which was formerly a limited partnership formed on November 15, 2013 and which converted to a Delaware corporation effective on November 26, 2018.corporation. Unless the context otherwise requires, references to “Ares,” “we,” “us,” “our,” and “the Company”the “Company” are intended to mean the business and operations of Ares Management Corporation and its consolidated subsidiaries. The following discussion analyzes the financial condition and results of operations of the Company. “Consolidated Funds” refers collectively to certain Ares‑affiliatedAres-affiliated funds, related co‑ investmentco-investment entities and certain CLOs that are required under generally accepted accounting principles in the United States (“GAAP”) to be consolidated in our condensed consolidated financial statements included in this Quarterly Report on Form 10‑Q.10-Q. Additional terms used by the Company are defined in the Glossary and throughout the Management's Discussion and Analysis in this Quarterly Report on Form 10-Q.
The following discussion and analysis should be read in conjunction with the unaudited condensed consolidated financial statements and the related notes included in this Quarterly Report on Form 10‑Q10-Q and the audited consolidated financial statements and the related notes included in the 20182019 Annual Report on Form 10-K of Ares Management Corporation.Corporation and the related notes.
Amounts and percentages presented throughout our discussion and analysis of financial condition and results of operations may reflect rounded results in thousands (unless otherwise indicated) and consequently, totals may not appear to sum.
Our Business
We are a leading global alternative investment manager that operates integrated businesses, which are our reportable segments. Our reportable segments are Credit Group, Private Equity Group and Real Estate Group. For a detailed description of our reportable segments, see Note 14, “Segment Reporting,” to our unaudited condensed consolidated financial statements included in this Quarterly Report on Form 10-Q. During the six months ended June 30, 2019, we reclassified certain expenses from OMG to our operating segments. Historical results Certain prior period amounts have been modifiedreclassified to conform to the current periodyear presentation.
The focus of our business model is to provide our investment management capabilities through various funds and products that meet the needs of a wide range of institutional and retail investors. Our revenues primarily consist of management fees, carried interest allocation, incentive fees, as well as principal investment income, administrative expense reimbursements and transaction fees. Management fees are generally based on a defined percentage of average fair value of assets, total commitments, invested capital, net asset value, net investment income or par value of the investment portfolios we manage. Carried interest allocation and incentive fees are based on certain specific hurdle rates as defined in the funds' applicable investment management or partnership agreements. Carried interest allocation and incentive fees are collectively referred to as performance income in our segment results and non-GAAP measures. Principal investment income consists of interest and dividend income and net realized and unrealized gain (loss) from the equity method investments that we manage. Other income (expense) typically represents investment income, realized gains (losses) and unrealized appreciation (depreciation) resulting from our other investments as well as investments of the Consolidated Funds. Interest expense is a component of other income (expense). We provide administrative services to certain of our affiliated funds that are presented within administrative, transaction and other fees for GAAP reporting but are netted against the respective expenses for segment reporting purposes. We also receive transaction fees from certain funds for activities related to fund transactions, such as loan originations. In accordance with GAAP, we are required to consolidate funds where we have a significant economic interest and substantive control rights. However, for segment reporting purposes, we present revenues, expenses and realized net investment income (loss) on a combined basis, which reflects the results of our reportable segments without giving effect to the consolidation of the funds. Accordingly, our segment revenues consist of management fees, other fees and realized performance income. Our segment expenses consist of compensation and benefits, general, administrative and other expenses and realized performance income compensation, net of administrative fees. Our segment realized net investment income (loss) consist of realized net investment income, interest and other realized investment income and interest expense.
Trends Affecting Our Business
We believe that our disciplined investment philosophy across our three distinct but complementary investment groups contributes to the stability of our performance throughout market cycles. As of June 30, 2019,2020, approximately 72%68% of our assets under managementAUM were in funds with a remaining contractual life of three years or more, approximately 74%73% of our AUM were in funds with an initial duration greater than seven years at time of closing and 89%88% of our management fees arewere derived from permanent capital vehicles, CLOs and closed end funds. Our funds have a stable base of committed capital enabling us to invest in assets with a long-term focus over different points in a market cycle and to take advantage of market volatility. However, our results of operations, including the fair value of our AUM, are affected by a variety of factors, particularly in the United States and Western Europe, including conditions in the global financial markets and the economic and political environments.
U.S. credit2020 has been a challenging year for markets experienced positive performancearound the world due to the ongoing impact of the COVID-19 pandemic. Following a historic decline in March, the global capital markets rallied during the second quarter as investor sentiment was encouraged by global central bank support and the gradual re-opening of economies, among other things. In the U.S., corporate credit spreads tightened due to a combination of robust inflows, economic data showing signs of stabilization and the Federal Reserve policy and stable credit conditions largely offset volatility from global trade tensions and increasing uncertainty surrounding future economic growth. The expectations of a potential rate cut contributed to higher leveraged loan and high yieldReserve’s secondary market corporate bond prices. The CSLLI,purchasing support programs. Specifically, the Credit Suisse Leveraged Loan Index ("CSLLI"), a leveraged loan index, returned 1.6%9.7% in the second quarter of 20192020, while the ICE BAML High Yield Master II Index, a high yield bond index, returned 2.6% in9.6%. Despite the secondstrong market recovery for the quarter, of 2019.the leveraged loan and high yield bond markets remained down for the year-to-date period with both returning a negative 4.8%.
European credit markets experienced similar performance behind accommodative statements fromresults, as European high yield and leveraged loan markets recovered alongside the broader global financial markets. Spreads tightened and retraced a significant portion of the widening seen during March. Performance was driven by, among other things, growing investor confidence in a market revival after the European Central BankBank’s announcement of the expansion of its asset-buying program, which increased bond purchases and strong European corporate earnings.extended the purchase horizon. The Credit Suisse Western European Leveraged Loan Index returned 1.1% during the second quarter of 201911.9%, while the ICE BAML European Currency High Yield Index returned 2.4%.11.2% for the second quarter of 2020. Similar to the U.S. credit markets, the European leveraged loan and high yield bond markets remained down for the year-to-date period and returned a negative 3.8% and 5.0%, respectively.
Similar to the credit markets, the equity markets remained down for the year-to-date period despite the recovery during the quarter. In the U.S., the S&P 500 Index continued its strong rally to start the year with the index growing 4.3% in the second quarter of 2019 bringing year to date appreciation to 18.5%. Outsidereturned 20.5% and outside the U.S., the global equity markets saw broad based appreciation as well with the MSCI All Country World ex USA Index increasing 3.0%returned 15.3% for the second quarter. For the year-to-date period, the U.S. and international equity markets returned a negative 3.1% and 11.5%, respectively.
Corporate performance and earnings across many industries continue to be impacted by COVID-19. Despite significant lingering health concerns, certain companies are rebounding more quickly than expected; however, performance and earnings are still well below pre-pandemic levels. As opposed to the broad based sell-off in the first quarter, distressed activity in the second quarter of 2019 bringing year to date appreciation of 13.6%. The intermediatedwas more industry and/or company specific. At the same time, transaction activity in the traditional private equity auctionbuyout market remains highly competitiveis beginning to resume. Furthermore, access to the capital markets is selectively re-opening for high quality businesses and leveraged buy out purchase price multiples remained near historical highs duringthe market for initial public offerings showed signs of strength in the second quarter of 2019. Amidst a significant expansion in the sizehalf of the corporate debt market, leverage levels continue to increasesecond quarter.
While economies are gradually re-opening across Europe and are even higher when EBITDA-adjustments are taken into account. These dynamicsthe U.S., real estate fundamentals remain depressed following the widespread lockdowns. Certain indications of asset-level distress have led toappeared including a significant compressionrise in private equity risk premiums. We continue to believe careful company selection, a focus on high-quality assetscommercial mortgage backed securities delinquencies primarily driven by retail and a differentiated view to drive value creation is of paramount importance inhotel properties. At the current market environment.same time, rent collection rates for industrial, office, and residential properties, bolstered by government stimulus plans, have exceeded expectations.
European and U.S. publicly-traded real estate fundamentals and pricing appear to have held steady or improvedinvestment trusts (“REITs”) rose over the second quarter of 2019. Whilewith the global macroeconomic backdrop is clouded by trade tensions among other geopolitical volatilities,FTSE EPRA/NAREIT Developed Europe Index and the FTSE NAREIT All Equity REITs Index returning 5.4% and 12.2%, respectively. For the year-to-date period, the European and U.S. property performance have been bolstered by consumer spending, low unemployment ratesREITs returned a negative 22.7% and accommodative central bank policies. Leverage continued to be accretive to property values and the availability of investment capital maintained transaction volumes. Across our targeted markets in both the U.S. and Europe, we continue to find opportunities to capitalize on our deep understanding of local market and overall industry dynamics to acquire and lend on commercial real estate.14.9%, respectively.
Notwithstanding the potential opportunities represented by market volatility, future earnings, cash flows, dividend payments and distributions are affected by a range of factors, including realizations of our funds’ investments, which are subject to significant fluctuations from period to period.
Recent Transactions
On July 9, 2019, we expanded our existing insurance platform,1, 2020, Ares Insurance Solutions, through the launchcompleted an acquisition of Aspida Financial (“Aspida”). Aspida entered into an agreement to acquire a Michigan-domiciled insurance company and its insurance operations for approximately $75 million in cash. The transaction is expected to close prior to the end of 2019, subject to regulatory approval and other closing conditions.
Consolidation and Deconsolidation of Ares Funds
Consolidated funds represented approximately 6.4% of our AUM as of June 30, 2019, 3.6% of our management fees and 1.5% of our performance income for the six months ended June 30, 2019. As of June 30, 2019, we consolidated 14 CLOs and eight private funds, and as of June 30, 2018, we consolidated 12 CLOs and nine private funds.
Our CLOs serve as long-term, non-recourse financing for debt investments and as a way to minimize refinancing and maturity risk and secure a fixed cost of funds over an underlying market interest rate. As of June 30, 2019, our maximum exposure of loss for CLO securities was $100.8 million.
The consolidation of these funds significantly impacted interest and other income of Consolidated Funds, interest expense of Consolidated Funds, net realized and unrealized gain (loss) on investments of Consolidated Funds and non-controlling interests in Consolidated Funds, among others, for the three and six months ended June 30, 2019 and 2018. Also, the consolidation of these funds typically has the impact of decreasing management fees, carried interest allocation and incentive fees reported under GAAP to the extent these are eliminated upon consolidation. For the actual impact that consolidation had on our results, see the Consolidating Schedules within Note 15, “Consolidation”, to our condensed consolidated financial statements included herein.
The assets and liabilities of our Consolidated Funds are held within separate legal entities and, as a result, the liabilities of our Consolidated Funds are typically non-recourse to us. Generally, the consolidation of our Consolidated Funds has a significant gross-up effect on our assets, liabilities and cash flows but has no net effect on the net income attributable to us. The net economic ownership interests of our Consolidated Funds, to which we have no economic rights, are reflected as non-controlling interests in the Consolidated Funds in our condensed consolidated financial statements.
We generally deconsolidate funds and CLOs when we are no longer deemed to have a controlling interest in SSG Capital Holdings Limited and its operating subsidiaries ("SSG") totaling $6.9 billion of AUM. The transaction consideration was primarily comprised of shares of Ares Class A common stock subject to a multi-year lock-up along with a cash component. In certain circumstances, Ares may acquire up to 100% ownership of SSG pursuant to a contractual arrangement that may be initiated by Ares or the entity. During the six months ended June 30, 2019, two entities were liquidated/dissolved and two entities experienced a significant change in ownership that resulted in deconsolidationminority equity holders of the fund and CLO during the period. During the six months ended June 30, 2018, one entity was liquidated/dissolved and no non-VIEs experienced a significant change in ownership or control that resulted in deconsolidation during the period.SSG.
The performance of our Consolidated Funds is not necessarily consistent with, or representative of, the combined performance trends of all of our funds.
Managing Business Performance
Non‑GAAPNon-GAAP Financial Measures
We use the following non-GAAP measures to assess and track our performance:
•Fee Related Earnings (FRE)("FRE")
•Realized Income (RI)("RI")
These non‑GAAPnon-GAAP financial measures supplement and should be considered in addition to and not in lieu of, the results of operations, which are discussed further under “—Components of Consolidated Results of Operations” and are prepared in accordance with GAAP. For the specific components and calculations of these non-GAAP measures, as well as a reconciliation of these measures to the most comparable measure in accordance with GAAP, see Note 14, “Segment"Note 14. Segment Reporting,” to our unaudited condensed consolidated financial statements included in this Quarterly Report on Form 10‑Q.10-Q.
Operating Metrics
We monitor certain operating metrics that are common to the alternative asset management industry, which are discussed below.
Assets Under Management
Assets under management (“AUM”)AUM refers to the assets we manage. We view AUMmanage and is viewed as a metric to measure our investment and fundraising performance as it reflects assets generally at fair value plus available uncalled capital. For our funds other than CLOs, our AUM equals the sum
net asset value (“NAV”) of such funds;
the drawn and undrawn debt (at the fund‑level including amounts subject to restrictions); and
uncalled committed capital (including commitments to funds that have yet to commence their investment periods).
NAV refers to the fair value of all of the assets of a fund less the liabilities of the fund.
For CLOs, our AUM is equal to initial principal amounts of notes adjusted for paydowns.
The tables below providepresent rollforwards of our total AUM by segment for the three months ended June 30, 2019 and 2018 (in($ in millions):
| | | | | | | | | | | | | | | | | | | | | | | | | | |
| | | Credit Group | | Private Equity Group | | Real Estate Group | | Total AUM |
| Balance at 3/31/2020 | | $ | 112,512 | | | $ | 22,015 | | | $ | 14,112 | | | $ | 148,639 | |
| | | | | | | | |
| Net new par/equity commitments | | 2,108 | | | 4,753 | | | 404 | | | 7,265 | |
| Net new debt commitments | | 1,784 | | | — | | | 38 | | | 1,822 | |
| Capital reductions | | (97) | | | (90) | | | (36) | | | (223) | |
| Distributions | | (706) | | | (388) | | | (190) | | | (1,284) | |
| Redemptions | | (825) | | | — | | | — | | | (825) | |
| Change in fund value | | 2,637 | | | 312 | | | 67 | | | 3,016 | |
| Balance at 6/30/2020 | | $ | 117,413 | | | $ | 26,602 | | | $ | 14,395 | | | $ | 158,410 | |
Average AUM(1) | | $ | 114,964 | | | $ | 24,309 | | | $ | 14,255 | | | $ | 153,528 | |
| | | | | | | | |
| | Credit Group | | Private Equity Group | | Real Estate Group | | Total AUM |
| Balance at 3/31/2019 | | $ | 101,076 | | | $ | 23,778 | | | $ | 11,810 | | | $ | 136,664 | |
| Net new par/equity commitments | | 2,350 | | | 997 | | | 455 | | | 3,802 | |
| Net new debt commitments | | 3,341 | | | — | | | 111 | | | 3,452 | |
| Capital reductions | | (783) | | | (2) | | | (89) | | | (874) | |
| Distributions | | (561) | | | (557) | | | (561) | | | (1,679) | |
| Redemptions | | (1,032) | | | — | | | — | | | (1,032) | |
| Change in fund value | | 1,114 | | | 519 | | | 142 | | | 1,775 | |
| Balance at 6/30/2019 | | $ | 105,505 | | | $ | 24,735 | | | $ | 11,868 | | | $ | 142,108 | |
Average AUM(1) | | $ | 103,292 | | | $ | 24,257 | | | $ | 11,840 | | | $ | 139,389 | |
| | | | | | | | |
| (1) Represents a two-point average of quarter-end balances for each period. | | | | | | | | |
| | | | | | | | |
| | Credit Group | | Private Equity Group | | Real Estate Group | | Total AUM |
| Balance at 12/31/2019 | | $ | 110,543 | | | $ | 25,166 | | | $ | 13,207 | | | $ | 148,916 | |
| Acquisitions | | 2,693 | | | — | | | — | | | 2,693 | |
| Net new par/equity commitments | | 4,145 | | | 5,117 | | | 1,966 | | | 11,228 | |
| Net new debt commitments | | 4,003 | | | — | | | 263 | | | 4,266 | |
| Capital reductions | | (144) | | | (115) | | | (36) | | | (295) | |
| Distributions | | (1,338) | | | (2,226) | | | (833) | | | (4,397) | |
| Redemptions | | (1,289) | | | — | | | — | | | (1,289) | |
| Change in fund value | | (1,200) | | | (1,340) | | | (172) | | | (2,712) | |
| Balance at 6/30/2020 | | $ | 117,413 | | | $ | 26,602 | | | $ | 14,395 | | | $ | 158,410 | |
Average AUM(1) | | $ | 113,488 | | | $ | 24,595 | | | $ | 13,904 | | | $ | 151,987 | |
| | | | | | | | |
| | Credit Group | | Private Equity Group | | Real Estate Group | | Total AUM |
| Balance at 12/31/2018 | | $ | 95,836 | | | $ | 23,487 | | | $ | 11,340 | | | $ | 130,663 | |
| Net new par/equity commitments | | 4,915 | | | 1,028 | | | 617 | | | 6,560 | |
| Net new debt commitments | | 6,307 | | | — | | | 584 | | | 6,891 | |
| Capital reductions | | (887) | | | (5) | | | (89) | | | (981) | |
| Distributions | | (1,088) | | | (1,194) | | | (900) | | | (3,182) | |
| Redemptions | | (1,749) | | | — | | | — | | | (1,749) | |
| Change in fund value | | 2,171 | | | 1,419 | | | 316 | | | 3,906 | |
| Balance at 6/30/2019 | | $ | 105,505 | | | $ | 24,735 | | | $ | 11,868 | | | $ | 142,108 | |
Average AUM(1) | | $ | 100,805 | | | $ | 24,000 | | | $ | 11,673 | | | $ | 136,478 | |
| | | | | | | | |
| (1) Represents a three-point average of quarter-end balances for each period. | | | | | | | | |
| | | | | | | | |
|
| | | | | | | | | | | | | | | |
| | Credit Group | | Private Equity Group | | Real Estate Group | | Total AUM |
| Balance at 3/31/2019 | $ | 101,076 |
| | $ | 23,778 |
| | $ | 11,810 |
| | $ | 136,664 |
|
| Net new par/equity commitments | 2,350 |
| | 997 |
| | 455 |
| | 3,802 |
|
| Net change in debt commitments | 3,341 |
| | — |
| | 111 |
| | 3,452 |
|
| Distributions | (2,376 | ) | | (559 | ) | | (650 | ) | | (3,585 | ) |
| Change in fund value | 1,114 |
| | 519 |
| | 142 |
| | 1,775 |
|
| Balance at 6/30/2019 | $ | 105,505 |
| | $ | 24,735 |
| | $ | 11,868 |
| | $ | 142,108 |
|
| Average AUM(1) | $ | 103,292 |
| | $ | 24,257 |
| | $ | 11,840 |
| | $ | 139,389 |
|
|
| | | | | | | | | | | | | | | |
| | Credit Group | | Private Equity Group | | Real Estate Group | | Total AUM |
| Balance at 3/31/2018 | $ | 77,310 |
| | $ | 24,303 |
| | $ | 10,896 |
| | $ | 112,509 |
|
| Net new par/equity commitments | 9,359 |
| | 350 |
| | 307 |
| | 10,016 |
|
| Net change in debt commitments | 1,990 |
| | — |
| | — |
| | 1,990 |
|
| Distributions | (1,800 | ) | | (1,039 | ) | | (240 | ) | | (3,079 | ) |
| Change in fund value | (1 | ) | | (12 | ) | | (53 | ) | | (66 | ) |
| Balance at 6/30/2018 | $ | 86,858 |
| | $ | 23,602 |
| | $ | 10,910 |
| | $ | 121,370 |
|
| Average AUM(1) | $ | 82,085 |
| | $ | 23,953 |
| | $ | 10,904 |
| | $ | 116,942 |
|
The tables below provide rollforwards of our total AUM by segment for the six months ended June 30, 2019 and 2018 (in millions):
|
| | | | | | | | | | | | | | | |
| | Credit Group | | Private Equity Group | | Real Estate Group | | Total AUM |
| Balance at 12/31/2018 | $ | 95,836 |
| | $ | 23,487 |
| | $ | 11,340 |
| | $ | 130,663 |
|
| Net new par/equity commitments | 4,915 |
| | 1,028 |
| | 617 |
| | 6,560 |
|
| Net new debt commitments | 6,306 |
| | — |
| | 583 |
| | 6,889 |
|
| Distributions | (3,724 | ) | | (1,199 | ) | | (989 | ) | | (5,912 | ) |
| Change in fund value | 2,172 |
| | 1,419 |
| | 317 |
| | 3,908 |
|
| Balance at 6/30/2019 | $ | 105,505 |
| | $ | 24,735 |
| | $ | 11,868 |
| | $ | 142,108 |
|
| Average AUM(1) | $ | 100,805 |
| | $ | 24,000 |
| | $ | 11,673 |
| | $ | 136,478 |
|
|
| | | | | | | | | | | | | | | |
| | Credit Group | | Private Equity Group | | Real Estate Group | | Total AUM |
| Balance at 12/31/2017 | $ | 71,732 |
| | $ | 24,530 |
| | $ | 10,229 |
| | $ | 106,491 |
|
| Net new par/equity commitments | 12,459 |
| | 363 |
| | 1,164 |
| | 13,986 |
|
| Net new debt commitments | 4,745 |
| | — |
| | — |
| | 4,745 |
|
| Distributions | (3,136 | ) | | (1,321 | ) | | (531 | ) | | (4,988 | ) |
| Change in fund value | 1,058 |
| | 30 |
| | 48 |
| | 1,136 |
|
| Balance at 6/30/2018 | $ | 86,858 |
| | $ | 23,602 |
| | $ | 10,910 |
| | $ | 121,370 |
|
| Average AUM(1) | $ | 78,634 |
| | $ | 24,145 |
| | $ | 10,679 |
| | $ | 113,458 |
|
(1) Represents the quarterly average of beginning and ending balances.
The components of our AUM including the portion that is FPAUM, are presented below as of June 30, 2019 and 2018 (in millions)($ in billions):
|
| |
AUM: $142,108 | AUM: $121,370 |
|
| | | | | | | |
| AUM: $158.4 | FPAUM | AUM: $142.1 |
| | | | | | | | | | | | | | | | | | | | | | | |
| FPAUM | | AUM not yet earningpaying fees | | Non-fee paying(1)paying(1) | | General partner and affiliates |
(1) Includes $7.8$8.4 billion and $7.0$7.8 billion of AUM of funds from which we indirectly earn management fees as of June 30, 20192020 and 2018,2019, respectively.
Please refer to “— Results of Operations by Segment” for a more detailed presentation of AUM by segment for each of the periods presented.
Fee Paying Assets Under Management
TheOur FPAUM is generally comprised of the following components generally comprise our FPAUM:components:
•The amount of limited partner capital commitments for certain closed-end funds within the reinvestment period in the Credit Group, certain funds in the Private Equity Group and certain private funds in the Real Estate Group;period;
•The amount of limited partner invested capital for the aforementioned closed-end funds beyond the reinvestment period as well as the structured assets funds in the Credit Group, certain managed accounts within their reinvestment period, European commingled funds in the Credit Group and co-invest vehicles in the Real Estate Group;period;
•The gross amount of aggregate collateral balance for CLOs, at par, adjusted for defaulted or discounted collateral; and
•The portfolio value, gross asset value or NAV, adjusted in certain instances for cash or certain accrued expenses, for the remaining funds in the Credit Group, ARCC, certain managed accounts in the Credit Group and certain debt funds in the Real Estate Group.NAV.
The tables below providepresent rollforwards of our total FPAUM by segment for the three months ended June 30, 2019 and 2018 (in($ in millions):
| | | | | | | | | | | | | | | | | | | | | | | | | | |
| | | Credit Group | | Private Equity Group | | Real Estate Group | | Total |
| FPAUM Balance at 3/31/2020 | | $ | 75,760 | | | $ | 17,020 | | | $ | 9,215 | | | $ | 101,995 | |
| | | | | | | | |
| Commitments | | 1,280 | | | — | | | 131 | | | 1,411 | |
| Subscriptions/deployment/increase in leverage | | 2,974 | | | 669 | | | 51 | | | 3,694 | |
| Capital reductions | | (870) | | | — | | | (37) | | | (907) | |
| Distributions | | (1,147) | | | (216) | | | (82) | | | (1,445) | |
| Redemptions | | (843) | | | — | | | — | | | (843) | |
| Change in fund value | | 1,630 | | | — | | | 53 | | | 1,683 | |
| Change in fee basis | | (40) | | | — | | | — | | | (40) | |
| FPAUM Balance at 6/30/2020 | | $ | 78,744 | | | $ | 17,473 | | | $ | 9,331 | | | $ | 105,548 | |
Average FPAUM(1) | | $ | 77,254 | | | $ | 17,247 | | | $ | 9,274 | | | $ | 103,775 | |
| | | | | | | | |
| | Credit Group | | Private Equity Group | | Real Estate Group | | Total |
| FPAUM Balance at 3/31/2019 | | $ | 62,924 | | | $ | 17,322 | | | $ | 6,975 | | | $ | 87,221 | |
| Commitments | | 1,570 | | | — | | | 279 | | | 1,849 | |
| Subscriptions/deployment/increase in leverage | | 2,695 | | | 188 | | | 402 | | | 3,285 | |
| Capital reductions | | (1,144) | | | (4) | | | (67) | | | (1,215) | |
| Distributions | | (651) | | | (320) | | | (162) | | | (1,133) | |
| Redemptions | | (1,197) | | | — | | | — | | | (1,197) | |
| Change in fund value | | 566 | | | 2 | | | 36 | | | 604 | |
| | | | | | | | |
| FPAUM Balance at 6/30/2019 | | $ | 64,763 | | | $ | 17,188 | | | $ | 7,463 | | | $ | 89,414 | |
Average FPAUM(1) | | $ | 63,845 | | | $ | 17,256 | | | $ | 7,220 | | | $ | 88,321 | |
| | | | | | | | |
| (1) Represents a two-point average of quarter-end balances for each period. | | | | | | | | |
| | | | | | | | |
| | Credit Group | | Private Equity Group | | Real Estate Group | | Total |
| FPAUM Balance at 12/31/2019 | | $ | 71,880 | | | $ | 17,040 | | | $ | 7,963 | | | $ | 96,883 | |
| Acquisitions | | 2,596 | | | — | | | — | | | 2,596 | |
| Commitments | | 2,520 | | | — | | | 1,498 | | | 4,018 | |
| Subscriptions/deployment/increase in leverage | | 7,539 | | | 1,021 | | | 529 | | | 9,089 | |
| Capital reductions | | (970) | | | — | | | (47) | | | (1,017) | |
| Distributions | | (2,178) | | | (584) | | | (307) | | | (3,069) | |
| Redemptions | | (1,324) | | | — | | | — | | | (1,324) | |
| Change in fund value | | (1,279) | | | (5) | | | 6 | | | (1,278) | |
| Change in fee basis | | (40) | | | 1 | | | (311) | | | (350) | |
| FPAUM Balance at 6/30/2020 | | $ | 78,744 | | | $ | 17,473 | | | $ | 9,331 | | | $ | 105,548 | |
Average FPAUM(1) | | $ | 75,461 | | | $ | 17,178 | | | $ | 8,836 | | | $ | 101,475 | |
| | | | | | | | |
| | Credit Group | | Private Equity Group | | Real Estate Group | | Total |
| FPAUM Balance at 12/31/2018 | | $ | 57,847 | | | $ | 17,071 | | | $ | 6,952 | | | $ | 81,870 | |
| Commitments | | 3,408 | | | 81 | | | 365 | | | 3,854 | |
| Subscriptions/deployment/increase in leverage | | 6,628 | | | 501 | | | 558 | | | 7,687 | |
| Capital reductions | | (1,229) | | | (8) | | | (67) | | | (1,304) | |
| Distributions | | (1,174) | | | (461) | | | (343) | | | (1,978) | |
| Redemptions | | (2,054) | | | — | | | — | | | (2,054) | |
| Change in fund value | | 1,471 | | | 4 | | | (2) | | | 1,473 | |
| Change in fee basis | | (134) | | | — | | | — | | | (134) | |
| FPAUM Balance at 6/30/2019 | | $ | 64,763 | | | $ | 17,188 | | | $ | 7,463 | | | $ | 89,414 | |
Average FPAUM(1) | | $ | 61,844 | | | $ | 17,194 | | | $ | 7,130 | | | $ | 86,168 | |
| | | | | | | | |
| (1) Represents a three-point average of quarter-end balances for each period. | | | | | | | | |
|
| | | | | | | | | | | | | | | |
| | Credit Group | | Private Equity Group | | Real Estate Group | | Total |
| FPAUM Balance at 3/31/2019 | $ | 62,924 |
| | $ | 17,322 |
| | $ | 6,975 |
| | $ | 87,221 |
|
| Commitments | 1,570 |
| | — |
| | 279 |
| | 1,849 |
|
| Subscriptions/deployment/increase in leverage | 2,695 |
| | 188 |
| | 402 |
| | 3,285 |
|
| Redemptions/distributions/decrease in leverage | (2,992 | ) | | (324 | ) | | (229 | ) | | (3,545 | ) |
| Change in fund value | 566 |
| | 2 |
| | 36 |
| | 604 |
|
| FPAUM Balance at 6/30/2019 | $ | 64,763 |
| | $ | 17,188 |
| | $ | 7,463 |
| | $ | 89,414 |
|
| Average FPAUM(1) | $ | 63,845 |
| | $ | 17,256 |
| | $ | 7,220 |
| | $ | 88,321 |
|
|
| | | | | | | | | | | | | | | |
| | Credit Group | | Private Equity Group | | Real Estate Group | | Total |
| FPAUM Balance at 3/31/2018 | $ | 51,540 |
| | $ | 16,663 |
| | $ | 6,751 |
| | $ | 74,954 |
|
| Commitments | 1,888 |
| | 350 |
| | 97 |
| | 2,335 |
|
| Subscriptions/deployment/increase in leverage | 1,951 |
| | 171 |
| | 280 |
| | 2,402 |
|
| Redemptions/distributions/decrease in leverage | (2,109 | ) | | (590 | ) | | (115 | ) | | (2,814 | ) |
| Change in fund value | 66 |
| | (5 | ) | | (50 | ) | | 11 |
|
| FPAUM Balance at 6/30/2018 | $ | 53,336 |
| | $ | 16,589 |
| | $ | 6,963 |
| | $ | 76,888 |
|
| Average FPAUM(1) | $ | 52,439 |
| | $ | 16,627 |
| | $ | 6,858 |
| | $ | 75,924 |
|
| | | | | | | | |
| FPAUM: $105.5 | | FPAUM: $89.4 |
| | | | | | | | | | | | | | | | | | | | | | | |
| Invested capital/other(1) | | Market value(2) | | Collateral balances (at par) | | Capital commitments |
(1) Represents the quarterly averageOther consists of beginningACRE's FPAUM, which is based on ACRE’s stockholders’ equity.
(2)Includes $19.2 billion and ending balances.
The tables below provide rollforwards$17.1 billion from funds that primarily invest in illiquid strategies as of our total FPAUM by segment for the six months ended June 30, 2020 and 2019, and 2018 (in millions):respectively. The underlying investments held in these funds are generally subject to less market volatility than investments held in liquid strategies.
|
| | | | | | | | | | | | | | | |
| | Credit Group | | Private Equity Group | | Real Estate Group | | Total |
| FPAUM Balance at 12/31/2018 | $ | 57,847 |
| | $ | 17,071 |
| | $ | 6,952 |
| | $ | 81,870 |
|
| Commitments | 3,408 |
| | 81 |
| | 365 |
| | 3,854 |
|
| Subscriptions/deployment/increase in leverage | 6,628 |
| | 500 |
| | 559 |
| | 7,687 |
|
| Redemptions/distributions/decrease in leverage | (4,457 | ) | | (468 | ) | | (410 | ) | | (5,335 | ) |
| Change in fund value | 1,471 |
| | 4 |
| | (3 | ) | | 1,472 |
|
| Change in fee basis | (134 | ) | | — |
| | — |
| | (134 | ) |
| FPAUM Balance at 6/30/2019 | $ | 64,763 |
| | $ | 17,188 |
| | $ | 7,463 |
| | $ | 89,414 |
|
| Average FPAUM(1) | $ | 61,844 |
| | $ | 17,194 |
| | $ | 7,130 |
| | $ | 86,168 |
|
|
| | | | | | | | | | | | | | | |
| | Credit Group | | Private Equity Group | | Real Estate Group | | Total |
| FPAUM Balance at 12/31/2017 | $ | 49,450 |
| | $ | 16,858 |
| | $ | 6,189 |
| | $ | 72,497 |
|
| Commitments | 2,818 |
| | 363 |
| | 863 |
| | 4,044 |
|
| Subscriptions/deployment/increase in leverage | 3,915 |
| | 374 |
| | 415 |
| | 4,704 |
|
| Redemptions/distributions/decrease in leverage | (3,334 | ) | | (1,016 | ) | | (298 | ) | | (4,648 | ) |
| Change in fund value | 494 |
| | 10 |
| | (2 | ) | | 502 |
|
| Change in fee basis | (7 | ) | | — |
| | (204 | ) | | (211 | ) |
| FPAUM Balance at 6/30/2018 | $ | 53,336 |
| | $ | 16,589 |
| | $ | 6,963 |
| | $ | 76,888 |
|
| Average FPAUM(1) | $ | 51,443 |
| | $ | 16,703 |
| | $ | 6,635 |
| | $ | 74,781 |
|
(1) Represents the quarterly average of beginning and ending balances.
Incentive Eligible Assets Under Management, Incentive Generating Assets Under Management and Available Capital
IEAUM generally represents the NAV plus uncalled equity or total assets plus uncalled debt, as applicable, of our funds from which we are entitled to receive a performance income, excluding capital committed by us and our professionals (from which we generally do not earn performance income). With respect to ARCC's AUM, only ARCC Part II Fees may be generated from IEAUM.
IGAUM generally represents the AUM of our funds that are currently generating performance income on a realized or unrealized basis, performance income.basis. It generally represents the NAV or total assets of our funds, as applicable, for which we are entitled to receive performance income, excluding capital committed by us and our professionals (from which we generally do not earn performance income). With respect to ARCC's AUM,ARCC is only included in IGAUM when ARCC Part II Fees may be generated from IGAUM.are being generated.
The charts below present our IEAUM and IGAUM by segment as of June 30, 2019 and 2018 (in millions)($ in billions):
|
| | | | | | | | | | | | | | | | |
| Credit | Credit | | Private Equity | | Real Estate | |
As of June 30, 2019 and 2018,The charts below present our available capital, which we refer to as dry powder, was $37.1 billion and $33.3 billion, respectively, primarily attributable to our fundsAUM not yet paying fees by segment ($ in the Credit Group.billions):
| | | | | | | | | | | | | | | | | |
| Credit | | Private Equity | | Real Estate |
Management Fees Fund Duration
We view the duration of funds we manage as a metric to measure the stability of our future management fees. For the three months ended June 30, 2020 and 2019, 77% and 2018, 83% and 81%, respectively, of our unconsolidatedsegment management fees were attributable to funds with three or more years in duration. The charts below present the composition of our unconsolidatedsegment management fees by the initial fund duration for the three months ended June 30, 2019 and 2018:duration:
|
| | | | | | | | | | | | | | | | | | | | | | | | | | | | | | | | | | | | | | | | |
| Permanent Capital | | 10 or more years | | 7 to 9 years | | 3 to 6 years | | 7 to 9Fewer than 3 years | | 10 or more years | | Differentiated Managed Accounts(1) | | Fewer Than 3 years | | Managed Accounts |
(1) Differentiated managed accounts have been managed by the Company for longer than three years, are investing in illiquid strategies or are co-investments structured to pay management fees.
Fund Performance Metrics
Fund performance information for our investment funds considered to be “significant funds” is included throughout this discussion with analysis to facilitate an understanding of our results of operations for the periods presented. Our significant funds include those that contributed at least 1% of our total management fees for the six months ended June 30, 2019 or represented at least 1% of the Company’s total FPAUM as of June 30, 2019,for the past two consecutive reporting periods, and for whichwhere we have sole discretion for investment decisions within the fund. In addition to management fees, each of our significant funds may generate performance income upon the achievement of performance hurdles. The fund performance information reflected in this discussion and analysis is not indicative of our overall performance. An investment in Ares is not an investment in any of our funds. Past performance is not indicative of future results. As with any investment there is always the potential for gains as well as the possibility of losses. There can be no assurance that any of these funds or our other existing and future funds will achieve similar returns.
We do not present fund performance metrics for significant funds with less than two years of investment performance from the date of the fund's first investment, except for those significant funds that pay management fees on invested capital, in which case investment performance will be presented on the earlier of (i) the one-year anniversary of the fund's first investment or (ii) such time that the fund has invested at least 50% of its capital.
Consolidation and Deconsolidation of Ares Funds
Consolidated Funds represented approximately 7.5% of our AUM as of June 30, 2020, 4.0% of our management fees and less than 1% of our carried interest and incentive fees for the six months ended June 30, 2020. As of June 30, 2020, we consolidated 21 CLOs and seven private funds, and as of June 30, 2019, we consolidated 14 CLOs and eight private funds.
The activity of the Consolidated Funds is reflected within the condensed consolidated financial statement line items indicated by reference thereto. The impact of the Consolidated Funds also typically will decrease management fees, carried interest allocation and incentive fees reported under GAAP to the extent these are eliminated upon consolidation.
The assets and liabilities of our Consolidated Funds are held within separate legal entities and, as a result, the liabilities of our Consolidated Funds are typically non-recourse to us. Generally, the consolidation of our Consolidated Funds has a significant gross-up effect on our assets, liabilities and cash flows but has no net effect on the net income attributable to us or our stockholders' equity. The net economic ownership interests of our Consolidated Funds, to which we have no economic rights, are reflected as non-controlling interests in the Consolidated Funds in our condensed consolidated financial statements.
We generally deconsolidate funds and CLOs when we are no longer deemed to have a controlling interest in the entity. During the six months ended June 30, 2020, one entity was liquidated/dissolved and no entities experienced a significant change in ownership that resulted in deconsolidation of the fund or CLO during each of the periods. During the six months ended June 30, 2019, two entities was liquidated/dissolved and two entities experienced a significant change in ownership that resulted in deconsolidation of the fund or CLO during each of the periods.
The performance of our Consolidated Funds is not necessarily consistent with, or representative of, the combined performance trends of all of our funds.
For the actual impact that consolidation had on our results and further discussion on consolidation and deconsolidation of funds, see “Note 15. Consolidation” to our condensed consolidated financial statements included herein.
Results of Operations
Consolidated Results of Operations
We consolidate funds where we are deemed to hold a controlling financial interest. The Consolidated Funds are not necessarily the same entities in each year presented due to changes in ownership, changes in limited partners' rights, and the creation and termination of funds. The consolidation of these funds had no effect on net income attributable to us for the periods presented. As such, we separate the analysis of the Consolidated Funds and evaluate that activity in total. The following table and discussion sets forth information regarding our consolidated results of operations for the three and six months ended June 30, 2019 and 2018 ($ in thousands):
| | | | Three Months Ended June 30, | | Favorable (Unfavorable) | | Six Months Ended June 30, | | Favorable (Unfavorable) | | Three months ended June 30, | | | Favorable (Unfavorable) | | | Six months ended June 30, | | | Favorable (Unfavorable) | |
| | 2019 | | 2018 | | $ Change | | % Change | | 2019 | | 2018 | | $ Change | | % Change | | 2020 | | 2019 | | $ Change | | % Change | | 2020 | | 2019 | | $ Change | | % Change |
| Revenues | | | | | | | | | | | | | | | | Revenues | | | | | | | | | | | | | | | |
| Management fees (includes ARCC Part I Fees of $39,157, $77,550 and $29,866, $58,283 for the three and six months ended June 30, 2019 and 2018, respectively) | $ | 237,846 |
| | $ | 194,032 |
| | $ | 43,814 |
| | 23 | % | | $ | 462,505 |
| | $ | 383,547 |
| | $ | 78,958 |
| | 21 | % | |
| Management fees (includes ARCC Part I Fees of $41,306, $85,229 and $39,157, $77,550 for the three and six months ended June 30, 2020 and 2019, respectively) | | Management fees (includes ARCC Part I Fees of $41,306, $85,229 and $39,157, $77,550 for the three and six months ended June 30, 2020 and 2019, respectively) | $ | 266,867 | | | $ | 237,846 | | | $ | 29,021 | | | 12 | % | | $ | 530,716 | | | $ | 462,505 | | | $ | 68,211 | | | 15 | % |
| Carried interest allocation | 119,712 |
| | (13,444 | ) | | 133,156 |
| | NM |
| | 317,005 |
| | 40,685 |
| | 276,320 |
| | NM |
| Carried interest allocation | 303,278 | | | 119,712 | | | 183,566 | | | 153 | | | 72,402 | | | 317,005 | | | (244,603) | | | (77) | |
| Incentive fees | 10,220 |
| | 7,740 |
| | 2,480 |
| | 32 | % | | 27,035 |
| | 12,811 |
| | 14,224 |
| | 111 | % | Incentive fees | 331 | | | 10,220 | | | (9,889) | | | (97) | | | (2,918) | | | 27,035 | | | (29,953) | | | NM |
| Principal investment income | 5,844 |
| | 1,871 |
| | 3,973 |
| | 212 | % | | 34,603 |
| | 6,780 |
| | 27,823 |
| | NM |
| |
| Principal investment income (loss) | | Principal investment income (loss) | 23,645 | | | 5,844 | | | 17,801 | | | NM | | (3,078) | | | 34,603 | | | (37,681) | | | NM |
| Administrative, transaction and other fees | 11,200 |
| | 13,964 |
| | (2,764 | ) | | (20 | )% | | 20,871 |
| | 26,429 |
| | (5,558 | ) | | (21 | )% | Administrative, transaction and other fees | 8,637 | | | 11,200 | | | (2,563) | | | (23) | | | 19,045 | | | 20,871 | | | (1,826) | | | (9) | |
| Total revenues | 384,822 |
| | 204,163 |
| | 180,659 |
| | 88 | % | | 862,019 |
| | 470,252 |
| | 391,767 |
| | 83 | % | Total revenues | 602,758 | | | 384,822 | | | 217,936 | | | 57 | | | 616,167 | | | 862,019 | | | (245,852) | | | (29) | |
| Expenses | | | | | | | | | | | | | | | | Expenses | | | | | | | | | | | | | |
| Compensation and benefits | 162,170 |
| | 138,992 |
| | (23,178 | ) | | (17 | )% | | 319,016 |
| | 273,631 |
| | (45,385 | ) | | (17 | )% | Compensation and benefits | 185,131 | | | 162,170 | | | (22,961) | | | (14) | | | 365,215 | | | 319,016 | | | (46,199) | | | (14) | |
| Performance related compensation | 92,688 |
| | (13,005 | ) | | (105,693 | ) | | NM |
| | 249,208 |
| | 12,873 |
| | (236,335 | ) | | NM |
| Performance related compensation | 237,108 | | | 92,688 | | | (144,420) | | | (156) | | | 69,209 | | | 249,208 | | | 179,999 | | | 72 | |
| General, administrative and other expenses | 65,416 |
| | 59,918 |
| | (5,498 | ) | | (9 | )% | | 116,603 |
| | 104,368 |
| | (12,235 | ) | | (12 | )% | General, administrative and other expenses | 58,084 | | | 65,416 | | | 7,332 | | | 11 | | | 120,415 | | | 116,603 | | | (3,812) | | | (3) | |
| | Expenses of Consolidated Funds | 15,427 |
| | 35,112 |
| | 19,685 |
| | 56 | % | | 19,981 |
| | 36,428 |
| | 16,447 |
| | 45 | % | Expenses of Consolidated Funds | 3,244 | | | 15,427 | | | 12,183 | | | 79 | | | 10,687 | | | 19,981 | | | 9,294 | | | 47 | |
| Total expenses | 335,701 |
| | 221,017 |
| | (114,684 | ) | | (52 | )% | | 704,808 |
| | 427,300 |
| | (277,508 | ) | | (65 | )% | Total expenses | 483,567 | | | 335,701 | | | (147,866) | | | (44) | | | 565,526 | | | 704,808 | | | 139,282 | | | 20 | |
| Other income (expense) | | | | | | | | | | | | | | | | Other income (expense) | | | | | | | | | | | | | |
| Net realized and unrealized gain on investments | 521 |
| | 3,267 |
| | (2,746 | ) | | (84 | )% | | 3,997 |
| | 2,428 |
| | 1,569 |
| | 65 | % | |
| Net realized and unrealized gains (losses) on investments | | Net realized and unrealized gains (losses) on investments | 290 | | | 521 | | | (231) | | | (44) | | | (7,744) | | | 3,997 | | | (11,741) | | | NM |
| Interest and dividend income | 1,652 |
| | 2,356 |
| | (704 | ) | | (30 | )% | | 3,496 |
| | 5,703 |
| | (2,207 | ) | | (39 | )% | Interest and dividend income | 1,978 | | | 1,652 | | | 326 | | | 20 | | | 3,768 | | | 3,496 | | | 272 | | | 8 | |
| Interest expense | (5,793 | ) | | (6,076 | ) | | 283 |
| | 5 | % | | (11,382 | ) | | (12,945 | ) | | 1,563 |
| | 12 | % | Interest expense | (6,082) | | | (5,793) | | | (289) | | | (5) | | | (11,388) | | | (11,382) | | | (6) | | | — | |
| Other income (expense), net | 4,797 |
| | (1,987 | ) | | 6,784 |
| | NM |
| | 300 |
| | (2,298 | ) | | 2,598 |
| | NM |
| |
| Net realized and unrealized gain (loss) on investments of Consolidated Funds | (116 | ) | | 34,487 |
| | (34,603 | ) | | NM |
| | 4,248 |
| | 21,402 |
| | (17,154 | ) | | (80 | )% | |
| Other income, net | | Other income, net | 2,181 | | | 4,797 | | | (2,616) | | | (55) | | | 7,645 | | | 300 | | | 7,345 | | | NM |
| Net realized and unrealized gains (losses) on investments of Consolidated Funds | | Net realized and unrealized gains (losses) on investments of Consolidated Funds | 83,522 | | | (116) | | | 83,638 | | | NM | | (171,239) | | | 4,248 | | | (175,487) | | | NM |
| Interest and other income of Consolidated Funds | 102,206 |
| | 92,633 |
| | 9,573 |
| | 10 | % | | 195,390 |
| | 157,055 |
| | 38,335 |
| | 24 | % | Interest and other income of Consolidated Funds | 116,314 | | | 102,206 | | | 14,108 | | | 14 | | | 229,539 | | | 195,390 | | | 34,149 | | | 17 | |
| Interest expense of Consolidated Funds | (68,005 | ) | | (56,754 | ) | | (11,251 | ) | | (20 | )% | | (132,917 | ) | | (101,179 | ) | | (31,738 | ) | | (31 | )% | Interest expense of Consolidated Funds | (76,297) | | | (68,005) | | | (8,292) | | | (12) | | | (156,538) | | | (132,917) | | | (23,621) | | | (18) | |
| Total other income | 35,262 |
| | 67,926 |
| | (32,664 | ) | | (48 | )% | | 63,132 |
| | 70,166 |
| | (7,034 | ) | | (10 | )% | |
| Income before taxes | 84,383 |
| | 51,072 |
| | 33,311 |
| | 65 | % | | 220,343 |
| | 113,118 |
| | 107,225 |
| | 95 | % | |
| Total other income (expense) | | Total other income (expense) | 121,906 | | | 35,262 | | | 86,644 | | | 246 | | | (105,957) | | | 63,132 | | | (169,089) | | | NM |
| Income (loss) before taxes | | Income (loss) before taxes | 241,097 | | | 84,383 | | | 156,714 | | | 186 | | | (55,316) | | | 220,343 | | | (275,659) | | | NM |
| Income tax expense | 9,505 |
| | 36,903 |
| | 27,398 |
| | 74 | % | | 23,889 |
| | 24,528 |
| | 639 |
| | 3 | % | Income tax expense | 24,421 | | | 9,505 | | | (14,916) | | | (157) | | | 3,805 | | | 23,889 | | | 20,084 | | | 84 | |
| Net income | 74,878 |
| | 14,169 |
| | 60,709 |
| | NM |
| | 196,454 |
| | 88,590 |
| | 107,864 |
| | 122 | % | |
| Less: Net income attributable to non-controlling interests in Consolidated Funds | 8,346 |
| | 9,882 |
| | (1,536 | ) | | (16 | )% | | 25,970 |
| | 10,249 |
| | 15,721 |
| | 153 | % | |
| Less: Net income attributable to non-controlling interests in Ares Operating Group entities | 34,393 |
| | 16,062 |
| | 18,331 |
| | 114 | % | | 93,396 |
| | 49,168 |
| | 44,228 |
| | 90 | % | |
| Net income (loss) attributable to Ares Management Corporation | 32,139 |
| | (11,775 | ) | | 43,914 |
| | NM |
| | 77,088 |
| | 29,173 |
| | 47,915 |
| | 164 | % | |
| Net income (loss) | | Net income (loss) | 216,676 | | | 74,878 | | | 141,798 | | | 189 | | | (59,121) | | | 196,454 | | | (255,575) | | | NM |
| Less: Net income (loss) attributable to non-controlling interests in Consolidated Funds | | Less: Net income (loss) attributable to non-controlling interests in Consolidated Funds | 85,186 | | | 8,346 | | | 76,840 | | | NM | | (81,220) | | | 25,970 | | | (107,190) | | | NM |
| Less: Net income (loss) attributable to non-controlling interests in Ares Operating Group entities | | Less: Net income (loss) attributable to non-controlling interests in Ares Operating Group entities | 75,119 | | | 34,393 | | | 40,726 | | | 118 | | | (3,236) | | | 93,396 | | | (96,632) | | | NM |
| Net income attributable to Ares Management Corporation | | Net income attributable to Ares Management Corporation | 56,371 | | | 32,139 | | | 24,232 | | | 75 | | | 25,335 | | | 77,088 | | | (51,753) | | | (67) | |
| Less: Series A Preferred Stock dividends paid | 5,425 |
| | 5,425 |
| | — |
| | — | % | | 10,850 |
| | 10,850 |
| | — |
| | — | % | Less: Series A Preferred Stock dividends paid | 5,425 | | | 5,425 | | | — | | | — | | | 10,850 | | | 10,850 | | | — | | | — | |
| Net income (loss) attributable to Ares Management Corporation Class A common stockholders | $ | 26,714 |
| | $ | (17,200 | ) | | 43,914 |
| | NM |
| | $ | 66,238 |
| | $ | 18,323 |
| | 47,915 |
| | 262 | % | |
| Net income attributable to Ares Management Corporation Class A common stockholders | | Net income attributable to Ares Management Corporation Class A common stockholders | $ | 50,946 | | | $ | 26,714 | | | 24,232 | | | 91 | | | $ | 14,485 | | | $ | 66,238 | | | (51,753) | | | (78) | |
NM - Not Meaningful
Three and Six Months Ended June 30, 20192020 Compared to Three and Six Months Ended June 30, 20182019
RevenuesConsolidated Results of Operations of the Company
Management Fees. Total management fees increased by $43.8$29.0 million, or 23%12%, for the three months ended June 30, 20192020 compared to the three months ended June 30, 20182019 and by $79.0$68.2 million, or 21%15%, for the six months ended June 30, 20192020 compared to the six months ended June 30, 2018.2019. The increases in total management fees were primarily due to the Credit Group, driven by increasesan increase in ARCC Part I Fees and by higher FPAUM from capital deployments andin direct lending funds. Management fees also increased in the Real Estate Group driven by higher FPAUM from new commitments during the current year periods.year. For detail regarding the fluctuations of management fees within each of our segments see “—Results of Operations by Segment.”
Carried Interest Allocation. Carried interest allocation increased by $133.2$183.6 million, or 153%, for the three months ended June 30, 2020 compared to the three months ended June 30, 2019 and decreased by $244.6 million, or 77%, for the six months ended June 30, 2020 compared to the six months ended June 30, 2019. The activity was principally composed of the following:
| | | | | | | | | | | | | | | | | |
| Three months ended June 30, 2020 | Primary Drivers | | Three months ended June 30, 2019 | Primary Drivers |
| ($ in millions) | | | ($ in millions) | |
| Credit funds | $ | 42.5 | | Five direct lending funds with $9.4 billion of IGAUM generating returns in excess of their hurdle rates. Ares Private Credit Solutions, L.P. ("PCS") generated carried interest allocation of $24.5 million that was driven by net investment income on an increasing invested capital base and by a partial recovery of unrealized losses recorded in the first quarter of 2020 related to market volatility driven by the COVID-19 pandemic. Ares Capital Europe IV L.P. ("ACE IV") generated carried interest allocation of $11.8 million from net investment income on an increasing invested capital base, partially offset by net unrealized losses for the period. | | $ | 35.9 | | Nine direct lending funds with $8.3 billion of IGAUM generating returns in excess of their hurdle rates. Ares Capital Europe III, L.P. ("ACE III"), PCS and ACE IV generated $6.8 million, $11.3 million and $7.2 million of carried interest allocation during the period, respectively.
|
| Private equity funds | 265.0 | | Market appreciation of Ares Corporate Opportunities Fund IV, L.P.'s ("ACOF IV") investment in The AZEK Company ("AZEK") following its initial public offering and Ares Corporate Opportunities Fund III, L.P.'s (“ACOF III”) investment in Floor & Decor Holdings, Inc. (“FND”) due to share price appreciation generated carried interest allocation of $179.7 million and $49.6 million, respectively. In addition, market appreciation across several investments generated carried interest allocation of $28.6 million for Ares Special Opportunities Fund, L.P. ("ASOF"). The market appreciation was driven by the recovery of investment valuations from the market lows from the COVID-19 pandemic. | | 65.0 | | Increased fair value of ACOF IV investment in National Veterinary Associates ("NVA") resulting from the pending sale of the company which closed in the first quarter of 2020. |
| Real estate funds | (4.2) | | Market depreciation from multiple properties within real estate equity funds that led to the reversal of unrealized carried interest allocation primarily from Ares European Real Estate Fund IV, L.P. ("EF IV") in the amount of $6.7 million. | | 18.8 | | Market appreciation from multiple properties within three of our U.S. real estate equity funds, EF IV and certain European real estate equity funds.
|
| Carried interest allocation | $ | 303.3 | | | | $ | 119.7 | | |
| | | | | |
| | | | | | | | | | | | | | | | | |
| Six months ended June 30, 2020 | Primary Drivers | | Six months ended June 30, 2019 | Primary Drivers |
| ($ in millions) | | | ($ in millions) | |
| Credit funds | $ | 15.0 | | Four direct lending funds with $8.6 billion of IGAUM generating returns in excess of their hurdle rates. PCS and ACE IV generated carried interest allocation of $6.3 million and $16.4 million, respectively, driven by net investment income on an increasing invested capital base that was partially offset by net unrealized losses on investments that primarily incurred during the first quarter of 2020 due to the market volatility driven by the COVID-19 pandemic. ACE III had net unrealized losses during the period, resulting in the reversal of $8.0 million of unrealized carried interest allocation for the period. | | $ | 72.7 | | Nine direct lending funds with $9.3 billion of IGAUM generating returns in excess of their hurdle rates. ACE III, PCS and ACE IV generated $20.0 million, $16.4 million and $19.7 million of carried interest allocation during the period, respectively.
|
| Private equity funds | 70.6 | | Market appreciation of ACOF IV's investment in AZEK following its initial public offering generated carried interest allocation of $156.0 million. In addition, market appreciation across several investments generated carried interest allocation of $28.9 million for ASOF. Market depreciation across several investments led to the reversal of unrealized carried interest allocation of $75.1 million for Ares Corporate Opportunities Fund V, L.P. ("ACOF V") and $27.4 million for Ares Energy Opportunities Fund, L.P. ("AEOF"). The market depreciation for investments of these funds was driven by the energy market dislocation. | | 209.1 | | Market appreciation of ACOF III's investment in FND; increased fair value of ACOF IV's investment in NVA resulting from the pending sale of the company which closed in the first quarter of 2020; and market appreciation across multiple ACOF IV portfolio companies. |
| Real estate funds | (13.2) | | Market depreciation from multiple properties within real estate equity funds that led to the reversal of unrealized carried interest allocation primarily from US Real Estate Fund IX, L.P. ("US IX") and EF IV in the amount of $6.8 million and $15.7 million for the period, respectively. This activity was offset by gains generated in multiple funds resulting from the sale of a pan-European logistics portfolio at a higher price than the December 31, 2019 price. | | 35.2 | | Market appreciation from multiple properties within four of our U.S. real estate equity funds, EF IV and two European real estate equity funds.
|
| Carried interest allocation | $ | 72.4 | | | | $ | 317.0 | | |
Incentive Fees. Incentive fees decreased by $9.9 million, or 97%, for the three months ended June 30, 2020 compared to the three months ended June 30, 2019 and decreased by $30.0 million to $119.7a reversal of $2.9 million for the six months ended June 30, 2020 compared to the six months ended June 30, 2019. The activity was principally composed of the following ($ in millions):
| | | | | | | | | | | | | | | | | |
| Three months ended June 30, 2020 | Primary Drivers | | Three months ended June 30, 2019 | Primary Drivers |
| Credit funds | $ | — | | No activity. | | $ | 10.2 | | Four direct lending funds with incentive fees that crystallized during the period. |
| Real estate funds | 0.3 | | Incentive fees generated from a real estate debt fund. | | — | | No activity. |
| Incentive fees | $ | 0.3 | | | | $ | 10.2 | | |
| | | | | |
| Six months ended June 30, 2020 | Primary Drivers | | Six months ended June 30, 2019 | Primary Drivers |
| Credit funds | $ | (3.2) | | One-time reversal of incentive fees following management's decision to extend the measurement period after the fees were crystallized. | | $ | 27.0 | | 15 direct lending funds with incentive fees that crystallized during the period. |
| Real estate funds | 0.3 | | Incentive fees generated from a real estate debt fund. | | — | | No activity. |
| Incentive fees | $ | (2.9) | | | | $ | 27.0 | | |
Principal Investment Income (Loss). Principal investment income (loss) increased by $17.8 million for the three months ended June 30, 20192020 compared to the three months ended June 30, 20182019 and decreased by $276.3$37.7 million to $317.0a $3.1 million loss for the six months ended June 30, 20192020 compared to the six months ended June 30, 2018.
Carried interest allocation for2019. The COVID-19 pandemic has caused extreme volatility during 2020. The global equity and credit markets experienced significant downturns in the first quarter of 2020 that were largely, but not fully, offset by a recovery in the second quarter. This volatility was in contrast to the three and six months ended June 30, 2019 and 2018 was principally composed of the following (in millions):
|
| | | | | | | | | |
| | Three Months Ended June 30, 2019 | Primary Drivers | | Six Months Ended June 30, 2019 | Primary Drivers |
| Credit funds | $ | 35.9 |
| Nine direct lending funds with $8.3 billion of IGAUM as of June 30, 2019 generating returns in excess of their hurdle rates. Ares Capital Europe III, L.P. (“ACE III”) and Ares Capital Europe IV, L.P. (“ACE IV”) generated $6.8 million and $7.2 million of carried interest allocation during the period, respectively | | $ | 72.7 |
| Nine direct lending funds with $9.3 billion of IGAUM as of June 30, 2019 generating returns in excess of their hurdle rates. ACE III and ACE IV generated $20.0 million and $19.7 million of carried interest allocation during the period, respectively |
| Private equity funds | 65.0 |
| Increased fair value of Ares Corporate Opportunities Fund IV, L.P.'s (“ACOF IV”) investment in a portfolio company resulting from a pending sale of the company | | 209.1 |
| Market appreciation of Ares Corporate Opportunities Fund III, L.P.'s (“ACOF III”) investment in Floor & Decor Holdings, Inc.(“Floor & Decor”); increased fair value of ACOF IV's investment in a portfolio company resulting from a pending sale of the company; and market appreciation across multiple ACOF IV portfolio companies |
| Real estate funds | 18.8 |
| Market appreciation from multiple properties within three of our U.S. real estate equity funds, Ares European Real Estate Fund IV L.P. (“EF IV”) and certain European real estate equity funds | | 35.2 |
| Market appreciation from multiple properties within four of our U.S. real estate equity funds, EF IV and two European real estate equity funds |
| Carried interest allocation | $ | 119.7 |
| | | $ | 317.0 |
| |
|
| | | | | | | | | |
| | Three Months Ended June 30, 2018 | Primary Drivers | | Six Months Ended June 30, 2018 | Primary Drivers |
| Credit funds | $ | 25.4 |
| Seven direct lending funds with $4.5 billion of IGAUM as of June 30, 2018 generating returns in excess of their hurdle rates. ACE III generated $12.1 million of carried interest allocation during the period | | $ | 41.5 |
| Seven direct lending funds with $4.5 billion of IGAUM as of June 30, 2018 generating returns in excess of their hurdle rates. ACE III generated $22.8 million of carried interest allocation during the period |
| Private equity funds | (53.2 | ) | Reduction of fair value of an ACOF IV industrial portfolio company and market depreciation of ACOF III's investment in Floor & Decor | | (27.7 | ) | Reductions of fair value of an ACOF IV industrial portfolio company and an Ares Energy Investors Fund V, L.P. (“EIF V”) asset; offset by market appreciation of ACOF III's investment in Floor & Decor |
| Real estate funds | 14.4 |
| Market appreciation from multiple properties within four of our U.S. real estate equity funds and EF IV | | 26.9 |
| Market appreciation from multiple properties within six of our U.S. real estate equity funds, EF IV and a certain European real estate equity fund |
| Carried interest allocation | $ | (13.4 | ) | | | $ | 40.7 |
| |
Incentive Fees. Incentive fees increased by $2.5 million, or 32%, for the three months ended June 30, 2019 compared to the three months ended June 30, 2018 and by $14.2 million, or 111%, for the six months ended June 30, 2019 compared to the six
months ended June 30, 2018. The increases were primarily driven by direct lending funds that did not generate incentive fees in the prior periods but generated returns in excess of hurdle rates in the current year periods.
Principal Investment Income. Principal investment income increased by $4.0 million to $5.8 million for the three months ended June 30, 2019 compared to the three months ended June 30, 2018 and by $27.8 million to $34.6 million for the six months ended June 30, 2019 compared to the six months ended June 30, 2018. The increase for the three month comparative period was primarily driven byincluded gains from a higher fair value of our investment in ACOF IV as a result of athe pending sale of ACOF IV's investment in a portfolio company.NVA, which closed in the first quarter of 2020. The increase for the six month comparative period was primarily driven bymonths ended June 30, 2019 also included gains from a higher fair value of our investment in ACOF III as a result of market appreciation of Floor & Decor, which benefited from the general equity market rebound during 2019 and by a higher fair value of our investment in ACOF IV as a result of a pending sale of ACOF IV's investment in a portfolio company.FND.
Administrative, Transaction and Other Fees.
Administrative fees and other fees decreased by $2.8 million, or 20%, for the three months ended June 30, 2019 compared to the three months ended June 30, 2018 and by $5.6 million, or 21%, for the six months ended June 30, 2019 compared to the six months ended June 30, 2018. The decreases for the comparative periods were primarily driven by fewer transaction-based fees based on loan originations within certain funds in our Credit Group that will fluctuate periodically with the volume of syndicated loan originations and with the amount of capital available for deployment.
Expenses
Compensation and Benefits. Compensation and benefits expenses increased by $23.2$23.0 million, or 17%14%, for the three months ended June 30, 20192020 compared to the three months ended June 30, 20182019 and by $45.4$46.2 million, or 17%14%, for the six months ended June 30, 20192020 compared to the six months ended June 30, 2018.2019. The increases were primarily driven by higher incentive compensation attributable to management fee growth, 7% headcount growth, merit increases in ARCC Part I Feesand equity compensation of $5.8 million and $11.7 millionincreases for the three and six month comparative periods, respectively, and increases in equity compensation.periods.
Equity compensation expense increased by $1.5$4.7 million and $8.0$9.7 million for the three and six month comparative periods primarily due to additional restricted units granted as part of our annual bonus program and to certain retention awards, including new restricted units granted to our Chief Executive Officer subsequent to June 30, 2018. Additionally, our annual equity compensation bonus program commenced in 2016 with awards scheduled to vest over a four year service period. As such, equity compensation expense for the three and six months ended June 30, 2020 compared to the six months ended June 30, 2019, reflects expenses associated with four yearsrespectively, primarily due to an increase from discretionary merit-based awards of bonus grants, whereas equity compensation expense$4.8 million and $8.8 million for the three and six months ended June 30, 2018 reflected only three yearsmonth comparative period. Additional expense incurred from restricted units awarded as part of the annual bonus grants.program is offset by the run-off of expense from the non-recurring initial public offering awards. The increase for the six month period also included $3.7 million of accelerated expense from the vesting of certain restricted units granted to our Chief Executive Officer as a result of the achievement of the first performance condition.
Performance Related Compensation. Performance related compensation increased by $105.7$144.4 million, to $92.7 millionor 156%, for the three months ended June 30, 20192020 compared to the three months ended June 30, 20182019 and decreased by $236.3$180.0 million, to $249.2 millionor 72%, for the six months ended June 30, 20192020 compared to the six months ended June 30, 2018.The increases2019. Changes in performance related compensation are largely correlateddirectly associated with the respective increaseschanges in carried interest allocation and incentive fees.fees described above.
General, Administrative and Other Expenses. General, administrative and other expenses increaseddecreased by $5.5$7.3 million, or 9%11%, for the three months ended June 30, 20192020 compared to the three months ended June 30, 20182019 and increased by $12.2$3.8 million, or 12%3%, for the six months ended June 30, 20192020 compared to the six months ended June 30, 2018.2019. The increasesthree and six month comparative periods were primarily drivenboth impacted by higherthe COVID-19 pandemic and resulted in a decrease in certain operating expenses. During the second quarter of 2020, our operating expenses were impacted by limitations in certain business activities,
most notably travel and marketing, and by office services and fringe benefits from the modified remote working environment. Collectively, these expenses decreased by $6.0 million during the second quarter of 2020.
Certain expenses have increased during the current period, including occupancy costs to support our growing headcount, and placement fees, information services and marketing costs to support the expansion of $11.7our business. Placement fees increased by $5.5 million primarily due to new commitments to our third U.S. opportunistic real estate equity fund. To support our modified remote working environment, we also incurred additional information technology and communication expenses that increased by $2.0 million and $11.2$3.2 million for the three and six month comparative periods, respectively, largely from fees associated with the launch of a fund in our special opportunities strategy. Additionally, we recognized higher professional service fees of $5.2 million and $9.0 million for the three and six month comparative periods, respectively, largely as a result of professional services related to due diligence, marketing and legal expenses related to the expansion of our existing insurance platform. The prior year periods include an $11.8 million one-time reimbursement to ARCC for certain rent and utilities for the first quarter of 2018 and the yearsmonths ended 2017, 2016, 2015 and 2014. Beginning inJune 30, 2020, respectively.
During the second quarter of 2018,2020, we began to incur certain expenses that were previously incurred by ARCC. These expenses resulted in approximately $3.5received insurance proceeds of $2.5 million in recurring occupancy and marketing related expenses forconnection with the previously disclosed SEC matter. For the six months ended June 30, 2019.2020, we recorded net expenses of $1.0 million in connection with this matter that included a civil penalty of $1.0 million.
While the timing of recovery is uncertain, we expect that future periods will continue to be impacted similarly until we return to pre-pandemic working conditions.
Expenses of the Consolidated Funds.Net Realized and Unrealized Gains (Losses) on Investments. Expenses of the Consolidated FundsNet realized and unrealized gains (losses) on investments decreased by $19.7$0.2 million, or 56%44%, for the three months ended June 30, 20192020 compared to the three months ended June 30, 20182019 and by $16.4$11.7 million or 45%,to a $7.7 million loss for the six months ended June 30, 20192020 compared to the six months ended June 30, 2018.2019. The decreases were primarily driven by higher professional fees incurred during the prior year periods as a result of CLO debt issuances during those periods. These fees were expensed in the period incurred, as CLO debt is recorded at fair value on our Consolidated Statements of Financial Condition.
Other Income (Expense)
When evaluating the changes in other income (expense), we separately analyze the other income generated by the Company from the investment returns generated by our Consolidated Funds.
Net realized and unrealized gain on investments. Net realized and unrealized gain on investments decreased by $2.7 million, or 84%,activity for the three months ended June 30, 2019 compared2020 wasprimarily attributable to unrealized gains from an insurance-related investment in a private fund managed by a third party and CLO securities due to prices rebounding from the three months ended June 30, 2018 and increasedmarket lows that were driven by $1.6 million, or 65%,the COVID-19 pandemic, offset by unrealized losses from market depreciation of properties held by an investment vehicle in our U.S. real estate equity strategy. The activity for the six months ended June 30, 2019 compared to the six months ended June 30, 2018. The decrease for the three month comparative periods2020 was primarily dueattributable to net gains onlosses from CLO securities driven by the COVID-19 pandemic and market depreciation of properties within funds in our non-core investments recognized duringU.S. real estate equity strategy. The activity in the prior year period. The increase for the six month comparative periods was primarily dueattributable to higher net gains on our CLO investments,securities, which benefited from favorable market conditions during the current year period.conditions.
Interest and Dividend Income.Expense Interest and dividend income decreased by $0.7 million, or 30%, for the three months ended June 30, 2019 compared to the three months ended June 30, 2018 and by $2.2 million, or 39%, for the six months ended June 30, 2019 compared to the six months ended June 30, 2018. During the second quarter of 2018, we sold $219.3 million of our investments in our CLO securities primarily resulting in a decrease in interest income attributable to CLO securities for the comparative periods.
Interest Expense. . Interest expense decreasedincreased by $0.3 million, or 5%, for the three months ended June 30, 20192020 compared to the three months ended June 30, 20182019. The issuance of the 2030 Senior Notes late in the second quarter of 2020 increased interest expense by $0.6 million and is expected to result in additional interest expense of $3.3 million per quarter prospectively.
Other Income, Net. Other income, net is principally composed of transaction gains (losses) associated with currency fluctuations for our businesses domiciled outside of the U.S. and is based on the fluctuations in currency rates primarily between the U.S. dollar against the British pound and the Euro.
Income Tax Expense. Income tax expense increased by $1.6$14.9 million, or 12%157%, for the three months ended June 30, 2020 compared to the three months ended June 30, 2019 and decreased by $20.1 million, or 84%, for the six months ended June 30, 20192020 compared to the six months ended June 30, 2018. The decreases for the comparative periods were primarily driven by the pay off2019.Income taxes are a result of term loans we had entered intonet income allocable to finance certain investments in CLOs during the second quarter of 2018.
Other income (expense), net. Other income (expense), net increased from other expense, net of $2.0 million and $2.3 million for three and six months ended June 30, 2018, respectively, to other income, net of $4.8 million and $0.3 million for the three and six months ended June 30, 2019. The increases were primarily driven by transaction gains from the revaluation of certain assets and liabilities denominated in foreign currencies for the three and six months ended June 30, 2019. The transaction gains were primarily due to the strengthening of the U.S. dollar against the British pounds sterlingAres Management Corporation and the Euro.
Net realizedapplicable statutory tax rate and unrealized gain (loss) on investments of Consolidated Funds. Net realized and unrealized gain (loss) on investments of Consolidated Funds decreased from net realized and unrealized gain on investments of Consolidated Funds of $34.5 million for three months ended June 30, 2018 to net realized and unrealized loss on investments of Consolidated Funds of $0.1 million. Net realized and unrealized gain on investments of Consolidated Funds decreased by $17.2 million, or 80%, for the six months ended June 30, 2019 compared to the six months ended June 30, 2018. The decreases for the comparative periods were primarily due to lower market prices for certain investments in our Asian private equity fund during the current year periods.
Interest and Other Income of the Consolidated Funds. Interest and other income of the Consolidated Funds increased by $9.6 million, or 10%, for the three months ended June 30, 2019 compared to the three months ended June 30, 2018 and by $38.3 million, or 24%, for the six months ended June 30, 2019 compared to the six months ended June 30, 2018. The increases were primarily driven by additional interest paying assets from four CLOs that we began consolidating subsequent to June 30, 2018 resulting in an increase in interest income for the comparative periods.
Interest Expense of the Consolidated Funds. Interest expense of the Consolidated Funds increased by $11.3 million, or 20%, for the three months ended June 30, 2019 compared to the three months ended June 30, 2018 and by $31.7 million, or 31%, for the six months ended June 30, 2019 compared to the six months ended June 30, 2018. The increases were primarily the result of interest expense from the debt issued for four CLOs we began consolidating subsequent to June 30, 2018 resulting in an increase in interest expense for the comparative periods.
Income tax expense. Income tax expense decreased by $27.4 million, or 74%, for the three months ended June 30, 2019 compared to the three months ended June 30, 2018 and decreased by $0.6 million, or 3%, for the six months ended June 30, 2019 compared to the six months ended June 30, 2018. The decreases in income tax expense were primarily driven by two significant one-time deferred tax items related to our election to be taxed ashave a corporation for U.S. federal income tax purposes during 2018. Income tax expense for the three months ended June 30, 2018 included a $28.9 million valuation allowance recorded during the period against a deferred tax asset, which was established during the three months ended March 31, 2018, effectively eliminating anydirect impact on income tax expense for the six months ended June 30, 2018. The decrease inour effective tax rate for the six months ended June 30, 2019 compared to the six months ended June 30, 2018 was primarily driven by one-time deferred tax items from the embedded net unrealized gains of both carried interest and the investment portfolio that were not subject to corporate taxes prior to our election to be taxed as a corporation for U.S. federal income tax purposes during 2018.rate.
Non-Controlling Interests. Net income (loss) attributable to non-controlling interests in Ares Operating Group entities represents results attributable to the owners of AOG Units that are not held by Ares Management Corporation andCorporation. Net income (loss) is generally allocated based on the weighted average daily ownership of the other AOG unitholders. unitholders, except for income (loss) generated from certain joint venture partnerships. Net income (loss) is allocated to other strategic distribution partners with whom we have established joint ventures based on the respective ownership percentages and to Crestline Denali Class B membership interests based on the activity of those financial interests.
Net income (loss) attributable to non-controlling interests in Ares Operating Group entities increased by $40.7 million, or 118%, for the three months ended June 30, 2020 compared to the three months ended June 30, 2019 and decreased by $96.6 million to a $3.2 million loss for the six months ended June 30, 2020 compared to the six months ended June 30, 2019. The changes in the comparative periods are a result of the respective changes in income (loss) before taxes and weighted average daily ownership.
The weighted average daily ownership for the non-controlling AOG unitholders decreased from 55.1% and 57.5% for the three and six months ended June 30, 2018 to 52.6% and 52.9% for the three and six months ended June 30, 2019.2019 to 46.3% and 47.9% for the three and six months ended June 30, 2020. The decreases in non–controlling ownership were primarily driven by the issuance of Class A common stock in connection with stock option exercises, duringvesting of restricted stock awards and by our offering that occurred after June 30, 2019. For the three and six months ended June 30, 20192020, net income of $4.3 million and by vestingsnet loss of restricted stock awards during$15.3 million, respectively, was also allocated to the Crestline Denali Class B membership interests attributable to the gains and losses from those CLO securities held.
Consolidated Results of Operations of the Consolidated Funds
The following table presents the results of operations of the Consolidated Funds:
| | | | | | | | | | | | | | | | | | | | | | | | | | | | | | | | | | | | | | | | | | | | | | | | | | | | | | | | |
| | | | | | | | | | | | | | | | | | | | | | |
| | | Three months ended June 30, | | | | Favorable (Unfavorable) | | | | Six months ended June 30, | | | | | | Favorable (Unfavorable) | | | | | | |
| | 2020 | | 2019 | | $ Change | | % Change | | 2020 | | 2019 | | | | $ Change | | % Change | | | | |
| Expenses of the Consolidated Funds | | $ | (3,244) | | | $ | (15,427) | | | $ | 12,183 | | | (79) | % | | $ | (10,687) | | | $ | (19,981) | | | | | $ | 9,294 | | | (47) | % | | | | |
| Net realized and unrealized gains (losses) on investments of Consolidated Funds | | 83,522 | | | (116) | | | 83,638 | | | NM | | (171,239) | | | 4,248 | | | | | (175,487) | | | NM | | | | |
| Interest and other income of Consolidated Funds | | 116,314 | | | 102,206 | | | 14,108 | | | 14 | | | 229,539 | | | 195,390 | | | | | 34,149 | | | 17 | | | | | |
| Interest expense of Consolidated Funds | | (76,297) | | | (68,005) | | | (8,292) | | | 12 | | | (156,538) | | | (132,917) | | | | | (23,621) | | | 18 | | | | | |
| Income (loss) before taxes | | 120,295 | | | 18,658 | | | 101,637 | | | NM | | (108,925) | | | 46,740 | | | | | (155,665) | | | NM | | | | |
| Income tax expense (benefit) of Consolidated Funds | | (2) | | | 267 | | | (269) | | | NM | | (30) | | | 846 | | | | | (876) | | | NM | | | | |
| Net income (loss) | | 120,293 | | | 18,925 | | | 101,368 | | | NM | | (108,955) | | | 47,586 | | | | | (156,541) | | | NM | | | | |
| Less: Revenues attributable to Ares Management Corporation eliminated upon consolidation | | 25,151 | | | 9,220 | | | 15,931 | | | 173 | | | (10,340) | | | 19,200 | | | | | (29,540) | | | NM | | | | |
| Less: Other income (expense), net attributable to Ares Management Corporation eliminated upon consolidation | | 9,956 | | | 1,359 | | | 8,597 | | | NM | | (17,395) | | | 2,416 | | | | | (19,811) | | | NM | | | | |
| Net income (loss) attributable to non-controlling interests in Consolidated Funds | | $ | 85,186 | | | $ | 8,346 | | | 76,840 | | | NM | | $ | (81,220) | | | $ | 25,970 | | | | | (107,190) | | | NM | | | | |
NM - Not Meaningful
The results of operations of the Consolidated Funds primarily represents activity from certain CLOs that we are deemed to have a controlling financial interest. Expenses primarily reflect professional fees that were incurred as a result of debt issuance costs related to the issuance of new CLOs. These fees were expensed in the period incurred, as CLO debt is recorded at fair value on our Consolidated Statements of Financial Condition. For the six months ended June 30, 2019.
Net income attributable to non-controlling interests in Ares Operating Group entities increased2020, the expenses were primarily driven by $18.3 million, or 114%, forthe issuance of a new European CLO. For the three months ended June 30, 2019 compared to the three months ended June 30, 2018 and by $44.2 million, or 90%, for the six months ended June 30, 2019, comparedthe expenses were primarily driven by the issuance of a European CLO and a U.S. CLO. Net realized and unrealized gains fluctuated for the comparative periods, primarily due to a significant change in the value of loans held by the CLOs. The CSLLI returned 9.7% and a negative 4.8% for the second quarter and year-to-date period for 2020, respectively, primarily due to the six months endeduncertainty associated with the COVID-19 pandemic. The increase in interest and other income and in interest expense was attributable to the net increase of seven additional CLOs that we began consolidating subsequent to June 30, 2018 .2019, resulting in additional interest paying loans and interest expense from debt issued.
Revenues and other income (expense) attributable to Ares Management Corporation represents management fees, incentive fees, principal investment income and administrative, transaction and other fees that are eliminated from the respective components of Ares Management Corporation's results upon consolidation. The increases weredecrease for the three and six month comparative periods for other income (expense) was primarily a resultdue to the price fluctuations associated with the COVID-19 pandemic mentioned above. The decrease was partially offset by management fees that increased due to the net increase of net income increasing at a greater rate thansix consolidated CLOs and private funds and to administrative fees that increased due to the decrease in non-controlling interests in Ares Operating Group entities.renegotiation of an administrative fee agreement with ACF FinCo I L.P. during the third quarter of 2019. The renegotiated administration fee allowed for more operating expenses to be reimbursed but eliminated the management fee paid by the fund to us.
Segment Analysis
For segment reporting purposes, revenues and expenses are presented on a basis before giving effect to the results of our Consolidated Funds. As a result, segment revenues from management fees, performance income and investment income are greaterdifferent than those presented on a consolidated basis in accordance with GAAP because revenues recognized from Consolidated Funds are eliminated in consolidation. Furthermore, expenses and the effects of other income (expense) are different than related amounts presented on a consolidated basis in accordance with GAAP due to the exclusion of the results of Consolidated Funds.
Discussed below are our results of operations for each of our three reportable segments. In addition to the three segments, weWe separately discuss the OMG. This information is used by our management to make operating decisions, assess performance and allocate resources.
FRE, RI and Other Measures
FRE and RI are non‑GAAPnon-GAAP financial measures our management uses when making resource deployment decisions and in assessing performance of our segments. For definitions of each of these non-GAAP financial measures see the Glossary. The following table sets forth FRE and RI by segment for the three and six months ended June 30, 2019 and 2018 ($ in thousands):
| | | | | | | | | | | | | | | | | | | | | | | | | | | | | | | | | | | | | | | | | | | | | | | | | | |
| | | | | | | | | | | | | | | | |
| | | Three months ended June 30, | | | | Favorable (Unfavorable) | | | | Six months ended June 30, | | | | Favorable (Unfavorable) | | |
| | 2020 | | 2019 | | $ Change | | % Change | | 2020 | | 2019 | | $ Change | | % Change |
| Fee Related Earnings: | | | | | | | | | | | | | | | | |
| Credit Group | | $ | 115,600 | | | $ | 97,940 | | | $ | 17,660 | | | 18 | % | | $ | 229,857 | | | $ | 190,119 | | | $ | 39,738 | | | 21 | % |
| Private Equity Group | | 26,852 | | | 25,959 | | | 893 | | | 3 | | | 53,890 | | | 52,102 | | | 1,788 | | | 3 | |
| Real Estate Group | | 7,497 | | | 6,991 | | | 506 | | | 7 | | | 17,037 | | | 13,234 | | | 3,803 | | | 29 | |
| Operations Management Group | | (52,992) | | | (53,868) | | | 876 | | | 2 | | | (110,723) | | | (107,161) | | | (3,562) | | | (3) | |
| Fee Related Earnings | | $ | 96,957 | | | $ | 77,022 | | | 19,935 | | | 26 | | | $ | 190,061 | | | $ | 148,294 | | | 41,767 | | | 28 | |
| Realized Income: | | | | | | | | | | | | | | | | |
| Credit Group | | $ | 119,781 | | | $ | 106,748 | | | $ | 13,033 | | | 12 | % | | $ | 237,172 | | | $ | 210,053 | | | $ | 27,119 | | | 13 | % |
| Private Equity Group | | 40,714 | | | 31,544 | | | 9,170 | | | 29 | | | 101,621 | | | 75,568 | | | 26,053 | | | 34 | |
| Real Estate Group | | 8,142 | | | 10,303 | | | (2,161) | | | (21) | | | 28,227 | | | 21,280 | | | 6,947 | | | 33 | |
| Operations Management Group | | (53,389) | | | (54,284) | | | 895 | | | 2 | | | (117,627) | | | (107,958) | | | (9,669) | | | (9) | |
| Realized Income | | $ | 115,248 | | | $ | 94,311 | | | 20,937 | | | 22 | | | $ | 249,393 | | | $ | 198,943 | | | 50,450 | | | 25 | |
|
| | | | | | | | | | | | | | | | | | | | | | | | | | | | | |
| | Three Months Ended | | Favorable (Unfavorable) | | Six Months Ended | | Favorable (Unfavorable) |
| | June 30, | | | June 30, | |
| | 2019 | | 2018 | | $ Change | | % Change | | 2019 | | 2018 | | $ Change | | % Change |
| Fee Related Earnings: | | | | | | | | | | | | | | | |
| Credit Group | $ | 97,940 |
| | $ | 79,160 |
| | $ | 18,780 |
| | 24 | % | | $ | 190,119 |
| | $ | 156,108 |
| | $ | 34,011 |
| | 22 | % |
| Private Equity Group | 25,959 |
| | 26,808 |
| | (849 | ) | | (3 | )% | | 52,102 |
| | 53,795 |
| | (1,693 | ) | | (3 | )% |
| Real Estate Group | 6,991 |
| | 5,986 |
| | 1,005 |
| | 17 | % | | 13,234 |
| | 11,091 |
| | 2,143 |
| | 19 | % |
| Operations Management Group | (53,868 | ) | | (49,916 | ) | | (3,952 | ) | | (8 | )% | | (107,161 | ) | | (98,499 | ) | | (8,662 | ) | | (9 | )% |
| Fee Related Earnings | $ | 77,022 |
| | $ | 62,038 |
| | 14,984 |
| | 24 | % | | $ | 148,294 |
| | $ | 122,495 |
| | 25,799 |
| | 21 | % |
| Realized Income: | | | | |
| |
|
| | | | | |
| |
|
|
| Credit Group | $ | 106,748 |
| | $ | 97,289 |
| | 9,459 |
| | 10 | % | | $ | 210,053 |
| | $ | 175,507 |
| | 34,546 |
| | 20 | % |
| Private Equity Group | 31,544 |
| | 53,408 |
| | (21,864 | ) | | (41 | )% | | 75,568 |
| | 80,735 |
| | (5,167 | ) | | (6 | )% |
| Real Estate Group | 10,303 |
| | 6,479 |
| | 3,824 |
| | 59 | % | | 21,280 |
| | 20,148 |
| | 1,132 |
| | 6 | % |
| Operations Management Group | (54,284 | ) | | (49,122 | ) | | (5,162 | ) | | (11 | )% | | (107,958 | ) | | (96,263 | ) | | (11,695 | ) | | (12 | )% |
| Realized Income | $ | 94,311 |
| | $ | 108,054 |
| | (13,743 | ) | | (13 | )% | | $ | 198,943 |
| | $ | 180,127 |
| | 18,816 |
| | 10 | % |
Reconciliation of Certain Non-GAAPConsolidated GAAP Financial Measures to Consolidated GAAP FinancialCertain Non-GAAP Measures
Income before provision for income taxes is the GAAP financial measure most comparable to RI and FRE. The following table presents the reconciliation of income before taxes as reported in the Condensed Consolidated Statements of Operations to RI and FRE (in($ in thousands):
| | | | | | | | | | | | | | | | | | | | | | | |
| Three months ended June 30, | | | | Six months ended June 30, | | |
| 2020 | | 2019 | | 2020 | | 2019 |
| Income (loss) before taxes | $ | 241,097 | | | $ | 84,383 | | | $ | (55,316) | | | $ | 220,343 | |
| Adjustments: | | | | | | | |
| Depreciation and amortization expense | 6,319 | | | 5,221 | | | 11,861 | | | 11,045 | |
| Equity compensation expense | 28,683 | | | 24,029 | | | 61,240 | | | 51,581 | |
| Acquisition and merger-related expense | 3,188 | | | 4,207 | | | 6,325 | | | 5,980 | |
| Deferred placement fees | 10,320 | | | 12,432 | | | 15,735 | | | 12,953 | |
| Other expense, net | — | | | 2 | | | — | | | 1 | |
| Net (income) expense of non-controlling interests in consolidated subsidiaries | (3,750) | | | 933 | | | 16,747 | | | 1,809 | |
| (Income) loss before taxes of non-controlling interests in Consolidated Funds, net of eliminations | (85,188) | | | (8,079) | | | 81,190 | | | (25,124) | |
| Unconsolidated performance (income) loss - unrealized | (257,303) | | | (98,662) | | | 130,354 | | | (245,237) | |
| Unconsolidated performance related compensation - unrealized | 200,064 | | | 67,459 | | | (85,828) | | | 174,762 | |
| Unconsolidated net investment (income) loss - unrealized | (28,182) | | | 2,386 | | | 67,085 | | | (9,170) | |
| Realized Income | 115,248 | | | 94,311 | | | 249,393 | | | 198,943 | |
| Unconsolidated performance income-realized | (44,625) | | | (35,994) | | | (196,395) | | | (104,567) | |
| Unconsolidated performance related compensation - realized | 37,044 | | | 25,229 | | | 155,037 | | | 74,446 | |
| Unconsolidated investment income-realized | (10,710) | | | (6,524) | | | (17,974) | | | (20,528) | |
| Fee Related Earnings | $ | 96,957 | | | $ | 77,022 | | | $ | 190,061 | | | $ | 148,294 | |
|
| | | | | | | | | | | | | | | |
| | For the Three Months Ended
June 30, | | For the Six Months Ended
June 30, |
| | 2019 | | 2018 | | 2019 | | 2018 |
| Income before taxes | $ | 84,383 |
| | $ | 51,072 |
| | $ | 220,343 |
| | $ | 113,118 |
|
| Adjustments: | | | | | | | |
| Depreciation and amortization expense | 5,221 |
| | 7,711 |
| | 11,045 |
| | 14,887 |
|
| Equity compensation expense | 24,029 |
| | 22,507 |
| | 51,581 |
| | 43,594 |
|
| Acquisition and merger-related expense | 4,207 |
| | 47 |
| | 5,980 |
| | (272 | ) |
| Unamortized placement fees | 12,432 |
| | 1,852 |
| | 12,953 |
| | 3,516 |
|
| Other expense, net | 2 |
| | 13,554 |
| | 1 |
| | 13,561 |
|
| Expense of non-controlling interests in consolidated subsidiaries | 933 |
| | 719 |
| | 1,809 |
| | 1,359 |
|
| Income before taxes of non-controlling interests in Consolidated Funds, net of eliminations | (8,079 | ) | | (9,951 | ) | | (25,124 | ) | | (10,318 | ) |
| Unconsolidated performance income - unrealized | (98,662 | ) | | 124,343 |
| | (245,237 | ) | | 89,225 |
|
| Unconsolidated performance related compensation - unrealized | 67,459 |
| | (100,886 | ) | | 174,762 |
| | (89,877 | ) |
| Unconsolidated net investment (income) loss - unrealized | 2,386 |
| | (2,914 | ) | | (9,170 | ) | | 1,334 |
|
| Realized Income | 94,311 |
| | 108,054 |
| | 198,943 |
| | 180,127 |
|
| Unconsolidated performance income - realized | (35,994 | ) | | (122,608 | ) | | (104,567 | ) | | (145,715 | ) |
| Unconsolidated performance related compensation - realized | 25,229 |
| | 87,881 |
| | 74,446 |
| | 102,750 |
|
| Unconsolidated net investment income - realized | (6,524 | ) | | (11,289 | ) | | (20,528 | ) | | (14,667 | ) |
| Fee Related Earnings | $ | 77,022 |
| | $ | 62,038 |
| | $ | 148,294 |
| | $ | 122,495 |
|
Results of Operations by Segment
Credit Group—Three and Six Months Ended June 30, 20192020 Compared to Three and Six Months Ended June 30, 20182019
Fee Related Earnings:
The following table presents the components of the Credit Group's FRE and the changes forfrom the comparative periodsprior year ($ in thousands):
| | | | | | | | | | | | | | | | | | | | | | | | | | | | | | | | | | | | | | | | | | | | | | | |
| | Three months ended June 30, | | | | Favorable (Unfavorable) | | | | Six months ended June 30, | | | | Favorable (Unfavorable) | | |
| 2020 | | 2019 | | $ Change | | % Change | | 2020 | | 2019 | | $ Change | | % Change |
| Management fees (includes ARCC Part I Fees of $41,306, $85,229 and $39,157, $77,550 for the three and six months ended June 30, 2020 and 2019, respectively) | $ | 200,788 | | | $ | 172,347 | | | $ | 28,441 | | | 17 | % | | $ | 398,225 | | | $ | 335,313 | | | $ | 62,912 | | | 19 | % |
| Other fees | 4,101 | | | 3,939 | | | 162 | | | 4 | | | 7,159 | | | 7,005 | | | 154 | | | 2 | |
| Compensation and benefits | (76,765) | | | (64,965) | | | (11,800) | | | (18) | | | (147,690) | | | (125,313) | | | (22,377) | | | (18) | |
| General, administrative and other expenses | (12,524) | | | (13,381) | | | 857 | | | 6 | | | (27,837) | | | (26,886) | | | (951) | | | (4) | |
| Fee Related Earnings | $ | 115,600 | | | $ | 97,940 | | | 17,660 | | | 18 | | | $ | 229,857 | | | $ | 190,119 | | | 39,738 | | | 21 | |
|
| | | | | | | | | | | | | | | | | | | | | | | | | | | | | |
| | Three Months Ended June 30, | | Favorable (Unfavorable) | | Six Months Ended June 30, | | Favorable (Unfavorable) |
| | | | |
| | 2019 | | 2018 | | $ Change | | % Change | | 2019 | | 2018 | | $ Change | | % Change |
| Management fees (includes ARCC Part I Fees of $39,157, $77,550 and $29,866, $58,283 for the three and six months ended June 30, 2019 and 2018, respectively) | $ | 172,347 |
| | $ | 135,848 |
| | $ | 36,499 |
| | 27 | % | | $ | 335,313 |
| | $ | 267,614 |
| | $ | 67,699 |
| | 25 | % |
| Other fees | 3,939 |
| | 6,877 |
| | (2,938 | ) | | (43 | )% | | 7,005 |
| | 12,607 |
| | (5,602 | ) | | (44 | )% |
| Compensation and benefits | (64,965 | ) | | (52,271 | ) | | (12,694 | ) | | (24 | )% | | (125,313 | ) | | (102,965 | ) | | (22,348 | ) | | (22 | )% |
| General, administrative and other expenses | (13,381 | ) | | (11,294 | ) | | (2,087 | ) | | (18 | )% | | (26,886 | ) | | (21,148 | ) | | (5,738 | ) | | (27 | )% |
| Fee Related Earnings | $ | 97,940 |
| | $ | 79,160 |
| | 18,780 |
| | 24 | % | | $ | 190,119 |
| | $ | 156,108 |
| | 34,011 |
| | 22 | % |
Management Fees
Fees. The chartschart below presentpresents Credit Group management fees and effective management fee rates ($ in millions):
Management fees on existing direct lending funds increased with deployment from ACE IV, PCS and Ares Senior Direct Lending Fund L.P. (“SDL”) collectively generating additional fees of $7.9 million and $20.0 million for the three and six months ended June 30, 2020 compared to the three and six months ended June 30, 2019, respectively. Management fees from ARCC increased $2.6 million and $9.0 million over the respective periods primarily due to an increase in the average size of
ARCC's portfolio, driven by an increase in leverage that became available at the end of the second quarter of 2019. ARCC Part I Fees increased primarily due to the expiration of the $10 million quarterly fee waiver at the end of the third quarter of 2019 and was partially offset by a reduction in ARCC's net investment income driven by a decrease in new commitments. The volatility and disruption to the global economy from the COVID-19 pandemic has affected the pace of investment activity.
The decreases in effective management fee rates for the three and six months ended June 30, 2019 ($ in millions):
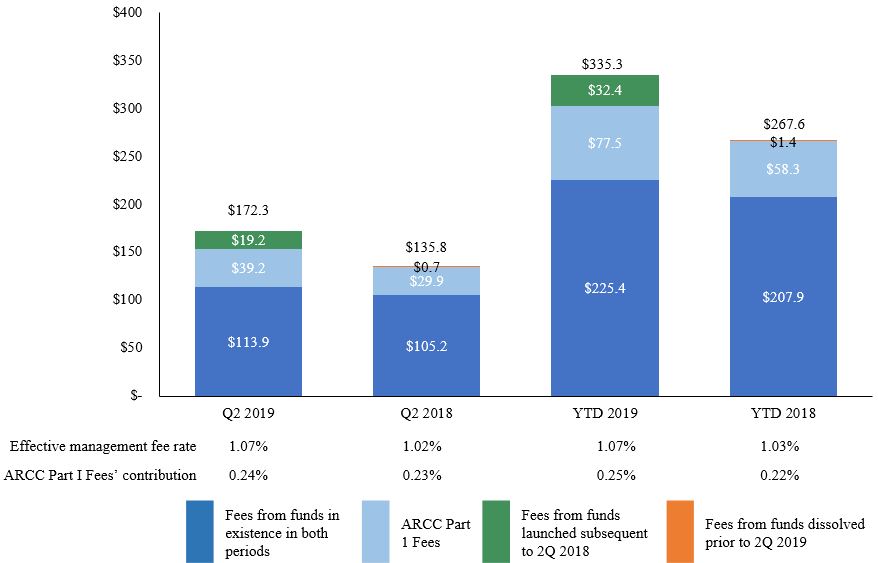
The increases in management fees were primarily driven by the following: (i) higher ARCC Part I Fees primarily due to increases in interest income from a higher average size and weighted average yield of ARCC's portfolio and due to increases in capital structuring service fees, which were primarily the result of a higher number of transactions with larger portfolio companies in larger issuances; (ii) additional capital deployment within funds in existence in both periods; (iii) the formation of 29 new funds subsequent to June 30, 2018 with FPAUM of $11.4 billion as of June 30, 2019, and (iv) offset by the liquidation of five funds subsequent to June 30, 2018 with FPAUM of $0.8 billion as of June 30, 2018. CLOs accounted for approximately 9.7% of the Credit Group's management fees for the three and six months ended June 30, 2019 and for approximately 10.0% of the Credit Group's management fees for the three and six months ended June 30, 2018.
The increases in the effective management fee rate were primarily due to increased ARCC Part I Fees and to new direct lending funds with higher effective fee rates for the three and six months ended June 30, 20192020 compared to the three and six months ended June 30, 2018.
Other Fees. Other fees decreased by $2.9 million, or 43%, for the three months ended June 30, 2019 compared to the three months ended June 30, 2018 and by $5.6 million, or 44%, for the six months ended June 30, 2019 compared to the six months ended June 30, 2018. The decreases were primarily driven by fewer transaction-based fees based on loan originations withinnew U.S. CLOs that have fee rates below 0.50% and deployment in certain direct lending and alternative credit funds that will fluctuate periodically with the volume of syndicated loan originations and with the amount of capital available for deployment.have fee rates below 1.00%.
Compensation and Benefits. Compensation and benefits expenses increased by $12.7$11.8 million, or 24%18%, for the three months ended June 30, 20192020 compared to the three months ended June 30, 20182019 and by $22.3$22.4 million, or 22%18%, for the six months ended June 30, 20192020 compared to the six months ended June 30, 2018.2019. The increases were primarily driven by higher compensation in connection with higher management fees for the comparative periods, 10% headcount growth and by increases in ARCC Part I Fees compensation of $5.8 million and $11.7 million for the three and six month comparative periods, respectively. We continue
to hireas we hired investment professionals to support our growing U.S. and European direct lending FPAUM, which increased by 33% for the comparative periods.and alternative credit platforms.
General, Administrative and Other Expenses. General, administrative and other expenses increaseddecreased by $2.1$0.9 million, or 18%6%, for the three months ended June 30, 20192020 compared to the three months ended June 30, 20182019 and increased by $5.7$1.0 million, or 27%4%, for the six months ended June 30, 20192020 compared to the six months ended June 30, 2018. Beginning2019. The three and six month comparative periods were both impacted by the COVID-19 pandemic and resulted in a decrease in certain operating expenses. During the second quarter of 2018, we began to incur2020, our operating expenses were impacted by limitations in certain business activities, most notably travel and marketing, and by office services and fringe benefits from the modified remote working environment. Collectively, these expenses decreased by $2.0 million during the second quarter of 2020. There were also certain expenses that were previously incurred by ARCC. These expenses resulted in approximately$3.5 million in recurringincreased during the current period, including occupancy costs to support the headcount growth, information services and marketing related expenses forthird-party distribution costs to support the six months ended June 30, 2019. Additionally, we continueexpansion of the business and information technology to invest in expanding our retail distribution footprint through a joint venture, which pays a third party broker for retail distribution services.support the modified remote working environment.
Realized Income:
The following table presents the components of the Credit Group's RI and the changes forfrom the comparative periodsprior year ($ in thousands):
| | | | | | | | | | | | | | | | | | | | | | | | | | | | | | | | | | | | | | | | | | | | | | | |
| | | | | | | | | | | | | | | |
| Three months ended June 30, | | | | Favorable (Unfavorable) | | | | Six months ended June 30, | | | | Favorable (Unfavorable) | | |
| 2020 | | 2019 | | $ Change | | % Change | | 2020 | | 2019 | | $ Change | | % Change |
| Fee Related Earnings | $ | 115,600 | | | $ | 97,940 | | | $ | 17,660 | | | 18 | % | | $ | 229,857 | | | $ | 190,119 | | | $ | 39,738 | | | 21 | % |
| Performance income-realized | — | | | 15,959 | | | (15,959) | | | (100) | | | 9,016 | | | 37,884 | | | (28,868) | | | (76) | |
| Performance related compensation-realized | (112) | | | (9,564) | | | 9,452 | | | 99 | | | (8,011) | | | (22,227) | | | 14,216 | | | 64 | |
| Realized net performance income | (112) | | | 6,395 | | | (6,507) | | | NM | | 1,005 | | | 15,657 | | | (14,652) | | | (94) | |
| Investment income (loss)-realized | — | | | (310) | | | 310 | | | (100) | | | (843) | | | 548 | | | (1,391) | | | NM |
| Interest and other investment income-realized | 6,629 | | | 4,631 | | | 1,998 | | | 43 | | | 11,204 | | | 7,536 | | | 3,668 | | | 49 | |
| Interest expense | (2,336) | | | (1,908) | | | (428) | | | (22) | | | (4,051) | | | (3,807) | | | (244) | | | (6) | |
| Realized net investment income | 4,293 | | | 2,413 | | | 1,880 | | | 78 | | | 6,310 | | | 4,277 | | | 2,033 | | | 48 | |
| Realized Income | $ | 119,781 | | | $ | 106,748 | | | 13,033 | | | 12 | | | $ | 237,172 | | | $ | 210,053 | | | 27,119 | | | 13 | |
|
| | | | | | | | | | | | | | | | | | | | | | | | | | | | | |
| | Three Months Ended June 30, | | Favorable (Unfavorable) | | Six Months Ended June 30, | | Favorable (Unfavorable) |
| | | | |
| | 2019 | | 2018 | | $ Change | | % Change | | 2019 | | 2018 | | $ Change | | % Change |
| Fee Related Earnings | $ | 97,940 |
| | $ | 79,160 |
| | $ | 18,780 |
| | 24 | % | | $ | 190,119 |
| | $ | 156,108 |
| | $ | 34,011 |
| | 22 | % |
| Performance income-realized | 15,959 |
| | 41,672 |
| | (25,713 | ) | | (62 | )% | | 37,884 |
| | 46,743 |
| | (8,859 | ) | | (19 | )% |
| Performance related compensation-realized | (9,564 | ) | | (23,577 | ) | | 14,013 |
| | 59 | % | | (22,227 | ) | | (26,665 | ) | | 4,438 |
| | 17 | % |
| Realized net performance income | 6,395 |
| | 18,095 |
| | (11,700 | ) | | (65 | )% | | 15,657 |
| | 20,078 |
| | (4,421 | ) | | (22 | )% |
| Investment income (loss)-realized | (310 | ) | | 595 |
| | (905 | ) | | NM |
| | 548 |
| | 1,366 |
| | (818 | ) | | (60 | )% |
| Interest and other investment income-realized | 4,631 |
| | 3,035 |
| | 1,596 |
| | 53 | % | | 7,536 |
| | 6,224 |
| | 1,312 |
| | 21 | % |
| Interest expense | (1,908 | ) | | (3,596 | ) | | 1,688 |
| | 47 | % | | (3,807 | ) | | (8,269 | ) | | 4,462 |
| | 54 | % |
| Realized net investment income (loss) | 2,413 |
| | 34 |
| | 2,379 |
| | NM |
| | 4,277 |
| | (679 | ) | | 4,956 |
| | NM |
|
| Realized Income | $ | 106,748 |
| | $ | 97,289 |
| | 9,459 |
| | 10 | % | | $ | 210,053 |
| | $ | 175,507 |
| | 34,546 |
| | 20 | % |
NM - Not meaningfulMeaningful
Realized income for the periods presented was composed of FRE, as explained above, realized net performance income and realized net investment income for the respective periods.
Realized net performance income decreased by $11.7 million, or 65%, for the three months ended June 30, 2019 compared to the three months ended June 30, 2018 and by $4.4 million, or 22%, for the six months ended June 30, 2019 compared2020 was primarily attributable to tax distributions received from ACE III and certain other direct lending funds, offset by a one-time reversal of certain incentive fees that were recognized in 2019. During the first quarter of 2020, management elected to extend the measurement period of these incentive fees. As a result, the performance obligation has no longer been met and achievement is not certain, leading to the six months ended June 30, 2018.derecognition of these incentive fees. Realized net performance income for the three and six months ended June 30, 2019 was principally composed of incentive fees from certainprimarily attributable to four and 15 direct lending funds with incentive fees that are generating returns in excesscrystallized during the respective periods.
Realized net performanceinvestment income for the three and six months ended June 30, 20182020 was principally composedprimarily attributable to interest income generated from our CLO investments and a term loan investment that was made in the third quarter of incentive fees2019 and to dividend income from certaina U.S. direct lending funds that are generating returns in excess of their hurdle rate and tax distributions received from ACE III and certain other direct lending funds.
fund. Realized net investment income increased by $2.4 million to $2.4 million for the three and six months ended June 30, 2019 comparedwas primarily attributable to the three months ended June 30, 2018. Realized net investment loss of $0.7 million for the six months ended June 30, 2018 increased to realized netinterest income generated from our CLO investments and investment income of $4.3 million for the six months ended June 30, 2019. The increases were primarily driven by lower interest expense for the comparative periods as a result of decreases in the cost basis of investments on which interest expense is allocated.
related to distributions from our direct lending funds.
Credit Group— Carried Interest and Incentive Fees
AccruedThe following table presents the accrued carried interest and incentive fee receivables for the Credit Group are composed of the following (in($ in thousands):
| | | | | | | | | | | |
| As of June 30, | | As of December 31, |
| | 2020 | | 2019 |
| ACE III | $ | 63,295 | | | $ | 76,628 | |
| ACE IV | 73,582 | | | 57,388 | |
| CSF III | 14,355 | | | 13,991 | |
| | | |
| PCS | 58,325 | | | 52,029 | |
| Other credit funds | 59,253 | | | 112,959 | |
| Total Credit Group | $ | 268,810 | | | $ | 312,995 | |
|
| | | | | | | |
| | As of June 30, | | As of December 31, |
| | 2019 | | 2018 |
| ACE III | $ | 78,331 |
| | $ | 63,338 |
|
| ACE IV | 28,194 |
| | 8,517 |
|
| CSF III | 13,056 |
| | 9,962 |
|
| ARCC | — |
| | 50,246 |
|
| PCS | 37,657 |
| | 21,009 |
|
| Other credit funds | 72,765 |
| | 57,583 |
|
| Total Credit Group | $ | 230,003 |
| | $ | 210,655 |
|
The change in accrued carried interest and incentive fee receivable forfrom the comparative periodsprior year end was primarily composed ofattributable to the following: (i) a $66.5$11.7 million increase in total unrealized carried interest allocation for six months ended June 30, 2019;2020; offset by (ii) $50.2$9.0 million of carried interest allocation and incentive fees realized in 2018 received during the six months ended June 30, 2019;2020; (iii) $42.7 million of net incentive fees realized in 2019 but for which the cash receipt did not occur until 2020; and (iii)(iv) $4.2 million of foreign currency translation and other adjustments.
The following tables presentspresent the components of incentive fees andthe total change in unrealized carried interest allocation and incentive fees for the Credit Group for the three and six months ended June 30, 2019 and 2018 (in($ in thousands):
| | | | | | | | | | | | | | | | | | | | | | | | | | | | | | | | | | | | | | | | | |
| | Three months ended June 30, 2020 | | | | | | Three months ended June 30, 2019 | | | | | | | | | | |
| | Realized | | Unrealized, net | | Total Change in Unrealized | | Realized | | Unrealized, net | | Total Change in Unrealized | | | | | | |
| ACE III | $ | — | | | $ | (199) | | | $ | (199) | | | $ | — | | | $ | 6,801 | | | $ | 6,801 | | | | | | | |
| ACE IV | — | | | 11,794 | | | 11,794 | | | — | | | 7,229 | | | 7,229 | | | | | | | |
| CSF III | — | | | 1,837 | | | 1,837 | | | — | | | 1,828 | | | 1,828 | | | | | | | |
| PCS | — | | | 24,552 | | | 24,552 | | | — | | | 11,282 | | | 11,282 | | | | | | | |
| | | | | | | | | | | | | | | | | |
| Other credit funds | — | | | 4,558 | | | 4,558 | | | 15,959 | | | 7,764 | | | 23,723 | | | | | | | |
| Total Credit Group | $ | — | | | $ | 42,542 | | | $ | 42,542 | | | $ | 15,959 | | | $ | 34,904 | | | $ | 50,863 | | | | | | | |
|
| | | | | | | | | | | | | | | | | | | | | | | |
| | Three Months Ended June 30, 2019 | | Three Months Ended June 30, 2018 |
| | Realized | | Unrealized | | Net | | Realized | | Unrealized | | Net |
| ACE III | $ | — |
| | $ | 6,801 |
| | $ | 6,801 |
| | $ | 15,361 |
| | $ | (3,298 | ) | | $ | 12,063 |
|
| ACE IV | — |
| | 7,229 |
| | 7,229 |
| | — |
| | — |
| | — |
|
| CSF III | — |
| | 1,828 |
| | 1,828 |
| | — |
| | 727 |
| | 727 |
|
| PCS | — |
| | 11,282 |
| | 11,282 |
| | — |
| | 6,424 |
| | 6,424 |
|
| Other credit funds | 15,959 |
| | 7,764 |
| | 23,723 |
| | 26,311 |
| | (8,421 | ) | | 17,890 |
|
| Total Credit Group | $ | 15,959 |
| | $ | 34,904 |
| | $ | 50,863 |
| | $ | 41,672 |
| | $ | (4,568 | ) | | $ | 37,104 |
|
| | | | | | | | | | | | | | | | | | | | | | | | | | | | | | | | | | | | | | | | | |
| | Six months ended June 30, 2020 | | | | | | Six months ended June 30, 2019 | | | | | | | | | | |
| | Realized | | Unrealized, net | | Total Change in Unrealized | | Realized | | Unrealized, net | | Total Change in Unrealized | | | | | | |
| ACE III | $ | 5,255 | | | $ | (13,213) | | | $ | (7,958) | | | $ | 4,706 | | | $ | 15,256 | | | $ | 19,962 | | | | | | | |
| ACE IV | — | | | 16,440 | | | 16,440 | | | — | | | 19,702 | | | 19,702 | | | | | | | |
| CSF III | — | | | 364 | | | 364 | | | — | | | 3,095 | | | 3,095 | | | | | | | |
| PCS | — | | | 6,305 | | | 6,305 | | | — | | | 16,398 | | | 16,398 | | | | | | | |
| | | | | | | | | | | | | | | | | |
| Other credit funds | 3,761 | | | (7,218) | | | (3,457) | | | 33,178 | | | 12,085 | | | 45,263 | | | | | | | |
| Total Credit Group | $ | 9,016 | | | $ | 2,678 | | | $ | 11,694 | | | $ | 37,884 | | | $ | 66,536 | | | $ | 104,420 | | | | | | | |
|
| | | | | | | | | | | | | | | | | | | | | | | |
| | Six Months Ended June 30, 2019 | | Six Months Ended June 30, 2018 |
| | Realized | | Unrealized | | Net | | Realized | | Unrealized | | Net |
| ACE III | $ | 4,706 |
| | $ | 15,256 |
| | $ | 19,962 |
| | $ | 15,361 |
| | $ | 7,469 |
| | $ | 22,830 |
|
| ACE IV | — |
| | 19,702 |
| | 19,702 |
| | — |
| | — |
| | — |
|
| CSF III | — |
| | 3,095 |
| | 3,095 |
| | — |
| | (275 | ) | | (275 | ) |
| PCS | — |
| | 16,398 |
| | 16,398 |
| | — |
| | 10,674 |
| | 10,674 |
|
| Other credit funds | 33,178 |
| | 12,085 |
| | 45,263 |
| | 31,382 |
| | (6,344 | ) | | 25,038 |
|
| Total Credit Group | $ | 37,884 |
| | $ | 66,536 |
| | $ | 104,420 |
| | $ | 46,743 |
| | $ | 11,524 |
| | $ | 58,267 |
|
Credit Group—Assets Under Management
The tables below providepresent rollforwards of AUM for the Credit Group for the three months ended June 30, 2019 and 2018 (in($ in millions):
| | | | | | | | | | | | | | | | | | | | | | | | | | | | | | | | | | | | | | | | | | | | | | | |
| | | | Syndicated Loans | | High Yield | | Multi-Asset Credit | | Alternative Credit | | U.S. Direct Lending | | European Direct Lending | | Total Credit Group |
| Balance at 3/31/2020 | | | $ | 24,668 | | | $ | 2,836 | | | $ | 2,225 | | | $ | 7,483 | | | $ | 49,237 | | | $ | 26,063 | | | $ | 112,512 | |
| | | | | | | | | | | | | | | |
| Net new par/equity commitments | | | 18 | | | 206 | | | 424 | | | 927 | | | 533 | | | — | | | 2,108 | |
| Net new debt commitments | | | 480 | | | — | | | — | | | — | | | 742 | | | 562 | | | 1,784 | |
| Capital reductions | | | (26) | | | — | | | — | | | — | | | (54) | | | (17) | | | (97) | |
| Distributions | | | (18) | | | — | | | (6) | | | (91) | | | (311) | | | (280) | | | (706) | |
| Redemptions | | | (52) | | | (613) | | | (55) | | | (78) | | | (27) | | | — | | | (825) | |
| Change in fund value | | | 381 | | | 231 | | | 224 | | | 580 | | | 664 | | | 557 | | | 2,637 | |
| Balance at 6/30/2020 | | | $ | 25,451 | | | $ | 2,660 | | | $ | 2,812 | | | $ | 8,821 | | | $ | 50,784 | | | $ | 26,885 | | | $ | 117,413 | |
Average AUM(1) | | | $ | 25,060 | | | $ | 2,748 | | | $ | 2,519 | | | $ | 8,152 | | | $ | 50,011 | | | $ | 26,474 | | | $ | 114,964 | |
| | | | | | | | | | | | | | | |
| | | Syndicated Loans | | High Yield | | Multi-Asset Credit | | Alternative Credit | | U.S. Direct Lending | | European Direct Lending | | Total Credit Group |
| Balance at 3/31/2019 | | | $ | 21,242 | | | $ | 4,246 | | | $ | 2,462 | | | $ | 6,576 | | | $ | 41,997 | | | $ | 24,553 | | | $ | 101,076 | |
| Net new par/equity commitments | | | 419 | | | 21 | | | 91 | | | 700 | | | 1,119 | | | — | | | 2,350 | |
| Net new debt commitments | | | (118) | | | — | | | — | | | 75 | | | 3,195 | | | 189 | | | 3,341 | |
| Capital reductions | | | (623) | | | — | | | — | | | — | | | (149) | | | (11) | | | (783) | |
| Distributions | | | (20) | | | (11) | | | (59) | | | (75) | | | (303) | | | (93) | | | (561) | |
| Redemptions | | | (118) | | | (865) | | | (36) | | | — | | | (13) | | | — | | | (1,032) | |
| Change in fund value | | | 142 | | | 103 | | | 39 | | | 63 | | | 446 | | | 321 | | | 1,114�� | |
| Balance at 6/30/2019 | | | $ | 20,924 | | | $ | 3,494 | | | $ | 2,497 | | | $ | 7,339 | | | $ | 46,292 | | | $ | 24,959 | | | $ | 105,505 | |
Average AUM(1) | | | $ | 21,083 | | | $ | 3,870 | | | $ | 2,480 | | | $ | 6,958 | | | $ | 44,145 | | | $ | 24,756 | | | $ | 103,292 | |
| | | | | | | | | | | | | | | |
| (1) Represents a two-point average of quarter-end balances for each period. | | | | | | | | | | | | | | | |
| | | | | | | | | | | | | | | |
| | | | Syndicated Loans | | High Yield | | Multi-Asset Credit | | Alternative Credit | | U.S. Direct Lending | | European Direct Lending | | Total Credit Group |
| Balance at 12/31/2019 | | | $ | 22,320 | | | $ | 3,492 | | | $ | 2,611 | | | $ | 7,571 | | | $ | 48,431 | | | $ | 26,118 | | | $ | 110,543 | |
| Acquisitions | | | 2,693 | | | — | | | — | | | — | | | — | | | — | | | 2,693 | |
| Net new par/equity commitments | | | 120 | | | 228 | | | 430 | | | 1,857 | | | 1,414 | | | 96 | | | 4,145 | |
| Net new debt commitments | | | 735 | | | — | | | — | | | — | | | 2,149 | | | 1,119 | | | 4,003 | |
| Capital reductions | | | (33) | | | — | | | — | | | — | | | (82) | | | (29) | | | (144) | |
| Distributions | | | (33) | | | — | | | (8) | | | (184) | | | (661) | | | (452) | | | (1,338) | |
| Redemptions | | | (177) | | | (880) | | | (91) | | | (96) | | | (45) | | | — | | | (1,289) | |
| Change in fund value | | | (174) | | | (180) | | | (130) | | | (327) | | | (422) | | | 33 | | | (1,200) | |
| Balance at 6/30/2020 | | | $ | 25,451 | | | $ | 2,660 | | | $ | 2,812 | | | $ | 8,821 | | | $ | 50,784 | | | $ | 26,885 | | | $ | 117,413 | |
Average AUM(1) | | | $ | 24,146 | | | $ | 2,996 | | | $ | 2,549 | | | $ | 7,958 | | | $ | 49,484 | | | $ | 26,355 | | | $ | 113,488 | |
| | | | | | | | | | | | | | | |
| | | Syndicated Loans | | High Yield | | Multi-Asset Credit | | Alternative Credit | | U.S. Direct Lending | | European Direct Lending | | Total Credit Group |
| Balance at 12/31/2018 | | | $ | 18,880 | | | $ | 4,024 | | | $ | 2,761 | | | $ | 5,448 | | | $ | 40,668 | | | $ | 24,055 | | | $ | 95,836 | |
| Net new par/equity commitments | | | 833 | | | 75 | | | (74) | | | 1,967 | | | 1,591 | | | 523 | | | 4,915 | |
| Net new debt commitments | | | 1,964 | | | — | | | — | | | 75 | | | 3,929 | | | 339 | | | 6,307 | |
| Capital reductions | | | (668) | | | — | | | — | | | — | | | (186) | | | (33) | | | (887) | |
| Distributions | | | (46) | | | (22) | | | (70) | | | (107) | | | (538) | | | (305) | | | (1,088) | |
| Redemptions | | | (252) | | | (957) | | | (301) | | | (220) | | | (19) | | | — | | | (1,749) | |
| Change in fund value | | | 213 | | | 374 | | | 181 | | | 176 | | | 847 | | | 380 | | | 2,171 | |
| Balance at 6/30/2019 | | | $ | 20,924 | | | $ | 3,494 | | | $ | 2,497 | | | $ | 7,339 | | | $ | 46,292 | | | $ | 24,959 | | | $ | 105,505 | |
Average AUM(1) | | | $ | 20,349 | | | $ | 3,921 | | | $ | 2,573 | | | $ | 6,454 | | | $ | 42,986 | | | $ | 24,522 | | | $ | 100,805 | |
| | | | | | | | | | | | | | | |
| (1) Represents a three-point average of quarter-end balances for each period. | | | | | | | | | | | | | | | |
|
| | | | | | | | | | | | | | | | | | | | | | | | | | | |
| | Syndicated Loans | | High Yield | | Credit Opportunities | | Alternative Credit | | U.S. Direct Lending | | European Direct Lending | | Total Credit Group |
| Balance at 3/31/2019 | $ | 21,242 |
| | $ | 4,246 |
| | $ | 2,462 |
| | $ | 6,576 |
| | $ | 41,997 |
| | $ | 24,553 |
| | $ | 101,076 |
|
| Net new par/equity commitments | 419 |
| | 21 |
| | 91 |
| | 700 |
| | 1,119 |
| | — |
| | 2,350 |
|
| Net change in debt commitments | (118 | ) | | — |
| | — |
| | 75 |
| | 3,195 |
| | 189 |
| | 3,341 |
|
| Distributions | (761 | ) | | (876 | ) | | (95 | ) | | (75 | ) | | (465 | ) | | (104 | ) | | (2,376 | ) |
| Change in fund value | 142 |
| | 103 |
| | 39 |
| | 63 |
| | 446 |
| | 321 |
| | 1,114 |
|
| Balance at 6/30/2019 | $ | 20,924 |
| | $ | 3,494 |
| | $ | 2,497 |
| | $ | 7,339 |
| | $ | 46,292 |
| | $ | 24,959 |
| | $ | 105,505 |
|
| Average AUM(1) | $ | 21,083 |
| | $ | 3,870 |
| | $ | 2,480 |
| | $ | 6,958 |
| | $ | 44,145 |
| | $ | 24,756 |
| | $ | 103,292 |
|
|
| | | | | | | | | | | | | | | | | | | | | | | | | | | |
| | Syndicated Loans | | High Yield | | Credit Opportunities | | Alternative Credit | | U.S. Direct Lending | | European Direct Lending | | Total Credit Group |
| Balance at 3/31/2018 | $ | 17,413 |
| | $ | 4,582 |
| | $ | 3,161 |
| | $ | 4,905 |
| | $ | 34,560 |
| | $ | 12,689 |
| | $ | 77,310 |
|
| Net new par/equity commitments | 27 |
| | 56 |
| | 36 |
| | 914 |
| | 1,210 |
| | 7,116 |
| | 9,359 |
|
| Net new debt commitments | 457 |
| | — |
| | — |
| | — |
| | 1,533 |
| | — |
| | 1,990 |
|
| Distributions | (172 | ) | | (295 | ) | | (297 | ) | | (73 | ) | | (862 | ) | | (101 | ) | | (1,800 | ) |
| Change in fund value | (98 | ) | | 38 |
| | 31 |
| | 7 |
| | 397 |
| | (376 | ) | | (1 | ) |
| Balance at 6/30/2018 | $ | 17,627 |
| | $ | 4,381 |
| | $ | 2,931 |
| | $ | 5,753 |
| | $ | 36,838 |
| | $ | 19,328 |
| | $ | 86,858 |
|
| Average AUM(1) | $ | 17,520 |
| | $ | 4,482 |
| | $ | 3,046 |
| | $ | 5,329 |
| | $ | 35,699 |
| | $ | 16,009 |
| | $ | 82,085 |
|
| |
(1) | Represents the quarterly average of beginning and ending balances. |
|
| | | | | | | | | | | | | | | | | | | | | | | | | | | |
| | Syndicated Loans | | High Yield | | Credit Opportunities | | Alternative Credit | | U.S. Direct Lending | | European Direct Lending | | Total Credit Group |
| Balance at 12/31/2018 | $ | 18,880 |
| | $ | 4,024 |
| | $ | 2,761 |
| | $ | 5,448 |
| | $ | 40,668 |
| | $ | 24,055 |
| | $ | 95,836 |
|
| Net new par/equity commitments | 834 |
| | 75 |
| | (74 | ) | | 1,966 |
| | 1,591 |
| | 523 |
| | 4,915 |
|
| Net change in debt commitments | 1,964 |
| | — |
| | — |
| | 75 |
| | 3,928 |
| | 339 |
| | 6,306 |
|
| Distributions | (966 | ) | | (979 | ) | | (371 | ) | | (327 | ) | | (743 | ) | | (338 | ) | | (3,724 | ) |
| Change in fund value | 212 |
| | 374 |
| | 181 |
| | 177 |
| | 848 |
| | 380 |
| | 2,172 |
|
| Balance at 6/30/2019 | $ | 20,924 |
| | $ | 3,494 |
| | $ | 2,497 |
| | $ | 7,339 |
| | $ | 46,292 |
| | $ | 24,959 |
| | $ | 105,505 |
|
| Average AUM(1) | $ | 20,349 |
| | $ | 3,921 |
| | $ | 2,573 |
| | $ | 6,454 |
| | $ | 42,986 |
| | $ | 24,522 |
| | $ | 100,805 |
|
|
| | | | | | | | | | | | | | | | | | | | | | | | | | | |
| | Syndicated Loans | | High Yield | | Credit Opportunities | | Alternative Credit | | U.S. Direct Lending | | European Direct Lending | | Total Credit Group |
| Balance at 12/31/2017 | $ | 16,530 |
| | $ | 4,630 |
| | $ | 3,333 |
| | $ | 4,791 |
| | $ | 30,640 |
| | $ | 11,808 |
| | $ | 71,732 |
|
| Net new par/equity commitments | 130 |
| | 200 |
| | 39 |
| | 974 |
| | 3,781 |
| | 7,335 |
| | 12,459 |
|
| Net new debt commitments | 1,574 |
| | — |
| | — |
| | — |
| | 2,925 |
| | 246 |
| | 4,745 |
|
| Distributions | (580 | ) | | (453 | ) | | (473 | ) | | (76 | ) | | (1,331 | ) | | (223 | ) | | (3,136 | ) |
| Change in fund value | (27 | ) | | 4 |
| | 32 |
| | 64 |
| | 823 |
| | 162 |
| | 1,058 |
|
| Balance at 6/30/2018 | $ | 17,627 |
| | $ | 4,381 |
| | $ | 2,931 |
| | $ | 5,753 |
| | $ | 36,838 |
| | $ | 19,328 |
| | $ | 86,858 |
|
| Average AUM(1) | $ | 17,190 |
| | $ | 4,531 |
| | $ | 3,142 |
| | $ | 5,150 |
| | $ | 34,013 |
| | $ | 14,608 |
| | $ | 78,634 |
|
| |
(1) | Represents the quarterly average of beginning and ending balances. |
Credit Group—Fee Paying AUM
The tables below provide rollforwards of fee paying AUM for the Credit Group for the three months ended June 30, 2019 and 2018 (in millions):
|
| | | | | | | | | | | | | | | | | | | | | | | | | | | |
| | Syndicated Loans | | High Yield | | Credit Opportunities | | Alternative Credit | | U.S. Direct Lending | | European Direct Lending | | Total Credit Group |
| FPAUM Balance at 3/31/2019 | $ | 19,666 |
| | $ | 4,247 |
| | $ | 2,060 |
| | $ | 3,190 |
| | $ | 23,681 |
| | $ | 10,080 |
| | $ | 62,924 |
|
| Commitments | 1,199 |
| | 21 |
| | 91 |
| | 253 |
| | 6 |
| | — |
| | 1,570 |
|
| Subscriptions/deployment/increase in leverage | 2 |
| | — |
| | 13 |
| | 404 |
| | 1,364 |
| | 912 |
| | 2,695 |
|
| Redemptions/distributions/decrease in leverage | (727 | ) | | (875 | ) | | (108 | ) | | (78 | ) | | (924 | ) | | (280 | ) | | (2,992 | ) |
| Change in fund value | 55 |
| | 103 |
| | 36 |
| | 59 |
| | 238 |
| | 75 |
| | 566 |
|
| FPAUM Balance at 6/30/2019 | $ | 20,195 |
| | $ | 3,496 |
| | $ | 2,092 |
| | $ | 3,828 |
| | $ | 24,365 |
| | $ | 10,787 |
| | $ | 64,763 |
|
| Average FPAUM(1) | $ | 19,931 |
| | $ | 3,872 |
| | $ | 2,076 |
| | $ | 3,509 |
| | $ | 24,023 |
| | $ | 10,434 |
| | $ | 63,845 |
|
|
| | | | | | | | | | | | | | | | | | | | | | | | | | | |
| | Syndicated Loans | | High Yield | | Credit Opportunities | | Alternative Credit | | U.S. Direct Lending | | European Direct Lending | | Total Credit Group |
| FPAUM Balance at 3/31/2018 | $ | 15,592 |
| | $ | 4,578 |
| | $ | 2,621 |
| | $ | 3,515 |
| | $ | 18,158 |
| | $ | 7,076 |
| | $ | 51,540 |
|
| Commitments | 1,721 |
| | 56 |
| | 1 |
| | 35 |
| | 45 |
| | 30 |
| | 1,888 |
|
| Subscriptions/deployment/increase in leverage | — |
| | — |
| | 25 |
| | 60 |
| | 1,134 |
| | 732 |
| | 1,951 |
|
| Redemptions/distributions/decrease in leverage | (163 | ) | | (293 | ) | | (307 | ) | | (188 | ) | | (890 | ) | | (268 | ) | | (2,109 | ) |
| Change in fund value | (6 | ) | | 39 |
| | 29 |
| | 10 |
| | 186 |
| | (192 | ) | | 66 |
|
| FPAUM Balance at 6/30/2018 | $ | 17,144 |
| | $ | 4,380 |
| | $ | 2,369 |
| | $ | 3,432 |
| | $ | 18,633 |
| | $ | 7,378 |
| | $ | 53,336 |
|
| Average FPAUM(1) | $ | 16,368 |
| | $ | 4,479 |
| | $ | 2,495 |
| | $ | 3,474 |
| | $ | 18,396 |
| | $ | 7,227 |
| | $ | 52,439 |
|
(1) Represents the quarterly average of beginning and ending balances.
The tables below provide rollforwards of fee paying AUM for the Credit Group for the six months ended June 30, 2019 and 2018 (in millions):
|
| | | | | | | | | | | | | | | | | | | | | | | | | | | |
| | Syndicated Loans | | High Yield | | Credit Opportunities | | Alternative Credit | | U.S. Direct Lending | | European Direct Lending | | Total Credit Group |
| FPAUM Balance at 12/31/2018 | $ | 18,328 |
| | $ | 4,025 |
| | $ | 2,196 |
| | $ | 2,826 |
| | $ | 21,657 |
| | $ | 8,815 |
| | $ | 57,847 |
|
| Commitments | 2,628 |
| | 75 |
| | 102 |
| | 583 |
| | 20 |
| | — |
| | 3,408 |
|
| Subscriptions/deployment/increase in leverage | 17 |
| | — |
| | 23 |
| | 614 |
| | 3,448 |
| | 2,526 |
| | 6,628 |
|
| Redemptions/distributions/decrease in leverage | (900 | ) | | (978 | ) | | (403 | ) | | (318 | ) | | (1,239 | ) | | (619 | ) | | (4,457 | ) |
| Change in fund value | 122 |
| | 374 |
| | 174 |
| | 123 |
| | 479 |
| | 199 |
| | 1,471 |
|
| Change in fee basis | — |
| | — |
| | — |
| | — |
| | — |
| | (134 | ) | | (134 | ) |
| FPAUM Balance at 6/30/2019 | $ | 20,195 |
| | $ | 3,496 |
| | $ | 2,092 |
| | $ | 3,828 |
| | $ | 24,365 |
| | $ | 10,787 |
| | $ | 64,763 |
|
| Average FPAUM(1) | $ | 19,396 |
| | $ | 3,923 |
| | $ | 2,116 |
| | $ | 3,281 |
| | $ | 23,234 |
| | $ | 9,894 |
| | $ | 61,844 |
|
|
| | | | | | | | | | | | | | | | | | | | | | | | | | | |
| | Syndicated Loans | | High Yield | | Credit Opportunities | | Alternative Credit | | U.S. Direct Lending | | European Direct Lending | | Total Credit Group |
| FPAUM Balance at 12/31/2017 | $ | 15,251 |
| | $ | 4,629 |
| | $ | 2,809 |
| | $ | 3,434 |
| | $ | 16,869 |
| | $ | 6,458 |
| | $ | 49,450 |
|
| Commitments | 2,425 |
| | 189 |
| | 4 |
| | 95 |
| | 75 |
| | 30 |
| | 2,818 |
|
| Subscriptions/deployment/increase in leverage | — |
| | 12 |
| | 25 |
| | 149 |
| | 2,373 |
| | 1,356 |
| | 3,915 |
|
| Redemptions/distributions/decrease in leverage | (566 | ) | | (451 | ) | | (499 | ) | | (289 | ) | | (1,136 | ) | | (393 | ) | | (3,334 | ) |
| Change in fund value | 38 |
| | 4 |
| | 30 |
| | 43 |
| | 452 |
| | (73 | ) | | 494 |
|
| Change in fee basis | (4 | ) | | (3 | ) | | — |
| | — |
| | — |
| | — |
| | (7 | ) |
| FPAUM Balance at 6/30/2018 | $ | 17,144 |
| | $ | 4,380 |
| | $ | 2,369 |
| | $ | 3,432 |
| | $ | 18,633 |
| | $ | 7,378 |
| | $ | 53,336 |
|
| Average FPAUM(1) | $ | 15,996 |
| | $ | 4,529 |
| | $ | 2,600 |
| | $ | 3,460 |
| | $ | 17,887 |
| | $ | 6,971 |
| | $ | 51,443 |
|
(1) Represents the quarterly average of beginning and ending balances.
The components of our AUM including the portion that is FPAUM, for the Credit Group are presented below as of June 30, 2019 and 2018 (in millions)($ in billions):
|
| |
AUM: $105,505 | AUM: $86,858 |
|
| | | | | | | |
| AUM: $117.4 | FPAUM | AUM: $105.5 |
| | | | | | | | | | | | | | | | | | | | | | | |
| FPAUM | | AUM not yet earningpaying fees | | Non-fee paying(1)paying(1) | | General partner and affiliates |
(1) Includes $7.8$8.4 billion and $7.0$7.8 billion of AUM of funds for which we indirectly earn management fees as of June 30, 20192020 and 2018,2019, respectively.
Credit Group—Fee Paying AUM
The tables below present rollforwards of fee paying AUM for the Credit Group ($ in millions):
| | | | | | | | | | | | | | | | | | | | | | | | | | | | | | | | | | | | | | | | | | | | |
| | | Syndicated Loans | | High Yield | | Multi-Asset Credit | | Alternative Credit | | U.S. Direct Lending | | European Direct Lending | | Total Credit Group |
| FPAUM Balance at 3/31/2020 | | $ | 24,124 | | | $ | 2,839 | | | $ | 1,713 | | | $ | 4,171 | | | $ | 28,808 | | | $ | 14,105 | | | $ | 75,760 | |
| | | | | | | | | | | | | | |
| Commitments | | 498 | | | 206 | | | 372 | | | 144 | | | 60 | | | — | | | 1,280 | |
| Subscriptions/deployment/increase in leverage | | — | | | — | | | 41 | | | 819 | | | 1,030 | | | 1,084 | | | 2,974 | |
| Capital reductions | | (26) | | | — | | | — | | | — | | | (828) | | | (16) | | | (870) | |
| Distributions | | (12) | | | — | | | (10) | | | (80) | | | (715) | | | (330) | | | (1,147) | |
| Redemptions | | (52) | | | (614) | | | (55) | | | (78) | | | (27) | | | (17) | | | (843) | |
| Change in fund value | | 300 | | | 230 | | | 217 | | | 376 | | | 351 | | | 156 | | | 1,630 | |
| Change in fee basis | | — | | | (40) | | | — | | | — | | | — | | | — | | | (40) | |
| FPAUM Balance at 6/30/2020 | | $ | 24,832 | | | $ | 2,621 | | | $ | 2,278 | | | $ | 5,352 | | | $ | 28,679 | | | $ | 14,982 | | | $ | 78,744 | |
Average FPAUM(1) | | $ | 24,478 | | | $ | 2,730 | | | $ | 1,996 | | | $ | 4,762 | | | $ | 28,744 | | | $ | 14,544 | | | $ | 77,254 | |
| | | | | | | | | | | | | | |
| | Syndicated Loans | | High Yield | | Multi-Asset Credit | | Alternative Credit | | U.S. Direct Lending | | European Direct Lending | | Total Credit Group |
| FPAUM Balance at 3/31/2019 | | $ | 19,666 | | | $ | 4,247 | | | $ | 2,060 | | | $ | 3,190 | | | $ | 23,681 | | | $ | 10,080 | | | $ | 62,924 | |
| Commitments | | 1,199 | | | 21 | | | 91 | | | 253 | | | 6 | | | — | | | 1,570 | |
| Subscriptions/deployment/increase in leverage | | 2 | | | — | | | 13 | | | 404 | | | 1,364 | | | 912 | | | 2,695 | |
| Capital reductions | | (595) | | | — | | | — | | | — | | | (525) | | | (24) | | | (1,144) | |
| Distributions | | (15) | | | (11) | | | (69) | | | (78) | | | (390) | | | (88) | | | (651) | |
| Redemptions | | (117) | | | (864) | | | (39) | | | — | | | (9) | | | (168) | | | (1,197) | |
| Change in fund value | | 55 | | | 103 | | | 36 | | | 59 | | | 238 | | | 75 | | | 566 | |
| | | | | | | | | | | | | | |
| FPAUM Balance at 6/30/2019 | | $ | 20,195 | | | $ | 3,496 | | | $ | 2,092 | | | $ | 3,828 | | | $ | 24,365 | | | $ | 10,787 | | | $ | 64,763 | |
Average FPAUM(1) | | $ | 19,931 | | | $ | 3,872 | | | $ | 2,076 | | | $ | 3,509 | | | $ | 24,023 | | | $ | 10,434 | | | $ | 63,845 | |
| | | | | | | | | | | | | | |
| (1) Represents a two-point average of quarter-end balances for each period. | | | | | | | | | | | | | | |
| | | | | | | | | | | | | | |
| | Syndicated Loans | | High Yield | | Multi-Asset Credit | | Alternative Credit | | U.S. Direct Lending | | European Direct Lending | | Total Credit Group |
| FPAUM Balance at 12/31/2019 | | $ | 21,458 | | | $ | 3,495 | | | $ | 2,144 | | | $ | 4,340 | | | $ | 27,876 | | | $ | 12,567 | | | $ | 71,880 | |
| Acquisitions | | 2,596 | | | — | | | — | | | — | | | — | | | — | | | 2,596 | |
| Commitments | | 1,299 | | | 228 | | | 378 | | | 479 | | | 136 | | | — | | | 2,520 | |
| Subscriptions/deployment/increase in leverage | | — | | | — | | | 50 | | | 1,031 | | | 3,522 | | | 2,936 | | | 7,539 | |
| Capital reductions | | (51) | | | — | | | (59) | | | — | | | (829) | | | (31) | | | (970) | |
| Distributions | | (26) | | | — | | | (21) | | | (208) | | | (1,531) | | | (392) | | | (2,178) | |
| Redemptions | | (177) | | | (880) | | | (88) | | | (96) | | | (45) | | | (38) | | | (1,324) | |
| Change in fund value | | (267) | | | (182) | | | (126) | | | (194) | | | (450) | | | (60) | | | (1,279) | |
| Change in fee basis | | — | | | (40) | | | — | | | — | | | — | | | — | | | (40) | |
| FPAUM Balance at 6/30/2020 | | $ | 24,832 | | | $ | 2,621 | | | $ | 2,278 | | | $ | 5,352 | | | $ | 28,679 | | | $ | 14,982 | | | $ | 78,744 | |
Average FPAUM(1) | | $ | 23,471 | | | $ | 2,985 | | | $ | 2,045 | | | $ | 4,621 | | | $ | 28,454 | | | $ | 13,885 | | | $ | 75,461 | |
| | | | | | | | | | | | | | |
| | Syndicated Loans | | High Yield | | Multi-Asset Credit | | Alternative Credit | | U.S. Direct Lending | | European Direct Lending | | Total Credit Group |
| FPAUM Balance at 12/31/2018 | | $ | 18,328 | | | $ | 4,025 | | | $ | 2,196 | | | $ | 2,826 | | | $ | 21,657 | | | $ | 8,815 | | | $ | 57,847 | |
| Commitments | | 2,628 | | | 75 | | | 101 | | | 583 | | | 21 | | | — | | | 3,408 | |
| Subscriptions/deployment/increase in leverage | | 17 | | | — | | | 23 | | | 614 | | | 3,448 | | | 2,526 | | | 6,628 | |
| Capital reductions | | (620) | | | — | | | (10) | | | — | | | (553) | | | (46) | | | (1,229) | |
| Distributions | | (28) | | | (22) | | | (79) | | | (98) | | | (673) | | | (274) | | | (1,174) | |
| Redemptions | | (252) | | | (956) | | | (313) | | | (220) | | | (14) | | | (299) | | | (2,054) | |
| Change in fund value | | 122 | | | 374 | | | 174 | | | 123 | | | 479 | | | 199 | | | 1,471 | |
| Change in fee basis | | — | | | — | | | — | | | — | | | — | | | (134) | | | (134) | |
| FPAUM Balance at 6/30/2019 | | $ | 20,195 | | | $ | 3,496 | | | $ | 2,092 | | | $ | 3,828 | | | $ | 24,365 | | | $ | 10,787 | | | $ | 64,763 | |
Average FPAUM(1) | | $ | 19,396 | | | $ | 3,923 | | | $ | 2,116 | | | $ | 3,281 | | | $ | 23,234 | | | $ | 9,894 | | | $ | 61,844 | |
| | | | | | | | | | | | | | |
| (1) Represents a three-point average of quarter-end balances for each period. | | | | | | | | | | | | | | |
The charts below present FPAUM for the Credit Group by its fee basis ($ in billions):
| | | | | | | | | | | | | | | | | | | | | | | |
| Market value(1) | | Invested capital | | Collateral balances (at par) | | Capital commitments |
(1)Includes $18.3 billion and $16.8 billion from funds that primarily invest in illiquid strategies as of June 30, 2020 and 2019, respectively. The underlying investments held in these funds are generally subject to less market volatility than investments held in liquid strategies.
Credit Group—Fund Performance Metrics as of June 30, 20192020
The Credit Group managed 170 funds and accounts as of June 30, 2019. ARCC contributed approximately 53%48% of the Credit Group’s total management fees for the six months ended June 30, 2019.2020. In addition to ARCC, foursix significant funds, ACE III, ACE IV, Ares Private Credit Solutions, L.P. (“PCS”) and Ares Credit Strategies Fund III L.P. (“CSF III”), Ares Secured Income Master Fund L.P. (“ASIF”), PCS and SDL, contributed approximately 13%19% of the Credit Group’s management fees for the six months ended June 30, 2019.2020. For the drawdown funds, ACE III and CSF III are in harvest mode, meaning they are generally not seeking to deploy capital into new investment opportunities, while ACE IV, focus on direct lending to European middle market companies. PCS targets junior capital needs of upper middle market companiesand SDL are in North America. CSF III focuses on European and U.S. direct lending strategies.deployment mode.
We do not present fund performance metrics for significant funds with less than two years of investment performance, which begins from the date of the fund's first investment, except for those significant funds that pay management fees on invested capital, in which case performance is shown at the earlier of (i) the one-year anniversary of the fund's first investment or (ii) such time that the fund has invested at least 50% of its capital. The following table presents the performance data for our significant non-drawdown fundfunds in the Credit Group as of June 30, 20192020 ($ in millions):
| | | | | | | | | | | | | | | | | | | | | | | | | | | | | | | | | | | | | | | | | | | | | | | | | | | | | |
| | | | | | Returns(%)(1) | | | | | | | | | | | | |
| | Year of Inception | | AUM | | Current Quarter | | | | Year-To-Date | | | | Since Inception(2) | | | | Primary Investment Strategy |
| Fund | | | | | Gross | | Net | | Gross | | Net | | Gross | | Net | | |
ARCC(3) | 2004 | | $ | 17,479 | | | N/A | | 4.2 | | | N/A | | (3.9) | | | N/A | | 11.1 | | | U.S. Direct Lending |
ASIF(4) | 2018 | | 961 | | | 13.1 | | | 12.9 | | | (1.9) | | | (2.2) | | | 1.1 | | | 0.4 | | | Alternative Credit |
| | | | | | | | | | | | | | | | | |
|
| | | | | | | | | | | | | | | | | | | |
| | | | | | Returns(%)(1) | | |
| | Year of Inception | | AUM | | Current Quarter | | Year-To-Date | | Since Inception(2) | | Primary Investment Strategy |
| Fund | | | Gross | | Net | | Gross | | Net | | Gross | | Net | |
| ARCC(3) | 2004 | | $ | 16,645 |
| | N/A | | 2.8 | | N/A | | 5.9 | | N/A | | 11.8 | | U.S. Direct Lending |
| |
(1) | Returns are time-weighted rates of return and include the reinvestment of income and other earnings from securities or other investments and reflect the deduction of all trading expenses.Returns are time-weighted rates of return and include the reinvestment of income and other earnings from securities or other investments and reflect the deduction of all trading expenses.
(2)Since inception returns are annualized. (3)Net returns are calculated using the fund's NAV and assume dividends are reinvested at the closest quarter-end NAV to the relevant quarterly ex-dividend dates. Additional information related to ARCC can be found in its financial statements filed with the SEC, which are not part of this report. (4)Gross returns do not reflect the deduction of management fees or other expenses. Net returns are calculated by subtracting the applicable management fee and other expenses from the gross returns on a monthly basis. ASIF is a master/feeder structure and the AUM and returns include activity from its investment in an affiliated Ares fund. Returns presented in the table are expressed in U.S. dollars and are for the master fund, excluding the share class hedges. The current quarter to-date, year-to-date and since inception returns (gross / net) for the pound sterling hedged Cayman feeder, the fund's sole feeder, are as follows: 12.5% / 12.3%, (3.1)% / (3.4)%, (0.9)% / (1.5)% respectively.
|
| |
(2) | Since inception returns are annualized.
|
| |
(3) | Net returns are calculated using the fund's NAV and assume dividends are reinvested at the closest quarter-end NAV to the relevant quarterly ex-dividend dates. Additional information related to ARCC can be found in its financial statements filed with the SEC, which are not part of this report.
|
The following table presents the performance data of our significant drawdown funds as of June 30, 20192020 ($ in millions):
| | | | | | | | | | | | | | | | | | | | | | | | | | | | | | | | | | | | | | | | | | | | | | | | | | | | | | | | | | | | | | | | | | | | | | | |
| Year of Inception | | AUM | | Original Capital Commitments | | Capital Invested to Date | | Realized Proceeds(1) | | Unrealized Value(2) | | Total | | MoIC | | | | IRR(%) | | | | Primary
Investment Strategy |
| Fund | | | | | | | | | | | | | | | Gross(3) | | Net(4) | | Gross(5) | | Net(6) | | |
| CSF III | 2010 | | $ | 1,660 | | | $ | 1,135 | | | $ | 1,267 | | | $ | 867 | | | $ | 983 | | | $ | 1,850 | | | 1.5x | | 1.5x | | 8.9 | | | 7.6 | | | European & U.S. Direct Lending |
ACE III(7) | 2015 | | 4,874 | | | 2,822 | | | 2,483 | | | 652 | | | 2,463 | | | 3,115 | | | 1.4x | | 1.3x | | 11.6 | | | 8.1 | | | European Direct Lending |
| PCS | 2017 | | 3,675 | | | 3,365 | | | 2,381 | | | 238 | | | 2,453 | | | 2,691 | | | 1.2x | | 1.1x | | 10.9 | | | 7.5 | | | U.S. Direct Lending |
ACE IV Unlevered(8) | 2018 | | 10,120 | | | 2,851 | | | 1,882 | | | 75 | | | 1,923 | | | 1,998 | | | 1.1x | | 1.1x | | 9.0 | | | 6.2 | | | European Direct Lending |
ACE IV Levered(8) | | | | | 4,819 | | | 3,171 | | | 176 | | | 3,306 | | | 3,482 | | | 1.1x | | 1.1x | | 13.3 | | | 9.4 | | | |
| SDL Unlevered | 2018 | | 4,970 | | | 922 | | | 471 | | | 81 | | | 404 | | | 485 | | | 1.0x | | 1.0x | | 6.3 | | | 4.4 | | | U.S. Direct Lending |
| SDL Levered | | | | | 2,045 | | | 1,045 | | | 233 | | | 853 | | | 1,086 | | | 1.1x | | 1.0x | | 10.1 | | | 6.1 | | | |
|
| | | | | | | | | | | | | | | | | | | | | | | | | | | | | | | | | | | |
| | Year of Inception | | AUM | | Original Capital Commitments | | Cumulative Invested Capital | | Realized Proceeds(1) | | Unrealized Value(2) | | Total Value | | MoIC | | IRR(%) | | Primary Investment Strategy |
| Fund | | | | | | | | Gross(3) | | Net(4) | | Gross(5) | | Net(6) | |
| CSF III | 2010 | | $ | 1,138 |
| | $ | 1,135 |
| | $ | 1,209 |
| | $ | 617 |
| | $ | 1,112 |
| | $ | 1,729 |
| | 1.5x | | 1.4x | | 8.9 | | 7.9 | | European & U.S. Direct Lending |
| ACE III(7) | 2015 | | 5,050 |
| | 2,822 |
| | 2,505 |
| | 503 |
| | 2,628 |
| | 3,131 |
| | 1.3x | | 1.3x | | 15.4 | | 11.6 | | European Direct Lending |
| PCS | 2017 | | 3,555 |
| | 3,365 |
| | 1,449 |
| | 98 |
| | 1,502 |
| | 1,600 |
| | 1.2x | | 1.1x | | 14.4 | | 10.0 | | U.S. Direct Lending |
| ACE IV Unlevered(8) | 2018 | | 9,014 |
| | 2,851 |
| | 939 |
| | 11 |
| | 974 |
| | 985 |
| | 1.1x | | 1.1x | | N/A | | N/A | | European Direct Lending |
| ACE IV Levered(8) | | | 4,819 |
| | 1,578 |
| | 26 |
| | 1,685 |
| | 1,711 |
| | 1.1x | | 1.1x | | N/A | | N/A | |
(1)Realized proceeds represent the sum of all cash distributions to all partners and if applicable, exclude tax and incentive distributions made to the general partner.
| |
(1) | Realized proceeds represent the sum of all cash distributions to all partners and if applicable, exclude tax and incentive distributions made to the general partner.(2)Unrealized value represents the fund's NAV reduced by the accrued incentive allocation, if applicable. There can be no assurance that unrealized values will be realized at the valuations indicated. (3)The gross multiple of invested capital (“MoIC”) is calculated at the fund-level and is based on the interests of the fee-paying limited partners and if applicable, excludes interests attributable to the non-fee paying limited partners and/or the general partner which does not pay management fees or carried interest. The gross MoIC is before giving effect to management fees, carried interest and other expenses, as applicable. (4)The net MoIC is calculated at the fund-level and is based on the interests of the fee-paying limited partners and if applicable, excludes those interests attributable to the non-fee paying limited partners and/or the general partner which does not pay management fees or carried interest. The net MoIC is after giving effect to management fees, carried interest, as applicable, and other expenses. The funds may utilize a credit facility during the investment period and for general cash management purposes. The net MoIC would have been lower had such fund called capital from its limited partners instead of utilizing the credit facility. (5)The gross IRR is an annualized since inception gross internal rate of return of cash flows to and from the fund and the fund’s residual value at the end of the measurement period. Gross IRR reflects returns to the fee-paying limited partners and, if applicable, excludes interests attributable to the non-fee paying limited partners and/or the general partner which does not pay management fees or carried interest. The cash flow dates used in the gross IRR calculation are based on the actual dates of the cash flows. The gross IRRs are calculated before giving effect to management fees, carried interest and other expenses, as applicable. (6)The net IRR is an annualized since inception net internal rate of return of cash flows to and from the fund and the fund’s residual value at the end of the measurement period. Net IRRs reflect returns to the fee-paying limited partners and, if applicable, exclude interests attributable to the non-fee paying limited partners and/or the general partner which does not pay management fees or carried interest. The cash flow dates used in the net IRR calculations are based on the actual dates of the cash flows. The net IRRs are calculated after giving effect to management fees, carried interest, as applicable, and other expenses. The funds may utilize a credit facility during the investment period and for general cash management purposes. Net fund-level IRRs would likely have been lower had such fund called capital from its limited partners instead of utilizing the credit facility. (7)ACE III is made up of two feeder funds, one denominated in U.S. dollars and one denominated in Euros. The gross and net IRR and MoIC presented in the table are for the Euro denominated feeder fund. The gross and net IRR for the U.S. dollar denominated feeder fund are 12.7% and 9.0%, respectively. The gross and net MoIC for the U.S. dollar denominated feeder fund are 1.4x and 1.3x, respectively. Original capital commitments are converted to U.S. dollars at the prevailing exchange rate at the time of the fund's closing. All other values for ACE III are for the combined fund and are converted to U.S. dollars at the prevailing quarter-end exchange rate. (8)ACE IV is made up of four parallel funds, two denominated in Euros and two denominated in pound sterling: ACE IV (E) Unlevered, ACE IV (G) Unlevered, ACE IV (E) Levered, and ACE IV (G) Levered. The gross and net IRR and MoIC presented in the table are for ACE IV (E) Unlevered and ACE IV (E) Levered. Metrics for ACE IV (E) Levered are inclusive of a U.S. dollar denominated feeder fund, which has not been presented separately. The gross and net IRR for ACE IV (G) Unlevered are 11.7% and 8.0%, respectively. The gross and net MoIC for ACE IV (G) Unlevered are 1.1x and 1.1.x, respectively. The gross and net IRR for ACE IV (G) Levered are 15.5% and 10.7%, respectively. The gross and net MoIC for ACE IV (G) Levered are 1.1x and 1.1x, respectively. Original capital commitments are converted to U.S. dollars at the prevailing exchange rate at the time of the fund's closing. All other values for ACE IV Unlevered and ACE IV Levered are for the combined levered and unlevered parallel funds and are converted to U.S. dollars at the prevailing quarter-end exchange rate.
|
| |
(2) | Unrealized value represents the fund's NAV reduced by the accrued incentive allocation, if applicable. There can be no assurance that unrealized values will be realized at the valuations indicated.
|
| |
(3) | The gross multiple of invested capital (“MoIC”) is calculated at the fund-level and is based on the interests of the fee-paying limited partners and if applicable, excludes interests attributable to the non-fee paying limited partners and/or the general partner which does not pay management fees or carried interest. The gross MoIC for CSF III is before giving effect to management fees and carried interest, as applicable. The gross MoIC for all other credit funds is before giving effect to management fees, carried interest, other expenses and taxes, as applicable.
|
| |
(4) | The net MoIC is calculated at the fund-level and is based on the interests of the fee-paying limited partners and if applicable, excludes those interests attributable to the non-fee paying limited partners and/or the general partner which does not pay management fees or carried interest. The net MoIC is after giving effect to management fees, carried interest, as applicable, and other expenses. The funds may utilize a credit facility during the investment period and for general cash management purposes. The net MoIC would have been lower had such fund called capital from its limited partners instead of utilizing the credit facility.
|
| |
(5) | The gross IRR is an annualized since inception gross internal rate of return of cash flows to and from the fund and the fund’s residual value at the end of the measurement period. Gross IRR reflects returns to the fee-paying limited partners and, if applicable, excludes interests attributable to the non-fee paying limited partners and/or the general partner which does not pay management fees or carried interest. The cash flow dates used in the gross IRR calculation are based on the actual dates of the cash flows. The gross IRRs for CSF III are calculated before giving effect to management fees and carried interest, as applicable. The gross IRRs for all other Credit funds are calculated before giving effect to management fees, carried interest, other expenses and taxes, as applicable.
|
| |
(6) | The net IRR is an annualized since inception net internal rate of return of cash flows to and from the fund and the fund’s residual value at the end of the measurement period. Net IRRs reflect returns to the fee-paying limited partners and, if applicable, exclude interests attributable to the non-fee paying limited partners and/or the general partner which does not pay management fees or carried interest. The cash flow dates used in the net IRR calculations are based on the actual dates of the cash flows. The net IRRs are calculated after giving effect to management fees, carried interest, as applicable, and other expenses. The funds may utilize a credit facility during the investment period and for general cash management purposes. Net fund-level IRRs would likely have been lower had such fund called capital from its limited partners instead of utilizing the credit facility.
|
| |
(7) | ACE III is made up of two feeder funds, one denominated in U.S. dollars and one denominated in Euros. The gross and net MoIC presented in the chart are for the Euro denominated feeder fund. The gross and net IRR for the U.S. dollar denominated feeder fund are 15.0% and 11.3%, respectively. The gross and net MoIC for the U.S. dollar denominated feeder fund are 1.3x and 1.2x, respectively. Original capital commitments are converted to U.S. dollars at the prevailing exchange rate at the time of the fund's closing. All other values for ACE III are for the combined fund and are converted to U.S. dollars at the prevailing quarter-end exchange rate.
|
| |
(8) | ACE IV is made up of four parallel funds: ACE IV (E) Unlevered, ACE IV (G) Unlevered, ACE IV (E) Levered, and ACE IV (G) Levered. The gross and net MoIC presented in the chart are for ACE IV (E) Unlevered and ACE IV (E) Levered. Metrics for ACE IV (E) Levered are inclusive of a U.S. Dollar denominated feeder fund, which has not been presented separately. The gross and net MoIC for ACE IV (G) Unlevered are 1.1x and 1.1x, respectively. The gross and net MoIC for ACE IV (G) Levered are 1.1x and 1.1.x, respectively. Original capital commitments are converted to U.S. Dollars at the prevailing exchange rate at the time of the fund's closing. All other values for ACE IV Unlevered and ACE IV Levered are for the combined levered and unlevered parallel funds and are converted to U.S. Dollars at the prevailing quarter-end exchange rate.
|
Private Equity Group—Three and Six Months Ended June 30, 20192020 Compared to Three and Six Months Ended June 30, 20182019
Fee Related Earnings:
The following table presents the components of the Private Equity Group's FRE and the changes forfrom the comparative periodsprior year ($ in thousands):
| | | | | | | | | | | | | | | | | | | | | | | | | | | | | | | | | | | | | | | | | | | | | | | |
| Three months ended June 30, | | | | Favorable (Unfavorable) | | | | Six months ended June 30, | | | | Favorable (Unfavorable) | | |
| | | | | | | | | | | | | | | |
| 2020 | | 2019 | | $ Change | | % Change | | 2020 | | 2019 | | $ Change | | % Change |
| Management fees | $ | 53,396 | | | $ | 52,162 | | | $ | 1,234 | | | 2 | % | | $ | 105,553 | | | $ | 103,558 | | | $ | 1,995 | | | 2 | % |
| Other fees | 30 | | | — | | | 30 | | | NM | | 140 | | | — | | | 140 | | | NM |
| Compensation and benefits | (22,126) | | | (21,291) | | | (835) | | | (4) | | | (41,722) | | | (42,487) | | | 765 | | | 2 | |
| General, administrative and other expenses | (4,448) | | | (4,912) | | | 464 | | | 9 | | | (10,081) | | | (8,969) | | | (1,112) | | | (12) | |
| Fee Related Earnings | $ | 26,852 | | | $ | 25,959 | | | 893 | | | 3 | | | $ | 53,890 | | | $ | 52,102 | | | 1,788 | | | 3 | |
|
| | | | | | | | | | | | | | | | | | | | | | | | | | | | | |
| | Three Months Ended June 30, | | Favorable (Unfavorable) | | Six Months Ended June 30, | | Favorable (Unfavorable) |
| | | | |
| | 2019 | | 2018 | | $ Change | | % Change | | 2019 | | 2018 | | $ Change | | % Change |
| Management fees | $ | 52,162 |
| | $ | 49,318 |
| | $ | 2,844 |
| | 6 | % | | $ | 103,558 |
| | $ | 99,205 |
| | $ | 4,353 |
| | 4 | % |
| Other fees | — |
| | 337 |
| | (337 | ) | | NM |
| | — |
| | 677 |
| | (677 | ) | | NM |
|
| Compensation and benefits | (21,291 | ) | | (18,672 | ) | | (2,619 | ) | | (14 | )% | | (42,487 | ) | | (37,871 | ) | | (4,616 | ) | | (12 | )% |
| General, administrative and other expenses | (4,912 | ) | | (4,175 | ) | | (737 | ) | | (18 | )% | | (8,969 | ) | | (8,216 | ) | | (753 | ) | | (9 | )% |
| Fee Related Earnings | $ | 25,959 |
| | $ | 26,808 |
| | (849 | ) | | (3 | )% | | $ | 52,102 |
| | $ | 53,795 |
| | (1,693 | ) | | (3 | )% |
NM - Not meaningfulMeaningful
Management Fees
Fees. The chartschart below presentpresents Private Equity Group management fees and effective management fee rates ($ in millions):
Management fees increased for the three and six months ended June 30, 2020 compared to the three and six months ended June 30, 2019 primarily from additional commitments and deployment in ASOF. Management fees also increased due to the launch of the corporate private equity continuation fund subsequent to the second quarter of 2019 and decreased due to ACOF III no longer paying management fees beginning in the fourth quarter of 2019.
The increases in effective management fee rates for the three and six months ended June 30, 2019 and 2018 ($ in millions):
Our first energy opportunities fund, which launched in the fourth quarter of 2018, generated management fees of $2.6 million and $5.2 million for2020 compared to the three and six months ended June 30, 2019 respectively. Capitalwere primarily driven by deployment in Ares Special Situations FundASOF that has a higher than average effective fee rate. In addition, ACOF IV L.P. (“SSF IV”) increasedhas stepped down to a lower than average effective fee rate and continues the run-off of its fee basis, which generated additionalassets. While the smaller asset base reduces our management fees, it contributes to the increase in effective fee rate because the lower than average rate is paid on a smaller asset base.
CompensationGeneral, Administrative and Benefits.Other Expenses. CompensationGeneral, administrative and benefitsother expenses increaseddecreased by $2.6$0.5 million, or 14%9%, for the three months ended June 30, 20192020 compared to the three months ended June 30, 20182019 and increased by $4.6$1.1 million, or 12%, for the six months ended June 30, 20192020 compared to the six months ended June 30, 2018.2019. The increasesthree and six month comparative periods were primarily drivenboth impacted by the timing ofCOVID-19 pandemic and resulted in a decrease in certain annual discretionary payments that were paid inoperating expenses. During the second quarter of 2020, our operating expenses were impacted by limitations in certain business activities, most notably travel and marketing, and by office services and fringe benefits from the current year but paidmodified remote working environment. Collectively, these expenses decreased by $1.6 million during the thirdsecond quarter of 2020. There was also an increase in the prior year.
General, administrativeplacement fees primarily in connection with new commitments to ASOF of $0.8 million and other expenses. General, administrative and other expenses increased by $0.7$1.3 million, or 18%, for the three and six months ended June 30, 2019 compared to the three months ended June 30, 2018 and by $0.8 million, or 9%, for2020, respectively. For the six months ended June 30, 2019 compared to the six months ended June 30, 2018. General, administrative and other expenses
will generally fluctuate2020, we also incurred $0.5 million of costs associated with the volumelaunch of deal flowASOF and new fund launches both of which increased during the comparative periods.AEOF.
Realized Income:
The following table presents the components of the Private Equity Group's RI and the changes forfrom the comparative periodsprior year ($ in thousands):
| | | | | | | | | | | | | | | | | | | | | | | | | | | | | | | | | | | | | | | | | | | | | | | |
| Three months ended June 30, | | | | Favorable (Unfavorable) | | | | Six months ended June 30, | | | | Favorable (Unfavorable) | | |
| 2020 | | 2019 | | $ Change | | % Change | | 2020 | | 2019 | | $ Change | | % Change |
| Fee Related Earnings | $ | 26,852 | | | $ | 25,959 | | | $ | 893 | | | 3 | % | | $ | 53,890 | | | $ | 52,102 | | | $ | 1,788 | | | 3 | % |
| Performance income-realized | 44,318 | | | 18,369 | | | 25,949 | | | 141 | | | 160,472 | | | 62,492 | | | 97,980 | | | 157 | |
| Performance related compensation-realized | (36,741) | | | (14,696) | | | (22,045) | | | (150) | | | (129,665) | | | (49,993) | | | (79,672) | | | (159) | |
| Realized net performance income | 7,577 | | | 3,673 | | | 3,904 | | | 106 | | | 30,807 | | | 12,499 | | | 18,308 | | | 146 | |
| Investment income-realized | 8,045 | | | 1,030 | | | 7,015 | | | NM | | 19,515 | | | 11,966 | | | 7,549 | | | 63 | |
| Interest and other investment income-realized | 487 | | | 3,318 | | | (2,831) | | | (85) | | | 1,299 | | | 3,612 | | | (2,313) | | | (64) | |
| Interest expense | (2,247) | | | (2,436) | | | 189 | | | 8 | | | (3,890) | | | (4,611) | | | 721 | | | 16 | |
| Realized net investment income | 6,285 | | | 1,912 | | | 4,373 | | | 229 | | | 16,924 | | | 10,967 | | | 5,957 | | | 54 | |
| Realized Income | $ | 40,714 | | | $ | 31,544 | | | 9,170 | | | 29 | | | $ | 101,621 | | | $ | 75,568 | | | 26,053 | | | 34 | |
|
| | | | | | | | | | | | | | | | | | | | | | | | | | | | | |
| | Three Months Ended June 30, | | Favorable (Unfavorable) | | Six Months Ended June 30, | | Favorable (Unfavorable) |
| | | | |
| | 2019 | | 2018 | | $ Change | | % Change | | 2019 | | 2018 | | $ Change | | % Change |
| Fee Related Earnings | $ | 25,959 |
| | $ | 26,808 |
| | $ | (849 | ) | | (3 | )% | | $ | 52,102 |
| | $ | 53,795 |
| | $ | (1,693 | ) | | (3 | )% |
| Performance income-realized | 18,369 |
| | 80,415 |
| | (62,046 | ) | | (77 | )% | | 62,492 |
| | 84,813 |
| | (22,321 | ) | | (26 | )% |
| Performance related compensation-realized | (14,696 | ) | | (64,311 | ) | | 49,615 |
| | 77 | % | | (49,993 | ) | | (67,871 | ) | | 17,878 |
| | 26 | % |
| Realized net performance income | 3,673 |
| | 16,104 |
| | (12,431 | ) | | (77 | )% | | 12,499 |
| | 16,942 |
| | (4,443 | ) | | (26 | )% |
| Investment income-realized | 1,030 |
| | 9,016 |
| | (7,986 | ) | | (89 | )% | | 11,966 |
| | 9,687 |
| | 2,279 |
| | 24 | % |
| Interest and other investment income-realized | 3,318 |
| | 2,920 |
| | 398 |
| | 14 | % | | 3,612 |
| | 2,979 |
| | 633 |
| | 21 | % |
| Interest expense | (2,436 | ) | | (1,440 | ) | | (996 | ) | | (69 | )% | | (4,611 | ) | | (2,668 | ) | | (1,943 | ) | | (73 | )% |
| Realized net investment income | 1,912 |
| | 10,496 |
| | (8,584 | ) | | (82 | )% | | 10,967 |
| | 9,998 |
| | 969 |
| | 10 | % |
| Realized Income | $ | 31,544 |
| | $ | 53,408 |
| | (21,864 | ) | | (41 | )% | | $ | 75,568 |
| | $ | 80,735 |
| | (5,167 | ) | | (6 | )% |
NM - Not Meaningful
Realized income for the periods presented was composed of FRE, as explained above, realized net performance income and realized net investment income for the respective periods.
Realized net performance income and realized net investment income for the three months ended June 30, 2020 were primarily attributable to realizations from the partial sale of ACOF III's position in FND. Realized net performance income and realized net investment income for the six months ended June 30, 2020 were primarily attributable to realizations from the monetization of ACOF IV's investment in NVA following the sale of the company and from the partial sale of ACOF III's position in FND.
Realized net performance income and realized net investment income for the three months ended June 30, 2019 were primarily attributable to a dividend from an ACOF III professional services portfolio company. Realized net performance income and realized net investment income for the six months ended June 30, 2019 were primarily attributable to realizations from the partial monetization of multiple investments held within ACOF III'sIII, including partial salessale of its positionsposition in Floor & Decor,FND, partial sale of its position in a real estate development portfolio company and a dividend from an ACOF III professional services portfolio company.
Realized net performance income and realized net investment income for the three and six months ended June 30, 2018 were primarily attributable to realizations from the monetization
Private Equity Group—Carried Interest
AccruedThe following table presents the accrued carried interest for the Private Equity Group is composed of the following (in($ in thousands):
| | | | | | | | | | | |
| | As of June 30, | | As of December 31, |
| 2020 | | 2019 |
| ACOF III | $ | 109,872 | | | $ | 156,053 | |
| ACOF IV | 385,757 | | | 343,546 | |
| ACOF V | — | | | 75,099 | |
| EIF V | 33,236 | | | 28,242 | |
| AEOF | — | | | 27,377 | |
| Other funds | 40,149 | | | 28,576 | |
| Total Private Equity Group | $ | 569,014 | | | $ | 658,893 | |
|
| | | | | | | |
| | As of June 30, | | As of December 31, |
| | 2019 | | 2018 |
| ACOF III | $ | 334,471 |
| | $ | 316,377 |
|
| ACOF IV | 287,294 |
| | 183,595 |
|
| EIF V | 15,694 |
| | — |
|
| First flagship energy opportunities fund | 11,033 |
| | — |
|
| Other funds | 4,972 |
| | 6,900 |
|
| Total Private Equity Group | $ | 653,464 |
| | $ | 506,872 |
|
The following table presentstables present the components of the total unrealized gains (losses) in the carried interest allocation for the Private Equity Group ($ in thousands):
| | | | | | | | | | | | | | | | | | | | | | | | | | | | | | | | | | | | | | | | | |
| | Three months ended June 30, 2020 | | | | | | Three months ended June 30, 2019 | | | | | | | | | | |
| Realized | | Unrealized, net | | Total Change in Unrealized | | Realized | | Unrealized, net | | Total Change in Unrealized | | | | | | |
| ACOF III | $ | 44,318 | | | $ | 5,239 | | | $ | 49,557 | | | $ | 18,369 | | | $ | (32,252) | | | $ | (13,883) | | | | | | | |
| ACOF IV | — | | | 179,694 | | | 179,694 | | | — | | | 60,237 | | | 60,237 | | | | | | | |
| | | | | | | | | | | | | | | | | |
| EIF V | — | | | 7,810 | | | 7,810 | | | — | | | 15,694 | | | 15,694 | | | | | | | |
| AEOF | — | | | — | | | — | | | — | | | 5,482 | | | 5,482 | | | | | | | |
| Other funds | — | | | 27,918 | | | 27,918 | | | — | | | (2,554) | | | (2,554) | | | | | | | |
| Total Private Equity Group | $ | 44,318 | | | $ | 220,661 | | | $ | 264,979 | | | $ | 18,369 | | | $ | 46,607 | | | $ | 64,976 | | | | | | | |
| | | | | | | | | | | | | | | | | | | | | | | | | | | | | | | | | | | | | | | | | |
| | Six months ended June 30, 2020 | | | | | | Six months ended June 30, 2019 | | | | | | | | | | |
| Realized | | Unrealized, net | | Total Change in Unrealized | | Realized | | Unrealized, net | | Total Change in Unrealized | | | | | | |
| ACOF III | $ | 46,710 | | | $ | (46,181) | | | $ | 529 | | | $ | 64,665 | | | $ | 18,094 | | | $ | 82,759 | | | | | | | |
| ACOF IV | 113,762 | | | 42,211 | | | 155,973 | | | — | | | 103,698 | | | 103,698 | | | | | | | |
| ACOF V | — | | | (75,099) | | | (75,099) | | | — | | | — | | | — | | | | | | | |
| EIF V | — | | | 4,994 | | | 4,994 | | | — | | | 15,694 | | | 15,694 | | | | | | | |
| AEOF | — | | | (27,377) | | | (27,377) | | | — | | | 11,033 | | | 11,033 | | | | | | | |
| Other funds | — | | | 11,601 | | | 11,601 | | | (2,173) | | | (1,904) | | | (4,077) | | | | | | | |
| Total Private Equity Group | $ | 160,472 | | | $ | (89,851) | | | $ | 70,621 | | | $ | 62,492 | | | $ | 146,615 | | | $ | 209,107 | | | | | | | |
Refer to "Consolidated Results of Operations of the Company—Carried Interest Allocation" of this report for further discussion of the total change in unrealized gains (losses) in carried interest allocation for the three and six months ended June 30, 2019 and 2018 (in thousands):Private Equity Group.
|
| | | | | | | | | | | | | | | | | | | | | | | |
| | Three Months Ended June 30, 2019 | | Three Months Ended June 30, 2018 |
| | Realized | | Unrealized | | Net | | Realized | | Unrealized | | Net |
| ACOF III | $ | 18,369 |
| | $ | (32,252 | ) | | $ | (13,883 | ) | | $ | 80,415 |
| | $ | (90,234 | ) | | $ | (9,819 | ) |
| ACOF IV | — |
| | 60,237 |
| | 60,237 |
| | — |
| | (41,578 | ) | | (41,578 | ) |
| EIF V | — |
| | 15,694 |
| | 15,694 |
| | — |
| | — |
| | — |
|
| First flagship energy opportunities fund | — |
| | 5,482 |
| | 5,482 |
| | — |
| | — |
| | — |
|
| Other funds | — |
| | (2,554 | ) | | (2,554 | ) | | — |
| | (1,793 | ) | | (1,793 | ) |
| Total Private Equity Group | $ | 18,369 |
| | $ | 46,607 |
| | $ | 64,976 |
| | $ | 80,415 |
| | $ | (133,605 | ) | | $ | (53,190 | ) |
|
| | | | | | | | | | | | | | | | | | | | | | | |
| | Six Months Ended June 30, 2019 | | Six Months Ended June 30, 2018 |
| | Realized | | Unrealized | | Net | | Realized | | Unrealized | | Net |
| ACOF III | $ | 64,665 |
| | $ | 18,094 |
| | $ | 82,759 |
| | $ | 83,209 |
| | $ | (59,584 | ) | | $ | 23,625 |
|
| ACOF IV | — |
| | 103,698 |
| | 103,698 |
| | 1,604 |
| | (33,150 | ) | | (31,546 | ) |
| EIF V | — |
| | 15,694 |
| | 15,694 |
| | — |
| | (16,215 | ) | | (16,215 | ) |
| First flagship energy opportunities fund | — |
| | 11,033 |
| | 11,033 |
| | — |
| | — |
| | — |
|
| Other funds | (2,173 | ) | | (1,904 | ) | | (4,077 | ) | | — |
| | (3,590 | ) | | (3,590 | ) |
| Total Private Equity Group | $ | 62,492 |
| | $ | 146,615 |
| | $ | 209,107 |
| | $ | 84,813 |
| | $ | (112,539 | ) | | $ | (27,726 | ) |
80
Private Equity Group—Assets Under Management
The tables below providepresent rollforwards of AUM for the Private Equity Group for the three months ended June 30, 2019 and 2018 (in($ in millions):
| | | | | | | | | | | | | | | | | | | | | | | | | | | | | | | | |
| | | Corporate Private Equity | | Infrastructure & Power | | Special Opportunities | | Energy Opportunities | | Total Private Equity Group |
| Balance at 3/31/2020 | | $ | 14,063 | | | $ | 3,227 | | | $ | 3,717 | | | $ | 1,008 | | | $ | 22,015 | |
| | | | | | | | | | |
| Net new par/equity commitments | | 3,287 | | | — | | | 1,466 | | | — | | | 4,753 | |
| | | | | | | | | | |
| Capital reductions | | (4) | | | — | | | (85) | | | (1) | | | (90) | |
| Distributions | | (371) | | | (17) | | | — | | | — | | | (388) | |
| | | | | | | | | | |
| Change in fund value | | 429 | | | (41) | | | 245 | | | (321) | | | 312 | |
| Balance at 6/30/2020 | | $ | 17,404 | | | $ | 3,169 | | | $ | 5,343 | | | $ | 686 | | | $ | 26,602 | |
Average AUM(1) | | $ | 15,734 | | | $ | 3,198 | | | $ | 4,530 | | | $ | 847 | | | $ | 24,309 | |
| | | | | | | | | | |
| | Corporate Private Equity | | Infrastructure & Power | | Special Opportunities | | Energy Opportunities | | Total Private Equity Group |
| Balance at 3/31/2019 | | $ | 17,519 | | | $ | 3,588 | | | $ | 1,809 | | | $ | 862 | | | $ | 23,778 | |
| Net new par/equity commitments | | — | | | — | | | 997 | | | — | | | 997 | |
| | | | | | | | | | |
| Capital reductions | | (1) | | | — | | | — | | | (1) | | | (2) | |
| Distributions | | (522) | | | (24) | | | (11) | | | — | | | (557) | |
| | | | | | | | | | |
| Change in fund value | | 425 | | | (7) | | | 77 | | | 24 | | | 519 | |
| Balance at 6/30/2019 | | $ | 17,421 | | | $ | 3,557 | | | $ | 2,872 | | | $ | 885 | | | $ | 24,735 | |
Average AUM(1) | | $ | 17,470 | | | $ | 3,573 | | | $ | 2,340 | | | $ | 874 | | | $ | 24,257 | |
| | | | | | | | | | |
| (1) Represents a two-point average of quarter-end balances for each period. | | | | | | | | | | |
| | | | | | | | | | |
| | Corporate Private Equity | | Infrastructure & Power | | Special Opportunities | | Energy Opportunities | | Total Private Equity Group |
| Balance at 12/31/2019 | | $ | 17,153 | | | $ | 3,233 | | | $ | 3,527 | | | $ | 1,253 | | | $ | 25,166 | |
| | | | | | | | | | |
| Net new par/equity commitments | | 3,287 | | | — | | | 1,830 | | | — | | | 5,117 | |
| | | | | | | | | | |
| Capital reductions | | (4) | | | — | | | (110) | | | (1) | | | (115) | |
| Distributions | | (2,207) | | | (17) | | | (2) | | | — | | | (2,226) | |
| | | | | | | | | | |
| Change in fund value | | (825) | | | (47) | | | 98 | | | (566) | | | (1,340) | |
| Balance at 6/30/2020 | | $ | 17,404 | | | $ | 3,169 | | | $ | 5,343 | | | $ | 686 | | | $ | 26,602 | |
Average AUM(1) | | $ | 16,207 | | | $ | 3,210 | | | $ | 4,196 | | | $ | 982 | | | $ | 24,595 | |
| | | | | | | | | | |
| | Corporate Private Equity | | Infrastructure & Power | | Special Opportunities | | Energy Opportunities | | Total Private Equity Group |
| Balance at 12/31/2018 | | $ | 17,159 | | | $ | 3,842 | | | $ | 1,733 | | | $ | 753 | | | $ | 23,487 | |
| Net new par/equity commitments | | (125) | | | — | | | 1,072 | | | 81 | | | 1,028 | |
| | | | | | | | | | |
| Capital reductions | | (4) | | | — | | | — | | | (1) | | | (5) | |
| Distributions | | (943) | | | (208) | | | (43) | | | — | | | (1,194) | |
| | | | | | | | | | |
| Change in fund value | | 1,334 | | | (77) | | | 110 | | | 52 | | | 1,419 | |
| Balance at 6/30/2019 | | $ | 17,421 | | | $ | 3,557 | | | $ | 2,872 | | | $ | 885 | | | $ | 24,735 | |
Average AUM(1) | | $ | 17,366 | | | $ | 3,663 | | | $ | 2,138 | | | $ | 833 | | | $ | 24,000 | |
| | | | | | | | | | |
| (1) Represents a three-point average of quarter-end balances for each period. | | | | | | | | | | |
|
| | | | | | | | | | | | | | | | | | | |
| | Corporate Private Equity | | Infrastructure & Power | | Special Opportunities | | Energy Opportunities | | Total Private Equity Group |
| Balance at 3/31/2019 | $ | 17,519 |
| | $ | 3,588 |
| | $ | 1,809 |
| | $ | 862 |
| | $ | 23,778 |
|
| Net new equity commitments | — |
| | — |
| | 997 |
| | — |
| | 997 |
|
| Distributions | (523 | ) | | (24 | ) | | (11 | ) | | (1 | ) | | (559 | ) |
| Change in fund value | 425 |
| | (7 | ) | | 77 |
| | 24 |
| | 519 |
|
| Balance at 6/30/2019 | $ | 17,421 |
| | $ | 3,557 |
| | $ | 2,872 |
| | $ | 885 |
| | $ | 24,735 |
|
| Average AUM(1) | $ | 17,470 |
| | $ | 3,573 |
| | $ | 2,340 |
| | $ | 874 |
| | $ | 24,257 |
|
|
| | | | | | | | | | | | | | | |
| | Corporate Private Equity | | Infrastructure & Power | | Special Opportunities | | Total Private Equity Group |
| Balance at 3/31/2018 | $ | 18,728 |
| | $ | 4,061 |
| | $ | 1,514 |
| | $ | 24,303 |
|
| Net new equity commitments | — |
| | 350 |
| | — |
| | 350 |
|
| Distributions | (485 | ) | | (545 | ) | | (9 | ) | | (1,039 | ) |
| Change in fund value | (157 | ) | | 117 |
| | 28 |
| | (12 | ) |
| Balance at 6/30/2018 | $ | 18,086 |
| | $ | 3,983 |
| | $ | 1,533 |
| | $ | 23,602 |
|
| Average AUM(1) | $ | 18,407 |
| | $ | 4,022 |
| | $ | 1,524 |
| | $ | 23,953 |
|
| |
(1) | Represents the quarterly average of beginning and ending balances. |
The tables below provide rollforwardscomponents of our AUM for the Private Equity Group for the six months ended June 30, 2019 and 2018 (in millions)are presented below ($ in billions):
|
| | | | | | | | | | | | | | | | | | | |
| | Corporate Private Equity | | Infrastructure & Power | | Special Opportunities | | Energy Opportunities | | Total Private Equity Group |
| Balance at 12/31/2018 | $ | 17,159 |
| | $ | 3,842 |
| | $ | 1,733 |
| | $ | 753 |
| | $ | 23,487 |
|
| Net new equity commitments | (125 | ) | | — |
| | 1,072 |
| | 81 |
| | 1,028 |
|
| Distributions | (947 | ) | | (208 | ) | | (43 | ) | | (1 | ) | | (1,199 | ) |
| Change in fund value | 1,334 |
| | (77 | ) | | 110 |
| | 52 |
| | 1,419 |
|
| Balance at 6/30/2019 | $ | 17,421 |
| | $ | 3,557 |
| | $ | 2,872 |
| | $ | 885 |
| | $ | 24,735 |
|
| Average AUM(1) | $ | 17,366 |
| | $ | 3,663 |
| | $ | 2,138 |
| | $ | 833 |
| | $ | 24,000 |
|
|
| | | | | | | | | | | | | | | |
| | Corporate Private Equity | | Infrastructure & Power | | Special Opportunities | | Total Private Equity Group |
| Balance at 12/31/2017 | $ | 18,557 |
| | $ | 4,423 |
| | $ | 1,550 |
| | $ | 24,530 |
|
| Net new equity commitments | 13 |
| | 350 |
| | — |
| | 363 |
|
| Distributions | (509 | ) | | (763 | ) | | (49 | ) | | (1,321 | ) |
| Change in fund value | 25 |
| | (27 | ) | | 32 |
| | 30 |
|
| Balance at 6/30/2018 | $ | 18,086 |
| | $ | 3,983 |
| | $ | 1,533 |
| | $ | 23,602 |
|
| Average AUM(1) | $ | 18,457 |
| | $ | 4,156 |
| | $ | 1,532 |
| | $ | 24,145 |
|
| | | | | |
(1)AUM: $26.6 | Represents the quarterly average of beginning and ending balances | AUM: $24.7 |
| | | | | | | | | | | | | | | | | | | | | | | |
| FPAUM | | AUM not yet paying fees | | Non fee paying | | General partner and affiliates |
Private Equity Group—Fee Paying AUM
The tables below providepresent rollforwards of fee paying AUM for the Private Equity Group for the three months ended June 30, 2019 and 2018 (in($ in millions):
| | | | | | | | | | | | | | | | | | | | | | | | | | | | | | | | |
| | | Corporate Private Equity | | Infrastructure & Power | | Special Opportunities | | Energy Opportunities | | Total Private Equity Group |
| FPAUM Balance at 3/31/2020 | | $ | 10,709 | | | $ | 3,352 | | | $ | 1,915 | | | $ | 1,044 | | | $ | 17,020 | |
| | | | | | | | | | |
| | | | | | | | | | |
| Subscriptions/deployment/increase in leverage | | — | | | — | | | 669 | | | — | | | 669 | |
| | | | | | | | | | |
| Distributions | | (5) | | | (52) | | | (159) | | | — | | | (216) | |
| | | | | | | | | | |
| | | | | | | | | | |
| | | | | | | | | | |
| FPAUM Balance at 6/30/2020 | | $ | 10,704 | | | $ | 3,300 | | | $ | 2,425 | | | $ | 1,044 | | | $ | 17,473 | |
Average FPAUM(1) | | $ | 10,707 | | | $ | 3,326 | | | $ | 2,170 | | | $ | 1,044 | | | $ | 17,247 | |
| | | | | | | | | | |
| | Corporate Private Equity | | Infrastructure & Power | | Special Opportunities | | Energy Opportunities | | Total Private Equity Group |
| FPAUM Balance at 3/31/2019 | | $ | 11,809 | | | $ | 3,411 | | | $ | 1,339 | | | $ | 763 | | | $ | 17,322 | |
| | | | | | | | | | |
| Subscriptions/deployment/increase in leverage | | 76 | | | — | | | 112 | | | — | | | 188 | |
| Capital reductions | | — | | | — | | | (4) | | | — | | | (4) | |
| Distributions | | (317) | | | (2) | | | (1) | | | — | | | (320) | |
| | | | | | | | | | |
| Change in fund value | | 2 | | | — | | | — | | | — | | | 2 | |
| | | | | | | | | | |
| FPAUM Balance at 6/30/2019 | | $ | 11,570 | | | $ | 3,409 | | | $ | 1,446 | | | $ | 763 | | | $ | 17,188 | |
Average FPAUM(1) | | $ | 11,690 | | | $ | 3,410 | | | $ | 1,393 | | | $ | 763 | | | $ | 17,256 | |
| | | | | | | | | | |
| (1) Represents a two-point average of quarter-end balances for each period. | | | | | | | | | | |
| | | | | | | | | | |
| | Corporate Private Equity | | Infrastructure & Power | | Special Opportunities | | Energy Opportunities | | Total Private Equity Group |
| FPAUM Balance at 12/31/2019 | | $ | 10,924 | | | $ | 3,352 | | | $ | 1,720 | | | $ | 1,044 | | | $ | 17,040 | |
| | | | | | | | | | |
| | | | | | | | | | |
| Subscriptions/deployment/increase in leverage | | 19 | | | — | | | 1,002 | | | — | | | 1,021 | |
| | | | | | | | | | |
| Distributions | | (235) | | | (52) | | | (297) | | | — | | | (584) | |
| | | | | | | | | | |
| Change in fund value | | (5) | | | — | | | — | | | — | | | (5) | |
| Change in fee basis | | 1 | | | — | | | — | | | — | | | 1 | |
| FPAUM Balance at 6/30/2020 | | $ | 10,704 | | | $ | 3,300 | | | $ | 2,425 | | | $ | 1,044 | | | $ | 17,473 | |
Average FPAUM(1) | | $ | 10,779 | | | $ | 3,335 | | | $ | 2,020 | | | $ | 1,044 | | | $ | 17,178 | |
| | | | | | | | | | |
| | Corporate Private Equity | | Infrastructure & Power | | Special Opportunities | | Energy Opportunities | | Total Private Equity Group |
| FPAUM Balance at 12/31/2018 | | $ | 11,716 | | | $ | 3,472 | | | $ | 1,201 | | | $ | 682 | | | $ | 17,071 | |
| Commitments | | — | | | — | | | — | | | 81 | | | 81 | |
| Subscriptions/deployment/increase in leverage | | 201 | | | 46 | | | 254 | | | — | | | 501 | |
| Capital reductions | | — | | | — | | | (8) | | | — | | | (8) | |
| Distributions | | (351) | | | (109) | | | (1) | | | — | | | (461) | |
| | | | | | | | | | |
| Change in fund value | | 4 | | | — | | | — | | | — | | | 4 | |
| | | | | | | | | | |
| FPAUM Balance at 6/30/2019 | | $ | 11,570 | | | $ | 3,409 | | | $ | 1,446 | | | $ | 763 | | | $ | 17,188 | |
Average FPAUM(1) | | $ | 11,698 | | | $ | 3,431 | | | $ | 1,329 | | | $ | 736 | | | $ | 17,194 | |
| | | | | | | | | | |
| (1) Represents a three-point average of quarter-end balances for each period. | | | | | | | | | | |
|
| | | | | | | | | | | | | | | | | | | |
| | Corporate Private Equity | | Infrastructure & Power | | Special Opportunities | | Energy Opportunities | | Total Private Equity Group |
| FPAUM Balance at 3/31/2019 | $ | 11,809 |
| | $ | 3,411 |
| | $ | 1,339 |
| | $ | 763 |
| | $ | 17,322 |
|
| Subscriptions/deployment/increase in leverage | 76 |
| | — |
| | 112 |
| | — |
| | 188 |
|
| Redemptions/distributions/decrease in leverage | (317 | ) | | (2 | ) | | (5 | ) | | — |
| | (324 | ) |
| Change in fund value | 2 |
| | — |
| | — |
| | — |
| | 2 |
|
| FPAUM Balance at 6/30/2019 | $ | 11,570 |
| | $ | 3,409 |
| | $ | 1,446 |
| | $ | 763 |
| | $ | 17,188 |
|
| Average FPAUM(1) | $ | 11,690 |
| | $ | 3,410 |
| | $ | 1,393 |
| | $ | 763 |
| | $ | 17,256 |
|
|
| | | | | | | | | | | | | | | |
| | Corporate Private Equity | | Infrastructure & Power | | Special Opportunities | | Total Private Equity Group |
| FPAUM Balance at 3/31/2018 | $ | 12,104 |
| | $ | 3,634 |
| | $ | 925 |
| | $ | 16,663 |
|
| Commitments | — |
| | 350 |
| | — |
| | 350 |
|
| Subscriptions/deployment/increase in leverage | 94 |
| | 33 |
| | 44 |
| | 171 |
|
| Redemptions/distributions/decrease in leverage | (66 | ) | | (500 | ) | | (24 | ) | | (590 | ) |
| Change in fund value | (5 | ) | | — |
| | — |
| | (5 | ) |
| FPAUM Balance at 6/30/2018 | $ | 12,127 |
| | $ | 3,517 |
| | $ | 945 |
| | $ | 16,589 |
|
| Average FPAUM(1) | $ | 12,116 |
| | $ | 3,576 |
| | $ | 935 |
| | $ | 16,627 |
|
The tablescharts below provide rollforwards of fee paying AUM for the Private Equity Group for the six months ended June 30, 2019 and 2018 (in millions):
|
| | | | | | | | | | | | | | | | | | | |
| | Corporate Private Equity | | Infrastructure & Power | | Special Opportunities | | Energy Opportunities | | Total Private Equity Group |
| FPAUM Balance at 12/31/2018 | $ | 11,716 |
| | $ | 3,472 |
| | $ | 1,201 |
| | $ | 682 |
| | $ | 17,071 |
|
| Commitments | — |
| | — |
| | — |
| | 81 |
| | $ | 81 |
|
| Subscriptions/deployment/increase in leverage | 200 |
| | 46 |
| | 254 |
| | — |
| | $ | 500 |
|
| Redemptions/distributions/decrease in leverage | (350 | ) | | (109 | ) | | (9 | ) | | — |
| | $ | (468 | ) |
| Change in fund value | 4 |
| | — |
| | — |
| | — |
| | $ | 4 |
|
| Change in fee basis | — |
| | — |
| | — |
| | — |
| | $ | — |
|
| FPAUM Balance at 6/30/2019 | $ | 11,570 |
| | $ | 3,409 |
| | $ | 1,446 |
| | $ | 763 |
| | $ | 17,188 |
|
| Average FPAUM(1) | $ | 11,698 |
| | $ | 3,431 |
| | $ | 1,329 |
| | $ | 736 |
| | $ | 17,194 |
|
|
| | | | | | | | | | | | | | | |
| | Corporate Private Equity | | Infrastructure & Power | | Special Opportunities | | Total Private Equity Group |
| FPAUM Balance at 12/31/2017 | $ | 12,073 |
| | $ | 4,019 |
| | $ | 766 |
| | $ | 16,858 |
|
| Commitments | 13 |
| | 350 |
| | — |
| | 363 |
|
| Subscriptions/deployment/increase in leverage | 123 |
| | 34 |
| | 217 |
| | 374 |
|
| Redemptions/distributions/decrease in leverage | (80 | ) | | (886 | ) | | (50 | ) | | (1,016 | ) |
| Change in fund value | (2 | ) | | — |
| | 12 |
| | 10 |
|
| FPAUM Balance at 6/30/2018 | $ | 12,127 |
| | $ | 3,517 |
| | $ | 945 |
| | $ | 16,589 |
|
| Average FPAUM(1) | $ | 12,101 |
| | $ | 3,723 |
| | $ | 879 |
| | $ | 16,703 |
|
(1) Represents the quarterly average of beginning and ending balances.
The components of our AUM, including the portion that ispresent FPAUM for the Private Equity Group are presented below as of June 30, 2019 and 2018 (in millions)by its fee basis ($ in billions):
|
| | | | | | | |
| FPAUM: $17.5 | FPAUM | | Non-fee paying | | AUM not yet earning fees | | General partner and affiliatesFPAUM: $17.2 |
| | | | | | | | | | | | | | |
| Capital commitments | | | Invested capital |
Private Equity Group—Fund Performance Metrics as of June 30, 20192020
The Private Equity Group managed 23 commingled funds and related co-investment vehicles as of June 30, 2019. Our significant funds combined for approximately 90%81% of the Private Equity Group’s management fees for the six months ended June 30, 2019. Our Corporate Private Equity funds focus on majority or shared-control investments, principally in under-capitalized companies in North America, Europe and Asia. Our special opportunities funds invest opportunistically across a broad spectrum of distressed or mispriced investments. Our infrastructure and power funds focus on generating long-term, stable cash-flowing investments in the power generation, transmission and midstream energy sector. Our energy opportunities fund targets investments in the energy industry where its flexible capital can provide attractive risk-adjusted returns while mitigating commodity risk.2020. ACOF III, ACOF IV, and U.S. Power Fund IV ("USPF IV") and Ares Special Situations Fund IV, L.P. ("SSF IV") are in harvest mode, meaning they are generally not seeking to deploy capital into new investment opportunities, while ACOF V SSF IV, EIF V and the first flagship energy opportunities fundAEOF are in deployment mode.
We do Ares Energy Investors Fund V, L.P. ("EIF V") is no longer considered a significant fund as it did not presentmeet our significant fund performance metrics for significant funds with less than two yearsthreshold beginning in the first quarter of investment performance, which begins from the date of the fund's first investment, except for those significant funds that pay management fees on invested capital, in which case performance is shown at the earlier of (i) the one-year anniversary of the fund's first investment or (ii) such time that the fund has invested at least 50% of its capital.2020.
The following table presents the performance data as of June 30, 20192020 for our significant funds in the Private Equity Group, all of which are drawdown funds ($ in millions):
| | | | | | | | | | | | | | | | | | | | | | | | | | | | | | | | | | | | | | | | | | | | | | | | | | | | | | | | | | | | | | | | | | | | | | | |
| | Year of Inception | | AUM | | Original Capital Commitments | | Capital Invested to Date | | Realized Proceeds(1) | | Unrealized Value(2) | | Total | | MoIC | | | | IRR(%) | | | | Primary Investment Strategy |
| Fund | | | | | | | | | | | | | | | Gross(3) | | Net(4) | | Gross(5) | | Net(6) | | |
| USPF IV | 2010 | | $ | 1,275 | | | $ | 1,688 | | | $ | 2,121 | | | $ | 1,393 | | | $ | 1,253 | | | $ | 2,646 | | | 1.2x | | 1.1x | | 6.1 | | 2.4 | | Infrastructure and Power |
| ACOF IV | 2012 | | 4,754 | | | 4,700 | | | 4,234 | | | 4,718 | | | 4,042 | | | 8,760 | | | 2.1x | | 1.8x | | 20.0 | | 14.0 | | Corporate Private Equity |
| SSF IV | 2015 | | 1,451 | | | 1,515 | | | 3,450 | | | 2,146 | | | 1,309 | | | 3,455 | | | 1.0x | | 1.0x | | 0.1 | | (1.7) | | Special Opportunities |
| ACOF V | 2017 | | 6,960 | | | 7,850 | | | 6,262 | | | 529 | | | 5,390 | | | 5,919 | | | 0.9x | | 0.9x | | (3.4) | | (7.8) | | Corporate Private Equity |
| AEOF | 2018 | | 687 | | | 1,120 | | | 908 | | | 12 | | | 520 | | | 532 | | | 0.6x | | 0.5x | | N/A | | N/A | | Energy Opportunities |
|
| | | | | | | | | | | | | | | | | | | | | | | | | | | | | | | | | | | | | |
| | Year of Inception | | AUM | | Original Capital Commitments | | Cumulative Invested Capital | | Realized Proceeds(1) | | Unrealized Value(2) | | Total Value | | MoIC | | IRR(%) | | Primary Investment Strategy |
| Fund | | | | | | | | Gross(3) | | Net(4) | | Gross(5) | | Net(6) | |
| ACOF III | 2008 | | $ | 2,936 |
| | $ | 3,510 |
| | $ | 3,885 |
| | $ | 7,656 |
| | $ | 2,650 |
| | $ | 10,306 |
| | 2.7x | | 2.2x | | 29.1 |
| | 20.8 |
| | Corporate Private Equity |
| USPF IV | 2010 | | 1,628 |
| | 1,688 |
| | 2,085 |
| | 1,215 |
| | 1,538 |
| | 2,753 |
| | 1.3x | | 1.2x | | 8.5 |
| | 5.3 |
| | Infrastructure and Power |
| ACOF IV | 2012 | | 5,633 |
| | 4,700 |
| | 4,230 |
| | 2,707 |
| | 4,920 |
| | 7,627 |
| | 1.8x | | 1.6x | | 19.0 |
| | 12.3 |
| | Corporate Private Equity |
| EIF V | 2015 | | 855 |
| | 801 |
| | 757 |
| | 237 |
| | 680 |
| | 917 |
| | 1.2x | | 1.1x | | 15.4 |
| | 8.9 |
| | Infrastructure and Power |
| SSF IV(7) | 2015 | | 1,518 |
| | 1,515 |
| | 2,805 |
| | 1,458 |
| | 1,305 |
| | 2,763 |
| | 1.0x | | 0.9x | | (1.4 | ) | | (3.3 | ) | | Special Opportunities |
| ACOF V | 2017 | | 8,198 |
| | 7,850 |
| | 4,570 |
| | 158 |
| | 5,154 |
| | 5,312 |
| | 1.2x | | 1.1x | | 13.9 |
| | 7.4 |
| | Corporate Private Equity |
| First flagship energy opportunities fund | 2019 | | 885 |
| | 756 |
| | 616 |
| | 4 |
| | 699 |
| | 703 |
| | 1.1x | | 1.1x | | N/A |
| | N/A |
| | Energy Opportunities |
| |
(1) | Realized proceeds represent the sum of all cash dividends, interest income, other fees and cash proceeds from realizations of interests in portfolio investments.Realized proceeds represent the sum of all cash dividends, interest income, other fees and cash proceeds from realizations of interests in portfolio investments. Realized proceeds exclude any proceeds related to bridge financings.
(2)Unrealized value represents the fair market value of remaining investments. Unrealized value does not take into account any bridge financings. There can be no assurance that unrealized investments will be realized at the valuations indicated. (3)The gross MoIC is calculated at the investment-level and is based on the interests of all partners. The gross MoIC is before giving effect to management fees, carried interest and other expenses, as applicable. The gross MoIC for the corporate private equity funds is also calculated before giving effect to any bridge financings. Inclusive of bridge financings, gross MoIC would be 2.0x for ACOF IV, 1.0x for ACOF V and 0.6x for AEOF. (4)The net MoIC for USPF IV and SSF IV is calculated at the fund-level. The net MoIC for the corporate private equity and energy opportunities funds is calculated at the investment level. For all funds, the net MoIC is based on the interests of the fee-paying limited partners and if applicable, excludes interests attributable to the non-fee paying limited partners and/or the general partner which does not pay management fees or performance fees. The net MoIC is after giving effect to management fees, carried interest, as applicable, and other expenses. The funds may utilize a credit facility during the investment period and for general cash management purposes. The net MoIC would have been lower had such fund called capital from its limited partners instead of utilizing the credit facility. (5)The gross IRR is an annualized since inception gross internal rate of return of cash flows to and from investments and the residual value of the investments at the end of the measurement period. Gross IRRs reflect returns to all partners. For SSF IV, cash flows used in the gross IRR calculation are based on the actual dates of the cash flows. For all other funds, cash flows are assumed to occur at month-end. The gross IRRs are calculated before giving effect to management fees, carried interest and other expenses, as applicable. The gross IRR for the corporate private equity funds is also calculated before giving effect to any bridge financings. Inclusive of bridge financings, the gross IRR would be 19.9% for ACOF IV and (2.8%) for ACOF V. (6)The net IRR is an annualized since inception net internal rate of return of cash flows to and from the fund and the fund’s residual value at the end of the measurement period. Net IRRs reflect returns to the fee-paying limited partners and if applicable, exclude interests attributable to the non-fee paying limited partners and/or the general partner which does not pay management fees or carried interest. The cash flow dates used in the net IRR calculation are based on the actual dates of the cash flows. The net IRRs are calculated after giving effect to management fees, carried interest as applicable, and other expenses and exclude commitments by the general partner and Schedule I investors who do not pay either management fees or carried interest. The funds may utilize a credit facility during the investment period and for general cash management purposes. Net fund-level IRRs would have generally been lower had such fund called capital from its limited partners instead of utilizing the credit facility.
|
| |
(2) | Unrealized value represents the fair market value of remaining investments. There can be no assurance that unrealized investments will be realized at the valuations indicated.
|
| |
(3) | The gross MoIC is calculated at the investment-level and is based on the interests of all partners. The gross MoIC is before giving effect to management fees, carried interest, other expenses and taxes, as applicable.
|
| |
(4) | The net MoIC for the infrastructure and power and SSF IV is calculated at the fund-level. The net MoIC for the corporate private equity funds is calculated at the investment level. For all funds, the net MoIC is based on the interests of the fee-paying limited partners and if applicable, excludes interests attributable to the non-fee paying limited partners and/or the general partner which does not pay management fees or performance fees. The net MoIC is after giving effect to management fees, carried interest, as applicable, and other expenses. The funds may utilize a credit facility during the investment period and for general cash management purposes. The net MoIC would have been lower had such fund called capital from its limited partners instead of utilizing the credit facility.
|
| |
(5) | The gross IRR is an annualized since inception gross internal rate of return of cash flows to and from investments and the residual value of the investments at the end of the measurement period. Gross IRRs reflect returns to all partners. For SSF IV, cash flows used in the gross IRR calculation are based on the actual dates of the cash flows. For all other funds, cash flows are assumed to occur at month-end. The gross IRRs are calculated before giving effect to management fees, carried interest, other expenses and taxes, as applicable.
|
| |
(6) | The net IRR is an annualized since inception net internal rate of return of cash flows to and from the fund and the fund’s residual value at the end of the measurement period. Net IRRs reflect returns to the fee-paying limited partners and if applicable, exclude interests attributable to the non-fee paying limited partners and/or the general partner which does not pay management fees or carried interest. The cash flow dates used in the net IRR calculation are based on the actual dates of the cash flows. The net IRRs are calculated after giving effect to management fees, carried interest as applicable, and other expenses and exclude commitments by the general partner and Schedule I investors who do not pay either management fees or carried interest. The funds may utilize a credit facility during the investment period and for general cash management purposes. Net fund-level IRRs would have generally been lower had such fund called capital from its limited partners instead of utilizing the credit facility.
|
| |
(7) | In January 2017, a new team assumed portfolio management of SSF IV. In addition to presenting the cumulative performance measure for SSF IV, we have also adopted a new performance measurement called “SSF IV 2.0”. SSF IV 2.0 is a subset of SSF IV positions and is intended to provide insight into the new team’s cumulative investment performance. SSF IV 2.0 investments represent (i) existing and re-underwritten positions by the new team on January 1, 2017 and (ii) all new investments made by the new team since January 1, 2017. As part of the re-underwriting process, each liquid investment in the SSF IV portfolio was evaluated and a determination was made whether to continue to hold such investment in the SSF IV portfolio or dispose of such investment. At the same time, legacy illiquid investments have been excluded from the SSF IV 2.0 track record as it was not possible to dispose of such investments in the near-term due to their private, illiquid nature. Since January 2017, SSF IV 2.0 has generated gross and net internal rates of return of 12.2% and 8.2% through June 30, 2019, respectively. The IRR is an annualized since inception internal rate of return of cash flows to and from investments and the residual value of the investments at the end of the measurement period. Cash flows used in the IRRs calculations are based on the actual dates of the cash flows. The gross IRRs are calculated before giving effect to management fees, carried interest, other expenses and taxes, as applicable. The net IRRs are calculated after giving effect to estimated management fees, carried interest and other expenses.
|
Real Estate Group—Three and Six Months Ended June 30, 20192020 Compared to Three and Six Months Ended June 30, 20182019
Fee Related Earnings:
The following table presents the components of the Real Estate Group's FRE and the changes forfrom the comparative periodsprior year ($ in thousands):
| | | | | | | | | | | | | | | | | | | | | | | | | | | | | | | | | | | | | | | | | | | | | | | |
| Three months ended June 30, | | | | Favorable (Unfavorable) | | | | Six months ended June 30, | | | | Favorable (Unfavorable) | | |
| | | | | | | | | | | | | | | |
| 2020 | | 2019 | | $ Change | | % Change | | 2020 | | 2019 | | $ Change | | % Change |
| Management fees | $ | 23,488 | | | $ | 21,770 | | | $ | 1,718 | | | 8 | % | | $ | 47,672 | | | $ | 40,420 | | | $ | 7,252 | | | 18 | % |
| Other fees | 7 | | | 672 | | | (665) | | | (99) | | | 711 | | | 681 | | | 30 | | | 4 | |
| Compensation and benefits | (12,735) | | | (11,928) | | | (807) | | | (7) | | | (25,148) | | | (21,212) | | | (3,936) | | | (19) | |
| General, administrative and other expenses | (3,263) | | | (3,523) | | | 260 | | | 7 | | | (6,198) | | | (6,655) | | | 457 | | | 7 | |
| Fee Related Earnings | $ | 7,497 | | | $ | 6,991 | | | 506 | | | 7 | | | $ | 17,037 | | | $ | 13,234 | | | 3,803 | | | 29 | |
|
| | | | | | | | | | | | | | | | | | | | | | | | | | | | | |
| | Three Months Ended June 30, | | Favorable (Unfavorable) | | Six Months Ended June 30, | | Favorable (Unfavorable) |
| | | | |
| | 2019 | | 2018 | | $ Change | | % Change | | 2019 | | 2018 | | $ Change | | % Change |
| Management fees | $ | 21,770 |
| | $ | 17,138 |
| | $ | 4,632 |
| | 27 | % | | $ | 40,420 |
| | $ | 32,311 |
| | $ | 8,109 |
| | 25 | % |
| Other fees | 672 |
| | 7 |
| | 665 |
| | NM |
| | 681 |
| | 10 |
| | 671 |
| | NM |
|
| Compensation and benefits | (11,928 | ) | | (8,768 | ) | | (3,160 | ) | | (36 | )% | | (21,212 | ) | | (16,407 | ) | | (4,805 | ) | | (29 | )% |
| General, administrative and other expenses | (3,523 | ) | | (2,391 | ) | | (1,132 | ) | | (47 | )% | | (6,655 | ) | | (4,823 | ) | | (1,832 | ) | | (38 | )% |
| Fee Related Earnings | $ | 6,991 |
| | $ | 5,986 |
| | 1,005 |
| | 17 | % | | $ | 13,234 |
| | $ | 11,091 |
| | 2,143 |
| | 19 | % |
NM - Not meaningful
Management Fees
Fees. The chartschart below presentpresents Real Estate Group management fees and effective management fee rates ($ in millions):
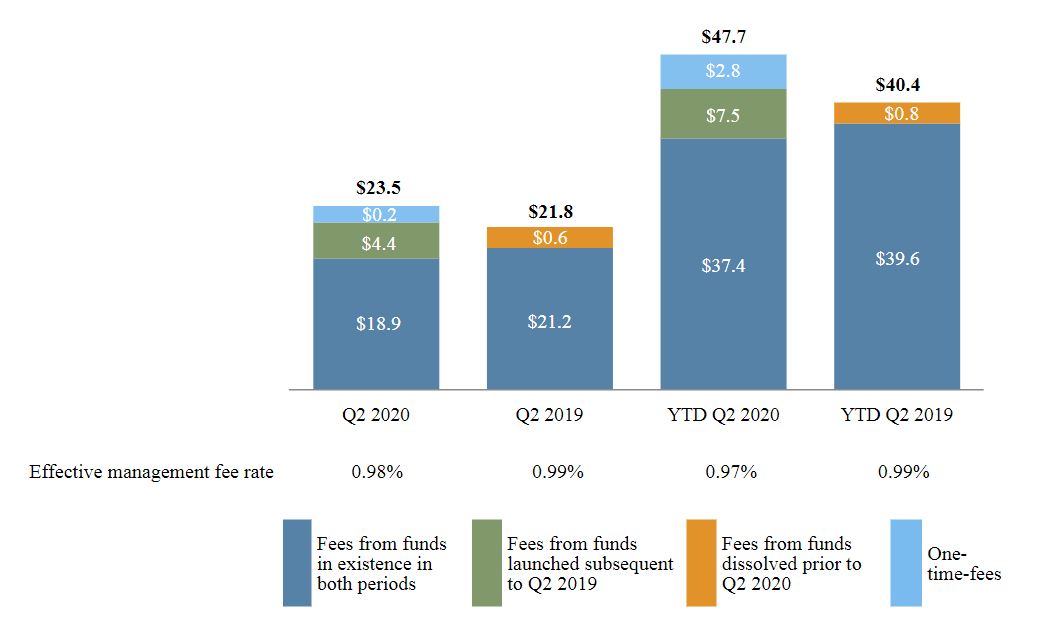
Management fees increased for thethree and six months ended June 30, 2020 compared to the three and six months ended June 30, 2019 primarily due to an increase in capital commitments relating to the launch of our third U.S. opportunistic real estate equity fund in the fourth quarter of 2019. The launch of this fund also generated one-time catch up fees of $0.2 million and $0.8 million for the three and six months ended June 30, 2020, respectively. Management fees also increased with deployment from our open-ended real estate debt funds, generating additional fees of $0.9 million and $1.6 million for the three and six months ended June 30, 2020 compared to the three and six months ended June 30, 2019, respectively. For the six months ended June 30, 2020, the increase in management fees was also driven by our Real Estate Group completing the sale of its stake in a 40-property pan-European logistics portfolio that resulted in the recognition of $2.0 million of deferred revenue that will not recur in future periods.
The decreases in effective management fee rates for the three and six months ended June 30, 2019 and 2018 ($ in millions):
Our fifth flagship European real estate equity fund generated additional management fees of $6.3 million and $10.9 million for2020 compared to the three and six month comparative periods, respectively, of which $3.6 million and $4.6 million were attributable to one-time catch up fees for the three and six month comparative periods, respectively, from additional capital commitments to the fund during the three and six month periodsmonths ended June 30, 2019. Conversely, multiple property sales held within several of our real estate equity funds resulted in decreases in management fees of $2.1 million and $4.1 million for the three and six month comparative periods, respectively.
The increases in effective management fee rates between periods2019 were primarily due to deploymentthe increase in committed capital from the launch of capital within our third
U.S. opportunistic real estate equity funds.fund. Our latest U.S. and Europeanmost recent real estate equity funds pay a lower fixed fee on committed capital and thenthat increases once that capital is invested. As a higher fee on deployed capital. Immediately following capital raising,result, our effective fee rate decreases temporarilyimmediately following capital raising and increases as capital is subsequently deployed.
Compensation and Benefits. Compensation and benefits expenses increased by $3.2$0.8 million, or 36%7%, for the three months ended June 30, 20192020 compared to the three months ended June 30, 20182019 and by $4.8$3.9 million, or 29%19%, for the six months ended June 30, 20192020 compared to the six months ended June 30, 2018.2019. The increases were primarily driven by higher incentive compensation attributable to the addition of new senior executives in connection with higher management feesthe fourth quarter of 2019.
General, Administrative and Other Expenses. General, administrative and other expenses decreased by $0.3 million, or 7%, for the three months ended June 30, 2020 compared to the three months ended June 30, 2019 and by $0.5 million, or 7%, for the six months ended June 30, 2020 compared to the six months ended June 30, 2019. The three and six month comparative periods.periods were both impacted by the COVID-19 pandemic and resulted in a decrease in certain operating expenses. During the second quarter of 2020, our operating expenses were impacted by limitations in certain business activities, most notably travel and marketing, and by office services and fringe benefits from the modified remote working environment. Collectively, these expenses decreased by $0.8 million during the second quarter of 2020. There was also an increase in placement fees of $0.5 million and $1.0 million for the three and six months ended June 30, 2020, respectively, primarily driven by new commitments to our third U.S. opportunistic real estate equity fund.
Realized Income:
The following table presents the components of the Real Estate Group's RI and the changes forfrom the comparative periodsprior year ($ in thousands):
| | | | | | | | | | | | | | | | | | | | | | | | | | | | | | | | | | | | | | | | | | | | | | | |
| Three months ended June 30, | | | | Favorable (Unfavorable) | | | | Six months ended June 30, | | | | Favorable (Unfavorable) | | |
| | | | | | | | | | | | | | | |
| 2020 | | 2019 | | $ Change | | % Change | | 2020 | | 2019 | | $ Change | | % Change |
| Fee Related Earnings | $ | 7,497 | | | $ | 6,991 | | | $ | 506 | | | 7 | % | | $ | 17,037 | | | $ | 13,234 | | | $ | 3,803 | | | 29 | % |
| Performance income-realized | 307 | | | 1,666 | | | (1,359) | | | (82) | | | 26,907 | | | 4,191 | | | 22,716 | | | NM |
| Performance related compensation-realized | (191) | | | (969) | | | 778 | | | 80 | | | (17,361) | | | (2,226) | | | (15,135) | | | NM |
| Realized net performance income | 116 | | | 697 | | | (581) | | | (83) | | | 9,546 | | | 1,965 | | | 7,581 | | | NM |
| Investment income-realized | 964 | | | 1,546 | | | (582) | | | (38) | | | 2,254 | | | 5,026 | | | (2,772) | | | (55) | |
| Interest and other investment income-realized | 920 | | | 2,119 | | | (1,199) | | | (57) | | | 1,716 | | | 3,224 | | | (1,508) | | | (47) | |
| Interest expense | (1,355) | | | (1,050) | | | (305) | | | (29) | | | (2,326) | | | (2,169) | | | (157) | | | (7) | |
| Realized net investment income | 529 | | | 2,615 | | | (2,086) | | | (80) | | | 1,644 | | | 6,081 | | | (4,437) | | | (73) | |
| Realized Income | $ | 8,142 | | | $ | 10,303 | | | (2,161) | | | (21) | | | $ | 28,227 | | | $ | 21,280 | | | 6,947 | | | 33 | |
|
| | | | | | | | | | | | | | | | | | | | | | | | | | | | | |
| | Three Months Ended June 30, | | Favorable (Unfavorable) | | Six Months Ended June 30, | | Favorable (Unfavorable) |
| | | | |
| | 2019 | | 2018 | | $ Change | | % Change | | 2019 | | 2018 | | $ Change | | % Change |
| Fee Related Earnings | $ | 6,991 |
| | $ | 5,986 |
| | $ | 1,005 |
| | 17 | % | | $ | 13,234 |
| | $ | 11,091 |
| | $ | 2,143 |
| | 19 | % |
| Performance income-realized | 1,666 |
| | 521 |
| | 1,145 |
| | 220 | % | | 4,191 |
| | 14,159 |
| | (9,968 | ) | | (70 | )% |
| Performance related compensation-realized | (969 | ) | | 7 |
| | (976 | ) | | NM |
| | (2,226 | ) | | (8,214 | ) | | 5,988 |
| | 73 | % |
| Realized net performance income | 697 |
| | 528 |
| | 169 |
| | 32 | % | | 1,965 |
| | 5,945 |
| | (3,980 | ) | | (67 | )% |
| Investment income (loss)-realized | 1,546 |
| | (250 | ) | | 1,796 |
| | NM |
| | 5,026 |
| | 3,100 |
| | 1,926 |
| | 62 | % |
| Interest and other investment income-realized | 2,119 |
| | 667 |
| | 1,452 |
| | 218 | % | | 3,224 |
| | 884 |
| | 2,340 |
| | 265 | % |
| Interest expense | (1,050 | ) | | (452 | ) | | (598 | ) | | (132 | )% | | (2,169 | ) | | (872 | ) | | (1,297 | ) | | (149 | )% |
| Realized net investment income (loss) | 2,615 |
| | (35 | ) | | 2,650 |
| | NM |
| | 6,081 |
| | 3,112 |
| | 2,969 |
| | 95 | % |
| Realized Income | $ | 10,303 |
| | $ | 6,479 |
| | 3,824 |
| | 59 | % | | $ | 21,280 |
| | $ | 20,148 |
| | 1,132 |
| | 6 | % |
NM - Not Meaningful
Realized income for the periods presented was composed of FRE, as explained above, realized net performance income and realized net investment income for the respective periods.
Realized net performance income for the six months ended June 30, 2019 was primarily attributable to the monetization of several properties held within a certain European equity real estate fund and a certain U.S. equity real estate fund. Realizedrealized net performanceinvestment income for the six months ended June 30, 2018 was2020 were primarily attributable to tax distributions receivedrealizations from EF IV.the sale of multiple properties held in a U.S real estate equity fund and the sale of a 40-property pan-European logistics portfolio held within multiple real estate funds.
Realized net performance income and investment income for the three and six months ended June 30, 2019 waswere primarily attributable to sales of multiple properties held within various U.S. real estate equity funds resulting in realized gains from our investments in these funds and to interest income from our investment in a U.S. real estate equity funds that was made in the fourth quarter of 2018. Realized net investment income for the six months ended June 30, 2018 was primarily attributable to salessale of multiple properties held within Ares US Real Estate Fund VIII, L.P. ("US VIII") and within various other U.S. real estate equity funds resulting infunds. Realized net realized gains from our investments in these funds.performance income and investment income for the six months ended June 30, 2019 also includes the monetization of several properties held within a certain European real estate equity fund.
Real Estate Group— Carried Interest and Incentive Fees
AccruedThe following table presents the accrued carried interest and incentive fee receivables for the Real Estate Group are composed of the following (in($ in thousands):
|
| | | | | | | |
| | As of June 30, | | As of December 31, |
| | 2019 | | 2018 |
| US VIII | $ | 58,054 |
| | $ | 50,847 |
|
| EF IV | 66,186 |
| | 65,166 |
|
| Other real estate funds | 64,247 |
| | 57,236 |
|
| Subtotal | 188,487 |
| | 173,249 |
|
| Other fee generating funds(1) | 12,310 |
| | 12,197 |
|
| Total Real Estate Group | $ | 200,797 |
| | $ | 185,446 |
|
| | | | | | | | | | | |
| | As of June 30, | | As of December 31, |
| | 2020 | | 2019 |
| US IX | $ | — | | | $ | 6,844 | |
| EF IV | 54,660 | | | 70,440 | |
| Other real estate funds | 111,648 | | | 128,826 | |
| Subtotal | 166,308 | | | 206,110 | |
Other fee generating funds(1) | 3,208 | | | 7,268 | |
| Total Real Estate Group | $ | 169,516 | | | $ | 213,378 | |
| |
(1) | Relates to investment income from AREA Sponsor Holdings LLC that is reclassified for segment reporting to align with the character of the underlying income generated. |
(1)Relates to investment income from AREA Sponsor Holdings LLC that is reclassified for segment reporting to align with the character of the underlying income generated.
The change in accrued carried interest and incentive fee receivable forfrom the comparative periodsprior year end was composed ofprimarily attributable to the following: (i) a $32.1$16.3 million increasedecrease in total unrealized carried interest allocation for the six months ended June 30, 2019;2020; (ii) $16.9$26.9 million of realized carried interest allocation in 2018 receivedand incentive fees realized during the six months ended June 30, 2019;2020; and (iii) $0.7 million of foreign currency translation and other adjustments.
The following table presentstables present the components of total change in unrealized incentive fees and carried interest allocation for the Real Estate Group for the three and six months ended June 30, 2019 and 2018 (in($ in thousands):
| | | | | | | | | | | | | | | | Three months ended June 30, 2020 | | | Three months ended June 30, 2019 | |
| | Three Months Ended June 30, 2019 | | Three Months Ended June 30, 2018 | | Realized | | Unrealized, net | | Total Change in Unrealized | | Realized | | Unrealized, net | | Total Change in Unrealized | |
| | Realized | | Unrealized | | Net | | Realized | | Unrealized | | Net | |
| US VIII | $ | — |
| | $ | 3,474 |
| | $ | 3,474 |
| | $ | — |
| | $ | 436 |
| | $ | 436 |
| |
| EF IV | — |
| | 6,197 |
| | 6,197 |
| | — |
| | 11,012 |
| | 11,012 |
| EF IV | $ | — | | | $ | (6,693) | | | $ | (6,693) | | | $ | — | | | $ | 6,197 | | | $ | 6,197 | | |
| Other real estate funds | 1,666 |
| | 7,508 |
| | 9,174 |
| | — |
| | 2,934 |
| | 2,934 |
| Other real estate funds | 308 | | | 2,449 | | | 2,757 | | | 1,666 | | | 10,982 | | | 12,648 | | |
| Subtotal | 1,666 |
|
| 17,179 |
|
| 18,845 |
| | — |
| | 14,382 |
| | 14,382 |
| Subtotal | 308 | | | (4,244) | | | (3,936) | | | 1,666 | | | 17,179 | | | 18,845 | | |
| Other fee generating funds(1) | — |
| | (27 | ) | | (27 | ) | | 521 |
| | (552 | ) | | (31 | ) | |
Other fee generating funds(1) | | Other fee generating funds(1) | (1) | | | (1,657) | | | (1,658) | | | — | | | (27) | | | (27) | | |
| Total Real Estate Group | $ | 1,666 |
|
| $ | 17,152 |
|
| $ | 18,818 |
| | $ | 521 |
|
| $ | 13,830 |
|
| $ | 14,351 |
| Total Real Estate Group | $ | 307 | | | $ | (5,901) | | | $ | (5,594) | | | $ | 1,666 | | | $ | 17,152 | | | $ | 18,818 | | |
|
| | | | | | | | | | | | | | | | | | | | | | | |
| | Six Months Ended June 30, 2019 | | Six Months Ended June 30, 2018 |
| | Realized | | Unrealized | | Net | | Realized | | Unrealized | | Net |
| US VIII | $ | — |
| | $ | 7,207 |
| | $ | 7,207 |
| | $ | — |
| | $ | 4,766 |
| | $ | 4,766 |
|
| EF IV | — |
| | 1,072 |
| | 1,072 |
| | 12,396 |
| | 1,104 |
| | 13,500 |
|
| Other real estate funds | 3,724 |
| | 23,694 |
| | 27,418 |
| | 1,242 |
| | 7,447 |
| | 8,689 |
|
| Subtotal | 3,724 |
| | 31,973 |
| | 35,697 |
| | 13,638 |
| | 13,317 |
| | 26,955 |
|
| Other fee generating funds(1) | 467 |
| | 113 |
| | 580 |
| | 521 |
| | (1,527 | ) | | (1,006 | ) |
| Total Real Estate Group | $ | 4,191 |
| | $ | 32,086 |
| | $ | 36,277 |
| | $ | 14,159 |
| | $ | 11,790 |
| | $ | 25,949 |
|
| | | | | | | | | | | | | | | | | | | | | | | | | | | | | | | | | | | | | | | | | |
| | Six months ended June 30, 2020 | | | | | | Six months ended June 30, 2019 | | | | | | | | | | |
| | Realized | | Unrealized, net | | Total Change in Unrealized | | Realized | | Unrealized, net | | Total Change in Unrealized | | | | | | |
| US IX | $ | — | | | $ | (6,844) | | | $ | (6,844) | | | $ | — | | | $ | — | | | $ | — | | | | | | | |
| EF IV | — | | | (15,741) | | | (15,741) | | | — | | | 1,072 | | | 1,072 | | | | | | | |
| Other real estate funds | 26,398 | | | (16,716) | | | 9,682 | | | 3,724 | | | 30,901 | | | 34,625 | | | | | | | |
| Subtotal | 26,398 | | | (39,301) | | | (12,903) | | | 3,724 | | | 31,973 | | | 35,697 | | | | | | | |
Other fee generating funds(1) | 509 | | | (3,882) | | | (3,373) | | | 467 | | | 113 | | | 580 | | | | | | | |
| Total Real Estate Group | $ | 26,907 | | | $ | (43,183) | | | $ | (16,276) | | | $ | 4,191 | | | $ | 32,086 | | | $ | 36,277 | | | | | | | |
| |
(1) | Relates to investment income from AREA Sponsor Holdings LLC that is reclassified for segment reporting to align with the character of the underlying income generated. |
(1)Relates to investment income from AREA Sponsor Holdings LLC that is reclassified for segment reporting to align with the character of the underlying income generated.
Real Estate Group—Assets Under Management
The tables below providepresent rollforwards of AUM for the Real Estate Group for the three months ended June 30, 2019 and 2018 (in($ in millions):
| | | | | | | | | | | | | | | | | | | | | | | | | | |
| | | Real Estate Equity - U.S. | | Real Estate Equity - Europe | | Real Estate Debt | | Total Real Estate Group |
| Balance at 3/31/2020 | | $ | 4,173 | | | $ | 4,511 | | | $ | 5,428 | | | $ | 14,112 | |
| | | | | | | | |
| Net new par/equity commitments | | 74 | | | 130 | | | 200 | | | 404 | |
| Net new debt commitments | | — | | | — | | | 38 | | | 38 | |
| Capital reductions | | — | | | — | | | (36) | | | (36) | |
| Distributions | | (91) | | | (80) | | | (19) | | | (190) | |
| | | | | | | | |
| Change in fund value | | (8) | | | 45 | | | 30 | | | 67 | |
| Balance at 6/30/2020 | | $ | 4,148 | | | $ | 4,606 | | | $ | 5,641 | | | $ | 14,395 | |
Average AUM(1) | | $ | 4,161 | | | $ | 4,559 | | | $ | 5,535 | | | $ | 14,255 | |
| | | | | | | | |
| | Real Estate Equity - U.S. | | Real Estate Equity - Europe | | Real Estate Debt | | Total Real Estate Group |
| Balance at 3/31/2019 | | $ | 3,894 | | | $ | 3,897 | | | $ | 4,019 | | | $ | 11,810 | |
| Net new par/equity commitments | | 38 | | | 279 | | | 138 | | | 455 | |
| Net new debt commitments | | — | | | — | | | 111 | | | 111 | |
| Capital reductions | | — | | | — | | | (89) | | | (89) | |
| Distributions | | (492) | | | (59) | | | (10) | | | (561) | |
| | | | | | | | |
| Change in fund value | | 64 | | | 65 | | | 13 | | | 142 | |
| Balance at 6/30/2019 | | $ | 3,504 | | | $ | 4,182 | | | $ | 4,182 | | | $ | 11,868 | |
Average AUM(1) | | $ | 3,699 | | | $ | 4,040 | | | $ | 4,101 | | | $ | 11,840 | |
| | | | | | | | |
| (1) Represents a two-point average of quarter-end balances for each period. | | | | | | | | |
| | | | | | | | |
| | Real Estate Equity - U.S. | | Real Estate Equity - Europe | | Real Estate Debt | | Total Real Estate Group |
| Balance at 12/31/2019 | | $ | 3,793 | | | $ | 4,588 | | | $ | 4,826 | | | $ | 13,207 | |
| | | | | | | | |
| Net new par/equity commitments | | 634 | | | 712 | | | 620 | | | 1,966 | |
| Net new debt commitments | | — | | | — | | | 263 | | | 263 | |
| Capital reductions | | — | | | — | | | (36) | | | (36) | |
| Distributions | | (144) | | | (652) | | | (37) | | | (833) | |
| | | | | | | | |
| Change in fund value | | (135) | | | (42) | | | 5 | | | (172) | |
| Balance at 6/30/2020 | | $ | 4,148 | | | $ | 4,606 | | | $ | 5,641 | | | $ | 14,395 | |
Average AUM(1) | | $ | 4,038 | | | $ | 4,568 | | | $ | 5,298 | | | $ | 13,904 | |
| | | | | | | | |
| | Real Estate Equity - U.S. | | Real Estate Equity - Europe | | Real Estate Debt | | Total Real Estate Group |
| Balance at 12/31/2018 | | $ | 4,163 | | | $ | 3,711 | | | $ | 3,466 | | | $ | 11,340 | |
| Net new par/equity commitments | | (72) | | | 470 | | | 219 | | | 617 | |
| Net new debt commitments | | — | | | — | | | 584 | | | 584 | |
| Capital reductions | | — | | | — | | | (89) | | | (89) | |
| Distributions | | (787) | | | (93) | | | (20) | | | (900) | |
| | | | | | | | |
| Change in fund value | | 200 | | | 94 | | | 22 | | | 316 | |
| Balance at 6/30/2019 | | $ | 3,504 | | | $ | 4,182 | | | $ | 4,182 | | | $ | 11,868 | |
Average AUM(1) | | $ | 3,854 | | | $ | 3,930 | | | $ | 3,889 | | | $ | 11,673 | |
| | | | | | | | |
| (1) Represents a three-point average of quarter-end balances for each period. | | | | | | | | |
|
| | | | | | | | | | | | | | | |
| | Real Estate Equity - U.S. | | Real Estate Equity - Europe | | Real Estate Debt | | Total Real Estate Group |
| Balance at 3/31/2019 | $ | 3,894 |
| | $ | 3,897 |
| | $ | 4,019 |
| | $ | 11,810 |
|
| Net new equity commitments | 38 |
| | 279 |
| | 138 |
| | 455 |
|
| Net new debt commitments | — |
| | — |
| | 111 |
| | 111 |
|
| Distributions | (492 | ) | | (59 | ) | | (99 | ) | | (650 | ) |
| Change in fund value | 64 |
| | 65 |
| | 13 |
| | 142 |
|
| Balance at 6/30/2019 | $ | 3,504 |
| | $ | 4,182 |
| | $ | 4,182 |
| | $ | 11,868 |
|
| Average AUM(1) | $ | 3,699 |
| | $ | 4,040 |
| | $ | 4,101 |
| | $ | 11,840 |
|
|
| | | | | | | | | | | | | | | |
| | Real Estate Equity - U.S. | | Real Estate Equity - Europe | | Real Estate Debt | | Total Real Estate Group |
| Balance at 3/31/2018 | $ | 4,505 |
| | $ | 3,388 |
| | $ | 3,003 |
| | $ | 10,896 |
|
| Net new equity commitments | 110 |
| | 197 |
| | — |
| | 307 |
|
| Distributions | (133 | ) | | (99 | ) | | (8 | ) | | (240 | ) |
| Change in fund value | 72 |
| | (135 | ) | | 10 |
| | (53 | ) |
| Balance at 6/30/2018 | $ | 4,554 |
| | $ | 3,351 |
| | $ | 3,005 |
| | $ | 10,910 |
|
| Average AUM(1) | $ | 4,530 |
| | $ | 3,370 |
| | $ | 3,004 |
| | $ | 10,904 |
|
The tables below provide rollforwardscomponents of our AUM for the Real Estate Group for the six months ended June 30, 2019 and 2018 (in millions)are presented below ($ in billions):
|
| | | | | | | | | | | | | | | |
| | Real Estate Equity - U.S. | | Real Estate Equity - Europe | | Real Estate Debt | | Total Real Estate Group |
| Balance at 12/31/2018 | $ | 4,163 |
| | $ | 3,711 |
| | $ | 3,466 |
| | $ | 11,340 |
|
| Net new equity commitments | (72 | ) | | 470 |
| | 219 |
| | 617 |
|
| Net new debt commitments | — |
| | — |
| | 583 |
| | 583 |
|
| Distributions | (788 | ) | | (93 | ) | | (108 | ) | | (989 | ) |
| Change in fund value | 201 |
| | 94 |
| | 22 |
| | 317 |
|
| Balance at 6/30/2019 | $ | 3,504 |
| | $ | 4,182 |
| | $ | 4,182 |
| | $ | 11,868 |
|
| Average AUM(1) | $ | 3,854 |
| | $ | 3,930 |
| | $ | 3,889 |
| | $ | 11,673 |
|
|
| | | | | | | | | | | | | | | |
| | Real Estate Equity - U.S. | | Real Estate Equity - Europe | | Real Estate Debt | | Total Real Estate Group |
| Balance at 12/31/2017 | $ | 4,578 |
| | $ | 2,704 |
| | $ | 2,947 |
| | $ | 10,229 |
|
| Net new equity commitments | 144 |
| | 965 |
| | 55 |
| | 1,164 |
|
| Distributions | (267 | ) | | (248 | ) | | (16 | ) | | (531 | ) |
| Change in fund value | 99 |
| | (70 | ) | | 19 |
| | 48 |
|
| Balance at 6/30/2018 | $ | 4,554 |
| | $ | 3,351 |
| | $ | 3,005 |
| | $ | 10,910 |
|
| Average AUM(1) | $ | 4,546 |
| | $ | 3,148 |
| | $ | 2,985 |
| | $ | 10,679 |
|
(1) Represents the quarterly average
| | | | | | | | | | | | | | | | | | | | | | | |
| FPAUM | | AUM not yet paying fees | | Non-fee paying | | General partner and affiliates |
Real Estate Group—Fee Paying AUM
The tables below providepresent rollforwards of fee paying AUM for the Real Estate Group for the three months ended June 30, 2019 and 2018 (in($ in millions):
| | | | | | | | | | | | | | | | | | | | | | | | | | |
| | | Real Estate Equity - U.S. | | Real Estate Equity - Europe | | Real Estate Debt | | Total Real Estate Group |
| FPAUM Balance at 3/31/2020 | | $ | 3,417 | | | $ | 3,911 | | | $ | 1,887 | | | $ | 9,215 | |
| | | | | | | | |
| Commitments | | 76 | | | 55 | | | — | | | 131 | |
| Subscriptions/deployment/increase in leverage | | 47 | | | 2 | | | 2 | | | 51 | |
| Capital reductions | | — | | | (7) | | | (30) | | | (37) | |
| Distributions | | (32) | | | (32) | | | (18) | | | (82) | |
| | | | | | | | |
| Change in fund value | | — | | | 36 | | | 17 | | | 53 | |
| | | | | | | | |
| FPAUM Balance at 6/30/2020 | | $ | 3,508 | | | $ | 3,965 | | | $ | 1,858 | | | $ | 9,331 | |
Average FPAUM(1) | | $ | 3,463 | | | $ | 3,938 | | | $ | 1,873 | | | $ | 9,274 | |
| | | | | | | | |
| | Real Estate Equity - U.S. | | Real Estate Equity - Europe | | Real Estate Debt | | Total Real Estate Group |
| FPAUM Balance at 3/31/2019 | | $ | 2,625 | | | $ | 3,317 | | | $ | 1,033 | | | $ | 6,975 | |
| Commitments | | — | | | 279 | | | — | | | 279 | |
| Subscriptions/deployment/increase in leverage | | 144 | | | 32 | | | 226 | | | 402 | |
| Capital reductions | | — | | | — | | | (67) | | | (67) | |
| Distributions | | (141) | | | (12) | | | (9) | | | (162) | |
| | | | | | | | |
| Change in fund value | | — | | | 22 | | | 14 | | | 36 | |
| | | | | | | | |
| FPAUM Balance at 6/30/2019 | | $ | 2,628 | | | $ | 3,638 | | | $ | 1,197 | | | $ | 7,463 | |
Average FPAUM(1) | | $ | 2,627 | | | $ | 3,478 | | | $ | 1,115 | | | $ | 7,220 | |
| | | | | | | | |
| (1) Represents a two-point average of quarter-end balances for each period. | | | | | | | | |
| | | | | | | | |
| | Real Estate Equity - U.S. | | Real Estate Equity - Europe | | Real Estate Debt | | Total Real Estate Group |
| FPAUM Balance at 12/31/2019 | | $ | 2,635 | | | $ | 3,792 | | | $ | 1,536 | | | $ | 7,963 | |
| | | | | | | | |
| Commitments | | 831 | | | 594 | | | 73 | | | 1,498 | |
| Subscriptions/deployment/increase in leverage | | 95 | | | 146 | | | 288 | | | 529 | |
| Capital reductions | | — | | | (17) | | | (30) | | | (47) | |
| Distributions | | (53) | | | (218) | | | (36) | | | (307) | |
| | | | | | | | |
| Change in fund value | | — | | | (21) | | | 27 | | | 6 | |
| Change in fee basis | | — | | | (311) | | | — | | | (311) | |
| FPAUM Balance at 6/30/2020 | | $ | 3,508 | | | $ | 3,965 | | | $ | 1,858 | | | $ | 9,331 | |
Average FPAUM(1) | | $ | 3,187 | | | $ | 3,889 | | | $ | 1,760 | | | $ | 8,836 | |
| | | | | | | | |
| | Real Estate Equity - U.S. | | Real Estate Equity - Europe | | Real Estate Debt | | Total Real Estate Group |
| FPAUM Balance at 12/31/2018 | | $ | 2,739 | | | $ | 3,269 | | | $ | 944 | | | $ | 6,952 | |
| Commitments | | — | | | 365 | | | — | | | 365 | |
| Subscriptions/deployment/increase in leverage | | 155 | | | 87 | | | 316 | | | 558 | |
| Capital reductions | | — | | | — | | | (67) | | | (67) | |
| Distributions | | (266) | | | (58) | | | (19) | | | (343) | |
| | | | | | | | |
| Change in fund value | | — | | | (25) | | | 23 | | | (2) | |
| | | | | | | | |
| FPAUM Balance at 6/30/2019 | | $ | 2,628 | | | $ | 3,638 | | | $ | 1,197 | | | $ | 7,463 | |
Average FPAUM(1) | | $ | 2,664 | | | $ | 3,408 | | | $ | 1,058 | | | $ | 7,130 | |
| | | | | | | | |
| (1) Represents a three-point average of quarter-end balances for each period. | | | | | | | | |
|
| | | | | | | | | | | | | | | |
| | Real Estate Equity - U.S. | | Real Estate Equity - Europe | | Real Estate Debt | | Total Real Estate Group |
| FPAUM Balance at 3/31/2019 | $ | 2,625 |
| | $ | 3,317 |
| | $ | 1,033 |
| | $ | 6,975 |
|
| Commitments | — |
| | 279 |
| | — |
| | 279 |
|
| Subscriptions/deployment/increase in leverage | 144 |
| | 32 |
| | 226 |
| | 402 |
|
| Redemptions/distributions/decrease in leverage | (141 | ) | | (12 | ) | | (76 | ) | | (229 | ) |
| Change in fund value | — |
| | 22 |
| | 14 |
| | 36 |
|
| FPAUM Balance at 6/30/2019 | $ | 2,628 |
| | $ | 3,638 |
| | $ | 1,197 |
| | $ | 7,463 |
|
| Average FPAUM(1) | $ | 2,627 |
| | $ | 3,478 |
| | $ | 1,115 |
| | $ | 7,220 |
|
|
| | | | | | | | | | | | | | | |
| | Real Estate Equity - U.S. | | Real Estate Equity - Europe | | Real Estate Debt | | Total Real Estate Group |
| FPAUM Balance at 3/31/2018 | $ | 3,008 |
| | $ | 2,729 |
| | $ | 1,014 |
| | $ | 6,751 |
|
| Commitments | 97 |
| | — |
| | — |
| | 97 |
|
| Subscriptions/deployment/increase in leverage | 14 |
| | 240 |
| | 26 |
| | 280 |
|
| Redemptions/distributions/decrease in leverage | (67 | ) | | (40 | ) | | (8 | ) | | (115 | ) |
| Change in fund value | 7 |
| | (67 | ) | | 10 |
| | (50 | ) |
| FPAUM Balance at 6/30/2018 | $ | 3,059 |
| | $ | 2,862 |
| | $ | 1,042 |
| | $ | 6,963 |
|
| Average FPAUM(1) | $ | 3,034 |
| | $ | 2,796 |
| | $ | 1,028 |
| | $ | 6,858 |
|
(1) Represents the quarterly average
The tablescharts below provide rollforwards of fee paying AUM for the Real Estate Group for the six months ended June 30, 2019 and 2018 (in millions):
|
| | | | | | | | | | | | | | | |
| | Real Estate Equity - U.S. | | Real Estate Equity - Europe | | Real Estate Debt | | Total Real Estate Group |
| FPAUM Balance at 12/31/2018 | $ | 2,739 |
| | $ | 3,269 |
| | $ | 944 |
| | $ | 6,952 |
|
| Commitments | — |
| | 365 |
| | — |
| | 365 |
|
| Subscriptions/deployment/increase in leverage | 155 |
| | 88 |
| | 316 |
| | 559 |
|
| Redemptions/distributions/decrease in leverage | (266 | ) | | (58 | ) | | (86 | ) | | (410 | ) |
| Change in fund value | — |
| | (26 | ) | | 23 |
| | (3 | ) |
| FPAUM Balance at 6/30/2019 | $ | 2,628 |
| | $ | 3,638 |
| | $ | 1,197 |
| | $ | 7,463 |
|
| Average FPAUM(1) | $ | 2,664 |
| | $ | 3,408 |
| | $ | 1,058 |
| | $ | 7,130 |
|
|
| | | | | | | | | | | | | | | |
| | Real Estate Equity - U.S. | | Real Estate Equity - Europe | | Real Estate Debt | | Total Real Estate Group |
| FPAUM Balance at 12/31/2017 | $ | 3,062 |
| | $ | 2,064 |
| | $ | 1,063 |
| | $ | 6,189 |
|
| Commitments | 126 |
| | 737 |
| | — |
| | 863 |
|
| Subscriptions/deployment/increase in leverage | 51 |
| | 338 |
| | 26 |
| | 415 |
|
| Redemptions/distributions/decrease in leverage | (148 | ) | | (83 | ) | | (67 | ) | | (298 | ) |
| Change in fund value | 5 |
| | (27 | ) | | 20 |
| | (2 | ) |
| Change in fee basis | (37 | ) | | (167 | ) | | — |
| | (204 | ) |
| FPAUM Balance at 6/30/2018 | $ | 3,059 |
| | $ | 2,862 |
| | $ | 1,042 |
| | $ | 6,963 |
|
| Average FPAUM(1) | $ | 3,043 |
| | $ | 2,552 |
| | $ | 1,040 |
| | $ | 6,635 |
|
(1) Represents the quarterly average of beginning and ending balances.
The components of our AUM, including the portion that ispresent FPAUM for the Real Estate Group are presented below as of June 30, 2019 and 2018 (in millions)by its fee basis ($ in billions):
|
| | | | | | | |
| FPAUM: $9.3 | FPAUM | | Non-fee paying | | AUM not yet earning fees | | General partner and affiliatesFPAUM: $7.4 |
| | | | | | | | | | | | | | | | | |
| Capital commitments | | Invested capital/other(1) | | Market value(2) |
(1)Other consists of ACRE's FPAUM, which is based on ACRE’s stockholders’ equity.
(2)Amounts represent FPAUM from funds that primarily invest in illiquid strategies. The underlying investments held in these funds are generally subject to less market volatility than investments held in liquid strategies.
Real Estate Group—Fund Performance Metrics as of June 30, 20192020
The Real Estate Group managed 45 funds as of June 30, 2019. Our significant funds in the Real Estate Group combined for approximately 57%37% of the Real Estate Group’s management fees for the six months ended June 30, 2019. EF IV and our fifth flagship2020. US IX, Ares European real estate fund are commingled funds focused on real estate assets located in Europe, primarily in the United Kingdom, France and Germany; and Ares US Real Estate Fund IX, L.P.V SCSp ("VEF IX"EF V"), a commingled and our third U.S. opportunistic real estate equity fund focused on real estate assets locatedare in United States.
We dodeployment mode, meaning they are generally seeking to invest capital into new investment opportunities. EF IV is no longer considered a significant fund as it did not presentmeet our significant fund performance metrics for significant funds with less than two yearsthreshold beginning in the first quarter of investment performance, which begins from the date of the fund's first investment, except for those significant funds that pay management fees on invested capital, in which case performance is shown at the earlier of (i) the one-year anniversary of the fund's first investment or (ii) such time that the fund has invested at least 50% of its capital.2020.
The following table presents the performance data as of June 30, 20192020 for our significant funds in the Real Estate Group, all of which are drawdown funds ($ in millions):
| | | | | | | | | | | | | | | | | | | | | | | | | | | | | | | | | | | | | | | | | | | | | | | | | | | | | | | | | | | | | | | | | | | | | | | |
| Year of Inception | | AUM | | Original Capital Commitments | | Capital Invested to Date | | Realized Proceeds(1) | | Unrealized Value(2) | | Total | | MoIC | | | | IRR(%) | | | | Primary
Investment Strategy |
| Fund | | | | | | | | | | | | | | | Gross(3) | | Net(4) | | Gross(5) | | Net(6) | | |
| US IX | 2017 | | $ | 1,027 | | | $ | 1,040 | | | $ | 851 | | | $ | 52 | | | $ | 837 | | | $ | 889 | | | 1.1x | | 1.1x | | 8.8 | | 5.4 | | U.S. Real Estate Equity |
EF V(7) | 2018 | | 1,950 | | | 1,968 | | | 647 | | | 46 | | | 656 | | | 702 | | | 1.1x | | 1.0x | | 9.6 | | (5.3) | | European Real Estate Equity |
| Third U.S. opportunistic real estate equity fund | 2019 | | 1,135 | | | 1,146 | | | 47 | | | — | | | 37 | | | 37 | | | 0.9x | | 0.8x | | N/A | | N/A | | U.S. Real Estate Equity |
|
| | | | | | | | | | | | | | | | | | | | | | | | | | | | | | | | | | | |
| | Year of Inception | | AUM | | Original Capital Commitments | | Cumulative Invested Capital | | Realized Proceeds(1) | | Unrealized Value(2) | | Total Value | | MoIC | | IRR(%) | | Primary Investment Strategy |
| Fund | | | | | | | | Gross(3) | | Net(4) | | Gross(5) | | Net(6) | |
| EF IV(7) | 2014 | | $ | 1,074 |
| | $ | 1,302 |
| | $ | 1,105 |
| | $ | 739 |
| | $ | 962 |
| | $ | 1,701 |
| | 1.5x | | 1.3x | | 19.2 | | 13.4 | | European Real Estate Equity |
| VEF IX | 2017 | | 1,029 |
| | 1,040 |
| | 595 |
| | 19 |
| | 584 |
| | 603 |
| | 1.1x | | 1.0x | | N/A | | N/A | | U.S. Real Estate Equity |
| Fifth flagship European real estate fund(8) | 2018 | | 1,557 |
| | 1,547 |
| | 308 |
| | 43 |
| | 303 |
| | 346 |
| | 1.1x | | 1.0x | | N/A | | N/A | | European Real Estate Equity |
| |
(1) | Realized proceeds include distributions of operating income, sales and financing proceeds received.Realized proceeds include distributions of operating income, sales and financing proceeds received.
(2)Unrealized value represents the fair value of remaining investments. There can be no assurance that unrealized investments will be realized at the valuations indicated. (3)The gross MoIC is calculated at the investment level and is based on the interests of all partners. The gross MoIC for all funds is before giving effect to management fees, carried interest and other expenses, as applicable. (4)The net MoIC is calculated at the fund-level and is based on the interests of the fee-paying partners and, if applicable, excludes interests attributable to the non fee-paying partners and/or the general partner which does not pay management fees, carried interest or has such fees rebated outside of the fund. The net MoIC is after giving effect to management fees, carried interest as applicable and other expenses. Net fund-level MoICs would generally likely have been lower had such fund called capital from its limited partners instead of utilizing the credit facility. (5)The gross IRR is an annualized since inception gross internal rate of return of cash flows to and from investments and the residual value of the investments at the end of the measurement period. Gross IRRs reflect returns to all partners. Cash flows used in the gross IRR calculation are assumed to occur at quarter-end. The gross IRRs are calculated before giving effect to management fees, carried interest and other expenses, as applicable. (6)The net IRR is an annualized since inception net internal rate of return of cash flows to and from the fund and the fund’s residual value at the end of the measurement period. Net IRRs reflect returns to the fee-paying partners and, if applicable, exclude interests attributable to the non fee-paying partners and/or the general partner which does not pay management fees or carried interest or has such fees rebated outside of the fund. The cash flow dates used in the net IRR calculation are based on the actual dates of the cash flows. The net IRRs are calculated after giving effect to management fees, carried interest as applicable, and other expenses. The funds may utilize a credit facility during the investment period and for general cash management purposes. Net fund-level IRRs would generally likely have been lower had such fund called capital from its limited partners instead of utilizing the credit facility. (7)EF V is made up of two parallel funds, one denominated in U.S. dollars and one denominated in Euros. The gross and net IRR and MoIC presented in the table are for the Euro denominated parallel fund. The gross and net IRRs for the U.S. dollar denominated parallel fund are 9.6% and (1.2)%, respectively. The gross and net MoIC for the U.S. dollar denominated parallel fund are 1.1x and 1.0x, respectively. Original capital commitments are converted to U.S. dollars at the prevailing exchange rate at the time of fund's closing. All other values for EF V are for the combined fund and are converted to U.S. dollars at the prevailing quarter-end exchange rate.
|
| |
(2) | Unrealized value represents the fair value of remaining investments. There can be no assurance that unrealized investments will be realized at the valuations indicated.
|
| |
(3) | The gross MoIC is calculated at the investment level and is based on the interests of all partners. The gross MoIC for all funds is before giving effect to management fees, carried interest, other expenses and taxes, as applicable.
|
| |
(4) | The net MoIC is calculated at the fund-level and is based on the interests of the fee-paying partners and, if applicable, excludes interests attributable to the non fee-paying partners and/or the general partner which does not pay management fees, carried interest or has such fees rebated outside of the fund. The net MoIC is after giving effect to management fees, carried interest as applicable and other expenses. Net fund-level MoICs would generally likely have been lower had such fund called capital from its limited partners instead of utilizing the credit facility.
|
| |
(5) | The gross IRR is an annualized since inception gross internal rate of return of cash flows to and from investments and the residual value of the investments at the end of the measurement period. Gross IRRs reflect returns to all partners. Cash flows used in the gross IRR calculation are assumed to occur at quarter-end. The gross IRRs are calculated before giving effect to management fees, carried interest, other expenses and taxes, as applicable.
|
| |
(6) | The net IRR is an annualized since inception net internal rate of return of cash flows to and from the fund and the fund’s residual value at the end of the measurement period. Net IRRs reflect returns to the fee-paying partners and, if applicable, exclude interests attributable to the non fee-paying partners and/or the general partner which does not pay management fees or carried interest or has such fees rebated outside of the fund. The cash flow dates used in the net IRR calculation are based on the actual dates of the cash flows. The net IRRs are calculated after giving effect to management fees, carried interest as applicable, and other expenses. The funds may utilize a credit facility during the investment period and for general cash management purposes. Net fund-level IRRs would generally likely have been lower had such fund called capital from its limited partners instead of utilizing the credit facility.
|
| |
(7) | EF IV is made up of two parallel funds, one denominated in U.S. dollars and one denominated in Euros. The gross and net MoIC and gross and net IRRs presented in the chart are for the Euro denominated parallel fund. The gross and net IRRs for the U.S. Dollar denominated parallel fund are 18.8% and 13.5%, respectively. The gross and net MoIC for the U.S. Dollar denominated parallel fund are 1.5x and 1.3x, respectively. Original capital commitments are converted to U.S. dollars at the prevailing exchange rate at the time of fund's closing. All other values for EF IV are for the combined fund and are converted to U.S. dollars at the prevailing quarter-end exchange rate.
|
| |
(8) | Our fifth flagship European real estate fund is made up of two parallel funds, one denominated in U.S. Dollars and one denominated in Euros. The gross MoIC presented in the chart is for the Euro denominated parallel fund. The gross and net MoIC for the U.S. Dollar denominated parallel fund are 1.1x and 1.0x, respectively. Original capital commitments are converted to U.S. Dollars at the prevailing exchange rate at the time of fund's closing. All other values for our fifth flagship European real estate fund are for the combined fund and are converted to U.S. Dollars at the prevailing quarter-end exchange rate.
|
Operations Management Group—Three and Six Months Ended June 30, 20192020 Compared to Three and Six Months Ended June 30, 20182019
Fee Related Earnings:
The following table presents the components of the OMG's FRE and the changes forfrom the comparative periodsprior year ($ in thousands):
| | | | | | | | | | | | | | | | | | | | | | | | | | | | | | | | | | | | | | | | | | | | | | | |
| Three months ended June 30, | | | | Favorable (Unfavorable) | | | | Six months ended June 30, | | | | Favorable (Unfavorable) | | |
| | | | | | | | | | | | | | | |
| 2020 | | 2019 | | $ Change | | % Change | | 2020 | | 2019 | | $ Change | | % Change |
| Compensation and benefits | $ | (36,939) | | | $ | (33,994) | | | $ | (2,945) | | | (9) | % | | $ | (73,365) | | | $ | (66,655) | | | $ | (6,710) | | | (10) | % |
| General, administrative and other expenses | (16,053) | | | (19,874) | | | 3,821 | | | 19 | | | (37,358) | | | (40,506) | | | 3,148 | | | 8 | |
| Fee Related Earnings | $ | (52,992) | | | $ | (53,868) | | | 876 | | | 2 | | | $ | (110,723) | | | $ | (107,161) | | | (3,562) | | | (3) | |
|
| | | | | | | | | | | | | | | | | | | | | | | | | | | | | |
| | Three Months Ended June 30, | | Favorable (Unfavorable) | | Six Months Ended June 30, | | Favorable (Unfavorable) |
| | | | |
| | 2019 | | 2018 | | $ Change | | % Change | | 2019 | | 2018 | | $ Change | | % Change |
| Compensation and benefits | $ | (33,994 | ) | | $ | (30,680 | ) | | $ | (3,314 | ) | | (11 | )% | | $ | (66,655 | ) | | $ | (60,872 | ) | | $ | (5,783 | ) | | (10 | )% |
| General, administrative and other expenses | (19,874 | ) | | (19,236 | ) | | (638 | ) | | (3 | )% | | (40,506 | ) | | (37,627 | ) | | (2,879 | ) | | (8 | )% |
| Fee Related Earnings | $ | (53,868 | ) | | $ | (49,916 | ) | | (3,952 | ) | | (8 | )% | | $ | (107,161 | ) | | $ | (98,499 | ) | | (8,662 | ) | | (9 | )% |
Compensation and Benefits. Compensation and benefits expenses increased by $3.3$2.9 million, or 11%9%, for the three months ended June 30, 20192020 compared to the three months ended June 30, 20182019 and by $5.8$6.7 million, or 10%, for the six months ended June 30, 20192020 compared to the six months ended June 30, 2018.2019. The increases were primarily driven by higher incentive compensation attributable to management fee growth and 7%the headcount growth from the expansion of our strategy and relationship management teams to support global fundraising and other strategic initiatives and of our business operations teams. The expansion of our business operations teams internalized certain business processes and included opening a new office in India during the second half of 2019. This expense growth of $1.2 million and $2.0 million for the three and six months ended June 30, 2020 was offset by reduced outsourced third party service provider expenses for accounting and information technology support that are reflected within general, administrative and other expenses.
General, Administrative and Other Expenses. General, administrative and other expenses decreased by $3.8 million, or 19%, for the three months ended June 30, 2020 compared to the three months ended June 30, 2019 and by $3.1 million, or 8%, for the six months ended June 30, 2020 compared to the six months ended June 30, 2019. The decreases were driven by a reduction in costs resulting from our efforts to build out operations in India. While occupancy and overhead costs increased, the reduction to outsourced third party service provider expenses resulted in the net reduction in total expenses of $1.4 million and $3.0 million for the three and six months ended June 30, 2020, respectively. We also incurred $0.7 million of start-up costs in the first half of 2019 that did not recur in the current year.
The three and six month comparative periods. We continueperiods were both impacted by the COVID-19 pandemic and resulted in a decrease in certain operating expenses. During the second quarter of 2020, our operating expenses were impacted by limitations in certain business activities, most notably travel and marketing, and by office services and fringe benefits from the modified remote working environment. Collectively, these expenses decreased by $2.0 million during the second quarter of 2020.
Certain expenses have increased during the current period, including occupancy costs to invest in resources dedicated to help evolvesupport our middlegrowing headcount and back office capabilitiesinformation services and marketing costs to support the growing needsexpansion of our businessbusiness. To support our modified remote working environment, we also incurred additional information technology and communication expenses that increased by $0.9 million and $1.7 million for the three and six months ended June 30, 2020, respectively.
During the second quarter of 2020, we received insurance proceeds of $2.5 million in connection with the years ahead.previously disclosed SEC matter. For the six months ended June 30, 2020, we recorded net expenses of $1.0 million in connection with this matter that included a civil penalty of $1.0 million.
Realized Income:
The following table presents the components of the OMG's RI and the changes forfrom the comparative periodsprior year ($ in thousands):
| | | | Three Months Ended June 30, | | Favorable (Unfavorable) | | Six Months Ended June 30, | | Favorable (Unfavorable) | | Three months ended June 30, | | | Favorable (Unfavorable) | | | Six months ended June 30, | | | Favorable (Unfavorable) | |
| | | | | | | | | | |
| | 2019 | | 2018 | | $ Change | | % Change | | 2019 | | 2018 | | $ Change | | % Change | | 2020 | | 2019 | | $ Change | | % Change | | 2020 | | 2019 | | $ Change | | % Change |
| Fee Related Earnings | $ | (53,868 | ) | | $ | (49,916 | ) | | $ | (3,952 | ) | | (8 | )% | | $ | (107,161 | ) | | $ | (98,499 | ) | | $ | (8,662 | ) | | (9 | )% | Fee Related Earnings | $ | (52,992) | | | $ | (53,868) | | | $ | 876 | | | 2 | % | | $ | (110,723) | | | $ | (107,161) | | | $ | (3,562) | | | (3) | % |
| Investment income-realized | — |
| | 798 |
| | (798 | ) | | NM |
| | — |
| | 1,636 |
| | (1,636 | ) | | NM |
| |
| Interest and other investment income (loss)-realized | (17 | ) | | 584 |
| | (601 | ) | | NM |
| | (2 | ) | | 1,736 |
| | (1,738 | ) | | NM |
| |
| Investment loss-realized | | Investment loss-realized | — | | | — | | | — | | | — | | | (5,698) | | | — | | | (5,698) | | | NM |
| Interest and other investment loss-realized | | Interest and other investment loss-realized | (253) | | | (17) | | | (236) | | | NM | | (85) | | | (2) | | | (83) | | | NM |
| Interest expense | (399 | ) | | (588 | ) | | 189 |
| | 32 | % | | (795 | ) | | (1,136 | ) | | 341 |
| | 30 | % | Interest expense | (144) | | | (399) | | | 255 | | | 64 | | | (1,121) | | | (795) | | | (326) | | | (41) | |
| Realized net investment income (loss) | (416 | ) | | 794 |
| | (1,210 | ) | | NM |
| | (797 | ) | | 2,236 |
| | (3,033 | ) | | NM |
| |
| Realized net investment loss | | Realized net investment loss | (397) | | | (416) | | | 19 | | | 5 | | | (6,904) | | | (797) | | | (6,107) | | | NM |
| Realized Income | $ | (54,284 | ) | | $ | (49,122 | ) | | (5,162 | ) | | (11 | )% | | $ | (107,958 | ) | | $ | (96,263 | ) | | (11,695 | ) | | (12 | )% | Realized Income | $ | (53,389) | | | $ | (54,284) | | | 895 | | | 2 | | | $ | (117,627) | | | $ | (107,958) | | | (9,669) | | | (9) | |
NM - Not Meaningful
Realized income for the periods presented was composed of FRE, as explained above, and realized net investment income for the respective periods.
Realized net investment income decreased from $0.8 million and $2.2loss was $6.9 million for the three and six months ended June 30, 2018 to realized net investment loss of $0.4 million and $0.8 million for the three and six months ended June 30, 2019. The decreases were2020 primarily driven by net investment income from oura realized loss associated with the sale of a non–core energy investments recognized in the prior year periods that were subsequently sold in the fourth quarter of 2018.insurance-related investment.
Liquidity and Capital Resources
Management assesses liquidity in terms of our ability to generate cash to fund operating, investing and financing activities. In the wake of the COVID-19 pandemic, management believes that the Company is well-positioned and its liquidity will continue to be sufficient for its foreseeable working capital needs, contractual obligations, dividend payments, pending acquisitions and strategic initiatives. For further discussion regarding the potential risks and impact of the COVID-19 pandemic on the Company, see Item 1A. "Risk Factors" in this Quarterly Report on Form 10-Q.
Sources and Uses of Liquidity
Our sources of liquidity are (1) cash on hand, (2) net working capital, (3) cash from operations, including management fees, which are collected monthly, quarterly or semi-annually, and net realized performance income, which is unpredictable as to amount and timing, (4) fund distributions related to our investments that are also unpredictable as to amount and timing and (5) net borrowing from the Credit Facility. As of June 30, 2019,2020, our cash and cash equivalents were $247.2$890.0 million, and we had $320.0 million ofno borrowings outstanding under our Credit Facility. Our ability to draw from the Credit Facility is subject to a leverage covenant.and other covenants. We remain in compliance with all covenants as of June 30, 2020. We believe that these sources of liquidity will be sufficient to fund our working capital requirements and to meet our commitments in the ordinary course of business and under the current market conditions for the foreseeable future. Market conditions resulting from the COVID-19 pandemic may impact our liquidity. Cash flows from management fees may be impacted by a slowdown or declines in deployment, declines or write downs in valuations, or a slowdown or negatively impacted fundraising. In addition, management fees may be subject to deferral. Declines or delays and transaction activity may impact our fund distributions and net realized performance income which could adversely impact our cash flows and liquidity. Market conditions may make it difficult to extend the maturity of or refinance our existing indebtedness or obtain new indebtedness with similar terms.
One of our sources of cash from operations is ARCC Part I Fees. Under certain circumstances, ARCC Part I Fees that have been earned and recorded by us as revenue may be deferred for payment under the terms of the applicable investment advisory and management agreement with ARCC. ARCC Part I Fees are earned based on ARCC’s net investment income, which does not include any realized gains or losses or any unrealized gains or losses resulting from changes in fair value. Cash payment of ARCC Part I Fees that we have earned is deferred if, during the most recent four full calendar quarter periods ending on or prior to the date such payment is to be made, the sum of (a) aggregate distributions to ARCC's stockholders and (b) ARCC's change in net assets (defined as ARCC's total assets less indebtedness and before taking into account any income based fees or capital gains incentive fees accrued during the period) is less than 7.0% of ARCC's net assets (defined as total assets less indebtedness) at the beginning of such period. These calculations will be adjusted for any share issuances or repurchases. Once earned, ARCC Part I Fees are not reversible even if payment is deferred. All fees deferred for payment will be carried over for payment in subsequent calculation periods to the extent the payment hurdle is achieved in accordance with the investment advisory and management agreement with ARCC. The impacts of COVID-19 are unknown and could result in
market dislocations that could cause the ARCC Part I Fees to continue to be earned yet deferred for payment. In such cases, we may continue to recognize the revenue, and such earned but unpaid amounts would result in a larger receivable from affiliates. The impact of this deferral mechanic to our liquidity is offset by the fact that 60% of ARCC Part I Fees are due to certain professionals as compensation, which is recorded as a liability but may not be paid until the related cash is received by us. Therefore, the potential liquidity impact of a deferral of the payment of ARCC Part I Fees is limited to 40% of the total amount of ARCC Part I Fees earned. As a result, while the deferral of the payment of ARCC Part I Fees for the three months ended June 30, 2020 will reduce our liquidity by $16.5 million, we do not believe this limits our ability to meet our primary liquidity needs.
We expect that our primary liquidity needs will continue to be to (1) provide capital to facilitate the growth of our existing investment management businesses, (2) fund our investment commitments, (3) provide capital to facilitate our expansion into businesses that are complementary to our existing investment management businesses as well as other strategic growth initiatives, (4) pay operating expenses, including cash compensation to our employees and payments under the tax receivable agreement (“TRA”), (5) fund capital expenditures, (6) service our debt, (7) pay income taxes and (8) make dividend payments to our Class A common stockholders and the Series A Preferred stockholders in accordance with our dividend policy.
In the normal course of business, we intendexpect to pay dividends based onthat are aligned with the expected changes in our expected fee related earnings. If cash flow from operations were insufficient to fund dividends over a sustained period of time, we expect that we would suspend or reduce paying such dividends. In addition, there is no assurance that dividends would continue at the current levels or at all. Unless quarterly dividends have been declared and paid (or declared and set apart for payment) on the Series A Preferred Stock, we may not declare or pay or set apart payment for dividends on any shares of our Class A common stock during the period. Dividends on Series A Preferred Stock are not cumulative and the Series A Preferred Stock is not convertible into our Class A common stock or any other security.
In February 2019,Our ability to obtain debt financing provides us with additional sources of liquidity. For further discussion of financing transactions occurring in the current period and our board of directors authorized the repurchase of updebt obligations, see "Cash Flows" within this section and "Note 7. Debt” to $150 million of shares of our Class A common stock. Underunaudited condensed consolidated financial statements included in this stock repurchase program, sharesQuarterly Report on Form 10-Q.
Stock offerings and repurchases may be repurchased from timeadditional sources and uses of liquidity, respectively. For a discussion of transactions occurring in the current period, see "Cash Flows" within this section and "Note 13. Equity” to timeour unaudited condensed consolidated financial statements included in open market purchases, privately negotiated transactions or otherwise, includingthis Quarterly Report on Form 10-Q.
Net realized performance income also provides us with a source of liquidity. Performance income may be realized when a portfolio investment is profitably disposed of and the fund’s cumulative returns are in reliance on Rule 10b5-1excess of the Securities Act. The program is scheduled to expire in February 2020. Repurchases underpreferred return or hurdle rate or may be realized at the program depend on the prevailing market conditions and other factors.
During the three and six months ended June 30, 2019, we repurchased 0.4 million shares as partend of the stock repurchase program ateach fund’s measurement period when investment performance exceeds a total coststated benchmark or hurdle rate. For a summary of $10.4 million. As of June 30, 2019, the amount remaining available for repurchases under the program was $139.6 million.
Our accrued carried interest and incentive fee receivablereceivables by segment, assee “— Results of June 30, 2019 is set forth below (in thousands):Operations by Segment.”
|
| | | |
| | Accrued Carried Interest & Incentive Fee Receivable |
| Credit Group | $ | 230,003 |
|
| Private Equity Group | 653,464 |
|
| Real Estate Group | 188,487 |
|
| Total | $ | 1,071,954 |
|
Our condensed consolidated financial statements reflect the cash flows of our operating businesses as well as those of our Consolidated Funds. The assets of our Consolidated Funds, on a gross basis, are significantly larger than the assets of our operating businesses and therefore have a substantial effect on our reported cash flows. The primary cash flow activities of our Consolidated Funds include: (1) raising capital from third-party investors, which is reflected as non-controlling interests of our Consolidated Funds, (2) financing certain investments by issuing debt, (3) purchasing and selling investment securities, (4) generating cash through the realization of certain investments, (5) collecting interest and dividend income and (6) distributing cash to investors. Our Consolidated Funds are treatedaccounted for as investment companies for financial accounting purposes under GAAP; therefore, the character and classification of all Consolidated Fund transactions are presented as cash flows from operations. Liquidity available at our Consolidated Funds is typically not available for corporate liquidity needs, and debt of the Consolidated Funds is non–recourse to the Company except to the extent of the Company's investment in the fund.
Cash Flows
We consolidate funds where we are deemed to hold a controlling financial interest. The table below summarizesConsolidated Funds are not necessarily the same entities in each year presented due to changes in ownership, changes in limited partners' rights, and the creation and termination of funds. The consolidation of these funds had no effect on cash flows attributable to us for the periods presented. As such, we evaluate the activity of the Consolidated Funds and the eliminations resulting from the consolidation separately. The following tables and discussion summarize our condensed consolidated statements of cash flows by activity attributable to the Company and to our Consolidated Funds. Negative amounts represent a net outflow or use of cash (in($ in thousands).:
| | | | | | | | | | | |
| | Six months ended June 30, | | |
| | 2020 | | 2019 |
| Net cash provided by the Company's operating activities | $ | 331,071 | | | $ | 195,046 | |
| Net cash used in the Consolidated Funds' operating activities, net of eliminations | (481,910) | | | (1,486,358) | |
| Net cash used in operating activities | (150,839) | | | (1,291,312) | |
| Net cash used in the Company's investing activities | (43,924) | | | (5,653) | |
| Net cash provided by (used in) the Company's financing activities | 468,198 | | | (44,551) | |
| Net cash provided by the Consolidated Funds' financing activities, net of eliminations | 494,032 | | | 1,489,676 | |
| Net cash provided by financing activities | 962,230 | | | 1,445,125 | |
| Effect of exchange rate changes | (15,811) | | | (11,187) | |
| Net change in cash and cash equivalents | $ | 751,656 | | | $ | 136,973 | |
|
| | | | | | | |
| | For the Six Months Ended June 30, |
| | 2019 | | 2018 |
| Net cash provided by the Company's operating activities | $ | 205,776 |
| | $ | 371,274 |
|
| Net cash used in the Consolidated Funds' operating activities | (1,497,088 | ) | | (1,658,875 | ) |
| Net cash used in operating activities | (1,291,312 | ) | | (1,287,601 | ) |
| Net cash used in the Company's investing activities | (5,653 | ) | | (7,126 | ) |
| Net cash used in the Company's financing activities | (44,551 | ) | | (349,661 | ) |
| Net cash provided by the Consolidated Funds' financing activities | 1,489,676 |
| | 1,642,676 |
|
| Net cash provided by financing activities | 1,445,125 |
| | 1,293,015 |
|
| Effect of exchange rate changes | (11,187 | ) | | 8,231 |
|
| Net change in cash and cash equivalents | $ | 136,973 |
| | $ | 6,519 |
|
Operating Activities
Net cash flows used in operating activities were $1.3 billion for the six months ended June 30, 2019 and 2018. Net cash flowsCash provided by the Company'sCompany’s operating activities were $205.8increased from $195.0 million for the six months ended June 30, 2019 compared to $371.3$331.1 million for the six months ended June 30, 2018. The2020. While net income of the Company decreased by $148.4 million for the six months ended June 30, 2020, the decrease in cash provided by the Company's operating activities was primarily driven by non-cash activity associated with the saleunrealized depreciation from our carried interest allocation and investments. Non-cash activity also consists of $206.0 million of CLO securitiesequity compensation, amortization and depreciation and is added back to net income in the prior year period subsequentdetermining cash that is provided by operations. Cash flow from operations increased primarily due to the removal of U.S. risk retention requirements related to open market CLO managers.greater management fees and net realized performance income and by a reduction in general, administrative and other expenses.
Net cash used in the Consolidated Funds' operating activities was $1.5 billion for the six months ended June 30, 2019 compared to net cash used in Consolidated Funds' operating activities of $1.7 billion for the six months ended June 30, 2018. Net cash used in the Consolidated Funds' operating activities were principally attributable to the consolidationpurchases of investment securities by recently launched funds' investment purchasesfunds during the comparativeboth periods.
Our increasing working capital needs reflect the growth of our business, while the capital requirements needed to support fund-related activities vary based upon the specific investment activities being conducted during such period. The movements within our Consolidated Funds do not adversely impact our liquidity or earnings trends. We believe that our ability to generate cash from operations, as well as the capacity under the Credit Facility, provides us with the necessary liquidity to manage short-term fluctuations in working capital and to meet our short-term commitments.
Investing Activities
Our investing activities generally reflect cash used for certain acquisitions and purchases of fixed assets. | | | | | | | | | | | |
| Six months ended June 30, | | |
| 2020 | | 2019 |
| Purchase of furniture, equipment and leasehold improvements, net | $ | (8,080) | | | $ | (5,653) | |
| Acquisitions | (35,844) | | | — | |
| Net cash used in investing activities | $ | (43,924) | | | $ | (5,653) | |
Net cash used in the Company's investing activities was principally composed of cash used to purchase CLO collateral management agreements from Crestline Denali Capital LLC in the current period that we recorded as intangible assets in our Statement of Financial Condition and of cash used for furniture, fixtures, equipment and leasehold improvements purchased during both periods to support the comparative periods.growth in our staffing levels and our expanding global presence.
Financing Activities
| | | | | | | | | | | |
| Six months ended June 30, | | |
| 2020 | | 2019 |
| Net proceeds from issuance of Class A common stock | $ | 383,154 | | | $ | — | |
| Net proceeds from credit facility | (70,000) | | | 85,000 | |
| Proceeds from senior notes | 399,084 | | | — | |
| Dividends | (108,712) | | | (72,149) | |
| Distributions | (115,695) | | | (80,215) | |
| Series A Preferred Stock dividends | (10,850) | | | (10,850) | |
| Repurchases of Class A common stock | — | | | (10,449) | |
| Stock option exercises | 67,441 | | | 78,794 | |
| Taxes paid related to net share settlement of equity awards | (74,335) | | | (31,424) | |
| Other financing activities | (1,889) | | | (3,258) | |
| Net cash provided by (used in) the Company's financing activities | $ | 468,198 | | | $ | (44,551) | |
Net cash used in the Company's financing activities was $44.6 million for the six months ended June 30, 2019 compared to $349.7 million for the six months ended June 30, 2018. Net cash used inprovided by (used in) the Company's financing activities for the six months ended June 30, 20192020 was principally composed of $163.2 millionnet proceeds from the issuance of the 2030 Senior Notes to provide additional liquidity at a reduced cost of capital during this period of uncertainty and to leverage our growth in future periods. A portion of these proceeds were used to repay borrowings under our Credit Facility. In addition, net cash provided by the Company's financing activities includes cash proceeds from the private offering of Class A common stock to SMBC. These proceeds were partially offset by cash used to pay higher dividends and distributions to AOG unitholders and dividends to our Class A common stockholders and Series A Preferred stockholders and $10.4 million of stock repurchases, offset by $85.0 million of net borrowings on the Company's Credit Facility and $78.8 million of net cash proceeds from exercises of stock options.
Net cash used in the Company's financing activities for the six months ended June 30, 2018 was principally composed of $192.4 million of distributions to AOG unitholders, commonrespectively, in connection with our expectation of generating higher fee related earnings and preferred shareholders and $247.0 millionwith the increased number of net repayments on the Company's debt facilities, offset by $105.4 million of net proceeds from our common share offering. The decrease in distributions and dividends was primarily due to a change in the timing of dividend payments to our Class A common stockholders to match the related income in the current quarter, as a result of our election to be treated as a corporation for U.S. federal income tax purposes. Dividends paid during the six months ended June 30, 2019 were related to income for that period, while distributions paid during the six months ended June 30, 2018 were related to income for the nine month period ended June 30, 2018.
Net cash provided by Consolidated Funds' financing activities was $1.5 billion for the six months ended June 30, 2019shares outstanding compared to $1.6 billion for the six months ended June 30, 2018 . prior period.
| | | | | | | | | | | |
| Six months ended June 30, | | |
| 2020 | | 2019 |
| Contributions from non-controlling interests in Consolidated Funds, net of eliminations | $ | 123,695 | | | $ | 115,499 | |
| Distributions to non-controlling interests in Consolidated Funds, net of eliminations | (150,329) | | | (30,955) | |
| Borrowings under loan obligations by Consolidated Funds | 608,355 | | | 1,934,087 | |
| Repayments under loan obligations by Consolidated Funds | (87,689) | | | (528,955) | |
| Net cash provided by Consolidated Funds' financing activities | $ | 494,032 | | | $ | 1,489,676 | |
Net cash provided by Consolidated Funds' financing activities was principally attributable to the consolidationborrowings of newly launched fundsissued CLOs for both comparative periods. Net borrowings of our Consolidated Funds was $1.4 billion forThere were one and three newly issued CLOs during the six months ended June 30, 2019 compared to net borrowings of $1.6 billion for the six months ended June 30, 2018. Net contributions of our Consolidated Funds were $84.5 million2020 and $35.7 million for the six months ended June 30, 2019, and 2018, respectively.
Capital Resources
The following table summarizes the Company's debt obligations ($ in thousands):
|
| | | | | | | | | | | | | | | | | | | |
| | | | | | | | As of June 30, 2019 | | December 31, 2018 |
| | Debt Origination Date | | Maturity | | Original Borrowing Amount | | Carrying
Value | | Interest Rate | | Carrying
Value | | Interest Rate |
| Credit Facility(1) | Revolver | | 3/21/2024 | | N/A |
| | $ | 320,000 |
| | 3.69% | | $ | 235,000 |
| | 4.00% |
| Senior Notes(2) | 10/8/2014 | | 10/8/2024 | | $ | 250,000 |
| | 246,277 |
| | 4.21% | | 245,952 |
| | 4.21% |
| Total debt obligations | | | | | | | $ | 566,277 |
| | | | $ | 480,952 |
| | |
| |
(1) | The AOG entities are borrowers under the Credit Facility, which provides a $1.065 billion revolving line of credit. It has a variable interest rate based on LIBOR or a base rate plus an applicable margin with an unused commitment fee paid quarterly, which is subject to change with the Company’s underlying credit agency rating. On March 21, 2019, the Company amended the Credit Facility to, among other things, extend the maturity date from February 2022 to March 2024 and to reduce borrowing costs on the drawn and undrawn amounts. As of June 30, 2019, base rate loans bear interest calculated based on the base rate plus 0.25% and the LIBOR rate loans bear interest calculated based on LIBOR plus 1.25%. The unused commitment fee is 0.15% per annum. There is a base rate and LIBOR floor of zero.
|
| |
(2) | The Senior Notes were issued in October 2014 by Ares Finance Co. LLC, a subsidiary of the Company, at 98.268% of the face amount with interest paid semi-annually. The Company may redeem the Senior Notes prior to maturity, subject to the terms of the indenture.
|
As of June 30, 2019, we were in compliance with all covenants under our debt obligations.
We intend to use a portion of our available liquidity to pay cash dividends to our Series A Preferred stockholders and our Class A common stockholders on a quarterly basis in accordance with our dividend policies. Our ability to make cash dividends to the Series A Preferred stockholders and our Class A common stockholders is dependent on a myriad of factors, including among others: general economic and business conditions; our strategic plans and prospects; our business and investment opportunities; timing of capital calls by our funds in support of our commitments; our financial condition and
operating results; working capital requirements and other anticipated cash needs; contractual restrictions and obligations; legal, tax and regulatory restrictions; restrictions on the payment of distributions by our subsidiaries to us and other relevant factors. We expect dividend payments for the remainder of the fiscal year to be consistent with dividends paid during the six months ended June 30, 2019.
We are required to maintain minimum net capital balances for regulatory purposes for our United Kingdom subsidiarybroker-dealer and for our broker-dealer subsidiary.certain subsidiaries operating in non-U.S. jurisdictions. These net capital requirements are met in part by retaining cash, cash equivalents and investment securities. As a result, we may be restricted in our ability to transfer cash between different operating entities and jurisdictions. As of June 30, 2019,2020, we were required to maintain approximately $28.6$30.7 million in liquid net assets within these subsidiaries to meet regulatory net capital and capital adequacy requirements. We remain in compliance with all regulatory requirements.
Holders of AOG Units, subject to the terms of the exchange agreement, may exchange their AOG Units for shares of our Class A common stock on a one-for-one basis. These exchanges are expected to result in increases in the tax basis of the tangible and intangible assets of Ares Management Corporation that otherwise would not have been available. These increases in tax basis may increase depreciation and amortization for U.S. federal income tax purposes and thereby reduce the amount of tax that we would otherwise be required to pay in the future. We entered into the tax receivable agreement (“TRA”) with the TRA recipients that provides payment to the TRA recipients of 85% of the amount of actual cash savings, if any, in U.S. federal, state, local and foreign income tax or franchise tax that we actually realize as a result of these increases in tax basis and of certain other tax benefits related to entering into the TRA, including tax benefits attributable to payments under the TRA and interest accrued thereon. Future payments under the TRA in respect of subsequent exchanges are expected to be substantial. As of June 30, 2019, theThe TRA liability balance was $24.9 million. In 2018, there were exchanges$36.4 million as of approximately 13.1 million of AOG Units for sharesJune 30, 2020.
For a discussion of our Class A common stock. In connection with these conversions, we recognized deferred tax benefitsdebt obligations, including the debt obligations of $25.2 million, which increased
additional paidour consolidated funds, see "Note 7. Debt,” to our unaudited condensed consolidated financial statements included in capital by $3.8 million and our TRA liability by $21.4 million. An immaterial number of AOG Units were exchanged prior to 2018 and during the six months ended June 30, 2019.this Quarterly Report on Form 10-Q.
Series A Preferred Stock
AsFor a discussion of June 30, 2019 and December 31, 2018, the Company had 12,400,000 shares ofour equity, including our Series A Preferred Stock, $0.01 par value per share, designated as “7.00% Series A Preferred Stock” outstanding. When, assee "Note 13. Equity,” to our unaudited condensed consolidated financial statements included in this Quarterly Report on Form 10-Q.
Recent Accounting Pronouncements
Information regarding recent accounting pronouncements and if declared by the Company’s board of directors, dividendstheir impact on the Series A Preferred Stock are paid quarterly at a rate per annum equalCompany can be found in "Note 2. Summary of Significant Accounting Policies,” in the “Notes to 7.00%. The Series A Preferred Stock may be redeemed atthe Condensed Consolidated Financial Statements” included in this Quarterly Report on Form 10-Q and in our option, in whole or in part, at any timeAnnual Report on or after June 30, 2021, at a price of $25.00 per share.Form 10-K.
Critical Accounting Estimates
We prepare our condensed consolidated financial statements in accordance with GAAP. In applying many of these accounting principles, we need to make assumptions, estimates or judgments that affect the reported amounts of assets, liabilities, revenues and expenses in our condensed consolidated financial statements. We base our estimates and judgments on historical experience and other assumptions that we believe are reasonable under the circumstances. These assumptions, estimates or judgments, however, are both subjective and subject to change, and actual results may differ from our assumptions and estimates. Actual results may also differ from our estimates and judgments due to risks and uncertainties, including uncertainty in the current economic environment due to the COVID-19 pandemic and oil and gas market disruption. As the impact of the COVID-19 pandemic continues to unfold, further volatility is likely to occur and may result in material differences in the valuation of our investments and the valuation of our interests in our funds and portfolio companies disclosed in this report. If actual amounts are ultimately different from our estimates, the revisions are included in our results of operations for the period in which the actual amounts become known.
Except as disclosed below, there have been no material changes to the critical accounting estimates previously disclosed in our Annual Report on Form 10-K for the year ended December 31, 2019. For a summary of our significant accounting policies, see Note 2, “Summary"Note 2. Summary of Significant Accounting Policies,” to our condensed consolidated financial statements included in this Quarterly Report on Form 10‑Q10-Q and in our Annual Report on Form 10-K. For a summary of our critical accounting estimates, please see "Management's Discussion and Analysis of Financial Condition and Results of Operations—Critical Accounting Estimates" in our Annual Report on Form 10-K.
Recent Accounting PronouncementsAcquisitions
Information regarding recent accounting pronouncements
Management’s determination of fair value of assets acquired and their impactliabilities assumed at the acquisition date is based on the Company can be found in Note 2, “Summary of Significant Accounting Policies,”best information available in the “Notescircumstances and may incorporate management’s own assumptions and involve a significant degree of judgment. We use our best estimates and assumptions to accurately assign fair value to the Condensed Consolidated Financial Statements” includedtangible and identifiable intangible assets acquired and liabilities assumed at the acquisition date as well as the useful lives of those acquired intangible assets. Examples of critical estimates in this Quarterly Reportvaluing certain of the intangible assets we have acquired include, but are not limited to, future expected cash inflows and outflows, expected useful life and discount rates. Our estimates for future cash flows are based on Form 10‑Qhistorical data, various internal estimates and incertain external sources, and are based on assumptions that are consistent with the plans and estimates we are using to manage the underlying assets acquired. We estimate the useful lives of the intangible assets based on the expected period over which we anticipate generating economic benefit from the asset. We base our Annual Reportestimates on Form 10-K.assumptions we believe to be reasonable but that are unpredictable and inherently uncertain. Unanticipated events and circumstances may occur that could affect the accuracy or validity of such assumptions, estimates or actual results.
Off‑Balance
Off-Balance Sheet Arrangements
In the normal course of business, we engage in off‑balanceoff-balance sheet arrangements, including transactions in derivatives, guarantees, commitments, indemnifications and potential contingent repayment obligations. See Note 8, “Commitments"Note 8. Commitments and Contingencies,” to our unaudited condensed consolidated financial statements included in this Quarterly Report on Form 10-Q.
Commitments and Contingencies
CapitalFor further discussion of our capital commitments, indemnification arrangements and contingent obligations, see "Note 8. Commitments and Contingencies,” to our unaudited condensed consolidated financial statements included in this Quarterly Report on Form 10-Q.
AsSEC Matter
On May 26, 2020, without admitting or denying any wrongdoing, Ares Management LLC, a subsidiary of June 30, 2019 and December 31, 2018, we had aggregate unfunded commitments of $304.1 million and $267.6 million, respectively, including commitments to both non-consolidated funds and Consolidated Funds.
ARCC Fee Waiver
In conjunction with ARCC's acquisition of American Capital, Ltd. (“ACAS”), we agreed to waive up to $10 million per quarter of ARCC's Part I Fees for ten calendar quarters, which began in the second quarter of 2017. ARCC Part I Fees will only be waivedAres Management Corporation, consented to the extent they are paid.entry of an administrative and cease-and-desist order (the “Order”) instituted by the SEC. According to the Order, in 2016, Ares’ written policies and procedures regarding the prevention of misuse of potentially material nonpublic information (“MNPI”) were not sufficiently implemented and enforced in certain circumstances when Ares had an employee serving on the board of directors of a public company in which one of its clients was invested. The maximum amountOrder did not find any misuse of fees that may be waived in a quarter is $10 million,MNPI by Ares or its employees; however, the Order included findings of violations of Section 204A and if ARCC Part I Fees are less than $10 million in any single quarter, the shortfall will not carry over to subsequent quarters. As of June 30, 2019, there is one remaining quarter as partSection 206(4) of the fee waiver agreement,Investment Advisers Act of 1940 and Rule 206(4)-7 thereunder with respect to the implementation and enforcement of its written policies and procedures. The Order includes cease and desist provisions and a maximum of $10.0 million in potential waivers. ARCC Part I Fees are reported net of the fee waiver.
Indemnification Arrangements
Consistent with standard business practices in the normal course of business, we enter into contracts that contain indemnities for our affiliates, persons acting on our behalf or such affiliatescensure, and third parties. The terms of the indemnities vary from contract to contract and the maximum exposure under these arrangements, if any, cannot be determined and has not been recorded in our consolidated financial statements. As of June 30, 2019, we have not had prior claims or losses pursuant to these contracts and expect the risk of loss to be remote.
Contingent Obligations
Generally, if at the terminationpayment of a fund (and increasingly at interim pointscivil penalty in the life of a fund), the fund has not achieved investment returns that (in most cases) exceed the preferred return threshold or (in all cases) the general partner receives net profits over the life of the fund in excess of its allocable share under the applicable partnership agreement, the Company will be obligated to repay carried interest that was received by the Company in excess of the amounts to which the Company is entitled. This contingent obligation is normally reduced by income taxes paid by the Company related to its carried interest.
The partnership documents governing our funds generally include a contingent repayment provision that, if triggered, may give rise to a contingent obligation that may require the general partner to return amounts to the fund for distribution to investors. Therefore, carried interest, a component of performance income, generally, is subject to reversal in the event that the funds incur future losses. These losses are limited to the extent of the cumulative performance income recognized to date.
Due in part to our investment performance and the fact that our performance income is generally determined on a liquidation basis, if the funds were liquidated at their fair values as of June 30, 2019 and December 31, 2018, there would have been $0.6 million and $0.4 million, respectively, of repayment obligations. There can be no assurance that we will not incur additional contingent repayment obligation in the future. If all of the existing investments were deemed worthless, the amount of cumulative revenues that have been recognized would be reversed. As of June 30, 2019 and December 31, 2018, had we assumed all existing investments were worthless, the amount of carried interest, net of tax, subject to contingent repayment would have been approximately $401.0 million and $469.0 million, respectively, of which approximately $297.5 million and $351.9 million, respectively, would be reimbursable to us by certain professionals who are the recipients of such carried interest. We believe that the possibility of all of the existing investments becoming worthless is remote.$1.0 million.
Performance income is also affected by changes in the fair values of the underlying investments in the funds that we advise. Valuations, on an unrealized basis, can be significantly affected by a variety of external factors including, but not limited to, public equity market volatility, industry trading multiples and interest rates.
Our senior professionals who have received carried interest distributions are responsible for funding their proportionate share of any contingent repayment obligations. However, the governing agreements of certain of our funds provide that if a current or former professional does not fund his or her respective share for such fund, then we may have to fund additional amounts beyond what we received in carried interest, although we will generally retain the right to pursue any remedies that we have under such governing agreements against those carried interest recipients who fail to fund their obligations.
Additionally, at the end of the life of the funds there could be a payment due to a fund by us if we have recognized more performance income than was ultimately earned. The general partner obligation amount, if any, will depend on final realized values of investments at the end of the life of the fund.
Item 3. Quantitative and Qualitative Disclosures About Market Risk
Our primary exposure to market risk is related to our role as general partner or investment adviser to our investment funds and the sensitivity to movements in the fair value of their investments, including the effect on management fees, performance income and investment income. Uncertainty with respect to the economic effects of the COVID-19 pandemic has introduced significant volatility in the financial markets, and the effects of this volatility could materially impact our market risks, including those listed below. For additional information concerning the COVID-19 pandemic and its potential impact on our business and our operating results, see Item 1A. "Risk Factors" in this Quarterly Report on Form 10-Q.
Market Risk
The market price of investments may significantly fluctuate during the period of investment. Investments may decline in value due to factors affecting securities markets generally or particular industries represented in the securities markets. The value of an investment may decline due to general market conditions, which are not specifically related to such investment, such as real or perceived adverse economic conditions, changes in the general outlook for corporate earnings, changes in interest or currency rates or adverse investor sentiment generally. It may also decline due to factors that affect a particular industry or industries, such as labor shortages or increased production costs and competitive conditions within an industry.
Our credit orientation has been a central tenet of our business across our debt and equity investment strategies. Our investment professionals benefit from our independent research and relationship networks and insights from our portfolio of
active investments. We believe the combination of high-quality proprietary information flow and a consistent, rigorous approach to managing investments across our strategies has been, and we believe will continue to be, a major driver of our strong risk-adjusted returns and the stability and predictability of our income.
Credit Risk
We are party to agreements providing for various financial services and transactions that contain an element of risk in the event that the counterparties are unable to meet the terms of such agreements. In such agreements, we depend on the counterparty to make payment or otherwise perform. We generally endeavor to minimize our risk of exposure by limiting to reputable financial institutions the counterparties with which we enter into financial transactions. In other circumstances, availability of financing from financial institutions may be uncertain due to market events, and we may not be able to access these financing markets. At June 30, 2020 and December 31, 2019, we had cash balances with financial institutions in excess of Federal Deposit Insurance Corporation insured limits. We seek to mitigate this exposure by monitoring the credit standing of these financial institutions.
There have been no material changes in our market risks for the six months ended June 30, 2019.2020. For additional information on our market risks, refer to our Annual Report on Form 10-K for the year ended December 31, 2018,2019, which is accessible on the SEC's website at sec.gov.
Item 4. Controls and Procedures
Evaluation of Disclosure Controls and Procedures
We maintain disclosure controls and procedures (as that term is defined in Rules 13a‑15(e)13a-15(e) and 15d‑15(e)15d-15(e) under the Exchange Act) that are designed to ensure that information required to be disclosed in our reports under the Exchange Act is recorded, processed, summarized and reported within the time periods specified in the SEC’s rules and forms, and that such information is accumulated and communicated to our management, including our co-principalprincipal executive officersofficer and principal financial officer, as appropriate, to allow timely decisions regarding required disclosures. Any controls and procedures, no matter how well designed and operated, can provide only reasonable assurance of achieving the desired control objectives. Our management, with the participation of our principal executive officer and principal financial officer, has evaluated the effectiveness of the design and operation of our disclosure controls and procedures as of June 30, 2019.2020. Based upon that evaluation and subject to the foregoing, our principal executive officersofficer and principal financial officer concluded that, as of June 30, 2019,2020, the design and operation of our disclosure controls and procedures were effective to accomplish their objectives at the reasonable assurance level.
Changes in Internal Control over Financial Reporting
There have been no changes in our internal control over financial reporting (as defined in Rule 13a‑15(f)13a-15(f) and 15d‑15(f)15d-15(f) under the Exchange Act) during the quarter ended June 30, 20192020 that have materially affected, or that are reasonably likely to materially affect, our internal control over financial reporting.
PART II.
Item 1. Legal Proceedings
From time to time we are involved in various legal proceedings, lawsuits and claims incidental to the conduct of our business, some of which may be material. As of June 30, 20192020 and December 31, 2018,2019, we were not subject to any material pending legal proceedings. Our businesses are also subject to extensive regulation, which may result in regulatory proceedings against us.
Item 1A. Risk Factors
For a discussion of ourIn addition to the other potential risksinformation set forth in this report, you should carefully consider the risk factors described below and uncertainties, see the information underin Part I, “Item 1A.1A, Risk Factors” in our Annual Report on Form 10‑K10-K for the year ended December 31, 2018,2019, which could materially affect our business, financial condition and/or operating results. The risks described below and in our Annual Report on Form 10-K for the fiscal year ended December 31, 2019 are not the only risks facing us. Additional risks and uncertainties not currently known to us or that we currently deem to be immaterial also may materially and adversely affect our business, financial condition and/or operating results.
The rapid development and fluidity of the ongoing COVID-19 pandemic precludes any prediction as to the ultimate adverse impact of the situation on economic and market conditions. In addition to the foregoing, COVID-19 may exacerbate the potential adverse effects on our business, financial performance, operating results, cash flows and financial condition described in the risk factors in our Annual Report on Form 10-K for the fiscal year ended December 31, 2019 filed with the SEC. Our Annual Report on Form 10-K for the year ended December 31, 2019 is accessible on the SEC’s website at www.sec.gov. There
Risks Related to Our Business
The COVID-19 pandemic has caused severe disruptions in the U.S. and global economy, has disrupted, and may continue to disrupt, industries in which we, our funds and our funds’ portfolio companies operate and could potentially negatively impact us, our funds or our funds’ portfolio companies.
As of the date of this Quarterly Report, there is an ongoing outbreak of a novel and highly contagious form of coronavirus ("COVID-19"), which the World Health Organization has declared a global pandemic, the United States has declared a national emergency and every state in the United States is under a federal disaster declaration. The COVID-19 pandemic has resulted in numerous deaths, adversely impacted global commercial activity and contributed to significant volatility in equity and debt markets. Many countries and states in the United States, including those in which we, our funds' and our funds' portfolio companies operate, have issued orders requiring the closure of, or certain restrictions on the operation of, nonessential businesses and/or requiring residents to stay at home. The COVID-19 pandemic and preventative measures taken to contain or mitigate its spread have caused, and are continuing to cause, business shutdowns or the re-introduction of business shutdowns, cancellations of events and restrictions on travel, significant reductions in demand for certain goods and services, reductions in business activity and financial transactions, supply chain interruptions and overall economic and financial market instability both globally and in the United States. Such measures, as well as the general uncertainty surrounding the dangers and impact of the COVID-19 pandemic, have created significant disruption in supply chains and economic activity and are having a particularly adverse impact on the energy, hospitality, travel, retail and restaurant industries, as well as other industries, including industries in which certain of our funds' portfolio companies operate. Such effects will likely continue for the duration of the pandemic, which is uncertain, and for some period thereafter. While several countries, as well as certain states, counties and cities in the United States, have begun to lift the public health restrictions with a view to reopening their economies, recurring COVID-19 outbreaks have led to the re-introduction of such restrictions in certain states in the United States and globally and could continue to lead to the re-introduction of such restrictions elsewhere. Additionally, the absence of viable treatment options or a vaccine could lead people to continue to self-isolate and not participate in the economy at pre-pandemic levels for a prolonged period of time. Even after the COVID-19 pandemic subsides, the U.S. economy and most other major global economies may continue to experience a recession, and we anticipate our and our funds' business and operations could be materially adversely affected by a prolonged recession in the U.S. and other major markets.
The extent of the impact of the COVID-19 pandemic on our and our funds’ operational and financial performance will depend on many factors, including the duration and scope of the public health emergency, the actions taken by governmental authorities to contain its financial and economic impact, the continued implementation of travel advisories and restrictions, the impact of such public health emergency on overall supply and demand, goods and services, investor liquidity, consumer confidence and levels of economic activity and the extent of its disruption to global, regional and local supply chains and economic markets, all of which are uncertain and difficult to assess. The COVID-19 pandemic is continuing as of the filing date
of this Quarterly Report and its extended duration may have further adverse impacts on our business, financial performance, operating results, cash flows and financial condition, including the market price of shares of our securities, including for the reasons described below.
The effects of a public health emergency may materially and adversely impact our value and performance and the value and performance of our funds and our funds’ portfolio companies. The impact of the COVID-19 pandemic may not be fully reflected in the valuation of our or our funds’ investments, which may differ materially from the values that we may ultimately realize with respect to such investments. Our valuations, and particularly valuations of our interests in our funds and our funds’ investments, reflect a moment in time, are inherently uncertain, may fluctuate over short periods of time and are often based on subjective estimates, comparisons and qualitative evaluations of private information. Valuations, on an unrealized basis, can also be significantly affected by a variety of external factors including, but not limited to, public equity market volatility, industry trading multiples and interest rates, all of which have been noimpacted by the COVID-19 pandemic. Further, the extreme volatility in the broader market and particularly in the energy markets has led to a broad decrease in valuations and such valuations may continue to decline and become increasingly difficult to ascertain. As a result, our valuations and the valuations of our interests in our funds and our funds’ investments, may not show the complete or continuing impact of the COVID-19 pandemic and the resulting measures taken in response thereto. Accordingly, we and our funds may continue to incur additional net unrealized losses or may incur realized losses in the future, which could have a material changesadverse effect on our business, financial condition and results of operations. Any public health emergency, including the COVID-19 pandemic or any outbreak of other existing or new epidemic diseases, or the threat thereof, and the resulting financial and economic market uncertainty could have a significant adverse impact on us, the fair value of our and our funds’ investments and could adversely impact our funds’ ability to fulfill our investment objectives.
Our ability to market and raise new or successor funds may be impacted by the shelter-in-place orders, travel restrictions and social distancing requirements implemented in response to the COVID-19 pandemic. This may lower or delay anticipated fee revenues. In addition, the significant volatility and declines in valuations in the global markets as well as liquidity concerns may impact our ability to raise funds or deter fund investors from investing in new or successor funds that we are marketing.
Our funds may experience a slowdown in the pace of their investment activity, which could also adversely affect the timing of raising capital for new or successor funds and could also impact the management fees we earn on funds that generate fees based on invested (and not committed) capital. While the increased volatility in the financial markets caused by the COVID-19 pandemic may present attractive investment opportunities, we or our funds may not be able to complete those investments due to, among other factors, increased competition or operational challenges such as our ability to obtain attractive financing, conduct due diligence and consummate the acquisition and disposition of investments for our funds because of shelter-in-place orders, travel restrictions and social distancing requirements.
If the impact of the COVID-19 pandemic and current market conditions continue, we and our funds may have fewer opportunities to successfully exit investments, due to, among other reasons, lower valuations, decreased revenues and earnings, lack of potential buyers with financial resources or access to financing to pursue an acquisition, lack of refinancing markets, resulting in a reduced ability to realize value from such investments at attractive valuations or at all, and thereby negatively impacting our realized income.
The current market conditions resulting from the COVID-19 pandemicmay impact our liquidity. Our cash flows from management fees may be impacted by, among other things, a slowdown in fundraising or delayed deployment. ARCC Part I Fees may be subject to cash payment deferral if certain return hurdles are not met, which could have an adverse effect on our cash flows. Current market conditions may make it difficult for us to refinance our existing indebtedness or obtain new indebtedness with similar terms and any failure to do so could have a material adverse effect on our business. The capital that will be available to us in the future, if at all, may be at a higher cost and on less favorable terms and conditions than we currently experience. While our senior professionals have historically made co-investments in our funds alongside our limited partners, thereby reducing our obligation to make such investments, due to financial uncertainty or liquidity concerns, our employees may be less likely to make co-investments, which would result in such general partner commitments remaining our obligation to fund and reducing our liquidity. In addition, our funds may be impacted due to failure by our fund investors to meet capital calls, which would negatively impact our funds’ ability to make investments or pay us management fees.
The COVID-19 pandemic is having a particularly severe impact on certain industries, including but not limited to the energy, hospitality, travel, retail and restaurant industries, which are industries in which some of our funds have made investments. As of June 30, 2020, approximately 2% of our total AUM was invested in the energy (including oil and gas exploration and midstream investments) sector and approximately 2% in the retail sector that were challenged during the period from the market disruption. Many of our funds’ portfolio companies in these industries are facing operational and financial
hardships resulting from the spread of COVID-19 and related governmental measures, such as the closure of stores, hotels, restaurants and other sites, restrictions on travel, quarantines or stay-at-home orders. As a result of these disruptions, the businesses, financial results and prospects of certain of these portfolio companies have already been severely affected and could continue to be so affected. This may result in potential impairment and decrease in value of our funds’ investments, which may be material.
Our funds’ portfolio companies are also facing or may face in the future increased credit and liquidity risk due to volatility in financial markets, reduced or eliminated revenue streams, and limited or higher cost of access to preferred sources of funding. Changes in the debt financing markets are impacting, and, if the volatility in financial markets continues, may in the future impact, the ability of our funds’ portfolio companies to meet their respective financial obligations and continue as going concerns. This could lead to the insolvency and/or bankruptcy of these companies which would cause our funds to realize losses in respect of those investments. Any of the foregoing would adversely affect our results of operations, perhaps materially, and could harm our reputation.
Our funds may experience similar credit and liquidity risk. Failure of our funds to meet their financial obligations could result in our funds being required to repay indebtedness or other financial obligations immediately in whole or in part, together with any attendant costs, and our funds could be forced to sell some of their assets to fund such costs. Our funds could lose both invested capital in, and anticipated profits from, the affected investment.
Borrowers of loans and other credit instruments made by our funds may be unable to make their loan payments on a timely basis and meet their loan covenants, and tenants leasing real estate properties owned by our funds may not be able to pay rents in a timely manner or at all, resulting in a decrease in value of our funds’ credit and real estate investments and lower than expected returns. In addition, for variable interest instruments, lower reference rates resulting from government stimulus programs in response to the COVID-19 pandemic could lead to lower interest income for funds making loans.
The COVID-19 pandemic may adversely impact our business and operations since an extended period of remote working by our employees could strain our technology resources and introduce operational risks, including heightened cybersecurity risk. Remote working environments may be less secure and more susceptible to hacking attacks, including phishing and social engineering attempts that seek to exploit the COVID-19 pandemic. In addition, our data security, data privacy, investor reporting and business continuity processes could be impacted by a third party’s inability to perform due to the COVID-19 pandemic or by failures of, or attacks on, their information systems and technology. Also, our accounting and financial reporting systems, processes, and controls could be impacted as a result of these risks. In addition, COVID-19 presents a significant threat to our employees’ well-being and morale, and we may experience potential loss of productivity. If our senior management or other key personnel become ill or are otherwise unable to perform their duties for an extended period of time, we may experience a loss of productivity or a delay in the implementation of certain strategic plans. In addition to any potential impact of such extended illness on our operations, we may be exposed to the risk of litigation by our employees against us for, among other things, failure to take adequate steps to protect their well-being, particularly in the event they become sick after a return to the office. Further, local COVID-19-related laws can be subject to rapid change depending on public health developments, which can lead to confusion and make compliance with laws uncertain and subject us, our funds or our funds’ portfolio companies to increased risk of litigation for non-compliance.
Regulatory oversight and enforcement may become more rigorous for the financial services industry and other regulated industries as a result of the impact of the COVID-19 pandemic on the financial markets, especially in the wake of the array of governmental financial assistance programs provided by state and national governments around the world. In addition, new laws or regulations that are passed in response to the COVID-19 pandemic could adversely impact investment management firms. This may result in a more complex regulatory, tax and political environment, which could subject us to increased compliance costs and administrative burdens.
The global capital markets are currently in a period of disruption and instability. Such market conditions have materially and adversely affected debt and equity capital markets, which have had, and may continue to have, a negative impact on our business and operations.
Beginning in February 2020 and continuing through date of this Quarterly Report, capital markets entered into a period of disruption and instability, as evidenced by the volatility in global stock markets as a result of, among other things, uncertainty surrounding the COVID-19 pandemic, the fluctuating price of commodities such as oil and uncertainty between the United States and other countries with respect to trade policies, treaties and tariffs. Despite actions of the U.S. federal government and foreign governments, these events have contributed to worsening general economic conditions that are materially and adversely impacting the broader financial and credit markets and reducing the availability of debt and equity capital for the market as a whole. These conditions could continue for a prolonged period or worsen in the future. The effects of
the COVID-19 pandemic and concerns regarding its global spread have negatively impacted, and are expected to continue to negatively impact, the domestic and international demand for oil and natural gas, which has caused and may continue to cause price volatility and reduced volumes of oil and natural gas transports. In April 2020, members of the Organization of Petroleum Exporting Countries (“OPEC”) and Russia engaged in negotiations to potentially extend their agreed oil production cuts and to make additional oil production cuts. Market volatility was further amplified as a result of Saudi Arabia’s decision in early March to discount oil pricing and increase its production, and Russia’s announcement that all agreed oil production cuts between members of OPEC and Russia expired on April 1, 2020. Following these announcements, within one day global oil prices declined to their lowest levels since 2016. Although OPEC reached an agreement in April 2020 to limit production, and further agreed to extend oil production cuts through the end of July 2020, increased oil price volatility is expected to continue due to, among other factors, disclosedthe uncertainties and economic impacts of the COVID-19 pandemic. The ongoing COVID-19 pandemic, and any fluctuations in oil and natural gas prices, may adversely affect our 2018 Form 10‑K.funds and our funds’ investments.
Item 2. Unregistered Sales of Equity Securities and Use of Proceeds
We did not sell any equity securities during the period covered in this report that were not registered under the Securities Act of 1933.
Except as set forth below, all unregistered salespurchases of equity securities during the period covered by this Quarterly Report were previously disclosed in our current reports on Form 8-K or quarterly reports on Form 10-Q ($ in thousands; except share data):
|
| | | | | | | | | | |
| Period | Total Number of Shares Purchased | Average Price Paid Per Share | Total Number of Shares Purchased as Part of Publicly Announced Plans or Programs | Approximate Dollar Value of Shares That May Yet be Purchased Under the Plans or Programs (1) |
| April 1, 2019 - April 30, 2019 | — |
| $ | — |
| — |
| $ | 150,000 |
|
| May 1, 2019 - May 31, 2019 | 400,000 |
| 26.12 |
| 400,000 | 139,551 |
|
| June 1, 2019 - June 30, 2019 | — |
| — |
| — |
| 139,551 |
|
| Total | 400,000 | | 400,000 | |
| | | | | | | | | | | | | | |
| Period | Total Number of Shares Purchased | Average Price Paid Per Share | Total Number of Shares Purchased as Part of Publicly Announced Plans or Programs | Approximate Dollar Value of Shares That May Yet be Purchased Under the Plans or Programs (1) |
| April 1, 2020 - April 30, 2020 | — | $ | — | | — | $ | 150,000 | |
| May 1, 2020 - May 31, 2020 | — | — | | — | 150,000 | |
| June 1, 2020 - June 30, 2020 | — | — | | — | 150,000 | |
| Total | — | | — | |
| |
(1) | In February 2019, our board of directors authorized the repurchase of up to $150 million of shares of our Class A common stock. Under this stock repurchase program, shares may be repurchased from time to time in open market purchases, privately negotiated transactions or otherwise, including in reliance on Rule 10b5-1 of the Securities Act. The program is scheduled to expire in February 2020. Repurchases under the program depend on the prevailing market conditions and other factors. |
(1)In February 2019, our board of directors authorized the repurchase of up to $150 million of shares of our Class A common stock. Under this stock repurchase program, shares may be repurchased from time to time in open market purchases, privately negotiated transactions or otherwise, including in reliance on Rule 10b5-1 of the Securities Act. In February 2020, our board of directors approved the renewal of the program and reset the repurchase amount back to $150 million. The program is scheduled to expire in March 2021. Repurchases under the program depend on the prevailing market conditions and other factors.
As permitted by our policies and procedures governing transactions in our securities by our directors, executive officers and other employees, from time to time some of these persons may establish plans or arrangements complying with Rule 10b5‐110b5-1 under the Exchange Act, and similar plans and arrangements relating to our Class A common stock.
Item 3. Defaults Upon Senior Securities
None.
Item 4. Mine Safety Disclosures
Not applicable.
Item 5. Other Information
None.
Section 219 of the Iran Threat Reduction and Syria Human Rights Act of 2012 (“ITRA”) and Section 13(r) of the Exchange Act, require an issuer to disclose in its annual and quarterly reports whether it or any of its affiliates have knowingly engaged in specified activities or transactions relating to Iran. On June 20, 2019, certain investment funds managed or advised by U.K.-based affiliates of Ares (the “Ares Entities”) acquired approximately 28.7% of the ordinary shares and 54.3% of the preferred shares of AgriBriefing 1364 Limited (“AgriBriefing”), a company based in London that provides price reporting data on a subscription basis to participants in the agricultural industry. Although the Ares Entities do not hold the largest voting position in AgriBriefing, their holdings of ordinary and preferred shares represent a majority of the outstanding equity interests in AgriBriefing. In addition, the Ares Entities hold certain contractual veto rights and the right to appoint a director to the board of directors of AgriBriefing. As a result, under applicable SEC definitions, the Ares Entities may be deemed to control AgriBriefing; however, this statement is not meant to be an admission that common control exists.
Subsequent to completion of the Ares Entities’ investment in AgriBriefing, in connection with Ares’ routine quarterly survey of its investment funds’ portfolio companies, AgriBriefing informed the Ares Entities that it had subscription contracts with five customers whose billing addresses were based in Iran. We have not been able to verify the identity or affiliations of these customers. As a result, it appears that we are required to provide this disclosure under ITRA and Section 13(r) of the Exchange Act.
These subscriptions generated annual gross revenues of less than €25,000 (less than 1% of AgriBriefing’s revenues) and de minimus net profits.
AgriBriefing has confirmed that each of the subscriptions commenced prior to the investment in AgriBriefing by the Ares Entities, and that it has terminated these subscriptions and does not intend to engage in any further dealings or transactions with these customers.
Based on currently available information, we and the Ares Entities have no reason to believe that any of the five customers are listed on the U.S. Treasury Department Office of Foreign Assets Control list of Specially Designated Nationals or that AgriBriefing has conducted any dealings in violation ITRA.
This disclosure does not relate to any activities conducted by Ares and does not involve Ares. This disclosure relates solely to activities conducted by AgriBriefing and its consolidated subsidiaries.
Item 6. Exhibits, Financial Statement Schedules
(a)Exhibits.
The following is a list of all exhibits filed or furnished as part of this report.
|
| | | | | | | |
| Exhibit No. | | Description |
| | Restated Certificate of Incorporation of Ares Management Corporation (incorporated by reference to Exhibit 99.33.1 to the Registrant’s Current Report on Form 8-K (File No. 001-36429) filed with the SEC on November 15, 2018)March 30, 2020). |
| | Bylaws of Ares Management Corporation (incorporated by reference to Exhibit 99.4 to the Registrant’s Current Report on Form 8-K (File No. 001-36429) filed with the SEC on November 15, 2018). |
| | Indenture dated as of June 15, 2020 among Ares Finance Co. II LLC, Ares Holdings L.P., Ares Investments L.P., Ares Management LLC, Ares Investments Holdings LLC, Ares Finance Co. LLC and Ares Offshore Holdings L.P. and U.S. Bank National Association, as trustee (incorporated by reference to Exhibit 4.1 to the Registrant's Current Report on Form 8-K (File No. 001-36429) filed with the SEC on June 15, 2020). |
| | First Supplemental Indenture dated as of June 15, 2020 among Ares Finance Co. II LLC, Ares Holdings L.P., Ares Investments L.P., Ares Management LLC, Ares Investments Holdings LLC, Ares Finance Co. LLC and Ares Offshore Holdings L.P. and U.S. Bank National Association, as trustee (incorporated by reference to Exhibit 4.2 to the Registrant's Current Report on Form 8-K (File No. 001-36429) filed with the SEC on June 15, 2020). |
| | Form of 3.250% Senior Note due 2030 (incorporated by reference to Exhibit 4.3 to the Registrant's Current Report on Form 8-K (File No. 001-36429) filed with the SEC on June 15, 2020). |
| | Certification of the Chief Executive Officer pursuant to Rule 13a‑14(a)13a-14(a). |
| | Certification of the Chief Financial Officer pursuant to Rule 13a‑14(a)13a-14(a). |
| | Certification of the Chief Executive Officer and Chief Financial Officer pursuant to 18 U.S.C. Section 1350. |
| 101.INS* | | XBRL Instance Document - the instance document does not appear in the Interactive Data File because its XBRL tags are embedded within the Inline XBRL document. |
| 101.SCH* | | Inline XBRL Taxonomy Extension Schema Document. |
| 101.CAL* | | Inline XBRL Taxonomy Extension Calculation Linkbase Document. |
| 101.DEF* | | Inline XBRL Taxonomy Extension Definition Linkbase Document. |
| 101.LAB* | | Inline XBRL Taxonomy Extension Label Linkbase Document. |
| 101.PRE* | | Inline XBRL Taxonomy Extension Presentation Linkbase Document. |
| 104* | | Cover Page Interactive Data File - the cover page interactive data file does not appear in the Interactive Data File because its XBRL tags are embedded within the Inline XBRL document. |
* These certifications are not deemed filed by the SEC and are not to be incorporated by reference in any filing we make under the Securities Act of 1933 or the Securities Exchange Act of 1934, irrespective of any general incorporation language in any filings.
SIGNATURES
| | | | | | | | | | | |
| ARES MANAGEMENT CORPORATION | | |
| | | |
| | | |
| Dated: August 7, 2020 | | By: | /s/ Michael J Arougheti |
| | Name: | Michael J Arougheti |
| | Title: | Co-Founder, Chief Executive Officer & President (Principal Executive Officer) |
| | | |
| | | |
| ARES MANAGEMENT CORPORATION |
| | | |
| | | |
Dated: August 1, 20197, 2020 | By: | By: | /s/ Michael J Arougheti |
| | Name: | Michael J Arougheti |
| | Title: | Co‑Founder, Chief Executive Officer & President (Principal Executive Officer) |
| | | |
| | | |
Dated: August 1, 2019 | By: | | /s/ Michael R. McFerran |
| | Name: | Michael R. McFerran |
| | Title: | Chief FinancialOperating Officer & Chief OperatingFinancial Officer (Principal Financial and Accounting Officer) |
| | | |
| | | |