UNITED STATES
SECURITIES AND EXCHANGE COMMISSION
Washington, D.C. 20549
FORM 10-Q
þ☑ QUARTERLY REPORT PURSUANT TO SECTION 13 OR 15(d) OF
THE SECURITIES EXCHANGE ACT OF 1934
For the fiscal quarter ended September 30, 20192020
¨☐ TRANSITION REPORT PURSUANT TO SECTION 13 OR 15(d) OF THE SECURITIES EXCHANGE ACT OF 1934
FOR THE TRANSITION PERIOD FROM _____________ TO _____________
Commission File Number 001-11476
———————
VERTEX ENERGY, INC.
(Exact name of registrant as specified in its charter)
———————
| | | | | |
| Nevada | 94-3439569 |
| (State or other jurisdiction of | (I.R.S. Employer Identification No.) |
| incorporation or organization) | |
| |
| |
NEVADA | 94-3439569 |
(State or other jurisdiction of | (I.R.S. Employer Identification No.) |
incorporation or organization) | |
| |
1331 GEMINI STREET, SUITE 250
HOUSTON, TEXAS
| 77058 |
(Address of principal executive offices) | (Zip Code) |
1331 Gemini Street, Suite 250 77058
Houston, Texas
(Address of principal executive offices)(Zip Code)
Registrant's telephone number, including area code: 866-660-8156
Securities registered pursuant to Section 12(b) of the Act:
|
| | | | | | | |
| Title of each class | Trading Symbol(s) | Name of each exchange on which registered |
Common Stock, $0.001 Par Value Per Share | VTNR | The NASDAQ Stock Market LLC
|
| (Nasdaq Capital Market) |
Indicate by check mark whether the registrant (1) has filed all reports required to be filed by Section 13 or 15(d) of the Securities Exchange Act of 1934 during the preceding 12 months (or for such shorter period that the registrant was required to file such reports), and (2) has been subject to such filing requirements for the past 90 days. Yes ý No ¨
Indicate by check mark whether the registrant has submitted electronically every Interactive Data File required to be submitted pursuant to Rule 405 of Regulation S-T (§232.405 of this chapter) during the preceding 12 months (or for such shorter period that the registrant was required to submit such files). Yes ý No ¨
Indicate by check mark whether the registrant is a large accelerated filer, an accelerated filer, a non-accelerated filer, a smaller reporting company, or an emerging growth company. See the definitions of “large accelerated filer,” “accelerated filer” and “smaller reporting company” and "emerging growth company" in Rule 12b-2 of the Exchange Act.
|
| | | | | | | | | | | | | |
Large accelerated filer¨ | ☐ | | Accelerated filer¨ | ☐ |
Non-accelerated filerý | ☒ | | Smaller reporting companyý | ☒ |
Emerging growth¨ | ☐ | | | |
If an emerging growth company, indicate by check mark if the registrant has elected not to use the extended transition period for complying with any new or revised financial accounting standards provided pursuant to Section 13(a) of the Exchange Act. ¨
Indicate by check mark whether the registrant is a shell company (as defined in Rule 12b-2 of the Exchange Act.
Yes ¨☐ No ý
State the number of shares of the issuer’s common stock outstanding, as of the latest practicable date: 41,849,40645,554,841shares of common stock are issued and outstanding as of November 7, 2019.9, 2020.
TABLE OF CONTENTS
| | | | | | | | | | | |
| | | Page |
| | PART I | |
| Item 1. | | | |
| | | |
| | | |
| | | |
| | | |
| | | |
| | | |
| | | |
| | | Page |
| | PART I | |
Item 1. | | | |
| | | |
| | | |
| | | |
| | | |
| | | |
| | | |
| | | |
| | | |
| | | |
| | | |
| | | |
| Item 2 | | | |
| | | |
| Item 3. | | | |
| | | |
| Item 4. | | | |
| | | |
| | | |
| | PART II | |
| Item 1. | | | |
| | | |
| Item 1A. | | | |
| | | |
| Item 2. | | | |
| | | |
| Item 3. | | | |
| | | |
| Item 4. | | | |
| | | |
| Item 5. | | | |
| | | |
| Item 6. | | | |
PART I – FINANCIAL INFORMATION
Item 1. Financial Statements
VERTEX ENERGY, INC.
CONSOLIDATED BALANCE SHEETS
(UNAUDITED)
| | | | | | | | | | | |
| | September 30,
2020 | | December 31,
2019 |
| ASSETS | | | |
| Current assets | | | |
| Cash and cash equivalents | $ | 15,552,980 | | | $ | 4,099,655 | |
| Restricted cash | 100,125 | | | 100,170 | |
| Accounts receivable, net | 9,090,927 | | | 12,138,078 | |
| Federal income tax receivable | 0 | | | 68,606 | |
| Inventory | 3,584,317 | | | 6,547,479 | |
| | | |
| Prepaid expenses and other current assets | 4,597,361 | | | 4,452,920 | |
| Total current assets | 32,925,710 | | | 27,406,908 | |
| | | |
| Noncurrent assets | | | |
| Fixed assets, at cost | 73,444,184 | | | 69,469,548 | |
| Less accumulated depreciation | (28,175,982) | | | (24,708,151) | |
| Fixed assets, net | 45,268,202 | | | 44,761,397 | |
| Finance lease right-of-use assets | 1,640,694 | | | 851,570 | |
| Operating lease right-of use assets | 34,014,076 | | | 35,586,885 | |
| Intangible assets, net | 9,880,310 | | | 11,243,800 | |
| Deferred income taxes | 0 | | | 68,605 | |
| Other assets | 1,424,288 | | | 840,754 | |
| | | |
| TOTAL ASSETS | $ | 125,153,280 | | | $ | 120,759,919 | |
| | | |
|
| | | | | | | |
| | September 30,
2019 | | December 31,
2018 |
| ASSETS | | | |
| Current assets | | | |
| Cash and cash equivalents | $ | 2,303,725 |
| | $ | 1,249,831 |
|
| Restricted cash | 100,088 |
| | 1,600,000 |
|
| Accounts receivable, net | 10,405,711 |
| | 9,027,990 |
|
| Federal income tax receivable | 205,818 |
| | 137,212 |
|
| Inventory | 5,878,408 |
| | 8,091,397 |
|
| Derivative commodity asset | — |
| | 695,941 |
|
| Prepaid expenses | 6,534,981 |
| | 2,740,541 |
|
| Total current assets | 25,428,731 |
| | 23,542,912 |
|
| | | | |
| Noncurrent assets | |
| | |
|
| Fixed assets, at cost | 69,437,842 |
| | 66,762,388 |
|
| Less accumulated depreciation | (23,550,224 | ) | | (19,874,896 | ) |
| Fixed assets, net | 45,887,618 |
| | 46,887,492 |
|
| Finance lease right-of-use assets | 904,691 |
| | 397,515 |
|
| Operating lease right-of use assets | 36,242,861 |
| | — |
|
| Intangible assets, net | 11,590,876 |
| | 12,578,519 |
|
Federal income tax receivable
| 68,605 |
| | 137,211 |
|
| Other assets | 616,759 |
| | 616,759 |
|
| TOTAL ASSETS | $ | 120,740,141 |
| | $ | 84,160,408 |
|
| | | | |
| | | | | | | | | | | |
| | September 30,
2020 | | December 31,
2019 |
| LIABILITIES, TEMPORARY EQUITY, AND EQUITY | | | |
| Current liabilities | | | |
| Accounts payable | $ | 8,275,862 | | | $ | 7,620,098 | |
| Accrued expenses | 3,312,018 | | | 5,016,132 | |
| Dividends payable | 591,763 | | | 389,176 | |
| Finance lease liability-current | 489,974 | | | 217,164 | |
| Operating lease liability-current | 5,830,681 | | | 5,885,304 | |
| Current portion of long-term debt, net of unamortized finance costs | 4,867,167 | | | 2,017,345 | |
| Derivative commodity liability | 23,995 | | | 375,850 | |
| Revolving note | 0 | | | 3,276,230 | |
| | | |
Total current liabilities | 23,391,460 | | | 24,797,299 | |
| Long-term liabilities | | | |
| Long-term debt, net of unamortized finance costs | 8,297,605 | | | 12,433,000 | |
| Finance lease liability-long-term | 1,072,623 | | | 610,450 | |
| Operating lease liability-long-term | 28,183,395 | | | 29,701,581 | |
| | | |
| Derivative warrant liability | 124,847 | | | 1,969,216 | |
| Total liabilities | 61,069,930 | | | 69,511,546 | |
| | | |
| COMMITMENTS AND CONTINGENCIES (Note 3) | 0 | | | 0 | |
| | | |
| TEMPORARY EQUITY | | | |
Series B Convertible Preferred Stock, $0.001 par value per share; 10,000,000 shares designated, 4,002,619 and 3,826,055 shares issued and outstanding at September 30, 2020 and December 31, 2019, respectively with a liquidation preference of $12,408,119 and $11,860,771 at September 30, 2020 and December 31, 2019, respectively. | 12,408,119 | | | 11,006,406 | |
| | | |
Series B1 Convertible Preferred Stock, $0.001 par value per share; 17,000,000 shares designated, 7,219,164 and 9,028,085 shares issued and outstanding at September 30, 2020 and December 31, 2019, respectively with a liquidation preference of $11,261,896 and $14,083,813 at September 30, 2020 and December 31, 2019, respectively. | 10,567,161 | | | 12,743,047 | |
| | | |
| Redeemable non-controlling interest | 29,928,211 | | | 4,396,894 | |
| Total Temporary Equity | 52,903,491 | | | 28,146,347 | |
| EQUITY | | | |
| 50,000,000 of total Preferred shares authorized: | | | |
Series A Convertible Preferred Stock, $0.001 par value; 5,000,000 shares designated, 419,859 shares issued and outstanding at September 30, 2020 and December 31, 2019, with a liquidation preference of $625,590 at September 30, 2020 and December 31, 2019. | 420 | | | 420 | |
| | | |
Series C Convertible Preferred Stock, $0.001 par value; 44,000 shares designated, 0 shares issued or outstanding. | 0 | | | 0 | |
| | | |
Common stock, $0.001 par value per share; 750,000,000 shares authorized; 45,554,841 and 43,395,563 shares issued and outstanding at September 30, 2020 and December 31, 2019, respectively. | 45,555 | | | 43,396 | |
| Additional paid-in capital | 94,404,520 | | | 81,527,351 | |
| Accumulated deficit | (84,323,362) | | | (59,246,514) | |
| Total Vertex Energy, Inc. stockholders' equity | 10,127,133 | | | 22,324,653 | |
| Non-controlling interest | 1,052,726 | | | 777,373 | |
| Total Equity | 11,179,859 | | | 23,102,026 | |
| TOTAL LIABILITIES, TEMPORARY EQUITY, AND EQUITY | $ | 125,153,280 | | | $ | 120,759,919 | |
|
| | | | | | | |
| | September 30,
2019 | | December 31,
2018 |
| LIABILITIES, TEMPORARY EQUITY, AND EQUITY | |
| | |
|
| Current liabilities | |
| | |
|
| Accounts payable | $ | 7,745,380 |
| | $ | 8,791,529 |
|
| Accrued expenses | 2,275,006 |
| | 2,535,347 |
|
| Dividends payable | 419,082 |
| | 403,002 |
|
| Finance lease liability-current | 214,045 |
| | 95,857 |
|
| Operating lease liability-current | 6,005,502 |
| | — |
|
| Current portion of long-term debt, net of unamortized finance costs | 2,794,624 |
| | 1,325,240 |
|
| Derivative commodity liability | 1,510,573 |
| | — |
|
| Revolving note | 5,387,639 |
| | 3,844,636 |
|
Total current liabilities | 26,351,851 |
| | 16,995,611 |
|
| Long-term liabilities | |
| | |
|
| Long-term debt, net of unamortized finance costs | 12,658,000 |
| | 14,402,179 |
|
| Finance lease liability-long-term | 665,926 |
| | 276,355 |
|
| Operating lease liability-long-term | 30,237,359 |
| | — |
|
| Contingent consideration | — |
| | 15,564 |
|
| Derivative warrant liability | 1,149,977 |
| | 1,481,692 |
|
| Total liabilities | 71,063,113 |
| | 33,171,401 |
|
| | | | |
| COMMITMENTS AND CONTINGENCIES (Note 3) | — |
| | — |
|
| | | | |
| TEMPORARY EQUITY | | | |
Series B Convertible Preferred Stock, $0.001 par value per share;
10,000,000 shares designated, 3,769,505 and 3,604,827 shares issued and outstanding at September 30, 2019 and December 31, 2018, respectively with a liquidation preference of $11,685,466 and $11,174,964 at September 30, 2019 and December 31, 2018, respectively. | 10,442,193 |
| | 8,900,208 |
|
| | | | |
Series B1 Convertible Preferred Stock, $0.001 par value per share;
17,000,000 shares designated, 10,417,966 and 10,057,597 shares issued and outstanding at September 30, 2019 and December 31, 2018, respectively with a liquidation preference of $16,252,027 and $15,689,851 at September 30, 2019 and December 31, 2018, respectively. | 14,454,821 |
| | 13,279,755 |
|
| | | | |
| Redeemable non-controlling interest | 4,000,000 |
| | — |
|
| Total Temporary Equity | 28,897,014 |
| | 22,179,963 |
|
| EQUITY | |
| | |
|
| 50,000,000 of total Preferred shares authorized: | |
| | |
|
Series A Convertible Preferred Stock, $0.001 par value;
5,000,000 shares designated, 419,859 and 419,859 shares issued and outstanding at September 30, 2019 and December 31, 2018, respectively with a liquidation preference of $625,590 and $625,590 at September 30, 2019 and December 31, 2018, respectively. | 420 |
| | 420 |
|
| | | | |
Common stock, $0.001 par value per share;
750,000,000 shares authorized; 41,849,406 and 40,174,821 shares issued and outstanding at September 30, 2019 and December 31, 2018, respectively. | 41,850 |
| | 40,175 |
|
| Additional paid-in capital | 79,719,745 |
| | 75,131,122 |
|
| Accumulated deficit | (59,788,939 | ) | | (47,800,886 | ) |
| Total Vertex Energy, Inc. stockholders' equity | 19,973,076 |
| | 27,370,831 |
|
| Non-controlling interest | 806,938 |
| | 1,438,213 |
|
| Total Equity | 20,780,014 |
| | 28,809,044 |
|
| TOTAL LIABILITIES, TEMPORARY EQUITY, AND EQUITY | $ | 120,740,141 |
| | $ | 84,160,408 |
|
See accompanying notes to the consolidated financial statements
statements.
VERTEX ENERGY, INC.
CONSOLIDATED STATEMENTS OF OPERATIONS
(UNAUDITED)
| | | | | | | | | | | | | | | | | | | | | | | | | | | | | | |
| | | Three Months Ended September 30, | | Nine Months Ended September 30, | | |
| | | 2020 | | 2019 | | 2020 | | 2019 | | | | |
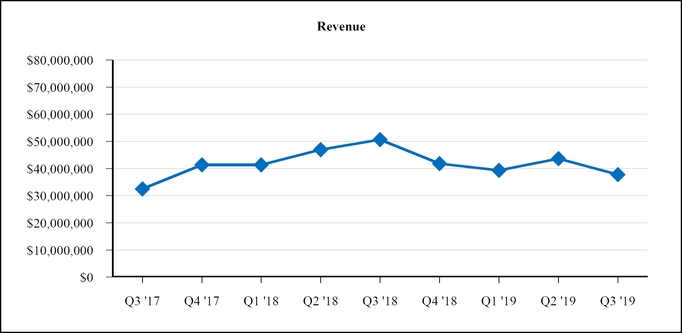
| Revenues | | $ | 37,383,632 | | | $ | 37,799,259 | | | $ | 94,961,188 | | | $ | 120,777,263 | | | | | |
| Cost of revenues (exclusive of depreciation and amortization shown separately below) | | 31,186,684 | | | 32,372,316 | | | 80,221,343 | | | 103,732,086 | | | | | |
| Depreciation and amortization attributable to costs of revenues | | 1,313,162 | | | 1,359,629 | | | 3,731,320 | | | 3,965,626 | | | | | |
| Gross profit | | 4,883,786 | | | 4,067,314 | | | 11,008,525 | | | 13,079,551 | | | | | |
| | | | | | | | | | | | |
| Operating expenses: | | | | | | | | | | | | |
| Selling, general and administrative expenses | | 6,241,570 | | | 6,153,184 | | | 18,972,648 | | | 17,529,784 | | | | | |
| Depreciation and amortization attributable to operating expenses | | 482,869 | | | 455,953 | | | 1,412,719 | | | 1,367,859 | | | | | |
| | | | | | | | | | | | |
| | | | | | | | | | | | |
| Total operating expenses | | 6,724,439 | | | 6,609,137 | | | 20,385,367 | | | 18,897,643 | | | | | |
| | | | | | | | | | | | |
| Loss from operations | | (1,840,653) | | | (2,541,823) | | | (9,376,842) | | | (5,818,092) | | | | | |
| | | | | | | | | | | | |
| Other income (expense): | | | | | | | | | | | | |
| | | | | | | | | | | | |
| | | | | | | | | | | | |
| Other income | | 1 | | | 918,153 | | | 101 | | | 920,071 | | | | | |
| Gain (loss) on sale of assets | | (136,434) | | | 0 | | | (124,090) | | | 31,443 | | | | | |
| Gain on change in value of derivative warrant liability | | 256,587 | | | 1,290,792 | | | 1,844,369 | | | 331,715 | | | | | |
| | | | | | | | | | | | |
| Interest expense | | (234,671) | | | (826,005) | | | (796,930) | | | (2,322,780) | | | | | |
| Total other income (expense) | | (114,517) | | | 1,382,940 | | | 923,450 | | | (1,039,551) | | | | | |
| Loss before income tax | | (1,955,170) | | | (1,158,883) | | | (8,453,392) | | | (6,857,643) | | | | | |
| Income tax benefit (expense) | | 0 | | | 0 | | | 0 | | | 0 | | | | | |
| Net loss | | (1,955,170) | | | (1,158,883) | | | (8,453,392) | | | (6,857,643) | | | | | |
| Net income (loss) attributable to non-controlling interest and redeemable non-controlling interest | | 480,215 | | | (67,102) | | | 190,771 | | | (374,862) | | | | | |
| Net loss attributable to Vertex Energy, Inc. | | (2,435,385) | | | (1,091,781) | | | (8,644,163) | | | (6,482,781) | | | | | |
| | | | | | | | | | | | |
| Accretion of redeemable noncontrolling interest to redemption value | | (1,287,559) | | | (1,849,930) | | | (13,635,797) | | | (1,849,930) | | | | | |
| Accretion of discount on Series B and B1 Preferred Stock | | (29,157) | | | (550,774) | | | (1,500,395) | | | (1,644,374) | | | | | |
| Dividends on Series B and B1 Preferred Stock | | (591,777) | | | (419,096) | | | (1,296,493) | | | (1,238,766) | | | | | |
| Net loss available to common shareholders | | $ | (4,343,878) | | | $ | (3,911,581) | | | $ | (25,076,848) | | | $ | (11,215,851) | | | | | |
| Loss per common share | | | | | | | | | | | | |
| Basic | | $ | (0.10) | | | $ | (0.09) | | | $ | (0.55) | | | $ | (0.28) | | | | | |
| Diluted | | $ | (0.10) | | | $ | (0.09) | | | $ | (0.55) | | | $ | (0.28) | | | | | |
| Shares used in computing earnings per share | | | | | | | | | | | | |
| Basic | | 45,554,841 | | | 41,376,335 | | | 45,494,235 | | | 40,626,700 | | | | | |
| Diluted | | 45,554,841 | | | 41,376,335 | | | 45,494,235 | | | 40,626,700 | | | | | |
|
| | | | | | | | | | | | | | | | |
| | | Three Months Ended September 30, | | Nine Months Ended September 30, |
| | | 2019 | | 2018 | | 2019 | | 2018 |
| Revenues | | $ | 37,799,259 |
| | $ | 50,632,948 |
| | $ | 120,777,263 |
| | $ | 138,918,913 |
|
| Cost of revenues (exclusive of depreciation and amortization shown separately below) | | 32,372,316 |
| | 42,593,367 |
| | 103,732,086 |
| | 114,434,776 |
|
| Gross profit | | 5,426,943 |
| | 8,039,581 |
| | 17,045,177 |
| | 24,484,137 |
|
| | | | | | | | | |
| Operating expenses: | | | | | | | | |
| Selling, general and administrative expenses | | 6,153,184 |
| | 5,658,659 |
| | 17,529,784 |
| | 16,668,692 |
|
| Depreciation and amortization | | 1,815,582 |
| | 1,806,839 |
| | 5,333,485 |
| | 5,234,014 |
|
| Total operating expenses | | 7,968,766 |
| | 7,465,498 |
| | 22,863,269 |
| | 21,902,706 |
|
| Income (loss) from operations | | (2,541,823 | ) | | 574,083 |
| | (5,818,092 | ) | | 2,581,431 |
|
| Other income (expense): | | |
| | |
| | | | |
| Other income | | 918,153 |
| | — |
| | 920,071 |
| | 659 |
|
| Gain on sale of assets | | — |
| | — |
| | 31,443 |
| | 51,523 |
|
| Gain (loss) on change in value of derivative warrant liability | | 1,290,792 |
| | (2,169,133 | ) | | 331,715 |
| | (2,124,971 | ) |
| Interest expense | | (826,005 | ) | | (798,800 | ) | | (2,322,780 | ) | | (2,448,771 | ) |
| Total other income (expense) | | 1,382,940 |
| | (2,967,933 | ) | | (1,039,551 | ) | | (4,521,560 | ) |
| Loss before income tax | | (1,158,883 | ) | | (2,393,850 | ) | | (6,857,643 | ) | | (1,940,129 | ) |
| Income tax benefit (expense) | | — |
| | — |
| | — |
| | — |
|
| Net loss | | (1,158,883 | ) | | (2,393,850 | ) | | (6,857,643 | ) | | (1,940,129 | ) |
| Net loss attributable to non-controlling interest and redeemable non-controlling interest | | (67,102 | ) | | (105,970 | ) | | (374,862 | ) | | 76,305 |
|
| Net loss attributable to Vertex Energy, Inc. | | (1,091,781 | ) | | (2,287,880 | ) | | (6,482,781 | ) | | (2,016,434 | ) |
| | | | | | | | | |
| Accretion of redeemable noncontrolling interest to redemption value | | (1,849,930 | ) | | — |
| | (1,849,930 | ) | | — |
|
| Accretion of discount on Series B and B1 Preferred Stock | | (550,774 | ) | | (1,152,968 | ) | | (1,644,374 | ) | | (2,351,472 | ) |
| Dividends on Series B and B1 Preferred Stock | | (419,096 | ) | | (1,194,524 | ) | | (1,238,766 | ) | | (2,284,121 | ) |
| Net loss available to common shareholders | | $ | (3,911,581 | ) | | $ | (4,635,372 | ) | | $ | (11,215,851 | ) | | $ | (6,652,027 | ) |
| Loss per common share | | |
| | |
| | | | |
| Basic | | $ | (0.09 | ) | | $ | (0.13 | ) | | $ | (0.28 | ) | | $ | (0.20 | ) |
| Diluted | | $ | (0.09 | ) | | $ | (0.13 | ) | | $ | (0.28 | ) | | $ | (0.20 | ) |
| Shares used in computing earnings per share | | |
| | |
| | | | |
| Basic | | 41,376,335 |
| | 35,144,113 |
| | 40,626,700 |
| | 33,843,721 |
|
| Diluted | | 41,376,335 |
| | 35,144,113 |
| | 40,626,700 |
| | 33,843,721 |
|
See accompanying notes to the consolidated financial statements
statements.
VERTEX ENERGY, INC.
CONSOLIDATED STATEMENTS OF EQUITY
FOR THE NINE MONTHS ENDED SEPTEMBER 30, 20192020 AND 20182019
(UNAUDITED)
| | | | | | | | | | | | | | | | | | | | | | | | | | | | | | | | | | | | | | | | | | | | | | | | | | | | | | | | | | | |
| Nine Months Ended September 30, 2020 |
| Common Stock | | Series A Preferred | | Series C Preferred | | | | | | | | |
| | Shares | | $0.001 Par | | Shares | | $0.001 Par | | Shares | | $0.001 Par | | Additional Paid-In Capital | | Retained Earnings | | Non-controlling Interest | | Total Equity |
| Balance on January 1, 2020 | 43,395,563 | | | $ | 43,396 | | | 419,859 | | | $ | 420 | | | 0 | | | $ | 0 | | | $ | 81,527,351 | | | $ | (59,246,514) | | | $ | 777,373 | | | $ | 23,102,026 | |
| Purchase of shares of consolidated subsidiary | — | | | — | | | — | | | — | | | — | | | — | | | (71,171) | | | — | | | — | | | (71,171) | |
| | | | | | | | | | | | | | | | | | | |
| Adjustment of carrying mount of non-controlling interest | — | | | — | | | — | | | — | | | — | | | — | | | 9,091,068 | | | — | | | — | | | 9,091,068 | |
| Share based compensation expense | — | | | — | | | — | | | — | | | — | | | — | | | 163,269 | | | — | | | — | | | 163,269 | |
| | | | | | | | | | | | | | | | | | | |
| | | | | | | | | | | | | | | | | | | |
| Conversion of Series B1 Preferred stock to common | 2,159,278 | | | 2,159 | | | — | | | — | | | — | | | — | | | 3,366,315 | | | — | | | — | | | 3,368,474 | |
| Dividends on Series B and B1 | — | | | — | | | — | | | — | | | — | | | — | | | — | | | (344,499) | | | — | | | (344,499) | |
| Accretion of discount on Series B and B1 | — | | | — | | | — | | | — | | | — | | | — | | | — | | | (932,003) | | | — | | | (932,003) | |
| Accretion of redeemable non-controlling interest to redemption value | — | | | — | | | — | | | — | | | — | | | — | | | — | | | (10,966,349) | | | — | | | (10,966,349) | |
| Net income | — | | | — | | | — | | | — | | | — | | | — | | | — | | | 2,788,860 | | | 119,268 | | | 2,908,128 | |
| Balance on March 31, 2020 | 45,554,841 | | | $ | 45,555 | | | 419,859 | | | $ | 420 | | | 0 | | | $ | 0 | | | $ | 94,076,832 | | | $ | (68,700,505) | | | $ | 896,641 | | | $ | 26,318,943 | |
| | | | | | | | | | | | | | | | | | | |
| Share based compensation expense | — | | | — | | | — | | | — | | | — | | | — | | | 156,539 | | | — | | | — | | | 156,539 | |
| Dividends on Series B and B1 | — | | | — | | | — | | | — | | | — | | | — | | | — | | | (360,217) | | | — | | | (360,217) | |
| Accretion of discount on Series B and B1 | — | | | — | | | — | | | — | | | — | | | — | | | — | | | (539,235) | | | — | | | (539,235) | |
| Accretion of redeemable non-controlling interest to redemption value | — | | | — | | | — | | | — | | | — | | | — | | | — | | | (1,381,889) | | | — | | | (1,381,889) | |
| Net loss | — | | | — | | | — | | | — | | | — | | | — | | | — | | | (8,997,638) | | | (17,879) | | | (9,015,517) | |
| Balance on June 30, 2020 | 45,554,841 | | | $ | 45,555 | | | 419,859 | | | $ | 420 | | | 0 | | | $ | 0 | | | $ | 94,233,371 | | | $ | (79,979,484) | | | $ | 878,762 | | | $ | 15,178,624 | |
| | | | | | | | | | | | | | | | | | | |
| Share based compensation expense | — | | | — | | | — | | | — | | | — | | | — | | | 171,149 | | | — | | | — | | | 171,149 | |
| Dividends on Series B and B1 | — | | | — | | | — | | | — | | | — | | | — | | | — | | | (591,777) | | | — | | | (591,777) | |
| Accretion of discount on Series B and B1 | — | | | — | | | — | | | — | | | — | | | — | | | — | | | (29,157) | | | — | | | (29,157) | |
| | | | | | | | | | | | | | | | | | | |
| Accretion of redeemable non-controlling interest to redemption value | — | | | — | | | — | | | — | | | — | | | — | | | — | | | (1,287,559) | | | — | | | (1,287,559) | |
| | | | | | | | | | | | | | | | | | | |
| | | | | | | | | | | | | | | | | | | |
| Net loss | — | | | — | | | — | | | — | | | — | | | — | | | — | | | (2,435,385) | | | 173,964 | | | (2,261,421) | |
| Balance on September 30, 2020 | 45,554,841 | | | $ | 45,555 | | | 419,859 | | | $ | 420 | | | 0 | | | $ | 0 | | | $ | 94,404,520 | | | $ | (84,323,362) | | | $ | 1,052,726 | | | $ | 11,179,859 | |
| | | Nine Months Ended September 30, 2019 | Nine Months Ended September 30, 2019 | Nine Months Ended September 30, 2019 |
| | Common Stock | | Series A Preferred | | | | | | | | | | Common Stock | | Series A Preferred | | Series C Preferred | |
| | Shares | | $.001 Par | | Shares | | $0.001 Par | | Additional Paid-In Capital | | Retained Earnings | | Non-controlling Interest | | Total Equity | | Shares | | $0.001 Par | | Shares | | $0.001 Par | | Shares | | $0.001 Par | | Additional Paid-In Capital | | Retained Earnings | | Non-controlling Interest | | Total Equity |
| Balance on January 1, 2019 | 40,174,821 |
| | $ | 40,175 |
| | 419,859 |
| | $ | 420 |
| | $ | 75,131,122 |
| | $ | (47,800,886 | ) | | $ | 1,438,213 |
| | $ | 28,809,044 |
| Balance on January 1, 2019 | 40,174,821 | | | $ | 40,175 | | | 419,859 | | | $ | 420 | | | 0 | | | $ | 0 | | | $ | 75,131,122 | | | $ | (47,800,886) | | | $ | 1,438,213 | | | $ | 28,809,044 | |
| Share based compensation expense, total | — |
| | — |
| | — |
| | — |
| | 143,063 |
| | — |
| | — |
| | 143,063 |
| |
| | Share based compensation expense | | Share based compensation expense | — | | | — | | | — | | | — | | | — | | | — | | | 143,063 | | | — | | | — | | | 143,063 | |
| | Conversion of Series B1 Preferred stock to common | 96,160 |
| | 96 |
| | — |
| | — |
| | 149,914 |
| | (30,242 | ) | | — |
| | 119,768 |
| Conversion of Series B1 Preferred stock to common | 96,160 | | | 96 | | | — | | | — | | | — | | | — | | | 149,914 | | | — | | | — | | | 150,010 | |
| Dividends on Series B and B1 | — |
| | — |
| | — |
| | — |
| | — |
| | (406,795 | ) | | — |
| | (406,795 | ) | Dividends on Series B and B1 | — | | | — | | | — | | | — | | | — | | | — | | | — | | | (406,795) | | | — | | | (406,795) | |
| Accretion of discount on Series B and B1 | — |
| | — |
| | — |
| | — |
| | — |
| | (530,433 | ) | | — |
| | (530,433 | ) | Accretion of discount on Series B and B1 | — | | | — | | | — | | | — | | | — | | | — | | | — | | | (560,675) | | | — | | | (560,675) | |
| Net loss | — |
| | — |
| | — |
| | — |
| | — |
| | (4,963,564 | ) | | (105,431 | ) | | (5,068,995 | ) | Net loss | — | | | — | | | — | | | — | | | — | | | — | | | — | | | (4,963,564) | | | (105,431) | | | (5,068,995) | |
| Balance on March 31, 2019 | 40,270,981 |
| | $ | 40,271 |
| | 419,859 |
| | $ | 420 |
| | $ | 75,424,099 |
| | $ | (53,731,920 | ) | | $ | 1,332,782 |
| | $ | 23,065,652 |
| Balance on March 31, 2019 | 40,270,981 | | | $ | 40,271 | | | 419,859 | | | $ | 420 | | | 0 | | | $ | 0 | | | $ | 75,424,099 | | | $ | (53,731,920) | | | $ | 1,332,782 | | | $ | 23,065,652 | |
| Exercise of options to common | 75,925 |
| | 76 |
| | — |
| | — |
| | 4,424 |
| | — |
| | — |
| | 4,500 |
| |
| Share based compensation expense, total | — |
| | — |
| | — |
| | — |
| | 171,002 |
| | — |
| | — |
| | 171,002 |
| |
| Exercise of options to purchase common stock | | Exercise of options to purchase common stock | 75,925 | | | 76 | | | — | | | — | | | — | | | — | | | 4,424 | | | — | | | — | | | 4,500 | |
| Share based compensation expense | | Share based compensation expense | — | | | — | | | — | | | — | | | — | | | — | | | 171,002 | | | — | | | — | | | 171,002 | |
| Distribution to noncontrolling | | Distribution to noncontrolling | — | | | — | | | — | | | — | | | — | | | — | | | — | | | — | | | (285,534) | | | (285,534) | |
| | Dividends on Series B and B1 | — |
| | — |
| | — |
| | — |
| | — |
| | (412,875 | ) | | — |
| | (412,875 | ) | Dividends on Series B and B1 | — | | | — | | | — | | | — | | | — | | | — | | | — | | | (412,875) | | | — | | | (412,875) | |
| Accretion of discount on Series B and B1 | — |
| | — |
| | — |
| | — |
| | — |
| | (532,925 | ) | | — |
| | (532,925 | ) | Accretion of discount on Series B and B1 | — | | | — | | | — | | | — | | | — | | | — | | | — | | | (532,925) | | | — | | | (532,925) | |
| VRM LA distribution | — |
| | — |
| | — |
| | — |
| | — |
| | — |
| | (285,534 | ) | | (285,534 | ) | |
| Net loss | — |
| | — |
| | — |
| | — |
| | — |
| | (427,436 | ) | | (202,329 | ) | | (629,765 | ) | |
| Net income | | Net income | — | | | — | | | — | | | — | | | — | | | — | | | — | | | (427,436) | | | (202,329) | | | (629,765) | |
| Balance on June 30, 2019 | 40,346,906 |
| | $ | 40,347 |
| | 419,859 |
| | $ | 420 |
| | $ | 75,599,525 |
| | $ | (55,105,156 | ) | | $ | 844,919 |
| | $ | 21,380,055 |
| Balance on June 30, 2019 | 40,346,906 | | | $ | 40,347 | | | 419,859 | | | $ | 420 | | | 0 | | | $ | 0 | | | $ | 75,599,525 | | | $ | (55,105,156) | | | $ | 844,919 | | | $ | 21,380,055 | |
| Exercise of options to common | 2,500 |
| | 3 |
| | — |
| | — |
| | 2,572 |
| | — |
| | — |
| | 2,575 |
| Exercise of options to common | 2,500 | | | 3 | | | — | | | — | | | — | | | — | | | 2,572 | | | — | | | — | | | 2,575 | |
| Share based compensation expense, total | — |
| | — |
| | — |
| | — |
| | 159,426 |
| | — |
| | — |
| | 159,426 |
| |
| Share based compensation expense | | Share based compensation expense | — | | | — | | | — | | | — | | | — | | | — | | | 159,426 | | | — | | | — | | | 159,426 | |
| Adjustment of carrying amount of non-controlling interest | | Adjustment of carrying amount of non-controlling interest | — | | | — | | | — | | | — | | | — | | | — | | | 970,809 | | | — | | | — | | | 970,809 | |
| Accretion of redeemable non-controlling interest to redemption value | | Accretion of redeemable non-controlling interest to redemption value | — | | | — | | | — | | | — | | | — | | | — | | | — | | | (1,849,930) | | | — | | | (1,849,930) | |
| Issuance of common stock and warrants | | Issuance of common stock and warrants | 1,500,000 | | | 1,500 | | | — | | | — | | | — | | | — | | | 2,987,413 | | | (772,202) | | | — | | | 2,216,711 | |
| Dividends on Series B and B1 | — |
| | — |
| | — |
| | — |
| | — |
| | (419,096 | ) | | — |
| | (419,096 | ) | Dividends on Series B and B1 | — | | | — | | | — | | | — | | | — | | | — | | | — | | | (419,096) | | | — | | | (419,096) | |
| Accretion of discount on Series B and B1 | — |
| | — |
| | — |
| | — |
| | — |
| | (550,774 | ) | | — |
| | (550,774 | ) | Accretion of discount on Series B and B1 | — | | | — | | | — | | | — | | | — | | | — | | | — | | | (550,774) | | | — | | | (550,774) | |
| Adjustment of carrying mount of non-controlling interest | — |
| | — |
| | — |
| | — |
| | 970,809 |
| | — |
| | — |
| | 970,809 |
| |
| Accretion of redeemable non-controlling interest to redemption value | — |
| | — |
| | — |
| | — |
| | — |
| | (1,849,930 | ) | | — |
| | (1,849,930 | ) | |
| Issuance of common stock and warrants | 1,500,000 |
| | 1,500 |
| | — |
| | — |
| | 2,987,413 |
| | (772,202 | ) | | — |
| | 2,216,711 |
| |
| Net loss | — |
| | — |
| | — |
| | — |
| | — |
| | (1,091,781 | ) | | (37,981 | ) | | (1,129,762 | ) | |
| Net income | | Net income | — | | | — | | | — | | | — | | | — | | | — | | | — | | | (1,091,781) | | | (37,981) | | | (1,129,762) | |
| Balance on September 30, 2019 | 41,849,406 |
| | $ | 41,850 |
| | 419,859 |
| | $ | 420 |
| | $ | 79,719,745 |
| | $ | (59,788,939 | ) | | $ | 806,938 |
| | $ | 20,780,014 |
| Balance on September 30, 2019 | 41,849,406 | | | $ | 41,850 | | | 419,859 | | | $ | 420 | | | 0 | | | $ | 0 | | | $ | 79,719,745 | | | $ | (59,788,939) | | | $ | 806,938 | | | $ | 20,780,014 | |
|
| | | | | | | | | | | | | | | | | | | | | | | | | | | | | | | | | | | | |
| Nine Months Ended September 30, 2018 |
| | Common Stock | | Series A Preferred | | Series C Preferred | | | | | | | | |
| | Shares | | $.001 Par | | Shares | | $.001 Par | | Shares | | $0.001 Par | | Additional Paid-In Capital | | Retained Earnings | | Non-controlling Interest | | Total Equity |
| Balance on January 1, 2018 | 32,658,176 |
| | $ | 32,658 |
| | 453,567 |
| | $ | 454 |
| | 31,568 |
| | $ | 32 |
| | $ | 67,768,509 |
| | $ | (39,816,300 | ) | | $ | 399,005 |
| | $ | 28,384,358 |
|
| Share based compensation expense, total | — |
| | — |
| | — |
| | — |
| | — |
| | — |
| | 145,971 |
| | — |
| | — |
| | 145,971 |
|
| Conversion of Series B1 Preferred stock to common | 500,000 |
| | 500 |
| | — |
| | — |
| | — |
| | — |
| | 779,500 |
| | (184,437 | ) | | — |
| | 595,563 |
|
| Dividends on Series B and B1 | — |
| | — |
| | — |
| | — |
| | — |
| | — |
| | — |
| | (554,917 | ) | | — |
| | (554,917 | ) |
| Accretion of discount on Series B and B1 | — |
| | — |
| | — |
| | — |
| | — |
| | — |
| | — |
| | (457,853 | ) | | — |
| | (457,853 | ) |
| Net income (loss) | — |
| | — |
| | — |
| | — |
| | — |
| | — |
| | — |
| | (2,258,622 | ) | | 50,539 |
| | (2,208,083 | ) |
| Balance on March 31, 2018 | 33,158,176 |
| | $ | 33,158 |
| | 453,567 |
| | $ | 454 |
| | 31,568 |
| | $ | 32 |
| | $ | 68,693,980 |
| | $ | (43,272,129 | ) | | $ | 449,544 |
| | $ | 25,905,039 |
|
| Exercise of options to common | 241 |
| | — |
| | — |
| | — |
| | — |
| | — |
| | — |
| | — |
| | — |
| | — |
|
| Share based compensation expense, total | — |
| | — |
| | — |
| | — |
| | — |
| | — |
| | 183,750 |
| | — |
| | — |
| | 183,750 |
|
| Conversion of Series A Preferred stock to common | 33,708 |
| | 34 |
| | (33,708 | ) | | (34 | ) | | — |
| | — |
| | — |
| | — |
| | — |
| | — |
|
| Conversion of Series B Preferred stock to common | 32,149 |
| | 33 |
| | — |
| | — |
| | — |
| | — |
| | 99,629 |
| | (36,700 | ) | | — |
| | 62,962 |
|
| Conversion of Series B1 Preferred stock to common | 133,264 |
| | 133 |
| | — |
| | — |
| | — |
| | — |
| | 207,759 |
| | (48,689 | ) | | — |
| | 159,203 |
|
| Dividends on Series B and B1 | — |
| | — |
| | — |
| | — |
| | — |
| | — |
| | — |
| | (534,680 | ) | | — |
| | (534,680 | ) |
| Accretion of discount on Series B and B1 | — |
| | — |
| | — |
| | — |
| | — |
| | — |
| | — |
| | (470,825 | ) | | — |
| | (470,825 | ) |
| Net income | — |
| | — |
| | — |
| | — |
| | — |
| | — |
| | — |
| | 2,530,068 |
| | 131,736 |
| | 2,661,804 |
|
| Balance on June 30, 2018 | 33,357,538 |
| | $ | 33,358 |
| | 419,859 |
| | $ | 420 |
| | 31,568 |
| | $ | 32 |
| | $ | 69,185,118 |
| | $ | (41,832,955 | ) | | $ | 581,280 |
| | $ | 27,967,253 |
|
| Correction of non-controlling interest | — |
| | — |
| | — |
| | — |
| | — |
| | — |
| | — |
| | 101,718 |
| | (101,718 | ) | | — |
|
| Share based compensation expense, total | — |
| | — |
| | — |
| | — |
| | — |
| | — |
| | 165,058 |
| | — |
| | — |
| | 165,058 |
|
| Fixed assets contributed capital VRMLA | — |
| | — |
| | — |
| | — |
| | — |
| | — |
| | — |
| | — |
| | 857,738 |
| | 857,738 |
|
| Conversion of Series C Preferred stock to common | 3,156,800 |
| | 3,157 |
| | — |
| | — |
| | (31,568 | ) | | (32 | ) | | (3,125 | ) | | — |
| | — |
| | — |
|
| Conversion of Series B1 Preferred stock to common | 2,326,552 |
| | 2,326 |
| | — |
| | — |
| | — |
| | — |
| | 3,627,095 |
| | (637,270 | ) | | — |
| | 2,992,151 |
|
| Dividends on Series B and B1 | — |
| | — |
| | — |
| | — |
| | — |
| | — |
| | — |
| | (1,194,524 | ) | | — |
| | (1,194,524 | ) |
| Accretion of discount on Series B and B1 | — |
| | — |
| | — |
| | — |
| | — |
| | — |
| | — |
| | (515,698 | ) | | — |
| | (515,698 | ) |
| Net income | — |
| | — |
| | — |
| | — |
| | — |
| | — |
| | — |
| | (2,287,880 | ) | | (105,970 | ) | | (2,393,850 | ) |
| Balance on September 30, 2018 | 38,840,890 |
| | $ | 38,841 |
| | 419,859 |
| | $ | 420 |
| | — |
| | $ | — |
| | $ | 72,974,146 |
| | $ | (46,366,609 | ) | | $ | 1,231,330 |
| | $ | 27,878,128 |
|
See accompanying notes to the consolidated financial statements
statements.
VERTEX ENERGY, INC.
CONSOLIDATED STATEMENTS OF CASH FLOWS
NINE MONTHS ENDED SEPTEMBER 30, 20192020 AND 20182019 (UNAUDITED)
| | | | | | | | | | | | |
| | Nine Months Ended | |
| | September 30,
2020 | | September 30,
2019 | |
| Cash flows from operating activities | | | | |
| Net loss | $ | (8,453,392) | | | $ | (6,857,643) | | |
| Adjustments to reconcile net loss to cash provided by operating activities | | | | |
| Stock based compensation expense | 490,957 | | | 473,491 | | |
| Depreciation and amortization | 5,144,039 | | | 5,333,485 | | |
| | | | |
| Loss (gain) on sale of assets | 124,090 | | | (31,443) | | |
| | | | |
| Contingent consideration reduction | 0 | | | (15,564) | | |
| Bad debt and reduction in allowance for bad debt | 34,127 | | | (389,943) | | |
| (Decrease) increase in fair value of derivative warrant liability | (1,844,369) | | | (331,715) | | |
| (Gain) loss on commodity derivative contracts | (4,489,355) | | | 2,691,833 | | |
| Net cash settlements on commodity derivatives | 5,484,734 | | | (3,446,274) | | |
| Amortization of debt discount and deferred costs | 47,826 | | | 430,431 | | |
| Changes in operating assets and liabilities, net of effect of acquisition | | | | |
| Accounts receivable | 4,952,388 | | | (987,778) | | |
| | | | |
| Inventory | 3,939,674 | | | 2,212,989 | | |
| Prepaid expenses | (1,477,191) | | | (833,485) | | |
| Accounts payable | (367,327) | | | (1,046,149) | | |
| Accrued expenses | (1,788,693) | | | (260,341) | | |
| Other assets | (446,324) | | | 0 | | |
| Net cash provided by (used in) operating activities | 1,351,184 | | | (3,058,106) | | |
| Cash flows from investing activities | | | | |
| Acquisition | (1,822,690) | | | 0 | | |
| | | | |
| Internally developed software | (49,229) | | | (380,216) | | |
| | | | |
| | | | |
| Purchase of fixed assets | (4,170,166) | | | (2,907,330) | | |
| | | | |
| | | | |
| | | | |
| Proceeds from sale of fixed assets | 36,465 | | | 86,846 | | |
| Net cash used in investing activities | (6,005,620) | | | (3,200,700) | | |
| Cash flows from financing activities | | | | |
| Payments on finance leases | (282,655) | | | (113,241) | | |
| Proceeds from exercise of stock options | 0 | | | 7,075 | | |
| Distribution VRM LA | 0 | | | (285,534) | | |
| Contributions received from redeemable noncontrolling interest | 21,000,000 | | | 3,150,000 | | |
| Proceeds received from issuance of common stock and warrants | 0 | | | 2,216,711 | | |
| Line of credit (payments) proceeds, net | (3,276,230) | | | 1,543,003 | | |
| | | | |
| Proceeds from note payable (includes proceeds from PPP note) | 7,992,346 | | | 2,809,139 | | |
| Payments on note payable | (9,325,745) | | | (3,514,365) | | |
| Net cash provided by financing activities | 16,107,716 | | | 5,812,788 | | |
| Net change in cash, cash equivalents and restricted cash | 11,453,280 | | | (446,018) | | |
| Cash, cash equivalents, and restricted cash at beginning of the period | 4,199,825 | | | 2,849,831 | | |
| Cash, cash equivalents, and restricted cash at end of period | $ | 15,653,105 | | | $ | 2,403,813 | | |
| | | | |
|
| | | | | | | |
| | Nine Months Ended |
| | September 30,
2019 | | September 30,
2018 |
| Cash flows from operating activities | | | |
| Net loss | $ | (6,857,643 | ) | | $ | (1,940,129 | ) |
| Adjustments to reconcile net loss to cash provided by (used in) operating activities | |
| | |
|
| Stock based compensation expense | 473,491 |
| | 494,779 |
|
| Depreciation and amortization | 5,333,485 |
| | 5,234,014 |
|
| Gain on sale of assets | (31,443 | ) | | (51,523 | ) |
| Contingent consideration reduction | (15,564 | ) | | — |
|
| Reduction in allowance for bad debt | (389,943 | ) | | — |
|
| (Decrease) increase in fair value of derivative warrant liability | (331,715 | ) | | 2,124,971 |
|
| Loss on commodity derivative contracts | 2,691,833 |
| | 1,859,234 |
|
| Net cash settlements on commodity derivatives | (3,446,274 | ) | | (2,386,897 | ) |
| Amortization of debt discount and deferred costs | 430,431 |
| | 474,360 |
|
| Changes in operating assets and liabilities | | | |
| Accounts receivable | (987,778 | ) | | (3,091,273 | ) |
| Inventory | 2,212,989 |
| | (341,329 | ) |
| Prepaid expenses | (833,485 | ) | | (1,072,076 | ) |
| Accounts payable | (1,046,149 | ) | | 534,689 |
|
| Accrued expenses | (260,341 | ) | | (1,175,692 | ) |
| Other assets | — |
| | (253,642 | ) |
| Net cash (used in) provided by operating activities | (3,058,106 | ) | | 409,486 |
|
| Cash flows from investing activities | |
| | |
|
| Acquisition of SES | — |
| | (269,826 | ) |
| Internally developed software | (380,216 | ) | | — |
|
| Purchase of fixed assets | (2,907,330 | ) | | (1,813,904 | ) |
| Proceeds from sale of fixed assets | 86,846 |
| | 6,848 |
|
| Net cash used in investing activities | (3,200,700 | ) | | (2,076,882 | ) |
| Cash flows from financing activities | |
| | |
|
| Payments on finance leases | (113,241 | ) | | (34,660 | ) |
| Proceeds from exercise of stock options | 7,075 |
| | — |
|
| Distribution VRM LA | (285,534 | ) | | — |
|
| Contributions received from redeemable noncontrolling interest | 3,150,000 |
| | — |
|
| Proceeds received from issuance of common stock and warrants | 2,216,711 |
| | — |
|
| Line of credit (payments) proceeds, net | 1,543,003 |
| | 1,408,206 |
|
| Proceeds from note payable | 2,809,139 |
| | 4,024,964 |
|
| Payments on note payable | (3,514,365 | ) | | (2,996,556 | ) |
| Net cash provided by financing activities | 5,812,788 |
| | 2,401,954 |
|
| Net change in cash, cash equivalents and restricted cash | (446,018 | ) | | 734,558 |
|
| Cash, cash equivalents, and restricted cash at beginning of the period | 2,849,831 |
| | 1,105,787 |
|
| Cash, cash equivalents, and restricted cash at end of period | $ | 2,403,813 |
| | $ | 1,840,345 |
|
| | | | |
| | | | | | | | | | | |
| SUPPLEMENTAL INFORMATION | | | |
| Cash paid for interest | $ | 812,887 | | | $ | 1,887,012 | |
| Cash paid for taxes | $ | 0 | | | $ | 0 | |
| NON-CASH INVESTING AND FINANCING TRANSACTIONS | | | |
| | | |
| | | |
| Conversion of Series B1 Preferred Stock into common stock | $ | 3,368,474 | | | $ | 149,914 | |
| Accretion of discount on Series B and B1 Preferred Stock | $ | 1,500,395 | | | $ | 1,644,374 | |
| Dividends-in-kind accrued on Series B and B1 Preferred Stock | $ | 1,296,493 | | | $ | 1,238,766 | |
| Equipment acquired under finance leases | $ | 1,017,638 | | | $ | 621,000 | |
| Initial adjustment of carrying amount redeemable noncontrolling interests | $ | 9,091,068 | | | $ | 970,809 | |
| Accretion of redeemable noncontrolling interest to redemption value | $ | 13,635,797 | | | $ | 1,849,930 | |
| | | |
|
| | | | | | | |
| SUPPLEMENTAL INFORMATION | | | |
| Cash paid for interest | $ | 1,887,012 |
| | $ | 2,034,275 |
|
| Cash paid for taxes | $ | — |
| | $ | — |
|
| NON-CASH INVESTING AND FINANCING TRANSACTIONS | | | |
| Conversion of Series A Preferred Stock into common stock | $ | — |
| | $ | 34 |
|
| Conversion of Series B Preferred Stock into common stock | $ | — |
| | $ | 99,629 |
|
| Conversion of Series B1 Preferred Stock into common stock | $ | 149,914 |
| | $ | 4,614,354 |
|
| Accretion of discount on Series B and B1 Preferred Stock | $ | 1,644,374 |
| | $ | 2,351,472 |
|
| Dividends-in-kind accrued on Series B and B1 Preferred Stock | $ | 1,238,766 |
| | $ | 2,284,121 |
|
| Equipment acquired under finance leases | $ | 621,000 |
| | $ | 450,098 |
|
| Initial adjustment of carrying amount redeemable noncontrolling interest | $ | 970,809 |
| | $ | — |
|
| Accretion of redeemable noncontrolling interest to redemption value | $ | 1,849,930 |
| | $ | — |
|
See accompanying notes to the consolidated financial statements
statements.
VERTEX ENERGY, INC.
NOTES TO CONSOLIDATED FINANCIAL STATEMENTS
SEPTEMBER 30, 20192020
(UNAUDITED)
NOTE 1. BASIS OF PRESENTATION AND NATURE OF OPERATIONS
The accompanying unaudited consolidated interim financial statements of Vertex Energy, Inc. (the "Company" or "Vertex Energy") have been prepared in accordance with accounting principles generally accepted in the United States of America and the rules of the Securities and Exchange Commission ("SEC") and should be read in conjunction with the audited consolidated financial statements and notes thereto for the year ended December 31, 2018,2019, contained in the Company's annual report, as filed with the SEC on Form 10-K on March 6, 20194, 2020 (the "Form 10-K"). The December 31, 20182019 balance sheet was derived from the audited financial statements of our 20182019 Form 10-K. In the opinion of management all adjustments, consisting of normal recurring adjustments necessary for a fair presentation of financial position and the results of operations for the interim periods presented, have been reflected herein. The results of operations for interim periods are not necessarily indicative of the results to be expected for the full year. Notes to the consolidated financial statements which would substantially duplicate the disclosures contained in the audited consolidated financial statements for the most recent fiscal year 20182019 as reported in Form 10-K have been omitted.
Uses
Novel Coronavirus (COVID-19)
In December 2019, a novel strain of coronavirus, which causes the infectious disease known as COVID-19, was reported in Wuhan, China. The World Health Organization declared COVID-19 a “Public Health Emergency of International Concern” on January 30, 2020 and Sourcesa global pandemic on March 11, 2020. In March and April, many U.S. states and local jurisdictions began issuing ‘stay-at-home’ orders, which continue in various forms as of Liquiditythe date of this report. Notwithstanding such ‘stay-at-home’ orders, to date, our operations have for the most part been deemed an essential business under applicable governmental orders based on the critical nature of the products we offer.
We sell products and services primarily in the U.S. domestic oil and gas commodity markets. Throughout the first quarter of 2020, the industry experienced multiple factors which lowered both the demand for, and prices of, oil and gas. First, the COVID-19 pandemic lowered global demand for hydrocarbons, as social distancing and travel restrictions were implemented across the world. Second, the lifting of Organization of the Petroleum Exporting Countries (OPEC)+ supply curtailments, and the associated increase in production of oil, drove the global supply of hydrocarbons higher through the first quarter of 2020. As a result of both dynamics, prices for hydrocarbons declined 67% from peak prices within the first quarter of 2020. While global gross domestic product (GDP) growth was impacted by COVID-19 during the first nine months of 2020, we expect GDP to continue to decline globally in the fourth quarter of 2020 and for at least the early part of 2021, as a result of the COVID-19 pandemic. As a result, we expect oil and gas related markets will continue to experience significant volatility in 2020 and 2021. Our goal through this downturn has been to remain disciplined in allocating capital and to focus on liquidity and cash preservation. We are taking the necessary actions to right-size the business for expected activity levels.
As a result of the impact of the COVID-19 outbreak, some of our feedstock suppliers have permanently or temporarily closed their businesses, limited our access to their businesses, and/or have experienced a decreased demand for services. As a result of the above, and due to ‘stay-at-home’ and other social distancing orders, as well as the decline in U.S. travel caused by COVID-19, we have seen a significant decline in the volume of feedstocks (specifically used oil) that we have been able to collect, and therefore process through our facilities. A prolonged economic slowdown, period of social quarantine (imposed by the government or otherwise), or a prolonged period of decreased travel due to COVID-19 or the responses thereto, will likely continue to have a material negative adverse impact on our ability to produce products, and consequently our revenues and results of operations.
The Company’s primary need for liquidity is to fund working capital requirementsfull extent of the Company’s businesses, capital expendituresimpact of COVID-19 on our business and for general corporate purposes, including debt repayment. The Company has incurred operating losses for the past several years,operations currently cannot be estimated and accordingly, the Company has takenwill depend on a number of actionsfactors including the scope and duration of the global pandemic.
Currently we believe that we have sufficient cash on hand and will generate sufficient cash through operations to support our operations for the foreseeable future; however, we will continue to support itsevaluate our business operations based on new information as it becomes available and meet its obligations.will make changes that we consider necessary in light of any new developments regarding the pandemic.
During 2018,
The pandemic is developing rapidly and the Company continuedfull extent to face a challenging competitive environmentwhich COVID-19 will ultimately impact us depends on future developments, including the duration and while it continues to focus on its overall profitability,spread of the virus, as well as potential seasonality of new outbreaks, including, managing expenses, it reported a loss in 2018 and funded operating activities with cash from investing and financing activities. Moving forward, the Company expects to generate additional liquidity from strategic initiatives including monetization of assets and raising funds from debt and equity financing transactions. The Company expects that these actions will be executed in alignment with the anticipated timing of its liquidity needs.
We had a working capital deficit of $923,120 as of September 30, 2019, compared to working capital of $6,547,301 as of December 31, 2018. The decline in working capital from December 31, 2018 to September 30, 2019, is mainly duebut not limited to the current portion of the operating lease liability in connection with the implementation of the new lease accounting requirements, anrecent increase in derivative commodity liability,infection rates, which may lead to further or extended stay-at-home and an increasesimilar orders in the balance of the Company's revolving note, offset by an increasemarkets in prepaid expenses.which we operate.
To address the liquidity deficiency and operating losses, the Company is considering pursuing a number of actions, including: 1) seeking to obtain additional funds through public or private financing sources; 2) restructuring existing debts from creditors; 3) seeking to reduce operating costs; 4) minimizing projected capital costs for the remainder of 2019 and 2020; and 5) exploring opportunities to sell or lease non-income producing assets.
The Company’s historical operating results indicate substantial doubt exists related to its ability to continue as a going concern. However, the Company believes it is probable that the actions discussed above will occur and mitigate the substantial doubt raised by its historical operating results and satisfy its estimated liquidity needs 12 months from the issuance of the financial statements. However, the Company cannot predict, with certainty, the outcome of its actions to generate liquidity, including the availability of additional debt or equity financing, or whether such actions would generate the expected liquidity as currently planned. In addition, the Company's Preferred Stock contains certain limitations on the Company's ability to sell assets, which could impact the Company's ability to complete asset sale transactions or the Company's ability to use proceeds from those transactions to fund its operations. Therefore, any planned actions must take into account the ability to transact within any applicable restrictions under these agreements and securities. If the Company continues to experience operating losses and is not able to generate additional liquidity through the mechanisms described above or through some combination of other actions, while not expected, it may be forced to secure additional sources of funds, which may or may not be available to us. Additionally, a failure to generate additional liquidity could negatively impact the Company’s access to materials or services that are important to the operation of its business.
NOTE 2. SUMMARY OF CRITICAL ACCOUNTING POLICIES AND ESTIMATES
Cash, Cash Equivalents and Restricted Cash
The Company considers all highly liquid investments with an original maturity of three months or less to be cash equivalents.
The following table provides a reconciliation of cash and cash equivalents and restricted cash reported within the consolidated balance sheets to the same such amounts shown in the consolidated statements of cash flows.
| | | | | | | | | | | |
| September 30, 2020 unaudited | | September 30, 2019 |
| Cash and cash equivalents | $ | 15,552,980 | | | $ | 2,303,725 | |
| Restricted cash | 100,125 | | | 100,088 | |
| Cash and cash equivalents and restricted cash as shown in the consolidated statements of cash flows | $ | 15,653,105 | | | $ | 2,403,813 | |
|
| | | | | | | |
| | September 30, 2019 | | September 30, 2018 |
| Cash and cash equivalents | $ | 2,303,725 |
| | $ | 1,740,345 |
|
| Restricted cash | 100,088 |
| | 100,000 |
|
| Cash and cash equivalents and restricted cash as shown in the consolidated statements of cash flows | $ | 2,403,813 |
| | $ | 1,840,345 |
|
The Company placed all the restricted cash in a money market account, to serve as collateral for payment of a credit card.
Inventory
Inventories of products consist of feedstocks, refined petroleum products and recovered ferrous and non-ferrous metals and are reported at the lower of cost or market.net realizable value. Cost is determined using the first-in, first-out (“FIFO”) method. The Company reviews its inventory commodities for impairment whenever events or circumstances indicate that the value may not be recoverable.
Impairment of long-lived assets
The Company evaluates the carrying value and recoverability of its long-lived assets when circumstances warrant such evaluation by applying the provisions of the Financial Accounting Standards Board (“FASB”) Accounting Standards Codification ("FASB ASC") regarding long-lived assets. It requires that long-lived assets be reviewed for impairment whenever events or changes in circumstances indicate that the carrying amount of an asset may not be recoverable through the estimated undiscounted cash flows expected to result from the use and eventual disposition of the assets. Whenever any such impairment exists, an impairment loss will be recognized for the amount by which the carrying value exceeds the fair value. The Company determined that no0 long-lived asset impairment existed atduring the nine months ended September 30, 2019.2020.
Use of Estimates
Fair valueThe preparation of financial instruments
Under the FASB ASC, we are permittedstatements in conformity with U.S. GAAP requires management to elect to measure financial instrumentsmake estimates and certain other items at fair value, with the change in fair value recorded in earnings. We elected not to measure any eligible items using the fair value option. Consistent with the Fair Value Measurement Topicassumptions that affect reported amounts of the FASB ASC, we implemented guidelines relating to the disclosure of our methodology for periodic measurement of our assets and liabilities, recorded at fair market value.
Fair value is defined as the price that would be received to sell an asset or paid to transfer a liability in an orderly transaction between market participants at the measurement date. A three-tier fair value hierarchy prioritizes the inputs used in measuring fair value. The hierarchy gives the highest priority to unadjusted quoted prices in active markets for identical assets or liabilities (level 1 measurements) and the lowest priority to unobservable inputs (level 3 measurements). These tiers include:
Level 1, defined as observable inputs such as quoted prices for identical instruments in active markets;
Level 2, defined as inputs other than quoted prices in active markets that are either directly or indirectly observable such as quoted prices for similar instruments in active markets or quoted prices for identical or similar instruments in markets that are not active; and
Level 3, defined as unobservable inputs in which little or no market data exists, therefore requiring an entity to develop its own assumptions, such as valuations derived from valuation techniques in which one or more significant inputs or significant value drivers are unobservable.
Our Level 1 assets primarily include our cash and cash equivalents. Valuations are obtained from readily available pricing sources for market transactions involving identical assets or liabilities. The carrying amountsdisclosure of accounts receivable, accounts payable and accrued liabilities approximate their fair values due to the immediate or short-term maturities of these financial instruments.
Our Level 2 liabilities include our marked to market changes in the estimated value of our open derivative contracts held at the balance sheet date.
Our Level 3 liabilities include our marked to market changes in the estimated value of our derivative warrants issued in connection with our Series B Preferred Stock and Series B1 Preferred Stock.
The Company estimates the fair values of the crude oil swaps and collars based on published forward commodity price curves for the underlying commodity as of the date of the estimate for which published forward pricing is readily available. The determination of the fair values above incorporates various factors including the impact of the Company's non-performance risk and the credit standing of the counterparty involved in the Company's derivative contracts. In addition, the Company routinely monitors the creditworthiness of its counterparty.
Nonfinancial assets and liabilities measured at fair value on a nonrecurring basis include certain nonfinancial assets and liabilities as may be acquired in a business combination and thereby measured at fair value.
Income Taxes
The Company accounts for income taxes in accordance with the FASB ASC Topic 740. The Company records a valuation allowance against net deferred tax assets if, based upon the available evidence, it is more likely than not that some or all of the deferred tax assets will not be realized. The ultimate realization of deferred tax assets is dependent upon the generation of future taxable income and when temporary differences become deductible. The Company considers, among other available information, uncertainties surrounding the recoverability of deferred tax assets, scheduled reversals of deferred tax liabilities, projected future taxable income, and other matters in making this assessment.
As part of the process of preparing its consolidated financial statements, the Company is required to estimate its income taxes in each of the jurisdictions in which it operates. This process requires the Company to estimate its actual current tax liability and to assess temporary differences resulting from differing book versus tax treatment of items, such as deferred revenue, compensation and benefits expense and depreciation. These temporary differences result in deferred tax assets and liabilities, which are included within the Company’s unaudited consolidated balance sheets, net of valuation allowance. Significant management judgment is required in determining the Company’s provision for income taxes, its deferred taxcontingent assets and liabilities, and any valuation allowance recorded against its net deferred tax assets. If actualreported amounts of revenue and expenses. Actual results could differ from these estimatesestimates. Any effects on the business, financial position or the Company adjustsresults of operations from revisions to these estimates in future periods, the Company may need to adjust its valuation allowance, which could materially impact the Company’s consolidated financial position and results of operations.
Tax contingencies can involve complex issues and may require an extended period of time to resolve. Changesare recorded in the level of annual pre-tax income can affectperiod in which the Company’s overall effective tax rate. Furthermore, the Company’s interpretation of complex tax laws may impact its recognition and measurement of current and deferred income taxes.
Derivative Transactions
All derivative instruments are recorded on the accompanying balance sheets at fair value. These derivative transactions are not designated as cash flow hedges under FASB ASC 815, Derivatives and Hedges. Accordingly, these derivative contracts are marked-to-market and any changes in the estimated value of derivative contracts held at the balance sheet date are recognized in the accompanying statements of operations as net gain or loss on derivative contracts. The derivative assets or liabilities are classified as either current or noncurrent assets or liabilities based on their anticipated settlement date. The Company nets derivative assets and liabilities for counterparties where it has a legal right of offset.
In accordance with ASC 815-40-25 and ASC 815-10-15, Derivatives and Hedging and ASC 480-10-25, Liabilities-Distinguishing from Equity, convertible preferred shares are accounted for net, outside of shareholders' equity and warrants are accounted for as liabilities at their fair value during periods where they can be net cash settled in case of a change in control transaction. The warrants are accounted for as a liability at their fair value at each reporting period. The value of the derivative warrant liability will be re-measured at each reporting period with changes in fair value recorded in earnings. To derive an estimate of the fair value of these warrants, a Dynamic Black Scholes model is utilized which computes the impact of a possible change in control transaction upon the exercise of the warrant shares. This process relies upon inputs such as shares outstanding, our quoted stock prices, strike price, risk-free interest rate and volatility assumptions to dynamically adjust the payoff of the warrants in the presence of the dilution effect.
Debt Issuance Costs
The Company follows the accounting guidance of ASC 835-30, Interest-Imputation of Interest, which requiresfacts that debt issuance costs related to a recognized debt liability be reported on the consolidated balance sheet as a direct reduction from the carrying amount of that debt liability.
Revenue Recognition
We account for a contract when it has approval and commitment from both parties, the rights of the parties are identified, payment terms are identified, the contract has commercial substance and collectability of consideration is probable. Revenue is recognized when our performance obligations under the terms of a contract with our customers are satisfied. Recognition occurs when the Company transfers control by completing the specified services at the point in time the customer benefits from the services performed or once our products are delivered. Revenue is measured as the amount of consideration we expect to receive in exchange for completing our performance obligations. Sales tax and other taxes we collect with revenue-producing activities are excluded from revenue. In the case of contracts with multiple performance obligations, the Company allocates the transaction price to each performance obligation based on the relative stand-alone selling prices of the various goods and/or services encompassed by the contract. We do not have any material significant payment terms, as payment is generally due within 30 days after the performance obligation has been satisfactorily completed. The Company has elected the practical expedient to recognize the incremental costs of obtaining a contract as an expense when incurred if the amortization period of the asset that we otherwise would have recognized is one year or less. In applying the guidance in Topic 606, there were no judgments or estimates made that the Company deems significant.
The nature of the Company's contracts give rise to certain types of variable consideration. The Company estimates the amount of variable consideration to include in the estimated transaction price based on historical experience, anticipated performance and its best judgment at the time and to the extent it is probable that a significant reversal of cumulative revenue recognized will not occur when the uncertainty associated with the variable consideration is resolved.
From time to time, our fuel oil customers in our black oil segment may request that we store product which they purchase from us in our facilities. We recognize revenues for these “bill and hold” sales once the following criteria have been met: (1) there is a substantive reason for the arrangement, (2) the product is segregated and identified as the customer's asset, (3) the product is ready for delivery to the customer, and (4) we cannot use the product or direct it to another customer.
revision become known.
Reclassification of Prior Year Presentation
Certain prior period amounts have been reclassified to conform to current period presentation. These reclassifications had no effect on the reported results of operations.
Contingent Consideration
During the nine months ended September 30, 2019, the Company wrote off the remaining portion of the contingent consideration related to the July 2017 Ygriega Environmental Services, LLC ("Ygriega") acquisition earn-out due to the fact that collected oil gallons targets required for the payout of such earn-out, were not met.
Other Income
During the quarter ended September 30, 2019, the Company received a payment of $907,500 related to the proceeds of an insurance settlement for a fire that had occurred at the used oil re-refining plant located in Churchill County, Nevada, which we previously rented. The insurance settlement satisfies a previous loan we made to Omega Refining, LLC to fund operating expenses at that facility. The Company previously determined this loan was uncollectible and wrote it off.
Redeemable Noncontrolling InterestInterests
As more fully described in "Note 14. Myrtle Grove Share Purchase and Subscription AgreementAgreements", the Company is party to a put/call option agreementagreements with the holder of MG SPV’s and Heartland SPV's non-controlling interest.interests. The put option permits theoptions permit MG SPV's and Heartland SPV's non-controlling interest holder,holders, at any time on or after the earlier of (a) the fifth anniversary of the Closing Dateapplicable closing date of such issuances and (ii) the occurrence of certain triggering events (a(an “MG Redemption”) and "Heartland
Redemption", as applicable) to require MG SPV and Heartland SPV to redeem the non-controlling interest from the holder of such interest. Per the agreement,agreements, the cash purchase price for such redeemed Class B Units (MG SPV) and Class A Units (Heartland SPV) is the greater of (y) the fair market value of such units (without discount for illiquidity, minority status or otherwise) as determined by a qualified third party agreed to in writing by a majority of the holders seeking an MG SPV Redemption and Heartland SPV Redemption and Vertex Operating, LLC, our wholly-owned subsidiary (“Vertex Operating”) (provided that Vertex Operating still owns Class A Units (as to MG SPV) or Class B Units (as to Heartland SPV) on such date)date, as applicable) and (z) the original per-unit price for such Class B Units/Class A Units plus any unpaid Class A/Class B preference. The preference is defined as the greater of (A) the aggregate unpaid “Class B/Class A Yield” (equal to an annual return of 22.5% per annum) and (B) an amount equal to fifty percent (50%) of the aggregate capital invested by the Class BB/Class A Unit holders through such MG Redemption date.holders. The agreementagreements also permitspermit the Company to acquire the non-controlling interest from the holderholders thereof upon certain events. Applicable accounting guidance requires an equity instrument that is redeemable for cash or other assets to be classified outside of permanent equity if it is redeemable (a) at a fixed or determinable price on a fixed or determinable date, (b) at the option of the holder, or (c) upon the occurrence of an event that is not solely within the control of the issuer. Based on this guidance, the Company has classified the MG SPV and Heartland SPV non-controlling interestinterests between the liabilities and equity sections of the accompanying September 30, 20192020 and December 31, 20182019 consolidated balance sheets.sheets (provided that the Heartland SPV interest was not outstanding until January 2020). If an equity instrument subject to the guidance is currently redeemable, the instrument is adjusted to its maximum redemption amount at the balance sheet date. If the equity instrument subject to the guidance is not currently redeemable but it is probable that the equity instrument will become redeemable (for example, when the redemption depends solely on the passage of time), the guidance permits either of the following measurement methods: (a) accrete changes in the redemption value over the period from the date of issuance (or from the date that it becomes probable that the instrument will become redeemable, if later) to the earliest redemption date of the instrument using an appropriate methodology, or (b) recognize changes in the redemption value immediately as they occur and adjust the carrying amount of the instrument to equal the redemption value at the end of each reporting period. The amount presented in temporary equity should be no less than the initial amount reported in temporary equity for the instrument. Because the MG SPV and Heartland SPV equity instrumentinstruments will become redeemable solely based on the passage of time, the Company determined that it is probable that the MG SPV and Heartland SPV equity instrumentinstruments will become redeemable. The Company has elected to apply the second of the two measurement options described above. An adjustment to the carrying amount of a non-controlling interest from the application of the above guidance does not impact net income in the consolidated financial statements. Rather, such adjustments are treated as equity transactions.
Recently Adopted Accounting PronouncementsVariable Interest Entities
In February 2016,
The Company accounts for the FASB issued Accounting Standards Update No. 2016-02 (ASU 2016-02)investments it makes in certain legal entities in which equity investors do not have (1) sufficient equity at risk for the legal entity to finance its activities without additional subordinated financial support, (2) as a group (the holders of the equity investment at risk), Leases (Topic 842). ASU 2016-02 requires companieseither the power, through voting or similar rights, to recognize lease assetsdirect the activities of the legal entity that most significantly impacts the entity’s economic performance, or (3) the obligation to absorb the expected losses of the legal entity or the right to receive expected residual returns of the legal entity. These certain legal entities are referred to as “variable interest entities” or “VIEs.”
The Company consolidates the results of any such entity in which it determines that it has a controlling financial interest. The Company has a “controlling financial interest” in such an entity if the Company has both the power to direct the activities that most significantly affect the VIE’s economic performance and
lease liabilities on the
balance sheet and disclose key information about leasing arrangements. We adopted ASU 2016-02, Leases (Topic 842) effective January 1, 2019 and will not recast comparative periods in transitionobligation to absorb the losses of, or right to receive benefits from, the VIE that could be potentially significant to the new standard. In addition, we electedVIE. On a quarterly basis, the Company reassesses whether it has a controlling financial interest in any investments it has in these certain practical expedients which permit us to not reassess whether existing contracts are or contain leases, to not reassess the lease classification of any existing leases, to not reassess initial direct costs for any existing leases, and to not separate lease and nonlease components for all classes of underlying assets. We also made an accounting policy election to keep leases with an initial term of 12 months or less off of the balance sheet for all classes of underlying assets. Adoption of the new standard resulted in an increase in the Company’s assets and liabilities of approximately $37.8 million. The ASU did not have an impact on our consolidated results of operations or cash flows. Additional information and disclosures required by this new standard are contained in "Note 13. Leases".legal entities.
NOTE 3. CONCENTRATIONS, SIGNIFICANT CUSTOMERS, COMMITMENTS AND CONTINGENCIES
At September 30, 20192020 and 20182019 and for each of the nine months then ended, the Company’s revenues and receivables were comprised of the following customer concentrations:
| | | | | | | | | | | | | | | | | | | | | | | |
| | Nine Months Ended September 30, 2020 | | Nine Months Ended
September 30, 2019 |
| % of
Revenues | | % of
Receivables | | % of
Revenues | | % of
Receivables |
| Customer 1 | 35% | | 11% | | 35% | | 25% |
| Customer 2 | 11% | | 13% | | 8% | | 15% |
| Customer 3 | 3% | | 11% | | 0% | | 0% |
| Customer 4 | 0% | | 0% | | 12% | | 0% |
| | | | | | | |
| | | | | | | |
| | | | | | | |
| | | | | | | |
| | | | | | | |
| | | | | | | |
| | | | | | | |
| | | | | | | |
|
| | | | | | | |
| | Nine Months Ended September 30, 2019 | | Nine Months Ended
September 30, 2018 |
| | % of Revenues | | % of Receivables | | % of Revenues | | % of Receivables |
| Customer 1 | 35% | | 25% | | 37% | | 37% |
| Customer 2 | 12% | | —% | | 8% | | —% |
| Customer 3 | 8% | | 15% | | —% | | —% |
At September 30, 2019 and 2018 and forFor each of the nine months then ended September 30, 2020 and 2019, the Company's segment revenues were comprised of the following customer concentrations:
| | | | | | | | | | | | | | | | | | | | | | | | | | | | | | | | | | | |
| % of Revenue by Segment | | % Revenue by Segment |
| Nine Months Ended September 30, 2020 | | Nine Months Ended September 30, 2019 |
| Black Oil | | Refining | | Recovery | | Black Oil | | Refining | | Recovery |
| Customer 1 | 54% | | 0% | | 0% | | 41% | | 0% | | 0% |
| Customer 2 | 17% | | 0% | | 0% | | 10% | | 0% | | 0% |
| Customer 3 | 0% | | 0% | | 25% | | 0% | | 0% | | 0% |
| Customer 4 | 0% | | 0% | | 0% | | 14% | | 0% | | 0% |
| | | | | | | | | | | |
| | | | | | | | | | | |
| | | | | | | | | | | |
| | | | | | | | | | | |
| | | | | | | | | | | |
| | | | | | | | | | | |
| | | | | | | | | | | |
| | | | | | | | | | | |
|
| | | | | | | | | | | |
| | % of Revenue by Segment | | % Revenue by Segment |
| | Nine Months Ended September 30, 2019 | | Nine Months Ended September 30, 2018 |
| | Black Oil | | Refining | | Recovery | | Black Oil | | Refining | | Recovery |
| Customer 1 | 41% | | —% | | —% | | 47% | | —% | | —% |
| Customer 2 | 14% | | —% | | —% | | 10% | | —% | | —% |
| Customer 3 | 10% | | —% | | —% | | —% | | —% | | —% |
The Company had one and no vendors that represented 10% of total purchases or payables for the three and nine months ended September 30, 2020 and 2019, respectively. The vendor represents 19% of total purchases for the nine months ended September 30, 2020 and 2018.17% of accounts payable at September 30, 2020.
The Company’s revenue, profitability and future rate of growth are substantially dependent on prevailing prices for petroleum-based products. Historically, the energy markets have been very volatile, and there can be no assurance that these prices will not be subject to wide fluctuations in the future. A substantial or extended decline in such prices could have a material adverse effect on the Company’s financial position, results of operations, cash flows, access to capital, and the quantities of petroleum-based products that the Company can economically produce.
Litigation:Litigation
The Company, in its normal course of business, is involved in various claims and legal action. In the opinion of management, the outcome of these claims and actions will not have a material adverse impact upon the financial position of the Company. We are currently party to the following material litigation proceedings:
Vertex Refining LA, LLC ("Vertex Refining LA"), the wholly-owned subsidiary of Vertex Operating was named as a defendant, along with numerous other parties, in five5 lawsuits filed on or about February 12, 2016, in the Second Parish Court for the Parish of Jefferson, State of Louisiana, Case No. 121749, by Russell Doucet et. al., Case No. 121750, by Kendra Cannon et. al., Case No. 121751, by Lashawn Jones et. al., Case No. 121752, by Joan Strauss et. al. and Case No. 121753, by Donna Allen et. al. The suits relate to alleged noxious and harmful emissions from our facility located in Marrero, Louisiana. The suits seek damages for physical and emotional injuries, pain and suffering, medical expenses and deprivation of the use and enjoyment of plaintiffs’ homes. We intend to vigorously defend ourselves and oppose the relief sought in the complaints, provided that at this stage of the litigation, the Company has no basis for determining whether there is any likelihood of material loss associated with the claims and/or the potential and/or the outcome of the litigation.
From time to time, the Company consults with a related party law firm. During the nine months ended September 30, 2020 and 2019, we paid $56,971 and $62,239, respectively, to such law firm for services rendered.
NOTE 4. REVENUES
Disaggregation of Revenue
The following table presentstables present our revenues disaggregated by geographical market and revenue source:
| | | | | | | | | | | | | | | | | | | | | | | |
| Three Months Ended September 30, 2020 |
| Black Oil | | Refining & Marketing | | Recovery | | Total |
| Primary Geographical Markets | | | | | | | |
| Northern United States | $ | 7,484,798 | | | $ | 0 | | | $ | 0 | | | $ | 7,484,798 | |
| Southern United States | 12,503,324 | | | 13,501,749 | | | 3,893,761 | | | 29,898,834 | |
| $ | 19,988,122 | | | $ | 13,501,749 | | | $ | 3,893,761 | | | $ | 37,383,632 | |
| Sources of Revenue | | | | | | | |
| Base oil | $ | 5,632,592 | | | $ | 0 | | | $ | 733,180 | | | $ | 6,365,772 | |
| Pygas | 0 | | | 1,184,433 | | | 0 | | | 1,184,433 | |
| Industrial fuel | 21,190 | | | 82,644 | | | 0 | | | 103,834 | |
| Distillates | 0 | | | 12,234,672 | | | 0 | | | 12,234,672 | |
| Oil collection services | 2,449,454 | | | 0 | | | 0 | | | 2,449,454 | |
| Metals | 0 | | | 0 | | | 3,160,581 | | | 3,160,581 | |
| Other re-refinery products | 834,438 | | | 0 | | | 0 | | | 834,438 | |
| VGO/Marine fuel sales | 11,050,448 | | | 0 | | | 0 | | | 11,050,448 | |
| Total revenues | $ | 19,988,122 | | | $ | 13,501,749 | | | $ | 3,893,761 | | | $ | 37,383,632 | |
| | | | | | | | | | | | | | | | | | | | | | | |
| Nine Months Ended September 30, 2020 |
| Black Oil | | Refining & Marketing | | Recovery | | Total |
| Primary Geographical Markets | | | | | | | |
| Northern United States | $ | 23,210,428 | | | $ | 0 | | | $ | 0 | | | $ | 23,210,428 | |
| Southern United States | 37,852,200 | | | 22,309,670 | | | 11,588,890 | | | 71,750,760 | |
| $ | 61,062,628 | | | $ | 22,309,670 | | | $ | 11,588,890 | | | $ | 94,961,188 | |
| Sources of Revenue | | | | | | | |
| Base oil | $ | 17,914,941 | | | $ | 0 | | | $ | 2,091,430 | | | $ | 20,006,371 | |
| Pygas | 0 | | | 4,815,040 | | | 0 | | | 4,815,040 | |
| Industrial fuel | 1,262,266 | | | 135,396 | | | 0 | | | 1,397,662 | |
| Distillates | 0 | | | 17,359,234 | | | 0 | | | 17,359,234 | |
| Oil collection services | 5,707,017 | | | 0 | | | 0 | | | 5,707,017 | |
| Metals | 0 | | | 0 | | | 9,549,144 | | | 9,549,144 | |
| Other re-refinery products | 4,341,027 | | | 0 | | | (51,684) | | | 4,289,343 | |
| VGO/Marine fuel sales | 31,837,377 | | | 0 | | | 0 | | | 31,837,377 | |
| Total revenues | $ | 61,062,628 | | | $ | 22,309,670 | | | $ | 11,588,890 | | | $ | 94,961,188 | |
| | | | Three Months Ended September 30, 2019 | | Three Months Ended September 30, 2019 |
| | Black Oil | | Refining & Marketing | | Recovery | | Total | | Black Oil | | Refining & Marketing | | Recovery | | Total |
| Primary Geographical Markets | | | | | | | | Primary Geographical Markets | | | | | | | |
| Northern United States | $ | 12,325,941 |
| | $ | — |
| | $ | — |
| | $ | 12,325,941 |
| Northern United States | $ | 12,325,941 | | | $ | 0 | | | $ | 0 | | | $ | 12,325,941 | |
| Southern United States | 20,004,590 |
| | 3,076,454 |
| | 2,392,274 |
| | 25,473,318 |
| Southern United States | 20,004,590 | | | 3,076,454 | | | 2,392,274 | | | 25,473,318 | |
| | $ | 32,330,531 |
| | $ | 3,076,454 |
| | $ | 2,392,274 |
| | $ | 37,799,259 |
| | $ | 32,330,531 | | | $ | 3,076,454 | | | $ | 2,392,274 | | | $ | 37,799,259 | |
| Sources of Revenue | | | | | | | | Sources of Revenue | | | | | | | |
| Petroleum products | $ | 32,330,531 |
| | $ | 3,076,454 |
| | $ | 668,249 |
| | $ | 36,075,234 |
| |
| Base oil | | Base oil | $ | 9,135,650 | | | $ | 0 | | | $ | 640,642 | | | $ | 9,776,292 | |
| Pygas | | Pygas | 0 | | | 2,741,557 | | | 0 | | | 2,741,557 | |
| Industrial fuel | | Industrial fuel | 891,676 | | | 334,897 | | | 0 | | | 1,226,573 | |
| Distillates | | Distillates | 0 | | | 0 | | | 0 | | | 0 | |
| Oil collection services | | Oil collection services | 1,953,924 | | | 0 | | | 0 | | | 1,953,924 | |
| Metals | — |
| | — |
| | 1,724,025 |
| | 1,724,025 |
| Metals | 0 | | | 0 | | | 1,724,025 | | | 1,724,025 | |
| Other re-refinery products | | Other re-refinery products | 3,057,171 | | | 0 | | | 27,607 | | | 3,084,778 | |
| VGO/Marine fuel sales | | VGO/Marine fuel sales | 17,292,110 | | | 0 | | | 0 | | | 17,292,110 | |
| Total revenues | $ | 32,330,531 |
| | $ | 3,076,454 |
| | $ | 2,392,274 |
| | $ | 37,799,259 |
| Total revenues | $ | 32,330,531 | | | $ | 3,076,454 | | | $ | 2,392,274 | | | $ | 37,799,259 | |
| | | | | | | | | | | | | | | | | | | | | | | |
| Nine Months Ended September 30, 2019 |
| Black Oil | | Refining & Marketing | | Recovery | | Total |
| Primary Geographical Markets | | | | | | | |
| Northern United States | $ | 31,530,289 | | | $ | 0 | | | $ | 0 | | | $ | 31,530,289 | |
| Southern United States | 71,523,240 | | | 9,212,477 | | | 8,511,257 | | | 89,246,974 | |
| $ | 103,053,529 | | | $ | 9,212,477 | | | $ | 8,511,257 | | | $ | 120,777,263 | |
| Sources of Revenue | | | | | | | |
| Base oil | $ | 23,918,490 | | | $ | 0 | | | $ | 2,439,071 | | | $ | 26,357,561 | |
| Pygas | 0 | | | 7,656,125 | | | 0 | | | 7,656,125 | |
| Industrial fuel | 5,714,478 | | | 1,501,655 | | | 0 | | | 7,216,133 | |
| Distillates | 0 | | | 54,697 | | | 0 | | | 54,697 | |
| Oil collection services | 4,261,391 | | | 0 | | | 0 | | | 4,261,391 | |
| Metals | 0 | | | 0 | | | 5,988,895 | | | 5,988,895 | |
| Other re-refinery products | 10,399,007 | | | 0 | | | 83,291 | | | 10,482,298 | |
| VGO/Marine fuel sales | 58,760,163 | | | 0 | | | 0 | | | 58,760,163 | |
| Total revenues | $ | 103,053,529 | | | $ | 9,212,477 | | | $ | 8,511,257 | | | $ | 120,777,263 | |
|
| | | | | | | | | | | | | | | |
| | Nine Months Ended September 30, 2019 |
| | Black Oil | | Refining & Marketing | | Recovery | | Total |
| Primary Geographical Markets | | | | | | | |
| Northern United States | $ | 31,530,289 |
| | $ | — |
| | $ | — |
| | $ | 31,530,289 |
|
| Southern United States | 71,523,240 |
| | 9,212,477 |
| | 8,511,257 |
| | 89,246,974 |
|
| | $ | 103,053,529 |
| | $ | 9,212,477 |
| | $ | 8,511,257 |
| | $ | 120,777,263 |
|
| Sources of Revenue | | | | | | | |
| Petroleum products | $ | 103,053,529 |
| | $ | 9,212,477 |
| | $ | 2,522,362 |
| | $ | 114,788,368 |
|
| Metals | — |
| | — |
| | 5,988,895 |
| | 5,988,895 |
|
| Total revenues | $ | 103,053,529 |
| | $ | 9,212,477 |
| | $ | 8,511,257 |
| | $ | 120,777,263 |
|
|
| | | | | | | | | | | | | | | |
| | Three Months Ended September 30, 2018 |
| | Black Oil | | Refining & Marketing | | Recovery | | Total |
| Primary Geographical Markets | | | | | | | |
| Northern United States | $ | 12,361,348 |
| | $ | — |
| | $ | — |
| | $ | 12,361,348 |
|
| Southern United States | 28,038,716 |
| | 7,313,630 |
| | 2,919,254 |
| | 38,271,600 |
|
| | $ | 40,400,064 |
| | $ | 7,313,630 |
| | $ | 2,919,254 |
| | $ | 50,632,948 |
|
| Sources of Revenue | | | | | | | |
| Petroleum products | $ | 40,400,064 |
| | $ | 7,313,630 |
| | $ | 547,184 |
| | $ | 48,260,878 |
|
| Metals | — |
| | — |
| | 2,372,070 |
| | 2,372,070 |
|
| Total revenues | $ | 40,400,064 |
| | $ | 7,313,630 |
| | $ | 2,919,254 |
| | $ | 50,632,948 |
|
|
| | | | | | | | | | | | | | | |
| | Nine Months Ended September 30, 2018 |
| | Black Oil | | Refining & Marketing | | Recovery | | Total |
| Primary Geographical Markets | | | | | | | |
| Northern United States | $ | 31,314,405 |
| | $ | — |
| | $ | — |
| | $ | 31,314,405 |
|
| Southern United States | 79,792,036 |
| | 17,381,741 |
| | 10,430,731 |
| | 107,604,508 |
|
| | $ | 111,106,441 |
| | $ | 17,381,741 |
| | $ | 10,430,731 |
| | $ | 138,918,913 |
|
| Sources of Revenue | | | | | | | |
| Petroleum products | $ | 111,106,441 |
| | $ | 17,381,741 |
| | $ | 1,607,596 |
| | $ | 130,095,778 |
|
| Metals | — |
| | — |
| | 8,823,135 |
| | 8,823,135 |
|
| Total revenues | $ | 111,106,441 |
| | $ | 17,381,741 |
| | $ | 10,430,731 |
| | $ | 138,918,913 |
|
Petroleum products- We derive a majority of our revenues from the sale of recovered/re-refined petroleum products, which include Base Oil, VGO (Vacuum Gas Oil), Pygas, Gasoline, Cutterstock and Fuel Oils.
Metals- Consist of recoverable ferrous and non-ferrous recyclable metals from manufacturing and consumption. Scrap metal can be recovered from pipes, barges, boats, building supplies, surplus equipment, tanks, and other items consisting of metal composition. These materials are segregated, processed, cut-up and sent back to a steel mill for re-purposing.
NOTE 5. ACCOUNTS RECEIVABLE
Accounts receivable, net, consists of the following at September 30, 20192020 and December 31, 2018:2019:
| | | | | | | | | | | |
| September 30, 2020 Unaudited | | December 31, 2019 |
| Accounts receivable trade | $ | 9,441,141 | | | $ | 12,540,553 | |
| Allowance for doubtful accounts | (350,214) | | | (402,475) | |
| Accounts receivable trade, net | $ | 9,090,927 | | | $ | 12,138,078 | |
|
| | | | | | | |
| | September 30, 2019 | | December 31, 2018 |
| Accounts receivable trade | $ | 10,817,099 |
| | $ | 9,859,758 |
|
| Allowance for doubtful accounts | (411,388 | ) | | (831,768 | ) |
| Accounts receivable trade, net | $ | 10,405,711 |
| | $ | 9,027,990 |
|
Accounts receivable trade represents amounts due from customers. Accounts receivable trade are recorded at invoiced amounts, net of reserves and allowances and do not bear interest. The Company uses its best estimate to determine the required allowance for doubtful accounts based on a variety of factors, including the length of time receivables are past due, economic trends and conditions affecting its customer base, significant one-time events and historical write-off experience. Specific provisions are recorded for individual receivables when we become aware of a customer’s inability to meet its financial obligations. The Company reviews the adequacy of its reserves and allowances quarterly.
Receivable balances greater than 90 days past due are individually reviewed for collectability and if deemed uncollectible, are charged off against the allowance accounts after all means of collection have been exhausted and the potential for recovery is considered remote. The Company does not have any significant off balance sheet credit exposure related to its customers.
NOTE 6. LINE OF CREDIT AND LONG-TERM DEBT
Credit and Guaranty Agreement and Revolving Credit Facility with
On April 24, 2020, (a) Encina Business Credit, LLC
Effective February 1, 2017, we, Vertex Operating, LLC, our wholly-owned subsidiary ("Vertex Operating"), and substantially all of our other operating subsidiaries, other than E-Source Holdings, LLC ("E-Source", provided that E-Source is no longer in operations and we no longer undertake dismantling, demolition, decommission and marine salvage services which were the operations of E-Source), entered into a Credit Agreement (the “EBC Credit Agreement”) with Encina Business Credit, LLC as agent (the “Agent” or “EBC” (“EBC”) and Encina Business Credit SPV, LLC and CrowdOut Capital LLC asthe lenders thereunder (the “EBC Lenders”). Pursuant to the EBC Credit Agreement, and the terms thereof, the EBC Lenders agreed to loan us up to $20 million, provided that the amount outstanding under the EBC Credit Agreement at any time cannot exceed 50% of the value of the operating plant facilities and related machinery and equipment owned by us.
Amounts borrowed under the EBC Credit Agreement bear interest at 12%, 13% or 14% per annum, based on the ratio of (a) (i) consolidated EBITDA for such applicable period minus (ii) capital expenditures made during such period, minus (iii) the aggregate amount of income taxes paid in cash during such period (but not less than zero) to (b) the sum of (i) debt service charges plus (ii) the aggregate amount of all dividend or other distributions paid on capital stock in cash for the most recently completed 12 month period (which ratio falls into one of the three following tiers: less than 1 to 1; from 1 to 1 to less than 1.45 to 1; or equal to or greater than 1.45 to 1, which together with the value below, determines which interest rate is applicable) and average availability under theour Revolving Credit Agreement (defined below) (which falls into two tiers: less than $2.5 million and greater than or equal to $2.5 million, which together with the calculation above, determines which interest rate is applicable), as described in greater detail in the EBC Credit Agreement (increasing by 2% per annum upon the occurrence of an event of default). Interest on amounts borrowed under the EBC Credit Agreement is payable by us in arrears, on the first business day of each month, beginning on the first business day of the first full month following the closing, together with required $75,000 monthly principal repayments. We also have the right to make voluntary repayments of the amount owed under the EBC Credit Agreement in amounts equal to or greater than $100,000, from time to time. The interest rate is 14% at September 30, 2019.
The amounts borrowed under the EBC Credit Agreement are guaranteed by us and our subsidiaries, other than E-Source, pursuant to a Guaranty and Security Agreement (the “Guaranty and Security Agreement”“EBC Lenders”), whereby we also pledged substantially all of our assets and all of the securities of our subsidiaries (other than E-Source) as collateral securing the amount due under the terms of the EBC Credit Agreement. We also provided EBC mortgages on our Marrero, Louisiana, and Columbus, Ohio facilities to secure the repayment of outstanding amounts and agreed to provide mortgages on certain other real property to be delivered post-closing. The post-closing mortgage properties provided were in Baytown, Pflugerville and Corpus Christi, Texas.
The EBC Credit Agreement contains customary representations, warranties and requirements for the Company to indemnify the EBC Lenders and their affiliates. The EBC Credit Agreement also includes various covenants (positive and negative) binding upon the Company, including, prohibiting us from undertaking acquisitions or dispositions unless they meet the criteria set forth in the EBC Credit Agreement, not incurring any capital expenditures in an amount exceeding $3.0 million in any fiscal year that the EBC Credit Agreement is in place, and requiring us to maintain at least $2.0 million of borrowing availability under the Revolving Credit Agreement (defined below) in any 30 day period.
The EBC Credit Agreement includes customary events of default for facilities of a similar nature and size as the EBC Credit Agreement, including if an event of default occurs under any agreement evidencing $500,000 or more of indebtedness of the Company; we fail to make any payment when due under any material agreement; subject to certain exceptions, any judgment is entered against the Company in an amount exceeding $500,000; and also provides that an event of default occurs if a change in control of the Company occurs, which includes if (a) Benjamin P. Cowart, the Company’s Chief Executive Officer, Chairman of the Board and largest shareholder and Chris Carlson, the Chief Financial Officer of the Company, cease to own and control legally and beneficially, collectively, either directly or indirectly, equity securities in Vertex Energy, Inc., representing more than 15% of the combined voting power of all securities entitled to vote for members of the board of directors or equivalent on a fully-diluted basis, (b) the acquisition of ownership, directly or indirectly, beneficially or of record, by any person or group of securities representing more than 30% of the aggregate ordinary voting power represented by the issued and outstanding securities of Vertex Energy, Inc., or (c) during any period of 12 consecutive months, a majority of the members of the board of directors of the Company cease to be composed of individuals (i) who were members of that board or equivalent governing body on the first day of such period, (ii) whose election or nomination to that board or equivalent governing body was approved by individuals referred to in clause (i) above constituting at the time of such election or nomination at least a majority of that board or equivalent governing body or (iii) whose election or nomination to that board or other equivalent governing body was approved by individuals referred to in clauses (i) and (ii) above constituting at the time of such election or nomination at least a majority of that board or equivalent governing body (collectively “Events of Default”). An event of default under the Revolving Credit Agreement (defined below), is also an event of default under the EBC Credit Agreement.
Effective February 1, 2017, we, Vertex Operating and substantially all of our operating subsidiaries, other than E-Source, entered into a Revolving Credit Agreement (the “Revolving Credit Agreement” and together with the EBC Credit Agreement, the "Credit Agreements") with Encina Business Credit SPV, LLC as lender (“Encina”) and EBC as the administrative agent. Pursuant to the Revolving Credit Agreement, and the terms thereof, Encina agreed to loan us, on a revolving basis, up to $10 million, subject to the terms of the Revolving Credit Agreement and certain lending ratios set forth therein, which provide that the amount outstanding thereunder cannot exceed an amount equal to the total of (a) the lesser of (A) the value (as calculated in the Revolving Credit Agreement) of our inventory which are raw materials or finished goods that are merchantable and readily saleable to the public in the ordinary course of our business (“EBC Eligible Inventory”), net of certain inventory reserves, multiplied by 85% of the appraised value of EBC Eligible Inventory, or (B) the value (as calculated in the Revolving Credit Agreement) of EBC Eligible Inventory, net of certain inventory reserves, multiplied by 65%, subject to a ceiling of $4 million, plus (b) the face amount of certain accounts receivables (net of certain reserves applicable thereto) multiplied by 85% (subject to adjustment as provided in
the Revolving Credit Agreement); minus (c) the then-current amount of certain reserves that the agent may determine necessary for the Company to maintain. At September 30, 2019, the maximum amount available to be borrowed was $3,372,089, based on the above borrowing base calculation.
Amounts borrowed under the Revolving Credit Agreement bear interest, subject to the terms of the Revolving Credit Agreement, at the one month LIBOR interest rate then in effect, subject to a floor of 0.25% (which interest rate is currently approximately 2.10% per annum), plus an additional 6.50% per annum (increasing by 2% per annum upon the occurrence of an event of default), provided that under certain circumstances amounts borrowed bear interest at the higher of (a) the “prime rate”; (b) the Federal Funds Rate, plus 0.50%; and (c) the LIBOR Rate for a one month interest period, plus 1.00%. Interest on amounts borrowed under the Revolving Credit Agreement is payable by us in arrears, on the first business day of each month, beginning on the first business day of the first full month following the closing.
The amounts borrowed under the Revolving Credit Agreement are guaranteed by us and our subsidiaries, other than E-Source, pursuant to a separate Guaranty and Security Agreement, similar to the EBC Credit Agreement, described in greater detail above. We also provided Encina mortgages on our Marrero, Louisiana, and Columbus, Ohio facilities to secure the repayment of outstanding amounts.
The Revolving Credit Agreement contains customary representations, warranties and requirements for the Company to indemnify Encina and its affiliates. The Revolving Credit Agreement also includes various covenants (positive and negative) binding upon the Company, including, prohibiting us from undertaking acquisitions or dispositions unless they meet the criteria set forth in the Revolving Credit Agreement, not incurring any capital expenditures in amount exceeding $3.0 million in any fiscal year that the Revolving Credit Agreement is in place, and requiring us to maintain at least $2.0 million of borrowing availability under the Revolving Credit Agreement in any 30 day period.
The Revolving Credit Agreement includes customary events of default for facilities of a similar nature and size as the Revolving Credit Agreement, including the same Events of Default as are described above under the description of the EBC Credit Agreement.
The principal balances of the EBC Credit Agreement and the Revolving Credit Agreement as of September 30, 2019 are $13,558,000 and $5,387,639, respectively.
Credit Agreement Amendments
On July 25, 2019, (a) EBC, the EBC Lenders, and Vertex Operating, entered into a ThirdFourth Amendment and Limited Waiver to Credit Agreement, effective on July 26, 2019,April 24, 2020, pursuant to which the EBC Lenders agreed to amend the EBC Credit Agreement; and (b) the EBC Lenders and Vertex Operating entered into a ThirdFourth Amendment and Limited Waiver to ABL Credit Agreement, effective on July 26, 2019,April 24, 2020, pursuant to which the EBC Lenders agreed to amend the Revolving Credit Agreement (collectively, the “Waivers”). The Waivers amended the credit agreements to:to extend the due date of amounts owed thereunder from February 1, 20202021 to February 1, 2021;2022.
On August 7, 2020, the Company and Vertex Operating entered into a Fifth Amendment to increaseCredit Agreement with EBC (the “Fifth Amendment”), which amended the EBC Credit Agreement to provide the Company up to a $2 million term loan to be used for capital expenditures (the “CapEx Loan”), which amounts may be requested from time to time by the Company, provided that not more than four advances of such amount may be requested, with each advance being not less than $500,000 (in multiples of $100,000). The amendment also provided that any prepayments of the EBC Credit Agreement would first be applied to the term loan and then to the CapEx Loan. The CapEx Loan bears interest at the rate of LIBOR (1.55% at September 30, 2020) plus 7%, or to the extent that LIBOR is not available, the highest of the prime rate and the Federal Funds Rate plus 0.50%, in each case, plus 6%. We are required to repay the CapEx Loan in monthly installments of 1/48th of the amount borrowed, each month that the CapEx Loan is outstanding, with a final balloon payment due at maturity. The obligation of permitted indebtedness allowable thereunderEBC to fund the CapEx Loan is subject to customary conditions and requirements set forth in the Fifth Amendment, including the requirement that the Company has maintained daily availability under the ABL Credit Agreement greater than $1 million for the last thirty days, and that such availability would remain over $1 million, on a pro forma basis with such new loan. We are also required to provide the agent for the EBC Credit Agreement, a first priority security interest in the rolling stock collection assets or other assets acquired with the CapEx Loan.
Loan Agreements
On May 4, 2020, the Company applied for a loan from $500,000 to $750,000; to increaseTexas Citizens Bank in the principal amount of capital expenditures we are authorized to make in fiscal 2019 from $3.0$4.22 million, to $3.5 million, and to set the amount of capital expenditures we are authorized to make in fiscal 2020 and thereafter at $3.0 million; and to decrease the minimum amount of availability required under the credit agreements to $1.5 million at any time from July 26, 2019 to August 31, 2019, and $2.0 million at any time thereafter. The Waivers also provided for waivers by the lenders of certain restrictions in the credit agreements which would have prevented us from consummating the MG Share Purchase and Heartland Transaction (each defined below under Note 14), subject to certain conditions, including us paying at least $1.1 million to the lenders from the amount received pursuant to the MG Purchase Agreement (which amount has been paid to date)Paycheck Protection Program (the “PPP”) under the Coronavirus Aid, Relief, and Economic Security Act (the “CARES Act”), which was enacted on March 27, 2020. On May 5, 2020, the Company received the loan funds. The Note is unsecured, matures on April 28, 2022, and bears interest at least $9.0 million (unless otherwise agreed bya rate of 1.00% per annum, payable monthly commencing on February 2021, following an initial deferral period as specified under the lenders) ofPPP. Under the amount to be received by us pursuant to terms of the Heartland Option, if exercised, inPPP, the event the transactions contemplated thereby close (which has not been and which transaction has not closed, to date),entire amount may be forgiven to the lenders.extent loan proceeds are used for qualifying expenses. As of the date of this report, the Company believes it has used the PPP funds for qualifying expenses.
On May 27, 2020, the Company entered into a loan contract security agreement with John Deere to finance $152,643 to purchase equipment. The Note matures on June 27, 2024, and bears interest at a rate of 2.45% per annum, payable monthly commencing on June 27, 2020. The payment of the note is secured by the equipment purchased.
Insurance Premiums
The Company financed insurance premiums through various financial institutions bearing interest rates from 4.00% to 4.90% per annum. All such premium finance agreements have maturities of less than one year and have a balance of $2,085,927$1,893,668 at September 30, 20192020 and $999,152$1,165,172 at December 31, 2018.2019.
Finance Leases
On March 1, 2018,April 2, 2020, the Company obtained one1 finance lease with payments of $9,322 per month for three years and on July 28, 2020, the Company entered into another finance lease with payments of $3,545 per month for three years. The amount of the finance lease obligation has been reduced to $410,928 at September 30, 2020.
On May 22, 2020, the Company entered into 1 finance lease. Payments are $908$15,078 per month for three years and the amount of the finance lease obligation has been reduced to $14,898$485,745 at September 30, 2019.2020.
On May 29, 2018, the Company obtained one finance lease. Payments are $26,305 per quarter for four years and the amount of the finance lease obligation has been reduced to $286,011 at September 30, 2019.
During April and May 2019, the Company obtained five finance leases. Payments are approximately $11,710 per month for five years and the amount of the finance lease obligation has been reduced to $579,062 at September 30, 2019.
The Company's outstanding debt facilities as of September 30, 20192020 and December 31, 20182019 are summarized as follows:
| | | Creditor | Loan Type | | Origination Date | | Maturity Date | | Loan Amount | | Balance on September 30, 2019 | Balance on December 31, 2018 | Creditor | Loan Type | | Origination Date | | Maturity Date | | Loan Amount | | Balance on September 30, 2020 | Balance on December 31, 2019 |
| Encina Business Credit, LLC | Term Loan | | February 1, 2017 | | February 1, 2021 | | $ | 20,000,000 |
| | $ | 13,558,000 |
| $ | 15,350,000 |
| Encina Business Credit, LLC | Term Loan | | February 1, 2017 | | February 1, 2022 | | $ | 20,000,000 | | | $ | 5,658,000 | | $ | 13,333,000 | |
| Encina Business Credit SPV, LLC | Revolving Note | | February 1, 2017 | | February 1, 2021 | | $ | 10,000,000 |
| | 5,387,639 |
| 3,844,636 |
| Encina Business Credit SPV, LLC | Revolving Note | | February 1, 2017 | | February 1, 2022 | | $ | 10,000,000 | | | 0 | | 3,276,230 | |
| Encina Business Credit, LLC | | Encina Business Credit, LLC | Capex Loan | | August 7, 2020 | | February 1, 2022 | | $ | 2,000,000 | | | 1,250,617 | | 0 | |
| Wells Fargo Equipment Lease-Ohio | Finance Lease | | April-May, 2019 | | April-May, 2024 | | $ | 621,000 |
| | 579,062 |
| — |
| Wells Fargo Equipment Lease-Ohio | Finance Lease | | April-May, 2019 | | April-May, 2024 | | $ | 621,000 | | | 465,678 | | 551,260 | |
| AVT Equipment Lease-Ohio | | AVT Equipment Lease-Ohio | Finance Lease | | April 2, 2020 | | April 2, 2023 | | $ | 337,155 | | | 410,928 | | 0 | |
| AVT Equipment Lease-HH | | AVT Equipment Lease-HH | Finance Lease | | May 22, 2020 | | May 22, 2023 | | $ | 551,609 | | | 485,745 | | 0 | |
| John Deere Note | | John Deere Note | Note | | May 27, 2020 | | June 24, 2024 | | $ | 152,643 | | | 140,487 | | 0 | |
| Tetra Capital Lease | Finance Lease | | May, 2018 | | May, 2022 | | $ | 419,690 |
| | 286,011 |
| 349,822 |
| Tetra Capital Lease | Finance Lease | | May, 2018 | | May, 2022 | | $ | 419,690 | | | 195,761 | | 264,014 | |
| Well Fargo Equipment Lease-VRM LA | Finance Lease | | March, 2018 | | March, 2021 | | $ | 30,408 |
| | 14,898 |
| 22,390 |
| Well Fargo Equipment Lease-VRM LA | Finance Lease | | March, 2018 | | March, 2021 | | $ | 30,408 | | | 4,485 | | 12,341 | |
| Texas Citizens Bank | | Texas Citizens Bank | PPP Loan | | May 5, 2020 | | April 28, 2022 | | $ | 4,222,000 | | | 4,222,000 | | 0 | |
| Various institutions | Insurance premiums financed | | Various | | < 1 year | | $ | 2,902,428 |
| | 2,085,927 |
| 999,152 |
| Various institutions | Insurance premiums financed | | Various | | < 1 year | | $ | 2,902,428 | | | 1,893,668 | | 1,165,172 | |
| Total | | | | 21,911,537 |
| 20,566,000 |
| Total | | 14,727,369 | | 18,602,017 | |
| Deferred finance costs, net | | | | (191,303 | ) | (621,733 | ) | |
| Deferred finance costs | | Deferred finance costs | | 0 | | (47,826) | |
| Total, net of deferred finance costs | | | | $ | 21,720,234 |
| $ | 19,944,267 |
| Total, net of deferred finance costs | | $ | 14,727,369 | | $ | 18,554,191 | |
Future contractual maturities of notes payable as of September 30, 20192020 are summarized as follows:
| | | | | | | | | | | | | | | | | | | | | | | | | | | | | | | | | | | |
| Creditor | Year 1 | | Year 2 | | Year 3 | | Year 4 | | Year 5 | | Thereafter |
| Encina Business Credit, LLC | $ | 900,000 | | | $ | 4,758,000 | | | $ | 0 | | | $ | 0 | | | $ | 0 | | | $ | 0 | |
| Encina Business Credit SPV, LLC | 0 | | | 0 | | | 0 | | | 0 | | | 0 | | | 0 | |
| Encina Business Credit, LLC | 158,966 | | | 1,091,651 | | | 0 | | | 0 | | | 0 | | | 0 | |
| John Deere Note | 37,071 | | | 37,991 | | | 38,934 | | | 26,491 | | | 0 | | | 0 | |
| Well Fargo Equipment Lease- Ohio | 119,356 | | | 125,643 | | | 132,261 | | | 88,418 | | | 0 | | | 0 | |
| AVT Equipment Lease-Ohio | 124,308 | | | 135,272�� | | | 151,348 | | | 0 | | | 0 | | | 0 | |
| AVT Equipment Lease-HH | 145,296 | | | 158,111 | | | 182,338 | | | 0 | | | 0 | | | 0 | |
| Tetra Capital Lease | 96,530 | | | 99,231 | | | 0 | | | 0 | | | 0 | | | 0 | |
| Well Fargo Equipment Lease- VRM LA | 4,485 | | | 0 | | | 0 | | | 0 | | | 0 | | | 0 | |
| Texas Citizens Bank | 1,877,461 | | | 2,344,539 | | | 0 | | | 0 | | | 0 | | | 0 | |
| Various institutions | 1,893,668 | | | 0 | | | 0 | | | 0 | | | 0 | | | 0 | |
| Totals | $ | 5,357,141 | | | $ | 8,750,438 | | | $ | 504,881 | | | $ | 114,909 | | | $ | 0 | | | $ | 0 | |
| | | | | | | | | | | |
| | | | | | | | | | | |
|
| | | | | | | | | | | | | | | | | | | | | | | |
| Creditor | Year 1 | | Year 2 | | Year 3 | | Year 4 | | Year 5 | | Thereafter |
| Encina Business Credit, LLC | $ | 900,000 |
| | $ | 12,658,000 |
| | $ | — |
| | $ | — |
| | $ | — |
| | $ | — |
|
| Encina Business Credit SPV, LLC | 5,387,639 |
| | — |
| | — |
| | — |
| | — |
| | — |
|
| Well Fargo Equipment Lease- Ohio | 113,383 |
| | 122,357 |
| | 125,642 |
| | 132,259 |
| | 85,421 |
| | |
| Tetra Capital Lease | 90,249 |
| | 96,530 |
| | 99,232 |
| | — |
| | — |
| | — |
|
| Well Fargo Equipment Lease- VRM LA | 10,413 |
| | 4,485 |
| | — |
| | — |
| | — |
| | — |
|
| Various institutions | 2,085,927 |
| | — |
| | — |
| | — |
| | — |
| | — |
|
| Totals | 8,587,611 |
| | 12,881,372 |
| | 224,874 |
| | 132,259 |
| | 85,421 |
| | — |
|
| Deferred finance costs, net | (191,303 | ) | | — |
| | — |
| | — |
| | — |
| | — |
|
| Totals, net of deferred finance costs | $ | 8,396,308 |
| | $ | 12,881,372 |
| | $ | 224,874 |
| | $ | 132,259 |
| | $ | 85,421 |
| | $ | — |
|
NOTE 7. EARNINGS PER SHARE
Basic earnings per share includes no dilution and is computed by dividing income available to common shareholders by the weighted average number of common shares outstanding for the periods presented. Diluted earnings per share reflects the potential dilution of securities that could share in the earnings of an entity, such as convertible preferred stock, stock options, warrants or convertible securities. Due to their anti-dilutive effect, the calculation of diluted earnings per share for the three and nine months ended September 30, 20192020 and 20182019 excludes: 1) options to purchase 4,218,2505,104,288 and 3,438,8374,218,250 shares, respectively, of common stock, 2) warrants to purchase 8,633,193 and 8,853,056 and 7,353,056 shares, respectively, of common stock, 3) Series B Preferred Stock which is convertible intointo 4,002,619 and 3,769,505 and 3,551,549 shares, respectively, of common stock, 4) Series B1 Preferred Stock which is convertible into 7,219,164 and 10,417,966 and 11,074,331 shares, respectively, of common stock, and 5) Series A Preferred Stock which is convertible into 419,859 of common stock as of September 30, 2019 and 2018. Due to their anti-dilutive effect, the calculation of diluted earnings per share for the nine months ended September 30, 2019 and 2018 excludes: 1) options to purchase 4,218,250 and 3,438,837 shares, respectively, of common stock, 2) warrants to purchase 8,853,056 and 7,353,056 shares, respectively, of common stock, 3) Series B Preferred Stock which is convertible into 3,769,505 and 3,499,059 shares, respectively, of common stock, 4) Series B1 Preferred Stock which is convertible into 10,417,966 and 13,105,989 shares, respectively, of common stock, and 5) Series A Preferred Stock which is convertible into 419,859 shares of common stock as of September 30, 20192020 and 2018.
The following is a reconciliation of the numerator and denominator for basic and diluted earnings per share for the three and nine months ended September 30, 2019 and 2018: 2019.
|
| | | | | | | | | | | | | | | |
| | Three Months Ended September 30, | | Nine Months Ended September 30, |
| | 2019 | | 2018 | | 2019 | | 2018 |
| | | | | | | | |
| Basic Earnings per Share | | | | | | | |
| Numerator: | | | | | | | |
| Net loss available to common shareholders | $ | (3,911,581 | ) | | $ | (4,635,372 | ) | | $ | (11,215,851 | ) | | $ | (6,652,027 | ) |
| Denominator: | | | | | | | |
| Weighted-average shares outstanding | 41,376,335 |
| | 35,144,113 |
| | 40,626,700 |
| | 33,843,721 |
|
| Basic loss per share | $ | (0.09 | ) | | $ | (0.13 | ) | | $ | (0.28 | ) | | $ | (0.20 | ) |
| | | | | | | | |
| Diluted Earnings per Share | | | | | | | |
| Numerator: | | | | | | | |
| Net loss available to common shareholders | $ | (3,911,581 | ) | | $ | (4,635,372 | ) | | $ | (11,215,851 | ) |
| $ | (6,652,027 | ) |
| Denominator: | | | | | | | |
| Weighted-average shares outstanding | 41,376,335 |
| | 35,144,113 |
| | 40,626,700 |
| | 33,843,721 |
|
| Effect of dilutive securities | | | | | | | |
| Stock options and warrants | — |
| | — |
| | — |
| | — |
|
| Preferred stock | — |
| | — |
| | — |
| | — |
|
| Diluted weighted-average shares outstanding | 41,376,335 |
| | 35,144,113 |
| | 40,626,700 |
| | 33,843,721 |
|
| Diluted loss per share | $ | (0.09 | ) | | $ | (0.13 | ) | | $ | (0.28 | ) | | $ | (0.20 | ) |
NOTE 8. COMMON STOCK
The total number of authorized shares of the Company’s common stock is 750,000,000 shares, $0.001 par value per share. As of September 30, 2019,2020, there were 41,849,40645,554,841 common shares issued and outstanding.
During the nine months ended September 30, 2020, the Company issued 2,159,278 shares of common stock in connection with the conversion of Series B1 Convertible Preferred Stock into common stock of the Company, pursuant to the terms of such securities.
During the nine months ended September 30, 2019, the Company issued 1,596,160 shares of common stock in connection with the July 2019 Tensile Capital Partners Master Fund LP, an investment fund based in San Francisco, California (“Tensile”), Share Purchase and Subscription Agreement and conversions of Series B1 Convertible Preferred Stock into common stock of the Company, pursuant to the terms of such securities. In addition, during the nine months ended September 30, 2019, the Company issued 78,425 shares of common stock in connection with the exercise of options.
DuringStock Option Agreements
On June 19, 2020, the nine months ended September 30, 2018,Board of Directors approved the Company issued 6,182,473grant to 3 employees and 1 officer/director (Benjamin P. Cowart, the Company’s Chief Executive Officer) of options to purchase an aggregate of 416,885 and 269,153 shares of common stock, in connectionrespectively, at an exercise price of $0.78 and $0.86 per share, respectively, with a ten year and five year term, respectively (subject to continued employment/directorship), vesting at the conversionrate of Series B, Series B1, Series C, and Series A Convertible Preferred Stock into common stock1/4th of such options per year on the first four anniversaries of the Company, pursuantgrant, under our 2019 Stock Incentive Plan, as amended, in consideration for services rendered and to be rendered to the termsCompany. The grant date fair value is $355,404 which amount is being amortized at the rate of such securities. In addition, the Company issued 241 shares of common stock$7,404 per month starting in connection with the exercise of options.July 2020.
NOTE 9. PREFERRED STOCK AND DETACHABLE WARRANTS
The total number of authorized shares of the Company’s preferred stock is 50,000,000 shares, $0.001 par value per share. The total number of designated shares of the Company’s Series A Convertible Preferred Stock is 5,000,000 (“Series A Preferred”). The total number of designated shares of the Company’s Series B Convertible Preferred Stock is 10,000,000. The total number of designated shares of the Company’s Series B1 Convertible Preferred Stock is 17,000,000. As of September 30, 20192020 and December 31, 2018,2019, there were 419,859 shares of Series A Preferred Stock issued and outstanding. As of September 30, 20192020 and December 31, 2018,2019, there were 3,769,5054,002,619 and 3,604,8273,826,055 shares of Series B Preferred Stock issued and outstanding, respectively. As of September 30, 20192020 and December 31, 2018,2019, there were 10,417,9667,219,164 and 10,057,5979,028,085 shares of Series B1 Preferred Stock issued and outstanding, respectively.
Series B Preferred Stock and Temporary Equity
Dividends on our Series B Preferred Stock accrue at an annual rate of 6% of the original issue price of the preferred stock ($3.10 per share), subject to increase under certain circumstances, and are payable on a quarterly basis. The dividends are payable by the Company, at the Company’s election, in registered common stock of the Company (if available), cash or in-kind in Series B Preferred Stock at $3.10 per share.
The Company has the option to redeem the outstanding shares of Series B Preferred Stock at $3.10 per share, plus any accrued and unpaid dividends on such Series B Preferred Stock redeemed, at any time beginning on June 24, 2017, and the Company is required to redeem the Series B Preferred Stock at $3.10 per share, plus any accrued and unpaid dividends, on June 24, 2020. However, the certificate of designation of the Series B Preferred Stock provides that the mandatory redemption date is automatically extended in the event that the terms of the Company’s senior credit facility prohibit the redemption of such Series B Preferred Stock and because the senior credit facility prohibits such redemption, the Company anticipates the redemption date of the Series B Preferred Stock being extended past June 24, 2020, until such date, if ever, as the Company’s senior credit facilities no longer prohibit such redemption. Effective on June 24, 2020, in the event the Series B Preferred Stock is not redeemed by the Company due to the provisions of the Company’s senior credit facilities, the dividend rate of such preferred stock increases to 10% per annum.
The Warrants issued in connection with the Series B Preferred Stock (Series B Warrants) were initially valued using the Dynamic Black Scholes Merton formula pricing model that computes the impact of share dilution upon the exercise of the warrant shares at $7,028,067. In accordance with ASC 815-40-25 and ASC 815-10-15 Derivatives and Hedging and ASC 480-10-25 Liabilities-Distinguishing Liabilities from Equity, the convertible preferred shares are accounted for net outside of stockholders’ equity with the Warrants accounted for as liabilities at their fair value. The initial value assigned to the derivative warrant liability was recognized through a corresponding discount to the Series B Preferred Stock. The value of the derivative warrant liability will be re-measured at each reporting period with changes in fair value recorded in earnings. The initial valuation of the warrants resulted in a beneficial conversion feature on the convertible preferred stock of $5,737,796. The amounts related to the warrant discount and beneficial conversion feature will be accreted over the term as a deemed dividend. Fees in the amount of $1.4 million relating to the stock placement were netted against proceeds.
The following table represents the activity related to the Series B Preferred Stock, classified as Temporary Equity on the accompanying unaudited consolidated balance sheet, during the nine months ended September 30, 20192020 and 2018:2019:
| | | | | | | | | | | |
| | | |
| | | |
| | | |
| | | |
| | | |
| | | |
| | | |
| | | |
| 2020 | | 2019 |
| Balance at beginning of period | $ | 11,006,406 | | | $ | 8,900,208 | |
| | | |
| Plus: discount accretion | 854,364 | | | 1,031,483 | |
| | | |
| Plus: dividends in kind | 547,349 | | | 510,502 | |
| | | |
| Balance at end of period | $ | 12,408,119 | | | $ | 10,442,193 | |
|
| | | | | | | |
| | 2019 | | 2018 |
| Balance at beginning of period | $ | 8,900,208 |
| | $ | 7,190,467 |
|
| Less: conversions of shares to common | — |
| | (62,962 | ) |
| Plus: discount accretion | 1,031,483 |
| | 815,373 |
|
| Plus: dividends in kind | 510,502 |
| | 489,282 |
|
| Balance at end of period | $ | 10,442,193 |
| | $ | 8,432,160 |
|
The Series B Warrants and Series B1 Warrants were revalued at September 30, 20192020 and December 31, 20182019 using the Dynamic Black Scholes model that computes the impact of a possible change in control transaction upon the exercise of the warrant shares at approximately $1,149,977$124,847 and $1,481,692,$1,969,216, respectively. At September 30, 2019,2020, the Series B Warrants and Series B1 Warrants were valued at approximately $111,790$0 and $1,038,187,$124,847, respectively. The Dynamic Black Scholes Merton inputs used were: expected dividend rate of 0%, expected volatility of 66%-100%, risk free interest rate of 1.69%0.11% (Series B Warrants) and 1.60%0.13% (Series B1 Warrants), and expected term of 1.500.25 years (Series B Warrants) and 2.501.25 years (Series B1 Warrants).
At September 30, 20192020 and December 31, 2018,2019, a total of $175,305$310,220 and $167,642$177,921 of dividends were accrued on our outstanding Series B Preferred Stock, respectively. During the three months ended September 30, 20192020 and 2018,2019, we paid dividends in-kind in additional shares of Series B Preferred Stock of $172,704$188,837 and $162,719,$175,305, respectively. Because such preferred stock was not redeemed on June 24, 2020, the preferred stock accrues a 10% per annum dividend (payable in-kind at the option of the Company), until such preferred stock is redeemed or converted into common stock.
Series B1 Preferred Stock and Temporary Equity
Dividends on our Series B1 Preferred Stock accrue at an annual rate of 6% of the original issue price of the preferred stock ($1.56 per share), and are payable on a quarterly basis. The dividends are payable by the Company, at the Company’s election, in registered common stock of the Company (if available), cash, or in-kind in Series B1 Preferred Stock at $1.56 per share.
The Company has the option to redeem the outstanding shares of Series B1 Preferred Stock at $1.72 per share, plus any accrued and unpaid dividends on such Series B1 Preferred Stock redeemed, at any time beginning on June 24, 2017, and the Company is required to redeem the Series B1 Preferred Stock at $1.56 per share, plus any accrued and unpaid dividends, on June 24, 2020. However, the certificate of designation of the Series B1 Preferred Stock provides that the mandatory redemption date is automatically extended in the event that the terms of the Company’s senior credit facility prohibit the redemption of such Series B1 Preferred Stock and because the senior credit facility prohibits such redemption, the Company anticipates the redemption date of the Series B1 Preferred Stock being extended past June 24, 2020, until such date, if ever, as the Company’s senior credit facilities no longer prohibit such redemption. Effective on June 24, 2020, in the event the Series B1 Preferred Stock is not redeemed by the Company due to the provisions of the Company’s senior credit facilities, the dividend rate of such preferred stock increases to 10% per annum.
The Warrants issued in connection with the Series B1 Preferred Stock offering (Series B1 Warrants) were initially valued using the Dynamic Black Scholes Merton formula pricing model that computes the impact of share dilution upon the exercise of the May 2016 Warrant shares at $2,867,264. In accordance with ASC 815-40-25 and ASC 815-10-15 Derivatives and Hedging and ASC 480-10-25 Liabilities-Distinguishing Liabilities from Equity, the convertible Series B1 Preferred Stock shares are accounted for net outside of stockholders’ equity with the May 2016 Warrants accounted for as liabilities at their fair value. The initial value assigned to the derivative warrant liability was recognized through a corresponding discount to the Series B1 Preferred Stock. The value of the derivative warrant liability will be re-measured at each reporting period with changes in fair value recorded in earnings. This initial valuation of the warrants resulted in a beneficial conversion feature on the convertible preferred stock of $2,371,106. The amounts related to the warrant discount and beneficial conversion feature will be accreted over the term as a deemed dividend. Fees in the amount of $0.6 million relating to the stock placement were netted against proceeds.
The following table represents the activity related to the Series B1 Preferred Stock, classified as Temporary Equity on the accompanying Consolidated Balance Sheet,unaudited consolidated balance sheet, for the nine months ended September 30, 2019,2020 and 2018:2019:
| | | | | | | | | | | |
| | | |
| | | |
| | | |
| | | |
| | | |
| | | |
| | | |
| | | |
| 2020 | | 2019 |
| Balance at beginning of period | $ | 12,743,047 | | | $ | 13,279,755 | |
| Less: conversions of shares to common | (3,368,474) | | | (119,768) | |
| Plus: discount accretion | 646,031 | | | 582,649 | |
| Plus: dividends in kind | 546,557 | | | 712,185 | |
| Balance at end of period | $ | 10,567,161 | | | $ | 14,454,821 | |
|
| | | | | | | |
| | 2019 | | 2018 |
| Balance at beginning of period | $ | 13,279,755 |
| | $ | 15,769,478 |
|
| Less: conversions of shares to common | (119,768 | ) | | (3,746,917 | ) |
Plus: discount accretion
| 582,649 |
| | 629,003 |
|
Plus: dividends in kind
| 712,185 |
| | 1,736,240 |
|
| Balance at end of period | $ | 14,454,821 |
| | $ | 14,387,804 |
|
As of September 30, 20192020 and December 31, 2018,2019, respectively, a total of $243,777$281,557 and $235,360$211,269 of dividends were accrued on our outstanding Series B1 Preferred Stock. During the three months ended September 30, 20192020 and 2018,2019, we paid dividends in-kind in additional shares of Series B1 Preferred Stock of $171,380 and $240,185, and $460,035, respectively.
The following is an analysis of changes in the derivative liability for the nine months ended SeptemberJune 30:
| | Level Three Roll-Forward | | Level Three Roll-Forward | |
| | | 2020 | 2019 |
| | Level Three Roll-Forward | | | |
| | | | 2019 | 2018 | |
| Balance at beginning of period | | $ | 1,481,692 |
| $ | 2,245,408 |
| Balance at beginning of period | | $ | 1,969,216 | | $ | 1,481,692 | |
| Change in valuation of warrants | | (331,715 | ) | 2,124,971 |
| Change in valuation of warrants | | (1,844,369) | | (331,715) | |
| Balance at end of period | | $ | 1,149,977 |
| $ | 4,370,379 |
| Balance at end of period | | $ | 124,847 | | $ | 1,149,977 | |
|
NOTE 10. SEGMENT REPORTING
The Company’s reportable segments include the (1) Black Oil, (2) Refining &and Marketing, and (3) Recovery divisions. segments.
(1) The Black Oil segment consists primary of the sale of (a) petroleum products which include base oil and industrial fuels—which consist of used motor oils, cutterstock and fuel oil generated by our facilities; (b) oil collection services—which consist of used oil sales, burner fuel sales, antifreeze sales and service charges; (c) the sale of other re-refinery products including asphalt, condensate, recovered products, and used motor oil; (d) transportation revenues; and (e) the sale of VGO (vacuum gas oil)/marine fuel.
(2) The Refining and Marketing segment consists primarily of the sale of pygas; industrial fuels, which are produced at a third-party facility; and distillates
(3) The Recovery segment consists primarily of revenues generated from the sale of ferrous and non-ferrous recyclable Metal(s) products that are recovered from manufacturing and consumption.It also includes revenues generated from trading/marketing of Group III Base Oils.
We also disaggregate our revenue by product category for each of our segments, as we believe such disaggregation helps depict how our revenue and cash flows are affected by economic factors.
Segment information for the three and nine months ended September 30, 20192020 and 20182019 is as follows:
| | | | | | | | | | | | | | | | | | | | | | | | | | |
| THREE MONTHS ENDED SEPTEMBER 30, 2020 |
| | | Black Oil | | Refining &
Marketing | | Recovery | | Total |
| Revenues: | | | | | | | | |
| Base oil | | $ | 5,632,592 | | | $ | 0 | | | $ | 733,180 | | | $ | 6,365,772 | |
| Pygas | | 0 | | | 1,184,433 | | | 0 | | | 1,184,433 | |
| Industrial fuel | | 21,190 | | | 82,644 | | | 0 | | | 103,834 | |
Distillates (1) | | 0 | | | 12,234,672 | | | 0 | | | 12,234,672 | |
| Oil collection services | | 2,449,454 | | | 0 | | | 0 | | | 2,449,454 | |
Metals (2) | | 0 | | | 0 | | | 3,160,581 | | | 3,160,581 | |
Other re-refinery products (3) | | 834,438 | | | 0 | | | 0 | | | 834,438 | |
| VGO/Marine fuel sales | | 11,050,448 | | | 0 | | | 0 | | | 11,050,448 | |
| Total revenues | | 19,988,122 | | | 13,501,749 | | | 3,893,761 | | | 37,383,632 | |
| Cost of revenues (exclusive of depreciation and amortization shown separately below) | | 14,687,141 | | | 13,217,757 | | | 3,281,786 | | | 31,186,684 | |
| Depreciation and amortization attributable to costs of revenues | | 1,041,719 | | | 121,744 | | | 149,699 | | | 1,313,162 | |
| Gross profit | | 4,259,262 | | | 162,248 | | | 462,276 | | | 4,883,786 | |
| Selling, general and administrative expenses | | 4,899,956 | | | 696,611 | | | 645,003 | | | 6,241,570 | |
| Depreciation and amortization attributable to operating expenses | | 390,105 | | | 72,314 | | | 20,450 | | | 482,869 | |
| Loss from operations | | $ | (1,030,799) | | | $ | (606,677) | | | $ | (203,177) | | | $ | (1,840,653) | |
| | | | | | | | |
| | | | | | | | |
| | | | | | | | |
| | | | | | | | |
| | | | | | | | |
| | | THREE MONTHS ENDED SEPTEMBER 30, 2019 | THREE MONTHS ENDED SEPTEMBER 30, 2019 | THREE MONTHS ENDED SEPTEMBER 30, 2019 |
| | | Black Oil | | Refining &
Marketing | | Recovery | | Total | | | Black Oil | | Refining &
Marketing | | Recovery | | Total |
| Revenues | | $ | 32,330,531 |
| | $ | 3,076,454 |
| | $ | 2,392,274 |
| | $ | 37,799,259 |
| |
| Revenues: | | Revenues: | | | | | | |
| Base oil | | Base oil | | $ | 9,135,650 | | | $ | 0 | | | $ | 640,642 | | | $ | 9,776,292 | |
| Pygas | | Pygas | | 0 | | | 2,741,557 | | | 0 | | | 2,741,557 | |
| Industrial fuel | | Industrial fuel | | 891,676 | | | 334,897 | | | 0 | | | 1,226,573 | |
Distillates (1) | | Distillates (1) | | 0 | | | 0 | | | 0 | | | 0 | |
| Oil collection services | | Oil collection services | | 1,953,924 | | | 0 | | | 0 | | | 1,953,924 | |
Metals (2) | | Metals (2) | | 0 | | | 0 | | | 1,724,025 | | | 1,724,025 | |
Other re-refinery products (3) | | Other re-refinery products (3) | | 3,057,171 | | | 0 | | | 27,607 | | | 3,084,778 | |
| VGO/Marine fuel sales | | VGO/Marine fuel sales | | 17,292,110 | | | 0 | | | 0 | | | 17,292,110 | |
| Total revenues | | Total revenues | | 32,330,531 | | | 3,076,454 | | | 2,392,274 | | | 37,799,259 | |
| Cost of revenues (exclusive of depreciation and amortization shown separately below) | | Cost of revenues (exclusive of depreciation and amortization shown separately below) | | 27,663,983 | | | 2,511,314 | | | 2,197,019 | | | 32,372,316 | |
| Depreciation and amortization attributable to costs of revenues | | Depreciation and amortization attributable to costs of revenues | | 1,073,520 | | | 147,658 | | | 138,451 | | | 1,359,629 | |
| Gross profit | | Gross profit | | 3,593,028 | | | 417,482 | | | 56,804 | | | 4,067,314 | |
| Selling, general and administrative expenses | | Selling, general and administrative expenses | | 5,040,772 | | | 494,781 | | | 617,631 | | | 6,153,184 | |
| Depreciation and amortization attributable to operating expenses | | Depreciation and amortization attributable to operating expenses | | 335,105 | | | 100,398 | | | 20,450 | | | 455,953 | |
| Loss from operations | | Loss from operations | | $ | (1,782,849) | | | $ | (177,697) | | | $ | (581,277) | | | $ | (2,541,823) | |
| | | | | | | | | | |
| Loss from operations | | $ | (1,782,849 | ) | | $ | (177,697 | ) | | $ | (581,277 | ) | | $ | (2,541,823 | ) | |
|
| | | | | | | | | | | | | | | | | | | | | | | | | | |
| NINE MONTHS ENDED SEPTEMBER 30, 2020 |
| | | Black Oil | | Refining &
Marketing | | Recovery | | Total |
| Revenues: | | | | | | | | |
| Base oil | | $ | 17,914,941 | | | $ | 0 | | | $ | 2,091,430 | | | $ | 20,006,371 | |
| Pygas | | 0 | | | 4,815,040 | | | 0 | | | 4,815,040 | |
| Industrial fuel | | 1,262,266 | | | 135,396 | | | 0 | | | 1,397,662 | |
Distillates (1) | | 0 | | | 17,359,234 | | | 0 | | | 17,359,234 | |
| Oil collection services | | 5,707,017 | | | 0 | | | 0 | | | 5,707,017 | |
Metals (2) | | 0 | | | 0 | | | 9,549,144 | | | 9,549,144 | |
Other re-refinery products (3) | | 4,341,027 | | | 0 | | | (51,684) | | | 4,289,343 | |
| VGO/Marine fuel sales | | 31,837,377 | | | 0 | | | 0 | | | 31,837,377 | |
| Total revenues | | 61,062,628 | | | 22,309,670 | | | 11,588,890 | | | 94,961,188 | |
| Cost of revenues (exclusive of depreciation and amortization shown separately below) | | 46,601,716 | | | 21,772,587 | | | 11,847,040 | | | 80,221,343 | |
| Depreciation and amortization attributable to costs of revenues | | 2,960,699 | | | 341,498 | | | 429,123 | | | 3,731,320 | |
| Gross profit (loss) | | 11,500,213 | | | 195,585 | | | (687,273) | | | 11,008,525 | |
| Selling, general and administrative expenses | | 15,180,569 | | | 1,867,027 | | | 1,925,052 | | | 18,972,648 | |
| Depreciation and amortization attributable to operating expenses | | 1,072,877 | | | 278,492 | | | 61,350 | | | 1,412,719 | |
| Loss from operations | | $ | (4,753,233) | | | $ | (1,949,934) | | | $ | (2,673,675) | | | $ | (9,376,842) | |
| | | | | | | | |
| | | | | | | | |
| | | | | | | | |
| | | | | | | | |
| | | | | | | | |
|
| | | | | | | | | | | | | | | | |
| THREE MONTHS ENDED SEPTEMBER 30, 2018 |
| | | Black Oil | | Refining &
Marketing | | Recovery | | Total |
| Revenues | | $ | 40,400,064 |
| | $ | 7,313,630 |
| | $ | 2,919,254 |
| | $ | 50,632,948 |
|
| | | | | | | | | |
| Income (loss) from operations | | $ | 1,769,439 |
| | $ | (418,482 | ) | | $ | (776,874 | ) | | $ | 574,083 |
|
| | | | | | | | | | | | | | | | | | | | | | | | | | |
| NINE MONTHS ENDED SEPTEMBER 30, 2019 |
| | | Black Oil | | Refining &
Marketing | | Recovery | | Total |
| Revenues: | | | | | | | | |
| Base oil | | $ | 23,918,490 | | | $ | 0 | | | $ | 2,439,071 | | | $ | 26,357,561 | |
| Pygas | | 0 | | | 7,656,125 | | | 0 | | | 7,656,125 | |
| Industrial fuel | | 5,714,478 | | | 1,501,655 | | | 0 | | | 7,216,133 | |
Distillates (1) | | 0 | | | 54,697 | | | 0 | | | 54,697 | |
| Oil collection services | | 4,261,391 | | | 0 | | | 0 | | | 4,261,391 | |
Metals (2) | | 0 | | | 0 | | | 5,988,895 | | | 5,988,895 | |
Other re-refinery products (3) | | 10,399,007 | | | 0 | | | 83,291 | | | 10,482,298 | |
| VGO/Marine fuel sales | | 58,760,163 | | | 0 | | | 0 | | | 58,760,163 | |
| Total revenues | | 103,053,529 | | | 9,212,477 | | | 8,511,257 | | | 120,777,263 | |
| Cost of revenues (exclusive of depreciation and amortization shown separately below) | | 88,374,446 | | | 7,767,882 | | | 7,589,758 | | | 103,732,086 | |
| Depreciation and amortization attributable to costs of revenues | | 3,122,664 | | | 431,948 | | | 411,014 | | | 3,965,626 | |
| Gross profit | | 11,556,419 | | | 1,012,647 | | | 510,485 | | | 13,079,551 | |
| Selling, general and administrative expenses | | 14,500,306 | | | 1,424,572 | | | 1,604,906 | | | 17,529,784 | |
| Depreciation and amortization attributable to operating expenses | | 1,005,315 | | | 301,194 | | | 61,350 | | | 1,367,859 | |
| Loss from operations | | $ | (3,949,202) | | | $ | (713,119) | | | $ | (1,155,771) | | | $ | (5,818,092) | |
| | | | | | | | |
| | | | | | | | |
| | | | | | | | |
| | | | | | | | |
| | | | | | | | |
(1) Distillates are finished fuel products such as gasoline and diesel fuels. |
| | | | | | | | | | | | | | | | |
| NINE MONTHS ENDED SEPTEMBER 30, 2019 |
| | | Black Oil | | Refining &
Marketing | | Recovery | | Total |
| Revenues | | $ | 103,053,529 |
| | $ | 9,212,477 |
| | $ | 8,511,257 |
| | $ | 120,777,263 |
|
| | | | | | | | | |
| Loss from operations | | $ | (3,949,202 | ) | | $ | (713,119 | ) | | $ | (1,155,771 | ) | | $ | (5,818,092 | ) |
(3) Other re-refinery products include the sales of asphalt, condensate, recovered products, and other petroleum products.
|
| | | | | | | | | | | | | | | | |
| NINE MONTHS ENDED SEPTEMBER 30, 2018 |
| | | Black Oil | | Refining &
Marketing | | Recovery | | Total |
| Revenues | | $ | 111,106,441 |
| | $ | 17,381,741 |
| | $ | 10,430,731 |
| | $ | 138,918,913 |
|
| | | | | | | | | |
| Income (loss) from operations | | $ | 3,979,619 |
| | $ | (1,119,522 | ) | | $ | (278,666 | ) | | $ | 2,581,431 |
|
NOTE 11. INCOME TAXES
Our effective tax rate of 0% on pretax income differs from the U.S. federal income tax rate of 21% because of the change in our valuation allowance.
The year to date loss at September 30, 20192020 puts the Company in an accumulated loss position for the cumulative 12 quarters then ended. For tax reporting purposes, we have net operating losses ("NOLs") of approximately $66.1$55.2 million as of September 30, 20192020 that are available to reduce future taxable income. In determining the carrying value of our net deferred tax asset, the Company considered all negative and positive evidence. The Company has generated a pre-tax loss of approximately $6.5$8.5 million from January 1, 20192020 through September 30, 2019.2020.
NOTE 12. COMMODITY DERIVATIVE INSTRUMENTS
The Company utilizes derivative instruments to manage its exposure to fluctuations in the underlying commodity prices of its inventory. The Company's management sets and implements hedging policies, including volumes, types of instruments and counterparties, to support oil prices at targeted levels and manage its exposure to fluctuating prices.
The Company’s derivative instruments consist of swap and futures arrangements for oil. In a commodity swap agreement, if the agreed-upon published third-party index price (“index price”) is lower than the swap fixed price, the Company receives the difference between the index price and the swap fixed price. If the index price is higher than the swap fixed price, the Company pays the difference. For futures arrangements, the Company receives the difference positive or negative between an agreed-upon strike price and the market price.
The mark-to-market effects of these contracts as of September 30, 20192020 and December 31, 2018,2019, are summarized in the following table. The notional amount is equal to the total net volumetric derivative position during the period indicated. The fair
value of the crude oil swap agreements is based on the difference between the strike price and the New York Mercantile Exchange futures price for the applicable trading months.
| | | | | | | | | | | | | | | | |
| As of September 30, 2020 |
| Contract Type | Contract Period | Weighted Average Strike Price (Barrels) | | | Remaining Volume (Barrels) | Fair Value |
| | | | | | |
| Swap | Sep. 2020- Oct. 2020 | $ | 37.10 | | | | 10,000 | | $ | 9,000 | |
| Swap | Sep. 2020- Oct. 2020 | $ | 46.33 | | | | 10,000 | | (28,896) | |
| Futures | Sep. 2020- Dec. 2020 | $ | 48.67 | | | | 26,000 | | (4,099) | |
| | | | | | $ | (23,995) | |
| | | | | | | | | | | | | | | | |
| As of December 31, 2019 |
| Contract Type | Contract Period | Weighted Average Strike Price (Barrels) | | | Remaining Volume (Barrels) | Fair Value |
| | | | | | |
| Swap | Dec. 2019-Mar. 2020 | $ | 40.88 | | | | 130,000 | | $ | 539,800 | |
| Swap | Dec. 2019-Mar. 2020 | $ | 81.19 | | | | 130,000 | | (673,428) | |
| Futures | Dec. 2019-Mar. 2020 | $ | 84.53 | | | | 105,000 | | (242,222) | |
| | | | | | $ | (375,850) | |
|
| | | | | | | | | |
| As of September 30, 2019 |
| Contract Type | Contract Period | Weighted Average Strike Price (Barrels) | Remaining Volume (Barrels) | Fair Value |
| | | | | |
| Swap | Oct. 2019- Jan. 2020 | $ | 37.25 |
| 210,000 |
| $ | (1,456,700 | ) |
| Swap | Oct. 2019- Jan. 2020 | $ | 76.90 |
| 210,000 |
| $ | (153,636 | ) |
| Futures | Oct. 2019- Jan. 2020 | $ | 79.50 |
| 60,000 |
| $ | 99,763 |
|
|
| | | | | | | | | |
| As of December 31, 2018 |
| Contract Type | Contract Period | Weighted Average Strike Price (Barrels) | Remaining Volume (Barrels) | Fair Value |
| | | | | |
| Swap | Dec. 2018-Feb. 2019 | $ | 48.78 |
| 60,000 |
| $ | (1,048,400 | ) |
| Swap | Dec. 2018-Feb. 2019 | $ | 68.69 |
| 60,000 |
| $ | 1,097,124 |
|
| Futures | Feb. 2019-Mar. 2019 | $ | 70.42 |
| 69,000 |
| $ | 394,317 |
|
| Futures | Dec. 2018-Feb. 2019 | $ | 45.41 |
| 30,000 |
| $ | 252,900 |
|
The carrying values of the Company's derivatives positions and their locations on the consolidated balance sheets as of September 30, 20192020 and December 31, 20182019 are presented in the table below.
| | | | | | | | | | | |
| Balance Sheet Classification | Contract Type | 2020 | 2019 |
| | | |
| Crude oil swaps | $ | (19,896) | | $ | (133,628) | |
| Crude oil futures | (4,099) | | (242,222) | |
| | | |
| Derivative commodity liability | | $ | (23,995) | | $ | (375,850) | |
|
| | | | | | | |
| Balance Sheet Classification | Contract Type | 2019 | 2018 |
| | | | |
| | Crude oil swaps | $ | (1,610,336 | ) | $ | 48,724 |
|
| | Crude oil futures | 99,763 |
| 647,217 |
|
| | | | |
| Derivative commodity asset (liability) | | $ | (1,510,573 | ) | $ | 695,941 |
|
For the three months ended September 30, 20192020 and 2018,2019, we recognized a $4,557 gain and a $1,622,056 and $647,149,loss, respectively, loss on commodity derivative contracts on the consolidated statements of operations as part of our costs of revenues. For the nine months ended September 30, 20192020 and 2018,2019, we recognized a $4,489,355 gain and a $2,691,833 and $1,859,234,loss, respectively, loss on commodity derivative contracts on the consolidated statements of operations as part of our costs of revenues.
NOTE 13. LEASES
The Company has various lease agreements including leases of plant, facilities, railcar, and equipment. Some leases include options to purchase, terminate or extend for one or more years. These options are included in the lease term when it is reasonably certain that the option will be exercised.
Leases with an initial term of 12 months or less are not recorded on our consolidated balance sheet; we recognize lease expense for these leases on a straight-line basis over the lease term. Leases with initial terms in excess of 12 months are recorded as operating or financing leases in our consolidated balance sheet.
Lease assets and operating lease liabilities are recognized based on the present value of the future minimum lease payments over the lease term at commencement date. As most of our leases do not provide an implicit rate, we use secured incremental borrowing rates based on the information available at commencement date, including lease term, in determining the present value of future payments. The operating lease asset also includes any lease payments made and excludes lease incentives and initial direct costs incurred. Our lease terms may include options to extend or terminate the lease when it is reasonably certain that the option will be exercised.
At inception, the Company determines if an arrangement contains a lease and whether that lease meets the classification criteria of a finance or operating lease. Some of the Company’s lease arrangements contain lease components (e.g. minimum rent payments) and non-lease components (e.g. maintenance, labor charges, etc.). The Company generally does not separate lease and nonlease components for all classes of underlying assets. For certain equipment leases, such as freight car, vehicles and work equipment, the Company accounts for the lease and non-lease components as a single lease component.
Certain of the Company’s lease agreements include rental payments that are adjusted periodically for an index or rate. The leases are initially measured using the projected payments adjusted for the index or rate in effect at the commencement date. The Company’s lease agreements do not contain any material residual value guarantees or material restrictive covenants.
Finance Leases
Finance leases are included in finance lease right-of-use lease assets and finance lease liability current and long-term liabilities on the unaudited consolidated balance sheets. The associated amortization expenseexpenses for the three months ended September 30, 2020 and interest expense2019 were $101,841 and $53,121, respectively, and are included in depreciation and amortization and interest expense, respectively, on the unaudited consolidated statements of operations. Total finance lease costsThe associated interest expense for the three months ended September 30, 2020 and 2019
were $33,077 and $12,436, respectively, and are included in interest expense on the unaudited consolidated statements of operations. The associated amortization expense for the nine months ended September 30, 2020 and 2019 were $65,675$228,514 and $141,549, respectively.$113,825, respectively, and are included in depreciation and amortization on the unaudited consolidated statements of operations. The associated interest expense for the nine months ended September 30, 2020 and 2019 were $66,014 and $30,206, respectively, and are included in interest expense on the unaudited consolidated statements of operations. Please see “Note 6. Line of Credit and Long-Term Debt” for more details. Operating Leases
Operating leases are included in operating lease right-of-use lease assets, and operating current and long-term lease liabilities on the consolidated balance sheets. Lease expense for operating leases is recognized on a straight-line basis over the lease term. Variable lease expense is recognized in the period in which the obligation for those payments is incurred. Lease expense for equipment is included in cost of revenues and other rents are included in selling, general and administrative expense on the consolidated statements of operations and are reported net of lease income. Lease income is not material to the results of operations for the three and nine months ended September 30, 2020 and 2019. Total operating lease costs for the three months ended September 30, 2020 and 2019 were $1.5 million and $1.6 million, respectively. Total operating lease costs, including some small leases with initial terms less than twelve months, for the nine months ended September 30, 2020 and 2019 were $1.6$4.5 million and $4.7 million, respectively.
Cash Flows
An initial right-of-use asset of $37.8 million was recognized as a non-cash asset addition with the adoption of the new lease accounting standard. Cash paid for amounts included in operating lease liabilities, including some small leases with initial terms less than twelve months was $1.6 million during the nine months ended September 30, 2020 and 2019, and is included in operating cash flows. Cash paid for amounts included in finance lease was $282,655 and $113,241 during the nine months ended September 30, 2020 and 2019, respectively, and is included in financing cash flows.
Maturities of our lease liabilities for all operating leases are as follows as of September 30, 2019:2020:
| | | | | | | | | | | | | | | | | | | | | | | | | | | | | |
| September 30, 2020 |
| Facilities | | Equipment | | Plant | | Railcar | | Total |
| Year 1 | $ | 710,879 | | | $ | 161,539 | | | $ | 4,060,417 | | | $ | 897,846 | | | $ | 5,830,681 | |
| Year 2 | 446,869 | | | 67,338 | | | 4,060,417 | | | 229,656 | | | 4,804,280 | |
| Year 3 | 346,733 | | | 0 | | | 4,060,417 | | | 56,712 | | | 4,463,862 | |
| Year 4 | 300,000 | | | 0 | | | 4,060,417 | | | 0 | | | 4,360,417 | |
| Year 5 | 300,000 | | | 0 | | | 4,060,417 | | | 0 | | | 4,360,417 | |
| Thereafter | 2,150,000 | | | 0 | | | 30,479,594 | | | 0 | | | 32,629,594 | |
| Total lease payments | $ | 4,254,481 | | | $ | 228,877 | | | $ | 50,781,679 | | | $ | 1,184,214 | | | $ | 56,449,251 | |
| Less: interest | (1,510,219) | | | (10,024) | | | (20,856,360) | | | (58,572) | | | (22,435,175) | |
| Present value of lease liabilities | $ | 2,744,262 | | | $ | 218,853 | | | $ | 29,925,319 | | | $ | 1,125,642 | | | $ | 34,014,076 | |
|
| | | | | | | | | | | | | | | | | | | |
| | Facilities | | Equipment | | Plant | | Railcar | | Total |
| Year 1 | $ | 733,420 |
| | $ | 161,539 |
| | $ | 4,060,417 |
| | $ | 1,050,126 |
| | $ | 6,005,502 |
|
| Year 2 | 550,070 |
| | 161,539 |
| | 4,060,417 |
| | 715,076 |
| | 5,487,102 |
|
| Year 3 | 367,770 |
| | 67,338 |
| | 4,060,417 |
| | 97,176 |
| | 4,592,701 |
|
| Year 4 | 315,000 |
| | — |
| | 4,060,417 |
| | 5,112 |
| | 4,380,529 |
|
| Year 5 | 300,000 |
| | — |
| | 4,060,417 |
| | — |
| | 4,360,417 |
|
| Thereafter | 2,450,000 |
| | — |
| | 34,540,011 |
| | — |
| | 36,990,011 |
|
| Total lease payments | $ | 4,716,260 |
| | $ | 390,416 |
| | $ | 54,842,096 |
| | $ | 1,867,490 |
| | $ | 61,816,262 |
|
| Less: interest | (1,716,201 | ) | | (27,868 | ) | | (23,702,742 | ) | | (126,590 | ) | | (25,573,401 | ) |
| Present value of lease liabilities | $ | 3,000,059 |
| | $ | 362,548 |
| | $ | 31,139,354 |
| | $ | 1,740,900 |
| | $ | 36,242,861 |
|
The weighted average remaining lease terms and discount rates for all of our operating leases were as follows as of September 30, 2019:2020:
|
| | | | | | | |
| Remaining lease term and discount rate: | | September 30, 20192020 |
| Weighted average remaining lease terms (years) | | |
| Lease facilities | | 5.35 |
5.53 |
| Lease equipment | | 2.42 |
1.42 |
| Lease plant | | 13.51 |
12.51 |
| Lease railcar | | 1.60 |
1.15 |
| Weighted average discount rate | | |
| Lease facilities | | 9.139.19 | % |
| Lease equipment | | 8.00 | % |
| Lease plant | | 9.37 | % |
| Lease railcar | | 8.00 | % |
Significant Judgments
Significant judgments include the discount rates applied, the expected lease terms, lease renewal options and residual value guarantees. There are several leases with renewal options or purchase options. Using the practical expedient, the Company utilized existing lease classifications as of December 31, 2018.September 30, 2020 and 2019.
The purchase options are not expected to have a material impact on the lease obligation. There are several facility and plant leases which have lease renewal options from one to twenty years.
The largest facility lease has an initial term through 2032. That lease does not have an extension option. For the twoThe 2 plant leases both have multiple 5-year extension options for a total of 20 years. TwoNaN extension options have been included in the lease right to useright-of-use asset and lease obligation at September 30,January 1, 2019.
The Company will reassess the lease terms and purchase options when there is a significant change in circumstances or when the Company elects to exercise an option that had previously been determined that it was not reasonably certain to do so.
NOTE 14. MYRTLE GROVE SHARE PURCHASE AND SUBSCRIPTION AGREEMENTAGREEMENTS
On July 26, 2019 (the “Closing Date”), Vertex Refining Myrtle Grove LLC, a Delaware limited liability company, which entity was formed as a special purpose vehicle in connection with the transactions, described in greater detail below (“MG SPV”), Vertex Operating, Tensile-Myrtle Grove Acquisition Corporation (“Tensile-MG”), an affiliate of Tensile, and solely for the purposes of the MG Guaranty (defined below), we entered into and closed the transactions contemplated by a Share Purchase and Subscription Agreement (the “MG Share Purchase”).
Prior to entering into the MG Share Purchase, Vertex Operating’s wholly-owned subsidiary, Vertex Refining LA, LLC (“Vertex LA”), transferred all of the operating assets owned by it and related to the planned development of the MG Refinery (as defined below), which the parties agreed had a fair market value of $22,666,667, to MG SPV in consideration for 21,667 Class A Units and 1,000 Class B Units of MG SPV, which units were distributed to Vertex Operating. At the closing of the MG Share Purchase (on the Closing Date), Vertex Operating sold 1,000 of the Class B Units to Tensile-MG for consideration of $1 million and Tensile-MG, purchased an additional 3,000 Class B Units directly from MG SPV for $3 million (less Tensile’s fees and expenses incurred in connection with the transaction, not to exceed $850,000).
As a result of the transaction, Tensile, through Tensile-MG, acquired an approximate 15.58% ownership interest in MG SPV, which in turn now owns the Company’s Belle Chasse, Louisiana, re-refining complex (the “MG Refinery”).
We, as required, used all proceeds we received from the sale of the Class B Units to pay down the EBC Credit Agreement. Amounts received by MG SPV from its direct sale of Class B Units to Tensile-MG may only be used for additional investments in the MG refinery or for day to day operations at the MG refinery. At September 30, 2019, $1.92020, $2.0 million reported as cash and cash equivalents on the balance sheet is restricted to MG refinery investments or operating expenses.
The MG Share Purchase includes customary representations and warranties and requires Myrtle-Grove SPV to indemnify Tensile-MG (and its related parties), Vertex Operating to indemnify Tensile-MG (and its related parties), and Tensile-MG to indemnify the Company (and its related parties), against various matters (subject to minimum losses being incurred by Myrtle-Grove SPV (and its related parties, as applicable) of $226,000 and a maximum liability by Myrtle-Grove SPV for all losses of Myrtle-Grove SPV of $3,400,000, subject to certain exceptions). Additionally, Myrtle-Grove SPV’s maximum indemnification liability under the agreement is not to exceed $4 million, except in the case of fraud, intentional misrepresentation or criminal activity.
The MG Share Purchase also provided for a guarantee by the Company to Tensile-MG of the payment obligations of Myrtle-Grove SPV and Vertex Operating as set forth in the MG Share Purchase, including the indemnification rights summarized above (the “MG Guaranty”).
In connection with the closing of the MG Share Purchase, MG SPV, Vertex Operating and the Company entered into an environmental remediation and indemnity agreement, whereby we agreed to indemnify and hold Tensile-MG harmless against certain potential environmental liabilities.
As discussed above, after the consummation of the transactions set forth in the MG Share Purchase, MG SPV is owned 84.42% by Vertex Operating and 15.58% by Tensile-MG. The Class B Units held by Tensile-MG are convertible into Class A Units at the option of Tensile-MG, as provided in the Limited Liability Company Agreement of MG SPV dated July 25, 2019 (the “MG Company Agreement”), based on a conversion price (initially one-for-one) which may be reduced from time to time if new Units of MG SPV are issued, and automatically convert into Series A Units upon certain events described in the MG Company Agreement.
Additionally, the Class B Unit holders may force MG SPV to redeem the outstanding Class B Units at any time on or after the earlier of (a) the fifth anniversary of the Closing Date and (ii) the occurrence of a Triggering Event (defined below)(an “MG Redemption”). The cash purchase price for such redeemed Class B Units is the greater of (y) the fair market value of such units (without discount for illiquidity, minority status or otherwise) as determined by a qualified third party agreed to in writing by a majority of the holders seeking an MG Redemption and Vertex Operating (provided that Vertex Operating still owns Class A Units on such date) and (z) the original per-unit price for such Class B Units plus any unpaid Class B preference. The preference is defined as the greater of (A) the aggregate unpaid “Class B Yield” (equal to an annual return of 22.5% per annum) and (B) an amount equal to fifty percent (50%) of the aggregate capital invested by the Class B Unit holders through such MG Redemption date.holders. The Company did not pay the preferential yield during the three and nine months ended September 30, 2020. “Triggering Events” mean (a) any dissolution, winding up or liquidation of the Company, Vertex Operating or any significant subsidiary of Vertex Operating, (b) any sale, lease, license or
disposition of any material assets of the Company, Vertex Operating or any significant subsidiary of Vertex Operating, (c) any transaction or series of related transactions (whether by merger, exchange, contribution, recapitalization, consolidation, reorganization, combination or otherwise) involving the Company, Vertex Operating or any significant subsidiary of Vertex Operating, the result of which is that the holders of the voting securities of the relevant entity as of the Closing Date are no longer the beneficial owners, in the aggregate, after giving effect to such transaction or series of transactions, directly or indirectly, of more than fifty percent (50%) of the voting power of the outstanding voting securities of the entity, subject to certain other requirements set forth in the MG Company Agreement, (d) the failure to consummate the
Heartland Closing (defined below) by June 30, 2020 (a “Failure to Close”), provided that such Heartland Closing was consummated by June 30, 2020, (e) the failure of Vertex Operating to operate MG SPV in good faith with appropriate resources, or (f) the material failure of the Company and its affiliates to comply with the terms of the contribution agreement, whereby the Company contributed assets and operations to MG SPV.
On or after the third anniversary of the Closing Date, the Company or any of its subsidiaries, may elect to purchase all of the outstanding units of MG SPV held by Tensile-MG (or any assignee of Tensile-MG) as discussed in the MG Company Agreement.
On the Closing Date, and as a required term of the closing of the MG Share Purchase, Tensile entered into a Subscription Agreement dated July 25, 2019, and effective on July 26, 2019, in favor of the Company (the “Subscription Agreement”), pursuant to which it subscribed to purchase (a) 1,500,000 shares of our common stock (the “Tensile Shares”), and (b) warrants to purchase 1,500,000 shares of our common stock, which were documented by a Common Stock Purchase Warrant (the “Warrants” and the shares of common stock issuable upon exercise thereof, the “Warrant Shares”) in consideration for $2.22 million or $1.48 per share and warrant.
The Warrants have an exercise price of $2.25 per share and a term of ten years. The Warrants also include a beneficial ownership limitation which prohibits Tensile from exercising any Warrants, if upon such exercise, Tensile, together with its affiliates, would, subject to limited exceptions, beneficially own in excess of 4.999% of the number of shares of our common stock outstanding immediately after the exercise. Tensile may elect to change this beneficial ownership limitation from 4.999% to up to 9.999% of the number of shares of our common stock outstanding immediately after the exercise upon 61 days’ prior written notice to us.
In connection with the subscription, we and Tensile entered into a Registration Rights and Lock-Up Agreement dated July 25, 2019 (the “Lock-Up Agreement”), pursuant to which we agreed to use commercially reasonable efforts to register the Tensile Shares and Warrant Shares prior to the end of the Initial Lock-Up (defined below) and Tensile agreed to not sell any of the Tensile Shares or Warrant Shares for a period of one year following the Closing Date (the “Initial Lock-Up”) and to sell no more than 300,000 of such Tensile Shares and Warrant Shares in any 90 day period No triggering events occurred during the four years thereafter (the “Volume Limitations”), each, subject to certain exemptions set forth therein.nine months ended September 30, 2020.
The Initial Lock-Up, but not the Volume Limitation, terminates if (i) the Heartland Closing does not occur by June 30, 2020 and/or (ii) if our common stock is not traded on Nasdaq or a similar market for a period of more than five consecutive trading days. Upon any termination of the Initial Lock-Up pursuant to the preceding sentence, in the event Tensile holds any Tensile Shares, Warrant Shares or any Warrants, we are required to disclose publicly all material nonpublic information disclosed to Tensile prior to the date of such termination.
We also provided Tensile-Heartland Acquisition Corporation (“Tensile-Heartland”), an affiliate of Tensile, an option (the “Heartland Option”), exercisable at any time prior to June 30, 2020, to the extent certain pilot studies to be conducted by MG SPV meet the standards of Tensile-Heartland, in its sole discretion, or the outcome of such studies are waived by Tensile-Heartland, to execute and close (within 30 days from such date of exercise by Tensile-Heartland) the acquisition of a 65% interest in a special purpose entity which will be formed to hold ownership of our
Heartland refinery, similar to what we have done with our Myrtle Grove facility as discussed above (the "Heartland Transaction"). Under the terms of that transaction, if closed, the Company will retain a 35% stake in the SPV and the Company will receive $13.5 million of non-recourse cash to its balance sheet.
Redeemable Noncontrolling Interest
As a result of the MG Share Purchase, (as defined and discussed above), Tensile, Capital Partners Master Fund LP, an investment fund based in San Francisco, California (“Tensile”), through Tensile-Myrtle Grove Acquisition Corporation, acquired an approximate 15.58% ownership interest in Vertex Refining Myrtle Grove LLC, a Delaware limited liability company, which entity was formed as a special purpose vehicle in connection with the transactions. This is considered a redeemable noncontrolling equity interest, as it is redeemable in the future and not solely within our control.
The initial carrying amount that is recognized in temporary equity for redeemable noncontrolling interests is the initial carrying amount determined in accordance with the accounting requirements for noncontrolling interests in ASC 810-10. In accordance
with ASC 810-10-45-23, changes in a parent’s ownership interest while the parent retains its controlling financial interest in its subsidiary are accounted for as equity transactions. Therefore, the Company recognized no gain or loss in consolidated net income and the carrying amount of the noncontrolling interest was adjusted to reflect the change in our ownership interest of the subsidiary. The difference of $970,809 between the fair value of the consideration received of $3,150,000 and the carrying amount of the noncontrolling interest determined in accordance with ASC 810-10 of $2,179,191, was recognized in additional paid in capital.
After initial recognition, in accordance with ASC 480-10-S99-3A, the Company applied a two-step approach to measure noncontrolling interests associated with MG SPV at the balance sheet date. First, the Company applied the measurement guidance in ASC 810-10 by attributing a portion of the subsidiariessubsidiary's net loss of $29,121$120,031 to the noncontrolling interest. Second, the Company applied the subsequent measurement guidance in ASC 480-10-S99-3A, which indicates that the noncontrolling interest’s carrying amount is the higher of (1) the cumulative amount that would result from applying the measurement guidance in ASC 810-10 in the first step or (2) the redemption value. Pursuant to ASC 480-10-S99-3A, for a security that is probable of becoming redeemable in the future, the Company adjusted the carrying amount of the redeemable noncontrolling interests to what would be the redemption value assuming the security was redeemable at the balance sheet date. This adjustment of $1,849,930$833,354 increased the carrying amount of redeemable noncontrolling interests to the redemption value as of September 30, 2019 of$4,000,000.2020 of $5,181,388. Adjustments to the carrying amount of redeemable noncontrolling interests to redemption value are reflected in retained earnings.
The table below presents the reconciliation of changes in redeemable noncontrolling interest.interest relating to MG SPV as of September 30, 2020.
| | | | | | |
| September 30, 2020 | |
| Beginning balance | $ | 4,396,894 | | |
| | |
| | |
| Net loss attributable to redeemable non-controlling interest | (120,031) | | |
| Change in ownership | 71,171 | | |
| Accretion of non-controlling interest to redemption value | 833,354 | | |
| Ending balance | $ | 5,181,388 | | |
|
| | | |
| | September 30, 2019 |
|
| Beginning balance | $ | — |
|
| Capital contribution from non-controlling interest | 3,150,000 |
|
| Initial adjustment of carrying amount of non-controlling interest | (970,809 | ) |
| Net loss attributable to redeemable non-controlling interest | (29,121 | ) |
| Accretion of non-controlling interest to redemption value | 1,849,930 |
|
| Ending balance | $ | 4,000,000 |
|
Heartland Share Purchase and Subscription Agreement
Encina Credit Agreement Amendments
InOn January 17, 2020 (the “Heartland Closing Date”), Vertex Operating, Tensile-Heartland, and solely for the purposes of the Heartland Guaranty (defined below), the Company, and HPRM LLC, a Delaware limited liability company, which entity was formed as a special purpose vehicle in connection with the transactions, contemplated bydescribed in greater detail below (“Heartland SPV”), entered into a Share Purchase and Subscription Agreement (the “Heartland Share Purchase”).
Prior to entering into the MGHeartland Share Purchase, the Company amendedtransferred 100% of the ownership of Vertex Refining OH, LLC, its EBC Creditindirect wholly-owned subsidiary (“Vertex OH”) to Heartland SPV in consideration for 13,500 Class A Units, 13,500 Class A-1 Preferred Units and 11,300 Class B Units of Heartland SPV and immediately thereafter contributed 248 Class B
Units to the Company’s wholly-owned subsidiary, Vertex Splitter Corporation, a Delaware corporation (“Vertex Splitter”), as a contribution to capital.
Vertex OH owned the Company’s Columbus, Ohio, Heartland facility, which produces a base oil product that is sold to lubricant packagers and distributors.
Pursuant to the Heartland Share Purchase, Vertex Operating sold Tensile-Heartland the 13,500 Class A Units and 13,500 Class A-1 Preferred Units of Heartland SPV in consideration for $13.5 million. Also, on the Heartland Closing Date, Tensile-Heartland purchased 7,500 Class A Units and 7,500 Class A-1 Units in consideration for $7.5 million (less the expenses of Tensile-Heartland in connection with the transaction) directly from Heartland SPV.
The approximate $7.5 million purchase amount and future free cash flows from the operation of Heartland SPV are planned to be available for investments at the Heartland facility to increase self-collections, maximize the throughput of the refinery, enhance the quality of the output and complete other projects.
Concurrently with the closing of the transactions described above, and pursuant to the terms of the Heartland Share Purchase, the Company, through Vertex Operating, purchased 1,000 newly issued Class A Units from MG SPV at a cost of $1,000 per unit ($1 million in aggregate). As a result of this transaction, MG SPV is owned 85.00% by Vertex Operating and 15.00% by Tensile-MG.
The Heartland Share Purchase provides Tensile-Heartland an option, exercisable at its election, at any time, subject to the terms of the Heartland Share Purchase, to purchase up to an additional 7,000 Class A-2 Preferred Units at a cost of $1,000 per Class A-2 Preferred Unit from Heartland SPV.
The Heartland SPV is currently owned 35% by Vertex Operating and 65% by Tensile-Heartland. Heartland SPV is managed by a 5-member Board of Managers, of which 3 members are appointed by Tensile-Heartland and 2 are appointed by the Company. The Class A Units held by Tensile-Heartland are convertible into Class B Units as provided in the Limited Liability Company Agreement
of Heartland SPV (the “Heartland Company Agreement”), based on a conversion price (initially 1-for-one) which may be reduced from time to time if new Units of Heartland SPV are issued and
Revolving Credit Agreement, as furtherwill automatically convert into Series B Units upon certain events described in
“Note 6. Linethe Heartland Company Agreement.
The Class A-1 and A-2 Preferred Units (“Class A Preferred Units”), which are 100% owned by Tensile-Heartland, accrue a 22.5% per annum preferred return subject to terms of Creditthe Heartland Company Agreement (the “Class A Yield”).
Additionally, the Class A Unit holders (common and Long-Term Debt”preferred) may force Heartland SPV to redeem the outstanding Class A Units at any time on or after the earlier of (a) the fifth anniversary of the Heartland Closing Date and (ii) the occurrence of a Heartland Triggering Event (defined below)(a “Heartland Redemption”). The cash purchase price for such redeemed Class A Unit will be the greater of (y) the fair market value of such units (without discount for illiquidity, minority status or otherwise) as determined by a qualified third party agreed to in writing by a majority of the holders seeking Heartland Redemption and Vertex Operating (provided that Vertex Operating still owns Class B Units on such date) and (z) the original per-unit price for such Class A Units plus fifty percent (50%) of the aggregate capital invested by the Class A Unit holders through such Heartland Redemption date. “Heartland Triggering Events” include (a) any termination of an Administrative Services Agreement entered into with Tensile, pursuant to its terms and/or any material breach by us of the environmental remediation and indemnity agreement entered into with Tensile, (b) any dissolution, winding up or liquidation of the Company, Vertex Operating or any significant subsidiary of Vertex Operating, (c) any sale, lease, license or disposition of any material assets of the Company, Vertex Operating or any significant subsidiary of Vertex Operating, or (d) any transaction or series of related transactions (whether by merger, exchange, contribution, recapitalization, consolidation, reorganization, combination or otherwise) involving the Company, Vertex Operating or any significant subsidiary of Vertex Operating, the result of which is that the holders of the voting securities of the relevant entity as of the Heartland Closing Date are no longer the beneficial owners, in the aggregate, after giving effect to such transaction or series of transactions, directly or indirectly, of more than fifty percent (50%) of the voting power of the outstanding voting securities of the entity, subject to certain other requirements set forth in the Heartland Company Agreement.
In the event that Heartland SPV fails to redeem such Class A Units within 180 days after a redemption is triggered, the Class A Yield is increased to 25% until such time as such redemption is completed (with such increase being effective back to the original date of a notice of redemption). In addition, in such event, the Class A Unit holders may cause Heartland SPV to initiate a process intended to result in a sale of Heartland SPV.
Distributions of available cash of Heartland SPV pursuant to the Heartland Company Agreement (including pursuant to liquidations of Heartland SPV), subject to certain exceptions set forth therein, are to be made (a) first, to the holders of the Class A Preferred Units, in amount equal to the greater of (A) the aggregate unpaid Class A Yield and (B) an amount equal to fifty percent (50%) of the aggregate capital invested by the Class A Preferred Unit holders (initially Tensile-Heartland)(such aggregate capital invested by the Class A Preferred Unit holders, the “Heartland Invested Capital”, which totaled approximately $21 million as of the Heartland Closing Date, subject to adjustment as provided in the Heartland Share Purchase), less prior distributions (such greater amount of (A) and (B), the “Class A Preferred Priority Distributions”); (b) second, the Class A Preferred Unit holders, together as a separate and distinct class, are entitled to receive an amount equal to the aggregate Heartland Invested Capital; (c) third, the Class B Unitholders (other than Class B Unitholders which received Class B Units upon conversion of Class A Preferred Units), together as a separate and distinct class, are entitled to receive all or a portion of any distribution equal to the sum of all distributions made under sections (a) and (b) above; and (d) fourth, to the holders of Units who are eligible to receive such distributions in proportion to the number of Units held by such holders.
Heartland Variable interest entity
The Company has assessed the Heartland SPV under the variable interest guidance in ASC 810. The Company determined that the Class A Units are not at risk due to a 22.5% preferred return and a redemption provision that, if elected, would require Heartland SPV to repurchase the Class A Units at their original cost plus the preferred return. The Company further determined that as a minority shareholder, holding only 35% of the voting rights, the Company does not have the ability to direct the activities of Heartland SPV that most significantly impact the entity’s performance. Based on this assessment, the Company concluded that Heartland SPV is a variable interest entity.
In assessing if the Company is the primary beneficiary of Heartland SPV, the Company determined that certain provisions of the Heartland Company Agreement prohibiting the transfer of its Class B Units result in the Class A Unit holders being related parties under the de facto agents criteria in ASC 810. The Company and the Class A Unit holders, as a group, have the power to direct the significant activities of Heartland SPV and the obligations to absorb the losses and the right to receive the benefits that could potentially be significant to Heartland SPV. The Company concluded that substantially all of the activities of Heartland SPV are conducted on its behalf, and not on behalf of the Class A Unit holders, the decision maker, thus the Company is the primary beneficiary and required to consolidate Heartland SPV in accordance with ASC 810.
The Company's consolidated financial statements include the assets, liabilities and results of operations of Heartland SPV for which the Company is the primary beneficiary. The other equity holders’ interests are reflected in net loss attributable to noncontrolling interests and redeemable noncontrolling interest in the consolidated statements of income and noncontrolling interests in the consolidated balance sheets.
The following table summarizes the carrying amounts of Heartland SPV's assets and liabilities included in the Company’s consolidated balance sheets at September 30, 2020:
| | | | | |
| September 30, 2020 |
| Cash and cash equivalents | $ | 8,072,347 | |
| Accounts receivable, net | 2,879,431 | |
| Inventory | 310,596 | |
| Prepaid expense and other current assets | 1,968,335 | |
| Total current assets | 13,230,709 | |
| |
| Fixed assets, net | 5,619,248 | |
| Finance lease right-of-use assets | 1,106,671 | |
| Operating lease right-of-use assets | 369,333 | |
| Intangible assets, net | 1,127,352 | |
| Other assets | 108,643 | |
| Total assets | $ | 21,561,956 | |
| |
| Accounts payable | $ | 1,413,378 | |
| Accrued expenses | 335,267 | |
| Finance lease liability-current | 340,193 | |
| Operating lease liability-current | 268,437 | |
| Total current liabilities | 2,357,275 | |
| |
| Finance lease liability-long term | 732,174 | |
| Operating lease liability-long term | 100,896 | |
| Total liabilities | $ | 3,190,345 | |
The assets of Heartland SPV may only be used to settle the obligations of Heartland SPV, and may not be used for other consolidated entities. The liabilities of Heartland SPV are non-recourse to the general credit of the Company’s other consolidated entities.
Heartland Redeemable Noncontrolling Interest
As a result of the Heartland Share Purchase (as defined and discussed above), Tensile Capital Partners Master Fund LP, an investment fund based in San Francisco, California (“Tensile”), through Tensile-Heartland, acquired an approximate 65.00% ownership interest in Heartland SPV, a Delaware limited liability company, which entity was formed as a special purpose vehicle in connection with the transactions. This is considered a redeemable noncontrolling equity interest, as it is redeemable in the future and not solely within our control.
The initial carrying amount that is recognized in temporary equity for redeemable noncontrolling interests is the initial carrying amount determined in accordance with the accounting requirements for noncontrolling interests in ASC 810-10. In accordance with ASC 810-10-45-23, changes in a parent’s ownership interest while the parent retains its controlling financial interest in its subsidiary are accounted for as equity transactions. Therefore, the Company recognized no gain or loss in consolidated net income and the carrying amount of the noncontrolling interest was adjusted to reflect the change in our ownership interest of the subsidiary. The difference of $9,091,068 between the fair value of the consideration received of $21,000,000 and the carrying amount of the noncontrolling interest determined in accordance with ASC 810-10 of $11,908,932, was recognized in additional paid in capital.
After initial recognition, in accordance with ASC 480-10-S99-3A, the Company applied a two-step approach to measure noncontrolling interests associated with Heartland SPV at the balance sheet date. First, the Company applied the measurement guidance in ASC 810-10 by attributing a portion of the subsidiary's net gain of $35,449 to the noncontrolling interest. Second, the Company applied the subsequent measurement guidance in ASC 480-10-S99-3A, which indicates that the noncontrolling interest’s carrying amount is the higher of (1) the cumulative amount that would result from applying the measurement guidance in ASC 810-10 in the first step or (2) the redemption value. Pursuant to ASC 480-10-S99-3A, for a security that is probable of becoming redeemable in the future, the Company adjusted the carrying amount of the redeemable noncontrolling interests to what would be the redemption value assuming the security was redeemable at the balance sheet date. This adjustment of $12,802,442 increased the carrying amount of redeemable noncontrolling interests to the redemption value as of
September 30, 2020 of $24,746,823. Adjustments to the carrying amount of redeemable noncontrolling interests to redemption value are reflected in retained earnings.
The table below presents the reconciliation of changes in redeemable noncontrolling interest relating to Heartland SPV as of September 30, 2020.
| | | | | |
| September 30, 2020 |
| Beginning balance | $ | 0 | |
| |
| Initial adjustment of carrying amount of non-controlling interest | 11,908,932 | |
| Net gain attributable to redeemable non-controlling interest | 35,449 | |
| Accretion of non-controlling interest to redemption value | 12,802,442 | |
| Ending balance | $ | 24,746,823 | |
The amounts of accretion of redeemable noncontrolling interest to redemption value of $1,287,559 and $13,635,797 presented as an adjustment to net loss attributable to Vertex Energy, Inc., to arrive at net loss available to common shareholders on the consolidated statements of operations represent the MG SPV and Heartland SPV accretion of redeemable noncontrolling interest to redemption value combined for the three and nine months ended September 30, 2020, respectively.
NOTE 15. ACQUISITION
Crystal Energy, LLC
On June 1, 2020, the Company entered into and closed a Member Interest Purchase Agreement with Crystal Energy, LLC ("Crystal") pursuant to which the Company agreed to buy all of the outstanding membership interests of Crystal for aggregate cash consideration of $1,822,690. This resulted in the recognition of $1,939,364 in accounts receivable, $976,512 in inventory, $14,484 in other current assets, and $1,107,670 in current liabilities. Upon the closing of the acquisition, Crystal became a wholly-owned subsidiary of the Company. The acquisition was accounted for as a business combination.
Crystal is an Alabama limited liability company that was organized on September 7, 2016, for the purpose of purchasing, storing, selling, and distributing refined motor fuels. These activities include the wholesale distribution of gasoline, blended gasoline, and diesel for use as engine fuel to operate automobiles, trucks, locomotives, and construction equipment. Crystal markets its products to third-party customers, and customers will typically resell these products to retailers, end use consumers, and others. These assets are used in our Refining division.
NOTE 15.16. SUBSEQUENT EVENTS
Issuance of Series B and B1 Preferred Stock Shares In-Kind and Common Stock
We paid the accrued dividends on our Series B Preferred Stock and Series B1 Preferred Stock, which were accrued as of September 30, 2019,2020, in-kind by way of the issuance of 56,550100,071 restricted shares of Series B Preferred Stock pro rata to each of the then holders of our Series B Preferred Stock in October 20192020 and the issuance of 156,276180,485 restricted shares of Series B1 Preferred Stock pro rata to each of the then holders of our Series B1 Preferred Stock in October 2019.2020. If converted in full, the 56,550100,071 shares of Series B Preferred Stock would convert into 56,550100,071 shares of common stock and the 156,276180,485 shares of Series B1 Preferred Stock would convert into 156,276180,485 shares of common stock.
Stock Option AgreementsMarrero Refinery Fire
On October 9, 2019,7, 2020, we had a fire at our Marrero refinery which took the Board of Directors granted one employee options to purchase an aggregate of 75,000 shares of common stock at an exercise price of $1.13 per sharefacility offline for repairs for about two weeks. The refinery suffered some minor structural damage along with a 5 year term (subject to continued employment), vesting atpiping, valves and instrumentation in the rate of 1/4th of such options per year on the first 4 anniversariesimmediate area of the grant, under our 2013 Stock Incentive Plan, as amended, in consideration for services rendered and to be renderedfire. The largest impact was the damage to the Company.
On October 29, 2019,electrical conduit that feeds the Board of Directors granted the same employee options to purchase an aggregate of 125,000 shares of common stock at an exercise price of $1.00 per share with a 5 year term (subject to continued employment), vesting at the rate of 1/4th of such options per year on the first 4 anniversaries of the grant, under our 2019 Equity Incentive Plan, in consideration for services rendered and to be renderedpower to the Company.
2019 Equity Incentive Plan
On refinery equipment. As of October 29, 2019, the Board of Directors adopted the Company’s 2019 Equity Incentive Plan (the “2019 Plan”). Notwithstanding such adoption, in accordance with the rules of the Nasdaq Capital Market, following the date of adoption, but prior to the Shareholder Approval Date (as defined below)26, 2020, the facility was back up and running and in the process of filing a claim with our insurance company. The Company may only grant stock options, but no shares of common stock or other securities, under the 2019 Plan. Additionally, (i) until the Shareholder Approval Date, no stock options can be exercised, and (ii) if Shareholder Approval is not received, the 2019 Plan is to be unwound, and the outstanding stock options granted thereunder cancelled (the “Nasdaq Pre-Approval Requirements”). Shareholder approval of the 2019 Plan is to be obtained in accordance with the Company’s Articles of Incorporation and Bylaws, each as amended and applicable laws, within twelve (12) months of the date of adoption (the “Shareholder Approval” and the date of such Shareholder Approval, the “Shareholder Approval Date”). Additionally, the grant of incentive stock options is subject to Shareholder Approval. A total of 4,000,000 shares of common stock are reserved for awards under the 2019 Plan. The Plan provides an opportunity for any employee, officer, director or consultant of the Company, subject to the terms of the 2019 Plan (including as discussed above and any limitations provided by federal or state securities laws, to receive (i) incentive stock options (to eligible employees only); (ii) nonqualified stock options; (iii) restricted stock; (iv) stock awards; (v) shares in performance of services; or (vi) any combination of the foregoing. Incentive stock options granted under the 2019 Plan are intended to qualify as “incentive stock options” within the meaning of Section 422 of the Internal Revenue Code of 1986, as amended (the “Code”). Nonqualified (non-statutory stock options) granted under the 2019 Plan are not intended to qualify as incentive stock options under the Code.believes that it maintains adequate insurance coverage.
Item 2. Management’s Discussion and Analysis of Financial Condition and Results of Operations
CAUTIONARY STATEMENT REGARDING FORWARD-LOOKING INFORMATION
This Report contains forward-looking statements within the meaning of Section 27A of the Private Securities Litigation Reform Act of 1933, as amended, and Section 21E of the Securities Exchange Act of 1934, as amended.1995. In some cases, you can identify forward-looking statements by the following words: “anticipate,” “believe,” “continue,” “could,” “estimate,” “expect,” “intend,” “may,” “ongoing,” “plan,” “potential,” “predict,” “project,” “should,” or the negative of these terms or other comparable terminology, although not all forward-looking statements contain these words. Forward-looking statements are not a guarantee of future performance or results, and will not necessarily be accurate indications of the times at, or by, which such performance or results will be achieved. Forward-looking statements are based on information available at the time the statements are made and involve known and unknown risks, uncertainties and other factors that may cause our results, levels of activity, performance or achievements to be materially different from the information expressed or implied by the forward-looking statements in this Report. These factors include:
•risks associated with our outstanding credit facilities, including amounts owed, restrictive covenants, security interests thereon and our ability to repay such facilities and amounts due thereon when due;
•risks associated with our outstanding preferred stock, including redemption obligations in connection therewith, restrictive covenants and our ability to redeem such securities when required pursuant to the terms of such securities and applicable law;
•the level of competition in our industry and our ability to compete;
•our ability to respond to changes in our industry;
•the loss of key personnel or failure to attract, integrate and retain additional personnel;
•our ability to protect our intellectual property and not infringe on others’ intellectual property;
•our ability to scale our business;
•our ability to maintain supplier relationships and obtain adequate supplies of feedstocks;
•our ability to obtain and retain customers;
•our ability to produce our products at competitive rates;
•our ability to execute our business strategy in a very competitive environment;
•trends in, and the market for, the price of oil and gas and alternative energy sources;
•our ability to maintain our relationship with KMTEX;
•the impact of competitive services and products;
•our ability to integrate acquisitions;
•our ability to complete future acquisitions;
•our ability to maintain insurance;
•potential future litigation, judgments and settlements;
•rules and regulations making our operations more costly or restrictive;restrictive, including IMO 2020 (defined below);
•changes in environmental and other laws and regulations and risks associated with such laws and regulations;
•economic downturns both in the United States and globally;
•risk of increased regulation of our operations and products;
•negative publicity and public opposition to our operations;
•disruptions in the infrastructure that we and our partners rely on;
•an inability to identify attractive acquisition opportunities and successfully negotiate acquisition terms;
•our ability to effectively integrate acquired assets, companies, employees or businesses;
•liabilities associated with acquired companies, assets or businesses;
•interruptions at our facilities;
•unexpected changes in our anticipated capital expenditures resulting from unforeseen required maintenance, repairs, or upgrades;
•our ability to acquire and construct new facilities;
•certain events of default which have occurred under our debt facilities and previously been waived;
•prohibitions on borrowing and other covenants of our debt facilities;
•our ability to effectively manage our growth;
•decreases in global demand for, and the price of, oil, due to COVID-19, state, federal and foreign responses thereto;
•our ability to acquire sufficient amounts of used oil feedstock through our collection routes, to produce finished products, and in the absence of such internally collected feedstocks, our ability to acquire third-party feedstocks on commercially reasonable terms;
•risks associated with COVID-19, the global efforts to stop the spread of COVID-19, potential downturns in the U.S. and global economies due to COVID-19 and the efforts to stop the spread of the virus, and COVID-19 in general;
•the lack of capital available on acceptable terms to finance our continued growth; and
•other risk factors included under “Risk Factors” in our latest Annual Report on Form 10-K and set forth below under “Risk Factors”.
You should read the matters described in, and incorporated by reference in, “Risk Factors” and the other cautionary statements made in this Report, and incorporated by reference herein, as being applicable to all related forward-looking statements wherever they appear in this Report. We cannot assure you that the forward-looking statements in this Report will prove to be accurate and therefore prospective investors are encouraged not to place undue reliance on forward-looking statements. Other than as required by law, we undertake no obligation to update or revise these forward-looking statements, even though our situation may change in the future.
This information should be read in conjunction with the interim unaudited financial statements and the notes thereto included in this Quarterly Report on Form 10-Q, and the audited financial statements and notes thereto and "Part II"II", "Item"Item 7, Management’s Discussion and Analysis of Financial Condition and Results of Operations" contained in our Annual Report on Form 10-K for the year ended December 31, 2018,2019, filed with the Securities and Exchange Commission on March 6, 20194, 2020 (the "Annual Report").
Certain capitalized terms used below and otherwise defined below, have the meanings given to such terms in the footnotes to our unaudited consolidated financial statements included above under “Part I - Financial Information” - “Item“Item 1. Financial Statements”.
In this Quarterly Report on Form 10-Q, we may rely on and refer to information regarding the refining, re-refining, used oil and oil and gas industries in general from market research reports, analyst reports and other publicly available information. Although we believe that this information is reliable, we cannot guarantee the accuracy and completeness of this information, and we have not independently verified any of it.
Please see the “Glossary of Selected Terms” incorporated by reference hereto as Exhibit 99.1, for a list of abbreviations and definitions used throughout this Report.
Unless the context requires otherwise, references to the “Company,” “we,” “us,” “our,” “Vertex”, “Vertex Energy” and “Vertex Energy, Inc.” refer specifically to Vertex Energy, Inc. and its consolidated subsidiaries.
In addition, unless the context otherwise requires and for the purposes of this report only:
“Base Oil” means the lubrication grade oils initially produced from refining crude oil (mineral base oil) or through chemical synthesis (synthetic base oil). In general, only 1% to 2% of a barrel of crude oil is suitable for refining into base oil. The majority of the barrel is used to produce gasoline and other hydrocarbons;
“Cutterstock” means fuel oil used as a blending agent added to other fuels. For example, to lower viscosity;
“Crack” means breaking apart crude oil into its component products, including gases like propane, heating fuel, gasoline, light distillates like jet fuel, intermediate distillates like diesel fuel and heavy distillates like grease;
"Exchange Act”" refers to the Securities Exchange Act of 1934, as amended;
"Feedstock” means a product or a combination of products derived from crude oil and destined for further processing in the refining or re-refining industries. It is transformed into one or more components and/or finished products;
“Gasoline Blendstock” means naphthas and various distillate products used for blending or compounding into finished motor gasoline. These components can include reformulated gasoline blendstock for oxygenate blending (RBOB) but exclude oxygenates (alcohols and ethers), butane, and pentanes (an organic compound with properties similar to a butane);
“Hydrotreating” means the process of reacting oil fractions with hydrogen in the presence of a catalyst to produce high-value clean products;
“IMO 2020” effective January 1, 2020, the International Maritime Organization (IMO) mandated a maximum sulphur content of 0.5% in marine fuels globally;
“MDO” means marine diesel oil, which is a type of fuel oil and is a blend of gasoil and heavy fuel oil, with less gasoil than intermediate fuel oil used in the maritime field;
“Naphthas” means any of various volatile, highly flammable liquid hydrocarbon mixtures used chiefly as solvents and diluents and as raw materials for conversion to gasoline;
“Pygas” means pyrolysis gasoline, an aromatics-rich gasoline stream produced in sizeable quantities by an ethylene plant. These plants are designed to crack a number of feedstocks, including ethane, propane, naphtha, and gasoil. Pygas can serve as a high-octane blendstock for motor gasoline or as a feedstock for an aromatics extraction unit;
"SEC”" or the “"Commission”" refers to the United States Securities and Exchange Commission;
“"Securities Act”" refers to the Securities Act of 1933, as amended; and
"VGO" refers to Vacuum Gas Oil (also known as cat feed) - a feedstock for a fluid catalytic cracker typically found in a crude oil refinery and used to make gasoline No. 2 oil and other byproducts.
“VRM LA” means Vertex Recovery Management LA, LLC, the Company’s indirect wholly-owned subsidiary.3
Where You Can Find Other Information
We file annual, quarterly, and current reports, proxy statements and other information with the Securities and Exchange Commission (“SEC”). Our SEC filings (reports, proxy and information statements, and other information) are available to the public over the Internet at the SEC’s website at www.sec.gov and are available for download, free of charge, soon after such reports are filed with or furnished to the SEC, on the “Investor Relations,” “SEC Filings” page of our website at www.vertexenergy.com. Information on our website is not part of this Report, and we do not desire to incorporate by reference such information herein. Copies of documents filed by us with the SEC are also available from us without charge, upon oral or written request to our Secretary, who can be contacted at the address and telephone number set forth on the cover page of this Report.
Novel Coronavirus (COVID-19) In December 2019, a novel strain of coronavirus, which causes the infectious disease known as COVID-19, was reported in Wuhan, China. The World Health Organization declared COVID-19 a “Public Health Emergency of International Concern” on January 30, 2020 and a global pandemic on March 11, 2020. In March and April, many U.S. states and local jurisdictions began issuing ‘stay-at-home’ orders, which continue in various forms as of the date of this report. Notwithstanding such ‘stay-at-home’ orders, to date, our operations have for the most part been deemed an essential business under applicable governmental orders based on the critical nature of the products we offer.
We sell products and services primarily in the U.S. domestic oil and gas commodity markets. Throughout the first quarter of 2020, the industry experienced multiple factors which lowered both the demand for, and prices of, oil and gas. First, the COVID-19 pandemic lowered global demand for hydrocarbons, as social distancing and travel restrictions were implemented across the world. Second, the lifting of Organization of the Petroleum Exporting Countries (OPEC)+ supply curtailments, and the associated increase in production of oil, drove the global supply of hydrocarbons higher through the first quarter of 2020. As a result of both dynamics, prices for hydrocarbons declined 67% from peak prices within the quarter. In addition, while global gross domestic product (GDP) growth was impacted by COVID-19 during the first nine months of 2020, we expect GDP to continue to decline globally in the fourth quarter of 2020 and for at least the early part of 2021, as a result of the COVID-19 pandemic. As a result, we expect oil and gas related markets will continue to experience significant volatility in 2020 and 2021. Our goal through this downturn has been to remain disciplined in allocating capital and to focus on liquidity and cash preservation. We are taking the necessary actions to right-size the business for expected activity levels.
As a result of the impact of the COVID-19 outbreak, some of our feedstock suppliers have permanently or temporarily closed their businesses, limited our access to their businesses, or have experienced a decreased demand for services. As a result of the above, and due to ‘stay-at-home’ and other social distancing orders, as well as the decline in U.S. travel caused by COVID-19, we have seen a significant decline in the volume of feedstocks (specifically used oil) that we have been able to collect, and therefore process through our facilities. A prolonged economic slowdown, period of social quarantine (imposed by the government or otherwise), or a prolonged period of decreased travel due to COVID-19 or the responses thereto, will likely have a material negative adverse impact on our ability to produce products, and consequently our revenues and results of operations.
The full extent of the impact of COVID-19 on our business and operations currently cannot be estimated and will depend on a number of factors including the scope and duration of the global pandemic.
Currently we believe that we have sufficient cash on hand and will generate sufficient cash through operations to support our operations for the foreseeable future; however, we will continue to evaluate our business operations based on new information as it becomes available and will make changes that we consider necessary in light of any new developments regarding the pandemic.
The pandemic is developing rapidly and the full extent to which COVID-19 will ultimately impact us depends on future developments, including the duration and spread of the virus, as well as potential seasonality of new outbreaks.
Description of Business Activities:
We are an environmental services company that recycles industrial waste streams and off-specification commercial chemical products. Our primary focus is recycling used motor oil and other petroleum by-products. We are engaged in operations across the entire petroleum recycling value chain including collection, aggregation, transportation, storage, re-refinement, and sales of aggregated feedstock and re-refined products to end users. We operate in three divisions: Black Oil, Refining and Marketing, and Recovery.
We currently provide our services in 15 states, primarily in the Gulf Coast, Midwest and Mid-Atlantic regions of the United States. For the rolling twelve-month period ending September 30, 2019,2020, we aggregated approximately 9281.4 million gallons of used motor oil and other petroleum by-product feedstocks and managed the re-refining of approximately 74.869.8 million gallons of used motor oil with our proprietary vacuum gas oil ("VGO") and Base Oil processes.
Our Black Oil division collects and purchases used motor oil directly from third-party generators, aggregates used motor oil from an established network of local and regional collectors, and sells used motor oil to our customers for use as a feedstock or replacement fuel for industrial burners. We operate a refining facility that uses our proprietary Thermal Chemical Extraction Process ("TCEP"(“TCEP”) (which is currently not in operation) and we also utilize third-party processing facilities. SubsequentTCEP’s original purpose was to re-fine used oil into marine cutterstock; however, in the third quarter of fiscal 2015, that use ceased to be economically accretive, and instead, we operated TCEP for the purposes of pre-treating our used motor oil feedstock prior to shipping to our facility in Marrero, Louisiana from the third quarter of fiscal 2015 to the third quarter of 2019. During the fourth quarter of 2019, the original purpose of TCEP once again became economically viable and at that time we switched to using TCEP to re-fine used oil into marine cutterstock; provided that with the recent decline in oil prices and challenges in obtaining feedstock, we switched back to using TCEP for the purposes of pre-treating our used motor oil feedstock prior to shipping to our facility in Marrero, Louisiana, beginning in the first quarter of 2020, and continuing through the filing date of this Report, we plan to recommence the use of our TCEP at our Baytown, Texas facility as we seek to capitalize on improved demand for lower sulfur marine fuels. Our TCEP technology will convert feedstock into a low sulfur marine fuel that can be sold into the new 0.5% low sulfur marine fuel specification mandated under International Maritime Organization (IMO) rules which go into effect on January 1, 2020.report.
We also acquired our Marrero, Louisiana facility, which facility re-refines used motor oil and also produces VGO and the Myrtle Grove re-refining complex in Belle Chasse, Louisiana (which is now owned by a special purpose entity which we own an approximate 85% interest of) in May 2014.
Our Refining and Marketing division aggregates and manages the re-refinement of used motor oil and other petroleum by-products and sells the re-refined products to end customers.
Our Recovery division includes a generator solutions company for the proper recovery and management of hydrocarbon streams as well as metals which includes transportation and marine salvage services throughout the Gulf Coast.
Black Oil Division
Our Black Oil division is engaged in operations across the entire used motor oil recycling value chain including collection, aggregation, transportation, storage, refinement, and sales of aggregated feedstock and re-refined products to end users. We collect and purchase used oil directly from generators such as oil change service stations, automotive repair shops, manufacturing facilities, petroleum refineries, and petrochemical manufacturing operations. We own a fleet of 41 collection vehicles, which routinely visit generators to collect and purchase used motor oil. We also aggregate used oil from a diverse network of approximately 50 suppliers who operate similar collection businesses to ours.
We manage the logistics of transport, storage and delivery of used oil to our customers. We own a fleet of 2930 transportation trucks and more than 15080 aboveground storage tanks with over 7.38.6 million gallons of storage capacity. These assets are used by both the Black Oil division and the Refining and Marketing division. In addition, we also utilize third parties for the transportation and storage of used oil feedstocks. Typically, we sell used oil to our customers in bulk to ensure efficient delivery by truck, rail, or barge. In many cases, we have contractual purchase and sale agreements with our suppliers and customers, respectively. We believe these contracts are beneficial to all parties involved because it ensures that a minimum volume is purchased from collectors and generators, a minimum volume is sold to our customers, and we are able to minimize our inventory risk by a spread between the costs to acquire used oil and the revenues received from the sale and delivery of used oil. We previouslyAlso, as discussed above under “Description of Business Activities”, from time to time, when market conditions warrant (i.e., when oil prices are sufficiently high), we have used our proprietary TCEP technology to re-refine used oil into marine fuel cutterstock and a higher-value feedstock for further processing; provided that duecutterstock. Due to the current depressed value ofrecent decline in oil prices and challenges in obtaining feedstock, since the thirdfirst quarter of fiscal 2015,2020, we have been utilizingused TCEP solely to pre-treat our used motor oil feedstock prior to shipping to our facility in Marrero, Louisiana; but have not operated our TCEP for the purpose of producing finished cutterstock. Subsequent to the filing of this Report, we plan to recommence the use of our TCEP at our Baytown, Texas facility as we seek to capitalize on improved demand for lower sulfur marine fuels. Our TCEP technology will convert feedstock into a low sulfur marine fuel that can be sold into the new 0.5% low sulfur marine fuel specification mandated under International Maritime Organization (IMO) rules which go into effect on January 1, 2020.Louisiana. In addition, at our Marrero, Louisiana facility, we produce a Vacuum Gas Oil (VGO) product that is sold to refineries as well as to the marine fuels market. At our Columbus, Ohio facility (Heartland Petroleum), we produce a base oil product that is sold to lubricant packagers and distributors.
Refining and Marketing Division
Our Refining and Marketing division is engaged in the aggregation of feedstock, re-refining it into higher value-end products, and selling these products to our customers, as well as related transportation and storage activities. We aggregate a diverse mix of feedstocks including used motor oil, petroleum distillates, transmix and other off-specification chemical products. These feedstock streams are purchased from pipeline operators, refineries, chemical processing facilities and third-party providers, and are also transferred from our Black Oil division. We have a toll-based processing agreement in place with KMTEX to re-refine feedstock streams, under our direction, into various end products that we specify. KMTEX uses industry standard processing technologies to re-refine our feedstocks into pygas, gasoline blendstock and marine fuel cutterstock. We sell all of our re-refined products directly to end-customers or to processing facilities for further refinement. In addition, we are distributing refined motor fuels such as gasoline, blended gasoline products and diesel used as engine fuels, to third party customers who typically resell these products to retailers and end consumers.
Recovery Division
The Company’s Recovery Segment includes a generator solutions company for the proper recovery and management of hydrocarbon streams, the sales and marketing of Group III base oils and other petroleum-based products, together with the recovery and processing of metals.
Thermal Chemical Extraction Process
We own the intellectual property for our patented TCEP. TCEP is a technology which utilizes thermal and chemical dynamics to extract impurities from used oil which increases the value of the feedstock. We intend to continue to develop our TCEP technology and design with the goal of producing additional re-refined products, including lubricating base oil.
TCEP differs from conventional re-refining technologies, such as vacuum distillation and hydrotreatment, by relying more heavily on chemical processes to remove impurities rather than temperature and pressure. Therefore, the capital requirements to build a TCEP plant are typically much less than a traditional re-refinery because large feed heaters, vacuum distillation columns, and a hydrotreating unit are not required. The end product currently produced by TCEP is used as fuel oil cutterstock. Conventional re-refineries produce lubricating base oils or product grades slightly lower than base oil that can be used as industrial fuels or transportation fuel blendstocks.
We currently estimate the cost to construct a new, fully-functional, commercial facility using our TCEP technology, with annual processing capacity of between 25 and 50 million gallons at another location would be approximately $10 - $15 million,
which could fluctuate based on throughput capacity. The facility infrastructure would require additional capitalized expenditures which would depend on the location and site specifics of the facility. We are currently utilizing TCEP to pre-treat our used motor oil feedstocks prior to shipping them to our facility in Marrero, Louisiana; but have not operated our TCEP for the purpose of producing finished cutterstock since the third quarter of fiscal 2015, due to market conditions. Subsequent to the filing of this Report, we plan to recommence the use of our TCEP at our Baytown, Texas facility as we seek to capitalize on improved demand for lower sulfur marine fuels. Our TCEP technology will convertconverts feedstock into a low sulfur marine fuel that can be sold into the new 0.5% low sulfur marine fuel specification mandated under International Maritime Organization (IMO) rules which gowent into effect on January 1, 2020.
As described above, due to the recent decline in oil prices and challenges in obtaining feedstock, we switched back to using TCEP for the purposes of pre-treating our used motor oil feedstock prior to shipping to our facility in Marrero, Louisiana beginning in the datefirst quarter of this Report, we2020. We have no current plans to construct additionalany other TCEP facilities.facilities at this time.
Products and Services
We generate substantially all of our revenue from the sale of sixeight product categories. All of these products are commodities that are subject to various degrees of product quality and performance specifications.
Used Motor
Base Oil
Used motor
Base oil is an oil to which other oils or substances are added to produce a petroleum-based or synthetic lubricant that contains impurities such as dirt, sand, water, and chemicals.lubricant. Typically the main substance in lubricants, base oils, are refined from crude oil.
Fuel Oil
Fuel oil is a distillate fuel which is typically blended with lower quality fuel oils. The distillation of used oil and other petroleum by-products creates a fuel with low viscosity, as well as low sulfur, ash, and heavy metal content, making it an ideal blending agent.
Pygas
Pygas, or pyrolysis gasoline, is a product that can be blended with gasoline as an octane booster or that can be distilled and separated into its components, including benzene and other hydrocarbons.
Gasoline Blendstock
Gasoline blendstock includes NaphthasIndustrial Fuel
Industrial fuel is a distillate fuel oil which is typically a blend of lower quality fuel oils. It can include diesel fuels and various distillate productsfuel oils such as No. 1, No. 2 and No. 4 diesel fuels that are historically used for space heating and power generation.Industrial fuel is typically a fuel with low viscosity, as well as low sulfur, ash, and heavy metal content, making it an ideal blending or compounding intoagent.
Distillates
Distillates are finished fuel products such as gasoline and diesel fuels.
Oil Collection Services
Oil collection services include the collection, handling, treatment and sales of used motor gasoline. These components canoil and products which include reformulated gasoline blendstock for oxygenate blending (RBOB) but exclude oxygenates (alcohols and ethers), butane, and pentanes plus.used motor oil (such as oil filters) which are collected from our customers.
Base Oil
An oil to which other oils or substances are added to produce a lubricant. Typically, the main substance in lubricants and base oils is refined from crude oil.Metals
Scrap Metal(s)
ConsistsMetals consist of recoverable ferrous and non-ferrous recyclable metals from manufacturing and consumption. Scrap metal can be recovered from pipes, barges, boats, building supplies, surplus equipment, tanks, and other items consisting of metal composition. These materials are segregated, processed, cut-up and sent back to a steel mill for re-purposing.
Other re-refinery products
Other re-refinery products include the sales of asphalt, condensate, recovered products, and other petroleum products.
VGO/Marine fuel sales
VGO/Marine fuel sales relate to the sale of low sulfur fuel meeting the criteria for IMO 2020 compliant marine fuels.
The way that the product categories above fit into our three operating segments (1) Black Oil; (2) Refining and Marketing; and (3) Recovery, are indicated below:
| | | | | | | | | | | |
| Black Oil(1) | Refining and Marketing(2) | Recovery(3) |
| Base oil | X | | X |
| Pygas | | X | |
| Industrial fuel | X | X | |
| Distillates | | X | |
| Oil collection services | X | | |
| Metals | | | X |
| Other re-refinery products | X | | X |
| VGO/Marine fuel sales | X | | |
(1) As discussed in greater detail above under “Black Oil Division”, the Black Oil segment consists primary of the sale of (a) petroleum products which include base oil and industrial fuels—which consist of used motor oils, cutterstock and fuel oil generated by our facilities; (b) oil collection services—which consist of used oil sales, burner fuel sales, antifreeze sales and service charges; (c) the sale of other re-refinery products including asphalt, condensate, recovered products, and used motor oil; (d) transportation revenues; and (e) the sale of VGO (vacuum gas oil)/marine fuel.
(2) As discussed in greater detail above under “Refining and Marketing Division”, the Refining and Marketing segment consists primarily of the sale of pygas; industrial fuels, which are produced at a third-party facility (KMTEX); and distillates.
(3) As discussed in greater detail above under “Recovery Division”, the Recovery segment consists primarily of revenues generated from the sale of ferrous and non-ferrous recyclable Metal(s) products that are recovered from manufacturing and consumption.It also includes revenues generated from trading/marketing of Group III Base Oils.
RESULTS OF OPERATIONS
Description of Material Financial Line Items:
Revenues
We generate revenues from three existing operating divisions as follows:
BLACK OIL - Revenues from our Black Oil division are comprised primarily of product sales from our re-refineries and feedstock sales (used motor oil) which are purchased from generators of used motor oil such as oil change shops and garages, as well as a network of local and regional suppliers. Volumes are consolidated for efficient delivery and then sold to third-party re-refiners and fuel oil blenders for the export market. In addition, through used oil re-refining, we re-refine used oil into different commodity products. Through the operations at our Marrero, Louisiana facility, we produce a Vacuum Gas Oil (VGO) product from used oil re-refining which is then sold via barge to crude refineries to be utilized as an intermediate feedstock in the refining process. Through the operations at our Columbus, Ohio facility, we produce a base oil finished product which is then sold via truck or rail car to end users for blending, packaging and marketing of lubricants.
REFINING AND MARKETING - The Refining and Marketing division generates revenues relating to the sales of finished products. The Refining and Marketing division gathers hydrocarbon streams in the form of petroleum distillates, transmix and other chemical products that have become off-specification during the transportation or refining process. These feedstock streams are purchased from pipeline operators, refineries, chemical processing facilities and third-party providers, and then processed at a third-party facility under our direction. The end products are typically three distillate petroleum streams (gasoline blendstock, pygas and fuel oil cutterstock), which are sold to major oil companies or to large petroleum trading and blending companies. The end products are delivered by barge and truck to customers.
RECOVERY - The Recovery division is a generator solutions company for the proper recovery and management of hydrocarbon streams. We own and operate a fleet of trucks and other vehicles used for shipping and handling equipment and scrap materials.
Our revenues are affected by changes in various commodity prices including crude oil, natural gas, #6 oil and metals.
Cost of Revenues
BLACK OIL - Cost of revenues for our Black Oil division are comprised primarily of feedstock purchases from a network of providers. Other cost of revenues include processing costs, transportation costs, purchasing and receiving costs, analytical assessments, brokerage fees and commissions, and surveying and storage costs.
REFINING AND MARKETING - The Refining and Marketing division incurs cost of revenues relating to the purchase of feedstock, purchasing and receiving costs, and inspection and processing of the feedstock into gasoline blendstock, pygas and fuel oil cutter by a third party. Cost of revenues also includes broker’s fees, inspection and transportation costs.
RECOVERY - The Recovery division incurs cost of revenues relating to the purchase of hydrocarbon products, purchasing and receiving costs, inspection, and transporting of metals and other salvage and materials. Cost of revenues also includes broker’s fees, inspection and transportation costs.
Our cost of revenues is affected by changes in various commodity indices, including crude oil, natural gas, #6 oil and metals. For example, if the price for crude oil increases, the cost of solvent additives used in the production of blended oil products, and fuel cost for transportation cost from third party providers will generally increase. Similarly, if the price of crude oil falls, these costs may also decline.
General and Administrative Expenses
Our general and administrative expenses consist primarily of salaries and other employee-related benefits for executive, administrative, legal, financial, and information technology personnel, as well as outsourced and professional services, rent, utilities, and related expenses at our headquarters, as well as certain taxes.
Depreciation and Amortization Expenses
Our depreciation and amortization expenses are primarily related to the property, plant and equipment and intangible assets acquired in connection with our Vertex Holdings, L.P. (formerly Vertex Energy, L.P.), a Texas limited partnership (“Holdings”), Omega Refining, LLC's (“Omega Refining”) and Warren Ohio Holdings Co., LLC, f/k/a Heartland Group Holdings, LLC (“Heartland”), Acadiana Recovery, LLC, Nickco Recycling, Inc., Ygriega Environmental Services, LLC, Specialty Environmental Services and SESCrystal Energy, LLC acquisitions, described in greater detail in the 2019 Annual Report.Report and herein (as to Crystal).
Depreciation and amortization expense attributable to cost of revenues reflects the depreciation and amortization of the fixed assets at our refineries along with rolling stock at our collection branches.
Depreciation and amortization expense attributable to operating expenses reflects depreciation and amortization related to our corporate and administrative offices along with internet technology (IT) related items and intangibles.
Recent Events
Myrtle GroveHeads of Agreement
On January 10, 2020, Vertex Operating entered into a Heads of Agreement (the “Heads of Agreement”) with Bunker One (USA) Inc., which is owned by Bunker Holding, a Danish holding company (“Bunker One”). Pursuant to the Heads of Agreement, the Company and Bunker One agreed to form a joint decision-making body (the “JDMB”) to focus on strategic matters related to the overall cooperation of the parties and to establish rules and procedures for identifying and undertaking joint projects. The Heads of Agreement is described in greater detail in the Current Report on Form 8-K filed by the Company with the Securities and Exchange Commission on January 13, 2020. JSMA
Also on January 10, 2020, Vertex Operating entered into a Joint Supply and Marketing Agreement (the “JSMA”), with Bunker One. The JSMA is effective as of May 1, 2020, and provides for Bunker One to acquire 100% of the production from the Company’s Marrero, Louisiana re-refining facility (which produces approximately 100,000 barrels per month of a bunker suitable fuel for offshore use and use as a marine vessel’s propulsion system (“Bunker Fuel”)) at the arithmetic mean of Platts #2 USGC Pipe and Platt’s ULSD USGC Waterborne on agreed pricing days less an agreed upon discount, adjusted every three months. The JSMA is described in greater detail in the Current Report on Form 8-K filed by the Company with the Securities and Exchange Commission on January 13, 2020. Heartland Share Purchase, Subscription Agreement and Heartland Limited Liability Company Agreement
Our Heartland Share Purchase and Subscription Agreement and the Heartland Limited Liability Company Agreement are described in greater detail under “Part I” - “Item 1. Financial Statements” - “Note 14. Share Purchase and Subscription Agreements” - “Heartland Share Purchase and Subscription Agreement".
On July 26, 2019 (the “Administrative Services Agreement
Pursuant to an Administrative Services Agreement, entered into on the Heartland Closing Date,”), Heartland SPV engaged Vertex Refining Myrtle Grove LLC, a Delaware limited liability company, which entity was formed as a special purpose vehicleOperating and the Company to provide administrative/management services and day-to-day operational management services of Heartland SPV in connection with the transactions,collection, storage, transportation, transfer, refining, re-refining, distilling, aggregating, processing, blending, sale of used motor oil, used lubricants, wholesale lubricants, recycled fuel oil, or related products and services such as vacuum gas oil, base oil, and asphalt flux, in consideration for a monthly fee. The Administrative Services Agreement has a term continuing until the earlier of (a) the date terminated with the mutual consent of the parties; (b) a liquidation of Heartland SPV; (c) a Heartland Redemption (as described in greater detail belowNote 14 to the unaudited notes to the consolidated financial statements included herein); (d) the determination of Heartland SPV to terminate following a change of control (as described in the Administrative Services Agreement) of Heartland SPV or the Company; or (e) written notice from the non-breaching party upon the occurrence of a breach which is not cured within the cure period set forth in the Administrative Services Agreement.
The Administrative Services Agreement also provides that in the event that Heartland SPV is unable to procure used motor-oil (“MG SPVUMO”), through its ordinary course operations, subject to certain conditions, Vertex Operating Tensile-Myrtle Grove Acquisition Corporation (“Tensile-MG”),and the Company are required to use their best efforts to sell (or cause an affiliate of Tensile Capital Partners Master Fund LP, an investment fund based in San Francisco, California (“Tensile”), and solely forto sell) UMO to Heartland SPV, at the purposeslesser of the MG Guaranty (defined below),(i) then-current market price for UMO sold in the same geography area and (ii) price paid by such entity for such UMO. Finally, the Administrative Services Agreement provides that in the event that the Heartland SPV is unable to procure vacuum gas oil (“VGO”) feedstock
through its ordinary course operations, subject to certain conditions, Vertex Operating and the Company are required to use their best efforts to sell (or cause an affiliate to sell) VGO to Heartland SPV, at the lesser of the (i) then-current market price for VGO sold in the same geographic area and (ii) price paid for such VGO.
Advisory Agreement
On the Heartland Closing Date, Heartland SPV entered into an Advisory Agreement with Tensile, pursuant to which Tensile agreed to provide advisory and consulting services to Heartland SPV and Heartland SPV agreed to reimburse and indemnify Tensile and its representatives, in connection therewith.
Crystal Energy, LLC
On June 1, 2020, the Company entered into and closed the transactions contemplated by a ShareMember Interest Purchase and Subscription Agreement (the “MG Share Purchase”).
Prior to entering into the MG Share Purchase, Vertex Operating’s wholly-owned subsidiary, Vertex Refining LA,with Crystal Energy, LLC (“Vertex LA”("Crystal'), transferred all of the operating assets owned by it and related pursuant to the planned development of the MG Refinery (as defined below), which the partiesCompany agreed had a fair market valueto buy the outstanding membership interests of $22,666,667, to MG SPVCrystal for aggregate cash consideration of $1,822,690. This resulted in consideration for 21,667 Class A Unitsthe recognition of $1,939,364 in accounts receivable, $976,512 in inventory, $14,484 in other current assets, and 1,000 Class B Units of MG SPV, which units were distributed to Vertex Operating. At$1,107,670 in current liabilities. Upon the closing of the MG Share Purchase (on the Closing Date), Vertex Operating sold 1,000acquisition, Crystal became a wholly-owned subsidiary of the Class B Units to Tensile-MG in consideration of the payment to it of $1 million by Tensile-MG, and Tensile-MG purchasedCompany.
Crystal is an additional 3,000 Class B Units directly from MG SPV for $3 million (less Tensile’s fees and expenses incurred in connection with the transaction, not to exceed $850,000).
As a result of the transaction, Tensile, through Tensile-MG, acquired an approximate 15.58% ownership interest in MG SPV, which in turn now owns the Company’s Belle Chasse, Louisiana, re-refining complex (the “MG Refinery”).
We were required to use all proceeds we received from the sale of the Class B Units to pay down an equal amount of indebtedness then owing under our senior credit agreement, which amount we have paid to date.
MG SPV Limited Liability Company Agreement
As discussed above, after the consummation of the transactions set forth in the MG Share Purchase, MG SPV is owned 84.42% by Vertex Operating and 15.58% by Tensile-MG. The Class B Units held by Tensile-MG are convertible into Class A Units at the option of Tensile-MG, as provided in the Limited Liability Company Agreement of MG SPV dated July 25, 2019 (the “MG Company Agreement”), based on a conversion price (initially one-for-one) which may be reduced from time to time if new Units of MG SPV are issued, and automatically convert into Series A Units upon certain events described in the MG Company Agreement.
Additionally, the Class B Unit holders may force MG SPV to redeem the outstanding Class B Units at any time on or after the earlier of (a) the fifth anniversary of the Closing Date and (ii) the occurrence of a Triggering Event (defined below)(an “MG Redemption”). The cash purchase price for such redeemed Class B Units is the greater of (y) the fair market value of such units (without discount for illiquidity, minority status or otherwise) as determined by a qualified third party agreed to in writing by a majority of the holders seeking an MG Redemption and Vertex Operating (provided that Vertex Operating still owns Class A Units on such date) and (z) the original per-unit price for such Class B Units plus fifty percent (50%) of the aggregate capital invested by the Class B Unit holders through such MG Redemption date. “Triggering Events” mean (a) any dissolution, winding up or liquidation of the Company, Vertex Operating or any significant subsidiary of Vertex Operating, (b) any sale, lease, license or disposition of any material assets of the Company, Vertex Operating or any significant subsidiary of Vertex Operating, (c) any transaction or series of related transactions (whether by merger, exchange, contribution, recapitalization, consolidation, reorganization, combination or otherwise) involving the Company, Vertex Operating or any significant subsidiary of Vertex Operating, the result of which is that the holders of the voting securities of the relevant entity as of the Closing Date are no longer the beneficial owners, in the aggregate, after giving effect to such transaction or series of transactions, directly or indirectly, of more than fifty percent (50%) of the voting power of the outstanding voting securities of the entity, subject to certain other requirements set forth in the MG Company Agreement, (d) the failure to consummate the Heartland Closing (defined below) by June 30, 2020 (a “Failure to Close”), (e) the failure of Vertex Operating to operate MG SPV in good faith with appropriate resources, or (f) the material failure of the Company and its affiliates to comply with the terms of the contribution agreement, whereby the Company contributed assets and operations to MG SPV.
On or after the third anniversary of the Closing Date, the Company or any of its subsidiaries, may elect to purchase all of the outstanding units of MG SPV held by Tensile-MG (or any assignee of Tensile-MG) as discussed in the MG Company Agreement.
Right of First Offer Letter Agreement
On the Closing Date, Tensile-MG, Vertex Operating and the Company entered into a right of first offer letter agreement (the “ROFO Agreement”), whereby we agreed that if we, at any time, propose to issue, sell, transfer, assign, pledge, encumber or otherwise directly or indirectly dispose of any equity or debt securities of (x) MG SPV and/or (y) Cedar Marine Terminals, L.P., or any other entity formed or designated to operate the Cedar Marine Terminal in Baytown, Texas, we would provide Tensile-MG written notice of such, and Tensile-MG would have thirty days to purchase the amount of securities offered on terms at least as favorable as those in the original proposal. The rights under the ROFO Agreement continue to apply until such time, if ever, as Tensile-MG has acquired $50 million of securities pursuant to the terms thereof.
Subscription Agreement; Common Stock Purchase Warrant and Registration Rights and Lock-Up Agreement
On the Closing Date, and as a required term of the closing of the MG Share Purchase, Tensile entered into a Subscription Agreement dated July 25, 2019, in favor of the Company (the “Subscription Agreement”), pursuant to which, on the Closing Date, it subscribed to purchase (a) 1,500,000 shares of our common stock (the “Tensile Shares”), and (b) warrants to purchase 1,500,000 shares of our common stock with an exercise price of $2.25 per share and a term of ten years, which were documented by a Common Stock Purchase Warrant (the “Warrants” and the shares of common stock issuable upon exercise thereof, the “Warrant Shares”) in consideration for $2.22 million or $1.48 per share and warrant.
Letter Agreement and Heartland Option
On the Closing Date, Tensile-Heartland Acquisition Corporation (“Tensile-Heartland”), an affiliate of Tensile, Vertex Operating and the Company entered into a letter agreement, whereby the Company and Vertex Operating provided Tensile an option (the “Heartland Option”), exercisable at any time prior to June 30, 2020, to the extent certain pilot studies to be conducted by MG SPV meet the standards of Tensile-Heartland, in its sole discretion, or the outcome of such studies are waived by Tensile-Heartland, to execute and close (within 30 days from such date of exercise by Tensile-Heartland) the transactions contemplated by a Share Purchase and Subscription Agreement between the parties and HPRM LLC, which are described below (the “Heartland Closing”).
In the event the option provided for in the Heartland Option is exercised by Tensile-Heartland, of which there can be no assurance, the parties will enter into and complete the transactions contemplated by the following:
Heartland Share Purchase and Subscription Agreement
Upon exercise of the Heartland Option, the parties will enter into a Share Purchase and Subscription Agreement (the “Heartland Share Purchase”) by and among HPRM LLC, a DelawareAlabama limited liability company which entitythat was formed as a special purpose vehicle (“Heartland SPV”), Vertex Operating, Tensile-Heartland, and solelyorganized on September 7, 2016, for the purposespurpose of purchasing, storing, selling, and distributing refined motor fuels. These activities include the wholesale distribution of gasoline, blended gasoline, and diesel for use as engine fuel to operate automobiles, trucks, locomotives, and construction equipment. Crystal markets its products to third-party customers, and customers will typically resell these products to retailers, end use consumers, and others. These assets are used in our Refining division.
Marrero Refinery Fire
On October 7, 2020, we had a guaranty,fire at our Marrero refinery which took the Company.
Prior to entering intofacility offline for repairs for about two weeks. The refinery suffered some minor structural damage along with piping, valves and instrumentation in the Heartland Share Purchase, the Company will transfer 100%immediate area of the ownership of Vertex Refining OH, LLC, its indirect wholly-owned subsidiary (“Vertex OH”) to Heartland SPV in consideration for 13,500 Class A Units, 13,500 Class A-1 Preferred Units and 11,300 Class B Units of Heartland SPV and immediately thereafter contribute 248 Class B Unitsfire, the largest impact was the damage to the Company’s wholly-owned subsidiary, Vertex Splitter, Inc., a Delaware corporation (“Vertex Splitter”), as a contribution to capital.
Vertex OH ownselectrical conduit that feeds the Company’s Columbus, Ohio, Heartland facility, which produces a base oil product that is sold to lubricant packagers and distributors.
Pursuantpower to the Heartland Share Purchase, Vertex Operating will sell Tensile-Heartlandrefinery equipment. As of October 26, 2020, the 13,500 Class A Unitsfacility was back up and 13,500 Class A-1 Preferred Unitsrunning and in the process of Heartland SPV in consideration for $13.5 million (less the amount of the indebtedness of Heartland SPVfiling a claim with our insurance company. The Company believes that exceeds $5 million at the time of closing). The Heartland Share Purchase also includes a true-up, based on an agreed calculation of how much the actual value of Heartland SPV exceeds, or is less than, $24.8 million, pursuant to which the number of Class B Units in Heartland SPV held by Vertex Operating will be adjusted up or down. Also, at the closing of the Heartland Share Purchase, Tensile-Heartland will purchase 7,500 Class A Units and 7,500 Class A-1 Units in consideration for $7.5 million (less the expenses of Tensile-Heartland in connection with the transaction) directly from Heartland SPV.it maintains adequate insurance coverage.
Assuming the Heartland Closing occurs, the $7.5 million purchase amount and future free cash flows from the operation of Heartland SPV are planned to be available for investments at the Heartland facility to increase self-collections, maximize the throughput of the refinery, enhance the quality of the output and complete other projects.
The Heartland Share Purchase also provides that at the Heartland Closing, the Company will purchase or cause one of its affiliates to purchase 1,000 newly issued Class A Units from MG SPV at a cost of $1,000 per unit ($1 million in aggregate) and that Tensile-Heartland has the option, at its election, any time after the Heartland Closing, subject to the terms of the Heartland Share
Purchase, to purchase up to an additional 7,000 Class A-2 Preferred Units at a cost of $1,000 per Class A-2 Preferred Unit from Heartland SPV.
RESULTS OF OPERATIONS FOR THE THREE MONTHS ENDED SEPTEMBER 30, 20192020 COMPARED TO THE THREE MONTHS ENDED SEPTEMBER 30, 20182019
Set forth below are our results of operations for the three months ended September 30, 20192020 as compared to the same period in 2018.2019.
| | | | | | | | | | | | | | | | | | | | | | | |
| Three Months Ended September 30, | | $ Change - Favorable (Unfavorable) | | % Change - Favorable (Unfavorable) |
| 2020 | | 2019 |
| Revenues | $ | 37,383,632 | | | $ | 37,799,259 | | | $ | (415,627) | | | (1) | % |
| Cost of revenues (exclusive of depreciation and amortization shown separately below) | 31,186,684 | | | 32,372,316 | | | 1,185,632 | | | 4 | % |
| Depreciation and amortization attributable to costs of revenues | 1,313,162 | | | 1,359,629 | | | 46,467 | | | 3 | % |
| Gross profit | 4,883,786 | | | 4,067,314 | | | 816,472 | | | 20 | % |
| | | | | | | |
| | | | | | | |
| | | | | | | |
| Operating expenses: | | | | | | | |
| Selling, general and administrative expenses | 6,241,570 | | | 6,153,184 | | | (88,386) | | | (1) | % |
| Depreciation and amortization attributable to operating expenses | 482,869 | | | 455,953 | | | (26,916) | | | (6) | % |
| | | | | | | |
| Total operating expenses | 6,724,439 | | | 6,609,137 | | | (115,302) | | | (2) | % |
| | | | | | | |
| | | | | | | |
| Loss from operations | (1,840,653) | | | (2,541,823) | | | 701,170 | | | 28 | % |
| | | | | | | |
| Other income (expense): | | | | | | | |
| | | | | | | |
| | | | | | | |
| | | | | | | |
| Other income | 1 | | | 918,153 | | | (918,152) | | | (100) | % |
| Gain (loss) on asset sales | (136,434) | | | — | | | (136,434) | | | (100) | % |
| Gain (loss) on change in value of derivative liability | 256,587 | | | 1,290,792 | | | (1,034,205) | | | (80) | % |
| | | | | | | |
| Interest expense | (234,671) | | | (826,005) | | | 591,334 | | | 72 | % |
| Total other income (expense) | (114,517) | | | 1,382,940 | | | (1,497,457) | | | (108) | % |
| | | | | | | |
| Loss before income tax | (1,955,170) | | | (1,158,883) | | | (796,287) | | | (69) | % |
| | | | | | | |
| Income tax benefit (expense) | — | | | — | | | — | | | — | % |
| | | | | | | |
| Net Loss | (1,955,170) | | | (1,158,883) | | | (796,287) | | | (69) | % |
| Net income (loss) attributable to non-controlling interest and redeemable non-controlling interest | 480,215 | | | (67,102) | | | 547,317 | | | 816 | % |
| Net loss attributable to Vertex Energy, Inc. | $ | (2,435,385) | | | $ | (1,091,781) | | | $ | (1,343,604) | | | (123) | % |
| | | | | | | |
| | | | | | | |
| | | | | | | |
|
| | | | | | | | | | | | | | |
| | Three Months Ended September 30, | | $ Change - Favorable (Unfavorable) | | % Change - Favorable (Unfavorable) |
| | 2019 | | 2018 |
| Revenues | $ | 37,799,259 |
| | $ | 50,632,948 |
| | $ | (12,833,689 | ) | | (25 | )% |
| Cost of revenues (exclusive of depreciation and amortization shown separately below) | 32,372,316 |
| | 42,593,367 |
| | 10,221,051 |
| | 24 | % |
| Gross profit | 5,426,943 |
| | 8,039,581 |
| | (2,612,638 | ) | | (32 | )% |
| | | | | | | | |
| Selling, general and administrative expenses | 6,153,184 |
| | 5,658,659 |
| | (494,525 | ) | | (9 | )% |
| Depreciation and amortization | 1,815,582 |
| | 1,806,839 |
| | (8,743 | ) | | — | % |
| Total operating expenses | 7,968,766 |
| | 7,465,498 |
| | (503,268 | ) | | (7 | )% |
| | | | | | | | |
| Income (loss) from operations | (2,541,823 | ) | | 574,083 |
| | (3,115,906 | ) | | (543 | )% |
| | | | | | | | |
| Other income (expense): | | | | | | | |
| Interest income | 918,153 |
| | — |
| | 918,153 |
| | 100 | % |
| Gain (loss) on change in value of derivative liability | 1,290,792 |
| | (2,169,133 | ) | | 3,459,925 |
| | 160 | % |
| Interest expense | (826,005 | ) | | (798,800 | ) | | (27,205 | ) | | (3 | )% |
| Total other income (expense) | 1,382,940 |
| | (2,967,933 | ) | | 4,350,873 |
| | 147 | % |
| | | | | | | |
|
|
| Loss before income tax | (1,158,883 | ) | | (2,393,850 | ) | | 1,234,967 |
| | 52 | % |
| | | | | | | | |
| Income tax benefit (expense) | — |
| | — |
| | — |
| | — | % |
| | | | | | | | |
| Net loss | (1,158,883 | ) | | (2,393,850 | ) | | 1,234,967 |
| | 52 | % |
| Net loss attributable to non-controlling interest and redeemable non-controlling interest | (67,102 | ) | | (105,970 | ) | | 38,868 |
| | 37 | % |
| Net loss attributable to Vertex Energy, Inc. | $ | (1,091,781 | ) | | $ | (2,287,880 | ) | | $ | 1,196,099 |
| | 52 | % |
| | | | | | | | |
Our revenues and cost of revenues are significantly impacted by fluctuations in commodity prices; increases in commodity prices typically result in increases in revenue and cost of revenues.revenues (i.e., feedstock acquisition costs). Our gross profit is to a large extent a function of the market discount we are able to obtain in purchasing feedstock, as well as how efficiently management conducts operations.
Total revenues decreased by 25% Additionally, we use hedging instruments to manage our exposure to underlying commodity prices. During the three months ended September 30, 2020, we had a gain of $5 thousand in our hedging instruments as compare to a loss of $1.6 million for the three months ended September 30, 2019,2019. We recognize our hedging activities from commodity derivatives in our cost of goods sold. During the three months ended September 30, 2020, compared to the same period in 2018,2019, we saw a 10% decrease in the discount we were paying for feedstock into our refineries. In addition, we saw a 3% decrease in operating costs (inclusive of depreciation and amortization) on a per barrel basis for the third quarter of 2020 as compared to the same period in 2019.
Total revenues decreased by 1% for the three months ended September 30, 2020, compared to the same period in 2019, due primarily to lower commodity prices and decreased volumes at our refineries, specificallyrefineries; offset by the $17 million of revenue generated in from our Marrero facility duringnewly acquired Crystal opertations for the three months ended September 30, 2019,2020, compared to the same period in 2018.2019. Total volume decreasedincreased 1% during the three months ended September 30, 20192020 compared to the same period in 2018.2019. Volumes were impacted as a result of weather delaysdecreased availability of feedstocks, specifically used motor oil, in the overall marketplace which forced us
to have reduced production rates at each of our facilities. This decrease was largely due to continued impacts of the shelter in place orders in the locations in which we collect used motor oil as a result of the COVID-19 pandemic, which directly impacted the generation of used oil, which caused a reduction in volumes of feedstock available for use in our refineries. The Company saw an increase in the volume of Group III base oil during the three months ended September 30, 2020. Gross profit increased by 20% for the three months ended September 30, 2020, compared to the three months ended September 30, 2019. This increase was largely a result of lower operating costs at our Marrero facility during our turnaroundfacilities relating to decreased transportation expenses, maintenance and contract labor, which had an impact on margins during the quarter. Gross profit decreased by 32%period, and the increases in volumes as noted above.
During the three months ended September 30, 2020, total cost of revenues (exclusive of depreciation and amortization) was $31,186,684, compared to $32,372,316 for the three months ended September 30, 2019, a decrease of $1,185,632 or 4% from the prior period. The main reason for the decrease was the result of a decline in commodity prices, which impacted our feedstock pricing and a decrease in overall operating costs at our refining facilities.
For the three months ended September 30, 2020, total depreciation and amortization expense attributable to cost of revenues was $1,313,162, compared to $1,359,629 for the three months ended September 30, 2019, a decrease of $46,417 mainly due to some of our assets becoming fully depreciated.
We had gross profit as a percentage of revenue of 13% for the three months ended September 30, 2020, compared to gross profit as a percentage of revenues of 10.7% for the three months ended September 30, 2019. The main reason for the improvement was the slight increase in volumes, along with decreases in operating expenses at our refineries during the period. In addition, the company was proactive in its risk management of commodity prices through the use of derivative instruments which resulted in a $1.6 million positive impact on gross margins when compared to the same period a year ago.
Additionally, our per barrel margin increased 19% for the three months ended September 30, 2020, relative to the three months ended September 30, 2019. Our per barrel margin is calculated by dividing the total volume of product sold (in bbls) by total gross profit for the applicable period ($4,883,786 for the 2020 period versus $4,067,314 for the 2019 period). This increase was a result of the improvements in our product spreads related to decreases in feedstock product prices and decreases in operating costs at our refining facilities, during the three months ended September 30, 2020, compared to the same period during 2019.
Overall, commodity prices were down for the three months ended September 30, 2020, compared to the same period in 2019. For example, the average posting (U.S. Gulfcoast Residual Fuel No. 6 3%) for the three months ended September 30, 2020, decreased $13.62 per barrel from a three-month average of $51.56 for the three months ended September 30, 2019 to $37.95 per barrel for the three months ended September 30, 2020. The average posting (U.S. Gulfcoast Unleaded 87 Waterborne) for the three months ended September 30, 2020 decreased $22.74 per barrel from a three-month average of $72.97 for the three months ended September 30, 2019 to $50.22 per barrel for the three months ended September 30, 2020.
We had a loss from operations of $1,840,653 for the three months ended September 30, 2020, compared to a loss from operations of $2,541,823 for the three months ended September 30, 2019, a decrease of $701,170 or 28% from the prior year’s three-month period. The decrease in loss from operations was due to the overall reduction in operating expenses at our facilities along with increases in charges throughout our collection operations. As market conditions change, the charges for our oil collection services will fluctuate.
We had interest expense of $234,671 for the three months ended September 30, 2020, compared to interest expense of $826,005 for the three months ended September 30, 2019, a decrease in interest expense of $591,334 or 72% from the prior period, due to having a lower balance owed under our line of credit and term loan along with a lower interest rate on the term debt outstanding during the three months ended September 30, 2020, compared to the prior year’s period. The Company received a total of $21.0 million from the Tensile transaction, of which approximately $9.0 million was used to pay down our debt obligations.
We had a $256,587 gain on change in value of derivative liability for the three months ended September 30, 2020, in connection with certain warrants granted in June 2015 and May 2016, as described in greater detail in "Note 9. Preferred Stock and Detachable Warrants" to the unaudited consolidated financial statements included herein under "Part I"-"Item 1 Financial Statements", compared to a gain on change in the value of our derivative liability of $1,290,792 in the prior year's period. This change was mainly due to the fluctuation in the market price of our common stock and non-cash accounting adjustments in connection therewith. This resulted in a significant change in non-cash expense for the period, compared to the prior year’s period.
We had other income of $1 for the three months ended September 30, 2020, compared to other income of $918,153 for the three months ended September 30, 2019. Other income for the three months ended September 30, 2019, was in connection with the Company receiving a payment of $ 907,500 related to the proceeds of an insurance settlement for a fire that had occurred at its used
oil re-refining plant located in Churchill County, Nevada, which we previously rented. The Company previously determined this loan was uncollectible and wrote it off.
We had a loss on asset sales of $136,434 for the three months ended September 30, 2020, in connection with sale of equipment compared to no gain or loss on asset sales in the prior year’s period.
We had a net loss of $1,955,170 for the three months ended September 30, 2020, compared to a net loss of $1,158,883 for the three months ended September 30, 2019, an increase in net loss of $796,287 or 69% from the prior period. The main reason for the increase in net loss for the three months ended September 30, 2020, compared to the three months ended September 30, 2018. This2019, was attributable to the decrease was a result of revenue decline, due to finished product prices, decreases in volumes at our Marrero facility, lower production and increased operating costs at our refineries and our metals facilities.
Additionally, our per barrel margin decreased 32%gain in derivative liability for the three months ended September 30, 2019, relative2020, which decreased to $256,587 for such period, compared to $1,290,792 for the three months ended September 30, 2018. This decrease was a result of the decline in our product spreads related to decreases in finished product prices, as well as increased operating costs at our refineries as well as our Gulf Coast operations, related to our metals business, during the three monthsperiod ended September 30, 2019, compared tooffset by the same period during 2018. The 24% decrease$816,472 increase in cost of revenues for thegross profit as discussed above.
three months ended September 30, 2019, compared to the three months ended September 30, 2018, is mainly a result of the lower production volumes at our Marrero facility during the period, as well as certain overhead operating expenses during the period.
Each of our segments’ income (loss) from operations during the three months ended September 30, 20192020 and 20182019 was as follows:
| | | | | | | | | | | | | | | | | | | | | | | |
| Three Months Ended
September 30, | | $ Change - Favorable (Unfavorable) | | % Change - Favorable (Unfavorable) |
| Black Oil Segment | 2020 | | 2019 |
| Revenues | $ | 19,988,122 | | | $ | 32,330,531 | | | $ | (12,342,409) | | | (38) | % |
| Cost of revenues (exclusive of depreciation and amortization shown separately below) | 14,687,141 | | | 27,663,983 | | | 12,976,842 | | | 47 | % |
| Depreciation and amortization attributable to costs of revenues | 1,041,719 | | | 1,073,520 | | | 31,801 | | | 3 | % |
| | | | | | | |
| Gross profit | 4,259,262 | | | 3,593,028 | | | 666,234 | | | 19 | % |
| Selling general and administrative expense | 4,899,956 | | | 5,040,772 | | | 140,816 | | | 3 | % |
| Depreciation and amortization attributable to operating expenses | 390,105 | | | 335,105 | | | (55,000) | | | (16) | % |
| | | | | | | |
| Loss from operations | $ | (1,030,799) | | | $ | (1,782,849) | | | $ | 752,050 | | | 42 | % |
| | | | | | | |
| | | | | | | |
| | | | | | | |
| | | | | | | |
| | | | | | | |
| | | | | | | |
| Refining and Marketing Segment | | | | | | | |
| Revenues | $ | 13,501,749 | | | $ | 3,076,454 | | | $ | 10,425,295 | | | 339 | % |
| Cost of revenues (exclusive of depreciation and amortization shown separately below) | 13,217,757 | | | 2,511,314 | | | (10,706,443) | | | (426) | % |
| Depreciation and amortization attributable to costs of revenues | 121,744 | | | 147,658 | | | 25,914 | | | 18 | % |
| Gross profit | 162,248 | | | 417,482 | | | (255,234) | | | (61) | % |
| Selling general and administrative expense | 696,611 | | | 494,781 | | | (201,830) | | | (41) | % |
| Depreciation and amortization attributable to operating expenses | 72,314 | | | 100,398 | | | 28,084 | | | 28 | % |
| Loss from operations | $ | (606,677) | | | $ | (177,697) | | | $ | (428,980) | | | (241) | % |
| | | | | | | |
| | | | | | | |
| | | | | | | |
| | | | | | | |
| | | | | | | |
| | | | | | | |
| Recovery Segment | | | | | | | |
| Revenues | $ | 3,893,761 | | | $ | 2,392,274 | | | $ | 1,501,487 | | | 63 | % |
| Cost of revenues (exclusive of depreciation and amortization shown separately below) | 3,281,786 | | | 2,197,019 | | | (1,084,767) | | | (49) | % |
| Depreciation and amortization attributable to costs of revenues | 149,699 | | | 138,451 | | | (11,248) | | | (8) | % |
| Gross profit | 462,276 | | | 56,804 | | | 405,472 | | | 714 | % |
| Selling general and administrative expense | 645,003 | | | 617,631 | | | (27,372) | | | (4) | % |
| Depreciation and amortization attributable to operating expenses | 20,450 | | | 20,450 | | | — | | | — | % |
| Loss from operations | $ | (203,177) | | | $ | (581,277) | | | $ | 378,100 | | | 65 | % |
| | | | | | | |
| | | | | | | |
| | | | | | | |
| | | | | | | |
| | | | | | | |
|
| | | | | | | | | | | | | | |
| Three Months Ended
September 30, |
| $ Change - Favorable (Unfavorable) | | % Change - Favorable (Unfavorable) |
| Black Oil Segment | 2019 |
| 2018 |
| Total revenue | $ | 32,330,531 |
| | $ | 40,400,064 |
|
| $ | (8,069,533 | ) | | (20 | )% |
| Total cost of revenue (exclusive of depreciation and amortization shown separately below) | 27,663,983 |
|
| 32,550,126 |
|
| 4,886,143 |
| | 15 | % |
| Gross profit | 4,666,548 |
|
| 7,849,938 |
|
| (3,183,390 | ) | | (41 | )% |
| Selling general and administrative expense | 5,040,772 |
| | 4,732,453 |
| | (308,319 | ) | | (7 | )% |
| Depreciation and amortization | 1,408,625 |
| | 1,348,046 |
| | (60,579 | ) | | (4 | )% |
| Income (loss) from operations | $ | (1,782,849 | ) | | $ | 1,769,439 |
| | $ | (3,552,288 | ) | | (201 | )% |
| | | | | | | | |
| Refining and Marketing Segment |
|
|
|
|
|
|
|
| |
|
|
| Total revenue | $ | 3,076,454 |
| | $ | 7,313,630 |
|
| $ | (4,237,176 | ) | | (58 | )% |
| Total cost of revenue (exclusive of depreciation and amortization shown separately below) | 2,511,314 |
| | 7,044,218 |
|
| 4,532,904 |
| | 64 | % |
| Gross profit | 565,140 |
|
| 269,412 |
|
| 295,728 |
| | 110 | % |
| Selling general and administrative expense | 494,781 |
| | 431,969 |
| | (62,812 | ) | | (15 | )% |
| Depreciation and amortization | 248,056 |
| | 255,925 |
| | 7,869 |
| | 3 | % |
| Loss from operations | $ | (177,697 | ) | | $ | (418,482 | ) | | $ | 240,785 |
| | 58 | % |
| | | | | | | | |
| Recovery Segment |
|
|
|
|
|
|
|
| |
|
|
| Total revenue | $ | 2,392,274 |
| | $ | 2,919,254 |
|
| $ | (526,980 | ) | | (18 | )% |
| Total cost of revenue (exclusive of depreciation and amortization shown separately below) | 2,197,019 |
| | 2,999,023 |
|
| 802,004 |
| | 27 | % |
| Gross profit (loss) | 195,255 |
|
| (79,769 | ) |
| 275,024 |
| | 345 | % |
| Selling general and administrative expense | 617,631 |
| | 494,237 |
| | (123,394 | ) | | (25 | )% |
| Depreciation and amortization | 158,901 |
| | 202,868 |
| | 43,967 |
| | 22 | % |
| Loss from operations | $ | (581,277 | ) | | $ | (776,874 | ) | | $ | 195,597 |
| | 25 | % |
14
Our Black Oil division'ssegment generated revenues of $19,988,122 for the three months ended September 30, 2020, with cost of revenues (exclusive of depreciation and amortization) of $14,687,141, and depreciation and amortization attributable to cost of revenues of $1,041,719. During the three months ended September 30, 2019, these revenues were $32,330,531 with cost of revenues (exclusive of depreciation and amortization) of $27,663,983 and depreciation and amortization attributable to cost of revenues of $1,073,520. Loss from operations improved for the three months ended September 30, 2020, compared to 2019, as a result of improvements in operating expenses through our various facilities as well as by diligent management of our street collections and pricing.
Our Black Oil segment's volume decreased approximately 5%6% during the three months ended September 30, 20192020, compared to the same period in 2018.2019. This decrease was largely due to extended downtimecontinued impacts of the shelter in place orders in the locations in which we experienced atcollect used motor oil as a result of the COVID-19 pandemic, which directly impacted the generation of used oil, which caused a reduction in volumes of feedstock available for use in our Marrero facility during our turn around which wasrefineries. In addition, we were impacted in the Gulf Coast region by weather delays including those caused by Hurricane Barry, which severely disrupted planned maintenance at the Marrero, Louisiana refinery during July 2019. High winds and flooding resultingexperienced from the hurricane extendedvarious hurricanes in the planned maintenance at the Marrero facility by 8 days, to 21 days, resulting in higher turnaround costs and lower than anticipated production levels at the refineryregion during the quarter.period. The Heartland facility experienced lower demands for finished products during the three months ended September 30, 2020 compared to the same period in 2019. Volumes collected through our H&H Oil, L.P. (“H&H Oil”)(based (based in Houston, Austin and Corpus Christi, Texas) and Heartland (based in Ohio and West Virginia) collection facilities increased 25%5% during the three months ended September 30, 20192020, compared to the same period in 2018.2019. One of our key initiatives continues to be a focus on growing our own volumes of collected material and displacing the third-party oil processed in our facilities. We started to see improvements in our collection volumes at the end of the period.
Overall volumes During the three months ended September 30, 2020, our Refining and Marketing cost of product sold decreased 1%revenues (exclusive of depreciation and amortization) were $13,217,757, of which the processing costs for our Refining and Marketing business located at KMTEX were $328,225, and depreciation and amortization attributable to cost of revenues was $121,744. Revenues for the same period were $13,501,749. During the three months ended September 30, 2019, versusour Refining and Marketing cost of revenues (exclusive of depreciation and amortization) were $2,511,314, which included the processing costs at KMTEX of $434,046, and depreciation and amortization attributable to cost of revenues was $147,658. Revenues for the same period were $3,076,454.
Our Refining segment includes the business operations of our Refining and Marketing operations, as well as our newly acquired assets from Crystal. With the acquisition of the Crystal assets, we now operate as a wholesale distributer of motor fuels which include gasoline, blended gasoline and diesel. Revenues in 2018.
Overall, commodity pricesthe Refining division were down forup 339% during the three months ended September 30, 2019,2020, as compared to the same period in 2018. For example,2019 mostly as a result of the average posting (U.S. Gulfcoast Residual Fuel No. 6 3%) for the three months ended September 30, 2019 decreased $14.23 per barrel from a three month average of $65.79 for the three months ended September 30, 2018 to $51.56 per barrel for the
three months ended September 30, 2019. The average posting (U.S. Gulfcoast Unleaded 87 Waterborne) for the three months ended September 30, 2019 decreased $13.24 per barrel from a three month average of $86.21 for the three months ended September 30, 2018 to $72.97 per barrel for the three months ended September 30, 2019.
added business line. Overall volume for the Refining and Marketing division decreased 51%21% during the three months ended September 30, 20192020, as compared to the same period in 2018.2019. This is a result of a focus on the production of higher quality finished products, which in turn has decreased the amount of volume being produced. In addition, volumes were slightly impacted as a result of 'stay-at-home' orders during the period. Our fuel oil cutterpygas volumes decreased 78%24% for the three months ended September 30, 2019,2020, as compared to the same period in 2018.2019. Our pygasfuel oil cutter volumes decreased 21%10% for the three months ended September 30, 20192020, as compared to the same period in 2018. Our gasoline blendstock volumes decreased 100% for the three months ended September 30, 2019, as compared to the same period in 2018, due to lower volumes of feedstock available from third party facilities in the fact that we are no longer processing gasoline blendstocks in this divisionGulf coast region as the processing margins were no longer economically feasible. The lower margins were a result of decreases in available feedstock volumes.weather delays. We have also had to assess the volume of fuel oil cutterstocks that we manage due to enhanced quality of products being demanded in the marketplace.
Our Recovery segment generated revenues of $3,893,761 for the three months ended September 30, 2020, with cost of revenues (exclusive of depreciation and amortization) of $3,281,786, and depreciation and amortization attributable to cost of revenues of $149,699. During the three months ended September 30, 2019, these revenues were $2,392,274 with cost of revenues (exclusive of depreciation and amortization) of $2,197,019, and depreciation and amortization attributable to cost of revenues of $138,451. Income from operations increased for the three months ended September 30, 2020, compared to 2019, as a result of increased volumes attributable to our Recovery division and margins related thereto, through our various facilities.
Our Recovery divisionsegment includes the business operations of Vertex Recovery Management.Management as well as our Group III base oil business. Vertex acts as Penthol C.V. of the Netherlands aka Penthol LLC's (a Penthol subsidiary in the United States) (“Penthol’s”) exclusive agent to provide marketing, sales, and logistical duties of Group III base oil from the United Arab Emirates to the United States. Revenues for this division decreased 18%increased 63% as a result of a decreasean increase in steel volumes and commodity prices, during the three months ended September 30, 2019,2020, compared to the same period in 2018.2019. Volumes of petroleum products acquiredwere up in our Recovery business were up 28%metals division during the three months ended September 30, 2019,2020, compared to the same period during 2018, we continue2019, due to focus on volume growth in this division.certain one-time projects. This division periodically participates in project work that is not ongoing thus we expect to see fluctuations in revenue and gross profit from this division from period to period.
We had selling, general, and administrative expenses of $6,153,184 for the three months ended September 30, 2019, compared to $5,658,659 of selling, general, and administrative expenses for the prior year’s period, an increase of $494,525 from the prior period, mainly due to the additional selling, general and administrative expenses incurred during the period as a result of increased personnel costs, legal expense, and insurance expense related to the expansion of trucking operations and facilities through organic growth, as well as increased accounting, legal and consulting expenses related to our Tensile transaction.
We had loss from operations of $2,541,823 for the three months ended September 30, 2019, compared to income from operations of $574,083 for the three months ended September 30, 2018, a decrease of $3,115,906 or 543% from the prior year’s three-month period. The decrease was due to a decrease in revenues resulting from a decrease in production at our Marrero facility as noted previously and increased operating costs at our refineries and metals operations, along with the increased selling, general and administrative expenses discussed above.
We had interest expense of $826,005 for the three months ended September 30, 2019, compared to interest expense of $798,800 for the three months ended September 30, 2018, an increase in interest expense of $27,205 or 3% from the prior period, due to a higher interest rate on the term debt outstanding during the three months ended September 30, 2019.
We had a $1,290,792 gain on change in value of derivative liability for the three months ended September 30, 2019, in connection with certain warrants granted in June 2015 and May 2016, as described in greater detail in "Note 9. Preferred Stock and Detachable Warrants" to the unaudited consolidated financial statements included herein under "Part I"-"Item 1 Financial Statements", compared to a loss on change in the value of our derivative liability of $2,169,133 in the prior year's period. This change was mainly due to fluctuation in the market price of our common stock. This resulted in a significant non-cash benefit for the period.
We had a net loss of $1,158,883 for the three months ended September 30, 2019, compared to net loss of $2,393,850 for the three months ended September 30, 2018, a decrease in net loss of $1,234,967 or 52% from the prior period, which was a result of the factors described above. The majority of our net loss for the three months ended September 30, 2019, was attributable to the decline in market conditions around our metals business, a reduction in volumes at our Marrero facility and commodity price reductions, along with increased operational costs.
During the three months ended September 30, 2019 and 2018, the processing costs for our Refining and Marketing division located at KMTEX were $434,046 and $631,261, respectively.
RESULTS OF OPERATIONS FOR THE NINE MONTHS ENDED SEPTEMBER 30, 20192020 COMPARED TO THE NINE MONTHS ENDED SEPTEMBER 30, 20182019
Set forth below are our results of operations for the nine months ended September 30, 20192020 as compared to the same period in 2018.2019.
| | | | | | | | | | | | | | | | | | | | | | | | | | | | | |
| | | Nine Months Ended September 30, | | $ Change - Favorable (Unfavorable) | | % Change - Favorable (Unfavorable) | |
| | | 2020 | | 2019 |
| Revenues | | $ | 94,961,188 | | | $ | 120,777,263 | | | $ | (25,816,075) | | | (21) | % | |
| Cost of revenues (exclusive of depreciation and amortization shown separately below) | | 80,221,343 | | | 103,732,086 | | | 23,510,743 | | | 23 | % | |
| Depreciation and amortization attributable to costs of revenues | | 3,731,320 | | | 3,965,626 | | | 234,306 | | | 6 | % | |
| Gross Profit | | 11,008,525 | | | 13,079,551 | | | (2,071,026) | | | (16) | % | |
| | | | | | | | | |
| | | | | | | | | |
| Operating expenses: | | | | | | | | | |
| Selling, general and administrative expenses | | 18,972,648 | | | 17,529,784 | | | (1,442,864) | | | (8) | % | |
| Depreciation and amortization attributable to operating expenses | | 1,412,719 | | | 1,367,859 | | | (44,860) | | | (3) | % | |
| | | | | | | | | |
| Total operating expenses | | 20,385,367 | | | 18,897,643 | | | (1,487,724) | | | (8) | % | |
| Loss from operations | | (9,376,842) | | | (5,818,092) | | | (3,558,750) | | | (61) | % | |
| | | | | | | | | |
| | | | | | | | | |
| | | | | | | | | |
| | | | | | | | | |
| | | | | | | | | |
| Other income (expense): | | | | | | | | | |
| Other Income | | 101 | | | 920,071 | | | (919,970) | | | (100) | % | |
| | | | | | | | | |
| Gain (loss) on sale of assets | | (124,090) | | | 31,443 | | | (155,533) | | | (495) | % | |
| Gain (loss) on change in value of derivative liability | | 1,844,369 | | | 331,715 | | | 1,512,654 | | | 456 | % | |
| | | | | | | | | |
| Interest expense | | (796,930) | | | (2,322,780) | | | 1,525,850 | | | 66 | % | |
| Total other income (expense) | | 923,450 | | | (1,039,551) | | | 1,963,001 | | | 189 | % | |
| | | | | | | | | |
| Loss before income taxes | | (8,453,392) | | | (6,857,643) | | | (1,595,749) | | | (23) | % | |
| | | | | | | | | |
| Income tax (expense) benefit | | — | | | — | | | — | | | — | % | |
| | | | | | | | | |
| Net loss | | (8,453,392) | | | (6,857,643) | | | (1,595,749) | | | (23) | % | |
| Net income (loss) attributable to non-controlling interest and redeemable non-controlling interest | | 190,771 | | | (374,862) | | | 565,633 | | | 151 | % | |
| Net loss attributable to Vertex Energy, Inc. | | $ | (8,644,163) | | | $ | (6,482,781) | | | $ | (2,161,382) | | | (33) | % | |
|
| | | | | | | | | | | | | | | | |
| | | Nine Months Ended September 30, | | $ Change - Favorable (Unfavorable) | | % Change - Favorable (Unfavorable) | |
| | | 2019 | | 2018 |
| Revenues | | $ | 120,777,263 |
| | $ | 138,918,913 |
| | $ | (18,141,650 | ) | | (13 | )% | |
| Cost of Revenues (exclusive of depreciation shown separately below) | | 103,732,086 |
| | 114,434,776 |
| | 10,702,690 |
| | 9 | % | |
| Gross Profit | | 17,045,177 |
| | 24,484,137 |
| | (7,438,960 | ) | | (30 | )% | |
| Selling, general and administrative expenses | | 17,529,784 |
| | 16,668,692 |
| | (861,092 | ) | | (5 | )% | |
| Depreciation and amortization | | 5,333,485 |
| | 5,234,014 |
| | (99,471 | ) | | (2 | )% | |
| Income (loss) from operations | | (5,818,092 | ) | | 2,581,431 |
| | (8,399,523 | ) | | (325 | )% | |
| Interest Income | | 920,071 |
| | 659 |
| | 919,412 |
| | 139,516 | % | |
| Gain (loss) on sale of assets | | 31,443 |
| | 51,523 |
| | (20,080 | ) | | (39 | )% | |
| Gain (loss) on change in value of derivative liability | | 331,715 |
| | (2,124,971 | ) | | 2,456,686 |
| | 116 | % | |
| Interest expense | | (2,322,780 | ) | | (2,448,771 | ) | | 125,991 |
| | 5 | % | |
| Total other income (expense) | | (1,039,551 | ) | | (4,521,560 | ) | | 3,482,009 |
| | 77 | % | |
| Loss before income taxes | | (6,857,643 | ) | | (1,940,129 | ) | | (4,917,514 | ) | | (253 | )% | |
| Income tax (expense) benefit | | — |
| | — |
| | — |
| | — | % | |
| Net loss | | (6,857,643 | ) | | (1,940,129 | ) | | (4,917,514 | ) | | (253 | )% | |
| Net loss attributable to non-controlling interest and redeemable non-controlling interest | | (374,862 | ) | | 76,305 |
| | (451,167 | ) | | (591 | )% | |
| Net loss attributable to Vertex Energy, Inc. | | $ | (6,482,781 | ) | | $ | (2,016,434 | ) | | $ | (4,466,347 | ) | | (221 | )% | |
Each of our segments’ gross profit (loss) during the nine months ended September 30, 2019 and 2018 was as follows:
|
| | | | | | | | | | | | | | | | |
| | | Nine Months Ended September 30, | | $ Change - Favorable (Unfavorable) | | % Change - Favorable (Unfavorable) | |
| Black Oil Segment | | 2019 | | 2018 |
| Total revenue | | $ | 103,053,529 |
| | $ | 111,106,441 |
| | $ | (8,052,912 | ) | | (7 | )% | |
| Total cost of revenue (exclusive of depreciation and amortization shown separately below) | | 88,374,446 |
| | 89,244,032 |
| | 869,586 |
| | 1 | % | |
| Gross profit | | 14,679,083 |
| | 21,862,409 |
| | (7,183,326 | ) | | (33 | )% | |
| Selling, general and administrative expense | | 14,500,306 |
| | 13,909,868 |
| | (590,438 | ) | | (4 | )% | |
| Depreciation and amortization | | 4,127,979 |
| | 3,972,922 |
| | (155,057 | ) | | (4 | )% | |
| Income (loss) from operations | | $ | (3,949,202 | ) | | $ | 3,979,619 |
| | $ | (7,928,821 | ) | | (199 | )% | |
| | | | | | | | | | |
| Refining Segment | | |
| | |
| | |
| | |
| |
| Total revenue | | $ | 9,212,477 |
| | $ | 17,381,741 |
| | $ | (8,169,264 | ) | | (47 | )% | |
| Total cost of revenue (exclusive of depreciation and amortization shown separately below) | | 7,767,882 |
| | 16,318,259 |
| | 8,550,377 |
| | 52 | % | |
| Gross profit | | 1,444,595 |
| | 1,063,482 |
| | 381,113 |
| | 36 | % | |
| Selling, general and administrative expense | | 1,424,572 |
| | 1,416,927 |
| | (7,645 | ) | | (1 | )% | |
| Depreciation and amortization | | 733,142 |
| | 766,077 |
| | 32,935 |
| | 4 | % | |
| Loss from operations | | $ | (713,119 | ) | | $ | (1,119,522 | ) | | $ | 406,403 |
| | 36 | % | |
| | | | | | | | | | |
| Recovery Segment | | | | | | | | | |
| Total revenue | | $ | 8,511,257 |
| | $ | 10,430,731 |
| | $ | (1,919,474 | ) | | (18 | )% | |
| Total cost of revenue (exclusive of depreciation and amortization shown separately below) | | 7,589,758 |
| | 8,872,485 |
| | 1,282,727 |
| | 14 | % | |
| Gross profit | | 921,499 |
| | 1,558,246 |
| | (636,747 | ) | | (41 | )% | |
| Selling, general and administrative expense | | 1,604,906 |
| | 1,341,897 |
| | (263,009 | ) | | (20 | )% | |
| Depreciation and amortization | | 472,364 |
| | 495,015 |
| | 22,651 |
| | 5 | % | |
| Loss from operations | | $ | (1,155,771 | ) | | $ | (278,666 | ) | | $ | (877,105 | ) | | (315 | )% | |
Our revenues and cost of revenues are significantly impacted by fluctuations in commodity prices; increases in commodity prices typically result in increases in revenue and cost of revenues.revenues (i.e., feedstock acquisition costs). Additionally, we use hedging instruments to manage our exposure to underlying commodity prices. During the nine months ended September 30, 2020, we had a gain of $4.4 million in our hedging instruments, which lowered our cost of goods sold. As demand for used oil feedstock increases, the prices we are required to pay for such feedstock typically increases as well – i.e., the discount pricing to non-used oil shrinks, which increases our acquisition costs. Our gross profit is to a large extent a function of the market discount we are able to obtain in purchasing feedstock, as well as how efficiently management conducts operations. As demand for used oil feedstock increases, the prices we are required to pay for such feedstock typically increases as well – i.e., the discount pricing to non-used oil shrinks, which increases our acquisition costs.
Our cost of revenues are a function of the ultimate price we are required to pay to acquire feedstocks, how efficient we are in acquiring such feedstocks (which relates to everything from how efficient our collection trucks are in their collection routes to how efficiently we operate our facilities), and the cost of turn-arounds and other maintenance at our facilities.
Total revenues decreased by 13%21% for the nine months ended September 30, 20192020 compared to the same period in 2018,2019, due primarily to lower commodity prices and decreased volumes at our refineries, specifically our Marrero facility, due to weather delay, as discussed above, during the nine months ended September 30, 2019, 2020,
compared to the prior year's period. Total volume was materially unchangeddown 5% during the nine months ended September 30, 2019,2020, compared to the same period in 2018. Gross profit decreased by 30%2019.
During the nine months ended September 30, 2020, total cost of revenues (exclusive of depreciation and amortization) was $80,221,343, compared to $103,732,086 for the nine months ended September 30, 2019, compared toa decrease of $23,510,743 or 23% from the nine months ended September 30, 2018. Thisprior period. The main reason for the decrease was the result of a decline in commodity prices, which impacted our overall revenue decline due to decreases in finished product prices, andfeedstock pricing, a decrease in volumes at our Refining & Marketing division,throughout the business as well as recent efforts in reducing operating costs at our Marrero facility and metals facilities.
Additionally, our per barrel margin decreased 34%11% for the nine months ended September 30, 2019,2020, relative to the nine months ended September 30, 2018,2019, due to increases in our feedstock pricinglower volumes, along with decreases in commodity prices for the finished products we sell during the nine months ended September 30, 2019,2020, compared to the same period during 2018.2019. Our per barrel margin is calculated by dividing the total volume of product sold (in bbls) by total gross profit for the applicable period ($11,008,525 for the 2020 period versus $13,079,551 for the 2019 period). The 9%23% decrease in cost of revenues (exclusive of depreciation and amortization) for the nine months ended September 30, 2019,2020, compared to the nine months ended September 30, 2018,2019, is mainly a result of the decrease in commodity prices, and lower volumes at our refining facilities during the period.period and decreases in operating expenses at our facilities.
Our Black Oil division's volume increased approximately 93% duringVolumes in our street collections were down 2% for the nine months ended September 30, 2019,2020, as compared to the same period in 2018. This increase was due to some trading opportunities earlier2019, and we saw a 10% decrease in the year that allowed us to sell additional volumes. Volumes collected throughdiscount we were paying for feedstock into our H&H Oilrefineries during the period. In addition, we saw an 8% decrease in operating costs (inclusive of depreciation and Heartland collection facilities increased 21% duringamortization) on a per barrel basis for the nine months ended
September 30, 2019,2020, as compared to the same period in 2018.2019. The cost of the oil collected was down 10% and revenue was up 34% from the prior period. The reduction in collection costs is a function of route efficiencies and increased volumes of collections when compared to fixed costs across our collection operations, as well as aggressive price changes on the street. Overall, this provided an additional 15% of gross margin to the business or approximately $2 million, for the nine-month period ended September 30, 2020. These improvements were mostly a result of an improvement in logistic costs for the period, as well as efficiencies in operations of our refineries and reductions in maintenance costs for the period. One of our key initiatives continues to be a focus on growing our own volumes of collected material and displacing the third partythird-party oil processed in our facilities.
Overall volumesFor the nine months ended September 30, 2020, total depreciation and amortization expense attributable to cost of product soldrevenues was unchanged$3,731,320, compared to $3,965,626 for the three months ended September 30, 2019, a decrease of $234,306 mainly due to some of our assets becoming fully depreciated.
We had gross profit as a percentage of revenue of 11.6% for the nine months ended September 30, 2019, versus2020, compared to gross profit as a percentage of revenues of 10.8% for the nine months ended September 30, 2019. The main reason for the improvement was a combination of reduced operating costs along with reduced product pricing on a per barrel basis. In addition, the company was proactive in its risk management of commodity prices through the use of derivative instruments which resulted in a $4.4 million positive impact on gross margins when compared to the same period in 2018. This is an important metric for us as it illustrates our reach into the market.a year ago.
In addition, commodity prices decreased approximately 8%35% for the nine months ended September 30, 2019,2020, compared to the same period in 2018.2019. For example, the average posting (U.S. Gulfcoast No. 2 Waterbone) for the nine months ended September 30, 2019,2020, decreased $6.07$24.92 per barrel from a nine monthnine-month average of $82.79$58.35 for the nine months ended September 30, 2018,2019, to $76.72$33.43 per barrel for the nine months ended September 30, 2020.
We had selling, general, and administrative expenses of $18,972,648 for the nine months ended September 30, 2020, compared to $17,529,784 of selling, general, and administrative expenses for the prior year's period, an increase of $1,442,864 or 8%. This increase is primarily due to the additional selling, general and administrative expenses incurred during the period as a result of increased personnel costs, legal expenses, and insurance expenses related to expansion of trucks and facilities through organic growth, as well as increased accounting, legal and consulting expenses related to our Tensile transaction which closed in the first part of the year, as disclosed in greater detail under “Part I” - “Item 1. Financial Statements” - “Note 14. Share Purchase and Subscription Agreements”.
We had a loss from operations of $9,376,842 for the nine months ended September 30, 2020, compared to a loss from operations of $5,818,092 for the nine months ended September 30, 2019, an increase of $3,558,750 or 61% from the prior year’s nine-month period. The increase was mainly due to a decrease in overall revenues for the nine months ended September 30, 2020, due to the reasons discussed above.
We had interest expense of $796,930 for the nine months ended September 30, 2020, compared to interest expense of $2,322,780 for the nine months ended June 30, 2019, a decrease in interest expense of $1,525,850 or 66%, due to a lower amount of
term debt outstanding during the nine months ended September 30, 2020, compared to the prior period. The Company received a total of $21.0 million from the Tensile transaction, of which approximately $9.0 million was used to pay down our debt obligations.
We had other income of $101 for the nine months ended September 30, 2020, compared to $920,071 for the nine months ended September 30, 2019, which was in connection with the Company receiving a payment of $907,500 related to the proceeds of an insurance settlement for a fire that had occurred at the used oil re-refining plant located in Churchill County, Nevada, which we previously rented. The Company previously determined this loan was uncollectible and wrote it off.
We had a loss on the sale of assets of $124,090 for the nine months ended September 30, 2020, compared to a gain on the sale of assets of $31,443 for the nine months ended September 30, 2019.
We had a $1,844,369 gain on change in value of derivative liability for the nine months ended September 30, 2020, in connection with certain warrants granted in June 2015 and May 2016, as described in greater detail in "Note 9. Preferred Stock and Detachable Warrants" to the unaudited consolidated financial statements included herein under "Part I"-"Item 1 Financial Statements", compared to a gain on change in the value of our derivative liability of $331,715 in the prior year's period. This change was mainly due to a fluctuation in the market price of our common stock.
We had a net loss of $8,453,392 for the nine months ended September 30, 2020, compared to a net loss of $6,857,643 for the nine months ended September 30, 2019, an increase in net loss of $1,595,749 or 23% from the prior period due to the reasons described above. The majority of our net loss for the nine months ended September 30, 2020, was attributable to the decline in market conditions and commodity prices.
Each of our segments’ income (loss) from operations during the nine months ended September 30, 2020 and 2019 was as follows:
| | | | | | | | | | | | | | | | | | | | | | | | | | | |
| | | Nine Months Ended September 30, | | $ Change - Favorable (Unfavorable) | | % Change - Favorable (Unfavorable) | |
| Black Oil Segment | | 2020 | | 2019 |
| Revenues | | $ | 61,062,628 | | | $ | 103,053,529 | | | $ | (41,990,901) | | | (41) | % | |
| Cost of revenues (exclusive of depreciation and amortization shown separately below) | | 46,601,716 | | | 88,374,446 | | | 41,772,730 | | | 47 | % | |
| Depreciation and amortization attributable to costs of revenues | | 2,960,699 | | | 3,122,664 | | | 161,965 | | | 5 | % | |
| Gross profit | | 11,500,213 | | | 11,556,419 | | | (56,206) | | | *% | |
| | | | | | | | | |
| Selling, general and administrative expense | | 15,180,569 | | | 14,500,306 | | | (680,263) | | | (5) | % | |
| Depreciation and amortization attributable to operating expenses | | 1,072,877 | | | 1,005,315 | | | (67,562) | | | (7) | % | |
| | | | | | | | | |
| Loss from operations | | $ | (4,753,233) | | | $ | (3,949,202) | | | $ | (804,031) | | | (20) | % | |
| | | | | | | | | |
| | | | | | | | | |
| | | | | | | | | |
| | | | | | | | | |
| | | | | | | | | |
| | | | | | | | | |
| Refining Segment | | | | | | | | | |
| Revenues | | $ | 22,309,670 | | | $ | 9,212,477 | | | $ | 13,097,193 | | | 142 | % | |
| Cost of revenues (exclusive of depreciation and amortization shown separately below) | | 21,772,587 | | | 7,767,882 | | | (14,004,705) | | | (180) | % | |
| Depreciation and amortization attributable to costs of revenues | | 341,498 | | | 431,948 | | | 90,450 | | | 21 | % | |
| Gross profit | | 195,585 | | | 1,012,647 | | | (817,062) | | | (81) | % | |
| Selling, general and administrative expense | | 1,867,027 | | 1,424,572 | | (442,455) | | (31)% | |
| Depreciation and amortization attributable to operating expenses | | 278,492 | | 301,194 | | 22,702 | | 8% | |
| Loss from operations | | $ | (1,949,934) | | $ | (713,119) | | $ | (1,236,815) | | (173)% | |
| | | | | | | | | |
| | | | | | | | | |
| | | | | | | | | |
| | | | | | | | | |
| | | | | | | | | |
| | | | | | | | | |
| Recovery Segment | | | | | | | | | |
| Revenues | | $ | 11,588,890 | | $ | 8,511,257 | | $ | 3,077,633 | | 36% | |
| Cost of revenues (exclusive of depreciation and amortization shown separately below) | | 11,847,040 | | 7,589,758 | | (4,257,282) | | (56)% | |
| Depreciation and amortization attributable to costs of revenues | | 429,123 | | 411,014 | | (18,109) | | (4)% | |
| Gross profit (loss) | | (687,273) | | 510,485 | | (1,197,758) | | (235)% | |
| Selling, general and administrative expense | | 1,925,052 | | 1,604,906 | | (320,146) | | (20)% | |
| Depreciation and amortization attributable to operating expenses | | 61,350 | | 61,350 | | — | | —% | |
| Loss from operations | | $ | (2,673,675) | | $ | (1,155,771) | | $ | (1,517,904) | | (131)% | |
| | | | | | | | | |
| | | | | | | | | |
| | | | | | | | | |
| | | | | | | | | |
| | | | | | | | | |
* Less than 1%.
Our Black Oil segment generated revenues of $61,062,628 for the nine months ended September 30, 2020, with cost of revenues (exclusive of depreciation and amortization) of $46,601,716, and depreciation and amortization attributable to cost of revenues of $2,960,699. During the nine months ended September 30, 2019, these revenues were $103,053,529 with cost of revenues (exclusive of depreciation and amortization) of $88,374,446, and depreciation and amortization attributable to cost of revenues of $3,122,664 Income from operations decreased for the nine months ended September 30, 2020, compared to 2019, as a result of lower volumes of processed products at the refineries, and other facilities, as well as an overall decrease in margins throughout the business as a result of lower commodity pricing, offset by decreased operating expenses through our various facilities, along with diligent management of our street collections and pricing.
Our Black Oil segment's volume decreased approximately 18% during the nine months ended September 30, 2020, compared to the same period in 2019. This decrease was largely due to the overall economic impact of the 'stay-at-home' orders that were imposed as a result of the COVID-19 pandemic. Volumes collected through our H&H Oil and Heartland collection facilities decreased 2% during the nine months ended September 30, 2020, compared to the same period in 2019. One of our key initiatives
continues to be a focus on growing our own volumes of collected material and displacing the third-party oil processed in our facilities.
Our Refining segment includes the business operations of our Refining and Marketing operations, as well as our newly acquired assets from Crystal. With the acquisition of the Crystal assets, we now operate as a wholesale distributer of motor fuels which include gasoline, blended gasoline and diesel. During the nine months ended September 30, 2020, our Refining and Marketing cost of revenues (exclusive of depreciation and amortization) were $21,772,587, of which the processing costs for our Refining and Marketing business located at KMTEX were $1,202,050, and depreciation and amortization attributable to cost of revenues of $341,498. Revenues for the same period were $22,309,670. During the nine months ended September 30, 2019, our Refining and Marketing cost of revenues (exclusive of depreciation and amortization) were $7,767,882, which included the processing costs at KMTEX of $1,419,225, and depreciation and amortization attributable to cost of revenues of $431,948 .Revenues for the same period were $9,212,477.
Overall volume for the Refining and Marketing division decreased 37%16% during the nine months ended September 30, 2019,2020, as compared to the same period in 2018.2019. Our fuel oil cutter volumes decreased 66%46% for the nine months ended September 30, 2019,2020, compared to the same period in 2018.2019. Our pygas volumes decreased 8%6% for the nine months ended September 30, 2019,2020, as compared to the same period in 2018. This division experienced a decrease in production of 88% for its gasoline blendstock for the nine months ended September 30, 2019, compared to the same period in 2018, due to the fact that we are no longer processing gasoline blendstocks in this division as the processing margins were no longer economically feasible.2019. The lower margins were a result of decreases in available feedstock volumes. We experienced a large decrease in volumes being received from third party facilities as a result of COVID-19 as well as recent weather delays as a result of the hurricanes in the Gulf which caused some of these facilities to shut-down operations for short periods of time. We have also had to assess the volume of fuel oil cutterstocks that we manage due to enhanced quality of products being demanded in the marketplace.
Our Recovery segment generated revenues of $11,588,890 for the nine months ended September 30, 2020, with cost of revenues (exclusive of depreciation and amortization) of $11,847,040, and depreciation and amortization attributable to cost of revenues of $429,123. During the nine months ended September 30, 2019, these revenues were $8,511,257 with cost of revenues (exclusive of depreciation and amortization) of $7,589,758, and depreciation and amortization attributable to cost of revenues of $411,014. Income from operations decreased for the nine months ended September 30, 2020, compared to 2019, as a result of increased operating expenses through our various facilities.
Our Recovery divisionsegment includes the business operations of Vertex Recovery Management.Management as well as our Group III base oil business. Vertex acts as Penthol’s exclusive agent to provide marketing, sales, and logistical duties of Group III base oil from the United Arab Emirates to the United States. Revenues for this division decreased 18%increased 36% as a result of lowerincreased volumes compared to the same period in 2018.2019. Volumes of petroleum products acquired in our Recovery business were up 8%20% during the nine months ended September 30, 2019,2020, compared to the same period during 2018.2019. This divisionsegment periodically participates in project work that is not ongoing, thus we expect to see fluctuations in revenue and gross profit from this divisionincome before income taxes from period to period. These projects are typically bid related and can take time to line out and get started; however, we believe these are very good projects for the Company and we anticipate more in the upcoming periods.
The Company purchases product/feedstock from third-party collectors as well as internally collected product using its fleet of trucks.Our long-term goal is to collect as much of our product/feedstock as possible as this helps to improve margins and ultimately net income of the Company. The more product/feedstock we can collect with our own fleet and displace third-party purchases improves the overall profitability of the Company through cost reductions, as our internally collected product/feedstock is generally cheaper than product/feedstock we have to purchase from third-parties. In general, the more product/feedstock we are required to acquire from third-parties, the lower our margins. While the breakdown between internally sourced and third-party sourced product/feedstock has no effect on revenue (which is a function of fluctuating product spreads), it does have an effect on cost of revenues, and therefore our profit before corporate selling, general and administrative expenses. Specifically, a higher number of third-party sourced product/feedstock generally results in increases to costs of revenues. Inventories are also affected to a limited extent by collection and production values – the more product we collect, the greater our inventories of product/feedstock, at least until such product/feedstock is processed into end-products. The inventory levels of our end-products are determined based on supply and demand, and how quickly such products can be transported, and not typically dependent on the amount of products/feedstock we source internally or externally.
The following table sets forth the high and low spot prices during the nine months ended September 30, 2020, for our key benchmarks.
| | | | | | | | | | | | | | | | | | | | | | | | | | |
| 2020 | | | | | | | | |
| Benchmark | | High | | Date | | Low | | Date |
| U.S. Gulfcoast No. 2 Waterborne (dollars per gallon) | | $ | 1.95 | | | January 3 | | $ | 0.42 | | | April 27 |
| U.S. Gulfcoast Unleaded 87 Waterborne (dollars per gallon) | | $ | 1.75 | | | January 3 | | $ | 0.40 | | | March 23 |
| U.S. Gulfcoast Residual Fuel No. 6 3% (dollars per barrel) | | $ | 47.34 | | | January 29 | | $ | 12.00 | | | April 21 |
| NYMEX Crude oil (dollars per barrel) | | $ | 63.27 | | | January 6 | | $ | (37.63) | | | April 20 |
| Reported in Platt's US Marketscan (Gulf Coast) | | | | | | |
The following table sets forth the high and low spot prices during the nine months ended September 30, 2019, for our key benchmarks.
| | | | | | | | | | | | | | | | | | | | | | | | | | |
| 2019 | | | | | | | | |
| Benchmark | | High | | Date | | Low | | Date |
| U.S. Gulfcoast No. 2 Waterborne (dollars per gallon) | | $ | 2.01 | | | September 16 | | $ | 1.53 | | | January 2 |
| U.S. Gulfcoast Unleaded 87 Waterborne (dollars per gallon) | | $ | 2.08 | | | April 10 | | $ | 1.31 | | | January 2 |
| U.S. Gulfcoast Residual Fuel No. 6 3% (dollars per barrel) | | $ | 68.54 | | | April 25 | | $ | 49.82 | | | January 2 |
| NYMEX Crude oil (dollars per barrel) | | $ | 66.30 | | | April 23 | | $ | 46.54 | | | January 2 |
| Reported in Platt's US Marketscan (Gulf Coast) | | | | | | |
|
| | | | | | | | | | | | |
| 2019 | | | | | | | | |
| Benchmark | | High | | Date | | Low | | Date |
| U.S. Gulfcoast No. 2 Waterborne (dollars per gallon) | | $ | 2.01 |
| | September 16 | | $ | 1.53 |
| | January 2 |
| U.S. Gulfcoast Unleaded 87 Waterborne (dollars per gallon) | | $ | 2.08 |
| | April 10 | | $ | 1.31 |
| | January 2 |
| U.S. Gulfcoast Residual Fuel No. 6 3% (dollars per barrel) | | $ | 68.54 |
| | April 25 | | $ | 41.19 |
| | August 14 |
| NYMEX Crude oil (dollars per barrel) | | $ | 66.30 |
| | April 23 | | $ | 46.54 |
| | January 2 |
| Reported in Platt's US Marketscan (Gulf Coast) | | | | |
| | |
The following table sets forth the high and low spot prices during the nine months ended September 30, 2018, for our key benchmarks.
|
| | | | | | | | | | | | |
| 2018 | | | | | | | | |
| Benchmark | | High | | Date | | Low | | Date |
| U.S. Gulfcoast No. 2 Waterborne (dollars per gallon) | | $ | 2.27 |
| | September 28 | | $ | 1.64 |
| | February 12 |
| U.S. Gulfcoast Unleaded 87 Waterborne (dollars per gallon) | | $ | 2.15 |
| | September 28 | | $ | 1.71 |
| | February 12 |
| U.S. Gulfcoast Residual Fuel No. 6 3% (dollars per barrel) | | $ | 70.59 |
| | September 28 | | $ | 51.30 |
| | February 9 |
| NYMEX Crude oil (dollars per barrel) | | $ | 74.11 |
| | July 10 | | $ | 59.19 |
| | February 13 |
| Reported in Platt's US Marketscan (Gulf Coast) | | | | |
| | |
We saw on average very little change during the first nine monthsan extreme drop in March and April of 2019,2020, in each of the benchmark commodities we track compared to the same period in 2018.2019. The extreme drop in market prices was a result of COVID-19, which led to worldwide shutdowns and halting of commercial and interpersonal activity, as governments around the world imposed regulations in response to efforts to control the spread of COVID-19, such as 'shelter-in-place' orders, quarantines, executive orders and similar restrictions. As a result, the global economy has been marked by significant slowdown and uncertainty, which has led to a precipitous decline in oil prices in response to demand concerns, further exacerbated by the price war among members of the Organization of Petroleum Exporting Countries (“OPEC”) and other non-OPEC producer nations (collectively with OPEC members, “OPEC+”) during the first quarter of 2020 and global storage considerations. Moving towards the end of 2020 and into 2021, we anticipate that our results of operations will continue to be significantly impacted by the price of, and demand for oil, COVID-19 and the global response thereto.
Our margins are a function of the difference between what we are able to pay for raw materials and the market prices for the range of products produced. The various petroleum products produced are typically a function of crude oil indices and are quoted on multiple exchanges such as the New York Mercantile Exchange ("NYMEX"). These prices are determined by a global market and can be influenced by many factors, including but not limited to supply/demand, weather, politics, and global/regional inventory levels. As such, we cannot provide any assurances regarding results of operations for any future periods, as numerous factors outside of our control affect the prices paid for raw materials and the prices (for the most part keyed to the NYMEX) that can be charged for such products. Additionally, for the near term, results of operations will be subject to further uncertainty, as the global markets and exchanges, including the NYMEX, continue to experience volatility.
As our competitors bring new technologies to the marketplace, which will likely enable them to obtain higher values for the finished products created through their technologies from purchased black oil feedstock, we anticipate that they will have to pay more for feedstock due to the additional value received from their finished product (i.e., as their margins increase, they are able to increase the prices they are willing to pay for feedstock). If we are not able to continue to refine and improve our technologies and gain efficiencies in our technologies, we could be negatively impacted by the ability of our competitors to bring new processes to market which compete with our processes, as well as their ability to outbid us for feedstock supplies. Additionally, if we are forced to pay more for feedstock, our cash flows will be negatively impacted and our margins will decrease.
We had selling, general, and administrative expenses of $17,529,784 for the nine months ended September 30, 2019, compared to $16,668,692 of selling, general, and administrative expenses for the prior year's period, an increase of $861,092 or 5%. This increase is primarily due to the additional selling, general and administrative expenses incurred during the period as a result of increased personnel costs, legal expenses, and insurance expenses related to expansion of trucks and facilities through organic growth, as well as increased accounting, legal and consulting expenses related to our Tensile transaction.
We had loss from operations of $5,818,092 for the nine months ended September 30, 2019, compared to income from operations of $2,581,431 for the nine months ended September 30, 2018, a decrease of $8,399,523 or 325% from the prior year’s nine-month period. The decrease was mainly due to a decrease in overall gross profit for the nine months ended September 30, 2019.
We had interest expense of $2,322,780 for the nine months ended September 30, 2019, compared to interest expense of $2,448,771 for the nine months ended September 30, 2018, a decrease in interest expense of $125,991 or 5%, due to a lower amount of term debt outstanding during the nine months ended September 30, 2019.
We had a gain on the sale of assets of $31,443 for the nine months ended September 30, 2019, compared to a gain on the sale of assets of $51,523 for the nine months ended September 30, 2018. The sale of fixed assets during the nine months ended September 30, 2018 was mainly related to the sale of certain assets related to E-Source Holdings, LLC ("E-Source"), our wholly-owned subsidiary.
We had a $331,715 gain on change in value of derivative liability for the nine months ended September 30, 2019, in connection with certain warrants granted in June 2015 and May 2016, as described in greater detail in "Note 9. Preferred Stock and Detachable Warrants" to the unaudited consolidated financial statements included herein under "Part I"-"Item 1 Financial Statements" compared to a loss on change in the value of our derivative liability of $2,124,971 in the prior year's period. This change was mainly due to a fluctuation in the market price of our common stock.
We had a net loss of $6,857,643 for the nine months ended September 30, 2019, compared to a net loss of $1,940,129 for the nine months ended September 30, 2018, an increase in net loss of $4,917,514 or 253% from the prior period for the reasons described above. The majority of our net loss for the nine months ended September 30, 2019, was attributable to the decline in market and commodity prices.
During the nine months ended September 30, 2019 and 2018, the processing costs for our Refining and Marketing division located at KMTEX were $1,419,225 and $1,573,152, respectively.
Set forth below, we have disclosed a quarter-by-quarter summary of our statements of operations for the third, second and first quarters of 2019, fiscal year 2018 and the fourth and third quarters of 2017.
|
| | | | | | | | | | | | | | | | | | | | | | | | | | | | | | | | | | | |
| | Fiscal 2019 | | Fiscal 2018 | | Fiscal 2017 |
| | Third | | Second | | First | | Fourth | | Third | | Second | | First | | Fourth | | Third |
| | Quarter | | Quarter | | Quarter | | Quarter | | Quarter | | Quarter | | Quarter | | Quarter | | Quarter |
| | | | | | | | | | | | | | | | | | |
| Revenues | $ | 37,799,259 |
| | $ | 43,657,292 |
| | $ | 39,320,712 |
| | $ | 41,801,748 |
| | $ | 50,632,948 |
| | $ | 46,917,770 |
| | $ | 41,368,195 |
| | $ | 41,345,248 |
| | $ | 32,470,451 |
|
| Cost of Revenues (exclusive of depreciation and amortization shown separately below) | 32,372,316 |
| | 36,515,421 |
| | 34,844,349 |
| | 36,879,263 |
| | 42,593,367 |
| | 36,796,258 |
| | 35,045,151 |
| | 33,362,445 |
| | 28,696,461 |
|
| Gross Profit | 5,426,943 |
| | 7,141,871 |
| | 4,476,363 |
| | 4,922,485 |
| | 8,039,581 |
| | 10,121,512 |
| | 6,323,044 |
| | 7,982,803 |
| | 3,773,990 |
|
| Selling, general and administrative expenses | 6,153,184 |
| | 6,028,859 |
| | 5,347,741 |
| | 5,258,572 |
| | 5,658,659 |
| | 5,364,591 |
| | 5,645,442 |
| | 5,405,047 |
| | 5,690,761 |
|
| Depreciation and amortization | 1,815,582 |
| | 1,780,890 |
| | 1,737,013 |
| | 1,756,996 |
| | 1,806,839 |
| | 1,733,076 |
| | 1,694,099 |
| | 1,700,413 |
| | 1,697,821 |
|
| Total operating expenses | 7,968,766 |
| | 7,809,749 |
| | 7,084,754 |
| | 7,015,568 |
| | 7,465,498 |
| | 7,097,667 |
| | 7,339,541 |
| | 7,105,460 |
| | 7,388,582 |
|
| Income (loss) from operations | (2,541,823 | ) | | (667,878 | ) | | (2,608,391 | ) | | (2,093,083 | ) | | 574,083 |
| | 3,023,845 |
| | (1,016,497 | ) | | 877,343 |
| | (3,614,592 | ) |
| Other income (expense): | | | | | | | | | | | | | | | | | |
| Interest income | 918,153 |
| | 1,918 |
| | — |
| | — |
| | — |
| | 659 |
| | — |
| | — |
| | 1,519 |
|
| Gain (loss) on change in value of warrant derivative liability | 1,290,792 |
| | 746,017 |
| | (1,705,094 | ) | | 2,888,687 |
| | (2,169,133 | ) | | 475,913 |
| | (431,751 | ) | | (556,318 | ) | | 1,371,461 |
|
| Gain (loss) on sale of assets | — |
| | 29,150 |
| | 2,293 |
| | (5,970 | ) | | — |
| | 8,843 |
| | 42,680 |
| | 14,251 |
| | 25,693 |
|
| Interest expense | (826,005 | ) | | (738,972 | ) | | (757,803 | ) | | (833,084 | ) | | (798,800 | ) | | (847,456 | ) | | (802,515 | ) | | (794,668 | ) | | (733,459 | ) |
| Total other income (expense) | 1,382,940 |
| | 38,113 |
| | (2,460,604 | ) | | 2,049,633 |
| | (2,967,933 | ) | | (362,041 | ) | | (1,191,586 | ) | | (1,336,735 | ) | | 665,214 |
|
| Income (loss) before income taxes | (1,158,883 | ) | | (629,765 | ) | | (5,068,995 | ) | | (43,450 | ) | | (2,393,850 | ) | | 2,661,804 |
| | (2,208,083 | ) | | (459,392 | ) | | (2,949,378 | ) |
| Income tax benefit (expense) | — |
| | — |
| | — |
| | — |
| | — |
| | — |
| | — |
| | 274,423 |
| | — |
|
| Net income (loss) | (1,158,883 | ) | | (629,765 | ) | | (5,068,995 | ) | | (43,450 | ) | | (2,393,850 | ) | | 2,661,804 |
| | (2,208,083 | ) | | (184,969 | ) | | (2,949,378 | ) |
| Net income (loss) attributable to non-controlling interest and redeemable non-controlling interest | (67,102 | ) | | (202,329 | ) | | (105,431 | ) | | 157,883 |
| | (105,970 | ) | | 131,736 |
| | 50,539 |
| | 200,418 |
| | 34,554 |
|
| Net income (loss) | $ | (1,091,781 | ) | | $ | (427,436 | ) | | $ | (4,963,564 | ) | | $ | (201,333 | ) | | $ | (2,287,880 | ) | | $ | 2,530,068 |
| | $ | (2,258,622 | ) | | $ | (385,387 | ) | | $ | (2,983,932 | ) |
The graph below charts our total quarterly revenue over time from September 30, 2017 to September 30, 2019:
In the table below, we have disclosed a quarter-by-quarter summary of our gross profit by segment for the second and first quarters of 2019, fiscal year 2018 and the fourth, third and second quarters of 2017.
|
| | | | | | | | | | | | | | | | | | | | | | | | | | | | | | | | | | | |
| | GROSS PROFIT BY SEGMENT BY QUARTER |
| | Fiscal 2019 | | Fiscal 2018 | | Fiscal 2017 |
| | Third | | Second | | First | | Fourth | | Third | | Second | | First | | Fourth | | Third |
| | Quarter | | Quarter | | Quarter | | Quarter | | Quarter | | Quarter | | Quarter | | Quarter | | Quarter |
| Black Oil | | | | | | | | | | | | | | | | | |
| Revenues | $ | 32,330,530 |
| | $ | 37,907,811 |
| | $ | 32,815,187 |
| | $ | 32,730,540 |
| | $ | 40,400,064 |
| | $ | 38,469,131 |
| | $ | 32,237,246 |
| | $ | 30,441,750 |
| | $ | 25,358,317 |
|
| Cost of revenues | 27,663,982 |
| | 31,368,939 |
| | 29,341,525 |
| | 27,280,433 |
| | 32,550,126 |
| | 29,723,927 |
| | 26,969,978 |
| | 24,323,240 |
| | 22,016,825 |
|
| Gross profit | $ | 4,666,548 |
| | $ | 6,538,872 |
| | $ | 3,473,662 |
| | $ | 5,450,107 |
| | $ | 7,849,938 |
| | $ | 8,745,204 |
| | $ | 5,267,268 |
| | $ | 6,118,510 |
| | $ | 3,341,492 |
|
| | | | | | | | | | | | | | | | | | |
| Refining & Marketing | | | | | | | | | | | | | | | | | |
| Revenues | $ | 3,076,454 |
| | $ | 3,277,402 |
| | $ | 2,858,621 |
| | $ | 5,553,741 |
| | $ | 7,313,630 |
| | $ | 4,392,870 |
| | $ | 5,675,241 |
| | $ | 4,660,406 |
| | $ | 4,856,520 |
|
| Cost of revenues | 2,511,314 |
| | 2,705,031 |
| | 2,551,537 |
| | 5,972,018 |
| | 7,044,218 |
| | 4,034,509 |
| | 5,239,532 |
| | 4,222,872 |
| | 4,850,354 |
|
| Gross profit (loss) | $ | 565,140 |
| | $ | 572,371 |
| | $ | 307,084 |
| | $ | (418,277 | ) | | $ | 269,412 |
| | $ | 358,361 |
| | $ | 435,709 |
| | $ | 437,534 |
| | $ | 6,166 |
|
| | | | | | | | | | | | | | | | | | |
| Recovery | | | | | | | | | | | | | | | | | |
| Revenues | $ | 2,392,274 |
| | $ | 2,472,079 |
| | $ | 3,646,904 |
| | $ | 3,517,467 |
| | $ | 2,919,254 |
| | $ | 4,055,769 |
| | $ | 3,455,708 |
| | $ | 6,243,092 |
| | $ | 2,255,614 |
|
| Cost of revenues | 2,197,019 |
| | 2,441,451 |
| | 2,951,287 |
| | 3,626,812 |
| | 2,999,023 |
| | 3,037,821 |
| | 2,835,641 |
| | 4,816,333 |
| | 1,829,282 |
|
| Gross profit (loss) | $ | 195,255 |
| | $ | 30,628 |
| | $ | 695,617 |
| | $ | (109,345 | ) | | $ | (79,769 | ) | | $ | 1,017,948 |
| | $ | 620,067 |
| | $ | 1,426,759 |
| | $ | 426,332 |
|
Liquidity and Capital Resources
The success of our current business operations has become dependent on repairs and maintenance to our facilities and our ability to make routine capital expenditures, as well as our ability to manage our margins which are a function of the difference between what we are able to pay or charge for raw materials and the market prices for the range of products produced. We also must maintain relationships with feedstock suppliers and end-product customers, and operate with efficient management of overhead costs. Through these relationships, we have historically been able to achieve volume discounts in the procurement of our feedstock, thereby increasing the margins of our segments’ operations. The resulting operating cash flow is crucial to the viability and growth of our existing business lines.
We had total assets of $120,740,141$125,153,280 as of September 30, 2019,2020, compared to $84,160,408$120,759,919 at December 31, 2018.2019. The increase was mainly due to the implementationgeneration of additional liquidity from the closing of the new lease accounting requirementsTensile transaction relating to Heartland SPV as discussed above, during the nine months ended September 30, 2019, which mandated the recognition of operating lease right of use assets totaling an aggregate of $36,242,861. The recognition of these right of use assets on the balance sheet existed in prior periods as well, but were not, due to the then accounting requirements, treated as assets on our balance sheet. Without taking into account the operating lease right to use assets, our total assets would have been $84,497,280 at September 30, 2019.2020.
We had total current liabilities of $26,351,851$23,391,460 as of September 30, 2019,2020, compared to $16,995,611$24,797,299 at December 31, 2018.2019. We had total liabilities of $71,063,113$61,069,930 as of September 30, 2019,2020, compared to total liabilities of $33,171,401$69,511,546 as of December 31, 2018.2019. The increasedecrease in current liabilities and total liabilities was mainly in connection with the implementationgeneration of additional liquidity from the closing of the new lease accounting requirements, which created a new line item onHeartland SPV transaction during the balance sheet, operating lease liability, which totaled $36,242,861nine months ended September 30, 2020, and the reduction of debt associated therewith.
We had working capital of $9,534,250 as of September 30, 2019.
We had a working capital deficit of $923,120 as of September 30, 2019,2020, compared to working capital of $6,547,301$2,609,609 as of December 31, 2018.2019. The declineincrease in working capital from December 31, 20182019 to September 30, 20192020 is mainly due to the current portiongeneration of additional liquidity from the closing of the operating lease liabilityHeartland SPV transaction during the nine months ended September 30, 2020.
The Company received a total of $21.0 million from the Tensile transaction, of which approximately $9.0 million was used to pay down our debt obligations, approximately $7.0 million is included in connection withcash as of September 30, 2020, and the implementation of the new lease accounting requirements.remaining balance was used to fund operations.
Our future operating cash flows will vary based on a number of factors, many of which are beyond our control, including commodity prices, the cost of recovered oil, and the ability to turn our inventory. Other factors that have affected and are expected to continue to affect earnings and cash flow are transportation, processing, and storage costs. Over the long term, our operating cash flows will also be impacted by our ability to effectively manage our administrative and operating costs. Additionally, we may incur capital expenditures related to new TCEP facilities in the future.future (provided that none are currently planned).
The Company financed insurance premiums through various financial institutions bearing interest rates from 4.00% to 4.90%. All of such premium finance agreements have maturities of less than one year and have a balance of $2,085,927 at September 30, 2019.
Given the ongoing COVID-19 pandemic, challenging market conditions and recent market events resulting in industry-wide spending cuts, we continue to remain focused on maintaining a strong balance sheet and adequate liquidity. Over the near term, we plan to reduce, defer or cancel certain planned capital expenditures and reduce our overall cost structures commensurate with our expected level of activities. We believe that our cash on hand, internally generated cash flows and availability under the Revolving Credit Facility will be sufficient to fund our operations and service our debt in the near term. A prolonged period of weak, or a significant decrease in, industry activity and overall markets, due to COVID-19 or otherwise, may make it difficult to comply with our covenants and the other restrictions in the agreements governing our debt. Current global and market conditions have increased the potential for that difficulty.
The Company's outstanding debt facilities as of September 30, 20192020 and December 31, 20182019 are summarized as follows:
| | | Creditor | Loan Type | | Origination Date | | Maturity Date | | Loan Amount | | Balance on September 30, 2019 | Balance on December 31, 2018 | Creditor | Loan Type | | Origination Date | | Maturity Date | | Loan Amount | | Balance on September 30, 2020 | Balance on December 31, 2019 |
| Encina Business Credit, LLC | Term Loan | | February 1, 2017 | | February 1, 2021 | | $ | 20,000,000 |
| | $ | 13,558,000 |
| $ | 15,350,000 |
| Encina Business Credit, LLC | Term Loan | | February 1, 2017 | | February 1, 2022 | | $ | 20,000,000 | | | $ | 5,658,000 | | $ | 13,333,000 | |
| Encina Business Credit SPV, LLC | Revolving Note | | February 1, 2017 | | February 1, 2021 | | $ | 10,000,000 |
| | 5,387,639 |
| 3,844,636 |
| Encina Business Credit SPV, LLC | Revolving Note | | February 1, 2017 | | February 1, 2022 | | $ | 10,000,000 | | | — | | 3,276,230 | |
| Encina Business Credit, LLC | | Encina Business Credit, LLC | Capex Loan | | August 7, 2020 | | February 1, 2022 | | $ | 2,000,000 | | | 1,250,617 | | — | |
| Wells Fargo Equipment Lease-Ohio | Finance Lease | | April-May, 2019 | | April-May, 2024 | | $ | 621,000 |
| | 579,062 |
| — |
| Wells Fargo Equipment Lease-Ohio | Finance Lease | | April-May, 2019 | | April-May, 2024 | | $ | 621,000 | | | 465,678 | | 551,260 | |
| AVT Equipment Lease-Ohio | | AVT Equipment Lease-Ohio | Finance Lease | | April 2, 2020 | | April 2, 2023 | | $ | 337,155 | | | 410,928 | | — | |
| AVT Equipment Lease-HH | | AVT Equipment Lease-HH | Finance Lease | | May 22, 2020 | | May 22, 2023 | | $ | 551,609 | | | 485,745 | | — | |
| John Deere Note | | John Deere Note | Note | | May 27, 2020 | | June 24, 2024 | | $ | 152,643 | | | 140,487 | | — | |
| Tetra Capital Lease | Finance Lease | | May, 2018 | | May, 2022 | | $ | 419,690 |
| | 286,011 |
| 349,822 |
| Tetra Capital Lease | Finance Lease | | May, 2018 | | May, 2022 | | $ | 419,690 | | | 195,761 | | 264,014 | |
| Well Fargo Equipment Lease-VRM LA | Finance Lease | | March, 2018 | | March, 2021 | | $ | 30,408 |
| | 14,898 |
| 22,390 |
| Well Fargo Equipment Lease-VRM LA | Finance Lease | | March, 2018 | | March, 2021 | | $ | 30,408 | | | 4,485 | | 12,341 | |
| Texas Citizens Bank | | Texas Citizens Bank | PPP Loan | | May 5, 2020 | | April 28, 2022 | | $ | 4,222,000 | | | 4,222,000 | | — | |
| Various institutions | Insurance premiums financed | | Various | | < 1 year | | $ | 2,902,428 |
| | 2,085,927 |
| 999,152 |
| Various institutions | Insurance premiums financed | | Various | | < 1 year | | $ | 2,902,428 | | | 1,893,668 | | 1,165,172 | |
| Total | |
|
| | 21,911,537 |
| 20,566,000 |
| Total | | 14,727,369 | | 18,602,017 | |
| Deferred finance costs, net | | | | (191,303 | ) | (621,733 | ) | |
| Deferred finance costs | | Deferred finance costs | | — | | (47,826) | |
| Total, net of deferred finance costs | |
| | $ | 21,720,234 |
| $ | 19,944,267 |
| Total, net of deferred finance costs | | $ | 14,727,369 | | $ | 18,554,191 | |
Future contractual maturities of notes payable are summarized as follows:
| | | Creditor | Year 1 | | Year 2 | | Year 3 | | Year 4 | | Year 5 | | Thereafter | Creditor | Year 1 | | Year 2 | | Year 3 | | Year 4 | | Year 5 | | Thereafter |
| Encina Business Credit, LLC | $ | 900,000 |
| | $ | 12,658,000 |
| | $ | — |
| | $ | — |
| | $ | — |
| | $ | — |
| Encina Business Credit, LLC | $ | 900,000 | | | $ | 4,758,000 | | | $ | — | | | $ | — | | | $ | — | | | $ | — | |
| Encina Business Credit SPV, LLC | 5,387,639 |
| | — |
| | — |
| | — |
| | — |
| | — |
| Encina Business Credit SPV, LLC | — | | | — | | | — | | | — | | | — | | | — | |
| Encina Business Credit, LLC | | Encina Business Credit, LLC | 158,966 | | | 1,091,651 | | | — | | | — | | | — | | | — | |
| John Deere Note | | John Deere Note | 37,071 | | | 37,991 | | | 38,934 | | | 26,491 | | | — | | | — | |
| Well Fargo Equipment Lease- Ohio | 113,383 |
| | 122,357 |
| | 125,642 |
| | 132,259 |
| | 85,421 |
| | — |
| Well Fargo Equipment Lease- Ohio | 119,356 | | | 125,643 | | | 132,261 | | | 88,418 | | | — | | | — | |
| AVT Equipment Lease-Ohio | | AVT Equipment Lease-Ohio | 124,308 | | | 135,272 | | | 151,348 | | | — | | | — | | | — | |
| AVT Equipment Lease-HH | | AVT Equipment Lease-HH | 145,296 | | | 158,111 | | | 182,338 | | | — | | | — | | | — | |
| Tetra Capital Lease | 90,249 |
| | 96,530 |
| | 99,232 |
| | — |
| | — |
| | — |
| Tetra Capital Lease | 96,530 | | | 99,231 | | | — | | | — | | | — | | | — | |
| Well Fargo Equipment Lease- VRM LA | 10,413 |
| | 4,485 |
| | — |
| | — |
| | — |
| | — |
| Well Fargo Equipment Lease- VRM LA | 4,485 | | | — | | | — | | | — | | | — | | | — | |
| Texas Citizens Bank | | Texas Citizens Bank | 1,877,461 | | | 2,344,539 | | | — | | | — | | | — | | | — | |
| Various institutions | 2,085,927 |
| | — |
| | — |
| | — |
| | — |
| | — |
| Various institutions | 1,893,668 | | | — | | | — | | | — | | | — | | | — | |
| Totals | 8,587,611 |
| | 12,881,372 |
| | 224,874 |
| | 132,259 |
| | 85,421 |
| | — |
| Totals | $ | 5,357,141 | | | $ | 8,750,438 | | | $ | 504,881 | | | $ | 114,909 | | | $ | — | | | $ | — | |
| Deferred finance costs, net | (191,303 | ) | | — |
| | — |
| | — |
| | — |
| | — |
| |
| Totals, net of deferred finance costs | $ | 8,396,308 |
| | $ | 12,881,372 |
| | $ | 224,874 |
| | $ | 132,259 |
| | $ | 85,421 |
| | $ | — |
| |
|
Credit and Guaranty Agreement and Revolving Credit Facility with Encina Business Credit, LLC and Credit Agreement Amendments
Our outstanding EBC Credit Agreement and the Revolving Credit Agreement are described in greater detail under “Part I” - “Item 1. Financial Statements” - “Note 6. Line of Credit and Long-Term Debt” - “Credit and Guaranty Agreement and Revolving Credit Facility with Encina Business Credit, LLC" and "Credit Agreement Amendments”.
The principal balances of the EBC Credit Agreement and the Revolving Credit Agreement as of September 30, 2019 are $13,558,000 and $5,387,639, respectively.
Subscription Agreement and Warrants
On July 26, 2019, we sold (a) 1,500,000 shares of our common stock, and (b) warrants to purchase 1,500,000 shares of our common stock with an exercise price of $2.25 per share and a term of ten years in consideration for $2.22 million or $1.48 per share and warrant.
Need for additional funding
Our re-refining business will require significant capital to design and construct any new facilities. The facility infrastructure would be an additional capitalized expenditure to these process costs and would depend on the location and site specifics of the facility.
Additionally, as part of our ongoing efforts to maintain a capital structure that is closely aligned with what we believe to be the potential of our business and goals for future growth, which is subject to cyclical changes in commodity prices, we will be exploring additional sources of external liquidity. The receptiveness of the capital markets to an offering of debt or equities cannot be assured and may be negatively impacted by, among other things, debt maturities, current market conditions, and potential stockholder dilution. The sale of additional securities, if undertaken by us and if accomplished, may result in dilution to our shareholders. However, such future financing may not be available in amounts or on terms acceptable to us, or at all.
In addition to the above, we may also seek to acquire additional businesses or assets. In addition, the Company could consider selling assets if a more strategic acquisition presents itself. Finally, in the event we deem such transaction in our best interest, we may enter into a business combination or similar transaction in the future.
We will also need additional capital in the future to redeem our Series B Preferred Stock and Series B1 Preferred Stock, provided that thewhich had a required redemption date of June 24, 2020, provided that, as discussed below under “Risk Factors” - “We do not anticipate redeeming our Series B and B1 Preferred Stock in the near future.”, we are not contractually, or legally, able to redeem such stock and do not anticipate having sufficient cash on hand to complete such redemption in the near term. Because such preferred stock (Junewas not redeemed on June 24, 2020)2020, the preferred stock accrues a 10% per annum dividend (payable in-kind at the option of the Company), is automatically extended in the event we are prohibited from redeeminguntil such preferred stock on such redemption date due to the terms of our credit facilities (which currently prohibit such redemption)is redeemed or applicable law.converted into common stock.
There is currently only a limited market for our common stock, and as such, we anticipate that such market will be illiquid, sporadic and subject to wide fluctuations in response to several factors moving forward, including, but not limited to:
| |
(1) | actual or anticipated variations in our results of operations; |
| |
(2) | the market for, and volatility in, the market for oil and gas; |
| |
(3) | our ability or inability to generate new revenues; and |
| |
(4) | the number of shares in our public float. |
(1)actual or anticipated variations in our results of operations;
(2)the market for, and volatility in, the market for oil and gas;
(3)our ability or inability to generate new revenues; and
(4)the number of shares in our public float.
Furthermore, because our common stock is traded on the NASDAQ Capital Market, our stock price may be impacted by factors that are unrelated or disproportionate to our operating performance. These market fluctuations, as well as general economic, political and market conditions, such as recessions, interest rates or international currency fluctuations may adversely affect the market price of our common stock. Additionally, at present, we have a limited number of shares in our public float, and as a result, there could be extreme fluctuations in the price of our common stock.
We believe that our stock prices (bid, ask and closing prices) may not relate to the actual value of our company, and may not reflect the actual value of our common stock. Shareholders and potential investors in our common stock should exercise caution before making an investment in our common stock, and should not rely on the publicly quoted or traded stock prices in determining our common stock value, but should instead determine the value of our common stock based on the information contained in our public reports, industry information, and those business valuation methods commonly used to value private companies.
Cash flows for the nine months ended September 30, 20192020 compared to the nine months ended September 30, 2018:2019:
| | | | | | | | | | | | | | |
| | Nine Months Ended September 30, |
| | 2020 | | 2019 |
| Beginning cash, cash equivalents and restricted cash | | $ | 4,199,825 | | | $ | 2,849,831 | |
| Net cash provided by (used in): | | | | |
| Operating activities | | 1,351,184 | | | (3,058,106) | |
| Investing activities | | (6,005,620) | | | (3,200,700) | |
| Financing activities | | 16,107,716 | | | 5,812,788 | |
| Net increase (decrease) in cash, cash equivalents and restricted cash | | 11,453,280 | | | (446,018) | |
| Ending cash, cash equivalents and restricted cash | | $ | 15,653,105 | | | $ | 2,403,813 | |
|
| | | | | | | | |
| | | Nine Months Ended September 30, |
| | | 2019 | | 2018 |
| Beginning cash, cash equivalents and restricted cash | | $ | 2,849,831 |
| | $ | 1,105,787 |
|
| Net cash provided by (used in): | | | | |
| Operating activities | | (3,058,106 | ) | | 409,486 |
|
| Investing activities | | (3,200,700 | ) | | (2,076,882 | ) |
| Financing activities | | 5,812,788 |
| | 2,401,954 |
|
| Net increase (decrease) in cash, cash equivalents and restricted cash | | (446,018 | ) | | 734,558 |
|
| Ending cash, cash equivalents and restricted cash | | $ | 2,403,813 |
| | $ | 1,840,345 |
|
Net cash used inprovided by operating activities was $3,058,106$1,351,184 for the nine months ended September 30, 2019,2020, as compared to net cash provided byused in operating activities of $409,486$3,058,106 during the corresponding period in 2018.2019. Our primary sources of liquidity are cash flows from our operations and the availability to borrow funds under our credit and loan facilities. The primary reason for the decreaseincrease in cash provided by operating activities for the nine month period ended September 30, 2019,2020, compared to the same period in 2018,2019, was the declinefluctuation in market and commodity prices.prices during the nine months ended September 30, 2020, a decrease of $4,952,388 in accounts receivable and $3,939,674 in inventory, and $5,484,734 of net cash settlements on commodity derivatives.
Investing activities used cash of $3,200,700$6,005,620 for the nine months ended September 30, 2019,2020, as compared to having used $2,076,882$3,200,700 of cash during the corresponding period in 2018,2019, due mainly to the purchase of fixed assets.assets and the acquisition of Crystal.
Financing activities provided cash of $5,812,788$16,107,716 for the nine months ended September 30, 2019,2020, as compared to providing cash of $2,401,954$5,812,788 during the corresponding period in 2018.2019. Financing activities for the nine months ended September 30, 2020 were comprised of contributions from the Tensile transaction of $21.0 million, offset by approximately $9.7 million used to pay down our long-term debt, $4.2 million of proceeds from our PPP loan (described in greater detail under “Note 6. Line of Credit and Long-Term Debt” to the unaudited financial statements included herein, under “Loan Agreements”), and $3.3 million of payments on our line of credit. Financing activities for the nine months ended September 30, 2019 were comprised of note proceeds of approximately $2.8 million, and contributions from the Tensile transaction of $5.4 million, offset by approximately $3.5 million used to pay down our long-term debt, and $1.5 million of proceeds from our line of credit. Financing activities for the nine months ended September 30, 2018 were comprised of note proceeds of approximately $4.0 million, offset by approximately $3.0 million used to pay down our long-term debt, and $1.4 million of payments on our line of credit.
More information regarding our outstanding line of credits, promissory notes and long-term debt can be found under “Note 6. Line of Credit and Long-Term Debt” to the unaudited financial statements included herein.
Critical Accounting Policies and Use of Estimates
Our financial statements are prepared in accordance with U.S. GAAP. The preparation of these financial statements requires management to make estimates and judgments that affect the reported amounts of assets, liabilities, revenues and expenses. Management regularly evaluates its estimates and judgments, including those related to revenue recognition, goodwill, intangible assets, long-lived assets valuation, and legal matters. Actual results may differ from these estimates. (See “Part I” - “Item 1. Financial Statements” - “Note 1. Basis of Presentation and Nature of Operations” to the financial statements included herein). Revenue Recognition
We account for a contract when it has approval and commitment from both parties, the rights of the parties are identified, payment terms are identified, the contract has commercial substance and collectability of consideration is probable. Revenue is recognized when our performance obligations under the terms of a contract with our customers are satisfied. Recognition occurs when the Company transfers control by completing the specified services at the point in time the customer benefits from the services performed or once our products are delivered. Revenue is measured as the amount of consideration we expect to receive in exchange for completing our performance obligations. Sales tax and other taxes we collect with revenue-producing activities are excluded from revenue. In the case of contracts with multiple performance obligations, the Company allocates the transaction price to each performance obligation based on the relative stand-alone selling prices of the various goods and/or services encompassed by the contract. We do not have any material significant payment terms, as payment is generally due within 30 days after the performance obligation has been satisfactorily completed. The Company has elected the practical expedient to recognize the incremental costs of obtaining a contract as an expense when incurred if the amortization period of the asset that we otherwise would have recognized is one year or less. In applying the guidance in Topic 606, there were no judgments or estimates made that the Company deems significant.
The nature of the Company's contracts give rise to certain types of variable consideration. The Company estimates the amount of variable consideration to include in the estimated transaction price based on historical experience, anticipated performance and its
best judgment at the time and to the extent it is probable that a significant reversal of cumulative revenue recognized will not occur when the uncertainty associated with the variable consideration is resolved.
From time to time, our fuel oil customers in our black oil segment may request that we store product which they purchase from us in our facilities. We recognize revenues for these “bill and hold” sales once the following criteria have been met: (1) there is a substantive reason for the arrangement, (2) the product is segregated and identified as the customer's asset, (3) the product is ready for delivery to the customer, and (4) we cannot use the product or direct it to another customer.
Fair value of financial instruments
Under the Financial Accounting Standards Board Accounting Standards Codification (“FASB ASC”), we are permitted to elect to measure financial instruments and certain other items at fair value, with the change in fair value recorded in earnings. We elected not to measure any eligible items using the fair value option. Consistent with the Fair Value Measurement Topic of the FASB ASC, we implemented guidelines relating to the disclosure of our methodology for periodic measurement of our assets and liabilities recorded at fair market value.
Fair value is defined as the price that would be received to sell an asset or paid to transfer a liability in an orderly transaction between market participants at the measurement date. A three-tier fair value hierarchy prioritizes the inputs used in measuring fair value. The hierarchy gives the highest priority to unadjusted quoted prices in active markets for identical assets or liabilities (level 1 measurements) and the lowest priority to unobservable inputs (level 3 measurements). These tiers include:
Level 1, defined as observable inputs such as quoted prices for identical instruments in active markets;
Level 2, defined as inputs other than quoted prices in active markets that are either directly or indirectly observable such as quoted prices for similar instruments in active markets or quoted prices for identical or similar instruments in markets that are not active; and
Level 3, defined as unobservable inputs in which little or no market data exists, therefore requiring an entity to develop its own assumptions, such as valuations derived from valuation techniques in which one or more significant inputs or significant value drivers are unobservable.
Our Level 1 assets primarily include our cash and cash equivalents. Valuations are obtained from readily available pricing sources for market transactions involving identical assets or liabilities. The carrying amounts of accounts receivable, accounts payable and accrued liabilities approximate their fair values due to the immediate or short-term maturities of these financial instruments.
Our Level 2 liabilities include our marked to market changes in the estimated value of our open derivative contracts held at the balance sheet date.
Our Level 3 liabilities include our marked to market changes in the estimated value of our derivative warrants issued in connection with our Series B Preferred Stock and Series B1 Preferred Stock.
The Company estimates the fair values of the crude oil swaps and collars based on published forward commodity price curves for the underlying commodity as of the date of the estimate for which published forward pricing is readily available. The determination of the fair values above incorporates various factors including the impact of the Company's non-performance risk and the credit standing of the counterparty involved in the Company's derivative contracts. In addition, the Company routinely monitors the creditworthiness of its counterparty.
Nonfinancial assets and liabilities measured at fair value on a nonrecurring basis include certain nonfinancial assets and liabilities as may be acquired in a business combination and thereby measured at fair value.
Impairment of long-lived assets
The Company evaluates the carrying value and recoverability of its long-lived assets when circumstances warrant such evaluation by applying the provisions of the FASB ASC regarding long-lived assets. It requires that long-lived assets be reviewed for impairment whenever events or changes in circumstances indicate that the carrying amount of an asset may not be recoverable through the estimated undiscounted cash flows expected to result from the use and eventual disposition of the assets. Whenever any such impairment exists, an impairment loss will be recognized for the amount by which the carrying value exceeds the fair value. The Company determined that no long-lived asset impairment existed at September 30, 2019.2020.
Derivative transactions
All derivative instruments are recorded on the accompanying balance sheets at fair value. These derivative transactions are not designated as cash flow hedges under FASB ASC 815, Derivatives and Hedges. Accordingly, these derivative contracts are marked-to-market and any changes in the estimated value of derivative contracts held at the balance sheet date are recognized in the accompanying statements of operations as net gain or loss on derivative contracts. The derivative assets or liabilities are classified as either current or noncurrent assets or liabilities based on their anticipated settlement date. The Company nets derivative assets and liabilities for counterparties where it has a legal right of offset.
In accordance with ASC 815-40-25 and ASC 815-10-15, Derivatives and Hedging and ASC 480-10-25, Liabilities-Distinguishing from Equity, convertible preferred shares are accounted for net, outside of shareholders' equity and warrants are accounted for as liabilities at their fair value during periods where they can be net cash settled in case of a change in control transaction. The warrants are accounted for as a liability at their fair value at each reporting period. The value of the derivative warrant liability will be re-measured at each reporting period with changes in fair value recorded in earnings. To derive an estimate of the fair value of these warrants, a Dynamic Black Scholes model is utilized which computes the impact of a possible change in control transaction upon the exercise of the warrant shares. This process relies upon inputs such as shares outstanding, our quoted stock prices, strike price, risk-free interest rate and volatility assumptions to dynamically adjust the payoff of the warrants in the presence of the dilution effect.
Leases
In February 2016, the FASB issued Accounting Standards Update No. 2016-02 (ASU 2016-02), Leases (Topic 842). ASU 2016-02 requires companies to recognize lease assets and lease liabilities on the balance sheet and disclose key information about leasing arrangements. We adopted ASU No. 2016-02, Leases (Topic 842) effective January 1, 2019 and will not recast comparative periods in transition to the new standard. In addition, we elected certain practical expedients which permit us to not reassess whether existing contracts are or contain leases, to not reassess the lease classification of any existing leases, to not reassess initial direct costs for any existing leases, and to not separate lease and nonlease components for all classes of underlying assets. We also made an accounting policy election to keep leases with an initial term of 12 months or less off of the balance sheet for all classes of underlying assets. Adoption of the new standard resulted in an increase in the Company’s assets and liabilities of approximately $37.8 million. The ASU did not have an impact on our consolidated results of operations or cash flows. Additional information and disclosures required by this new standard are contained in “Part I” - “Item 1. Financial Statements” - "Note 13. Leases".
Preferred Stock Classification
A mandatorily redeemable financial instrument shall be classified as a liability unless the redemption is required to occur only upon the liquidation or termination of the reporting entity. A financial instrument issued in the form of shares is mandatorily redeemable if it embodies an unconditional obligation requiring the issuer to redeem the instrument by transferring its assets at a specified or determinable date (or dates) or upon an event certain to occur. A financial instrument that embodies a conditional obligation to redeem the instrument by transferring assets upon an event not certain to occur becomes mandatorily redeemable-and, therefore, becomes a liability-if that event occurs, the condition is resolved, or the event becomes certain to occur. The Series B Preferred Stock requires the Company to redeem such preferred stock on the fifth anniversary of the issuance of the Series B Preferred Stock and the Series B1 Preferred Stock requires the Company to redeem such preferred stock on the same date as the Series B Preferred Stock.Stock, in the event such redemptions are allowed pursuant to the Company’s senior credit facilities and applicable law. SEC reporting requirements provide that any possible redemption outside of the control of the Company requires the preferred stock to be classified outside of permanent equity.
Redeemable Noncontrolling Interest
As more fully described in "Note 14. Myrtle Grove Share Purchase and Subscription AgreementAgreements", the Company is party to a put/call option agreementagreements with the holder of MG SPV’s and Heartland SPV's non-controlling interest.interests. The put option permits theoptions permit MG SPV's and Heartland SPV's non-controlling interest holder,holders, at any time on or after the earlier of (a) the fifth anniversary of the Closing Dateapplicable closing date of such issuances and (ii) the occurrence of certain triggering events (a(an “MG Redemption”) and "Heartland Redemption", as applicable) to require MG SPV and Heartland SPV to redeem the non-controlling interest from the holder of such interest. Per the agreement,agreements, the cash purchase price for such redeemed Class B Units (MG SPV) and Class A Units (Heartland SPV) is the greater of (y) the fair market value of such units (without discount for illiquidity, minority status or otherwise) as determined by a qualified third party agreed to in writing by a majority of the holders seeking an MG SPV Redemption and Heartland SPV Redemption and Vertex Operating (provided that Vertex Operating still owns Class A Units (as to MG SPV) or Class B Units (as to Heartland SPV) on such date)date, as applicable) and (z) the original per-unit price for such Class B Units/Class A Units plus any unpaid Class A/Class B preference. The preference is defined as the greater of (A) the aggregate unpaid “Class B/Class A Yield” (equal to an annual return of 22.5% per annum) and (B) an amount equal to fifty percent (50%) of the aggregate capital invested by the Class BB/Class A Unit holders through such MG Redemption date.holders. The agreementagreements also permitspermit the Company to acquire the non-controlling interest from the holderholders thereof upon certain events. Applicable accounting guidance requires an equity instrument that is redeemable for cash
or other assets to be classified outside of permanent equity if it is redeemable (a) at a fixed or determinable price on a fixed or determinable date, (b) at the option of the holder, or (c) upon the occurrence of an event that is not solely within the control of the issuer. Based on this guidance, the Company has classified the MG SPV and Heartland SPV non-controlling interestinterests between the liabilities and equity sections of the accompanying September 30, 20192020 and December 31, 20182019 consolidated balance sheets.sheets (provided that the Heartland SPV interest was not outstanding until January 2020). If an equity instrument subject to the guidance is currently redeemable, the instrument is adjusted to its maximum redemption amount at the balance sheet date. If the equity instrument subject to the guidance is not currently redeemable but it is probable that the equity instrument will become redeemable (for example, when the redemption depends solely on the passage of time), the guidance permits either of the following measurement methods: (a) accrete changes in the redemption value over the period from the date of issuance (or from the date that it becomes probable that the instrument will become redeemable, if later) to the earliest redemption date of the instrument using an appropriate methodology, or (b) recognize changes in the redemption value immediately as they occur and adjust the carrying amount of the instrument to equal the redemption value at the end of each reporting period. The amount presented in temporary equity should be no less than the initial amount reported in temporary equity for the instrument. Because the MG SPV and Heartland SPV equity instrumentinstruments will become redeemable solely based on the passage of time, the Company determined that it is probable that the MG SPV and Heartland SPV equity instrumentinstruments will become redeemable. The Company has elected to apply the second of the two measurement options described above. An adjustment to the carrying amount of a non-controlling interest from
the application of the above guidance does not impact net income in the consolidated financial statements. Rather, such adjustments are treated as equity transactions.
Variable Interest Entities
The Company has investments in certain legal entities in which equity investors do not have (1) sufficient equity at risk for the legal entity to finance its activities without additional subordinated financial support, (2) as a group, (the holders of the equity investment at risk), do not have either the power, through voting or similar rights, to direct the activities of the legal entity that most significantly impacts the entity’s economic performance, or (3) the obligation to absorb the expected losses of the legal entity or the right to receive expected residual returns of the legal entity. These certain legal entities are referred to as “variable interest entities” or “VIEs.”
The Company consolidates the results of any such entity in which it determines that it has a controlling financial interest. The Company has a “controlling financial interest” in such an entity if the Company has both the power to direct the activities that most significantly affect the VIE’s economic performance and the obligation to absorb the losses of, or right to receive benefits from, the VIE that could be potentially significant to the VIE. On a quarterly basis, the Company reassesses whether it has a controlling financial interest in any investments it has in these certain legal entities.
Market Risk
Our revenues and cost of revenues are affected by fluctuations in the value of energy related products. We attempt to mitigate much of the risk associated with the volatility of relevant commodity prices by using our knowledge of the market to obtain feedstock at attractive costs, by efficiently managing the logistics associated with our products, by turning our inventory over quickly and by selling our products into markets where we believe we can achieve the greatest value.
Item 3. Quantitative and Qualitative Disclosures about Market Risk
We are exposed to interest rate risks primarily through borrowings under various bank facilities. Interest on these facilities is based upon variable interest rates using LIBOR or Prime as the base rate.
At September 30, 2019,2020, the Company had approximately $5.4$6.9 million of variable-rate term debt outstanding. At this borrowing level, a hypothetical relative increase of 10% in interest rates would have an unfavorable but insignificant impact on the Company’s pre-tax earnings and cash flows. The primary interest rate exposure on variable-rate debt is based on the LIBOR rate (2.10%(1.55% at September 30, 2019)2020) plus 6.50% per year.
We are exposed to market risks related to the volatility of crude oil and refined oil products. Our financial results can be significantly affected by changes in these prices which are driven by global economic and market conditions. We attempt to mitigate much of the risk associated with the volatility of relevant commodity prices by using our knowledge of the market to obtain feedstock at attractive costs, by efficiently managing the logistics associated with our products, by turning our inventory over quickly, and by selling our products into markets where we believe we can achieve the greatest value.
Item 4. Controls and Procedures
Evaluation of Disclosure Controls and Procedures
We have established and maintain a system of disclosure controls and procedures that are designed to provide reasonable assurance that information required to be disclosed in our reports filed with the SEC pursuant to the Exchange Act, is recorded, processed, summarized and reported within the time periods specified in the rules and forms of the Commission and that such information is accumulated and communicated to our management, including our Chief Executive Officer (CEO)(principal executive officer) and Chief Financial Officer (CFO) (principal accounting/financial officer), as appropriate, to allow timely decisions regarding required disclosures.
Management, with the participation of our CEO and CFO, evaluated the effectiveness of the design and operation of our disclosure controls and procedures (as defined in Rules 13a-15(e) and 15d-15(e) of the Exchange Act) as of the end of the period covered by this report. As of September 30, 2019,2020, based on the evaluation of these disclosure controls and procedures, and in light of the material weakness we found in our internal controls over financial reporting as of December 31, 20182019 (as described in greater detail in our annual report on Form 10-K for the year ended December 31, 2018)2019), our CEO and CFO have concluded that our disclosure controls and procedures were not effective to provide reasonable assurance that information required to be disclosed in our reports filed with the Securities and Exchange Commission pursuant to the Exchange Act, is recorded properly, processed, summarized and reported within the time periods specified in the rules and forms of the Commission and that such information is accumulated and communicated to our management, including our CEO and CFO, as appropriate, to allow timely decisions regarding required disclosures.
Remediation Efforts to Address Material Weakness
We believe the remedial measures described in Part II, “Item“Item 9A, Controls and Procedures”Procedures” in our Annual Report on Form 10-K for the year ended December 31, 2018,2019, and others that may be implemented, will remediate this material weakness. However, this material weakness will not be considered formally remediated until controls have operated effectively for a sufficient period of time and management has concluded, through testing, that the controls are operating effectively. We expect this to occur by the end of fiscal 2019.2020.
Changes in Internal Control Over Financial Reporting
We regularly review our system of internal control over financial reporting to ensure we maintain an effective internal control environment. There were no changes in our internal control over financial reporting that occurred during the period covered by this Quarterly Report on Form 10-Q that have materially affected, or are reasonably likely to materially affect, our internal control over financial reporting. As a result of the COVID-19 pandemic, certain employees of the Company began working remotely in March 2020 but these changes to the working environment did not have a material effect on the Company’s internal control over financial reporting. We will continue to monitor the impact of COVID-19 on our internal control over financial reporting.
PART II – OTHER INFORMATION
Item 1. Legal Proceedings
From time to time, we may become party to litigation or other legal proceedings that we consider to be a part of the ordinary course of our business.
Such current litigation or other legal proceedings are described in, and incorporated by reference in, this “Item 1. Legal Proceedings” of this Form 10-Q from, “Part I” - “Item 1. Financial Statements” in the Notes to Consolidated Financial Statements in “Note 3. Concentrations, Significant Customers, Commitments and Contingencies”, under the heading “Litigation”. The Company believes that the resolution of currently pending matters will not individually or in the aggregate have a material adverse effect on our financial condition or results of operations. However, assessment of the current litigation or other legal claims could change in light of the discovery of facts not presently known to the Company or by judges, juries or other finders of fact, which are not in accord with management’s evaluation of the possible liability or outcome of such litigation or claims.
Additionally, the outcome of litigation is inherently uncertain. If one or more legal matters were resolved against the Company in a reporting period for amounts in excess of management’s expectations, the Company’s financial condition and operating results for that reporting period could be materially adversely affected.
Item 1A. Risk Factors
There have been no material changes from the risk factors previously disclosed in Part I, Item 1A of the Company’s Annual Report on Form 10-K for the year ended December 31, 2018,2019, filed with the Commission on March 6, 20194, 2020 (the “Form 10-K”), under the heading “Risk Factors”, except as set forth below, and investors should review the risks provided in the Form 10-K and below, prior to making an investment in the Company. The business, financial condition and operating results of the Company can be affected by a number of factors, whether currently known or unknown, including but not limited to those described below and in the Form 10-K for the year ended December 31, 2018,2019, under “Risk Factors”, andwhich risk factors from the Form 10-K are incorporated by reference in this Item 1A. Risk Factors, subject to updates to such risk factors as provided below, any one or more of which could, directly or indirectly, cause the Company’s actual financial condition and operating results to vary materially from past, or from anticipated future, financial condition and operating results. Any of these factors, in whole or in part, could materially and adversely affect the Company’s business, financial condition, operating results and stock price.
The risk factor entitled “We will need to raise additional capital to meet the requirementsThe price of the termsoil and conditionsfluctuations in oil prices may have a negative effect on our results of our Credit Agreements and the required redemption provisions of our Series B and B1 Preferred Stock and to fund future acquisitions and our ability to obtain the necessary funding is uncertain.operations.” from the Form 10-K is replaced and superseded by the following:
WeThe price of oil and fluctuations in oil prices may have a negative effect on our results of operations.
The majority of our operations are associated with collecting used oil, re-refining or otherwise processing a portion of such used oil and then selling both such re-refined/processed oil and the excess feedstock oil which we do not currently have the capacity to re-refine, to other customers. The prices at which we sell our re-refined/processed oil and extra feedstock are affected by changes in the reported spot market prices of oil. If applicable rates increase or decrease, we typically will needcharge a higher or lower corresponding price for our re-refined/processed oil and excess feedstock. The price at which we sell our re-refined/processed oil and excess feedstock is affected by changes in certain indices measuring changes in the price of heavy fuel oil, with increases and decreases in the indices typically translating into a higher or lower price for our re-refined/processed oil and excess feedstock. The cost to raise additional capitalcollect used oil, including the amounts we pay to meetobtain a portion of our used oil and therefore ability to collect necessary volumes as well as the requirementsfuel costs of our oil collection fleet, typically also increases or decreases when the relevant indices increase or decrease. However, even though the prices we can charge for our re-refined/processed oil and excess feedstock and the costs to collect and re-refine/processed used oil typically increase and decrease together, there is no assurance that when our costs to collect and re-refine/process used oil increase we will be able to increase the prices we charge for our re-refined/processed oil excess feedstock to cover such increased costs, or that our costs to collect and re-refine/process used oil will decline when the prices we can charge for re-refined/processed oil declines. These risks are exacerbated when there are rapid fluctuations in these oil indices and when there is lower pricing due to decreased demand, which have both occurred recently as a result of the termseconomic uncertainty caused by the COVID-19 outbreak. These risks are also greater when there is an increased supply of oil from the Organization of the Petroleum Exporting Countries (OPEC), which has also recently occurred.
In addition to the above, the value of re-refined and conditionsprocessed used oil is usually greater the more expensive oil is. As the price of oil decreases so does the spread between re-refined/processed used oil and refined oil and extremely low oil prices, such as those which we are currently experiencing, customers will often be willing to pay the slightly higher cost of refined oil rather than paying for re-refined/processed oil. Furthermore, as the price of oil decreases, the price we can charge for re-refined/processed oil decreases, and while in general the cost of our Credit Agreementsfeedstocks decreases, the prices required to process such feedstock and to fund future acquisitions andoperate our ability to obtain the necessary funding is uncertain.
We will need to raise additional funding or refinance our existing debt to meet the requirements of the terms and conditions of our Credit Agreements, which amounts totaling approximately $19 million as of September 30, 2019, come due on February 1, 2021. We may also need to raise additional fundsplans remain fixed. As such, in the future to fund acquisitions. If we raise additional funds inevent the future, by issuing equity securities, dilution to existing stockholders will result, and such securities may have rights, preferences and privileges senior to thoseprice of our common stock and preferred stock. If funding is insufficient at any time in the futureoil remains low and we are unablenot able to generate sufficient revenue from new business arrangements,increase the prices we charge for re-refined/processed oil, our margins will likely decrease and it may not become economically feasible to repaycontinue to operate our outstanding debts, complete planned acquisitions or operations,facilities. In the event that were to occur, we may be forced to shut down our facilities.
The occurrence of any of the events described above could have a material adverse effect on our results of operations and could in turn cause the value of our securities could be adversely affected. Future funding may not be available on favorable terms, if at all.to decline.
The risk factor entitled “We have substantial indebtedness which could adversely affect our financial flexibility and our competitive position. Our debt agreements have previously been declared in default, and our future failure to comply with financial covenants in our debt agreements could result in such debt agreements again being declared in default.TCEP only makes commercial sense when the market price for oil is high.”, from the Form 10-K is replaced and superseded by the following:
We have substantial indebtedness which could adversely affect our financial flexibility and our competitive position. Our debt agreements have previously been declared in default, and our future failureTCEP only makes commercial sense when the market price for oil is high.
From the third quarter of 2015 to comply with financial covenants in our debt agreements could result in such debt agreements again being declared in default.
We have a significant amountthe fourth quarter of outstanding indebtedness. As of September 30, 2019, we owed approximately $10.0 million in accounts payable and accrued expenses. As of September 30, 2019, we owed $19 million under the Credit Agreements, and further have outstanding Series B Preferred Stock and Series B1 Preferred Stock (which currently, as of the date of this filing, has a liquidation and redemption value of $28.4 million).
Our substantial indebtedness could have important consequences and significant effects onutilized TCEP to pre-treat our business. For example, it could:
increase our vulnerabilityused motor oil feedstocks prior to adverse changes in general economic, industry and competitive conditions;
require us to dedicate a substantial portion of our cash flow from operations to make payments on our indebtedness, thereby reducing the availability of our cash flow to fund working capital, capital expenditures and other general corporate purposes;
restrict us from taking advantage of business opportunities;
make it more difficult to satisfy our financial obligations;
place us at a competitive disadvantage comparedshipping to our competitors that have less debt obligations; andfacility in Marrero, Louisiana; however, from the fourth quarter of 2019 to the first quarter of 2020, we once again used TCEP for the purpose of producing finished cutterstock. Starting in the first quarter of 2020, with
limitdeclining oil prices, such use of TCEP for its originally intended purpose became non-economical. When oil prices are low (such as they are now) we anticipate using TCEP only to pre-treat our abilityused motor oil feedstocks prior to borrow additional fundsshipping them to our facility in Marrero, Louisiana, versus for working capital, capital expenditures, acquisitions, debt service requirements, executionits original intended purpose, producing finished cutterstock. This is because when oil prices are low, the fixed costs of our business strategy or other general corporate purposes on satisfactory terms or at all.
We may needTCEP are greater than the price we can charge for re-refined oil we can create using such technology. If oil prices continue to raise additional fundingremain low in the future to repay or refinance the Credit Agreements and our accounts payable, and as such may need to seek additional debt or equity financing. Such additional financing may not be available on favorable terms, if at all. If debt financing is available and obtained, our interest expense may increase and weit may be subjectinefficient to the risk of default, depending on the terms of such financing. If equity financing is available and obtained it may result in our shareholders experiencing significant dilution. If such financing is unavailable, we may be forcedoperate TCEP to curtail our operations,re-refine oil, which may causehave a negative effect on our cash flows and results of operations. Since the valuefirst quarter of 2020, we have used TCEP solely to pre-treat our securitiesused motor oil feedstocks prior to declineshipping to our facility in value and/or become worthless. Furthermore, the fact that our prior credit agreements have previously been declared in default may negatively affect the perception of the Company and our ability to pay our debts as they become due in the future and could result in the price of our securities declining in value or being valued at lower levels than companies with similar histories of defaults.Marrero, Louisiana.
The risk factor entitled “The issuanceWorsening economic conditions and sale of common stock upon conversiontrends and downturns in the business cycles of the Series B Preferred Stockindustries we serve and Series B1 Preferred Stock may depress the market price ofwhich provide services to us would impact our common stock;business and the redemption of the Series B Preferred Stock and Series B1 Preferred Stock, if not converted into common stock prior to the required redemption date, will require significant additional funds.operating results.”, from the Form 10-K is replaced and superseded by the following:
The issuanceWorsening economic conditions and sale of common stock upon conversiontrends and downturns in the business cycles of the Series B Preferred Stockindustries we serve and Series B1 Preferred Stock may depress the market pricewhich provide services to us would impact our business and operating results.
A significant portion of our common stock.
If conversionscustomer base is comprised of companies in the Series B Preferred Stockchemical manufacturing and Series B1 Preferred Stockhydrocarbon recovery industries. The overall levels of demand for our products, refining operations, and salesfuture planned re-refined oil products are driven by fluctuations in levels of such converted shares take place,end-user demand, which depend in large part on general macroeconomic conditions in the U.S., as well as regional economic conditions. For example, many of our principal consumers are themselves heavily dependent on general economic conditions, including the price of fuel and energy, availability of affordable credit and capital, employment levels, interest rates, consumer confidence and housing demand. These cyclical shifts in our common stockcustomers’ businesses may decline. result in fluctuations in demand, volumes, pricing and operating margins for our services and products.
In addition to our customers, the common stock issuable upon conversionsuppliers of the Series B Preferred Stock and Series B1 Preferred Stock may represent overhang thatour feedstock may also adversely affect the market price of our common stock. Overhang occurs when there is a greater supply of a company’s stockbe affected by downturns in the market than there is demand for that stock. When this happenseconomy and adverse changes in the price of feedstock. For example, we previously experienced difficulty obtaining feedstock from our suppliers who, because of prior sharp downturns in the Company’sprice of oil (used and otherwise) in 2015-16 saw their margins decrease substantially, which in some cases made it uneconomical for such suppliers to purchase feedstock from their suppliers and/or sell to us at the rates set forth in their contracts. Additionally, as a result of the impact of the COVID-19 outbreak, some of our feedstock suppliers have permanently or temporarily closed their businesses, limited our access to their businesses, and/or have experienced a decreased demand for services. As a result of the above, and due to ‘stay-at-home’ and other social distancing orders, as well as the decline in U.S. travel caused by COVID-19, we have seen a significant decline in the volume of feedstocks (specifically used oil) that we have been able to collect, and therefore process through our facilities. Any similar decline in the price of oil and/or the economy in general, including those which we are currently experiencing, will likely create a further decrease in the supply of feedstock, prevent us from maintaining our required levels of output and/or force us to seek additional suppliers of feedstock, who may charge more than our current suppliers, and therefore adversely affect our results of operations. We anticipate the above being exacerbated by the further uncertainty regarding the COVID-19 outbreak.A prolonged economic slowdown, period of social quarantine (imposed by the government or otherwise), or a prolonged period of decreased travel due to COVID-19 or the responses thereto, will likely continue to have a material negative adverse impact on our ability to produce products, and consequently our revenues and results of operations.
The risk factor entitled “Disruptions in the supply of feedstock and/or increases in the cost of feedstock could have an adverse effect on our business.”, from the Form 10-K is replaced and superseded by the following:
Disruptions in the supply of feedstock and/or increases in the cost of feedstock could have an adverse effect on our business.
We depend on the continuing availability of raw materials, including feedstock, to remain in production. Additionally, we depend on the price of such raw materials, including feedstock being reasonable to us in relation to the prices we are able to receive for our final products. As a result of the impact of the COVID-19 outbreak, some of our feedstock suppliers have permanently or temporarily closed their businesses, limited our access to their businesses, and/or have experienced a decreased demand for services. As a result of the above, and due to ‘stay-at-home’ and other social distancing orders, as well as the decline in U.S. travel caused by COVID-19, we have seen a significant decline in the volume of feedstocks (specifically used oil) that we have been able to collect, and therefore process through our facilities. A continued disruption in supply of feedstock, such as we are currently experiencing, or significant increases in the prices of feedstock, could significantly reduce the availability of raw materials at our plants and which are available to be processed by our third-party processors. Additionally, increases in production costs could have a material adverse effect on our business, results of operations and financial condition.
The risk factor entitled “Our reliance on small business customers causes us to be subject to the trends and downturns that impact small businesses, which could adversely affect our business.”, from the Form 10-K is replaced and superseded by the following:
Our reliance on small business customers causes us to be subject to the trends and downturns that impact small businesses, which could adversely affect our business.
Our feedstock customer base is primarily composed of small businesses in the vehicle repair and manufacturing industries. The high concentration of our feedstock customers that are small businesses exposes us to significant risk. Small businesses start, close, relocate, and are acquired and sold frequently. Small businesses have also been more significantly affected by decreased demand caused by COVID-19, the reduction in vehicle miles driven, and therefore, the reduction in the demand for oil change and vehicle repair services, as a result of ‘work-from-home’ mandates and recommendations and the overall decline in economic activity caused by COVID-19 and the efforts to curtail the spread of the virus. In addition, small businesses are often impacted more significantly by economic recessions when compared to larger businesses. As a result, we must continually identify new feedstock customers and expand our business with existing feedstock customers in order to sustain our growth and feedstock supply. If we experience a rise in levels of customer turnover, it may have a negative impact on the profitability of our business. We have also seen that our suppliers have been significantly impacted, both in their ability to operate, and the amount of feedstock they produce, due to the governmental responses to COVID-19 including stay-at-home orders and the reduced demand for their services relating thereto. In the event these decreases in feedstock continue, it will have a material adverse effect on our year-over-year results of operations, our ability to generate higher quality products for sale, the amount of feedstocks we are required to purchase from third parties, the demand for such third-party feedstocks, and therefore the price we are required to pay for such third party feedstocks, the amount of feedstock we have available for use in finished products, and consequently, our net income.
The risk factor entitled “The covenants in our credit and loan agreements restrict our ability to operate our business and might lead to a default under our credit agreements.”, from the Form 10-K is replaced and superseded by the following:
The covenants in our credit and loan agreements restrict our ability to operate our business and might lead to a default under our credit agreements.
Our debt agreements limit, among other things, our ability to:
•incur or guarantee additional indebtedness;
•create liens;
•make payments to junior creditors;
•make investments;
•sell material assets;
•affect fundamental changes in our structure;
•make certain acquisitions;
•sell interests in our subsidiaries;
•consolidate or merge with or into other companies or transfer all or substantially all of our assets;
•redeem or repurchase shares of our stock, will decrease,including our outstanding Series B and B1 Preferred Stock; and
•engage in transactions with affiliates.
Our credit agreements contain customary representations, warranties and requirements for the Company to indemnify the lenders and their affiliates. Our credit agreements also include various covenants (positive and negative) binding upon the Company, including, prohibiting us from undertaking acquisitions or dispositions unless they meet the criteria set forth in such credit agreements, not incurring any capital expenditures in amount exceeding $3 million in any fiscal year that the credit agreements are in place, and requiring us to maintain at least $2.0 million of borrowing availability under our revolving credit agreement at any time.
As a result of these covenants and limitations, we may not be able to respond to changes in business and economic conditions and to obtain additional sharesfinancing, if needed, and we may be prevented from engaging in transactions that might otherwise be beneficial to us. Our credit and loan agreements require, and our future credit facilities and loan agreements may require, us to maintain certain financial ratios and satisfy certain other financial condition tests. Our ability to meet these financial ratios and tests can be affected by events beyond our control, and we may not be able to meet those tests. The breach of any of these covenants could result in a default under our credit agreements or future credit facilities. Upon the occurrence of an event of default, the lenders could elect to declare all amounts outstanding under such credit agreements, including accrued interest or other obligations, to be immediately due and payable. If amounts outstanding under such credit agreements were to be accelerated, our assets might not be sufficient to repay in full that indebtedness and our other indebtedness.
Our credit agreements and loan agreements also contain cross-default and cross-acceleration provisions. Under these provisions, a default or acceleration under one instrument governing our debt may constitute a default under our other debt instruments that contain cross-default and cross-acceleration provisions, which shareholders attemptcould result in the related debt and the debt issued under such other instruments becoming immediately due and payable. In such event, we would need to raise funds from alternative sources, which funds might not be available to us on favorable terms, on a timely basis or at all. Alternatively, such a default could require us to sell assets and otherwise curtail operations to pay our creditors. The proceeds of such a sale of assets, or curtailment of operations, might not enable us to pay all of our liabilities.
A prolonged period of weak, or a significant decrease in, industry activity and overall markets, due to COVID-19 or otherwise, may make it difficult to comply with our covenants and the other restrictions in the agreements governing our debt and current global and market will only further decreaseconditions have increased the share price. If the share volume ofpotential for that difficulty.
The risk factor entitled “We do not anticipate redeeming our common stock cannot absorb converted shares sold by the Series B Preferred Stock and Series B1 Preferred Stock holders, then the value of our common stock will likely decrease.
The following are new risk factors which supplement the risk factors included in the Form 10-K:
Our Series B and B1 Preferred Stock Is Required to Be Redeemed on June 24, 2020, Subjectnotwithstanding the fact that our Series B and B1 Preferred Stock is required to be redeemed on June 24, 2020, subject to the Termsterms of the Certificate of Designations of Suchsuch Preferred Stock and Applicable Lawapplicable law, and the Dividend Ratedividend rate of such Preferred Stock Increasesincreases to 10% Per Annumper annum in the Eventevent the Company Is Unableis unable to Complete Such Redemptions.complete such redemptions.”, from the Form 10-K is replaced and superseded by the following:
We aredo not anticipate redeeming our Series B and B1 Preferred Stock in the near future.
We were required to redeem any non-converted shares of (a) Series B Preferred Stock, which remainremained outstanding on June 24, 2020, at the rate of $3.10 per share (or $11.9$12.7 million in aggregate as of the date of this filing); and (b) Series B1 Preferred Stock, which remainremained outstanding on June 24, 2020, at the rate of $1.56 per share (or $16.5$11.5 million in aggregate as of the date of this filing), subject to the terms of the certificate of designations of such Series B and B1 Preferred Stock and applicable law. The certificate of designations of the Series B and B1 Preferred Stock provide that the mandatory redemption date of the Series B and B1 Preferred Stock is automatically extended in the event that the terms of the Company’s senior credit facility (i.e., the Credit Agreements), prohibit the redemption of such Series B and B1 Preferred Stock and because the Credit Agreements prohibit such redemption, the Company anticipates the redemption date of the Series B and B1 Preferred Stock beinghas automatically been extended past June 24, 2020, until such date, if ever, as the Company’s senior credit facilities (and any facilities which replace or refinance the Credit Agreements) no longer prohibit such redemptions. Effective on June 24, 2020, in the event thedividend rate of such Series B and B1 Preferred Stock is not redeemed by the Company due to the provisions of the Company’s senior credit facilities, the dividend rate of such preferred stock increasesincreased to 10% per annum. Notwithstanding the dividend rate increase, because the interest is payable in-kind (or in registered shares of common stock, if allowed under the applicable certificate of designation of the preferred stock, at the option of the Company), the increase in dividend rate followingand the redemption date may cause significant additional shares of Series B and B1 Preferred Stock and/or common stock to be due to the holders of such Series B and B1 Preferred Stock andin connection therewith, may cause significant dilution to existing shareholders.
Notwithstanding the above, pursuant to the Nevada Revised Statutes, no redemption of the Series B or B1 Preferred Stock is allowed unless such redemption would not result in the Company (i) having less (a) assets than its (b) total liabilities plus the liquidation rights of any preferred stock or other preferred right holders and/or (ii) being unable to pay its debts as they become due after such redemption. Furthermore, the Series B and B1 Preferred Stock designations currently only provide for an ‘all or nothing’ type redemption, and as such, regardless of the compliance of the redemptions of the Series B and B1 Preferred Stock with the terms of the Company’s senior credit agreements, the Company anticipates being legally unable to redeem the Series B and B1 Preferred Stock due to the requirements of Nevada law and the ‘all or nothing’ requirement of such preferred stock.stock until such time as the Company has sufficient cash on hand to pay the entire liquidation preference of the Series B and B1 Preferred Stock ($24.3 million) and has sufficient cash left over to pay its debts as they become due.
Due to the above, the holders of the Series B and B1 Preferred Stock may be forced to hold such Series B and B1 Preferred Stock indefinitely and the Company may never be in a position to contractually or legally redeem the Series B and B1
Preferred Stock. The only rights of the holders of the Series B and B1 Preferred Stock in the event the Company is unable to redeem such
preferred stock due to the reasons above would be to continue to hold such preferred stock (with dividends accruing at 10% per annum), sell such preferred stock in private transactions, or convert such preferred stock into common stock pursuant to the terms thereof.
Finally, notwithstanding the prohibitions on redemptions described above, the Company does not currently have the funds required to redeem such Series B and B1 Preferred Stock (i.e., an aggregate of $28.4$24.2 million), and does not anticipate having such funds in the near term, if at all. Consequently, the Company does not anticipate redeeming the Series B and B1 Preferred Stock at any time in the foreseeable future.
The risk factor entitled “Unanticipated problems at, or downtime effecting, our facilities and those operated by third parties on June 24, 2020.
Our consolidated financial statements, includingwhich we rely, could have a material adverse effect on our liabilities and statementsresults of operations.”, from the Form 10-K is replaced and superseded by the following:
Unanticipated problems at, or downtime effecting, our facilities and those operated by third parties on which we rely, could have a material adverse effect on our results of operations.
Our ability to process feedstocks depends on our ability to operate our refining/processing operations and facilities, and those operated by third parties on which we rely, including, but not limited to KMTEX, and the total time that such facilities are subjectonline and operational. The occurrence of significant unforeseen conditions or events in connection with the operation or maintenance of such facilities, such as the need to quarterlyrefurbish such facilities, shortages of workers or materials, adverse weather, including, but not limited to lightning strikes, floods, hurricanes, tornadoes and earthquakes, equipment failures, fires, explosions, oil or other leaks, damage to or destruction of property and equipment associated therewith, environmental releases and/or damage, government regulation changes inaffecting the use of such facilities, terrorist attacks, mechanical or physical failures of equipment, acts of God, or other conditions or events, could prevent us from operating our derivative accountingfacilities, or prevent such third parties from operating their facilities, or could force us or such third parties to shut such facilities down for repairs, maintenance, refurbishment or upgrades for a significant period. In the event any of our outstanding Series Bfacilities or those of third parties on which we rely are offline for an extended period, it could have a material adverse effect on our results of operations and B1 Preferred Stockconsequently the price of our securities. For example, on October 7, 2020, we had a fire at our Marrero refinery which took the facility offline for repairs for about two weeks. The refinery suffered some minor structural damage along with piping, valves and warrants.instrumentation in the immediate area of the fire, the largest impact was the damage to the electrical conduit that feeds the power to the refinery equipment. As of October 26, 2020, the facility was back up and running and in the process of filing a claim with our insurance company. The Company believes that it maintains adequate insurance coverage.
In accordance with ASC 815-40-25The following are new risk factors which supplement the risk factors included in the Form 10-K:
Epidemics, including the recent outbreak of the COVID-19 coronavirus, and ASC 815-10-15, Derivativesother crises have, and Hedgingwill in the future, negatively impact our business and ASC 480-10-25, Liabilities-Distinguishing from Equity, convertible preferred sharesresults of operations.
Our revenues and cost of revenues are accounted for net, outsidesignificantly impacted by fluctuations in commodity prices; decreases in commodity prices typically result in decreases in revenue and cost of shareholders’ equityrevenues. Our revenue is to a large extent a function of the market discount we are able to obtain in purchasing feedstock, as well as how efficiently management conducts operations. Additionally, our sales volumes, and warrants are accounted for as liabilities at their fair value during periods where they can be net cash settled in case of a change in control transaction. The warrants are accounted for as a liability at their fair value at each reporting period. The valueresult, our results of operations and cash flows, significantly depend on the derivative warrant liability is re-measured at each reporting period with changes in fair value recorded in earnings. To derive an estimate of the fair value of these warrants,U.S. and to a Dynamic Black Scholes model is utilized which computes the impact of a possible change in control transaction upon the exercise of the warrant shares. This process relies upon inputs such as shares outstanding, our quoted stock prices, strike pricelesser extent, worldwide demand for oil and volatility assumptions to dynamically adjust the payoff of the warrants in the presence of the dilution effect.used oil. As a result, pandemics, epidemics, and public health crises, which effect the U.S. and the world as a whole, and which result in travel disruptions, reductions in shipping and therefore declines in the need for oil and used oil, will harm our consolidated financial statementsbusiness and cause our operating results to suffer. For example, beginning in December 2019 and continuing through the date of this filing, the outbreak of the COVID-19 coronavirus has resulted in decreased production in China and other countries around the world, as well as decreased demand for products and materials in general, and has consequently led to a decrease in global shipping. Furthermore, risks associated with the potential spread of the new strain of coronavirus has resulted in additional declines in shipping volumes with ships from oil tankers to container lines being turned away from ports, or held in quarantine, due to the fear of spreading the virus. The shipping segment has suffered even more as factories have been shut down across the world and travel restrictions have been put in place to control the spread of the coronavirus outbreak. It is anticipated that the diminished demand for transported goods as a result of such slowdown and shutdowns will continue to weigh on the shipping industry for months ahead.
Similarly, the recent economic slowdown and general market uncertainty caused by the COVID-19 coronavirus outbreak and the steps taken by local, state and federal governments to attempt to reduce the spread of, and effects of, such virus, have significantly reduced the demand for, and price of oil (which reached all-time lows earlier this year) and concurrent
therewith, the slowdown in the U.S. economy caused by stay-at-home and similar orders, has reduced the amount of feedstock being produced and as a result, our ability to obtain feedstocks, and produce finished products, which has had a material adverse effect on our year-over-year results of operations.
We are continuing to experience reductions to, and interruptions in, our ability to obtain and transport feedstock and in the demand for our finished products.
A public health pandemic, including COVID-19, poses the risk that the Company or its affiliates, employees, suppliers, customers and others may be prevented from conducting business activities for an indefinite period of time, including as a result of shutdowns, travel restrictions and other actions that may be requested or mandated by governmental authorities. Such actions may prevent the Company from accessing or operating its facilities, delivering products or continuing to obtain feedstocks. While a substantial portion of the Company’s businesses has been classified as an essential business in jurisdictions in which facility closures have been mandated, the Company can give no assurance that this will not change in the future or that the Company’s businesses will be classified as essential in each of the jurisdictions in which it operates.
It is also possible that the current outbreak or continued spread of COVID-19 will cause a global recession.
A prolonged period of weak, or a significant decrease in, industry activity and overall markets, due to COVID-19 or otherwise, may make it difficult to comply with our covenants and the other restrictions in the agreements governing our debt. Current global and market conditions have increased the potential for that difficulty.
Additionally, certain of the Company’s employees have been working from home, either to avoid the risk of catching the COVID-19 coronavirus, or due to stay-at-home orders issued by local governments where they live or work, and as a result, productivity may drop, which could impact revenues and profitability.
While the overall impact of the COVID-19 coronavirus on our results of operations at this point is uncertain, we anticipate that the factors discussed above and others, will have a negative effect on our results of operations for the fourth quarter of 2020 and into the 2021 year, depending on how long the global slowdown associated with the virus and its after effects last. Any one or more of the events described above could cause the value of our securities to decline in value.
We are not in compliance with the minimum bid price requirement of the Nasdaq Capital Market.
On April 22, 2020, we received written notice (the “Notification Letter”) from the Listing Qualifications Department of The NASDAQ Stock Market LLC (“Nasdaq”) notifying us that we were not in compliance with the minimum bid price requirements set forth in Nasdaq Listing Rule 5550(a)(2) for continued listing on The Nasdaq Capital Market. Nasdaq Listing Rule 5550(a)(2) requires listed securities to maintain a minimum bid price of $1.00 per share, and Listing Rule 5810(c)(3)(A) provides that a failure to meet the minimum bid price requirement exists if the deficiency continues for a period of thirty (30) consecutive business days. Based on the closing bid price of the Company’s common stock for the thirty (30) consecutive business days prior to the date of the Notification Letter, the Company no longer meets the minimum bid price requirement.
However, given the unprecedented turmoil in U.S. and world financial markets over the last few months, Nasdaq has determined to toll the compliance periods for the bid price and market value of publicly held shares requirements through June 30, 2020. The Notification Letter does not impact the Company’s listing on The Nasdaq Capital Market at this time. The Notification Letter states that the Company has 180 calendar days (beginning after the end of the tolling period, which ends on July 1, 2020), or until December 28, 2020, to regain compliance with Nasdaq Listing Rule 5550(a)(2). To regain compliance, the bid price of the Company’s common stock must have a closing bid price of at least $1.00 per share for a minimum of 10 consecutive business days. If the Company does not regain compliance by December 28, 2020, an additional 180 days may fluctuate quarterly, based on factors, suchbe granted to regain compliance, so long as the Company meets The Nasdaq Capital Market initial listing criteria (except for the bid price requirement) and notifies Nasdaq in writing of its intention to cure the deficiency during the second compliance period by effecting a reverse stock split, if necessary. If the Company does not qualify for the second compliance period or fails to regain compliance during the second 180-day period, the Company’s common stock will be subject to delisting, at which point the Company would have an opportunity to appeal the delisting determination to a Hearings Panel.
The Company intends to monitor the closing bid price of its common stock and may, if appropriate, consider implementing available options to regain compliance with the minimum bid price requirement under the Nasdaq Listing Rules. Management remains vigilant with the Company’s business strategy and is continuing to take steps to increase liquidity.
In the event we are delisted from the Nasdaq Capital Market, stockholders may have a difficult time getting a quote for the sale or purchase of our stock, the sale or purchase of our stock would likely be made more difficult and the trading volume
and liquidity of our stock could decline. Delisting from the Nasdaq Capital Market could also result in negative publicity and could also make it more difficult for us to raise additional capital. The absence of such a listing may adversely affect the acceptance of our common stock as currency or the value accorded by other parties. Further, if we are delisted, we would also incur additional costs under state blue sky laws in connection with any sales of our securities. These requirements could severely limit the market liquidity of our common stock and certain assumptions, which are outsidethe ability of our control. Consequently,stockholders to sell our liabilities and consolidated statementscommon stock in the secondary market. If our common stock is delisted by Nasdaq, our common stock may be eligible to trade on an over-the-counter quotation system, such as the OTCQB market, where an investor may find it more difficult to sell our stock or obtain accurate quotations as to the market value of operationsour common stock. In the event our common stock is delisted from the Nasdaq Capital Market, we may vary quarterly, basednot be able to list our common stock on factors other than the Company’s revenues and expenses. The liabilities and accounting line itemsanother national securities exchange or obtain quotation on an over-the counter quotation system.
We may not qualify for forgiveness of our PPP Loan. We face risks associated with our derivative securitiessuch PPP Loan.
On May 5, 2020, we received a $4.222 million loan (the “PPP Loan”) from Texas Citizens Bank, NA (the “PPP Lender”), pursuant to the Paycheck Protection Program (the “PPP”) under the Coronavirus Aid, Relief, and Economic Security Act (the “CARES Act”). The PPP Loan is evidenced by a promissory note (the “PPP Note”), dated effective April 28, 2020, issued by the Company to the PPP Lender. The PPP Note is unsecured, matures on our balance sheetApril 28, 2022, and statementbears interest at a rate of operations1.00% per annum, payable monthly commencing on November 15, 2020, following an initial deferral period as specified under the PPP. The PPP Note may be prepaid at any time prior to maturity with no prepayment penalties. Proceeds from the PPP Loan will be available to the Company to fund designated expenses, including certain payroll costs, rent, utilities and other permitted expenses, in accordance with the PPP. Under the terms of the PPP, up to the entire amount of principal and accrued interest may be forgiven to the extent loan proceeds are non-cash items,used for qualifying expenses as described in the CARES Act and applicable implementing guidance issued by the inclusionU.S. Small Business Administration under the PPP (including that up to 60% of such itemsPPP Loan funds are used for payroll). The Company intends to use the entire PPP Loan amount for designated qualifying expenses and to apply for forgiveness of the respective PPP Loan in accordance with the terms of the PPP. Notwithstanding that, the Company may not qualify for forgiveness of the PPP Loan in whole or part and may be required to repay such PPP Loan in full. With respect to any portion of the PPP Loan that is not forgiven, the PPP Loan will be subject to customary provisions for a loan of this type, including customary events of default relating to, among other things, payment defaults, breaches of the provisions of the PPP Note and cross-defaults on any other loan with the PPP Lender or other creditors. In the event the PPP Loan is not forgiven, the debt service payments on such loan may negatively affect our financial statementsability to grow our operations, service other debt and/or pay our expenses as they come due. Furthermore, any default under the PPP Loan may materially affect the outcomerequire us to pay a significant amount of our quarterly and annual results, even thoughavailable cash and/or cash flow to service such items are non-cash and do not affect the cash we have available for operations. Investors should take such derivative accounting matters and other non-cash items into account when comparing our quarter-to-quarter and year-to-year operating results and financial statements.
We have identified material weaknesses in our disclosure controls and procedures and internal control over financial reporting. If not remediated, our failure to establish and maintain effective disclosure controls and procedures and internal control over financial reporting could result in material misstatements in our financial statements and a failure to meet our reporting and financial obligations, each ofdebt, which could have a material adverse effect on our financial condition and the trading price of our common stock.
Maintaining effective internal control over financial reporting and effective disclosure controls and procedures are necessary for us to produce reliable financial statements. As reported above, as of September 30, 2019, our CEO and CFO have determined that our disclosure controls and procedures were not effective, and such disclosure controls and procedures have not been deemed effective since approximately September 30, 2018. Separately, management assessed the effectivenessoperations. Any failure of the Company’s internal control over financial reporting as of December 31, 2018 and determined that such internal control over financial reporting was not effective as a result of such assessment.
A material weakness is a deficiency, PPP Loan to be forgiven pursuant to its terms, and/or a combination of deficiencies,our requirement to repay the PPP Loan in internal control over financial reporting, such that there is a reasonable possibility that a material misstatement ofwhole or part, could cause the Company's annual or interim financial statements will not be prevented or detected on a timely basis. A control deficiency exists when the design or operation of a control does not allow management or employees, in the normal course of performing their assigned functions, to prevent or detect misstatements on a timely basis.
Maintaining effective disclosure controls and procedures and effective internal control over financial reporting are necessary for us to produce reliable financial statements and the Company is committed to remediating its material weaknesses in such controls as promptly as possible. However, there can be no assurance as to when these material weaknesses will be remediated or that additional material weaknesses will not arise in the future. Any failure to remediate the material weaknesses, or the development of new material weaknesses in our internal control over financial reporting, could result in material misstatements in our financial statements and cause us to fail to meet our reporting and financial obligations, which in turn could have a material adverse effect on our financial condition and the trading price ofvalue our common stock and/or resultto decline in litigation against us or our management. In addition, even ifvalue. Separately, we are successful in strengthening our controls and procedures, those controls and procedures may not be adequate to prevent or identify irregularities or facilitate the fair presentation of our financial statements or our periodic reports filedface risks associated with the SEC.
Tensile-Heartlandfact that the Treasury Department and a House oversight subcommittee has discretion asrecently requested that certain large public companies return prior PPP Loans which have been obtained by such public companies and Treasury Secretary Steven Mnuchin has warned that public companies receiving loans over $2 million would be audited and could have potential criminal liability if their certifications (required to whether or not to move forwardobtain such loans) were untrue. As a result, we could face penalties in connection with the Heartland Closing.
Tensile-Heartland may decide to move forward with the Heartland Share Purchase and related transactions at any time prior to June 30, 2020, in its sole discretion (the “Heartland Option”). We have no control over whether Tensile-Heartland exercises such Heartland Option. In the event Heartland-Tensile does not exercise the Heartland Option, we will not realize any of the benefits from the Heartland Share Purchase and related transactions.
Failure to complete the Heartland Closing could negatively impact our stock price, future business and financial results.
If the Heartland Closing is not completed, our ongoing business may be adversely affected and we would be subject to a number of risks, including the following:
we will not realize the benefits expected from the Heartland Closing, including a potentially enhanced competitive and financial position, expansion of assets and operations and therefore opportunities, and will instead be subject to all the risks we currently face as an independent company;
we may experiencePPP Loan and/or negative reactions from the financial markets andpublic associated with our partners and employees; and
matters relating to the Heartland Closing (including negotiationPPP Loan, either of definitive documents and integration planning) may require substantial commitments of time and resources by our management, which would otherwise have been devoted to other opportunities that may have been beneficial to us as an independent company.
Failure to affect the Heartland Closing could negatively impact the Company.
In the event the Heartland Option is not exercised and/or the Heartland Closing does not occur, our business may be adversely impacted by our failure to pursue other beneficial opportunities, due to the focus of management on the Heartland transaction, and the market price of our common stock might decline to the extent that the current market price reflects a market assumption that the Heartland Closing will be completed. If the Heartland Closing is terminated and our board of directors seeks another transaction or business combination, our stockholders cannot be certain that we will be able to find a party willing to offer equivalent or more attractive consideration than the consideration provided for by the Heartland Closing.
We will be subject to business uncertainties and restrictions while the Heartland Option is pending.
Until such time as Tensile-Heartland exercises, or terminates, the Heartland Option, we will be unable to enter into or affect any transactions regarding the Company’s Columbus, Ohio, Heartland facility, which produces a base oil product that is sold to lubricant packagers and distributors, which is subject to the Heartland Option. Uncertainty about the effect of the Heartland Closing on employees and partners may have an adverse effect on us. These uncertainties may impair our ability to attract, retain and motivate key personnel until the Heartland Closing is completed or the Heartland Option is terminated, and could cause partners and others that deal with us to seek to change existing business relationships, cease doing business with us or cause potential new partners to delay doing business with us until the Heartland Closing has been successfully completed or the Heartland Option is terminated. Retention of certain employees may be challenging during the pendency of the Heartland Option, as certain employees may experience uncertainty about their future roles or compensation structure. If key employees depart because of issues relating to the uncertainty and difficulty of integration or a desire not to remain with the business, our business following the Heartland Closing could be negatively impacted.
If the benefits of the Heartland Closing do not meet the expectations of the marketplace, or financial or industry analysts, the market price of our common stock may decline.
Even if the Heartland Closing occurs, the market price of our common stock may decline, if we are not otherwise able to achieve the perceived benefits of the Heartland Closing as rapidly as, or to the extent, anticipated by the marketplace, or financial or industry analysts. Accordingly, investors may experience a loss as a result of a decreasing stock price and we may not be able to raise future capital, if necessary, in the equity markets.
The Lock-Up Agreement with Tensile includes termination rights.
We and Tensile entered into a Registration Rights and Lock-Up Agreement, pursuant to which we agreed to use commercially reasonable efforts to register the Tensile Shares and Warrant Shares prior to the end of the Initial Lock-Up and Tensile agreed to not sell any of the Tensile Shares or Warrant Shares for a period of one year following the Closing Date and to
sell no more than 300,000 of such Tensile Shares and Warrant Shares in any 90 day period during the four years thereafter, each, subject to certain exemptions set forth therein. The Initial Lock-Up, but not the Volume Limitation, terminates if (i) the Heartland Closing does not occur by June 30, 2020 and/or (ii) if our common stock is not traded on Nasdaq or a similar market for a period of more than five consecutive trading days. Upon any termination of the lock-up pursuant to the preceding sentence, in the event Tensile holds any Tensile Shares, Warrant Shares or any Warrants, we are required to disclose publicly all material nonpublic information disclosed to Tensile prior to the date of such termination. The sale by Heartland of common stock into the marketplace, in the event of the termination of the terms of the Lock-Up Agreement may result in a decrease in the then trading values of our common stock. Furthermore, the required disclosure of material nonpublic information, if required by the terms of the Lock-Up Agreement, could have a material adverse effect on our ability to compete in our industry, require the disclosure of proprietary and other information, and/or may cause the value of our common stock to decline in value.
The MG Company Agreement includes redemption rights.
The MG SPV Class B Unit holders may force MG SPV to redeem the outstanding Class B Units at any time on or after the earlier of (a) the fifth anniversary of the Closing Date and (ii) the occurrence of an applicable triggering event. The cash purchase price for such redeemed Class B Units is the greater of (y) the fair market value of such units (without discount for illiquidity, minority status or otherwise) as determined by a qualified third party and (z) the original per-unit price for such Class B Units plus fifty percent (50%) of the aggregate capital invested by the Class B Unit holders through such redemption date. MG SPV may not have sufficient funds to redeem such Class B Units on such required redemption date and/or the Company may be forced to advance funds to MG SPV to allow it to complete such redemption, if such redemption is triggered.
We use derivative commodity instruments to attempt to hedge against fluctuating prices.
The Company utilizes derivative instruments to manage its exposure to fluctuations in the underlying commodity prices of its inventory. The Company's management sets and implements hedging policies, including volumes, types of instruments and counterparties, to support oil prices at targeted levels and manage its exposure to fluctuating prices. The Company’s derivative instruments consist of swap and futures arrangements for oil. In a commodity swap agreement, if the agreed-upon published third-party index price (“index price”) is lower than the swap fixed price, the Company receives the difference between the index price and the swap fixed price. If the index price is higher than the swap fixed price, the Company pays the difference. For futures arrangements, the Company receives the difference, positive or negative, between an agreed-upon strike price and the market price. Our results of operations may be negatively affected by our derivative instruments.
Item 2. Recent Sales of Unregistered Securities
There have been no sales of unregistered securities during the quarter ended September 30, 20192020 and from the period from OctoberJuly 1, 20192020 to the filing date of this report, which have not previously been disclosed in a Currentthe Company’s Quarterly Report on Form 8-K,10-Q for the quarter ended June 30, 2020, except as set forth below:
For the period from July 1, 20192020 to September 30, 2019,2020, a total of approximately $175,305$310,220 of dividends accrued on our outstanding Series B Preferred Stock and for the period from July 1, 20192020 to September 30, 2019,2020, a total of approximately $243,777$281,557 of dividends accrued on our outstanding Series B1 Preferred Stock. We chose to pay such dividends in-kind by way of the issuance of 56,550100,071 restricted shares of Series B Preferred Stock pro rata to each of the then holders of our Series B Preferred Stock in October 20192020 and the issuance of 156,276180,485 restricted shares of Series B1 Preferred Stock pro rata to each of the then holders of our Series B1 Preferred Stock in October 2019.2020. The maximum number of shares of common stock issuable upon conversion of the 56,550100,071 shares of Series B Preferred Stock issued in lieu of September 30, 20192020 dividends, if converted in full, would total 56,550100,071 shares of common stock and the maximum number of shares of common stock issuable upon conversion of the 156,276180,485 shares of Series B1 Preferred Stock issued in lieu of September 30, 20192020 dividends, if converted in full, would total 156,276180,485 shares of common stock.
As the issuance of the Series B Preferred Stock and Series B1 Preferred Stock in-kind in satisfaction of the dividends did not involve a “sale” of securities under Section 2(a)(3) of the Securities Act, we believe that no registration of such securities, or exemption from registration for such securities, was required under the Securities Act. Notwithstanding the above, to the extent such shares are deemed “sold or offered”, we claim an exemption from registration pursuant to Section 4(a)(2) and/or Rule 506 of Regulation D of the Securities Act, since the transaction did not involve a public offering, the recipients were “accredited investors”, and acquired the securities for investment only and not with a view towards, or for resale in connection with, the public sale or distribution thereof. The securities are subject to transfer restrictions, and the certificates evidencing the securities contain an appropriate legend stating that such securities have not been registered under the Securities Act and may not be offered or sold absent registration or pursuant to an exemption therefrom. The securities were not registered under the Securities Act and such securities may not be offered or sold in the United States absent registration or an exemption from registration under the Securities Act and any applicable state securities laws.
As a result of the issuances described above, there are 419,859 outstanding shares of Series A Convertible Preferred Stock issued and outstanding as of the date of this Report, and the maximum number of shares of common stock which may be issued, if such shares were converted in full, totals 419,859 shares of common stock; 3,826,0554,102,690 outstanding shares of Series B Convertible Preferred Stock issued and outstanding as of the date of this Report, and the maximum number of shares of common stock which may be issued, if such shares were converted in full, totals 3,826,0554,102,690 shares of common stock; and 10,574,2427,399,649 outstanding shares of Series B1 Convertible Preferred Stock issued and outstanding as of the date of this Report, and the maximum number of shares of common stock which may be issued, if such shares were converted in full, totals 10,574,2427,399,649 shares of common stock.
On October 9, 2019, the Board of Directors granted one employee options to purchase an aggregate of 75,000 shares of common stock at an exercise price of $1.13 per share with a 5 year term (subject to continued employment), vesting at the rate of 1/4th of such options per year on the first 4 anniversaries of the grant, under our 2013 Stock Incentive Plan, as amended, in consideration for services rendered and to be rendered to the Company.
On October 29, 2019, the Board of Directors granted the same employee options to purchase an aggregate of 125,000 shares of common stock at an exercise price of $1.00 per share with a 5 year term (subject to continued employment), vesting at the rate of 1/4th of such options per year on the first 4 anniversaries of the grant, under our 2019 Equity Incentive Plan, in consideration for services rendered and to be rendered to the Company.
To the extent such grants constituted ‘offers’ and ‘sales’ of securities, if at all, we claim an exemption from registration pursuant to Section 4(a)(2) and/or Rule 506 of Regulation D of the Securities Act, since the transaction did not involve a public offering, the recipient acquired the securities for investment only and not with a view towards, or for resale in connection with, the public sale or distribution thereof. The securities are subject to transfer restrictions, and the certificates evidencing the securities contain an appropriate legend stating that such securities have not been registered under the Securities Act and may not be offered or sold absent registration or pursuant to an exemption therefrom. The securities were not registered under the Securities Act and such securities may not be offered or sold in the United States absent registration or an exemption from registration under the Securities Act and any applicable state securities laws.
Use of Proceeds Fromfrom Sale of Registered Securities
None.
Issuer Purchases of Equity Securities
None.
Item 3. Defaults Upon Senior Securities
None.
Item 4. Mine Safety Disclosures
Not applicable.
Item 5. Other Information.
None.
Item 6. Exhibits
See the Exhibit Index following the signature page to this Quarterly Report on Form 10-Q for a list of exhibits filed or furnished with this report, which Exhibit Index is incorporated herein by reference.
|
| | | | | | | | | | | | | | | |
| | EXHIBIT INDEX |
| | Incorporated by Reference |
| | Exhibit Number | | Description of Exhibit | | Filed or Furnished Herewith | | Form | | Exhibit | | Filing Date/Period End Date | | File No. |
| |
| | 2.1+ |
| | | | | | 8-K | | 2.1 |
| | 7/31/2019 | | 001-11476 |
| | 2.2+ |
| | | | | | 8-K | | 2.2 |
| | 7/31/2019 | | 001-11476 |
| | 3.1 |
| | | | | | 8-K | | 3.1 |
| | 4/29/2019 | | 001-11476 |
| | 10.1 | % | | | | | | 8-K | | 10.1 |
| | 7/31/2019 | | 001-11476 |
| | 10.2 |
| | | | | | 8-K | | 10.2 |
| | 7/31/2019 | | 001-11476 |
| | 10.3 | % | | | | | | 8-K | | 10.3 |
| | 7/31/2019 | | 001-11476 |
| | 10.4 |
| | | | | | 8-K | | 10.4 |
| | 7/31/2019 | | 001-11476 |
| | 10.5 |
| | | | | | 8-K | | 10.5 |
| | 7/31/2019 | | 001-11476 |
| | 10.6#% |
| | | | | | 8-K | | 10.6 |
| | 7/31/2019 | | 001-11476 |
| | 10.7 |
| | | | | | 8-K | | 10.7 |
| | 7/31/2019 | | 001-11476 |
| | 10.8 | % | | | | | | 8-K | | 10.8 |
| | 7/31/2019 | | 001-11476 |
| | 10.9 | % | | | | | | 8-K | | 10.9 |
| | 7/31/2019 | | 001-11476 |
| | 10.10 |
| | | | | | 8-K | | 10.1 |
| | 10/29/2019 | | 001-11476 |
| | 31.1 |
| | | | X | | | | | | | | |
| | | | | | | | | | | | | | | | | | | | | | | | | | | | | | | | | | | | | | |
| EXHIBIT INDEX |
| Incorporated by Reference |
| Exhibit Number | | Description of Exhibit | | Filed or Furnished Herewith | | Form | | Exhibit | | Filing Date/Period End Date | | File No. |
|
| 2.1(+) | | | | | | 8-K | | 2.1 | | | 1/24/2020 | | 001-11476 |
| 10.1 | | | | | | | 8-K | | 10.1 | | | 1/13/2020 | | 001-11476 |
| 10.2 | | | | | | | 8-K | | 10.2 | | | 2/13/2020 | | 001-11476 |
| 10.3 | | | | | | | 8-K | | 10.1 | | | 4/24/2020 | | 001-11476 |
| 10.4 | | | | | | | 8-K | | 10.2 | | | 4/24/2020 | | 001-11476 |
| 10.5 | | | | | | | 8-K | | 10.1 | | | 11/1/2019 | | 001-11476 |
| 10.6 | | | | | | | 8-K | | 10.2 | | | 2/23/2020 | | 001-11476 |
| 10.7 | | | | | | | 8-K | | 10.3 | | | 2/23/2020 | | 001-11476 |
| 10.8 | | | | | | | 10-Q | | 10.8 | | 8/11/2020 | | 001-11476 |
| 31.1 | | | | | X | | | | | | | | |
| 31.2 | | | | | X | | | | | | | | |
| 32.1 | | | | | X | | | | | | | | |
| 32.2 | | | | | X | | | | | | | | |
| 99.1 | | | | | | | 10-K | | 99.1 | | | 12/31/2012 | | 001-11476 |
| 101.INS | | XBRL Instance Document | | X | | | | | | | | |
| 101.SCH | | XBRL Taxonomy Extension Schema Document | | X | | | | | | | | |
| 101.CAL | | XBRL Taxonomy Extension Calculation Linkbase Document | | X | | | | | | | | |
| 101.DEF | | XBRL Taxonomy Extension Definition Linkbase Document | | X | | | | | | | | |
| 101.LAB | | XBRL Taxonomy Extension Label Linkbase Document | | X | | | | | | | | |
|
| | | | | | | | | | | | | | |
| 31.2 |
| | | | X | | | | | | | | |
| 32.1 |
| | | | X | | | | | | | | |
| 32.2 |
| | | | X | | | | | | | | |
| 99.1 |
| | | | | | 10-K | | 99.1 |
| | 12/31/2012 | | 001-11476 |
| 101.INS | | XBRL Instance Document | | X | | | | | | | | |
| 101.SCH | | XBRL Taxonomy Extension Schema Document | | X | | | | | | | | |
| 101.CAL | | XBRL Taxonomy Extension Calculation Linkbase Document | | X | | | | | | | | |
| 101.DEF | | XBRL Taxonomy Extension Definition Linkbase Document | | X | | | | | | | | |
| 101.LAB | | XBRL Taxonomy Extension Label Linkbase Document | | X | | | | | | | | |
| 101.PRE | | XBRL Taxonomy Extension Presentation Linkbase Document | | X | | | | | | | | |
| | | | | | | | | | | | | | | | | | | | | | | | | | | | | | | | | | | | | | |
| 101.PRE | | XBRL Taxonomy Extension Presentation Linkbase Document | | X | | | | | | | | |
* Filed herewith.
** Furnished herewith.
+ Certain schedules and exhibits have been omitted pursuant to Item 601(b)(2) of Regulation S-K. A copy of any omitted schedule or exhibit will be furnished supplementally to the Securities and Exchange Commission upon request; provided, however that Vertex Energy, Inc. may request confidential treatment pursuant to Rule 24b-2 of the Securities Exchange Act of 1934, as amended, for any schedule or exhibit so furnished.
# Certain confidential portions of this Exhibit were omitted by means of marking such portions with brackets (“[****]”) because the identified confidential portions (i) are not material and (ii) would be competitively harmful if publicly disclosed.
% Certain schedules, annexes and similar attachments have been omitted pursuant to Item 601(a)(5) of Regulation S-K. A copy of any omitted schedule or exhibit will be furnished supplementally to the Securities and Exchange Commission upon request; provided, however that Vertex Energy, Inc. may request confidential treatment pursuant to Rule 24b-2 of the Securities Exchange Act of 1934, as amended, for any schedule or exhibit so furnished.
SIGNATURES
Pursuant to the requirements of the Securities Exchange Act of 1934, the registrant has duly caused this Report to be signed on its behalf by the undersigned, hereunto duly authorized.
|
| | | | |
| VERTEX ENERGY, INC. |
| |
Date: November 7, 20199, 2020 | By: /s/ Benjamin P. Cowart |
| Benjamin P. Cowart |
| Chief Executive Officer |
| (Principal Executive Officer) |
| |
| |
Date: November 7, 20199, 2020 | By: /s/ Chris Carlson |
| Chris Carlson |
| Chief Financial Officer |
| (Principal Financial/Accounting Officer) |