00014658859/30/2020false12/312020Q31,8531,756,917182,125292,61341,05580,0311,096,9971,375,86016,33333,26916,82834,897323,651350,213001,636,460681,643207,852142,9056606470.010.01500,000,000500,000,00060,812,70153,523,8760.010.01100,000,000100,000,00000100,00001,096,9971,375,86015,31931,74816,82834,89772,69990,7881,636,460681,643207,852142,9056606472,647964520344083.014.003.014.004.015.004.015.005.016.005.016.006.017.006.017.007.018.007.018.001,124,0511,375,86015,31931,74816,82834,8977.019.009.0111.0011.0113.0017.0119.009.0111.0011.0113.0013.0115.0015.0117.0017.0119.0022 months, 2 days0025 months, 24 days5 months, 18 days2005 months, 18 days4.54.759.253.023.753.753.754.854.254.04.10.0000831947P1Y67673003333330001465885srt:HotelMemberwmc:InterestOnlyFirstMortgageMemberwmc:SecuritizedCommercialLoanMemberwmc:CRENineMemberwmc:CRELLCAndCREMezzMember2020-09-30
UNITED STATES
SECURITIES AND EXCHANGE COMMISSION
Washington, D.C. 20549
FORM 10-Q
(Mark One)
| | | | | |
| ☒ | Quarterly Report Pursuant to Section 13 or 15(d) of the Securities Exchange Act of 1934 |
For the quarterly period ended September 30, 20202021
| | | | | |
| ☐ | Transition Report Pursuant to Section 13 or 15(d) of the Securities Exchange Act of 1934 |
For the transition period from to
Commission File Number: 001-35543
Western Asset Mortgage Capital Corporation
(Exact name of Registrant as specified in its charter)
| | | | | | | | |
| Delaware | | 27-0298092 |
(State or other jurisdiction of
incorporation or organization) | | (IRS Employer
Identification Number) |
Western Asset Mortgage Capital Corporation
385 East Colorado Boulevard
Pasadena, California 91101
(Address of Registrant’s principal executive offices)
(626) 844-9400
(Registrant’s telephone number, including area code)
Indicate by check mark whether the registrant (1) has filed all reports required to be filed by Section 13 or 15(d) of the Securities Exchange Act of 1934 during the preceding 12 months (or for such shorter period that the registrant was required to file such reports), and (2) has been subject to such filing requirements for the past 90 days. Yes ý No o
Indicate by check mark whether the registrant has submitted electronically every Interactive Data File required to be submitted and posted pursuant to Rule 405 of Regulation S-T (§232.405 of this chapter) during the preceding 12 months (or for such shorter period that the registrant was required to submit such files). Yes ý No o
Indicate by check mark whether the registrant is a large accelerated filer, an accelerated filer, a non-accelerated filer, a smaller reporting company or an emerging growth company. See the definitions of “large accelerated filer,” “accelerated filer,” “smaller reporting company,” and "emerging growth company" in Rule 12b-2 of the Exchange Act.
| | | | | | | | | | | | | | |
| Large accelerated filer | o | | Accelerated filer | x |
| Non-accelerated filer | o | | Smaller reporting company | ☐x |
| | | Emerging growth company | ☐ |
If an emerging growth company, indicate by check mark if the registrant has elected not to use the extended transition period for complying with any new or revised financial accounting standards provided pursuant to Section 13(a) of the Exchange Act. o
Indicate by check mark whether the registrant is a shell company (as defined in Rule 12b-2 under the Securities Exchange Act of 1934). Yes ☐ No ý
Securities registered pursuant to Section 12(b) of the Act:
| | | | | | | | | | | | | | |
| Title of Each Class | | Trading Symbol(s) | | Name of Each Exchange on Which Registered |
| Common Stock, $0.01 par value | | WMC | | New York Stock Exchange |
Indicate the number of shares outstanding of each of the issuer’s classes of common stock, as of the latest practical date.
As of November 4, 20203, 2021 there were 60,812,70160,859,913 shares, par value $0.01, of the registrant’s common stock outstanding.
TABLE OF CONTENTS
Part I
ITEM I. Financial Statements
Western Asset Mortgage Capital Corporation and Subsidiaries
Consolidated Balance Sheets
(in thousands—except share and per share data)
(Unaudited)
| | | | | | | | | | | |
| | September 30,
2020 | | December 31, 2019 |
| Assets: | | | |
| Cash and cash equivalents | $ | 27,459 | | | $ | 31,331 | |
| Restricted cash | 95,579 | | | 52,948 | |
| Agency mortgage-backed securities, at fair value ($1,853 and $1,756,917 pledged as collateral, at fair value, respectively) | 1,853 | | | 1,795,255 | |
| Non-Agency mortgage-backed securities, at fair value ($182,125 and $292,613 pledged as collateral, at fair value, respectively) | 207,137 | | | 361,833 | |
| Other securities, at fair value ($41,055 and $80,031 pledged as collateral, at fair value, respectively) | 41,055 | | | 80,161 | |
| Residential Whole Loans, at fair value ($1,096,997 and $1,375,860 pledged as collateral, at fair value, respectively) | 1,096,997 | | | 1,375,860 | |
| Residential Bridge Loans ($16,333 and $33,269 at fair value and $16,828 and $34,897 pledged as collateral, respectively) | 17,841 | | | 36,419 | |
| Securitized commercial loans, at fair value | 1,687,545 | | | 909,040 | |
| Commercial Loans, at fair value ($325,651 and $350,213 pledged as collateral, at fair value, respectively) | 325,651 | | | 370,213 | |
| | | |
| Investment related receivable | 18,861 | | | 19,931 | |
| Interest receivable | 14,101 | | | 19,413 | |
| Due from counterparties | 1,192 | | | 98,947 | |
| Derivative assets, at fair value | 481 | | | 5,111 | |
| Other assets | 4,418 | | | 4,509 | |
Total Assets (1) | $ | 3,540,170 | | | $ | 5,160,971 | |
| | | |
| Liabilities and Equity: | | | |
| Liabilities: | | | |
| Repurchase agreements, net | $ | 358,525 | | | $ | 2,824,801 | |
| Convertible senior unsecured notes, net | 194,510 | | | 197,299 | |
| Securitized debt, net ($1,636,460 and $681,643 at fair value and $207,852 and $142,905 held by affiliates, respectively) | 2,602,909 | | | 1,477,454 | |
| Interest payable (includes $660 and $647 on securitized debt held by affiliates, respectively) | 8,840 | | | 15,001 | |
| | | |
| Due to counterparties | 17 | | | 709 | |
| Derivative liability, at fair value | 1,166 | | | 6,370 | |
| Accounts payable and accrued expenses | 3,992 | | | 3,188 | |
| Payable to affiliate | 3,255 | | | 2,148 | |
| Dividend payable | 3,041 | | | 16,592 | |
| Other liabilities | 116,124 | | | 52,948 | |
Total Liabilities (2) | 3,292,379 | | | 4,596,510 | |
| | | |
| Commitments and contingencies | | | |
| | | |
| Stockholders’ Equity: | | | |
| Common stock: $0.01 par value, 500,000,000 shares authorized, 60,812,701 and 53,523,876 outstanding, respectively | 609 | | | 535 | |
| Preferred stock, $0.01 par value, 100,000,000 shares authorized and no shares outstanding | 0 | | | 0 | |
| Treasury stock, at cost, 100,000 and 0 shares held, respectively | (578) | | | 0 | |
| Additional paid-in capital | 915,258 | | | 889,227 | |
| Retained earnings (accumulated deficit) | (667,500) | | | (325,301) | |
| Total Stockholders’ Equity | 247,789 | | | 564,461 | |
| Non-controlling interest | 2 | | | 0 | |
| Total Equity | 247,791 | | | 564,461 | |
| Total Liabilities and Equity | $ | 3,540,170 | | | $ | 5,160,971 | |
| | | | | | | | | | | |
| | September 30,
2021 | | December 31, 2020 |
| Assets: | | | |
| Cash and cash equivalents | $ | 63,916 | | | $ | 31,613 | |
| Restricted cash | 260 | | | 76,132 | |
| Agency mortgage-backed securities, at fair value ($1,342 and $1,708 pledged as collateral, at fair value, respectively) | 1,342 | | | 1,708 | |
| Non-Agency mortgage-backed securities, at fair value ($153,460 and $167,970 pledged as collateral, at fair value, respectively) | 162,661 | | | 189,462 | |
| Other securities, at fair value ($52,093 and $48,754 pledged as collateral, at fair value, respectively) | 52,093 | | | 48,754 | |
| Residential Whole Loans, at fair value ($949,417 and $1,008,782 pledged as collateral, at fair value, respectively) | 949,417 | | | 1,008,782 | |
| Residential Bridge Loans ($5,960 and $12,813 at fair value and $5,960 and $12,960 pledged as collateral, respectively) | 5,960 | | | 13,916 | |
| Securitized commercial loans, at fair value | 1,377,005 | | | 1,605,335 | |
| Commercial Loans, at fair value ($101,271 and $310,523 pledged as collateral, at fair value, respectively) | 128,766 | | | 310,523 | |
| | | |
| Investment related receivable | 27,586 | | | 30,576 | |
| Interest receivable | 10,726 | | | 13,568 | |
| Due from counterparties | 2,842 | | | 2,327 | |
| Derivative assets, at fair value | 94 | | | 161 | |
| Other assets | 46,676 | | | 3,152 | |
Total Assets (1) | $ | 2,829,344 | | | $ | 3,336,009 | |
| | | |
| Liabilities and Equity: | | | |
| Liabilities: | | | |
| Repurchase agreements, net | $ | 483,268 | | | $ | 356,923 | |
| Convertible senior unsecured notes, net | 126,632 | | | 170,797 | |
| Securitized debt, net ($1,365,494 and $1,553,722 at fair value and $185,666 and $215,753 held by affiliates, respectively) | 1,970,513 | | | 2,446,012 | |
| Interest payable (includes $712 and $784 on securitized debt held by affiliates, respectively) | 7,763 | | | 12,006 | |
| | | |
| Due to counterparties | — | | | 321 | |
| Derivative liability, at fair value | 562 | | | 656 | |
| Accounts payable and accrued expenses | 2,965 | | | 2,686 | |
| Payable to affiliate | 3,133 | | | 3,171 | |
| Dividend payable | 3,651 | | | 3,649 | |
| Other liabilities | 8,804 | | | 84,674 | |
Total Liabilities (2) | 2,607,291 | | | 3,080,895 | |
| | | |
| Commitments and contingencies | 0 | | 0 |
| | | |
| Stockholders’ Equity: | | | |
| Common stock: $0.01 par value, 500,000,000 shares authorized, 60,859,913 and 60,812,701 outstanding, respectively | 609 | | | 609 | |
| Preferred stock, $0.01 par value, 100,000,000 shares authorized and no shares outstanding | — | | | — | |
| Treasury stock, at cost, 100,000 and 100,000 shares held, respectively | (578) | | | (578) | |
| Additional paid-in capital | 917,963 | | | 915,458 | |
| Retained earnings (accumulated deficit) | (707,808) | | | (660,377) | |
| Total Stockholders’ Equity | 210,186 | | | 255,112 | |
| Non-controlling interest | 11,867 | | | 2 | |
| Total Equity | 222,053 | | | 255,114 | |
| Total Liabilities and Equity | $ | 2,829,344 | | | $ | 3,336,009 | |
See notes to unaudited consolidated financial statements.
Western Asset Mortgage Capital Corporation and Subsidiaries
Consolidated Balance Sheets (Continued)
(in thousands—thousands — except share and per share data)
(Unaudited)
| | | | | | | | | | | |
| September 30,
2020 | | December 31, 2019 |
(1) Assets of consolidated VIEs included in the total assets above: | | | |
| Cash and cash equivalents | $ | 0 | | | $ | 7,589 | |
| Restricted cash | 95,579 | | | 52,948 | |
| Residential Whole Loans, at fair value ($1,096,997 and $1,375,860 pledged as collateral, at fair value, respectively) | 1,096,997 | | | 1,375,860 | |
| Residential Bridge Loans ($15,319 and $31,748 at fair value and $16,828 and $34,897 pledged as collateral, respectively) | 16,828 | | | 34,897 | |
| Securitized commercial loans, at fair value | 1,687,545 | | | 909,040 | |
| Commercial Loans, at fair value ($72,699 and $90,788 pledged as collateral, at fair value, respectively) | 72,699 | | | 90,788 | |
| Investment related receivable | 18,817 | | | 19,138 | |
| Interest receivable | 11,287 | | | 10,829 | |
| Other assets | 92 | | | 90 | |
| Total assets of consolidated VIEs | $ | 2,999,844 | | | $ | 2,501,179 | |
| | | |
(2) Liabilities of consolidated VIEs included in the total liabilities above: | | | |
| Securitized debt, net ($1,636,460 and $681,643 at fair value and $207,852 and $142,905 held by affiliates, respectively) | $ | 2,602,909 | | | $ | 1,477,454 | |
| Interest payable (includes $660 and $647 on securitized debt held by affiliates, respectively) | 7,681 | | | 3,886 | |
| Accounts payable and accrued expenses | 410 | | | 185 | |
| Other liabilities | 95,579 | | | 52,948 | |
| Total liabilities of consolidated VIEs | $ | 2,706,579 | | | $ | 1,534,473 | |
| | | | | | | | | | | |
| September 30,
2021 | | December 31, 2020 |
(1) Assets of consolidated VIEs included in the total assets above: | | | |
| Cash and cash equivalents | $ | 9,245 | | | $ | — | |
| Restricted cash | 260 | | | 76,132 | |
| Residential Whole Loans, at fair value ($949,417 and $1,008,782 pledged as collateral, at fair value, respectively) | 949,417 | | | 1,008,782 | |
| Residential Bridge Loans ($5,960 and $11,858 at fair value and $5,960 and $12,960 pledged as collateral, respectively) | 5,960 | | | 12,960 | |
| Securitized commercial loans, at fair value | 1,377,005 | | | 1,605,335 | |
| Commercial Loans, at fair value ($14,362 and $68,466 pledged as collateral, at fair value, respectively) | 14,362 | | | 68,466 | |
| Investment related receivable | 24,224 | | | 27,987 | |
| Interest receivable | 9,433 | | | 10,936 | |
| Other assets | 80 | | | 80 | |
| Total assets of consolidated VIEs | $ | 2,389,986 | | | $ | 2,810,678 | |
| | | |
(2) Liabilities of consolidated VIEs included in the total liabilities above: | | | |
| Securitized debt, net ($1,365,494 and $1,553,722 at fair value and $185,666 and $215,753 held by affiliates, respectively) | $ | 1,970,513 | | | $ | 2,446,012 | |
| Interest payable (includes $712 and $784 on securitized debt held by affiliates, respectively) | 6,519 | | | 7,882 | |
| Accounts payable and accrued expenses | 49 | | | 89 | |
| Other liabilities | 260 | | | 76,132 | |
| Total liabilities of consolidated VIEs | $ | 1,977,341 | | | $ | 2,530,115 | |
See notes to unaudited consolidated financial statements.
Western Asset Mortgage Capital Corporation and Subsidiaries
Consolidated Statements of Operations
(in thousands—except share and per share data)
(Unaudited)
| | | | | | | | | | | | | | | | | | | | | | | |
| | For the three months ended September 30, 2020 | | For the three months ended September 30, 2019 | | For the nine months ended September 30, 2020 | | For the nine months ended September 30, 2019 |
| Net Interest Income | | | | | | | |
| Interest income | $ | 43,970 | | | $ | 55,652 | | | $ | 130,310 | | | $ | 161,503 | |
| Interest expense (includes $2,647, $964, $5,203 and $4,408 on securitized debt held by affiliates, respectively) | 33,853 | | | 39,082 | | | 94,376 | | | 113,440 | |
| Net Interest Income | 10,117 | | | 16,570 | | | 35,934 | | | 48,063 | |
| | | | | | | |
| Other Income (Loss) | | | | | | | |
| Realized gain (loss), net | 718 | | | 21,399 | | | 82,944 | | | 16,286 | |
| Other than temporary impairment | 0 | | | (1,819) | | | 0 | | | (6,346) | |
| Unrealized gain (loss), net | 54,690 | | | 35,030 | | | (225,381) | | | 160,425 | |
| Gain (loss) on derivative instruments, net | (88) | | | (47,056) | | | (197,922) | | | (145,734) | |
| Other, net | (31) | | | 918 | | | 385 | | | 1,686 | |
| Other Income (Loss) | 55,289 | | | 8,472 | | | (339,974) | | | 26,317 | |
| | | | | | | |
| Expenses | | | | | | | |
| Management fee to affiliate | 1,513 | | | 1,800 | | | 3,016 | | | 5,367 | |
| Financing fee | 0 | | | 0 | | | 20,540 | | | 0 | |
| Other operating expenses | 1,198 | | | 1,589 | | | 2,994 | | | 4,440 | |
| General and administrative expenses: | | | | | | | |
| Compensation expense | 716 | | | 671 | | | 2,070 | | | 1,920 | |
| Professional fees | 827 | | | 973 | | | 3,848 | | | 2,949 | |
| Other general and administrative expenses | 1,138 | | | 344 | | | 2,263 | | | 1,059 | |
| Total general and administrative expenses | 2,681 | | | 1,988 | | | 8,181 | | | 5,928 | |
| Total Expenses | 5,392 | | | 5,377 | | | 34,731 | | | 15,735 | |
| | | | | | | |
| Income (loss) before income taxes | 60,014 | | | 19,665 | | | (338,771) | | | 58,645 | |
| Income tax provision (benefit) | 205 | | | (55) | | | 367 | | | 435 | |
| Net income (loss) | 59,809 | | | 19,720 | | | (339,138) | | | 58,210 | |
| Net income attributable to non-controlling interest | 2 | | | 0 | | | 6 | | | 0 | |
| Net income (loss) attributable to common stockholders and participating securities | $ | 59,807 | | | $ | 19,720 | | | $ | (339,144) | | | $ | 58,210 | |
| | | | | | | |
| Net income (loss) per Common Share — Basic | $ | 0.98 | | | $ | 0.37 | | | $ | (6.02) | | | $ | 1.15 | |
| Net income (loss) per Common Share — Diluted | $ | 0.98 | | | $ | 0.37 | | | $ | (6.02) | | | $ | 1.15 | |
| | | | | | | | | | | | | | | | | | | | | | | |
| | For the three months ended September 30, 2021 | | For the three months ended September 30, 2020 | | For the nine months ended September 30, 2021 | | For the nine months ended September 30, 2020 |
| Net Interest Income | | | | | | | |
| Interest income | $ | 40,141 | | | $ | 43,970 | | | $ | 127,353 | | | $ | 130,310 | |
| Interest expense (includes $3,564, $2,647, $10,919 and $5,203 on securitized debt held by affiliates, respectively) | 32,978 | | | 33,853 | | | 104,352 | | | 94,376 | |
| Net Interest Income | 7,163 | | | 10,117 | | | 23,001 | | | 35,934 | |
| | | | | | | |
| Other Income (Loss) | | | | | | | |
| Realized gain (loss), net | (1,526) | | | 718 | | | (7,367) | | | 82,944 | |
| | | | | | | |
| Unrealized gain (loss), net | (6,003) | | | 54,690 | | | (39,271) | | | (225,381) | |
| Gain (loss) on derivative instruments, net | 515 | | | (88) | | | 716 | | | (197,922) | |
| Other, net | 277 | | | (31) | | | 449 | | | 385 | |
| Other Income (Loss) | (6,737) | | | 55,289 | | | (45,473) | | | (339,974) | |
| | | | | | | |
| Expenses | | | | | | | |
| Management fee to affiliate | 1,502 | | | 1,513 | | | 4,469 | | | 3,016 | |
| Financing fee | — | | | — | | | — | | | 20,540 | |
| Other operating expenses | 1,306 | | | 1,198 | | | 2,126 | | | 2,994 | |
| General and administrative expenses: | | | | | | | |
| Compensation expense | 626 | | | 716 | | | 1,985 | | | 2,070 | |
| Professional fees | 947 | | | 827 | | | 2,864 | | | 3,848 | |
| Other general and administrative expenses | 747 | | | 1,138 | | | 2,793 | | | 2,263 | |
| Total general and administrative expenses | 2,320 | | | 2,681 | | | 7,642 | | | 8,181 | |
| Total Expenses | 5,128 | | | 5,392 | | | 14,237 | | | 34,731 | |
| | | | | | | |
| Income (loss) before income taxes | (4,702) | | | 60,014 | | | (36,709) | | | (338,771) | |
| Income tax provision (benefit) | (218) | | | 205 | | | (19) | | | 367 | |
| Net income (loss) | (4,484) | | | 59,809 | | | (36,690) | | | (339,138) | |
| Net income (loss) attributable to non-controlling interest | (271) | | | 2 | | | (267) | | | 6 | |
| Net income (loss) attributable to common stockholders and participating securities | $ | (4,213) | | | $ | 59,807 | | | $ | (36,423) | | | $ | (339,144) | |
| | | | | | | |
| Net income (loss) per Common Share — Basic | $ | (0.07) | | | $ | 0.98 | | | $ | (0.60) | | | $ | (6.02) | |
| Net income (loss) per Common Share — Diluted | $ | (0.07) | | | $ | 0.98 | | | $ | (0.60) | | | $ | (6.02) | |
.
See notes to unaudited consolidated financial statements.
Western Asset Mortgage Capital Corporation and Subsidiaries
Consolidated Statements of Changes in Equity
(in thousands—except shares and share data)
(Unaudited)
| | | | | | | | | | | | | | | | | | | | | | | | | | | | | | | | | | | | | | | | | | | | | | | |
| Three Months Ended September 30, 2020 |
| | Common Stock Outstanding | | Additional
Paid-In Capital | | Retained
Earnings
(Accumulated Deficit) | | Treasury Stock | | Total Stockholders' Equity | | Non-Controlling Interest | | Total Equity |
| Shares | | Par | | | | | | |
| Balance at June 30, 2020, as Revised | 59,458,617 | | | $ | 595 | | | $ | 911,488 | | | $ | (724,252) | | | $ | (578) | | | $ | 187,253 | | | $ | 2 | | | $ | 187,255 | |
| | | | | | | | | | | | | | | |
| | | | | | | | | | | | | | | |
| | | | | | | | | | | | | | | |
| | | | | | | | | | | | | | | |
| Exchange of convertible senior notes | 1,354,084 | | | 14 | | | 3,574 | | | — | | | — | | | 3,588 | | | — | | | 3,588 | |
| | | | | | | | | | | | | | | |
| Vesting of restricted stock | — | | | — | | | 182 | | | — | | | — | | | 182 | | | — | | | 182 | |
| | | | | | | | | | | | | | | |
| Net income | — | | | — | | | — | | | 59,807 | | | — | | | 59,807 | | | 2 | | | 59,809 | |
| Dividends declared on non-controlling interest | — | | | — | | | — | | | — | | | — | | | — | | | (2) | | | (2) | |
| Dividends declared on common stock | — | | | — | | | 14 | | | (3,055) | | | — | | | (3,041) | | | — | | | (3,041) | |
| Balance at September 30, 2020 | 60,812,701 | | | $ | 609 | | | $ | 915,258 | | | $ | (667,500) | | | $ | (578) | | | $ | 247,789 | | | $ | 2 | | | $ | 247,791 | |
| | | | | | | | | | | | | | | | | | | | | | | | | | | | | | | | | | | | | | | | | | | | | | | |
| Three Months Ended September 30, 2021 |
| | Common Stock Outstanding | | Additional
Paid-In Capital | | Retained
Earnings
(Accumulated Deficit) | | Treasury Stock | | Total Stockholders' Equity | | Non-Controlling Interest | | Total Equity |
| Shares | | Par | | | | | | |
| Balance at June 30, 2021 | 60,812,701 | | | $ | 609 | | | $ | 915,782 | | | $ | (699,920) | | | $ | (578) | | | $ | 215,893 | | | $ | 2 | | | $ | 215,895 | |
| | | | | | | | | | | | | | | |
| | | | | | | | | | | | | | | |
| Equity contributions | — | | | — | | | — | | | — | | | — | | | — | | | 12,138 | | | 12,138 | |
| Equity component of convertible senior unsecured notes | — | | | — | | | 2,060 | | | — | | | — | | | 2,060 | | | — | | | 2,060 | |
| Exchange of phantom stock to common stock | 47,212 | | | — | | | — | | | — | | | — | | | — | | | — | | | — | |
| | | | | | | | | | | | | | | |
| Offering costs | — | | | — | | | (68) | | | — | | | — | | | (68) | | | — | | | (68) | |
| Vesting of restricted stock | — | | | — | | | 165 | | | — | | | — | | | 165 | | | — | | | 165 | |
| | | | | | | | | | | | | | | |
| Net loss | — | | | — | | | — | | | (4,213) | | | — | | | (4,213) | | | (271) | | | (4,484) | |
| Dividends declared on non-controlling interest | — | | | — | | | — | | | — | | | — | | | — | | | (2) | | | (2) | |
| Dividends declared on common stock | — | | | — | | | 24 | | | (3,675) | | | — | | | (3,651) | | | — | | | (3,651) | |
| Balance at September 30, 2021 | 60,859,913 | | | $ | 609 | | | $ | 917,963 | | | $ | (707,808) | | | $ | (578) | | | $ | 210,186 | | | $ | 11,867 | | | $ | 222,053 | |
| | | | | | | | | | | | | | | | | | | | | | | | | | | | | | | | | | | | | | | | | | | | | | | |
| Three Months Ended September 30, 2019 |
| | Common Stock Outstanding | | Additional
Paid-In Capital | | Retained
Earnings
(Accumulated Deficit) | | Treasury Stock | | Total Stockholders' Equity | | Non-Controlling Interest | | Total Equity |
| Shares | | Par | | | | | | |
| Balance at June 30, 2019 | 53,224,379 | | | $ | 532 | | | $ | 883,417 | | | $ | (324,323) | | | $ | 0 | | | $ | 559,626 | | | $ | 0 | | | $ | 559,626 | |
| | | | | | | | | | | | | | | |
| Offering costs | — | | | — | | | (41) | | | — | | | — | | | (41) | | | — | | | (41) | |
| Equity component of convertible senior unsecured notes | — | | | — | | | 1,390 | | | — | | | — | | | 1,390 | | | — | | | 1,390 | |
| | | | | | | | | | | | | | | |
| Vesting of restricted stock | — | | | — | | | 164 | | | — | | | — | | | 164 | | | — | | | 164 | |
| | | | | | | | | | | | | | | |
| Net income | — | | | — | | | — | | | 19,720 | | | — | | | 19,720 | | | — | | | 19,720 | |
| Dividends declared on common stock | — | | | — | | | 48 | | | (16,547) | | | — | | | (16,499) | | | — | | | (16,499) | |
| Balance at September 30, 2019 | 53,224,379 | | | $ | 532 | | | $ | 884,978 | | | $ | (321,150) | | | $ | 0 | | | $ | 564,360 | | | $ | 0 | | | $ | 564,360 | |
| | | | | | | | | | | | | | | | | | | | | | | | | | | | | | | | | | | | | | | | | | | | | | | |
| Three Months Ended September 30, 2020 |
| | Common Stock Outstanding | | Additional
Paid-In Capital | | Retained
Earnings
(Accumulated Deficit) | | Treasury Stock | | Total Stockholders' Equity | | Non-Controlling Interest | | Total Equity |
| Shares | | Par | | | | | | |
| Balance at June 30, 2020 | 59,458,617 | | | $ | 595 | | | $ | 911,488 | | | $ | (724,252) | | | $ | (578) | | | $ | 187,253 | | | $ | 2 | | | $ | 187,255 | |
| Exchange of convertible senior unsecured notes | 1,354,084 | | | 14 | | | 3,574 | | | — | | | — | | | 3,588 | | | — | | | 3,588 | |
| | | | | | | | | | | | | | | |
| | | | | | | | | | | | | | | |
| | | | | | | | | | | | | | | |
| | | | | | | | | | | | | | | |
| Vesting of restricted stock | — | | | — | | | 182 | | | — | | | — | | | 182 | | | — | | | 182 | |
| | | | | | | | | | | | | | | |
| Net income | — | | | — | | | — | | | 59,807 | | | — | | | 59,807 | | | 2 | | | 59,809 | |
| Dividends declared on non-controlling interest | — | | | — | | | — | | | — | | | — | | | — | | | (2) | | | (2) | |
| Dividends declared on common stock | — | | | — | | | 14 | | | (3,055) | | | — | | | (3,041) | | | | | (3,041) | |
| Balance at September 30, 2020 | 60,812,701 | | | $ | 609 | | | $ | 915,258 | | | $ | (667,500) | | | $ | (578) | | | $ | 247,789 | | | $ | 2 | | | $ | 247,791 | |
| | | | | | | | | | | | | | | | | | | | | | | | | | | | | | | | | | | | | | | | | | | | | | | |
| Nine Months Ended September 30, 2020 |
| | Common Stock Outstanding | | Additional
Paid-In Capital | | Retained
Earnings
(Accumulated Deficit) | | Treasury Stock | | Total Stockholders' Equity | | Non-Controlling Interest | | |
| Shares | | Par | | | | | | | Total |
| Balance at December 31, 2019 | 53,523,876 | | | $ | 535 | | | $ | 889,227 | | | $ | (325,301) | | | $ | 0 | | | $ | 564,461 | | | $ | 0 | | | $ | 564,461 | |
| Proceeds from public offerings of common stock | 6,034,741 | | | 60 | | | 22,297 | | | — | | | — | | | 22,357 | | | — | | | 22,357 | |
| Offering costs | — | | | — | | | (371) | | | — | | | — | | | (371) | | | — | | | (371) | |
| Proceeds from non-controlling interest, net of offering costs | — | | | — | | | — | | | — | | | — | | | — | | | 2 | | | 2 | |
| | | | | | | | | | | | | | | |
| Exchange of convertible senior notes | 1,354,084 | | | 14 | | | 3,574 | | | — | | | — | | | 3,588 | | | — | | | 3,588 | |
| | | | | | | | | | | | | | | |
| Vesting of restricted stock | — | | | — | | | 517 | | | — | | | — | | | 517 | | | — | | | 517 | |
| Treasury stock | (100,000) | | | — | | | — | | | — | | | (578) | | | (578) | | | — | | | (578) | |
| Net loss | — | | | — | | | — | | | (339,144) | | | — | | | (339,144) | | | 6 | | | (339,138) | |
| Dividends declared on non-controlling interest | — | | | — | | | — | | | — | | | — | | | — | | | (6) | | | (6) | |
| Dividends declared on common stock | — | | | — | | | 14 | | | (3,055) | | | — | | | (3,041) | | | — | | | (3,041) | |
| Balance at September 30, 2020 | 60,812,701 | | | $ | 609 | | | $ | 915,258 | | | $ | (667,500) | | | $ | (578) | | | $ | 247,789 | | | $ | 2 | | | $ | 247,791 | |
| | | | | | | | | | | | | | | |
| | | | | | | | | | | | | | | |
| | | | | | | | | | | | | | | | | | | | | | | | | | | | | | | | | | | | | | | | | | | | | | | |
| Nine Months Ended September 30, 2021 |
| | Common Stock Outstanding | | Additional
Paid-In Capital | | Retained
Earnings
(Accumulated Deficit) | | Treasury Stock | | Total Stockholders' Equity | | Non-Controlling Interest | | |
| Shares | | Par | | | | | | | Total |
| Balance at December 31, 2020 | 60,812,701 | | | $ | 609 | | | $ | 915,458 | | | $ | (660,377) | | | $ | (578) | | | $ | 255,112 | | | $ | 2 | | | $ | 255,114 | |
| | | | | | | | | | | | | | | |
| | | | | | | | | | | | | | | |
| Equity contributions | — | | | — | | | — | | | — | | | — | | | — | | | 12,138 | | | 12,138 | |
| Equity component of convertible senior unsecured notes | — | | | — | | | 2,060 | | | — | | | — | | | 2,060 | | | — | | | 2,060 | |
| Exchange of phantom stock to common stock | 47,212 | | | — | | | — | | | — | | | — | | | — | | | — | | | — | |
| Offering costs | — | | | — | | | (68) | | | — | | | — | | | (68) | | | — | | | (68) | |
| | | | | | | | | | | | | | | |
| Vesting of restricted stock | — | | | — | | | 454 | | | — | | | — | | | 454 | | | — | | | 454 | |
| | | | | | | | | | | | | | | |
| Net loss | — | | | — | | | — | | | (36,423) | | | — | | | (36,423) | | | (267) | | | (36,690) | |
| Dividends declared on non-controlling interest | — | | | — | | | — | | | — | | | — | | | — | | | (6) | | | (6) | |
| Dividends declared on common stock | — | | | — | | | 59 | | | (11,008) | | | — | | | (10,949) | | | — | | | (10,949) | |
| Balance at September 30, 2021 | 60,859,913 | | | $ | 609 | | | $ | 917,963 | | | $ | (707,808) | | | $ | (578) | | | $ | 210,186 | | | $ | 11,867 | | | $ | 222,053 | |
| | | | | | | | | | | | | | | | | | | | | | | | | | | | | | | | | | | | | | | | | | | | | | | |
| Nine Months Ended September 30, 2019 |
| Common Stock Outstanding | | Additional
Paid-In Capital | | Retained
Earnings
(Accumulated Deficit) | | Treasury Stock | | Total Stockholders' Equity | | Non-Controlling Interest | | |
| Shares | | Par | | | | | | | Total |
| Balance at December 31, 2018 | 48,116,379 | | | $ | 481 | | | $ | 833,810 | | | $ | (331,282) | | | $ | 0 | | | $ | 503,009 | | | $ | 0 | | | $ | 503,009 | |
| Proceeds from public offerings of common stock | 5,000,000 | | | 50 | | | 49,600 | | | — | | | — | | | 49,650 | | | — | | | 49,650 | |
| Offering costs | — | | | — | | | (350) | | | — | | | — | | | (350) | | | — | | | (350) | |
| Equity component of convertible senior unsecured notes | — | | | — | | | 1,390 | | | — | | | — | | | 1,390 | | | — | | | 1,390 | |
| Grants of restricted stock | 108,000 | | | 1 | | | (1) | | | — | | | — | | | — | | | — | | | 0 | |
| Vesting of restricted stock | — | | | — | | | 399 | | | — | | | — | | | 399 | | | — | | | 399 | |
| | | | | | | | | | | | | | | |
| Net income | — | | | — | | | — | | | 58,210 | | | — | | | 58,210 | | | — | | | 58,210 | |
| Dividends declared on common stock | — | | | — | | | 130 | | | (48,078) | | | — | | | (47,948) | | | — | | | (47,948) | |
| Balance at September 30, 2019 | 53,224,379 | | | $ | 532 | | | $ | 884,978 | | | $ | (321,150) | | | $ | 0 | | | $ | 564,360 | | | $ | 0 | | | $ | 564,360 | |
| | | | | | | | | | | | | | | | | | | | | | | | | | | | | | | | | | | | | | | | | | | | | | | |
| Nine Months Ended September 30, 2020 |
| | Common Stock Outstanding | | Additional
Paid-In Capital | | Retained
Earnings
(Accumulated Deficit) | | Treasury Stock | | Total Stockholders' Equity | | Non-Controlling Interest | | |
| Shares | | Par | | | | | | | Total |
| Balance at December 31, 2019 | 53,523,876 | | | $ | 535 | | | $ | 889,227 | | | $ | (325,301) | | | $ | — | | | $ | 564,461 | | | $ | — | | | $ | 564,461 | |
| Proceeds from public offerings of common stock | 6,034,741 | | | 60 | | | 22,297 | | | — | | | — | | | 22,357 | | | — | | | 22,357 | |
| Offering costs | — | | | — | | | (371) | | | — | | | — | | | (371) | | | — | | | (371) | |
| Proceeds from non-controlling interest, net of offering costs | — | | | — | | | — | | | — | | | — | | | — | | | 2 | | | 2 | |
| | | | | | | | | | | | | | | |
| Exchange of convertible senior notes | 1,354,084 | | | 14 | | | 3,574 | | | — | | | — | | | 3,588 | | | — | | | 3,588 | |
| | | | | | | | | | | | | | | |
| Vesting of restricted stock | — | | | — | | | 517 | | | — | | | — | | | 517 | | | — | | | 517 | |
| Treasury stock | (100,000) | | | — | | | — | | | — | | | (578) | | | (578) | | | — | | | (578) | |
| Net loss | — | | | — | | | — | | | (339,144) | | | — | | | (339,144) | | | 6 | | | (339,138) | |
| Dividends declared on non-controlling interest | — | | | — | | | — | | | — | | | — | | | — | | | (6) | | | (6) | |
| Dividends declared on common stock | — | | | — | | | 14 | | | (3,055) | | | — | | | (3,041) | | | — | | | (3,041) | |
| Balance at September 30, 2020 | 60,812,701 | | | $ | 609 | | | $ | 915,258 | | | $ | (667,500) | | | $ | (578) | | | $ | 247,789 | | | $ | 2 | | | $ | 247,791 | |
See notes to unaudited consolidated financial statements.
Western Asset Mortgage Capital Corporation and Subsidiaries
Consolidated Statements of Cash Flows (in thousands)
(Unaudited)
| | | | For the nine months ended September 30, 2020 | | For the nine months ended September 30, 2019 | | For the nine months ended September 30, 2021 | | For the nine months ended September 30, 2020 |
| Cash flows from operating activities: | Cash flows from operating activities: | | | | Cash flows from operating activities: | | | |
| Net income (loss) | $ | (339,138) | | | $ | 58,210 | | |
| Adjustments to reconcile net income (loss) to net cash used in operating activities: | | | | |
| Net loss | | Net loss | $ | (36,690) | | | $ | (339,138) | |
| Adjustments to reconcile net loss to net cash provided by (used in) operating activities: | | Adjustments to reconcile net loss to net cash provided by (used in) operating activities: | | | |
| Premium amortization and (discount accretion), net | Premium amortization and (discount accretion), net | 5,291 | | | 5,165 | | Premium amortization and (discount accretion), net | 145 | | | 5,291 | |
| Interest income earned added to principal of investments | Interest income earned added to principal of investments | (647) | | | 0 | | Interest income earned added to principal of investments | (310) | | | (647) | |
| Amortization of deferred financing costs | Amortization of deferred financing costs | 2,165 | | | 942 | | Amortization of deferred financing costs | 3,935 | | | 2,165 | |
| Amortization of discount on convertible senior unsecured notes | Amortization of discount on convertible senior unsecured notes | 830 | | | 461 | | Amortization of discount on convertible senior unsecured notes | 712 | | | 830 | |
| Restricted stock amortization | Restricted stock amortization | 517 | | | 399 | | Restricted stock amortization | 453 | | | 517 | |
| | Interest payments and basis recovered on MAC interest rate swaps | Interest payments and basis recovered on MAC interest rate swaps | 202 | | | 4,870 | | Interest payments and basis recovered on MAC interest rate swaps | — | | | 202 | |
| Premium on purchase of Residential Whole Loans | Premium on purchase of Residential Whole Loans | (3,858) | | | (6,940) | | Premium on purchase of Residential Whole Loans | (10,281) | | | (3,858) | |
| | Premium on purchase of securitized commercial loans | 0 | | | (3,769) | | |
| Unrealized (gain) loss, net | 225,381 | | | (160,425) | | |
| Realized gain on exchange of convertible senior notes for common stock | (1,258) | | | 0 | | |
| Realized loss on sale of real estate owned ("REO") | 680 | | | 33 | | |
| Unrealized (gain) loss on derivative instruments, net | 4,122 | | | (3,293) | | |
| Other than temporary impairment | 0 | | | 6,346 | | |
| | Unrealized loss, net | | Unrealized loss, net | 39,271 | | | 225,381 | |
| Realized (gain) loss on extinguishment of convertible senior notes | | Realized (gain) loss on extinguishment of convertible senior notes | 1,337 | | | (1,258) | |
| Realized (gain) loss on sale of real estate owned ("REO") | | Realized (gain) loss on sale of real estate owned ("REO") | (54) | | | 680 | |
| Unrealized loss on derivative instruments, net | | Unrealized loss on derivative instruments, net | 97 | | | 4,122 | |
| | Realized (gain) loss on investments, net | Realized (gain) loss on investments, net | (82,366) | | | (16,319) | | Realized (gain) loss on investments, net | 6,084 | | | (82,366) | |
| Loss on derivatives, net | Loss on derivatives, net | 13,133 | | | 2,068 | | Loss on derivatives, net | — | | | 13,133 | |
| | Changes in operating assets and liabilities: | Changes in operating assets and liabilities: | | | | Changes in operating assets and liabilities: | | | |
| Decrease in interest receivable | 5,312 | | | 3,158 | | |
| (Increase) decrease in other assets | (1,933) | | | 267 | | |
| (Decrease) increase in interest payable | (6,161) | | | 1,202 | | |
| Increase (decrease) in accounts payable and accrued expenses | 804 | | | (134) | | |
| Increase (decrease) in payable to affiliate | 1,107 | | | (2,589) | | |
| Increase in other liabilities | 20,540 | | | 0 | | |
| Net cash used in operating activities | (155,277) | | | (110,348) | | |
| Interest receivable | | Interest receivable | 2,496 | | | 5,312 | |
| Investment related receivable | | Investment related receivable | (704) | | | — | |
| Other assets | | Other assets | (973) | | | (1,933) | |
| Interest payable | | Interest payable | (4,243) | | | (6,161) | |
| Accounts payable and accrued expenses | | Accounts payable and accrued expenses | 60 | | | 804 | |
| Payable to affiliate | | Payable to affiliate | (38) | | | 1,107 | |
| Other liabilities | | Other liabilities | 1 | | | 20,540 | |
| Net cash provided by (used in ) in operating activities | | Net cash provided by (used in ) in operating activities | 1,298 | | | (155,277) | |
| Cash flows from investing activities: | Cash flows from investing activities: | | | | Cash flows from investing activities: | | | |
| Purchase of securities | Purchase of securities | (320,996) | | | (1,468,473) | | Purchase of securities | — | | | (320,996) | |
| Proceeds from sale of securities | Proceeds from sale of securities | 2,216,830 | | | 808,440 | | Proceeds from sale of securities | — | | | 2,216,830 | |
| Proceeds from sale of REO | Proceeds from sale of REO | 2,491 | | | 219 | | Proceeds from sale of REO | 738 | | | 2,491 | |
| Principal repayments and basis recovered on securities | Principal repayments and basis recovered on securities | 32,401 | | | 85,980 | | Principal repayments and basis recovered on securities | 14,685 | | | 32,401 | |
| Purchase of Residential Whole Loans | Purchase of Residential Whole Loans | (109,480) | | | (323,003) | | Purchase of Residential Whole Loans | (233,041) | | | (109,480) | |
| Proceeds from sale of Residential Whole Loans | Proceeds from sale of Residential Whole Loans | 144,258 | | | 0 | | Proceeds from sale of Residential Whole Loans | — | | | 144,258 | |
| Principal repayments on Residential Whole Loans | Principal repayments on Residential Whole Loans | 210,097 | | | 165,224 | | Principal repayments on Residential Whole Loans | 313,661 | | | 210,097 | |
| Purchase of commercial loans | 0 | | | (300,919) | | |
| | Principal repayments on commercial loans | Principal repayments on commercial loans | 37,728 | | | 76,000 | | Principal repayments on commercial loans | 103,272 | | | 37,728 | |
| Purchase of securitized commercial loans | 0 | | | (900,000) | | |
| | Principal repayments on securitized commercial loans | Principal repayments on securitized commercial loans | 211,205 | | | 1,214,583 | | Principal repayments on securitized commercial loans | 354,202 | | | 211,205 | |
| | Principal repayments on Residential Bridge Loans | Principal repayments on Residential Bridge Loans | 16,759 | | | 186,989 | | Principal repayments on Residential Bridge Loans | 7,052 | | | 16,759 | |
| Payment of premium for option derivatives | 0 | | | (780) | | |
| Premium received from option derivatives | 0 | | | 2,157 | | |
| | Premium for credit default swaps, net | Premium for credit default swaps, net | (14,028) | | | 3,884 | | Premium for credit default swaps, net | — | | | (14,028) | |
| Net settlements of TBAs | Net settlements of TBAs | (2,430) | | | 0 | | Net settlements of TBAs | — | | | (2,430) | |
| (Payments on) Proceeds from termination of futures, net | 0 | | | (6,718) | | |
| | | Interest payments and basis recovered on MAC interest rate swaps | Interest payments and basis recovered on MAC interest rate swaps | (202) | | | (4,870) | | Interest payments and basis recovered on MAC interest rate swaps | — | | | (202) | |
| Due from counterparties | Due from counterparties | 2,160 | | | (3,720) | | Due from counterparties | 50 | | | 2,160 | |
| | Premium for interest rate swaptions, net | Premium for interest rate swaptions, net | 80 | | | (332) | | Premium for interest rate swaptions, net | — | | | 80 | |
| Net cash provided by (used in) investing activities | 2,426,873 | | | (465,339) | | |
| Net cash provided by investing activities | | Net cash provided by investing activities | 560,619 | | | 2,426,873 | |
| | Cash flows from financing activities: | | Cash flows from financing activities: | | | |
| Proceeds from issuance of common stock | | Proceeds from issuance of common stock | — | | | 22,357 | |
| Payment of offering costs | | Payment of offering costs | (86) | | | (374) | |
| Repurchase of common stock | | Repurchase of common stock | — | | | (578) | |
| | Proceeds from issuance of convertible senior unsecured notes | | Proceeds from issuance of convertible senior unsecured notes | 86,250 | | | — | |
| Payments on extinguishment of convertible senior unsecured notes | | Payments on extinguishment of convertible senior unsecured notes | (128,645) | | | — | |
Western Asset Mortgage Capital Corporation and Subsidiaries
Consolidated Statements of Cash Flows (Continued) (in thousands)
(Unaudited)
| | | | For the nine months ended September 30, 2020 | | For the nine months ended September 30, 2019 | | For the nine months ended September 30, 2021 | | For the nine months ended September 30, 2020 |
| | Cash flows from financing activities: | | | | |
| Proceeds from issuance of common stock | 22,357 | | | 49,650 | | |
| Payment of offering costs | (374) | | | (490) | | |
| Repurchase of common stock | (578) | | | 0 | | |
| | Proceeds from issuance of convertible senior notes | 0 | | | 40,000 | | |
| Proceeds from offering to non-controlling interest, net of offering costs | Proceeds from offering to non-controlling interest, net of offering costs | 2 | | | 0 | | Proceeds from offering to non-controlling interest, net of offering costs | — | | | 2 | |
| Proceeds from repurchase agreement borrowings | Proceeds from repurchase agreement borrowings | 9,149,204 | | | 16,401,124 | | Proceeds from repurchase agreement borrowings | 2,527,530 | | | 9,149,204 | |
| Repayments of repurchase agreement borrowings | Repayments of repurchase agreement borrowings | (11,615,203) | | | (16,294,853) | | Repayments of repurchase agreement borrowings | (2,403,068) | | | (11,615,203) | |
| | Proceeds from securitized debt | Proceeds from securitized debt | 460,787 | | | 1,757,464 | | Proceeds from securitized debt | — | | | 460,787 | |
| Repayments of securitized debt | Repayments of securitized debt | (366,828) | | | (1,233,153) | | Repayments of securitized debt | (597,221) | | | (366,828) | |
| | Payments made for deferred financing costs | Payments made for deferred financing costs | (3,145) | | | (7,023) | | Payments made for deferred financing costs | (2,536) | | | (3,145) | |
| Due from counterparties, net | Due from counterparties, net | 95,595 | | | (46,813) | | Due from counterparties, net | (565) | | | 95,595 | |
| Due to counterparties, net | Due to counterparties, net | (692) | | | (15,685) | | Due to counterparties, net | (321) | | | (692) | |
| (Decrease) increase in other liabilities | 42,634 | | | (19,351) | | |
| Increase (decrease) in other liabilities | | Increase (decrease) in other liabilities | (75,873) | | | 42,634 | |
| Dividends paid on common stock | Dividends paid on common stock | (16,592) | | | (46,365) | | Dividends paid on common stock | (10,947) | | | (16,592) | |
| Dividends paid to non-controlling interest | Dividends paid to non-controlling interest | (4) | | | 0 | | Dividends paid to non-controlling interest | (4) | | | (4) | |
| Net cash (used in) provided by financing activities | (2,232,837) | | | 584,505 | | |
| Net cash used in financing activities | | Net cash used in financing activities | (605,486) | | | (2,232,837) | |
| | Net (decrease) increase in cash, cash equivalents and restricted cash | Net (decrease) increase in cash, cash equivalents and restricted cash | 38,759 | | | 8,818 | | Net (decrease) increase in cash, cash equivalents and restricted cash | (43,569) | | | 38,759 | |
| Cash, cash equivalents and restricted cash, beginning of period | Cash, cash equivalents and restricted cash, beginning of period | 84,279 | | | 77,795 | | Cash, cash equivalents and restricted cash, beginning of period | 107,745 | | | 84,279 | |
| Cash, cash equivalents and restricted cash, end of period | Cash, cash equivalents and restricted cash, end of period | $ | 123,038 | | | $ | 86,613 | | Cash, cash equivalents and restricted cash, end of period | $ | 64,176 | | | $ | 123,038 | |
| | Supplemental disclosure of operating cash flow information: | Supplemental disclosure of operating cash flow information: | | | | Supplemental disclosure of operating cash flow information: | | | |
| Interest paid | Interest paid | $ | 90,885 | | | $ | 113,746 | | Interest paid | $ | 87,658 | | | $ | 90,885 | |
| Income taxes paid | Income taxes paid | $ | 810 | | | $ | 454 | | Income taxes paid | $ | 192 | | | $ | 810 | |
| Supplemental disclosure of non-cash financing/investing activities: | Supplemental disclosure of non-cash financing/investing activities: | | | | Supplemental disclosure of non-cash financing/investing activities: | | | |
| Underwriting and offering costs payable | Underwriting and offering costs payable | $ | 0 | | | $ | 38 | | Underwriting and offering costs payable | $ | 6 | | | $ | — | |
| Principal payments of securities, not settled | Principal payments of securities, not settled | $ | 44 | | | $ | 0 | | Principal payments of securities, not settled | $ | — | | | $ | 44 | |
| | Securities purchased, not settled | $ | 0 | | | $ | (71,146) | | |
| | Assets of deconsolidated VIE | Assets of deconsolidated VIE | $ | (150,804) | | | $ | 0 | | Assets of deconsolidated VIE | $ | — | | | $ | (150,804) | |
| Liabilities of deconsolidated VIE | Liabilities of deconsolidated VIE | $ | 143,952 | | | $ | 0 | | Liabilities of deconsolidated VIE | $ | — | | | $ | 143,952 | |
| Mortgage-backed securities recorded upon deconsolidation | Mortgage-backed securities recorded upon deconsolidation | $ | 6,852 | | | $ | 0 | | Mortgage-backed securities recorded upon deconsolidation | $ | — | | | $ | 6,852 | |
| | Assets of consolidated VIE | Assets of consolidated VIE | $ | 1,245,287 | | | $ | 0 | | Assets of consolidated VIE | $ | — | | | $ | 1,245,287 | |
| Liabilities of consolidated VIE | Liabilities of consolidated VIE | $ | (1,231,549) | | | $ | 0 | | Liabilities of consolidated VIE | $ | — | | | $ | (1,231,549) | |
| Mortgage-backed securities derecognized upon VIE consolidation | Mortgage-backed securities derecognized upon VIE consolidation | $ | (13,737) | | | $ | 0 | | Mortgage-backed securities derecognized upon VIE consolidation | $ | — | | | $ | (13,737) | |
| Dividends and distributions declared, not paid | Dividends and distributions declared, not paid | $ | 3,041 | | | $ | 16,499 | | Dividends and distributions declared, not paid | $ | 3,651 | | | $ | 3,041 | |
| Dividends to non-controlling interest, not paid | Dividends to non-controlling interest, not paid | $ | 2 | | | $ | 0 | | Dividends to non-controlling interest, not paid | $ | 2 | | | $ | 2 | |
| Principal payments of Residential Whole Loans, not settled | Principal payments of Residential Whole Loans, not settled | $ | 16,097 | | | $ | 21,621 | | Principal payments of Residential Whole Loans, not settled | $ | 22,621 | | | $ | 16,097 | |
| Principal payments of Residential Bridge Loans, not settled | Principal payments of Residential Bridge Loans, not settled | $ | 2,720 | | | $ | 10,412 | | Principal payments of Residential Bridge Loans, not settled | $ | 1,715 | | | $ | 2,720 | |
| | Other assets - Transfer of Bridge Loans to REO | Other assets - Transfer of Bridge Loans to REO | $ | 419 | | | $ | 3,536 | | Other assets - Transfer of Bridge Loans to REO | $ | 752 | | | $ | 419 | |
| Other assets - Transfer of Commercial Loans to REO | | Other assets - Transfer of Commercial Loans to REO | $ | 30,345 | | | $ | — | |
| Other assets - Contribution of REO from non-controlling interest | | Other assets - Contribution of REO from non-controlling interest | $ | 12,138 | | | $ | — | |
| Financing fee payable | Financing fee payable | $ | (20,540) | | | $ | 0 | | Financing fee payable | $ | — | | | $ | (20,540) | |
| Exchange of convertible senior notes for commons stock | $ | 3,588 | | | $ | 0 | | |
| Exchange of convertible senior notes for common stock | | Exchange of convertible senior notes for common stock | $ | — | | | $ | 3,588 | |
| | Reconciliation of cash, cash equivalents and restricted cash reported in the Consolidated Balance Sheets: | Reconciliation of cash, cash equivalents and restricted cash reported in the Consolidated Balance Sheets: | | Reconciliation of cash, cash equivalents and restricted cash reported in the Consolidated Balance Sheets: | |
| Cash and cash equivalents | Cash and cash equivalents | $ | 27,459 | | | $ | 50,157 | | Cash and cash equivalents | $ | 63,916 | | | $ | 27,459 | |
| Restricted cash | Restricted cash | 95,579 | | | 36,456 | | Restricted cash | 260 | | | 95,579 | |
| Total cash, cash equivalents and restricted cash shown in the Consolidated Statements of Cash Flows | Total cash, cash equivalents and restricted cash shown in the Consolidated Statements of Cash Flows | $ | 123,038 | | | $ | 86,613 | | Total cash, cash equivalents and restricted cash shown in the Consolidated Statements of Cash Flows | $ | 64,176 | | | $ | 123,038 | |
See notes to unaudited consolidated financial statements.
Western Asset Mortgage Capital Corporation and Subsidiaries
Notes to Consolidated Financial Statements (Unaudited)
(in thousands- except share and per share data)
The following defines certain of the commonly used terms in these Notes to Consolidated Financial Statements: “Agency” or “Agencies” refer to a federally chartered corporation, such as the Federal National Mortgage Association (“Fannie Mae” or “FNMA”) or the Federal Home Loan Mortgage Corporation (“Freddie Mac” or “FHLMC”), or an agency of the U.S. Government, such as the Government National Mortgage Association (“Ginnie Mae” or “GNMA”); references to “MBS” refer to mortgage backed securities, including residential mortgage-backed securities or “RMBS,” commercial mortgage-backed securities or “CMBS,” and “Interest-Only Strips” (as defined herein); “Agency MBS” refer to RMBS, CMBS and Interest-Only Strips issued or guaranteed by the Agencies while “Non-Agency MBS” refer to RMBS, CMBS and Interest-Only Strips that are not issued or guaranteed by the Agencies; references to “ARMs” refers to adjustable rate mortgages; references to “Interest-Only Strips” refer to interest-only (“IO”) and inverse interest-only (“IIO”) securities issued as part of or collateralized with MBS; references to “TBA” refer to To-Be-Announced Securities; and references to “Residential Whole Loans,” “Residential Bridge Loans” and “Commercial Loans” (collectively “Whole Loans”) refer to individual mortgage loans secured by single family, multifamily and commercial properties.
Note 1 — Organization
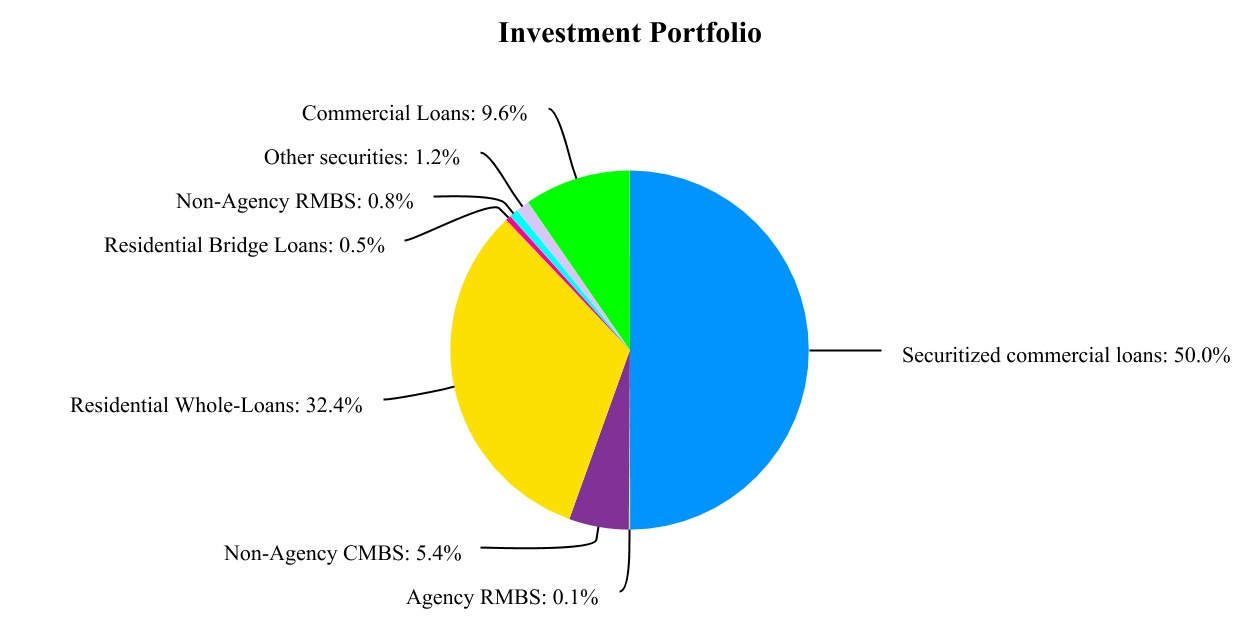
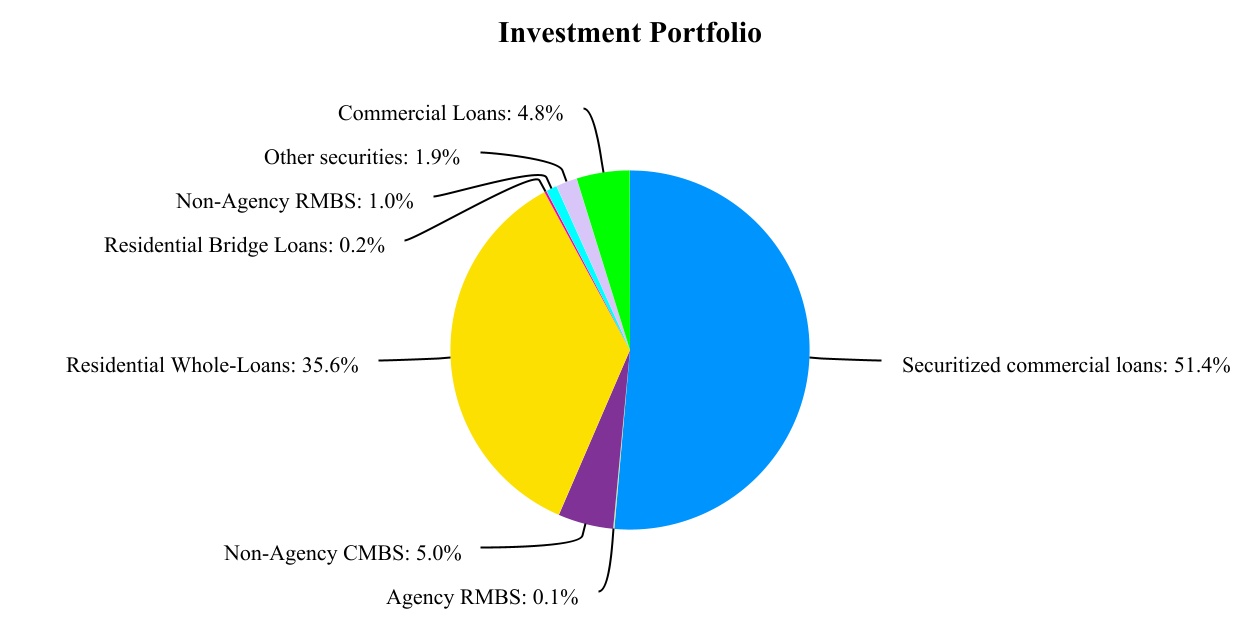
Western Asset Mortgage Capital Corporation, a Delaware corporation, and its subsidiaries (the “Company”), commenced operations in May 2012. The Company invests in, finances and manages a diversified portfolio of real estate related securities, Whole Loans and other financial assets. The Company’s current portfolio is comprised of Non-Qualified Residential Whole Loans ("Non-QM"), Commercial Loans, Non-Agency CMBS and to a lesser extent Agency RMBS, Non-Agency RMBS, Residential Bridge Loans, GSE Risk Transfer Securities and asset-backed securities (“ABS”) investments secured by a portfolio of private student loans. The Company’s investment strategy is based on Western Asset Management Company, LLC’s (the “Manager”) perspective of which mix of portfolio assets it believes provides the Company with the best risk-reward opportunities at any given time. The Manager will vary the allocation among various asset classes subject to maintaining the Company’s qualification as a REIT and maintaining its exemption from the Investment Company Act of 1940, as amended (the “1940 Act”). These restrictions limit the Company’s ability to invest in non-qualifying MBS, non-real estate assets and/or assets which are not secured by real estate. Accordingly, the Company’s portfolio will continue to be principally invested in qualifying MBS, Whole Loans and other real estate related assets.
The Company is externally managed by the Manager, an investment advisor registered with the Securities and Exchange Commission (“SEC”). The Manager is a wholly-owned subsidiary of Franklin Resources, Inc. (“Franklin”), which on July 31, 2020 acquired the Manager's previous parent Legg Mason Inc. The Company operates and has elected to be taxed as a real estate investment trust or “REIT” commencing with its taxable year ended December 31, 2012.
Note 2 — Basis of Presentation and Summary of Significant Accounting Policies
Basis of Presentation and Consolidation
The accompanying unaudited financial statements and related notes have been prepared in conformity with generally accepted accounting principles in the United States of America (“GAAP”) for interim financial reporting in accordance with Article 10 of Regulation S-X and the instructions to Form 10-Q. In the opinion of management, all adjustments (which include only normal recurring adjustments) necessary have been made to state fairly the Company’s financial position, results of operations and cash flows. The results of operations for the period ended September 30, 2020,2021, are not necessarily indicative of the results to be expected for the full year or any future period. These consolidated financial statements should be read in conjunction with the Company’s Annual Report on Form 10-K for the year ended December 31, 2019,2020, filed with the SEC on March 6, 2020.5, 2021.
The consolidated financial statements include the accounts of the Company, its wholly-owned and majority-owned subsidiaries, and variable interest entities (“VIEs”) in which it is considered the primary beneficiary. All intercompany amounts between the Company and its subsidiaries and consolidated VIEs have been eliminated in consolidation.
Variable Interest Entities
VIEs are defined as entities that by design either lack sufficient equity for the entity to finance its activities without additional subordinated financial support or are unable to direct the entity’s activities or are not exposed to the entity’s losses or entitled to its residual returns. The Company evaluates all of its interests in VIEs for consolidation. When the interests are determined to be variable interests, the Company assesses whether it is deemed the primary beneficiary. The primary beneficiary of a VIE is determined to be the party that has both the power to direct the activities of a VIE that most significantly impact the VIE’s economic performance and the obligation to absorb losses or the right to receive benefits of the VIE that could potentially be significant to the VIE.
To assess whether the Company has the power to direct the activities of a VIE that most significantly impact the VIE’s economic performance, it considers all facts and circumstances, including its role in establishing the VIE and its ongoing rights and responsibilities. This assessment includes: first, identifying the activities that most significantly impact the VIE’s economic performance; and second, identifying which party, if any, has power over those activities. In general, the parties that make the most significant decisions affecting the VIE or have the right to unilaterally remove those decision makers are deemed to have the power to direct the activities of a VIE.
To assess whether the Company has the obligation to absorb losses of the VIE or the right to receive benefits from the VIE that could potentially be significant to the VIE, it considers all of its economic interests. This assessment requires the Company to apply judgment in determining whether these interests, in the aggregate, are considered potentially significant to the VIE. Factors considered in assessing significance include: the design of the VIE, including its capitalization structure; subordination of interests; payment priority; relative share of interests held across various classes within the VIE’s capital structure; and the reasons why the interests are held by the Company.
In instances where the Company and its related parties have variable interests in a VIE, the Company considers whether there is a single party in the related party group that meets both the power and losses or benefits criteria on its own as though no related party relationship existed. If one party within the related party group meets both these criteria, such reporting entity is the primary beneficiary of the VIE and no further analysis is needed. If no party within the related party group on its own meets both the power and losses or benefits criteria, but the related party group as a whole meets these two criteria, the determination of primary beneficiary within the related party group requires significant judgment. The analysis is based upon qualitative as well as quantitative factors, such as the relationship of the VIE to each of the members of the related-party group, as well as the significance of the VIE's activities to those members, with the objective of determining which party is most closely associated with the VIE.
Ongoing assessments of whether an enterprise is the primary beneficiary of a VIE are required.
Revision of Previously Issued Quarterly Financial Statements
During the third quarter 2020, as part of the close process, the Company discovered an under accrual related to one of its financing arrangements for $1.5 million. The Company has evaluated the impact of this error and has concluded that individually and in the aggregate, the error was not material to the previously issued June 30, 2020 Form 10-Q. However, the Company has decided to revise the June 30, 2020 financial statements. The below tables summarize the effects of the revision of the interest expense under accrual on the originally reported amounts:
| | | | | | | | | | | | | | | | | | | | | | | | | | |
| | As of June 30, 2020 |
| Dollars in thousands | | As Originally Reported | | Adjustments | | Revised | | Change % |
Consolidated Balance Sheets
(effect on individual line items) | | | | | | | | |
| Interest payable | | 7,710 | | | 1,459 | | | 9,169 | | | 18.9 | % |
| Total Liabilities | | 2,091,309 | | | 1,459 | | | 2,092,768 | | | 0.1 | % |
| Total Stockholders' Equity | | 188,712 | | | (1,459) | | | 187,253 | | | (0.8) | % |
| Total Equity | | 188,714 | | | (1,459) | | | 187,255 | | | (0.8) | % |
| | | | | | | | | | | | | | | | | | | | | | | | | | |
| | For the three months ended June 30, 2020 |
| Dollars in thousands (except per share data) | | As Originally Reported | | Adjustments | | Revised | | Change % |
Consolidated Statements of Operations
(effect on individual line items) | | | | | | | | |
| Interest expense | | 22,959 | | | 1,459 | | | 24,418 | | | 6.4 | % |
| Net Interest Income | | 8,535 | | | (1,459) | | | 7,076 | | | (17.1) | % |
| Income (loss) before income taxes | | (15,378) | | | (1,459) | | | (16,837) | | | 9.5 | % |
| Net income (loss) | | (15,633) | | | (1,459) | | | (17,092) | | | 9.3 | % |
| Net income (loss) attributable to common shareholders and participating securities | | (15,635) | | | (1,459) | | | (17,094) | | | 9.3 | % |
| Net income (loss) per Common Share - Basic | | (0.29) | | | (0.02) | | | (0.31) | | | 6.9 | % |
| Net income (loss) per Common Share - Diluted | | (0.29) | | | (0.02) | | | (0.31) | | | 6.9 | % |
| | | | | | | | | | | | | | | | | | | | | | | | | | |
| | For the six months ended June 30, 2020 |
| Dollars in thousands (except per share data) | | As Originally Reported | | Adjustments | | Revised | | Change % |
Consolidated Statements of Operations
(effect on individual line items) | | | | | | | | |
| Interest expense | | 59,064 | | | 1,459 | | | 60,523 | | | 2.5 | % |
| Net Interest Income | | 27,276 | | | (1,459) | | | 25,817 | | | (5.3) | % |
| Income (loss) before income taxes | | (397,326) | | | (1,459) | | | (398,785) | | | 0.4 | % |
| Net income (loss) | | (397,488) | | | (1,459) | | | (398,947) | | | 0.4 | % |
| Net income (loss) attributable to common shareholders and participating securities | | (397,492) | | | (1,459) | | | (398,951) | | | 0.4 | % |
| Net income (loss) per Common Share - Basic | | (7.35) | | | (0.03) | | | (7.38) | | | 0.4 | % |
| Net income (loss) per Common Share - Diluted | | (7.35) | | | (0.03) | | | (7.38) | | | 0.4 | % |
Use of Estimates
The preparation of the consolidated financial statements requires management to make estimates and assumptions that affect the reported amounts of assets and liabilities and disclosure of contingent assets and liabilities at the date of the financial statements and the reported amounts of revenues and expenses during the reporting periods. Actual results could differ from those estimates.
Impact of the COVID-19 Pandemic
The outbreakBeginning with the quarter ended March 31, 2020, the COVID-19 pandemic, created extensive disruptions to the global economy and the lives of individuals throughout the world. Governments and businesses have taken and are continuing to take unprecedented actions to contain the spread of COVID-19 whichand to mitigate its effects, including vaccination efforts, face covering mandates, quarantines, travel bans, shelter-in-place orders, closures of businesses and schools, fiscal stimulus, and legislation designed to deliver monetary aid and other relief. The pandemic and related efforts to contain the World Health Organization designated a pandemic,spread of COVID-19 have disrupted global economic activity, impacted interest rates, increased economic and market uncertainty, disrupted trade and supply chains, and created unprecedented financial market conditions and disruptions. This rapid disruption and dislocation acrossin the fixed income markets. The conditions caused by the pandemic created an extreme lack of liquiditymarkets in early 2020 specifically in mortgage markets combined with forced selling led to swift and dramatic price declines. The illiquidity was exacerbated by inadequate demand for MBS among primary dealers due to balance sheet constraints. During late March 2020 and April 2020, the significant decline in value of the Company's investment portfolio resulted in substantial margin calls from its repurchase agreement counterparties. In order to satisfy the margin calls, the Company sold a significant portion of its investments resulting in a materialhad an adverse impact on our book value, earningsliquidity, results of operations, and financial position. DuringAlthough market conditions have improved since the thirdfirst quarter our portfolio has experienced improved valuations andof 2020, the Company did not have significant asset sales or margin calls during the quarter.
The full impact of COVID-19 on the mortgage REIT industry, the credit markets, and consequently, on the Company’sCompany's financial condition and results of operations for future periods remain uncertain.
While the roll out of vaccines and booster vaccines offer a prospective timeline for recovery, our Manager's view is uncertainthat it will take some time, if ever, for economic and cannot be predicted atsocial conditions to fully rebound. Our Manager's outlook is that (i) the current time as it depends on several factors beyondnear-term, ii) COVID-19 continues to impact global populations, but the controlworst of the Company including, but not limited to (i) the uncertainty around the severity, duration and spread of the outbreak, (ii) the effectiveness of the United States public health response, (iii) the pandemic’s impact on thedelta variant is behind us, iii) U.S. and global economies, (iv)grow is decelerating from high levels, iv) monetary accommodation will be reduced from crisis levels, v) the timing, scopebar for the Federal Reserve tightening remains high and effectivenessis unlikely to be met in 2022, vi) global fiscal stimulus will be sharply reduced, vii) inflation remains challenging but will ease meaningfully during 2022, and viii)rates should remain range-bound in an estimated band of additional governmental responses to the pandemic, including the availability of a treatment or vaccination1.25%-1.75% for COVID-19, (v) the impact of government interventions, and (vi) the negative impact on our borrowers, asset values and cost of capital.10-year U.S. treasuries.
Significant Accounting Policies
There have been no significant changes to our accounting policies included in Note 2 to the consolidated financial statements of our Annual Report on Form 10-K for the year ended December 31, 2019,2020, other than the below newsignificant accounting policy.policy disclosed below.
Real Estate Owned
As of January 1, 2020,
REO represents real estate property acquired by the Company has adopted ASU 2016-13, “Financial Instruments - Credit Losses (Topic 326): Measurementthrough foreclosure and it is classified as held for sale. Upon completion of Credit Losses on Financial Instruments or CECL in the first quarter of 2020. The standard significantly changes how entities measure credit losses for most financial assets and certain other instruments that are not measuredforeclosure, the Company initially records the REO at fair value throughless estimated costs to sell the income statement. The standard replacedproperty. In subsequent periods, REO is reported at the lower of the current "incurred loss" approach with an "expected loss" model for instruments measured at amortized cost. Becausecarrying amount or fair value less estimated selling costs and it is classified in "Other assets" in the Consolidated Balance Sheets. Gains/losses recognized on foreclosure as well as realized gains/losses on the disposition of REO are reported by the Company elected the Fair Value Option on most of its investments, an allowance is recorded rather than reduce the carrying amount, as was done under the “other than temporary impairment model”. The difference between the amortized cost basis and the fair value is recordedin "Realized gain (loss), net" in the “Unrealized, gain (loss), net”. The Company performs both qualitative and quantitative analysis factors to determine if a credit loss exist. The qualitative analysis includes assessing the security’s collateral, industry, geographic area, credit enhancement, payment structure, and credit rating. Solely for the purposesConsolidated Statements of calculating interest income the Company maintains a “shadow allowance”. The shadow allowance is determined for purposes of ensuring subsequent improvements in cash flows would first reduce the “shadow allowance” and then be treated as prospective yield adjustments. The “shadow allowance” is an operational account for the purposes of determining and calculating accretable yield and accretable basis and would not be recorded in the Company’s financial statements.Operations.
Recently adopted accounting pronouncements
| | | | | | | | | | | | | | |
| Description | | Adoption Date | | Effect on Financial Statements |
| | | | |
In June 2016, the FASB issued ASU 2016-13, “Financial Instruments - Credit Losses (Topic 326): Measurement of Credit Losses on Financial Instruments.” This standard significantly changes how an entity will measure credit losses for most financial assets and certain other instruments that aren't measured at fair value through the income statement. The standard will replace the current "incurred loss" approach with an "expected loss" model for instruments measured at amortized cost. For available for sale debt securities, entities will be required to record an allowance rather than reduce the carrying amount, as is currently done under the other than temporary impairment model. It also simplifies the accounting model for purchased credit impaired debt securities and loans. In November 2018, the FASB issued ASU 2018-19, "Codification Improvements to Topic 326, Financial Instruments-Credit Losses." This update was issued related to ASU 2016-13 to increase the stakeholders' awareness of the amendments to scope and transition and effective date requirements and to expedite the improvements. In November 2019, the FASB issued ASU 2019-11, "Codification Improvements to Topic 326, Financial Instruments-Credit Losses." The amendments in this update clarify or address stakeholders' specific issues about certain aspects of the amendments in Update 2016-13. | | First quarter 2020. | | The adoption of this standard did not have a material impact on its consolidated financial statements. |
| | | | |
In August 2018, the FASB issued ASU 2018-13, "Fair Value Measurement (Topic 820), Disclosure Framework-Changes to the Disclosure Requirements for Fair Value Measurement." The amendments in this update modify the disclosure requirements on fair value measurements including the consideration of costs and benefits. | | First quarter 2020. | | The adoption of this standard did not have a material impact on its consolidated financial statements. |
| | | | |
In April 2019, the FASB issued ASU 2019-04, "Codification Improvements to Topic 326, Financial Instruments-Credit Losses, Topic 815, Derivatives and Hedging, and Topic 825, Financial Instruments." The amendments in this update represent changes to clarify, correct errors in, or improve the Codification. The amendments should make the Codification easier to understand and easier to apply by eliminating inconsistencies and providing clarification. | | First quarter 2020. | | The adoption of this standard did not have a material impact on its consolidated financial statements. |
| | | | |
In May 2019, the FASB issued ASU 2019-05, "Financial Instruments-Credit Losses (Topic 326)." The amendments in this Update provide entities that have certain instruments within the scope of Subtopic 326-20 with an option to irrevocably elect the fair value option in the Subtopic 825-10, Financial Instruments-Overall, upon adoption of Topic 326. An entity that elects the fair value option should subsequently apply the guidance in Subtopic 820-10, Fair Value Measurement-Overall, and 825-10. | | First quarter 2020. | | The adoption of this standard did not have a material impact on its consolidated financial statements. |
| | | | |
Recently issued accounting pronouncements
| | | | | | | | | | | | | | |
Description | | Effective Date | | Effect on Financial Statements |
In January 2020, the FASB issued ASU 2020-01, “Investments-Equity Securities (Topic 321), Investment-Equity Method and Joint Ventures (Topic 323, and Derivatives and Hedging (Topic 815).” The amendments in this Update clarifyupdate clarified the interaction of the accounting for equity securities under Topic 321 and investments accounted for under the equity method of accounting in Topic 323 and the accounting for certain forward contracts and purchase options accounted for under Topic 815. | | First quarter 2021.January 1, 2021 | | The adoption of this standard did not have a material impact on the consolidated financial statements. |
| | | | |
| | | | |
| | | | |
| | | | |
| | | | |
| | | | |
Recently issued accounting pronouncements | | | | | | | | | | | | | | |
| Description | | Effective Date | | Effect on Financial Statements |
| | | | |
| In August 2020, the FASB issued ASU 2020-06, “Debt—Debt with Conversion and Other Options (Subtopic 470-20) and Derivatives and Hedging— Contracts in Entity’s Own Equity (Subtopic 815-40).” The amendments in this Update affect entities that issue convertible instruments and/or contracts in an entity’s own equity. For convertible instruments, the instruments primarily affected are those issued with beneficial conversion features or cash conversion features because the accounting models for those specific features are removed. | | January 1, 2022. | | The Company is evaluatingevaluated the impact this
statements.statements and does not believe it will have a material impact on its financial statements due to the limited nature of such transactions. |
In March 2020, the FASB issued ASU 2020-04, “Reference Rate Reform (Topic 848), Facilitation of the Effects of Reference Rate Reform on Financial Reporting.” The amendments in this Update provideupdate provided optional expedients and exceptions for applying generally accepted accounting principles (GAAP) to contracts, hedging relationships, and other transactions affected by reference rate reform if certain criteria are met. The amendments in this Update apply only to contracts, hedging relationships, and other transactions that reference LIBOR or another reference rate expected to be discontinued because of reference rate reform. In January 2021, the FASB issued ASU 2021-01, "Reference Rate Reform (Topic 848)." The amendments in this Update clarify that certain optional expedients and exceptions in Topic 848 for contract modifications and hedge accounting apply to derivatives that are affected by the discounting transition. | | March 12, 2020 through December 31, 2022 | | The Company may elect to adopt the amendments in ASU 2020-04 and ASU 2021-1 at any time after March 12, 2020 but not later than December 31, 2022. Currently, the Company's contracts that are referenced to LIBOR have not been affected by the amendments in these updates. The Company is in the process of evaluating the impact this
standard may haveguidance and the other optional expedients, and the effect on its consolidated
the company's financial statements.statements has not yet been determined |
| | | | |
| | | | |
| | | | |
| | | | |
| | | | |
| | | | |
| | | | |
| | | | |
| | | | |
| | | | |
| | | | |
| | | | |
Note 3 — Fair Value of Financial Instruments
The following tables present the Company’s financial instruments carried at fair value as of September 30, 20202021 and December 31, 2019,2020, based upon the valuation hierarchy (dollars in thousands):
| | | | | | | | | | | | | | | | | | | | | | | |
| | September 30, 2020 |
| | Fair Value |
| | Level I | | Level II | | Level III | | Total |
| Assets | | | | | | | |
| | | | | | | |
| | | | | | | |
| | | | | | | |
| | | | | | | |
| Agency RMBS Interest-Only Strips | $ | 0 | | | $ | 0 | | | $ | 153 | | | $ | 153 | |
| Agency RMBS Interest-Only Strips accounted for as derivatives, included in MBS | 0 | | | 0 | | | 1,700 | | | 1,700 | |
| Subtotal Agency MBS | 0 | | | 0 | | | 1,853 | | | 1,853 | |
| Non-Agency CMBS | 0 | | | 172,391 | | | 8,930 | | | 181,321 | |
| Non-Agency RMBS | 0 | | | 0 | | | 21,568 | | | 21,568 | |
| Non-Agency RMBS Interest-Only Strips | 0 | | | 0 | | | 4,248 | | | 4,248 | |
| | | | | | | |
| Subtotal Non-Agency MBS | 0 | | | 172,391 | | | 34,746 | | | 207,137 | |
| | | | | | | |
| Other securities | 0 | | | 32,542 | | | 8,513 | | | 41,055 | |
| Total mortgage-backed securities and other securities | 0 | | | 204,933 | | | 45,112 | | | 250,045 | |
| | | | | | | |
| Residential Whole Loans | 0 | | | 0 | | | 1,096,997 | | | 1,096,997 | |
| Residential Bridge Loans | 0 | | | 0 | | | 16,333 | | | 16,333 | |
| Securitized commercial loans | 0 | | | 0 | | | 1,687,545 | | | 1,687,545 | |
| Commercial Loans | 0 | | | 0 | | | 325,651 | | | 325,651 | |
| Derivative assets | 0 | | | 481 | | | 0 | | | 481 | |
| Total Assets | $ | 0 | | | $ | 205,414 | | | $ | 3,171,638 | | | $ | 3,377,052 | |
| | | | | | | |
| Liabilities | | | | | | | |
| Derivative liabilities | $ | 0 | | | $ | 1,166 | | | $ | 0 | | | $ | 1,166 | |
| Securitized debt | 0 | | | 1,619,093 | | | 17,367 | | | 1,636,460 | |
| | | | | | | |
| Total Liabilities | $ | 0 | | | $ | 1,620,259 | | | $ | 17,367 | | | $ | 1,637,626 | |
| | | | | | | | | | | | | | | | | | | | | | | |
| | September 30, 2021 |
| | Fair Value |
| | Level I | | Level II | | Level III | | Total |
| Assets | | | | | | | |
| | | | | | | |
| | | | | | | |
| | | | | | | |
| | | | | | | |
| Agency RMBS Interest-Only Strips | $ | — | | | $ | — | | | $ | 134 | | | $ | 134 | |
| Agency RMBS Interest-Only Strips accounted for as derivatives, included in MBS | — | | | — | | | 1,208 | | | 1,208 | |
| Subtotal Agency MBS | — | | | — | | | 1,342 | | | 1,342 | |
| | | | | | | |
| Non-Agency CMBS | — | | | 119,861 | | | 14,789 | | | 134,650 | |
| Non-Agency RMBS | — | | | 25,731 | | | — | | | 25,731 | |
| Non-Agency RMBS Interest-Only Strips | — | | | — | | | 2,280 | | | 2,280 | |
| | | | | | | |
| Subtotal Non-Agency MBS | — | | | 145,592 | | | 17,069 | | | 162,661 | |
| | | | | | | |
| Other securities | — | | | 52,093 | | | — | | | 52,093 | |
| Total mortgage-backed securities and other securities | — | | | 197,685 | | | 18,411 | | | 216,096 | |
| | | | | | | |
| Residential Whole Loans | — | | | — | | | 949,417 | | | 949,417 | |
| Residential Bridge Loans | — | | | — | | | 5,960 | | | 5,960 | |
| Securitized commercial loans | — | | | — | | | 1,377,005 | | | 1,377,005 | |
| Commercial Loans | — | | | — | | | 128,766 | | | 128,766 | |
| Derivative assets | — | | | 94 | | | — | | | 94 | |
| Total Assets | $ | — | | | $ | 197,779 | | | $ | 2,479,559 | | | $ | 2,677,338 | |
| | | | | | | |
| Liabilities | | | | | | | |
| Derivative liabilities | $ | — | | | $ | 562 | | | $ | — | | | $ | 562 | |
| Securitized debt | — | | | 1,350,574 | | | 14,920 | | | 1,365,494 | |
| | | | | | | |
| Total Liabilities | $ | — | | | $ | 1,351,136 | | | $ | 14,920 | | | $ | 1,366,056 | |
| | | | December 31, 2019 | | December 31, 2020 |
| | | Fair Value | | Fair Value |
| | | Level I | | Level II | | Level III | | Total | | Level I | | Level II | | Level III | | Total |
| Assets | Assets | | | | | | | | Assets | | | | | | | |
| | Agency CMBS | $ | 0 | | | $ | 1,435,477 | | | $ | 0 | | | $ | 1,435,477 | | |
| | Agency CMBS Interest-Only Strips accounted for as derivatives, included in MBS | 0 | | | 3,092 | | | 0 | | | 3,092 | | |
| Agency RMBS | 0 | | | 340,771 | | | 0 | | | 340,771 | | |
| | Agency RMBS Interest-Only Strips | Agency RMBS Interest-Only Strips | 0 | | | 0 | | | 10,343 | | | 10,343 | | Agency RMBS Interest-Only Strips | $ | — | | | $ | — | | | $ | 143 | | | $ | 143 | |
| Agency RMBS Interest-Only Strips accounted for as derivatives, included in MBS | Agency RMBS Interest-Only Strips accounted for as derivatives, included in MBS | 0 | | | 0 | | | 5,572 | | | 5,572 | | Agency RMBS Interest-Only Strips accounted for as derivatives, included in MBS | — | | | — | | | 1,565 | | | 1,565 | |
| Subtotal Agency MBS | Subtotal Agency MBS | 0 | | | 1,779,340 | | | 15,915 | | | 1,795,255 | | Subtotal Agency MBS | — | | | — | | | 1,708 | | | 1,708 | |
| | Non-Agency CMBS | Non-Agency CMBS | 0 | | | 316,019 | | | 0 | | | 316,019 | | Non-Agency CMBS | — | | | 155,093 | | | 8,988 | | | 164,081 | |
| Non-Agency RMBS | Non-Agency RMBS | 0 | | | 0 | | | 38,131 | | | 38,131 | | Non-Agency RMBS | — | | | — | | | 21,416 | | | 21,416 | |
| Non-Agency RMBS Interest-Only Strips | Non-Agency RMBS Interest-Only Strips | 0 | | | 0 | | | 7,683 | | | 7,683 | | Non-Agency RMBS Interest-Only Strips | — | | | — | | | 3,965 | | | 3,965 | |
| | Subtotal Non-Agency MBS | Subtotal Non-Agency MBS | 0 | | | 316,019 | | | 45,814 | | | 361,833 | | Subtotal Non-Agency MBS | — | | | 155,093 | | | 34,369 | | | 189,462 | |
| | Other securities | Other securities | 0 | | | 62,965 | | | 17,196 | | | 80,161 | | Other securities | — | | | 40,161 | | | 8,593 | | | 48,754 | |
| Total mortgage-backed securities and other securities | Total mortgage-backed securities and other securities | 0 | | | 2,158,324 | | | 78,925 | | | 2,237,249 | | Total mortgage-backed securities and other securities | — | | | 195,254 | | | 44,670 | | | 239,924 | |
| | Residential Whole Loans | Residential Whole Loans | 0 | | | 0 | | | 1,375,860 | | | 1,375,860 | | Residential Whole Loans | — | | | — | | | 1,008,782 | | | 1,008,782 | |
| Residential Bridge Loans | Residential Bridge Loans | 0 | | | 0 | | | 33,269 | | | 33,269 | | Residential Bridge Loans | — | | | — | | | 12,813 | | | 12,813 | |
| Securitized commercial loan | Securitized commercial loan | 0 | | | 0 | | | 370,213 | | | 370,213 | | Securitized commercial loan | — | | | — | | | 1,605,335 | | | 1,605,335 | |
| Commercial Loans | Commercial Loans | 0 | | | 0 | | | 909,040 | | | 909,040 | | Commercial Loans | — | | | — | | | 310,523 | | | 310,523 | |
| Derivative assets | Derivative assets | 0 | | | 5,111 | | | 0 | | | 5,111 | | Derivative assets | — | | | 161 | | | — | | | 161 | |
| Total Assets | Total Assets | $ | 0 | | | $ | 2,163,435 | | | $ | 2,767,307 | | | $ | 4,930,742 | | Total Assets | $ | — | | | $ | 195,415 | | | $ | 2,982,123 | | | $ | 3,177,538 | |
| | Liabilities | Liabilities | | | | | | | | Liabilities | | | | | | | |
| Derivative liabilities | Derivative liabilities | $ | 0 | | | $ | 6,370 | | | $ | 0 | | | $ | 6,370 | | Derivative liabilities | $ | — | | | $ | 656 | | | $ | — | | | $ | 656 | |
| Securitized debt | Securitized debt | 0 | | | 680,586 | | | 1,057 | | | 681,643 | | Securitized debt | — | | | 1,538,304 | | | 15,418 | | | 1,553,722 | |
| Total Liabilities | Total Liabilities | $ | 0 | | | $ | 686,956 | | | $ | 1,057 | | | $ | 688,013 | | Total Liabilities | $ | — | | | $ | 1,538,960 | | | $ | 15,418 | | | $ | 1,554,378 | |
When available, the Company uses quoted market prices to determine the fair value of an asset or liability. If quoted market prices are not available, the Company will use independent pricing services, and if the independent pricing service cannot price a particular asset or liability, the Company will obtain third party broker quotes. The Manager’s pricing group, which functions independently from its portfolio management personnel, reviews the third party broker quotes by comparing the broker quotes for reasonableness to alternate sources when available. If independent pricing services or third party broker quotes, are not available, the Company determines the fair value of the securities using valuation techniques that use, when possible, current market-based or independently sourced market parameters, such as interest rates and when applicable, estimates of prepayments and credit losses.
In instances when the Company is required to consolidate a VIE that is determined to be a qualifying collateralized financing entity ("CFE"), under GAAP and if the Company has elected the fair value option for the securitized debt, the Company will measure both the financial assets and financial liabilities of the VIE using the fair value of either the VIE’s financial assets or financial liabilities, whichever is more observable.
Mortgage-backed securities and other securities
In determining the proper fair value hierarchy or level, the Company considers the amount of available observable market data for each security. Agency CMBS, given the amount of available observable market data, generally are classified in Level II. For newly issued Agency CMBS securities that have not settled at period end and do not have a CUSIP yet, the Company utilizes a broker quote due to lack of observable market data. Accordingly these securities are classified in Level III. For Agency IOs, Non-Agency RMBS, CMBS and other securities, to determine whether a security should be a Level II, the securities are grouped by security type and the Manager reviews the internal trade history, for the quarter, for each security type. If there is sufficient trade data above a predetermined threshold of a security type, the
Manager determines it has sufficient observable market data and the security will be categorized as a Level II; otherwise, the security is classified as a Level III.
Values for the Company’s securities are based upon prices obtained from independent third party pricing services. The valuation methodology of the third party pricing services incorporates market information and commonly used market pricing methods, which include actual trades and quoted prices for similar or identical instruments, and are designed to produce a pricing process that is responsive to market conditions. Depending on the type of asset and the underlying collateral, the primary inputs to the model include yields for TBAs, Agency RMBS, the U.S. Treasury market and floating rate indices such as LIBOR, the Constant Maturity Treasury rate and the prime rate as a benchmark yield. In addition, the model may incorporate the current weighted average maturity and additional pool level information such as prepayment speeds, default frequencies and default severities, if applicable. When the third party pricing service cannot adequately price a particular security, the Company utilizes a broker’s quote which is reviewed for reasonableness by the Manager’s pricing group.
Residential Whole Loans and Residential Bridge Loans
Values for the Company's Non-QM Residential Whole Loans and Bridge Loans are based upon prices obtained from an independent third party pricing service that specializes in loan valuation, utilizing a discounted cash flow valuation model that is calibrated to recent loan trade execution. Their valuation methodology incorporates commonly used market pricing methods, which include the inputs considered most significant to the determination of fair value of the Company's Residential Whole Loans and Residential Bridge Loans. The key loan inputs include loan balance, interest rate, loan to value, delinquencies and fair value of the collateral for collateral dependent loans. The assumptions made by the independent third party pricing service includes the yield,market discount rate, default assumptionassumptions and loss severity. Other inputs and assumptions relevant to the pricing of Residential Whole Loans include FICO scores and prepayment speeds.
InDuring the third quarter of 2020 there was very limited, if any residential whole loans sale transactions. As a resultended September 30, 2021, the independent third party pricing service used a combination of recent loan trades and recent residential whole loans securitization transactions which was very active,adjusted for deal cost and liquidity premium, to form their opinion on the appropriate discount rate. To arrive at the appropriate discount rate for residential whole loans, the vendor made adjustments for deal cost and liquidity premium.
The values for the Conforming Residential Whole Loan Portfolio were based on a third party pricing service valuation model that assigns a loan value using TBA prices, adjusted for delivery to Fannie Mae using Fannie Mae's loan-level price adjustment matrix. In addition to pricing the underlying mortgages, the third party pricing service uses a service release premium valuation representing the sale of the right to service the mortgages. Together, the TBA price and service release premium price form the "All-In" price for these mortgages. During the second quarter of 2020, the Company sold its Conforming Residential Whole Loan portfolio and as of September 30, 2020, holds no Conforming Residential Whole Loans in its investment portfolio.
The Company reviews the analysis provided by pricing service as well as the key assumptions made available to the Company. Due to the inherent uncertainty of such valuation, the fair values established for residential loans held by the Company may differ from the fair values that would have been established if a readily available market existed for these loans. Accordingly, the Company's loans are classified as Level III.
Commercial Loans
Values for the Company's Commercial Loans are based upon prices obtained from an independent third party pricing service that specializes in loan valuation, utilizing a valuation model that is calibrated to recent loan trade execution. Their valuation methodology incorporates commonly used market pricing methods, which include the inputs considered most significant to the determination of fair value of the Company's Commercial Loans. The assumptions made by the independent third party pricing vendor include a market discount rate, default assumption, loss severity, cash flows and probability weighted loss severity.scenarios. The Company reviews the analysis provided by the pricing service as well as the key assumptions. Due to the inherent uncertainty of such valuation, the fair values established for commercial loans held by the Company may differ from the fair values that would have been established if a readily available market existed for these loans. Accordingly, the Company's commercial loans are classified as a Level III.
Securitized commercial loans
Values for the Company’s securitized commercial loans are based on the CFEcollateralized financing entity ("CFE") valuation methodology. Since there is an extremely limited market for the securitized commercial loans, the Company determined the securitized debt is more actively traded and therefore was more observable. Due to the inherent uncertainty of the securitized commercial loans' valuation, the Company classifies its securitized commercial loans as Level III.
Securitized debt
Values for the Company's securitized debt that the Company elected the fair value option are based upon prices obtained from independent third party pricing services. The valuation methodology of the third party pricing services incorporates market information and commonly used market pricing methods, which include actual trades and quoted prices for similar or identical instruments. In determining the proper fair value hierarchy or level, the Company considers the amount of available observable market data for each security. Since the securitized debt represents traded debt securities, the Manager's pricing team reviews the trade activity during the quarter for each security to determine the appropriate level within the fair value hierarchy. If there is sufficient trade data above a predetermined volume threshold, the Manager determines it has sufficient observable market data and the debt security will be categorized as a Level II. If there is not sufficient observable market data the debt security will be categorized as a Level III.
Derivatives
Values for the Company's derivatives are based upon prices from third party pricing services, whose pricing is subject to review by the Manager’s pricing committee. In valuing its over-the-counter interest rate derivatives, such as swaps and swaptions, its currency derivatives, such as swaps and forwards and credit derivatives such as total return swaps, the Company considers the creditworthiness of both the Company and its counterparties, along with collateral provisions contained in each derivative agreement, from the perspective of both the Company and its counterparties. NaNNo credit valuation adjustment was made in determining the fair value of interest rate derivatives and/or futures contracts for the periods ended September 30, 20202021 and December 31, 2019.2020.
Third Party Pricing Data Review
The Company performs quarterly reviews of the independent third party pricing data. These reviews may include a review of the valuation methodology used by third party valuation specialists and review of the daily change in the prices provided by the independent pricing vendor which exceed established tolerances or comparisons to executed transaction prices, utilizing the Manager’s pricing group. The Manager’s pricing group, which functions independently from its portfolio management personnel, reviews the price differences or changes in price by comparing the vendor price to alternate sources including other independent pricing services or broker quotations. If the price change or difference cannot be corroborated, the Manager’s pricing group consults with the portfolio management team for market color in reviewing such pricing data as warranted. To the extent that the Manager has information, typically in the form of broker quotations that would indicate that a price received from the independent pricing service is outside of a tolerance range, the Manager generally challenges the independent pricing service price.
The following tables present a summary of the available quantitative information about the significant unobservable inputs used in the fair value measurement of financial instruments for which the Company has utilized Level III inputs to determine fair value as of September 30, 20202021 and December 31, 20192020 (dollars in thousands):
| | | | | | | | | | | | | | | | | | | | | | | | | | | | | | | | | | | | | | |
| | Fair Value at | | | | | | Range | | |
| | September 30, 2021 | | Valuation Technique | | Unobservable Input | | Minimum | | Maximum | | Weighted Average |
| | | | | | | | | | | | |
| | | | | | | | | | | | |
| | | | | | | | | | | | |
| | | | | | | | | | | | |
| | | | | | | | | | | | |
| | | | | | | | | | | | |
| Residential Whole Loans | | $ | 949,417 | | | Discounted Cash Flow | | Market Discount Rate | | 2.0 | % | | 7.5 | % | | 3.2 | % |
| | | | | | Weighted Average Life | | 1.1 | | 8.6 | | 2.9 |
| Residential Bridge Loans | | $ | 5,960 | | | Discounted Cash Flow | | Market Discount Rate | | 9.7 | % | | 26.3 | % | (1) | 16.8 | % |
| | | | | | Weighted Average Life | | 0.3 | | 3.3 | | 2.2 |
| | | | | | | | | | | | |
| | | | | | | | | | | | |
| | | | | | | | | | | | |
| Commercial Loans | | $ | 128,766 | | | Discounted Cash Flow | | Market Discount Rate | | 4.2 | % | | 22.0 | % | | 9.1 | % |
| | | | | | Weighted Average Life | | 0.8 | | 2.4 | | 1.3 |
| | | | | | | | | | | | |
| | | | | | | | | | | | |
| | | | | | | | | | | | | | | | | | | | | | | | | | | | | | | | | | | | | | |
| | Fair Value at | | | | | | Range | | |
| | September 30, 2020 | | Valuation Technique | | Unobservable Input | | Minimum | | Maximum | | Weighted Average |
| | | | | | | | | | | | |
| | | | | | | | | | | | |
| | | | | | | | | | | | |
| | | | | | | | | | | | |
| | | | | | | | | | | | |
| | | | | | | | | | | | |
| Residential Whole-Loans | | 1,096,997 | | | Discounted Cash Flow | | Yield | | 2.0 | % | | 7.5 | % | | 4.0 | % |
| | | | | | Weighted Average Life | | 1.2 | | 6.4 | | 2.7 |
| Residential Bridge Loans | | 16,333 | | | Discounted Cash Flow | | Yield | | 8.0 | % | | 36.9 | % | (1) | 14.9 | % |
| | | | | | Weighted Average Life | | 0.3 | | 2.3 | | 1.0 |
| | | | | | | | | | | | |
| | | | | | | | | | | | |
| | | | | | | | | | | | |
| Commercial Loans | | 325,651 | | | Discounted Cash Flow | | Yield | | 6.3 | % | | 14.7 | % | | 9.3 | % |
| | | | | | Weighted Average Life | | 0.7 | | 2.2 | | 0.9 |
| | | | | | | | | | | | |
| | | | | | | | | | | | |
| | | | | | | | | | | | | | | | | | | | | | | | | | | | | | | | | | | | | | |
| | Fair Value at | | | | | | Range | | |
| | December 31, 2019 | | Valuation Technique | | Unobservable Input | | Minimum | | Maximum | | Weighted Average |
| | | | | | | | | | | | |
| | | | | | | | | | | | |
| | | | | | | | | | | | |
| | | | | | | | | | | | |
| | | | | | | | | | | | |
| | | | | | | | | | | | |
Residential Whole-Loans(2) | | 1,200,566 | | | Discounted Cash Flow | | Yield | | 3.4 | % | | 7.0 | % | | 3.7 | % |
| | | | | | Weighted Average Life | | 1.4 | | 7.8 | | 3.0 |
| Residential Bridge Loans | | 33,269 | | | Discounted Cash Flow | | Yield | | 7.5 | % | | 27.0 | % | (1) | 9.8 | % |
| | | | | | Weighted Average Life | | 0.3 | | 1.8 | | 0.8 |
| | | | | | | | | | | | |
| Commercial Loans | | 370,213 | | | Discounted Cash Flow | | Yield | | 4.7 | % | | 10.9 | % | | 7.5 | % |
| | | | | | Weighted Average Life | | 0.4 | | 2.9 | | 1.6 |
| | | | | | | | | | | | |
| | | | | | | | | | | | |
| | | | | | | | | | | | | | | | | | | | | | | | | | | | | | | | | | | | | | |
| | Fair Value at | | | | | | Range | | |
| | December 31, 2020 | | Valuation Technique | | Unobservable Input | | Minimum | | Maximum | | Weighted Average |
| | | | | | | | | | | | |
| | | | | | | | | | | | |
| | | | | | | | | | | | |
| | | | | | | | | | | | |
| | | | | | | | | | | | |
| | | | | | | | | | | | |
| Residential Whole Loans | | $ | 1,008,782 | | | Discounted Cash Flow | | Market Discount Rate | | 2.1 | % | | 7.5 | % | | 4.1 | % |
| | | | | | Weighted Average Life | | 1.5 | | 8.4 | | 2.9 |
| Residential Bridge Loans | | $ | 12,813 | | | Discounted Cash Flow | | Market Discount Rate | | 8.0 | % | | 35.2 | % | (1) | 18.0 | % |
| | | | | | Weighted Average Life | | 0.3 | | 2.6 | | 1.3 |
| | | | | | | | | | | | |
| Commercial Loans | | $ | 310,523 | | | Discounted Cash Flow | | Market Discount Rate | | 6.3 | % | | 18.4 | % | | 10.5 | % |
| | | | | | Weighted Average Life | | 0.5 | | 1.9 | | 0.7 |
| | | | | | | | | | | | |
| | | | | | | | | | | | |
(1) Yield to maturity is the total return on the loan expressed as an annual rate. Delinquent Bridge Loans that are nearing maturity and with fair value that is significantly less than the principal amount have a higher discount rate or yield to maturity, some of which are greater than 100%.
(2) As of December 31, 2019, excludes $175.3 million of Conforming Residential Whole Loans, which were valued using TBA prices, adjusted for delivery to Fannie Mae using Fannie Mae's loan-level price adjustment matrix. As of December 31, 2019, the TBA prices used for valuing the conforming loans range from $101.39 to $107.63.
The following tables present additional information about the Company’s financial instruments which are measured at fair value on a recurring basis for which the Company has utilized Level III inputs to determine fair value:
| | | | | | | | | | | | | | | | | | | | | | | | | | | | | | | | | | | | | | | | | | | | | |
| | Three months ended September 30, 2021 |
| $ in thousands | Agency MBS | | Non-Agency MBS | | | | Residential
Whole Loans | | Residential
Bridge Loans | | Commercial Loans | | Securitized
commercial
loans | | Securitized debt | | |
| Beginning balance | $ | 1,501 | | | $ | 11,803 | | | | | $ | 801,503 | | | $ | 7,471 | | | $ | 267,203 | | | $ | 1,595,077 | | | $ | 14,937 | | | |
| Transfers into Level III from Level II | — | | | 5,683 | | | | | — | | | — | | | — | | | — | | | — | | | |
| Transfers from Level III into Level II | — | | | — | | | | | — | | | — | | | — | | | — | | | — | | | |
| Purchases | — | | | — | | | | | 232,993 | | | — | | | — | | | — | | | — | | | |
| | | | | | | | | | | | | | | | | |
| Transfers to REO | — | | | — | | | | | — | | | (68) | | | (30,000) | | | — | | | — | | | |
| | | | | | | | | | | | | | | | | |
| | | | | | | | | | | | | | | | | |
| Loan modifications / capitalized interest | — | | | — | | | | | 34 | | | — | | | — | | | — | | | — | | | |
| Principal repayments | — | | | — | | | | | (80,607) | | | (1,575) | | | (102,969) | | | (214,545) | | | — | | | |
| Total net gains / losses included in net income | | | | | | | | | | | | | | | | | |
| Realized gains/(losses), net on assets | — | | | — | | | | | — | | | (3) | | | — | | | — | | | — | | | |
| | | | | | | | | | | | | | | | | |
| | | | | | | | | | | | | | | | | |
Unrealized gains/(losses), net on assets(1) | (93) | | | (399) | | | | | (3,074) | | | 154 | | | (5,495) | | | (9,617) | | | — | | | |
Unrealized (gains)/losses, net on liabilities(2) | — | | | — | | | | | — | | | — | | | — | | | — | | | 1,103 | | | |
| Premium and discount amortization, net | (66) | | | (18) | | | | | (1,432) | | | (19) | | | 27 | | | 6,090 | | | (1,120) | | | |
| Ending balance | $ | 1,342 | | | $ | 17,069 | | | | | $ | 949,417 | | | $ | 5,960 | | | $ | 128,766 | | | $ | 1,377,005 | | | $ | 14,920 | | | |
| | | | | | | | | | | | | | | | | |
Unrealized gains/(losses), net on assets held at the end of the period(1) | $ | (93) | | | $ | (399) | | | | | $ | (1,055) | | | $ | 36 | | | $ | (5,479) | | | $ | (12,336) | | | $ | — | | | |
Unrealized gains/(losses), net on liabilities held at the end of the period(2) | $ | — | | | $ | — | | | | | $ | — | | | $ | — | | | $ | — | | | $ | — | | | $ | (1,121) | | | |
| | | | | | | | | | | | | | | | | | | | | | | | | | | | | | | | | | | | | | | | | | | | | | | | | |
| | Three months ended September 30, 2020 |
| $ in thousands | Agency MBS | | Non-Agency MBS | | Other Securities | | Residential
Whole Loans | | Residential
Bridge Loans | | Commercial Loans | | Securitized
commercial
loans | | Securitized debt | | |
| Beginning balance | $ | 1,975 | | | $ | 33,984 | | | $ | 8,695 | | | $ | 1,124,051 | | | $ | 24,171 | | | $ | 323,474 | | | $ | 465,694 | | | $ | 31 | | | |
| Transfers into Level III from Level II | — | | | — | | | — | | | — | | | — | | | — | | | — | | | — | | | |
| Transfers from Level III into Level II | — | | | — | | | — | | | — | | | — | | | — | | | — | | | — | | | |
| | | | | | | | | | | | | | | | | |
| | | | | | | | | | | | | | | | | |
| Transfers to REO | — | | | — | | | — | | | — | | | 0 | | | — | | | — | | | — | | | |
| VIE consolidation | — | | | — | | | — | | | — | | | — | | | — | | | 1,245,287 | | | 17,960 | | | |
| | | | | | | | | | | | | | | | | |
| Loan modifications / capitalized interest | — | | | — | | | — | | | 607 | | | — | | | 33 | | | — | | | — | | | |
| Principal repayments | — | | | (97) | | | — | | | (74,818) | | | (7,942) | | | (91) | | | (32,560) | | | — | | | |
| Total net gains / losses included in net income | | | | | | | | | | | | | | | | | |
| Realized gains/(losses), net on assets | 0 | | | — | | | — | | | 0 | | | (288) | | | — | | | — | | | — | | | |
| Realized (gains)/losses, net on liabilities | — | | | — | | | — | | | — | | | — | | | — | | | — | | | — | | | |
| | | | | | | | | | | | | | | | | |
Unrealized gains/(losses), net on assets(1) | 61 | | | 950 | | | (188) | | | 48,108 | | | 412 | | | 2,195 | | | 4,567 | | | — | | | |
Unrealized (gains)/losses, net on liabilities(2) | — | | | — | | | — | | | — | | | — | | | — | | | — | | | 122 | | | |
| Premium and discount amortization, net | (183) | | | (91) | | | 6 | | | (951) | | | (20) | | | 40 | | | 4,557 | | | (746) | | | |
| Ending balance | $ | 1,853 | | | $ | 34,746 | | | $ | 8,513 | | | $ | 1,096,997 | | | $ | 16,333 | | | $ | 325,651 | | | $ | 1,687,545 | | | $ | 17,367 | | | |
| | | | | | | | | | | | | | | | | |
Unrealized gains/(losses), net on assets held at the end of the period(1) | $ | 61 | | | $ | 950 | | | $ | (188) | | | $ | 45,948 | | | $ | 29 | | | $ | 2,195 | | | $ | 4,567 | | | $ | — | | | |
Unrealized gains/(losses), net on liabilities held at the end of the period(2) | $ | — | | | $ | — | | | $ | — | | | $ | — | | | $ | — | | | $ | — | | | $ | — | | | $ | (122) | | | |
| | | | | | | | | | | | | | | | | | | | | | | | | | | | | | | | | | | | | | | | | | | | | | | | | |
| Three months ended September 30, 2020 |
| $ in thousands | Agency MBS | | Non-Agency MBS | | Other Securities | | Residential
Whole Loans | | Residential
Bridge Loans | | Commercial Loans | | Securitized
commercial
loan | | Securitized debt | | |
| Beginning balance | $ | 1,975 | | | $ | 33,984 | | | $ | 8,695 | | | $ | 1,124,051 | | | $ | 24,171 | | | $ | 323,474 | | | $ | 465,694 | | | $ | 31 | | | |
| Transfers into Level III from Level II | — | | | — | | | — | | | — | | | — | | | — | | | — | | | — | | | |
| Transfers from Level III into Level II | — | | | — | | | — | | | — | | | — | | | — | | | — | | | — | | | |
| | | | | | | | | | | | | | | | | |
| Sales and settlements | — | | | — | | | — | | | — | | | — | | | — | | | — | | | — | | | |
| Transfers to REO | — | | | — | | | — | | | — | | | — | | | — | | | — | | | — | | | |
| VIE consolidation | — | | | — | | | — | | | — | | | — | | | — | | | 1,245,287 | | | 17,960 | | | |
| | | | | | | | | | | | | | | | | |
| Loan modifications / capitalized interest | — | | | — | | | — | | | 607 | | | — | | | 33 | | | — | | | — | | | |
| Principal repayments | — | | | (97) | | | — | | | (74,818) | | | (7,942) | | | (91) | | | (32,560) | | | — | | | |
| Total net gains / losses included in net income | | | | | 0 | | | | | | | | | | | | |
| Realized gains/(losses), net on assets | — | | | — | | | — | | | — | | | (288) | | | — | | | — | | | — | | | |
| | | | | | | | | | | | | | | | | |
| | | | | | | | | | | | | | | | | |
Unrealized gains/(losses), net on assets(1) | 61 | | | 950 | | | (188) | | | 48,108 | | | 412 | | | 2,195 | | | 4,567 | | | — | | | |
Unrealized (gains)/losses, net on liabilities(2) | — | | | — | | | — | | | — | | | — | | | — | | | — | | | 122 | | | |
| Premium and discount amortization, net | (183) | | | (91) | | | 6 | | | (951) | | | (20) | | | 40 | | | 4,557 | | | (746) | | | |
| Ending balance | $ | 1,853 | | | $ | 34,746 | | | $ | 8,513 | | | $ | 1,096,997 | | | $ | 16,333 | | | $ | 325,651 | | | $ | 1,687,545 | | | $ | 17,367 | | | |
| | | | | | | | | | | | | | | | | |
Unrealized gains/(losses), net on assets held at the end of the period(1) | $ | 61 | | | $ | 950 | | | $ | (188) | | | $ | 45,948 | | | $ | 29 | | | $ | 2,195 | | | $ | 4,567 | | | $ | — | | | |
Unrealized gains/(losses), net on liabilities held at the end of the period(2) | $ | — | | | $ | — | | | $ | — | | | $ | — | | | $ | — | | | $ | — | | | $ | — | | | $ | (122) | | | |
| | | | | | | | | | | | | | | | | | | | | | | | | | | | | | | | | | | | | | | | | | | | | | | | | |
| Nine months ended September 30, 2021 |
| $ in thousands | Agency MBS | | Non-Agency MBS | | Other Securities | | Residential
Whole-Loans | | Residential
Bridge Loans | | Commercial Loans | | Securitized
commercial
loan | | Securitized debt | | |
| Beginning balance | $ | 1,708 | | | $ | 34,369 | | | $ | 8,593 | | | $ | 1,008,782 | | | $ | 12,813 | | | $ | 310,523 | | | $ | 1,605,335 | | | $ | 15,418 | | | |
| Transfers into Level III from Level II | — | | | 5,683 | | | — | | | — | | | — | | | — | | | — | | | — | | | |
| Transfers from Level III into Level II | — | | | (23,370) | | | (10,306) | | | — | | | — | | | — | | | — | | | — | | | |
| Purchases | — | | | — | | | — | | | 241,417 | | | — | | | — | | | — | | | — | | | |
| | | | | | | | | | | | | | | | | |
| Transfers to REO | — | | | — | | | — | | | — | | | (752) | | | (30,000) | | | — | | | — | | | |
| | | | | | | | | | | | | | | | | |
| | | | | | | | | | | | | | | | | |
| Loan modifications / capitalized interest | — | | | — | | | — | | | 311 | | | — | | | — | | | — | | | — | | | |
| Principal repayments | — | | | (256) | | | — | | | (307,543) | | | (6,542) | | | (103,272) | | | (354,202) | | | — | | | |
| Total net gains / losses included in net income | | | | | | | | | | | | | | | | | |
| Realized gains/(losses), net on assets | — | | | — | | | — | | | — | | | (155) | | | — | | | — | | | — | | | |
| | | | | | | | | | | | | | | | | |
| | | | | | | | | | | | | | | | | |
Unrealized gains/(losses), net on assets(1) | (109) | | | 868 | | | 1,657 | | | 13,160 | | | 617 | | | (48,630) | | | 107,423 | | | — | | | |
Unrealized (gains)/losses, net on liabilities(2) | — | | | — | | | — | | | — | | | — | | | — | | | — | | | 2,810 | | | |
| Premium and discount amortization, net | (257) | | | (225) | | | 56 | | | (6,710) | | | (21) | | | 145 | | | 18,449 | | | (3,308) | | | |
| Ending balance | $ | 1,342 | | | $ | 17,069 | | | $ | — | | | $ | 949,417 | | | $ | 5,960 | | | $ | 128,766 | | | $ | 1,377,005 | | | $ | 14,920 | | | |
| | | | | | | | | | | | | | | | | |
Unrealized gains/(losses), net on assets held at the end of the period(1) | $ | (109) | | | $ | (1,434) | | | $ | — | | | $ | 13,702 | | | $ | (60) | | | $ | (48,630) | | | $ | 92,424 | | | $ | — | | | |
Unrealized gains/(losses), net on liabilities held at the end of the period(2) | $ | — | | | $ | — | | | $ | — | | | $ | — | | | $ | — | | | $ | — | | | $ | — | | | $ | (2,357) | | | |
| | | | | | | | | | | | | | | | | | | | | | | | | | | | | | | | | | | | | | | | | | | | | | | | | |
| Three months ended September 30, 2019 |
| $ in thousands | Agency MBS | | Non-Agency MBS | | Other Securities | | Residential
Whole Loans | | Residential
Bridge Loans | | Commercial Loans | | Securitized
commercial
loan | | Securitized debt | | |
| Beginning balance | $ | 58,917 | | | $ | 47,187 | | | $ | 17,797 | | | $ | 1,206,220 | | | $ | 87,402 | | | $ | 312,032 | | | $ | 804,134 | | | $ | 2,876 | | | |
| Transfers into Level III from Level II | — | | | — | | | — | | | — | | | — | | | — | | | — | | | — | | | |
| Transfers from Level III into Level II | (43,686) | | | — | | | — | | | — | | | — | | | — | | | — | | | — | | | |
| Purchases | 68,633 | | | — | | | — | | | 80,725 | | | — | | | 129,730 | | | — | | | — | | | |
| Sales and settlements | (401) | | | — | | | — | | | — | | | — | | | — | | | — | | | 0 | | | |
| Transfers to REO | — | | | — | | | — | | | — | | | (2,677) | | | — | | | — | | | — | | | |
| Principal repayments | 0 | | | (311) | | | (253) | | | (78,672) | | | (36,978) | | | 0 | | | (100,700) | | | — | | | |
| Total net gains / losses included in net income | | | | | 0 | | | | | | | | | | | | |
| Realized gains/(losses), net on assets | — | | | — | | | — | | | — | | | (195) | | | — | | | — | | | — | | | |
| | | | | | | | | | | | | | | | | |
| Other than temporary impairment | (193) | | | (27) | | | — | | | — | | | — | | | — | | | — | | | — | | | |
Unrealized gains/(losses), net on assets(1) | 2,256 | | | 970 | | | 305 | | | 1,875 | | | 569 | | | 204 | | | (845) | | | — | | | |
Unrealized (gains)/losses, net on liabilities(2) | — | | | — | | | — | | | — | | | — | | | — | | | — | | | (71) | | | |
| Premium and discount amortization, net | (983) | | | (564) | | | (74) | | | (911) | | | (67) | | | 66 | | | (754) | | | (829) | | | |
| Ending balance | $ | 84,543 | | | $ | 47,255 | | | $ | 17,775 | | | $ | 1,209,237 | | | $ | 48,054 | | | $ | 442,032 | | | $ | 701,835 | | | $ | 1,976 | | | |
| | | | | | | | | | | | | | | | | |
Unrealized gains/(losses), net on assets held at the end of the period(1) | $ | 844 | | | $ | 970 | | | $ | 305 | | | $ | 3,239 | | | $ | (41) | | | $ | 204 | | | $ | (845) | | | $ | — | | | |
Unrealized gains/(losses), net on liabilities held at the end of the period(2) | $ | — | | | $ | — | | | $ | — | | | $ | — | | | $ | — | | | $ | — | | | $ | — | | | $ | 71 | | | |
| | | | | | | | | | | | | | | | | | | | | | | | | | | | | | | | | | | | | | | | | | | | | | | | | |
| Nine months ended September 30, 2020 |
| $ in thousands | Agency MBS | | Non-Agency MBS | | Other Securities | | Residential
Whole-Loans | | Residential
Bridge Loans | | Commercial Loans | | Securitized
commercial
loan | | Securitized debt | | |
| Beginning balance | $ | 15,915 | | | $ | 45,814 | | | $ | 17,196 | | | $ | 1,375,860 | | | $ | 33,269 | | | $ | 370,213 | | | $ | 909,040 | | | $ | 1,057 | | | |
| Transfers into Level III from Level II | — | | | — | | | — | | | — | | | — | | | — | | | — | | | — | | | |
| Transfers from Level III into Level II | — | | | — | | | (6,482) | | | — | | | — | | | — | | | — | | | — | | | |
| Purchases | — | | | — | | | — | | | 103,758 | | | — | | | — | | | — | | | — | | | |
| Sales and settlements | (11,529) | | | (12,658) | | | — | | | (144,259) | | | — | | | — | | | — | | | — | | | |
| Transfers to REO | — | | | — | | | — | | | — | | | (419) | | | — | | | — | | | — | | | |
| VIE consolidation | — | | | — | | | — | | | — | | | — | | | — | | | 1,245,287 | | | 17,960 | | | |
| VIE deconsolidation | — | | | 6,852 | | | — | | | — | | | — | | | — | | | (150,804) | | | — | | | |
| Loan modifications / capitalized interest | — | | | — | | | — | | | 614 | | | — | | | 33 | | | — | | | — | | | |
| Principal repayments | — | | | (628) | | | (154) | | | (199,655) | | | (15,821) | | | (37,728) | | | (211,204) | | | — | | | |
| Total net gains / losses included in net income | | | | | | | | | | | | | | | | | |
| Realized gains/(losses), net on assets | 1,528 | | | (60) | | | — | | | (10,511) | | | (346) | | | — | | | — | | | — | | | |
| | | | | | | | | | | | | | | | | |
| | | | | | | | | | | | | | | | | |
Unrealized gains/(losses), net on assets(1) | (2,594) | | | (3,633) | | | (2,025) | | | (25,766) | | | (290) | | | (7,218) | | | (109,683) | | | — | | | |
Unrealized (gains)/losses, net on liabilities(2) | — | | | — | | | — | | | — | | | — | | | — | | | — | | | (432) | | | |
| Premium and discount amortization, net | (1,467) | | | (941) | | | (22) | | | (3,044) | | | (60) | | | 351 | | | 4,909 | | | (1,218) | | | |
| Ending balance | $ | 1,853 | | | $ | 34,746 | | | $ | 8,513 | | | $ | 1,096,997 | | | $ | 16,333 | | | $ | 325,651 | | | $ | 1,687,545 | | | $ | 17,367 | | | |
| | | | | | | | | | | | | | | | | |
Unrealized gains/(losses), net on assets held at the end of the period(1) | $ | (601) | | | $ | (3,403) | | | $ | (675) | | | $ | (18,880) | | | $ | (618) | | | $ | (7,218) | | | $ | (50,517) | | | $ | — | | | |
Unrealized gains/(losses), net on liabilities held at the end of the period(2) | $ | — | | | $ | — | | | $ | — | | | $ | — | | | $ | — | | | $ | — | | | $ | — | | | $ | 432 | | | |
| | | | | | | | | | | | | | | | | | | | | | | | | | | | | | | | | | | | | | | | | | | | | | | | | |
| Nine months ended September 30, 2019 |
| $ in thousands | Agency MBS | | Non-Agency MBS | | Other Securities | | Residential
Whole-Loans | | Residential
Bridge Loans | | Commercial Loans | | Securitized
commercial
loan | | Securitized debt | | |
| Beginning balance | $ | 19,837 | | | $ | 50,555 | | | $ | 8,951 | | | $ | 1,041,885 | | | $ | 211,999 | | | $ | 216,123 | | | $ | 1,013,511 | | | $ | 2,286 | | | |
| Transfers into Level III from Level II | — | | | — | | | 8,386 | | | — | | | — | | | — | | | — | | | — | | | |
| Transfers from Level III into Level II | — | | | — | | | — | | | — | | | — | | | — | | | — | | | — | | | |
| Purchases | 66,641 | | | — | | | — | | | 318,130 | | | — | | | 225,109 | | | 903,770 | | | — | | | |
| Sales and settlements | (401) | | | — | | | — | | | — | | | — | | | — | | | — | | | 3,769 | | | |
| Transfers to REO | — | | | — | | | — | | | — | | | (2,677) | | | — | | | — | | | — | | | |
| Principal repayments | — | | | (837) | | | (439) | | | (166,015) | | | (160,240) | | | 0 | | | (1,214,584) | | | — | | | |
| Total net gains / losses included in net income | | | | | | | | | | | | | | | | | |
| Realized gains/(losses), net on assets | — | | | — | | | — | | | — | | | (444) | | | — | | | — | | | — | | | |
| Realized (gains)/losses, net on liabilities | — | | | — | | | — | | | — | | | — | | | — | | | — | | | — | | | |
| Other than temporary impairment | (222) | | | (1,204) | | | — | | | — | | | — | | | — | | | — | | | — | | | |
Unrealized gains/(losses), net on assets(1) | 1,776 | | | 494 | | | 1,123 | | | 17,281 | | | 80 | | | 368 | | | 1,076 | | | — | | | |
Unrealized (gains)/losses, net on liabilities(2) | — | | | — | | | — | | | — | | | — | | | — | | | — | | | (2,088) | | | |
| Premium and discount amortization, net | (3,088) | | | (1,753) | | | (246) | | | (2,044) | | | (664) | | | 432 | | | (1,938) | | | (1,991) | | | |
| Ending balance | $ | 84,543 | | | $ | 47,255 | | | $ | 17,775 | | | $ | 1,209,237 | | | $ | 48,054 | | | $ | 442,032 | | | $ | 701,835 | | | $ | 1,976 | | | |
| | | | | | | | | | | | | | | | | |
Unrealized gains/(losses), net on assets held at the end of the period(1) | $ | 1,771 | | | $ | 494 | | | $ | 1,123 | | | $ | 18,247 | | | $ | (678) | | | $ | 368 | | | $ | 1,104 | | | $ | — | | | |
Unrealized gains/(losses), net on liabilities held at the end of the period(2) | $ | — | | | $ | — | | | $ | — | | | $ | — | | | $ | — | | | $ | — | | | $ | — | | | $ | 90 | | | |
(1)Gains and losses are included in "Unrealized gain (loss), net" in the Consolidated Statements of Operations.
(2)Gains and losses on securitized debt are included in "Unrealized gain (loss), net" in the Consolidated Statements of Operations.
Transfers between hierarchy levels for the three and nine months ended September 30, 20202021 and September 30, 20192020 were based on the availability of sufficient observable inputs. Movements from Level II to Level III was based on the back-testing of historical sales transactions performed by the Manager, which did not provide sufficient observable data to meet Level II versus Level III criteria, resulting in the movement from Level II to Level III. Movements from Level III to Level II was based on information received from a third party pricing service which, along with the back-testing of historical sales transactions performed by the Manager, which provided the sufficient observable data for the movement from Level III to Level II. The Company did not have transfers between either Level I and Level II or Level I and Level III for the three and nine months ended September 30, 20202021 and September 30, 2019.2020.
Other Fair Value Disclosures
Certain Residential Bridge Loans, repurchase agreement borrowings, convertible senior unsecured notes and securitized debt are not carried at fair value in the consolidated financial statements. The following table presents the carrying value and estimated fair value of the Company’s financial instruments that are not carried at fair value as of September 30, 20202021 and December 31, 20192020 in the consolidated financial statements (dollars in thousands):
| | | | | | | | | | | | | | | | | | | | | | | |
| September 30, 2020 | | December 31, 2019 |
| Carrying Value | | Estimated Fair Value | | Carrying Value | | Estimated Fair Value |
| Assets | | | | | | | |
| Residential Bridge Loans | $ | 1,508 | | | $ | 1,501 | | | $ | 3,150 | | | $ | 3,148 | |
| Total | $ | 1,508 | | | $ | 1,501 | | | $ | 3,150 | | | $ | 3,148 | |
| | | | | | | |
| Liabilities | | | | | | | |
| Borrowings under repurchase agreements | $ | 358,525 | | | $ | 361,421 | | | $ | 2,824,801 | | | $ | 2,829,093 | |
| Convertible senior unsecured notes | 194,510 | | | 172,430 | | | 197,299 | | | 209,172 | |
Securitized debt(1) | 973,680 | | | 995,536 | | | 801,109 | | | 810,914 | |
| Total | $ | 1,526,715 | | | $ | 1,529,387 | | | $ | 3,823,209 | | | $ | 3,849,179 | |
| | | | | | | | | | | | | | | | | | | | | | | |
| September 30, 2021 | | December 31, 2020 |
| Carrying Value | | Estimated Fair Value | | Carrying Value | | Estimated Fair Value |
| Assets | | | | | | | |
| Residential Bridge Loans | N/A | | N/A | | $ | 1,103 | | | $ | 1,095 | |
| Total | $ | — | | | $ | — | | | $ | 1,103 | | | $ | 1,095 | |
| | | | | | | |
| Liabilities | | | | | | | |
| Borrowings under repurchase agreements | $ | 483,268 | | | $ | 481,009 | | | $ | 356,923 | | | $ | 359,799 | |
| Convertible senior unsecured notes | 126,632 | | | 133,365 | | | 170,797 | | | 155,129 | |
Securitized debt(1) | 610,900 | | | 618,553 | | | 899,207 | | | 922,362 | |
| Total | $ | 1,220,800 | | | $ | 1,232,927 | | | $ | 1,426,927 | | | $ | 1,437,290 | |
(1) Carrying value excludes $7.2$5.9 million and $5.3$6.9 million of deferred financing costs as of September 30, 20202021 and December 31, 2019,2020, respectively.
"Due from counterparties" and "Due to counterparties" in the Company’s Consolidated Balance Sheets are reflected at cost which approximates fair value.
Residential Bridge Loans
Values for the Company's Bridge Loans are based upon prices obtained from an independent third party pricing service that specializes in loan valuation, utilizing a discounted cash flow valuation model that is calibrated to recent loan trade execution. Their valuation methodology incorporates commonly used market pricing methods, which include the inputs considered most significant to the determination of fair value of the Residential Bridge Loans. The key loan inputs include loan balance, interest rate, loan to value, FICO score, debt to income ratio and delinquencies. The assumption made by the independent third party pricing service includes the market discount rate, prepayment, default assumption and loss severity. The Company reviews the analysis provided by pricing service as well as the key assumptions made available to the Company. Due to the inherent uncertainty of such valuation, the fair values established for residential loans held by the Company may differ from the fair values that would have been established if a readily available market existed for these loans. Accordingly, the Company's loans are classified as Level III.
Borrowings under repurchase agreements
The fair values of the borrowings under repurchase agreements are based on a net present value technique. This method discounts future estimated cash flows using rates the Company determined best estimates current market interest rates that would be offered for loans with similar characteristics and credit quality. The use of different market assumptions or estimation methodologies could have a material effect on the fair value amounts. This fair value measurement is based on observable inputs, and as such, are classified as Level II.
Convertible senior unsecured notes
The fair value of the convertible senior unsecured notes is based on quoted market prices. Accordingly, the Company's convertible senior unsecured notes are classified as Level I.
Securitized debt
Values for the Company's securitized debt, related to the securitization of a portion of its Residential Whole Loans, are based upon prices obtained from independent third party pricing services. The valuation methodology of the third party pricing services incorporates market information and commonly used market pricing methods, which include actual trades and quoted prices for similar or identical instruments. In determining the proper fair value hierarchy or level, the Company considers the amount of available observable market data for each security. Since the securitized debt represents traded debt securities, the Manager's pricing team reviews the trade activity during the quarter for each security to determine the appropriate level within the fair value hierarchy. If there is sufficient trade data above a predetermined threshold, the Manager determines it has sufficient observable market data and the debt security will be categorized as a Level II. If there is not sufficient observable market data the debt security will be categorized as a Level III. At September 30, 2020,2021, there was not sufficient observable market data for the debt to be classified as a Level II, accordingly it was classified as a Level III.
Note 4 – Mortgage-Backed Securities and other securities
The following tables present certain information about the Company’s investment portfolio at September 30, 20202021 and December 31, 20192020 (dollars in thousands):
| | | | | | | | | | | | | | | | | | | | | | | | | | | | | | | | | | | | | | | | | | | | | | |
| | September 30, 2020 | |
| | Principal
Balance | | Unamortized
Premium
(Discount),
net | | | | Amortized
Cost | | Unrealized
Gain | | Unrealized
Loss | | Estimated
Fair Value | | Net
Weighted
Average
Coupon | |
| | | | | | | | | | | | | | | | |
| | | | | | | | | | | | | | | | |
| | | | | | | | | | | | | | | | |
| | | | | | | | | | | | | | | | |
| | | | | | | | | | | | | | | | |
Agency RMBS Interest-Only Strips (1)(2) | N/A | | N/A | | | | $ | 105 | | | $ | 48 | | | $ | 0 | | | $ | 153 | | | 2.4 | % | |
Agency RMBS Interest-Only Strips, accounted for as derivatives (1) (2) | N/A | | N/A | | | | N/A | | N/A | | N/A | | 1,700 | | | 3.0 | % | |
| | | | | | | | | | | | | | | | |
| Total Agency MBS | 0 | | | 0 | | | | | 105 | | | 48 | | | 0 | | | 1,853 | | | 2.9 | % | |
| | | | | | | | | | | | | | | | |
| Non-Agency RMBS | 38,447 | | | (15,018) | | | | | 23,429 | | | 427 | | | (2,288) | | | 21,568 | | | 4.5 | % | |
Non-Agency RMBS Interest- Only Strips (1) | N/A | | N/A | | | | 6,530 | | | 0 | | | (2,282) | | | 4,248 | | | 0.5 | % | |
| | | | | | | | | | | | | | | | |
| Subtotal Non-Agency RMBS | 38,447 | | | (15,018) | | | | | 29,959 | | | 427 | | | (4,570) | | | 25,816 | | | 0.9 | % | |
| Non-Agency CMBS | 256,450 | | | (26,058) | | | | | 230,392 | | | 2,718 | | | (51,789) | | | 181,321 | | | 5.2 | % | |
| Total Non-Agency MBS | 294,897 | | | (41,076) | | | | | 260,351 | | | 3,145 | | | (56,359) | | | 207,137 | | | 2.6 | % | |
| | | | | | | | | | | | | | | | |
Other securities (3) | 51,586 | | | (8,305) | | | | | 50,417 | | | 220 | | | (9,582) | | | 41,055 | | | 4.4 | % | |
| Total | $ | 346,483 | | | $ | (49,381) | | | | | $ | 310,873 | | | $ | 3,413 | | | $ | (65,941) | | | $ | 250,045 | | | 2.8 | % | |
| | | | | | | | | | | | | | | | | | | | | | | | | | | | | | | | | | | | | | | | | | | | | | |
| | September 30, 2021 | |
| | Principal
Balance | | Unamortized
Premium
(Discount),
net | | | | Amortized
Cost | | Unrealized
Gain | | Unrealized
Loss | | Estimated
Fair Value | | Net
Weighted
Average
Coupon | |
| | | | | | | | | | | | | | | | |
| | | | | | | | | | | | | | | | |
| | | | | | | | | | | | | | | | |
| | | | | | | | | | | | | | | | |
| | | | | | | | | | | | | | | | |
Agency RMBS Interest-Only Strips (1)(2) | N/A | | N/A | | | | $ | 63 | | | $ | 71 | | | $ | — | | | $ | 134 | | | 1.4 | % | |
Agency RMBS Interest-Only Strips, accounted for as derivatives (1) (2) | N/A | | N/A | | | | N/A | | N/A | | N/A | | 1,208 | | | 1.3 | % | |
| | | | | | | | | | | | | | | | |
| Total Agency MBS | — | | | — | | | | | 63 | | | 71 | | | — | | | 1,342 | | | 1.3 | % | |
| | | | | | | | | | | | | | | | |
| Non-Agency RMBS | 36,879 | | | (14,437) | | | | | 22,442 | | | 3,327 | | | (38) | | | 25,731 | | | 4.3 | % | |
Non-Agency RMBS Interest- Only Strips (1) | N/A | | N/A | | | | 5,742 | | | — | | | (3,462) | | | 2,280 | | | 0.3 | % | |
| | | | | | | | | | | | | | | | |
| Subtotal Non-Agency RMBS | 36,879 | | | (14,437) | | | | | 28,184 | | | 3,327 | | | (3,500) | | | 28,011 | | | 0.9 | % | |
| Non-Agency CMBS | 212,440 | | | (15,474) | | | | | 196,966 | | | 2,414 | | | (64,730) | | | 134,650 | | | 5.0 | % | |
| Total Non-Agency MBS | 249,319 | | | (29,911) | | | | | 225,150 | | | 5,741 | | | (68,230) | | | 162,661 | | | 2.9 | % | |
| | | | | | | | | | | | | | | | |
Other securities (3) | 51,269 | | | (8,046) | | | | | 48,066 | | | 4,198 | | | (171) | | | 52,093 | | | 5.3 | % | |
| Total | $ | 300,588 | | | $ | (37,957) | | | | | $ | 273,279 | | | $ | 10,010 | | | $ | (68,401) | | | $ | 216,096 | | | 3.0 | % | |
| | | | | | | | | | | | | | | | | | | | | | | | | | | | | | | | | | | | | | | | | | | | | | | | | | |
| | December 31, 2019 | |
| | Principal
Balance | | Unamortized
Premium
(Discount),
net | | Discount
Designated as
Credit Reserve
and OTTI | | Amortized
Cost | | Unrealized
Gain | | Unrealized
Loss | | Estimated
Fair Value | | Net
Weighted
Average
Coupon | |
| | | | | | | | | | | | | | | | |
| Agency CMBS | $ | 1,347,929 | | | $ | 26,514 | | | $ | — | | | $ | 1,374,443 | | | $ | 66,832 | | | $ | (5,798) | | | $ | 1,435,477 | | | 3.4 % | |
| | | | | | | | | | | | | | | | |
Agency CMBS Interest-Only Strips accounted for as derivatives (1) (2) | N/A | | N/A | | N/A | | N/A | | N/A | | N/A | | 3,092 | | | 0.4 % | |
| Subtotal Agency CMBS | 1,347,929 | | | 26,514 | | | — | | | 1,374,443 | | | 66,832 | | | (5,798) | | | 1,438,569 | | | 3.1 | % | |
| Agency RMBS | 327,814 | | | 5,473 | | | — | | | 333,287 | | | 7,484 | | | 0 | | | 340,771 | | | 3.5 % | |
Agency RMBS Interest-Only Strips (1) | N/A | | N/A | | N/A | | $ | 8,661 | | | $ | 1,820 | | | $ | (138) | | | $ | 10,343 | | | 2.8 % | |
Agency RMBS Interest-Only Strips, accounted for as derivatives (1) (2) | N/A | | N/A | | N/A | | N/A | | N/A | | N/A | | 5,572 | | | 3.0 % | |
| Subtotal Agency RMBS | 327,814 | | | 5,473 | | | — | | | 341,948 | | | 9,304 | | | (138) | | | 356,686 | | | 3.3 % | |
| Total Agency MBS | 1,675,743 | | | 31,987 | | | — | | | 1,716,391 | | | 76,136 | | | (5,936) | | | 1,795,255 | | | 3.1 | % | |
| | | | | | | | | | | | | | | | |
| Non-Agency RMBS | 52,767 | | | 4,492 | | | (20,256) | | | 37,003 | | | 1,388 | | | (260) | | | 38,131 | | | 4.8 % | |
Non-Agency RMBS Interest- Only Strips (1) | N/A | | N/A | | N/A | | 7,705 | | | 636 | | | (658) | | | 7,683 | | | 0.6 % | |
| | | | | | | | | | | | | | | | |
| Subtotal Non-Agency RMBS | 52,767 | | | 4,492 | | | (20,256) | | | 44,708 | | | 2,024 | | | (918) | | | 45,814 | | | 1.0 | % | |
| Non-Agency CMBS | 354,458 | | | (17,909) | | | (22,016) | | | 314,533 | | | 6,359 | | | (4,873) | | | 316,019 | | | 5.1 % | |
| Total Non-Agency MBS | 407,225 | | | (13,417) | | | (42,272) | | | 359,241 | | | 8,383 | | | (5,791) | | | 361,833 | | | 2.7 | % | |
| | | | | | | | | | | | | | | | |
Other securities (3) | 71,896 | | | (2,437) | | | (6,203) | | | 73,975 | | | 6,392 | | | (206) | | | 80,161 | | | 6.7 % | |
| Total | $ | 2,154,864 | | | $ | 16,133 | | | $ | (48,475) | | | $ | 2,149,607 | | | $ | 90,911 | | | $ | (11,933) | | | $ | 2,237,249 | | | 3.1 | % | |
| | | | | | | | | | | | | | | | | | | | | | | | | | | | | | | | | | | | | | | | | | | | | | |
| | December 31, 2020 | |
| | Principal
Balance | | Unamortized
Premium
(Discount),
net | | | | Amortized
Cost | | Unrealized
Gain | | Unrealized
Loss | | Estimated
Fair Value | | Net Weighted Average Coupon(4) | |
| | | | | | | | | | | | | | | | |
| | | | | | | | | | | | | | | | |
| | | | | | | | | | | | | | | | |
| | | | | | | | | | | | | | | | |
| | | | | | | | | | | | | | | | |
| | | | | | | | | | | | | | | | |
Agency RMBS Interest-Only Strips (1) | N/A | | N/A | | | | $ | 89 | | | $ | 54 | | | $ | — | | | $ | 143 | | | 2.1 | % | |
Agency RMBS Interest-Only Strips, accounted for as derivatives (1) (2) | N/A | | N/A | | | | N/A | | N/A | | N/A | | 1,565 | | | 2.6 | % | |
| | | | | | | | | | | | | | | | |
| Total Agency MBS | — | | | — | | | | | 89 | | | 54 | | | — | | | 1,708 | | | 2.5 | % | |
| | | | | | | | | | | | | | | | |
| Non-Agency RMBS | 38,112 | | | (14,649) | | | | | 23,463 | | | 451 | | | (2,498) | | | 21,416 | | | 1.6 | % | |
Non-Agency RMBS Interest- Only Strips (1) | N/A | | N/A | | | | 6,271 | | | — | | | (2,306) | | | 3,965 | | | 0.4 | % | |
| | | | | | | | | | | | | | | | |
| Subtotal Non-Agency RMBS | 38,112 | | | (14,649) | | | | | 29,734 | | | 451 | | | (4,804) | | | 25,381 | | | 0.6 | % | |
| Non-Agency CMBS | 235,497 | | | (25,258) | | | | | 210,239 | | | 2,850 | | | (49,008) | | | 164,081 | | | 5.0 | % | |
| Total Non-Agency MBS | 273,609 | | | (39,907) | | | | | 239,973 | | | 3,301 | | | (53,812) | | | 189,462 | | | 2.4 | % | |
| | | | | | | | | | | | | | | | |
Other securities (3) | 51,537 | | | (8,239) | | | | | 49,420 | | | 1,152 | | | (1,818) | | | 48,754 | | | 4.4 | % | |
| Total | $ | 325,146 | | | $ | (48,146) | | | | | $ | 289,482 | | | $ | 4,507 | | | $ | (55,630) | | | $ | 239,924 | | | 2.5 | % | |
(1) IOs and IIOs have no principal balances and bear interest based on a notional balance. The notional balance is used solely to determine interest distributions on interest-only class of securities. At September 30, 2020,2021, the notional balance for Agency RMBS IOs and IIOs, Non-Agency RMBS IOs and IIO and Agency RMBS IOs and IIOs, accounted for as derivatives was $4.0$3.0 million, $347.5$200.1 million and $23.4$17.6 million, respectively. At December 31, 2019,2020, the notional balance for Agency RMBS IOs and IIOs, Non-Agency RMBS IOs and IIOs and Agency RMBS IOs and IIOs, accounted for as derivatives and Agency CMBS IOs and IIOs, accounted for as derivatives was $121.7$3.7 million, $442.4 million, $64.8$306.0 million and $160.2$21.6 million, respectively.
(2) Interest on these securities is reported as a component of "Gain (loss) on derivative instruments, net" in the Consolidated Statements of Operations.
(3) Other securities include residual interests in asset-backed securities which have 0no principal balance and an amortized cost of approximately $7.1$4.8 million and $10.7$6.1 million, as of September 30, 20202021 and December 31, 2019,2020, respectively.
Table of Contentsthe weighted average coupon rate includes the weighted average coupon rates of IOs and IIOs accounted for as derivatives using their notional amounts.
As of September 30, 20202021 and December 31, 20192020 the weighted average expected remaining term of the MBS and other securities investment portfolio was 4.75.6 years and 7.95.5 years, respectively.
Prior to the adoption of ASU 2016-13, “Financial Instruments - Credit Losses (Topic 326): Measurement of Credit Losses on Financial Instruments.” on January 1, 2020, the Company recorded Other Than Temporary Impairment ("OTTI") when the credit quality of the underlying collateral of the beneficial interest deteriorates and or the scheduled payments are faster than previously projected. As of January 1, 2020, a credit loss adjustment, if any, would be reflected in the fair value of these securities and reported as "Unrealized gain (loss), net in the Consolidated Statements of Operations.
The following table presents the changes in the components of the Company’s purchase discount and amortizable premium on its Non-Agency RMBS, Non-Agency CMBS and other securities for the three and nine months ended September 30, 2019 (dollars in thousands):
| | | | | | | | | | | | | | | | | | | | | | | | | |
| | | | Three months ended September 30, 2019 |
| | | | | | | | Discount Designated as
Credit Reserve and
OTTI | | Accretable Discount(1) | | Amortizable Premium(1) |
| Balance at beginning of period | | | | | | | $ | (48,824) | | | $ | (28,582) | | | $ | 14,441 | |
| Accretion of discount | | | | | | | — | | | 1,032 | | | — | |
| Amortization of premium | | | | | | | — | | | — | | | (220) | |
| Realized credit losses | | | | | | | 831 | | | — | | | — | |
| Purchases | | | | | | | 0 | | | (3,493) | | | 473 | |
| Sales | | | | | | | 18,388 | | | — | | | (17,905) | |
| Net impairment losses recognized in earnings | | | | | | | (1,587) | | | — | | | — | |
Transfers/release of credit reserve(2) | | | | | | | (19,567) | | | 1,130 | | | 18,437 | |
| Balance at end of period | | | | | | | $ | (50,759) | | | $ | (29,913) | | | $ | 15,226 | |
| | | | | | | | | | | | | | | | | | | | | | | |
| | | | Nine months ended September 30, 2019 |
| | | | | | | | Discount Designated as
Credit Reserve and
OTTI | | Accretable Discount(1) | | Amortizable Premium(1) |
| Balance at beginning of period | | | | | | | $ | (53,523) | | | $ | (29,465) | | | $ | 14,928 | |
| Accretion of discount | | | | | | | — | | | 3,352 | | | — | |
| Amortization of premium | | | | | | | — | | | — | | | (836) | |
| Realized credit losses | | | | | | | 5,584 | | | — | | | — | |
| Purchases | | | | | | | 0 | | | (6,599) | | | 760 | |
| Sales | | | | | | | 24,422 | | | 0 | | | (19,516) | |
| Net impairment losses recognized in earnings | | | | | | | (4,553) | | | — | | | — | |
Transfers/release of credit reserve(2) | | | | | | | (22,689) | | | 2,799 | | | 19,890 | |
| Balance at end of period | | | | | | | $ | (50,759) | | | $ | (29,913) | | | $ | 15,226 | |
(1) Together with coupon interest, accretable purchase discount and amortizable premium is recognized as interest income over the life of the security.
(2) Subsequent reductions of a security’s non-accretable discount results in a corresponding reduction in its amortizable premium.
The following tables present the fair value and contractual maturities of the Company’s investment securities at September 30, 20202021 and December 31, 20192020 (dollars in thousands):
| | | | | | | | | | | | | | | | | | | | | | | | | | | | | |
| | September 30, 2020 |
| | < or equal to 10
years | | > 10 years and < or
equal to 20 years | | > 20 years and < or
equal to 30 years | | > 30 years | | Total |
| | | | | | | | | |
| | | | | | | | | |
| | | | | | | | | |
| | | | | | | | | |
| Agency RMBS Interest-Only Strips | $ | 0 | | | $ | 0 | | | $ | 153 | | | $ | 0 | | | $ | 153 | |
| Agency RMBS Interest-Only Strips accounted for as derivatives | 0 | | | 1,700 | | | 0 | | | 0 | | | 1,700 | |
| Subtotal Agency | 0 | | | 1,700 | | | 153 | | | 0 | | | 1,853 | |
| | | | | | | | | |
| Non-Agency CMBS | 58,500 | | | 67,286 | | | 54,978 | | | 557 | | | 181,321 | |
| Non-Agency RMBS | 0 | | | 0 | | | 8,008 | | | 13,560 | | | 21,568 | |
| Non-Agency RMBS Interest- Only Strips | 0 | | | 0 | | | 628 | | | 3,620 | | | 4,248 | |
| | | | | | | | | |
| Subtotal Non-Agency | 58,500 | | | 67,286 | | | 63,614 | | | 17,737 | | | 207,137 | |
| | | | | | | | | |
| Other securities | 6,668 | | | 5,092 | | | 18,517 | | | 10,778 | | | 41,055 | |
| Total | $ | 65,168 | | | $ | 74,078 | | | $ | 82,284 | | | $ | 28,515 | | | $ | 250,045 | |
| | | | | | | | | | | | | | | | | | | | | | | | | | | | | |
| | September 30, 2021 |
| | < or equal to 10
years | | > 10 years and < or
equal to 20 years | | > 20 years and < or
equal to 30 years | | > 30 years | | Total |
| | | | | | | | | |
| | | | | | | | | |
| | | | | | | | | |
| | | | | | | | | |
| Agency RMBS Interest-Only Strips | $ | — | | | $ | — | | | $ | 134 | | | $ | — | | | $ | 134 | |
| Agency RMBS Interest-Only Strips accounted for as derivatives | — | | | 1,208 | | | — | | | — | | | 1,208 | |
| Subtotal Agency | — | | | 1,208 | | | 134 | | | — | | | 1,342 | |
| | | | | | | | | |
| Non-Agency CMBS | 80,460 | | | 17,856 | | | 36,110 | | | 224 | | | 134,650 | |
| Non-Agency RMBS | — | | | — | | | 10,181 | | | 15,550 | | | 25,731 | |
| Non-Agency RMBS Interest- Only Strips | — | | | — | | | 142 | | | 2,138 | | | 2,280 | |
| | | | | | | | | |
| Subtotal Non-Agency | 80,460 | | | 17,856 | | | 46,433 | | | 17,912 | | | 162,661 | |
| | | | | | | | | |
| Other securities | 9,394 | | | 4,271 | | | 25,935 | | | 12,493 | | | 52,093 | |
| Total | $ | 89,854 | | | $ | 23,335 | | | $ | 72,502 | | | $ | 30,405 | | | $ | 216,096 | |
| | | | December 31, 2019 | | December 31, 2020 |
| | | < or equal to 10
years | | > 10 years and < or
equal to 20 years | | > 20 years and < or
equal to 30 years | | > 30 years | | Total | | < or equal to 10
years | | > 10 years and < or
equal to 20 years | | > 20 years and < or
equal to 30 years | | > 30 years | | Total |
| Agency CMBS | $ | 973,189 | | | $ | 462,288 | | | $ | 0 | | | $ | 0 | | | $ | 1,435,477 | | |
| | Agency CMBS Interest-Only Strips, accounted for as derivatives | 0 | | | 0 | | | 0 | | | 3,092 | | | 3,092 | | |
| Agency RMBS | 0 | | | 0 | | | 340,771 | | | 0 | | | 340,771 | | |
| | Agency RMBS Interest-Only Strips | Agency RMBS Interest-Only Strips | 2,413 | | | 1,966 | | | 5,964 | | | 0 | | | 10,343 | | Agency RMBS Interest-Only Strips | $ | — | | | $ | — | | | $ | 143 | | | $ | — | | | $ | 143 | |
| Agency RMBS Interest-Only Strips accounted for as derivatives | Agency RMBS Interest-Only Strips accounted for as derivatives | 669 | | | 3,893 | | | 1,010 | | | 0 | | | 5,572 | | Agency RMBS Interest-Only Strips accounted for as derivatives | — | | | 1,565 | | | — | | | — | | | 1,565 | |
| Subtotal Agency | Subtotal Agency | 976,271 | | | 468,147 | | | 347,745 | | | 3,092 | | | 1,795,255 | | Subtotal Agency | — | | | 1,565 | | | 143 | | | — | | | 1,708 | |
| | Non-Agency CMBS | Non-Agency CMBS | 89,782 | | | 125,282 | | | 92,610 | | | 8,345 | | | 316,019 | | Non-Agency CMBS | 59,724 | | | 50,408 | | | 53,269 | | | 680 | | | 164,081 | |
| Non-Agency RMBS | Non-Agency RMBS | 0 | | | 0 | | | 8,966 | | | 29,165 | | | 38,131 | | Non-Agency RMBS | — | | | — | | | 7,958 | | | 13,458 | | | 21,416 | |
| Non-Agency RMBS Interest- Only Strips | Non-Agency RMBS Interest- Only Strips | 0 | | | 0 | | | 1,716 | | | 5,967 | | | 7,683 | | Non-Agency RMBS Interest- Only Strips | — | | | — | | | 472 | | | 3,493 | | | 3,965 | |
| | Subtotal Non-Agency | Subtotal Non-Agency | 89,782 | | | 125,282 | | | 103,292 | | | 43,477 | | | 361,833 | | Subtotal Non-Agency | 59,724 | | | 50,408 | | | 61,699 | | | 17,631 | | | 189,462 | |
| | Other securities | Other securities | 25,824 | | | 31,823 | | | 2,768 | | | 19,746 | | | 80,161 | | Other securities | 7,247 | | | 6,203 | | | 24,610 | | | 10,694 | | | 48,754 | |
| Total | Total | $ | 1,091,877 | | | $ | 625,252 | | | $ | 453,805 | | | $ | 66,315 | | | $ | 2,237,249 | | Total | $ | 66,971 | | | $ | 58,176 | | | $ | 86,452 | | | $ | 28,325 | | | $ | 239,924 | |
The following tables present the gross unrealized losses and estimated fair value of the Company’s MBS and other securities by length of time that such securities have been in a continuous unrealized loss position at September 30, 20202021 and December 31, 20192020 (dollars in thousands):
| | | | September 30, 2020 | | September 30, 2021 |
| | | Less than 12 Months | | 12 Months or More | | Total | | Less than 12 Months | | 12 Months or More | | Total |
| | Fair Value | | Unrealized
Losses | | Number
of
Securities | | Fair Value | | Unrealized
Losses | | Number
of
Securities | | Fair Value | | Unrealized
Losses | | Number
of
Securities | | Fair Value | | Unrealized
Losses | | Number
of
Securities | | Fair Value | | Unrealized
Losses | | Number
of
Securities | | Fair Value | | Unrealized
Losses | | Number
of
Securities |
| | Non-Agency CMBS | Non-Agency CMBS | $ | 142,229 | | | $ | (43,839) | | | 25 | | | $ | 28,946 | | | $ | (7,950) | | | 13 | | | $ | 171,175 | | | $ | (51,789) | | | 38 | | Non-Agency CMBS | $ | — | | | $ | — | | | — | | | $ | 118,859 | | | $ | (64,730) | | | 24 | | | $ | 118,859 | | | $ | (64,730) | | | 24 | |
| Non-Agency RMBS | Non-Agency RMBS | 18,304 | | | (2,288) | | | 4 | | | 0 | | | 0 | | | 0 | | | 18,304 | | | (2,288) | | | 4 | | Non-Agency RMBS | — | | | — | | | — | | | 216 | | | (38) | | | 1 | | | 216 | | | (38) | | | 1 | |
| Non-Agency RMBS Interest-Only Strips | Non-Agency RMBS Interest-Only Strips | 3,620 | | | (854) | | | 3 | | | 628 | | | (1,428) | | | 1 | | | 4,248 | | | (2,282) | | | 4 | | Non-Agency RMBS Interest-Only Strips | — | | | — | | | — | | | 2,280 | | | (3,462) | | | 4 | | | 2,280 | | | (3,462) | | | 4 | |
| Subtotal Non-Agency | Subtotal Non-Agency | 164,153 | | | (46,981) | | | 32 | | | 29,574 | | | (9,378) | | | 14 | | | 193,727 | | | (56,359) | | | 46 | | Subtotal Non-Agency | — | | | — | | | — | | | 121,355 | | | (68,230) | | | 29 | | | 121,355 | | | (68,230) | | | 29 | |
| | Other securities | Other securities | 33,016 | | | (9,582) | | | 9 | | | 0 | | | 0 | | | 0 | | | 33,016 | | | (9,582) | | | 9 | | Other securities | — | | | — | | | — | | | 11,080 | | | (171) | | | 5 | | | 11,080 | | | (171) | | | 5 | |
| Total | Total | $ | 197,169 | | | $ | (56,563) | | | 41 | | | $ | 29,574 | | | $ | (9,378) | | | 14 | | | $ | 226,743 | | | $ | (65,941) | | | 55 | | Total | $ | — | | | $ | — | | | — | | | $ | 132,435 | | | $ | (68,401) | | | 34 | | | $ | 132,435 | | | $ | (68,401) | | | 34 | |
| | | | | | | | | | | | | | | | | | | | | | | | | | | | | | | | | | | | | | | | | | | | | | | | | | | | | |
| | December 31, 2020 |
| | Less than 12 Months | | 12 Months or More | | Total |
| Fair Value | | Unrealized
Losses | | Number
of
Securities | | Fair Value | | Unrealized
Losses | | Number
of
Securities | | Fair Value | | Unrealized
Losses | | Number
of
Securities |
| | | | | | | | | | | | | | | | | |
| | | | | | | | | | | | | | | | | |
| | | | | | | | | | | | | | | | | |
| | | | | | | | | | | | | | | | | |
| | | | | | | | | | | | | | | | | |
| Non-Agency CMBS | $ | 102,935 | | | $ | (33,602) | | | 16 | | | $ | 50,887 | | | $ | (15,406) | | | 15 | | | $ | 153,822 | | | $ | (49,008) | | | 31 | |
| Non-Agency RMBS | 18,242 | | | (2,498) | | | 4 | | | — | | | — | | | — | | | 18,242 | | | (2,498) | | | 4 | |
| Non-Agency RMBS Interest-Only Strips | 3,492 | | | (790) | | | 3 | | | 472 | | | (1,516) | | | 1 | | | 3,964 | | | (2,306) | | | 4 | |
| Subtotal Non-Agency | 124,669 | | | (36,890) | | | 23 | | | 51,359 | | | (16,922) | | | 16 | | | 176,028 | | | (53,812) | | | 39 | |
| | | | | | | | | | | | | | | | | |
| Other securities | 26,365 | | | (1,818) | | | 6 | | | — | | | — | | | — | | | 26,365 | | | (1,818) | | | 6 | |
| Total | $ | 151,034 | | | $ | (38,708) | | | 29 | | | $ | 51,359 | | | $ | (16,922) | | | 16 | | | $ | 202,393 | | | $ | (55,630) | | | 45 | |
| | | | | | | | | | | | | | | | | | | | | | | | | | | | | | | | | | | | | | | | | | | | | | | | | | | | | |
| | December 31, 2019 |
| | Less than 12 Months | | 12 Months or More | | Total |
| Fair Value | | Unrealized
Losses | | Number
of
Securities | | Fair Value | | Unrealized
Losses | | Number
of
Securities | | Fair Value | | Unrealized
Losses | | Number
of
Securities |
| Agency CMBS | $ | 214,084 | | | $ | (5,798) | | | 16 | | | $ | 0 | | | $ | 0 | | | 0 | | | $ | 214,084 | | | $ | (5,798) | | | 16 | |
| | | | | | | | | | | | | | | | | |
| Agency RMBS Interest-Only Strips | 1,376 | | | (43) | | | 4 | | | 1,828 | | | (95) | | | 7 | | | 3,204 | | | (138) | | | 11 | |
| Subtotal Agency | 215,460 | | | (5,841) | | | 20 | | | 1,828 | | | (95) | | | 7 | | | 217,288 | | | (5,936) | | | 27 | |
| | | | | | | | | | | | | | | | | |
| Non-Agency CMBS | 171,650 | | | (4,302) | | | 31 | | | 18,069 | | | (571) | | | 4 | | | 189,719 | | | (4,873) | | | 35 | |
| Non-Agency RMBS | 13,214 | | | (260) | | | 1 | | | 0 | | | 0 | | | 0 | | | 13,214 | | | (260) | | | 1 | |
| Non-Agency RMBS Interest-Only Strips | 1,716 | | | (658) | | | 1 | | | 0 | | | 0 | | | 0 | | | 1,716 | | | (658) | | | 1 | |
| Subtotal Non-Agency | 186,580 | | | (5,220) | | | 33 | | | 18,069 | | | (571) | | | 4 | | | 204,649 | | | (5,791) | | | 37 | |
| | | | | | | | | | | | | | | | | |
| Other securities | 10,512 | | | (206) | | | 2 | | | 0 | | | 0 | | | 0 | | | 10,512 | | | (206) | | | 2 | |
| Total | $ | 412,552 | | | $ | (11,267) | | | 55 | | | $ | 19,897 | | | $ | (666) | | | 11 | | | $ | 432,449 | | | $ | (11,933) | | | 66 | |
The following table presents the OTTI the Company recorded on its securities portfolio for the three and nine months ended September 30, 2019 (dollars in thousands):
| | | | | | | | | | | | | | | | | |
| | | | Three months ended September 30, 2019 | | | | Nine months ended September 30, 2019 |
Agency RMBS(1) | | | $ | 49 | | | | | $ | 74 | |
| Non-Agency CMBS | | | 1,588 | | | | | 4,506 | |
| Non-Agency RMBS | | | 27 | | | | | 1,204 | |
| Other securities | | | 155 | | | | | 562 | |
| Total | | | $ | 1,819 | | | | | $ | 6,346 | |
(1) Other-than-temporary impairment on Agency RMBS includes impairments on Agency RMBS IOs and unrealized loss on Agency RMBS securities that we had the intent to sell at the end of the period, if applicable.
The following tables present components of interest income on the Company’s MBS and other securities for the three and nine months ended September 30, 20202021 and September 30, 2019,2020, respectively (dollars in thousands):
| | | | | | | | | | | | | | | | | | | | | | | | | | | | | | | | | | | | | | | | | |
| | Three months ended September 30, 2021 | | Three months ended September 30, 2020 | | | | | | |
| Coupon
Interest | | Net (Premium Amortization/Amortization Basis) Discount Amortization | | Interest
Income | | Coupon
Interest | | Net (Premium Amortization/Amortization Basis) Discount Amortization | | Interest
Income | | | | | | |
| | | | | | | | | | | | | | | | | |
| Agency RMBS | $ | 11 | | | $ | (7) | | | $ | 4 | | | $ | 25 | | | $ | (17) | | | $ | 8 | | | | | | | |
| Non-Agency CMBS | 2,621 | | | 1,669 | | | 4,290 | | | 3,500 | | | 1,686 | | | 5,186 | | | | | | | |
| Non-Agency RMBS | 609 | | | (240) | | | 369 | | | 616 | | | (154) | | | 462 | | | | | | | |
| Other securities | 1,043 | | | (270) | | | 773 | | | 1,723 | | | (1,013) | | | 710 | | | | | | | |
| Total | $ | 4,284 | | | $ | 1,152 | | | $ | 5,436 | | | $ | 5,864 | | | $ | 502 | | | $ | 6,366 | | | | | | | |
| | | | | | | | | | | | | | | | | | | | | | | | | | | | | | | | | | | | | | | | | |
| | Three months ended September 30, 2020 | | Three months ended September 30, 2019 | | | | | | |
| Coupon
Interest | | Net (Premium Amortization/Amortization Basis) Discount Amortization | | Interest
Income | | Coupon
Interest | | Net (Premium Amortization/Amortization Basis) Discount Amortization | | Interest
Income | | | | | | |
| Agency CMBS | $ | 0 | | | $ | 0 | | | $ | 0 | | | $ | 14,544 | | | $ | (764) | | | $ | 13,780 | | | | | | | |
| Agency RMBS | 25 | | | (17) | | | 8 | | | 4,723 | | | (981) | | | 3,742 | | | | | | | |
| Non-Agency CMBS | 3,500 | | | 1,686 | | | 5,186 | | | 3,696 | | | 1,048 | | | 4,744 | | | | | | | |
| Non-Agency RMBS | 616 | | | (154) | | | 462 | | | 1,120 | | | (564) | | | 556 | | | | | | | |
| Other securities | 1,723 | | | (1,013) | | | 710 | | | 2,924 | | | (1,636) | | | 1,288 | | | | | | | |
| Total | $ | 5,864 | | | $ | 502 | | | $ | 6,366 | | | $ | 27,007 | | | $ | (2,897) | | | $ | 24,110 | | | | | | | |
| | | | | | | | | | | | | | | | | | | | | | | | | | | | | | | | | | | |
| | Nine months ended September 30, 2020 | | Nine months ended September 30, 2019 |
| Coupon
Interest | | Net (Premium Amortization/Amortization Basis) Discount Amortization | | Interest
Income | | Coupon
Interest | | Net (Premium Amortization/Amortization Basis) Discount Amortization | | Interest
Income |
| Agency CMBS | $ | 11,336 | | | $ | (636) | | | $ | 10,700 | | | $ | 38,100 | | | $ | (1,553) | | | $ | 36,547 | |
| Agency RMBS | 2,954 | | | (971) | | | 1,983 | | | 8,389 | | | (2,256) | | | 6,133 | |
| Non-Agency CMBS | 12,257 | | | 4,426 | | | 16,683 | | | 9,975 | | | 3,294 | | | 13,269 | |
| Non-Agency RMBS | 2,349 | | | (1,162) | | | 1,187 | | | 3,712 | | | (1,752) | | | 1,960 | |
| Other securities | 6,565 | | | (3,810) | | | 2,755 | | | 8,883 | | | (4,985) | | | 3,898 | |
| Total | $ | 35,461 | | | $ | (2,153) | | | $ | 33,308 | | | $ | 69,059 | | | $ | (7,252) | | | $ | 61,807 | |
| | | | | | | | | | | | | | | | | | | | | | | | | | | | | | | | | | | |
| | Nine months ended September 30, 2021 | | Nine months ended September 30, 2020 |
| Coupon
Interest | | Net (Premium Amortization/Amortization Basis) Discount Amortization | | Interest
Income | | Coupon
Interest | | Net (Premium Amortization/Amortization Basis) Discount Amortization | | Interest
Income |
| Agency CMBS | $ | — | | | $ | — | | | $ | — | | | $ | 11,336 | | | $ | (636) | | | $ | 10,700 | |
| Agency RMBS | 38 | | | (26) | | | 12 | | | 2,954 | | | (971) | | | 1,983 | |
| Non-Agency CMBS | 7,171 | | | 6,230 | | | 13,401 | | | 12,257 | | | 4,426 | | | 16,683 | |
| Non-Agency RMBS | 1,762 | | | (704) | | | 1,058 | | | 2,349 | | | (1,162) | | | 1,187 | |
| Other securities | 3,717 | | | (1,214) | | | 2,503 | | | 6,565 | | | (3,810) | | | 2,755 | |
| Total | $ | 12,688 | | | $ | 4,286 | | | $ | 16,974 | | | $ | 35,461 | | | $ | (2,153) | | | $ | 33,308 | |
The following tables present the sales and realized gain (loss) of the Company’s MBS and other securities, excluding Interest-Only Strips accounted for as derivatives, for the three and nine months ended September 30, 20202021 and September 30, 2019,2020, respectively (dollars in thousands):
| | | | | | | | | | | | | | | | | | | | | | | | | | | | | | | | | | | | | | | | | | | | | | | |
| | Three months ended September 30, 2020 | | Three months ended September 30, 2019 |
| | Proceeds | | Gross Gains | | Gross Losses | | Net Gain (Loss) | | Proceeds | | Gross Gains | | Gross Losses | | Net Gain (Loss) |
| Agency CMBS | $ | 0 | | | $ | 0 | | | $ | 0 | | | $ | 0 | | | $ | 356,967 | | | $ | 20,268 | | | $ | 0 | | | $ | 20,268 | |
| Agency RMBS | 0 | | | 0 | | | 0 | | | 0 | | | 205,310 | | | 1,560 | | | 0 | | | 1,560 | |
| Non-Agency CMBS | 0 | | | 0 | | | 0 | | | 0 | | | 24,288 | | | 134 | | | (210) | | | (76) | |
| Non-Agency RMBS | (44) | | | 0 | | | (44) | | | (44) | | | 0 | | | 0 | | | 0 | | | 0 | |
| | | | | | | | | | | | | | | |
| Total | $ | (44) | | | $ | 0 | | | $ | (44) | | | $ | (44) | | | $ | 586,565 | | | $ | 21,962 | | | $ | (210) | | | $ | 21,752 | |
| | | | | | | | | | | | | | | | | | | | | | | | | | | | | | | | | | | | | | | | | | | | | | | |
| | Three months ended September 30, 2021 | | Three months ended September 30, 2020 |
| | Proceeds | | Gross Gains | | Gross Losses | | Net Gain (Loss) | | Proceeds | | Gross Gains | | Gross Losses | | Net Gain (Loss) |
| | | | | | | | | | | | | | | |
| | | | | | | | | | | | | | | |
| | | | | | | | | | | | | | | |
| Non-Agency RMBS | $ | — | | | $ | — | | | $ | — | | | $ | — | | | $ | (44) | | | $ | — | | | $ | (44) | | | $ | (44) | |
| | | | | | | | | | | | | | | |
| Total | $ | — | | | $ | — | | | $ | — | | | $ | — | | | $ | (44) | | | $ | — | | | $ | (44) | | | $ | (44) | |
| | | | Nine months ended September 30, 2020 | | Nine months ended September 30, 2019 | | Nine months ended September 30, 2021 | | Nine months ended September 30, 2020 |
| | | Proceeds | | Gross Gains | | Gross Losses | | Net Gain (Loss) | | Proceeds | | Gross Gains | | Gross Losses | | Net Gain (Loss) | | Proceeds | | Gross Gains | | Gross Losses | | Net Gain (Loss) | | Proceeds | | Gross Gains | | Gross Losses | | Net Gain (Loss) |
| Agency CMBS | Agency CMBS | $ | 1,668,149 | | | $ | 116,463 | | | $ | (6,486) | | | $ | 109,977 | | | $ | 563,677 | | | $ | 20,268 | | | $ | (4,189) | | | $ | 16,079 | | Agency CMBS | $ | — | | | $ | — | | | $ | — | | | $ | — | | | $ | 1,668,149 | | | $ | 116,463 | | | $ | (6,486) | | | $ | 109,977 | |
| Agency RMBS | Agency RMBS | 400,948 | | | 12,552 | | | (506) | | | 12,046 | | | 205,310 | | | 1,560 | | | 0 | | | 1,560 | | Agency RMBS | — | | | — | | | — | | | — | | | 400,948 | | | 12,552 | | | (506) | | | 12,046 | |
Non-Agency CMBS | Non-Agency CMBS | 94,586 | | | 1 | | | (22,703) | | | (22,702) | | | 39,453 | | | 317 | | | (1,064) | | | (747) | | Non-Agency CMBS | — | | | — | | | (5,929) | | | (5,929) | | | 94,586 | | | 1 | | | (22,703) | | | (22,702) | |
| Non-Agency RMBS | Non-Agency RMBS | 12,658 | | | 0 | | | (60) | | | (60) | | | 0 | | | 0 | | | 0 | | | 0 | | Non-Agency RMBS | — | | | — | | | — | | | — | | | 12,658 | | | — | | | (60) | | | (60) | |
| Other securities | Other securities | 35,957 | | | 113 | | | (6,223) | | | (6,110) | | | 0 | | | 0 | | | 0 | | | 0 | | Other securities | — | | | — | | | — | | | — | | | 35,957 | | | 113 | | | (6,223) | | | (6,110) | |
| Total | Total | $ | 2,212,298 | | | $ | 129,129 | | | $ | (35,978) | | | $ | 93,151 | | | $ | 808,440 | | | $ | 22,145 | | | $ | (5,253) | | | $ | 16,892 | | Total | $ | — | | | $ | — | | | $ | (5,929) | | | $ | (5,929) | | | $ | 2,212,298 | | | $ | 129,129 | | | $ | (35,978) | | | $ | 93,151 | |
(1) Realized loss for the nine months ended September 30, 2021 was attributable to a legacy Non-agency CMBS bond that factored down to zero from a cash shortfall in the securitization.
Unconsolidated CMBS VIEs
The Company’s economic interests held in unconsolidated CMBS VIEs are limited in nature to those of a passive holder of CMBS issued by securitization trusts; the Company was not involved in the design or creation of the securitization trusts. The Company evaluates its CMBS holdings, for potential consolidation of the securitized trust, in which it owns the most subordinate tranche or a portion of the controlling class. As of both September 30, 20202021 and December 31, 2019,2020, the Company held 8 and 107 variable interests in unconsolidated CMBS VIEs, respectively, in which it either owned the most subordinate class or a portion of the controlling class. The Company determined it was not the primary beneficiary and accordingly, the CMBS VIEs were not consolidated in the Company’s consolidated financial statements. As of September 30, 20202021 and December 31, 2019,2020, the Company’s maximum exposure to loss from these variable interests did not exceed the carrying value of these investments of $65.2$27.5 million and $117.7$48.9 million, respectively. These investments are classified in "Non-Agency mortgage-backed securities, at fair value" in the Company’s Consolidated Balance Sheets. Further, as of September 30, 20202021 and December 31, 2019,2020, the Company did not guarantee any obligations of unconsolidated entities or enter into any commitment or intent to provide funding to any such entities.
Note 5 — Residential Whole Loans and Bridge Loans
Residential Whole-Loan Trust
The consolidated financial statements include the consolidation of Revolving Mortgage Investment Trust 2015-1QR2 ("RMI 2015 Trust") since it met the definition of a VIE and the Company determined that it was the primary beneficiary of the trust because it was involved in the design of the trust, has oversight rights on defaulted assets and has other significant decision making powers. In addition, the Company has the obligation to absorb losses to the extent of its ownership interest and the right to receive benefits from the trust that could potentially be significant to the trust. RMI 2015 Trust has issued a trust certificate that is wholly-owned by the Company and represents the entire beneficial interest in pools of Non-QM Residential Whole Loans held by the trust. As of September 30, 20202021 and December 31, 2019,2020, the Company financed the trust certificate with $20.8$236.8 million and $209.9$30.2 million, respectively, on long-term financing facility. The financing liability is held outside the trust. The Company classifies the underlying Residential Whole Loans owned by the trust in "Residential Whole Loans, at fair value" in the Consolidated Balance Sheets and has eliminated the intercompany trust certificate in consolidation.
In August 2018, the Company formed Revolving Mortgage Investment Trust 2018-RCR ("RCR Trust") to acquire Conforming Residential Whole Loans.conforming residential whole loans. The Company determined that RCR Trust was a VIE and that the Company was the primary beneficiary of the trust because it was involved in the design of the trust, has oversight rights on defaulted assets and has other significant decision making powers. In addition, the Company has the obligation to absorb losses to the extent of its ownership interest and the right to receive benefits from the trust that could potentially be significant to the trust. As of December 31, 2019, the Company financed the trust certificate with $164.3 million of repurchase agreements, which is a liability held outside the trust. The Company classifies the underlying conforming mortgages owned by the trust in "Residential Whole Loans, at fair value" in the Consolidated Balance Sheets. The Company has eliminated the intercompany trust certificate in consolidation. In May 2020, the conforming mortgages held by RCR Trust were sold and the trust was terminated.
In September 2018, the Company formed Revolving Mortgage Investment Trust 2018-RNR ("RNR Trust") to acquire Non-QM Residential Whole Loans. The Company determined that RNR Trust was a VIE and that the Company was the primary beneficiary because it was involved in the design of the trust, has oversight rights on defaulted assets and has other significant decision making powers. In addition, the Company has the obligation to absorb losses to the extent of its ownership interest and the right to receive benefits from the trust that could potentially be significant to the trust. As of December 31, 2019, the Company's trust certificate was financed with $8.1 million of repurchase agreements, which is a liability held outside the trust. The Company classifies the underlying Non-QM Residential Whole Loans in "Residential Whole Loans, at fair value" in the Consolidated Balance Sheets. The Company has eliminated the intercompany trust certificate in consolidation. In April 2020, the RNR Trust was terminated following the transfer of the Non-QM Residential Whole Loans it held to RMI 2015 Trust.
In May 2019, the Company completed a residential mortgage-backed securitization comprised of a portion of its Residential Whole Loan portfolio. During the securitization, RMI 2015 Trust and RNR Trust collectively transferred $945.5 million of Non-QM Residential Whole Loans, to a wholly-owned subsidiary of the Company, Arroyo Mortgage Trust 2019-2 ("Arroyo Trust"(the "Arroyo Trust 2019"). The Company issued $919.0 million of mortgage-backed notes and retained all the subordinate and residual
debt securities ("Owner Certificates"), which includes the required 5% eligible risk retention. Refer to Note 7 - "Financings" for details on the associated securitized debt. The Company determined that the Arroyo Trust 2019 was a VIE and that the Company was also the primary beneficiary because the Manager was involved in the design of the trust and the Company has significant decision making powers. In addition, the Company has the obligation to absorb losses to the extent of its ownership interest and the right to receive benefits from the Arroyo Trust 2019 that could potentially be significant to the trust. The Company classifies the underlying Non-QM Residential Whole Loans in "Residential Whole Loans, at fair value" in the Consolidated Balance Sheets. The Company has eliminated the intercompany Owner Certificates in consolidation.
In November 2019, the Company formed Revolving Mortgage Investment Trust 2019-RBR ("RBR Trust") to acquire Non-QM Residential Whole Loans. The Company determined that RBR Trust was a VIE and that the Company was the primary beneficiary because it was involved in the design of the trust, has oversight rights on defaulted assets and has other significant decision making powers. In addition, the Company has the obligation to absorb losses to the extent of its ownership interest and the right to receive benefits from the trust that could potentially be significant to the trust. As of December 31, 2019, the Company's trust certificate was financed with $91.7 million of repurchase agreements, which is a liability held outside the trust. The Company classifies the underlying Non-QM Residential Whole Loans in "Residential Whole Loans, at fair value" in the Consolidated Balance Sheets. The Company has eliminated the intercompany trust certificate in consolidation. In April 2020, the RBR Trust was terminated following the transfer of the Non-QM Residential Whole Loans it held to RMI 2015 Trust.
In June 2020, the Company completed a residential mortgage-backed securitization comprised of a portion of its Residential Whole Loan portfolio. During the securitization, RMI 2015 Trust transferred $355.8 million of Non-QM Residential Whole Loans, to a wholly-owned subsidiary of the Company, Arroyo Mortgage Trust 2020-1 ("Arroyo Trust 2020"). The Company issued $341.7 million of mortgage-backed notes and retained all the subordinate and residual debt securities, which includes the required 5% eligible risk retention. Refer to Note 7 - "Financings" for details on the associated securitized debt. The Company determined that Arroyo Trust 2020 was a VIE and that the Company was also the primary beneficiary because the Manager was involved in the design of the trust and the Company has significant decision making powers. In addition, the Company has the obligation to absorb losses to the extent of its ownership interest and the right to receive benefits from the Arroyo Trust 2020 that could potentially be significant to the trust. The Company classifies the
underlying Non-QM Residential Whole Loans in "Residential Whole Loans, at fair value" in the Consolidated Balance Sheets. The Company has eliminated the intercompany Owner Certificates in consolidation.
Residential Bridge Loan Trust
In February 2017, The Company formed Revolving Mortgage Investment Trust 2017-BRQ1 ("RMI 2017 Trust") and acquired the trust certificate, which represents the entire beneficial interest in pools of Residential Bridge Loans and certain Residential Whole Loans held by the trust. Residential Bridge Loans are mortgage loans secured by residences, typically short-term. The Company determined that RMI Trust was a VIE and that the Company was the primary beneficiary because it was involved in the design of the trust, has oversight rights on defaulted assets and has other significant decision making powers. In addition, the Company has the obligation to absorb losses to the extent of its ownership interest and the right to receive benefits from the trust that could potentially be significant to the trust. As of September 30, 20202021 and December 31, 2019,2020, the Company financed the trust certificate with $18.2$7.5 million and $32.1$13.4 million, respectively, of repurchase agreement borrowings, which is a liability held outside the trust. The Company classifies both the underlying Residential Bridge Loans carried at amortized cost and the Residential Bridge Loans that it elected the fair value option in "Residential Bridge Loans" and the Residential Whole Loans in "Residential Whole Loans, at fair value" in the Consolidated Balance Sheets. The Company has eliminated the intercompany trust certificate in consolidation.
Consolidated Residential Whole-Loan and Residential Bridge Loan Trusts
The Company assesses modifications to VIEs on an ongoing basis to determine if a significant reconsideration event has occurred that would change the Company’s initial consolidation assessment. The three3 consolidated Residential Whole-Loan trusts collectively hold 2,7012,187 Residential Whole Loans and the consolidated Bridge Loan Trust holds 3312 Residential Bridge Loans and 96 Residential Whole Loans as of September 30, 2020.2021.
The following table presents a summary of the assets and liabilities of the consolidated residential whole loan trusts and residential bridge loan trust included in the Consolidated Balance Sheets as of September 30, 20202021 and December 31, 20192020 (dollars in thousands):
| | | | | | | | | | | |
| | September 30, 2020 | | December 31, 2019 |
| Cash and cash equivalents | $ | 0 | | | $ | 1,811 | |
| Residential Whole Loans, at fair value ($1,096,997 and $1,375,860 pledged as collateral, at fair value, respectively) | 1,096,997 | | | 1,375,860 | |
| Residential Bridge Loans ($15,319 and $31,748 at fair value and $16,828 and $34,897 pledged as collateral, respectively) | 16,828 | | | 34,897 | |
| | | |
| Investment related receivable | 18,817 | | | 19,138 | |
| Interest receivable | 5,123 | | | 7,840 | |
| Other assets | 92 | | | 90 | |
| Total assets | $ | 1,137,857 | | | $ | 1,439,636 | |
| Securitized debt, net | $ | 966,449 | | | $ | 795,811 | |
| Interest payable | 2,394 | | | 2,367 | |
| Accounts payable and accrued expenses | 109 | | | 173 | |
| | | |
| Total liabilities | $ | 968,952 | | | $ | 798,351 | |
| | | | | | | | | | | |
| | September 30, 2021 | | December 31, 2020 |
| | | |
| Residential Whole Loans, at fair value ($949,417 and $1,008,782 pledged as collateral, at fair value, respectively) | $ | 949,417 | | | $ | 1,008,782 | |
| Residential Bridge Loans ($5,960 and $11,858 at fair value and $5,960 and $12,960 pledged as collateral, respectively) | 5,960 | | | 12,960 | |
| | | |
| Investment related receivable | 24,224 | | | 27,987 | |
| Interest receivable | 4,314 | | | 4,688 | |
| Other assets | 80 | | | 80 | |
| Total assets | $ | 983,995 | | | $ | 1,054,497 | |
| Securitized debt, net | $ | 605,019 | | | $ | 892,290 | |
| Interest payable | 1,524 | | | 2,222 | |
| Accounts payable and accrued expenses | 40 | | | 77 | |
| | | |
| Total liabilities | $ | 606,583 | | | $ | 894,589 | |
The Company’s risk with respect to its investment in each residential loan trust is limited to its direct ownership in the trust. The Residential Whole Loans, Residential Bridge Loans and Commercial Loan held by the consolidated trusts are held solely to satisfy the liabilities of the trust, and creditors of the trust have no recourse to the general credit of the Company. The Company is not contractually required and has not provided any additional financial support to the trusts for the three and nine months ended September 30, 20202021 and September 30, 2019.2020.
The following table presents the components of the carrying value of Residential Whole Loans and Residential Bridge Loans as of September 30, 20202021 and December 31, 20192020 (dollars in thousands):
| | | | | | | | | | | | | | | | | | | | | | | | | | | | | | | | | | | | | | | |
| | Residential Whole Loans, at Fair Value | | Residential Bridge Loans, at Fair Value(1) | | Residential Bridge Loans, at Amortized Cost(1) | | |
| | September 30, 2020 | | December 31, 2019 | | September 30, 2020 | | December 31, 2019 | | September 30, 2020 | | December 31, 2019 | | | | |
| Principal balance | $ | 1,073,648 | | | $ | 1,325,443 | | | $ | 17,455 | | | $ | 34,041 | | | $ | 1,518 | | | $ | 3,155 | | | | | |
| Unamortized premium | 26,113 | | | 28,588 | | | 4 | | | 79 | | | 0 | | | 6 | | | | | |
| Unamortized discount | (1,864) | | | (2,839) | | | 0 | | | (13) | | | (10) | | | (11) | | | | | |
| Amortized cost | 1,097,897 | | | 1,351,192 | | | 17,459 | | | 34,107 | | | 1,508 | | | 3,150 | | | | | |
| Gross unrealized gains | 8,872 | | | 26,363 | | | 24 | | | 10 | | | N/A | | N/A | | | | |
| Gross unrealized losses | (9,772) | | | (1,695) | | | (1,150) | | | (848) | | | N/A | | N/A | | | | |
| Fair value | $ | 1,096,997 | | | $ | 1,375,860 | | | $ | 16,333 | | | $ | 33,269 | | | N/A | | N/A | | | | |
| | | | | | | | | | | | | | | | | | | | | | | | | | | | | | | | | | | | | | | |
| | Residential Whole Loans, at Fair Value | | Residential Bridge Loans, at Fair Value(1) | | Residential Bridge Loans, at Amortized Cost(1) | | |
| | September 30, 2021 | | December 31, 2020 | | September 30, 2021 | | December 31, 2020 | | September 30, 2021 | | December 31, 2020 | | | | |
| Principal balance | $ | 908,512 | | | $ | 984,555 | | | $ | 6,654 | | | $ | 14,144 | | | $ | — | | | $ | 1,103 | | | | | |
| Unamortized premium | 26,920 | | | 24,248 | | | 1 | | | 3 | | | — | | | — | | | | | |
| Unamortized discount | (1,459) | | | (1,799) | | | — | | | — | | | — | | | — | | | | | |
| Amortized cost | 933,973 | | | 1,007,004 | | | 6,655 | | | 14,147 | | | — | | | 1,103 | | | | | |
| Gross unrealized gains | 19,174 | | | 9,282 | | | — | | | 5 | | | N/A | | N/A | | | | |
| Gross unrealized losses | (3,730) | | | (7,504) | | | (695) | | | (1,339) | | | N/A | | N/A | | | | |
| Fair value | $ | 949,417 | | | $ | 1,008,782 | | | $ | 5,960 | | | $ | 12,813 | | | N/A | | N/A | | | | |
(1) These loans are classified in "Residential Bridge Loans" in the Consolidated Balance Sheets.
Residential Whole Loans
The Residential Whole Loans have low LTV's and are comprised of 2,7012,187 Non-QM adjustable rate mortgages and 96 investor fixed rate mortgages. The following tables present certain information about the Company’s Residential Whole Loan investment portfolio at September 30, 20202021 and December 31, 20192020 (dollars in thousands):
| | | | | | | | | | | | | | | | | | | | | | | | | | | | | | | | | | | | | | | | | |
| September 30, 2020 |
| | | | | | Weighted Average |
| Current Coupon Rate | Number of Loans | | Principal
Balance | | Original LTV | | Original FICO Score(1) | | Expected
Life (years) | | Contractual
Maturity
(years) | | Coupon
Rate |
| 3.01 – 4.00% | 73 | | | $ | 25,295 | | | 57.0 | % | | 708 | | | 3.6 | | 23.7 | | 3.8 | % |
| 4.01– 5.00% | 1,287 | | | 448,466 | | | 61.8 | % | | 751 | | | 2.5 | | 27.9 | | 4.9 | % |
| 5.01 – 6.00% | 1,310 | | | 585,577 | | | 64.3 | % | | 740 | | | 2.7 | | 27.8 | | 5.4 | % |
| 6.01 – 7.00% | 38 | | | 13,798 | | | 67.4 | % | | 723 | | | 3.0 | | 27.3 | | 6.3 | % |
| 7.01 - 8.00% | 2 | | | 512 | | | 73.2 | % | | 753 | | | 4.0 | | 27.9 | | 7.1 | % |
| | | | | | | | | | | | | |
| Total | 2,710 | | | $ | 1,073,648 | | | 63.1 | % | | 744 | | | 2.7 | | 27.7 | | 5.1 | % |
| | | | | | | | | | | | | | | | | | | | | | | | | | | | | | | | | | | | | | | | | |
| September 30, 2021 |
| | | | | | Weighted Average |
| Current Coupon Rate | Number of Loans | | Principal
Balance | | Original LTV | | Original FICO Score(1) | | Expected
Life (years) | | Contractual
Maturity
(years) | | Coupon
Rate |
| 2.01% – 3.00% | 14 | | | $ | 7,816 | | | 66.0 | % | | 746 | | | 5.7 | | 28.4 | | 2.7 | % |
| 3.01% – 4.00% | 332 | | | 163,681 | | | 62.6 | % | | 751 | | | 3.2 | | 27.3 | | 3.7 | % |
| 4.01% – 5.00% | 997 | | | 380,394 | | | 64.8 | % | | 748 | | | 2.7 | | 28.0 | | 4.8 | % |
| 5.01% – 6.00% | 820 | | | 346,778 | | | 64.6 | % | | 739 | | | 2.9 | | 27.2 | | 5.4 | % |
| 6.01% – 7.00% | 28 | | | 9,337 | | | 67.8 | % | | 720 | | | 3.0 | | 25.9 | | 6.3 | % |
| 7.01% - 8.00% | 2 | | | 506 | | | 73.2 | % | | 753 | | | 4.5 | | 26.9 | | 7.1 | % |
| | | | | | | | | | | | | |
| Total | 2,193 | | | $ | 908,512 | | | 64.3 | % | | 745 | | | 2.9 | | 27.6 | | 4.8 | % |
(1)The original FICO score is not available for 249215 loans with a principal balance of approximately $79.5$68.8 million at September 30, 2020.2021. The Company has excluded these loans from the weighted average computations.
| | | | | | | | | | | | | | | | | | | | | | | | | | | | | | | | | | | | | | | | | |
| December 31, 2019 |
| | | | | | Weighted Average |
| Current Coupon Rate | Number of Loans | | Principal
Balance | | Original LTV | | Original FICO Score(1) | | Expected Life (years)(2) | | Contractual
Maturity
(years) | | Coupon
Rate |
| 3.01 – 4.00% | 53 | | | $ | 17,284 | | | 61.7 % | | 736 | | | 2.4 | | 28.0 | | 3.9 % |
| 4.01– 5.00% | 1,689 | | | 557,144 | | | 61.4 % | | 744 | | | 2.8 | | 28.5 | | 4.8 % |
| 5.01 – 6.00% | 1,682 | | | 713,397 | | | 62.0 % | | 736 | | | 3.0 | | 28.3 | | 5.4 % |
| 6.01 – 7.00% | 103 | | | 37,102 | | | 54.1 % | | 727 | | | 3.8 | | 25.3 | | 6.2 % |
| 7.01 - 8.00% | 2 | | | 516 | | | 73.2 % | | 753 | | | 4.7 | | 28.6 | | 7.1 % |
| Total | 3,529 | | | $ | 1,325,443 | | | 61.5 % | | 739 | | | 3.0 | | 28.3 | | 5.2 % |
| | | | | | | | | | | | | | | | | | | | | | | | | | | | | | | | | | | | | | | | | |
| December 31, 2020 |
| | | | | | Weighted Average |
| Current Coupon Rate | Number of Loans | | Principal
Balance | | Original LTV | | Original FICO Score(1) | | Expected Life (years)(2) | | Contractual
Maturity
(years) | | Coupon
Rate |
| 2.01% – 3.00% | 4 | | | $ | 3,239 | | | 66.7 | % | | 733 | | | 5.9 | | 28.0 | | 2.7 | % |
| 3.01% – 4.00% | 118 | | | 41,489 | | | 55.8 | % | | 709 | | | 3.8 | | 23.3 | | 3.7 | % |
| 4.01% – 5.00% | 1,172 | | | 403,398 | | | 61.8 | % | | 751 | | | 2.7 | | 27.7 | | 4.9 | % |
| 5.01% – 6.00% | 1,166 | | | 523,105 | | | 64.2 | % | | 740 | | | 2.9 | | 27.7 | | 5.4 | % |
| 6.01% – 7.00% | 35 | | | 12,813 | | | 67.5 | % | | 720 | | | 3.2 | | 27.0 | | 6.3 | % |
| 7.01% - 8.00% | 2 | | | 511 | | | 73.2 | % | | 753 | | | 4.1 | | 27.6 | | 7.1 | % |
| Total | 2,497 | | | $ | 984,555 | | | 62.9 | % | | 744 | | | 2.9 | | 27.5 | | 5.1 | % |
(1)The original FICO score is not available for 286236 loans with a principal balance of approximately $94.6$75.2 million at December 31, 2019.2020. The Company has excluded these loans from the weighted average computations.
The following table presents the various states across the United States in which the collateral securing the Company’s Residential Whole Loans at September 30, 20202021 and December 31, 2019,2020, based on principal balance, is located (dollars in thousands):
| | September 30, 2020 | | December 31, 2019 | |
| September 30, 2021 | | September 30, 2021 | | December 31, 2020 |
| State | State | State Concentration | | Principal Balance | | State | State Concentration | | Principal Balance | State | State Concentration | | Principal Balance | | State | State Concentration | | Principal Balance |
| California | California | 65.4 | % | | $ | 702,352 | | | California | 66.1 | % | | $ | 875,738 | | California | 72.3 | % | | $ | 656,801 | | | California | 65.8 | % | | $ | 647,877 | |
| New York | New York | 17.9 | % | | 192,458 | | | New York | 16.2 | % | | 214,141 | | New York | 14.3 | % | | 129,931 | | | New York | 17.7 | % | | 173,788 | |
| Georgia | Georgia | 3.4 | % | | 35,969 | | | Georgia | 3.4 | % | | 45,189 | | Georgia | 2.7 | % | | 24,300 | | | Georgia | 3.4 | % | | 33,577 | |
| Florida | Florida | 2.7 | % | | 29,268 | | | Florida | 2.8 | % | | 36,641 | | Florida | 2.4 | % | | 21,697 | | | Florida | 2.8 | % | | 27,274 | |
| New Jersey | New Jersey | 2.5 | % | | 26,642 | | | New Jersey | 2.3 | % | | 30,450 | | New Jersey | 2.0 | % | | 18,255 | | | New Jersey | 2.5 | % | | 24,704 | |
| Other | Other | 8.1 | % | | 86,959 | | | Other | 9.2 | % | | 123,284 | | Other | 6.3 | % | | 57,528 | | | Other | 7.8 | % | | 77,335 | |
| Total | Total | 100.0 | % | | $ | 1,073,648 | | | Total | 100.0 | % | | $ | 1,325,443 | | Total | 100.0 | % | | $ | 908,512 | | | Total | 100.0 | % | | $ | 984,555 | |
Residential Bridge Loans
The Residential Bridge Loans are comprised of short-term non-owner occupied fixed rate loans secured by non-owner occupied single or multi-unit residential properties, with LTVs generally not to exceed 85%. The following tables present certain information about the Company’s Residential Bridge Loan investment portfolio at September 30, 20202021 and December 31, 20192020 (dollars in thousands):
| | | | | | | | | | | | | | | | | | | | | | | | | | | | | | | | |
| September 30, 2020 |
| c | | | | | | Weighted Average |
| Current Coupon Rate | | Number of Loans | | Principal
Balance | | Original LTV | | Contractual Maturity (months)(1) | | Coupon
Rate |
| | | | | | | | | | |
| | | | | | | | | | |
| 7.01 – 9.00% | | 15 | | $ | 10,430 | | | 69.5 | % | | 1.8 | | 8.6 | % |
| 9.01 – 11.00% | | 18 | | 7,714 | | | 74.8 | % | | 3.2 | | 10.1 | % |
| 11.01 – 13.00% | | 3 | | 705 | | | 69.8 | % | | 0.0 | | 11.4 | % |
| | | | | | | | | | |
| | | | | | | | | | |
| 17.01 – 19.00% | | 1 | | 124 | | | 75.0 | % | | 0.0 | | 18.0 | % |
| | | | | | | | | | |
| | | | | | | | | | |
| | | | | | | | | | |
| Total | | 37 | | $ | 18,973 | | | 71.7 | % | | 2.2 | | 9.4 | % |
| | | | | | | | | | | | | | | | | | | | | | | | | | | | | | | | |
| September 30, 2021 |
| c | | | | | | Weighted Average |
| Current Coupon Rate | | Number of Loans | | Principal
Balance | | Original LTV | | Contractual Maturity (months)(1) | | Coupon
Rate |
| | | | | | | | | | |
| | | | | | | | | | |
| 7.01% – 9.00% | | 3 | | $ | 2,946 | | | 70.4 | % | | 0.0 | | 8.8 | % |
| 9.01% – 11.00% | | 7 | | 3,213 | | | 75.9 | % | | 2.0 | | 10.3 | % |
| 11.01% – 13.00% | | 2 | | 495 | | | 69.7 | % | | 2.0 | | 11.4 | % |
| | | | | | | | | | |
| | | | | | | | | | |
| | | | | | | | | | |
| | | | | | | | | | |
| | | | | | | | | | |
| | | | | | | | | | |
| Total | | 12 | | $ | 6,654 | | | 73.0 | % | | 2.0 | | 9.7 | % |
| | | | | | | | | | | | | | | | | | | | | | | | | | | | | | | | |
| December 31, 2019 |
| | | | | | | Weighted Average |
| Current Coupon Rate | | Number of Loans | | Principal
Balance | | Original LTV | | Contractual Maturity (months)(1) | | Coupon
Rate |
| | | | | | | | | | |
| 7.01 – 9.00% | | 36 | | $ | 22,409 | | | 70.2 % | | 5.8 | | 8.4 % |
| 9.01 – 11.00% | | 28 | | 9,972 | | | 74.0 % | | 5.6 | | 10.1 % |
| 11.01 – 13.00% | | 9 | | 2,741 | | | 63.1 % | | 2.0 | | 11.7 % |
| 13.01 – 15.00% | | 1 | | 1,125 | | | 75.0 % | | 0.0 | | 13.5 % |
| | | | | | | | | | |
| 17.01 – 19.00% | | 2 | | 949 | | | 75.0 | % | | 0.0 | | 18.0 | % |
| | | | | | | | | | |
| | | | | | | | | | |
| Total | | 76 | | 37,196 | | | 71.0 | % | | 5.6 | | 9.5 | % |
| | | | | | | | | | | | | | | | | | | | | | | | | | | | | | | | |
| December 31, 2020 |
| | | | | | | Weighted Average |
| Current Coupon Rate | | Number of Loans | | Principal
Balance | | Original LTV | | Contractual Maturity (months)(1) | | Coupon
Rate |
| | | | | | | | | | |
| 7.01% – 9.00% | | 10 | | $ | 8,295 | | | 69.6 | % | | 1.4 | | 8.7 | % |
| 9.01% – 11.00% | | 15 | | 6,123 | | | 75.5 | % | | 0.5 | | 10.1 | % |
| 11.01% – 13.00% | | 3 | | 705 | | | 69.8 | % | | 0.0 | | 11.4 | % |
| | | | | | | | | | |
| | | | | | | | | | |
| 17.01% – 19.00% | | 1 | | 124 | | | 75.0 | % | | 0.0 | | 18.0 | % |
| | | | | | | | | | |
| | | | | | | | | | |
| Total | | 29 | | $ | 15,247 | | | 72.0 | % | | 0.8 | | 9.4 | % |
(1) Non-performing loans that are past their maturity date are excluded from the calculation of the weighted average contractual maturity. The weighted average contractual maturity for these loans is zero.
The following table presents the U.S. states in which the collateral securing the Company’s Residential Bridge Loans at September 30, 20202021 and December 31, 2019,2020, based on principal balance, is located (dollars in thousands):
| | | | | | | | | | | | | | | | | | | | | | | | | | |
| September 30, 2020 | | December 31, 2019 |
| State | Concentration | | Principal Balance | | State | Concentration | | Principal Balance |
| California | 37.8 | % | | $ | 7,163 | | | California | 50.4 | % | | $ | 18,763 | |
| New York | 17.7 | % | | 3,365 | | | Washington | 13.1 | % | | 4,863 | |
| Washington | 17.7 | % | | 3,361 | | | New York | 12.1 | % | | 4,518 | |
| Florida | 12.6 | % | | 2,384 | | | Florida | 8.9 | % | | 3,296 | |
| New Jersey | 4.4 | % | | 843 | | | New Jersey | 3.8 | % | | 1,424 | |
| Other | 9.8 | % | | 1,857 | | | Other | 11.7 | % | | 4,332 | |
| Total | 100.0 | % | | $ | 18,973 | | | Total | 100.0 | % | | $ | 37,196 | |
| | | | | | | | | | | | | | | | | | | | | | | | | | |
| September 30, 2021 | | December 31, 2020 |
| State | Concentration | | Principal Balance | | State | Concentration | | Principal Balance |
| New York | 39.5 | % | | $ | 2,631 | | | California | 37.5 | % | | $ | 5,713 | |
| California | 35.9 | % | | 2,386 | | | New York | 17.3 | % | | 2,632 | |
| Florida | 16.9 | % | | 1,125 | | | Washington | 16.1 | % | | 2,461 | |
| New Jersey | 5.0 | % | | 335 | | | Florida | 12.9 | % | | 1,969 | |
| Pennsylvania | 1.6 | % | | 105 | | | Connecticut | 5.7 | % | | 872 | |
| Other | 1.1 | % | | 72 | | | Other | 10.5 | % | | 1,600 | |
| Total | 100.0 | % | | $ | 6,654 | | | Total | 100.0 | % | | $ | 15,247 | |
Non-performing Loans
The following table presents the aging of the Residential Whole Loans and Bridge Loans as of September 30, 20202021 (dollars in thousands):
| | | | | | | | | | | | | | | | | | | | | | | | | | | | | | | | | | | | | | |
| | Residential Whole Loans | | Bridge Loans |
| | No of Loans | | Principal | | Fair Value | | No of Loans | | Principal | | Fair Value (1) |
Current(2) | | 2,655 | | | $ | 1,038,836 | | | $ | 1,063,022 | | | 10 | | | $ | 4,501 | | | $ | 4,486 | |
| 1-30 days | | 24 | | | 10,330 | | | 10,472 | | | 2 | | | 1,430 | | | 1,412 | |
| 31-60 days | | 3 | | | 1,303 | | | 1,281 | | | 3 | | | 2,080 | | | 2,038 | |
| 61-90 days | | 7 | | | 7,266 | | | 6,978 | | | 0 | | | 0 | | | 0 | |
| 90+ days | | 21 | | | 15,913 | | | 15,244 | | | 22 | | | 10,962 | | | 9,904 | |
| Total | | 2,710 | | | $ | 1,073,648 | | | $ | 1,096,997 | | | 37 | | | $ | 18,973 | | | $ | 17,840 | |
| | | | | | | | | | | | | | | | | | | | | | | | | | | | | | | | | | | | | | |
| | Residential Whole Loans | | Bridge Loans |
| | No of Loans | | Principal | | Fair Value | | No of Loans | | Principal | | Fair Value |
Current(1) | | 2,156 | | | $ | 889,231 | | | $ | 930,286 | | | 1 | | | $ | 75 | | | $ | 75 | |
| 1-30 days | | 15 | | | 7,448 | | | 7,746 | | | 1 | | | 105 | | | 105 | |
| 31-60 days | | — | | | — | | | — | | | — | | | — | | | — | |
| 61-90 days | | 3 | | | 1,238 | | | 1,259 | | | — | | | — | | | — | |
| 90+ days | | 19 | | | 10,595 | | | 10,126 | | | 10 | | | 6,474 | | | 5,780 | |
| Total | | 2,193 | | | $ | 908,512 | | | $ | 949,417 | | | 12 | | | $ | 6,654 | | | $ | 5,960 | |
(1) Includes $1.5 million loans carried at amortized cost.
(2) Includes loans1 loan in forbearance with unpaid principal balance of approximately $109.6 million.$493 thousand.
COVID-19 has materially disrupted business operations, resulting in significantly higher levels of unemployment or underemployment. As a result,underemployment in certain sectors. At the beginning of the COVID-19 pandemic, some of its Residential Whole Loan borrowers have experienced financial hardship, making it difficult to meet their payment obligations to the Company, leading to requests for forbearance and higher levels of delinquency and potentially defaults. The Company maintains a strong relationship with its servicers and has utilizedwas able to utilize these relationships to manage the impacts of COVID-19 pandemic on the Company's Non-QM loans. As of September 30, 2020,2021, the Company had 2521 Non-QM loan in forbearance and 0 Non-QM loans in the repayment phase following forbearance. Under the forbearance agreement, the borrower can generally elect to defer the principal and interest payments for 3 to 5 months. At the end of the forbearance period, the borrower can either repay the deferred principal and interest in full or over the next 9 months or capitalize the deferred principal and interest to the loan balance and calculate a new amortization payment or request an extension.payment. Loans under a forbearance agreement are treated as "Current" in the above table. These loans areThe loan in forbearance is carried at fair value and had an unpaid principal balance of approximately $109.6 million,$493 thousand, a fair value of $110.3 million, a weighted average$434 thousand, an original LTV of 63.7%64.7%, and representrepresents approximately 10.2%0.1% of the total outstanding principal balance of the Company's Residential Whole LoansLoans.
As of September 30, 2020,2021, there were 2119 Residential Whole Loans carried at fair value in non-accrual status with an unpaid principal balance of approximately $15.9$10.6 million and a fair value of $15.2$10.1 million. These nonperforming loans represent approximately 1.5%1.2% of the total outstanding principal balance. These loans are collateral dependent with a weighted average original LTV of 61.5%60.8%.
As of December 31, 2019,2020, there were 1226 Residential Whole Loans carried at fair value in non-accrual status with an unpaid principal balance of approximately $7.1$15.3 million and a fair value of approximately $6.7$14.7 million. These nonperforming loans represent approximately 0.5%1.6% of the total outstanding principal balance. These loans are collateral dependent with a weighted average original LTV of 62.1%60.4%.
These loans are carried at fair value, and accordingly no allowance for credit losses or credit loss expense was recorded, since the adjustment for credit losses, if any, would be reflected in the fair value of these loans as a component of "Unrealized gain (loss), netnet" in the Consolidated Statements of Operations. The Company stopsstopped accruing interest income for these loans when they became contractually 90 days delinquent.
Residential Bridge Loans
As of September 30, 2020,2021, there was 1 Residential Bridge Loans carried at amortized cost in non-accrual status with an unpaid principal balance of approximately $124 thousand and 21were 10 Residential Bridge Loans carried at fair value in non-accrual status with an unpaid principal balance of approximately $10.8$6.5 million and a fair value of $9.8$5.8 million. These nonperforming loans represent approximately 57.8%97.3% of the total outstanding Bridge Loans principal balance of $19.0$6.7 million. These loans are collateral dependent with a weighted average original LTV of 72.8%73.1%.
As of December 31, 2019,2020, there were 27was 1 Residential Bridge Loan carried at amortized cost in non-accrual status with an unpaid principal balance of approximately $123.8 thousand and 20 Residential Bridge Loans carried at fair value in non-accrual status with an unpaid principal balance of $12.1approximately $9.9 million and a fair value of $11.4$8.9 million. These nonperforming loans representedrepresent approximately 32.6%66.0% of the total outstanding Bridge Loans principal balance of $37.2$15.2 million. These loans are collateral dependent with a weighted average original LTV of 72.1%73.0%.
The Company concluded that an allowance for credit losses was not necessary for loans carried at amortized costs as of and for the three and nine months ended September 30,December 31, 2020 and September 30, 2019 since the fair value of the collateral balance less the cost to sell was in excess of the outstanding principal and interest balances. For loans carried at fair value, no allowance for credit losses or credit loss expense was recorded as of September 30, 2021 and December 31, 2020 since the valuation adjustment, for credit losses, if any, would be reflected in the fair value of these loans as a component of "Unrealized gain (loss), net in the Consolidated Statements of Operations.loans. The Company stopsstopped accruing interest income for these loanloans when they became contractually 90 days delinquent.
As of September 30, 2021 and December 31, 2020, the Company had real estate owned ("REO")4 and 3 REO properties with an aggregate carrying value of $1.3$1.1 million and $1.1 million, respectively, related to foreclosed Bridge Loans. The REO properties are held for sale and accordingly carried at the lower of cost or fair value less cost to sell. The REO properties are classified in "Other assets" in the Consolidated Balance Sheets.
Note 6 — Commercial Loans
Securitized Commercial Loans
Securitized commercial loans is comprised of commercial loans from consolidated third party sponsored CMBS VIE's. At September 30, 2020,2021, the Company had a variable interestsinterest in 21 third party sponsored CMBS VIEs, RETL 2019-RVP andVIE, CSMC Trust 2014-USA, that it determined it was the primary beneficiary and was required to consolidate. The commercial loans that serve as collateral for the securitized debt issued by these VIEsthis VIE can only be used to settle the securitized debt. Refer to Note 7 - "Financings" for details on the associated securitized debt. The Company assesses modifications to VIEs on an ongoing basis to determine if a significant reconsideration event has occurred that would change the Company’s initial consolidation assessment.
CSMC Trust 2015 - Longhouse MZ
In November 2015, the Company acquired a $14.0 million interest in the trust certificate issued by CSMC Trust 2015 - Longhouse MZ (“CSMC Trust”). The Company determined that CSMC Trust was a VIE and that the Company was the primary beneficiary because it was involved in certain aspects of the design of the trust, has certain oversight rights on defaulted assets and has other significant decision making powers. As the primary beneficiary, the Company was required to consolidate CSMC Trust and accordingly its investment in CSMC Trust was eliminated in consolidation. The CSMC Trust holds a mezzanine loan collateralized by interests in commercial real estate. The mezzanine loan serves as collateral for the trust certificates. In June 2020, the variable interest the Company acquired was paid off and, accordingly, the CSMC Trust is no longer consolidated.
RETL 2019-RVP
RETL 2018 was refinanced with a new securitization RETL 2019-RVP ("RETL 2019 Trust") in March 2019. The Company acquired a $65.3 million interest in the trust certificates issued by the RETL 2019 Trust, including $45.3 million
which represents the 5% eligible risk retention certificate. The Company determined that RETL 2019 Trust was a VIE and that the Company was also the primary beneficiary because the Manager was involved in certain aspects of the design of the trust and the Company together with other related party entities own more than 50% of the controlling class. As the primary beneficiary, the Company consolidated RETL 2019 Trust and its investment in the trust certificates (HRR class and a portion of the C class) of RETL 2019 Trust werewas eliminated in the consolidation. The RETL 2019 Trust holdsheld a commercial loan collateralized by first mortgages, deeds of trusts and interests in commercial real estate. The outstanding principal balance on this
On September 15, 2021, the commercial loan is $488.9 million as of September 30, 2020. The loan's stated maturity date is March 15, 2021 (subject towas paid in full by the borrower's option to extend the initial stated maturity date for two successive one-year terms)borrower and bears an interest rate of one month LIBOR plus 2.30%. As of September 30, 2020, the RETL HRR bonds arebond with an outstanding principal amount of $45.3 million held in WMC RETL LLC, which is a wholly ownedwholly-owned subsidiary of the Company.Company, was paid off. Accordingly, the RETL 2019 Trust is no longer consolidated.
MRCD 2019-PRKC Mortgage Trust
In December 2019, the Company acquired a $161.4 million interest in the trust certificates issued by the MRCD 2019-PRKC Mortgage Trust ("MRCD Trust"), including $10.5 million which represents the initial controlling class (HRR class). The Company determined that MRCD Trust was a VIE and that the Company was also the primary beneficiary because the
Manager was involved in certain aspects of the design of the trust and the Company owns the controlling class. As the primary beneficiary, the Company consolidated MRCD Trust and its investment in the trust certificates (HRR class and a portion of the A class) of MRCD Trust were eliminated in the consolidation.
On March 24, 2020, the Company sold its investments in the A Class certificates of the MRCD Trust. Shortly after the sale, the Company entered into an agreement to irrevocably assign the controlling rights and appointed one of the buyers as the new Directing Holder. As a result, the assets and liabilities of the MRCD Trust were deconsolidated, since the Company no longer has the power to direct the activities that significantly impact the economic performance of the MRCD Trust.
MRCD qualified as a CFE under GAAP and the Company measured both the financial assets and financial liabilities using the fair value of the financial liabilities, since it was more observable. The Company recognized an unrealized loss of $43.7 million in earnings, related to the periodic change in fair value of MRCD's assets and liabilities in March 2020, and prior to deconsolidation. Also, the Company retained the HRR certificates, which were measured at fair value at the date of deconsolidation and is included in the "Non-Agency mortgage-backed securities, at fair value" in the Consolidated Balance Sheets.
CSMC Trust 2014-USA
The Company together with other related party entities own more than 50% of the controlling class of CSMC Trust 2014-USA ("CSMC USA"). As of September 30, 2020,2021, the Company held $14.9 million oran 8.8% interest in the trust certificates issued by CSMC USA.USA (F Class) with an outstanding principal balance of $14.9 million. The Company performs ongoing reassessment of its CMBS VIE holdings for potential consolidation of the securitized trust in which it owns a portion of the controlling class. Since the ownership of the controlling financial interest is held within a related party group, the Company must determine whether it is the primary beneficiary under the related party tie-breaker rule, which requires the evaluation of the following considerations: (1) the principal-agency relationship between parties; (2) relationship and significance of the VIE's activities to the variable interest holders; (3) variable interest holder's exposure to VIE's expected losses and (4) the design of the VIE. As a result of the Company's evaluation, it was determined that the Company is the primary beneficiary of CSMC USA, and effective on August 1, 2020, consolidated CSMC USA. The Company’s investment in the trust certificate of CSMC USA (F Class) was eliminated in the consolidation. . The CSMC USA holds a commercial loan secured by a first mortgage lien on the borrowers’ fee and leasehold interests in a portion of a super-regional mall. The outstanding principal balance on this commercial loan is $1.4 billion as of September 30, 2020.2021. The loan's stated maturity date is September 11, 2025 and bears a fixed interest rate of 4.38%. The Company elected the fair value option for the commercial loan as well as the associated securitized debt.
In December 2020, the commercial loan held by CSMC USA was amended to an interest only payment through maturity. As part of the modification, a Cash Management Forbearance Agreement was entered into by the special servicer and the borrower that required both increased reporting requirements and monthly net cash remittance.
Commercial Loans
In January 2019, WMC CRE LLC ("CRE LLC"), a wholly-owned subsidiary of the Company and WMC CRE Mezzanine Loan Subsidiary LCC ("CRE Mezz"), a wholly-owned subsidiary of CRE LLC, werewas formed for the purpose of acquiring commercial loans.
The following table presents the commercial loans held by CRE LLC and CRE Mezz as of September 30, 20202021 (dollars in thousands):
Table of Contents | | | | | | | | | | | | | | | | | | | | | | | | | | | | | |
| Loan | Acquisition Date | Loan Type | Principal Balance | Fair Value | Original LTV | Interest Rate | Maturity Date | Extension Option | Collateral |
| CRE 3 | August 2019 | Interest-Only Mezzanine loan | $ | 90,000 | | $ | 27,495 | | 58% | 1-Month LIBOR plus 9.25% | 6/29/2021 | Two-Year First Extension and One-Year Second Extension | Entertainment and Retail |
| CRE 4 | September 2019 | Interest-Only First Mortgage | 38,367 | | 38,294 | | 63% | 1-Month LIBOR plus 3.02% | 8/6/2022 | NaN One-Year Extensions | Retail |
| CRE 5 | December 2019 | Interest-Only First Mortgage | 24,535 | | 24,085 | | 62% | 1-Month LIBOR plus 3.75% | 11/6/2022 | NaN One-Year Extensions | Hotel |
| CRE 6 | December 2019 | Interest-Only First Mortgage | 13,207 | | 12,964 | | 62% | 1-Month LIBOR plus 3.75% | 11/6/2022 | NaN One-Year Extensions | Hotel |
| CRE 7 | December 2019 | Interest-Only First Mortgage | 7,259 | | 7,126 | | 62% | 1-Month LIBOR plus 3.75% | 11/6/2022 | NaN One-Year Extensions | Hotel |
| CRE 8 | December 2019 | Interest-Only First Mortgage | 4,442 | | 4,440 | | 79% | 1-Month LIBOR plus 4.85% | 12/6/2022 | None | Assisted Living Facilities |
| | | $ | 177,810 | | $ | 114,404 | | | | | | |
| | | | | | | | | | | | | | | | | | | | | | | | | | | | | |
| Loan | Acquisition Date | Loan Type | Principal Balance | Fair Value | Original LTV | Interest Rate | Maturity Date | Extension Option | Collateral |
| CRE 1 | June 2018 | Interest-Only First Mortgage | 30,000 | | 29,177 | | 65% | 1-Month LIBOR plus 4.5% | 6/9/2021 | None | Hotel |
| CRE 2 | June 2019 | Principal & Interest First Mortgage | 49,909 | | 49,314 | | 75% | 1-Month LIBOR plus 4.75% | 1/11/2022 | Two One-Year Extensions | Nursing Facilities |
| CRE 3 | August 2019 | Interest-Only Mezzanine loan | 90,000 | | 87,522 | | 58% | 1-Month LIBOR plus 9.25% | 6/29/2021 | Two-Year First Extension and One-Year Second Extension | Entertainment and Retail |
| CRE 4 | September 2019 | Interest-Only First Mortgage | 40,000 | | 39,001 | | 63% | 1-Month LIBOR plus 3.02% | 8/6/2021 | Two One-Year Extensions | Retail |
| CRE 5 | December 2019 | Interest-Only First Mortgage | 24,535 | | 23,695 | | 62% | 1-Month LIBOR plus 3.75% | 11/6/2021 | Three One-Year Extensions | Hotel |
| CRE 6 | December 2019 | Interest-Only First Mortgage | 13,207 | | 12,754 | | 62% | 1-Month LIBOR plus 3.75% | 11/6/2021 | Three One-Year Extensions | Hotel |
| CRE 7 | December 2019 | Interest-Only First Mortgage | 7,259 | | 7,010 | | 62% | 1-Month LIBOR plus 3.75% | 11/6/2021 | Three One-Year Extensions | Hotel |
| CRE 8 | December 2019 | Interest-Only First Mortgage | 4,458 | | 4,479 | | 79% | 1-Month LIBOR plus 4.85% | 12/6/2022 | None | Assisted Living |
| | | $ | 259,368 | | $ | 252,952 | | | | | | |
| | | | | | | | | |
Commercial Loan Trust
In March 2018, the Company formed the Revolving Small Balance Commercial Trust 2018-1 ("RSBC Trust") to acquire commercial real estate mortgage loans. The Company determined that the wholly-owned RSBC Trust was a VIE and that the Company was the primary beneficiary because it was involved in the design of the trust and holds significant decision making powers. In addition, the Company has the obligation to absorb losses to the extent of its ownership interest and the right to receive benefits from the trust that could potentially be significant to the trust. As of September 30, 2020,2021, the Company financed the trust certificate with $36.6$10.6 million of repurchase agreements, which is a liability held outside the trust.
The following table presents the commercial real estate loansloan held by RSBC Trust as of September 30, 20202021 (dollars in thousands):
| | | | | | | | | | | | | | | | | | | | | | | | | | | | | |
| Loan | Acquisition Date | Loan Type | Principal Balance | Fair Value | LTV | Interest Rate | Maturity Date | Extension Option | Collateral |
| SBC 3 | January 2019 | Interest-Only First Mortgage | $ | 14,362 | | $ | 14,362 | | 49% | 1-Month LIBOR plus 4.10% | 7/6/2022 | None | Nursing Facilities |
| | | $ | 14,362 | | $ | 14,362 | | | | | | |
| | | | | | | | | | | | | | | | | | | | | | | | | | | | | |
| Loan | Acquisition Date | Loan Type | Principal Balance | Fair Value | LTV | Interest Rate | Maturity Date | Extension Option | Collateral |
| SBC 1 | July 2018 | Interest-Only First Mortgage | $ | 45,188 | | $ | 44,852 | | 74% | One-Month LIBOR plus 4.25% (1) | 8/1/2021 | One-Year Extension | Nursing Facilities |
| SBC 2 | January 2019 | Interest-Only First Mortgage | 13,600 | | 13,554 | | 84% | One-Month LIBOR plus 4.0% (2) | 12/1/2021 | One-Year Extension | Apartment Complex |
| SBC 3 | January 2019 | Interest-Only First Mortgage | 14,362 | | 14,293 | | 49% | One-Month LIBOR plus 4.1% | 7/1/2021 | None | Nursing Facilities |
| | | $ | 73,150 | | $ | 72,699 | | | | | | |
(1) Subject to LIBOR floorOn July 7, 2021, SBC 1, with an outstanding principal balance of 1.25%.
(2) Subject to LIBOR floor of 2%.$45.2 million collateralized by nursing facilities, was paid off in full.
On September 24, 2021, SBC 2 with an outstanding principal balance of $9.2 million collateralized by an apartment complex was paid off in full.
Consolidated Securitized Commercial Loan Trusts and Commercial Loan Trust
The Company assesses modifications to VIEs on an ongoing basis to determine if a significant reconsideration event has occurred that would change the Company’s initial consolidation assessment. The 3As of September 30, 2021, the Company had 2 consolidated trusts, RETL 2019 Trust, CSMC USA and RSBC Trust, that collectively hold 52 commercial loans as of September 30, 2020.loans.
The following table presents a summary of the assets and liabilities of the 32 consolidated trusts included in the Consolidated Balance Sheets as of September 30, 20202021 and December 31, 20192020 (dollars in thousands):
| | | | | | | | | | | |
| | September 30, 2020 | | December 31, 2019 |
| Cash | $ | 0 | | | $ | 5,778 | |
| Restricted cash | 95,579 | | | 52,948 | |
| Securitized commercial loans, at fair value | 1,687,545 | | | 909,040 | |
| Commercial Loans, at fair value | 72,699 | | | 90,788 | |
| Interest receivable | 6,164 | | | 2,989 | |
| Total assets | $ | 1,861,987 | | | $ | 1,061,543 | |
| Securitized debt, at fair value | $ | 1,636,460 | | | $ | 681,643 | |
| Interest payable | 5,287 | | | 1,519 | |
| Accounts payable and accrued expenses | 301 | | | 12 | |
| Other liabilities | 95,579 | | | 52,948 | |
| Total liabilities | $ | 1,737,627 | | | $ | 736,122 | |
| | | | | | | | | | | |
| | September 30, 2021 | | December 31, 2020 |
| Cash | $ | 9,245 | | | $ | — | |
| Restricted cash | 260 | | | 76,132 | |
| Securitized commercial loans, at fair value | 1,377,005 | | | 1,605,335 | |
| Commercial Loans, at fair value | 14,362 | | | 68,466 | |
| Interest receivable | 5,119 | | | 6,248 | |
| Total assets | $ | 1,405,991 | | | $ | 1,756,181 | |
| Securitized debt, at fair value | $ | 1,365,494 | | | $ | 1,553,722 | |
| Interest payable | 4,995 | | | 5,660 | |
| Accounts payable and accrued expenses | 9 | | | 12 | |
| Other liabilities | 260 | | | 76,132 | |
| Total liabilities | $ | 1,370,758 | | | $ | 1,635,526 | |
The Company’s risk with respect to its investment in each securitized commercial loan trust is limited to its direct ownership in the trust. The commercial loans held by the consolidated securitized commercial loan trusts are held solely to satisfy the liabilities of the trust, and creditors of the trust have no recourse to the general credit of the Company. The assets of a consolidated securitized commercial loan trust can only be used to satisfy the obligations of that trust. The Company is not contractually required and has not provided any additional financial support to the securitized commercial loan trusts for the three and nine months ended September 30, 20202021 and September 30, 2019.2020.
The following table presents the components of the carrying value of the securitized commercial loans and commercial loans as of September 30, 20202021 and December 31, 20192020 (dollars in thousands):
| | | | | | | | | | | | | | | | | | | | | | | | | | | | | | | | | | | | | | | | | | | | | | | | | | | |
| | | | RETL Trust Securitized Commercial Loan, at Fair Value(1) | | CSMC USA Trust Securitized Commercial Loan, at Fair Value | | RSBC Trust Commercial Loans, at Fair Value | | Commercial Loans, at Fair Value |
| | | | | | September 30, 2021 | | December 31, 2020 | | September 30, 2021 | | December 31, 2020 | | September 30, 2021 | | December 31, 2020 | | September 30, 2021 | | December 31, 2020 |
| Principal balance | | | | | $ | — | | | $ | 354,202 | | | $ | 1,385,591 | | | $ | 1,385,591 | | | $ | 14,362 | | | $ | 68,750 | | | $ | 177,810 | | | $ | 256,694 | |
| Unamortized premium | | | | | — | | | 180 | | | — | | | — | | | — | | | — | | | — | | | — | |
| Unamortized discount | | | | | — | | | — | | | (117,024) | | | (135,653) | | | — | | | (94) | | | (2) | | | (53) | |
| Amortized cost | | | | | — | | | 354,382 | | | 1,268,567 | | | 1,249,938 | | | 14,362 | | | 68,656 | | | 177,808 | | | 256,641 | |
| Gross unrealized gains | | | | | — | | | — | | | 108,438 | | | 16,013 | | | — | | | — | | | — | | | 1 | |
| Gross unrealized losses | | | | | — | | | (14,998) | | | — | | | — | | | — | | | (190) | | | (63,404) | | | (14,585) | |
| Fair value | | | | | $ | — | | | $ | 339,384 | | | $ | 1,377,005 | | | $ | 1,265,951 | | | $ | 14,362 | | | $ | 68,466 | | | $ | 114,404 | | | $ | 242,057 | |
| | | | | | | | | | | | | | | | | | | | | | | | | | | | | | | | | | | | | | | | | | | | | | | | | | | | | | | | | | | |
| | CSMC Trust Securitized Commercial Loan,
at Fair Value | | RETL Trust Securitized Commercial Loan, at Fair Value | | CSMC USA Trust Securitized Commercial Loan, at Fair Value | | RSBC Trust Commercial Loans, at Fair Value | | Commercial Loans, at Fair Value |
| | September 30, 2020 | | December 31, 2019 | | September 30, 2020 | | December 31, 2019 | | September 30, 2020 | | December 31, 2019 | | September 30, 2020 | | December 31, 2019 | | September 30, 2020 | | December 31, 2019 |
| Principal balance | $ | 0 | | | $ | 24,048 | | | $ | 488,922 | | | $ | 674,331 | | | $ | 1,389,276 | | | $ | 0 | | | $ | 73,150 | | | $ | 90,788 | | | $ | 259,368 | | | $ | 279,425 | |
| Unamortized premium | 0 | | | 0 | | | 553 | | | 1,836 | | | 0 | | | 0 | | | 0 | | | 0 | | | 0 | | | 0 | |
| Unamortized discount | 0 | | | 0 | | | 0 | | | 0 | | | (140,959) | | | 0 | | | (65) | | | (215) | | | (91) | | | (294) | |
| Amortized cost | 0 | | | 24,048 | | | 489,475 | | | 676,167 | | | 1,248,317 | | | 0 | | | 73,085 | | | 90,573 | | | 259,277 | | | 279,131 | |
| Gross unrealized gains | 0 | | | 9 | | | 0 | | | 269 | | | 0 | | | 0 | | | 0 | | | 215 | | | 21 | | | 294 | |
| Gross unrealized losses | 0 | | | 0 | | | (34,810) | | | 0 | | | (15,437) | | | 0 | | | (386) | | | 0 | | | (6,346) | | | 0 | |
| Fair value | $ | 0 | | | $ | 24,057 | | | $ | 454,665 | | | $ | 676,436 | | | $ | 1,232,880 | | | $ | 0 | | | $ | 72,699 | | | $ | 90,788 | | | $ | 252,952 | | | $ | 279,425 | |
(1) On September 15, 2021, the commercial loan was paid in full by the borrower and the RETL HRR bond with an outstanding principal amount of $45.3 million held in WMC RETL LLC, a wholly-owned subsidiary of the Company, was paid off. Accordingly, the RETL 2019 Trust is no longer consolidated.
Non-Performing Commercial Loans
The following table presents the aging of the Commercial Loans as of September 30, 20202021 (dollars in thousands):
| | | Commercial Loans | | Commercial Loans |
| | No of Loans | | Principal | | Fair Value | | No of Loans | | Principal | | Fair Value |
| Current | Current | | 10 | | $ | 302,518 | | | $ | 296,474 | | Current | | 6 | | $ | 102,172 | | | $ | 101,271 | |
| 1-30 days | 1-30 days | | 0 | | | 0 | | | 0 | | 1-30 days | | — | | | — | | | — | |
| 31-60 days | 31-60 days | | 0 | | | 0 | | | 0 | | 31-60 days | | — | | | — | | | — | |
| 61-90 days | 61-90 days | | 0 | | | 0 | | | 0 | | 61-90 days | | — | | | — | | | — | |
| 90+ days | 90+ days | | 1 | | | 30,000 | | | 29,177 | | 90+ days | | 1 | | | 90,000 | | | 27,495 | |
| Total | Total | | 11 | | $ | 332,518 | | | $ | 325,651 | | Total | | 7 | | $ | 192,172 | | | $ | 128,766 | |
The impact of COVID-19 pandemic has adversely impacted a broad range of industries in which the commercial loan borrowers operate and could impair their ability to fulfill their financial obligations to the Company, most significantly hospitality and retail asset. The Company believes its CRE loan sponsors are well capitalized and generally committed to supporting the assets collateralizing itsassets. loans. The low average original LTV of the Company's commercial loan portfolio of 65.5% reflects59.7%, reflecting significant equity value that the sponsors are motivated to protect, is a mitigating factor of these risks. Still there is no guarantee that losses will not occur.
CRE 1 Loan
In October 2020, the Company commenced foreclosure proceedings for its non-performing commercial loan with an outstanding principal balance of $30.0 million.secured by a hotel. However, on February 24, 2021, the borrower filed for bankruptcy protection halting the foreclosure process. In August 2021, the bankruptcy case was dismissed by the bankruptcy court and the Company and the other holders of the loan foreclosed on the property through a special purpose entity ("SPE") formed for the COVID-19 disruption. Apurpose of holding the property. The process of marketing the property began following the foreclosure but the borrower has continued to file legal challenges to the sale process. While the Company believes these legal challenges have no merit, they have delayed moving forward with the sale of the property. Based on preliminary bids, the Company believes there is a reasonable likelihood that its investment along with the other members' interest will be recovered, although there is no assurance of full recovery
s
The SPE is consolidated by the Company and the property is recorded at the lower of cost or fair value less cost to sell. As of September 30, 2021, the REO is recorded at $42.5 million and classified in "Other assets" in the Consolidated Balance Sheets and the other members' interests in the SPE of approximately $11.9 million are recorded as "Non-controlling interest" in the consolidated financial statements.
CRE 3 Loan
As of September 30, 2021, the CRE 3 junior mezzanine loan which has an outstanding principal balance of $90.0 million secured by a class A retail and entertainment complex located in the North East U.S. (the “Property”) was in default. The Property, which was originally scheduled to open in March 2020, was severely impacted by COVID-19 related shutdowns and restrictions and continues to face the challenging conditions impacting large portions of the retail sector. The Company was receiving interest payments on this loan from a reserve that was exhausted in May 2021 and the loan became non-performing.
Additionally, on May 10, 2021, the administrative agent for the senior mortgage loan on the Property (the “Administrative Agent”) notified us, as administrative agent for the junior mezzanine loan, of the Administrative Agent’s intent to accept an assignment in lieu of foreclosure with respect to the Property if the junior mezzanine lenders did not elect to purchase the senior mortgage loan within 30 days pursuant to the terms set forth in an intercreditor agreement among the Administrative Agent, the Company had 1 delinquent borrowerand the senior mezzanine lender. The senior mezzanine lender was provided with a similar notice on May 10, 2021. Since the original notice provided by the Administrative Agent on May 10, 2021, the Administrative Agent has extended the deadline for the junior mezzanine lenders and the senior mezzanine lender to exercise their purchase right with respect to the senior mortgage loan a total loan principal balance oof three times, with the most recent extension expired on July 14, 2021, and neither the junior mezzanine lenders nor the senior mezzanine lender offered to purchase the senior mortgage loan.
f $30.0 million.
The Company has filed a noticeis currently in discussions with the borrower and certain other lenders regarding alternatives to address the situation which might include modifications of defaultloan terms, deferral of payments and the funding of new advances. There can be no assurance that these discussions will result in an outcome in which the Company would be repaid any amount of the loan and the Company may suffer further declines in fair value with respect to this loan and is currently exploringmezzanine investment. For the three months
ended September 30, 2021, the Company recorded a further decline of $5.2 million in the fair value of this investment. The Company could experience a total loss of its investment under various workout strategies.scenarios, which at current levels would result in a $27.5 million reduction in the Company’s book value.
Note 7— Financings
Repurchase Agreements
The Company has primarily financed its investment acquisitions with repurchase agreements. The repurchase agreements bear interest at a contractually agreed-upon rate and historically had terms ranging from one month to 18 months. The Company’s repurchase agreement borrowings are accounted for as secured borrowings when the Company maintains effective control of the financed assets. Under these repurchase agreements, the respective counterparties retain the right to determine the fair value of the underlying collateral. A reduction in the value of pledged assets normally requires the Company to post additional securities as collateral, pay down borrowings or establish cash margin accounts with the counterparties in order to re-establish the agreed-upon collateral requirements, and is referred to as a margin call. The inability of the Company to post adequate collateral for a margin call by a counterparty, in a timeframe as short as the close of the same business day, could result in a condition of default under the Company’s repurchase agreements, thereby enabling the counterparty to liquidate the collateral pledged by the Company, which may have a material adverse effect on the Company’s financial position, results of operations and cash flows.
The market disruptions surrounding COVID-19 resulted in the decline of the Company's asset values making it challenging to obtain repurchase agreement financing with favorable terms or at all. The Company's repurchase agreement counterparties have increased borrowing rates and increased haircuts. In the second quarter iIn order to manage the severe market conditions and the resulting large margin demands from lenders and pressure on the Company’s liquidity, the Company entered into two3 longer term financing arrangements to reduce its exposure to short-term financings with daily mark to market exposure. Below is a summary of each of the these financing arrangements.
Residential Whole Loan Facility
On April 21, 2020, the Company entered into amendments with respect to certain of its loan warehouse facilities. These amendments mainly served to convert an existing residential whole loan facility into a term facility by removing any mark to market margin requirements, and to consolidate the Company’s Non-Qualified Mortgage loans, which were previously financed by 3 separate, unaffiliated counterparties, into a single facility.
The target advance rate under the amended and restated facility iswas approximately 84% of the aggregate unpaid principal balance of the loans. The facility had an original facility matured onmaturity of October 20, 2021. All principal payments and income generated by the loans during the term of the facility wwere used to pay principal and interest on the facility. Upon the securitization or sale by the Company of any whole loan subject to this amended and restated facility, the counterparty iswas entitled to receive a recapture premium fee of 30% of all realized value on any whole loans above such counterparty’s amortized basis as well as an exit fee of 0.50% of the loan amount in circumstances where the counterparty was not involved in the disposition of the loans. The
financing cost of this facility was reflective of the challenging market conditions, at such time, when wethe Company entered into the agreement.
Initially, the Company’s aggregate borrowings under this facility with respect to its Residential Whole Loans was approximately $385.0 million and the market value of such loans was approximately $430.0 million. On June 29, 2020, the Company securitized approximately $355.8 million of the Residential Whole Loans and paid down the facility by approximately $339.4 million (see "Securitized"—Securitized Debt" below for additional details). As noted above part of the financing arrangements noted above, the Company agreed to pay the lender a fee of 30% of all realized value on the Residential Whole Loans above the counterparty's amortized basis upon securitization or sale. As a result of refinancing the Residential Whole Loans through a securitization, the Company accrued a premium recapture fee of approximately $20.5 million, which iswas payable at the maturity of the facility, and iswas recorded in "Financing fees" in the Consolidated Statements of Operations.
On October 6, 2020, the Company entered into an amendment with respect to this residential loan warehouse facility. The amendment served to convert the existing residential loan facility to a limited mark to market margin facility that bears an interest rate of LIBOR plus 2.75%, with a LIBOR floor of 0.25%. The target advance rate under the amended facility is 85% and the facility matures on October 5, 2021. IAsn connection with the amendment to the facility, the Company paid $12.0 million of the premium recapture fee. The balance of $8.5 million is payable at October 5, 2021 when the amended facility matures. The premium recapture fee was eliminated for new and remaining investments financed under the amended facility.
Under the residential whole loan facility, as of September 30, 2020,2021, the Company had approximately $72.7$236.8 million in borrowings with an interest rate of non QMone month LIBOR plus 2.75%. The borrowing is secured by Non-QM loans remain in thewith an estimated fair market value of $287.1 million.
The Company further amended its residential whole loan facility which are also subjecton November 5, 2021. Refer to the recapture premium at sale or securitization and the amount of such liability is contingent on the realizable value at time of sale or securitization. Subsequent to the end of the quarter the facility was further amended. See Note 16-16 - "Subsequent Events" for details.
Non-Agency CMBS and Non-Agency RMBS Facility
On May 4, 2020, the Company supplemented one of its existing securities repurchase facilities to consolidate most of its CMBS and RMBS assets, which were financed by multiple counterparties, into a single term facility with limited mark to market margin requirements. Pursuant to the agreement, a margin deficit will not occur until such time as the loan to value ratio surpasses a certain threshold (the “LTV Trigger”), on a weighted average basis per asset type, calculated on a portfolio level. If this threshold iswas reached, the Company may elect to provide cash margin or sell certain assets to the extent necessary to lower the ratio. The term of this facility iswas 12 months, subject to a 12 month extensions at the counterparty’s option. All interest income generated by the assets during the term of the facility will bewas paid to the Company no less often than monthly. Interest on the facility iswas due from the Company at a rate of three-month LIBOR plus 5.00% payable quarterly in arrears. Half of all principal repayments on the underlying assets will bewas applied to repay the obligations owed to the counterparty, with the remainder paid to the Company, unless the LTV Trigger has occurred, in which case all principal payments will be applied to repay the obligations.
On May 5, 2021, the Company amended its Non-Agency CMBS and Non-Agency RMBS financing facility to, among other things, extend the facility for an additional 12 months and reduce the interest rate. The amended facility has improved advance rates and bears interest at a rate of three-month LIBOR plus 2.00%. As of September 30, 2021, the outstanding balance under this facility was $111.5 million. The borrowing is secured by investments with an estimated fair market value of $196.7 million as of September 30, 2021.
Commercial Whole Loan Facility
On May 5, 2021, the Company amended its Commercial Whole Loan Facility to, among other things, convert the term to a 12-month facility with up to a 12-month extension option, subject to the lender's consent.
As of September 30, 2021, the Company had approximately $63.7 million in borrowings, with a weighted average interest rate of 2.27% under its commercial whole loan facility. The borrowing is secured by loans with an estimated fair market value of $86.9 million as of September 30, 2021. The facility was subject to automatic monthly rolling until such time that it is terminated pursuant to the terms of the agreement by either the borrower or lender or until certain conditions of default.
Financial Metrics
Certain of the repurchase agreementsCompany’s financing arrangements provide the counterparty with the right to terminate the agreement and accelerate amounts due under the associated agreement if the Company does not maintain certainfinancial metrics. Although specific to each financing arrangement, typical financial metrics include minimum equity and liquidity requirements, leverage ratios, and leverage metrics, the most restrictive of which include a limit on leverage based on the compositionperformance triggers. In addition, some of the Company’s portfolio. For all the repurchasefinancing arrangements contain cross-default features, whereby default under an agreement with one lender simultaneously causes default under agreements with outstanding borrowings, theother lenders. The Company was in compliance with the terms of such financial tests as of September 30, 2020.2021.
Outstanding Borrowings
As of September 30, 2020,2021, the Company had borrowings under 65 of its master repurchase agreements. The following table summarizes certain characteristics of the Company’s repurchase agreements at September 30, 20202021 and December 31, 20192020 (dollars in thousands):
| | | | | | | | | | | | | | | | | | | | | | | | | | | | | | | | | | | | | | |
| | | September 30, 2020 | | December 31, 2019 |
| Securities Pledged | | Repurchase Agreement Borrowings | | Weighted Average Interest Rate on Borrowings Outstanding at end of period | | Weighted Average Remaining Maturity (days) | | Repurchase Agreement Borrowings | | Weighted Average Interest Rate on Borrowings Outstanding at end of period | | Weighted Average Remaining Maturity (days) |
| Short Term Borrowings: | | | | | | | | | | | | |
| Agency CMBS | | $ | 0 | | | 0 | % | | 0 | | $ | 1,352,248 | | | 2.05 % | | 26 |
| Agency RMBS | | 1,438 | | | 1.46 | % | | 59 | | 348,274 | | | 1.99 % | | 52 |
| Non-Agency CMBS | | 9,119 | | | 3.28 | % | | 13 | | 190,390 | | | 3.05 % | | 35 |
| Non-Agency RMBS | | 0 | | | 0 | % | | 0 | | 30,481 | | | 3.56 % | | 9 |
Residential Whole Loans (1) | | 19,215 | | | 4.72 | % | | 23 | | 266,294 | | | 3.14 | % | | 202 |
Residential Bridge Loans (1) | | 15,763 | | | 2.75 | % | | 36 | | 29,869 | | | 3.93 % | | 28 |
Commercial Loans (1) | | 36,575 | | | 3.34 | % | | 77 | | 62,746 | | | 4.04 % | | 28 |
Securitized Commercial Loans (1)(4) | | 0 | | | 0 | % | | 0 | | 116,087 | | | 3.93 % | | 49 |
| Membership Interest | | 18,845 | | | 2.90 | % | | 29 | | N/A | | N/A | | N/A |
| Other Securities | | 2,599 | | | 4.50 | % | | 21 | | 56,762 | | | 3.23 % | | 34 |
| Subtotal | | 103,554 | | | 3.42 | % | | 45 | | 2,453,151 | | | 2.44 | % | | 51 |
| Long Term Borrowings: | | | | | | | | | | | | |
Non-Agency CMBS (2) | | 74,145 | | | 5.25 | % | | 218 | | N/A | | N/A | | N/A |
| Non-Agency RMBS | | 14,742 | | | 5.25 | % | | 218 | | N/A | | N/A | | N/A |
Residential Whole Loans (1) (3) | | 20,846 | | | 5.22 | % | | 386 | | 209,878 | | | 3.55 | % | | 1358 |
Commercial Loans (3) | | 131,822 | | | 2.20 | % | | 377 | | 161,848 | | | 3.88 % | | 590 |
| | | | | | | | | | | | |
| Other Securities | | 13,769 | | | 5.25 | % | | 218 | | N/A | | N/A | | N/A |
| Subtotal | | 255,324 | | | 3.67 | % | | 314 | | 371,726 | | | 3.70 | % | | 1024 |
| Repurchase Agreements Borrowings | | $ | 358,878 | | | 3.60 | % | | 236 | | $ | 2,824,877 | | | 2.61 | % | | 179 |
| Less Unamortized Debt Issuance Costs | | 353 | | | N/A | | N/A | | 76 | | | N/A | | N/A |
| Repurchase Agreements Borrowings, net | | $ | 358,525 | | | 3.60 | % | | 236 | | $ | 2,824,801 | | | 2.61 | % | | 179 |
| | | | | | | | | | | | | | | | | | | | | | | | | | | | | | | | | | | | | | |
| | | September 30, 2021 | | December 31, 2020 |
| Securities Pledged | | Repurchase Agreement Borrowings | | Weighted Average Interest Rate on Borrowings Outstanding at end of period | | Weighted Average Remaining Maturity (days) | | Repurchase Agreement Borrowings | | Weighted Average Interest Rate on Borrowings Outstanding at end of period | | Weighted Average Remaining Maturity (days) |
| Short-Term Borrowings: | | | | | | | | | | | | |
| | | | | | | | | | | | |
| Agency RMBS | | $ | 1,048 | | | 1.05 | % | | 59 | | $ | 1,418 | | | 1.34 | % | | 59 |
| Non-Agency CMBS | | 10,314 | | | 1.75 | % | | 12 | | 10,313 | | | 2.25 | % | | 14 |
| | | | | | | | | | | | |
Residential Whole Loans (1) | | 41,013 | | | 2.66 | % | | 4 | | 29,800 | | | 3.71 | % | | 15 |
Residential Bridge Loans (1) | | 5,817 | | | 2.60 | % | | 4 | | 11,254 | | | 2.73 | % | | 36 |
Commercial Loans (1) | | 10,603 | | | 3.18 | % | | 4 | | 34,375 | | | 3.32 | % | | 75 |
| | | | | | | | | | | | |
| Membership Interest | | — | | | — | % | | 0 | | 18,844 | | | 2.90 | % | | 29 |
| Other Securities | | 2,587 | | | 3.52 | % | | 19 | | 2,594 | | | 4.51 | % | | 19 |
| Subtotal | | 71,382 | | | 2.60 | % | | 7 | | 108,598 | | | 3.19 | % | | 39 |
| Long-Term Borrowings: | | | | | | | | | | | | |
Non-Agency CMBS (2) | | 68,352 | | | 2.12 | % | | 193 | | 66,767 | | | 5.23 | % | | 126 |
| Non-Agency RMBS | | 15,632 | | | 2.12 | % | | 217 | | 14,643 | | | 5.23 | % | | 126 |
Residential Whole Loans (1)(3) | | 236,767 | | | 3.00 | % | | 36 | | 30,224 | | | 3.00 | % | | 278 |
| Commercial Loans | | 63,669 | | | 2.27 | % | | 360 | | 124,937 | | | 2.17 | % | | 287 |
| Other Securities | | 27,506 | | | 2.12 | % | | 217 | | 13,677 | | | 5.24 | % | | 126 |
| Subtotal | | 411,926 | | | 2.65 | % | | 113 | | 250,248 | | | 3.74 | % | | 225 |
| Repurchase Agreements Borrowings | | $ | 483,308 | | | 2.64 | % | | 98 | | $ | 358,846 | | | 3.57 | % | | 169 |
| Less Unamortized Debt Issuance Costs | | 40 | | | N/A | | N/A | | 1,923 | | | N/A | | N/A |
| Repurchase Agreements Borrowings, net | | $ | 483,268 | | | 2.64 | % | | 98 | | $ | 356,923 | | | 3.57 | % | | 169 |
(1)Repurchase agreement borrowings on loans owned are through trust certificates. The trust certificates are eliminated upon consolidation. This includes $39.3 million borrowings on the trust certificates would have been classified as Non-Agency RMBS.
(2)Includes repurchase agreement borrowings on securities eliminated upon VIE consolidation.
(3)Certain Residential Whole Loans and Commercial Loans were financed under 2 longer term repurchase agreements. The Residential Whole facility is 18 months and the Commercial Loan facility automatically rolls until such time as they are terminated or until certain conditions of default. Thefacility's maturity was extended one month in October 2021.The weighted average remaining maturity days was calculated using expected weighted life ofreflects the underlying collateral.
(4)Repurchase agreement borrowings on subordinate securities owned in the consolidated securitizations are reflected in Non-Agency CMBS for the nine months ended September 30, 2020one month extension.
At September 30, 20202021 and December 31, 2019,2020, repurchase agreements collateralized by investments had the following remaining maturities:
| | | | | | | | | | | |
| (dollars in thousands) | September 30, 2020 | | December 31, 2019 |
| | | |
| 1 to 29 days | $ | 47,864 | | | $ | 1,480,286 | |
| 30 to 59 days | 18,195 | | | 552,786 | |
| 60 to 89 days | 37,495 | | | 255,814 | |
| | | |
| Greater than or equal to 90 days | 255,324 | | | 535,991 | |
| Total | $ | 358,878 | | | $ | 2,824,877 | |
| | | | | | | | | | | |
| (dollars in thousands) | September 30, 2021 | | December 31, 2020 |
| | | |
| 1 to 29 days | $ | 307,487 | | | $ | 59,856 | |
| 30 to 59 days | — | | | 13,421 | |
| 60 to 89 days | 12,181 | | | 35,321 | |
| | | |
| Greater than or equal to 90 days | 163,640 | | | 250,248 | |
| Total | $ | 483,308 | | | $ | 358,846 | |
At September 30, 2020,2021, the following table reflects amounts of collateral at risk under its repurchase agreements greater than 10% of the Company's equity with any counterparty (dollars in thousands):
| | | | | September 30, 2020 | | | September 30, 2021 |
| Counterparty | Counterparty | | Amount of Collateral at Risk, at fair value | | Weighted Average Remaining Maturity (days) | | Percentage of Stockholders’ Equity | Counterparty | | Amount of Collateral at Risk, at fair value | | Weighted Average Remaining Maturity (days) | | Percentage of Stockholders’ Equity |
| Citigroup Global Markets Inc. | | Citigroup Global Markets Inc. | | $ | 85,627 | | | 202 | | 40.7 | % |
| Credit Suisse AG, Cayman Islands Branch | Credit Suisse AG, Cayman Islands Branch | | $ | 202,428 | | | 312 | | 81.7 | % | Credit Suisse AG, Cayman Islands Branch | | 76,778 | | | 71 | | 36.5 | % |
| Citigroup Global Markets Inc. | | 109,454 | | | 218 | | 44.2 | % | |
| Nomura Securities International, Inc. | | 37,999 | | | 63 | | 15.3 | % | |
| |
Collateral for Borrowings under Repurchase Agreements
The following table summarizes the Company’s collateral positions, with respect to its borrowings under repurchase agreements at September 30, 20202021 and December 31, 20192020 (dollars in thousands):
| | | | | | | | | | | | | | | | | | | | | | | | | | | | | | | | | | | |
| | September 30, 2020 | | December 31, 2019 |
| | Assets Pledged | | Accrued Interest | | Assets Pledged and Accrued Interest | | Assets Pledged | | Accrued Interest | | Assets Pledged and Accrued Interest |
| Assets pledged for borrowings under repurchase agreements: | | | | | | | | | | | |
| Agency CMBS, at fair value | $ | 0 | | | $ | 0 | | | $ | 0 | | | $ | 1,400,230 | | | $ | 3,916 | | | $ | 1,404,146 | |
| Agency RMBS, at fair value | 1,853 | | | 61 | | | 1,914 | | | 356,687 | | | 1,336 | | | 358,023 | |
Non-Agency CMBS, at fair value(1) | 165,699 | | | 734 | | | 166,433 | | | 246,797 | | | 951 | | | 247,748 | |
| Non-Agency RMBS, at fair value | 25,817 | | | 277 | | | 26,094 | | | 45,816 | | | 414 | | | 46,230 | |
Residential Whole Loans, at fair value(2) | 105,059 | | | 564 | | | 105,623 | | | 529,495 | | | 3,704 | | | 533,199 | |
Residential Bridge Loans(2) | 16,828 | | | 301 | | | 17,129 | | | 34,897 | | | 471 | | | 35,368 | |
Commercial Loans, at fair value(2)(6) | 325,651 | | | 1,817 | | | 327,468 | | | 350,213 | | | 1,855 | | | 352,068 | |
Securitized commercial loans, at fair value (2) | 0 | | | 0 | | | 0 | | | 171,640 | | | 674 | | | 172,314 | |
Membership interest(5) | 33,495 | | | n/a | | 33,495 | | | 0 | | | n/a | | 0 | |
| Other securities, at fair value | 41,055 | | | 55 | | | 41,110 | | | 80,031 | | | 128 | | | 80,159 | |
Cash (3) | 502 | | | — | | | 502 | | | 43,499 | | | — | | | 43,499 | |
| Total | $ | 715,959 | | | $ | 3,809 | | | $ | 719,768 | | | $ | 3,259,305 | | | $ | 13,449 | | | $ | 3,272,754 | |
| | | | | | | | | | | | | | | | | | | | | | | | | | | | | | | | | | | |
| | September 30, 2021 | | December 31, 2020 |
| | Assets Pledged | | Accrued Interest | | Assets Pledged and Accrued Interest | | Assets Pledged | | Accrued Interest | | Assets Pledged and Accrued Interest |
| Assets pledged for borrowings under repurchase agreements: | | | | | | | | | | | |
| | | | | | | | | | | |
| Agency RMBS, at fair value | $ | 1,342 | | | $ | 20 | | | $ | 1,362 | | | $ | 1,708 | | | $ | 49 | | | $ | 1,757 | |
Non-Agency CMBS, at fair value(1) | 136,968 | | | 564 | | | 137,532 | | | 152,275 | | | 649 | | | 152,924 | |
| Non-Agency RMBS, at fair value | 28,003 | | | 182 | | | 28,185 | | | 25,382 | | | 160 | | | 25,542 | |
Residential Whole Loans, at fair value(2) | 328,811 | | | 1,494 | | | 330,305 | | | 97,566 | | | 543 | | | 98,109 | |
Residential Bridge Loans(2) | 5,960 | | | 78 | | | 6,038 | | | 12,960 | | | 180 | | | 13,140 | |
Commercial Loans, at fair value(2) | 101,271 | | | 346 | | | 101,617 | | | 310,523 | | | 1,850 | | | 312,373 | |
| | | | | | | | | | | |
Membership interest(3) | — | | | n/a | | — | | | 33,690 | | | — | | | 33,690 | |
| Other securities, at fair value | 52,093 | | | 82 | | | 52,175 | | | 48,754 | | | 44 | | | 48,798 | |
Cash(4) | 1,428 | | | — | | | 1,428 | | | 1,817 | | | — | | | 1,817 | |
| Total | $ | 655,876 | | | $ | 2,766 | | | $ | 658,642 | | | $ | 684,675 | | | $ | 3,475 | | | $ | 688,150 | |
(1)Includes securities eliminated upon VIE consolidation.
(2)Loans owned through trust certificates are pledged as collateral. The trust certificates are eliminated upon consolidation.
(3)Cash posted as collateral is included in "Due from counterparties" in the Company’s Consolidated Balance Sheets.
(4)Included in the Non-Agency CMBS securities pledged is the Company’s investment in the trust certificate of CSMC USA (F Class). As of September 30, 2020, the fair value of this investment is $9.4 million which is eliminated in the consolidation.
(5)The pledged amount relates to the Company's non-controlling membership interest in its wholly ownedwholly-owned subsidiary WMC RETL LLC, which was financed under a repurchase agreement. The membership interest is eliminated in consolidation.
(6)(4)The assets pledgedCash posted as collateral are the subordinate interestsis included in "Due from counterparties" in the securitization. For the none months ended September 30, 2020 the assets pledged are reflected in Agency CMBS instead of securitized commercial loans.Company’s Consolidated Balance Sheets.
A reduction in the value of pledged assets typically results in the repurchase agreement counterparties initiating a margin call. At September 30, 20202021 and December 31, 2019,2020, investments held by counterparties as security for repurchase agreements totaled approximately $715.5$654.4 million and $3.2 billion,$682.9 million, respectively. Cash collateral held by counterparties at September 30, 20202021 and December 31, 20192020 was approximately $502 thousand$1.4 million and $43.5$1.8 million, respectively. Cash posted by repurchase agreement counterparties at September 30, 20202021 and December 31, 2019,2020, was approximately $16 thousand$0 and $709$320 thousand, respectively.
Convertible Senior Unsecured Notes
Table of Contents6.75% Convertible Senior Unsecured Notes due 2024 (the "2024 Notes")
AtIn September 30, 2020,2021, the Company had $200.0issued $86.3 million aggregate principal amount of 6.75% convertible senior unsecured notes outstanding through three issuances.the 2024 Notes for net proceeds of $83.4 million. Interest on the notes2024 Notes is paid semiannually. The notes2024 Notes are convertible into, at the Company's election, cash, shares of the Company's common stock or a combination of both, subject to the satisfaction of certain conditions and during specified periods. The conversion rate is subject to adjustment upon the occurrence of certain specified events and the holders may require the Company to repurchase all or any portion of their notes for cash equal to 100% of the principal amount of the notes,2024 Notes, plus accrued and unpaid interest, if the Company undergoes a fundamental change as specified in the agreement.
supplemental indenture for the 2024 Notes. The initial conversion rate was 337.9520 shares of common stock per $1,000 principal amount of notes and represented a conversion price of $2.96 per share of common stock. The 2024 Notes mature on September 15, 2024, unless earlier converted, redeemed or repurchased by the holders pursuant to their terms, and are not redeemable by the Company except during the final three months prior to maturity.
6.75% Convertible Senior Unsecured Notes due 2022 (the "2022 Notes")
At September 30, 2021 and December 31, 2020, the Company had $45.7 million and $175.0 million aggregate principal amount, respectively, of the 2022 Notes outstanding through 3 issuances. Interest on the 2022 Notes is paid semiannually. The 2022 Notes are convertible into, at the Company's election, cash, shares of the Company's common stock or a combination of both, subject to the satisfaction of certain conditions and during specified periods. The conversion rate is subject to adjustment upon the occurrence of certain specified events and the holders may require the Company to repurchase all or any portion of their notes for cash equal to 100% of the principal amount of the 2022 Notes, plus accrued and unpaid interest, if the Company undergoes a fundamental change as specified in the supplemental indenture for the 2022 Notes. The initial and current conversion rate was 83.1947 shares of common stock per $1,000 principal amount of notes and represented a conversion price of $12.02 per share of common stock. The notes2022 Notes mature on October 1, 2022, unless earlier converted, redeemed or repurchased by the holders pursuant to their terms, and are not redeemable by usthe Company except during the final three months prior to maturity.
The 2022 Notes Exchanges and Repurchases
On July 1, 2020, the Company issued an aggregate of 1,354,084 shares of its common stock, par value $0.01 per share (the “Common Stock”), in exchange for $5.0 million aggregate principal amount of its 6.75% Convertible Seniorthe 2022 Notes due 2022 (the “Notes”) pursuant to separate privately negotiated exchange agreements entered into on July 1, 2020 (collectively, the “Exchange Agreement”) between the Company and certain holders of the 2022 Notes. The Company did not receive any cash proceeds as a result of the Exchange Agreement, and the Notes exchanged pursuant to the Exchange Agreement were retired and cancelled. The common stock was issued in reliance upon the exemption set forth in Section 3(a)(9) of the Securities Act of 1933 for securities exchanged by the Company and an existing security holder where no commission or other remuneration is paid or given directly or indirectly by the Company for soliciting such exchange.
During the quarter ended December 31, 2020, the Company repurchased $25.0 million aggregate principal amount of the 2022 Notes at an approximate 13% discount to par value, plus accrued and unpaid interest.
During the quarter ended March 31, 2021, the Company repurchased $6.7 million aggregate principal amount of the 2022 Notes at an approximate 6.3% discount to par value, plus accrued and unpaid interest.
During August 2021, the Company repurchased $22.3 million aggregate principal amount of the 2022 Notes at an approximate 2.8% discount to par value, plus accrued and unpaid interest.
In addition, in September 2021, the Company used the net proceeds from the issuance of the 2024 Notes and $20.2 million in cash on hand to repurchase $100.3 million of the 2022 Notes at par, plus accrued and unpaid interest.
Securitized Debt
Commercial Mortgage-Backed Notes
RETL 2019 Trust
The following table summarizes RETL 2019 Trust's commercial mortgage pass-through certificates at September 30, 2020 (dollars in thousands):
| | | | | | | | | | | | | | |
| Classes | Principal Balance | Coupon | Fair Value | Contractual Maturity |
| Class A | $ | 34,022 | | 1.3% | $ | 34,024 | | 3/15/2021 |
| Class B | 101,200 | | 1.7% | 96,085 | | 3/15/2021 |
| Class C | 308,400 | | 2.3% | 282,831 | | 3/15/2021 |
| | | | |
Class X-EXT(1) | N/A | 1.2% | 31 | | 3/15/2021 |
| $ | 443,622 | | | $ | 412,971 | | |
| | | | |
| | | | |
| | | | |
| | | | |
(1) Class X-EXT is an interest-only class with an initial notional balance of $308.4 million.
At September 30, 2020, the Company owned the entire class of HRR certificates with a fair value of $41.7 million, which is eliminated in consolidation and the remaining RETL debt with a fair value of $413.0 million is recorded in "Securitized debt, net" in the Consolidated Balance Sheets. The outstanding principal balance of the Securitized debt of $443.6 million, excluding the interest-only debt securities, $47.5 million is owned by related parties and $396.1 million is owned by third parties. The securitized debt of the RETL 2019 Trust can only be settled with the commercial loan with an outstanding principal balance of approximately $488.9 million at September 30, 2020, that serves as collateral for the securitized debt and is non-recourse to the Company. The Company has chosen to make the fair value election pursuant to ASC 825 for the debt and accordingly the periodic change in fair value are recorded in current period earnings in the Consolidated Statements of Operations as a component of "Unrealized gain (loss), net."
CSMC 2014 USA
The following table summarizes CSMC 2014 USA's commercial mortgage pass-through certificates at September 30, 20202021 (dollars in thousands):
| | | | | | | | | | | | | | |
| Classes | Principal Balance | Coupon | Fair Value | Contractual Maturity |
| Class A-1 | 124,076 | | 3.3 | % | 124,648 | | 9/11/2025 |
| Class A-2 | 531,700 | | 4.0 | % | 541,905 | | 3/15/2021 |
| Class B | 136,400 | | 4.2 | % | 122,802 | | 9/11/2025 |
| Class C | 94,500 | | 4.3 | % | 80,348 | | 9/11/2025 |
| Class D | 153,950 | | 4.4 | % | 117,058 | | 9/11/2025 |
| Class E | 180,150 | | 4.4 | % | 122,585 | | 9/11/2025 |
| Class F | 153,600 | | 4.4 | % | 96,808 | | 9/11/2025 |
Class X-1(1) | n/a | 0.5 | % | 14,638 | | 9/11/2025 |
Class X-2(1) | n/a | 0.4 | % | 2,697 | | 9/11/2025 |
| $ | 1,374,376 | | | $ | 1,223,489 | | |
| | | | |
| | | | |
| | | | |
| | | | |
| | | | | | | | | | | | | | |
| Classes | Principal Balance | Coupon | Fair Value | Contractual Maturity |
| Class A-1 | $ | 120,391 | | 3.3 | % | $ | 126,264 | | 9/11/2025 |
| Class A-2 | 531,700 | | 4.0 | % | 570,167 | | 9/11/2025 |
| Class B | 136,400 | | 4.2 | % | 138,562 | | 9/11/2025 |
| Class C | 94,500 | | 4.3 | % | 92,630 | | 9/11/2025 |
| Class D | 153,950 | | 4.4 | % | 142,388 | | 9/11/2025 |
| Class E | 180,150 | | 4.4 | % | 161,900 | | 9/11/2025 |
| Class F | 153,600 | | 4.4 | % | 118,664 | | 9/11/2025 |
Class X-1(1) | N/A | 0.5 | % | 12,347 | | 9/11/2025 |
Class X-2(1) | N/A | 0.03 | % | 2,572 | | 9/11/2025 |
| $ | 1,370,691 | | | $ | 1,365,494 | | |
| | | | |
| | | | |
| | | | |
| | | | |
(1) Class X-1 and X-2 are interest-only classes with notional balances of $655.8$652.1 million and $733.5 million as of September 30, 2020,2021, respectively.
At September 30, 2020,2021, the Company owned $14.9 milliona portion of the class F certificates with an outstanding principal with a fair valuebalance of $9.4$14.9 million, which is eliminated in consolidation and theconsolidation. The remaining CSMC USA debt withfor which the Company elected the fair value option had a fair value of $1.2$1.4 billion at September 30, 2021, and is recorded in "Securitized debt, net" in the Consolidated Balance Sheets. Of the remaining outstanding principal balance of approximately $1.4 billion, $208.2approximately $201.6 million is owned by related parties and approximately $1.2 billion is owned by third parties. The securitized debt of the CSMC USA can only be settled with the commercial loan with an outstanding principal balance of approximately $1.4 billion at September 30, 2020,2021, that serves as collateral for the securitized debt and is non-recourse to the Company. The Company has chosen to make the fair value election pursuant to ASC 825 for the debt and accordingly the periodic change in fair value are recorded in current period earnings in the Consolidated Statements of Operations as a component of "Unrealized gain (loss), net."
Residential Mortgage-Backed Notes
Arroyo Trust 2019
In May 2019, the Company completed a residential mortgage-backed securitization comprised of $945.5 million of Non-QM Residential Whole Loans, issuing $919.0 million of mortgage-backed notes. The Company did not elect the fair value option for these notes and accordingly they are recorded at their principal balance less unamortized deferred financing cost and classified in "Securitized debt, net" in the Consolidated Balance Sheets. The following table summarizes the issued Arroyo Trust'sTrust 2019's residential mortgage pass-through certificates at September 30, 20202021 (dollars in thousands):
| | | | | | | | | | | | | | |
| Classes | Principal Balance | Coupon | Carrying Value | Contractual Maturity |
| Offered Notes: | | | | |
| Class A-1 | $ | 552,779 | | 3.3% | $ | 552,777 | | 4/25/2049 |
| Class A-2 | 29,619 | | 3.5% | 29,618 | | 4/25/2049 |
| Class A-3 | 46,925 | | 3.8% | 46,924 | | 4/25/2049 |
| Class M-1 | 25,055 | | 4.8% | 25,055 | | 4/25/2049 |
| Subtotal | $ | 654,378 | | | $ | 654,374 | | |
| Less: Unamortized Deferred Financing Costs | N/A | | 4,625 | | |
| Total | $ | 654,378 | | | $ | 649,749 | | |
| | | | | | | | | | | | | | |
| Classes | Principal Balance | Coupon | Carrying Value | Contractual Maturity |
| Offered Notes: | | | | |
| Class A-1 | $ | 330,944 | | 3.3% | $ | 330,944 | | 4/25/2049 |
| Class A-2 | 17,740 | | 3.5% | 17,740 | | 4/25/2049 |
| Class A-3 | 28,106 | | 3.8% | 28,106 | | 4/25/2049 |
| Class M-1 | 25,055 | | 4.8% | 25,055 | | 4/25/2049 |
| Subtotal | $ | 401,845 | | | $ | 401,845 | | |
| Less: Unamortized Deferred Financing Costs | N/A | | 3,727 | | |
| Total | $ | 401,845 | | | $ | 398,118 | | |
The Company retained the non-offered securities in the securitization, which include the class B, Class A-IO-S and Class XS certificates. These non-offered securities with an estimated fair value of $43.7 million at September 30, 2020 were eliminated in the consolidation. The securitized debt of the Arroyo Trust 2019 can only be settled with the residential loans that serve as collateral for the securitized debt and is non-recourse to the Company. At September 30, 2021, Residential Whole Loans, with an outstanding principal balance of approximately $414.0
as collateral for the securitized debt and is non-recourse to the Company. At September 30, 2020, Residential Whole Loans, with an outstanding principal balance of approximately $668.7 million, serve as collateral for the Arroyo Trust'sTrust 2019's securitized debt. The Company may redeem the offered notes on or after the earlier of (i) the three-year anniversary of the closing date or ii) the date on which the aggregate collateral balance is 20% of the original principal balance. The notes are redeemable at their face value plus accrued interest.
Arroyo Trust 2020
In June 2020, the Company completed a residential mortgage-backed securitization comprised of $355.8 million of Non-QM Residential Whole Loans, issuing $341.7 million of mortgage-backed notes. The Company did not elect the fair value option for these notes and accordingly they are recorded at their principal balance less unamortized deferred financing cost and classified in "Securitized debt, net" in the Consolidated Balance Sheets. The following table summarizes the issued Arroyo Trust 2020's residential mortgage pass-through certificates at September 30, 20202021 (dollars in thousands):
| | | | | | | | | | | | | | |
| Classes | Principal Balance | Coupon | Carrying Value | Contractual Maturity |
| Offered Notes: | | | | |
| Class A-1A | $ | 246,807 | | 1.7% | $ | 246,801 | | 3/25/2055 |
| Class A-1B | 29,287 | | 2.1% | 29,286 | | 3/25/2055 |
| Class A-2 | 13,518 | | 2.9% | 13,517 | | 3/25/2055 |
| Class A-3 | 17,963 | | 3.3% | 17,963 | | 3/25/2055 |
| Class M-1 | 11,739 | | 4.3% | 11,739 | | 3/25/2055 |
| Subtotal | $ | 319,314 | | | $ | 319,306 | | |
| Less: Unamortized Deferred Financing Costs | N/A | | 2,606 | | |
| Total | $ | 319,314 | | | $ | 316,700 | | |
| | | | | | | | | | | | | | |
| Classes | Principal Balance | Coupon | Carrying Value | Contractual Maturity |
| Offered Notes: | | | | |
| Class A-1A | $ | 148,244 | | 1.7% | $ | 148,244 | | 3/25/2055 |
| Class A-1B | 17,591 | | 2.1% | 17,591 | | 3/25/2055 |
| Class A-2 | 13,518 | | 2.9% | 13,518 | | 3/25/2055 |
| Class A-3 | 17,963 | | 3.3% | 17,963 | | 3/25/2055 |
| Class M-1 | 11,739 | | 4.3% | 11,739 | | 3/25/2055 |
| Subtotal | $ | 209,055 | | | $ | 209,055 | | |
| Less: Unamortized Deferred Financing Costs | N/A | | 2,154 | | |
| Total | $ | 209,055 | | | $ | 206,901 | | |
The Company retained the non-offered securities in the securitization, which include the Class B, Class A-IO-S and Class XS certificates. These non-offered securities with an estimated fair value of $29.5 million at September 30, 2020 were eliminated in the consolidation. The securitized debt of the Arroyo Trust 2020 can only be settled with the residential loans that serve as collateral for the securitized debt and is non-recourse to the Company. At September 30, 20202021, Residential Whole Loans, with an outstanding principal balance of approximately $329.7$216.4 million serve as collateral for the Arroyo Trust 2020's securitized debt. The Company may redeem the offered notes on or after the earlier of (i) the three-year anniversary of the closing date or ii)(ii) the date on which the aggregate collateral balance is equal to or less than 30% of the original principal balance. The notes are redeemable at their face value plus accrued interest.
Note 8 — Derivative Instruments
The Company’s derivatives may include interest rate swaps, swaptions, options, futures contracts, TBAs, Agency and Non-Agency Interest-Only Strips that are classified as derivatives, credit default swaps and total return swaps.
In MarchThe following table summarizes the Company’s derivative instruments at September 30, 2021 and December 31, 2020 the Company terminated fixed-pay interest rate swaps with a notional value of approximately $3.1 billion and variable-pay interest rate with a notional value of approximately $1.9 billion to reduce hedging costs and associated margin volatility.(dollars in thousands):
| | | | | | | | | | | | | | | | | | | | | | | | | | | | | | | | | | | | | | | | | | | | |
| | | | | | | September 30, 2021 | | December 31, 2020 |
| Derivative Instrument | | Accounting Designation | | Consolidated Balance Sheets Location | | Notional Amount | | Fair Value | | | | Notional Amount | | Fair Value | | |
| | | | | | | | | | | | | | | | |
| | | | | | | | | | | | | | | | |
| | | | | | | | | | | | | | | | |
| | | | | | | | | | | | | | | | |
| | | | | | | | | | | | | | | | |
| | | | | | | | | | | | | | | | |
| Credit default swaps, asset | | Non-Hedge | | Derivative assets, at fair value | | 2,030 | | | $ | 94 | | | | | 2,030 | | | $ | 161 | | | |
| | | | | | | | | | | | | | | | |
| Total derivative instruments, assets | | | | | | | | 94 | | | | | | | 161 | | | |
| | | | | | | | | | | | | | | | |
| Interest rate swaps, liability | | Non-Hedge | | Derivative liability, at fair value | | 22,000 | | | (25) | | | | | — | | | — | | | |
| | | | | | | | | | | | | | | | |
| | | | | | | | | | | | | | | | |
| | | | | | | | | | | | | | | | |
| | | | | | | | | | | | | | | | |
| Credit default swaps, liability | | Non-Hedge | | Derivative liability, at fair value | | 4,140 | | | (537) | | | | | 4,140 | | | (656) | | | |
| | | | | | | | | | | | | | | | |
| Total derivative instruments, liabilities | | | | | | | | (562) | | | | | | | (656) | | | |
| Total derivative instruments, net | | | | | | | | $ | (468) | | | | | | | $ | (495) | | | |
The following table summarizes the Company’s derivative instruments at September 30, 2020 and December 31, 2019 (dollars in thousands):
| | | | | | | | | | | | | | | | | | | | | | | | | | | | | | | | | | | | | | | | | | | | |
| | | | | | | September 30, 2020 | | December 31, 2019 |
| Derivative Instrument | | Accounting Designation | | Consolidated Balance Sheets Location | | Notional Amount | | Fair Value | | | | Notional Amount | | Fair Value | | |
| Interest rate swaps, asset | | Non-Hedge | | Derivative assets, at fair value | | $ | 0 | | | $ | 0 | | | | | $ | 2,701,000 | | | $ | 3,017 | | | |
| | | | | | | | | | | | | | | | |
| | | | | | | | | | | | | | | | |
| | | | | | | | | | | | | | | | |
| | | | | | | | | | | | | | | | |
| | | | | | | | | | | | | | | | |
| Credit default swaps, asset | | Non-Hedge | | Derivative assets, at fair value | | 2,030 | | | 481 | | | | | 60,100 | | | 948 | | | |
| TBA securities, asset | | Non-Hedge | | Derivative assets, at fair value | | 0 | | | 0 | | | | | 1,000,000 | | | 1,146 | | | |
| Total derivative instruments, assets | | | | | | | | 481 | | | | | | | 5,111 | | | |
| | | | | | | | | | | | | | | | |
| Interest rate swaps, liability | | Non-Hedge | | Derivative liability, at fair value | | 0 | | | 0 | | | | | 1,255,000 | | | (501) | | | |
| | | | | | | | | | | | | | | | |
| | | | | | | | | | | | | | | | |
| | | | | | | | | | | | | | | | |
| | | | | | | | | | | | | | | | |
| Credit default swaps, liability | | Non-Hedge | | Derivative liability, at fair value | | 4,140 | | | (1,166) | | | | | 90,900 | | | (3,795) | | | |
| TBA securities, liability | | Non-Hedge | | Derivative liability, at fair value | | 0 | | | 0 | | | | | 1,000,000 | | | (2,074) | | | |
| Total derivative instruments, liabilities | | | | | | | | (1,166) | | | | | | | (6,370) | | | |
| Total derivative instruments, net | | | | | | | | $ | (685) | | | | | | | $ | (1,259) | | | |
The following tables summarize the effects of the Company’s derivative positions, including Interest-Only Strips characterized as derivatives and TBAs, which are reported in "Gain (loss) on derivative instruments, net" in the Consolidated Statements of Operations for the three and nine months ended September 30, 20202021 and September 30, 20192020 (dollars in thousands):
| | | | | | | | | | | | | | | | | | | | | | | | | | | | | | | | | | | | | | |
| | Realized Gain (Loss), net | | | | | | | | |
| Description | | Other Settlements / Expirations | | Variation Margin Settlement | | Return (Recovery) of Basis | | Mark-to-Market | | Contractual interest income (expense), net(1) | | Total |
| Three months ended September 30, 2021 | | | | | | | | | | | | |
| Interest rate swaps | | $ | — | | | $ | 485 | | | $ | — | | | $ | (71) | | | $ | 96 | | | $ | 510 | |
| | | | | | | | | | | | |
| Interest-Only Strips— accounted for as derivatives | | — | | | — | | | (59) | | | (90) | | | 82 | | | (67) | |
| | | | | | | | | | | | |
| | | | | | | | | | | | |
| | | | | | | | | | | | |
| | | | | | | | | | | | |
| | | | | | | | | | | | |
| Credit default swaps | | 16 | | | — | | | — | | | 56 | | | — | | | 72 | |
| | | | | | | | | | | | |
| Total | | $ | 16 | | | $ | 485 | | | $ | (59) | | | $ | (105) | | | $ | 178 | | | $ | 515 | |
| | | | | | | | | | | | |
| | | | | | | | | | | | |
| Three months ended September 30, 2020 | | | | | | | | | | | | |
| | | | | | | | | | | | |
| | | | | | | | | | | | |
| Interest-Only Strips— accounted for as derivatives | | $ | — | | | $ | — | | | $ | (166) | | | $ | 71 | | | $ | 200 | | | $ | 105 | |
| | | | | | | | | | | | |
| | | | | | | | | | | | |
| | | | | | | | | | | | |
| | | | | | | | | | | | |
| Credit default swap | | 166 | | | — | | | — | | | (359) | | | — | | | (193) | |
| | | | | | | | | | | | |
| Total | | $ | 166 | | | $ | — | | | $ | (166) | | | $ | (288) | | | $ | 200 | | | $ | (88) | |
| | | Realized Gain (Loss), net | | | Realized Gain (Loss), net | |
| Description | Description | | Other Settlements / Expirations | | Variation Margin Settlement | | Return (Recovery) of Basis | | Mark-to-Market | | Contractual interest income (expense), net(1) | | Total | Description | | Other Settlements / Expirations | | Variation Margin Settlement | | Return (Recovery) of Basis | | Mark-to-Market | | Contractual interest income (expense), net(1) | | Total |
| Three months ended September 30, 2020 | | | | | | | | | | | | | |
| | Nine months ended September 30, 2021 | | Nine months ended September 30, 2021 | | | | | | | | | | | | |
| Interest rate swaps | | Interest rate swaps | | $ | — | | | $ | 520 | | | $ | — | | | $ | (25) | | | $ | 172 | | | $ | 667 | |
| | Interest-Only Strips— accounted for as derivatives | Interest-Only Strips— accounted for as derivatives | | $ | 0 | | | $ | — | | | $ | (166) | | | $ | 71 | | | $ | 200 | | | $ | 105 | | Interest-Only Strips— accounted for as derivatives | | — | | | — | | | (232) | | | (124) | | | 305 | | | (51) | |
| | Credit default swaps | Credit default swaps | | 166 | | | — | | | — | | | (359) | | | — | | | (193) | | Credit default swaps | | 48 | | | — | | | — | | | 52 | | | — | | | 100 | |
| | Total | Total | | $ | 166 | | | $ | 0 | | | $ | (166) | | | $ | (288) | | | $ | 200 | | | $ | (88) | | Total | | $ | 48 | | | $ | 520 | | | $ | (232) | | | $ | (97) | | | $ | 477 | | | $ | 716 | |
| | | Three months ended September 30, 2019 | | |
| Nine months ended September 30, 2020 | | Nine months ended September 30, 2020 | |
| Interest rate swaps | Interest rate swaps | | $ | (123) | | | $ | (56,121) | | | $ | 1,655 | | | $ | 3,289 | | | $ | 60 | | | $ | (51,240) | | Interest rate swaps | | $ | (262) | | | $ | (179,759) | | | $ | 262 | | | $ | (2,515) | | | $ | (1,395) | | | $ | (183,669) | |
| Interest rate swaptions | Interest rate swaptions | | (332) | | | — | | | — | | | 176 | | | — | | | (156) | | Interest rate swaptions | | 80 | | | — | | | — | | | — | | | — | | | 80 | |
| Interest-Only Strips— accounted for as derivatives | Interest-Only Strips— accounted for as derivatives | | — | | | — | | | (590) | | | (420) | | | 723 | | | (287) | | Interest-Only Strips— accounted for as derivatives | | (940) | | | — | | | (982) | | | (512) | | | 1,176 | | | (1,258) | |
| Options | | 1,378 | | | — | | | — | | | (470) | | | — | | | 908 | | |
| Futures contracts | | 3,620 | | | — | | | — | | | (710) | | | — | | | 2,910 | | |
| | | Credit default swap | Credit default swap | | 175 | | | — | | | — | | | 634 | | | — | | | 809 | | Credit default swap | | (9,550) | | | — | | | — | | | (2,023) | | | — | | | (11,573) | |
| | TBAs | | TBAs | | (2,430) | | | — | | | — | | | 928 | | | — | | | (1,502) | |
| Total | Total | | $ | 4,718 | | | $ | (56,121) | | | $ | 1,065 | | | $ | 2,499 | | | $ | 783 | | | $ | (47,056) | | Total | | $ | (13,102) | | | $ | (179,759) | | | $ | (720) | | | $ | (4,122) | | | $ | (219) | | | $ | (197,922) | |
| | | | | | | | | | | | | | | | | | | | | | | | | | | | | | | | | | | | | | |
| | Realized Gain (Loss), net | | | | | | | | |
| Description | | Other Settlements / Expirations | | Variation Margin Settlement | | Return (Recovery) of Basis | | Mark-to-Market | | Contractual interest income (expense), net(1) | | Total |
| Nine months ended September 30, 2020 | | | | | | | | | | | | |
| Interest rate swaps | | $ | (262) | | | $ | (179,759) | | | $ | 262 | | | $ | (2,515) | | | $ | (1,395) | | | $ | (183,669) | |
| Interest rate swaptions | | 80 | | | — | | | — | | | 0 | | | — | | | 80 | |
| Interest-Only Strips— accounted for as derivatives | | (940) | | | — | | | (982) | | | (512) | | | 1,176 | | | (1,258) | |
| | | | | | | | | | | | |
| | | | | | | | | | | | |
| | | | | | | | | | | | |
| | | | | | | | | | | | |
| | | | | | | | | | | | |
| Credit default swaps | | (9,550) | | | — | | | — | | | (2,023) | | | — | | | (11,573) | |
| TBAs | | (2,430) | | | — | | | — | | | 928 | | | — | | | (1,502) | |
| Total | | $ | (13,102) | | | $ | (179,759) | | | $ | (720) | | | $ | (4,122) | | | $ | (219) | | | $ | (197,922) | |
| | | | | | | | | | | | |
| | | | | | | | | | | | |
| Nine months ended September 30, 2019 | | | | | | | | | | | | |
| Interest rate swaps | | $ | (714) | | | $ | (152,559) | | | $ | 4,859 | | | $ | (453) | | | $ | 4,989 | | | $ | (143,878) | |
| Interest rate swaptions | | (332) | | | — | | | — | | | 0 | | | — | | | (332) | |
| Interest-Only Strips— accounted for as derivatives | | — | | | — | | | (1,840) | | | (460) | | | 2,326 | | | 26 | |
| Options | | 1,378 | | | — | | | — | | | 0 | | | — | | | 1,378 | |
| Futures contracts | | (6,720) | | | — | | | — | | | 3,947 | | | — | | | (2,773) | |
| | | | | | | | | | | | |
| | | | | | | | | | | | |
| | | | | | | | | | | | |
| Credit default swap | | (414) | | | — | | | — | | | 259 | | | — | | | (155) | |
| | | | | | | | | | | | |
| Total | | $ | (6,802) | | | $ | (152,559) | | | $ | 3,019 | | | $ | 3,293 | | | $ | 7,315 | | | $ | (145,734) | |
At September 30, 20202021 and December 31, 2019,2020, the Company had cash pledged as collateral for derivatives of approximately $690$1.4 million and $510 thousand, and $55.4 million, respectively, which is reported in "Due from counterparties" in the Consolidated Balance Sheets.
Interest rate swaps and interest rate swaptions
The Company enters intouses interest rate swaps and interest rate swaptions to mitigate its exposure to higher short-term interest rates in connection with its repurchase agreements. Interest rate swaps generally involve the receipt of variable-rate amounts from a counterparty in exchange for the Company making fixed-rate payments over the life of the interest rate swap without exchange of the underlying notional amount. Notwithstanding the foregoing, in order to manage its hedge position with regard to its liabilities, the Company on occasion will enter into interest rate swaps which involve the receipt of fixed-rate amounts from a counterparty in exchange for the Company making variable-rate payments over the life of the interest rate swap without exchange of the underlying notional amount. The Company also enters into forward starting swaps and interest rate swaptions to help mitigate the effects of changes in interest rates on a portion of its borrowings under repurchase agreements. Interest rate swaptions provide the Company the option to enter into an interest rate swap agreement for a predetermined notional amount, stated term and pay and receive interest rates in the future. The Company generally enters into MAC (Market Agreed Coupon) interest rate swaps in which it may receive or make a payment at the time of entering such interest rate swap to compensate for the out of the market nature of such interest rate swap. Similar to all other interest rate swaps, these interest rate swaps are also subject to margin requirements.
The Company has not elected to account for its interest rate swaps as “hedges” under GAAP, accordingly the change in fair value of the interest rate swaps not designated in hedging relationships are recorded together with periodic net interest settlement amounts in "Gain (loss) on derivatives instruments, net" in the Consolidated Statements of Operations.
Interest Rate Swaps
From time to time, the Company may enter into interest rate swaps. During the nine months ended September 30, 2021, the Company entered into a fixed-pay interest rate swap and a variable-pay interest rate swap with notional amounts of $22.0 million and $56.5 million, respectively. The Company terminated the variable-pay interest rate swap during the three months ended September 30, 2021.
In March 2020, the Company terminated fixed-pay interest rate swaps with a notional value of approximately $3.1 billion and variable-pay interest rate swaps with a notional value of approximately $1.9 billion to reduce hedging costs and associated margin volatility. As of December 31, 2020, the Company did not have any interest rate swaps in its holdings at September 30, 2020. derivative holdings.
The following tables providetable provides additional information on our fixed pay interest rate swaps and the variable payCompany's fixed-pay interest rate swap as of December 31, 2019September 30, 2021 (dollars in thousands):
| | | | | | | | | | | | | | | | | | | | | | | | | | | | |
| | | December 31, 2019 |
| Fixed Pay Interest Rate Swap Remaining Term | | Notional Amount | | Average Fixed Pay Rate | | Average Floating Receive Rate | | Average Maturity (Years) | | |
| 1 year or less | | $ | 200,000 | | | 1.8 % | | 1.9 % | | 0.4 | | |
| | | | | | | | | | |
| Greater than 3 years and less than 5 years | | 622,400 | | | 2.6 % | | 1.9 % | | 4.1 | | |
| Greater than 5 years | | 1,728,600 | | | 2.1 % | | 2.0 % | | 8.9 | | |
| Total | | $ | 2,551,000 | | | 2.2 % | | 2.0 % | | 7.1 | | |
| | | | | | | | | | | | | | | | | | | | | | | | | | | | |
| | | December 31, 2019 |
| Variable Pay Interest Rate Swap Remaining Term | | Notional Amount | | Average
Variable Pay Rate | | Average Fixed Receive Rate | | Average Maturity (Years) | | |
| Greater than 1 year and less than 3 years | | $ | 810,000 | | | 2.0 % | | 2.0 % | | 1.6 | | |
| Greater than 3 years and less than 5 years | | 550,000 | | | 1.9 % | | 1.6 % | | 5.0 | | |
| Greater than 5 years | | 45,000 | | | 1.9 % | | 2.3 % | | 19.5 | | |
| Total | | $ | 1,405,000 | | | 2.0 % | | 1.9 % | | 3.5 | | |
| | | | | | | | | | |
| | | | | | | | | | |
| | | | | | | | | | |
| | | | | | | | | | |
| | | | | | | | | | |
| | | | | | | | | | |
| | | | | | | | | | | | | | | | | | | | | | | | | | | | | | | | |
| | September 30, 2021 | | |
| Fixed Pay Interest Rate Swap Remaining Term | | Notional Amount | | Average
Fixed Pay Rate | | Average Variable Receive Rate | | Average Maturity (Years) | | |
| Greater than 5 years | | $ | 22,000 | | | 1.2 | % | | 0.1 | % | | 10 | | |
| Total | | $ | 22,000 | | | 1.2 | % | | 0.1 | % | | 10 | | |
Interest Rate Swaptions
The Company did not have any swaptions in its derivative holdings as of September 30, 2020 and December 31, 2019.
Futures Contracts
From time to time, the Company may enter into Eurodollar, Volatility Index, and U.S. Treasury futures. As of September 30, 2020 and December 31, 2019, the Company had no open futures contracts.
To-Be-Announced Securities
The Company purchased or sold TBAs during the nine months ended September 30, 2020 and the year ended December 31, 2019. The following is a summary of the Company's TBA positions as of September 30, 2020 and December 31, 2019, reported in "Derivative assets, at fair value" and "Derivative liability, at fair value" in the Consolidated Balance Sheets (dollars in thousands):
| | | | | | | | | | | | | | | | | | | | | | | | | | | | |
| | September 30, 2020 | | December 31, 2019 | | |
| | Notional
Amount | | Fair
Value | | Notional
Amount | | Fair
Value | | |
| Purchase contracts, asset | | $ | 0 | | | $ | 0 | | | $ | 1,000,000 | | | $ | 1,146 | | | |
| | | | | | | | | | |
| | | | | | | | | | |
| | | | | | | | | | |
| Sale contracts, liability | | 0 | | | 0 | | | (1,000,000) | | | (2,074) | | | |
| | | | | | | | | | |
| TBA securities, net | | $ | 0 | | | $ | 0 | | | $ | 0 | | | $ | (928) | | | |
| | | | | | | | | | |
The following table presents additional information about the Company's contracts to purchase and sell TBAs for the nine months ended September 30, 2020 (dollars in thousands):
| | | | | | | | | | | | | | | | | | | | | | | | | | | | |
| | Notional Amount | | | | Settlement, Termination, | | Notional Amount | | |
| | December 31, 2019 | | Additions | | Expiration or Exercise | | September 30, 2020 | | |
| Purchase of TBAs | | $ | 1,000,000 | | | $ | 5,257,000 | | | $ | (6,257,000) | | | $ | 0 | | | |
| Sale of TBAs | | $ | 1,000,000 | | | $ | 5,257,000 | | | $ | (6,257,000) | | | $ | 0 | | | |
| | | | | | | | | | |
| | | | | | | | | | |
| | | | | | | | | | |
| | | | | | | | | | |
| | | | | | | | | | |
| | | | | | | | | | |
Interest-Only Strips
The Company also invests in Interest-Only Strips. In determining the classification of its holdings of Interest-Only Strips, the Company evaluates the securities to determine if the nature of the cash flows has been altered from that of the underlying mortgage collateral. Generally, Interest-Only Strips for which the security represents a strip off of a mortgage pass through security will be considered a hybrid instrument classified as an MBS investment in the Consolidated Balance Sheets utilizing the fair value option. Alternatively, those Interest-Only Strips, for which the underlying mortgage collateral has been included into a structured security that alters the cash flows from the underlying mortgage collateral, are accounted for as derivatives at fair value with changes recognized in "Gain (loss) on derivative instruments, net" in the Consolidated Statements of Operations, along with any interest received. The carrying value of these Interest-Only Strips is included in "Agency mortgage-backed securities, at fair value" in the Consolidated Balance Sheets.
Credit Default Swaps
The Company entered intocurrently has outstanding credit default swaps and, in the future, may continue to enter into these types of credit derivatives. Under these instruments, the buyer makes a monthly premium payment over the term of the contract in exchange for the seller making a payment for losses of the reference securities, upon the occurrence of a specified credit event.
Note 9 — Offsetting Assets and Liabilities
The following tables present information about certain assets and liabilities that are subject to master netting agreements (or similar agreements) and can potentially be offset in the Company’s Consolidated Balance Sheets at September 30, 20202021 and December 31, 20192020 (dollars in thousands):
| | | | | | | | | | | | | | | | | | | | | | | | | | | | | | | | | | | | | | |
| | September 30, 2020 |
| | | Gross
Amounts | | Gross
Amounts
Offset in the Consolidated
Balance
Sheets | | Net Amounts
of Assets
presented in
the Consolidated
Balance
Sheets | | Gross Amounts Not Offset in
the Consolidated Balance
Sheets | | Net Amount |
Description | | | | | Financial Instruments(1) | | Cash Collateral (1) | |
| Derivative Assets and Receivable under Reverse Repurchase Agreements | | | | | | | | | | | | |
| Agency and Non-Agency Interest-Only Strips, accounted for as derivatives included in MBS | | $ | 1,700 | | | $ | 0 | | | $ | 1,700 | | | $ | (1,700) | | | $ | 0 | | | $ | 0 | |
| Derivative asset, at fair value | | 481 | | | 0 | | | 481 | | | (481) | | | 0 | | | 0 | |
| | | | | | | | | | | | |
| Total assets | | $ | 2,181 | | | $ | 0 | | | $ | 2,181 | | | $ | (2,181) | | | $ | 0 | | | $ | 0 | |
| | | | | | | | | | | | |
| Derivative Liabilities and Repurchase Agreements | | | | | | | | | | | | |
Derivative liability, at fair value(2) | | $ | 1,166 | | | $ | 0 | | | $ | 1,166 | | | $ | (481) | | | $ | (685) | | | $ | 0 | |
Repurchase Agreements(3) | | 358,525 | | | 0 | | | 358,525 | | | (358,525) | | | 0 | | | 0 | |
| Total liabilities | | $ | 359,691 | | | $ | 0 | | | $ | 359,691 | | | $ | (359,006) | | | $ | (685) | | | $ | 0 | |
| | | | | | | | | | | | | | | | | | | | | | | | | | | | | | | | | | | | | | |
| | September 30, 2021 |
| | | Gross
Amounts | | Gross
Amounts
Offset in the Consolidated
Balance
Sheets | | Net Amounts
of Assets
presented in
the Consolidated
Balance
Sheets | | Gross Amounts Not Offset in
the Consolidated Balance
Sheets | | Net Amount |
Description | | | | | Financial Instruments(1) | | Cash Collateral (1) | |
| Derivative Assets | | | | | | | | | | | | |
| Agency and Non-Agency Interest-Only Strips, accounted for as derivatives included in MBS | | $ | 1,208 | | | $ | — | | | $ | 1,208 | | | $ | (1,208) | | | $ | — | | | $ | — | |
| Derivative asset, at fair value | | 94 | | | — | | | 94 | | | (94) | | | — | | | — | |
| | | | | | | | | | | | |
| Total assets | | $ | 1,302 | | | $ | — | | | $ | 1,302 | | | $ | (1,302) | | | $ | — | | | $ | — | |
| | | | | | | | | | | | |
| Derivative Liabilities and Repurchase Agreements | | | | | | | | | | | | |
Derivative liability, at fair value(2) | | $ | 562 | | | $ | — | | | $ | 562 | | | $ | (94) | | | $ | (468) | | | $ | — | |
Repurchase Agreements(3) | | 483,268 | | | — | | | 483,268 | | | (483,268) | | | — | | | — | |
| Total liabilities | | $ | 483,830 | | | $ | — | | | $ | 483,830 | | | $ | (483,362) | | | $ | (468) | | | $ | — | |
(1)Amounts disclosed in the Financial Instruments column of the tables above represent securities, Whole Loans and securitized commercial loan collateral pledged and derivative assets that are available to be offset against liability balances associated with repurchase agreement and derivative
liabilities. In addition, the Financial Instruments column includes reverse repurchase agreement receivables that are available to be offset against repurchase agreement liabilities. Amounts disclosed in the Cash Collateral column of the tables above represents amounts pledged or received as collateral against derivative transactions.
(2)Cash collateral pledged against the Company’s derivative counterparties was approximately $690 thousand$1.4 million as of September 30, 2020.2021.
(3)The carrying value of investments pledged against the Company’s repurchase agreements was approximately $715.5$654.4 million as of September 30, 2020.2021.
| | | | | | | | | | | | | | | | | | | | | | | | | | | | | | | | | | | | | | |
| | December 31, 2019 |
| | | Gross
Amounts | | Gross
Amounts
Offset in the Consolidated
Balance
Sheets | | Net Amounts
of Assets
presented in
the Consolidated
Balance
Sheets | | Gross Amounts Not Offset in
the Consolidated Balance
Sheets | | Net Amount |
| | | | | Financial Instruments(1) | | Cash Collateral (1) | |
| Derivative Assets | | | | | | | | | | | | |
| Agency and Non-Agency Interest-Only Strips, accounted for as derivatives included in MBS | | $ | 8,665 | | | $ | 0 | | | $ | 8,665 | | | $ | (8,665) | | | $ | 0 | | | $ | 0 | |
Derivative asset, at fair value(2) | | 5,111 | | | 0 | | | 5,111 | | | (2,576) | | | 0 | | | 2,535 | |
| Total derivative assets | | $ | 13,776 | | | $ | 0 | | | $ | 13,776 | | | $ | (11,241) | | | $ | 0 | | | $ | 2,535 | |
| | | | | | | | | | | | |
| Derivative Liabilities and Repurchase Agreements | | | | | | | | | | | | |
Derivative liability, at fair value(2)(3) | | $ | 6,370 | | | $ | 0 | | | $ | 6,370 | | | $ | (2,576) | | | $ | (2,819) | | | $ | 975 | |
Repurchase Agreements(4) | | 2,824,801 | | | 0 | | | 2,824,801 | | | (2,824,801) | | | 0 | | | 0 | |
| Total derivative liability | | $ | 2,831,171 | | | $ | 0 | | | $ | 2,831,171 | | | $ | (2,827,377) | | | $ | (2,819) | | | $ | 975 | |
| | | | | | | | | | | | | | | | | | | | | | | | | | | | | | | | | | | | | | |
| | December 31, 2020 |
| | | Gross
Amounts | | Gross
Amounts
Offset in the Consolidated
Balance
Sheets | | Net Amounts
of Assets
presented in
the Consolidated
Balance
Sheets | | Gross Amounts Not Offset in
the Consolidated Balance
Sheets | | Net Amount |
| | | | | Financial Instruments(1) | | Cash Collateral (1) | |
| Derivative Assets | | | | | | | | | | | | |
| Agency and Non-Agency Interest-Only Strips, accounted for as derivatives included in MBS | | $ | 1,565 | | | $ | — | | | $ | 1,565 | | | $ | (1,565) | | | $ | — | | | $ | — | |
Derivative asset, at fair value(2) | | 161 | | | — | | | 161 | | | (161) | | | — | | | — | |
| Total derivative assets | | $ | 1,726 | | | $ | — | | | $ | 1,726 | | | $ | (1,726) | | | $ | — | | | $ | — | |
| | | | | | | | | | | | |
| Derivative Liabilities and Repurchase Agreements | | | | | | | | | | | | |
Derivative liability, at fair value(2)(3) | | $ | 656 | | | $ | — | | | $ | 656 | | | $ | (161) | | | $ | (495) | | | $ | — | |
Repurchase Agreements(4) | | 356,923 | | | — | | | 356,923 | | | (356,923) | | | — | | | — | |
| Total derivative liability | | $ | 357,579 | | | $ | — | | | $ | 357,579 | | | $ | (357,084) | | | $ | (495) | | | $ | — | |
(1)Amounts disclosed in the Financial Instruments column of the tables above represent securities, Whole Loans and securitized commercial loan collateral pledged and derivative assets that are available to be offset against liability balances associated with repurchase agreement and derivative liabilities. Amounts disclosed in the Cash Collateral Pledged column of the tables above represents amounts pledged as collateral against derivative transactions.
(2)Derivative asset, at fair value and Derivative liability, at fair value includes interest rate swaps, credit default swaps and futures contracts.
(3)Cash collateral pledged against the Company’s derivative counterparties was approximately $55.4 million$510 thousand as of December 31, 2019.2020.
(4)The carrying value of investments pledged against the Company’s repurchase agreements was approximately $3.2 billion$682.9 million as of December 31, 2019.2020.
Certain of the Company’s repurchase agreement and derivative transactions are governed by underlying agreements that generally provide for a right of set-off in the event of default or in the event of a bankruptcy of either party to the transaction.
Note 10 — Related Party Transactions
Management Agreement
In connection with the Company’s initial public offering ("IPO") in May 2012, the Company entered into a management agreement (the “Management Agreement”) with the Manager, which describes the services to be provided by the Manager and compensation for such services. The Manager is responsible for managing the Company’s operations, including: (i) performing all of its day-to-day functions; (ii) determining investment criteria in conjunction with the Board of Directors; (iii) sourcing, analyzing and executing investments, asset sales and financings; (iv) performing asset management duties; and (v) performing financial and accounting management, subject to the direction and oversight of the Company’s Board of Directors. Pursuant to the terms of the Management Agreement, the Manager is paid a management fee equal to 1.50% per annum of the Company’s stockholders’ equity (as defined in the Management Agreement), calculated and payable (in cash) quarterly in arrears. For purposes of calculating the management fee, “stockholders’ equity” means the sum of the net proceeds from any issuances of the Company’s equity securities since inception (allocated on a pro rata daily basis for such issuances during the fiscal quarter of any such issuance), plus retained earnings, calculated in accordance with GAAP, at the end of the most recently completed fiscal quarter (without taking into account any non-cash equity compensation expense incurred in current or prior periods), less any amount paid for repurchases of the Company’s shares of common stock, excluding any
unrealized gains or losses on our investments and derivatives and other non-cash items (excluding OTTI)other than temporary impairment) that have impacted stockholders' equity as reported in the Company’s consolidated financial statements prepared in accordance with GAAP, regardless of whether such items are included in other comprehensive income or loss, or in net income, and excluding one-time events pursuant to changes in GAAP and certain other non-cash charges after discussions between the Manager and the Company’s independent directors and after approval by a majority of the Company’s independent directors. However, if the Company’s stockholders’ equity for any given quarter is negative based on the calculation described above, the Manager will not be entitled to receive any management fee for that quarter.
In addition, the Company may be required to reimburse the Manager for certain expenses as described below, and shall reimburse the Manager for the compensation paid to the Company’s chief financial officer, controller and their staff. Expense reimbursements to the Manager are made in cash on a regular basis. The Company’s reimbursement obligation is not subject to any dollar limitation. Because the Manager’s personnel perform certain legal, accounting, due diligence tasks and other services that outside professionals or outside consultants otherwise would perform, the Manager may be paid or reimbursed for the documented cost of performing such tasks, provided that such costs and reimbursements are in amounts which are no greater than those which would be payable to outside professionals or consultants engaged to perform such services pursuant to agreements negotiated on an arm’s-length basis.
The Management Agreement may be amended, supplemented or modified by agreement between the Company and the Manager. The Management Agreement expires on May 16, 2021.2022. It is automatically renewed for one-yearone-year terms on each May 15th unless previously terminated as described below. The Company’s independent directors review the Manager’s performance and any fees payable to the Manager annually and, the Management Agreement may be terminated annually upon the affirmative vote of at least two-thirds (2/3) of the Company’s independent directors, based upon: (i) the Manager’s unsatisfactory performance that is materially detrimental to the Company; or (ii) the Company’s determination that any fees payable to the Manager are not fair, subject to the Manager’s right to prevent such termination due to unfair fees by accepting a reduction of management fees agreed to by at least two-thirds (2/3) of the Company’s independent directors. The Company will provide the Manager 180 days prior notice of any such termination. Unless terminated for cause, the Company will pay the Manager a termination fee equal to three3 times the average annual management fee earned by the Manager during the prior 24-month24-
month period immediately preceding the date of termination, calculated as of the end of the most recently completed fiscal quarter prior to the date of termination.
The Company may also terminate the Management Agreement at any time, without the payment of any termination fee, with 30 days prior written notice from the Company’s Board of Directors for cause, which will be determined by at least two-thirds (2/3) of the Company’s independent directors, which is defined as: (i) the Manager’s continued material breach of any provision of the Management Agreement (including the Manager’s failure to comply with the Company’s investment guidelines); (ii) the Manager’s fraud, misappropriation of funds, or embezzlement against the Company; (iii) the Manager’s gross negligence in the performance of its duties under the Management Agreement; (iv) the occurrence of certain events with respect to the bankruptcy or insolvency of the Manager, including an order for relief in an involuntary bankruptcy case or the Manager authorizing or filing a voluntary bankruptcy petition; (v) the Manager is convicted (including a plea of nolo contendere) of a felony; or (vi) the dissolution of the Manager.
For the three months ended September 30, 20202021 and September 30, 2019,2020, the Company incurred approximately $1.5 million and approximately $1.8$1.5 million in management fees, respectively. For the nine months ended September 30, 20202021 and September 30, 2019,2020, the Company incurred approximately $3.0$4.5 million and approximately $5.4$3.0 million in management fees, respectively. The Manager waived the management fee for three months from March 2020 through May 2020 because of the unprecedented market disruption and dislocation across fixed income markets surrounding the uncertainty related to the COVID-19 pandemic. Future waivers, if any, will be at the Manager's discretion.
In addition to the management fee, the Company is also responsible for reimbursing the Manager for certain expenses paid by the Manager on behalf of the Company as defined in the Management Agreement. For the three months ended September 30, 20202021 and September 30, 2019,2020, the Company recorded expenses included in general and administrative expenses totaling approximately $211$201 thousand and approximately $210$211 thousand, respectively, related to reimbursable employee costs. For the nine months ended September 30, 20202021 and September 30, 2019,2020, the Company recorded expenses included in general and administrative expenses totaling approximately $1.4$1.5 million and approximately $1.4 million, respectively, related to reimbursable employee costs. Any such expenses incurred by the Manager and reimbursed by the Company, including the employee compensation expense, are typically included in the Company’s general and administrative expenses in the Consolidated Statements of Operations. At September 30, 20202021 and December 31, 2019,2020, approximately $2.0$3.0 million and
approximately $2.0$3.0 million, respectively, for management fees incurred but not yet paid was included in "Payable to affiliate" in the Consolidated Balance Sheets. In addition, at September 30, 20202021 and December 31, 2019,2020, approximately $1.3 million$141 thousand and approximately $181$148 thousand, respectively, of reimbursable costs incurred but not yet paid was included in "Payable to affiliate" in the Consolidated Balance Sheets.
Note 11 — Share-Based Payments
In conjunction with the Company’s IPO and concurrent private placement, the Company’s Board of Directors approved the Western Asset Mortgage Capital Corporation Equity Plan (the “Equity Plan”) and the Western Asset Manager Equity Plan (the “Manager Equity Plan” and collectively the “Equity Incentive Plans”). The Equity Incentive Plans include provisions for grants of restricted common stock and other equity-based awards to the Manager, its employees and employees of its affiliates and to the Company’s directors, officers and employees. The Company can issue up to 3.0% of the total number of issued and outstanding shares of its common stock (on a fully diluted basis) at the time of each award (other than any shares previously issued or subject to awards made pursuant to one of the Company’s Equity Incentive Plans) under these Equity Incentive Plans. Upon the completion of the Company's most recent secondary public offerings, the number of shares of common stock available under the Equity Incentive Plans increased to 1,804,258. Approximately 1,022,4521,140,653 shares have been issued under the Equity Plans with 781,806663,605 shares available for issuance, as of September 30, 2020.
Under the Equity Plan, the Company made the following grants during the nine months ended September 30, 2020 and the year ended December 31, 2019:
On March 28, 2019, the Company granted 108,000 shares of restricted common stock to the Manager under the Manager Equity Plan. One-third of the shares vested on March 28, 2020, one-third will vest on March 28, 2021 and the remaining one-third will vest on March 28, 2022.2021.
On June 6, 2019,25, 2021, the Company granted a total of 28,78081,160 shares (7,195(20,290 each) of restricted common stock under the Equity Plan to the Company’s 4 independent directors. These restricted shares vestedwill vest in full on June 6, 2020,25, 2022, the first anniversary of the grant date. Each of the independent directors has elected to defer the issuance of the shares granted to him under the Company’s Director Deferred Fee Plan.
On June 19, 2020, the Company granted a total of 127,275 shares (25,455 each) of restricted common stock under the Equity Plan (the “Directorto the Company’s then 5 independent directors. Each of the independent directors elected to defer the issuance of the shares granted under the Director Deferred Fee Plan”). Plan. In May 2021, 1 of the independent directors retired. As a result,
25,455 shares of the unvested restricted stock were forfeited during the nine months ended September 30, 2021. The remaining restricted shares in this grant vested in full on June 19, 2021, the first anniversary of the grant date.
The Director Deferred Fee Plan permits eligible members of the Company's board of directors to defer certain stock awards made under its director compensation programs. The Director Deferred Fee Plan allows directors to defer issuance of their stock awards and therefore defer payment of any tax liability until the deferral is terminated, pursuant to the election form executed each year by each eligible director.
On June 19, 2020, the Company granted a total of 127,275 shares (25,455 each) of restricted common stock under the Equity Plan to the Company’s 5 independent directors. These restricted shares will vest in full on June 19, 2021, the first anniversary of the grant date. Each of the independent directors has elected to defer the shares granted under the Director Deferred Fee Plan.
During the nine months ended September 30, 20202021 and September 30, 2019,2020, 137,820 and 67,480 and 29,200 restricted common shares vested, respectively, including shares whose issuance has been deferred under the Director Deferred Fee Plan. The Company recognized stock-based compensation expense of approximately $182$165 thousand and approximately $164$182 thousand for the three months ended September 30, 20202021 and September 30, 2019,2020, respectively. The Company recognized stock-based compensation expense of approximately $517$453 thousand and approximately $399$517 thousand for the nine months ended September 30, 20202021 and September 30, 2019,2020, respectively. In addition, the Company had unamortized compensation expense of $801$376 thousand and $968$619 thousand for equity awards at September 30, 20202021 and December 31, 2019,2020, respectively.
All restricted common shares granted, other than those whose issuance has been deferred pursuant to the Director Deferred Fee Plan, possess all incidents of ownership, including the right to receive dividends and distributions currently, and the right to vote. Dividend equivalent payments otherwise allocable to restricted common shares under the Company's Director Deferred Fee Plan are deemed to purchase additional phantom shares of the Company’s common stock that are credited to each participant’s deferral account. The award agreements include restrictions whereby the restricted shares cannot be sold, assigned, transferred, pledged, hypothecated or otherwise disposed of prior to the lapse of restrictions under the respective award agreement. The restrictions lapse on the unvested restricted shares awarded when vested, subject to the grantee’s continuing to provide services to the Company as of the vesting date. Unvested restricted shares and rights to dividends thereon are forfeited upon termination of the grantee.
The following is a summary of restricted common stock vesting dates as of September 30, 20202021 and December 31, 2019,2020, including shares whose issuance has been deferred under the Director Deferred Fee Plan:
| | | | September 30, 2020 | | December 31, 2019 | | September 30, 2021 | | December 31, 2020 |
| Vesting Date | Vesting Date | Shares Vesting | | Shares Vesting | Vesting Date | Shares Vesting | | Shares Vesting |
| | March 2020 | 0 | | | 36,000 | | |
| June 2020 | 0 | | | 30,592 | | |
| March 2021 | March 2021 | 36,000 | | | 36,000 | | March 2021 | — | | | 36,000 | |
| June 2021 | June 2021 | 127,275 | | | 0 | | June 2021 | — | | | 130,365 | |
| March 2022 | March 2022 | 36,000 | | | 36,000 | | March 2022 | 36,000 | | | 36,000 | |
| June 2022 | | June 2022 | 81,160 | | | — | |
| | | 199,275 | | | 138,592 | | | 117,160 | | | 202,365 | |
The following table presents information with respect to shares issued under the Company’s restricted stockEquity Incentive Plans for the nine months ended September 30, 20202021 and September 30, 2019,2020, respectively, including shares whose issuance has been deferred under the Director Deferred Fee Plan:
| | | | | | | | | | | | | | | | | | | | | | | |
| September 30, 2020 | | September 30, 2019 |
| | Shares of
Restricted Stock | | Weighted Average Grant Date Fair Value (1) | | Shares of
Restricted Stock | | Weighted Average Grant Date Fair Value (1) |
| Outstanding at beginning of period | 894,289 | | | $ | 15.76 | | | 753,973 | | | $ | 16.77 | |
Granted (2) | 128,163 | | | 2.80 | | | 139,380 | | | 10.34 | |
| Cancelled/forfeited | 0 | | | 0 | | | 0 | | | 0 | |
| Outstanding at end of period | 1,022,452 | | | 14.13 | | | 893,353 | | | 15.76 | |
| Unvested at end of period | 199,275 | | | $ | 5.55 | | | 137,656 | | | $ | 10.34 | |
| | | | | | | | | | | | | | | | | | | | | | | |
| September 30, 2021 | | September 30, 2020 |
| | Shares Issued Under the Equity Incentive Plans | | Weighted Average Grant Date Fair Value (1) | | Shares Issued Under the Equity Incentive Plans | | Weighted Average Grant Date Fair Value (1) |
| Outstanding at beginning of period | 1,025,542 | | | $ | 14.10 | | | 894,289 | | | $ | 15.76 | |
Granted (2) | 140,566 | | | 5.21 | | | 128,163 | | | 2.80 | |
| Cancelled/forfeited | (25,455) | | | 2.75 | | | — | | | — | |
| Outstanding at end of period | 1,140,653 | | | 13.26 | | | 1,022,452 | | | 14.13 | |
| Unvested at end of period | 117,160 | | | $ | 5.62 | | | 199,275 | | | $ | 5.55 | |
(1)The grant date fair value of restricted stockthe awards is based on the closing market price of the Company’s common stock at the grant date.
(2)Includes 59,406 and 888 and 2,600 shares of restricted stock attributed to dividends on restricted stock under the Director Deferred Fee Plan for the nine months ended September 30, 20202021 and September 30, 2019,2020, respectively.
Note 12 — Stockholders’ Equity
At-The-Market Program
In March 2017, the Company entered into an equity distribution agreement with JMP Securities LLC, which was amended on June 5, 2020, under which the Company may offer and sell up to $100.0 million shares of common stock in an At-The-Market equity offering. During the nine monthsyear ended September 30,December 31, 2020, the Company sold 6,034,741 shares under this amended agreement with an average price of $3.70 per share for a total net proceeds of $22.0 million. During the nine months ended September 30, 2019,2021, the Company did not sell any shares under the amended agreement.
Stock Repurchase Program
On December 19, 2019, the Board of Directors of the Company reauthorized its repurchase program of up to 2,700,000 shares of its common stock through December 31, 2021. The previous reauthorization announced on December 21, 2017 of the Company's repurchase program of up to 2,100,000 shares of its common stock expired on December 31, 2019. Purchases made pursuant to the program will be made in the open market, in privately negotiated transactions, or pursuant to any trading plan that may be adopted in accordance with Rules 10b5-1 and 10b-18 of the Securities and Exchange Act of 1934, as amended. The authorization does not obligate the Company to acquire any particular amount of common shares and the program may be suspended or discontinued at the Company’s discretion without prior notice. The timing, manner, price and amount of any repurchases will be determined by the Company in its discretion and will be subject to economic and market
conditions, stock price, applicable legal requirements and other factors. In March 2020, the Company repurchased 100,000 shares of common stock pursuant to the authorization.with a weighted average price of $5.78. The repurchased stock was not retired and will beis accounted for as treasury stock.
Convertible Notes Exchange
On July 1, 2020, the Company issued an aggregate of 1,354,084 shares of its common stock in exchange for $5.0 million aggregate principal amount of its 6.75% Convertible Senior Notes due 2022.2022 Notes. See Note 7 - "Financings" for information related to the convertible notes agreement.
Dividends
To preserve liquidity, the Company suspended its first and second quarter of 2020 common stock dividends in 2020 given extraordinary market volatility driven by uncertainty surrounding the COVID-19 pandemic. InStarting in the third quarter ofended September 30, 2020, the Company resumed itspayment of the quarterly dividend after making progress strengthening its balance sheet and improving liquidity and earnings power of its investment portfolio.
The following table presents cash dividends declared and paid by the Company on its common stock:
| | | | | | | | | | | | | | | | | | | | | | | | | | |
| Declaration Date | | Record Date | | Payment Date | | Amount per Share | | Tax Characterization |
20202021 | | | | | | | | |
| | | | | | | | |
SeptemerSeptember 23, 2021 | | October 4, 2021 | | October 26, 2021 | | $ | 0.06 | | | Not yet determined |
| June 22, 2021 | | July 2, 2021 | | July 26, 2021 | | $ | 0.06 | | | Not yet determined |
| March 23, 2021 | | April 2, 2021 | | April 26, 2021 | | $ | 0.06 | | | Not yet determined |
| | | | | | | | |
| 2020 | | | | | | | | |
| December 17, 2020 | | December 28, 2020 | | January 26, 2021 | | $ | 0.06 | | | Not yet determined(1) |
| September 22, 2020 | | October 2, 2020 | | October 26, 2020 | | $ | 0.05 | | | Not yet determined |
June 23, 2020 | | N/A | | N/A | | $ | 0 | | | N/A |
March 27, 2020 | | N/A | | N/A | | $ | 0 | | | N/AReturn of capital |
| | | | | | | | |
| | | | | | | | |
2019 | | | | | | | | |
December 19, 2019 | | December 30, 2019 | | January 24, 2020 | | $ | 0.31 | | | Ordinary income |
September 19, 2019 | | September 30, 2019 | | October 25, 2019 | | $ | 0.31 | | | Ordinary income |
June 20, 2019 | | July 1, 2019 | | July 26, 2019 | | $ | 0.31 | | | Ordinary income |
March 21, 2019 | | April 1, 2019 | | April 26, 2019 | | $ | 0.31 | | | Ordinary income |
| | | | | | | | |
| | | | | | | | |
| | | | | | | | |
(1)The cash distributions made on January 26, 2021, with a record date of December 28, 2020, are treated as received by stockholders on January 26, 2021 and taxable in calendar year 2021. The tax characterization of these distributions will be determined in January 2022.
Note 13 — Net Income (loss) per Common Share
The table below presents basic and diluted net income (loss) per share of common stock using the two-class method for the three and nine months ended September 30, 20202021 and September 30, 20192020 (dollars, other than shares and per share amounts, in thousands):
| | | | For the three months ended September 30, 2020 | | For the three months ended September 30, 2019 | | Nine months ended September 30, 2020 | | Nine months ended September 30, 2019 | | For the three months ended September 30, 2021 | | For the three months ended September 30, 2020 | | For the nine months ended September 30, 2021 | | For the nine months ended September 30, 2020 |
Numerator: | Numerator: | | | | | | | | Numerator: | | | | | | | |
| Net income (loss) attributable to common stockholders and participating securities for basic and diluted earnings per share | Net income (loss) attributable to common stockholders and participating securities for basic and diluted earnings per share | $ | 59,807 | | | $ | 19,720 | | | $ | (339,144) | | | $ | 58,210 | | Net income (loss) attributable to common stockholders and participating securities for basic and diluted earnings per share | $ | (4,213) | | | $ | 59,807 | | | $ | (36,423) | | | $ | (339,144) | |
| Less: | Less: | | | | | | | Less: | | | | | | |
| Dividends and undistributed earnings allocated to participating securities | Dividends and undistributed earnings allocated to participating securities | 353 | | | 96 | | | 16 | | | 236 | | Dividends and undistributed earnings allocated to participating securities | 24 | | | 353 | | | 65 | | | 16 | |
| Net income (loss) allocable to common stockholders — basic and diluted | Net income (loss) allocable to common stockholders — basic and diluted | $ | 59,454 | | | $ | 19,624 | | | $ | (339,160) | | | $ | 57,974 | | Net income (loss) allocable to common stockholders — basic and diluted | $ | (4,237) | | | $ | 59,454 | | | $ | (36,488) | | | $ | (339,160) | |
| Denominator: | Denominator: | | | | | | | | Denominator: | | | | | | | |
| Weighted average common shares outstanding for basic earnings per share | Weighted average common shares outstanding for basic earnings per share | 60,740,701 | | | 53,116,379 | | | 56,293,512 | | | 50,625,537 | | Weighted average common shares outstanding for basic earnings per share | 60,795,688 | | | 60,740,701 | | | 60,771,759 | | | 56,293,512 | |
| Weighted average common shares outstanding for diluted earnings per share | Weighted average common shares outstanding for diluted earnings per share | 60,740,701 | | | 53,116,379 | | | 56,293,512 | | | 50,625,537 | | Weighted average common shares outstanding for diluted earnings per share | 60,795,688 | | | 60,740,701 | | | 60,771,759 | | | 56,293,512 | |
| Basic earnings (loss) per common share | Basic earnings (loss) per common share | $ | 0.98 | | | $ | 0.37 | | | $ | (6.02) | | | $ | 1.15 | | Basic earnings (loss) per common share | $ | (0.07) | | | $ | 0.98 | | | $ | (0.60) | | | $ | (6.02) | |
| Diluted earnings (loss) per common share | Diluted earnings (loss) per common share | $ | 0.98 | | | $ | 0.37 | | | $ | (6.02) | | | $ | 1.15 | | Diluted earnings (loss) per common share | $ | (0.07) | | | $ | 0.98 | | | $ | (0.60) | | | $ | (6.02) | |
For the three and nine months ended September 30, 20202021 and September 30, 2019,2020, the Company excluded the effects of the convertible senior unsecured notes from the computation of diluted earnings per share since the average market value per share of the Company’s common stock was below the exercise price of the convertible senior unsecured notes.
Note 14 — Income Taxes
As a REIT, the Company is not subject to federal income tax to the extent that it makes qualifying distributions to its stockholders and satisfies on a continuing basis, through actual investment and operating results, the REIT requirements including certain asset, income and stock ownership tests.
Based on the Company’s analysis of any potential uncertain income tax positions, the Company concluded that it does not have any uncertain tax positions that meet the recognition or measurement criteria as of September 30, 2020.2021. The Company files U.S. federal and state income tax returns. As of September 30, 2020,2021, U.S. federal tax returns filed by the Company for 2019, 2018 and 2017 and state tax returns filed for 2019, 2018, 2017, 2016 and 2015 are open for examination pursuant to relevant statutes of limitation. In the event that the Company incurs income tax related interest and penalties, the Company’s policy is to classify them as a component of its provision for income taxes.
Income Tax Provision
Subject to the limitation under the REIT asset test rules, the Company is permitted to own up to 100% of the stock of one or more taxable REIT subsidiaries ("TRS"). Currently, the Company owns one TRS that is taxable as a corporation and is subject to federal, state and local income tax on its net income at the applicable corporate rates. The TRS, which was formed in Delaware on July 28, 2014, is a limited liability company and a wholly-owned subsidiary of the Company. During the three months ended September 30, 20202021 and September 30, 2019,2020, the Company recorded a federal and state tax provisionbenefit of $205$218 thousand and tax benefitprovision of $55$205 thousand, respectively, which is recorded in "Income tax provision (benefit)" in the Consolidated Statements of Operations. During the nine months ended September 30, 20202021 and September 30, 2019,2020, the Company recorded a federal and state tax provisionbenefit of $367$19 thousand and tax provision of $435$367 thousand, respectively,respectively.
Deferred Tax Asset
As of September 30, 20202021 and December 31, 2019,2020, the Company recorded a deferred tax asset of approximately $21.6$20.6 million and $8.5$21.0 million, respectively, relating to capital loss carryforward and temporary differences as a result of the timing of income recognition of certain investments held in the TRS. The capital loss carryforwards may only be recognized to the extent
of capital gains. There is uncertainty as to the TRSTRS' ability to recognize capital gains in the future. As a result, the Company has concluded it is more likely than not the deferred tax asset will not be realized and has recorded a full valuation allowance of $21.6$20.6 million and $8.5$21.0 million as of September 30, 20202021 and December 31, 2019,2020, respectively.
In addition, the REIT generated net operating losses ("NOLs") during the nine months ended September 30, 2021 related to ordinary losses on its MBS portfolio and it generated NOLs for the years ended December 31, 2020 and the year ended December 31, 2017, related to its interest rate swap terminations, and for its California return a portion of the NOL'sNOLs is apportioned to the TRS. The Company recorded a deferred tax asset relating to the NOLs of $21.9$18.8 million and $6.0$19.3 million in the REIT and $2.3$2.1 million and $1.3$2.1 million in the TRS as of September 30, 20202021 and December 31, 2019,2020, respectively. The TRS can carryback the NOLs generated during the three monthsyears ended September 30,December 31, 2020 to each of the five preceding years and the NOLs generated during the year ended December 31, 2017 can be carried back to each of the two preceding years to request a refund for taxes paid. As of September 30, 20202021 and December 31, 2019,2020, the Company has concluded it is more likely than not the deferred tax asset relating to the NOLs will not be realized, with the exception of the TRS carryback to 2015, and it has recorded a combined valuation allowance of $24.3$20.9 million and $6.9$21.4 million, respectively. The Company also recorded a deferred federal tax liability of $85 thousand as of December 31, 2019 in anticipation of the receipt of the state tax refund as a result of the carryback of the California NOL. The state tax refund was received during the three months ended March 31, 2020.
Effective Tax Rate
The Company's effective tax rate differs from its combined federal and state income tax rate primarily due to its valuation allowance and the deduction of dividends distributions to be paid under Code Section 857(a).
Note 15 — Contingencies
From time to time, the Company may become involved in various claims and legal actions arising in the ordinary course of business. Management is not aware of any material contingencies at September 30, 2020.2021.
Note 16-16 — Subsequent Events
On October 6, 2020,November 5, 2021, the Company entered into an amendment with respect toof its residential loan warehouse facility.Residential Whole Loan Facility. The amendment servesfacility bears an interest rate to convertLIBOR plus 2.00%, with a LIBOR floor of 0.25%. The facility is available to finance five types of residential mortgages: Non-Agency mortgage loans, Non-QM loans, investor loans, re-performing and non-performing loans. The advance rates differ by type of loan, but for performing Non-QM loans the existing residential loanadvance rate is 90%. The facility tomatures on November 4, 2022. The facility is a limited mark to market margin facility that bears an interest rateonce the collateral value declines below par and has a stated capacity of LIBOR plus 2.75%, with a LIBOR floor 0.25%. The target advance rate under the amended facility is 85% and the facility matures on October 5, 2021. The premium recapture fee was eliminated for investments financed under the facility. With the amendment the Company paid $12 million of the accrued premium recapture fee with the balance of the $8.5 million due upon the maturity of the facility.$500 million.
ITEM 2. Management’s Discussion and Analysis of Financial Condition and Results of Operations.
FORWARD-LOOKING INFORMATION
The Company makes forward-looking statements herein and will make forward-looking statements in future filings with the Securities and Exchange Commission (the “SEC”), press releases or other written or oral communications within the meaning of Section 27A of the Securities Act of 1933, as amended (the “Securities Act”), and Section 21E of the Securities Exchange Act of 1934, as amended (the “Exchange Act”). For these statements, the Company claims the protections of the safe harbor for forward-looking statements contained in such sections. Forward-looking statements are subject to substantial risks and uncertainties, many of which are difficult to predict and are generally beyond the Company’s control. In particular, it is difficult to fully assess the long-term social, economic and health impact of and success of recovery efforts, including vaccine distribution, relate to COVID-19 at this time due to, among other factors, uncertainty regarding the severity and duration of the outbreak domestically and internationally and the effectiveness of federal, state and local governments’ efforts to contain the spread of COVID-19 and respond to its direct and indirect impact on the U.S. economy and economic activity.time.
These forward-looking statements include information about possible or assumed future results of the Company’s business, financial condition, liquidity, results of operations, plans and objectives. When the Company uses the words “believe,” “expect,” “anticipate,” “estimate,” “plan,” “continue,” “intend,” “should,” “may” or similar expressions, the Company intends to identify forward-looking statements. Statements regarding the following subjects, among others, may be forward-looking: market trends in the Company’s industry, interest rates, real estate values, the debt securities markets, the U.S. housing and the U.S. and foreign commercial real estate markets or the general economy or the market for residential and/or commercial mortgage loans; the Company’s business and investment strategy; the Company’s projected operating results; changes in interest rates and the market value of the Company’s target assets; credit risks; servicing - related risks, including those associated with foreclosure and liquidation; the state of the U.S. and to a lesser extent, international economy generally or in specific geographic regions; economic trends and economic recoveries; the Company’s ability to obtain and maintain financing arrangements, including under the Company’s repurchase agreements, a form of secured financing, and securitizations; the current potential return dynamics available in residential mortgage-backed securities (“RMBS”), and commercial mortgage-backed securities (“CMBS” and collectively with RMBS, “MBS”); the level of government involvement in the U.S. mortgage market; the anticipated default rates on CMBS and Commercial Loans; the loss severity on Non-Agency MBS; the general volatility of the securities markets in which the Company participates; changes in the value of the Company’s assets; the Company’s expected portfolio of assets; the Company’s expected investment and underwriting process; interest rate mismatches between the Company’s target assets and any borrowings used to fund such assets; changes in prepayment rates on the Company’s target assets; effects of hedging instruments on the Company’s target assets; rates of default or decreased recovery rates on the Company’s target assets; the degree to which the Company’s hedging strategies may or may not protect the Company from interest rate volatility; the impact of and changes in governmental regulations, tax law and rates, accounting guidance and similar matters; the Company’s ability to maintain the Company’s qualification as a real estate investment trust for U.S. federal income tax purposes; the Company’s ability to maintain its exemption from registration under the Investment Company Act of 1940, as amended (the “1940 Act”); the availability of opportunities to acquire Agency RMBS, Non-Agency RMBS, CMBS, Residential and Commercial Whole Loans, Residential and Commercial Bridge Loans and other mortgage assets; the availability of qualified personnel; estimates relating to the Company’s ability to make distributions to its stockholders in the future; the Company’s understanding of its competition; and the uncertainty and economic impact of pandemics, epidemics or other public health emergencies, such as the ongoing outbreak of COVID-19.COVID-19; and the Manager's expectations regarding COVID-19 recovery.
The forward-looking statements are based on the Company’s beliefs, assumptions and expectations of its future performance, taking into account all information currently available to it. Forward-looking statements are not predictions of future events. These beliefs, assumptions and expectations can change as a result of many possible events or factors, not all of which are known to the Company. Some of these factors, are described in “Risk Factors” and “Management’s Discussion and Analysis of Financial Condition and Results of Operations” herein and in the Company’s Annual Report on Form 10-K for the year ended December 31, 2019,2020, filed with the SEC on March 6, 2019.5, 2021. These and other risks, uncertainties and factors, including those described in the annual, quarterly and current reports that the Company files with the SEC, could cause its actual results to differ materially from those included in any forward-looking statements the Company makes. All forward-looking statements speak only as of the date they are made. New risks and uncertainties arise over time and it is not possible to predict those events or how they may affect the Company. Except as required by law, the Company is not obligated to, and does not intend to, update or revise any forward-looking statements, whether as a result of new information, future events or otherwise.
Overview
Western Asset Mortgage Capital Corporation, a Delaware corporation, and its Subsidiaries (the “Company” unless otherwise indicated or except where the context otherwise requires “we,” “us” or “our”) commenced operations in May 2012, focused on investing in, financing and managing a diversified portfolio of real estate related securities, whole loans and other financial assets, which we collectively refer to as our target assets. We are externally managed by Western Asset Management Company, LLC (our “Manager”) pursuant to the terms of a management agreement. We conduct our operations to qualify and be taxed as a real estate investment trust, or REIT, for U.S. federal income tax purposes. Accordingly, we generally will not be subject to U.S. federal income taxes on our taxable income that we distribute currently to our stockholders as long as we maintain our intended qualification as a REIT. However, certain activities that we may perform may cause us to earn income which will not be qualifying income for REIT purposes. We have designated a subsidiary as a taxable REIT subsidiary, or TRS, to engage in such activities. We also intend to operate our business in a manner that permits us to maintain our exemption from registration under the Investment Company Act of 1940, as amended (the "1940 Act"). Our common stock is traded on the New York Stock Exchange, or the NYSE, under the symbol "WMC."
Our objective is to provide attractive risk adjusted returns to our stockholders primarily through an attractive dividend, supportedwhich we intend to support with sustainable distributable earnings (which we previously referred to as core earnings,earnings), as well as the potential for higher returns through capital appreciation. Our investment strategy is based on our Manager's perspective of which mix of our target assets it believes provides us with the best risk-reward opportunities at any given time. We also deploy leverage as part of our investment strategy to increase potential returns.
Impact of the COVID-19 Pandemic
The outbreak of COVID-19, which the World Health Organization designated a pandemic, has created extensive disruptions to the global economy and the lives of individuals throughout the world. Governments, businesses, and the public have taken and are continuing to take unprecedented actions to contain the spread of COVID-19 and to mitigate its effects, including quarantines, travel bans, shelter-in-place orders, closures of businesses and schools, fiscal stimulus, and legislation designed to deliver monetary aid and other relief. The scope, duration, and full effects of COVID-19 are rapidly evolving and not fully known. The pandemic and related efforts to contain the COVID-19 have disrupted global economic activity, impacted interest rates, increased economic and market uncertainty, disrupted trade and supply chains, and created unprecedented financial market conditions and disruptions. This rapid disruption in the fixed income markets specifically in mortgage markets had an adverse impact on our book value, liquidity, results of operations, and financial position.
The extreme lack of liquidity in mortgage markets combined with forced selling led to swift and dramatic price declines in late March 2020. The illiquidity was exacerbated by inadequate demand for MBS among primary dealers due to balance sheet constraints. On March 23, 2020, the significant decrease in our asset values resulted in margin calls of approximately $116.5 million from our repurchase agreement counterparties. Additional margin calls occurred in the following days. Failure to have posted adequate collateral for these margin calls would have given counterparties the right to call events of default under our repurchase agreements. Under an event of default the counterparty could sell or take ownership of the collateral to satisfy our repurchase agreement obligation and we would be liable for any shortfall. To meet the margin calls it was necessary to sell a material portion of our investment portfolio. In response to the unprecedented market volatility, during the first two quarters of 2020 we implemented measures to improve our balance sheet by increasing liquidity, reduce leverage, and seek financing arrangements as an alternative to short term repurchase agreements with daily margin requirements to preserve long-term shareholder value. These measures included, but were not limited to, the following:
•Suspended our first quarter and second quarter common dividends to preserve liquidity.
•In March 2020 terminated all interest rate hedges and further reduced margin call volatility.
•To meet margin calls and reduce our exposure to short-term mark to market financing, we old approximately $2.1 billion of Agency MBS, $107.3 million of Non-Agency MBS and $144.3 million of conforming residential whole loans.
•Our Manager waived management fees from March 2020 through May 2020.
•In April 2020, we closed an 18 month term financing arrangement without margin requirements for our entire non-QM loan portfolio. The impact of this financing was to reduce our exposure to repurchase agreement financing by $385 million and the associated margin calls from such agreements.
•In May 2020, we closed a 12 month term financing arrangement for Non-Agency RMBS and Non-Agency CMBS, significantly mitigating exposure to margin volatility. The aggregate financing provided by the counterparty with respect to the assets covered under this confirmation is approximately $108.8 million and the market value of such assets is approximately $182.7 million.
•In June 2020, we completed a residential mortgage-backed securitization of $355.8 million of our Residential Whole Loan investments, enabling the Company to secure $341.7 million of long-term financing at a weighted average interest rate of 2.0%.
These above actions enabled us to strengthening our balance sheet, stabilizing our financing arrangements. In the third quarter of 2020, we implemented the the following measure to further reduced leverage, improve liquidity, shareholders equity and the earnings power of the portfolio. These measures included, but were not limited to, the following:
•In July, the Company retired $5.0 million of its 6.75% Convertible Senior Notes at a 25% discount to par value, in exchange for the issuance of 1.4 million shares of our common stock.
•In the third quarter 2020, we reduced leverage on our commercial loan portfolio by 21.9%, which were financed under our commercial warehouse facility.
•In October 2020, we amended our existing residential loan facility to reduce borrowing costs. The amended facility has a 12 month term bearing an interest rate of one month LIBOR plus 2.75%.
•Also, for the nine months ended September 30, 2020, we reduced our repurchase agreement financings by 87.3% to $358.5 million.
For the three months ended September 30, 2020, we had improved financial results, which included significant recovery in asset valuations and improved net interest margin on our investments. With mortgage credit markets railing during the quarter, valuations on both our Residential Whole Loan portfolio and our commercial investments benefited meaningfully. Also, because of the continued improvement in the underlying performance of our portfolio, we were able to reinstate our dividend in the third quarter, an important step for the Company and our shareholders.
Our Manager's view is the road ahead will be a long hard slog. The full impact of COVID-19 on our results of operations, financial position and cost of capital is still uncertain as it depends on several factors beyond our control. Our Manager outlook is that (i) COVID-19 related growth setbacks have meaningful reduced global and U.S. growth, (ii) the medical battle will take time and prolonged efforts but recent developments are encouraging (iii) U.S. and global inflation are expected to be very subdued, (iv) Fiscal policy will need to remain supportive, and (v) after recovery begins central banks are expected to keep rates ultra low. We continue to operate with a defensive stance to preserve liquidity, reduce our exposure to short-term repurchase agreement financings, and reduce expenses.
Our Investment Strategy
Our Manager’s investment philosophy, which developed from a singular focus in fixed-income asset management over a variety of credit cycles and conditions, is to provide clients with a diversified, long-term value-oriented portfolio. We benefit from the breadth and depth of our Manager’s overall investment philosophy, which focuses on a macroeconomic analysis as well as an in-depth analysis of individual assets and their relative value. In making investment decisions on our behalf, our Manager seeks to identify assets across the broad mortgage universe with attractive risk adjusted returns, which incorporates its view on the outlook for the mortgage markets, including relative valuation, supply and demand trends, the level of interest rates, the shape of the yield curve, prepayment rates, financing and liquidity, commercial and residential real estate prices, delinquencies, default rates, recovery of various segments of the economy and vintage of collateral, subject to maintaining our REIT qualification and our exemption from registration under the 1940 Act. We do not have an established minimum current rating requirement for our investments.
Our Target Assets
Residential Whole Loans. — Residential Whole Loans are mortgages secured by single family residences held directly by us or through consolidated trusts with us holding the beneficial interest in the trusts. Our Residential Whole Loans are mainly adjustable rate mortgages that do not qualify for the Consumer Finance Protection Bureau’s (or CFPB) safe harbor provision for “qualified mortgages” ("Non QM" mortgages)Non-QM mortgages"). Our Manager’s review, relating to Non QMNon-QM mortgages, includes an analysis of the loan originator’s procedures and documentation for compliance with Ability to Repay requirements. As discussed in Note 7 "Financing," we have and may continue to securitize whole loan interests, selling more senior interests in the pool of loans and retaining residual portions. The characteristics of our Residential Whole Loans may vary going forward.
Commercial Whole Loans. — Commercial Whole Loans are generally loans ranging from $5 million to $125 million, secured by commercial real estate typically short-term loans. The collateral types may include hospitality, senior care living
facilities, multifamily, office retail and industrial properties. These loans may be held directly by us or through consolidated trusts with us holding the beneficial interest in the trust.
Commercial Mezzanine Loans. — Commercial mezzanine loans are generally structured to represent a senior position in the borrower’s equity in, and subordinate to a first mortgage loan, on a property. These loans are generally secured by pledges of ownership interests, in whole or in part, in entities that directly or indirectly own the real property. At times, mezzanine loans may be secured by additional collateral, including letters of credit, personal guarantees, or collateral unrelated to the property. Mezzanine loans may be structured to carry either fixed or floating interest rates as well as carry a right to participate in a percentage of gross revenues and a percentage of the increase in the fair market value of the property securing
the loan. Mezzanine loans may also contain prepayment lockouts, penalties, minimum profit hurdles and other mechanisms to protect and enhance returns to the lender. Mezzanine loans usually have maturities that match the maturity of the related mortgage loan but may have shorter or longer terms. Depending on the structure of a transaction, Commercial Mezzanine loans may or may not qualify as "qualifying real estate interests" for purposes of the 1940 Act.
Non-Agency RMBS. — RMBS that are not guaranteed by a U.S. Government agency or U.S. Government-sponsored entity. The mortgage loan collateral for Non-Agency RMBS consists of residential mortgage loans that do not generally conform to underwriting guidelines issued by a U.S. Government agency or U.S. Government-sponsored entity due to certain factors, including mortgage balances in excess of Agency underwriting guidelines, borrower characteristics, loan characteristics and/or level of documentation, and therefore are not issued or guaranteed by a U.S. Government agency or U.S. Government-sponsored entity. The mortgage loan collateral may be classified as subprime, Alternative-A or prime depending on the borrower’s credit rating and the underlying level of documentation. Non-Agency RMBS collateral may also include reperforming loans, which are conventional mortgage loans that were current at the time of the securitization, but had been delinquent in the past. Non-Agency RMBS may be secured by fixed-rate mortgages, adjustable-rate mortgages or hybrid adjustable-rate mortgages.
Non-Agency CMBS. — Fixed and floating rate CMBS for which the principal and interest payments are not guaranteed by a U.S. Government agency or U.S. Government-sponsored entity.
Agency CMBS. — Fixed and floating rate CMBS, for which the principal and interest payments are guaranteed by a U.S. Government agency or U.S. Government-sponsored entity, but for which the underlying mortgage loans are secured by real property other than single family residences. These may include, but are not limited to Fannie Mae DUS (Delegated Underwriting and Servicing) MBS, Freddie Mac Multifamily Mortgage Participation Certificates, Ginnie Mae project loan pools, and/or CMOs structured from such collateral. These securities generally have prepayment protection in the form of defeasance, yield maintenance or points.
Agency RMBS. — Agency RMBS, which are RMBS for which the principal and interest payments are guaranteed by a U.S. Government agency, such as the Government National Mortgage Association (“GNMA” or “Ginnie Mae”), or a U.S. Government-sponsored entity ("GSE"), such as the Federal National Mortgage Association (“FNMA” or “Fannie Mae”) or the Federal Home Loan Mortgage Corporation (“FHLMC” or “Freddie Mac”). The Agency RMBS we acquire can be secured by fixed-rate mortgages, adjustable-rate mortgages or hybrid adjustable-rate mortgages. Fixed-rate mortgages have interest rates that are fixed for the term of the loan and do not adjust. The interest rates on adjustable-rate mortgages generally adjust annually (although some may adjust more frequently) to an increment over a specified interest rate index. Hybrid adjustable-rate mortgages have interest rates that are fixed for a specified period of time (typically three, five, seven or ten years) and, thereafter, adjust to an increment over a specified interest rate index. Adjustable-rate mortgages and hybrid adjustable-rate mortgages generally have periodic and lifetime constraints on the amount by which the loan interest rate can change on any predetermined interest rate reset date.
Non-Agency RMBS. — RMBS that are not guaranteed by a U.S. Government agency or U.S. Government-sponsored entity. The mortgage loan collateral for Non-Agency RMBS consists of residential mortgage loans that do not generally conform to underwriting guidelines issued by a U.S. Government agency or U.S. Government-sponsored entity due to certain factors, including mortgage balances in excess of Agency underwriting guidelines, borrower characteristics, loan characteristics and/or level of documentation, and therefore are not issued or guaranteed by a U.S. Government agency or U.S. Government-sponsored entity. The mortgage loan collateral may These investments can be classified as subprime, Alternative-A or prime depending on the borrower’s credit rating and the underlying level of documentation. Non-Agency RMBS collateral may also include reperforming loans, which are conventional mortgage loans that were current at the time of the securitization, but had been delinquent in the past. Non-Agency RMBS may be secured by fixed-rate mortgages, adjustable-rate mortgages or hybrid adjustable-rate mortgages.
Non-Agency CMBS. — Fixed and floating rate CMBS for which the principal and interest payments are not guaranteed by a U.S. Government agency or U.S. Government-sponsored entity. We do not have an established minimum current rating requirement for such investments.
Agency CMBS. — Fixed and floating rate CMBS, for which the principal and interest payments are guaranteed by a U.S. Government agency or U.S. Government-sponsored entity, but for which the underlying mortgage loans are secured by real property other than single family residences. These may include, but are not limited to Fannie Mae DUS (Delegated Underwriting and Servicing) MBS, Freddie Mac Multifamily Mortgage Participation Certificates, Ginnie Mae project loan pools, and/or CMOs structured from such collateral. These securities generally have prepayment protection in the form of defeasance, yield maintenancepools, TBA and CMO (including interest only, principal only or points.
GSE Risk Sharing Securities Issued by Fannie Mae and Freddie Mac. — From time to time we have and may in the future continue to invest in risk sharing securities issued by Fannie Mae and Freddie Mac. Principal and interest payments on these securities are based on the performance of a specified pool of Agency residential mortgages. The payments due on these securities, however, are not secured by the referenced mortgages. The payments due are full faith and credit obligations of Fannie Mae or Freddie Mac respectively, but neither agency guarantees full payment of the underlying mortgages. Investments in these securities generally are not qualifying assets for purposes of the 75% real estate asset test applicable to REITs and
generally do not generate qualifying income for purposes of the 75% real estate income test applicable to REITs. As a result, we may be limited in our ability to invest in such assets.
TBAs. — We may utilize TBAs, in order to invest in Agency RMBS. Pursuant to these TBAs, we agree to purchase (or deliver), for future settlement, Agency RMBS with certain principal and interest terms and certain underlying collateral, but the particular Agency RMBS to be delivered is not identified until shortly before the TBA settlement date. Our ability to invest in Agency RMBS through TBAs may be limited by the 75% real estate income and asset tests applicable to REITs.
Mortgage pass-through certificates. — Mortgage pass-through certificates are securities representing interests in “pools” of mortgage loans secured by residential real property where payments of both interest and scheduled principal, plus pre-paid principal, on the underlying loan pools are made monthly to holders of the securities, in effect “passing through” monthly payments made by the individual borrowers on the mortgage loans that underlie the securities, net of fees paid to the issuer/guarantor of the securities and servicers of the underlying mortgages.
Interest-Only Strips or IOs. — This type of security entitles the holder only to payments of interest based on a notional principal balance. The yield to maturity of Interest-Only Strips is extremely sensitive to the rate of principal payments (particularly prepayments) on the underlying pool of mortgages. We invest in these types of securities primarily to take advantage of particularly attractive prepayment-related or structural opportunities in the MBS markets, as well as to help manage the duration of our overall portfolio.
Inverse Interest-Only Strips or IIOs. — This type of security has a coupon with an inverse relationship to its index and is subject to caps and floors. Inverse Interest-Only MBS entitles the holder to interest only payments based on a notional principal balance, which is typically equal to a fixed rate of interest on the notional principal balance less a floating rate of interest on the notional principal balance that adjusts according to an index subject to set minimum and maximum rates. The current yield of Inverse Interest-Only MBS will generally decrease when its related index rate increases and increase when its related index rate decreases.
Agency and Non-Agency CMBS IO and IIO Securities. — Interest-Only and Inverse Interest-Only securities for which the underlying collateral is commercial mortgages the principal and interest on which may or may not be guaranteed by a U.S Government agency or U.S. Government-sponsored entity. Unlike single family residential mortgages in which the borrower, generally, can prepay at any time, commercial mortgages frequently limit the ability of the borrower to prepay, thereby providing a certain level of prepayment protection. Common restrictions include yield maintenance and prepayment penalties, the proceeds of which are generally at least partially allocable to these securities, as well as, defeasance.
Principal-Only Strips or POs. — This type of security generally only entitles the holder to receive cash flows that are derived from principal repayments of an underlying loan pool, but in the case of Non-Agency Principal-Only Strips will also include cash flows from default recoveries and excess interest. The yield to maturity of Principal-Only Strips is extremely sensitive to the rate of principal payments (particularly prepayments) on the underlying pool of mortgages. We invest in these types of securities primarily to take advantage of structural opportunities in the MBS markets.
Collateralized Mortgage Obligations or CMOs. — These are securities, which can be Agency or Non-Agency, that are structured from residential and/or commercial pass-through certificates, which receive monthly payments of principal and interest. CMOs divide the cash flows which come from the underlying mortgage pass-through certificates into different classes of securities that may have different maturities and different weighted average lives than the underlying pass-through certificates.
ABS. — Debt and/or equity tranches of securitizations backed by various asset classes including, but not limited to, automobiles, credit cards, equipment, franchises, recreational vehicles and student loans. Investments in ABS generally are not qualifying assets for purposes of the 75% real estate asset test applicable to REITs and generally do not generate qualifying income for purposes of the 75% real estate income test applicable to REITs. As a result, we may be limited in our ability to invest in such assets.
Other investments. — In addition to MBS, our principal investment, and ABS from time to time, we may also make other investments in securities, which our Manager believes will assist us in meeting our investment objective and are consistent with our overall investment policies. These investments will normally be limited by the REIT requirements that 75%
our assets be real estate assets and that 75% of our income be generated from real estate, thereby limiting our ability to invest in such assets.
Our Investment Portfolio
Our investment portfolio composition at September 30, 20202021.
Our Financing Strategy
TheDuring 2020, the uncertainties created by the COVID-19 pandemic have made it challenging to obtain financing arrangements on favorable terms, including our repurchase agreements, term financings, and securitizations. We expect to continue to seekIn the latter part of 2020 and continuing into 2021 terms for financing arrangements as an alternative to short termhave improved significantly. We have primarily financed our investment acquisitions with repurchase agreements with daily margin requirements, including but not limited to term financing, securitization and convertible senior unsecured notes, as market permit. Theagreements. We believe the amount of leverage we use foris consistent with our portfolio depends uponintention of keeping total borrowings within a prudent range, as determined by our Manager, taking into account a variety of factors such as general economic, political and financial market conditions, the anticipated liquidity and price volatility of our assets, the availability and cost of financing the assets, the creditworthiness of financing counterparties and the health of the U.S. residential and commercial mortgage markets. In utilizing leverage, we seek to enhance equity returns while limiting our exposure to interest rate volatility and daily margin calls. We areexpect to continue to seek financing arrangements without daily margin requirements or with margin requirements which apply only after a significant reduction in the valuation of the assets financed, including but not requiredlimited to maintain any particular leverage ratio.term financing, securitization and convertible senior unsecured notes, as the market permits. We expect to maintain a debt-to-equity ratio of two to sixfour and a half times the amount of our stockholders’ equity, depending on our investment composition.
See Financing Activity for details of financing arrangements we recently entered into to reduce our exposure to short-term financings with daily mark to market exposure.
Repurchase Agreements
We have primarily financed our investment acquisitions with repurchase agreements. TheOur repurchase agreements bear interest at a contractually agreed-upon rate and historically had terms ranging from one month to twelve18 months. Our repurchase agreement borrowings are accounted for as secured borrowings when we maintain effective control of the financed assets. Under these repurchase agreements, the respective counterparties retain the right to determine the fair value of the underlying collateral. A reduction in the value of pledged assets requiresmay require us to post additional securities as collateral, pay down
borrowings or establish cash margin accounts with the counterparties in order to re-establish the agreed-upon collateral requirements, and is referred to as a margin call.advance rates. Our inability to post adequate collateral for a margin call by a counterparty, in a timeframe as short as the close of the same business day, could result in a condition of default under our repurchase agreements, thereby enabling the counterparty to liquidate the collateral pledged by us, which may have a material adverse effect on our financial position, results of operations and cash flows.
Our repurchase agreement counterparties generally require collateral in excess of the loan amount, or haircuts. As of September 30, 2020,2021, the ranges of the haircuts on our investments were as follows:
| | | | | | | | | | | | | | | | | | | | |
| Collateral | | Minimum | | Maximum (excluding IOs and IIOs) | | Maximum (including IOs and IIOs) |
| Agency RMBS | | 25.0% | | n/a | | 25.0% |
| | | | | | |
| Non-Agency RMBS | | 32.5% | | 35.0% | | 35.0% |
| Non-Agency CMBS | | 30.0% | | 45.0% | | n/a |
| Other securities | | 32.5% | | 60.0% | | n/a |
Residential Whole Loans(1) | | 20.0% | | 80.0% | | n/a |
Commercial Loans(2) | | 22.0% | | 67.2% | | n/a |
| | | | | | | | | | | | | | | | | | | | |
| Collateral | | Minimum | | Maximum (excluding IOs and IIOs) | | Maximum (including IOs and IIOs) |
| Agency RMBS | | 25.0% | | n/a | | 25.0% |
| | | | | | |
| Non-Agency RMBS | | 35.0% | | 35.0% | | 35.0% |
| Non-Agency CMBS | | 25.0% | | 40.0% | | n/a |
| Other securities | | 35.0% | | 60.0% | | n/a |
Residential Whole Loans(1) | | 15.0% | | 50.0% | | n/a |
Commercial Loans(2) | | 22.0% | | 55.0% | | n/a |
(1) Includes Residential Bridge Loans.
(2) Includes Securitized commercial loans.
Our Hedging Strategy and Risk Management Strategy
Our overall portfolio strategy is designed to generate attractive returns to our investors through various economic cycles. We believe our broad approach to investing in the real estate mortgage markets, which considers all categories of real estate assets, allows us to invest in a diversified portfolio and help mitigate our portfolio from risks that arise from investing in a single or limited collateral type. In connection with our risk management activities, we may enter into a variety of derivative and non-derivative instruments. When purchased, our primary objective for acquiring these derivatives and non-derivative instruments is to mitigate our exposure to future events that are outside our control. Our derivative instruments are designed to mitigate the effects of market risk and cash flow volatility associated with interest rate risk, including prepayment risk. As part of our hedging strategy, we may enter into, interest rate swaps, including forward starting swaps, interest rate swaptions, U.S. Treasury options, future contracts, TBAs, total return swaps, credit default swaps, foreign current swaps and forwards and other similar instruments. There can be no assurance that appropriate hedging strategies will be available or that if implemented they will be successful.
Critical Accounting Policies
The consolidated financial statements include our accounts, those of our wholly-owned subsidiaries and certain VIEs in which we are the primary beneficiary. All intercompany amounts have been eliminated in consolidation. In accordance with GAAP, our consolidated financial statements require the use of estimates and assumptions that involve the exercise of judgment and use of assumptions as to future uncertainties. In accordance with SEC guidance, the following discussion addresses the accounting policies that we currently apply. Our most critical accounting policies will involve decisions and assessments that could affect our reported assets and liabilities, as well as our reported revenues and expenses. We believe that all of the decisions and assessments upon which our consolidated financial statements have been based were reasonable at the time made and based upon information available to us at that time. For a review of recent accounting pronouncements that may impact our results of operations, see Note 2 of our “Notes to Consolidated Financial Statements (Unaudited).”.
There have been no significant changes to our critical accounting policies that are disclosed in our most recent Annual Report on Form 10-K for the year ended December 31, 2019,2020, other than the newsignificant accounting policy adopted describeddisclosed below.
Real Estate Owned
REO represents real estate property acquired by the Company through foreclosure and it is classified as held for sale. Upon completion of the foreclosure, the Company initially records the REO at fair value less estimated costs to sell the property. In subsequent periods, REO is reported at the lower of the current carrying amount or fair value less estimated selling costs and it is classified in Note 2 to"Other assets" in the Consolidated Financial Statements.Balance Sheets. Gains/losses recognized on foreclosure as well as realized gains/losses on the disposition of REO are reported by the Company in "Realized gain (loss), net" in the Consolidated Statements of Operations.
20202021 Activity
Investment Activity
The COVID-19 pandemic has created unprecedented market disruptionWe continually evaluate potential investments and dislocation. The extreme lackour investment selection is based on supply and demand of liquidity in mortgage markets combined with forced selling led to swiftour target assets, costs of financing, and dramatic price declines.the expected future interest rate volatility costs of hedging. During the first quarternine months ended September 30, 2021, we acquired $243.3 million of 2020 and the early part of the second quarter, the significant decline in asset values resulted in us having to sell assets in order to meet margin calls by our repurchase agreement counterparties. By the end of the second quarter and into the third quarter the equity and credit markets rallied, driven by improved liquidity. Our portfolio has experienced improved valuations and weresidential whole loans. We did not have significant asset sales or margin calls during the third quarter.sell any investments.
The following table presents our investing activity for the nine months ended September 30, 20202021 (dollars in thousands):
| | | | | | | | | | | | | | | | | | | | | | | | | | | | | | | | | | | | |
| Balance at | | Loan Modification/Capitalized Interest | Principal Payments and Basis Recovery | Proceeds from
Sales | Transfers to REO | Realized Gain/(Loss) | Unrealized Gain/(loss) | Premium and discount amortization, net | | VIE Consolidation / Deconsolidation, net | Balance at |
| Investment Type | December 31, 2019 | Purchases | | September 30, 2020 |
| Agency RMBS and Agency RMBS IOs | $ | 356,686 | | $ | 64,008 | | $ | — | | $ | (17,425) | | $ | (402,965) | | n/a | $ | 11,543 | | $ | (9,713) | | $ | (281) | | | $ | — | | $ | 1,853 | |
| Non-Agency RMBS | 45,814 | | — | | — | | (1,802) | | (12,658) | | n/a | (60) | | (5,491) | | 13 | | | — | | 25,816 | |
| Agency CMBS and Agency CMBS IOs | 1,438,569 | | 185,082 | | — | | (920) | | (1,670,664) | | n/a | 109,539 | | (60,970) | | (636) | | | — | | — | |
| Non-Agency CMBS | 316,019 | | 48,505 | | — | | (11,276) | | (94,586) | | n/a | (22,702) | | (52,179) | | 4,425 | | | (6,885) | | 181,321 | |
Other securities(1) | 80,161 | | 23,401 | | — | | (1,022) | | (35,957) | | n/a | (6,110) | | (15,608) | | (3,810) | | | — | | 41,055 | |
| Total MBS and other securities | 2,237,249 | | 320,996 | | — | | (32,445) | | (2,216,830) | | n/a | 92,210 | | (143,961) | | (289) | | | (6,885) | | 250,045 | |
| Residential Whole Loans | 1,375,860 | | 113,338 | | 614 | | (208,940) | | (144,258) | | — | | (10,511) | | (25,568) | | (3,538) | | | — | | 1,096,997 | |
| Residential Bridge Loans | 36,419 | | — | | — | | (17,530) | | — | | (419) | | (273) | | (289) | | (67) | | | — | | 17,841 | |
| Commercial Loans | 370,213 | | — | | 33 | | (37,729) | | — | | — | | — | | (7,218) | | 352 | | | — | | 325,651 | |
| Securitized commercial loans | 909,040 | | — | | — | | (211,204) | | — | | — | | — | | (109,683) | | 4,909 | | | 1,094,483 | | 1,687,545 | |
| Total Investments | $ | 4,928,781 | | $ | 434,334 | | $ | 647 | | $ | (507,848) | | $ | (2,361,088) | | $ | (419) | | $ | 81,426 | | $ | (286,719) | | $ | 1,367 | | | $ | 1,087,598 | | $ | 3,378,079 | |
| | | | | | | | | | | | | | | | | | | | | | | | | | | | | | | | | | |
| Balance at | | Loan Modification/Capitalized Interest | Principal Payments and Basis Recovery | Proceeds from
Sales | Transfers to REO | Realized Gain/(Loss) | Unrealized Gain/(loss) | Premium and discount amortization, net | | | Balance at |
| Investment Type | December 31, 2020 | Purchases | | September 30, 2021 |
| Agency RMBS and Agency RMBS IOs | $ | 1,708 | | $ | — | | N/A | $ | (258) | | $ | — | | N/A | $ | — | | $ | (108) | | $ | — | | | | $ | 1,342 | |
| Non-Agency RMBS | 25,381 | | — | | N/A | (904) | | — | | N/A | — | | 3,710 | | (176) | | | | 28,011 | |
| | | | | | | | | | | | |
| Non-Agency CMBS | 164,081 | | — | | N/A | (13,479) | | — | | N/A | (5,929) | | (16,254) | | 6,231 | | | | 134,650 | |
Other securities(1) | 48,754 | | — | | N/A | — | | — | | N/A | — | | 4,553 | | (1,214) | | | | 52,093 | |
| Total MBS and other securities | 239,924 | | — | | N/A | (14,641) | | — | | N/A | (5,929) | | (8,099) | | 4,841 | | | | 216,096 | |
| Residential Whole Loans | 1,008,782 | | 243,322 | | 310 | | (309,395) | | — | | — | | — | | 13,667 | | (7,269) | | | | 949,417 | |
| Residential Bridge Loans | 13,916 | | — | | — | | (7,667) | | — | | (752) | | (155) | | 639 | | (21) | | | | 5,960 | |
| Commercial Loans | 310,523 | | — | | — | | (103,272) | | — | | (30,000) | | — | | (48,630) | | 145 | | | | 128,766 | |
| Securitized commercial loans | 1,605,335 | | — | | — | | (354,202) | | — | | — | | — | | 107,423 | | 18,449 | | | | 1,377,005 | |
| Total Investments | $ | 3,178,480 | | $ | 243,322 | | $ | 310 | | $ | (789,177) | | $ | — | | $ | (30,752) | | $ | (6,084) | | $ | 65,000 | | $ | 16,145 | | | | $ | 2,677,244 | |
(1) Other securities include $34.1$45.8 million of GSE CRTs and $7.0$6.3 million of ABS at September 30, 2020.2021.
Portfolio Characteristics
Our Agency Portfolio
The following table summarizes our Agency portfolio by investment category as of September 30, 20202021 (dollars in thousands):
| | | | | | | | | | | | | | | | | | | | | | | |
| | Principal Balance | | Amortized Cost | | Fair Value | | Net Weighted
Average Coupon |
| | | | | | | |
| | | | | | | |
| | | | | | | |
| | | | | | | |
| | | | | | | |
| | | | | | | |
| | | | | | | |
Agency RMBS IOs and IIOs (1) | N/A | | $ | 105 | | | $ | 153 | | | 2.4 | % |
Agency RMBS IOs and IIOs accounted for as derivatives (1) | N/A | | N/A | | 1,700 | | | 3.0 | % |
| Total Agency RMBS | — | | | 105 | | | 1,853 | | | 2.9 | % |
| Total | $ | — | | | $ | 105 | | | $ | 1,853 | | | 2.9 | % |
| | | | | | | | | | | | | | | | | | | | | | | |
| | Principal Balance | | Amortized Cost | | Fair Value | | Net Weighted
Average Coupon |
| | | | | | | |
| | | | | | | |
| | | | | | | |
| | | | | | | |
| | | | | | | |
| | | | | | | |
| | | | | | | |
Agency RMBS IOs and IIOs (1) | N/A | | $ | 63 | | | $ | 134 | | | 1.4 | % |
Agency RMBS IOs and IIOs accounted for as derivatives (1) | N/A | | N/A | | 1,208 | | | 1.3 | % |
| Total Agency RMBS | — | | | 63 | | | 1,342 | | | 1.3 | % |
| Total | $ | — | | | $ | 63 | | | $ | 1,342 | | | 1.3 | % |
(1)IOs and IIOs have no principal balances and bear interest based on a notional balance. The notional balance is used solely to determine interest distributions on the interest-only class of securities.
Credit Sensitive Portfolio
The following table presents information by vintage(1) as it relates to our credit sensitive investment portfolio at September 30, 2020:
| | | | | | | | | | | | | | | | | | | | | | | | | | | | | | | | | | | | | | | | | | | | | | | | | | | | | | | | | | | | | | | | | | | | | | | | | |
| Credit Sensitive Securities | Pre 2011 | | | | 2011 | | 2012 | | 2013 | | 2014 | | 2015 | | 2016 | | 2017 | | 2018 | | 2019 | | 2020 | | Total |
| Non-Agency RMBS | 0.1 | % | | | | — | % | | — | % | | — | % | | — | % | | — | % | | — | % | | 0.3 | % | | 0.2 | % | | — | % | | — | % | | 0.6 | % |
| Non-Agency RMBS IOs | — | % | | | | — | % | | — | % | | — | % | | — | % | | — | % | | — | % | | 0.1 | % | | — | % | | — | % | | — | % | | 0.1 | % |
| | | | | | | | | | | | | | | | | | | | | | | | | |
| Non-Agency CMBS | 0.2 | % | | | | 0.9 | % | | — | % | | — | % | | 0.4 | % | | 0.3 | % | | 0.3 | % | | 0.1 | % | | 1.0 | % | | 1.9 | % | | 0.2 | % | | 5.3 | % |
| Other securities | — | % | | | | — | % | | — | % | | — | % | | 0.1 | % | | 0.1 | % | | 0.1 | % | | 0.1 | % | | 0.5 | % | | — | % | | 0.4 | % | | 1.3 | % |
| Residential Whole Loans | 0.1 | % | | | | 0.1 | % | | 0.1 | % | | 1.1 | % | | 0.6 | % | | — | % | | 0.8 | % | | 2.5 | % | | 15.5 | % | | 11.5 | % | | 0.1 | % | | 32.4 | % |
| Residential Bridge Loans | — | % | | | | — | % | | — | % | | — | % | | — | % | | — | % | | — | % | | 0.1 | % | | 0.4 | % | | — | % | | — | % | | 0.5 | % |
| Securitized commercial loans | — | % | | | | — | % | | — | % | | — | % | | 36.5 | % | | — | % | | — | % | | — | % | | 13.6 | % | | — | % | | — | % | | 50.1 | % |
| Commercial Loans | — | % | | | | — | % | | — | % | | — | % | | — | % | | — | % | | — | % | | — | % | | 2.2 | % | | 7.5 | % | | — | % | | 9.7 | % |
| Total | 0.4 | % | | | | 1.0 | % | | 0.1 | % | | 1.1 | % | | 37.6 | % | | 0.4 | % | | 1.2 | % | | 3.2 | % | | 33.4 | % | | 20.9 | % | | 0.7 | % | | 100 | % |
(1) Based on carrying amount of the investments.
Non-Agency RMBS
The following table presents the fair value and weighted average purchase price for each of our Non-agency RMBS categories, including IOs accounted for as derivatives, together with certain of their respective underlying loan collateral attributes and current performance metrics as of September 30, 20202021 (fair value dollars in thousands):
| | | | | | | | | | | | | | | | | | | | | | | | | | | | | | | | | | | | | | | | | | | | |
| | | | | Weighted Average |
| Category | | Fair Value | | Purchase
Price | | Life (Years) | | Original LTV | | Original
FICO | | 60+ Day
Delinquent | | 6-Month
CPR |
| Prime | | $ | 8,636 | | | $ | 71.26 | | | 11.8 | | | 68.9 | % | | 769 | | | 4.0 | % | | 15.0 | % |
| Alt-A | | 17,180 | | | 47.49 | | | 12.0 | | | 80.6 | % | | 665 | | | 20.9 | % | | 9.0 | % |
| | | | | | | | | | | | | | |
| Total | | $ | 25,816 | | | $ | 55.44 | | | 12.0 | | | 76.7 | % | | 700 | | | 15.3 | % | | 11.0 | % |
Non-Agency CMBS
| | | | | | | | | | | | | | | | | | | | | | | | | | | | | | | | | | | | | | | | | | | | |
| | | | | Weighted Average |
| Category | | Fair Value | | Purchase
Price | | Life (Years) | | Original LTV | | Original
FICO | | 60+ Day
Delinquent | | CPR |
| Prime | | $ | 10,324 | | | $ | 74.82 | | | 5.6 | | | 59.4 | % | | 779 | | | 4.1 | % | | 40.5 | % |
| Alt-A | | 17,687 | | | 44.10 | | | 10.5 | | | 71.4 | % | | 589 | | | 18.5 | % | | 9.6 | % |
| | | | | | | | | | | | | | |
| Total | | $ | 28,011 | | | $ | 55.42 | | | 8.7 | | | 67.0 | % | | 659 | | | 13.2 | % | | 21.0 | % |
Non-Agency CMBS
The following table presents certain characteristics of our Non-Agency CMBS portfolio as of September 30, 20202021 (dollars in thousands):
| | | | | | | | | | | | | | | | | | | | | | | | | | | | | | | | |
| | | | | Principal | | | | Weighted Average |
| Type | | Vintage | | Balance | | Fair Value | | Life (Years) | | Original LTV |
| Conduit: | | | | | | | | | | |
| | | 2006-2009 | | $ | 14,126 | | | $ | 6,735 | | | 1.1 | | | 72.5 | % |
| | | 2010-2020 | | 94,107 | | | 52,252 | | | 3.7 | | | 61.6 | % |
| | | | | 108,233 | | | 58,987 | | | 3.4 | | | 62.9 | % |
| Single Asset: | | | | | | | | | | |
| | | 2010-2020 | | 148,217 | | | 122,334 | | | 2.2 | | | 66.2 | % |
| Total | | | | $ | 256,450 | | | $ | 181,321 | | | 2.6 | | | 65.1 | % |
| | | | | | | | | | | | | | | | | | | | | | | | | | | | | | | | |
| | | | | Principal | | | | Weighted Average |
| Type | | Vintage | | Balance | | Fair Value | | Life (Years) | | Original LTV |
| Conduit: | | | | | | | | | | |
| | | 2006-2009 | | $ | 2,229 | | | $ | 1,677 | | | 2.4 | | | 75.0 | % |
| | | 2010-2020 | | 94,107 | | | 34,657 | | | 5.8 | | | 63.6 | % |
| | | | | 96,336 | | | 36,334 | | | 5.7 | | | 64.1 | % |
| Single Asset: | | | | | | | | | | |
| | | 2010-2020 | | 116,104 | | | 98,316 | | | 1.7 | | | 64.9 | % |
| Total | | | | $ | 212,440 | | | $ | 134,650 | | | 2.8 | | | 64.7 | % |
Residential Whole Loans
The Residential Whole Loans have low LTV's and are comprised of 2,7012,187 Non-QM adjustable rate mortgages and ninesix investor fixed rate mortgages. The following table presents certain information about our Residential Whole Loans investment portfolio at September 30, 20202021 (dollars in thousands):
| | | | | | | | | | | | | | | | | | | | | | | | | | | | | | | | | | | | | | | | | | | | |
| | | | | | | Weighted Average |
| Current Coupon Rate | | Number of Loans | | Principal
Balance | | Original LTV | | Original FICO Score(1) | | Expected
Life (years) | | Contractual
Maturity
(years) | | Coupon
Rate |
| 3.01 – 4.00% | | 73 | | $ | 25,295 | | | 57.0 | % | | 708 | | | 3.6 | | 23.7 | | 3.8 | % |
| 4.01– 5.00% | | 1,287 | | 448,466 | | | 61.8 | % | | 751 | | | 2.5 | | 27.9 | | 4.9 | % |
| 5.01 – 6.00% | | 1,310 | | 585,577 | | | 64.3 | % | | 740 | | | 2.7 | | 27.8 | | 5.4 | % |
| 6.01 – 7.00% | | 38 | | 13,798 | | | 67.4 | % | | 723 | | | 3.0 | | 27.3 | | 6.3 | % |
| 7.01 - 8.00% | | 2 | | 512 | | | 73.2 | % | | 753 | | | 4.0 | | 27.9 | | 7.1 | % |
| | | | | | | | | | | | | | |
| Total | | 2,710 | | $ | 1,073,648 | | | 63.1 | % | | 744 | | | 2.7 | | 27.7 | | 5.1 | % |
| | | | | | | | | | | | | | | | | | | | | | | | | | | | | | | | | | | | | | | | | | | | |
| | | | | | | Weighted Average |
| Current Coupon Rate | | Number of Loans | | Principal
Balance | | Original LTV | | Original FICO Score(1) | | Expected
Life (years) | | Contractual
Maturity
(years) | | Coupon
Rate |
| 2.01% – 3.00% | | 14 | | $ | 7,816 | | | 66.0 | % | | 746 | | | 5.7 | | 28.4 | | 2.7 | % |
| 3.01% – 4.00% | | 332 | | 163,681 | | | 62.6 | % | | 751 | | | 3.2 | | 27.3 | | 3.7 | % |
| 4.01% – 5.00% | | 997 | | 380,394 | | | 64.8 | % | | 748 | | | 2.7 | | 28.0 | | 4.8 | % |
| 5.01% – 6.00% | | 820 | | 346,778 | | | 64.6 | % | | 739 | | | 2.9 | | 27.2 | | 5.4 | % |
| 6.01% – 7.00% | | 28 | | 9,337 | | | 67.8 | % | | 720 | | | 3.0 | | 25.9 | | 6.3 | % |
| 7.01% - 8.00% | | 2 | | 506 | | | 73.2 | % | | 753 | | | 4.5 | | 26.9 | | 7.1 | % |
| | | | | | | | | | | | | | |
| Total | | 2,193 | | $ | 908,512 | | | 64.3 | % | | 745 | | | 2.9 | | 27.6 | | 4.8 | % |
(1)The original FICO score is not available for 249215 loans with a principal balance of approximately $79.5$68.8 million at September 30, 2020.2021. We have excluded those loans from the weighted average computation.
Residential Bridge Loans
Our Residential Bridge Loans are comprised of short-term fixed rate mortgages secured by non-owner occupied single and multi-family residences with low LTVs, generally up to 85%. The following table presents certain information about our Residential Bridge Loans investment portfolio at September 30, 20202021 (dollars in thousands):
| | | | | | | | | | | | | | | | | | | | | | | | | | | | | | | | |
| | | | | | | Weighted Average |
| Current Coupon Rate | | Number of Loans | | Principal
Balance | | Original LTV | | Contractual Maturity (months)(1) | | Coupon
Rate |
| | | | | | | | | | |
| | | | | | | | | | |
| 7.01 – 9.00% | | 15 | | $ | 10,430 | | | 69.5 | % | | 1.8 | | 8.6 | % |
| 9.01 – 11.00% | | 18 | | 7,714 | | | 74.8 | % | | 3.2 | | 10.1 | % |
| 11.01 – 13.00% | | 3 | | 705 | | | 69.8 | % | | 0.0 | | 11.4 | % |
| | | | | | | | | | |
| | | | | | | | | | |
| 17.01 – 19.00% | | 1 | | 124 | | | 75.0 | % | | 0.0 | | 18.0 | % |
| | | | | | | | | | |
| | | | | | | | | | |
| | | | | | | | | | |
| Total | | 37 | | $ | 18,973 | | | 71.7 | % | | 2.2 | | 9.4 | % |
thousands): | | | | | | | | | | | | | | | | | | | | | | | | | | | | | | | | |
| | | | | | | Weighted Average |
| Current Coupon Rate | | Number of Loans | | Principal
Balance | | Original LTV | | Contractual Maturity (months)(1) | | Coupon
Rate |
| | | | | | | | | | |
| 7.01% – 9.00% | | 3 | | $ | 2,946 | | | 70.4 | % | | 0.0 | | 8.8 | % |
| 9.01% – 11.00% | | 7 | | 3,213 | | | 75.9 | % | | 2.0 | | 10.3 | % |
| 11.01% – 13.00% | | 2 | | 495 | | | 69.7 | % | | 2.0 | | 11.4 | % |
| | | | | | | | | | |
| | | | | | | | | | |
| | | | | | | | | | |
| | | | | | | | | | |
| | | | | | | | | | |
| Total | | 12 | | $ | 6,654 | | | 73.0 | % | | 2.0 | | 9.7 | % |
(1) Non-performing loans that are past their maturity date are excluded from the calculation of the weighted average contractual maturity. The weighted average contractual maturity for these loans is zero.
Non-performing Residential Loans
The following table presents the aging of the Residential Whole Loans and Bridge Loans as of September 30, 20202021 (dollars in thousands):
| | | | | | | | | | | | | | | | | | | | | | | | | | | | | | | | | | | | | | |
| | Residential Whole Loans | | Bridge Loans |
| | No of Loans | | Principal | | Fair Value | | No of Loans | | Principal | | Fair Value (1) |
Current(2) | | 2,655 | | | $ | 1,038,836 | | | $ | 1,063,022 | | | 10 | | | $ | 4,501 | | | $ | 4,486 | |
| 1-30 days | | 24 | | | 10,330 | | | 10,472 | | | 2 | | | 1,430 | | | 1,412 | |
| 31-60 days | | 3 | | | 1,303 | | | 1,281 | | | 3 | | | 2,080 | | | 2,038 | |
| 61-90 days | | 7 | | | 7,266 | | | 6,978 | | | — | | | — | | | — | |
| 90+ days | | 21 | | | 15,913 | | | 15,244 | | | 22 | | | 10,962 | | | 9,904 | |
| Total | | 2,710 | | | $ | 1,073,648 | | | $ | 1,096,997 | | | 37 | | | $ | 18,973 | | | $ | 17,840 | |
| | | | | | | | | | | | | | | | | | | | | | | | | | | | | | | | | | | | | | |
| | Residential Whole Loans | | Bridge Loans |
| | No of Loans | | Principal | | Fair Value | | No of Loans | | Principal | | Fair Value |
Current(1) | | 2,156 | | | $ | 889,231 | | | $ | 930,286 | | | 1 | | | $ | 75 | | | $ | 75 | |
| 1-30 days | | 15 | | | 7,448 | | | 7,746 | | | 1 | | | 105 | | | 105 | |
| 31-60 days | | — | | | — | | | — | | | — | | | — | | | — | |
| 61-90 days | | 3 | | | 1,238 | | | 1,259 | | | — | | | — | | | — | |
| 90+ days | | 19 | | | 10,595 | | | 10,126 | | | 10 | | | 6,474 | | | 5,780 | |
| Total | | 2,193 | | | $ | 908,512 | | | $ | 949,417 | | | 12 | | | $ | 6,654 | | | $ | 5,960 | |
(1) Includes $1.5 million loans carried at amortized cost.
(2) Includes loansone loan in forbearance with unpaid principal balance of approximately $109.6 million.$493 thousand.
Residential Whole Loans Forbearance Programs
COVID-19 has materially disrupted business operations, resulting in significantly higher levels of unemployment or underemployment.underemployment in certain sectors. As a result, some of its Residential Whole Loan borrowers have experienced financial hardship, making it difficult to meet their payment obligations to the Company,us, leading to requests for forbearance and higher levels of delinquency and potentially defaults. The Company maintainsWe maintain a strong relationship with itsour servicers and hashave utilized these relationships to manage the impacts of COVID-19 pandemic on our Non-QM loans, including the Company's Non-QM loans.use of forbearance programs. As of September 30, 2020, the Company2021, we had 252one Non-QM loan in forbearance and no Non-QM loans in the repayment phase following forbearance. Under the forbearance agreement, the borrower can generally elect to defer the principal and interest payments for 3 to 5 months. At the end of the forbearance period, the borrower can either repay the deferred principal and interest in full or over the next 9 months or, capitalize the deferred principal and interest to the loan balance and calculate a new amortization payment or request an extension.payment. Loans in forbearance are treated as "Current" in the above chart. These loans aretable. The loan in forbearance is carried at fair value and had an unpaid principal balance of approximately $109.6 million,493 thousand, a fair value of $110.3 million,434 thousand, a weighted averagean original LTV of 63.7%64.7%., and representrepresents approximately 10.2%0.1% of the total outstanding principal balance.balance of our Residential Whole Loans.
Residential Whole Loans in Non-Accrual Status
As of September 30, 2020,2021, there were 21 Residential Whole Loans19 Non-QM loans carried at fair value in non-accrual status with an unpaid principal balance of approximately $15.9$10.6 million and a fair value of $15.2$10.1 million. These nonperforming loans represent approximately 1.5%1.2% of the total outstanding principal balance. No allowance or provision for credit losses was recorded as of and for the three and nine months ended September 30, 20202021 since the valuation adjustment, if any, would be reflected in the fair value of these loans. We stopped accruing interest income for these loans when they became contractually 90 days delinquent.
As of September 30, 2020,2021, there were one Residential Bridge Loans carried at amortized cost in non-accrual status with an unpaid principal balance of approximately $123.8 thousand and 2110 Residential Bridge Loans carried at fair value in non-accrual status with an unpaid principal balance of approximately $10.8$6.5 million and a fair value of $9.8$5.8 million. These nonperforming Residential Bridge Loans represent approximately 57.8%97.3% of the total outstanding principal balance. We reviewed the estimated fair value of the collateral to determine if an allowance and provision of credit loss was required for loans carried at amortized costs. Based upon our evaluation, no allowance and provision for credit losses was recorded for loans carried at amortized cost as of and for the three and nine months ended September 30, 2020 since the fair value of the collateral balance less the cost to sell was in excess of the outstanding principal and interest balances. No allowance and provision for credit losses was recorded for loans carried at fair value as of and for the three and nine months ended September 30, 20202021 since valuation adjustments, if any, would be reflected in the fair value of these loans. We stopped accruing interest income for these loans when they became contractually 90 days delinquent.
As of September 30, 2020,2021, we had four real estate owned ("REO") properties with an aggregate carrying value of $1.3$1.1 million related to foreclosed Bridge Loans. The REO properties are held for sale and accordingly carried at the lower of cost or fair value less cost to sell. The REO properties are classified in "Other assets" in the Consolidated Balance Sheets.
Commercial Real Estate Investments
SecuritizedThe following table presents our commercial loan investments as of September 30, 2021 (dollars in thousands):
| | | | | | | | | | | | | | | | | | | | | | | | | | | | | |
| Loan | Loan Type | Principal Balance | Fair Value | Original LTV | Interest Rate | Maturity Date | Extension Option | Collateral | Geographic Location |
| CRE 3 | Interest-Only Mezzanine loan | $ | 90,000 | | $ | 27,495 | | 58% | 1-Month LIBOR plus 9.25% | 6/29/2021 | Two-Year First Extension and One-Year Second Extension | Entertainment and Retail | NJ |
| CRE 4 | Interest-Only First Mortgage | 38,367 | | 38,294 | | 63% | 1-Month LIBOR plus 3.02% | 8/6/2022 | Two One-Year Extensions | Retail | CT |
| CRE 5 | Interest-Only First Mortgage | 24,535 | | 24,085 | | 62% | 1-Month LIBOR plus 3.75% | 11/6/2022 | Three One-Year Extensions | Hotel | NY |
| CRE 6 | Interest-Only First Mortgage | 13,207 | | 12,964 | | 62% | 1-Month LIBOR plus 3.75% | 11/6/2022 | Three One-Year Extensions | Hotel | CA |
| CRE 7 | Interest-Only First Mortgage | 7,259 | | 7,126 | | 62% | 1-Month LIBOR plus 3.75% | 11/6/2022 | Three One-Year Extensions | Hotel | IL, FL |
| CRE 8 | Interest-Only First Mortgage | 4,442 | | 4,440 | | 79% | 1-Month LIBOR plus 4.85% | 12/6/2022 | None | Assisted Living Facilities | FL |
| SBC 3 | Interest-Only First Mortgage | 14,362 | | 14,362 | | 49% | 1-Month LIBOR plus 4.10% | 7/6/2022 | None | Nursing Facilities | CT |
| | $ | 192,172 | | $ | 128,766 | | | | | | | |
| | | | | | | | | |
Commercial Loan Payoffs
On July 7, 2021, SBC 1, with an outstanding principal balance of $45.2 million collateralized by nursing facilities, was paid off in full.
On September 7, 2021, CRE 2, with an outstanding principal balance of $46.8 million collateralized by nursing facilities, was paid off in full.
On September 24, 2021, SBC 2 with an outstanding principal balance of $9.2 million collateralized by an apartment complex was paid off in full.
Non-Performing Commercial Loans
In November 2015, we acquiredThe impact of COVID-19 pandemic has adversely impacted a $14.0 million variable interestbroad range of industries in CSMC Trust, which is a VIE that we were requiredour commercial loan borrowers operate and could impair their ability to consolidate. In June 2020,fulfill their financial obligations to us, most significantly retail and hospitality asset. All but the variable interest we acquired was paid off and accordingly, the CSMC Trust is no longer consolidated.two loans discussed below remain current.
CRE 1 Loan
In October 2020, we commenced foreclosure proceedings. However, on February 24, 2021, the borrower filed for bankruptcy protection halting the foreclosure process. In August 2021, the bankruptcy case was refinanceddismissed by the bankruptcy court and we, together with the other holders of the loan, foreclosed on the property through a new securitization RETL 2019-RVP ("RETL 2019 Trust")SPE formed for the purpose of holding the property. The property is currently being marketed for sale. Based on preliminary bids, we believe there is a reasonable likelihood that our investment along with the other members' interest will be recovered, although there is no assurance of full recovery. The borrower has continued to file legal challenge to the sale process. While the Company believes these legal challenges have no merit, they have delayed moving forward with the sale of the property.
The SPE is consolidated by us and the property is recorded at the lower of cost or fair value less cost to sell. As of September 30, 2021, the REO is recorded at $42.5 million and classified in March 2019. We acquired a $65.3 million variable interest"Other assets" in the trust certificates issuedConsolidated Balance Sheets and the other members' interests in the SPE of approximately $11.9 million are recorded as "Non-controlling interest" in the consolidated financial statements.
CRE 3 Loan
As of September 30, 2021, the CRE 3 junior mezzanine loan with an outstanding principal balance of $90.0 million secured by RETL 2019 Trust, including $45.3a retail facility was non-performing and past its maturity date of June 29, 2021. We were receiving interest payments on this loan from a reserve that was exhausted in May 2021. During the second quarter of 2021, the fair value of the loan declined significantly. We are currently in discussions with the borrower and certain other lenders regarding alternatives to address the situation which might include modifications of loan terms, deferral of payments and the funding of new advances. There can be no assurance that these discussions will result in an outcome in which we would be repaid any amount of the loan and we may suffer further declines in fair value with respect to the mezzanine investment. For the three months ended September 30, 2021, we suffered a further decline of $5.2 million in the fair value of this investment. We could experience a total loss of our investment under various scenarios, which representsat current levels would result in a $27.5 million reduction in the 5% eligible risk retention certificate. Please referCompany’s book value. Refer to Note 6 - "Commercial Real Estate Investments"Loans" for details.
The RETL 2019 Trust holds a commercial loan collateralized by first mortgages, deedsfollowing table presents the aging of trusts and interests in commercial real estate located throughout the United States and Puerto Rico. The outstanding principal balance on this commercial loan is $488.9 millionCommercial Loans as of September 30, 2020. The commercial loan served as collateral for the $488.9 million securitized debt issued by RETL 2019 Trust and the securitized debt is non-recourse to us. Refer to Note 7 - "Financings" for details on the associated securitized debt.2021 (dollars in thousands): | | | | | | | | | | | | | | | | | | | | |
| | Commercial Loans |
| | No of Loans | | Principal | | Fair Value |
| Current | | 6 | | | $ | 102,172 | | | $ | 101,271 | |
| 1-30 days | | — | | | — | | | — | |
| 31-60 days | | — | | | — | | | — | |
| 61-90 days | | — | | | — | | | — | |
| 90+ days | | 1 | | | 90,000 | | | 27,495 | |
| Total | | 7 | | | $ | 192,172 | | | $ | 128,766 | |
In December 2019, we acquired a $161.4 million interest in the trust certificates issued by the MRCD 2019-PRKC Mortgage Trust ("MRCD Trust"), including $10.5 million which represents the initial controlling class (HRR class). We determined that MRCD Trust was a VIE and that we were also the primary beneficiary because the Manager was involved in certain aspects of the design of the trust and we ow the controlling class. As the primary beneficiary, we consolidated MRCD Trust and its investment in the trust certificates (HRR class and a portion of the A class) of MRCD Trust were eliminated in the consolidation.
In March 2020, we sold our investments in the A Class certificates of MRCD Trust, and shortly after the sale, we entered into an agreement to assign our controlling rights and appoint one of the buyers as the new Directing Holder. As a result, the assets and liabilities of MRCD Trust were unconsolidated since we no longer have the power to direct the activities that significantly impact the economic performance of the MRCD Trust.
MRCD qualified as a CFE under GAAP and we measured both the financial assets and financial liabilities using the fair value of the financial liabilities, since it was more observable. We recognized an unrealized loss of $43.7 million in earnings, related to the periodic change in fair value of MRCD's assets and liabilities in March 2020 and prior to deconsolidation. Also, we retained the HRR certificates, which were measured at fair value at the date of deconsolidation and is included in the "Non-Agency mortgage-backed securities, at fair value" in the Consolidated Balance Sheets.Securitized Commercial Loan
On August 1, 2020 we consolidated CSMC USA as a result of our ongoing reassessment of our CMBS VIE holdings for potential consolidation of the securitized trust. Our $14.9 million or 8.8% interest in the trust certificate of CSMC USA (F Class) was eliminated in the consolidation. Please refer to Note 6 - "Commercial Real Estate Investments" for details. The CSMC USA holds a commercial loan secured by a first mortgage lien on the borrowers’ fee and leasehold interests in a portion of a super-regional mall. The outstanding principal balance on this commercial loan is $1.4 billion as of September 30, 2020.2021. The loan's stated maturity date is September 11, 2025 and bears a fixed interest rate of 4.38%. The commercial loan served as collateral for the $1.4 billion securitized debt issued by CMSC USA and the securitized debt is non-recourse to us. Refer to Note 7 - "Financings" for details on the associated securitized debt.
Non-Performing Commercial LoansIn December 2020, the commercial loan held by CSMC USA was amended to an interest only payment through maturity. As part of the modification, a Cash Management Forbearance Agreement was entered into by special servicer and the borrower that required both increased reporting requirements and monthly net cash remittance.
The impact of COVID-19 pandemic has adversely impacted a broad range of industries in which our commercial loan borrowers operate and could impair their ability to fulfill their financial obligations to us, most significantly hospitality asset. We believe our CRE loan sponsors are well capitalized and generally committed to supporting the assets collateralizing our loans. Our portfolio’s low average LTV of 65.5% as of September 30, 2020 reflects significant equity value that our sponsors
are motivated to protect through the COVID-19 disruption. As of September 30, 2020, we had one delinquent borrower with a total loan principal balance of $30.0 million. The Company is currently exploring various workout strategies.
The following table presents the aging of the Commercial Loans as of September 30, 2020 (dollars in thousands):
| | | | | | | | | | | | | | | | | | | | |
| | Commercial Loans |
| | No of Loans | | Principal | | Fair Value |
| Current | | 10 | | | $ | 302,518 | | | $ | 296,474 | |
| 1-30 days | | — | | | — | | | — | |
| 31-60 days | | — | | | — | | | — | |
| 61-90 days | | — | | | — | | | — | |
| 90+ days | | 1 | | | 30,000 | | | 29,177 | |
| Total | | 11 | | | $ | 332,518 | | | $ | 325,651 | |
Geographic Concentration
The mortgages underlying our Non-Agency RMBS and Non-Agency CMBS are located in various states across the United States and other countries. The following table presents the five largest concentrations by location for the mortgages collateralizing our Non-Agency RMBS and Non-Agency CMBS as of September 30, 2020,2021, based on fair value (dollars in thousands):
| | | | | | | | | | | | | | | | | | | | | | | | | | |
| | Non-Agency RMBS | | | Non-Agency CMBS |
| | Concentration | | Fair Value | | | Concentration | | Fair Value |
| California | 29.4 | % | | $ | 7,602 | | | California | 25.7 | % | | $ | 46,533 | |
| Florida | 8.5 | % | | 2,199 | | | Illinois | 11.3 | % | | 20,545 | |
| New York | 7.4 | % | | 1,913 | | | Nevada | 10.9 | % | | 19,754 | |
| Maryland | 4.2 | % | | 1,092 | | | Bahamas | 6.5 | % | | 11,728 | |
| Georgia | 4.1 | % | | 1,068 | | | Kansas | 5.3 | % | | 9,664 | |
| | | | | | | | | | | | | | | | | | | | | | | | | | |
| | Non-Agency RMBS | | | Non-Agency CMBS |
| | Concentration | | Fair Value | | | Concentration | | Fair Value |
| California | 27.2 | % | | $ | 7,628 | | | California | 30.6 | % | | $ | 41,196 | |
| New York | 9.3 | % | | 2,591 | | | Nevada | 14.6 | % | | 19,620 | |
| Florida | 9.1 | % | | 2,554 | | | Illinois | 13.6 | % | | 18,372 | |
| New Jersey | 4.2 | % | | 1,173 | | | Bahamas | 10.6 | % | | 14,330 | |
| Maryland | 4.0 | % | | 1,125 | | | New York | 3.8 | % | | 5,073 | |
The following table presents the various states across the United States in which the collateral securing our Residential Whole Loans and Residential Bridge Loans at September 30, 2020,2021, based on principal balance, is located (dollars in thousands):
| | | | Residential Whole Loans | | | Residential Bridge Loans | | Residential Whole Loans | | | Residential Bridge Loans |
| | | State
Concentration | | Principal
Balance | | State
Concentration | | Principal
Balance | | State
Concentration | | Principal
Balance | | State
Concentration | | Principal
Balance |
| California | California | 65.4 | % | | $ | 702,352 | | | California | 37.8 | % | | $ | 7,163 | | California | 72.3 | % | | $ | 656,801 | | | New York | 39.5 | % | | $ | 2,631 | |
| New York | New York | 17.9 | % | | 192,458 | | | New York | 17.7 | % | | 3,365 | | New York | 14.3 | % | | 129,931 | | | California | 35.9 | % | | 2,386 | |
| Georgia | Georgia | 3.4 | % | | 35,969 | | | Washington | 17.7 | % | | 3,361 | | Georgia | 2.7 | % | | 24,300 | | | Florida | 16.9 | % | | 1,125 | |
| Florida | Florida | 2.7 | % | | 29,268 | | | Florida | 12.6 | % | | 2,384 | | Florida | 2.4 | % | | 21,697 | | | New Jersey | 5.0 | % | | 335 | |
| New Jersey | New Jersey | 2.5 | % | | 26,642 | | | New Jersey | 4.4 | % | | 843 | | New Jersey | 2.0 | % | | 18,255 | | | Pennsylvania | 1.6 | % | | 105 | |
| Other | Other | 8.1 | % | | 86,959 | | | Other | 9.8 | % | | 1,857 | | Other | 6.3 | % | | 57,528 | | | Other | 1.1 | % | | 72 | |
| Total | Total | 100.0 | % | | $ | 1,073,648 | | | Total | 100.0 | % | | $ | 18,973 | | Total | 100.0 | % | | $ | 908,512 | | | Total | 100.0 | % | | $ | 6,654 | |
Financing Activity
The market disruptions surrounding COVID-19 resulted in the decline of our asset values making it more difficult to obtain repurchase agreement financing with favorable terms or at all. Our repurchase agreement counterparties have increased borrowing rates and increased haircuts. We will look to continue to expand and diversify our financing sources, especially those sources that provide an alternative to short termshort-term repurchase agreements with daily margin requirements. Our amended Residential Whole Loan facilityDuring the nine months ended September 30, 2021, we repurchased $129.3 million aggregate principal amount of the 2022 Notes and supplemented Non-Agency CMBS and RMBS facility has significantly reducing our exposure to margin volatility.issued $86.3 million aggregate principal amount of the 2024 Notes. We did not sell any investments during the nine months ended September 30, 2021.
Repurchase Agreements
Residential Whole Loan Facility
On April 21, 2020, we entered into amendments with respect to certain of its loan warehouse facilities. These amendments mainly served to convert an existing residential whole loan facility into a term facility by removing any mark to market margin requirements, and to consolidate the our Non-Qualified Mortgage loans onto a single facility, which were previously financed by three separate, unaffiliated counterparties.
The target advance rate under the amended and restated facility is approximately 84% of the aggregate unpaid principal balance of the loans. The original maturity date for the facility was October 20, 2021. All principal payments and income generated by the loans during the term of the facility will be used to pay principal and interest on the facility. Upon the securitization or sale by us of any whole loan subject to this amended and restated facility, the counterparty is entitled to receive a recapture premium fee of 30% of all realized value on any whole loans above such counterparty’s amortized basis as well as an exit fee of 0.50% of the loan amount in circumstances where the counterparty was involved in the disposition of the loans. The financing cost of this facility was reflective of the challenging market conditions, at such time, when we entered into the agreement.
Initially, the aggregate borrowings under this facility with respect to its Residential Whole Loans was approximately $385.0 million and the market value of such loans was approximately $430.0 million. On June 29, 2020, we securitized approximately $355.8 million of the Residential Whole Loans and paid down the facility by approximately $339.4 million (see "Securitized Debt" below for additional details). As noted above part of the financing arrangements we agreed to pay the lender a fee of 30% of all realized value on the Residential Whole Loans above the counterparty's amortized basis upon securitization or sale. As a result of refinancing the Residential Whole Loans through a securitization, we accrued a premium recapture fee of approximately $20.5 million, which is payable at the maturity of the facility, and was recorded in "Financing fees" in the Consolidated Statements of Operations. In October 2020, in connection with the amendment to the facility discussed above we paid $12.0 million of the premium recapture fee and the balance of $8.5 million is payable at the maturity of the amended facility, October 5, 2021.
As of September 30, 2020, approximately $72.7 million in non QM loans remain in the facility which are also subject to the recapture premium at sale or securitization and the amount of such liability is contingent on the realizable value at time of sale or securitization.
On October 6, 2020 the Company entered into an amendment with respect to its residential loan warehouse facility. The amendment serves to convert the existing residential loan facility to a limited mark to market margin facility that bears an interest rate of LIBOR plus 2.75%, with a LIBOR floor of 0.25%. The target advance rate under the amended facility is 85% and the facility matures on October 5, 2021. As part of the amendment, the premium recapture fee was eliminated for investments financed under the amended facility.
Non-Agency CMBS and Non-Agency RMBS Facility
On May 4, 2020, the Company supplemented one of its existing securities repurchase facilities to consolidate most of its5, 2021, we amended our Non-Agency CMBS and Non-Agency RMBS assets, which were financedfinancing facility to, among other things, extend the facility for an additional 12 months and reduce the interest rate. The amended facility has improved advance rates and bears interest at a rate of three-month LIBOR plus 2.00%. As of September 30, 2021, the outstanding balance under this facility was $111.5 million. The borrowing is secured by multiple counterparties, into a single term facilityinvestments with limited mark toan estimated fair market margin requirements. Pursuant to the agreement, a margin deficit will not occur until such timevalue of $196.7 million as the loan to value ratio surpasses a certain threshold (the “LTV Trigger”), onof September 30, 2021.
Commercial Whole Loan Facility
As of September 30, 2021, we had approximately $63.7 million in borrowings, with a weighted average basis per asset type, calculated on a portfolio level. If this thresholdinterest rate of 2.27% under our commercial whole loan facility. The borrowing is reached, the Company may elect to provide cash margin or sell certain assets to the extent necessary to lowersecured by loans with an estimated fair market value of
the ratio. The term of this facility is 12 months, subject to 12 month extensions at the counterparty’s option. All interest income generated by the assets during the term of the facility will be paid to the Company no less often than monthly. Interest on the facility is due from the Company at a rate of three-month LIBOR plus 5.00% payable quarterly in arrears. Half of all principal repayments on the underlying assets will be applied to repay the obligations owed to the counterparty, with the remainder paid to the Company, unless the LTV Trigger has occurred, in which case all principal payments will be applied to repay the obligations.
Certain of the repurchase agreements provide the counterparty with the right to terminate the agreement if the Company does not maintain certain equity, liquidity and leverage metrics, the most restrictive of which include a limit on leverage based on the composition of the Company’s portfolio. For all the repurchase agreements with outstanding borrowings, the Company was in compliance with the terms of such financial tests$86.9 million as of September 30, 2020.2021. The facility was subject to automatic monthly rolling until such time that it is terminated pursuant to the terms of the agreement by either the borrower or lender or until certain conditions of default.
Residential Whole Loan Facility
Under the residential whole loan facility, as of September 30, 2021, we had approximately $236.8 million in borrowings with an interest rate of one month LIBOR plus 2.75%. The borrowing is secured by Non-QM loans with an estimated fair market value of $287.1 million.
Recourse and Non-Recourse Financing
We utilize both recourse and non-recourse debt to finance our portfolio. Our recourse debt included our short and long-term repurchase agreement financings and our convertible senior unsecured notes. At September 30, 2021, our total non-recourse financing of approximately $2.0 billion is comprised of $605.0 million of securitized debt issued in connection with our two Residential Whole Loan securitizations and $1.4 billion of securitized debt from owning a $14.9 million Non-Agency CMBS bond deemed to be a controlling financial variable interest in CSMC USA which required us to consolidate the CMBS VIE.
| | | | | | | | | | | | | | |
| (dollars in thousands) | September 30, 2021 | | December 31, 2020 | |
| Recourse and non-recourse financing | $ | 2,580,413 | | | $ | 2,973,732 | | |
| Non-recourse financing | 1,970,513 | | | 2,446,012 | | |
| Total recourse financing | $ | 609,900 | | $609,900 | $ | 527,720 | | |
| | | | |
| Stockholders' equity | $ | 210,186 | | | $ | 255,112 | | |
| | | | |
| Recourse leverage | 2.9x | | 2.1x | |
Financing Facilities Outstanding Borrowings
At September 30, 2020,2021, we had outstanding borrowings under sixfive of our repurchase agreements. The following table summarizes our financing activity undercertain characteristics of our repurchase agreements for the nine months endedat September 30, 20202021 (dollars in thousands):
| | | | | | | | | | | | | | | | | | | | | | | | | | |
| | Balance at | | | | | | Balance at |
| Collateral | | December 31, 2019 | | Proceeds | | Repayments | | September 30, 2020 |
| Agency CMBS | | $ | 1,352,248 | | | $ | 2,931,690 | | | $ | (4,283,938) | | | $ | — | |
| Agency RMBS | | 348,274 | | | 214,477 | | | (561,313) | | | 1,438 | |
Non-Agency CMBS(1) | | 190,390 | | | 718,121 | | | (825,247) | | | 83,264 | |
| Non-Agency RMBS | | 30,481 | | | 80,574 | | | (96,313) | | | 14,742 | |
Residential Whole Loans(2) | | 476,172 | | | 2,632,792 | | | (3,068,903) | | | 40,061 | |
Residential Bridge Loans(2) | | 29,869 | | | 263,038 | | | (277,144) | | | 15,763 | |
Commercial loans(2) | | 224,594 | | | 1,943,521 | | | (1,999,718) | | | 168,397 | |
Securitized commercial loans(2) | | 116,087 | | | 179,649 | | | (295,736) | | | — | |
| Membership interest | | — | | | 18,845 | | | — | | | 18,845 | |
| Other securities | | 56,762 | | | 166,497 | | | (206,891) | | | 16,368 | |
| Borrowings under repurchase agreements | | 2,824,877 | | | 9,149,204 | | | (11,615,203) | | | 358,878 | |
| Less unamortized debt issuance costs | | 76 | | | — | | | — | | | 353 | |
| Borrowings under repurchase agreements, net | | $ | 2,824,801 | | | $ | 9,149,204 | | | $ | (11,615,203) | | | $ | 358,525 | |
| | | | | | | | |
| | | | | | | | |
(1)Includes repurchase agreement borrowings on securities eliminated upon VIE consolidation.
(2)The borrowings and collateral pledged attributed to loans owned through trust certificates. The trust certificates are eliminated upon consolidation.
.
At September 30, 2020, we had outstanding repurchase agreement borrowings with the following counterparties:
| | | | | | | | | | | | | | | | | | | | | | | | | | |
(dollars in thousands)
Repurchase Agreement Counterparties | | Amount Outstanding | | Percent of Total Amount Outstanding | | Company Investments Held as Collateral | | Counterparty Rating(1) |
Credit Suisse AG, Cayman Islands Branch (2) | | $ | 188,296 | | | 52.5 | % | | $ | 388,909 | | | A+ |
| Citigroup Global Markets Inc. | | 102,656 | | | 28.6 | % | | 211,414 | | | A+ |
Nomura Securities International, Inc. (3) | | 54,770 | | | 15.3 | % | | 92,123 | | | Unrated (3) |
| Barclays Capital Inc. | | 9,119 | | | 2.5 | % | | 14,196 | | | A |
| | | | | | | | |
| | | | | | | | |
| | | | | | | | |
| | | | | | | | |
| | | | | | | | |
| | | | | | | | |
| | | | | | | | |
| | | | | | | | |
| | | | | | | | |
| | | | | | | | |
| | | | | | | | |
| | | | | | | | |
All other counterparties (4) | | 4,037 | | | 1.1 | % | | 8,815 | | | |
| Total | | $ | 358,878 | | | 100.0 | % | | $ | 715,457 | | | |
| | | | | | | | | | | | | | | | | | | | |
| Securities Pledged | | Repurchase Agreement Borrowings | | Weighted Average Interest Rate on Borrowings Outstanding at end of period | | Weighted Average Remaining Maturity (days) |
| Short-Term Borrowings: | | | | | | |
| | | | | | |
| Agency RMBS | | $ | 1,048 | | | 1.05 | % | | 59 |
| Non-Agency CMBS | | 10,314 | | | 1.75 | % | | 12 |
| | | | | | |
Residential Whole Loans (1) | | 41,013 | | | 2.66 | % | | 4 |
Residential Bridge Loans (1) | | 5,817 | | | 2.60 | % | | 4 |
Commercial Loans (1) | | 10,603 | | | 3.18 | % | | 4 |
| | | | | | |
| Other Securities | | 2,587 | | | 3.52 | % | | 19 |
| Subtotal | | 71,382 | | | 2.60 | % | | 7 |
| Long-Term Borrowings: | | | | | | |
Non-Agency CMBS (2) | | 68,352 | | | 2.12 | % | | 193 |
| Non-Agency RMBS | | 15,632 | | | 2.12 | % | | 217 |
Residential Whole Loans (1)(3) | | 236,767 | | | 3.00 | % | | 36 |
| Commercial Loans | | 63,669 | | | 2.27 | % | | 360 |
| Other Securities | | 27,506 | | | 2.12 | % | | 217 |
| Subtotal | | 411,926 | | | 2.65 | % | | 113 |
| Repurchase Agreements Borrowings | | $ | 483,308 | | | 2.64 | % | | 98 |
| Less Unamortized Debt Issuance Costs | | 40 | | | N/A | | N/A |
| Repurchase Agreements Borrowings, net | | $ | 483,268 | | | 2.64 | % | | 98 |
(1)Repurchase agreement borrowings on loans owned are through trust certificates. The trust certificates are eliminated in consolidation.
(2)Includes repurchase agreement borrowings on securities eliminated upon VIE consolidation.
(3)The Residential Whole Loan facility's maturity was extended one month in October 2021.The weighted average remaining maturity reflects the one month extension.
.
Certain of the financing arrangements provide the counterparty with the right to terminate the agreement if we do not maintain certain equity, liquidity and leverage metrics. We were in compliance with the terms of such financial tests as of September 30, 2021.
At September 30, 2021, we had outstanding repurchase agreement borrowings with the following counterparties:
| | | | | | | | | | | | | | | | | | | | | | | | | | |
(dollars in thousands)
Repurchase Agreement Counterparties | | Amount Outstanding | | Percent of Total Amount Outstanding | | Company Investments Held as Collateral | | Counterparty Rating(1) |
Credit Suisse AG, Cayman Islands Branch (2) | | $ | 339,773 | | | 70.3 | % | | $ | 414,003 | | | A+ |
| Citigroup Global Markets Inc. | | 111,491 | | | 23.1 | % | | 196,665 | | | A+ |
Nomura Securities International, Inc. (3) | | 18,096 | | | 3.7 | % | | 22,038 | | | Unrated (3) |
| Credit Suisse Securities (USA) LLC | | 12,900 | | | 2.7 | % | | 20,400 | | | A+ |
| | | | | | | | |
| | | | | | | | |
| | | | | | | | |
| | | | | | | | |
| | | | | | | | |
| | | | | | | | |
| | | | | | | | |
| | | | | | | | |
| | | | | | | | |
| | | | | | | | |
| | | | | | | | |
| | | | | | | | |
All other counterparties (4) | | 1,048 | | | 0.2 | % | | 1,342 | | | |
| Total | | $ | 483,308 | | | 100.0 | % | | $ | 654,448 | | | |
(1)The counterparty ratings presented above are the long-term issuer credit ratings as rated at September 30, 20202021 by S&P.
(2)Includes master repurchase agreements in which the buyer includes Alpine Securitization LTD., a Credit Suisse sponsored asset-backed commercial paper conduit.
(3) Nomura Holdings, Inc., the parent company of Nomura Securities International, Inc., is rated BBB+ by S&P at September 30, 2020.2021.
(4) Represents amount outstanding with two counterparties,one counterparty, which each holds collateral valued less than 5% of our stockholders’ equity as security for our obligations under the applicable repurchase agreements as of September 30, 2020.2021.
The following table presents our average repurchase agreement borrowings, excluding unamortized debt issuance costs, by type of collateral pledged for the three and nine months ended September 30, 20202021 (dollars in thousands):
| | | | | | | | | | | | | | |
| Collateral | | Three Months Ended September 30, 2020 | | Nine months ended September 30, 2020 |
| Agency RMBS | | $ | 1,473 | | | $ | 91,960 | |
| Agency CMBS | | — | | | 488,102 | |
| Non-Agency RMBS | | 15,044 | | | 14,438 | |
Non-Agency CMBS(1) | | 84,785 | | | 182,661 | |
| Residential Whole Loans | | 38,161 | | | 339,749 | |
| Commercial loans | | 170,291 | | | 187,259 | |
| | | | |
| Residential Bridge Loans | | 21,644 | | | 25,519 | |
| Membership interest | | 410 | | | 138 | |
| Other securities | | 16,552 | | | 32,159 | |
| Total | | $ | 348,360 | | | $ | 1,361,985 | |
Maximum borrowings during the period(2) | | $ | 369,727 | | | $ | 3,006,550 | |
| | | | | | | | | | | | | | |
| Collateral | | Three Months Ended September 30, 2021 | | Nine months ended September 30, 2021 |
| Agency RMBS | | $ | 1,125 | | | $ | 1,235 | |
| | | | |
| Non-Agency RMBS | | 15,632 | | | 15,120 | |
Non-Agency CMBS(1) | | 81,645 | | | 79,890 | |
| Residential Whole Loans | | 133,556 | | | 80,565 | |
| Commercial loans | | 106,200 | | | 135,398 | |
| | | | |
| Residential Bridge Loans | | 7,897 | | | 10,342 | |
| Membership interest | | 15,452 | | | 17,863 | |
| Other securities | | 30,052 | | | 23,596 | |
| Total | | $ | 391,559 | | | $ | 364,009 | |
Maximum borrowings during the period(2) | | $ | 483,307 | | | $ | 483,307 | |
(1)Includes repurchase agreement borrowings on securities eliminated upon VIE consolidation.
(2)Amount represents the maximum borrowings at month-end during each of the respective periods.
Securitized Debt
Commercial Mortgage-Backed Notes
We hold a controlling financial variable interest in RETL 2019 Trust and CSMC USA and were required to consolidate the CMBS VIEs.VIE. Refer to Note 7 - "Financings" for details.
The following table summarizes the consolidated RETL 2019 Trust's2014 CSMC USA's commercial mortgage pass-through certificates at September 30, 20202021 which is classified in "Securitized debt, net" in the Consolidated Balance Sheets (dollars in thousands):
| | | | | | | | | | | | | | |
| Classes | Principal Balance(1) | Coupon | Fair Value | Contractual Maturity |
| Class A | $ | 34,022 | | 1.3 | % | $ | 34,024 | | 3/15/2021 |
| Class B | 101,200 | | 1.7 | % | 96,085 | | 3/15/2021 |
| Class C | 308,400 | | 2.3 | % | 282,831 | | 3/15/2021 |
| | | | |
Class X-EXT(2) | N/A | 1.2 | % | 31 | | 3/15/2021 |
| $ | 443,622 | | | $ | 412,971 | | |
(1) Excluded the principal and fair value of classes owned by us that are eliminated in the Consolidated Balance Sheets.
(2) Class X-EXT is an interest-only class with an initial notional balance of $308.4 million.
The above table does not reflect the class HRR bond held by us because the bond is eliminated in consolidation The HRR Class bonds had a fair value of $41.7 million as of September 30, 2020 and our exposure to loss is limited to our ownership interest in this bond..
The following table summarizes the consolidated 2014 CSMC USA's commercial mortgage pass-through certificates at September 30, 2020 which is classified in "Securitized debt, net" in the Consolidated Balance Sheets (dollars in thousands):
| | | | | | | | | | | | | | |
| Classes | Principal Balance | Coupon | Fair Value | Contractual Maturity |
| Class A-1 | 124,076 | | 3.3 | % | 124,648 | | 9/11/2025 |
| Class A-2 | 531,700 | | 4.0 | % | 541,905 | | 3/15/2021 |
| Class B | 136,400 | | 4.2 | % | 122,802 | | 9/11/2025 |
| Class C | 94,500 | | 4.3 | % | 80,348 | | 9/11/2025 |
| Class D | 153,950 | | 4.4 | % | 117,058 | | 9/11/2025 |
| Class E | 180,150 | | 4.4 | % | 122,585 | | 9/11/2025 |
| Class F | 153,600 | | 4.4 | % | 96,808 | | 9/11/2025 |
Class X-1(1) | n/a | 0.5 | % | 14,638 | | 9/11/2025 |
Class X-2(1) | n/a | 0.4 | % | 2,697 | | 9/11/2025 |
| $ | 1,374,376 | | | $ | 1,223,489 | | |
| | | | |
| | | | |
| | | | |
| | | | |
| | | | | | | | | | | | | | |
| Classes | Principal Balance | Coupon | Fair Value | Contractual Maturity |
| Class A-1 | $ | 120,391 | | 3.3 | % | $ | 126,264 | | 9/11/2025 |
| Class A-2 | 531,700 | | 4.0 | % | 570,167 | | 9/11/2025 |
| Class B | 136,400 | | 4.2 | % | 138,562 | | 9/11/2025 |
| Class C | 94,500 | | 4.3 | % | 92,630 | | 9/11/2025 |
| Class D | 153,950 | | 4.4 | % | 142,388 | | 9/11/2025 |
| Class E | 180,150 | | 4.4 | % | 161,900 | | 9/11/2025 |
| Class F | 153,600 | | 4.4 | % | 118,664 | | 9/11/2025 |
Class X-1(1) | N/A | 0.5 | % | 12,347 | | 9/11/2025 |
Class X-2(1) | N/A | 0.03 | % | 2,572 | | 9/11/2025 |
| $ | 1,370,691 | | | $ | 1,365,494 | | |
| | | | |
| | | | |
| | | | |
| | | | |
(1) Class X-1 and X-2 are interest-only classes with notional balances of $655.8$652.1 million and $733.5 million as of September 30, 2020,2021, respectively.
The above table does not reflect the portion of the class F bond held by us because the bond is eliminated in consolidation. The Company'sOur ownership interest in the F bonds represents a controlling financial interest, which resulted in consolidation of the trust, during the quarter. The bond had a fair market value of $9.4$11.5 million at September 30, 2020,2021, and our exposure to loss is limited to our ownership interest in this bond..bond.
Residential Mortgage-Backed Notes
In May 2019, we completed a residential mortgage-backed securitization comprised of a portion of our Residential Whole Loan portfolio. RMI 2015 Trust and RNR Trust collectively transferred $945.5 million of Non-QM Residential Whole
Loans, to our wholly owned subsidiary, Arroyo Trust.Trust 2019. Arroyo Trust 2019 issued $919.0 million of mortgage-backed notes and we retained the subordinate non-offered securities. These non-offered securities with an estimated fair value of $43.7$35.9 million at September 30, 20202021 were eliminated in the consolidation. At September 30, 2020,2021, Residential Whole Loans, with an outstanding principal balance of approximately $668.7$414.0 million, serve as collateral for the Arroyo Trust'sTrust 2019's securitized debt.
The following table summarizes the consolidated Arroyo Trust'sTrust 2019's issued mortgage-backed notes at September 30, 20202021 which is classified in "Securitized debt, net" in the Consolidated Balance Sheets (dollars in thousands):
| | | | | | | | | | | | | | |
| Classes | Principal Balance | Coupon | Carrying Value | Contractual Maturity |
| Issued Mortgage-Backed Notes | | | | |
| Class A-1 | $ | 552,779 | | 3.3% | $ | 552,777 | | 4/25/2049 |
| Class A-2 | 29,619 | | 3.5% | 29,618 | | 4/25/2049 |
| Class A-3 | 46,925 | | 3.8% | 46,924 | | 4/25/2049 |
| Class M-1 | 25,055 | | 4.8% | 25,055 | | 4/25/2049 |
| Subtotal | 654,378 | | | $ | 654,374 | | |
| Less: Unamortized deferred financing costs | N/A | | 4,625 | | |
| Total | $ | 654,378 | | | $ | 649,749 | | |
| | | | | | | | | | | | | | |
| Classes | Principal Balance | Coupon | Carrying Value | Contractual Maturity |
| Issued Mortgage-Backed Notes | | | | |
| Class A-1 | $ | 330,944 | | 3.3% | $ | 330,944 | | 4/25/2049 |
| Class A-2 | 17,740 | | 3.5% | 17,740 | | 4/25/2049 |
| Class A-3 | 28,106 | | 3.8% | 28,106 | | 4/25/2049 |
| Class M-1 | 25,055 | | 4.8% | 25,055 | | 4/25/2049 |
| Subtotal | $ | 401,845 | | | $ | 401,845 | | |
| Less: Unamortized deferred financing costs | N/A | | 3,727 | | |
| Total | $ | 401,845 | | | $ | 398,118 | | |
In June 2020, we completed a residential mortgage-backed securitization comprised of a portion of our Residential Whole Loan portfolio. RMI 2015 Trust transferred $355.8 million of Non-QM Residential Whole Loans, to our wholly owned subsidiary, Arroyo Trust 2020. Arroyo Trust 2020 issued $341.7 million of mortgage-backed notes and we retained the subordinate non-offered securities. These non-offered securities with an estimated fair value of $29.5$26.0 million at September 30,
2020 2021 were eliminated in the consolidation. At September 30, 2020,2021, Residential Whole Loans, with an outstanding principal balance of approximately $329.7$216.4 million, serve as collateral for the Arroyo Trust 2020's securitized debt.
The following table summarizes the consolidated Arroyo Trust 2020's issued mortgage-backed notes at September 30, 20202021 which is classified in "Securitized debt, net" in the Consolidated Balance Sheets (dollars in thousands):
| | | | | | | | | | | | | | |
| Classes | Principal Balance | Coupon | Carrying Value | Contractual Maturity |
| Issued Mortgage-Backed Notes | | | | |
| Class A-1A | $ | 246,807 | | 1.7% | $ | 246,801 | | 3/25/2055 |
| Class A-1B | 29,287 | | 2.1% | 29,286 | | 3/25/2055 |
| Class A-2 | 13,518 | | 2.9% | 13,517 | | 3/25/2055 |
| Class A-3 | 17,963 | | 3.3% | 17,963 | | 3/25/2055 |
| Class M-1 | 11,739 | | 4.3% | 11,739 | | 3/25/2055 |
| Subtotal | 319,314 | | | $ | 319,306 | | |
| Less: Unamortized deferred financing costs | N/A | | 2,606 | | |
| Total | $ | 319,314 | | | $ | 316,700 | | |
| | | | | | | | | | | | | | |
| Classes | Principal Balance | Coupon | Carrying Value | Contractual Maturity |
| Issued Mortgage-Backed Notes | | | | |
| Class A-1A | $ | 148,244 | | 1.7% | $ | 148,244 | | 3/25/2055 |
| Class A-1B | 17,591 | | 2.1% | 17,591 | | 3/25/2055 |
| Class A-2 | 13,518 | | 2.9% | 13,518 | | 3/25/2055 |
| Class A-3 | 17,963 | | 3.3% | 17,963 | | 3/25/2055 |
| Class M-1 | 11,739 | | 4.3% | 11,739 | | 3/25/2055 |
| Subtotal | $ | 209,055 | | | $ | 209,055 | | |
| Less: Unamortized deferred financing costs | N/A | | 2,154 | | |
| Total | $ | 209,055 | | | $ | 206,901 | | |
Convertible Senior Unsecured Notes
1
During the quarter we reduced the our overall convertible senior unsecured notes outstanding by $36.4 million and extended the maturity to 2024 for $86.3 million of our convertible senior unsecured debt through the issuance of the 2024 Notes to further strengthen our balance sheet.
1
In August 2021, we repurchased $22.3 million aggregate principal amount of our existing 2022 Notes at a weighted average discount to par value of 2.8%.
In September 2021, we issued $86.3 million of 2024 Notes and used the net proceeds, together with approximately $20.2 million of cash on hand, to repurchase an additional $100.3 million of our 2022 Notes.
As of September 30, 2020,2021, we had $200.0$45.7 million of 6.75% convertible senior unsecured notesthe 2022 Notes outstanding. The notes2022 Notes mature on October 1, 2022, unless earlier converted, redeemed or repurchased by the holders pursuant to their terms, and are not redeemable by us except during the final three months prior to maturity. On July 1, 2020,
As of September 30, 2021, we issued anhad $86.3 million aggregate principal amount of 1,354,084 shares of our common stock in exchange for $5.0 million of our 6.75% convertible senior unsecuredthe 2024 Notes outstanding. The 2024 notes mature on September 15, 2024, unless earlier converted, redeemed or repurchased by the holders pursuant to separate privately negotiated exchange agreements entered into on July 1, 2020 (collectively,their terms, and are not redeemable by us except during the “Exchange Agreement”) between us and certain holders of the Notes. We did not receive any cash proceeds as a result of the Exchange Agreement, and the notes exchanged pursuantfinal three months prior to the Exchange Agreement were retired and cancelled. See Note 7 – “Financings.”maturity.
Hedging ActivityConvertible Notes Exchange
In March
On July 1, 2020, we effectively terminated fixed-pay interest rate swaps with a notional valuethe Company issued an aggregate of approximately $3.1 billion1,354,084 shares of its common stock in exchange for $5.0 million aggregate principal amount of its 2022 Notes. See Note 7 - "Financings" for information related to the convertible notes agreement.
Dividends
To preserve liquidity, the Company suspended its first and variable-pay interest rate with a notional value of approximately $1.9 billion to reduce hedging costs and associatedsecond quarter common stock dividends in 2020 given extraordinary market volatility. The effect ofvolatility driven by uncertainty surrounding the termination is reflectedCOVID-19 pandemic. Starting in the table below for the nine monthsquarter ended September 30, 2020, in Settlements, Terminations or Expirations.
The following tables summarize the hedging activity duringCompany resumed payment of the nine months ended September 30, 2020 (dollars in thousands):
| | | | | | | | | | | | | | | | | | | | | | | |
| Notional Amount at | | | | Settlements, Terminations or Expirations | | Notional Amount at |
| Derivative Instrument | December 31, 2019 | | Acquisitions | | | September 30, 2020 |
| Fixed pay interest rate swaps | $ | 2,551,000 | | | $ | 783,000 | | | $ | (3,334,000) | | | $ | — | |
| Variable pay interest rate swaps | 1,405,000 | | | 794,800 | | | (2,199,800) | | | — | |
| Interest rate swaptions | — | | | 305,000 | | | (305,000) | | | — | |
| | | | | | | |
| | | | | | | |
| | | | | | | |
| | | | | | | |
| | | | | | | |
| | | | | | | |
| Credit default swaps | 151,000 | | | 164,000 | | | (308,830) | | | 6,170 | |
| TBA securities - long positions | 1,000,000 | | | 5,257,000 | | | (6,257,000) | | | — | |
| TBA securities - short positions | 1,000,000 | | | 5,257,000 | | | (6,257,000) | | | — | |
| Total derivative instruments | $ | 6,107,000 | | | $ | 12,560,800 | | | $ | (18,661,630) | | | $ | 6,170 | |
The following table presents cash dividends declared and paid by the Company on its common stock:
| | | | | | | | | | | | | | | | | | | | | | | | | | |
| Declaration Date | | Record Date | | Payment Date | | Amount per Share | | Tax Characterization |
| 2021 | | | | | | | | |
| | | | | | | | |
| September 23, 2021 | | October 4, 2021 | | October 26, 2021 | | $ | 0.06 | | | Not yet determined |
| June 22, 2021 | | July 2, 2021 | | July 26, 2021 | | $ | 0.06 | | | Not yet determined |
| March 23, 2021 | | April 2, 2021 | | April 26, 2021 | | $ | 0.06 | | | Not yet determined |
| | | | | | | | |
| 2020 | | | | | | | | |
| December 17, 2020 | | December 28, 2020 | | January 26, 2021 | | $ | 0.06 | | | Not yet determined(1) |
| September 22, 2020 | | October 2, 2020 | | October 26, 2020 | | $ | 0.05 | | | Return of capital |
| | | | | | | | |
| | | | | | | | |
| | | | | | | | |
| | | | | | | | |
| | | | | | | | |
(1)The cash distributions made on January 26, 2021, with a record date of December 28, 2020, are treated as received by stockholders on January 26, 2021 and taxable in calendar year 2021. The tax characterization of these distributions will be determined in January 2022.
Note 13 — Net Income (loss) per Common Share
| | | | | | | | | | | | | | | | | | | | | | | | | | | | | | | | | | | |
| Fair Value at | | Acquisitions | | Settlements, Terminations or Expirations | | Realized Gains / Losses | | Mark-to-market | | Fair Value at |
| Derivative Instrument | December 31, 2019 | | | | | | September 30, 2020 |
| Fixed pay interest rate swaps | $ | 3,001 | | | $ | (32,894) | | | $ | 241,939 | | | $ | (209,046) | | | $ | (3,000) | | | $ | — | |
| Variable pay interest rate swaps | (485) | | | 7,608 | | | (36,633) | | | 29,025 | | | 485 | | | — | |
| Interest rate swaptions | — | | | — | | | (80) | | | 80 | | | — | | | — | |
| | | | | | | | | | | |
| | | | | | | | | | | |
| | | | | | | | | | | |
| | | | | | | | | | | |
| | | | | | | | | | | |
| | | | | | | | | | | |
| Credit default swaps | (2,847) | | | 2,526 | | | 11,502 | | | (9,843) | | | (2,023) | | | (685) | |
| TBA securities | (928) | | | — | | | 2,430 | | | (2,430) | | | 928 | | | — | |
| Total derivative instruments | $ | (1,259) | | | $ | (22,760) | | | $ | 219,158 | | | $ | (192,214) | | | $ | (3,610) | | | $ | (685) | |
The table below presents basic and diluted net income (loss) per share of common stock using the two-class method for the three and nine months ended September 30, 2021 and September 30, 2020 (dollars, other than shares and per share amounts, in thousands):
| | | | | | | | | | | | | | | | | | | | | | | |
| | For the three months ended September 30, 2021 | | For the three months ended September 30, 2020 | | For the nine months ended September 30, 2021 | | For the nine months ended September 30, 2020 |
Numerator: | | | | | | | |
| Net income (loss) attributable to common stockholders and participating securities for basic and diluted earnings per share | $ | (4,213) | | | $ | 59,807 | | | $ | (36,423) | | | $ | (339,144) | |
| Less: | | | | | | | |
| Dividends and undistributed earnings allocated to participating securities | 24 | | | 353 | | | 65 | | | 16 | |
| Net income (loss) allocable to common stockholders — basic and diluted | $ | (4,237) | | | $ | 59,454 | | | $ | (36,488) | | | $ | (339,160) | |
| | | | | | | |
Denominator: | | | | | | | |
| Weighted average common shares outstanding for basic earnings per share | 60,795,688 | | | 60,740,701 | | | 60,771,759 | | | 56,293,512 | |
| Weighted average common shares outstanding for diluted earnings per share | 60,795,688 | | | 60,740,701 | | | 60,771,759 | | | 56,293,512 | |
| Basic earnings (loss) per common share | $ | (0.07) | | | $ | 0.98 | | | $ | (0.60) | | | $ | (6.02) | |
| Diluted earnings (loss) per common share | $ | (0.07) | | | $ | 0.98 | | | $ | (0.60) | | | $ | (6.02) | |
For the three and nine months ended September 30, 2021 and September 30, 2020, the Company excluded the effects of the convertible senior unsecured notes from the computation of diluted earnings per share since the average market value per share of the Company’s common stock was below the exercise price of the convertible senior unsecured notes.
Note 14 — Income Taxes
As a REIT, the Company is not subject to federal income tax to the extent that it makes qualifying distributions to its stockholders and satisfies on a continuing basis, through actual investment and operating results, the REIT requirements including certain asset, income and stock ownership tests.
Based on the Company’s analysis of any potential uncertain income tax positions, the Company concluded that it does not have any uncertain tax positions that meet the recognition or measurement criteria as of September 30, 2021. The Company files U.S. federal and state income tax returns. As of September 30, 2021, U.S. federal tax returns filed by the Company for 2019, 2018 and 2017 and state tax returns filed for 2019, 2018, 2017, 2016 and 2015 are open for examination pursuant to relevant statutes of limitation. In the event that the Company incurs income tax related interest and penalties, the Company’s policy is to classify them as a component of its provision for income taxes.
Income Tax Provision
Subject to the limitation under the REIT asset test rules, the Company is permitted to own up to 100% of the stock of one or more taxable REIT subsidiaries ("TRS"). Currently, the Company owns one TRS that is taxable as a corporation and is subject to federal, state and local income tax on its net income at the applicable corporate rates. The TRS, which was formed in Delaware on July 28, 2014, is a limited liability company and a wholly-owned subsidiary of the Company. During the three months ended September 30, 2021 and September 30, 2020, the Company recorded a federal and state tax benefit of $218 thousand and tax provision of $205 thousand, respectively, which is recorded in "Income tax provision (benefit)" in the Consolidated Statements of Operations. During the nine months ended September 30, 2021 and September 30, 2020, the Company recorded a federal and state tax benefit of $19 thousand and tax provision of $367 thousand, respectively.
Deferred Tax Asset
As of September 30, 2021 and December 31, 2020, we had no fixed pay ratethe Company recorded a deferred tax asset of approximately $20.6 million and $21.0 million, respectively, relating to capital loss carryforward and temporary differences as a result of the timing of income recognition of certain investments held in the TRS. The capital loss carryforwards may only be recognized to the extent of capital gains. There is uncertainty as to the TRS' ability to recognize capital gains in the future. As a result, the Company has concluded it is more likely than not the deferred tax asset will not be realized and has recorded a full valuation allowance of $20.6 million and $21.0 million as of September 30, 2021 and December 31, 2020, respectively.
In addition, the REIT generated net operating losses ("NOLs") during the nine months ended September 30, 2021 related to ordinary losses on its MBS portfolio and it generated NOLs for the years ended December 31, 2020 and December 31, 2017, related to its interest rate swaps or variable payswap terminations, and for its California return a portion of the NOLs is apportioned to the TRS. The Company recorded a deferred tax asset relating to the NOLs of $18.8 million and $19.3 million in the REIT and $2.1 million and $2.1 million in the TRS as of September 30, 2021 and December 31, 2020, respectively. The TRS can carryback the NOLs generated during the years ended December 31, 2020 and December 31, 2017 to each of the two preceding years to request a refund for taxes paid. As of September 30, 2021 and December 31, 2020, the Company has concluded it is more likely than not the deferred tax asset relating to the NOLs will not be realized, with the exception of the TRS carryback to 2015, and it has recorded a combined valuation allowance of $20.9 million and $21.4 million, respectively.
Effective Tax Rate
The Company's effective tax rate interestdiffers from its combined federal and state income tax rate swaps.primarily due to its valuation allowance and the deduction of dividends distributions to be paid under Code Section 857(a).
Capital Markets ActivityNote 15 — Contingencies
The following
From time to time, the Company may become involved in various claims and legal actions arising in the ordinary course of business. Management is a summarynot aware of activity during 2020: any material contingencies at September 30, 2021.
Stock Repurchase
Note 16 — Subsequent Events
On December 19, 2019, our BoardNovember 5, 2021, the Company entered into an amendment of Directors reauthorizedits Residential Whole Loan Facility. The amendment facility bears an interest rate to LIBOR plus 2.00%, with a LIBOR floor of 0.25%. The facility is available to finance five types of residential mortgages: Non-Agency mortgage loans, Non-QM loans, investor loans, re-performing and non-performing loans. The advance rates differ by type of loan, but for performing Non-QM loans the advance rate is 90%. The facility matures on November 4, 2022. The facility is a mark to market margin facility once the collateral value declines below par and has a stated capacity of $500 million.
ITEM 2.Management’s Discussion and Analysis of Financial Condition and Results of Operations.
FORWARD-LOOKING INFORMATION
The Company makes forward-looking statements herein and will make forward-looking statements in future filings with the Securities and Exchange Commission (the “SEC”), press releases or other written or oral communications within the meaning of Section 27A of the Securities Act of 1933, as amended (the “Securities Act”), and Section 21E of the Securities Exchange Act of 1934, as amended (the “Exchange Act”). For these statements, the Company claims the protections of the safe harbor for forward-looking statements contained in such sections. Forward-looking statements are subject to substantial risks and uncertainties, many of which are difficult to predict and are generally beyond the Company’s control. In particular, it is difficult to fully assess the long-term social, economic and health impact of and success of recovery efforts, including vaccine distribution, relate to COVID-19 at this time.
These forward-looking statements include information about possible or assumed future results of the Company’s business, financial condition, liquidity, results of operations, plans and objectives. When the Company uses the words “believe,” “expect,” “anticipate,” “estimate,” “plan,” “continue,” “intend,” “should,” “may” or similar expressions, the Company intends to identify forward-looking statements. Statements regarding the following subjects, among others, may be forward-looking: market trends in the Company’s industry, interest rates, real estate values, the debt securities markets, the U.S. housing and the U.S. and foreign commercial real estate markets or the general economy or the market for residential and/or commercial mortgage loans; the Company’s business and investment strategy; the Company’s projected operating results; changes in interest rates and the market value of the Company’s target assets; credit risks; servicing - related risks, including those associated with foreclosure and liquidation; the state of the U.S. and to a lesser extent, international economy generally or in specific geographic regions; economic trends and economic recoveries; the Company’s ability to obtain and maintain financing arrangements, including under the Company’s repurchase programagreements, a form of upsecured financing, and securitizations; the current potential return dynamics available in residential mortgage-backed securities (“RMBS”), and commercial mortgage-backed securities (“CMBS” and collectively with RMBS, “MBS”); the level of government involvement in the U.S. mortgage market; the anticipated default rates on CMBS and Commercial Loans; the loss severity on Non-Agency MBS; the general volatility of the securities markets in which the Company participates; changes in the value of the Company’s assets; the Company’s expected portfolio of assets; the Company’s expected investment and underwriting process; interest rate mismatches between the Company’s target assets and any borrowings used to 2,700,000 sharesfund such assets; changes in prepayment rates on the Company’s target assets; effects of our common stock throughhedging instruments on the Company’s target assets; rates of default or decreased recovery rates on the Company’s target assets; the degree to which the Company’s hedging strategies may or may not protect the Company from interest rate volatility; the impact of and changes in governmental regulations, tax law and rates, accounting guidance and similar matters; the Company’s ability to maintain the Company’s qualification as a real estate investment trust for U.S. federal income tax purposes; the Company’s ability to maintain its exemption from registration under the Investment Company Act of 1940, as amended (the “1940 Act”); the availability of opportunities to acquire Agency RMBS, Non-Agency RMBS, CMBS, Residential and Commercial Whole Loans, Residential and Commercial Bridge Loans and other mortgage assets; the availability of qualified personnel; estimates relating to the Company’s ability to make distributions to its stockholders in the future; the Company’s understanding of its competition; the uncertainty and economic impact of pandemics, epidemics or other public health emergencies, such as the ongoing outbreak of COVID-19; and the Manager's expectations regarding COVID-19 recovery.
The forward-looking statements are based on the Company’s beliefs, assumptions and expectations of its future performance, taking into account all information currently available to it. Forward-looking statements are not predictions of future events. These beliefs, assumptions and expectations can change as a result of many possible events or factors, not all of which are known to the Company. Some of these factors, are described in “Risk Factors” and “Management’s Discussion and Analysis of Financial Condition and Results of Operations” herein and in the Company’s Annual Report on Form 10-K for the year ended December 31, 2020, filed with the SEC on March 5, 2021. In March 2020,These and other risks, uncertainties and factors, including those described in the annual, quarterly and current reports that the Company files with the SEC, could cause its actual results to differ materially from those included in any forward-looking statements the Company makes. All forward-looking statements speak only as of the date they are made. New risks and uncertainties arise over time and it is not possible to predict those events or how they may affect the Company. Except as required by law, the Company is not obligated to, and does not intend to, update or revise any forward-looking statements, whether as a result of new information, future events or otherwise.
Overview
Western Asset Mortgage Capital Corporation, a Delaware corporation, and its Subsidiaries (the “Company” unless otherwise indicated or except where the context otherwise requires “we,” “us” or “our”) commenced operations in May 2012, focused on investing in, financing and managing a diversified portfolio of real estate related securities, whole loans and other financial assets, which we collectively refer to as our target assets. We are externally managed by Western Asset Management Company, LLC (our “Manager”) pursuant to the repurchase planterms of a management agreement. We conduct our operations to qualify and be taxed as a real estate investment trust, or REIT, for U.S. federal income tax purposes. Accordingly, we acquired 100,000 shares with an average price, including commission,generally will not be subject to U.S. federal income taxes on our taxable income that we distribute currently to our stockholders as long as we maintain our intended qualification as a REIT. However, certain activities that we may perform may cause us to earn income which will not be qualifying income for REIT purposes. We have designated a subsidiary as a taxable REIT subsidiary, or TRS, to engage in such activities. We also intend to operate our business in a manner that permits us to maintain our exemption from registration under the Investment Company Act of $5.78 per share, totaling approximately $578 thousand.1940, as amended (the "1940 Act"). Our common stock is traded on the New York Stock Exchange, or the NYSE, under the symbol "WMC."
At-The-Market Program
In March 2017, we entered into Our objective is to provide attractive risk adjusted returns to our stockholders primarily through an equity distribution agreement with JMP Securities LLC, which was amended on June 5, 2020, underattractive dividend, which we intend to support with sustainable distributable earnings (which we previously referred to as core earnings), as well as the potential for higher returns through capital appreciation. Our investment strategy is based on our Manager's perspective of which mix of our target assets it believes provides us with the best risk-reward opportunities at any given time. We also deploy leverage as part of our investment strategy to increase potential returns.
Our Investment Strategy
Our Manager’s investment philosophy, which developed from a singular focus in fixed-income asset management over a variety of credit cycles and conditions, is to provide clients with a diversified, long-term value-oriented portfolio. We benefit from the breadth and depth of our Manager’s overall investment philosophy, which focuses on a macroeconomic analysis as well as an in-depth analysis of individual assets and their relative value. In making investment decisions on our behalf, our Manager seeks to identify assets across the broad mortgage universe with attractive risk adjusted returns, which incorporates its view on the outlook for the mortgage markets, including relative valuation, supply and demand trends, the level of interest rates, the shape of the yield curve, prepayment rates, financing and liquidity, commercial and residential real estate prices, delinquencies, default rates, recovery of various segments of the economy and vintage of collateral, subject to maintaining our REIT qualification and our exemption from registration under the 1940 Act. We do not have an established minimum current rating requirement for our investments.
Our Target Assets
Residential Whole Loans. — Residential Whole Loans are mortgages secured by single family residences held directly by us or through consolidated trusts with us holding the beneficial interest in the trusts. Our Residential Whole Loans are mainly adjustable rate mortgages that do not qualify for the Consumer Finance Protection Bureau’s (or CFPB) safe harbor provision for “qualified mortgages” ("Non-QM mortgages"). Our Manager’s review, relating to Non-QM mortgages, includes an analysis of the loan originator’s procedures and documentation for compliance with Ability to Repay requirements. As discussed in Note 7 "Financing," we have and may offercontinue to securitize whole loan interests, selling more senior interests in the pool of loans and retaining residual portions. The characteristics of our Residential Whole Loans may vary going forward.
Commercial Whole Loans. — Commercial Whole Loans are generally loans ranging from $5 million to $125 million, secured by commercial real estate typically short-term loans. The collateral types may include hospitality, senior care living facilities, multifamily, office retail and industrial properties. These loans may be held directly by us or through consolidated trusts with us holding the beneficial interest in the trust.
Commercial Mezzanine Loans. —Commercialmezzanine loans are generally structured to represent a senior position in the borrower’s equity in, and subordinate to a first mortgage loan, on a property. These loans are generally secured by pledges of ownership interests, in whole or in part, in entities that directly or indirectly own the real property. At times, mezzanine loans may be secured by additional collateral, including letters of credit, personal guarantees, or collateral unrelated to the property. Mezzanine loans may be structured to carry either fixed or floating interest rates as well as carry a right to participate in a percentage of gross revenues and a percentage of the increase in the fair market value of the property securing
the loan. Mezzanine loans may also contain prepayment lockouts, penalties, minimum profit hurdles and other mechanisms to protect and enhance returns to the lender. Mezzanine loans usually have maturities that match the maturity of the related mortgage loan but may have shorter or longer terms. Depending on the structure of a transaction, Commercial Mezzanine loans may or may not qualify as "qualifying real estate interests" for purposes of the 1940 Act.
Non-Agency RMBS. — RMBS that are not guaranteed by a U.S. Government agency or U.S. Government-sponsored entity. The mortgage loan collateral for Non-Agency RMBS consists of residential mortgage loans that do not generally conform to underwriting guidelines issued by a U.S. Government agency or U.S. Government-sponsored entity due to certain factors, including mortgage balances in excess of Agency underwriting guidelines, borrower characteristics, loan characteristics and/or level of documentation, and therefore are not issued or guaranteed by a U.S. Government agency or U.S. Government-sponsored entity. The mortgage loan collateral may be classified as subprime, Alternative-A or prime depending on the borrower’s credit rating and the underlying level of documentation. Non-Agency RMBS collateral may also include reperforming loans, which are conventional mortgage loans that were current at the time of the securitization, but had been delinquent in the past. Non-Agency RMBS may be secured by fixed-rate mortgages, adjustable-rate mortgages or hybrid adjustable-rate mortgages.
Non-Agency CMBS. — Fixed and floating rate CMBS for which the principal and interest payments are not guaranteed by a U.S. Government agency or U.S. Government-sponsored entity.
Agency CMBS. — Fixed and floating rate CMBS, for which the principal and interest payments are guaranteed by a U.S. Government agency or U.S. Government-sponsored entity, but for which the underlying mortgage loans are secured by real property other than single family residences. These may include, but are not limited to Fannie Mae DUS (Delegated Underwriting and Servicing) MBS, Freddie Mac Multifamily Mortgage Participation Certificates, Ginnie Mae project loan pools, and/or CMOs structured from such collateral. These securities generally have prepayment protection in the form of defeasance, yield maintenance or points.
Agency RMBS. — Agency RMBS, which are RMBS for which the principal and interest payments are guaranteed by a U.S. Government agency, such as the Government National Mortgage Association (“GNMA” or “Ginnie Mae”), or a U.S. Government-sponsored entity ("GSE"), such as the Federal National Mortgage Association (“FNMA” or “Fannie Mae”) or the Federal Home Loan Mortgage Corporation (“FHLMC” or “Freddie Mac”). The Agency RMBS we acquire can be secured by fixed-rate mortgages, adjustable-rate mortgages or hybrid adjustable-rate mortgages. Fixed-rate mortgages have interest rates that are fixed for the term of the loan and do not adjust. The interest rates on adjustable-rate mortgages generally adjust annually (although some may adjust more frequently) to an increment over a specified interest rate index. Hybrid adjustable-rate mortgages have interest rates that are fixed for a specified period of time (typically three, five, seven or ten years) and, thereafter, adjust to an increment over a specified interest rate index. Adjustable-rate mortgages and hybrid adjustable-rate mortgages generally have periodic and lifetime constraints on the amount by which the loan interest rate can change on any predetermined interest rate reset date. These investments can be in the form of pools, TBA and CMO (including interest only, principal only or other structures).
GSE Risk Sharing Securities Issued by Fannie Mae and Freddie Mac. — From time to time we have and may in the future continue to invest in risk sharing securities issued by Fannie Mae and Freddie Mac. Principal and interest payments on these securities are based on the performance of a specified pool of Agency residential mortgages. The payments due on these securities, however, are not secured by the referenced mortgages. The payments due are full faith and credit obligations of Fannie Mae or Freddie Mac respectively, but neither agency guarantees full payment of the underlying mortgages. Investments in these securities generally are not qualifying assets for purposes of the 75% real estate asset test applicable to REITs and generally do not generate qualifying income for purposes of the 75% real estate income test applicable to REITs. As a result, we may be limited in our ability to invest in such assets.
Other investments. — In addition to MBS, our principal investment, we may also make other investments in securities, which our Manager believes will assist us in meeting our investment objective and are consistent with our overall investment policies. These investments will normally be limited by the REIT requirements that 75% our assets be real estate assets and that 75% of our income be generated from real estate, thereby limiting our ability to invest in such assets.
Our Investment Portfolio
Our investment portfolio composition at September 30, 2021.
Our Financing Strategy
During 2020, the uncertainties created by the COVID-19 pandemic made it challenging to obtain financing arrangements on favorable terms, including our repurchase agreements, term financings, and securitizations. In the latter part of 2020 and continuing into 2021 terms for financing arrangements have improved significantly. We have primarily financed our investment acquisitions with repurchase agreements. We believe the amount of leverage we use is consistent with our intention of keeping total borrowings within a prudent range, as determined by our Manager, taking into account a variety of factors such as general economic, political and financial market conditions, the anticipated liquidity and price volatility of our assets, the availability and cost of financing the assets, the creditworthiness of financing counterparties and the health of the U.S. residential and commercial mortgage markets. In utilizing leverage, we seek to enhance equity returns while limiting our exposure to interest rate volatility and daily margin calls. We expect to continue to seek financing arrangements without daily margin requirements or with margin requirements which apply only after a significant reduction in the valuation of the assets financed, including but not limited to term financing, securitization and convertible senior unsecured notes, as the market permits. We expect to maintain a debt-to-equity ratio of two to four and a half times the amount of our stockholders’ equity, depending on our investment composition.
Our repurchase agreements bear interest at a contractually agreed-upon rate and historically had terms ranging from one month to 18 months. Under these repurchase agreements, the respective counterparties retain the right to determine the fair value of the underlying collateral. A reduction in the value of pledged assets may require us to post additional securities as collateral, pay down borrowings or establish cash margin accounts with the counterparties in order to re-establish the agreed-upon advance rates. Our inability to post adequate collateral for a margin call by a counterparty, in a timeframe as short as the close of the same business day, could result in a condition of default under our repurchase agreements, thereby enabling the counterparty to liquidate the collateral pledged by us, which may have a material adverse effect on our financial position, results of operations and cash flows.
Our repurchase agreement counterparties generally require collateral in excess of the loan amount, or haircuts. As of September 30, 2021, the ranges of the haircuts on our investments were as follows:
| | | | | | | | | | | | | | | | | | | | |
| Collateral | | Minimum | | Maximum (excluding IOs and IIOs) | | Maximum (including IOs and IIOs) |
| Agency RMBS | | 25.0% | | n/a | | 25.0% |
| | | | | | |
| Non-Agency RMBS | | 35.0% | | 35.0% | | 35.0% |
| Non-Agency CMBS | | 25.0% | | 40.0% | | n/a |
| Other securities | | 35.0% | | 60.0% | | n/a |
Residential Whole Loans(1) | | 15.0% | | 50.0% | | n/a |
Commercial Loans(2) | | 22.0% | | 55.0% | | n/a |
(1) Includes Residential Bridge Loans.
(2) Includes Securitized commercial loans.
Our Hedging Strategy and Risk Management Strategy
Our overall portfolio strategy is designed to generate attractive returns to our investors through various economic cycles. We believe our broad approach to investing in the real estate mortgage markets, which considers all categories of real estate assets, allows us to invest in a diversified portfolio and help mitigate our portfolio from risks that arise from investing in a single or limited collateral type. In connection with our risk management activities, we may enter into a variety of derivative and non-derivative instruments. When purchased, our primary objective for acquiring these derivatives and non-derivative instruments is to mitigate our exposure to future events that are outside our control. Our derivative instruments are designed to mitigate the effects of market risk and cash flow volatility associated with interest rate risk, including prepayment risk. As part of our hedging strategy, we may enter into, interest rate swaps, including forward starting swaps, interest rate swaptions, U.S. Treasury options, future contracts, TBAs, credit default swaps, forwards and other similar instruments. There can be no assurance that appropriate hedging strategies will be available or that if implemented they will be successful.
Critical Accounting Policies
The consolidated financial statements include our accounts, those of our wholly-owned subsidiaries and certain VIEs in which we are the primary beneficiary. All intercompany amounts have been eliminated in consolidation. In accordance with GAAP, our consolidated financial statements require the use of estimates and assumptions that involve the exercise of judgment and use of assumptions as to future uncertainties. In accordance with SEC guidance, the following discussion addresses the accounting policies that we currently apply. Our most critical accounting policies will involve decisions and assessments that could affect our reported assets and liabilities, as well as our reported revenues and expenses. We believe that all of the decisions and assessments upon which our consolidated financial statements have been based were reasonable at the time made and based upon information available to us at that time. For a review of recent accounting pronouncements that may impact our results of operations, see Note 2 of our “Notes to Consolidated Financial Statements (Unaudited).”
There have been no significant changes to our critical accounting policies that are disclosed in our most recent Annual Report on Form 10-K for the year ended December 31, 2020, other than the significant accounting policy disclosed below.
Real Estate Owned
REO represents real estate property acquired by the Company through foreclosure and it is classified as held for sale. Upon completion of the foreclosure, the Company initially records the REO at fair value less estimated costs to sell up to $100.0 million sharesthe property. In subsequent periods, REO is reported at the lower of common stockthe current carrying amount or fair value less estimated selling costs and it is classified in an At-The-Market equity offering."Other assets" in the Consolidated Balance Sheets. Gains/losses recognized on foreclosure as well as realized gains/losses on the disposition of REO are reported by the Company in "Realized gain (loss), net" in the Consolidated Statements of Operations.
2021 Activity
Investment Activity
We continually evaluate potential investments and our investment selection is based on supply and demand of our target assets, costs of financing, and the expected future interest rate volatility costs of hedging. During the nine months ended September 30, 2021, we acquired $243.3 million of residential whole loans. We did not sell any investments.
The following table presents our investing activity for the nine months ended September 30, 2021 (dollars in thousands): | | | | | | | | | | | | | | | | | | | | | | | | | | | | | | | | | | |
| Balance at | | Loan Modification/Capitalized Interest | Principal Payments and Basis Recovery | Proceeds from
Sales | Transfers to REO | Realized Gain/(Loss) | Unrealized Gain/(loss) | Premium and discount amortization, net | | | Balance at |
| Investment Type | December 31, 2020 | Purchases | | September 30, 2021 |
| Agency RMBS and Agency RMBS IOs | $ | 1,708 | | $ | — | | N/A | $ | (258) | | $ | — | | N/A | $ | — | | $ | (108) | | $ | — | | | | $ | 1,342 | |
| Non-Agency RMBS | 25,381 | | — | | N/A | (904) | | — | | N/A | — | | 3,710 | | (176) | | | | 28,011 | |
| | | | | | | | | | | | |
| Non-Agency CMBS | 164,081 | | — | | N/A | (13,479) | | — | | N/A | (5,929) | | (16,254) | | 6,231 | | | | 134,650 | |
Other securities(1) | 48,754 | | — | | N/A | — | | — | | N/A | — | | 4,553 | | (1,214) | | | | 52,093 | |
| Total MBS and other securities | 239,924 | | — | | N/A | (14,641) | | — | | N/A | (5,929) | | (8,099) | | 4,841 | | | | 216,096 | |
| Residential Whole Loans | 1,008,782 | | 243,322 | | 310 | | (309,395) | | — | | — | | — | | 13,667 | | (7,269) | | | | 949,417 | |
| Residential Bridge Loans | 13,916 | | — | | — | | (7,667) | | — | | (752) | | (155) | | 639 | | (21) | | | | 5,960 | |
| Commercial Loans | 310,523 | | — | | — | | (103,272) | | — | | (30,000) | | — | | (48,630) | | 145 | | | | 128,766 | |
| Securitized commercial loans | 1,605,335 | | — | | — | | (354,202) | | — | | — | | — | | 107,423 | | 18,449 | | | | 1,377,005 | |
| Total Investments | $ | 3,178,480 | | $ | 243,322 | | $ | 310 | | $ | (789,177) | | $ | — | | $ | (30,752) | | $ | (6,084) | | $ | 65,000 | | $ | 16,145 | | | | $ | 2,677,244 | |
(1) Other securities include $45.8 million of GSE CRTs and $6.3 million of ABS at September 30, 2021.
Portfolio Characteristics
Our Agency Portfolio
The following table summarizes our Agency portfolio by investment category as of September 30, 2021 (dollars in thousands): | | | | | | | | | | | | | | | | | | | | | | | |
| | Principal Balance | | Amortized Cost | | Fair Value | | Net Weighted
Average Coupon |
| | | | | | | |
| | | | | | | |
| | | | | | | |
| | | | | | | |
| | | | | | | |
| | | | | | | |
| | | | | | | |
Agency RMBS IOs and IIOs (1) | N/A | | $ | 63 | | | $ | 134 | | | 1.4 | % |
Agency RMBS IOs and IIOs accounted for as derivatives (1) | N/A | | N/A | | 1,208 | | | 1.3 | % |
| Total Agency RMBS | — | | | 63 | | | 1,342 | | | 1.3 | % |
| Total | $ | — | | | $ | 63 | | | $ | 1,342 | | | 1.3 | % |
(1)IOs and IIOs have no principal balances and bear interest based on a notional balance. The notional balance is used solely to determine interest distributions on the interest-only class of securities.
Credit Sensitive Portfolio
Non-Agency RMBS
The following table presents the fair value and weighted average purchase price for each of our Non-agency RMBS categories, including IOs accounted for as derivatives, together with certain of their respective underlying loan collateral attributes and current performance metrics as of September 30, 2021 (fair value dollars in thousands):
| | | | | | | | | | | | | | | | | | | | | | | | | | | | | | | | | | | | | | | | | | | | |
| | | | | Weighted Average |
| Category | | Fair Value | | Purchase
Price | | Life (Years) | | Original LTV | | Original
FICO | | 60+ Day
Delinquent | | CPR |
| Prime | | $ | 10,324 | | | $ | 74.82 | | | 5.6 | | | 59.4 | % | | 779 | | | 4.1 | % | | 40.5 | % |
| Alt-A | | 17,687 | | | 44.10 | | | 10.5 | | | 71.4 | % | | 589 | | | 18.5 | % | | 9.6 | % |
| | | | | | | | | | | | | | |
| Total | | $ | 28,011 | | | $ | 55.42 | | | 8.7 | | | 67.0 | % | | 659 | | | 13.2 | % | | 21.0 | % |
Non-Agency CMBS
The following table presents certain characteristics of our Non-Agency CMBS portfolio as of September 30, 2021 (dollars in thousands): | | | | | | | | | | | | | | | | | | | | | | | | | | | | | | | | |
| | | | | Principal | | | | Weighted Average |
| Type | | Vintage | | Balance | | Fair Value | | Life (Years) | | Original LTV |
| Conduit: | | | | | | | | | | |
| | | 2006-2009 | | $ | 2,229 | | | $ | 1,677 | | | 2.4 | | | 75.0 | % |
| | | 2010-2020 | | 94,107 | | | 34,657 | | | 5.8 | | | 63.6 | % |
| | | | | 96,336 | | | 36,334 | | | 5.7 | | | 64.1 | % |
| Single Asset: | | | | | | | | | | |
| | | 2010-2020 | | 116,104 | | | 98,316 | | | 1.7 | | | 64.9 | % |
| Total | | | | $ | 212,440 | | | $ | 134,650 | | | 2.8 | | | 64.7 | % |
Residential Whole Loans
The Residential Whole Loans have low LTV's and are comprised of 2,187 Non-QM adjustable rate mortgages and six investor fixed rate mortgages. The following table presents certain information about our Residential Whole Loans investment portfolio at September 30, 2021 (dollars in thousands):
| | | | | | | | | | | | | | | | | | | | | | | | | | | | | | | | | | | | | | | | | | | | |
| | | | | | | Weighted Average |
| Current Coupon Rate | | Number of Loans | | Principal
Balance | | Original LTV | | Original FICO Score(1) | | Expected
Life (years) | | Contractual
Maturity
(years) | | Coupon
Rate |
| 2.01% – 3.00% | | 14 | | $ | 7,816 | | | 66.0 | % | | 746 | | | 5.7 | | 28.4 | | 2.7 | % |
| 3.01% – 4.00% | | 332 | | 163,681 | | | 62.6 | % | | 751 | | | 3.2 | | 27.3 | | 3.7 | % |
| 4.01% – 5.00% | | 997 | | 380,394 | | | 64.8 | % | | 748 | | | 2.7 | | 28.0 | | 4.8 | % |
| 5.01% – 6.00% | | 820 | | 346,778 | | | 64.6 | % | | 739 | | | 2.9 | | 27.2 | | 5.4 | % |
| 6.01% – 7.00% | | 28 | | 9,337 | | | 67.8 | % | | 720 | | | 3.0 | | 25.9 | | 6.3 | % |
| 7.01% - 8.00% | | 2 | | 506 | | | 73.2 | % | | 753 | | | 4.5 | | 26.9 | | 7.1 | % |
| | | | | | | | | | | | | | |
| Total | | 2,193 | | $ | 908,512 | | | 64.3 | % | | 745 | | | 2.9 | | 27.6 | | 4.8 | % |
(1)The original FICO score is not available for 215 loans with a principal balance of approximately $68.8 million at September 30, 2021. We have excluded those loans from the weighted average computation.
Residential Bridge Loans
Our Residential Bridge Loans are comprised of short-term fixed rate mortgages secured by non-owner occupied single and multi-family residences with low LTVs, generally up to 85%. The following table presents certain information about our Residential Bridge Loans investment portfolio at September 30, 2021 (dollars in
thousands): | | | | | | | | | | | | | | | | | | | | | | | | | | | | | | | | |
| | | | | | | Weighted Average |
| Current Coupon Rate | | Number of Loans | | Principal
Balance | | Original LTV | | Contractual Maturity (months)(1) | | Coupon
Rate |
| | | | | | | | | | |
| 7.01% – 9.00% | | 3 | | $ | 2,946 | | | 70.4 | % | | 0.0 | | 8.8 | % |
| 9.01% – 11.00% | | 7 | | 3,213 | | | 75.9 | % | | 2.0 | | 10.3 | % |
| 11.01% – 13.00% | | 2 | | 495 | | | 69.7 | % | | 2.0 | | 11.4 | % |
| | | | | | | | | | |
| | | | | | | | | | |
| | | | | | | | | | |
| | | | | | | | | | |
| | | | | | | | | | |
| Total | | 12 | | $ | 6,654 | | | 73.0 | % | | 2.0 | | 9.7 | % |
(1) Non-performing loans that are past their maturity date are excluded from the calculation of the weighted average contractual maturity. The weighted average contractual maturity for these loans is zero.
Non-performing Residential Loans
The following table presents the aging of the Residential Whole Loans and Bridge Loans as of September 30, 2021 (dollars in thousands):
| | | | | | | | | | | | | | | | | | | | | | | | | | | | | | | | | | | | | | |
| | Residential Whole Loans | | Bridge Loans |
| | No of Loans | | Principal | | Fair Value | | No of Loans | | Principal | | Fair Value |
Current(1) | | 2,156 | | | $ | 889,231 | | | $ | 930,286 | | | 1 | | | $ | 75 | | | $ | 75 | |
| 1-30 days | | 15 | | | 7,448 | | | 7,746 | | | 1 | | | 105 | | | 105 | |
| 31-60 days | | — | | | — | | | — | | | — | | | — | | | — | |
| 61-90 days | | 3 | | | 1,238 | | | 1,259 | | | — | | | — | | | — | |
| 90+ days | | 19 | | | 10,595 | | | 10,126 | | | 10 | | | 6,474 | | | 5,780 | |
| Total | | 2,193 | | | $ | 908,512 | | | $ | 949,417 | | | 12 | | | $ | 6,654 | | | $ | 5,960 | |
(1) Includes one loan in forbearance with unpaid principal balance of $493 thousand.
Residential Whole Loans Forbearance Programs
COVID-19 has materially disrupted business operations, resulting in significantly higher levels of unemployment or underemployment in certain sectors. As a result, some Residential Whole Loan borrowers have experienced financial hardship, making it difficult to meet their payment obligations to us, leading to requests for forbearance and higher levels of delinquency and potentially defaults. We maintain a strong relationship with our servicers and have utilized these relationships to manage the impacts of COVID-19 pandemic on our Non-QM loans, including the use of forbearance programs. As of September 30, 2021, we had one Non-QM loan in forbearance and no Non-QM loans in the repayment phase following forbearance. Under the forbearance agreement, the borrower can generally elect to defer the principal and interest payments for 3 to 5 months. At the end of the forbearance period, the borrower can either repay the deferred principal and interest in full or over the next 9 months or, capitalize the deferred principal and interest to the loan balance and calculate a new amortization payment. Loans in forbearance are treated as "Current" in the above table. The loan in forbearance is carried at fair value and had an unpaid principal balance of $493 thousand, a fair value of $434 thousand, an original LTV of 64.7%, and represents approximately 0.1% of the total outstanding principal balance of our Residential Whole Loans.
Residential Whole Loans in Non-Accrual Status
As of September 30, 2021, there were 19 Non-QM loans carried at fair value in non-accrual status with an unpaid principal balance of approximately $10.6 million and a fair value of $10.1 million. These nonperforming loans represent approximately 1.2% of the total outstanding principal balance. No allowance or provision for credit losses was recorded as of and for the three and nine months ended September 30, 2021 since the valuation adjustment, if any, would be reflected in the fair value of these loans. We stopped accruing interest income for these loans when they became contractually 90 days delinquent.
As of September 30, 2021, there were 10 Residential Bridge Loans carried at fair value in non-accrual status with an unpaid principal balance of approximately $6.5 million and a fair value of $5.8 million. These nonperforming Residential Bridge Loans represent approximately 97.3% of the total outstanding principal balance. No allowance and provision for credit losses was recorded for loans carried at fair value as of and for the three and nine months ended September 30, 2021 since valuation adjustments, if any, would be reflected in the fair value of these loans. We stopped accruing interest income for these loans when they became contractually 90 days delinquent.
As of September 30, 2021, we had four real estate owned ("REO") properties with an aggregate carrying value of $1.1 million related to foreclosed Bridge Loans. The REO properties are held for sale and accordingly carried at the lower of cost or fair value less cost to sell. The REO properties are classified in "Other assets" in the Consolidated Balance Sheets.
Commercial Real Estate Investments
The following table presents our commercial loan investments as of September 30, 2021 (dollars in thousands):
| | | | | | | | | | | | | | | | | | | | | | | | | | | | | |
| Loan | Loan Type | Principal Balance | Fair Value | Original LTV | Interest Rate | Maturity Date | Extension Option | Collateral | Geographic Location |
| CRE 3 | Interest-Only Mezzanine loan | $ | 90,000 | | $ | 27,495 | | 58% | 1-Month LIBOR plus 9.25% | 6/29/2021 | Two-Year First Extension and One-Year Second Extension | Entertainment and Retail | NJ |
| CRE 4 | Interest-Only First Mortgage | 38,367 | | 38,294 | | 63% | 1-Month LIBOR plus 3.02% | 8/6/2022 | Two One-Year Extensions | Retail | CT |
| CRE 5 | Interest-Only First Mortgage | 24,535 | | 24,085 | | 62% | 1-Month LIBOR plus 3.75% | 11/6/2022 | Three One-Year Extensions | Hotel | NY |
| CRE 6 | Interest-Only First Mortgage | 13,207 | | 12,964 | | 62% | 1-Month LIBOR plus 3.75% | 11/6/2022 | Three One-Year Extensions | Hotel | CA |
| CRE 7 | Interest-Only First Mortgage | 7,259 | | 7,126 | | 62% | 1-Month LIBOR plus 3.75% | 11/6/2022 | Three One-Year Extensions | Hotel | IL, FL |
| CRE 8 | Interest-Only First Mortgage | 4,442 | | 4,440 | | 79% | 1-Month LIBOR plus 4.85% | 12/6/2022 | None | Assisted Living Facilities | FL |
| SBC 3 | Interest-Only First Mortgage | 14,362 | | 14,362 | | 49% | 1-Month LIBOR plus 4.10% | 7/6/2022 | None | Nursing Facilities | CT |
| | $ | 192,172 | | $ | 128,766 | | | | | | | |
| | | | | | | | | |
Commercial Loan Payoffs
On July 7, 2021, SBC 1, with an outstanding principal balance of $45.2 million collateralized by nursing facilities, was paid off in full.
On September 7, 2021, CRE 2, with an outstanding principal balance of $46.8 million collateralized by nursing facilities, was paid off in full.
On September 24, 2021, SBC 2 with an outstanding principal balance of $9.2 million collateralized by an apartment complex was paid off in full.
Non-Performing Commercial Loans
The impact of COVID-19 pandemic has adversely impacted a broad range of industries in which our commercial loan borrowers operate and could impair their ability to fulfill their financial obligations to us, most significantly retail and hospitality asset. All but the two loans discussed below remain current.
CRE 1 Loan
In October 2020, we sold 6,034,741 sharescommenced foreclosure proceedings. However, on February 24, 2021, the borrower filed for bankruptcy protection halting the foreclosure process. In August 2021, the bankruptcy case was dismissed by the bankruptcy court and we, together with the other holders of the loan, foreclosed on the property through a SPE formed for the purpose of holding the property. The property is currently being marketed for sale. Based on preliminary bids, we believe there is a reasonable likelihood that our investment along with the other members' interest will be recovered, although there is no assurance of full recovery. The borrower has continued to file legal challenge to the sale process. While the Company believes these legal challenges have no merit, they have delayed moving forward with the sale of the property.
The SPE is consolidated by us and the property is recorded at the lower of cost or fair value less cost to sell. As of September 30, 2021, the REO is recorded at $42.5 million and classified in "Other assets" in the Consolidated Balance Sheets and the other members' interests in the SPE of approximately $11.9 million are recorded as "Non-controlling interest" in the consolidated financial statements.
CRE 3 Loan
As of September 30, 2021, the CRE 3 junior mezzanine loan with an outstanding principal balance of $90.0 million secured by a retail facility was non-performing and past its maturity date of June 29, 2021. We were receiving interest payments on this loan from a reserve that was exhausted in May 2021. During the second quarter of 2021, the fair value of the loan declined significantly. We are currently in discussions with the borrower and certain other lenders regarding alternatives to address the situation which might include modifications of loan terms, deferral of payments and the funding of new advances. There can be no assurance that these discussions will result in an outcome in which we would be repaid any amount of the loan and we may suffer further declines in fair value with respect to the mezzanine investment. For the three months ended September 30, 2021, we suffered a further decline of $5.2 million in the fair value of this investment. We could experience a total loss of our investment under various scenarios, which at current levels would result in a $27.5 million reduction in the Company’s book value. Refer to Note 6 - "Commercial Loans" for details.
The following table presents the aging of the Commercial Loans as of September 30, 2021 (dollars in thousands): | | | | | | | | | | | | | | | | | | | | |
| | Commercial Loans |
| | No of Loans | | Principal | | Fair Value |
| Current | | 6 | | | $ | 102,172 | | | $ | 101,271 | |
| 1-30 days | | — | | | — | | | — | |
| 31-60 days | | — | | | — | | | — | |
| 61-90 days | | — | | | — | | | — | |
| 90+ days | | 1 | | | 90,000 | | | 27,495 | |
| Total | | 7 | | | $ | 192,172 | | | $ | 128,766 | |
Securitized Commercial Loan
On August 1, 2020 we consolidated CSMC USA as a result of our ongoing reassessment of our CMBS VIE holdings for potential consolidation of the securitized trust. Our $14.9 million or 8.8% interest in the trust certificate of CSMC USA (F Class) was eliminated in the consolidation. Please refer to Note 6 - "Commercial Real Estate Investments" for details. The CSMC USA holds a commercial loan secured by a first mortgage lien on the borrowers’ fee and leasehold interests in a portion of a super-regional mall. The outstanding principal balance on this commercial loan is $1.4 billion as of September 30, 2021. The loan's stated maturity date is September 11, 2025 and bears a fixed interest rate of 4.38%. The commercial loan served as collateral for the $1.4 billion securitized debt issued by CMSC USA and the securitized debt is non-recourse to us. Refer to Note 7 - "Financings" for details on the associated securitized debt.
In December 2020, the commercial loan held by CSMC USA was amended to an interest only payment through maturity. As part of the modification, a Cash Management Forbearance Agreement was entered into by special servicer and the borrower that required both increased reporting requirements and monthly net cash remittance.
Geographic Concentration
The mortgages underlying our Non-Agency RMBS and Non-Agency CMBS are located in various states across the United States and other countries. The following table presents the five largest concentrations by location for the mortgages collateralizing our Non-Agency RMBS and Non-Agency CMBS as of September 30, 2021, based on fair value (dollars in thousands):
| | | | | | | | | | | | | | | | | | | | | | | | | | |
| | Non-Agency RMBS | | | Non-Agency CMBS |
| | Concentration | | Fair Value | | | Concentration | | Fair Value |
| California | 27.2 | % | | $ | 7,628 | | | California | 30.6 | % | | $ | 41,196 | |
| New York | 9.3 | % | | 2,591 | | | Nevada | 14.6 | % | | 19,620 | |
| Florida | 9.1 | % | | 2,554 | | | Illinois | 13.6 | % | | 18,372 | |
| New Jersey | 4.2 | % | | 1,173 | | | Bahamas | 10.6 | % | | 14,330 | |
| Maryland | 4.0 | % | | 1,125 | | | New York | 3.8 | % | | 5,073 | |
The following table presents the various states across the United States in which the collateral securing our Residential Whole Loans and Residential Bridge Loans at September 30, 2021, based on principal balance, is located (dollars in thousands):
| | | | | | | | | | | | | | | | | | | | | | | | | | |
| | Residential Whole Loans | | | Residential Bridge Loans |
| | State
Concentration | | Principal
Balance | | | State
Concentration | | Principal
Balance |
| California | 72.3 | % | | $ | 656,801 | | | New York | 39.5 | % | | $ | 2,631 | |
| New York | 14.3 | % | | 129,931 | | | California | 35.9 | % | | 2,386 | |
| Georgia | 2.7 | % | | 24,300 | | | Florida | 16.9 | % | | 1,125 | |
| Florida | 2.4 | % | | 21,697 | | | New Jersey | 5.0 | % | | 335 | |
| New Jersey | 2.0 | % | | 18,255 | | | Pennsylvania | 1.6 | % | | 105 | |
| Other | 6.3 | % | | 57,528 | | | Other | 1.1 | % | | 72 | |
| Total | 100.0 | % | | $ | 908,512 | | | Total | 100.0 | % | | $ | 6,654 | |
Financing Activity
We will look to continue to expand and diversify our financing sources, especially those sources that provide an alternative to short-term repurchase agreements with daily margin requirements. During the nine months ended September 30, 2021, we repurchased $129.3 million aggregate principal amount of the 2022 Notes and issued $86.3 million aggregate principal amount of the 2024 Notes. We did not sell any investments during the nine months ended September 30, 2021.
Repurchase Agreements
Non-Agency CMBS and Non-Agency RMBS Facility
On May 5, 2021, we amended our Non-Agency CMBS and Non-Agency RMBS financing facility to, among other things, extend the facility for an additional 12 months and reduce the interest rate. The amended facility has improved advance rates and bears interest at a rate of three-month LIBOR plus 2.00%. As of September 30, 2021, the outstanding balance under this amended agreementfacility was $111.5 million. The borrowing is secured by investments with an estimated fair market value of $196.7 million as of September 30, 2021.
Commercial Whole Loan Facility
As of September 30, 2021, we had approximately $63.7 million in borrowings, with a weighted average priceinterest rate of $3.70 per share2.27% under our commercial whole loan facility. The borrowing is secured by loans with an estimated fair market value of
$86.9 million as of September 30, 2021. The facility was subject to automatic monthly rolling until such time that it is terminated pursuant to the terms of the agreement by either the borrower or lender or until certain conditions of default.
Residential Whole Loan Facility
Under the residential whole loan facility, as of September 30, 2021, we had approximately $236.8 million in borrowings with an interest rate of one month LIBOR plus 2.75%. The borrowing is secured by Non-QM loans with an estimated fair market value of $287.1 million.
Recourse and Non-Recourse Financing
We utilize both recourse and non-recourse debt to finance our portfolio. Our recourse debt included our short and long-term repurchase agreement financings and our convertible senior unsecured notes. At September 30, 2021, our total non-recourse financing of approximately $2.0 billion is comprised of $605.0 million of securitized debt issued in connection with our two Residential Whole Loan securitizations and $1.4 billion of securitized debt from owning a $14.9 million Non-Agency CMBS bond deemed to be a controlling financial variable interest in CSMC USA which required us to consolidate the CMBS VIE.
| | | | | | | | | | | | | | |
| (dollars in thousands) | September 30, 2021 | | December 31, 2020 | |
| Recourse and non-recourse financing | $ | 2,580,413 | | | $ | 2,973,732 | | |
| Non-recourse financing | 1,970,513 | | | 2,446,012 | | |
| Total recourse financing | $ | 609,900 | | $609,900 | $ | 527,720 | | |
| | | | |
| Stockholders' equity | $ | 210,186 | | | $ | 255,112 | | |
| | | | |
| Recourse leverage | 2.9x | | 2.1x | |
Financing Facilities Outstanding Borrowings
At September 30, 2021, we had outstanding borrowings under five of our repurchase agreements. The following table summarizes certain characteristics of our repurchase agreements at September 30, 2021 (dollars in thousands):
| | | | | | | | | | | | | | | | | | | | |
| Securities Pledged | | Repurchase Agreement Borrowings | | Weighted Average Interest Rate on Borrowings Outstanding at end of period | | Weighted Average Remaining Maturity (days) |
| Short-Term Borrowings: | | | | | | |
| | | | | | |
| Agency RMBS | | $ | 1,048 | | | 1.05 | % | | 59 |
| Non-Agency CMBS | | 10,314 | | | 1.75 | % | | 12 |
| | | | | | |
Residential Whole Loans (1) | | 41,013 | | | 2.66 | % | | 4 |
Residential Bridge Loans (1) | | 5,817 | | | 2.60 | % | | 4 |
Commercial Loans (1) | | 10,603 | | | 3.18 | % | | 4 |
| | | | | | |
| Other Securities | | 2,587 | | | 3.52 | % | | 19 |
| Subtotal | | 71,382 | | | 2.60 | % | | 7 |
| Long-Term Borrowings: | | | | | | |
Non-Agency CMBS (2) | | 68,352 | | | 2.12 | % | | 193 |
| Non-Agency RMBS | | 15,632 | | | 2.12 | % | | 217 |
Residential Whole Loans (1)(3) | | 236,767 | | | 3.00 | % | | 36 |
| Commercial Loans | | 63,669 | | | 2.27 | % | | 360 |
| Other Securities | | 27,506 | | | 2.12 | % | | 217 |
| Subtotal | | 411,926 | | | 2.65 | % | | 113 |
| Repurchase Agreements Borrowings | | $ | 483,308 | | | 2.64 | % | | 98 |
| Less Unamortized Debt Issuance Costs | | 40 | | | N/A | | N/A |
| Repurchase Agreements Borrowings, net | | $ | 483,268 | | | 2.64 | % | | 98 |
(1)Repurchase agreement borrowings on loans owned are through trust certificates. The trust certificates are eliminated in consolidation.
(2)Includes repurchase agreement borrowings on securities eliminated upon VIE consolidation.
(3)The Residential Whole Loan facility's maturity was extended one month in October 2021.The weighted average remaining maturity reflects the one month extension.
.
Certain of the financing arrangements provide the counterparty with the right to terminate the agreement if we do not maintain certain equity, liquidity and leverage metrics. We were in compliance with the terms of such financial tests as of September 30, 2021.
At September 30, 2021, we had outstanding repurchase agreement borrowings with the following counterparties:
| | | | | | | | | | | | | | | | | | | | | | | | | | |
(dollars in thousands)
Repurchase Agreement Counterparties | | Amount Outstanding | | Percent of Total Amount Outstanding | | Company Investments Held as Collateral | | Counterparty Rating(1) |
Credit Suisse AG, Cayman Islands Branch (2) | | $ | 339,773 | | | 70.3 | % | | $ | 414,003 | | | A+ |
| Citigroup Global Markets Inc. | | 111,491 | | | 23.1 | % | | 196,665 | | | A+ |
Nomura Securities International, Inc. (3) | | 18,096 | | | 3.7 | % | | 22,038 | | | Unrated (3) |
| Credit Suisse Securities (USA) LLC | | 12,900 | | | 2.7 | % | | 20,400 | | | A+ |
| | | | | | | | |
| | | | | | | | |
| | | | | | | | |
| | | | | | | | |
| | | | | | | | |
| | | | | | | | |
| | | | | | | | |
| | | | | | | | |
| | | | | | | | |
| | | | | | | | |
| | | | | | | | |
| | | | | | | | |
All other counterparties (4) | | 1,048 | | | 0.2 | % | | 1,342 | | | |
| Total | | $ | 483,308 | | | 100.0 | % | | $ | 654,448 | | | |
(1)The counterparty ratings presented above are the long-term issuer credit ratings as rated at September 30, 2021 by S&P.
(2)Includes master repurchase agreements in which the buyer includes Alpine Securitization LTD., a Credit Suisse sponsored asset-backed commercial paper conduit.
(3) Nomura Holdings, Inc., the parent company of Nomura Securities International, Inc., is rated BBB+ by S&P at September 30, 2021.
(4) Represents amount outstanding with one counterparty, which holds collateral valued less than 5% of our stockholders’ equity as security for totalour obligations under the applicable repurchase agreements as of September 30, 2021.
The following table presents our average repurchase agreement borrowings, excluding unamortized debt issuance costs, by type of collateral pledged for the three and nine months ended September 30, 2021 (dollars in thousands):
| | | | | | | | | | | | | | |
| Collateral | | Three Months Ended September 30, 2021 | | Nine months ended September 30, 2021 |
| Agency RMBS | | $ | 1,125 | | | $ | 1,235 | |
| | | | |
| Non-Agency RMBS | | 15,632 | | | 15,120 | |
Non-Agency CMBS(1) | | 81,645 | | | 79,890 | |
| Residential Whole Loans | | 133,556 | | | 80,565 | |
| Commercial loans | | 106,200 | | | 135,398 | |
| | | | |
| Residential Bridge Loans | | 7,897 | | | 10,342 | |
| Membership interest | | 15,452 | | | 17,863 | |
| Other securities | | 30,052 | | | 23,596 | |
| Total | | $ | 391,559 | | | $ | 364,009 | |
Maximum borrowings during the period(2) | | $ | 483,307 | | | $ | 483,307 | |
(1)Includes repurchase agreement borrowings on securities eliminated upon VIE consolidation.
(2)Amount represents the maximum borrowings at month-end during each of the respective periods.
Securitized Debt
Commercial Mortgage-Backed Notes
We hold a controlling financial variable interest in CSMC USA and were required to consolidate the CMBS VIE. Refer to Note 7 - "Financings" for details. The following table summarizes the consolidated 2014 CSMC USA's commercial mortgage pass-through certificates at September 30, 2021 which is classified in "Securitized debt, net" in the Consolidated Balance Sheets (dollars in thousands):
| | | | | | | | | | | | | | |
| Classes | Principal Balance | Coupon | Fair Value | Contractual Maturity |
| Class A-1 | $ | 120,391 | | 3.3 | % | $ | 126,264 | | 9/11/2025 |
| Class A-2 | 531,700 | | 4.0 | % | 570,167 | | 9/11/2025 |
| Class B | 136,400 | | 4.2 | % | 138,562 | | 9/11/2025 |
| Class C | 94,500 | | 4.3 | % | 92,630 | | 9/11/2025 |
| Class D | 153,950 | | 4.4 | % | 142,388 | | 9/11/2025 |
| Class E | 180,150 | | 4.4 | % | 161,900 | | 9/11/2025 |
| Class F | 153,600 | | 4.4 | % | 118,664 | | 9/11/2025 |
Class X-1(1) | N/A | 0.5 | % | 12,347 | | 9/11/2025 |
Class X-2(1) | N/A | 0.03 | % | 2,572 | | 9/11/2025 |
| $ | 1,370,691 | | | $ | 1,365,494 | | |
| | | | |
| | | | |
| | | | |
| | | | |
(1) Class X-1 and X-2 are interest-only classes with notional balances of $652.1 million and $733.5 million as of September 30, 2021, respectively.
The above table does not reflect the portion of the class F bond held by us because the bond is eliminated in consolidation. Our ownership interest in the F bonds represents a controlling financial interest, which resulted in consolidation of the trust, during the quarter. The bond had a fair market value of $11.5 million at September 30, 2021, and our exposure to loss is limited to our ownership interest in this bond.
Residential Mortgage-Backed Notes
In May 2019, we completed a residential mortgage-backed securitization comprised of a portion of our Residential Whole Loan portfolio. RMI 2015 Trust and RNR Trust collectively transferred $945.5 million of Non-QM Residential Whole
Loans, to our wholly owned subsidiary, Arroyo Trust 2019. Arroyo Trust 2019 issued $919.0 million of mortgage-backed notes and we retained the subordinate non-offered securities. These non-offered securities with an estimated fair value of $35.9 million at September 30, 2021 were eliminated in the consolidation. At September 30, 2021, Residential Whole Loans, with an outstanding principal balance of approximately $414.0 million, serve as collateral for the Arroyo Trust 2019's securitized debt.
The following table summarizes the consolidated Arroyo Trust 2019's issued mortgage-backed notes at September 30, 2021 which is classified in "Securitized debt, net" in the Consolidated Balance Sheets (dollars in thousands):
| | | | | | | | | | | | | | |
| Classes | Principal Balance | Coupon | Carrying Value | Contractual Maturity |
| Issued Mortgage-Backed Notes | | | | |
| Class A-1 | $ | 330,944 | | 3.3% | $ | 330,944 | | 4/25/2049 |
| Class A-2 | 17,740 | | 3.5% | 17,740 | | 4/25/2049 |
| Class A-3 | 28,106 | | 3.8% | 28,106 | | 4/25/2049 |
| Class M-1 | 25,055 | | 4.8% | 25,055 | | 4/25/2049 |
| Subtotal | $ | 401,845 | | | $ | 401,845 | | |
| Less: Unamortized deferred financing costs | N/A | | 3,727 | | |
| Total | $ | 401,845 | | | $ | 398,118 | | |
In June 2020, we completed a residential mortgage-backed securitization comprised of a portion of our Residential Whole Loan portfolio. RMI 2015 Trust transferred $355.8 million of Non-QM Residential Whole Loans, to our wholly owned subsidiary, Arroyo Trust 2020. Arroyo Trust 2020 issued $341.7 million of mortgage-backed notes and we retained the subordinate non-offered securities. These non-offered securities with an estimated fair value of $26.0 million at September 30, 2021 were eliminated in the consolidation. At September 30, 2021, Residential Whole Loans, with an outstanding principal balance of approximately $216.4 million, serve as collateral for the Arroyo Trust 2020's securitized debt.
The following table summarizes the consolidated Arroyo Trust 2020's issued mortgage-backed notes at September 30, 2021 which is classified in "Securitized debt, net" in the Consolidated Balance Sheets (dollars in thousands):
| | | | | | | | | | | | | | |
| Classes | Principal Balance | Coupon | Carrying Value | Contractual Maturity |
| Issued Mortgage-Backed Notes | | | | |
| Class A-1A | $ | 148,244 | | 1.7% | $ | 148,244 | | 3/25/2055 |
| Class A-1B | 17,591 | | 2.1% | 17,591 | | 3/25/2055 |
| Class A-2 | 13,518 | | 2.9% | 13,518 | | 3/25/2055 |
| Class A-3 | 17,963 | | 3.3% | 17,963 | | 3/25/2055 |
| Class M-1 | 11,739 | | 4.3% | 11,739 | | 3/25/2055 |
| Subtotal | $ | 209,055 | | | $ | 209,055 | | |
| Less: Unamortized deferred financing costs | N/A | | 2,154 | | |
| Total | $ | 209,055 | | | $ | 206,901 | | |
Convertible Senior Unsecured Notes
1
During the quarter we reduced the our overall convertible senior unsecured notes outstanding by $36.4 million and extended the maturity to 2024 for $86.3 million of our convertible senior unsecured debt through the issuance of the 2024 Notes to further strengthen our balance sheet.
1
In August 2021, we repurchased $22.3 million aggregate principal amount of our existing 2022 Notes at a weighted average discount to par value of 2.8%.
In September 2021, we issued $86.3 million of 2024 Notes and used the net proceeds, together with approximately $20.2 million of $22.0 million. cash on hand, to repurchase an additional $100.3 million of our 2022 Notes.
As of September 30, 2021, we had $45.7 million of the 2022 Notes outstanding. The 2022 Notes mature on October 1, 2022, unless earlier converted, redeemed or repurchased by the holders pursuant to their terms, and are not redeemable by us except during the final three months prior to maturity.
As of September 30, 2021, we had $86.3 million aggregate principal amount of the 2024 Notes outstanding. The 2024 notes mature on September 15, 2024, unless earlier converted, redeemed or repurchased by the holders pursuant to their terms, and are not redeemable by us except during the final three months prior to maturity.
Convertible Notes Exchange
On July 1, 2020, wethe Company issued an aggregate of 1,354,084 shares of ourits common stock in exchange for $5.0 million aggregate principal amount of our 6.75% Convertible Senior Notes due 2022.its 2022 Notes. See Note 7 - "Financings" for information related to the convertible notes exchange.agreement.
Dividends
To preserve liquidity, wethe Company suspended ourits first and second quarter of 2020 common stock dividends in light of2020 given extraordinary market volatility driven by uncertainty surrounding the COVID-19 pandemic.
In Starting in the third quarter ended September 30, 2020, the Company resumed payment of 2020, we resumed ourthe quarterly dividend after making progress strengthening ourits balance sheet and improving liquidity and earnings power of ourits investment portfolio. For
The following table presents cash dividends declared and paid by the quarterCompany on its common stock:
| | | | | | | | | | | | | | | | | | | | | | | | | | |
| Declaration Date | | Record Date | | Payment Date | | Amount per Share | | Tax Characterization |
| 2021 | | | | | | | | |
| | | | | | | | |
| September 23, 2021 | | October 4, 2021 | | October 26, 2021 | | $ | 0.06 | | | Not yet determined |
| June 22, 2021 | | July 2, 2021 | | July 26, 2021 | | $ | 0.06 | | | Not yet determined |
| March 23, 2021 | | April 2, 2021 | | April 26, 2021 | | $ | 0.06 | | | Not yet determined |
| | | | | | | | |
| 2020 | | | | | | | | |
| December 17, 2020 | | December 28, 2020 | | January 26, 2021 | | $ | 0.06 | | | Not yet determined(1) |
| September 22, 2020 | | October 2, 2020 | | October 26, 2020 | | $ | 0.05 | | | Return of capital |
| | | | | | | | |
| | | | | | | | |
| | | | | | | | |
| | | | | | | | |
| | | | | | | | |
(1)The cash distributions made on January 26, 2021, with a record date of December 28, 2020, are treated as received by stockholders on January 26, 2021 and taxable in calendar year 2021. The tax characterization of these distributions will be determined in January 2022.
Note 13 — Net Income (loss) per Common Share
The table below presents basic and diluted net income (loss) per share of common stock using the two-class method for the three and nine months ended September 30, 2021 and September 30, 2020 (dollars, other than shares and per share amounts, in thousands):
| | | | | | | | | | | | | | | | | | | | | | | |
| | For the three months ended September 30, 2021 | | For the three months ended September 30, 2020 | | For the nine months ended September 30, 2021 | | For the nine months ended September 30, 2020 |
Numerator: | | | | | | | |
| Net income (loss) attributable to common stockholders and participating securities for basic and diluted earnings per share | $ | (4,213) | | | $ | 59,807 | | | $ | (36,423) | | | $ | (339,144) | |
| Less: | | | | | | | |
| Dividends and undistributed earnings allocated to participating securities | 24 | | | 353 | | | 65 | | | 16 | |
| Net income (loss) allocable to common stockholders — basic and diluted | $ | (4,237) | | | $ | 59,454 | | | $ | (36,488) | | | $ | (339,160) | |
| | | | | | | |
Denominator: | | | | | | | |
| Weighted average common shares outstanding for basic earnings per share | 60,795,688 | | | 60,740,701 | | | 60,771,759 | | | 56,293,512 | |
| Weighted average common shares outstanding for diluted earnings per share | 60,795,688 | | | 60,740,701 | | | 60,771,759 | | | 56,293,512 | |
| Basic earnings (loss) per common share | $ | (0.07) | | | $ | 0.98 | | | $ | (0.60) | | | $ | (6.02) | |
| Diluted earnings (loss) per common share | $ | (0.07) | | | $ | 0.98 | | | $ | (0.60) | | | $ | (6.02) | |
For the three and nine months ended September 30, 2021 and September 30, 2020, the Company excluded the effects of the convertible senior unsecured notes from the computation of diluted earnings per share since the average market value per share of the Company’s common stock was below the exercise price of the convertible senior unsecured notes.
Note 14 — Income Taxes
As a REIT, the Company is not subject to federal income tax to the extent that it makes qualifying distributions to its stockholders and satisfies on a continuing basis, through actual investment and operating results, the REIT requirements including certain asset, income and stock ownership tests.
Based on the Company’s analysis of any potential uncertain income tax positions, the Company concluded that it does not have any uncertain tax positions that meet the recognition or measurement criteria as of September 30, 2021. The Company files U.S. federal and state income tax returns. As of September 30, 2021, U.S. federal tax returns filed by the Company for 2019, 2018 and 2017 and state tax returns filed for 2019, 2018, 2017, 2016 and 2015 are open for examination pursuant to relevant statutes of limitation. In the event that the Company incurs income tax related interest and penalties, the Company’s policy is to classify them as a component of its provision for income taxes.
Income Tax Provision
Subject to the limitation under the REIT asset test rules, the Company is permitted to own up to 100% of the stock of one or more taxable REIT subsidiaries ("TRS"). Currently, the Company owns one TRS that is taxable as a corporation and is subject to federal, state and local income tax on its net income at the applicable corporate rates. The TRS, which was formed in Delaware on July 28, 2014, is a limited liability company and a wholly-owned subsidiary of the Company. During the three months ended September 30, 2021 and September 30, 2020, the Company recorded a federal and state tax benefit of $218 thousand and tax provision of $205 thousand, respectively, which is recorded in "Income tax provision (benefit)" in the Consolidated Statements of Operations. During the nine months ended September 30, 2021 and September 30, 2020, the Company recorded a federal and state tax benefit of $19 thousand and tax provision of $367 thousand, respectively.
Deferred Tax Asset
As of September 30, 2021 and December 31, 2020, the Company recorded a deferred tax asset of approximately $20.6 million and $21.0 million, respectively, relating to capital loss carryforward and temporary differences as a result of the timing of income recognition of certain investments held in the TRS. The capital loss carryforwards may only be recognized to the extent of capital gains. There is uncertainty as to the TRS' ability to recognize capital gains in the future. As a result, the Company has concluded it is more likely than not the deferred tax asset will not be realized and has recorded a full valuation allowance of $20.6 million and $21.0 million as of September 30, 2021 and December 31, 2020, respectively.
In addition, the REIT generated net operating losses ("NOLs") during the nine months ended September 30, 2021 related to ordinary losses on its MBS portfolio and it generated NOLs for the years ended December 31, 2020 and December 31, 2017, related to its interest rate swap terminations, and for its California return a portion of the NOLs is apportioned to the TRS. The Company recorded a deferred tax asset relating to the NOLs of $18.8 million and $19.3 million in the REIT and $2.1 million and $2.1 million in the TRS as of September 30, 2021 and December 31, 2020, respectively. The TRS can carryback the NOLs generated during the years ended December 31, 2020 and December 31, 2017 to each of the two preceding years to request a refund for taxes paid. As of September 30, 2021 and December 31, 2020, the Company has concluded it is more likely than not the deferred tax asset relating to the NOLs will not be realized, with the exception of the TRS carryback to 2015, and it has recorded a combined valuation allowance of $20.9 million and $21.4 million, respectively.
Effective Tax Rate
The Company's effective tax rate differs from its combined federal and state income tax rate primarily due to its valuation allowance and the deduction of dividends distributions to be paid under Code Section 857(a).
Note 15 — Contingencies
From time to time, the Company may become involved in various claims and legal actions arising in the ordinary course of business. Management is not aware of any material contingencies at September 30, 2021.
Note 16 — Subsequent Events
On November 5, 2021, the Company entered into an amendment of its Residential Whole Loan Facility. The amendment facility bears an interest rate to LIBOR plus 2.00%, with a LIBOR floor of 0.25%. The facility is available to finance five types of residential mortgages: Non-Agency mortgage loans, Non-QM loans, investor loans, re-performing and non-performing loans. The advance rates differ by type of loan, but for performing Non-QM loans the advance rate is 90%. The facility matures on November 4, 2022. The facility is a mark to market margin facility once the collateral value declines below par and has a stated capacity of $500 million.
ITEM 2.Management’s Discussion and Analysis of Financial Condition and Results of Operations.
FORWARD-LOOKING INFORMATION
The Company makes forward-looking statements herein and will make forward-looking statements in future filings with the Securities and Exchange Commission (the “SEC”), press releases or other written or oral communications within the meaning of Section 27A of the Securities Act of 1933, as amended (the “Securities Act”), and Section 21E of the Securities Exchange Act of 1934, as amended (the “Exchange Act”). For these statements, the Company claims the protections of the safe harbor for forward-looking statements contained in such sections. Forward-looking statements are subject to substantial risks and uncertainties, many of which are difficult to predict and are generally beyond the Company’s control. In particular, it is difficult to fully assess the long-term social, economic and health impact of and success of recovery efforts, including vaccine distribution, relate to COVID-19 at this time.
These forward-looking statements include information about possible or assumed future results of the Company’s business, financial condition, liquidity, results of operations, plans and objectives. When the Company uses the words “believe,” “expect,” “anticipate,” “estimate,” “plan,” “continue,” “intend,” “should,” “may” or similar expressions, the Company intends to identify forward-looking statements. Statements regarding the following subjects, among others, may be forward-looking: market trends in the Company’s industry, interest rates, real estate values, the debt securities markets, the U.S. housing and the U.S. and foreign commercial real estate markets or the general economy or the market for residential and/or commercial mortgage loans; the Company’s business and investment strategy; the Company’s projected operating results; changes in interest rates and the market value of the Company’s target assets; credit risks; servicing - related risks, including those associated with foreclosure and liquidation; the state of the U.S. and to a lesser extent, international economy generally or in specific geographic regions; economic trends and economic recoveries; the Company’s ability to obtain and maintain financing arrangements, including under the Company’s repurchase agreements, a form of secured financing, and securitizations; the current potential return dynamics available in residential mortgage-backed securities (“RMBS”), and commercial mortgage-backed securities (“CMBS” and collectively with RMBS, “MBS”); the level of government involvement in the U.S. mortgage market; the anticipated default rates on CMBS and Commercial Loans; the loss severity on Non-Agency MBS; the general volatility of the securities markets in which the Company participates; changes in the value of the Company’s assets; the Company’s expected portfolio of assets; the Company’s expected investment and underwriting process; interest rate mismatches between the Company’s target assets and any borrowings used to fund such assets; changes in prepayment rates on the Company’s target assets; effects of hedging instruments on the Company’s target assets; rates of default or decreased recovery rates on the Company’s target assets; the degree to which the Company’s hedging strategies may or may not protect the Company from interest rate volatility; the impact of and changes in governmental regulations, tax law and rates, accounting guidance and similar matters; the Company’s ability to maintain the Company’s qualification as a real estate investment trust for U.S. federal income tax purposes; the Company’s ability to maintain its exemption from registration under the Investment Company Act of 1940, as amended (the “1940 Act”); the availability of opportunities to acquire Agency RMBS, Non-Agency RMBS, CMBS, Residential and Commercial Whole Loans, Residential and Commercial Bridge Loans and other mortgage assets; the availability of qualified personnel; estimates relating to the Company’s ability to make distributions to its stockholders in the future; the Company’s understanding of its competition; the uncertainty and economic impact of pandemics, epidemics or other public health emergencies, such as the ongoing outbreak of COVID-19; and the Manager's expectations regarding COVID-19 recovery.
The forward-looking statements are based on the Company’s beliefs, assumptions and expectations of its future performance, taking into account all information currently available to it. Forward-looking statements are not predictions of future events. These beliefs, assumptions and expectations can change as a result of many possible events or factors, not all of which are known to the Company. Some of these factors, are described in “Risk Factors” and “Management’s Discussion and Analysis of Financial Condition and Results of Operations” herein and in the Company’s Annual Report on Form 10-K for the year ended December 31, 2020, filed with the SEC on March 5, 2021. These and other risks, uncertainties and factors, including those described in the annual, quarterly and current reports that the Company files with the SEC, could cause its actual results to differ materially from those included in any forward-looking statements the Company makes. All forward-looking statements speak only as of the date they are made. New risks and uncertainties arise over time and it is not possible to predict those events or how they may affect the Company. Except as required by law, the Company is not obligated to, and does not intend to, update or revise any forward-looking statements, whether as a result of new information, future events or otherwise.
Overview
Western Asset Mortgage Capital Corporation, a Delaware corporation, and its Subsidiaries (the “Company” unless otherwise indicated or except where the context otherwise requires “we,” “us” or “our”) commenced operations in May 2012, focused on investing in, financing and managing a diversified portfolio of real estate related securities, whole loans and other financial assets, which we collectively refer to as our target assets. We are externally managed by Western Asset Management Company, LLC (our “Manager”) pursuant to the terms of a management agreement. We conduct our operations to qualify and be taxed as a real estate investment trust, or REIT, for U.S. federal income tax purposes. Accordingly, we generally will not be subject to U.S. federal income taxes on our taxable income that we distribute currently to our stockholders as long as we maintain our intended qualification as a REIT. However, certain activities that we may perform may cause us to earn income which will not be qualifying income for REIT purposes. We have designated a subsidiary as a taxable REIT subsidiary, or TRS, to engage in such activities. We also intend to operate our business in a manner that permits us to maintain our exemption from registration under the Investment Company Act of 1940, as amended (the "1940 Act"). Our common stock is traded on the New York Stock Exchange, or the NYSE, under the symbol "WMC."
Our objective is to provide attractive risk adjusted returns to our stockholders primarily through an attractive dividend, which we intend to support with sustainable distributable earnings (which we previously referred to as core earnings), as well as the potential for higher returns through capital appreciation. Our investment strategy is based on our Manager's perspective of which mix of our target assets it believes provides us with the best risk-reward opportunities at any given time. We also deploy leverage as part of our investment strategy to increase potential returns.
Our Investment Strategy
Our Manager’s investment philosophy, which developed from a singular focus in fixed-income asset management over a variety of credit cycles and conditions, is to provide clients with a diversified, long-term value-oriented portfolio. We benefit from the breadth and depth of our Manager’s overall investment philosophy, which focuses on a macroeconomic analysis as well as an in-depth analysis of individual assets and their relative value. In making investment decisions on our behalf, our Manager seeks to identify assets across the broad mortgage universe with attractive risk adjusted returns, which incorporates its view on the outlook for the mortgage markets, including relative valuation, supply and demand trends, the level of interest rates, the shape of the yield curve, prepayment rates, financing and liquidity, commercial and residential real estate prices, delinquencies, default rates, recovery of various segments of the economy and vintage of collateral, subject to maintaining our REIT qualification and our exemption from registration under the 1940 Act. We do not have an established minimum current rating requirement for our investments.
Our Target Assets
Residential Whole Loans. — Residential Whole Loans are mortgages secured by single family residences held directly by us or through consolidated trusts with us holding the beneficial interest in the trusts. Our Residential Whole Loans are mainly adjustable rate mortgages that do not qualify for the Consumer Finance Protection Bureau’s (or CFPB) safe harbor provision for “qualified mortgages” ("Non-QM mortgages"). Our Manager’s review, relating to Non-QM mortgages, includes an analysis of the loan originator’s procedures and documentation for compliance with Ability to Repay requirements. As discussed in Note 7 "Financing," we have and may continue to securitize whole loan interests, selling more senior interests in the pool of loans and retaining residual portions. The characteristics of our Residential Whole Loans may vary going forward.
Commercial Whole Loans. — Commercial Whole Loans are generally loans ranging from $5 million to $125 million, secured by commercial real estate typically short-term loans. The collateral types may include hospitality, senior care living facilities, multifamily, office retail and industrial properties. These loans may be held directly by us or through consolidated trusts with us holding the beneficial interest in the trust.
Commercial Mezzanine Loans. —Commercialmezzanine loans are generally structured to represent a senior position in the borrower’s equity in, and subordinate to a first mortgage loan, on a property. These loans are generally secured by pledges of ownership interests, in whole or in part, in entities that directly or indirectly own the real property. At times, mezzanine loans may be secured by additional collateral, including letters of credit, personal guarantees, or collateral unrelated to the property. Mezzanine loans may be structured to carry either fixed or floating interest rates as well as carry a right to participate in a percentage of gross revenues and a percentage of the increase in the fair market value of the property securing
the loan. Mezzanine loans may also contain prepayment lockouts, penalties, minimum profit hurdles and other mechanisms to protect and enhance returns to the lender. Mezzanine loans usually have maturities that match the maturity of the related mortgage loan but may have shorter or longer terms. Depending on the structure of a transaction, Commercial Mezzanine loans may or may not qualify as "qualifying real estate interests" for purposes of the 1940 Act.
Non-Agency RMBS. — RMBS that are not guaranteed by a U.S. Government agency or U.S. Government-sponsored entity. The mortgage loan collateral for Non-Agency RMBS consists of residential mortgage loans that do not generally conform to underwriting guidelines issued by a U.S. Government agency or U.S. Government-sponsored entity due to certain factors, including mortgage balances in excess of Agency underwriting guidelines, borrower characteristics, loan characteristics and/or level of documentation, and therefore are not issued or guaranteed by a U.S. Government agency or U.S. Government-sponsored entity. The mortgage loan collateral may be classified as subprime, Alternative-A or prime depending on the borrower’s credit rating and the underlying level of documentation. Non-Agency RMBS collateral may also include reperforming loans, which are conventional mortgage loans that were current at the time of the securitization, but had been delinquent in the past. Non-Agency RMBS may be secured by fixed-rate mortgages, adjustable-rate mortgages or hybrid adjustable-rate mortgages.
Non-Agency CMBS. — Fixed and floating rate CMBS for which the principal and interest payments are not guaranteed by a U.S. Government agency or U.S. Government-sponsored entity.
Agency CMBS. — Fixed and floating rate CMBS, for which the principal and interest payments are guaranteed by a U.S. Government agency or U.S. Government-sponsored entity, but for which the underlying mortgage loans are secured by real property other than single family residences. These may include, but are not limited to Fannie Mae DUS (Delegated Underwriting and Servicing) MBS, Freddie Mac Multifamily Mortgage Participation Certificates, Ginnie Mae project loan pools, and/or CMOs structured from such collateral. These securities generally have prepayment protection in the form of defeasance, yield maintenance or points.
Agency RMBS. — Agency RMBS, which are RMBS for which the principal and interest payments are guaranteed by a U.S. Government agency, such as the Government National Mortgage Association (“GNMA” or “Ginnie Mae”), or a U.S. Government-sponsored entity ("GSE"), such as the Federal National Mortgage Association (“FNMA” or “Fannie Mae”) or the Federal Home Loan Mortgage Corporation (“FHLMC” or “Freddie Mac”). The Agency RMBS we acquire can be secured by fixed-rate mortgages, adjustable-rate mortgages or hybrid adjustable-rate mortgages. Fixed-rate mortgages have interest rates that are fixed for the term of the loan and do not adjust. The interest rates on adjustable-rate mortgages generally adjust annually (although some may adjust more frequently) to an increment over a specified interest rate index. Hybrid adjustable-rate mortgages have interest rates that are fixed for a specified period of time (typically three, five, seven or ten years) and, thereafter, adjust to an increment over a specified interest rate index. Adjustable-rate mortgages and hybrid adjustable-rate mortgages generally have periodic and lifetime constraints on the amount by which the loan interest rate can change on any predetermined interest rate reset date. These investments can be in the form of pools, TBA and CMO (including interest only, principal only or other structures).
GSE Risk Sharing Securities Issued by Fannie Mae and Freddie Mac. — From time to time we have and may in the future continue to invest in risk sharing securities issued by Fannie Mae and Freddie Mac. Principal and interest payments on these securities are based on the performance of a specified pool of Agency residential mortgages. The payments due on these securities, however, are not secured by the referenced mortgages. The payments due are full faith and credit obligations of Fannie Mae or Freddie Mac respectively, but neither agency guarantees full payment of the underlying mortgages. Investments in these securities generally are not qualifying assets for purposes of the 75% real estate asset test applicable to REITs and generally do not generate qualifying income for purposes of the 75% real estate income test applicable to REITs. As a result, we may be limited in our ability to invest in such assets.
Other investments. — In addition to MBS, our principal investment, we may also make other investments in securities, which our Manager believes will assist us in meeting our investment objective and are consistent with our overall investment policies. These investments will normally be limited by the REIT requirements that 75% our assets be real estate assets and that 75% of our income be generated from real estate, thereby limiting our ability to invest in such assets.
Our Investment Portfolio
Our investment portfolio composition at September 30, 2021.
Our Financing Strategy
During 2020, the uncertainties created by the COVID-19 pandemic made it challenging to obtain financing arrangements on favorable terms, including our repurchase agreements, term financings, and securitizations. In the latter part of 2020 and continuing into 2021 terms for financing arrangements have improved significantly. We have primarily financed our investment acquisitions with repurchase agreements. We believe the amount of leverage we use is consistent with our intention of keeping total borrowings within a prudent range, as determined by our Manager, taking into account a variety of factors such as general economic, political and financial market conditions, the anticipated liquidity and price volatility of our assets, the availability and cost of financing the assets, the creditworthiness of financing counterparties and the health of the U.S. residential and commercial mortgage markets. In utilizing leverage, we seek to enhance equity returns while limiting our exposure to interest rate volatility and daily margin calls. We expect to continue to seek financing arrangements without daily margin requirements or with margin requirements which apply only after a significant reduction in the valuation of the assets financed, including but not limited to term financing, securitization and convertible senior unsecured notes, as the market permits. We expect to maintain a debt-to-equity ratio of two to four and a half times the amount of our stockholders’ equity, depending on our investment composition.
Our repurchase agreements bear interest at a contractually agreed-upon rate and historically had terms ranging from one month to 18 months. Under these repurchase agreements, the respective counterparties retain the right to determine the fair value of the underlying collateral. A reduction in the value of pledged assets may require us to post additional securities as collateral, pay down borrowings or establish cash margin accounts with the counterparties in order to re-establish the agreed-upon advance rates. Our inability to post adequate collateral for a margin call by a counterparty, in a timeframe as short as the close of the same business day, could result in a condition of default under our repurchase agreements, thereby enabling the counterparty to liquidate the collateral pledged by us, which may have a material adverse effect on our financial position, results of operations and cash flows.
Our repurchase agreement counterparties generally require collateral in excess of the loan amount, or haircuts. As of September 30, 2021, the ranges of the haircuts on our investments were as follows:
| | | | | | | | | | | | | | | | | | | | |
| Collateral | | Minimum | | Maximum (excluding IOs and IIOs) | | Maximum (including IOs and IIOs) |
| Agency RMBS | | 25.0% | | n/a | | 25.0% |
| | | | | | |
| Non-Agency RMBS | | 35.0% | | 35.0% | | 35.0% |
| Non-Agency CMBS | | 25.0% | | 40.0% | | n/a |
| Other securities | | 35.0% | | 60.0% | | n/a |
Residential Whole Loans(1) | | 15.0% | | 50.0% | | n/a |
Commercial Loans(2) | | 22.0% | | 55.0% | | n/a |
(1) Includes Residential Bridge Loans.
(2) Includes Securitized commercial loans.
Our Hedging Strategy and Risk Management Strategy
Our overall portfolio strategy is designed to generate attractive returns to our investors through various economic cycles. We believe our broad approach to investing in the real estate mortgage markets, which considers all categories of real estate assets, allows us to invest in a diversified portfolio and help mitigate our portfolio from risks that arise from investing in a single or limited collateral type. In connection with our risk management activities, we may enter into a variety of derivative and non-derivative instruments. When purchased, our primary objective for acquiring these derivatives and non-derivative instruments is to mitigate our exposure to future events that are outside our control. Our derivative instruments are designed to mitigate the effects of market risk and cash flow volatility associated with interest rate risk, including prepayment risk. As part of our hedging strategy, we may enter into, interest rate swaps, including forward starting swaps, interest rate swaptions, U.S. Treasury options, future contracts, TBAs, credit default swaps, forwards and other similar instruments. There can be no assurance that appropriate hedging strategies will be available or that if implemented they will be successful.
Critical Accounting Policies
The consolidated financial statements include our accounts, those of our wholly-owned subsidiaries and certain VIEs in which we are the primary beneficiary. All intercompany amounts have been eliminated in consolidation. In accordance with GAAP, our consolidated financial statements require the use of estimates and assumptions that involve the exercise of judgment and use of assumptions as to future uncertainties. In accordance with SEC guidance, the following discussion addresses the accounting policies that we currently apply. Our most critical accounting policies will involve decisions and assessments that could affect our reported assets and liabilities, as well as our reported revenues and expenses. We believe that all of the decisions and assessments upon which our consolidated financial statements have been based were reasonable at the time made and based upon information available to us at that time. For a review of recent accounting pronouncements that may impact our results of operations, see Note 2 of our “Notes to Consolidated Financial Statements (Unaudited).”
There have been no significant changes to our critical accounting policies that are disclosed in our most recent Annual Report on Form 10-K for the year ended December 31, 2020, other than the significant accounting policy disclosed below.
Real Estate Owned
REO represents real estate property acquired by the Company through foreclosure and it is classified as held for sale. Upon completion of the foreclosure, the Company initially records the REO at fair value less estimated costs to sell the property. In subsequent periods, REO is reported at the lower of the current carrying amount or fair value less estimated selling costs and it is classified in "Other assets" in the Consolidated Balance Sheets. Gains/losses recognized on foreclosure as well as realized gains/losses on the disposition of REO are reported by the Company in "Realized gain (loss), net" in the Consolidated Statements of Operations.
2021 Activity
Investment Activity
We continually evaluate potential investments and our investment selection is based on supply and demand of our target assets, costs of financing, and the expected future interest rate volatility costs of hedging. During the nine months ended September 30, 2021, we acquired $243.3 million of residential whole loans. We did not sell any investments.
The following table presents our investing activity for the nine months ended September 30, 2021 (dollars in thousands): | | | | | | | | | | | | | | | | | | | | | | | | | | | | | | | | | | |
| Balance at | | Loan Modification/Capitalized Interest | Principal Payments and Basis Recovery | Proceeds from
Sales | Transfers to REO | Realized Gain/(Loss) | Unrealized Gain/(loss) | Premium and discount amortization, net | | | Balance at |
| Investment Type | December 31, 2020 | Purchases | | September 30, 2021 |
| Agency RMBS and Agency RMBS IOs | $ | 1,708 | | $ | — | | N/A | $ | (258) | | $ | — | | N/A | $ | — | | $ | (108) | | $ | — | | | | $ | 1,342 | |
| Non-Agency RMBS | 25,381 | | — | | N/A | (904) | | — | | N/A | — | | 3,710 | | (176) | | | | 28,011 | |
| | | | | | | | | | | | |
| Non-Agency CMBS | 164,081 | | — | | N/A | (13,479) | | — | | N/A | (5,929) | | (16,254) | | 6,231 | | | | 134,650 | |
Other securities(1) | 48,754 | | — | | N/A | — | | — | | N/A | — | | 4,553 | | (1,214) | | | | 52,093 | |
| Total MBS and other securities | 239,924 | | — | | N/A | (14,641) | | — | | N/A | (5,929) | | (8,099) | | 4,841 | | | | 216,096 | |
| Residential Whole Loans | 1,008,782 | | 243,322 | | 310 | | (309,395) | | — | | — | | — | | 13,667 | | (7,269) | | | | 949,417 | |
| Residential Bridge Loans | 13,916 | | — | | — | | (7,667) | | — | | (752) | | (155) | | 639 | | (21) | | | | 5,960 | |
| Commercial Loans | 310,523 | | — | | — | | (103,272) | | — | | (30,000) | | — | | (48,630) | | 145 | | | | 128,766 | |
| Securitized commercial loans | 1,605,335 | | — | | — | | (354,202) | | — | | — | | — | | 107,423 | | 18,449 | | | | 1,377,005 | |
| Total Investments | $ | 3,178,480 | | $ | 243,322 | | $ | 310 | | $ | (789,177) | | $ | — | | $ | (30,752) | | $ | (6,084) | | $ | 65,000 | | $ | 16,145 | | | | $ | 2,677,244 | |
(1) Other securities include $45.8 million of GSE CRTs and $6.3 million of ABS at September 30, 2021.
Portfolio Characteristics
Our Agency Portfolio
The following table summarizes our Agency portfolio by investment category as of September 30, 2021 (dollars in thousands): | | | | | | | | | | | | | | | | | | | | | | | |
| | Principal Balance | | Amortized Cost | | Fair Value | | Net Weighted
Average Coupon |
| | | | | | | |
| | | | | | | |
| | | | | | | |
| | | | | | | |
| | | | | | | |
| | | | | | | |
| | | | | | | |
Agency RMBS IOs and IIOs (1) | N/A | | $ | 63 | | | $ | 134 | | | 1.4 | % |
Agency RMBS IOs and IIOs accounted for as derivatives (1) | N/A | | N/A | | 1,208 | | | 1.3 | % |
| Total Agency RMBS | — | | | 63 | | | 1,342 | | | 1.3 | % |
| Total | $ | — | | | $ | 63 | | | $ | 1,342 | | | 1.3 | % |
(1)IOs and IIOs have no principal balances and bear interest based on a notional balance. The notional balance is used solely to determine interest distributions on the interest-only class of securities.
Credit Sensitive Portfolio
Non-Agency RMBS
The following table presents the fair value and weighted average purchase price for each of our Non-agency RMBS categories, including IOs accounted for as derivatives, together with certain of their respective underlying loan collateral attributes and current performance metrics as of September 30, 2021 (fair value dollars in thousands):
| | | | | | | | | | | | | | | | | | | | | | | | | | | | | | | | | | | | | | | | | | | | |
| | | | | Weighted Average |
| Category | | Fair Value | | Purchase
Price | | Life (Years) | | Original LTV | | Original
FICO | | 60+ Day
Delinquent | | CPR |
| Prime | | $ | 10,324 | | | $ | 74.82 | | | 5.6 | | | 59.4 | % | | 779 | | | 4.1 | % | | 40.5 | % |
| Alt-A | | 17,687 | | | 44.10 | | | 10.5 | | | 71.4 | % | | 589 | | | 18.5 | % | | 9.6 | % |
| | | | | | | | | | | | | | |
| Total | | $ | 28,011 | | | $ | 55.42 | | | 8.7 | | | 67.0 | % | | 659 | | | 13.2 | % | | 21.0 | % |
Non-Agency CMBS
The following table presents certain characteristics of our Non-Agency CMBS portfolio as of September 30, 2021 (dollars in thousands): | | | | | | | | | | | | | | | | | | | | | | | | | | | | | | | | |
| | | | | Principal | | | | Weighted Average |
| Type | | Vintage | | Balance | | Fair Value | | Life (Years) | | Original LTV |
| Conduit: | | | | | | | | | | |
| | | 2006-2009 | | $ | 2,229 | | | $ | 1,677 | | | 2.4 | | | 75.0 | % |
| | | 2010-2020 | | 94,107 | | | 34,657 | | | 5.8 | | | 63.6 | % |
| | | | | 96,336 | | | 36,334 | | | 5.7 | | | 64.1 | % |
| Single Asset: | | | | | | | | | | |
| | | 2010-2020 | | 116,104 | | | 98,316 | | | 1.7 | | | 64.9 | % |
| Total | | | | $ | 212,440 | | | $ | 134,650 | | | 2.8 | | | 64.7 | % |
Residential Whole Loans
The Residential Whole Loans have low LTV's and are comprised of 2,187 Non-QM adjustable rate mortgages and six investor fixed rate mortgages. The following table presents certain information about our Residential Whole Loans investment portfolio at September 30, 2021 (dollars in thousands):
| | | | | | | | | | | | | | | | | | | | | | | | | | | | | | | | | | | | | | | | | | | | |
| | | | | | | Weighted Average |
| Current Coupon Rate | | Number of Loans | | Principal
Balance | | Original LTV | | Original FICO Score(1) | | Expected
Life (years) | | Contractual
Maturity
(years) | | Coupon
Rate |
| 2.01% – 3.00% | | 14 | | $ | 7,816 | | | 66.0 | % | | 746 | | | 5.7 | | 28.4 | | 2.7 | % |
| 3.01% – 4.00% | | 332 | | 163,681 | | | 62.6 | % | | 751 | | | 3.2 | | 27.3 | | 3.7 | % |
| 4.01% – 5.00% | | 997 | | 380,394 | | | 64.8 | % | | 748 | | | 2.7 | | 28.0 | | 4.8 | % |
| 5.01% – 6.00% | | 820 | | 346,778 | | | 64.6 | % | | 739 | | | 2.9 | | 27.2 | | 5.4 | % |
| 6.01% – 7.00% | | 28 | | 9,337 | | | 67.8 | % | | 720 | | | 3.0 | | 25.9 | | 6.3 | % |
| 7.01% - 8.00% | | 2 | | 506 | | | 73.2 | % | | 753 | | | 4.5 | | 26.9 | | 7.1 | % |
| | | | | | | | | | | | | | |
| Total | | 2,193 | | $ | 908,512 | | | 64.3 | % | | 745 | | | 2.9 | | 27.6 | | 4.8 | % |
(1)The original FICO score is not available for 215 loans with a principal balance of approximately $68.8 million at September 30, 2021. We have excluded those loans from the weighted average computation.
Residential Bridge Loans
Our Residential Bridge Loans are comprised of short-term fixed rate mortgages secured by non-owner occupied single and multi-family residences with low LTVs, generally up to 85%. The following table presents certain information about our Residential Bridge Loans investment portfolio at September 30, 2021 (dollars in
thousands): | | | | | | | | | | | | | | | | | | | | | | | | | | | | | | | | |
| | | | | | | Weighted Average |
| Current Coupon Rate | | Number of Loans | | Principal
Balance | | Original LTV | | Contractual Maturity (months)(1) | | Coupon
Rate |
| | | | | | | | | | |
| 7.01% – 9.00% | | 3 | | $ | 2,946 | | | 70.4 | % | | 0.0 | | 8.8 | % |
| 9.01% – 11.00% | | 7 | | 3,213 | | | 75.9 | % | | 2.0 | | 10.3 | % |
| 11.01% – 13.00% | | 2 | | 495 | | | 69.7 | % | | 2.0 | | 11.4 | % |
| | | | | | | | | | |
| | | | | | | | | | |
| | | | | | | | | | |
| | | | | | | | | | |
| | | | | | | | | | |
| Total | | 12 | | $ | 6,654 | | | 73.0 | % | | 2.0 | | 9.7 | % |
(1) Non-performing loans that are past their maturity date are excluded from the calculation of the weighted average contractual maturity. The weighted average contractual maturity for these loans is zero.
Non-performing Residential Loans
The following table presents the aging of the Residential Whole Loans and Bridge Loans as of September 30, 2021 (dollars in thousands):
| | | | | | | | | | | | | | | | | | | | | | | | | | | | | | | | | | | | | | |
| | Residential Whole Loans | | Bridge Loans |
| | No of Loans | | Principal | | Fair Value | | No of Loans | | Principal | | Fair Value |
Current(1) | | 2,156 | | | $ | 889,231 | | | $ | 930,286 | | | 1 | | | $ | 75 | | | $ | 75 | |
| 1-30 days | | 15 | | | 7,448 | | | 7,746 | | | 1 | | | 105 | | | 105 | |
| 31-60 days | | — | | | — | | | — | | | — | | | — | | | — | |
| 61-90 days | | 3 | | | 1,238 | | | 1,259 | | | — | | | — | | | — | |
| 90+ days | | 19 | | | 10,595 | | | 10,126 | | | 10 | | | 6,474 | | | 5,780 | |
| Total | | 2,193 | | | $ | 908,512 | | | $ | 949,417 | | | 12 | | | $ | 6,654 | | | $ | 5,960 | |
(1) Includes one loan in forbearance with unpaid principal balance of $493 thousand.
Residential Whole Loans Forbearance Programs
COVID-19 has materially disrupted business operations, resulting in significantly higher levels of unemployment or underemployment in certain sectors. As a result, some Residential Whole Loan borrowers have experienced financial hardship, making it difficult to meet their payment obligations to us, leading to requests for forbearance and higher levels of delinquency and potentially defaults. We maintain a strong relationship with our servicers and have utilized these relationships to manage the impacts of COVID-19 pandemic on our Non-QM loans, including the use of forbearance programs. As of September 30, 2021, we had one Non-QM loan in forbearance and no Non-QM loans in the repayment phase following forbearance. Under the forbearance agreement, the borrower can generally elect to defer the principal and interest payments for 3 to 5 months. At the end of the forbearance period, the borrower can either repay the deferred principal and interest in full or over the next 9 months or, capitalize the deferred principal and interest to the loan balance and calculate a new amortization payment. Loans in forbearance are treated as "Current" in the above table. The loan in forbearance is carried at fair value and had an unpaid principal balance of $493 thousand, a fair value of $434 thousand, an original LTV of 64.7%, and represents approximately 0.1% of the total outstanding principal balance of our Residential Whole Loans.
Residential Whole Loans in Non-Accrual Status
As of September 30, 2021, there were 19 Non-QM loans carried at fair value in non-accrual status with an unpaid principal balance of approximately $10.6 million and a fair value of $10.1 million. These nonperforming loans represent approximately 1.2% of the total outstanding principal balance. No allowance or provision for credit losses was recorded as of and for the three and nine months ended September 30, 2021 since the valuation adjustment, if any, would be reflected in the fair value of these loans. We stopped accruing interest income for these loans when they became contractually 90 days delinquent.
As of September 30, 2021, there were 10 Residential Bridge Loans carried at fair value in non-accrual status with an unpaid principal balance of approximately $6.5 million and a fair value of $5.8 million. These nonperforming Residential Bridge Loans represent approximately 97.3% of the total outstanding principal balance. No allowance and provision for credit losses was recorded for loans carried at fair value as of and for the three and nine months ended September 30, 2021 since valuation adjustments, if any, would be reflected in the fair value of these loans. We stopped accruing interest income for these loans when they became contractually 90 days delinquent.
As of September 30, 2021, we had four real estate owned ("REO") properties with an aggregate carrying value of $1.1 million related to foreclosed Bridge Loans. The REO properties are held for sale and accordingly carried at the lower of cost or fair value less cost to sell. The REO properties are classified in "Other assets" in the Consolidated Balance Sheets.
Commercial Real Estate Investments
The following table presents our commercial loan investments as of September 30, 2021 (dollars in thousands):
| | | | | | | | | | | | | | | | | | | | | | | | | | | | | |
| Loan | Loan Type | Principal Balance | Fair Value | Original LTV | Interest Rate | Maturity Date | Extension Option | Collateral | Geographic Location |
| CRE 3 | Interest-Only Mezzanine loan | $ | 90,000 | | $ | 27,495 | | 58% | 1-Month LIBOR plus 9.25% | 6/29/2021 | Two-Year First Extension and One-Year Second Extension | Entertainment and Retail | NJ |
| CRE 4 | Interest-Only First Mortgage | 38,367 | | 38,294 | | 63% | 1-Month LIBOR plus 3.02% | 8/6/2022 | Two One-Year Extensions | Retail | CT |
| CRE 5 | Interest-Only First Mortgage | 24,535 | | 24,085 | | 62% | 1-Month LIBOR plus 3.75% | 11/6/2022 | Three One-Year Extensions | Hotel | NY |
| CRE 6 | Interest-Only First Mortgage | 13,207 | | 12,964 | | 62% | 1-Month LIBOR plus 3.75% | 11/6/2022 | Three One-Year Extensions | Hotel | CA |
| CRE 7 | Interest-Only First Mortgage | 7,259 | | 7,126 | | 62% | 1-Month LIBOR plus 3.75% | 11/6/2022 | Three One-Year Extensions | Hotel | IL, FL |
| CRE 8 | Interest-Only First Mortgage | 4,442 | | 4,440 | | 79% | 1-Month LIBOR plus 4.85% | 12/6/2022 | None | Assisted Living Facilities | FL |
| SBC 3 | Interest-Only First Mortgage | 14,362 | | 14,362 | | 49% | 1-Month LIBOR plus 4.10% | 7/6/2022 | None | Nursing Facilities | CT |
| | $ | 192,172 | | $ | 128,766 | | | | | | | |
| | | | | | | | | |
Commercial Loan Payoffs
On July 7, 2021, SBC 1, with an outstanding principal balance of $45.2 million collateralized by nursing facilities, was paid off in full.
On September 7, 2021, CRE 2, with an outstanding principal balance of $46.8 million collateralized by nursing facilities, was paid off in full.
On September 24, 2021, SBC 2 with an outstanding principal balance of $9.2 million collateralized by an apartment complex was paid off in full.
Non-Performing Commercial Loans
The impact of COVID-19 pandemic has adversely impacted a broad range of industries in which our commercial loan borrowers operate and could impair their ability to fulfill their financial obligations to us, most significantly retail and hospitality asset. All but the two loans discussed below remain current.
CRE 1 Loan
In October 2020, we commenced foreclosure proceedings. However, on February 24, 2021, the borrower filed for bankruptcy protection halting the foreclosure process. In August 2021, the bankruptcy case was dismissed by the bankruptcy court and we, together with the other holders of the loan, foreclosed on the property through a SPE formed for the purpose of holding the property. The property is currently being marketed for sale. Based on preliminary bids, we believe there is a reasonable likelihood that our investment along with the other members' interest will be recovered, although there is no assurance of full recovery. The borrower has continued to file legal challenge to the sale process. While the Company believes these legal challenges have no merit, they have delayed moving forward with the sale of the property.
The SPE is consolidated by us and the property is recorded at the lower of cost or fair value less cost to sell. As of September 30, 2021, the REO is recorded at $42.5 million and classified in "Other assets" in the Consolidated Balance Sheets and the other members' interests in the SPE of approximately $11.9 million are recorded as "Non-controlling interest" in the consolidated financial statements.
CRE 3 Loan
As of September 30, 2021, the CRE 3 junior mezzanine loan with an outstanding principal balance of $90.0 million secured by a retail facility was non-performing and past its maturity date of June 29, 2021. We were receiving interest payments on this loan from a reserve that was exhausted in May 2021. During the second quarter of 2021, the fair value of the loan declined significantly. We are currently in discussions with the borrower and certain other lenders regarding alternatives to address the situation which might include modifications of loan terms, deferral of payments and the funding of new advances. There can be no assurance that these discussions will result in an outcome in which we would be repaid any amount of the loan and we may suffer further declines in fair value with respect to the mezzanine investment. For the three months ended September 30, 2021, we suffered a further decline of $5.2 million in the fair value of this investment. We could experience a total loss of our investment under various scenarios, which at current levels would result in a $27.5 million reduction in the Company’s book value. Refer to Note 6 - "Commercial Loans" for details.
The following table presents the aging of the Commercial Loans as of September 30, 2021 (dollars in thousands): | | | | | | | | | | | | | | | | | | | | |
| | Commercial Loans |
| | No of Loans | | Principal | | Fair Value |
| Current | | 6 | | | $ | 102,172 | | | $ | 101,271 | |
| 1-30 days | | — | | | — | | | — | |
| 31-60 days | | — | | | — | | | — | |
| 61-90 days | | — | | | — | | | — | |
| 90+ days | | 1 | | | 90,000 | | | 27,495 | |
| Total | | 7 | | | $ | 192,172 | | | $ | 128,766 | |
Securitized Commercial Loan
On August 1, 2020 we consolidated CSMC USA as a result of our ongoing reassessment of our CMBS VIE holdings for potential consolidation of the securitized trust. Our $14.9 million or 8.8% interest in the trust certificate of CSMC USA (F Class) was eliminated in the consolidation. Please refer to Note 6 - "Commercial Real Estate Investments" for details. The CSMC USA holds a commercial loan secured by a first mortgage lien on the borrowers’ fee and leasehold interests in a portion of a super-regional mall. The outstanding principal balance on this commercial loan is $1.4 billion as of September 30, 2021. The loan's stated maturity date is September 11, 2025 and bears a fixed interest rate of 4.38%. The commercial loan served as collateral for the $1.4 billion securitized debt issued by CMSC USA and the securitized debt is non-recourse to us. Refer to Note 7 - "Financings" for details on the associated securitized debt.
In December 2020, the commercial loan held by CSMC USA was amended to an interest only payment through maturity. As part of the modification, a Cash Management Forbearance Agreement was entered into by special servicer and the borrower that required both increased reporting requirements and monthly net cash remittance.
Geographic Concentration
The mortgages underlying our Non-Agency RMBS and Non-Agency CMBS are located in various states across the United States and other countries. The following table presents the five largest concentrations by location for the mortgages collateralizing our Non-Agency RMBS and Non-Agency CMBS as of September 30, 2021, based on fair value (dollars in thousands):
| | | | | | | | | | | | | | | | | | | | | | | | | | |
| | Non-Agency RMBS | | | Non-Agency CMBS |
| | Concentration | | Fair Value | | | Concentration | | Fair Value |
| California | 27.2 | % | | $ | 7,628 | | | California | 30.6 | % | | $ | 41,196 | |
| New York | 9.3 | % | | 2,591 | | | Nevada | 14.6 | % | | 19,620 | |
| Florida | 9.1 | % | | 2,554 | | | Illinois | 13.6 | % | | 18,372 | |
| New Jersey | 4.2 | % | | 1,173 | | | Bahamas | 10.6 | % | | 14,330 | |
| Maryland | 4.0 | % | | 1,125 | | | New York | 3.8 | % | | 5,073 | |
The following table presents the various states across the United States in which the collateral securing our Residential Whole Loans and Residential Bridge Loans at September 30, 2021, based on principal balance, is located (dollars in thousands):
| | | | | | | | | | | | | | | | | | | | | | | | | | |
| | Residential Whole Loans | | | Residential Bridge Loans |
| | State
Concentration | | Principal
Balance | | | State
Concentration | | Principal
Balance |
| California | 72.3 | % | | $ | 656,801 | | | New York | 39.5 | % | | $ | 2,631 | |
| New York | 14.3 | % | | 129,931 | | | California | 35.9 | % | | 2,386 | |
| Georgia | 2.7 | % | | 24,300 | | | Florida | 16.9 | % | | 1,125 | |
| Florida | 2.4 | % | | 21,697 | | | New Jersey | 5.0 | % | | 335 | |
| New Jersey | 2.0 | % | | 18,255 | | | Pennsylvania | 1.6 | % | | 105 | |
| Other | 6.3 | % | | 57,528 | | | Other | 1.1 | % | | 72 | |
| Total | 100.0 | % | | $ | 908,512 | | | Total | 100.0 | % | | $ | 6,654 | |
Financing Activity
We will look to continue to expand and diversify our financing sources, especially those sources that provide an alternative to short-term repurchase agreements with daily margin requirements. During the nine months ended September 30, 2021, we repurchased $129.3 million aggregate principal amount of the 2022 Notes and issued $86.3 million aggregate principal amount of the 2024 Notes. We did not sell any investments during the nine months ended September 30, 2021.
Repurchase Agreements
Non-Agency CMBS and Non-Agency RMBS Facility
On May 5, 2021, we amended our Non-Agency CMBS and Non-Agency RMBS financing facility to, among other things, extend the facility for an additional 12 months and reduce the interest rate. The amended facility has improved advance rates and bears interest at a rate of three-month LIBOR plus 2.00%. As of September 30, 2021, the outstanding balance under this facility was $111.5 million. The borrowing is secured by investments with an estimated fair market value of $196.7 million as of September 30, 2021.
Commercial Whole Loan Facility
As of September 30, 2021, we had approximately $63.7 million in borrowings, with a weighted average interest rate of 2.27% under our commercial whole loan facility. The borrowing is secured by loans with an estimated fair market value of
$86.9 million as of September 30, 2021. The facility was subject to automatic monthly rolling until such time that it is terminated pursuant to the terms of the agreement by either the borrower or lender or until certain conditions of default.
Residential Whole Loan Facility
Under the residential whole loan facility, as of September 30, 2021, we had approximately $236.8 million in borrowings with an interest rate of one month LIBOR plus 2.75%. The borrowing is secured by Non-QM loans with an estimated fair market value of $287.1 million.
Recourse and Non-Recourse Financing
We utilize both recourse and non-recourse debt to finance our portfolio. Our recourse debt included our short and long-term repurchase agreement financings and our convertible senior unsecured notes. At September 30, 2021, our total non-recourse financing of approximately $2.0 billion is comprised of $605.0 million of securitized debt issued in connection with our two Residential Whole Loan securitizations and $1.4 billion of securitized debt from owning a $14.9 million Non-Agency CMBS bond deemed to be a controlling financial variable interest in CSMC USA which required us to consolidate the CMBS VIE.
| | | | | | | | | | | | | | |
| (dollars in thousands) | September 30, 2021 | | December 31, 2020 | |
| Recourse and non-recourse financing | $ | 2,580,413 | | | $ | 2,973,732 | | |
| Non-recourse financing | 1,970,513 | | | 2,446,012 | | |
| Total recourse financing | $ | 609,900 | | $609,900 | $ | 527,720 | | |
| | | | |
| Stockholders' equity | $ | 210,186 | | | $ | 255,112 | | |
| | | | |
| Recourse leverage | 2.9x | | 2.1x | |
Financing Facilities Outstanding Borrowings
At September 30, 2021, we had outstanding borrowings under five of our repurchase agreements. The following table summarizes certain characteristics of our repurchase agreements at September 30, 2021 (dollars in thousands):
| | | | | | | | | | | | | | | | | | | | |
| Securities Pledged | | Repurchase Agreement Borrowings | | Weighted Average Interest Rate on Borrowings Outstanding at end of period | | Weighted Average Remaining Maturity (days) |
| Short-Term Borrowings: | | | | | | |
| | | | | | |
| Agency RMBS | | $ | 1,048 | | | 1.05 | % | | 59 |
| Non-Agency CMBS | | 10,314 | | | 1.75 | % | | 12 |
| | | | | | |
Residential Whole Loans (1) | | 41,013 | | | 2.66 | % | | 4 |
Residential Bridge Loans (1) | | 5,817 | | | 2.60 | % | | 4 |
Commercial Loans (1) | | 10,603 | | | 3.18 | % | | 4 |
| | | | | | |
| Other Securities | | 2,587 | | | 3.52 | % | | 19 |
| Subtotal | | 71,382 | | | 2.60 | % | | 7 |
| Long-Term Borrowings: | | | | | | |
Non-Agency CMBS (2) | | 68,352 | | | 2.12 | % | | 193 |
| Non-Agency RMBS | | 15,632 | | | 2.12 | % | | 217 |
Residential Whole Loans (1)(3) | | 236,767 | | | 3.00 | % | | 36 |
| Commercial Loans | | 63,669 | | | 2.27 | % | | 360 |
| Other Securities | | 27,506 | | | 2.12 | % | | 217 |
| Subtotal | | 411,926 | | | 2.65 | % | | 113 |
| Repurchase Agreements Borrowings | | $ | 483,308 | | | 2.64 | % | | 98 |
| Less Unamortized Debt Issuance Costs | | 40 | | | N/A | | N/A |
| Repurchase Agreements Borrowings, net | | $ | 483,268 | | | 2.64 | % | | 98 |
(1)Repurchase agreement borrowings on loans owned are through trust certificates. The trust certificates are eliminated in consolidation.
(2)Includes repurchase agreement borrowings on securities eliminated upon VIE consolidation.
(3)The Residential Whole Loan facility's maturity was extended one month in October 2021.The weighted average remaining maturity reflects the one month extension.
.
Certain of the financing arrangements provide the counterparty with the right to terminate the agreement if we do not maintain certain equity, liquidity and leverage metrics. We were in compliance with the terms of such financial tests as of September 30, 2021.
At September 30, 2021, we had outstanding repurchase agreement borrowings with the following counterparties:
| | | | | | | | | | | | | | | | | | | | | | | | | | |
(dollars in thousands)
Repurchase Agreement Counterparties | | Amount Outstanding | | Percent of Total Amount Outstanding | | Company Investments Held as Collateral | | Counterparty Rating(1) |
Credit Suisse AG, Cayman Islands Branch (2) | | $ | 339,773 | | | 70.3 | % | | $ | 414,003 | | | A+ |
| Citigroup Global Markets Inc. | | 111,491 | | | 23.1 | % | | 196,665 | | | A+ |
Nomura Securities International, Inc. (3) | | 18,096 | | | 3.7 | % | | 22,038 | | | Unrated (3) |
| Credit Suisse Securities (USA) LLC | | 12,900 | | | 2.7 | % | | 20,400 | | | A+ |
| | | | | | | | |
| | | | | | | | |
| | | | | | | | |
| | | | | | | | |
| | | | | | | | |
| | | | | | | | |
| | | | | | | | |
| | | | | | | | |
| | | | | | | | |
| | | | | | | | |
| | | | | | | | |
| | | | | | | | |
All other counterparties (4) | | 1,048 | | | 0.2 | % | | 1,342 | | | |
| Total | | $ | 483,308 | | | 100.0 | % | | $ | 654,448 | | | |
(1)The counterparty ratings presented above are the long-term issuer credit ratings as rated at September 30, 2021 by S&P.
(2)Includes master repurchase agreements in which the buyer includes Alpine Securitization LTD., a Credit Suisse sponsored asset-backed commercial paper conduit.
(3) Nomura Holdings, Inc., the parent company of Nomura Securities International, Inc., is rated BBB+ by S&P at September 30, 2021.
(4) Represents amount outstanding with one counterparty, which holds collateral valued less than 5% of our stockholders’ equity as security for our obligations under the applicable repurchase agreements as of September 30, 2021.
The following table presents our average repurchase agreement borrowings, excluding unamortized debt issuance costs, by type of collateral pledged for the three and nine months ended September 30, 2021 (dollars in thousands):
| | | | | | | | | | | | | | |
| Collateral | | Three Months Ended September 30, 2021 | | Nine months ended September 30, 2021 |
| Agency RMBS | | $ | 1,125 | | | $ | 1,235 | |
| | | | |
| Non-Agency RMBS | | 15,632 | | | 15,120 | |
Non-Agency CMBS(1) | | 81,645 | | | 79,890 | |
| Residential Whole Loans | | 133,556 | | | 80,565 | |
| Commercial loans | | 106,200 | | | 135,398 | |
| | | | |
| Residential Bridge Loans | | 7,897 | | | 10,342 | |
| Membership interest | | 15,452 | | | 17,863 | |
| Other securities | | 30,052 | | | 23,596 | |
| Total | | $ | 391,559 | | | $ | 364,009 | |
Maximum borrowings during the period(2) | | $ | 483,307 | | | $ | 483,307 | |
(1)Includes repurchase agreement borrowings on securities eliminated upon VIE consolidation.
(2)Amount represents the maximum borrowings at month-end during each of the respective periods.
Securitized Debt
Commercial Mortgage-Backed Notes
We hold a controlling financial variable interest in CSMC USA and were required to consolidate the CMBS VIE. Refer to Note 7 - "Financings" for details. The following table summarizes the consolidated 2014 CSMC USA's commercial mortgage pass-through certificates at September 30, 2021 which is classified in "Securitized debt, net" in the Consolidated Balance Sheets (dollars in thousands):
| | | | | | | | | | | | | | |
| Classes | Principal Balance | Coupon | Fair Value | Contractual Maturity |
| Class A-1 | $ | 120,391 | | 3.3 | % | $ | 126,264 | | 9/11/2025 |
| Class A-2 | 531,700 | | 4.0 | % | 570,167 | | 9/11/2025 |
| Class B | 136,400 | | 4.2 | % | 138,562 | | 9/11/2025 |
| Class C | 94,500 | | 4.3 | % | 92,630 | | 9/11/2025 |
| Class D | 153,950 | | 4.4 | % | 142,388 | | 9/11/2025 |
| Class E | 180,150 | | 4.4 | % | 161,900 | | 9/11/2025 |
| Class F | 153,600 | | 4.4 | % | 118,664 | | 9/11/2025 |
Class X-1(1) | N/A | 0.5 | % | 12,347 | | 9/11/2025 |
Class X-2(1) | N/A | 0.03 | % | 2,572 | | 9/11/2025 |
| $ | 1,370,691 | | | $ | 1,365,494 | | |
| | | | |
| | | | |
| | | | |
| | | | |
(1) Class X-1 and X-2 are interest-only classes with notional balances of $652.1 million and $733.5 million as of September 30, 2021, respectively.
The above table does not reflect the portion of the class F bond held by us because the bond is eliminated in consolidation. Our ownership interest in the F bonds represents a controlling financial interest, which resulted in consolidation of the trust, during the quarter. The bond had a fair market value of $11.5 million at September 30, 2021, and our exposure to loss is limited to our ownership interest in this bond.
Residential Mortgage-Backed Notes
In May 2019, we completed a residential mortgage-backed securitization comprised of a portion of our Residential Whole Loan portfolio. RMI 2015 Trust and RNR Trust collectively transferred $945.5 million of Non-QM Residential Whole
Loans, to our wholly owned subsidiary, Arroyo Trust 2019. Arroyo Trust 2019 issued $919.0 million of mortgage-backed notes and we retained the subordinate non-offered securities. These non-offered securities with an estimated fair value of $35.9 million at September 30, 2021 were eliminated in the consolidation. At September 30, 2021, Residential Whole Loans, with an outstanding principal balance of approximately $414.0 million, serve as collateral for the Arroyo Trust 2019's securitized debt.
The following table summarizes the consolidated Arroyo Trust 2019's issued mortgage-backed notes at September 30, 2021 which is classified in "Securitized debt, net" in the Consolidated Balance Sheets (dollars in thousands):
| | | | | | | | | | | | | | |
| Classes | Principal Balance | Coupon | Carrying Value | Contractual Maturity |
| Issued Mortgage-Backed Notes | | | | |
| Class A-1 | $ | 330,944 | | 3.3% | $ | 330,944 | | 4/25/2049 |
| Class A-2 | 17,740 | | 3.5% | 17,740 | | 4/25/2049 |
| Class A-3 | 28,106 | | 3.8% | 28,106 | | 4/25/2049 |
| Class M-1 | 25,055 | | 4.8% | 25,055 | | 4/25/2049 |
| Subtotal | $ | 401,845 | | | $ | 401,845 | | |
| Less: Unamortized deferred financing costs | N/A | | 3,727 | | |
| Total | $ | 401,845 | | | $ | 398,118 | | |
In June 2020, we completed a residential mortgage-backed securitization comprised of a portion of our Residential Whole Loan portfolio. RMI 2015 Trust transferred $355.8 million of Non-QM Residential Whole Loans, to our wholly owned subsidiary, Arroyo Trust 2020. Arroyo Trust 2020 issued $341.7 million of mortgage-backed notes and we retained the subordinate non-offered securities. These non-offered securities with an estimated fair value of $26.0 million at September 30, 2021 were eliminated in the consolidation. At September 30, 2021, Residential Whole Loans, with an outstanding principal balance of approximately $216.4 million, serve as collateral for the Arroyo Trust 2020's securitized debt.
The following table summarizes the consolidated Arroyo Trust 2020's issued mortgage-backed notes at September 30, 2021 which is classified in "Securitized debt, net" in the Consolidated Balance Sheets (dollars in thousands):
| | | | | | | | | | | | | | |
| Classes | Principal Balance | Coupon | Carrying Value | Contractual Maturity |
| Issued Mortgage-Backed Notes | | | | |
| Class A-1A | $ | 148,244 | | 1.7% | $ | 148,244 | | 3/25/2055 |
| Class A-1B | 17,591 | | 2.1% | 17,591 | | 3/25/2055 |
| Class A-2 | 13,518 | | 2.9% | 13,518 | | 3/25/2055 |
| Class A-3 | 17,963 | | 3.3% | 17,963 | | 3/25/2055 |
| Class M-1 | 11,739 | | 4.3% | 11,739 | | 3/25/2055 |
| Subtotal | $ | 209,055 | | | $ | 209,055 | | |
| Less: Unamortized deferred financing costs | N/A | | 2,154 | | |
| Total | $ | 209,055 | | | $ | 206,901 | | |
Convertible Senior Unsecured Notes
1
During the quarter we reduced the our overall convertible senior unsecured notes outstanding by $36.4 million and extended the maturity to 2024 for $86.3 million of our convertible senior unsecured debt through the issuance of the 2024 Notes to further strengthen our balance sheet.
1
In August 2021, we repurchased $22.3 million aggregate principal amount of our existing 2022 Notes at a weighted average discount to par value of 2.8%.
In September 2021, we issued $86.3 million of 2024 Notes and used the net proceeds, together with approximately $20.2 million of cash on hand, to repurchase an additional $100.3 million of our 2022 Notes.
As of September 30, 2021, we had $45.7 million of the 2022 Notes outstanding. The 2022 Notes mature on October 1, 2022, unless earlier converted, redeemed or repurchased by the holders pursuant to their terms, and are not redeemable by us except during the final three months prior to maturity.
As of September 30, 2021, we had $86.3 million aggregate principal amount of the 2024 Notes outstanding. The 2024 notes mature on September 15, 2024, unless earlier converted, redeemed or repurchased by the holders pursuant to their terms, and are not redeemable by us except during the final three months prior to maturity.
Hedging Activity
The following tables summarize the hedging activity during the nine months ended September 30, 2021 (dollars in thousands): | | | | | | | | | | | | | | | | | | | | | | | |
| Notional Amount at | | | | Settlements, Terminations or Expirations | | Notional Amount at |
| Derivative Instrument | December 31, 2020 | | Acquisitions | | | September 30, 2021 |
| Fixed pay interest rate swaps | $ | — | | | $ | 22,000 | | | $ | — | | | $ | 22,000 | |
| Variable pay interest rate swaps | — | | | 56,500 | | | (56,500) | | | — | |
| | | | | | | |
| | | | | | | |
| | | | | | | |
| | | | | | | |
| | | | | | | |
| | | | | | | |
| | | | | | | |
| Credit default swaps | 6,170 | | | — | | | — | | | 6,170 | |
| | | | | | | |
| | | | | | | |
| Total derivative instruments | $ | 6,170 | | | $ | 78,500 | | | $ | (56,500) | | | $ | 28,170 | |
| | | | | | | | | | | | | | | | | | | | | | | | | | | | | | | | | | | |
| Fair Value at | | Acquisitions | | Settlements, Terminations or Expirations | | Realized Gains / Losses | | Mark-to-market | | Fair Value at |
| Derivative Instrument | December 31, 2020 | | | | | | September 30, 2021 |
| Fixed pay interest rate swaps | $ | — | | | $ | — | | | $ | (341) | | | $ | 341 | | | $ | (25) | | | $ | (25) | |
| Variable pay interest rate swaps | — | | | — | | | (179) | | | 179 | | | — | | | — | |
| | | | | | | | | | | |
| | | | | | | | | | | |
| | | | | | | | | | | |
| | | | | | | | | | | |
| | | | | | | | | | | |
| | | | | | | | | | | |
| | | | | | | | | | | |
| Credit default swaps | (495) | | | — | | | — | | | — | | | 52 | | | (443) | |
| | | | | | | | | | | |
| Total derivative instruments | $ | (495) | | | $ | — | | | $ | (520) | | | $ | 520 | | | $ | 27 | | | $ | (468) | |
Capital Markets Activity
Convertible Notes Repurchases
During the nine months ended September 30, 2021, we repurchased $129.3 million aggregate principal amount of the 2022 Notes at an approximate 0.8% discount to par value, plus accrued and unpaid interest.
Dividends
During the nine months ended September 30, 2021, we declared a $0.05 dividenddividends totaling $0.18 per share generating a dividend yield of approximately 9.8%9.2% based on the stock closing price of $2.04 at$2.61 on September 30, 2020.2021.
Book Value
The following chart reflects our book value per common share basic and diluted over five consecutive quarters:
TheDuring the first half of 2020, the COVID-19 pandemic has created unprecedented market disruption and dislocation, requiring us to sell assetassets to meet margin calls. We have implemented measures to increase liquidity, reduce leverage, and seek alternative financing arrangements to preserve long-term shareholder value. In the second quarter in order to manage the severe market conditions and the resulting large margin demands from lenders and pressure on our liquidity, we entered into two longer term financing arrangements, a Residential Whole Loan Facility and a Non-Agency CMBS and Non-Agency RMBS Facility, as we sought to reduce our exposure to short-term financings with daily mark to market exposure. See Financing Activity for details.
We had improved financial results during the third quarter, which included significant recovery in asset valuations. The improved asset valuations resulted in the increasedecrease in book value from $3.55 as of 29.2%June 30, 2021, to $4.07 at$3.45 as of September 30, 2020 when compared2021, was primarily due to a decline in fair value in our June 30, 2020 bookcommercial investment portfolio and the fair value of $3.15.adjustment and accelerated premium amortization associated prepayments in our residential whole loan portfolio during the 3rd quarter.
Results of Operations
Comparison of the three months ended September 30, 20202021 to the three months ended September 30, 2019.2020.
General
OurDue to the continued uncertainty still surrounding COVID-19 pandemic, our results of operations were adverselyfor the three months ended September 30, 2021 and September 30, 2020 may not be comparable.
We continued to make progress towards strengthening our balance sheet and improving liquidity. For the three months ended September 30, 2021, we generated a net loss of $4.5 million, or $0.07 per basic and diluted weighted common share. Although the residential credit markets continued to improve in the three months ended September 30, 2021, our commercial real estate investments especially in the retail ans hospitality sectors are taking longer to recover, which impacted valuations and was a key driver of the net loss for the period. Our commercial investment declined in fair value by approximately $8.5 million and further losses are possible. However, during the COVID-19 pandemic, which created unprecedented market disruption and dislocation. Duringquarter, certain of our commercial investments benefited from improvements in the first quarter of 2020, the uncertainty surrounding the pandemic created an extreme lack of liquidity incommercials mortgage markets resulting in $157.3 million in payoffs from three commercial loans, a CMBS bond and when combined with forced selling leda risk retention bond.We deployed the capital to swiftacquire $233.2 million in Non_QM loans and dramatic price declines. The significant decline in value of our investment portfolio resulted in substantial margin calls from our repurchase agreement counterparties. In order to satisfy the margin calls, we soldbuy back a significant portion of our investments.2022 Notes. We also terminated our interest rate hedges because they were ineffective in the low interest rate environment and it further reduced margin call volatility. During the third quarter ending September 30, 2020, our portfolio experienced improved valuations and earnings, and we did not havedispose of any investments or receive significant asset sales or margin calls during the quarter.third quarter of 2021.
For the three months ended September 30, 2020, due the improved residential credit markets there was significant increase in our residential whole loan investments, which was a key contributor to the generation of net income of $59.8 million, or $0.98 per basic and diluted weighted common share.
The full impact of COVID-19 on our results of operations is still uncertain as it depends on several factors beyond our control including, but not limited to (i) the uncertainty around the severity and duration of the outbreak, (ii) the effectiveness of the United States public health response, (iii) the pandemic’s impact on the U.S. and global economies, (iv) the timing, scope and effectiveness of additional governmental responses to the pandemic, (v) the timing and speed of economic recovery, including the availability of a treatment or vaccination for COVID-19 and (vi) the negative impact on our borrowers, asset values and cost of capital.
Due to the significant amount of investment sales, resulting from the market volatility created by the COVID-19 pandemic, our results of operations for the three and nine months ended September 30, 2020 and 2019 are not comparable.
During the third quarter of 2020, we continued to make progress towards strengthening our balance sheet, improving liquidity, shareholders equity and the earnings power of the portfolio. For the three months ended September 30, 2020, we generated net income of $59.8 million, or $0.98 per basic and diluted weighted common share. The increase in net income was mainly attributable to improved asset valuations across our portfolio . For the three months ended September 30, 2019 we generated net income of $19.7 million, or $0.37 per basic and diluted weighted common share.
Net Interest Income
The following tables set forth certain information regarding our net interest income on our investment portfolio for the three months ended September 30, 20202021 and September 30, 20192020 (dollars in thousands):
| | | | | | | | | | | | | | | | | | | | |
| Three Months Ended September 30, 2021 | | Average Amortized
Cost of Assets | | Total Interest Income | | Yield on Average Assets |
| | | | | | |
| Investments | | | | | | |
| | | | | | |
| Agency RMBS | | $ | 70 | | | $ | 4 | | | 22.67 | % |
| Non-Agency CMBS | | 200,824 | | | 4,290 | | | 8.48 | % |
| Non-Agency RMBS | | 28,528 | | | 369 | | | 5.13 | % |
| Residential Whole Loans | | 831,634 | | | 8,147 | | | 3.89 | % |
| Residential Bridge Loans | | 8,714 | | | 89 | | | 4.05 | % |
| Commercial loans | | 243,534 | | | 2,847 | | | 4.64 | % |
| Securitized commercial loans | | 1,407,129 | | | 23,622 | | | 6.66 | % |
| Other securities | | 48,364 | | | 773 | | | 6.34 | % |
| Total investments | | $ | 2,768,797 | | | $ | 40,141 | | | 5.75 | % |
| | | | | | |
| | Average Carrying Value | | Total Interest Expense | | Average Cost of Funds(1) |
| Borrowings | | | | | | |
| Repurchase agreements | | $ | 391,559 | | | $ | 3,037 | | | 3.08 | % |
| Convertible senior unsecured notes, net | | 145,356 | | | 3,099 | | | 8.46 | % |
| Securitized debt | | 1,995,098 | | | 26,842 | | | 5.34 | % |
| Total borrowings | | $ | 2,532,013 | | | $ | 32,978 | | | 5.17 | % |
| | | | | | |
Net interest income and net interest margin(2) | | | | $ | 7,163 | | | 1.03 | % |
| | | | | | | | | | | | | | | | | | | | |
| Three Months Ended September 30, 2020 | | Average Amortized
Cost of Assets | | Total Interest Income | | Yield on Average Assets |
| | | | | | |
| Investments | | | | | | |
| | | | | | |
| Agency RMBS | | $ | 136 | | | $ | 8 | | | 23.40 | % |
| Non-Agency CMBS | | 244,082 | | | 5,186 | | | 8.45 | % |
| Non-Agency RMBS | | 30,355 | | | 462 | | | 6.05 | % |
| Residential Whole Loans | | 1,137,905 | | | 12,698 | | | 4.44 | % |
| Residential Bridge Loans | | 24,328 | | | 325 | | | 5.31 | % |
| Commercial loans | | 332,348 | | | 5,390 | | | 6.45 | % |
| Securitized commercial loans | | 1,329,556 | | | 19,191 | | | 5.74 | % |
| Other securities | | 51,475 | | | 710 | | | 5.49 | % |
| Total investments | | $ | 3,150,185 | | | $ | 43,970 | | | 5.55 | % |
| | | | | | |
| | Average Carrying Value | | Total Interest Expense | | Average Cost of Funds(1) |
| Borrowings | | | | | | |
| Repurchase agreements | | $ | 348,360 | | | $ | 3,503 | | | 4.00 | % |
| Convertible senior unsecured notes, net | | 194,281 | | | 4,062 | | | 8.32 | % |
| Securitized debt | | 2,264,800 | | | 26,288 | | | 4.62 | % |
| Total borrowings | | $ | 2,807,441 | | | $ | 33,853 | | | 4.80 | % |
| | | | | | |
Net interest income and net interest margin(2) | | | | $ | 10,117 | | | 1.28 | % |
| | | | | | | | | | | | | | | | | | | | |
| Three Months Ended September 30, 2020 | | Average Amortized
Cost of Assets | | Total Interest Income | | Yield on Average Assets |
| | | | | | |
| Investments | | | | | | |
| | | | | | |
| Agency RMBS | | $ | 136 | | | $ | 8 | | | 23.40 | % |
| Non-Agency CMBS | | 244,082 | | | 5,186 | | | 8.45 | % |
| Non-Agency RMBS | | 30,355 | | | 462 | | | 6.05 | % |
| Residential Whole Loans | | 1,137,905 | | | 12,698 | | | 4.44 | % |
| Residential Bridge Loans | | 24,328 | | | 325 | | | 5.31 | % |
| Commercial Loans | | 332,348 | | | 5,390 | | | 6.45 | % |
| Securitized commercial loan | | 1,329,556 | | | 19,191 | | | 5.74 | % |
| Other securities | | 51,475 | | | 710 | | | 5.49 | % |
| Total investments | | $ | 3,150,185 | | | $ | 43,970 | | | 5.55 | % |
| | | | | | |
| | Average Carrying Value | | Total Interest Expense | | Average Cost of Funds(1) |
| Borrowings | | | | | | |
| Repurchase agreements | | $ | 348,360 | | | $ | 3,503 | | | 4.00 | % |
| Convertible senior unsecured notes, net | | 194,281 | | | 4,062 | | | 8.32 | % |
| Securitized debt | | 2,264,800 | | | 26,288 | | | 4.62 | % |
| Total borrowings | | $ | 2,807,441 | | | $ | 33,853 | | | 4.80 | % |
| | | | | | |
Net interest income and net interest margin(2) | | | | $ | 10,117 | | | 1.28 | % |
| | | | | | | | | | | | | | | | | | | | |
| Three Months Ended September 30, 2019 | | Average Amortized
Cost of Assets | | Total Interest Income | | Yield on Average Assets |
| | | | | | |
| Investments | | | | | | |
| Agency CMBS | | $ | 1,734,681 | | | $ | 13,780 | | | 3.15 | % |
| Agency RMBS | | 462,431 | | | 3,742 | | | 3.21 | % |
| Non-Agency CMBS | | 241,580 | | | 4,744 | | | 7.79 | % |
| Non-Agency RMBS | | 46,133 | | | 556 | | | 4.78 | % |
| Residential Whole Loans | | 1,186,261 | | | 13,953 | | | 4.67 | % |
| Residential Bridge Loans | | 83,208 | | | 1,362 | | | 6.49 | % |
| Commercial Loans | | 372,802 | | | 7,612 | | | 8.10 | % |
| Securitized commercial loan | | 736,542 | | | 8,615 | | | 4.64 | % |
| Other securities | | 73,997 | | | 1,288 | | | 6.91 | % |
| Total investments | | $ | 4,937,635 | | | $ | 55,652 | | | 4.47 | % |
| | | | | | |
| | Average Carrying Value | | Total Interest Expense | | Average Cost of Funds(1) |
| Borrowings | | | | | | |
| Repurchase agreements | | $ | 2,990,018 | | | $ | 22,054 | | | 2.93 | % |
| Convertible senior unsecured notes, net | | 135,951 | | | 2,653 | | | 7.74 | % |
| Securitized debt | | 1,505,784 | | | 14,375 | | | 3.79 | % |
| Total borrowings | | $ | 4,631,753 | | | $ | 39,082 | | | 3.35 | % |
| | | | | | |
Net interest income and net interest margin(2) | | | | $ | 16,570 | | | 1.33 | % |
(1) Average cost of funds does not include the interest expense related to our derivatives. In accordance with GAAP, such costs are included in "Gain (loss) on derivative instruments, net" in the Consolidated Statements of Operations.
(2) Since we do not apply hedge accounting, our net interest margin in this table does not reflect the benefit /cost of our interest rate swaps. See Non-GAAP Financial Measure section for net investment income table that includes the benefit/cost from our interest rate swaps.
Interest Income
For the three months ended September 30, 2020 and September 30, 2019, we earned interest income on our investments of approximately $44.0 million and $55.7 million, respectively, a decrease of approximately $11.7 million. The decrease was driven by the sales of a significant portion of our investment portfolio to meet margin calls. During the first six months of the year, mainly in March and April 2020, we sold $2.4 billion of investments. The full impact of these sales were reflected in interest income in the third quarter of 2020.
For the three months ended September 30, 2020 the weighted average yield on our portfolio increased to 5.55% for the three months ended September 30, 2020 from 4.47% for the three months ended September 30, 2020. While it is difficult to predict the future impact of COVID-19, our principal and interest payments through September 30, 2020 have not been materially impacted.
Interest Expense
Interest expense decreased from $39.1 million for the three months ended September 30, 2019 to $33.9 million for the three months ended September 30, 2020. The decrease was a result of reduced leverage associated with the sale of $2.4 billion of investments, mainly in March and April 2020. During the second quarter of 2020, we entered into two new financing facilities to limit our exposure to short-term mark to market financings. Also, we completed a securitization of approximately $355.8 million of our Residential Whole Loans, reducing our recourse leverage by $339.4 million or 46.0%.
Other income (loss), net
Realized gain (loss) on investments, net
Realized gain (loss) on investments represents the net gain (loss) on sales or settlements from our investment portfolio. Our portfolio experienced improved valuations and we did not have significant asset sales during the third quarter.
The following table presents the realized gains (losses) of our investments for each of the three months ended September 30, 2020 and September 30, 2019 (dollars in thousands):
| | | | | | | | | | | | | | | | | | | | | | | | | | | | | | | | | | | | | | | | | | | | | | | |
| | For the three months ended September 30, 2020 | | For the three months ended September 30, 2019 |
| | Proceeds | | Gross Gains | | Gross Losses | | Net Gain (Loss) | | Proceeds | | Gross Gains | | Gross Losses | | Net Gain (Loss) |
| Agency CMBS | $ | — | | | $ | — | | | $ | — | | | $ | — | | | $ | 356,967 | | | $ | 20,268 | | | $ | — | | | $ | 20,268 | |
| Agency RMBS | — | | | — | | | — | | | — | | | 205,310 | | | 1,560 | | | — | | | 1,560 | |
| Non-Agency CMBS | — | | | — | | | — | | | — | | | 24,288 | | | 134 | | | (210) | | | (76) | |
| Non-Agency RMBS | (44) | | | — | | | (44) | | | (44) | | | — | | | — | | | — | | | — | |
| | | | | | | | | | | | | | | |
| | | | | | | | | | | | | | | |
Residential Bridge Loans(1) | — | | | — | | | (225) | | | (225) | | | — | | | 107 | | | (474) | | | (367) | |
Loans transferred to REO(1) | — | | | — | | | — | | | — | | | 3,536 | | | 399 | | | (352) | | | 47 | |
| Disposition of REO | 786 | | | — | | | (271) | | | (271) | | | 219 | | | — | | | (33) | | | (33) | |
| Total | $ | 742 | | | $ | — | | | $ | (540) | | | $ | (540) | | | $ | 590,320 | | | $ | 22,468 | | | $ | (1,069) | | | $ | 21,399 | |
(1)Realized gains/losses recognized on the transfer of Residential Bridge Loans to REO. Proceeds represent the fair value less estimated selling costs of the real estate on the date of transfer.
Unrealized gain (loss), net
Our investments, and securitized debt, for which we have elected the fair value option are recorded at fair value with the periodic changes in fair value being recorded in earnings. The change in unrealized gain (loss) is directly attributable to changes in market pricing on the underlying investments and securitized debt during the period. For the three months ended September 30, 2020, we saw significant recovery in asset prices across our portfolio, which resulted in a net unrealized gain during the period.
The following table presents the net unrealized gains (losses) we recorded on our investments and securitized debt (dollars in thousands):
| | | | | | | | | | | |
| | Three months ended September 30, 2020 | | Three months ended September 30, 2019 |
| Agency CMBS | $ | — | | | $ | 25,603 | |
| Agency RMBS | (9) | | | 1,772 | |
| Non-Agency CMBS | 5,873 | | | 3,405 | |
| Non-Agency RMBS | (856) | | | 971 | |
| Residential Whole Loans | 48,307 | | | 2,141 | |
| Residential Bridge Loans | 410 | | | 569 | |
| Commercial loans | 2,194 | | | 135 | |
| Securitized commercial loans | 4,567 | | | (845) | |
| Other securities | 1,602 | | | 534 | |
| Securitized debt | (7,523) | | | 745 | |
| REO | 125 | | | — | |
| | | |
| Total | $ | 54,690 | | | $ | 35,030 | |
Gain (loss) on derivatives, net
In March 2020, we effectively terminated all of our fixed-pay interest rate swaps and our variable-pay interest rate to reduce hedging costs and associated margin volatility.
The following table presents the components of gain (loss) on derivatives for the three months ended September 30, 2020 and September 30, 2019 (dollars in thousands):
| | | | | | | | | | | | | | | | | | | | | | | | | | | | | | | | | | | | | | |
| | Realized Gain (Loss), net | | | | | | | | |
| Description | | Other Settlements / Expirations | | Variation Margin Settlement | | Return (Recovery) of Basis | | Mark-to-Market | | Contractual interest income (expense), net(1) | | Total |
| Three months ended September 30, 2020 | | | | | | | | | | | | |
| | | | | | | | | | | | |
| | | | | | | | | | | | |
| Agency and Non-Agency Interest-Only Strips— accounted for as derivatives | | $ | — | | | $ | — | | | $ | (166) | | | $ | 71 | | | $ | 200 | | | $ | 105 | |
| | | | | | | | | | | | |
| | | | | | | | | | | | |
| | | | | | | | | | | | |
| | | | | | | | | | | | |
| | | | | | | | | | | | |
| Credit default swaps | | 166 | | | — | | | — | | | (359) | | | — | | | (193) | |
| | | | | | | | | | | | |
| Total | | $ | 166 | | | $ | — | | | $ | (166) | | | $ | (288) | | | $ | 200 | | | $ | (88) | |
| | | | | | | | | | | | |
| Three months ended September 30, 2019 | | | | | | | | | | | | |
| Interest rate swaps | | $ | (123) | | | $ | (56,121) | | | $ | 1,655 | | | $ | 3,289 | | | $ | 60 | | | $ | (51,240) | |
| Interest rate swaptions | | (332) | | | — | | | — | | | 176 | | | — | | | (156) | |
| Agency and Non-Agency Interest-Only Strips— accounted for as derivatives | | — | | | — | | | (590) | | | (420) | | | 723 | | | (287) | |
| Options | | 1,378 | | | — | | | — | | | (470) | | | — | | | 908 | |
| Futures contracts | | 3,620 | | | — | | | — | | | (710) | | | — | | | 2,910 | |
| | | | | | | | | | | | |
| | | | | | | | | | | | |
| Credit default swaps | | 175 | | | — | | | — | | | 634 | | | — | | | 809 | |
| | | | | | | | | | | | |
| Total | | $ | 4,718 | | | $ | (56,121) | | | $ | 1,065 | | | $ | 2,499 | | | $ | 783 | | | $ | (47,056) | |
(1)Contractual interest income (expense), net on derivative instruments includes interest settlement paid or received.
Other, net
For the three months ended September 30, 2020 and September 30, 2019, "Other, net" was a loss of $31 thousand and income of $918 thousand, respectively. The balance is mainly comprised of income on cash balances, miscellaneous net interest income (expense) on cash collateral for our repurchase agreements, and derivatives and miscellaneous fees and expenses on residential mortgage loans.
Expenses
Management Fee
We incurred management fee expense of approximately $1.5 million and $1.8 million for the three months ended September 30, 2020 and September 30, 2019, respectively. Pursuant to the terms of the Management Agreement, our Manager is paid a management fee equal to 1.5% per annum of our stockholders’ equity (as defined in the Management Agreement), calculated and payable (in cash) quarterly in arrears. The decrease was mainly attributable to a decline in stockholders' equity, as defined in the agreement, as a result of losses recognized in connection with the asset sales and interest rate swap terminations in March and April 2020.
The management fees, expense reimbursements and the relationship between our Manager and us are discussed further in Note 10, “Related Party Transactions” to the financial statements contained in this Quarterly Report on Form 10-Q.
Other Operating Expenses
We incurred other operating expenses of approximately $1.2 million and $1.6 million for the three months ended September 30, 2020 and September 30, 2019, respectively. Other operating cost is comprised of derivative transaction costs, custody, and asset management/loan servicing fees for loans acquired serving released. The decrease was primarily a result of a a reduction in acquisition transaction costs due to no acquisitions in the quarter ended September 30, 2020 , a smaller bridge loan portfolio, which were acquired servicing released, thereby decreasing the associated third party asset management/ loan servicing fees by approximately $362 thousand. Also there was a decrease of approximately $95 thousand in transaction costs related to derivatives, trustee fees and acquisitions.
General and Administrative Expenses
General and administrative expenses for three months ended September 30, 2020 was $2.7 million, an increase of $693 thousand from the three months ended September 30, 2019. The increase was mainly attributable to an increase in the cost of our D&O insurance.
Comparison of the nine months ended September 30, 2020 to the nine months ended September 30, 2019.
General
Our results of operations for the nine months ended September 30, 2020 were adversely impacted by the COVID-19 pandemic, which created unprecedented market disruption and dislocation. The uncertainty surrounding the pandemic created an extreme lack of liquidity in mortgage markets and when combined with forced selling led to swift and dramatic price declines. The significant decline in value of our investment portfolio resulted in substantial margin calls from our repurchase agreement counterparties. In order to satisfy the margin calls, we sold a significant portion of our investments. We also terminated our interest rate hedges because they were ineffective in the low interest rate environment and it further reduced margin call volatility. The full impact of COVID-19 on our results of operations is still uncertain as it depends on several factors beyond our control including, but not limited to (i) the uncertainty around the severity and duration of the outbreak, (ii) the effectiveness of the United States public health response, (iii) the pandemic’s impact on the U.S. and global economies, (iv) the timing, scope and effectiveness of additional governmental responses to the pandemic, (v) the timing and speed of economic recovery, including the availability of a treatment or vaccination for COVID-19 and (vi) the negative impact on our borrowers, asset values and cost of capital.
Due to the significant amount of investment sales resulting from the market volatility created by the COVID-19 pandemic, our results of operations for the nine months ended September 30, 2020 and September 30, 2019 are not comparable. Although, we continued to make progress towards strengthening our balance sheet, improving liquidity, shareholders equity and the earnings power of the portfolio, we generated a net loss of $339.1 million, or $6.02 per basic and diluted weighted common share for the nine months ended September 30, 2020. We generated net income of $58.2 million, or $1.15 per basic and diluted weighted common share, for the nine months ended September 30, 2019.
Net Interest Income
The following tables set forth certain information regarding our net interest income on our investment portfolio for the nine months ended September 30, 2020 and September 30, 2019 (dollars in thousands):
| | | | | | | | | | | | | | | | | | | | |
| Nine months ended September 30, 2020 | | Average Amortized
Cost of Assets | | Total Interest Income | | Yield on Average Assets |
| | | | | | |
| Investments | | | | | | |
| Agency CMBS | | $ | 458,152 | | | $ | 10,700 | | | 3.12 | % |
| Agency RMBS | | 78,167 | | | 1,983 | | | 3.39 | % |
| Non-Agency CMBS | | 274,878 | | | 16,683 | | | 8.11 | % |
| Non-Agency RMBS | | 33,928 | | | 1,187 | | | 4.67 | % |
| Residential Whole Loans | | 1,277,263 | | | 42,892 | | | 4.49 | % |
| Residential Bridge Loans | | 29,311 | | | 1,542 | | | 7.03 | % |
| Commercial loans | | 340,184 | | | 17,777 | | | 6.98 | % |
| Securitized commercial loans | | 846,243 | | | 34,791 | | | 5.49 | % |
| Other securities | | 57,730 | | | 2,755 | | | 6.37 | % |
| Total investments | | $ | 3,395,856 | | | $ | 130,310 | | | 5.13 | % |
| | | | | | |
| | Average Carrying Value | | Total Interest Expense | | Average Cost of Funds(1) |
| Borrowings | | | | | | |
| Repurchase agreements | | $ | 1,361,985 | | | $ | 31,220 | | | 3.06 | % |
| Convertible senior unsecured notes, net | | 196,826 | | | 12,351 | | | 8.38 | % |
| Securitized debt | | 1,650,091 | | | 50,805 | | | 4.11 | % |
| Total borrowings | | $ | 3,208,902 | | | $ | 94,376 | | | 3.93 | % |
| | | | | | |
Net interest income and net interest margin(2) | | | | $ | 35,934 | | | 1.41 | % |
| | | | | | | | | | | | | | | | | | | | |
| Nine months ended September 30, 2019 | | Average Amortized
Cost of Assets | | Total Interest Income | | Yield on Average Assets |
| | | | | | |
| Investments | | | | | | |
| Agency CMBS | | $ | 1,495,011 | | | $ | 36,547 | | | 3.27 | % |
| Agency RMBS | | 239,969 | | | 6,133 | | | 3.42 | % |
| Non-Agency CMBS | | 204,068 | | | 13,269 | | | 8.69 | % |
| Non-Agency RMBS | | 48,292 | | | 1,960 | | | 5.43 | % |
| Residential Whole Loans | | 1,176,978 | | | 42,819 | | | 4.86 | % |
| Residential Bridge Loans | | 138,100 | | | 7,162 | | | 6.93 | % |
| Commercial loans | | 318,673 | | | 19,392 | | | 8.14 | % |
| Securitized commercial loan | | 852,621 | | | 30,323 | | | 4.75 | % |
| Other securities | | 65,950 | | | 3,898 | | | 7.90 | % |
| Total investments | | $ | 4,539,662 | | | $ | 161,503 | | | 4.76 | % |
| | | | | | |
| | Average Carrying Value | | Total Interest Expense | | Average Cost of Funds(1) |
| Borrowings | | | | | | |
| Repurchase agreements | | $ | 2,853,746 | | | $ | 70,952 | | | 3.32 | % |
| Convertible senior unsecured notes, net | | 118,946 | | | 7,193 | | | 8.09 | % |
| Securitized debt | | 1,255,360 | | | 35,295 | | | 3.76 | % |
| Total borrowings | | $ | 4,228,052 | | | $ | 113,440 | | | 3.59 | % |
| | | | | | |
Net interest income and net interest margin(2) | | | | $ | 48,063 | | | 1.42 | % |
(1) Average cost of funds does not include the interest expense related to our derivatives. In accordance with GAAP, such costs are included in "Gain (loss) on derivative instruments, net" in the Consolidated Statements of Operations.
(2) Since we do not apply hedge accounting, our net interest margin in this table does not reflect the benefit /cost of our interest rate swaps. See Non-GAAP Financial Measure section for net investment income table that includes the benefit/cost from our interest rate swaps.
Interest Income
For the ninethree months ended September 30, 20202021, and September 30, 2019,2020, we earned interest income on our investments of approximately $130.3$40.1 million and $161.5$44.0 million, respectively, a decrease of approximately $31.2$3.8 million. The decrease in interest income was drivena result of payoffs in our commercial investment portfolio and our $90 million commercial mezzanine loan becoming non-performing in May 2021. The decrease was partially offset by the sales ofincrease in the weighted average yield on our portfolio to 5.75% for the three months ended September 30, 2021 from 5.55% for the three months ended September 30, 2020, due to a significantlarger portion of our investment portfolio to meet margin calls. We sold $2.4 billion of investments, mainly in March and April 2020. The majority of the impact of these sales were reflected in interest income in the second and third quarter of 2020. Our portfolio experienced improved valuations and we did not have significant asset sales during the third quarter. While it is difficult to predict the future impact of COVID-19, our principal and interest payments through September 30, 2020 have not been materially impacted.higher yielding investments.
Interest Expense
Interest expense decreased from $113.4$33.9 million for the ninethree months ended September 30, 20192020, to $94.4$33.0 million for the ninethree months ended September 30, 2020.2021. The decrease in interest expense was a result of improved cost of financing from the significant reduction in leverage associated with the sale of $2.4 billion of investments, mainly in Marchimproved terms on our amended residential and April 2020. During the second quarter of 2020, we entered into two newsecurities financing facilities to limitand a decrease in our exposure to short-term mark to market financings. Also, we completedconvertible senior unsecured notes outstanding as a securitizationresult of approximately $355.8 million of our Residential Whole Loans, reducing our recourse leverage by $339.4 million or 46.0%.
Other income (loss), net
Realized gain (loss) on investments,, net
Realized gain (loss) on investments represents the net gain (loss) on sales or settlements from our investment portfolio. To improve liquidity, reduce our repurchase agreement borrowingportfolio and satisfy our margin calls, we sold $2.4 billion in investments mainly in March and April 2020. These sales generated $81.7 million in realized gains. Our portfolio experienced improved valuations and wedebt. We did not have significant asset sales during the third quarter.quarter ended September 30, 2021. However, during the quarter ended September 30, 2021, we repurchased $122.6 million aggregate principal amount of our 2022 Notes. Refer to Note 7 - "Financing" for details.
The following table presents the realized gains (losses) of our investments and debt for each of the ninethree months ended September 30, 20202021 and September 30, 20192020 (dollars in thousands):
| | | | | | | | | | | | | | | | | | | | | | | | | | | | | | | | | | | | | | | | | | | | | | | |
| For the nine months ended September 30, 2020 | | For the nine months ended September 30, 2019 |
| | Proceeds | | Gross Gains | | Gross Losses | | Net Gain (Loss) | | Proceeds | | Gross Gains | | Gross Losses | | Net Gain (Loss) |
| Agency CMBS | $ | 1,668,149 | | | $ | 116,463 | | | $ | (6,486) | | | $ | 109,977 | | | $ | 563,677 | | | $ | 20,268 | | | $ | (4,189) | | | $ | 16,079 | |
Agency RMBS | 400,948 | | | 12,552 | | | (506) | | | 12,046 | | | 205,310 | | | 1,560 | | | — | | | 1,560 | |
| Non-Agency CMBS | 94,586 | | | 1 | | | (22,703) | | | (22,702) | | | 39,453 | | | 317 | | | (1,064) | | | (747) | |
| Non-Agency RMBS | 12,658 | | | — | | | (60) | | | (60) | | | — | | | — | | | — | | | — | |
| Other securities | 35,957 | | | 113 | | | (6,223) | | | (6,110) | | | — | | | — | | | — | | | — | |
| Residential Whole-Loans | 144,259 | | | — | | | (10,511) | | | (10,511) | | | — | | | — | | | — | | | — | |
Residential Bridge Loans(1) | — | | | 8 | | | (376) | | | (368) | | | — | | | 142 | | | (762) | | | (620) | |
Loan transferred to REO(2) | 419 | | | 126 | | | (32) | | | 94 | | | 3,536 | | | 399 | | | (352) | | | 47 | |
| Disposition of REO | 1,763 | | | 18 | | | (698) | | | (680) | | | 219 | | | — | | | (33) | | | (33) | |
| Total | $ | 2,358,739 | | | $ | 129,281 | | | $ | (47,595) | | | $ | 81,686 | | | $ | 812,195 | | | $ | 22,686 | | | $ | (6,400) | | | $ | 16,286 | |
| | | | | | | | | | | | | | | | | | | | | | | | | | | | | | | | | | | | | | | | | | | | | | | |
| | For the three months ended September 30, 2021 | | For the three months ended September 30, 2020 |
| | Proceeds (Payments) | | Gross Gains | | Gross Losses | | Net Gain (Loss) | | Proceeds (Payments) | | Gross Gains | | Gross Losses | | Net Gain (Loss) |
| | | | | | | | | | | | | | | |
| | | | | | | | | | | | | | | |
| | | | | | | | | | | | | | | |
| Non-Agency RMBS | $ | — | | | $ | — | | | $ | — | | | $ | — | | | $ | (44) | | | $ | — | | | $ | (44) | | | $ | (44) | |
| | | | | | | | | | | | | | | |
| | | | | | | | | | | | | | | |
Residential Bridge Loans(1) | — | | | 19 | | | (37) | | | (18) | | | — | | | — | | | (225) | | | (225) | |
Loans transferred to REO(2) | 68 | | | 15 | | | — | | | 15 | | | — | | | — | | | — | | | — | |
| Disposition of REO | 738 | | | 54 | | | — | | | 54 | | | 786 | | | — | | | (271) | | | (271) | |
Convertible senior unsecured notes(3) | (122,330) | | | 165 | | | (1,742) | | | (1,577) | | | — | | | 1,258 | | | — | | | 1,258 | |
| Total | $ | (121,524) | | | $ | 253 | | | $ | (1,779) | | | $ | (1,526) | | | $ | 742 | | | $ | 1,258 | | | $ | (540) | | | $ | 718 | |
(1)Realized gains/losses recognized on the final settlement of the loans.
(2)Realized gains/losses recognized on the transfer of Residential Bridge Loans to REO. Proceeds represent the fair value less estimated selling costs of the real estate on the date of transfer.
(3)Realized gains/losses recognized on the extinguishment of convertible senior notes.
Unrealized gain (loss), net
Our investments, and securitized debt, for which we have elected the fair value option are recorded at fair value with the periodic changes in fair value being recorded in earnings. The change in unrealized gain (loss) is directly attributable to
changes in market pricing on the underlying investments and securitized debt during the period. The residential credit markets improved in the three months ended September 30, 2020 and three months ended September 30, 2021 resulting in improved valuations. However, our commercial real estate investments suffered from lower valuation in the three months ended September 30, 2021.
The following table presents the net unrealized gains (losses) we recorded on our investments and securitized debt (dollars in thousands):
| | | | | | | | | | | |
| | Three months ended September 30, 2021 | | Three months ended September 30, 2020 |
| | | |
| Agency RMBS | $ | (3) | | | $ | (9) | |
| Non-Agency CMBS | (2,980) | | | 5,873 | |
| Non-Agency RMBS | 2,241 | | | (856) | |
| Residential Whole Loans | (2,394) | | | 48,307 | |
| Residential Bridge Loans | 175 | | | 410 | |
| Commercial loans | (5,494) | | | 2,194 | |
| Securitized commercial loans | (9,616) | | | 4,567 | |
| Other securities | 930 | | | 1,602 | |
| Securitized debt | 11,138 | | | (7,523) | |
| REO | — | | | 125 | |
| | | |
| Total | $ | (6,003) | | | $ | 54,690 | |
Gain (loss) on derivatives, net
In March 2020, we effectively terminated all of our fixed-pay interest rate swaps and our variable-pay interest rate swaps to reduce hedging costs and associated margin volatility. As of September 30, 2021, we had interest rate swaps with a notional amount of $22.0 million. Our hedging strategy is designed to mitigate our exposure to interest rate volatility.
The following table presents the components of gain (loss) on derivatives for the three months ended September 30, 2021 and September 30, 2020 (dollars in thousands):
| | | | | | | | | | | | | | | | | | | | | | | | | | | | | | | | | | | | | | |
| | Realized Gain (Loss), net | | | | | | | | |
| Description | | Other Settlements / Expirations | | Variation Margin Settlement | | Return (Recovery) of Basis | | Mark-to-Market | | Contractual interest income (expense), net(1) | | Total |
| Three months ended September 30, 2021 | | | | | | | | | | | | |
| Interest rate swaps | | $ | — | | | $ | 485 | | | $ | — | | | $ | (71) | | | $ | 96 | | | $ | 510 | |
| | | | | | | | | | | | |
| Agency and Non-Agency Interest-Only Strips— accounted for as derivatives | | — | | | — | | | (59) | | | (90) | | | 82 | | | (67) | |
| | | | | | | | | | | | |
| | | | | | | | | | | | |
| | | | | | | | | | | | |
| | | | | | | | | | | | |
| | | | | | | | | | | | |
| Credit default swaps | | 16 | | | — | | | — | | | 56 | | | — | | | 72 | |
| | | | | | | | | | | | |
| Total | | $ | 16 | | | $ | 485 | | | $ | (59) | | | $ | (105) | | | $ | 178 | | | $ | 515 | |
| | | | | | | | | | | | |
| Three months ended September 30, 2020 | | | | | | | | | | | | |
| | | | | | | | | | | | |
| | | | | | | | | | | | |
| Agency and Non-Agency Interest-Only Strips— accounted for as derivatives | | $ | — | | | $ | — | | | $ | (166) | | | $ | 71 | | | $ | 200 | | | $ | 105 | |
| | | | | | | | | | | | |
| | | | | | | | | | | | |
| | | | | | | | | | | | |
| | | | | | | | | | | | |
| Credit default swaps | | 166 | | | — | | | — | | | (359) | | | — | | | (193) | |
| | | | | | | | | | | | |
| Total | | $ | 166 | | | $ | — | | | $ | (166) | | | $ | (288) | | | $ | 200 | | | $ | (88) | |
(1)Contractual interest income (expense), net on derivative instruments includes interest settlement paid or received.
Other, net
For the three months ended September 30, 2021 and September 30, 2020, "Other, net" was a income of $277 thousand and a loss of $31 thousand, respectively. The balance is mainly comprised of income on cash balances, miscellaneous net interest income (expense) on cash collateral for our repurchase agreements and derivatives, and miscellaneous fees and expenses on residential mortgage loans.
Expenses
Management Fee
We incurred management fee expense of approximately $1.5 million and $1.5 million for the three months ended September 30, 2021 and September 30, 2020, respectively. Pursuant to the terms of the Management Agreement, our Manager is paid a management fee equal to 1.5% per annum of our stockholders’ equity (as defined in the Management Agreement), calculated and payable (in cash) quarterly in arrears.
The management fees, expense reimbursements and the relationship between our Manager and us are discussed further in Note 10, “Related Party Transactions” to the financial statements contained in this Quarterly Report on Form 10-Q.
Other Operating Expenses
We incurred other operating expenses of approximately $1.3 million and $1.2 million for the three months ended September 30, 2021, and September 30, 2020, respectively. Other operating costs comprise derivative transaction costs, custody, and asset management/loan servicing fees for loans acquired serving released. The increase was primarily due to transaction costs associated with the foreclosure of one of our commercial loans. The hotel REO is held in an SPE in which we have a majority interest and which we consolidate.
General and Administrative Expenses
General and administrative expenses for the three months ended September 30, 2021 was $2.3 million, a decrease of $361 thousand from $2.7 million for the three months ended September 30, 2020. The decrease was mainly attributable to a decrease in the cost of our D&O insurance.
Comparison of the nine months ended September 30, 2021 to the nine months ended September 30, 2020
General
During the nine months ended September 30, 2021, our results of operations continued to be impacted by ongoing market disruption and dislocation due to the COVID-19 pandemic. In 2021, our portfolio generally experienced improved valuations and earnings. However, the recovery of the commercial mortgage sector, mainly retail and hospitality, has lagged the residential mortgage sector. We expect improvement in the retail and hospitality mortgage markets as the economy reopens, which in turn should improve valuations. However, there is no assurance that this will be the case. Certain of our commercial investments benefited from some improvement in the commercial mortgage markets resulting in $157.3 million in payoffs from three commercial loans, a CMBS bond, and a risk retention bond. We deployed the capital to acquire $243.3 million in Non_QM loans and buy back a portion of our 2022 Notes. We did not sell a material amount of assets or receive significant margin calls during the nine months ended September 30, 2021.
Due to the significant amount of investment sales in the first half of 2020 resulting from the market volatility created by the COVID-19 pandemic, our results of operations for the nine months ended September 30, 2021 and September 30, 2020 may not be comparable.
We continued to make progress towards strengthening our balance sheet and improving liquidity. For the nine months ended September 30, 2021, we generated a net loss of $36.7 million, or $0.60 per basic and diluted weighted common share. The key driver of the net loss was the $52.8 million decline in the fair value of our $90.0 million non-performing commercial mezzanine loan collateralized by the Property. For the nine months ended September 30, 2020, due to a significant decline in
asset values created by the uncertainty surrounding the pandemic, we generated a net loss of $339.1 million, or $6.02 per basic and diluted weighted common share.
Net Interest Income
The following tables set forth certain information regarding our net interest income on our investment portfolio for the nine months ended September 30, 2021 and September 30, 2020 (dollars in thousands):
| | | | | | | | | | | | | | | | | | | | |
| Nine months ended September 30, 2021 | | Average Amortized
Cost of Assets | | Total Interest Income | | Yield on Average Assets |
| | | | | | |
| Investments | | | | | | |
| | | | | | |
| Agency RMBS | | $ | 89 | | | $ | 12 | | | 18.03 | % |
| Non-Agency CMBS | | 202,937 | | | 13,401 | | | 8.83 | % |
| Non-Agency RMBS | | 29,270 | | | 1,058 | | | 4.83 | % |
| Residential Whole Loans | | 883,711 | | | 25,724 | | | 3.89 | % |
| Residential Bridge Loans | | 11,383 | | | 806 | | | 9.47 | % |
| Commercial loans | | 297,593 | | | 11,263 | | | 5.06 | % |
| Securitized commercial loans | | 1,487,050 | | | 72,586 | | | 6.53 | % |
| Other securities | | 49,355 | | | 2,503 | | | 6.78 | % |
| Total investments | | $ | 2,961,388 | | | $ | 127,353 | | | 5.75 | % |
| | | | | | |
| | Average Carrying Value | | Total Interest Expense | | Average Cost of Funds(1) |
| Borrowings | | | | | | |
| Repurchase agreements | | $ | 364,009 | | | $ | 9,755 | | | 3.58 | % |
| Convertible senior unsecured notes, net | | 159,862 | | | 10,056 | | | 8.41 | % |
| Securitized debt | | 2,170,148 | | | 84,541 | | | 5.21 | % |
| Total borrowings | | $ | 2,694,019 | | | $ | 104,352 | | | 5.18 | % |
| | | | | | |
Net interest income and net interest margin(2) | | | | $ | 23,001 | | | 1.04 | % |
| | | | | | | | | | | | | | | | | | | | |
| Nine months ended September 30, 2020 | | Average Amortized
Cost of Assets | | Total Interest Income | | Yield on Average Assets |
| | | | | | |
| Investments | | | | | | |
| Agency CMBS | | $ | 458,152 | | | $ | 10,700 | | | 3.12 | % |
| Agency RMBS | | 78,167 | | | 1,983 | | | 3.39 | % |
| Non-Agency CMBS | | 274,878 | | | 16,683 | | | 8.11 | % |
| Non-Agency RMBS | | 33,928 | | | 1,187 | | | 4.67 | % |
| Residential Whole Loans | | 1,277,263 | | | 42,892 | | | 4.49 | % |
| Residential Bridge Loans | | 29,311 | | | 1,542 | | | 7.03 | % |
| Commercial loans | | 340,184 | | | 17,777 | | | 6.98 | % |
| Securitized commercial loan | | 846,243 | | | 34,791 | | | 5.49 | % |
| Other securities | | 57,730 | | | 2,755 | | | 6.37 | % |
| Total investments | | $ | 3,395,856 | | | $ | 130,310 | | | 5.13 | % |
| | | | | | |
| | Average Carrying Value | | Total Interest Expense | | Average Cost of Funds(1) |
| Borrowings | | | | | | |
| Repurchase agreements | | $ | 1,361,985 | | | $ | 31,220 | | | 3.06 | % |
| Convertible senior unsecured notes, net | | 196,826 | | | 12,351 | | | 8.38 | % |
| Securitized debt | | 1,650,091 | | | 50,805 | | | 4.11 | % |
| Total borrowings | | $ | 3,208,902 | | | $ | 94,376 | | | 3.93 | % |
| | | | | | |
Net interest income and net interest margin(2) | | | | $ | 35,934 | | | 1.41 | % |
(1) Average cost of funds does not include the interest expense related to our derivatives. In accordance with GAAP, such costs are included in "Gain (loss) on derivative instruments, net" in the Consolidated Statements of Operations.
(2) Since we do not apply hedge accounting, our net interest margin in this table does not reflect the benefit /cost of our interest rate swaps. See Non-
Interest Income
For the nine months ended September 30, 2021, and September 30, 2020, we earned interest income on our investments of approximately $127.4 million and $130.3 million, respectively, a decrease of approximately $3.0 million. A smaller investment portfolio from sales in the first six months of 2020, 2021 payoffs in our residential and commercial investments and our $90 million commercial mezzanine loan becoming non-performing in May 2021 mainly drove the decrease in interest income. The consolidation of CSMC USA as of August 1, 2020 and the 2021 acquisition of $243.3 million in Non_QM loans partially offset the decline in interest income.
Interest Expense
Interest expense increased from $94.4 million for the nine months ended September 30, 2020, to $104.4 million for the nine months ended September 30, 2021. The increase in interest expense was mainly a result of the consolidation of CSMC USA, which increased interest expense by $46.9 million. The increase was partially offset by a decline in recourse leverage from a smaller investment portfolio, improved cost of financing from our 2020 residential whole loan securitization, improved terms on our amended residential and securities financing facilities, repurchases of our 2022 Notes and securitized debt paydowns.
Other income (loss), net
Realized gain (loss) on investments, net
Realized gain (loss) on investments represents the net gain (loss) on sales or settlements from our investment portfolio and debt. We did not have a significant amount of asset sales. However, during the nine months ended September 30, 2021, we repurchased $129.3 million of our 2022 Notes. Refer to Note 7 - "Financing" for details. For the nine months ended September 30, 2020, we sold $2.4 billion in investments in order to improve liquidity, reduce our repurchase agreement borrowing, and satisfy our margin calls. These sales generated $82.9 million in realized gains.
The following table presents the realized gains (losses) of our investments and debt for each of the nine months ended September 30, 2021 and September 30, 2020 (dollars in thousands):
| | | | | | | | | | | | | | | | | | | | | | | | | | | | | | | | | | | | | | | | | | | | | | | |
| For the nine months ended September 30, 2021 | | For the nine months ended September 30, 2020 |
| | Proceeds (Payments) | | Gross Gains | | Gross Losses | | Net Gain (Loss) | | Proceeds (Payments) | | Gross Gains | | Gross Losses | | Net Gain (Loss) |
| Agency CMBS | $ | — | | | $ | — | | | $ | — | | | $ | — | | | $ | 1,668,149 | | | $ | 116,463 | | | $ | (6,486) | | | $ | 109,977 | |
Agency RMBS | — | | | — | | | — | | | — | | | 400,948 | | | 12,552 | | | (506) | | | 12,046 | |
| Non-Agency CMBS | — | | | — | | | (5,929) | | | (5,929) | | | 94,586 | | | 1 | | | (22,703) | | | (22,702) | |
| Non-Agency RMBS | — | | | — | | | — | | | — | | | 12,658 | | | — | | | (60) | | | (60) | |
| Other securities | — | | | — | | | — | | | — | | | 35,957 | | | 113 | | | (6,223) | | | (6,110) | |
| Residential Whole-Loans | — | | | — | | | — | | | — | | | 144,259 | | | — | | | (10,511) | | | (10,511) | |
Residential Bridge Loans(1) | — | | | 19 | | | (153) | | | (134) | | | — | | | 8 | | | (376) | | | (368) | |
Loan transferred to REO(2) | 752 | | | 15 | | | (36) | | | (21) | | | 419 | | | 126 | | | (32) | | | 94 | |
| Disposition of REO | 738 | | | 54 | | | — | | | 54 | | | 1,763 | | | 18 | | | (698) | | | (680) | |
Convertible senior unsecured notes(3) | (128,645) | | | 405 | | | (1,742) | | | (1,337) | | | — | | | 1,258 | | | — | | | 1,258 | |
| Total | $ | (127,155) | | | $ | 493 | | | $ | (7,860) | | | $ | (7,367) | | | $ | 2,358,739 | | | $ | 130,539 | | | $ | (47,595) | | | $ | 82,944 | |
(1)Realized gains/losses recognized on the final settlement of the loans.
(2)Realized gains/losses recognized on the transfer of Residential Bridge Loans to REO. Proceeds represent the fair value less estimated selling costs of the real estate on the date of transfer.
(3)Realized gains/losses recognized on the extinguishment of convertible senior notes.
Unrealized gain (loss), net
Our investments, and securitized debt, for which we have elected the fair value option are recorded at fair value with the periodic changes in fair value being recorded in earnings. The change in unrealized gain (loss) is directly attributable to changes in market pricing on the underlying investments and securitized debt during the period. The
We recognized an unrealized loss of $39.3 million for the nine months ended September 30, 2021, mainly driven by a commercial mezzanine loan and our Non-Agency CMBS investments. During the nine months ended September 30, 2021, the fair value of the commercial mezzanine loan declined significantly, and we recognized an unrealized loss of $52.8 million, which reflected the new facts and circumstances that unfolded in the period. Generally, we saw a recovery in asset prices across our residential investments.
We recognized an unrealized loss of $225.4 million for the nine months ended September 30, 2020, driven by the extreme lack of liquidity in mortgage markets combined with forced selling led to swift and dramatic price declines in the first quarter of 2020. While we have seen some price recovery of certain investments in the second and third quarters,quarter of 2020, the recoveryrally was not sufficient to significantly reduce the substantial unrealized loss from the dramatic price declines in the first quarter of 2020.
The following table presents the net unrealized gains (losses) we recorded on our investments and securitized debt (dollars in thousands):
| | | | Nine months ended September 30, 2020 | | Nine months ended September 30, 2019 | | Nine months ended September 30, 2021 | | Nine months ended September 30, 2020 |
| Agency CMBS | Agency CMBS | $ | (61,034) | | | $ | 129,670 | | Agency CMBS | $ | — | | | $ | (61,034) | |
| Agency RMBS | Agency RMBS | (9,138) | | | 7,923 | | Agency RMBS | 16 | | | (9,138) | |
| Non-Agency CMBS | Non-Agency CMBS | (52,180) | | | 2,969 | | Non-Agency CMBS | (16,254) | | | (52,180) | |
| Non-Agency RMBS | Non-Agency RMBS | (5,490) | | | 494 | | Non-Agency RMBS | 3,710 | | | (5,490) | |
| Residential Whole Loans | Residential Whole Loans | (25,568) | | | 17,260 | | Residential Whole Loans | 13,667 | | | (25,568) | |
| Residential Bridge Loans | Residential Bridge Loans | (289) | | | 183 | | Residential Bridge Loans | 639 | | | (289) | |
| Commercial loans | Commercial loans | (7,218) | | | 299 | | Commercial loans | (48,630) | | | (7,218) | |
| Securitized commercial loans | Securitized commercial loans | (109,683) | | | 1,076 | | Securitized commercial loans | 107,423 | | | (109,683) | |
| Other securities | Other securities | (15,608) | | | 1,632 | | Other securities | 4,553 | | | (15,608) | |
| Securitized debt | Securitized debt | 60,827 | | | (1,306) | | Securitized debt | (104,395) | | | 60,827 | |
| | Other liabilities | — | | | 225 | | |
| | Total | Total | $ | (225,381) | | | $ | 160,425 | | Total | $ | (39,271) | | | $ | (225,381) | |
Gain (loss) on derivatives, net
In March 2020, we effectively terminated all of our fixed-pay interest rate swaps and variable-pay interest rate swaps to reduce hedging costs and associated margin volatility. The effectsAs of the termination is reflected in the table below for the nine months ended September 30, 2020 in Realized Gain (Loss), net.2021, we had interest rate swaps with a notional amount of $22.0 million. Our hedging strategy is designed to mitigate our exposure to interest rate volatility.
The following table presents the components of gain (loss) on derivatives for the nine months ended September 30, 20202021 and September 30, 20192020 (dollars in thousands):
| | | Realized Gain (Loss), net | | | Realized Gain (Loss), net | |
| Description | Description | | Other Settlements / Expirations | | Variation Margin Settlement | | Return (Recovery) of Basis | | Mark-to-Market | | Contractual interest income (expense), net(1) | | Total | Description | | Other Settlements / Expirations | | Variation Margin Settlement | | Return (Recovery) of Basis | | Mark-to-Market | | Contractual interest income (expense), net(1) | | Total |
| Nine months ended September 30, 2021 | | Nine months ended September 30, 2021 | | | | | | | | | | | | |
| Interest rate swaps | | Interest rate swaps | | $ | — | | | $ | 520 | | | $ | — | | | $ | (25) | | | $ | 172 | | | $ | 667 | |
| | Agency and Non-Agency Interest-Only Strips— accounted for as derivatives | | Agency and Non-Agency Interest-Only Strips— accounted for as derivatives | | — | | | — | | | (232) | | | (124) | | | 305 | | | (51) | |
| | Credit default swaps | | Credit default swaps | | 48 | | | — | | | — | | | 52 | | | — | | | 100 | |
| | Total | | Total | | $ | 48 | | | $ | 520 | | | $ | (232) | | | $ | (97) | | | $ | 477 | | | $ | 716 | |
| | Nine months ended September 30, 2020 | Nine months ended September 30, 2020 | | | | | | | | | | | | | Nine months ended September 30, 2020 | |
| Interest rate swaps | Interest rate swaps | | $ | (262) | | | $ | (179,759) | | | $ | 262 | | | $ | (2,515) | | | $ | (1,395) | | | $ | (183,669) | | Interest rate swaps | | $ | (262) | | | $ | (179,759) | | | $ | 262 | | | $ | (2,515) | | | $ | (1,395) | | | $ | (183,669) | |
| Interest rate swaptions | Interest rate swaptions | | 80 | | | — | | | — | | | — | | | — | | | 80 | | Interest rate swaptions | | 80 | | | — | | | — | | | — | | | — | | | 80 | |
| Agency and Non-Agency Interest-Only Strips— accounted for as derivatives | Agency and Non-Agency Interest-Only Strips— accounted for as derivatives | | (940) | | | — | | | (982) | | | (512) | | | 1,176 | | | (1,258) | | Agency and Non-Agency Interest-Only Strips— accounted for as derivatives | | (940) | | | — | | | (982) | | | (512) | | | 1,176 | | | (1,258) | |
| | Credit default swaps | Credit default swaps | | (9,550) | | | — | | | — | | | (2,023) | | | — | | | (11,573) | | Credit default swaps | | (9,550) | | | — | | | — | | | (2,023) | | | — | | | (11,573) | |
| TBAs | TBAs | | (2,430) | | | — | | | — | | | 928 | | | — | | | (1,502) | | TBAs | | (2,430) | | | — | | | — | | | 928 | | | — | | | (1,502) | |
| Total | Total | | $ | (13,102) | | | $ | (179,759) | | | $ | (720) | | | $ | (4,122) | | | $ | (219) | | | $ | (197,922) | | Total | | $ | (13,102) | | | $ | (179,759) | | | $ | (720) | | | $ | (4,122) | | | $ | (219) | | | $ | (197,922) | |
| | Nine months ended September 30, 2019 | | |
| Interest rate swaps | | $ | (714) | | | $ | (152,559) | | | $ | 4,859 | | | $ | (453) | | | $ | 4,989 | | | $ | (143,878) | | |
| Interest rate swaptions | | (332) | | | — | | | — | | | — | | | — | | | (332) | | |
| Agency and Non-Agency Interest-Only Strips— accounted for as derivatives | | — | | | — | | | (1,840) | | | (460) | | | 2,326 | | | 26 | | |
| Options | | 1,378 | | | — | | | — | | | — | | | — | | | 1,378 | | |
| Futures contracts | | (6,720) | | | — | | | — | | | 3,947 | | | — | | | (2,773) | | |
| | Credit default swaps | | (414) | | | — | | | — | | | 259 | | | — | | | (155) | | |
| | Total | | $ | (6,802) | | | $ | (152,559) | | | $ | 3,019 | | | $ | 3,293 | | | $ | 7,315 | | | $ | (145,734) | | |
(1)Contractual interest income (expense), net on derivative instruments includes interest settlement paid or received.
Other, net
For the nine months ended September 30, 20202021 and September 30, 2019,2020, "Other, net" was income of $385$449 thousand and $1.7 million,income of $385 thousand, respectively. The balance is mainly comprised of income on cash balances, miscellaneous net interest income (expense) on cash collateral for our repurchase agreements and derivatives and miscellaneous fees collected on residential mortgage loans.
Expenses
Management Fee
We incurred management fee expense of approximately $3.0$4.5 million and $5.4$3.0 million for the nine months ended September 30, 20202021 and September 30, 2019,2020, respectively. Pursuant to the terms of the Management Agreement, our Manager is paid a management fee equal to 1.5% per annum of our stockholders’ equity (as defined in the Management Agreement), calculated and payable (in cash) quarterly in arrears. The decreaseincrease was mainly attributable to our Manager waiving the management fee from March 2020 to May 2020 as a result of the impact of COVID-19 and the disruption in the mortgage markets. Future waivers, if any, are at the Manager's discretion. In addition, asset sales mainly in March and April 2020 resulted in losses that reduced stockholders' equity that is used to calculate the management fee.
The management fees, expense reimbursements and the relationship between our Manager and us are discussed further in Note 10, “Related Party Transactions” to the financial statements contained in this Quarterly Report on Form 10-Q.
Financing Fee
In the second quarternine months ended September 30, 2020, in order to manage the severe market conditions and the resulting large margin demands from lenders and pressure on our liquidity, we entered into a longer term financing arrangement for our Residential Whole Loans, as our sortwe sought to reduce our exposure to short-term financings with daily mark to market exposure. Under this agreement, we arewere required to pay the counterparty a 30% premium recapture fee of 30% of all realized value on any residential whole loans above such counterparty’s amortized basis upon the securitization or sale.
On June 29, 2020, we securitized approximately $355.8 million of the Residential Whole Loans and paid down the facility by approximately $339.4 million (see "Securitized"—Securitized Debt" below for additional details). As noted above, as part of the financing arrangements, we agreed to pay the lender a fee of 30% of all realized value on the Residential Whole Loans above the counterparty's amortized basis upon securitization or sale. As a result of refinancing the Residential Whole Loans through a securitization, we accrued a premium recapture fee of approximately $20.5 million which is payable atin the maturitynine months ended September 30, 2020.
In October 2020, the residential financing facility was amended and as part of the facility. However, in connection with an amendment to this facility effective October 6, 2020, we paid $12 million of the fee with the balance of $8.5 million due on the new maturity if the facility on October 5, 2021. The amendment also eliminated the the premium recapture fee was eliminated for assetsnew and remaining investments financed under the amended facility.
Other Operating Expenses
We incurred other operating expenses of approximately $3.0$2.1 million and $4.4$3.0 million for the nine months ended September 30, 20202021 and September 30, 2019,2020, respectively. Other operating cost is comprised of derivative transaction costs, custody, and asset management/loan servicing fees for loans acquired serving released. The decrease was primarily a result of a smaller bridge loan portfolio, which were acquired servicing released, thereby decreasing the associateddecrease in third party asset management/loan servicing fees by approximately $1.0 million. In addition we incurred lower acquisition transaction costs, due to no acquisitions in the second and third quarters and lower derivative derivative commissions and fees due to no new derivative transactions since we terminated our interest rate swaps in March 2020.special servicing fees.
General and Administrative Expenses
General and administrative expenses for nine months ended September 30, 2020 was2021 were $7.6 million, a decrease of $539 thousand from $8.2 million, an increase of $2.3 million from $5.9 million for the nine months ended September 30, 2019.2020. The increasedecrease was mainly attributable to an increasea reduction in professional fees which was partially offset by higher D&O insurance and legal fees incurred.insurance.
Non-GAAP Financial Measures
We believe that our non-GAAP measures (described below), when considered with GAAP, provide supplemental information useful to investors in evaluating the results of our operations. Our presentations of such non-GAAP measures may not be comparable to similarly-titled measures of other companies, who may use different calculations. As a result, such non-GAAP measures should not be considered as substitutes for our GAAP net income, as measures of our financial performance or any measure of our liquidity under GAAP.
Distributable Earnings (formerly referred to as Core Earnings
Core EarningsEarnings) is a non-GAAP financial measure that is used by us to approximate cash yield or income associated with our portfolio and is defined as GAAP net income (loss) as adjusted, excluding: (i) net realized gain (loss) on investments and termination of derivative contracts; (ii) net unrealized gain (loss) on investments and debt; (iii) net unrealized gain (loss) resulting from mark-to-market adjustments on derivative contracts; (iv) other than temporary impairment; (v) provision for income taxes; (vi) non-cash stock-based compensation expense; (vii) non-cash amortization of the convertible senior unsecured notes discount; (viii) one-time charges such as acquisition costs and impairment on loans; and (ix) one-time events pursuant to changes in GAAP and certain other non-cash charges after discussions between us, our Manager and our independent directors and after approval by a majority of our independent directors.
We utilize CoreDistributable Earnings as a key metric to evaluate the effective yield of the portfolio. CoreDistributable Earnings allows us to reflect the net investment income of our portfolio as adjusted to reflect the net interest rate swap interest expense. CoreDistributable Earnings allows us to isolate the interest expense associated with our interest rate swaps in order to monitor and project our borrowing costs and interest rate spread. It is one metric of several used in determining the appropriate distributions to our shareholders.
In March and April 2020, we sold $2.4 billion of investments. The majority of the impact of these sales were reflected in net income in the second and third quarters of 2020. Due to the significant amount of investment sales resulting from the market volatility created by the COVID-19 pandemic, our coredistributable earnings for the three and nine months ended September 30, 20202021 and September 30, 2019 are2020 may not be comparable.
The table below reconciles Net Income to CoreDistributable Earnings for the three and nine months ended September 30, 20202021 and September 30, 2019:2020:
| | | | | | | | | | | | | | | | | | | | | | | | | | |
| (dollars in thousands) | | Three months ended September 30, 2021 | | Three months ended September 30, 2020 | | Nine months ended September 30, 2021 | | Nine months ended September 30, 2020 |
| Net income (loss) attributable to common stockholders and participating securities | | $ | (4,213) | | | $ | 59,807 | | | $ | (36,423) | | | $ | (339,144) | |
| Income tax provision (benefit) | | (218) | | | 205 | | | (19) | | | 367 | |
| Net income (loss) before income taxes | | (4,431) | | | 60,012 | | | (36,442) | | | (338,777) | |
| | | | | | | | |
| Adjustments: | | | | | | | | |
| Investments: | | | | | | | | |
| Unrealized (gain) loss on investments, securitized debt and other liabilities | | 6,003 | | | (54,690) | | | 39,271 | | | 225,381 | |
| Realized (gain) loss on investments | | (51) | | | 540 | | | 6,030 | | | (81,686) | |
| | | | | | | | |
| | | | | | | | |
| One-time transaction costs | | 681 | | | 57 | | | 781 | | | 20,989 | |
| | | | | | | | |
| Derivative Instruments: | | | | | | | | |
| Net realized (gain) loss on derivatives | | (485) | | | (154) | | | (520) | | | 193,154 | |
| Net unrealized loss on derivatives | | 105 | | | 288 | | | 97 | | | 4,122 | |
| | | | | | | | |
| Other: | | | | | | | | |
| Realized (gain) loss on extinguishment of convertible senior unsecured notes | | 1,577 | | | (1,258) | | | 1,337 | | | (1,258) | |
| Amortization of discount on convertible senior unsecured notes | | 228 | | | 284 | | | 712 | | | 830 | |
| Other non-cash adjustments | | — | | | 1,130 | | | 977 | | | 2,118 | |
| Non-cash stock-based compensation expense | | 165 | | | 182 | | | 453 | | | 517 | |
| Total adjustments | | 8,223 | | | (53,621) | | | 49,138 | | | 364,167 | |
| Distributable Earnings | | $ | 3,792 | | | $ | 6,391 | | | $ | 12,696 | | | $ | 25,390 | |
| | | | | | | | | | | | | | | | | | | | | | | | | | |
| (dollars in thousands) | | Three months ended September 30, 2020 | | Three months ended September 30, 2019 | | Nine months ended September 30, 2020 | | Nine months ended September 30, 2019 |
| Net income (loss) attributable to common stockholders and participating securities | | $ | 59,807 | | | $ | 19,720 | | | $ | (339,144) | | | $ | 58,210 | |
| Income tax (benefit) provision | | 205 | | | (55) | | | 367 | | | 435 | |
| Net income (loss) before income taxes | | 60,012 | | | 19,665 | | | (338,777) | | | 58,645 | |
| | | | | | | | |
| Adjustments: | | | | | | | | |
| Investments: | | | | | | | | |
| Unrealized (gain) loss on investments, securitized debt and other liabilities | | (54,690) | | | (35,030) | | | 225,381 | | | (160,425) | |
| Other than temporary impairment | | — | | | 1,819 | | | — | | | 6,346 | |
| Realized (gain) loss on sale of investments | | (718) | | | (21,399) | | | (82,944) | | | (16,286) | |
| | | | | | | | |
| | | | | | | | |
| One-time transaction costs | | 57 | | | 531 | | | 20,989 | | | 930 | |
| | | | | | | | |
| Derivative Instruments: | | | | | | | | |
| Net realized (gain) loss on derivatives | | (154) | | | 51,577 | | | 193,154 | | | 159,487 | |
| Net unrealized (gain) loss on derivatives | | 288 | | | (2,499) | | | 4,122 | | | (3,293) | |
| | | | | | | | |
| Amortization of discount on convertible senior unsecured notes | | 284 | | | 186 | | | 830 | | | 461 | |
| Other non-cash adjustments | | 1,130 | | | — | | | 2,118 | | | — | |
| Non-cash stock-based compensation expense | | 182 | | | 164 | | | 517 | | | 399 | |
| Total adjustments | | (53,621) | | | (4,651) | | | 364,167 | | | (12,381) | |
| Core Earnings | | $ | 6,391 | | | $ | 15,014 | | | $ | 25,390 | | | $ | 46,264 | |
Alternatively, our CoreDistributable Earnings can also be derived as presented in the table below by starting with Adjusted net interest income, which includes interest income on Interest-Only Strips accounted for as derivatives and other derivatives, and net interest expense incurred on interest rate swaps and foreign currency swaps and forwards (a Non-GAAP financial measure) subtracting Total expenses, adding Non-cash stock based compensation, adding one-time transaction costs, adding amortization of discount on convertible senior notes and adding interest income on cash balances and other income (loss), net:
| | | | | | | | | | | | | | | | | | | | | | | | | | |
| (dollars in thousands) | | Three months ended September 30, 2021 | | Three months ended September 30, 2020 | | Nine months ended September 30, 2021 | | Nine months ended September 30, 2020 |
| Net interest income | | $ | 7,163 | | | $ | 10,117 | | | $ | 23,001 | | | $ | 35,934 | |
| Interest income from IOs and IIOs accounted for as derivatives | | 23 | | | 34 | | | 73 | | | 194 | |
| Net interest income (expense) from interest rate swaps | | 96 | | | — | | | 172 | | | (1,133) | |
| Adjusted net interest income | | 7,282 | | | 10,151 | | | 23,246 | | | 34,995 | |
| Total expenses | | (5,128) | | | (5,392) | | | (14,237) | | | (34,731) | |
| Other non-cash adjustments | | — | | | 1,130 | | | 977 | | | 2,118 | |
| Non-cash stock-based compensation | | 165 | | | 182 | | | 453 | | | 517 | |
| One-time transaction costs | | 681 | | | 57 | | | 781 | | | 20,989 | |
| Amortization of discount on convertible unsecured senior notes | | 228 | | | 284 | | | 712 | | | 830 | |
| Interest income on cash balances and other income (loss), net | | 293 | | | (19) | | | 497 | | | 678 | |
| Income attributable to non-controlling interest | | 271 | | | (2) | | | 267 | | | (6) | |
| Distributable Earnings | | $ | 3,792 | | | $ | 6,391 | | | $ | 12,696 | | | $ | 25,390 | |
| | | | | | | | | | | | | | | | | | | | | | | | | | |
| (dollars in thousands) | | Three months ended September 30, 2020 | | Three months ended September 30, 2019 | | Nine months ended September 30, 2020 | | Nine months ended September 30, 2019 |
| Net interest income | | $ | 10,117 | | | $ | 16,570 | | | $ | 35,934 | | | $ | 48,063 | |
| Interest income from IOs and IIOs accounted for as derivatives | | 34 | | | 133 | | | 194 | | | 486 | |
| Net interest (expense) income from interest rate swaps | | — | | | 1,715 | | | (1,133) | | | 9,848 | |
| Adjusted net interest income | | 10,151 | | | 18,418 | | | 34,995 | | | 58,397 | |
| Total expenses | | (5,392) | | | (5,377) | | | (34,731) | | | (15,735) | |
| Other non-cash adjustments | | 1,130 | | | — | | | 2,118 | | | — | |
| Non-cash stock-based compensation | | 182 | | | 164 | | | 517 | | | 399 | |
| One-time transaction costs | | 57 | | | 531 | | | 20,989 | | | 930 | |
| Amortization of discount on convertible unsecured senior notes | | 284 | | | 186 | | | 830 | | | 461 | |
| Interest income on cash balances and other income (loss), net | | (19) | | | 1,092 | | | 678 | | | 1,812 | |
| Income attributable to non-controlling interest | | (2) | | | — | | | (6) | | | — | |
| Core Earnings | | $ | 6,391 | | | $ | 15,014 | | | $ | 25,390 | | | $ | 46,264 | |
Revision of Core Earnings for the three and six months ended June 30, 2020
As discussed further in Note 2 - "Basis of Presentation and Summary of Significant Accounting Policies", we have elected to revise our presentation of Core Earnings for the three and six months ended June 30, 2020 in this quarterly financial statements on Form 10-Q to correct this errors.
The following tables reflect the effect of these error on individual line items of the reconciliation of Net Income (Loss) to Core Earnings:
| | | | | | | | | | | | | | | | | | | | | | | | | | |
| | For the three months ended June 30, 2020 |
| Dollars in thousands | | As Originally Reported | | Adjustments | | Revised | | Change % |
| Core Earnings (effect on individual line items) | | | | | | | | |
| Net income (loss) attributable to common shareholders and participating securities | | (15,635) | | | (1,459) | | | (17,094) | | | 9.3 | % |
| Net income (loss) before income taxes | | (15,380) | | | (1,459) | | | (16,839) | | | 9.5 | % |
| Core Earnings | | 5,802 | | | (1,459) | | | 4,343 | | | (25.1) | % |
| | | | | | | | | | | | | | | | | | | | | | | | | | |
| | For the six months ended June 30, 2020 |
| Dollars in thousands | | As Originally Reported | | Adjustments | | Revised | | Change % |
| Core Earnings (effect on individual line items) | | | | | | | | |
| Net income (loss) attributable to common shareholders and participating securities | | (397,492) | | | (1,459) | | | (398,951) | | | 0.4 | % |
| Net income (loss) before income taxes | | (397,330) | | | (1,459) | | | (398,789) | | | 0.4 | % |
| Core Earnings | | 20,458 | | | (1,459) | | | 18,999 | | | (7.1) | % |
Reconciliation of GAAP Book Value to Non-GAAP Economic Book Value
"Economic book value" is a non-GAAP financial measure of our financial position on an unconsolidated basis. The Company ownsWe own certain securities that represent a controlling variable interest, which under GAAP requires consolidation; however, the Company'sour economic exposure to these variable interests is limited to the fair value of the individual investments. Economic book value is calculated by taking the GAAP book value and 1) adding the fair value of the retained interest or acquired security of the VIEs held by the Companyus and 2) removing the asset and liabilities associated with each of consolidated trusts (RETL 2019, CSMC(CSMC USA, Arroyo 2019-2 and Arroyo 2020-1). Management considers that Economic book value provides investors with a useful supplemental measure to evaluate our financial position as it reflects the actual financial interest of these investments irrespective of the variable interest consolidation model applied for GAAP reporting purposes. Economic book value does not represent and should not be considered as a substitute for Stockholders' Equity, as determined in accordance with GAAP, and our calculation of this measure may not be comparable to similarly titled measures reported by other companies.
The table below is a reconciliation of the GAAP Book Value to Non-GAAP Economic Book Value:Value (dollars in thousands - except per share data):
| | | | | | | | | | | | | | | | |
| | $ Amount | | Per Share | | |
| | | | | | |
| | | | | | |
| | | | | | |
| | | | | | |
| | | | | | |
| | | | | | |
| | | | | | |
| | | | | | |
| | | | | | |
| | | | | | |
| | | | | | |
| | | | | | |
| | | | | | |
| | | | | | |
| | | | | | |
| | | | | | |
| | | | | | |
| | | | | | |
| | | | | | |
| GAAP Book Value at September 30, 2021 | | $ | 210,186 | | | $ | 3.45 | | | |
| | | | | | |
| Adjustments to deconsolidate VIEs and reflect the Company's interest in the securities owned | | |
| Deconsolidation of VIEs assets | | (2,065,610) | | | (33.95) | | | |
| Deconsolidation of VIEs liabilities | | 1,977,055 | | | 32.49 | | | |
| Interest in securities of VIEs owned, at fair value | | 73,390 | | | 1.21 | | | |
| Economic Book Value at September 30, 2021 | | $ | 195,021 | | | $ | 3.20 | | | |
| | | | | | | | | | | | | | | | |
| | $ Amount | | Per Share | | |
| | | | | | |
| | | | | | |
| | | | | | |
| | | | | | |
| | | | | | |
| | | | | | |
| | | | | | |
| | | | | | |
| | | | | | |
| | | | | | |
| | | | | | |
| | | | | | |
| | | | | | |
| | | | | | |
| | | | | | |
| | | | | | |
| | | | | | |
| | | | | | |
| | | | | | |
| GAAP Book Value at September 30, 2020 | | $ | 247,789 | | | $ | 4.07 | | | |
| | | | | | |
| Adjustments to deconsolidate VIEs and reflect the Company's interest in the securities owned | | |
| Deconsolidation of VIEs assets | | (2,827,360) | | | (46.48) | | | |
| Deconsolidation of VIEs liabilities | | 2,705,246 | | | 44.48 | | | |
| Interest in securities of VIEs owned, at fair value | | 124,309 | | | 2.04 | | | |
| Economic Book Value at September 30, 2020 | | $ | 249,984 | | | $ | 4.11 | | | |
Net Interest Income and Net Interest Margin
The following tables set forth certain information regarding our Non-GAAP net investment income and net interest margin which includes interest income on Agency and Non-Agency Interest-Only Strips classified as derivatives and excludes the interest expense for third-party consolidated VIEs for the three and nine months ended September 30, 20202021 and September 30, 20192020 (dollars in thousands):
| | | | | | | | | | | | | | | | | | | | |
| Three Months Ended September 30, 2021 | | Average Amortized Cost of Assets(1) | | Total Interest Income(2) | | Yield on Average Assets |
| | | | | | |
| Investments | | | | | | |
| | | | | | |
| Agency RMBS | | $ | 1,160 | | | $ | 27 | | | 9.23 | % |
| Non-Agency CMBS | | 200,824 | | | 4,290 | | | 8.48 | % |
| Non-Agency RMBS | | 28,528 | | | 369 | | | 5.13 | % |
| Residential Whole Loans | | 831,634 | | | 8,147 | | | 3.89 | % |
| Residential Bridge Loans | | 8,714 | | | 89 | | | 4.05 | % |
| Commercial loans | | 243,534 | | | 2,847 | | | 4.64 | % |
| Securitized commercial loans | | 1,407,129 | | | 23,622 | | | 6.66 | % |
| Other securities | | 48,364 | | | 773 | | | 6.34 | % |
| | | | | | |
| Total investments | | 2,769,887 | | | 40,164 | | | 5.75 | % |
| Adjustments: | | | | | | |
| Securitized commercial loans from consolidated VIEs | | (1,407,129) | | | (23,622) | | | 6.66 | % |
| Investments in consolidated VIEs eliminated in consolidation | | 51,278 | | | 1,038 | | | 8.03 | % |
| Adjusted total investments | | $ | 1,414,036 | | | $ | 17,580 | | | 4.93 | % |
| | | | | | |
| | Average Carrying Value | | Total Interest Expense | | Average Effective Cost of Funds |
| Borrowings | | | | | | |
| Repurchase agreements | | $ | 391,559 | | | $ | 3,037 | | | 3.08 | % |
| Convertible senior unsecured notes, net | | 145,356 | | | 3,099 | | | 8.46 | % |
| Securitized debt | | 1,995,098 | | | 26,842 | | | 5.34 | % |
| Interest rate swaps | | n/a | | (96) | | | (0.02) | % |
| Total borrowings | | 2,532,013 | | | 32,882 | | | 5.15 | % |
| Adjustments: | | | | | | |
Securitized debt from consolidated VIEs(3) | | (1,361,048) | | | (21,745) | | | 6.34 | % |
| Adjusted total borrowings | | $ | 1,170,965 | | | $ | 11,137 | | | 3.77 | % |
| | | | | | |
| Adjusted net interest income and net interest margin | | | | $ | 6,443 | | | 1.81 | % |
| | Three Months Ended September 30, 2020 | Three Months Ended September 30, 2020 | | Average Amortized Cost of Assets(1) | | Total Interest Income(2) | | Yield on Average Assets | Three Months Ended September 30, 2020 | | Average Amortized Cost of Assets(1) | | Total Interest Income(2) | | Yield on Average Assets |
| | Investments | Investments | | Investments | |
| | Agency RMBS | Agency RMBS | | $ | 1,680 | | | $ | 42 | | | 9.95 | % | Agency RMBS | | $ | 1,680 | | | $ | 42 | | | 9.95 | % |
| Non-Agency CMBS | Non-Agency CMBS | | 244,082 | | | 5,186 | | | 8.45 | % | Non-Agency CMBS | | 244,082 | | | 5,186 | | | 8.45 | % |
| Non-Agency RMBS | Non-Agency RMBS | | 30,355 | | | 462 | | | 6.05 | % | Non-Agency RMBS | | 30,355 | | | 462 | | | 6.05 | % |
| Residential Whole Loans | Residential Whole Loans | | 1,137,905 | | | 12,698 | | | 4.44 | % | Residential Whole Loans | | 1,137,905 | | | 12,698 | | | 4.44 | % |
| Residential Bridge Loans | Residential Bridge Loans | | 24,328 | | | 325 | | | 5.31 | % | Residential Bridge Loans | | 24,328 | | | 325 | | | 5.31 | % |
| Commercial loans | Commercial loans | | 332,348 | | | 5,390 | | | 6.45 | % | Commercial loans | | 332,348 | | | 5,390 | | | 6.45 | % |
| Securitized commercial loans | Securitized commercial loans | | 1,329,556 | | | 19,191 | | | 5.74 | % | Securitized commercial loans | | 1,329,556 | | | 19,191 | | | 5.74 | % |
| Other securities | Other securities | | 51,475 | | | 710 | | | 5.49 | % | Other securities | | 51,475 | | | 710 | | | 5.49 | % |
| | Total investments | Total investments | | 3,151,729 | | | 44,004 | | | 5.55 | % | Total investments | | $ | 3,151,729 | | | $ | 44,004 | | | 5.55 | % |
| Adjustments: | Adjustments: | | Adjustments: | | | | | | |
| Securitized commercial loans from consolidated VIEs | Securitized commercial loans from consolidated VIEs | | (1,329,556) | | | (19,191) | | | 5.74 | % | Securitized commercial loans from consolidated VIEs | | (1,329,556) | | | (19,191) | | | 5.74 | % |
| Investments in consolidated VIEs eliminated in consolidation | Investments in consolidated VIEs eliminated in consolidation | | 54,437 | | | 1,172 | | | 8.56 | % | Investments in consolidated VIEs eliminated in consolidation | | 54,437 | | | 1,172 | | | 8.56 | % |
| Adjusted total investments | Adjusted total investments | | $ | 1,876,610 | | | $ | 25,985 | | | 5.51 | % | Adjusted total investments | | $ | 1,876,610 | | | $ | 25,985 | | | 5.51 | % |
| | | Average Carrying Value | | Total Interest Expense(3) | | Average Effective Cost of Funds | | Average Carrying Value | | Total Interest Expense(4) | | Average Effective Cost of Funds |
| Borrowings | Borrowings | | | | | | | Borrowings | | | | | | |
| Repurchase agreements | Repurchase agreements | | $ | 348,360 | | | $ | 3,503 | | | 4.00 | % | Repurchase agreements | | $ | 348,360 | | | $ | 3,503 | | | 4.00 | % |
| Convertible senior unsecured notes, net | Convertible senior unsecured notes, net | | 194,281 | | | 4,062 | | | 8.32 | % | Convertible senior unsecured notes, net | | 194,281 | | | 4,062 | | | 8.32 | % |
| Securitized debt | Securitized debt | | 2,264,800 | | | 26,288 | | | 4.62 | % | Securitized debt | | 2,264,800 | | | 26,288 | | | 4.62 | % |
| | Total borrowings | Total borrowings | | 2,807,441 | | | 33,853 | | | 4.80 | % | Total borrowings | | 2,807,441 | | | 33,853 | | | — | % |
| Adjustments: | Adjustments: | | Adjustments: | |
Securitized debt from consolidated VIEs(4) | | (1,268,471) | | | (18,597) | | | 5.83 | % | |
Securitized debt from consolidated VIEs(3) | | Securitized debt from consolidated VIEs(3) | | (1,268,471) | | | (18,597) | | | 5.83 | % |
| Adjusted total borrowings | Adjusted total borrowings | | $ | 1,538,970 | | | $ | 15,256 | | | 3.94 | % | Adjusted total borrowings | | $ | 1,538,970 | | | $ | 15,256 | | | 3.94 | % |
| | Adjusted net interest income and net interest margin | Adjusted net interest income and net interest margin | | $ | 10,729 | | | 2.27 | % | Adjusted net interest income and net interest margin | | $ | 10,729 | | | 2.27 | % |
| | | | | | | | | | | | | | | | | | | | |
| Three Months Ended September 30, 2019 | | Average Amortized Cost of Assets(1) | | Total Interest Income(2) | | Yield on Average Assets |
| | | | | | |
| Investments | | | | | | |
| Agency CMBS | | $ | 1,738,553 | | | $ | 13,803 | | | 3.15 | % |
| Agency RMBS | | 468,099 | | | 3,852 | | | 3.26 | % |
| Non-Agency CMBS | | 241,580 | | | 4,744 | | | 7.79 | % |
| Non-Agency RMBS | | 46,133 | | | 556 | | | 4.78 | % |
| Residential Whole Loans | | 1,186,261 | | | 13,953 | | | 4.67 | % |
| Residential Bridge Loans | | 83,208 | | | 1,362 | | | 6.49 | % |
| Commercial loans | | 372,802 | | | 7,612 | | | 8.10 | % |
| Securitized commercial loans | | 736,542 | | | 8,615 | | | 4.64 | % |
| Other securities | | 73,997 | | | 1,288 | | | 6.91 | % |
| Total investments | | 4,947,175 | | | 55,785 | | | 4.47 | % |
| Adjustments: | | | | | | |
| Securitized commercial loans from consolidated VIEs | | (736,542) | | | (8,615) | | | 4.64 | % |
| Investments in consolidated VIEs eliminated in consolidation | | 86,956 | | | 1,863 | | | 8.50 | % |
| Adjusted total investments | | $ | 4,297,589 | | | $ | 49,033 | | | 4.53 | % |
| | | | | | |
| | Average Carrying Value | | Total Interest Expense(3) | | Average Effective Cost of Funds |
| Borrowings | | | | | | |
| Repurchase agreements | | $ | 2,990,018 | | | $ | 22,054 | | | 2.93 | % |
| Convertible senior unsecured notes, net | | 135,951 | | | 2,653 | | | 7.74 | % |
| Securitized debt | | 1,505,784 | | | 14,375 | | | 3.79 | % |
| Interest rate swaps | | n/a | | (1,715) | | | (0.15) | % |
| Total borrowings | | 4,631,753 | | | 37,367 | | | 3.20 | % |
| Adjustments: | | | | | | |
Securitized debt from consolidated VIEs(4) | | (631,219) | | | (6,657) | | | 4.18 | % |
| Adjusted total borrowings | | $ | 4,000,534 | | | $ | 30,710 | | | 3.05 | % |
| | | | | | |
| Adjusted net interest income and net interest margin | | | | $ | 18,323 | | | 1.69 | % |
| | | | | | | | | | | | | | | | | | | | |
| Nine Months Ended September 30, 2021 | | Average Amortized Cost of Assets(1) | | Total Interest Income(2) | | Yield on Average Assets |
| | | | | | |
| Investments | | | | | | |
| | | | | | |
| Agency RMBS | | $ | 1,353 | | | $ | 85 | | | 8.40 | % |
| Non-Agency CMBS | | 202,937 | | | 13,401 | | | 8.83 | % |
| Non-Agency RMBS | | 29,270 | | | 1,058 | | | 4.83 | % |
| Residential Whole Loans | | 883,711 | | | 25,724 | | | 3.89 | % |
| Residential Bridge Loans | | 11,383 | | | 806 | | | 9.47 | % |
| Commercial loans | | 297,593 | | | 11,263 | | | 5.06 | % |
| Securitized commercial loans | | 1,487,050 | | | 72,586 | | | 6.53 | % |
| Other securities | | 49,355 | | | 2,503 | | | 6.78 | % |
| | | | | | |
| Total investments | | 2,962,652 | | | 127,426 | | | 5.75 | % |
| Adjustments: | | | | | | |
| Securitized commercial loans from consolidated VIEs | | (1,487,050) | | | (72,586) | | | 6.53 | % |
| Investments in consolidated VIEs eliminated in consolidation | | 56,396 | | | 3,432 | | | 8.14 | % |
| Adjusted total investments | | $ | 1,531,998 | | | $ | 58,272 | | | 5.09 | % |
| | | | | | |
| | Average Carrying Value | | Total Interest Expense | | Average Effective Cost of Funds |
| Borrowings | | | | | | |
| Repurchase agreements | | $ | 364,009 | | | $ | 9,755 | | | 3.58 | % |
| Convertible senior unsecured notes, net | | 159,862 | | | 10,056 | | | 8.41 | % |
| Securitized debt | | 2,170,148 | | | 84,541 | | | 5.21 | % |
| Interest rate swaps | | n/a | | (172) | | | (0.01) | % |
| Total borrowings | | 2,694,019 | | | 104,180 | | | 5.17 | % |
| Adjustments: | | | | | | |
Securitized debt from consolidated VIEs(3) | | (1,434,559) | | | (67,057) | | | 6.25 | % |
| Adjusted total borrowings | | $ | 1,259,460 | | | $ | 37,123 | | | 3.94 | % |
| | | | | | |
| Adjusted net interest income and net interest margin | | | | $ | 21,149 | | | 1.85 | % |
| | | | | | |
| | | | | | |
| | | | | | | | | | | | | | | | | | | | |
| Nine Months Ended September 30, 2020 | | Average Amortized Cost of Assets(1) | | Total Interest Income(2) | | Yield on Average Assets |
| | | | | | |
| Investments | | | | | | |
| Agency CMBS | | $ | 459,539 | | | $ | 10,751 | | | 3.13 | % |
| Agency RMBS | | 81,068 | | | 2,126 | | | 3.50 | % |
| Non-Agency CMBS | | 274,878 | | | 16,683 | | | 8.11 | % |
| Non-Agency RMBS | | 33,928 | | | 1,187 | | | 4.67 | % |
| Residential Whole-Loans | | 1,277,263 | | | 42,892 | | | 4.49 | % |
| Residential Bridge Loans | | 29,311 | | | 1,542 | | | 7.03 | % |
| Commercial loans | | 340,184 | | | 17,777 | | | 6.98 | % |
| Securitized commercial loans | | 846,243 | | | 34,791 | | | 5.49 | % |
| Other securities | | 57,730 | | | 2,755 | | | 6.37 | % |
| | | | | | |
| Total investments | | 3,400,144 | | | 130,504 | | | 5.13 | % |
| Adjustments: | | | | | | |
| Securitized commercial loans from consolidated VIEs | | (846,243) | | | (34,791) | | | 5.49 | % |
| Investments in consolidated VIEs eliminated in consolidation | | 107,663 | | | 7,466 | | | 9.26 | % |
| Adjusted total investments | | $ | 2,661,564 | | | $ | 103,179 | | | 5.18 | % |
| | | | | | |
| | Average Carrying Value | | Total Interest Expense(3) | | Average Effective Cost of Funds |
| Borrowings | | | | | | |
| Repurchase agreements | | $ | 1,361,985 | | | $ | 31,220 | | | 3.06 | % |
| Convertible senior unsecured notes, net | | 196,826 | | | 12,351 | | | 8.38 | % |
| Securitized debt | | 1,650,091 | | | 50,805 | | | 4.11 | % |
| Interest rate swaps | | n/a | | 1,133 | | | 0.05 | % |
| Total borrowings | | 3,208,902 | | | 95,509 | | | 3.98 | % |
| Adjustments: | | | | | | |
Securitized debt from consolidated VIEs(4) | | (787,280) | | | (30,012) | | | 5.09 | % |
| Adjusted total borrowings | | $ | 2,421,622 | | | $ | 65,497 | | | 3.61 | % |
| | | | | | |
| Adjusted net interest income and net interest margin | | | | $ | 37,682 | | | 1.89 | % |
| | | | | | | | | | | | | | | | | | | | |
| Nine Months Ended September 30, 2019 | | Average Amortized Cost of Assets(1) | | Total Interest Income(2) | | Yield on Average Assets |
| | | | | | |
| Investments | | | | | | |
| Agency CMBS | | $ | 1,499,301 | | | $ | 36,626 | | | 3.27 | % |
| Agency RMBS | | 246,505 | | | 6,540 | | | 3.55 | % |
| Non-Agency CMBS | | 204,068 | | | 13,269 | | | 8.69 | % |
| Non-Agency RMBS | | 48,292 | | | 1,960 | | | 5.43 | % |
| Residential Whole-Loans | | 1,176,978 | | | 42,819 | | | 4.86 | % |
| Residential Bridge Loans | | 138,100 | | | 7,162 | | | 6.93 | % |
| Commercial loans | | 318,673 | | | 19,392 | | | 8.14 | % |
| Securitized commercial loans | | 852,621 | | | 30,323 | | | 4.75 | % |
| Other securities | | 65,950 | | | 3,898 | | | 7.90 | % |
| Total return swaps | | — | | | — | | | — | |
| Total investments | | 4,550,488 | | | 161,989 | | | 4.76 | % |
| Adjustments: | | | | | | |
| Securitized commercial loans from consolidated VIEs | | (852,621) | | | (30,323) | | | 4.75 | % |
| Investments in consolidated VIEs eliminated in consolidation | | 74,858 | | | 5,259 | | | 9.39 | % |
| Adjusted total investments | | $ | 3,772,725 | | | $ | 136,925 | | | 4.85 | % |
| | | | | | |
| | Average Carrying Value | | Total Interest Expense(3) | | Average Effective Cost of Funds |
| Borrowings | | | | | | |
| Repurchase agreements | | $ | 2,853,746 | | | $ | 70,952 | | | 3.32 | % |
| Convertible senior unsecured notes, net | | 118,946 | | | 7,193 | | | 8.09 | % |
| Securitized debt | | 1,255,360 | | | 35,295 | | | 3.76 | % |
| Interest rate swaps | | n/a | | (9,848) | | | (0.31) | % |
| Total borrowings | | 4,228,052 | | | 103,592 | | | 3.28 | % |
| Adjustments: | | | | | | |
Securitized debt from consolidated VIEs(4) | | (761,564) | | | (24,029) | | | 4.22 | % |
| Adjusted total borrowings | | $ | 3,466,488 | | | $ | 79,563 | | | 3.07 | % |
| | | | | | |
| Adjusted net interest income and net interest margin | | | | $ | 57,362 | | | 2.03 | % |
| | | | | | | | | | | | | | | | | | | | |
| | | | | | |
| Nine months ended September 30, 2020 | | Average Amortized Cost of Assets(1) | | Total Interest Income(2) | | Yield on Average Assets |
| | | | | | |
| Investments | | | | | | |
| Agency CMBS | | $ | 459,539 | | | $ | 10,751 | | | 3.13 | % |
| Agency RMBS | | 81,068 | | | 2,126 | | | 3.50 | % |
| Non-Agency CMBS | | 274,878 | | | 16,683 | | | 8.11 | % |
| Non-Agency RMBS | | 33,928 | | | 1,187 | | | 4.67 | % |
| Residential Whole Loans | | 1,277,263 | | | 42,892 | | | 4.49 | % |
| Residential Bridge Loans | | 29,311 | | | 1,542 | | | 7.03 | % |
| Commercial loans | | 340,184 | | | 17,777 | | | 6.98 | % |
| Securitized commercial loans | | 846,243 | | | 34,791 | | | 5.49 | % |
| Other securities | | 57,730 | | | 2,755 | | | 6.37 | % |
| | | | | | |
| Total investments | | 3,400,144 | | | 130,504 | | | 5.13 | % |
| Adjustments: | | | | | | |
| Securitized commercial loans from consolidated VIEs | | (846,243) | | | (34,791) | | | 5.49 | % |
| Investments in consolidated VIEs eliminated in consolidation | | 107,663 | | | 7,466 | | | 9.26 | % |
| Adjusted total investments | | $ | 2,661,564 | | | $ | 103,179 | | | 5.18 | % |
| | | | | | |
| | Average Carrying Value | | Total Interest Expense(3) | | Average Effective Cost of Funds |
| Borrowings | | | | | | |
| Repurchase agreements | | $ | 1,361,985 | | | $ | 31,220 | | | 3.06 | % |
| Convertible senior unsecured notes, net | | 196,826 | | | 12,351 | | | 8.38 | % |
| Securitized debt | | 1,650,091 | | | 50,805 | | | 4.11 | % |
| Interest rate swaps | | n/a | | 1,133 | | | 0.05 | % |
| Total borrowings | | 3,208,902 | | | 95,509 | | | 3.98 | % |
| Adjustments: | | | | | | |
Securitized debt from consolidated VIEs(5) | | (787,280) | | | (30,012) | | | 5.09 | % |
| Adjusted total borrowings | | $ | 2,421,622 | | | $ | 65,497 | | | 3.61 | % |
| | | | | | |
| Adjusted net interest income and net interest margin | | | | $ | 37,682 | | | 1.89 | % |
(1)Includes Agency and Non-Agency Interest-Only Strips accounted for as derivatives.
(2)Refer to below table for components of interest income.
(3)Includes only the third-party sponsored securitized debt from RETL Trust and CSMC USA.
(4)Includes the net amount paid, including accrued amounts and premium amortization for MAC interest rate swaps during the periods included in gain/loss on derivative instruments for GAAP.
(4)(5)Includes only the third-party sponsored securitized debt from RETL Trust, CMSC Trust and CSMC USA.MRCD Trust.
The following table reconciles total interest income to adjusted interest income, which includes interest income on Agency and Non-Agency Interest-Only Strips classified as derivatives (Non-GAAP financial measure) for the three and nine months ended September 30, 20202021 and September 30, 2019:2020:
| | | | | | | | | | | | | | | | | | | | | | | | | | |
| (dollars in thousands) | | Three months ended September 30, 2020 | | Three months ended September 30, 2019 | | Nine months ended September 30, 2020 | | Nine months ended September 30, 2019 |
| Coupon interest income: | | | | | | | | |
| Agency CMBS | | $ | — | | | $ | 14,544 | | | $ | 11,336 | | | $ | 38,100 | |
| Agency RMBS | | 25 | | | 4,723 | | | 2,954 | | | 8,389 | |
| Non-Agency CMBS | | 3,500 | | | 3,696 | | | 12,257 | | | 9,975 | |
| Non-Agency RMBS | | 616 | | | 1,120 | | | 2,349 | | | 3,712 | |
| Residential Whole Loans | | 13,847 | | | 15,129 | | | 46,430 | | | 45,056 | |
| Residential Bridge Loans | | 345 | | | 1,429 | | | 1,609 | | | 7,897 | |
| Commercial loans | | 5,349 | | | 7,477 | | | 17,425 | | | 18,701 | |
| Securitized commercial loans | | 14,634 | | | 9,369 | | | 29,882 | | | 32,261 | |
| Other Securities | | 1,723 | | | 2,924 | | | 6,565 | | | 8,883 | |
| Subtotal coupon interest | | 40,039 | | | 60,411 | | | 130,807 | | | 172,974 | |
| Premium accretion, discount amortization and amortization of basis, net: | | | | | | | | |
| Agency CMBS | | — | | | (764) | | | (636) | | | (1,553) | |
| Agency RMBS | | (17) | | | (981) | | | (971) | | | (2,256) | |
| Non-Agency CMBS | | 1,686 | | | 1,048 | | | 4,426 | | | 3,294 | |
| Non-Agency RMBS | | (154) | | | (564) | | | (1,162) | | | (1,752) | |
| Residential Whole Loans | | (1,149) | | | (1,176) | | | (3,538) | | | (2,237) | |
| Residential Bridge Loans | | (20) | | | (67) | | | (67) | | | (735) | |
| Commercial loans | | 41 | | | 135 | | | 352 | | | 691 | |
| Securitized commercial loans | | 4,557 | | | (754) | | | 4,909 | | | (1,938) | |
| Other Securities | | (1,013) | | | (1,636) | | | (3,810) | | | (4,985) | |
| Subtotal accretion and amortization | | 3,931 | | | (4,759) | | | (497) | | | (11,471) | |
| Interest income | | $ | 43,970 | | | $ | 55,652 | | | $ | 130,310 | | | $ | 161,503 | |
Contractual interest income, net of amortization of basis on Agency and Non-Agency Interest-Only Strips, classified as derivatives(1): | | | | | | | | |
| Coupon interest income | | $ | 200 | | | $ | 723 | | | $ | 1,176 | | | $ | 2,326 | |
| Amortization of basis | | (166) | | | (590) | | | (982) | | | (1,840) | |
| | | | | | | | |
| | | | | | | | |
| Subtotal | | 34 | | | 133 | | | 194 | | | 486 | |
| Total adjusted interest income | | $ | 44,004 | | | $ | 55,785 | | | $ | 130,504 | | | $ | 161,989 | |
| | | | | | | | | | | | | | | | | | | | | | | | | | |
| (dollars in thousands) | | Three months ended September 30, 2021 | | Three months ended September 30, 2020 | | Nine months ended September 30, 2021 | | Nine months ended September 30, 2020 |
| Coupon interest income: | | | | | | | | |
| Agency CMBS | | $ | — | | | $ | — | | | $ | — | | | $ | 11,336 | |
| Agency RMBS | | 11 | | | 25 | | | 38 | | | 2,954 | |
| Non-Agency CMBS | | 2,621 | | | 3,500 | | | 7,171 | | | 12,257 | |
| Non-Agency RMBS | | 609 | | | 616 | | | 1,762 | | | 2,349 | |
| Residential Whole Loans | | 10,268 | | | 13,847 | | | 32,993 | | | 46,430 | |
| Residential Bridge Loans | | 108 | | | 345 | | | 827 | | | 1,609 | |
| Commercial loans | | 2,820 | | | 5,349 | | | 11,118 | | | 17,425 | |
| Securitized commercial loans | | 17,533 | | | 14,634 | | | 54,137 | | | 29,882 | |
| Other Securities | | 1,043 | | | 1,723 | | | 3,717 | | | 6,565 | |
| Subtotal coupon interest | | 35,013 | | | 40,039 | | | 111,763 | | | 130,807 | |
| Premium accretion, discount amortization and amortization of basis, net: | | | | | | | | |
| Agency CMBS | | — | | | — | | | — | | | (636) | |
| Agency RMBS | | (7) | | | (17) | | | (26) | | | (971) | |
| Non-Agency CMBS | | 1,669 | | | 1,686 | | | 6,230 | | | 4,426 | |
| Non-Agency RMBS | | (240) | | | (154) | | | (704) | | | (1,162) | |
| Residential Whole Loans | | (2,121) | | | (1,149) | | | (7,269) | | | (3,538) | |
| Residential Bridge Loans | | (19) | | | (20) | | | (21) | | | (67) | |
| Commercial loans | | 27 | | | 41 | | | 145 | | | 352 | |
| Securitized commercial loans | | 6,089 | | | 4,557 | | | 18,449 | | | 4,909 | |
| Other Securities | | (270) | | | (1,013) | | | (1,214) | | | (3,810) | |
| Subtotal accretion and amortization | | 5,128 | | | 3,931 | | | 15,590 | | | (497) | |
| Interest income | | $ | 40,141 | | | $ | 43,970 | | | $ | 127,353 | | | $ | 130,310 | |
Contractual interest income, net of amortization of basis on Agency and Non-Agency Interest-Only Strips, classified as derivatives(1): | | | | | | | | |
| Coupon interest income | | $ | 82 | | | $ | 200 | | | $ | 305 | | | $ | 1,176 | |
| Amortization of basis | | (59) | | | (166) | | | (232) | | | (982) | |
| | | | | | | | |
| | | | | | | | |
| Subtotal | | 23 | | | 34 | | | 73 | | | 194 | |
| Total adjusted interest income | | $ | 40,164 | | | $ | 44,004 | | | $ | 127,426 | | | $ | 130,504 | |
(1)Reported in "Gain (loss) on derivative instruments, net" in our Consolidated Statements of Operations.
Effective Cost of Funds
Effective Cost of Funds includes the net interest component related to our interest rate swaps, as well as the impact of our foreign currency swaps and forwards. While we have not elected hedge accounting for these instruments, such derivative instruments are viewed by us as an economic hedge against increases in future market interest rates on our liabilities and changes in foreign currency exchange rates on our assets and liabilities and are characterized as hedges for purposes of satisfying the REIT requirements and therefore the Effective Cost of Funds reflects interest expense adjusted to include the realized gain/loss (i.e., the interest income/expense component) for all of our interest rate swaps and the impact of our foreign currency swaps and forwards.
The following table reconciles the Effective Cost of Funds (Non-GAAP financial measure) with interest expense for the three and nine months ended September 30, 20202021 and September 30, 2019:2020:
| | | | | Three months ended September 30, 2020 | | Three months ended September 30, 2019 | | Nine months ended September 30, 2020 | | Nine months ended September 30, 2019 | | | Three months ended September 30, 2021 | | Three months ended September 30, 2020 | | Nine months ended September 30, 2021 | | Nine months ended September 30, 2020 |
| (dollars in thousands) | (dollars in thousands) | | Reconciliation | | Cost of Funds/
Effective Borrowing Costs | | Reconciliation | | Cost of Funds/
Effective Borrowing Costs | | Reconciliation | | Cost of Funds/
Effective Borrowing Costs | | Reconciliation | | Cost of Funds/
Effective Borrowing Costs | (dollars in thousands) | | Reconciliation | | Cost of Funds/
Effective Borrowing Costs | | Reconciliation | | Cost of Funds/
Effective Borrowing Costs | | Reconciliation | | Cost of Funds/
Effective Borrowing Costs | | Reconciliation | | Cost of Funds/
Effective Borrowing Costs |
| Interest expense | Interest expense | | $ | 33,853 | | | 4.80 | % | | $ | 39,082 | | | 3.35 | % | | $ | 94,376 | | | 3.93 | % | | $ | 113,440 | | | 3.59 | % | Interest expense | | $ | 32,978 | | | 5.17 | % | | $ | 33,853 | | | 4.80 | % | | $ | 104,352 | | | 5.18 | % | | $ | 94,376 | | | 3.93 | % |
| Adjustments: | Adjustments: | | Adjustments: | |
| Interest expense on Securitized debt from consolidated VIEs | Interest expense on Securitized debt from consolidated VIEs | | (18,597) | | | (5.83) | % | | (6,657) | | | (4.18) | % | | (30,012) | | | (5.09) | % | | (24,029) | | | (4.22) | % | Interest expense on Securitized debt from consolidated VIEs | | (21,745) | | | (6.34) | % | | (18,597) | | | (5.83) | % | | (67,057) | | | (6.25) | % | | (30,012) | | | (5.09) | % |
| Net interest (received) paid - interest rate swaps | Net interest (received) paid - interest rate swaps | | — | | | — | % | | (1,715) | | | (0.15) | % | | 1,133 | | | 0.05 | % | | (9,848) | | | (0.31) | % | Net interest (received) paid - interest rate swaps | | (96) | | | (0.02) | % | | — | | | — | % | | (172) | | | (0.01) | % | | 1,133 | | | 0.05 | % |
| Effective Borrowing Costs | | $ | 15,256 | | | 3.94 | % | | $ | 30,710 | | | 3.05 | % | | $ | 65,497 | | | 3.61 | % | | $ | 79,563 | | | 3.07 | % | |
| Effective Cost of Funds | | Effective Cost of Funds | | $ | 11,137 | | | 3.77 | % | | $ | 15,256 | | | 3.94 | % | | $ | 37,123 | | | 3.94 | % | | $ | 65,497 | | | 3.61 | % |
| Weighted average borrowings | Weighted average borrowings | | $ | 1,538,970 | | | | | $ | 4,000,534 | | | | | $ | 2,421,622 | | | | | $ | 3,466,488 | | | | Weighted average borrowings | | $ | 1,170,965 | | | | | $ | 1,538,970 | | | | | $ | 1,259,460 | | | | | $ | 2,421,622 | | | |
Liquidity and Capital Resources
General
Liquidity is a measure of our ability to meet potential cash requirements, including ongoing commitments to repay borrowings, fund and maintain our assets and operations, make distributions to our stockholders, and other general business needs. To maintain our REIT qualifications under the Internal Revenue Code, we must distribute annually at least 90% of our taxable income, excluding capital gains and, such distributions requirements limit our ability to retain earnings and increase capital for operations.
Our liquidity and capital resources are managed on a daily basis to ensure that we have sufficient liquidity to absorb market events that could negatively impact collateral valuations and result in margin calls as well as to ensure that we have the flexibility to manage our investment portfolio to take advantage of market opportunities. As of September 30, 2020, our2021, we had $45.7 million of senior unsecured convertible notes outstanding of which $45.7 million aggregate principal sourcesamount mature in October 2022 and $86.3 million aggregate principal amount mature in September 2024. We also had $483.3 million of cash consistasset specific financings. As of borrowings under repurchase agreements, payments of principal and interest on our investment portfolioSeptember 30, 2021, we had $63.9 million in cash and cash generated from operations and, if market conditions permit, secondary public stock offerings.
While under normal market conditions we believe that our significant capital resources and accessequivalents. We continue to financing will provide us with financial flexibility at levels sufficient to meet current and anticipated capital requirements, recent market conditions resulting from the COVID 19 pandemic resulted in significant decline in liquidity. In response to the unprecedented market conditions, we implemented measures to increase liquidity, reduce leverage, and seek alternative financing arrangements. We made further progresstake steps towards strengthening our balance sheet in the third quarter by reducing debt and leverage, while improving liquidity shareholders equity and the earnings power of the portfolio.We had improved financial results during the third quarter, which included significant recovery in asset valuations.shareholders' equity.
Financing Arrangements
On April 21, 2020, we entered into amendments with respectWe will continue to certain ofclosely monitor developments related to COVID-19 as it relates to our residential loan warehouse facilities. These amendments mainly served to convert an existing residential whole loan facility into a term facility by removing any mark to market margin requirements,liquidity position and to consolidate our Non-Qualified Mortgage loans, which were previously financed by three separate, unaffiliated counterparties, into a single facility. See "Note 7 - Financings" for details.
On October 6, 2020 the Company entered into an amendment with respect to its residential loan warehouse facility. The amendment serves to convert the existing residential loan facility to a limited mark to market margin facility that bears an interest rate of LIBOR plus 2.75%, with a LIBOR floor of 0.25%. The target advance rate under the amended facility is 85%
and the facility matures on October 5, 2021. The premium recapture fee was eliminated for holdings that had not yet been sold or otherwise disposed of. See "Note 7 - Financings " for details.
On May 4, 2020, we supplemented one of our existing securities repurchase facilities to confirm terms pursuant to which we will consolidate most of our CMBS and RMBS assets, which are currently financed by multiple counterparties, into a single term facility with limited mark to market margin requirements. See "Note 7 - Financings " for details.
Based on the measures taken by us during these difficult market conditions,financial obligations. At this time, we believe we have sufficient current liquidity and access to additional liquidity to meet financial obligations for at least the next 12 months.
Debt to Equity Ratio
| | | | | | | | | | | | | | | | |
| | September 30, 2021 | | December 31, 2020 | | |
Total debt(1) | | $ | 609,900 | | | $ | 527,720 | | | |
| Total equity | | $ | 210,186 | | | $ | 255,112 | | | |
| Debt to equity ratio | | 2.9x | | 2.1x | | |
(1) Total debt excludes the securitized debt which is non-recourse to us.
Sources of Liquidity
Principal Sources of Cash
We held cash of approximately $27.5 million and $81.8 million at September 30, 2020 and September 30, 2019, respectively. Our primary sources of cash currently consist of investment income, principal repayments on investments, financings and the proceeds from debt and equity offerings, to the extent available in the capital markets. In the future, we expect our primary sources of liquidity to consist of payments of principal and investment income, unused borrowing capacity under our financing sources and future issuances of equity and debt securities to the extent available.
Repurchase Agreements
As of September 30, 2020, we had borrowings under six of our master repurchase agreements of approximately $358.9 million. The following tables present our repurchase agreement borrowings by type of collateral pledged,are as of September 30, 2020 and September 30, 2019, and the respective effective cost of funds (Non-GAAP financial measure) for the three and nine months ended September 30, 2020 and September 30, 2019, respectively. See “Non-GAAP Financial Measures” (dollars in thousands):
| | | | | | | | | | | | | | | | | | | | | | | | | | | | | | | | | | | | | | | | | | | | | | | |
| September 30, 2020 | | Three months ended September 30, 2020 | | Nine months ended September 30, 2020 | | |
| Collateral | Borrowings
Outstanding | | Value of
Collateral
Pledged | | Weighted
Average
Interest Rate
end of period | | Weighted
Average Cost
of Funds | | Weighted Average Effective Cost of Funds (Non-GAAP)(1) | | Weighted
Average Cost
of Funds | | Weighted Average Effective Cost of Funds (Non-GAAP)(1) | | Weighted
Average
Haircut
end of period |
| Agency CMBS, at fair value | $ | — | | | $ | — | | | — | % | | — | % | | — | % | | 2.21 | % | | 2.21 | % | | — | % |
| Agency RMBS, at fair value | 1,438 | | | 1,853 | | | 1.46 | % | | 1.62 | % | | 1.62 | % | | 2.00 | % | | 2.00 | % | | 25.00 | % |
Non-Agency CMBS, at fair value(2) | 83,264 | | | 165,699 | | | 5.02 | % | | 5.26 | % | | 5.26 | % | | 3.86 | % | | 3.86 | % | | 41.21 | % |
| Non-Agency RMBS, at fair value | 14,742 | | | 25,817 | | | 5.25 | % | | 5.45 | % | | 5.45 | % | | 4.61 | % | | 4.61 | % | | 33.33 | % |
Residential Whole Loans, at fair value(2) | 40,061 | | | 105,059 | | | 4.98 | % | | 5.95 | % | | 5.95 | % | | 3.85 | % | | 3.85 | % | | 59.21 | % |
Residential Bridge Loans(2) | 15,763 | | | 16,828 | | | 2.75 | % | | 2.90 | % | | 2.90 | % | | 3.43 | % | | 3.43 | % | | 20.00 | % |
| Commercial loans, at fair value | 168,397 | | | 325,651 | | | 2.45 | % | | 2.84 | % | | 2.84 | % | | 3.29 | % | | 3.29 | % | | 35.53 | % |
| | | | | | | | | | | | | | | |
| Membership interest | 18,845 | | | 33,495 | | | 2.90 | % | | 3.88 | % | | 3.88 | % | | 3.87 | % | | 3.87 | % | | 35.00 | % |
| Other securities, at fair value | 16,368 | | | 41,055 | | | 5.13 | % | | 5.34 | % | | 5.34 | % | | 3.93 | % | | 3.93 | % | | 36.87 | % |
| Interest rate swaps | n/a | | n/a | | n/a | | n/a | | — | % | | — | | | 0.11 | % | | n/a |
| Total | $ | 358,878 | | | $ | 715,457 | | | 3.60 | % | | 4.00 | % | | 4.00 | % | | 3.06 | % | | 3.17 | % | | 38.44 | % |
(1)The effective cost of funds for the period presented is calculated on an annualized basis and includes interest expense for the period and net periodic interest payments on interest rate swaps, net of premium amortization on MAC swaps, of zero and $1.1 million paid for the three and nine months ended September 30, 2020, respectively. While interest rate swaps are not accounted for using hedge accounting, such instruments are viewed by us as an economic hedge against increases in interest rates on our liabilities and are treated as hedges for purposes of satisfying the REIT requirements. See “Non-GAAP Financial Measures”.
(2)Includes repurchase agreement borrowings on securities eliminated upon VIE consolidation.
(3)Repurchase agreement borrowings collateralized by Whole Loans, Bridge Loans and securitized commercial loans owned through trust certificates. The trust certificates are eliminated upon consolidation.
| | | | | | | | | | | | | | | | | | | | | | | | | | | | | | | | | | | | | | | | | | | | | | | |
| September 30, 2019 | | Three months ended September 30, 2019 | | Nine months ended September 30, 2019 | | |
| Collateral | Borrowings
Outstanding | | Fair Value of Collateral Pledged(3) | | Weighted
Average
Interest Rate
end of period | | Weighted
Average Cost
of Funds | | Weighted Average Effective Cost of Funds (Non-GAAP)(2) | | Weighted
Average Cost
of Funds | | Weighted Average Effective Cost of Funds (Non-GAAP)(1) | | Weighted
Average
Haircut
end of period |
| Agency CMBS | $ | 1,640,190 | | | $ | 1,739,015 | | | 2.36 | % | | 2.50 | % | | 2.50 | % | | 2.63 | % | | 2.63 | % | | 5.11 | % |
| Agency RMBS | 366,488 | | | 379,998 | | | 2.31 | % | | 2.55 | % | | 2.55 | % | | 2.61 | % | | 2.61 | % | | 5.18 | % |
| Non-Agency CMBS | 201,751 | | | 270,434 | | | 3.28 | % | | 3.52 | % | | 3.52 | % | | 3.85 | % | | 3.85 | % | | 22.74 | % |
| Non-Agency RMBS | 31,071 | | | 47,256 | | | 3.67 | % | | 3.78 | % | | 3.78 | % | | 4.05 | % | | 4.05 | % | | 36.03 | % |
Residential Whole Loans, at fair value(2) | 282,741 | | | 300,551 | | | 3.69 | % | | 3.85 | % | | 3.85 | % | | 4.22 | % | | 4.22 | % | | 6.75 | % |
Residential Bridge Loans(2) | 50,092 | | | 50,675 | | | 4.26 | % | | 4.44 | % | | 4.44 | % | | 4.67 | % | | 4.67 | % | | 20.00 | % |
| Commercial loans, at fair value | 262,821 | | | 422,032 | | | 4.31 | % | | 4.66 | % | | 4.66 | % | | 4.97 | % | | 4.97 | % | | 35.17 | % |
Securitized commercial loan, at fair value(2) | 32,893 | | | 44,244 | | | 3.13 | % | | 3.30 | % | | 3.30 | % | | 3.57 | % | | 3.57 | % | | 22.20 | % |
| Other securities, at fair value | 57,061 | | | 82,875 | | | 3.55 | % | | 3.77 | % | | 3.77 | % | | 4.04 | % | | 4.04 | % | | 28.94 | % |
| Interest rate swaps | n/a | | n/a | | n/a | | n/a | | (0.23) | % | | n/a | | (0.46) | % | | n/a |
| Total | $ | 2,925,108 | | | $ | 3,337,080 | | | 2.80 | % | | 2.93 | % | | 2.70 | % | | 3.32 | % | | 2.86 | % | | 10.45 | % |
(1)The effective cost of funds for the period presented is calculated on an annualized basis and includes interest expense for the period and net periodic interest payments on interest rate swaps, net of premium amortization on MAC swaps, of approximately $1.7 million and $9.8 million received for the three and nine months ended September 30, 2019. While interest rate swaps are not accounted for using hedge accounting, such instruments are viewed by us as an economic hedge against increases in interest rates on our liabilities and are treated as hedges for purposes of satisfying the REIT requirements. See “Non-GAAP Financial Measures”.
(2)Repurchase agreement borrowings collateralized by Whole Loans, Bridge Loans and securitized commercial loan owned through trust certificates. The trust certificates are eliminated upon consolidation.
We are also required to pledge cash or securities as collateral as part of a margin arrangement for our derivative contracts, calculated daily, subject either to the terms of individual agreements for bilateral agreements and the clearinghouse rules in the case of cleared swaps. The amount of margin that we are required to post will vary and generally reflects collateral posted with respect to swaps that are in an unrealized loss position to us and a percentage of the aggregate notional amount of swaps per counterparty as well as margin posted with our clearing broker, pursuant to clearinghouse rules and practices, for cleared swaps. We have significantly reduced our exposure to margin volatility by terminating our interest rate hedge positions, as well as the majority of our bilateral derivative contracts. Conversely, if our bilateral swaps and swaptions are in an unrealized gain position, our counterparties are required to post collateral with us, under the same terms that we post collateral with them. We may enter into a MAC interest rate swap in which we may receive or make a payment at the time of entering such interest rate swap to compensate for the out of the market nature of such interest rate swap. Similar to all other interest rate swaps, these interest rate swaps are also subject to margin requirements.
At-The-Market Program
In March 2017, we entered into an equity distribution agreement with JMP Securities LLC, or "JMP", which was amended on June 5, 2020, under which we may offer and sell up to $100.0 million shares of common stock in an At-The-Market equity offering from time to time through JMP. DuringFor the nine months ended September 30, 2020, we sold 6,034,741 shares under this amended agreement with an average price of $3.70 per share for total2021, net proceeds of $22.0cash provided by operating activities was approximately $1.3 million.
Securitized Debt
In June 2020, we completed a residential mortgage-backed securitization comprised of a portion ofThis was primarily attributable to the net interest income on our Residential Whole Loan portfolio. RMI 2015 Trust transferred $355.8 million of Non-QM Residential Whole Loans, to our wholly owned subsidiary, Arroyo Trust 2020. Arroyo Trust 2020 issued $341.7 million of mortgage-backed notesinvestments, less operating expenses, and we retained the subordinate Non-Offered Securities. These non-offered securities with an estimated fair value of $29.5 million at September 30, 2020 were eliminated in the consolidation. At September 30, 2020, Residential Whole Loans, with an outstanding principal balance of approximately $329.7 million, serve as collateral for the Arroyo Trust 2020's securitized debt.
The following table summarizes the consolidated Arroyo Trust 2020's issued mortgage-backed notes at September 30, 2020 which is classified in "Securitized debt, net" in the Consolidated Balance Sheets (dollars in thousands):
| | | | | | | | | | | | | | |
| Classes | Principal Balance | Coupon | Carrying Value | Contractual Maturity |
| Issued Mortgage-Backed Notes | | | | |
| Class A-1A | $ | 246,807 | | 1.7% | $ | 246,801 | | 3/25/2055 |
| Class A-1B | 29,287 | | 2.1% | 29,286 | | 3/25/2055 |
| Class A-2 | 13,518 | | 2.9% | 13,517 | | 3/25/2055 |
| Class A-3 | 17,963 | | 3.3% | 17,963 | | 3/25/2055 |
| Class M-1 | 11,739 | | 4.3% | 11,739 | | 3/25/2055 |
| Subtotal | $ | 319,314 | | | $ | 319,306 | | |
| Less: Unamortized deferred financing costs | N/A | | 2,606 | | |
| Total | $ | 319,314 | | | $ | 316,700 | | |
Cash Generated from Operations
general and administrative expenses. For the nine months ended September 30, 2020, net cash used in operating activities was approximately $155.3 million. ThisThis was primarily attributable to margin settlements of interest rate swaps, operating expenses, and general and administrative expenses, which waswere offset by the net interest income we earned on our investments. For the nine months ended September 30, 2019, net cash used in operating activities was approximately $110.3 million, this was attributable to the net interest income we earned on our investments less operating expenses, general and administrative expenses and margin settlements of interest rate swaps.
Cash Provided by and Used in Investing Activities
For the nine months ended September 30, 2021, net cash provided by investing activities was approximately $560.6 million. This was primarily attributable to receipts of principal payments and payoffs on our investments. For the nine months ended September 30, 2020, net cash provided by investing activities was approximately $2.4 billion. This was primarily attributable to proceeds from sales to meet the margin calls and receipts of principal payments and payoffs on our investments, which waswere partially offset by our investment acquisitions.
Cash Provided by and Used in Financing Activities
For the nine months ended September 30, 2019,2021, net cash used in investingfinancing activities was approximately $465.3$605.5 million. This was primarily attributable to investment acquisitions, including an investment from arepayment of securitized debt, distribution of escrows related to consolidated CMBS VIE, which was partially offset by proceeds from salesVIEs and receiptsextinguishment of principal payments and payoffs on our investments.
Cash Provided by and Used in Financing Activities
convertible senior unsecured notes. For the nine months ended September 30, 2020, net cash used in financing activities was approximately $2.2 billion. This was attributable to net repayments of our repurchase agreement borrowings to reduce our exposure to short term financings and repayment of securitized debt related to consolidated VIEs which was offset net proceeds from the Arroyo 2020-1 that closed during this quarter. For the quarter ended June 30, 2020.
Repurchase Agreements
As of September 30, 2021, we had borrowings under five of our master repurchase agreements of approximately $483.3 million. The following tables present our repurchase agreement borrowings by type of collateral pledged, as of September 30, 2021 and September 30, 2020, and the respective effective cost of funds (Non-GAAP financial measure) for the three and nine months ended September 30, 2019, net cash provided by financing activities was approximately $584.5 million. This was attributable to net proceeds from financings during the quarter2021 and a secondary public offering. Our net cash provided by financing activities was partially offset by dividends paid on our common stock.
Contractual Obligations and Commitments
Our contractual obligations as of September 30, 2020, are as followsrespectively. See “Non-GAAP Financial Measures” (dollars in thousands):
| | | | | | | | | | | | | | | | | | | | | | | | | | | | | | | | | | | | | | | | | | | | | | | |
| September 30, 2021 | | Three months ended September 30, 2021 | | Nine months ended September 30, 2021 | | |
| Collateral | Borrowings
Outstanding | | Value of
Collateral
Pledged | | Weighted
Average
Interest Rate
end of period | | Weighted
Average Cost
of Funds | | Weighted Average Effective Cost of Funds (Non-GAAP)(1) | | Weighted
Average Cost
of Funds | | Weighted Average Effective Cost of Funds (Non-GAAP)(1) | | Weighted
Average
Haircut
end of period |
| | | | | | | | | | | | | | | |
| Agency RMBS, at fair value | $ | 1,048 | | | $ | 1,342 | | | 1.05 | % | | 1.06 | % | | 1.06 | % | | 1.19 | % | | 1.19 | % | | 25.00 | % |
Non-Agency CMBS, at fair value(2) | 78,666 | | | 136,968 | | | 2.07 | % | | 2.12 | % | | 2.12 | % | | 3.33 | % | | 3.33 | % | | 38.03 | % |
| Non-Agency RMBS, at fair value | 15,632 | | | 28,003 | | | 2.12 | % | | 2.18 | % | | 2.18 | % | | 3.55 | % | | 3.55 | % | | 35.00 | % |
Residential Whole Loans, at fair value(3) | 277,780 | | | 328,811 | | | 2.95 | % | | 4.10 | % | | 4.10 | % | | 5.70 | % | | 5.70 | % | | 18.71 | % |
Residential Bridge Loans(3) | 5,817 | | | 5,960 | | | 2.60 | % | | 2.66 | % | | 2.66 | % | | 2.71 | % | | 2.71 | % | | 20.00 | % |
Commercial loans, at fair value(3) | 74,272 | | | 101,271 | | | 2.40 | % | | 2.93 | % | | 2.93 | % | | 2.63 | % | | 2.63 | % | | 31.14 | % |
| | | | | | | | | | | | | | | |
| Membership interest | — | | | — | | | — | % | | 3.08 | % | | 3.08 | % | | 3.02 | % | | 3.02 | % | | — | % |
| Other securities, at fair value | 30,093 | | | 52,093 | | | 2.24 | % | | 2.30 | % | | 2.30 | % | | 3.20 | % | | 3.20 | % | | 37.15 | % |
| Interest rate swaps | n/a | | n/a | | n/a | | n/a | | (0.10) | % | | n/a | | (0.06) | % | | n/a |
| Total | $ | 483,308 | | | $ | 654,448 | | | 2.64 | % | | 3.08 | % | | 2.98 | % | | 3.58 | % | | 3.52 | % | | 25.47 | % |
(1)The effective cost of funds for the period presented is calculated on an annualized basis and includes interest expense for the period and net periodic interest payments on interest rate swaps, net of premium amortization on MAC swaps, of approximately $96 thousand and $172 thousand received for the three and nine months ended September 30, 2021. While interest rate swaps are not accounted for using hedge accounting, such instruments are viewed by us as an economic hedge against increases in interest rates on our liabilities and are treated as hedges for purposes of satisfying the REIT requirements. See “Non-GAAP Financial Measures.”
(2)Includes repurchase agreement borrowings on securities eliminated upon VIE consolidation.
| | | | | | | | | | | | | | | | | | | | | | | | | | | | | |
| | Less than 1
year | | 1 to 3
years | | 3 to 5
years | | More than
5 years | | Total |
| Borrowings under repurchase agreements | $ | 266,145 | | | $ | 92,733 | | | $ | — | | | $ | — | | | $ | 358,878 | |
| Contractual interest on repurchase agreements | 8,563 | | | 462 | | | — | | | — | | | 9,025 | |
| Convertible senior unsecured notes | — | | | 200,000 | | | — | | | — | | | 200,000 | |
| Contractual interest on convertible senior unsecured notes | 6,750 | | | 20,250 | | | — | | | — | | | 27,000 | |
Securitized debt(2) | 443,622 | | | — | | | 1,374,376 | | | 973,692 | | | 2,791,690 | |
Contractual interest on securitized debt(3) | 89,560 | | | 169,953 | | | 169,953 | | | 714,207 | | | 1,143,673 | |
| | | | | | | | | |
| | | | | | | | | |
| Total: GAAP Basis - Excluding TBA - long positions | 814,640 | | | 483,398 | | | 1,544,329 | | | 1,687,899 | | | 4,530,266 | |
| TBA - long positions | — | | | — | | | — | | | — | | | — | |
| Total | $ | 814,640 | | | $ | 483,398 | | | $ | 1,544,329 | | | $ | 1,687,899 | | | $ | 4,530,266 | |
| | | | | | | | | | | | | | | | | | | | | | | | | | | | | | | | | | | | | | | | | | | | | | | |
| September 30, 2020 | | Three months ended September 30, 2020 | | Nine months ended September 30, 2020 | | |
| Collateral | Borrowings
Outstanding | | Fair Value of Collateral Pledged(3) | | Weighted
Average
Interest Rate
end of period | | Weighted
Average Cost
of Funds | | Weighted Average Effective Cost of Funds (Non-GAAP)(1) | | Weighted
Average Cost
of Funds | | Weighted Average Effective Cost of Funds (Non-GAAP)(1) | | Weighted
Average
Haircut
end of period |
| Agency CMBS, at fair value | $ | — | | | $ | — | | | — | % | | — | % | | — | % | | 2.21 | % | | 2.21 | % | | — | % |
| Agency RMBS, at fair value | 1,438 | | | 1,853 | | | 1.46 | % | | 1.62 | % | | 1.62 | % | | 2.00 | % | | 2.00 | % | | 25.00 | % |
Non-Agency CMBS, at fair value(2) | 83,264 | | | 165,699 | | | 5.03 | % | | 5.26 | % | | 5.26 | % | | 3.86 | % | | 3.86 | % | | 41.21 | % |
| Non-Agency RMBS, at fair value | 14,742 | | | 25,817 | | | 5.25 | % | | 5.45 | % | | 5.45 | % | | 4.61 | % | | 4.61 | % | | 33.33 | % |
Residential Whole Loans, at fair value(3) | 40,061 | | | 105,059 | | | 4.98 | % | | 5.95 | % | | 5.95 | % | | 3.85 | % | | 3.85 | % | | 59.21 | % |
Residential Bridge Loans(3) | 15,763 | | | 16,828 | | | 2.75 | % | | 2.90 | % | | 2.90 | % | | 3.43 | % | | 3.43 | % | | 20.00 | % |
Commercial loans, at fair value(3) | 168,397 | | | 325,651 | | | 2.45 | % | | 2.84 | % | | 2.84 | % | | 3.29 | % | | 3.29 | % | | 35.53 | % |
| Membership interest | 18,845 | | | 33,495 | | | 2.90 | % | | 3.88 | % | | 3.88 | % | | 3.87 | % | | 3.87 | % | | 35.00 | % |
| | | | | | | | | | | | | | | |
| Other securities, at fair value | 16,368 | | | 41,055 | | | 5.13 | % | | 5.34 | % | | 5.34 | % | | 3.93 | % | | 3.93 | % | | 36.87 | % |
| Interest rate swaps | n/a | | n/a | | n/a | | n/a | | — | % | | n/a | | 0.11 | % | | n/a |
| Total | $ | 358,878 | | | $ | 715,457 | | | 3.60 | % | | 4.00 | % | | 4.00 | % | | 3.06 | % | | 3.17 | % | | 38.44 | % |
(1)The effective cost of funds for the period presented is calculated on an annualized basis and includes interest expense for the period and net periodic interest payments on interest rate swaps, net of premium amortization on MAC swaps, of zero and $1.1 million paid for the three and nine months ended September 30, 2020, respectively. While interest rate swaps are not accounted for using hedge accounting, such instruments are viewed by us as an economic hedge against increases in interest rates on our liabilities and are treated as hedges for purposes of satisfying the REIT requirements. See “Non-GAAP Financial Measures.”
(2)Includes repurchase agreement borrowings on securities eliminated upon VIE consolidation.
(3)Repurchase agreement borrowings collateralized by Whole Loans, Bridge Loans and commercial loan owned through trust certificates. The trust certificates are eliminated upon consolidation.
Contractual Obligations and Commitments
Our contractual obligations as of September 30, 2021 are as follows (dollars in thousands):
| | | | | | | | | | | | | | | | | | | | | | | | | | | | | |
| | Less than 1
year | | 1 to 3
years | | 3 to 5
years | | More than
5 years | | Total |
| Borrowings under repurchase agreements | $ | 449,566 | | | $ | 33,742 | | | $ | — | | | $ | — | | | $ | 483,308 | |
| Contractual interest on repurchase agreements | 3,880 | | | 87 | | | — | | | — | | | 3,967 | |
| Convertible senior unsecured notes | — | | | 131,948 | | | — | | | — | | | 131,948 | |
| Contractual interest on convertible senior unsecured notes | 7,154 | | | 13,186 | | | — | | | — | | | 20,340 | |
Securitized debt(2) | — | | | — | | | 1,370,691 | | | 610,900 | | | 1,981,591 | |
| Contractual interest on securitized debt | 74,416 | | | 148,832 | | | 92,703 | | | 438,585 | | | 754,536 | |
| | | | | | | | | |
| | | | | | | | | |
| | | | | | | | | |
| | | | | | | | | |
| Total | $ | 535,016 | | | $ | 327,795 | | | $ | 1,463,394 | | | $ | 1,049,485 | | | $ | 3,375,690 | |
(1)The table above does not include amounts due under the Management Agreement (as defined herein) with our Manager, as those obligations do not have fixed and determinable payments.
(2)The securitized debt is non-recourse to us and can only be settled with the loans that serve as collateral. The collateral for the securitized debt has a principal balance of $2.9$2.0 billion. Assumes entire outstanding principal balance at September 30, 20202021 is paid at maturity.
(3)For variable rate debt, the one month LIBOR rate as of September 30, 2020 of 0.2% was used to calculate the contractual interest.
Management Agreement
On May 9, 2012, we entered into a management agreement (the “Management Agreement”) with our Manager which describes the services to be provided by our Manager and compensation for such services. Our Manager is responsible for managing our operations, including: (i) performing all of our day-to-day functions; (ii) determining investment criteria in conjunction with our Board of Directors; (iii) sourcing, analyzing and executing investments, asset sales and financings; (iv) performing asset management duties; and (v) performing financial and accounting management, subject to the direction and oversight of our Board of Directors. Pursuant to the terms of the Management Agreement, our Manager is paid a management fee equal to 1.50% per annum of our stockholders’ equity, (as defined in the Management Agreement), calculated and payable (in cash) quarterly in arrears. The Manager waived the management fee for March 2020 through May 2020 because of the
unprecedented market disruption and dislocation across fixed income markets surrounding the uncertainty related to COVID-19 pandemic. Future waivers, if any, are at the Manager's discretion.
Off-Balance Sheet Arrangements
We do not have any relationships with any entities or financial partnerships, such as entities often referred to as structured investment vehicles, or special purpose or variable interest entities, established to facilitate off-balance sheet arrangements or other contractually narrow or limited purposes.
Further, other than guaranteeing certain obligations of our wholly-owned taxable REIT subsidiary or TRS and the obligations of our wholly-owned subsidiary, WMC CRE LLC, we have not guaranteed any obligations of any entities or entered into any commitment to provide additional funding to any such entities.
Dividends
To preserve liquidity, we suspended our first and second quarter common stock dividends in 2020 given extraordinary market volatility driven by uncertainty surrounding the COVID-19 pandemic. InBeginning in the third quarter ofended September 30, 2020, the Companywe resumed itspaying a quarterly dividend after making progress strengthening itsour balance sheet and improving liquidity and earnings power of itsour investment portfolio. We will continue to evaluate each subsequent quarter to determine our ability to pay dividends to our stockholders based on our net taxable income if and to the extent authorized by our Board of Directors. Before we pay any dividend, whether for U.S. federal income tax purposes or otherwise, we must first meet both our operating requirements and debt service payments. If our cash available for distribution is less than our net taxable income, we could be required to sell assets or borrow funds to make cash distributions or we may make a portion of the required distribution in the form of a taxable stock distribution or distribution of debt securities.
Recent Developments
On November 5, 2021, we entered into an amendment of our Residential Whole Loan Facility. The amendment facility bears an interest rate of LIBOR plus 2.00%, with a LIBOR floor of 0.25%. The facility is available to finance five types of residential mortgages: Non-Agency mortgage loans, Non-QM loans, BPL-Long, re-performing and non-performing loans. The advance rates differ by type of loan, but for performing Non-QM loans the advance rate is 90%. The facility matures on November 5, 2022. The facility is a mark to market margin facility once the collateral value declines below par and has a stated capacity of $500 million.
ITEM 3. Quantitative and Qualitative Disclosures about Market Risk.
We seek to manage the risks related to the credit quality of our assets, interest rates, liquidity, prepayment speeds and market values while, at the same time, seeking to provide an opportunity to stockholders to realize attractive risk-adjusted returns from our assets through ownership of our common stock. While we do not seek to avoid risk completely, our Manager seeks to actively manage risk for us, to earn sufficient compensation to justify taking those risks and to maintain capital levels consistent with the risks we undertake.
Credit Risk
We are subject to varying degrees of credit risk in connection with our assets. We are exposed to the risk of potential credit losses from general credit spread widening related to instruementsinstruments that make up most of our current portfolio. As part of the risk management process, our Manager uses detailed proprietary models, applicable to evaluate, depending on the asset class, house price appreciation and depreciation by region, prepayment speeds and foreclosure/default frequency, cost and timing. If our Manager determines that the proposed investment can meet the appropriate risk and return criteria as well as complement our existing asset portfolio, the investment will undergo a more thorough analysis. Investments are evaluated and decisions are made following a bottom-up credit analysis and specific relevant risk assumptions.
As of September 30, 2020,2021, four of theour counterparties that we had outstanding repurchase agreement borrowings held collateral which we posted as security for such borrowings in excess of 5% of our stockholders’ equity. Prior to entering into a repurchase agreement with any particular institution, our Manager does a thorough review of such potential counterparty. Such review, however, does not assure the creditworthiness of such counterparty nor that the financial wherewithal of the counterparty will not deteriorate in the future.
Interest Rate Risk
Interest rates are highly sensitive to many factors, including fiscal and monetary policies and domestic and international economic and political considerations, as well as other factors beyond our control. We are subject to interest rate risk in connection with our assets and our related financing obligations. In general, we expect to finance the acquisition of our assets through financings in the form of repurchase agreements, warehouse facilities, securitizations, bank credit facilities (including term loans and revolving facilities) and public and private equity and debt issuances in addition to transaction or asset specific funding arrangements. Subject to maintaining our qualification as a REIT for U.S. federal income tax purposes, we may utilize derivative financial instruments to hedge the interest rate risk associated with our borrowings. These hedging activities may not be effective. We also may engage in a variety of interest rate management techniques that seek to mitigate changes in interest rates or other potential influences on the values of our assets.
Interest Rate Effect on Net Interest Income
Our operating results will depend in large part on differences between the income earned on our assets and our borrowing costs. The cost of our borrowings is generally based on prevailing market interest rates. During a period of rising interest rates, our borrowing costs generally will increase and the yields earned on our leveraged fixed-rate mortgage assets will remain static. Further, the cost of such financing could increase at a faster pace than the yields earned on our leveraged ARM and hybrid ARM assets. This could result in a decline in our net interest spread and net interest margin. The severity of any such decline would depend on our asset/liability composition at the time as well as the magnitude and duration of the interest rate increase. Further, an increase in short-term interest rates could also have a negative impact on the market value of our assets. If any of these events happen, we could experience a decrease in net income or incur a net loss during these periods, which could adversely affect our liquidity and results of operations.
Interest Rate Cap Risk
To the extent we invest in adjustable-rate RMBS and Whole-Loans, such instruments may be subject to interest rate caps, which potentially could cause such instruments to acquire many of the characteristics of fixed-rate securities if interest rates were to rise above the cap levels. This issue is magnified to the extent we acquire ARM and hybrid ARM assets that are not based on mortgages which are fully indexed. In addition, ARM and hybrid ARM assets may be subject to periodic payment caps that result in some portion of the interest being deferred and added to the principal outstanding or a portion of the
incremental interest rate increase being deferred. To the extent we invest in such ARM and/or hybrid ARM assets, we could potentially receive less cash income on such assets than we would need to pay the interest cost on our related borrowings. To mitigate interest rate mismatches, we may utilize the hedging strategies discussed above under “Interest Rate Risk.”
Interest Rate Effects on Fair value
Another component of interest rate risk is the effect that changes in interest rates will have on the market value of the assets that we acquire. We face the risk that the market value of our assets will increase or decrease at different rates than those of our liabilities, including our hedging instruments. See “Market Risk” below.
The impact of changing interest rates on fair value can change significantly when interest rates change materially. Therefore, the volatility in the fair value of our assets could increase significantly in the event interest rates change materially. In addition, other factors impact the fair value of our interest rate-sensitive investments and hedging instruments, such as the shape of the yield curve, market expectations as to future interest rate changes and other market conditions. Accordingly, changes in actual interest rates may have a material adverse effect on us.
Market Risk
Our MBS and other assets are reflected at their fair value with unrealized gains and losses included in earnings. The fair value of our investments fluctuates primarily due to changes in interest rates and other factors. Generally, in a rising interest rate environment, the fair value of these assets would be expected to decrease; conversely, in a decreasing interest rate environment, the fair value of these securities would be expected to increase.
The sensitivity analysis table presented below shows the estimated impact of an instantaneous parallel shift in the yield curve, up and down 50 and 100 basis points, on the market value of our interest rate-sensitive investments, including interest rate swaps, Interest-Only Strips, and net interest income at September 30, 2020,2021, assuming a static portfolio of assets. When evaluating the impact of changes in interest rates, prepayment assumptions and principal reinvestment rates are adjusted based on our Manager’s expectations. The analysis presented utilizes our Manager’s assumptions, models and estimates, which are based on our Manager’s judgment and experience.
| | | | | | | | | | | | | | |
| Change in Interest Rates | | Percentage Change in Projected
Net Interest Income | | Percentage Change in Projected
Portfolio Value |
| +1.00% | | (8.44) | % | | (0.50) | % |
| +0.50% | | (4.25) | % | | (0.26) | % |
| -0.50% | | 4.91 | % | | 0.18 | % |
| -1.00% | | 9.89 | % | | 0.37 | % |
| | | | | | | | | | | | | | |
| Change in Interest Rates | | Percentage Change in Projected
Net Interest Income | | Percentage Change in Projected
Portfolio Value |
| +1.00% | | (0.18) | % | | (1.13) | % |
| +0.50% | | 0.12 | % | | (0.57) | % |
| -0.50% | | (0.05) | % | | 0.39 | % |
| -1.00% | | (1.22) | % | | 0.57 | % |
While the table above reflects the estimated immediate impact of interest rate increases and decreases on a static portfolio, we may rebalance our portfolio from time to time either to seek to take advantage of or reduce the impact of changes in interest rates. It is important to note that the impact of changing interest rates on market value and net interest income can change significantly when interest rates change beyond 100 basis points from current levels. Therefore, the volatility in the market value of our assets could increase significantly when interest rates change beyond amounts shown in the table above. In addition, other factors impact the market value of and net interest income from our interest rate-sensitive investments and derivative instruments, such as the shape of the yield curve, market expectations as to future interest rate changes and other market conditions. Accordingly, interest income would likely differ from that shown above and such difference might be material and adverse to our stockholders.
Certain assumptions have been made in connection with the calculation of the information set forth in the table above and, as such, there can be no assurance that assumed events will occur or that other events will not occur that would affect the outcomes. The base interest rate scenario assumes interest rates at September 30, 2020.2021. The analysis presented utilizes assumptions and estimates based on our Manager’s judgment and experience. Furthermore, while we generally expect to retain such assets and the associated interest rate risk, future purchases and sales of assets could materially change our interest rate risk profile.
Prepayment Risk
The value of our Agency and Non-Agency RMBS and our Residential Whole Loans may be affected by prepayment rates on the underlying residential mortgage. We acquire RMBS and Residential Whole Loans and anticipate that the underlying residential mortgages will prepay at a projected rate generating an expected yield. If we purchase assets at a premium to par value, when borrowers prepay their residential mortgage loans faster than expected, the corresponding prepayments may reduce the expected yield on our residential mortgage assets because we will have to amortize the related premium on an accelerated basis and, in the case of Agency RMBS, other than interest-only strips, and certain other investment grade rated securities, we are required to make a retrospective adjustment to historical amortization. Conversely, if we purchase assets at a discount to par value, when borrowers prepay their residential mortgage loans slower than expected, such decrease may reduce the expected yield on such assets because we will not be able to accrete the related discount as quickly as originally anticipated and, in the case of Agency RMBS, other than interest-only strips, and certain other investment grade rated securities, we will be required to make a retrospective adjustment to historical amortization.
The value of our Agency and Non-Agency CMBS, as well as Commercial Whole Loans, will also be affected by prepayment rates. However, commercial mortgages frequently limit the ability of the borrower to prepay, thereby providing a certain level of prepayment protection. Common restrictions include yield maintenance and prepayment penalties, the proceeds of which are generally at least partially allocable to these securities, as well as defeasance.
Likewise, the value of our ABS and other structured securities will also be affected by prepayment rates. The collateral underlying such securities may, similar to most residential mortgages, allow the borrower to prepay at any time or, similar to commercial mortgages, limit the ability of the borrower to prepay by imposing lock-out provisions, prepayment penalties and/or make whole provisions.
Extension Risk
Most residential mortgage loans do not prohibit the partial or full prepayment of principal outstanding. Accordingly, while the stated maturity of a residential mortgage loan may be 30 years, or in some cases even longer, historically the vast majority of residential mortgage loans are satisfied prior to their maturity date. In periods of rising interest rates, borrowers have less incentive to refinance their existing mortgages and mortgage financing may not be as readily available. This generally results in a slower rate of prepayments and a corresponding longer weighted average life for RMBS and Residential Whole Loans. The increase, or extension, in weighted average life is commonly referred to as “Extension Risk” which can negatively impact our portfolio. To the extent we receive smaller pre-payments of principal, we will have less capital to invest in new assets. This is extremely detrimental in periods of rising interest rates as we will be unable to invest in new higher coupon investments and a larger portion of our portfolio will remain invested in lower coupon investments. Further, our borrowing costs are generally short-term and, even if hedged, are likely to increase in a rising interest rate environment, thereby reducing our net interest margin. Finally, to the extent we acquired securities at a discount to par, a portion of the overall return on such investments is based on the recovery of this discount. Slower principal prepayments will result in a longer recovery period and a lower overall return on our investment.
Prepayment rates on Agency and Non-Agency CMBS, as well as Commercial Whole Loans, are generally less volatile than residential mortgage assets as commercial mortgages usually limit the ability of the borrower to prepay the mortgage prior to maturity or a period shortly before maturity. Accordingly, extension risk for Agency and Non-Agency CMBS and Commercial Whole Loans is generally less than RMBS and Residential Whole Loans as it presumed that other than defaults (i.e., involuntary prepayments), most commercial mortgages will remain outstanding for the contractual term of the mortgage.
Prepayment rates on ABS and our other structured securities will be determined by the underlying collateral. The extension risk of such securities will generally be less than residential mortgages, but greater than commercial mortgages.
Real Estate Risk
Residential and commercial property values are subject to volatility and may be adversely affected by a number of factors, including, but not limited to: national, regional and local economic conditions (which may be adversely affected by industry slowdowns and other factors); local real estate conditions (such as the supply of housing stock); changes or continued weakness in specific industry segments; construction quality, age and design; demographic factors; and retroactive changes to building or similar codes. In addition, the COVID 19 pandemic decreases in property values reducein the value of the collateralretail and the potential proceedshospitality
sectors since these sectors were more affected by health related shutdowns. There remains uncertainty around the timing and extent of a recovery in the performance in these property types and the reduction in value of the collateral and the potential proceeds available to a borrower to repay our loans, which could alsomay cause us to suffer further losses. The COVID 19 pandemic could have a significant impact on real estate values generally or as certain sectors more affected by health related shut downs or reductions in activity
Counterparty Risk
The following discussion on counterparty risk reflects how these transactions are structured, rather than how they are presented for financial reporting purposes.
When we engage in repurchase transactions, we generally sell securities to lenders (i.e., repurchase agreement counterparties) and receive cash from the lenders. The lenders are obligated to resell the same securities back to us at the end of the term of the transaction. Because the cash we receive from the lender when we initially sell the securities to the lender is less than the value of those securities (this difference is the haircut), if the lender defaults on its obligation to resell the same securities back to us, we could incur a loss on the transaction up to the amount of the haircut (assuming there was no change in the value of the securities).
If a counterparty to a bi-lateral interest rate swap cannot perform under the terms of the interest rate swap, we may not receive payments due under that agreement, and thus, we may lose any unrealized gain associated with the interest rate swap. We may also risk the loss of any collateral we have pledged to secure our obligations under an interest rate swap if the counterparty becomes insolvent or files for bankruptcy. In the case of a cleared swap, if our clearing broker were to default, become insolvent or file for bankruptcy, we may also risk the loss of any collateral we have posted to the clearing broker unless we were able to transfer or “port” our positions and held collateral to another clearing broker. In addition, the interest rate swap would no longer mitigate the impact of changes in interest rates as intended. Most of our interest swaps are currently cleared through a central clearing house which reduces but does not eliminate the aforementioned risks. Also see “Liquidity Risk” below.
Prior to entering into a trading agreement or transaction with any particular institution where we take on counterparty risk, our Manager does a thorough review of such potential counterparty. Such review, however, does not assure the creditworthiness of such counterparty nor that the financial wherewithal of the counterparty will not deteriorate in the future.
Funding Risk
We have financed a substantial majority of our assets with repurchase agreement financing. Over time, as market conditions change, in addition to these financings, we may use other forms of leverage. Changes in the regulatory environment, as well as, weakness in the financial markets, the residential mortgage markets, the commercial mortgage markets, the asset-backed securitization markets and the economy generally could adversely affect one or more of our potential lenders and could cause one or more of our potential lenders to be unwilling or unable to provide us with financing or to increase the costs of that financing.
Liquidity Risk
Our liquidity risk is principally associated with the financing of long-maturity assets with short-term borrowings in the form of repurchase agreements. Although the interest rate adjustments of these assets and liabilities fall within the guidelines established by our operating policies, maturities are not required to be, nor are they, matched.
Should the value of our assets pledged as collateral suddenly decrease, margin calls relating to our repurchase agreements could increase, causing an adverse change in our liquidity position. Our inability to post adequate collateral for a margin call by the counterparty could result in a condition of default under our repurchase agreements, thereby enabling the counterparty to liquidate the collateral pledged by us, which may have a material adverse consequence on our business and results of operations.
In an instance of severe volatility, or where the additional stress on liquidity resulting from volatility is sustained over an extended period of time, we could be required to sell securities, possibly even at a loss to generate sufficient liquidity to satisfy collateral and margin requirements which could have a material adverse effect on our financial position, results of operations and cash flows.
Additionally, if one or more of our repurchase agreement counterparties chose not to provide on-going funding, our ability to finance would decline or exist at possibly less advantageous terms. Further, if we are unable to renew, replace or expand repurchase financing with other sources of financing on substantially similar terms, it may have a material adverse effect on our business, financial position, results of operations and cash flows, due to the long term nature of our investments and relatively short-term maturities of our repurchase agreements. As such, there is no assurance that we will always be able to roll over our repurchase agreements.
The costs associated with our borrowings are generally based on prevailing market interest rates. During a period of rising interest rates, our borrowing costs generally will increase while the yields earned on our existing portfolio of leveraged fixed-rate MBS and other fixed rate assets will remain static. Further, certain of our floating rate assets may contain annual or lifetime interest rate caps as well as limit the frequency or timing of changes to the underlying interest rate index. This could result in a decline in our net interest spread and net interest margin. The severity of any such decline would depend on our asset/liability composition at the time, as well as the magnitude and duration of the interest rate increase. Further, an increase in short-term interest rates could also have a negative impact on the market value of our assets. If any of these events happen, we could experience a decrease in net income or incur a net loss during these periods, which could have a material adverse effect on our liquidity and results of operations.
In addition, the assets that comprise our investment portfolio are not traded on a public exchange. A portion of these assets may be subject to legal and other restrictions on resale or will otherwise be less liquid than publicly-traded securities. The illiquidity of our assets may make it difficult for us to sell such assets if the need or desire arises, including in response to changes in economic and other conditions. Recent regulatory changes have imposed new capital requirements and other restrictions on banks and other market intermediaries’ ability and desire to hold assets on their balance sheets and otherwise make markets in fixed income securities and other assets resulting in reduced liquidity in many sectors of the market. This regulatory trend is expected to continue. As a result of these developments, it may become increasingly difficult for us to sell assets in the market, especially in credit oriented sectors such as Non-Agency RMBS and CMBS, ABS and Whole Loans.
We enter into interest rate swaps to manage our interest rate risk. We are required to pledge cash or securities as collateral as part of a margin arrangement, calculated daily, in connection with the interest rate swaps. The amount of margin that we are required to post will vary and generally reflects collateral required to be posted with respect to interest rate swaps that are in an unrealized loss position to us and is generally based on a percentage of the aggregate notional amount of interest rate swaps per counterparty. Margin calls could adversely affect our liquidity. Our inability to post adequate collateral for a margin call could result in a condition of default under our interest rate swap agreements, thereby resulting in liquidation of the collateral pledged by us, which may have a material adverse consequence on our business, financial position, results of operations and cash flows. Conversely, if our interest rate swaps are in an unrealized gain position, our counterparties to bilateral swaps are required to post collateral with us, under the same terms that we post collateral with them. We generally enter into a MAC interest rate swap in which we receive or make a payment at the time of entering such interest rate swap to compensate for the out of the market nature of such interest rate swap. Similar to all other interest rate swaps, MAC interest rate swaps are subject to the margin requirements previously described.
Inflation
Virtually all of our assets and liabilities are interest rate sensitive in nature. As a result, interest rates and other factors influence our performance far more so than does inflation. Changes in interest rates do not necessarily directly correlate with inflation rates or changes in inflation rates. Our consolidated financial statements are prepared in accordance with GAAP and our distributions will be determined by our Board of Directors consistent with our obligation to distribute to our stockholders at least 90% of our net taxable income on an annual basis, in accordance with the REIT regulations, in order to maintain our REIT qualification. In each case, our activities and consolidated balance sheets are measured with reference to historical cost and/or fair market value without considering inflation.
Foreign Investment risk
We have invested in non U.S. CMBS transactions and, in the future, we may make other investments in non U.S. issuers and transactions. These investments present certain unique risks, including those resulting from future political, legal, and economic developments, which could include favorable or unfavorable changes in currency exchange rates, exchange control regulations (including currency blockage), expropriation, nationalization, or confiscatory taxation of assets, adverse changes in investment capital or exchange control regulations (which may include suspension of the ability to transfer currency from a country), political changes, diplomatic developments, difficulty in obtaining and enforcing judgments against non U.S. entities, the possible imposition of the applicable country’s governmental laws or restrictions, and the reduced availability of public information concerning issuers. In the event of a nationalization, expropriation, or other confiscation of assets, we could lose our entire investment in a security. Legal remedies available to investors in certain jurisdictions may be more limited than those available to investors in the United States. Issuers of non U.S. securities may not be subject to the same degree of regulation as U.S. issuers.
Furthermore, non U.S. issuers are not generally subject to uniform accounting, auditing, and financial reporting standards or other regulatory practices and requirements comparable to those applicable to U.S. issuers. There is generally less government supervision and regulation of non U.S. exchanges, brokers, and issuers than there is in the United States, and there is greater difficulty in taking appropriate legal action in non U.S. courts. There are also special tax considerations that apply to securities of non U.S. issuers and securities principally traded overseas.
To the extent that our investments are denominated in U.S. dollars, these investments are not affected directly by changes in currency exchange rates relative to the dollar and exchange control regulations. We are, however, subject to currency risk with respect to such investments to the extent that a decline in a non U.S. issuer’s or borrower’s own currency relative to the dollar may impair such issuer’s or borrower’s ability to make timely payments of principal and/or interest on a loan or other debt security. To the extent that our investments are in non-dollar denominated securities, the value of the investment and the net investment income available for distribution may be affected favorably or unfavorably by changes in currency exchange rates relative to the dollar and exchange control regulations.
Currency exchange rates can be volatile and affected by, among other factors, the general economics of a country, the actions of governments or central banks and the imposition of currency controls and speculation. In addition, a security may be denominated in a currency that is different from the currency where the issuer is domiciled.
Currency Risk
We have and may continue in the future to invest in assets which are denominated in a currency other than U.SU.S. dollars and may finance such investments with repurchase financing or other forms of financing which may also be denominated in a currency other than U.S. dollars. To the extent we make such investments and/or enter into such financing arrangements, we may utilize foreign currency swaps, forwards or other derivative instruments to hedge our exposure to foreign currency risk. Despite being economic hedges, we have elected not to treat such derivative instruments as hedges for accounting purposes and therefore the changes in the value of such instruments, including actual and accrued payments, will be included in our Consolidated Statements of Operations. While such transactions are entered into in an effort to minimize our foreign currency risk, there can be no assurance that they will perform as expected. If actual prepayments of the foreign denominated asset are faster, or slower, than expected, the hedge instrument is unlikely to fully protect us from changes in the valuation of such foreign currency. Further, as with interest rate swaps, there is counterparty risk associated with the future creditworthiness of such counterparty.
ITEM 4. Controls and Procedures
Disclosure Controls and Procedures: Our management is responsible for establishing and maintaining disclosure controls and procedures that are designed to ensure that information we are required to disclose in the reports that we file or submit under the Exchange Act is recorded, processed, summarized and reported, within the time periods specified in the SEC’s rules and forms. Disclosure controls and procedures include controls and procedures designed to ensure that the required information is accumulated and communicated to our management, including our principal executive officer and principal financial officer, as appropriate, to allow timely decisions regarding required disclosure.
We have evaluated, with the participation of our principal executive officer and principal financial officer, the effectiveness of our disclosure controls and procedures as of September 30, 2020.2021. There are inherent limitations to the effectiveness of any system of disclosure controls and procedures, including the possibility of human error and the circumvention or overriding of the controls and procedures. Accordingly, even effective disclosure controls and procedures can only provide reasonable assurance of achieving their control objectives. Based upon our evaluation, our principal executive officer and principal financial officer concluded that our disclosure controls and procedures were effective to provide reasonable assurance that information required to be disclosed by us in the reports that we file or submit under the Exchange Act is recorded, processed, summarized and reported, within the time periods specified in the applicable rules and forms, and that it is accumulated and communicated to our management, including our principal executive officer and principal financial officer, as appropriate to allow timely decisions regarding required disclosure.
No change occurred in our internal control over financial reporting (as defined in Rule13a-15(f) and Rule 15d-15(f) of the Exchange Act) during the three months ended September 30, 20202021 that has materially affected, or is reasonably likely to materially affect, our internal control over financial reporting.
PART II — OTHER INFORMATION
ITEM 1. Legal Proceedings
From time to time, the Company may be involved in various claims and legal actions arising in the ordinary course of business. As of September 30, 2020,2021, the Company was not involved in any material legal proceedings.
ITEM 1A. Risk Factors
The Company is supplementingThere were no material changes during the period covered by this report to the risk factors previously disclosed in our Annual Report on Form 10-K for the year ended December 31, 2019,2020, as filed with the SEC on March 6, 2020. These supplemental risk factors should be read in conjunction with the other risk factors described in the Form 10-K.
The COVID-19 pandemic and measures intended to prevent its spread have had and5, 2021. Additional risks not presently known, or that we currently deem immaterial, also may continue to have a material adverse effect on our business, financial condition and results of operations, liquidity and financial condition.
The COVID-19 pandemic is causing significant disruptions to the U.S. and global economies and has contributed to volatility and negative pressure in financial markets. The outbreak has led governments and other authorities around the world to impose measures intended to control its spread, including restrictions on freedom of movement and business operations such as travel bans, border closings, business closures, quarantines and shelter-in-place orders. The actual and potential impact and duration of COVID-19 or another pandemic have and are expected to continue to have significant repercussions across regional, national and global economies and financial markets, and have triggered a period of regional, national and global economic slowdown and may trigger a longer term recession. The impact of the pandemic and measures to prevent its spread have negatively impacted us and could further negatively impact our business. To the extent current conditions persist or worsen, we expect there to be a materially negative effect on the value of our assets and our results of operations, and, in turn, cash available for distribution to our stockholders. Moreover, many risk factors set forth in the Company’s Annual Report on Form 10-K for the year ended December 31, 2019 should be interpreted as heightened risks as a result of the ongoing and numerous adverse impacts of the COVID-19 pandemic.
Our commercial mortgages collateralized by hotels, retail properties are disproportionately impacted by the effects of COVID-19. We expect over the near- and long-term that the economic impacts of the pandemic will impact the financial stability of these borrowers As a result, we expect that some of our borrowers will experience financial hardship, making it difficult to meet their payment obligations to us, leading to requests for forbearance and elevated levels of delinquency and default, which will have an adverse effect on our business, the value of these assets and our results of operations and financial condition. Future outbreaks involving other highly infectious or contagious diseases could have similar adverse effects.
We are subject to risks related to residential mortgages. Over the near and long term, the economic and market disruptions caused by the COVID-19 pandemic are likely to adversely impact the financial condition of borrowers underlying our residential mortgage loan investments, As a result, we anticipate that the number of borrowers who become delinquent or default on their loans may increase significantly. Such increased levels of payment delinquencies, defaults, foreclosures, or losses would adversely affect our business, the value of these assets, results of operations and financial position. Future outbreaks involving other highly infectious or contagious diseases could have similar adverse effects.
In response to the pandemic, the U.S. government has taken various actions to support the economy and the continued functioning of the financial markets. The Federal Reserve has announced its commitment to purchase unlimited amounts of U.S. Treasuries, mortgage-backed securities, municipal bonds and other assets. In addition, President Trump signed into law the Coronavirus Aid, Relief, and Economic Security (CARES) Act, has and is expected to provide billions of dollars of relief to individuals, businesses, state and local governments, and the health care system suffering the impact of the pandemic, including mortgage loan forbearance and modification programs to qualifying borrowers who have difficulty making their loan payments. There can be no assurance as to how, in the long term, actions by the U.S. government intended to counter the effects of the COVID-19 pandemic, including the CARES Act, will affect the efficiency, liquidity and stability of the financial and mortgage markets. To the extent the financial or mortgage markets do not respond favorably to these government actions, or such actions do not function as intended, our business, results of operations and financial condition may continue to be materially adversely affected.
The extent to which the COVID-19 pandemic impacts our business will depend on future developments which are highly uncertain and cannot be predicted including new information which may emerge concerning the severity of COVID-19
and the actions to contain the pandemic or treat its impact, among others. If these effects continue for a prolonged period or result in a global economic slowdown or recession, many of the risk factors identified in our Annual Report on Form 10-K could be exacerbated and such effects could have a material adverse impact on our results of operations, value of our investments and cash available for distribution to our stockholders.
Our inability to access funding or the terms on which such funding is available could have a material adverse effect on our financial condition, particularly in light of ongoing market dislocations resulting from the COVID-19 pandemic.
Our ability to fund our operations, meet financial obligations and finance our asset may be impacted by our ability to secure and maintain our financings through master repurchase agreements and other borrowings with our counterparties. Because repurchase agreements are short-term commitments of capital, lenders may respond to market conditions making it more difficult for us to renew or replace on a continuous basis our maturing short-term borrowings and have and may continue to impose more onerous conditions when rolling such financings. If we are not able to renew our existing facilities or arrange for new financing on terms acceptable to us, or if we default on our covenants or are otherwise unable to access funds under our financing facilities or if we are required to post more collateral or face larger haircuts, we may have to dispose of assets at significantly depressed prices and at inopportune times, which could cause significant losses. If we are subject to a larger haircut in order to roll repurchase agreement or other borrowings with a particular counterparty then we would be required to post additional margin. Similarly, if we were to move financing to another counterparty that was subject to a larger haircut we would have to pay more cash to the original repurchase agreement counterparty than would be able to borrow from new counterparty.
In addition, if the regulatory capital requirements imposed on our lenders change, they may be required to significantly increase the cost of the financing that they provide to us. Our lenders also have revised and may continue to revise their eligibility requirements for the types of assets they are willing to finance or the terms of such financings, including haircuts and requiring additional collateral in the form of cash, based on, among other factors, the regulatory environment and their management of actual and perceived risk, particularly with respect to assignee liability. Moreover, the amount of financing we receive under our financing arrangements will be directly related to our lenders’ valuation of our assets subject to such agreements. Typically, repurchase agreements grant the lender the absolute right to reevaluate the fair market value of the assets that cover outstanding borrowings at any time. If a lender determines in its sole discretion that the value of the assets has decreased, it has the right to initiate a margin call. These valuations may be different than the values that we ascribe to these assets and may be influenced by recent asset sales and distressed levels by forced sellers. A margin call requires us to transfer additional assets to a lender without any advance of funds from the lender for such transfer or to repay a portion of the outstanding borrowings. We have experienced this phenomenon in recent weeks
In March and April 2020, we have observed a significant mark-down on our assets by the counterparties to our financing arrangements, resulting in us having to pay cash or securities to satisfy higher than historical levels of margin calls. The significant decline in asset values resulted in us having to sell assets in order to these meet margin calls by our repurchase agreement counterparties. If in the future we are unable to post adequate collateral for a margin call by a counterparty, in a time frame as short as the close of the same business day, it could result in a condition of default under certain of our repurchase agreements, thereby enabling the counterparty to liquidate the collateral pledged by us, which may have a material adverse effect on our financial position, results of operations and cash flows.
In connection with the market disruptions in the first and second quarters of 2020, resulting from the COVID-19 pandemic, we changed our interest rate hedging strategy and closed out of, or terminated all of our interest rate hedges, incurring realized losses. As a result, interest rate risk exposure that is associated with certain of our assets and liabilities is no longer being hedged in the manner that we previously used to address interest rate risk and our revised strategy to address interest rate risk may not be effective and could result in the occurrence of future realized losses.
In response to the recent market dislocations resulting from the global pandemic of COVID-19, we made the determination that certain of our interest rate hedges were no longer effective in hedging asset market values and, as of March 23, 2020, had terminated or closed out all of our outstanding interest rate hedges and, overall, incurred realized losses. While we are monitoring market conditions and determining when we believe it would be appropriate and effective to re-implement interest rate hedging strategies, including by taking into account our future business activities and assets and liabilities, we will be exposed to the impact that changes in benchmark interest rates may have on the value of the loans, securities and other assets we own that are sensitive to interest rate changes, as well as long-term debt obligations that are sensitive to interest rate changes. There can be no assurance that future market conditions and our financial condition in the future will enable us to re-
establish an effective interest rate risk hedging program, even if in the future we believe it would otherwise be appropriate or desirable to do so.
We cannot predict the effect that government policies, laws, and plans adopted in response to the COVID-19 pandemic or other future outbreaks involving highly infectious or contagious diseases and resulting recessionary economic conditions will have on us.
Governments have adopted, and we expect will continue to adopt, policies, laws, and plans intended to address the COVID-19 pandemic and adverse developments in the credit, financial, and mortgage markets that it has caused. We cannot assure you that these programs will be effective, sufficient, or otherwise have a positive impact on our business.
Market and economic disruptions caused by the COVID-19 pandemic have made it more difficult for us to determine the fair value of our investments.
Market-based inputs are generally the preferred source of values for purposes of measuring the fair value of our assets under U.S. GAAP. However, the markets for our investments have and continue to experience extreme volatility, reduced transaction volume and liquidity, and disruption as a result of the COVID-19 pandemic, which has made it more difficult for us, and for the providers of third-party valuations that we use, to rely on market-based inputs in connection with the valuation of our assets under U.S. GAAP. The fair value of certain of our investments may fluctuate over short periods of time, and our determinations of fair value may differ materially from the values that would have been used if a ready market for these investments existed. The value of our common and our results of operations could be adversely affected if our determinations regarding the fair value of these investments were materially higher than the values that we ultimately realize upon their disposal.
We may pay taxable dividends in our common stock and cash, in which case stockholders may sell shares of our common stock to pay tax on such dividends, placing downward pressure on the market price of our common stock.
We generally must distribute annually at least 90% of our REIT taxable income (subject to certain adjustments and excluding any net capital gain), in order to qualify as a REIT, and any REIT taxable income that we do not distribute will be subject to U.S. corporate income tax at regular rates. In March 2020, the Board of Directors of the Company determined it was prudent to conserve available liquidity and suspend the Company’s first quarter dividend. The Board of Directors will evaluate dividends in future periods based upon customary consideration, such as our cash balances, and cash flows and market conditions and could consider paying future dividends in shares of common stock, cash, or a combination of shares of common stock and cash.
On May 4, 2020 the IRS issued Revenue Procedure 2020-19, which modifies Revenue Procedure 2017-45 solely with respect to distributions by publicly owned REITs. Pursuant to this revenue procedure, effective for distributions declared on or after April 1, 2020, the IRS will treat the distribution of stock pursuant to an elective stock dividend as a distribution of property under Section 301 of the Code (i.e., as a dividend to the extent of our earnings and profits), as long as at least 10% of the total dividend is available in cash and certain other requirements outlined in the revenue procedure are met.
If we make a taxable dividend payable in cash and common stock, taxable stockholders receiving such dividends will be required to include the full amount of the dividend as ordinary income to the extent of our current and accumulated earnings and profits, as determined for U.S. federal income tax purposes. As a result, stockholders may be required to pay income tax with respect to such dividends in excess of the cash dividends received. If a U.S. stockholder sells the common stock that it receives as a dividend in order to pay this tax, the sales proceeds may be less than the amount included in income with respect to the dividend, depending on the market price of our common stock at the time of the sale. Furthermore, with respect to certain non-U.S. stockholders, we may be required to withhold U.S. federal income tax with respect to such dividends, including in respect of all or a portion of such dividend that is payable in common stock. If we make a taxable dividend payable in cash and our common stock and a significant number of our stockholders determine to sell shares of our common stock in order to pay taxes owed on dividends, it may put downward pressure on the trading price of our common stock.operations.
ITEM 2. Unregistered Sales of Equity Securities and Use of Proceeds
None.
ITEM 3. Defaults Upon Senior Securities
None.
ITEM 4. Mine Safety Disclosures
Not Applicable.
ITEM 5. Other Information
None.
ITEM 6. Exhibits
The following exhibits are filed as part of this report.
| | | | | | | | |
| Exhibit No. | | Description |
| | | |
| 3.1* | | |
| | | |
| 3.2* | | |
| | |
| 3.3* | | |
| | | |
| 4.1* | | |
| | | |
| 4.2* | | |
| | |
| 4.3* | | |
| | |
| 4.4* | | |
| | |
10.1* | | |
| | |
10.2* | | |
| | |
10.3* | | |
| | |
10.4* | | |
| | |
10.5* | | |
| | |
10.6* | | |
| | |
10.7* | | |
| | |
10.8* | | |
| | |
10.9* | | |
| | |
10.10* | | |
| | |
| | | | | | | | |
10.11* | | Amendment No. 1 to the Equity Distribution Agreement, dated June 5, 2020, among Western Asset Mortgage Capital Corporation, Western Asset Management Company, LLC and JMP Securities LLC, incorporated by reference to Exhibit 1.1 to the Current Report on Form 8-K, filed June 5, 2020. |
| | |
| 31.1 | | |
| | | |
| 31.2 | | |
| | | |
| 32.1 | | |
| | | |
| 101 | | The following materials from the Company’s Quarterly Report on Form 10-Q for the quarter ended September 30, 2019,2021, formatted in iXBRL (Inline eXtensible Business Reporting Language): (i) the Consolidated Balance Sheets as of September 30, 20202021 and December 31, 2019;2020; (ii) the Consolidated Statements of Operations for the three and nine months ended September 30, 20202021 and 2019;2020; (iii) the Consolidated Statements of Changes in Equity for the three and nine months ended September 30, 20202021 and 2019;2020; (iv) the Consolidated Statements of Cash Flows for the three and nine months ended September 30, 20202021 and 2019;2020; and (v) the Notes to Consolidated Financial Statements. |
| | |
| 104 | | Cover Page Interactive Data File (the cover page XBRL tags are embedded within the iXBRL document).
|
| | |
| | |
| | |
| | |
| | |
| | |
| | |
| | |
*Fully or partly previously filed.
SIGNATURES
Pursuant to the requirements of the Securities Exchange Act of 1934, this report has been signed below by the following persons on behalf of the registrant and in the capacities and on the dates indicated.
| | | | | | | | |
| | By: | /s/ JENNIFER W. MURPHYBONNIE M. WONGTRAKOOL |
| | | |
| | Jennifer W. Murphy/s/ BONNIE M. WONGTRAKOOL |
| | President, Chief Executive Officer and Director (Principal Executive Officer) |
| | |
| | November 6, 20205, 2021 |
| | | |
| | | |
| | By: | /s/ LISA MEYER |
| | | |
| | Lisa Meyer |
| | President, Chief Financial Officer and Treasurer (Principal Financial and Accounting Officer) |
| | |
| | November 6, 20205, 2021 |