UNITED STATES
SECURITIES AND EXCHANGE COMMISSION
Washington, D.C. 20549
______________
FORM 10-Q
______________
FORM 10-Q
(Mark One)
☒QUARTERLY REPORT PURSUANT TO SECTION 13 OR 15(d) OF THE SECURITIES EXCHANGE ACT OF 1934
For the quarterly period ended March 31, 20222023
OR
OR☐ | | | | | |
☐ | TRANSITION REPORT PURSUANT TO SECTION 13 OR 15(d) OF THE SECURITIES EXCHANGE ACT OF 1934 |
For the transition period from to
Commission File Number 000-56273
___________________________nuveen
Nuveen Global Cities REIT, Inc.
(Exact name of Registrant as specified in its Charter)
___________________________ | | | | | |
Maryland | 82-1419222 |
(State or other jurisdiction of incorporation or organization) | | 82-1419222
(I.R.S. Employer Identification No.) |
| | |
730 Third Avenue, 3rd Floor New York, NY | 10017 |
| (Address of principal executive offices) | | 10017
(Zip Code) |
Registrant’s telephone number, including area code: (212) 490-9000
_____________________________
Securities registered pursuant to Section 12(b) of the Act: | | | | | | | | | | | | | | |
| Title of each class | | Trading Symbol(s) | | Name of each exchange on which registered |
| None | | N/A | | N/A |
Indicate by check mark whether the registrant (1) has filed all reports required to be filed by Section 13 or 15(d) of the Securities Exchange Act of 1934 during the preceding 12 months (or for such shorter period that the registrant was required to file such reports), and (2) has been subject to such filing requirements for the past 90 days. Yes ☒ No ☐
Indicate by check mark whether the registrant has submitted electronically every Interactive Data File required to be submitted pursuant to Rule 405 of Regulation S-T (§ 232.405 of this chapter) during the preceding 12 months (or for such shorter period that the registrant was required to submit such files). Yes ☒ No ☐
Indicate by check mark whether the registrant is a large accelerated filer, an accelerated filer, a non-accelerated filer, a smaller reporting company, or an emerging growth company. See the definitions of “large accelerated filer,” “accelerated filer,” “smaller reporting company,” and “emerging growth company” in Rule 12b-2 of the Exchange Act.
| | | | | | | | | | | |
| Large accelerated filer | ☐ | Accelerated filer | ☐ |
| | | |
| Non-accelerated filer | ☒ | Smaller reporting company | ☐☒ |
| | | |
| | Emerging growth company | ☒ |
If an emerging growth company, indicate by check mark if the registrant has elected not to use the extended transition period for complying with any new or revised financial accounting standards provided pursuant to Section 13(a) of the Exchange Act. ☒
Indicate by check mark whether the Registrant is a shell company (as defined in Rule 12b-2 of the Exchange Act). Yes ☐ No ☒
As of May 13, 2022,12, 2023, there were 13,646,36818,550,150 outstanding shares of Class T common stock, 36,115,04548,218,360 outstanding shares of Class S common stock, 7,420,9788,517,324 outstanding shares of Class D common stock, 58,000,58885,398,570 outstanding shares of Class I common stock and 29,730,608 outstanding shares of Class N common stock.
Table of Contents
| | | | | | | | | | | |
| | | Page |
| | | |
| PagePART I | FINANCIAL INFORMATION | |
| | | |
| Item 1. | | |
| | |
| | Consolidated Financial Statements (Unaudited) | |
| | | |
| Consolidated | | |
| | | |
| | | |
| | | |
| | | |
| Item 2. | | |
| Item 3. | | |
| Item 4. | | |
| | | |
| | |
| PART II | | |
| | | |
| Item 1. | | |
| Item 1A. | | |
| Item 2. | | |
| Item 3. | | |
| Item 4. | | |
| Item 5. | | |
| Item 6. | | |
| | | |
ITEM 1. FINANCIAL STATEMENTS
Nuveen Global Cities REIT, Inc.
Consolidated Balance Sheets (unaudited)(Unaudited)
(in thousands, except share and per share data) | | | | | | | | | | | | |
| March 31,
2022 | | December 31,
2021 | |
| Assets | | | | |
| Investments in real estate, net | $ | 1,033,587 | | | $ | 909,832 | | |
| Investments in real estate-related securities, at fair value | 102,737 | | | 93,970 | | |
| Investments in international affiliated funds | 129,356 | | | 131,046 | | |
| Cash and cash equivalents | 116,971 | | | 36,163 | | |
| Investment in commercial mortgage loans, at fair value | 233,637 | | | 140,512 | | |
| Investments in real estate debt, at fair value | 59,354 | | | 14,183 | | |
| Restricted cash | 156,607 | | | 94,413 | | |
| Intangible assets, net | 61,756 | | | 57,473 | | |
| Other assets | 13,930 | | | 20,545 | | |
| Total assets | $ | 1,907,935 | | | $ | 1,498,137 | | |
| Liabilities and Equity | | | | |
| Credit facility | $ | 270,000 | | | $ | 238,000 | | |
| Subscriptions received in advance | 156,146 | | | 100,778 | | |
| Mortgages payable, net | 105,644 | | | 105,614 | | |
| Loan participation, at fair value | 47,803 | | | — | | |
| Due to affiliates | 35,074 | | | 30,006 | | |
| Intangible liabilities, net | 24,211 | | | 22,522 | | |
| Accounts payable, accrued expenses, and other liabilities | 23,253 | | | 14,810 | | |
| Distributions payable | 6,822 | | | 5,323 | | |
| Total liabilities | 668,953 | | | 517,053 | | |
| Redeemable non-controlling interest | 276 | | | 258 | | |
| Equity | | | | |
| Series A Preferred Stock | 126 | | | 126 | | |
| Common stock - Class T shares, $0.01 par value per share, 500,000,000 shares authorized, 11,849,851 and 9,201,452 shares issued and outstanding at March 31, 2022 and December 31, 2021, respectively | 119 | | | 92 | | |
| Common stock - Class S shares, $0.01 par value per share, 500,000,000 shares authorized, 30,913,220 and 23,809,171 issued and outstanding at March 31, 2022 and December 31, 2021, respectively | 310 | | | 238 | | |
| Common stock - Class D shares, $0.01 par value per share, 500,000,000 shares authorized, 6,301,746 and 4,648,665 issued and outstanding at March 31, 2022 and December 31, 2021, respectively | 62 | | | 46 | | |
| Common stock - Class I shares, $0.01 par value per share, 500,000,000 shares authorized, 43,743,078 and 31,460,729 shares issued and outstanding at March 31, 2022 and December 31, 2021, respectively | 439 | | | 316 | | |
| Common stock - Class N shares, $0.01 par value per share, 100,000,000 shares authorized, 29,730,608 shares issued and outstanding at March 31, 2022 and December 31, 2021 | 297 | | | 297 | | |
| Additional paid-in capital | 1,329,491 | | | 1,043,073 | | |
| Accumulated deficit and cumulative distributions | (90,787) | | | (63,958) | | |
| | | | | | | | | | | | | | |
| March 31,
2023 | | December 31,
2022 | | | |
| Assets | | | | | | |
| Investments in real estate, net | $ | 1,765,302 | | | $ | 1,760,484 | | | | |
| Investments in commercial mortgage loans, at fair value | 349,541 | | | 343,970 | | | | |
| Investments in real estate-related securities, at fair value | 128,148 | | | 116,164 | | | | |
| Investments in international affiliated funds | 126,205 | | | 127,224 | | | | |
| Investments in real estate debt, at fair value | 110,106 | | | 98,252 | | | | |
| Intangible assets, net | 117,755 | | | 122,991 | | | | |
| Cash and cash equivalents | 41,907 | | | 43,073 | | | | |
| Restricted cash | 25,932 | | | 32,348 | | | | |
| Other assets | 28,410 | | | 26,355 | | | | |
| Total assets | $ | 2,693,306 | | | $ | 2,670,861 | | | | |
| Liabilities and Equity | | | | | | |
| Credit facility | $ | 190,500 | | | $ | 190,000 | | | | |
| Mortgages payable, net | 188,839 | | | 187,908 | | | | |
| Loan participations, at fair value | 179,387 | | | 175,830 | | | | |
| Note payable, at fair value | 69,060 | | | 69,030 | | | | |
| Accounts payable, accrued expenses and other liabilities | 100,561 | | | 74,571 | | | | |
| Due to affiliates | 51,116 | | | 50,637 | | | | |
| Intangible liabilities, net | 38,721 | | | 40,232 | | | | |
| Subscriptions received in advance | 24,657 | | | 31,147 | | | | |
| Distributions payable | 10,131 | | | 10,065 | | | | |
| Total liabilities | 852,972 | | | 829,420 | | | | |
| Redeemable non-controlling interest | 360 | | | 610 | | | | |
| Equity | | | | | | |
| Series A Preferred Stock | 125 | | | 125 | | | | |
| Common stock - Class T shares, $0.01 par value per share, 500,000,000 shares authorized, 17,750,167 and 17,285,298 shares issued and outstanding at March 31, 2023 and December 31, 2022, respectively | 176 | | | 172 | | | | |
| Common stock - Class S shares, $0.01 par value per share, 500,000,000 shares authorized, 46,144,672 and 45,277,146 issued and outstanding at March 31, 2023 and December 31, 2022, respectively | 461 | | | 453 | | | | |
| Common stock - Class D shares, $0.01 par value per share, 500,000,000 shares authorized, 7,993,000 and 8,009,944 issued and outstanding at March 31, 2023 and December 31, 2022, respectively | 79 | | | 79 | | | | |
| Common stock - Class I shares, $0.01 par value per share, 500,000,000 shares authorized, 80,846,370 and 79,727,458 shares issued and outstanding at March 31, 2023 and December 31, 2022, respectively | 811 | | | 799 | | | | |
| Common stock - Class N shares, $0.01 par value per share, 100,000,000 shares authorized, 29,730,608 shares issued and outstanding at March 31, 2023 and December 31, 2022, respectively | 297 | | | 297 | | | | |
| Additional paid-in capital | 2,091,877 | | | 2,060,366 | | | | |
| Accumulated deficit and cumulative distributions | (254,166) | | | (220,425) | | | | |
| Accumulated other comprehensive loss | (3,752) | | | (5,137) | | | | |
| Total stockholder's equity | 1,835,908 | | | 1,836,729 | | | | |
| Non-controlling interests attributable to third party joint ventures | 4,066 | | | 4,102 | | | | |
| Total equity | 1,839,974 | | | 1,840,831 | | | | |
| Total liabilities and equity | $ | 2,693,306 | | | $ | 2,670,861 | | | | |
| | | | | | |
| The accompanying notes are an integral part of these consolidated financial statements. | | | |
| | | | | | | | | | | | |
| Accumulated other comprehensive loss | (2,205) | | | (239) | | |
| Total stockholder's equity | 1,237,852 | | | 979,991 | | |
| Non-controlling interest attributable to third party joint venture | 854 | | | 835 | | |
| Total equity | 1,238,706 | | | 980,826 | | |
| Total liabilities and equity | $ | 1,907,935 | | | $ | 1,498,137 | | |
| The accompanying notes are an integral part of these consolidated financial statements. | |
Nuveen Global Cities REIT, Inc.
Consolidated Statements of Operations (Unaudited)
(in thousands, except share and per share data) | | | | | | | | | | | | | | | |
| | | Three Months Ended
March 31, |
| | | | | 2022 | | 2021 |
| Revenues | | | | | | | |
| Rental revenue | | | | | $ | 21,668 | | | $ | 11,262 | |
| Income from commercial mortgage loans | | | | | 1,995 | | | — | |
| Total revenues | | | | | 23,663 | | | 11,262 | |
| Expenses | | | | | | | |
| Rental property operating | | | | | 7,561 | | | 3,514 | |
| General and administrative | | | | | 2,096 | | | 1,057 | |
| Advisory fee due to affiliate | | | | | 4,706 | | | 1,064 | |
| Depreciation and amortization | | | | | 12,367 | | | 5,484 | |
| Total expenses | | | | | 26,730 | | | 11,119 | |
| Other income (expense) | | | | | | | |
| Realized and unrealized (loss) income from real estate-related securities | | | | | (3,404) | | | 2,881 | |
| Realized and unrealized loss from real estate debt | | | | | (706) | | | — | |
| Income from equity investments in unconsolidated international affiliated funds | | | | | 859 | | | 689 | |
| | | | | | | |
| Interest income | | | | | 330 | | | 60 | |
| Interest expense | | | | | (1,796) | | | (943) | |
| Total other income (expense) | | | | | (4,717) | | | 2,687 | |
| Net (loss) income | | | | | $ | (7,784) | | | $ | 2,830 | |
| Net income attributable to non-controlling interest in third party joint venture | | | | | 19 | | | — | |
| Net income attributable to preferred stock | | | | | 4 | | | 8 | |
| Net (loss) income attributable to common stockholders | | | | | $ | (7,807) | | | $ | 2,822 | |
| Net (loss) income per share of common stock - basic and diluted | | | | | $ | (0.07) | | | $ | 0.06 | |
| Weighted-average shares of common stock outstanding, basic and diluted | | | | | 114,256,504 | | | 43,986,617 | |
| | | | | | | | | | | | | | | |
| | | Three Months Ended March 31, |
| | | | | 2023 | | 2022 |
| Revenues | | | | | | | |
| Rental revenue | | | | | $ | 42,334 | | | $ | 21,668 | |
| Income from commercial mortgage loans | | | | | 6,485 | | | 1,995 | |
| Total revenues | | | | | 48,819 | | | 23,663 | |
| Expenses | | | | | | | |
| Rental property operating | | | | | 14,939 | | | 7,561 | |
| General and administrative | | | | | 2,437 | | | 2,096 | |
| Advisory fee due to affiliate | | | | | 8,042 | | | 4,706 | |
| Depreciation and amortization | | | | | 21,260 | | | 12,367 | |
| Total expenses | | | | | 46,678 | | | 26,730 | |
| Other income (expense) | | | | | | | |
| Realized and unrealized gain (loss) from real estate-related securities | | | | | 2,996 | | | (3,404) | |
| Realized and unrealized loss from real estate debt | | | | | (403) | | | (706) | |
| (Loss) income from equity investments in unconsolidated international affiliated funds | | | | | (355) | | | 859 | |
| Unrealized loss on commercial mortgage loans | | | | | (949) | | | — | |
| Unrealized loss on note payable | | | | | (30) | | | — | |
| Interest income | | | | | 1,884 | | | 330 | |
| Interest expense | | | | | (8,629) | | | (1,796) | |
| Total other income (expense) | | | | | (5,486) | | | (4,717) | |
| Net loss | | | | | $ | (3,345) | | | $ | (7,784) | |
| Net (loss) income attributable to non-controlling interests in third party joint ventures | | | | | (36) | | | 19 | |
| Net income attributable to preferred stock | | | | | 4 | | | 4 | |
| Net loss attributable to common stockholders | | | | | $ | (3,313) | | | $ | (7,807) | |
| Net loss per share of common stock - basic and diluted | | | | | $ | (0.02) | | | $ | (0.07) | |
| Weighted-average shares of common stock outstanding, basic and diluted | | | | | 182,210,463 | | | 114,256,504 | |
| | | | | | | |
The accompanying notes are an integral part of these consolidated financial statements.
Nuveen Global Cities REIT, Inc.
Consolidated Statements of Comprehensive Income (Loss) (Unaudited)
(in thousands)
| | | | | | | | | | | | | | | | | |
| | | Three Months Ended
March 31, |
| | | | | 2022 | | 2021 |
| Net (loss) income | | | | | $ | (7,784) | | | $ | 2,830 | |
| Other comprehensive (loss) income: | | | | | | | |
| Foreign currency translation adjustment | | | | | (1,966) | | | (1,261) | |
| Comprehensive (loss) income | | | | | (9,750) | | | 1,569 | |
| Comprehensive income attributable to non-controlling interest in third party joint venture | | | | | 19 | | | — | |
| Comprehensive income attributable to preferred stock | | | | | 4 | | | 8 | |
| Comprehensive (loss) income attributable to common stockholders | | | | | $ | (9,773) | | | $ | 1,561 | |
| | | | | | | | | | | | | | | |
| | | Three Months Ended March 31, |
| | | | | 2023 | | 2022 |
| Net loss | | | | | $ | (3,345) | | | $ | (7,784) | |
| Other comprehensive income (loss): | | | | | | | |
| Foreign currency translation adjustment | | | | | 1,385 | | | (1,966) | |
| Comprehensive loss | | | | | (1,960) | | | (9,750) | |
| Comprehensive (loss) income attributable to non-controlling interests in third party joint ventures | | | | | (36) | | | 19 | |
| Comprehensive income attributable to preferred stock | | | | | 4 | | | 4 | |
| Comprehensive loss attributable to common stockholders | | | | | $ | (1,928) | | | $ | (9,773) | |
The accompanying notes are an integral part of these consolidated financial statements.
Nuveen Global Cities REIT, Inc.
Consolidated Statements of Changes in Equity (unaudited)(Unaudited)
(in thousands, except share data) | | | | | | | | | | | | | | | | | | | | | |
Three Months Ended September 30, 2021 |
| | | | | | | | | | | |
| | | | | | | | | | | | | | |
| | | | | | | | | | | | | | | | | | | |
| | | | | | | | | | | | | | | | | | | |
| | | | | | | | | | | | | | | | | | | |
| | | | | | | | | | | | | | | | | | | |
| | | | | | | | | | | | | | | | | | | |
| | | | | | | | | | | | | | | | | | | |
| | | | | | | | | | | | | | | | | | | |
| | | | | | | | | | | | | | | | | | | |
| | | | | | | | | | | | | | | | | | | |
| | | | | | | | | | | | | | | | | | | |
| | | | | | | | | | | | | | | | | | | |
| | | | | | | | | | | | | | | | | | | |
. | | | | | | | | | | | | | | | | | | | | | |
Three Months Ended September 30, 2020 |
| | | | | | | | | | | |
| | | | | | | | | | | | | | | |
| | | | | | | | | | | | | | | | | | | |
| | | | | | | | | | | | | | | | | | | |
| | | | | | | | | | | | | | | | | | | |
| | | | | | | | | | | | | | | | | | | |
| | | | | | | | | | | | | | | | | | | |
| | | | | | | | | | | | | | | | | | | |
| | | | | | | | | | | | | | | | | | | |
| | | | | | | | | | | | | | | | | | | |
| | | | | | | | | | | | | | | | | | | |
| | | | | | | | | | | | | | | | | | | |
| | | | | | | | | | | | | | | | | | | | | | | | | | | | | | | | | | | | | | | | | | | | | | | | | | | | | | | | | | | | | | | | | | | | | | | |
| Three Months Ended March 31, 2022 |
| Preferred
Stock | | Par Value | | Additional
Paid-in
Capital | | Accumulated
Deficit and
Cumulative
Distributions | | Accumulated Other Comprehensive Income (Loss) | | Total Stockholders' Equity | | Non-Controlling Interest Attributable to Third Party Joint Venture | | Total
Equity |
| | Common
Stock
Class T | | Common Stock Class S | | Common
Stock
Class D | | Common
Stock
Class I | | Common
Stock
Class N | | | | | | |
| Balance at December 31, 2021 | $ | 126 | | | $ | 92 | | | $ | 238 | | | $ | 46 | | | $ | 316 | | | $ | 297 | | | $ | 1,043,073 | | | $ | (63,958) | | | $ | (239) | | | $ | 979,991 | | | $ | 835 | | | $ | 980,826 | |
| Issuance of 23,687,878 shares of common stock (net of $143 of offering costs) | — | | | 26 | | | 70 | | | 16 | | | 121 | | | — | | | 282,532 | | | — | | | — | | | 282,765 | | | — | | | 282,765 | |
Distribution reinvestment
| — | | | 1 | | | 2 | | | — | | (a) | 2 | | | — | | | 5,869 | | | — | | | — | | | 5,874 | | | — | | | 5,874 | |
| | | | | | | | | | | | | | | | | | | | | | | |
| Common stock repurchased | — | | | ��� | | (a) | — | | (a) | — | | (a) | — | | (a) | — | | | (2,058) | | | — | | | — | | | (2,058) | | | — | | | (2,058) | |
| Amortization of restricted stock grants | — | | | — | | | — | | | — | | | — | | | — | | | 93 | | | — | | | — | | | 93 | | | — | | | 93 | |
| Net income (loss) | 4 | | | — | | | — | | | — | | | — | | | — | | | — | | | (7,807) | | | — | | | (7,803) | | | 19 | | | (7,784) | |
| Distributions on common stock | — | | | — | | | — | | | — | | | — | | | — | | | — | | | (19,022) | | | — | | | (19,022) | | | — | | | (19,022) | |
| | | | | | | | | | | | | | | | | | | | | | | |
| Distribution on preferred stock | (4) | | | — | | | — | | | — | | | — | | | — | | | — | | | — | | | — | | | (4) | | | — | | | (4) | |
| Foreign currency translation adjustment | — | | | — | | | — | | | — | | | — | | | — | | | — | | | — | | | (1,966) | | | (1,966) | | | — | | | (1,966) | |
| Allocation to redeemable non-controlling interest | — | | | — | | | — | | | — | | | — | | | — | | | (18) | | | — | | | — | | | (18) | | | — | | | (18) | |
| Balance at March 31, 2022 | $ | 126 | | | $ | 119 | | | $ | 310 | | | $ | 62 | | | $ | 439 | | | $ | 297 | | | $ | 1,329,491 | | | $ | (90,787) | | | $ | (2,205) | | | $ | 1,237,852 | | | $ | 854 | | | $ | 1,238,706 | |
(a)Amount is not presented due to rounding; see Note 15.
| | Three Months Ended March 31, 2021 | |
| | Par Value | | Additional
Paid-in
Capital | | Accumulated
Deficit and
Cumulative
Distributions | | Accumulated Other Comprehensive Income (Loss) | | Total Stockholders' Equity | | Non-Controlling Interest Attributable to Third Party Joint Venture | | Total
Equity | | | | | | | | | | | | | | | | | | | | | | | | | | | | | | | | | | | | | | | | | | | | | | | | | | | | | | | | | | | | |
| |
Preferred
Stock | | Common
Stock
Class T | | Common Stock Class S | | Common
Stock
Class D | | Common
Stock
Class I | | Common
Stock
Class N | | | Preferred
Stock | | Par Value | | Additional
Paid-in
Capital | | Accumulated
Deficit and
Cumulative
Distributions | | Accumulated Other Comprehensive Income (Loss) | | Total Stockholders' Equity | | Non-Controlling Interests Attributable to Third Party Joint Ventures | | Total
Equity |
| Balance at December 31, 2020 | $ | 250 | | | $ | 33 | | | $ | 28 | | | $ | 13 | | | $ | 46 | | | $ | 297 | | | $ | 416,348 | | | $ | (42,406) | | | $ | 2,168 | | | $ | 376,777 | | | $ | — | | | $ | 376,777 | | |
| Issuance of 4,230,002 shares of common stock (net of $166 of offering costs) | — | | | 6 | | | 19 | | | 3 | | | 15 | | | — | | | 43,022 | | | — | | | — | | | $ | 43,065 | | | — | | | 43,065 | | |
| | | Preferred
Stock | | Common
Stock
Class T | | Common
Stock
Class S | | Common
Stock
Class D | | Common
Stock
Class I | | Common
Stock
Class N | | Additional
Paid-in
Capital | | Accumulated
Deficit and
Cumulative
Distributions | | Accumulated Other Comprehensive Income (Loss) | | Total Stockholders' Equity | | Non-Controlling Interests Attributable to Third Party Joint Ventures | | Total
Equity |
| Balance at December 31, 2022 | | Balance at December 31, 2022 | | $ | 172 | | | $ | 453 | | | $ | 79 | | | $ | 799 | | | $ | 297 | | |
| Issuance of 6,515,940 shares of common stock (net of $414 of offering costs) | | Issuance of 6,515,940 shares of common stock (net of $414 of offering costs) | — | | | 5 | | | 18 | | | — | | (a) | 42 | | | — | | | 82,629 | | | — | | | — | | | 82,694 | | | — | | | 82,694 | |
| Distribution reinvestment | Distribution reinvestment | — | | | — | | (a) | — | | (a) | — | | (a) | — | | (a) | — | | | 796 | | | — | | | — | | | $ | 796 | | | — | | | 796 | | Distribution reinvestment | — | | | 1 | | | 3 | | | 1 | | | 6 | | | — | | | 13,807 | | | — | | | — | | | 13,818 | | | — | | | 13,818 | |
| Preferred stock redemption | (125) | | | — | | | — | | | — | | | — | | | — | | | — | | | — | | | — | | | $ | (125) | | | — | | | (125) | | |
| Common stock repurchased | | Common stock repurchased | — | | | (2) | | | (13) | | | (1) | | | (36) | | | — | | | (65,228) | | | — | | | — | | | (65,280) | | | — | | | (65,280) | |
| Amortization of restricted stock grants | Amortization of restricted stock grants | — | | | — | | | — | | | — | | | — | | | — | | | 17 | | | — | | | — | | | $ | 17 | | | — | | | 17 | | Amortization of restricted stock grants | — | | | — | | | — | | | — | | | — | | | — | | | 53 | | | — | | | — | | | 53 | | | — | | | 53 | |
| Common stock repurchased | — | | | — | | | — | | | — | | | — | | | — | | | (290) | | | — | | | — | | | $ | (290) | | | — | | | (290) | | |
| Net income (loss) | Net income (loss) | 8 | | | — | | | — | | | — | | | — | | | — | | | — | | | 2,822 | | | — | | | $ | 2,830 | | | — | | | 2,830 | | Net income (loss) | 4 | | | — | | | — | | | — | | | — | | | — | | | — | | | (3,313) | | | — | | | (3,309) | | | (36) | | | (3,345) | |
| Distributions on common stock | Distributions on common stock | — | | | — | | | — | | | — | | | — | | | — | | | — | | | (6,546) | | | — | | | $ | (6,546) | | | — | | | (6,546) | | Distributions on common stock | — | | | — | | | — | | | — | | | — | | | — | | | — | | | (30,428) | | | — | | | (30,428) | | | — | | | (30,428) | |
| Distribution on preferred stock | (4) | | | — | | | — | | | — | | | — | | | — | | | — | | | — | | | — | | | $ | (4) | | | — | | | (4) | | |
| | Distribution to Series A preferred stock | | Distribution to Series A preferred stock | (4) | | | — | | | — | | | — | | | — | | | — | | | — | | | — | | | — | | | (4) | | | — | | | (4) | |
| Foreign currency translation adjustment | Foreign currency translation adjustment | — | | | — | | | — | | | — | | | — | | | — | | | — | | | — | | | (1,261) | | | $ | (1,261) | | | — | | | (1,261) | | Foreign currency translation adjustment | — | | | — | | | — | | | — | | | — | | | — | | | — | | | — | | | 1,385 | | | 1,385 | | | — | | | 1,385 | |
| Balance at March 31, 2021 | $ | 129 | | | $ | 39 | | | $ | 47 | | | $ | 16 | | | $ | 61 | | | $ | 297 | | | $ | 459,893 | | | $ | (46,130) | | | $ | 907 | | | $ | 415,259 | | | $ | — | | | $ | 415,259 | | |
| Allocation to redeemable non-controlling interests | | Allocation to redeemable non-controlling interests | — | | | — | | | — | | | — | | | — | | | — | | | 250 | | | — | | | — | | | 250 | | | 250 | |
| Balance at Mach 31, 2023 | | Balance at Mach 31, 2023 | $ | 125 | | | $ | 176 | | | $ | 461 | | | $ | 79 | | | $ | 811 | | | $ | 297 | | | $ | 2,091,877 | | | $ | (254,166) | | | $ | (3,752) | | | $ | 1,835,908 | | | $ | 4,066 | | | $ | 1,839,974 | |
| | | | | Preferred
Stock | | Par Value | | Additional
Paid-in
Capital | | Accumulated
Deficit and
Cumulative
Distributions | | Accumulated Other Comprehensive Income (Loss) | | Total Stockholders' Equity | | Non-Controlling Interests Attributable to Third Party Joint Ventures | | Total
Equity |
| | | Common
Stock
Class T | | Common
Stock
Class S | | Common
Stock
Class D | | Common
Stock
Class I | | Common
Stock
Class N | |
| Balance at December 31, 2021 | | Balance at December 31, 2021 | $ | 126 | | | $ | 92 | | | $ | 238 | | | $ | 46 | | | $ | 316 | | | $ | 297 | | | $ | 1,043,073 | | | $ | (63,958) | | | $ | (239) | | | $ | 979,991 | | | $ | 835 | | | $ | 980,826 | |
| Issuance of 23,375,848 shares of common stock (net of $143 of offering costs) | | Issuance of 23,375,848 shares of common stock (net of $143 of offering costs) | — | | | 26 | | | 70 | | | 16 | | | 121 | | | — | | | 282,532 | | | — | | | — | | | 282,765 | | | — | | | 282,765 | |
| Distribution reinvestment | | Distribution reinvestment | — | | | 1 | | | 2 | | | — | | (a) | 2 | | | — | | | 5,869 | | | — | | | — | | | 5,874 | | | — | | | 5,874 | |
| | Common stock repurchased | | Common stock repurchased | — | | | — | | (a) | — | | (a) | — | | (a) | — | | (a) | — | | | (2,058) | | | — | | | — | | | (2,058) | | | — | | | (2,058) | |
| Amortization of restricted stock grants | | Amortization of restricted stock grants | — | | | — | | | — | | | — | | | — | | | — | | | 93 | | | — | | | — | | | 93 | | | — | | | 93 | |
| Net income (loss) | | Net income (loss) | 4 | | | — | | | — | | | — | | | — | | | — | | | — | | | (7,807) | | | — | | | (7,803) | | | 19 | | | (7,784) | |
| Distributions on common stock | | Distributions on common stock | — | | | — | | | — | | | — | | | — | | | — | | | — | | | (19,022) | | | — | | | (19,022) | | | — | | | (19,022) | |
| | Distribution to Series A preferred stock | | Distribution to Series A preferred stock | (4) | | | — | | | — | | | — | | | — | | | — | | | — | | | — | | | — | | | (4) | | | — | | | (4) | |
| Foreign currency translation adjustment | | Foreign currency translation adjustment | — | | | — | | | — | | | — | | | — | | | — | | | — | | | — | | | (1,966) | | | (1,966) | | | — | | | (1,966) | |
| Allocation to redeemable non-controlling interests | | Allocation to redeemable non-controlling interests | — | | | — | | | — | | | — | | | — | | | — | | | (18) | | | — | | | — | | | (18) | | | — | | | (18) | |
| Balance at March 31, 2022 | | Balance at March 31, 2022 | $ | 126 | | | $ | 119 | | | $ | 310 | | | $ | 62 | | | $ | 439 | | | $ | 297 | | | $ | 1,329,491 | | | $ | (90,787) | | | $ | (2,205) | | | $ | 1,237,852 | | | $ | 854 | | | $ | 1,238,706 | |
(a)Amount is not presented due to rounding; see Note 15.18.
| Nuveen Global Cities REIT, Inc. Consolidated Statements of Cash Flows (Unaudited) (in thousands) | Nuveen Global Cities REIT, Inc. Consolidated Statements of Cash Flows (Unaudited) (in thousands) | Nuveen Global Cities REIT, Inc. Consolidated Statements of Cash Flows (Unaudited) (in thousands) |
| | Three Months Ended
March 31, | | Three Months Ended March 31, |
| | 2022 | | 2021 | | 2023 | | 2022 |
| Cash flows from operating activities: | Cash flows from operating activities: | | | | Cash flows from operating activities: | | | |
| Net (loss) income | $ | (7,784) | | | $ | 2,830 | | |
| Adjustments to reconcile net (loss) income to net cash provided by operating activities: | | |
| Net loss | | Net loss | $ | (3,345) | | | $ | (7,784) | |
| Adjustments to reconcile net loss to net cash provided by operating activities: | | Adjustments to reconcile net loss to net cash provided by operating activities: | |
| Depreciation and amortization | Depreciation and amortization | 12,367 | | | 5,484 | | Depreciation and amortization | 21,260 | | | 12,367 | |
| Unrealized loss (gain) on changes in fair value of real estate-related securities | 7,018 | | | (1,773) | | |
| Realized gain on sale of real estate-related securities | (2,929) | | | (776) | | |
| Unrealized (gain) loss on changes in fair value of real estate-related securities | | Unrealized (gain) loss on changes in fair value of real estate-related securities | (3,716) | | | 7,018 | |
| Realized loss (gain) on sale of real estate-related securities | | Realized loss (gain) on sale of real estate-related securities | 1,897 | | | (2,929) | |
| Unrealized loss on changes in fair value of real estate debt | Unrealized loss on changes in fair value of real estate debt | 702 | | | — | | Unrealized loss on changes in fair value of real estate debt | 403 | | | 702 | |
| Realized loss (gain) on sale of real estate debt | 4 | | | — | | |
| Income from equity investment in unconsolidated international affiliated funds | (859) | | | (689) | | |
| Income distribution from equity investment in unconsolidated international affiliated funds | 582 | | | 251 | | |
| Unrealized loss on changes in fair value of note payable | | Unrealized loss on changes in fair value of note payable | 30 | | | — | |
| Unrealized loss on changes in fair value of commercial mortgage loans | | Unrealized loss on changes in fair value of commercial mortgage loans | 949 | | | — | |
| Realized loss on sale of real estate debt | | Realized loss on sale of real estate debt | — | | | 4 | |
| Loss (income) from equity investments in unconsolidated international affiliated funds | | Loss (income) from equity investments in unconsolidated international affiliated funds | 355 | | | (859) | |
| Income distributions from equity investments in unconsolidated international affiliated funds | | Income distributions from equity investments in unconsolidated international affiliated funds | 1,556 | | | 582 | |
| Straight line rent adjustment | Straight line rent adjustment | (617) | | | (304) | | Straight line rent adjustment | (1,301) | | | (617) | |
| Amortization of above and below-market lease intangibles | Amortization of above and below-market lease intangibles | (669) | | | (198) | | Amortization of above and below-market lease intangibles | (1,029) | | | (669) | |
| | Amortization of deferred financing costs | Amortization of deferred financing costs | 195 | | | 133 | | Amortization of deferred financing costs | 264 | | | 195 | |
| Amortization of mortgage discount | | Amortization of mortgage discount | 310 | | | — | |
| Amortization of restricted stock grants | Amortization of restricted stock grants | 93 | | | 17 | | Amortization of restricted stock grants | 53 | | | 93 | |
| Change in assets and liabilities: | Change in assets and liabilities: | | Change in assets and liabilities: | |
| | Increase in other assets | 7,067 | | | 319 | | |
| (Increase) decrease in other assets | | (Increase) decrease in other assets | (989) | | | 7,067 | |
| | Increase in accounts payable, accrued expenses, and other liabilities | 8,442 | | | 630 | | |
| Increase in accounts payable, accrued expenses and other liabilities | | Increase in accounts payable, accrued expenses and other liabilities | 400 | | | 8,442 | |
| Net cash provided by operating activities | Net cash provided by operating activities | 23,612 | | | 5,924 | | Net cash provided by operating activities | 17,097 | | | 23,612 | |
| Cash flows from investing activities: | Cash flows from investing activities: | | | | Cash flows from investing activities: | | | |
| Acquisitions of real estate | Acquisitions of real estate | (133,733) | | | (12,510) | | Acquisitions of real estate | (13,759) | | | (133,733) | |
| Origination and fundings of commercial mortgage loans | Origination and fundings of commercial mortgage loans | (93,125) | | | — | | Origination and fundings of commercial mortgage loans | (2,963) | | | (93,125) | |
| | Capital improvements to real estate | Capital improvements to real estate | (4,313) | | | (288) | | Capital improvements to real estate | (5,769) | | | (4,313) | |
| | Purchase of real estate-related securities | Purchase of real estate-related securities | (15,783) | | | (6,840) | | Purchase of real estate-related securities | (20,600) | | | (15,783) | |
| Proceeds from sale of real estate-related securities | Proceeds from sale of real estate-related securities | 2,927 | | | 6,650 | | Proceeds from sale of real estate-related securities | 10,435 | | | 2,927 | |
| Purchases of real estate debt | Purchases of real estate debt | (45,877) | | | — | | Purchases of real estate debt | (20,274) | | | (45,877) | |
| Proceeds from sale of real estate debt | | Proceeds from sale of real estate debt | 8,017 | | | — | |
| Net cash used in investing activities | Net cash used in investing activities | (289,904) | | | (12,988) | | Net cash used in investing activities | (44,913) | | | (289,904) | |
| Cash flows from financing activities: | Cash flows from financing activities: | | Cash flows from financing activities: | | | |
| Proceeds from issuance of common stock | Proceeds from issuance of common stock | 186,528 | | | 39,775 | | Proceeds from issuance of common stock | 52,072 | | | 186,528 | |
| Repurchase of common stock | Repurchase of common stock | (1,395) | | | (290) | | Repurchase of common stock | (40,098) | | | (1,395) | |
| Offering costs paid | Offering costs paid | (135) | | | (179) | | Offering costs paid | (314) | | | (135) | |
| Borrowings from credit facility | 107,000 | | | 5,000 | | |
| Borrowings under credit facility | | Borrowings under credit facility | 39,500 | | | 107,000 | |
| Repayments on credit facility | Repayments on credit facility | (75,000) | | | (40,000) | | Repayments on credit facility | (39,000) | | | (75,000) | |
| Borrowings from mortgages payable | — | | | (604) | | |
| | Payments on mortgages payable | | Payments on mortgages payable | (35) | | | — | |
| Proceeds from sale of loan participations | Proceeds from sale of loan participations | 47,803 | | | — | | Proceeds from sale of loan participations | — | | | 47,803 | |
| Repurchase of preferred stock | — | | | (125) | | |
| Distributions to preferred stockholders | | Distributions to preferred stockholders | (4) | | | (4) | |
| Subscriptions received in advance | | Subscriptions received in advance | 24,657�� | | | 156,146 | |
| Distributions | | Distributions | (16,544) | | | (11,649) | |
| Net cash provided by financing activities | | Net cash provided by financing activities | 20,234 | | | 409,294 | |
| Net (decrease) increase in cash and cash equivalents and restricted cash during the period | | Net (decrease) increase in cash and cash equivalents and restricted cash during the period | (7,582) | | | 143,002 | |
| Cash and cash equivalents and restricted cash, beginning of period | | Cash and cash equivalents and restricted cash, beginning of period | 75,421 | | | 130,576 | |
| Cash and cash equivalents and restricted cash, end of period | | Cash and cash equivalents and restricted cash, end of period | $ | 67,839 | | | $ | 273,578 | |
| Reconciliation of cash and cash equivalents and restricted cash to the Consolidated Balance Sheets, end of period: | | Reconciliation of cash and cash equivalents and restricted cash to the Consolidated Balance Sheets, end of period: | | | |
| Cash and cash equivalents | | Cash and cash equivalents | $ | 41,907 | | | $ | 116,971 | |
| Restricted cash | | Restricted cash | 25,932 | | | 156,607 | |
| Total cash and cash equivalents and restricted cash | | Total cash and cash equivalents and restricted cash | $ | 67,839 | | | $ | 273,578 | |
| | | | | | | | | | | |
Nuveen Global Cities REIT, Inc. Consolidated Statements of Cash Flows (Unaudited) (in thousands) |
| Three Months Ended
March 31, |
| 2022 | | 2021 |
| Distributions to preferred stockholders | (4) | | | (4) | |
| Subscriptions received in advance | 156,146 | | | 51,969 | |
| Distributions | (11,649) | | | (6,299) | |
| Net cash provided by financing activities | 409,294 | | | 49,243 | |
| Net increase in cash and cash equivalents and restricted cash during the period | 143,002 | | | 42,179 | |
| Cash and cash equivalents and restricted cash, beginning of period | 130,576 | | | 15,671 | |
| Cash and cash equivalents and restricted cash, end of period | $ | 273,578 | | | $ | 57,850 | |
| Reconciliation of cash and cash equivalents and restricted cash to the Consolidated Balance Sheets, end of period: | | | |
| Cash and cash equivalents | $ | 116,971 | | | $ | 5,881 | |
| Restricted cash | 156,607 | | | 51,969 | |
| Total cash and cash equivalents and restricted cash | $ | 273,578 | | | $ | 57,850 | |
| Supplemental disclosures: | | | |
| Interest paid | $ | 1,660 | | | $ | 829 | |
| | | |
| Non-cash investing activities: | | | |
| Assumption of other liabilities in conjunction with acquisitions of investments in real estate | $ | (1,179) | | | $ | 23 | |
| Accrued capital expenditures | $ | 692 | | | $ | (23) | |
| | | |
| Non-cash financing activities: | | | |
| Accrued distributions | $ | (1,499) | | | $ | (246) | |
| Accrued stockholder servicing fees | $ | 4,836 | | | $ | 1,714 | |
| Distribution reinvestments | $ | 5,874 | | | $ | 796 | |
| Accrued offering costs | $ | 8 | | | $ | (17) | |
| | | |
| Allocation to redeemable non-controlling interest | $ | 18 | | | $ | 258 | |
| Accrued organization and offering costs due to affiliate | $ | — | | | $ | 3 | |
| | | | | | | | | | | |
Nuveen Global Cities REIT, Inc. Consolidated Statements of Cash Flows (Unaudited) (in thousands) |
| Three Months Ended March 31, |
| 2023 | | 2022 |
| Supplemental disclosures: | | | |
| Interest paid | $ | 8,487 | | | $ | 1,660 | |
| Non-cash investing activities: | | | |
| Assumption of other assets and liabilities in conjunction with acquisitions of investments in real estate | $ | (79) | | | $ | (1,179) | |
| Accrued capital expenditures | $ | 676 | | | $ | 692 | |
| Non-cash financing activities: | | | |
| Accrued distributions | $ | (66) | | | $ | (1,499) | |
| Accrued stockholder servicing fees | $ | 479 | | | $ | 4,836 | |
| Distribution reinvestments | $ | 13,818 | | | $ | 5,874 | |
| Allocation to redeemable non-controlling interests | $ | (250) | | | $ | 18 | |
| Fundings of commercial mortgage loans through increases in loan participations | $ | 3,583 | | | $ | — | |
| Accrued offering costs | $ | 100 | | | $ | 8 | |
The accompanying notes are an integral part of these consolidated financial statements.
Nuveen Global Cities REIT, Inc.
Notes to consolidated financial statementsConsolidated Financial Statements (Unaudited)
Note 1. Organization and Business Purpose
Nuveen Global Cities REIT, Inc. (the “Company”) was formed on May 1, 2017 as a Maryland corporation and elected to be taxed as a real estate investment trust (“REIT”) for U.S. federal income tax purposes commencing with its taxable year ending December 31, 2018 and intends to operate in a manner that will allow it to continue to qualify as a REIT. The Company’s sponsor is Nuveen, LLC (the “Sponsor”), a wholly owned subsidiary of Teachers Insurance and Annuity Association of America (“TIAA”). The Company is the sole general partner of Nuveen Global Cities REIT OP, LP, a Delaware limited partnership (“Nuveen OP”). Nuveen OP has issued a limited partner interest to Nuveen Global Cities REIT LP, LLC (the “Limited Partner”), a wholly owned subsidiary of the Company. The Company was organized to invest primarily in stabilized income-oriented commercial real estate in the United States and a substantial but lesser portion of the Company's portfolio will include real properties located in Canada, Europe and the Asia-Pacific region. Substantially all of the Company’s business is conducted through Nuveen OP. The Company and Nuveen OP are externally managed by Nuveen Real Estate Global Cities Advisors, LLC (the “Advisor”), an indirect, wholly owned subsidiary of the Sponsor and an investment advisory affiliate of Nuveen Real Estate.Estate ("NRE").
Pursuant to a Registration Statement on Form S-11 (File No. 333-222231), the (“IPO (the “IPO Registration Statement”), the Company registered with the Securities and Exchange Commission (the “SEC”) its initial public offering of up to $5.0 billion in shares of common stock consisting of up to $4.0 billion in shares in its primary offering and up to $1.0 billion in shares pursuant to its distribution reinvestment plan (the “Initial Public Offering”). The IPO Registration Statement was initially declared effective on January 31, 2018 and the Initial Public Offering terminated on July 2, 2021.
, (the "Follow-on Registration Statement") to register up to $5.0 billion in shares of common stock, consisting of up to $4.0 billion in shares in its primary offering and up to $1.0 billion in shares pursuant to its distribution reinvestment plan (the "Follow-on Public Offering"). The Follow-on Registration Statement was initially declared effective by the SEC on July 2, 2021. In the Follow-on Public Offering, the Company is offering to the public any combination of four classes of shares of its common stock, Class T shares, Class S shares, Class D shares and Class I shares, with a dollar value up to the maximum offering amount. The publicly offered share classes have different upfront selling commissions and ongoing stockholder servicing fees. The purchase price per share for each class of common stock varies and generally equals the Company’s prior month’s net asset value (“NAV”) per share, as calculated monthly, plus applicable upfront selling commissions and dealer manager fees.
Note 2. Summary of Significant Accounting Policies
Basis of Presentation
The accompanying unaudited consolidated financial statements include the accounts of the Company and its subsidiaries, and in the opinion of management, include all necessary adjustments, consisting of only normal and recurring items, necessary for a fair statement of the Company’s consolidated financial statements as of March 31, 2023 and December 31, 2022 and for the three months ended March 31, 20222023 and 2021.2022. Results of operations for the interim periods are not necessarily indicative of results for the entire year. These financial statements have been prepared by the Company in accordance with accounting principles generally accepted in the United States of America (“GAAP”) for interim financial information and the applicable rules and regulations of the SEC. Accordingly, they do not include all information and footnotes required by GAAP for complete financial statements. Certain footnote disclosures normally included in financial statements prepared in accordance with GAAP have been condensed from this report pursuant to the rules of the SEC. The accompanying unaudited consolidated interim financial statements should be read in conjunction with the audited consolidated financial statements prepared in accordance with GAAP, and the related notes thereto, that are included in the Company’s Annual Report on Form 10-K for the fiscal year ended December 31, 20212022 as filed with the SEC. The year-end balance sheet was derived from those audited financial statements.
The accompanying condensed consolidated financial statements include the accounts of the Company, the Company's subsidiaries and joint ventures in which the Company has a controlling interest.
All intercompany balances and transactions have been eliminated in consolidation. The preparation of the financial statements in conformity with GAAP requires management to make estimates and assumption that affect the reported amounts of assets and liabilities and disclosures of contingent assets and liabilities at the date of the balance sheet. Actual results could differ from those estimates.
Principles of Consolidation
The Company consolidates all entities in which it has a controlling financial interest through majority ownership or voting rights and variable interest entities whereby the Company is the primary beneficiary. In determining whether the Company has a controlling financial interest in a partially owned entity and the requirement to consolidate the accounts of that entity, the Company considers whether the entity is a variable interest entity (“VIE”) and whether it is the primary beneficiary. The Company is the primary beneficiary of a VIE when it has (i) the power to direct the most significant activities impacting the economic performance of the VIE and (ii) the obligation to absorb losses or receive benefits significant to the VIE. Entities that
do not qualify as VIEs are generally considered voting interest entities (“VOEs”) and are evaluated for consolidation under the voting interest model. VOEs are consolidated when the Company controls the entity through a majority voting interest or other means. When the requirements for consolidation are not met and the Company has significant influence over the operations of the entity, the investment is accounted for under the equity method of accounting. Equity method investments for which the Company has not elected a fair value option (“FVO”) are initially recorded at cost and subsequently adjusted for the Company’s pro-rata share of net income, contributions and distributions. When the Company elects the FVO, the Company records its share of net asset value of the entity and any related unrealized gains and losses.
The Company holds interest in aEach of the Company’s joint venture that isventures are considered to be a VIE.VIE or VOE. The Company consolidated this entityconsolidates these entities because it has the ability to direct the most significant activities of the joint venture,ventures, including unilateral decision making on the disposition of the investment.
For select joint ventures, the non-controlling partner’s share of the assets, liabilities and operations of each joint venture is included in noncontrolling interests as equity of the Company. The non-controlling partner’s interest is generally computed as the joint venture partner’s ownership percentage. Certain of the joint ventures formed by the Company provide the other partner a profits interest based on certain internal rate of return hurdles being achieved. Any profits interest due to the other partner is reported within redeemable non-controlling interests.
As of March 31, 2022,2023, and December 31, 2021,2022, the total assets and liabilities of the Company’s consolidated VIEVIEs and VOEs were $59.5$184.1 million and $30.0$98.0 million, and $53.5$186.7 million and $29.7$98.0 million, respectively. Such amounts are included on the Company’Company’s Consolidated Balance Sheets.
The Company has limited contractual rights to obtain the financial records of its consolidated single familysingle-family housing, portfolioretail, student housing, self-storage and direct international portfolios from the operating partner. The operating partner does not prepare separate GAAP financial statements; therefore, the Company compiles GAAP financial information for them based on reports prepared by and received from the operating partner. Such reports are not available to the Company until approximately 25 days after the end of any given period. As a result, single-family rentalthese activities are generally included in the Company's consolidated financial statements on a one monthone-month lag; however, any significant activity that occurs in the final month of the quarter is recorded in that period.
Investments in Real Estate
In accordance with the guidance for business combinations, the Company determines whether the acquisition of a property qualifies as a business combination, which requires that the assets acquired and liabilities assumed constitute a business. If the property acquired is not a business, the Company accounts for the transaction as an asset acquisition. All property acquisitions to date have been accounted for as asset acquisitions.
Whether the acquisition of a property acquired is considered a business combination or asset acquisition, the Company recognizes the identifiable assets acquired, the liabilities assumed and any non-controlling interest in the acquired entity. In addition, for transactions that will be considered business combinations, the Company will evaluate the existence of goodwill or a gain from a bargain purchase. The Company expenses acquisition-related costs associated with business combinations as they are incurred. The Company capitalizes acquisition-related costs associated with asset acquisitions.
Upon acquisition of a property, the Company assesses the fair value of acquired tangible and intangible assets (including land, buildings, tenant improvements, above-market and below-market leases, acquired in-place leases, other identified intangible assets and assumed liabilities) and allocates the purchase price to the acquired assets and assumed liabilities. The Company assesses and considers fair value based on estimated cash flow projections that utilize discount and/or capitalization rates that it deems appropriate, as well as other available market information. Estimates of future cash flows are based on a number of factors including the historical operating results, known and anticipated trends and market and economic conditions.
The fair value of the tangible assets of an acquired property considers the value of the property as if it were vacant. The Company also considers an allocation of purchase price of other acquired intangibles, including acquired in-place leases that may have a customer relationship intangible value, including but not limited to the nature and extent of the existing relationship with the tenants, the tenants’ credit quality and expectations of lease renewals. Based on its acquisitions to date, the Company’s allocation to customer relationship intangible assets has not been material.
The Company records acquired above-market and below-market leases at their fair values (using a discount rate which reflects the risks associated with the leases acquired) equal to the difference between (1) the contractual amounts to be paid pursuant to each in-place lease and (2) management’s estimate of fair market lease rates for each corresponding in-place lease, measured over a period equal to the remaining term of the lease for above-market leases and the initial term plus the term of any below-
marketbelow-market fixed rate renewal options for below-market leases. Other intangible assets acquired include amounts for in-place lease values that are based on the Company’s evaluation of the specific characteristics of each tenant’s lease. Factors to be considered include estimates of carrying costs during hypothetical expected lease-up periods considering current market conditions, and costs to execute similar leases. In estimating carrying costs, the Company includes real estate taxes, insurance and other operating expenses and estimates of lost rentals at market rates during the expected lease-up periods, depending on local market conditions. In estimating costs to execute similar leases, the Company considers leasing commissions, legal and other related expenses.
Intangible assets and intangible liabilities are recorded as separate components on the Company's Consolidated Balance Sheets. The amortization of acquired above-market and below-market leases is recorded as an adjustment to Rental Revenue on the Company’s Consolidated Statements of Operations. The amortization of in-place leases is recorded as an adjustment to Depreciation and Amortization on the Company's Consolidated Statements of Operations.
The cost of buildings and improvements includes the purchase price of the Company’s properties and any acquisition-related adjustments, along with any subsequent improvements to such properties. The Company’s Investments in Real Estate are stated at cost and are generally depreciated on a straight-line basis over the estimated useful lives of the assets as follows:
| | | | | | | | |
| Description | | Depreciable Life |
| Building | | 40 years |
| Building, land and site improvements | | 15-40 years |
| Furniture, fixtures and equipment | | 3-7 years |
| Lease intangibles | | Over lease term |
Significant improvements to properties are capitalized. When assets are sold or retired, their costs and related accumulated depreciation or amortization are removed from the accounts with the resulting gains or losses reflected in net income or loss for the period.
Repairs and maintenance are expensed to operations as incurred and are included in Rental Property Operating on the Company’s Consolidated Statements of Operations.
The Company’s management reviews its real estate properties for impairment each quarter or when there is an event or change in circumstances that indicates an impaired value. If the carrying amount of the real estate investment is no longer recoverable and exceeds the fair value of such investment, an impairment loss is recognized. The impairment loss is recognized based on the excess of the carrying amount of the asset over its fair value, or fair value, less cost to sell if classified as held for sale. If the Company’s strategy changes or market conditions otherwise dictate an earlier sale date, an impairment loss may be recognized and such loss could be material to the Company’s results. If the Company determines that an impairment has occurred, the affected assets are reduced to their fair value or fair value, less cost to sell if classified as held for sale. During the periods presented, no such impairment occurred.
Investments in Real Estate-Related Securities
The Company reports its investment in real estate-related securities at fair value and any changes in fair value are recorded in the current period earnings. Dividend income is recorded when declared and the resulting dividend income, along with gains and losses are recorded as a component of Realized and Unrealized Income (Loss) Gain from Real Estate-Related Securities on the Company’s Consolidated Statements of Operations.
Investments in Real Estate Debt
The Company’s investments in real estate debt consists of commercial mortgage-backed securities (“CMBS”)., which are securities backed by one or more mortgage loans secured by real estate assets. The Company classifies the securitiesits CMBS as trading securities and records such investments at fair value. As such, the resulting unrealized gains and losses of such securitiesits CMBS are recorded as a component of income (loss)Realized and Unrealized (Loss) Gain from investments in real estate debtReal Estate Debt on the Company’s Consolidated Statements of Operations.
Interest income from the Company’s investments in CMBS is recognized over the life of each investment and is recorded on the accrual basis on the Company’s Consolidated Statements of Operations.
Investments in International Affiliated Funds
The Company reports its investment in European Cities Partnership SCSp (“ECF”) and Asia Pacific Cities Fund (“APCF”), investment funds managed by an affiliate of TIAA (collectively, the “International Affiliated Funds”), under the equity method
of accounting as it has significant influence over these investments.accounting. The equity method income (loss) from the investments in the International Affiliated Funds represents the Company’s allocable share of each fund’s net income or loss, which includes income and expense, realized gains and losses, and unrealized appreciation or depreciation as determined from the financial statements of ECF and APCF (which carry investments at fair value in accordance with the applicable GAAP) and is reported as (Loss) Income from Equity Investment in Unconsolidated International Affiliated Funds on the Company’s Consolidated StatementStatements of Operations.
All contributions to or distributions from the investment in the International Affiliated Funds are accrued when notice is received and recorded as a receivable from or payable to the International Affiliated Funds on the Company's Consolidated Balance Sheets.
InvestmentThe Company uses the cumulative earnings approach to classify its distribution received from equity method investments. Under the cumulative earnings approach, distributions received are considered returns on investment and classified as cash inflows from operating activities, unless the investor’s cumulative distributions received less distributions received in prior periods that were determined to be returns on investment exceed cumulative equity in earnings recognized by the investor. When such an excess occurs, the current-period distribution up to this excess is considered a return of investment and classified as cash inflows from investing activities.
Investments in Commercial Mortgage Loans
The Company has originated multipleoriginates commercial mortgage loans and electedelects the fair value option for each. In accordance with the adoption of the fair value option allowed under ASC 825, Financial Instruments, and at the election of the Company, the commercial mortgage loans wereare stated at fair value and were initially valued at the face amount of the loan funding. Subsequently, the commercial mortgage loans wereare valued at least quarterly by an independent third-party valuation firm with additional oversight being performed by the Advisor’s internal valuation department. The value wasis based on market factors, such as market interest rates and spreads for comparable loans, the performance of the underlying collateral (such as the loan-to-value ratio and the cash flow of the underlying collateral), and the credit quality of the borrower.
The income from the commercial mortgage loans represents interest income and origination fee income, which is reported as incomeIncome from commercial mortgage loanCommercial Mortgage Loans on the Company’s Consolidated Statements of Operations. Unrealized gains and losses are recorded as a component of Unrealized Gain (Loss)Loss on Commercial Mortgage Loan on the Company’s Consolidated Statements of Operations.
In the event of a partial or whole sale of the commercial mortgage loan that qualifies for sale accounting under GAAP, the Company derecognizes the corresponding asset and fees paid as part of the partial or whole sale are recognized on the Company’s Consolidated Statements of Operations.
Senior Loan Participations
In certain instances, the Company finances loans through the non-recourse syndication of a senior loan interest to a third party. Depending on the particular structure of the syndication, the senior loan interest may remain on the Company's Consolidated Balance SheetSheets or, in other cases, the sale will be recognized and the senior loan interest will no longer be included in its consolidated financial statements. When these sales do not qualify for sale accounting under GAAP, the Company reflects the transaction by recording a loan participations liability at fair value on the Consolidated Balance Sheet,Sheets, however this gross presentation does not impact Stockholders’ Equity or Net Income. When the sales are recognized, the Consolidated Balance SheetSheets only includes the remaining subordinate loan.
Note Payable
The Company finances the acquisition of certain mortgage loans through the use of "note-on-note" transactions in which the Company pledges mortgage loans as collateral to secure a loan which is equal in value to a specified percentage of the estimated fair value of the pledged collateral. These "note-on-note" transactions are recorded in Note Payable on the Consolidated Balance Sheets and notare carried at fair value through the non-consolidated senior interest sold.adoption of the fair value option allowed under ASC 825.
Financing costs related to the Company's note payable are expensed as incurred and recorded in Interest Expense on the Consolidated Statements of Operations.
Deferred Charges
The Company's deferred charges include financing and leasing costs. Financing costs include legal, structuring and other loan costs incurred by the Company for its financing arrangements.
Deferred financing costs related to the Credit Facility (as defined herein) are recorded as a component of Other Assets on the Company’s Consolidated Balance Sheets and are being amortized on a straight-line basis over the term of the Credit Facility, which approximates the effective interest method. Unamortized deferred financing costs are charged to interest expense upon early repayment or significant modification of the Credit Facility and fully amortized deferred financing costs are removed from the books upon the maturity of the Credit Facility.
Deferred financing costs related to the Company’s mortgagemortgages payable are recorded as an offset to the related liability and amortized on a straight-line basis over the term of the financing instrument, which approximates the effective interest method. Unamortized deferred financing costs related to the Company's mortgages payable are charged to interest expense upon early repayment or significant modification of the mortgages payable and fully amortized deferred financing costs are removed from the books upon maturity.
Deferred leasing costs incurred in connection with new leases, which consist primarily of brokerage and legal fees, are recorded as a component of Investments in Real Estate,Intangible Assets, Net on the Company’s Consolidated Balance Sheets and amortized over the life of the related lease. Unamortized deferred leasing costs are charged to amortization expense upon early termination or significant modification of the leases and fully amortized deferred leasing costs are removed from the books upon lease expiration.
Fair Value Measurement
Fair value is defined as the price that would be received to sell an asset or paid to transfer a liability in an orderly transaction between market participants on the measurement date. Accounting guidance also establishes a fair value hierarchy that requires
an entity to maximize the use of observable inputs and minimize the use of unobservable inputs when measuring fair value. The standard describes three levels of inputs that may be used to measure fair value:
Level 1—quoted prices are available in active markets for identical investments as of the measurement date. The Company does not adjust the quoted price for these investments.
Level 2—quoted prices are available in markets that are not active or model inputs are based on inputs that are either directly or indirectly observable as of the measurement date.
Level 3—pricing inputs are unobservable and include instances where there is minimal, if any, market activity for the investment. These inputs require significant judgment or estimation by management or third parties when determining fair value and generally represent anything that does not meet the criteria of Levels 1 and 2. Due to the inherent uncertainty of these estimates, these values may differ materially from the values that would have been used had a ready market for these investments existed.
InvestmentsThe Company's investments in real estate-related securities are recorded at fair value based on the closing price of the common stock as reported by the applicable national securities exchange and were classified as Level 1.
The Company’s investments in real estate debt, which consists of CMBS, are reported at fair value. As of March 31, 2022, the Company’s investments in real estate debt consisted of CMBS, which are securities backed by one or more mortgage loans secured by real estate assets. The Company generally determines the fair value of its investments in real estate debt by utilizing third-party pricing service providers whenever available and has classified as Level 2.
The Company’s investment in commercial mortgage loans consists of floating rate senior and mezzanine loans the Company originated and has classified as Level 3. The commercial mortgage loans are carried at fair value based on significant unobservable inputs.
The Company's loan participations and note payable are carried at fair value based on significant unobservable inputs and have been classified as Level 3.
The carrying amounts of financial instruments such as other assets, accounts payable, accrued expenses and other liabilities approximate their fair values due to the short-term maturities and market rates of interest of these instruments.
The following table details the Company’s assets and liabilities measured at fair value on a recurring basis ($ in thousands):
| | | March 31, 2022 | | December 31, 2021 | | March 31, 2023 | | December 31, 2022 |
| | Level I | | Level 2 | | Level 3 | | Total | | Level I | | Level 2 | | Level 3 | | Total | | Level 1 | | Level 2 | | Level 3 | | Total | | Level 1 | | Level 2 | | Level 3 | | Total |
| Assets: | Assets: | | | | | | | | | | | | | | | | | Assets: | | | | | | | | | | | | | | | | |
| Investments in real estate-related securities | Investments in real estate-related securities | | $ | 102,737 | | | $ | — | | | $ | — | | | $ | 102,737 | | | $ | 93,970 | | | $ | — | | | $ | — | | | $ | 93,970 | | Investments in real estate-related securities | | $ | 128,148 | | | $ | — | | | $ | — | | | $ | 128,148 | | | $ | 116,164 | | | $ | — | | | $ | — | | | $ | 116,164 | |
| Investments in real estate debt | Investments in real estate debt | | $ | — | | | $ | 59,354 | | | $ | — | | | $ | 59,354 | | | $ | — | | | $ | 14,183 | | | $ | — | | | $ | 14,183 | | Investments in real estate debt | | — | | | 110,106 | | | — | | | 110,106 | | | — | | | 98,252 | | | — | | | 98,252 | |
| Investments in commercial mortgage loans | Investments in commercial mortgage loans | | $ | — | | | $ | — | | | $ | 233,637 | | | $ | 233,637 | | | $ | — | | | $ | — | | | $ | 140,512 | | | $ | 140,512 | | Investments in commercial mortgage loans | | — | | | — | | | 349,541 | | | 349,541 | | | — | | | — | | | 343,970 | | | 343,970 | |
| Total | Total | | $ | 102,737 | | | $ | 59,354 | | | $ | 233,637 | | | $ | 395,728 | | | $ | 93,970 | | | $ | 14,183 | | | $ | 140,512 | | | $ | 248,665 | | Total | | $ | 128,148 | | | $ | 110,106 | | | $ | 349,541 | | | $ | 587,795 | | | $ | 116,164 | | | $ | 98,252 | | | $ | 343,970 | | | $ | 558,386 | |
| | Liabilities: | Liabilities: | | Liabilities: | |
| Loan participation | | $ | — | | | $ | — | | | $ | 47,803 | | | $ | 47,803 | | | $ | — | | | $ | — | | | $ | — | | | $ | — | | |
| Loan participations | | Loan participations | | — | | | — | | | 179,387 | | | 179,387 | | | — | | | — | | | 175,830 | | | 175,830 | |
| Note payable | | Note payable | | — | | | — | | | 69,060 | | | 69,060 | | | — | | | — | | | 69,030 | | | 69,030 | |
| Total | Total | | $ | — | | | $ | — | | | $ | 47,803 | | | $ | 47,803 | | | $ | — | | | $ | — | | $ | — | | $ | — | | | $ | — | | Total | | $ | — | | | $ | — | | | $ | 248,447 | | | $ | 248,447 | | | $ | — | | | $ | — | | | $ | 244,860 | | | $ | 244,860 | |
The following table details the Company’s assets and liabilities measured at fair value on a recurring basis using Level 3 inputs ($ in thousands):
| | | | | | | | | | | | | | | | | |
| Investments in Commercial Mortgage Loans | | Loan Participations | | Note Payable |
| Balance as of December 31, 2022 | $ | 343,970 | | | $ | 175,830 | | | $ | 69,030 | |
| Additional fundings | 6,546 | | | 3,583 | | | — | |
| Net unrealized loss on assets | (975) | | (a) | — | | | — | |
| Net unrealized (gain) loss on liabilities | — | | | (26) | | | 30 | |
| Balance as of March 31, 2023 | $ | 349,541 | | | $ | 179,387 | | | $ | 69,060 | |
| | | | | | | | |
| Investments in Commercial Mortgage Loans | Loan Participation |
| Balance as of December 31, 2021 | $ | 140,512 | | $ | — | |
| Loan Originations | 92,350 | | — | |
| Loan Participation Sold | — | | 47,803 | |
| Additional Fundings | 775 | | — | |
| | |
| Balance as of March 31, 2022 | $ | 233,637 | | $ | 47,803 | |
The following table shows the quantitative information about unobservable inputs related to the Level 3 fair value measurements comprising the investments in commercial mortgage loans, loan participations and loan participationnote payable as of March 31, 2022.2023.
| | | | | | | | | | | | | | | | | | | | | | | | | | |
| Type | | Asset Class | | Valuation Technique | | Unobservable Inputs | | Weighted AverageRange (Weighted Average) |
| Commercial Mortgage Loans | | Various | | Discounted Cash EquivalencyFlow Method | | DiscountEquivalency Rate | | LIBOR(1) LIBOR(1) + 1.65%2.30% - LIBOR (1) + 5.25%7.55% (3.61%) |
SOFR (2) + 2.95%2.05% - 6.97% (3.61%) |
Loan ParticipationParticipations | | Various | | Discounted Cash EquivalencyFlow Method | | DiscountEquivalency Rate | | LIBOR(1) LIBOR(1) + 1.75%2.30% (2.30%) |
SOFR (2) + 2.05% - 2.10% (2.07%) |
| Note Payable | | Multifamily | | Discounted Cash Flow Method | | Equivalency Rate | | SOFR (2) + 1.80% (1.80%) |
(1) LIBOR as of March 31, 20222023 was 0.2%4.9%.
(2) SOFRSecured Overnight Financing Rate ("SOFR") as of March 31, 20222023 was 0.3%4.9%.
As of March 31, 2022,2023, the carrying value of the Company's Credit Facilitycredit facility approximated fair value. The fair value of the Company's mortgages payable was $103.9$176.6 million and $106.3$178.6 million as of March 31, 20222023 and December 31, 2021,2022, respectively. Fair value of the Company's indebtedness is estimated by modeling the cash flows required by the Company's debt agreements and discounting them back to present value using the appropriate discount rate. Additionally, the Company considers current market rates and conditions by evaluating similar borrowing agreements with comparable loan-to-value ratios and credit profiles. The inputs used in determining the fair value of the Company's indebtedness are considered Level 3.
Revenue Recognition
The Company’s sources of revenue and the related revenue recognition policies are as follows:
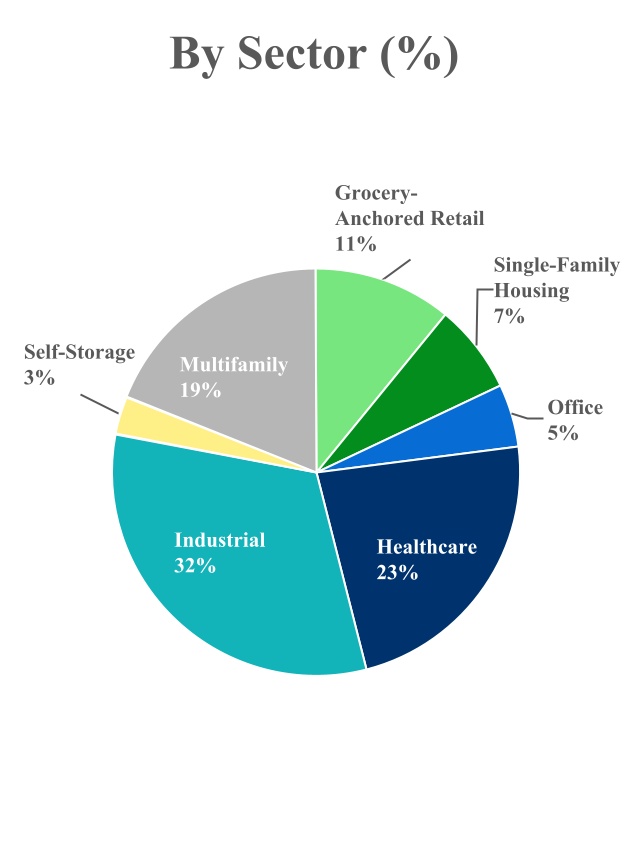
Rental revenueRevenue — consists primarily of base rent arising from tenant operating leases at the Company’s office, industrial, multifamily, retail, healthcare and single family housing properties. Rental revenue is recognized on a straight-line basis over the life of the lease, including any rent steps or abatement provisions. The Company begins to recognize revenue when a tenant takes possession of the leased space. The Company includes its tenant reimbursement income in rental revenue that consists of amounts due from tenants for costs related to common area maintenance, real estate taxes and other recoverable costs as defined in lease agreements.
The Company evaluates the collectability of receivables related to rental revenue on an individual lease basis. Management exercises judgment in assessing collectability and considers the length of time a receivable has been outstanding, tenant credit-worthiness, payment history, available information about the financial condition of the tenant, and current economic trends, among other factors. Tenant receivables that are deemed uncollectible are recognized as a reduction to rental revenue.
Income from Commercial Mortgage LoanLoans — consists of income from interest earned and recognized as operating income based upon the principal amount outstanding and the contracted interest rate along with origination fees. The accrual of interest income on mortgage loans is discontinued when in management’s opinion, the borrower may be unable to meet payments as they become due (“nonaccrual mortgage loans”), unless the loan is well-secured and is in the process of collection. Interest income on nonaccrual mortgage loans is subsequently recognized only to the extent cash payments are received until the loans are returned to accrual status. As of March 31, 2022,2023, the Company did not have any mortgage loans on nonaccrual status.
Leases
The Company derives revenue pursuant to lease agreements. At the inception of a contract, the Company assesses whether a contract is, or contains, a lease. A contract is, or contains, a lease if the contract conveys the right to control the use of an identified asset for a period of time in exchange for consideration. At the lease inception, the Company determines whether each lease is a sales-type, direct financing or operating lease. Such classification is based on whether:
•The lessee gains control of the underlying asset and the lessor therefore relinquishes control to the lessee under certain criteria (sales-type or direct-financing); or
•All other leases that do not meet the criteria as sales-type or direct financing leases (operating).
The Company's leases are classified as operating leases in accordance with relevant accounting guidelines, and the related revenue is recognized on a straight-line basis. Upon the termination or vacation of a tenant lease, the associated straight-line rent receivable is written off.
Cash and Cash Equivalents
Cash and cash equivalents represent cash held in banks, cash on hand and liquid investments with original maturities of three months or less at the time of purchase. The Company may have bank balances in excess of federally insured amounts; however, the Company deposits its cash with high credit-quality institutions to minimize credit risk.
Restricted Cash
As of March 31, 2022,2023, the Company had $156.6$25.9 million of restricted cash. The restricted cash consisted of $0.5$1.2 million of tenant security deposits and $156.1$24.7 million of cash received for subscriptions prior to the date in which the subscriptions are effective, which is held in a bank account controlled by the Company’s transfer agent, but in the name of the Company.
Income Taxes
The Company elected to be taxed as a REIT under Sections 856 through 860 of the Internal Revenue Code (“Code”) commencing with its taxable year endingended December 31, 2018, and intends to operate in a manner that will allow it to continue to qualify as a REIT. In qualifying for taxation as a REIT, the Company generally is not subject to federal corporate income tax to the extent it distributes annually at least 90%less than 100% of its REIT taxable income (determined without regard to the dividends-paid deduction and excluding any(including for this purpose its net capital gains)gain) to its shareholders. A REIT isThe Company will be subject to U.S. federal incomea 4% nondeductible excise tax on undistributed REIT taxablethe amount, if any, by which distributions it pays in any calendar year are less than the sum of 85% of its ordinary income, and95% of its net capital gains, and may be subject to 21% corporate100% of its undistributed income tax and a 4% excise tax. REITs arefrom prior years. The Company is also subject to a number of other organizational and operational requirements. Even in qualifying for taxation as a REIT, the Company may be subject to certain state and local taxes on its income and property, and federal income and excise taxes on its undistributed income. The Company may elect to treat certain of its corporate subsidiaries as taxable REIT subsidiaries (“TRSs”). In general, a TRS may perform additional services for the Company’s tenants and generally may engage in any real estate or non-real estate-related business other than management or operation of a lodging facility or a health care facility. The Company’s dealings with the TRSs must be arm’s length in nature or be permitted under the Code. Otherwise, the Company may be subject to 100% penalty tax, or its TRSs may be denied deductions. A domestic TRS is subject to US corporate federal income tax and state income or franchise tax. The Cayman Islands TRSs are not subject to US corporate federal income tax or Cayman Islands taxes. As of March 31, 2022,2023, the Company had 3five active TRSs: the Company uses two Cayman Islands TRSs to hold its investments in the International Affiliated Funds, and usedone Luxembourg TRS to hold minority interests in direct European investments, one domestic TRS to hold the senior portionportions of the commercial mortgage loans. No income tax provision was included inloans, and one domestic TRS for self-storage, nonrental-related business. The asset tests that apply to REITs limit the consolidated financial statements.Company's ownership of the securities of its TRSs to no more than 20% of the value of the Company's total assets.
The Company accrues liabilities when it believes that it is more likely than not that it will not realize the benefits of tax positions that it has taken in its tax returns or for the amount of any tax benefit that exceeds the cumulative probability threshold in accordance with ASC 740-10, Uncertain Tax Positions.
Tax legislation commonly referred Interest and penalties related to as the Tax Cuts & Jobs Act (the “TCJA”) was enacted on December 22, 2017. Among other things, the TCJA reduced the U.S. federal corporateunrecognized tax positions are included in income tax rate from 35%expense, and no amount has been accrued. Income tax returns for tax years 2018 through 2022 remain subject to 21%governmental examination.
Deferred Taxes
As of March 31, 2023, the Company had a deferred tax liability of $2.6 million that is recorded in Accounts Payable, Accrued Expenses and created new taxesOther Liabilities on certain foreign-sourced earnings. Federal legislation intended to ameliorate the economic impactCompany’s Consolidated Balance Sheets. The deferred tax liability is a value-based tax, calculated on the difference between acquisition cost and current tax basis, and was assumed during the acquisition of the COVID-19 pandemic, the Coronavirus Aid, Relief and Economic Security Act (the "CARES Act"), was enacted on March 27, 2020, which, among other things, made technical corrections to, or modifies on a temporary basis, certain of the provisions of the TCJA.
Management has evaluated the effects of TCJA, as modified by the CARES Act, and concluded that the TCJA will not materially impact its consolidated financial statements. The Company also estimates that the taxes on foreign-sourced earnings imposed under the TCJA are not likely to apply to its foreign investments.multifamily portfolio in Copenhagen, Denmark.
Organization and Offering Expenses
The Advisor advanced organization and offering expenses on behalf of the Company (including legal, accounting and other expenses attributable to the organization, but excluding upfront selling commissions, dealer manager fees and stockholder servicing fees) through the fourth full fiscal quarter after the Company’s acquisition of its first property. The Company will
agreed to reimburse the Advisor for all such advanced expenses it incurred in 60 equal monthly installments commencing on the earlier of the date the Company’s NAV reaches $1.0 billion or January 31, 2023.
As2023.The Company's NAV reached $1.0 billion in October 2021 and as of March 31, 2022,2023, the Company had reimbursed the Advisor $1.1 million of such costs.
The Advisor and its affiliates hadhave incurred organization and offering expenses on the Company’s behalf for the Initial Public Offering of $4.6 million, consisting of offering costs of $3.5 million and organization costs of $1.1 million.million, of which $3.6 million remained outstanding as of both March 31, 2023 and December 31, 2022. These organization and offering costs are recorded as Due to Affiliates on the Company’s Consolidated Balance Sheets as of March 31, 2022 and December 31, 2021.Sheets.
Offering costs are currently charged to equity as such amounts are incurred. For the three months ended March 31, 2023 and 2022, the Company charged $0.2$0.4 million and $0.1 million, respectively, in offering costs to equity.
Foreign Currency
The financial position and results of operations of ECF is measured using the local currency (Euro) as the functional currency and are translated into U.S. dollars for purposes of recording the related activity under the equity method of accounting. Net income (loss), which includes the Company’s allocable share of ECF's income and expense, realized gains and losses and unrealized appreciation or depreciation, has been translated at average exchange rates prevailing during the period. Assets and liabilities have been translated at the rates of exchange on the balance sheet date.
The financial position and results of operations of the Company's wholly owned multifamily property CASA Nord located in Copenhagen, Denmark ("CASA Nord") is measured using the local currency (Danish Krone) as the functional currency and are translated into U.S. dollars for purposes of recording the related activity. Net income (loss), which includes CASA Nord's income and expense, has been translated at average exchange rates prevailing during the period. Assets and liabilities have been translated at the rates of exchange on the balance sheet date.
The resulting translation gain and loss adjustments are recorded directly as a separate component of accumulated other comprehensive income (loss), unless there is a sale or complete liquidation of the underlying foreign investments. Foreign currency translation adjustments resulted in other comprehensive lossesincome and (losses) of approximately $2.0$1.4 million and $1.3$(2.0) million respectively, for the three months ended March 31, 2023 and 2022 and 2021, respectively..
The financial position and results of operations of APCF isare measured in U.S. dollars for purposes of recording the related activity under the equity method of accounting. There is no direct foreign currency exposure to the Company for its investment in APCF.
Derivative Instruments
The Company uses derivative financial instruments such as interest rate swaps to manage risks from fluctuations in interest rates. The Company records its derivatives on its Consolidated Balance Sheets at fair value and such amounts are reflected within Other Assets or Accounts Payable, Accrued Expenses and Other Liabilities on the Company’s Consolidated Balance Sheets. Any changes in the fair value of these derivatives are recorded as Unrealized Gain (Loss) on Derivatives on the Company's Consolidated Statements of Operations.
Earnings per Share
Basic net income/income (loss) per share of common stock is determined by dividing net income/income (loss) attributable to common stockholders by the weighted average number of common shares outstanding during the period. All classes of common stock are allocated net income/income (loss) at the same rate per share. The Company does not have any dilutive securities outstanding that would cause basic earnings per share and diluted earnings per share to differ.
Recent Accounting Pronouncements
In July 2021, the Financial Accounting Standards Board ("FASB") issued ASU 2021-05—Leases (Topic 842): Lessors—Certain Leases with Variable Lease Payments (“ASU 2021-05”). The amendments in ASU 2021-05 amend the lease classification requirements for lessors to align them with practice under Topic 840. Lessors should classify and account for a lease with variable lease payments that do not depend on a reference index or a rate as an operating lease if certain criteria are met. When a lease is classified as operating, the lessor does not recognize a net investment in the lease, does not derecognize the underlying asset, and, therefore, does not recognize a selling profit or loss. The amendments are effective for fiscal years beginning after December 15, 2021, for all entities, and interim periods within those fiscal years for public business entities. Management has adopted the guidance and it did not have a material impact to the financial statements.
In April 2020, the FASB staff released guidance focused on treatment of concessions related to the effects of COVID-19 on the application of lease modification guidance in Accounting Standards Codification (ASC) 842, “Leases.” The guidance provides a practical expedient to forgo the associated reassessments required by ASC 842 when changes to a lease result in similar or lower future consideration. There were no material exposures to rent concessions or lease defaults for tenants impacted by the COVID-19 pandemic as of March 31, 2022.
In March 2020, the FASB issued ASU 2020-04, Facilitation of the Effects of Reference Rate Reform on Financial Reporting (“ASU 2020-04”). The guidance provides optional expedients and exceptions for applying generally accepted accounting principles to contract modifications and hedging relationships, subject to meeting certain criteria, that reference London Interbank Offered Rate (“LIBOR”) or another reference rate expected to be discontinued. The expedients and exceptions are effective for the period from March 12, 2020 to December 31, 2022. Management is assessing the impact and currently does not expectadopted the guidance and it did not have a material impact to materially impact the Company.
In December 2022, the FASB issued ASU 2022-06, Reference Rate Reform (Topic 848): Deferral of the Sunset Date of Topic 848 (“ASU 2022-06”). The amendments in ASU 2020-04 provide optional expedients and exceptions for applying GAAP to contracts, hedging relationships, and other transactions affected by2022-06 extend the period of time preparers can utilize the reference rate reform if certain criteria are met.relief guidance. ASU 2022-06 is effective for all entities upon issuance. To ensure the relief in Topic 848 covers the period of time during which a significant number of modifications may take place, the ASU defers the sunset date of Topic 848 from December 31, 2022, to December 31, 2024, after which entities will no longer be permitted to apply the relief in Topic 848. Management adopted the guidance and it did not have a material impact to the Company.
In March 2023, the FASB issued ASU 2023-01— Leases (Topic 842): Common Control Arrangements (“ASU 2023-01”). The amendments in this ASU 2020-04 apply only2023-01 provide a practical expedient for private companies and not-for-profit entities that are not conduit bond obligors to contracts, hedging relationships,use the written terms and other transactionsconditions of a common control arrangement to determine: 1. Whether a lease exists and, if so, 2. The classification of and accounting for that referencelease. In addition, ASU 2023-01 requires all entities to amortize leasehold improvements associated with common control leases over the LIBOR or another reference rate expecteduseful life and leasehold improvements should be accounted for as a transfer between entities under common control through an adjustment to be discontinued because of reference rate reform.equity. The expedientsamendments in ASU 2023-01 are effective for fiscal years beginning after December 15, 2023, including interim periods within those fiscal years. Early adoption is permitted for both interim and exceptions provided byannual financial statements that have not yet been made available for issuance. If an entity adopts the amendments do not apply to contract modifications made and hedging relationships entered into or evaluated after December 31, 2022, except for hedging relationships existingin an interim period, it must adopt them as of December 31, 2022, that an entity has elected certain optional expedients for and that are retained through the endbeginning of the hedging relationship.fiscal year that includes that interim period. Management does not believe that the adoption will have a material impact to the Company.
Note 3. Investments in Real Estate
Investments in Real Estate, Net consisted of the following ($ in thousands): | | | March 31, 2022 | | December 31, 2021 | | March 31, 2023 | | December 31, 2022 |
| Building and building improvements | Building and building improvements | $ | 892,391 | | | $ | 778,324 | | Building and building improvements | $ | 1,538,858 | | | $ | 1,522,540 | |
| Land and land improvements | Land and land improvements | 184,250 | | | 166,944 | | Land and land improvements | 315,413 | | | 312,989 | |
| Furniture, fixtures and equipment | Furniture, fixtures and equipment | 10,045 | | | 9,976 | | Furniture, fixtures and equipment | 13,934 | | | 13,285 | |
| Total | Total | 1,086,686 | | | 955,244 | | Total | 1,868,205 | | | 1,848,814 | |
| Accumulated depreciation | Accumulated depreciation | (53,099) | | | (45,412) | | Accumulated depreciation | (102,903) | | | (88,330) | |
| Investments in real estate, net | Investments in real estate, net | $ | 1,033,587 | | | $ | 909,832 | | Investments in real estate, net | $ | 1,765,302 | | | $ | 1,760,484 | |
For the three months ended March 31, 20222023 and 2021,2022 depreciation expense was $7.6$14.6 million and $2.9$7.6 million, respectively.
During the three months ended March 31, 2022,2023, the Company acquired an interest in two industrial real estate investments and 8 single-family rentals.one self-storage property.
The following table provides details of the propertiesproperty acquired during the three months ended March 31, 20222023 ($ in thousands):
| | | | | | | | | | | | | | | | | | | | | | | | | | | | | | | | | | | | | | |
| Property Name | | Ownership
Interest | | Number of
Properties | | Location | | Sector | | Acquisition
Date | | Acquisition Price(1) |
| Tampa Lakeland Industrial | | 100% | | 3 | | Tampa, FL | | Industrial | | January, 2022 | | 54,900 | |
| 610 Loop - Houston Industrial | | 100% | | 5 | | Houston, TX | | Industrial | | March, 2022 | | 76,100 | |
| Single-Family Rentals | | 100% | | 8 | | Various | | Single-Family Housing | | Various | | 2,733 | |
| | | | 16 | | | | | | | | $ | 133,733 | |
| | | | | | | | | | | | | | | | | | | | | | | | | | |
| Sectors | | Purchase Price (1) | | Number of Transactions | | Number of Properties | | Sq. Ft. (in thousands)/Units |
| Self-Storage | | $ | 13,759 | | | 1 | | 1 | | 716 Units |
(1) AcquisitionPurchase price is inclusive of acquisition costs and other acquisition related adjustments. AcquisitionPurchase price does not include any net liabilities assumed.
The following table summarizes the purchase price allocation for the propertiesproperty acquired during the three months ended March 31, 20222023 ($ in thousands):
| | | | | | | | | | | | | | | | | |
| Tampa Lakeland Industrial | | 610 Loop - Houston Industrial | | Single-Family Rentals |
| Building and building improvements | $ | 43,523 | | | $ | 64,716 | | | $ | 2,119 | |
| Land and land improvements | 8,011 | | | 8,660 | | | 612 | |
| In-place lease intangibles | 2,956 | | | 2,531 | | | 2 | |
| | | | | |
| Leasing Commissions | 831 | | | 1,019 | | | — | |
| Other intangibles | (421) | | | (826) | | | — | |
| Total purchase price | $ | 54,900 | | | $ | 76,100 | | | $ | 2,733 | |
| | | | | |
| Amount |
| Building and building improvements | $ | 10,306 | |
| Land and land improvements | 2,258 | |
| In-place lease intangibles | 704 | |
| Furniture, fixtures and equipment | 491 | |
| Total purchase price | $ | 13,759 | |
Note 4. Investments in Real Estate-Related Securities
As of March 31, 20222023 and December 31, 2021,2022, the Company’s investments in real estate-related securities consisted of shares of common stock of publicly-listed REITs. As described in Note 2, the Company records its investments in real estate-related securities at fair value on its Consolidated Balance Sheets.
The following table summarizes the Investments in Real Estate-Related Securities as of March 31, 20222023 ($ in thousands):
| | | | | | | | |
| | Investments in Real
Estate-Related Securities |
Balance as of December 31, 20212022 | | $ | 93,970116,164 | |
| Additions | | 15,78320,600 | |
| Disposals | | (2,927)(10,435) | |
Unrealized lossesgains | | (7,018)3,716 | |
Realized gainsRealizes losses | | 2,929 (1,897) | |
Balance as ofat March 31, 20222023 | | $ | 102,737128,148 | |
The following table summarizes the components of Realized and Unrealized Income (Loss) from Real Estate-Related Securities during the three months ended March 31, 20222023 and 20212022 ($ in thousands):
| | | | Three Months Ended
March 31, | | | Three Months Ended March 31, |
| | | 2022 | | 2021 | | | 2023 | | 2022 |
| Unrealized (losses) gains | | $ | (7,018) | | | $ | 1,773 | | |
| Unrealized gains (losses) | | Unrealized gains (losses) | | $ | 3,716 | | | $ | (7,018) | |
| Realized (losses) gains | Realized (losses) gains | | 2,929 | | | 776 | | Realized (losses) gains | | (1,897) | | | 2,929 | |
| Dividend income | Dividend income | | 685 | | | 332 | | Dividend income | | 1,177 | | | 685 | |
| Total | Total | | $ | (3,404) | | | $ | 2,881 | | Total | | $ | 2,996 | | | $ | (3,404) | |
Note 5. Investments in Real Estate Debt
The following tables detail the Company's Investments in Real Estate Debt ($ in thousands):
| | March 31, 2022 | | |
| | | March 31, 2023 |
| Type of Security/Loan | Type of Security/Loan | Weighted Average Coupon | | Weighted Average Maturity Date (1, 2) | | Face Amount | | Cost Basis | | Fair Value | Type of Security/Loan | Weighted Average Coupon | | Weighted Average Maturity Date (1, 2) | | Face Amount | | Cost Basis | | Fair Value |
| CMBS - Fixed | CMBS - Fixed | 3.71 | % | | 2/16/2045 | | $ | 9,287 | | | $ | 9,090 | | | $ | 8,891 | | CMBS - Fixed | 3.72 | % | | 3/10/2043 | | $ | 17,220 | | | $ | 17,380 | | | $ | 16,083 | |
| CMBS - Floating | CMBS - Floating | 2.51 | % | | 7/14/2036 | | 51,351 | | 50,965 | | 50,463 | CMBS - Floating | 7.00 | % | | 7/19/2037 | | 99,640 | | 97,270 | | 94,023 |
| Total | Total | 2.69 | % | | 11/6/2037 | | $ | 60,638 | | | $ | 60,055 | | | $ | 59,354 | | Total | 6.52 | % | | 5/18/2038 | | $ | 116,860 | | | $ | 114,650 | | | $ | 110,106 | |
| | December 31, 2021 | | |
| | | December 31, 2022 |
| Type of Security/Loan | Type of Security/Loan | Weighted Average Coupon | | Weighted Average Maturity Date (1, 2) | | Face Amount | | Cost Basis | | Fair Value | Type of Security/Loan | Weighted Average Coupon | | Weighted Average Maturity Date (1, 2) | | Face Amount | | Cost Basis | | Fair Value |
| CMBS - Fixed | CMBS - Fixed | 4.02 | % | | 5/13/2042 | | $ | 3,219 | | | $ | 3,300 | | | $ | 3,300 | | CMBS - Fixed | 3.83 | % | | 9/25/2043 | | $ | 19,541 | | | $ | 18,324 | | | $ | 17,157 | |
| CMBS - Floating | CMBS - Floating | 2.10 | % | | 1/16/2037 | | 10,976 | | 10,880 | | 10,883 | CMBS - Floating | 6.48 | % | | 4/28/2037 | | 86,035 | | 84,068 | | 81,095 |
| Total | Total | 2.54 | % | | 4/02/2038 | | $ | 14,195 | | | $ | 14,180 | | | $ | 14,183 | | Total | 5.99 | % | | 7/05/2038 | | $ | 105,576 | | | $ | 102,392 | | | $ | 98,252 | |
(1) Weighted by face amountamount.
(2) Stated legal maturity.
The following table details the collateral type of the properties securing the Company's investmentsInvestments in real estate debtReal Estate Debt ($ in thousands):
17 | | | | | | | | | | | | | | | | | | | | | | | | | | | | | | | | | | | |
| March 31, 2023 | | December 31, 2022 |
| Collateral | Cost Basis | | Fair Value | | Percentage based on Fair Value | | Cost Basis | | Fair Value | | Percentage based on Fair Value |
| Industrial | $ | 43,061 | | | $ | 41,992 | | | 38.1 | % | | $ | 31,069 | | | $ | 29,979 | | | 30.5 | % |
| Multifamily | 17,704 | | | 17,264 | | | 15.7 | % | | 17,457 | | | 17,083 | | | 17.3 | % |
| Office | 11,668 | | | 10,406 | | | 9.5 | % | | 13,148 | | | 12,194 | | | 12.4 | % |
| Diversified | 9,889 | | | 9,292 | | | 8.4 | % | | 10,833 | | | 10,179 | | | 10.4 | % |
| Cold Storage | 8,329 | | | 8,183 | | | 7.4 | % | | 9,799 | | | 9,664 | | | 9.8 | % |
| Manu Housing | 5,529 | | | 5,495 | | | 5.0 | % | | 3,149 | | | 3,148 | | | 3.2 | % |
| Hotel | 4,798 | | | 4,646 | | | 4.2 | % | | 4,798 | | | 4,637 | | | 4.7 | % |
| Retail | 4,356 | | | 4,266 | | | 3.9 | % | | 4,245 | | | 4,106 | | | 4.2 | % |
| Net Lease | 3,907 | | | 3,425 | | | 3.1 | % | | 3,907 | | | 3,493 | | | 3.6 | % |
| Self-Storage | 3,647 | | | 3,428 | | | 3.1 | % | | 2,494 | | | 2,330 | | | 2.4 | % |
| Life Science | 1,762 | | | 1,709 | | | 1.6 | % | | 1,493 | | | 1,439 | | | 1.5 | % |
| Total | $ | 114,650 | | | $ | 110,106 | | | 100.0 | % | | $ | 102,392 | | | $ | 98,252 | | | 100.0 | % |
| | | | | | | | | | | | | | | | | | | | | | | | | | | | | | | | | | | |
| March 31, 2022 | | December 31, 2021 |
| Collateral | Cost Basis | | Fair Value | | Percentage based on Fair Value | | Cost Basis | | Fair Value | | Percentage based on Fair Value |
| Office | $ | 10,064 | | | $ | 10,000 | | | 16.8 | % | | $ | 2,497 | | | $ | 2,496 | | | 17.6 | % |
| Industrial | 22,302 | | | 22,062 | | | 37.2 | % | | 5,163 | | | 5,163 | | | 36.4 | % |
| Retail | 2,977 | | | 2,952 | | | 5.0 | % | | 1,791 | | | 1,792 | | | 12.6 | % |
| NNN | 1,514 | | | 1,459 | | | 2.4 | % | | 1,513 | | | 1,511 | | | 10.7 | % |
| Life Science | 1,405 | | | 1,392 | | | 2.3 | % | | 1,428 | | | 1,426 | | | 10.1 | % |
| Multifamily | 7,282 | | | 7,219 | | | 12.2 | % | | — | | | — | | | — | % |
| Hotel | 1,991 | | | 1,939 | | | 3.3 | % | | — | | | — | | | — | % |
| Self-Storage | 2,494 | | | 2,461 | | | 4.1 | % | | — | | | — | | | — | % |
| Cold Storage | 3,854 | | | 3,828 | | | 6.5 | % | | — | | | — | | | — | % |
| Diversified | 6,172 | | | 6,042 | | | 10.2 | % | | 1,788 | | | 1,795 | | | 12.6 | % |
| Total | $ | 60,055 | | | $ | 59,354 | | | 100 | % | | $ | 14,180 | | | $ | 14,183 | | | 100 | % |
The following table details the credit rating of the Company's investmentsInvestments in real estate debtReal Estate Debt ($ in thousands):
| | | March 31, 2022 | | December 31, 2021 | | March 31, 2023 | | December 31, 2022 |
Credit Rating | Credit Rating | Cost Basis | | Fair Value | | Percentage based on Fair Value | | Cost Basis | | Fair Value | | Percentage based on Fair Value | Credit Rating | Cost Basis | | Fair Value | | Percentage based on Fair Value | | Cost Basis | | Fair Value | | Percentage based on Fair Value |
| AAA | AAA | $ | 3,091 | | | $ | 3,013 | | | 5.1 | % | | $ | 1,788 | | | $ | 1,795 | | | 12.6 | % | AAA | $ | 3,898 | | | $ | 3,795 | | | 3.5 | % | | $ | 3,528 | | | $ | 3,347 | | | 3.4 | % |
| AA | AA | 1,982 | | | 1,970 | | | 3.3 | % | | — | | | — | | | — | % | AA | 12,674 | | | 12,638 | | | 11.5 | % | | 9,903 | | | 9,861 | | | 10.0 | % |
| A | A | 13,217 | | | 13,097 | | | 22.1 | % | | 996 | | | 996 | | | 7.0 | % | A | 25,164 | | | 24,027 | | | 21.8 | % | | 25,406 | | | 24,364 | | | 24.8 | % |
| BBB | BBB | 39,067 | | | 38,571 | | | 65.0 | % | | 11,396 | | | 11,392 | | | 80.4 | % | BBB | 70,215 | | | 67,271 | | | 61.1 | % | | 60,856 | | | 58,254 | | | 59.3 | % |
| BB | BB | 2,163 | | | 2,172 | | | 3.6 | % | | — | | | — | | | — | % | BB | 2,164 | | | 2,031 | | | 1.8 | % | | 2,164 | | | 2,021 | | | 2.1 | % |
| B | B | 535 | | | 531 | | | 0.9 | % | | — | | | — | | | — | % | B | 535 | | | 344 | | | 0.3 | % | | 535 | | | 405 | | | 0.4 | % |
| Total | Total | $ | 60,055 | | | $ | 59,354 | | | 100 | % | | $ | 14,180 | | | $ | 14,183 | | | 100 | % | Total | $ | 114,650 | | | $ | 110,106 | | | 100.0 | % | | $ | 102,392 | | | $ | 98,252 | | | 100.0 | % |
(1) Composite rating at the time of purchase.
The following table summarizes the Investments in Real Estate Debt as of March 31, 2023 ($ in thousands):
| | | | | | | | |
| | Investments in Real Estate Debt |
Balance as of December 31, 20212022 | | $ | 14,18398,252 | |
| Additions | | 45,877 20,274 | |
| Disposals | | (8,017) | |
| Unrealized losses | | (702)(403) | |
Realized losses | | (4) | |
Balance as ofat March 31, 20222023 | | $ | 59,354110,106 | |
Note 6. Investment in International Affiliated Funds
Investment in ECF:
ECF was formed in March 2016 as an open-end, Euro-denominated fund that seeks to build a diversified portfolio of high quality and stabilized commercial real estate with good fundamentals (i.e., core real estate) located in or around certain investment cities in Europe selected for their resilience, potential for long-term structural performance and ability to deliver an attractive and stable distribution yield.
The Company originally committed to invest approximately $28.4$79 million (€25.070 million) into ECF and subsequently increased its commitment by $51.0 million (€45.0 million). Asas of March 31, 2022, the Company had2023, has fully satisfied both commitments.its commitment. The Company has a 6% ownership in ECF.
As described in Note 2, the Company records its investment in ECF using the equity method on its Consolidated Balance Sheets. While the Company has strategies to manage the foreign exchange risk associated with its investment made in Euros,
there can be no assurance that these strategies will be successful or that foreign exchange fluctuations will not negatively impact the Company’s financial performance and results of operations in a material manner.
The following table summarizes the equity investmentEquity Investment in Unconsolidated International Affiliated Funds from ECF as of March 31, 20222023 ($ in thousands): | | | | | | | | |
| | Investment in ECF |
Balance as of December 31, 20212022 | | $ | 79,09778,353 | |
| | |
Income distributiondistributions | | (463)(1,243) | |
IncomeLoss from equity investment in unconsolidated international affiliated fund | | 917 (4,261) | |
| Foreign currency translation adjustment | | (1,966)892 | |
Balance as ofat March 31, 20222023 | | $ | 77,58573,741 | |
Income (loss)(Loss) income from equity investmentsEquity Investments in Unconsolidated International Affiliated Funds from ECF was $0.9 million and $(0.2) million for the three months ended March 31, 2023 and 2022 was $(4.3) million and 2021,$0.9 million, respectively.
Investment in APCF:
APCF was launched in November 2018 as an open-end, U.S. dollarU.S.-dollar denominated fund that seeks durable income and capital appreciation from a balanced and diversified portfolio of real estate investments in a defined list of investment cities in the Asia-Pacific region.
The Company committed to invest $10.0$50 million into APCF and subsequently, twice increased its commitment by $20.0 million, bringing its total commitment to $50.0 million. Asas of March 31, 2022, the Company2023, has fully funded its total commitment. As described in Note 2, the Company records its investment in APCF using the equity method on its Consolidated Balance Sheets. The Company has a 6% ownership in APCF.
The following table summarizes the equity investmentEquity Investment in Unconsolidated International Affiliated Funds from APCF as of March 31, 20222023 ($ in thousands): | | | | | | | | |
| | Investment in APCF |
Balance as of December 31, 20212022 | | $ | 51,94848,871 | |
| | |
Income distributiondistributions | | (119)(313) | |
LossIncome from equity investment in unconsolidated international affiliated fund | | (58)3,906 | |
| | |
Balance as ofat March 31, 20222023 | | $ | 51,77152,464 | |
(Loss) incomeIncome (loss) from equity investmentsEquity Investments in Unconsolidated International Affiliated Funds from APCF for the three months ended March 31, 2023 and 2022 and 2021 was $(0.1)$3.9 million and $0.9($0.1) million, respectively.
Note 7. InvestmentInvestments in Commercial Mortgage Loans
On November 9, 2021The following table summarizes the Company originated a floating rate senior mortgage and mezzanine loan to financeInvestments in Commercial Mortgage Loans as of March 31, 2023 ($ in thousands):
| | | | | | | | | | | | | | | | | | | | | | | | | | | | | | | | | | | | | | | | | | | | | | | | | | | | | | | | | | | | | | |
| Investment Name | | Origination Date | | Loan Type | | Property Type | | Location | | Interest Rate | | Maturity Date | | Periodic Payment Terms | | Commitment Amount | | Principal Receivable | | Fair Value |
9-90 Corporate Center(1) | | 11/9/2021 | | Senior | | Office | | Framingham, MA | | LIBOR + 175 bps | | 11/9/2024 | | Interest only | | $72,033 | | $62,809 | | $62,287 |
| 9-90 Corporate Center | | 11/9/2021 | | Mezzanine | | Office | | Framingham, MA | | LIBOR + 575 bps | | 11/9/2024 | | Interest only | | $23,344 | | $20,936 | | $20,389 |
Panorama House(1) | | 11/16/2021 | | Senior | | Multifamily | | Roseville, CA | | SOFR + 165 bps | | 12/9/2025 | | Interest only | | $66,488 | | $66,488 | | $65,810 |
| Panorama House | | 11/16/2021 | | Mezzanine | | Multifamily | | Roseville, CA | | SOFR + 597 bps | | 12/9/2025 | | Interest only | | $22,163 | | $22,163 | | $21,630 |
| Tucson IV | | 3/28/2022 | | Senior | | Multifamily | | Tuscon, AZ | | SOFR + 295 bps | | 4/9/2025 | | Interest only | | $76,260 | | $71,947 | | $72,187 |
| Tucson IV | | 3/28/2022 | | Mezzanine | | Multifamily | | Tuscon, AZ | | SOFR + 295 bps | | 4/9/2025 | | Interest only | | $25,420 | | $23,982 | | $22,189 |
Dolce Living Royal Palm(1) | | 7/8/2022 | | Senior | | Multifamily | | Kissimmee, FL | | SOFR + 185 bps | | 7/9/2024 | | Interest only | | $51,432 | | $51,432 | | $51,290 |
| Dolce Living Royal Palm | | 7/8/2022 | | Mezzanine | | Multifamily | | Kissimmee, FL | | SOFR + 525 bps | | 7/9/2024 | | Interest only | | $17,144 | | $17,144 | | $16,970 |
Luxe Scottsdale(1) | | 7/19/2022 | | Mezzanine | | Multifamily | | Scottsdale, AZ | | SOFR + 570 bps | | 8/9/2025 | | Interest only | | $17,043 | | $17,072 | | $16,789 |
| Total | | | | | | | | | | | | | | | | | | | | $349,541 |
(1) During the acquisition of an office property in Farmington, Massachusetts, amounting to $63.0 million and has committed to fund an additional $30.4 million for future renovations of the property. On November 16, 2021 the Company originated a second floating rate senior mortgage and mezzanine loan in the amount of $76.9 million to finance the acquisition of a multifamily property in Seattle, Washington, with additional commitments to fund $11.1 million for future renovations.
On March 24,year ended December 31, 2022, the Company sold thefour senior portion of a loanloans to an unaffiliated party and retained the subordinate mortgage,parties, receiving total proceeds of $47.4$208.5 million, which isare net of disposition fees.fees and additional fundings. The salesenior loan sales, with the exception of Luxe Scottsdale, did not qualify for sale accounting under US GAAP and as such, the loan wasloans were not de-recognized. On
For the three months ended March 28,31, 2023, the Company had unrealized losses on its commercial mortgage loans of $0.9 million. For the three months ended March 31, 2022, the Company originated a floating rate seniordid not have any unrealized losses on its commercial mortgage and mezzanine loan to finance the acquisition and reposition of five multi-family properties located in Tucson, AZ, amounting to $92.4 million and have committed to fund an additional $9.3 million for future renovations of the property.loans.
For the three months ended March 31, 2023 and 2022 the Company recognized interest income and loan origination fee income from its investment in its commercial mortgage loans of $6.5 million and $2.0 million. As of March 31, 2021, the Company did not have a commercial mortgage loan investment.million, respectively.
The following is a reconciliation of the beginning and ending balances for the Company’s investment in commercial mortgage loans for the three months ended March 31, 20222023 ($ in thousands):
| | | | | |
| Investment in Commercial Mortgage Loans |
Balance as of December 31, 20212022 | $ | 140,512343,970 | |
Loan originations | 92,350 | |
| |
| Additional fundings | 7756,546 | |
Net unrealized loss (1) | (975) | |
Balance as of March 31, 20222023 | $ | 233,637349,541 | |
(1) Includes unrealized loss on commercial mortgage loans of $0.9 million combined with unrealized loss of $26.0 thousand associated with loan participations.
Note 8. Intangibles
The gross carrying amount and accumulated amortization of the Company’s intangible assets and liabilities consisted of the following ($ in thousands): | | | March 31, 2022 | | December 31,
2021 | | March 31, 2023 | | December 31, 2022 |
| Intangible assets: | Intangible assets: | | | | Intangible assets: | | | |
| In-place lease intangibles | In-place lease intangibles | $ | 58,503 | | | $ | 53,031 | | In-place lease intangibles | $ | 96,035 | | | $ | 95,325 | |
| Above-market lease intangibles | Above-market lease intangibles | 490 | | | 493 | | Above-market lease intangibles | 13,030 | | | 13,030 | |
| Leasing commissions | Leasing commissions | 22,666 | | | 20,559 | | Leasing commissions | 42,813 | | | 41,757 | |
| Other intangibles | Other intangibles | 7,174 | | | 5,666 | | Other intangibles | 19,012 | | | 18,881 | |
| Total intangible assets | Total intangible assets | 88,833 | | | 79,749 | | Total intangible assets | 170,890 | | | 168,993 | |
| Accumulated amortization: | Accumulated amortization: | | Accumulated amortization: | |
| In-place lease intangibles | In-place lease intangibles | (19,992) | | | (16,282) | | In-place lease intangibles | (37,559) | | | (33,200) | |
| Above-market lease intangibles | Above-market lease intangibles | (180) | | | (77) | | Above-market lease intangibles | (1,426) | | | (943) | |
| Leasing commissions | Leasing commissions | (5,812) | | | (5,055) | | Leasing commissions | (10,548) | | | (9,034) | |
| Other intangibles | Other intangibles | (1,093) | | | (862) | | Other intangibles | (3,602) | | | (2,825) | |
| Total accumulated amortization | Total accumulated amortization | (27,077) | | | (22,276) | | Total accumulated amortization | (53,135) | | | (46,002) | |
| Intangible assets, net | Intangible assets, net | $ | 61,756 | | | $ | 57,473 | | Intangible assets, net | $ | 117,755 | | | $ | 122,991 | |
| Intangible liabilities: | Intangible liabilities: | | | | Intangible liabilities: | | | |
| Below-market lease intangibles | Below-market lease intangibles | $ | (28,303) | | | $ | (25,841) | | Below-market lease intangibles | $ | (47,785) | | | $ | (47,785) | |
| Accumulated amortization | Accumulated amortization | 4,092 | | | 3,319 | | Accumulated amortization | 9,064 | | | 7,553 | |
| Intangible liabilities, net | Intangible liabilities, net | $ | (24,211) | | | $ | (22,522) | | Intangible liabilities, net | $ | (38,721) | | | $ | (40,232) | |
Amortization expense relating to intangible assets was $4.8 $7.1 million and $1.7$4.8 million, respectively, for the three months ended March 31, 2023 and 2022, which includes above market lease amortization of $0.5 millionand 2021, respectively.$0.1 million, respectively, that is recorded to Rental revenue on the Consolidated Statement of Operations. Income from the amortization of intangible liabilities was $0.8$1.5 million and $0.2$0.8 million, respectively, for the three months ended March 31, 20222023 and 2021, respectively.2022.
The estimated future amortization on the Company’s intangibles for each of the next five years and thereafter as of March 31, 2023 is as follows ($ in thousands): | | | In-Place Lease
Intangibles | | Above-Market Lease Intangibles | | Leasing Commissions | | Other
Intangibles | | Below-Market
Lease Intangibles | | In-Place Lease
Intangibles | | Above-Market Lease Intangibles | | Leasing Commissions | | Other
Intangibles | | Below-Market
Lease Intangibles |
| 2022 (remaining) | $ | 9,807 | | | $ | 32 | | | $ | 1,995 | | | $ | 846 | | | $ | (2,526) | | |
| 2023 | 6,656 | | | 54 | | | 2,824 | | | 1,123 | | | (3,400) | | |
| 2023 (Remaining) | | 2023 (Remaining) | $ | 12,514 | | | $ | 1,334 | | | $ | 4,335 | | | $ | 2,617 | | | $ | (4,576) | |
| 2024 | 2024 | 6,163 | | | 54 | | | 2,717 | | | 1,068 | | | (3,320) | | 2024 | 10,770 | | | 1,852 | | | 5,378 | | | 2,851 | | | (5,470) | |
| 2025 | 2025 | 4,658 | | | 54 | | | 2,287 | | | 821 | | | (2,699) | | 2025 | 8,683 | | | 1,786 | | | 4,809 | | | 2,533 | | | (5,018) | |
| 2026 | 2026 | 2,992 | | | 54 | | | 1,789 | | | 533 | | | (2,423) | | 2026 | 6,435 | | | 1,727 | | | 4,004 | | | 2,048 | | | (4,526) | |
| 2027 | | 2027 | 5,070 | | | 1,688 | | | 3,318 | | | 1,662 | | | (3,921) | |
| Thereafter | Thereafter | 9,385 | | | 62 | | | 5,242 | | | 1,690 | | | (9,843) | | Thereafter | 15,004 | | | 3,217 | | | 10,421 | | | 3,699 | | | (15,210) | |
| $ | 39,661 | | | $ | 310 | | | $ | 16,854 | | | $ | 6,081 | | | $ | (24,211) | | |
| Total | | Total | $ | 58,476 | | | $ | 11,604 | | | $ | 32,265 | | | $ | 15,410 | | | $ | (38,721) | |
As of March 31, 2022,2023, the weighted-average amortization periods for the acquired in-place lease intangibles, above-market lease intangibles, leasing commissions, other intangibles and below-market lease intangibles of the properties acquired were 6, 6, 7, 9 and 12 years, respectively.
Note 9. Credit Facility and Mortgages Payable
Credit Facility
On October 24, 2018, the Company entered into a credit agreement (“Credit Agreement”) with Wells Fargo Bank, National Association (“Wells Fargo”), as administrative agent and lead arranger. The Credit Agreement providesprovided for aggregate commitments of up to $60.0 million for unsecured revolving loans, with an accordion feature that may increase the aggregate commitments to up to $500.0 million (the “Credit Facility”). Loans outstanding under the Credit Facility bear interest, at Nuveen OP’s option, at either an adjusted base rate or an adjusted 30-day LIBOR rate, in each case, plus an applicable margin. The applicable margin ranges from 1.30% to 1.90% for borrowings at the adjusted LIBOR rate, in each case, based on the total leverage ratio of Nuveen OP and its subsidiaries. Interest under the Credit Facility is determined based on a one-month U.S. dollar-denominated LIBOR, which was 0.1% and 1.8% as of December 31, 2020 and 2019, respectively. Loans under the Credit Facility will mature three years from October 24, 2018, with an option to extend twice for an additional year pursuant to the terms of the Credit Agreement. On December 17, 2018 and June 11, 2019, the Company amended the Credit Agreement to increase the Credit Facility to $150.0 million and $210.0 million in aggregate commitments, respectively, with all other terms remaining the same.
On September 30, 2021, the borrower andWells Fargo Bank, N.A., the Company and Nuveen OP amended the Credit Agreement to increase the Credit Facility to $335.0 million in aggregate commitments, comprised of a $235.0 million revolving facility, and a senior delayed draw term loan facility in the aggregate amount of up to $100.0 million (the “DDTL Facility”). Loans under the DDTL Facility may be borrowed in up to 3three advances, each in a minimum amount of $30.0 million. The Credit Facility will terminate, and all amounts outstanding thereunder will be due and payable in full, on September 30, 2024 (the “Revolving Termination Date”), with 2two additional one-year extension options held by Nuveen OP, including the payment of an extension fee of 0.125% of the aggregate commitment. The DDTL Facility will mature, and all amounts outstanding thereunder will be due and payable in full, on September 30, 2026.
On February 17, 2023, the Company amended its Credit Agreement to increase the Credit Facility to $455.0 million in aggregate commitments, comprised of a $321.0 million revolving facility and a delayed draw term loan facility of $134.0 million, with an accordion feature that may increase aggregate commitments up to $800.0 million. The Credit Facility will convert to SOFR effective May 1, 2023, at SOFR plus .10%, plus applicable margin under the existing margin, with all other terms remaining the same.
Loans outstanding under the Credit Facility bear interest, at Nuveen OP’s option, at either an adjusted base rate or an adjusted LIBOR rate, in each case, plus an applicable margin. The applicable margin ranges from 0.30% to 0.90% for Credit Facility borrowings for base rate loans, in each case, based on the total leverage ratio of the Nuveen OP and its subsidiaries. The applicable margin ranges from 1.30% to 1.90% for Credit Facility borrowings at the adjusted LIBOR rate, in each case, based on the total leverage ratio of the Nuveen OP and its subsidiaries. Loans outstanding under the DDTL Facility bear interest, at the Nuveen OP’s option, at either an adjusted base rate or an adjusted LIBOR rate, in each case, plus an applicable margin. The applicable margin ranges from 0.25% to 0.85% for DDTL Facility borrowings for base rate loans, in each case, based on the total leverage ratio of the Nuveen OP and its subsidiaries. The applicable margin ranges from 1.25% to 1.85% for DDTL Facility borrowings at the adjusted LIBOR rate, in each case, based on the total leverage ratio of the Nuveen OP and its subsidiaries. There is an unused fee of 0.15% if the usage is greater than or equal to 50% of the aggregate commitments and 0.25% of the usage is less than 50% of the aggregate commitments. There is a ticking fee on the DDTL Facility equal to 0.15% of the undisbursed portion of the DDTL Facility. An upfront fee of 40 basis points was payable at closing.
In July 2017, the Financial Conduct Authority (the authority that regulates LIBOR) announced it intends to stop compelling banks to submit rates for the calculation of LIBOR after 2021. The Alternative Reference Rates Committee has proposed that the Secured Overnight Financing Rate (“SOFR”)SOFR is the rate that represents best practice as the alternative to USD-LIBOR for
use in derivatives and other financial contracts that are currently indexed to USD-LIBOR. On April 3, 2023, the Financial Conduct Authority announced that it will compel the ICE Benchmark Administration, which is supervised by the Financial Conduct Authority, to publish an unrepresentative synthetic USD-LIBOR through September 30, 2024 for use in legacy contracts. The consequence of these developments cannot be entirely predicted but could include an increase in the cost of ourits variable rate indebtedness.
The following is a summary of the Credit Facility ($ in thousands): | | | Principal Balance Outstanding | | Principal Balance Outstanding |
| Indebtedness | Indebtedness | | Interest Rate | | Maturity Date | | Maximum Facility Size | | March 31, 2022 | | December 31, 2021 | Indebtedness | | Interest Rate | | Maturity Date | | Maximum Facility Size | | March 31, 2023 | December 31, 2022 |
| Revolving facility | Revolving facility | | L+applicable margin(1) | | September 30, 2024 | | $ | 235,000 | | | $ | 195,000 | | | $ | 163,000 | | Revolving facility | | L+applicable margin(1) | | September 30, 2024 | | $ | 321,000 | | | 56,500 | | $ | 90,000 | |
| DDTL Facility | | L+applicable margin(1) | | September 30, 2026 | | 100,000 | | | 75,000 | | | 75,000 | | |
| Totals | | $ | 335,000 | | | $ | 270,000 | | | $ | 238,000 | | |
| DDTL facility | | DDTL facility | | L+applicable margin(1) | | September 30, 2026 | | 134,000 | | | 134,000 | | 100,000 | |
| Credit facility | | Credit facility | | $ | 455,000 | | | $ | 190,500 | | $ | 190,000 | |
(1) The weighted-average interest raterates for the three months ended March 31, 2022 was 1.32%.2023 for the Revolving facility and the DDTL facility were 5.82% and 5.79%, respectively.
As of March 31, 2022,2023, the Company had $270.0$190.5 million in borrowings and had outstanding accrued interest of $0.3$3.2 million under the Credit Facility. For the three months ended March 31, 20222023 and 2021,2022, the Company incurred $2.7 million and $0.8 million, and $0.4 millionrespectively, in interest expense under the Credit Facility, respectively.Facility.
As of March 31, 2022,2023, the Company was in compliance with all loan covenants with respect to the Credit Agreement.
The following table presents future principal payments due under the Credit Facility as of March 31, 2023 ($ in thousands):
| | | | | | | | |
| Year | | Credit Facility |
| | |
| 2023 (Remaining) | | $ | —�� | |
| 2024 | | 56,500 | |
| 2025 | | — | |
| 2026 | | 134,000 | |
| 2027 | | — | |
| Thereafter | | — | |
| Total | | $ | 190,500 | |
Note 10. Mortgages Payable
The following table is a summary of the Company's Mortgages Payable secured by the Company’s properties ($ in thousands):
| | | Principal Balance Outstanding | | Principal Balance Outstanding |
| Indebtedness | Indebtedness | | Lender | | Interest Rate | | Maturity Date | | Maximum Principal Amount | | March 31, 2022 | | December 31, 2021 | Indebtedness | | Lender | | Interest Rate(1) | | Maturity Date | | March 31, 2023 | | December 31, 2022 |
| Fixed rate mortgages payable: | Fixed rate mortgages payable: | | | | | | | | | | | | | Fixed rate mortgages payable: | | | | | | | | | | |
| Main Street at Kingwood | Main Street at Kingwood | | Nationwide Life Insurance Company | | 3.15% | | 12/01/26 | | $ | 48,000 | | | $ | 48,000 | | | $ | 48,000 | | Main Street at Kingwood | | Nationwide Life Insurance Company | | 3.15% | | 12/01/26 | | $ | 48,000 | | | $ | 48,000 | |
| Tacara Steiner Ranch | Tacara Steiner Ranch | | Brighthouse Life Insurance | | 2.62% | | 06/01/28 | | 28,750 | | | 28,750 | | | 28,750 | | Tacara Steiner Ranch | | Brighthouse Life Insurance | | 2.62% | | 06/01/28 | | 28,750 | | | 28,750 | |
| Signature at Hartwell | Signature at Hartwell | | Allstate/American Heritage | | 3.01% | | 12/01/28 | | 29,500 | | | 29,500 | | | 29,500 | | Signature at Hartwell | | Allstate/American Heritage | | 3.01% | | 12/01/28 | | 29,500 | | | 29,500 | |
| GFI Grocery Anchored Portfolio | | GFI Grocery Anchored Portfolio | | Nationwide/Amerant/Synovus | | 2.98% - 3.40% | | Various | | 69,599 | | | 69,634 | |
| Total fixed rate mortgages payable | Total fixed rate mortgages payable | | | | | | | | | | 106,250 | | | 106,250 | | Total fixed rate mortgages payable | | 175,849 | | | 175,884 | |
| Variable rate mortgage payable: | | Variable rate mortgage payable: | |
| CASA Nord Portfolio | | CASA Nord Portfolio | | Nyrkredit Realkredit | | C + 0.70%(2) | | 12/31/32 | | 20,804 | | | 20,173 | |
| Total mortgages payable | | Total mortgages payable | | 196,653 | | | 196,057 | |
| Deferred financing costs, net | Deferred financing costs, net | | (606) | | | (636) | | Deferred financing costs, net | | (840) | | | (865) | |
| Discount on assumed mortgage notes | | Discount on assumed mortgage notes | | (6,974) | | | (7,284) | |
| Mortgages payable, net | Mortgages payable, net | | $ | 105,644 | | | $ | 105,614 | | Mortgages payable, net | | $ | 188,839 | | | $ | 187,908 | |
(1) The term "C" refers to the relevant floating benchmark rates, which is the three-month Copenhagen Interbank Offered Rate ("CIBOR") for the CASA Nord variable rate mortgage payable..
(2) CASA Nord entered into an interest rate swap on January 3, 2023, which fixed the rate at 3.18%.
As of March 31, 2022,2023, the Company had $106.3 million in borrowings and $0.2 million inoutstanding accrued interest outstanding under its Mortgages Payable.of $0.3 million on mortgages payable. For the three months ended March 31, 20222023 and 2021,2022, the Company incurred $1.5 million and $0.8 million, respectively, in interest expense on mortgages payable, respectively.payable.
The following table presents the future principal payments due under the Credit Facilitymortgages payable as of March 31, 2023 ($ in thousands):
| | | | | | | | |
| Year | | Mortgages Payable |
| | |
| 2023 (Remaining) | | $ | 293 | |
| 2024 | | 542 | |
| 2025 | | 1,486 | |
| 2026 | | 54,639 | |
| 2027 | | 15,641 | |
| Thereafter | | 124,052 | |
| Total | | $ | 196,653 | |
Note 11. Note Payable
The Company finances the acquisition of certain commercial mortgage loans through the use of "note-on-note" transactions. The notes bear interest based on competitive market rates determined at the time of issuance. The notes involve leverage risk and Mortgagesalso the risk that the market value of the collateral will decline below the amount of the funding advanced. As of March 31, 2023, the Company has one note outstanding with Capital One which matures on April 9, 2025. As of March 31, 2023, the total principal amount of the note was $69.3 million and the Company had $0.2 million in accrued interest outstanding. Interest expense incurred for the three months ended March 31, 2023 was $1.1 million based on a rate of SOFR plus 1.65%.
The following is a reconciliation of the beginning and ending balances for the Company's note payable for the three months ended March 31, 2023 ($ in thousands):
| | | | | |
| Note Payable |
| Balance as of December 31, 2022 | $ | 69,030 | |
| Net unrealized loss | 30 | |
| Balance as of March 31, 2023 | $ | 69,060 | |
The following table presents the future principal payments due under the Note Payable as of March 31,
20222023 ($ in thousands):
| | | | | | | | | | | | | | | | | |
| | Amount | |
| Year | | Credit Facility | | Mortgages Payable | Total |
| | | | | |
| 2022 (remaining) | | $ | — | | | $ | — | | $ | — | |
| 2023 | | — | | | — | | — | |
| 2024 | | 195,000 | | | — | | 195,000 | |
| 2025 | | — | | | — | | — | |
| 2026 | | 75,000 | | | 48,000 | | 123,000 | |
| Thereafter | | — | | | 58,250 | | 58,250 | |
| Total | | $ | 270,000 | | | $ | 106,250 | | $ | 376,250 | |
| | | | | | | | |
| Year | | Note Payable |
| 2023 (Remaining) | | $ | — | |
| 2024 | | — | |
| 2025 | | 69,263 | |
| 2026 | | — | |
| 2027 | | — | |
| Thereafter | | — | |
| Total | | $ | 69,263 | |
The weighted-average interest rate on the note payable for the three months ended March 31, 2023 was 6.18%.
Note 10.12. Other Assets and Other Liabilities
The following table summarizes the components of Other Assets ($ in thousands): | | | March 31, 2022 | | December 31, 2021 | | March 31, 2023 | | December 31, 2022 |
| Straight-line rent receivable | Straight-line rent receivable | $ | 7,068 | | | $ | 6,451 | | Straight-line rent receivable | $ | 10,742 | | | $ | 9,442 | |
| Receivables | Receivables | 3,523 | | | 3,245 | | Receivables | 8,527 | | | 7,788 | |
| Right-of-use asset - finance leases | | Right-of-use asset - finance leases | 2,494 | | | 2,531 | |
| Right-of-use asset - operating lease | | Right-of-use asset - operating lease | 2,097 | | | 2,123 | |
| Prepaid expenses | | Prepaid expenses | 2,258 | | | 2,057 | |
| Deferred financing costs on credit facility, net | Deferred financing costs on credit facility, net | 1,627 | | | 1,710 | | Deferred financing costs on credit facility, net | 1,779 | | | 1,140 | |
| Prepaid expenses | 822 | | | 1,154 | | |
| | Other | Other | 890 | | | 7,985 | | Other | 513 | | | 1,274 | |
| Total | Total | $ | 13,930 | | | $ | 20,545 | | Total | $ | 28,410 | | | $ | 26,355 | |
The following table summarizes the components of Accounts Payable, Accrued Expenses and Other Liabilities ($ in thousands): | | | March 31, 2022 | | December 31, 2021 | | March 31, 2023 | | December 31, 2022 |
| Common stock repurchases | | Common stock repurchases | $ | 37,552 | | | $ | 12,637 | |
| Accounts payable and accrued expenses | | Accounts payable and accrued expenses | 23,564 | | | 29,343 | |
| Tenant security deposits | | Tenant security deposits | 7,444 | | | 6,531 | |
| Real estate taxes payable | Real estate taxes payable | $ | 3,554 | | | $ | 3,072 | | Real estate taxes payable | 6,543 | | | 6,794 | |
| Accounts payable and accrued expenses | 9,467 | | | 5,733 | | |
| Accrued interest expense | | Accrued interest expense | 3,936 | | | 3,794 | |
| Lease liability - finance leases | | Lease liability - finance leases | 2,527 | | | 2,531 | |
| Lease liability - operating lease | | Lease liability - operating lease | 2,140 | | | 2,123 | |
| Prepaid rental income | Prepaid rental income | 3,306 | | | 2,213 | | Prepaid rental income | 2,500 | | | 2,332 | |
| Tenant security deposits | 2,632 | | | 2,010 | | |
| Accrued interest expense | 598 | | | 462 | | |
| Deferred tax liability | | Deferred tax liability | 2,642 | | | 2,273 | |
| Other | Other | 3,696 | | | 1,320 | | Other | 11,713 | | | 6,213 | |
| Total | Total | $ | 23,253 | | | $ | 14,810 | | Total | $ | 100,561 | | | $ | 74,571 | |
Note 11.13. Related Party Transactions
Management Fees Due to Related Party
Pursuant to the advisory agreement between the Company, Nuveen OP, and the Advisor, the Advisor is responsible for sourcing, evaluating and monitoring the Company’s investment opportunities and making decisions related to the acquisition, management, financing and disposition of the Company’s assets, in accordance with the Company’s investment objectives, guidelines, policies and limitations, subject to oversight by the Company’s board of directors.
The Advisor will receivereceives fees, and compensation, payable monthly in arrears, in connection with the offering and ongoing management of the assets of the Company, as follows:
| | | | | | | | | | | | | | | | | | | | | | | | | | | | | |
| Class T Shares | | Class S Shares | | Class D Shares | | Class I Shares | | Class N Shares |
| Advisory Fee (% of NAV) | 1.25% | | 1.25% | | 1.25% | | 1.25% | | 0.65% |
As of March 31, 2023 and December 31, 2022, the Company had accrued advisory fees of approximately $4.6$2.3 million at each period end which has been included in Accounts Payable, Accrued Expenses and Other Liabilities on the Company’s Consolidated Balance Sheets. For the three months ended March 31, 20222023 and 2021,2022, the Company incurred advisory fee expenses of $6.3 million and $3.6 million, and $1.1 million, respectively.
Fees Due to Affiliates
The Company may retain certain of the Advisor’s affiliates for necessary services relating to the Company’s investments or its operations, including construction, special servicing, leasing, development, property oversight and other property management services, as well as services related to mortgage servicing, group purchasing, healthcare, consulting/brokerage, capital markets/credit origination, loan servicing, property, title and other types of insurance, management consulting and other similar operational matters.
During the year ended December 31, 2020, the
The Company has engaged NexCore Companies LLC ("NexCore"), an affiliate of TIAA, to provide property management, accounting and leasing services for certain of its investments in healthcare properties. NexCore is a real estate development company focused exclusively on development, acquisition and management of healthcare real estate. The Company paid approximately $82,000 and $15,000 in management fees to NexCore during the three months ended March 31, 2022 and 2021, respectively.
Additionally, asAs part of this engagement, the Company may pay acquisition fees to NexCore for sourcing deals. The Company did not incur any acquisition fees to NexCore duringdeals and the three months ended March 31, 2022 and 2021. The Company may also enter into joint ventures with NexCore, and pursuant to the terms of the joint venture agreements, if certain internal rate of return hurdles are met, Nexcore will participate in the profits based on a set criteria once each member has received distributions in excess of hurdle rates or at the crystallization event. NexCore may receive a promotehas the ability to exercise the crystallization event at any time following the fifth anniversary from the joint venture. Theeffective date of the agreement. As of March 31, 2023, the Company has entered in 3into eight joint venture arrangementsagreements with NexCore as of March 31, 2022, which have not incurred any promote payments.NexCore.
On July 27, 2021, theThe Company entered in an agreement with Imajn Homes Holdings ("Sparrow"), an affiliate of TIAA, to assist the Company in acquiring and managing single-family housing in the United States. Sparrow is a vertically integrated company with acquisition, asset, property and construction management capabilities. As part of the joint venture arrangement with Sparrow, if certain internal rate of return hurdles are met, Sparrow will participate in the profits based on a set criteria at the crystallization event. Additionally, Sparrow has the ability to exercise the crystallization event between the fifth and sixth anniversaries from the effective date of the agreement. Subsequent to entering in the agreement, the Company committed $100.0$150.0 million to acquire single family rentals identified by Sparrow.
The Company incurred approximately $109,374entered in an agreement with Frigatebird CP Holdings LLC ("MyPlace"), an affiliate of TIAA, to assist the Company in acquiring and $40,291managing self-storage properties in the United States. MyPlace is a vertically integrated company with acquisition, asset, property and propertyconstruction management fees, respectively, related to Sparrow during eachcapabilities. As part of the three months ended March 31, 2022. No fees were incurred byjoint venture arrangement with MyPlace, if certain internal rate of return hurdles are met, MyPlace will participate in the Company forprofits based on a set criteria once each member has received distributions in excess of hurdle rates or at the three months ended March 31, 2021.crystallization event. MyPlace has the ability to exercise the crystallization event between the fifth and seventh anniversaries from the effective date of the agreement.
On August 23, 2021, theThe Company entered into a master services agreement with Nuveen Real Estate Project Management
Services, LLC (“Nuveen RE PMS”), an affiliate of the Advisor, for the purpose of Nuveen RE PMS providing professional services described below in connection with certain of ourthe Company's real estate investments.
For project management services provided by Nuveen RE PMS, the Company will pay Nuveen RE PMS fees determined by the estimated total cost of the any project; provided that such fees shall not exceed 6% of project costs. For development and management services provided by Nuveen RE PMS, the Company will pay Nuveen RE PMS fees to be determined by the complexity and size of the project; provided that such fees shall not exceed 4% of project costs. NoAs of March 31, 2023, no fees have been incurred by the Company asto Nuveen RE PMS.
The following table is a summary of the Company’s affiliated service providers and the fees incurred by the Company to those service providers for the three months ended March 31, 2022.2023 ($ in thousands):
| | | | | | | | | | | | | | | | | | | | |
| Service provided | | NexCore | | Sparrow | | MyPlace |
| Property and project management services | | $ | 111 | | | $ | 175 | | | $ | — | |
| Acquisition and asset management services | | — | | | 164 | | | 69 | |
| Accounting and leasing services | | 275 | | | — | | | — | |
| Total | | $ | 386 | | | $ | 339 | | | $ | 69 | |
The following table is a summary of the Company’s affiliated service providers and the fees incurred by the Company to those service providers for the three months ended March 31, 2022 ($ in thousands):
| | | | | | | | | | | | | | |
| Service provided | | NexCore | | Sparrow |
| Property and project management services | | $ | 82 | | | $ | 40 | |
| Accounting and leasing services | | 14 | | | — | |
| Acquisition and asset management services | | — | | | 109 | |
| Total | | $ | 96 | | | $ | 149 | |
Stockholder Servicing Fee
Nuveen Securities, LLC (the “Dealer Manager”"Dealer Manager") serves as the dealer manager for the Initial Public Offering and Follow-on Public Offering (together, the "Offerings"). The Dealer Manager is a registered broker-dealer affiliated with the Advisor. The Company’sCompany's obligations under the Dealer Manager Agreement to pay stockholder servicing fees with respect to the Class T, Class S and Class D shares distributed in the Offerings shall survive until such shares are no longer outstanding or converted into Class I shares. As ofFor the three months ended March 31, 2023 and March 31, 2022, the Company incurred stockholder servicing fees of $1.7 million and $1.1 million, respectively. As of March 31, 2023, the Company accrued approximately $30.2$47.6 million of stockholder servicing fees with respect to the outstanding Class T, Class S and Class D common shares.shares, which includes $0.6 million for the current month.
The following table presents the upfront selling commissions and dealer manager fees for each class of shares sold in the Offerings, and the stockholder servicing feefees per annum based on the aggregate outstanding NAV: | | | | | | | | | | | | | | | | | | | | | | | |
| Class T Shares | | Class S Shares | | Class D Shares | | Class I Shares |
| Maximum Upfront Selling Commissions (% of Transaction Price) | up to 3.0% | | up to 3.5% | | — | | — |
| Maximum Upfront Dealer Manager Fees (% of Transaction Price) | up to 0.5% | | — | | — | | — |
| Stockholder Servicing Fee (% of NAV) | 0.85%(1) | | 0.85% | | 0.25% | | — |
| | | | | | | | | | | | | | | | | | | | | | | |
| Class T Shares | | Class S Shares | | Class D Shares | | Class I Shares |
| Maximum Upfront Selling Commissions (% of Transaction Price) | up to 3.0% | | up to 3.5% | | up to 1.5% | | — |
| Maximum Upfront Dealer Manager Fees (% of Transaction Price) | up to 0.5% | | — | | — | | — |
| Stockholder Servicing Fee (% of NAV) | 0.85%(1) | | 0.85% | | 0.25% | | — |
(1) Consists of an advisor stockholder servicing fee of 0.65% per annum and a dealer stockholder servicing fee of 0.20% per annum (or other amounts, provided that the sum equals 0.85%), of the aggregate NAV of outstanding Class T shares.
The Company will cease paying the stockholder servicing fee with respectDue to any Class T share, Class S share or Class D share held in a stockholder’s account at the end of the month in which the Dealer Manager, in conjunction with the transfer agent, determines that total upfront selling commissions, dealer manager fees and stockholder servicing fees paid with respect to the shares held within such account would exceed, in the aggregate, 8.75% of the sum of the gross proceeds from the sale of such shares and the aggregate gross proceeds of any shares issued under the distribution reinvestment plan with respect thereto (or, solely with respect to the Class T shares, a lower limit set forth in an agreement between the Dealer Manager and the applicable participating broker-dealer in effect on the date that such shares were sold). At the end of such month, each Class T share, Class S share and Class D share held in a stockholder’s account will convert into a number of Class I shares (including any fractional shares) with an equivalent aggregate NAV as such share. The Company accrues the cost of the stockholder servicing fee as an offering cost at the time each Class T, Class S and Class D share is sold. There is not a stockholder servicing fee with respect to Class I shares.
If not already converted into Class I shares upon a determination that total upfront selling commissions, dealer manager fees and stockholder servicing fees paid with respect to such shares would exceed the applicable limit as described above, each Class T share, Class S share, Class D share and Class N share held in a stockholder’s account will automatically and without any action on the part of the holder thereof convert into a number of Class I shares (including any fractional shares) with an equivalent NAV as such share on the earliest of (i) a listing of Class I shares, (ii) the Company’s merger or consolidation with or into another entity or the sale or other disposition of all or substantially all of the Company��s assets, in each case in a transaction in which stockholders receive cash and/or listed securities or (iii) after termination of the primary portion of the offering in which such Class T shares, Class S shares and Class D shares were sold, the end of the month in which the Company, with the assistance of the dealer manager, determines that all underwriting compensation from all sources in connection with the public offering in which the shares were sold, including upfront selling commissions, the stockholder servicing fee and other underwriting compensation, is equal to 10% of the gross proceeds of the primary portion of such Offering. In addition, immediately before any liquidation, dissolution or winding up, each Class T share, Class S share, Class D share and Class N shares will automatically convert into a number of Class I shares (including any fractional shares) with an equivalent NAV as such share.
Other Related Party TransactionsAffiliates
The following table summarizes the components of Due to Affiliates ($ in thousands): | | | March 31,
2022 | | December 31,
2021 | | March 31,
2023 | | December 31,
2022 |
Accrued stockholder servicing fees(1) | Accrued stockholder servicing fees(1) | $ | 30,194 | | | $ | 25,358 | | Accrued stockholder servicing fees(1) | $ | 47,565 | | | $ | 47,086 | |
| Advanced organization and offering expenses | Advanced organization and offering expenses | 4,880 | | | 4,648 | | Advanced organization and offering expenses | 3,551 | | | 3,551 | |
| Total | Total | $ | 35,074 | | | $ | 30,006 | | Total | $ | 51,116 | | | $ | 50,637 | |
(1)The Company accrues the full amount of future stockholder servicing fees payable to the Dealer Manager for Class T, Class S and Class D shares up to the 8.75% of gross proceeds limit at the time such shares are sold. The Dealer Manager has entered into agreements with the selected dealers distributing the Company’s shares in the Offerings, which provide, among other things, for the re-allowance of the full amount of the selling commissions and the dealer manager fee and all or a portion of stockholder servicing fees received by the Dealer Manager to such selected dealers. The Company will no longer incur the stockholder servicing fee after September 2056 in connection with those Class T, Class S and Class D shares currently outstanding; the fees may end sooner if the total underwriting compensation paid in respect of the Offering reaches 10.0% of the gross offering proceeds or if the Company completes a liquidity event. The Company will incur stockholder servicing fees in connection with future issuances of Class D shares for a 35-year period from the date of issuance and seven years for Class T shares and Class S shares from date of issuance.
issuance, assuming the maximum up-front selling commissions and dealer manager fees are paid.See "Note 15.18. Equity and Redeemable Non-controlling Interest" for additional information related to TIAA's purchase of $300.0 million Class N shares of the Company's common stock through its wholly-owned subsidiary.
See "Note 6. Investment in International Affiliated Funds" for additional information related to the Company's investment in International Affiliated Funds.
Note 12.14. Economic Dependency
The Company depends on the Advisor and its affiliates for certain services that are essential to it, including the sale of the Company’s shares of common stock, acquisition and disposition decisions, and certain other responsibilities. In the event that the Advisor and its affiliates are unable to provide such services, the Company would be required to find alternative service providers.
Note 13.15. Risks and Contingencies
The outbreak of COVID-19 and subsequent global pandemic began significantly impacting the U.S. and global financial markets and economies during the first half of 2020. The worldwide spread of the COVID-19 pandemic has created significant uncertainty in the global economy. At this time, tenants have requested certain rent relief and lease modifications from this unprecedented event; however, such requests have not been significant as of March 31, 2022 for the Company's direct real estate investments. Requests have generally been comprised of deferrals, with payments postponed for a brief period (i.e., less than twelve months) and then repaid over the remaining duration of the contract. During the prior year, the Company pursued litigation with a tenant in lease default at one of its office properties in an effort to recover the outstanding balance due to the Company. A settlement agreement was reached between the Company and the tenant in default, and accordingly, the Company received $0.4 million in upfront settlement proceeds paid by the tenant, and is entitled to an additional $0.5 million to be received in 36 equal installments beginning September 1, 2021.
Except as described above, the Company does not have any other material exposure to rent concessions, tenant defaults or loan defaults. The duration and extent of the COVID-19 pandemic over the long-term cannot be reasonably estimated at this time. The extent to which the COVID-19 pandemic impacts the Company’s business, results of operations, investments, and cash flows will depend on future developments, which are highly uncertain and difficult to predict.
Concentrations of risk may arise when a number of properties are located in a similar geographic region such that the economic conditions of that region could impact tenants’ obligations to meet their contractual obligations or cause the values of individual properties to decline. Additionally, concentrations of risk may arise if any one tenant comprises a significant amount of the Company's rent, or if tenants are concentrated in a particular industry.
As of March 31, 2022,2023, the Company had no significant geographic concentrations of risk. Additionally, the Company had no significant concentrations of tenants, as no single tenant had annual contract rent that made up more than 4%6% of the rental income of the Company. There are no significant lease expirations scheduled to occur over the next twelve months. Based on its assessment, the Company has concluded that there is no impairment of its investments as of March 31, 2022.
The Company's investment in the International Affiliated Funds have been negatively impacted by COVID-19 in the foreign countries where their investments are located. The duration and extent of the COVID-19 pandemic over the long-term cannot be reasonably estimated at this time.
The Company's investments in real estate-related securities may also be negatively impacted by uncertainty surrounding the COVID-19 pandemic. Market volatility and economic uncertainty surrounding the COVID-19 pandemic may lead to fluctuations in market pricing, which has the ability to adversely impact the fair value of the Company’s investments in real estate-related securities.
In the normal course of business, the Advisor, on behalf of the Company enters into contracts that contain a variety of representations and warranties and which provide general indemnifications. The Company’s maximum exposure under these arrangements is unknown, as this would involve future claims that may be made against the Company that have not yet occurred. However, based on experience, the Advisor expects the risk of loss to be remote.
Note 14. Tenant16. Leases
The Company’s real estate properties are leased to tenants under operating lease agreements which expire on various dates. Certain leases have the option to extend or terminate at the tenant’s discretion, with termination options resulting in additional fees due to the Company.
Rental income is recognized on a straight linestraight-line basis. The leases do not have material variable payments, material residual value guarantees or material restrictive covenants. Rental income for the three months ended March 31, 2023 and 2022 and 2021 was $21.7$42.3 million and $11.3$21.7 million, respectively.
Aggregate minimum annual rentals for wholly-owned real estate investments owned by the Company through the non-cancelable lease term, excluding short-term multifamily, self-storage and single family rentals as of March 31, 2023 are as follows ($ in thousands): | | Year | Year | | March 31, 2022 | Year | | March 31, 2023 |
| 2022 (remaining) | | $ | 33,096 | | |
| 2023 | | 44,342 | | |
| 2023 (Remaining) | | 2023 (Remaining) | | $ | 68,022 | |
| 2024 | 2024 | | 43,770 | | 2024 | | 86,555 | |
| 2025 | 2025 | | 37,864 | | 2025 | | 78,060 | |
| 2026 | 2026 | | 28,967 | | 2026 | | 66,326 | |
| 2027 | 2027 | | 22,555 | | 2027 | | 54,838 | |
| 2028 | | 2028 | | 43,879 | |
| Thereafter | Thereafter | | 53,516 | | Thereafter | | 121,671 | |
| Total | Total | | $ | 264,110 | | Total | | $ | 519,351 | |
Certain leases provide for additional rental amounts based upon the recovery of actual operating expenses in excess of specified base amounts, sales volume or contractual increases as defined in the lease agreement. These contractual contingent rentals are not included in the table above.
DuringLessee
Certain of the Company’s investments in real estate are subject to ground leases for which the Company is a lessee. The Company’s ground leases are classified as either operating leases or finance leases based on the characteristics of each lease. As of March 31, 2023, the Company had one ground lease classified as operating and two ground leases classified as finance. The right-of-use assets and lease liabilities related to ground leases are reflected within Other Assets and Accounts Payable, Accrued Expenses and Other Liabilities on the Company’s Consolidated Balance Sheets, respectively.
Each of the Company’s ground leases were acquired as part of the acquisition of real estate, and no incremental costs were incurred for such ground leases. The leases do not contain material residual value guarantees or material restrictive covenants. The Company’s ground leases are non-cancelable and certain leases contain renewal options.
The balances of the right-of-use assets and lease liabilities related to the Company's ground leases as of March 31, 2023 are as follows ($ in thousands):
| | | | | | | | | | | | | | | | | |
| Assets: | | March 31, 2023 | | December 31, 2022 |
| Right-of-use asset - finance leases | | | $ | 2,494 | | | $ | 2,531 | |
| Right-of-use asset - operating lease | | 2,097 | | | 2,123 | |
| Liabilities: | | | | |
| Lease liability - finance leases | | | 2,527 | | | 2,531 | |
| Lease liability - operating lease | | 2,140 | | | 2,123 | |
The Company utilized its incremental borrowing rate at the time of entering such leases, which was 8.43%, to determine its lease liabilities. As of March 31, 2023, the weighted average remaining lease term of the Company’s operating lease and finance leases was 38 years and 44 years, respectively.
Aggregate future minimum annual payments for ground leases held by the Company are as follows ($ in thousands):
| | | | | | | | | | | | | | |
| | Operating Lease | | Finance Leases |
| 2023 (Remaining) | | $ | 115 | | | $ | 164 | |
| 2024 | | 154 | | | 219 | |
| 2025 | | 157 | | | 219 | |
| 2026 | | 165 | | | 219 | |
| 2027 | | 169 | | | 219 | |
| Thereafter | | 7,698 | | | 8,808 | |
| Total undiscounted future lease payments | | 8,458 | | | 9,848 | |
| Difference between undiscounted cash flows and discounted cash flows | | (6,318) | | | (7,321) | |
| Total lease liability | | $ | 2,140 | | | $ | 2,527 | |
Expenses related to the Company's ground leases are reflected within Rental Property Operating Expenses on the Company's Consolidated Statements of Operations. Payments under the Company's operating ground leases contain fixed payment components that may include periodic increases based on an index of periodic fixed percentage escalations.
The following table details the components of the Company's finance leases ($ in thousands):
| | | | | | | | | | | | | | |
| | Three Months Ended March 31, |
| | 2023 | | 2022 |
| Interest on lease liabilities | | $ | 142 | | | $ | — | |
| Amortization of right-of-use assets | | 37 | | — | |
| Total finance lease cost | | $ | 179 | | | $ | — | |
Note 17. Derivatives
The Company uses derivative financial instruments to minimize the risks and/or costs associated with the Company’s investments and financing transactions. The Company has not designated any of its derivative financial instruments as hedges as defined under GAAP. Derivatives not designated as hedges are not speculative and are used to manage the Company’s exposure to interest rate movements and other identified risks.
The use of derivative financial instruments involves certain risks, including the risk that the counterparties to these contractual arrangements do not perform as agreed. To mitigate this risk, the Company enters into derivative financial instruments with counterparties it believes to have appropriate credit ratings and that are major financial institutions with which the Company and its affiliates may also have other financial relationships.
Interest Rate Contracts
Certain of the Company’s transactions expose the Company to interest rate risk, including exposure to variable interest rates on certain loans secured by the Company’s real estate. The Company uses derivative financial instruments, which includes interest rate swaps, to limit the Company’s exposure to the future variability of interest rates.
The following table details the Company’s outstanding interest rate derivatives that were non-designated hedges of interest rate risk (notional amounts in thousands):
| | | | | | | | | | | | | | | | | | | | | | | | | | | | | | | | | | | | | | | | | | | | |
| | March 31, 2023 |
| Interest Rate Derivatives | | Number of instruments | | Notional Amount | | Weighted Average Strike Rate | | Index | | Weighted Average Maturity (Years) | | Commencement Date | | Maturity Date |
| Interest rate swaps - property debt | | 1 | | DKK 142,452 | | 3.18% | | CIBOR | | 4.8 | | 1/5/2023 | | 12/30/2027 |
For the three months ended March 31, 20222023 and 2021,March 31, 2022, the Company did not have material exposurerecorded no unrealized gain (loss) related to rent concessions or lease defaults for tenants impacted by the COVID-19 pandemic.changes in fair value of its derivative financial instrument.
Note 15.18. Equity and Redeemable Non-controlling Interest
Authorized Capital
As of March 31, 2022,2023, the Company had authority to issue a total of 2,200,000,0002.2 billion shares of capital stock consisting of the following: | | | | | | | | | | | | | | |
| Classification | | Number of Shares
(in thousands) | | Par Value |
| Class T Shares | | 500,000 | | | $ | 0.01 | |
| Class S Shares | | 500,000 | | | $ | 0.01 | |
| Class D Shares | | 500,000 | | | $ | 0.01 | |
| Class I Shares | | 500,000 | | | $ | 0.01 | |
| Class N Shares | | 100,000 | | | $ | 0.01 | |
| Preferred Stock | | 100,000 | | | $ | 0.01 | |
| Total | | 2,200,000 | | | |
In addition, theThe Company’s board of directors may amend the Charter from time to time, without stockholder approval, to increase or decrease the aggregate number of shares of stock or the number of shares of stock of any class or series that the Company has authority to issue, or to issue additional classes of stock which may be subject to various class-specific fees.stock.
Preferred Stock
On January 2, 2019, the Company filed Articles Supplementary to the Charter, which set forth the rights, preferences and privileges of the Company’s 12.0% Series A cumulative non-voting preferred stock (“Series A Preferred Stock”). On January 4, 2019, the Company sold 125 shares of its Series A Preferred Stock at a purchase price of $1,000 per share in a private placement exempt from registration under the Securities Act of 1933, as amended. The offering of the Series A Preferred Stock
was effected for the purpose of the Company having at least 100 stockholders to satisfy one of the qualifications required in order to qualify as a REIT under the Code. On March 31, 2021, the Company redeemed all of the 125 outstanding shares of the Series A Preferred Stock in accordance with its Charter.
On October 8, 2020, a subsidiary of Nuveen OP sold 125 shares of preferred stock in a private placement to effectuate the formation of a REIT established to hold the Company's industrial property located in Massachusetts for tax management purposes.
Common Stock
As of March 31, 2022,2023, the Company had issued and outstanding 11,849,85117,750,167 shares of Class T common stock, 30,913,22046,144,672 shares of Class S common stock, 6,301,7467,993,000 shares of Class D common stock, 43,743,07880,846,370 shares of Class I common stock and 29,730,608 shares of Class N common stock.
The following tables detailtable details the movement in the Company’sCompany's outstanding shares of common stock (in thousands): for the three months ended March 31, 2023. | | | | | | | | | | | | | | | | | | | | | | | | | | | | | | | | | | | |
| Three Months Ended March 31, 2022 |
| Class T Shares | | Class S Shares | | Class D Shares | | Class I Shares | | Class N Shares | | Total |
| December 31, 2021 | 9,201 | | | 23,809 | | | 4,649 | | | 31,460 | | | 29,731 | | | 98,850 | |
| Common stock issued | 2,598 | | | 6,970 | | | 1,633 | | | 12,174 | | | — | | | 23,375 | |
| Distribution reinvestment plan | 51 | | | 158 | | | 29 | | | 234 | | | — | | | 472 | |
| | | | | | | | | | | |
| Common stock repurchased | — | | | (24) | | | (10) | | | (125) | | | — | | | (159) | |
| March 31, 2022 | 11,850 | | | 30,913 | | | 6,301 | | | 43,743 | | | 29,731 | | | 122,538 | |
| | | | | | | | | | | | | | | | | | | | | | | | | | | | | | | | | | | |
| Three Months Ended March 31, 2023 |
| Class T Shares | | Class S Shares | | Class D Shares | | Class I Shares | | Class N Shares | | Total |
| December 31, 2022 | 17,285 | | | 45,277 | | | 8,010 | | | 79,727 | | | 29,731 | | | 180,030 | |
| Common Stock Issued | 524 | | | 1,837 | | | 60 | | | 4,095 | | | — | | | 6,516 | |
| Distribution Reinvestment | 105 | | | 304 | | | 52 | | | 617 | | | — | | | 1,078 | |
| Vested Stock Grant | — | | | — | | | — | | | 1 | | | — | | | 1 | |
| Common Stock Repurchased | (164) | | | (1,273) | | | (129) | | | (3,594) | | | — | | | (5,160) | |
| March 31, 2023 | 17,750 | | | 46,145 | | | 7,993 | | | 80,846 | | | 29,731 | | | 182,465 | |
TIAA has purchased $300.0 million of the Company’s Class N shares of common stock through its wholly owned subsidiary. Per the terms of the agreement between the Company and TIAA, beginning on January 31, 2023, TIAA may submit a portion of its Class N shares for repurchase, provided that after taking into account the repurchase, the total value of TIAA’s aggregate ownership of our classthe Company's Class N shares shall not be less than $300.0 million. Beginning on January 31, 2025, TIAA may submit all of its remaining shares for repurchase, provided that provided that TIAA must continue to maintain ownership of the $200,000 initial investment in the Company’s shares for so long as the Advisor or its affiliate serves as the Company’s advisor. Notwithstanding the foregoing, the total amount of repurchases of Class N shares eligible for repurchase will be limited to no more than 0.67% of the Company’s aggregate NAV per month and no more than 1.67% of the Company’s aggregate NAV per calendar quarter; provided that,, if in any month or quarter the total amount of aggregate repurchases of all classes of the Company’s common stock do not reach the overall share repurchase plan limits of 2% of the aggregate NAV per month and 5% of the aggregate NAV per calendar quarter, the above repurchase limits on the Class N shares shall not apply to that month or quarter and TIAA shall be entitled to submit shares for repurchase up to the overall share repurchase plan limits.
Restricted Stock Grants
The Company’sEffective July 1, 2022, each independent directors receivedirector receives a $75,000$100,000 annual retainer, and the chairperson of the audit committee will receivereceives an additional $15,000$20,000 annual retainer and the lead independent director receives an additional $5,000 annual retainer. The Company pays 75%50% of this compensation in cash, unrestricted stock, or a combination thereof in quarterly installments and the remaining 25%50% in the form of an annual grant of restricted stock based on the most recent transaction price thatprice. The restricted stock generally vests one year from the date of grant.
Distribution Reinvestment Plan
The Company has adopted a distribution reinvestment plan whereby holders of Class T, Class S, Class D and Class I shares (other than investors in certain states or who are clients of a participating broker-dealer that does not permit automatic enrollment in the distribution reinvestment plan) have their cash distributions automatically reinvested in additional shares of common stock unless they elect to receive their distributions in cash. Holders of Class N shares are not eligible to participate in the distribution reinvestment plan and receive their distributions in cash. Investors who are clients of a participating broker-dealer that does not permit automatic enrollment in the distribution reinvestment plan or are residents of those states that do not allow automatic enrollment receive their distributions in cash unless they elect to have their cash distributions reinvested in additional shares of the Company’s common stock. The per share purchase price for shares purchased pursuant to the distribution reinvestment plan will be equal to the transaction price at the time the distribution is payable, which will generally be equal to the Company’s prior month’s NAV per share for that share class. Stockholders do not pay upfront selling commissions or dealer manager fees when purchasing shares pursuant to the distribution reinvestment plan. The stockholder servicing fees with respect to shares of the Company’s Class T shares, Class S shares and Class D shares are calculated based
on the NAV for those shares and may reduce the NAV or, alternatively, the distributions payable with respect to shares of each such class, including shares issued in respect of distributions on such shares under the distribution reinvestment plan.
Distributions
The Company generally intends to distribute substantially all of its taxable income, which does not necessarily equal net income as calculated in accordance with GAAP, to its stockholders each year to comply with the REIT provisions of the Code. Beginning September 30, 2018, the Company established a monthly record date for a quarterly distribution to stockholders on record as of the last day of each applicable month typically payable within 30 days following quarter end. On January 17, 2020, the Company’s board of directors amended theThe Company’s distribution policy to reflect that the Company intendsreflects its intention to pay distributions monthly, rather than quarterly going forward, subject to the discretion of the board of directors.
Based on the monthly record dates established by the board of directors, the Company accrues for distributions on a monthly basis. As of March 31, 2023 and December 31, 2022, the Company had accrued $6.8$10.1 million in Distributions Payable on the Consolidated Balance Sheets for the March distribution.at each period end. For the three months ended March 31, 2023 and 2022 and 2021,, the Company declared and paid distributions in the amount of $17.5$30.4 million and $6.3$17.5 million, respectively.
Each class of common stock receives the same gross distribution per share, which was $0.2077,$0.2128 per share for the three months ended March 31, 2022.2023. The net distribution varies for each class based on the applicable advisory fee and stockholder servicing fee, which is deducted from the monthly distribution per share.
The following tables detailtable details the aggregatenet distribution declared for each of the Company's share classes for the three months ended March 31, 2022:2023: | | | Three Months Ended March 31, 2022 | | Three Months Ended March 31, 2023 |
| | Class T Common Stock | | Class S Common Stock | | Class D Common Stock | | Class I Common Stock | | Class N Common Stock | | Class T Common Stock | | Class S Common Stock | | Class D Common Stock | | Class I Common Stock | | Class N Common Stock |
| Gross distribution per share of common stock | Gross distribution per share of common stock | | $ | 0.2077 | | | $ | 0.2077 | | | $ | 0.2077 | | | $ | 0.2077 | | | $ | 0.2077 | | Gross distribution per share of common stock | | $ | 0.2128 | | | $ | 0.2128 | | | $ | 0.2128 | | | $ | 0.2128 | | | $ | 0.2128 | |
| Advisory fee per share of common stock | Advisory fee per share of common stock | | (0.0127) | | | (0.0125) | | | (0.0127) | | | 0.0127 | | | (0.0068) | | Advisory fee per share of common stock | | (0.0376) | | | (0.0371) | | | (0.0376) | | | (0.0376) | | | (0.0209) | |
| Stockholder servicing fee per share of common stock | Stockholder servicing fee per share of common stock | | (0.0094) | | | (0.0093) | | | (0.0028) | | | — | | | — | | Stockholder servicing fee per share of common stock | | (0.0268) | | | (0.0267) | | | (0.0077) | | | — | | | — | |
| Net distribution per share of common stock | Net distribution per share of common stock | | $ | 0.1856 | | | $ | 0.1859 | | | $ | 0.1922 | | | $ | 0.2204 | | | $ | 0.2009 | | Net distribution per share of common stock | | $ | 0.1484 | | | $ | 0.1490 | | | $ | 0.1675 | | | $ | 0.1752 | | | $ | 0.1919 | |
Share Repurchases
The Company has adopted a share repurchase plan, whereby on a monthly basis, stockholders may request that the Company repurchase all or any portion of their shares. The Company may choose to repurchase all, some or none of the shares that have been requested to be repurchased at the end of any particular month, in its discretion, subject to any limitations in the share repurchase plan. The total amount of aggregate repurchases of Class T, Class S, Class D and Class I shares will be limited to 2% of the aggregate NAV per month and 5% of the aggregate NAV per calendar quarter. In addition, if during any consecutive 24-month period, the Company does not have at least one month in which the Company fully satisfies 100% of properly submitted repurchase requests or accepts all properly submitted tenders in a self-tender offer for the Company’s shares, the Company will not make any new investments (excluding short-term cash management investments under 30 days in duration) and will use all available investable assets to satisfy repurchase requests (subject to the limitations under this program) until all outstanding repurchase requests have been satisfied. Shares would be repurchased at a price equal to the transaction price on the applicable repurchase date, subject to any early repurchase deduction. Shares that have not been outstanding for at least one year would be repurchased at 95% of the transaction price. Due to the illiquid nature of investments in real estate, the Company may not have sufficient liquid resources to fund repurchase requests and has established limitations on the amount of funds the Company may use for repurchases during any calendar month and quarter. Further, the Company’s board of directors may modify, suspend or terminate the share repurchase plan.
For the three months ended March 31, 2022,2023, the Company repurchased shares of its common stock for $2.1$65.3 million. The Company had no unfulfilled repurchase requests during the three months ended March 31, 2022.2023.
Redeemable Non-Controlling Interest
The Company's affiliated partner has apartners have redeemable non-controlling interestinterests in the joint ventureventures due to crystallization rights, which allowsallow the partnerpartners to trigger the payment on the promote. The Redeemable Non-Controlling Interests are recorded at the greater of (i) their carrying amount, adjusted for their share of the allocation of GAAP net income or loss and distributions, or (ii) their redemption value, which is equivalent to the fair value of such interests at the end of each measurement period. As the redemption value was greater than the adjusted carrying value as of March 31, 20222023 and December 31, 2021,2022, the Company recorded an allocation adjustment between Additional Paid-In-Capital and Redeemable Non-Controlling Interest. The balance was $0.3$0.4 million and $0.6 million as of March 31, 20222023 and December 31, 2021.2022.
Note 16.19. Segment Reporting
The Company operates in 10eleven reportable segments: healthcare properties, industrial properties, multifamily properties, office properties, retailhealthcare properties, commercial mortgage loans, multifamily properties, retail properties, single-family housing, International Affiliated Funds, office properties, real estate-related securities, International Affiliated Funds,self-storage properties and other (corporate). These are operating segments that are defined as components of an enterprise about which separate financial information is available that is evaluated regularly by the chief operating decision-makers in deciding how to allocate resources and in assessing performance. The Company’s chief executive officer, chief financial officer and head of portfolio management have been identified as the chief operating decision-makers. The Company’s chief operating decision-makers direct the allocation of resources to operating segments based on the profitability and cash flows of each respective segment. The Company believes that segment net operating income is the performance metric that captures the unique operating characteristics of each segment.
The following table sets forth the total assetsfinancial results by segment as of March 31, 20222023 and December 31, 20212022 ($ in thousands): | | | March 31,
2022 | | December 31,
2021 | | March 31,
2023 | | December 31,
2022 |
| Industrial | | Industrial | $ | 565,945 | | | $ | 569,607 | |
| Healthcare | Healthcare | $ | 185,367 | | | $ | 185,953 | | Healthcare | 468,502 | | | 476,894 | |
| Industrial | 316,494 | | | 186,502 | | |
| Commercial Mortgage Loans | | Commercial Mortgage Loans | 349,541 | | | 343,970 | |
| Multifamily | Multifamily | 298,945 | | | 303,852 | | Multifamily | 330,116 | | | 292,081 | |
| Retail | | Retail | 221,168 | | | 223,248 | |
| Single-Family Housing | | Single-Family Housing | 147,595 | | | 148,796 | |
| International Affiliated Funds | | International Affiliated Funds | 126,205 | | | 127,224 | |
| Office | Office | 124,421 | | | 125,563 | | Office | 119,483 | | | 120,322 | |
| Retail | 81,905 | | | 82,791 | | |
| Commercial Mortgage Loans | 233,637 | | | 140,512 | | |
| Single-Family Housing | 99,930 | | | 100,039 | | |
| Real Estate-Related Securities | 162,091 | | | 108,153 | | |
| International Affiliated Funds | 129,356 | | | 131,046 | | |
Real Estate-Related Securities(1) | | Real Estate-Related Securities(1) | 238,254 | | | 214,416 | |
| Self-Storage | | Self-Storage | 62,347 | | | 48,951 | |
| Other (Corporate) | Other (Corporate) | 275,789 | | | 133,726 | | Other (Corporate) | 64,150 | | | 105,352 | |
| Total assets | Total assets | $ | 1,907,935 | | | $ | 1,498,137 | | Total assets | $ | 2,693,306 | | | $ | 2,670,861 | |
(1) Includes real estate-related securities and real estate debt as shown on the Company's Consolidated Balance Sheets.
The following table sets forth the financial results by segment for the three months ended March 31, 2023 ($ in thousands):
| | | | | | | | | | | | | | | | | | | | | | | | | | | | | | | | | | | | | | | | | | | | | | | | | | | | | | | | | | | | | | | | | | | | |
| | Industrial | | Healthcare | | Multifamily | | Retail | | Single-Family Housing | | Office | | Self-Storage | | Commercial Mortgage Loans | | International Affiliated Funds | | Real Estate-Related Securities | | Total |
| Revenues: | | | | | | | | | | | | | | | | | | | | | | |
| Rental revenue | | $ | 12,612 | | | $ | 10,875 | | | $ | 7,620 | | | $ | 4,593 | | | $ | 2,535 | | | $ | 3,339 | | | $ | 760 | | | $ | — | | | $ | — | | | $ | — | | | $ | 42,334 | |
| Other revenue | | — | | | — | | | — | | | — | | | — | | | — | | | — | | | 6,485 | | | — | | | — | | | 6,485 | |
| Total revenues | | 12,612 | | | 10,875 | | | 7,620 | | | 4,593 | | | 2,535 | | | 3,339 | | | 760 | | | 6,485 | | | — | | | — | | | 48,819 | |
| Expenses: | | | | | | | | | | | | | | | | | | | | | | |
| Property operating | | 3,996 | | | 3,735 | | | 3,087 | | | 1,259 | | | 1,478 | | | 953 | | | 431 | | | — | | | — | | | — | | | 14,939 | |
| Total segment expenses | | 3,996 | | | 3,735 | | | 3,087 | | | 1,259 | | | 1,478 | | | 953 | | | 431 | | | — | | | — | | | — | | | 14,939 | |
| Loss from unconsolidated international affiliated funds | | | | | | | | | | | | | | | | | | (355) | | | | | (355) | |
| Unrealized loss on note payable | | | | | | | | | | | | | | | | (30) | | | | | | | (30) | |
| Realized and unrealized gains from real estate-related securities | | | | | | | | | | | | | | | | | | | | 2,996 | | | 2,996 | |
| Realized and unrealized loss from real estate debt | | | | | | | | | | | | | | | | | | | | (403) | | | (403) | |
| Unrealized loss from commercial mortgage loans | | | | | | | | | | | | | | | | (949) | | | | | | | (949) | |
| Segment net operating income | | $ | 8,616 | | | $ | 7,140 | | | $ | 4,533 | | | $ | 3,334 | | | $ | 1,057 | | | $ | 2,386 | | | $ | 329 | | | $ | 5,506 | | | $ | (355) | | | $ | 2,593 | | | $ | 35,139 | |
| Depreciation and amortization | | (6,463) | | | (6,378) | | | (2,662) | | | (2,274) | | | (852) | | | (1,821) | | | (810) | | | — | | | — | | | — | | | (21,260) | |
| General and administrative expenses | | | | | | | | | | | | | | | | | | | | | | (2,437) | |
| Advisory fee due to affiliate | | | | | | | | | | | | | | | | | | | | | | (8,042) | |
| Interest income | | | | | | | | | | | | | | | | | | | | | | 1,884 | |
| Interest expense | | | | | | | | | | | | | | | | | | | | | | (8,629) | |
| Net loss | | | | | | | | | | | | | | | | | | | | | | $ | (3,345) | |
| Net loss attributable to non-controlling interests in third party joint ventures | | | | | | | | | | | | | | | | | | | | | | (36) | |
| Net income attributable to preferred stock | | | | | | | | | | | | | | | | | | | | | | 4 | |
| Net loss attributable to common stockholders | | | | | | | | | | | | | | | | | | | | | | $ | (3,313) | |
| | | | | | | | | | | | | | | | | | | | | | |
The following table sets forth the financial results by segment for the three months ended March 31, 2022 and 2021 ($ in thousands):
| | | | | | | | | | | | | | | | | | | | | | | | | | | | | | | | | | | | | | | | | | | | | | | | | | | | | | | | | | | | | | | | | | | | |
| | Industrial | | Healthcare | | Multifamily | | Retail | | Single-Family Housing | | Office | | Self-Storage | | Commercial Mortgage Loans | | International Affiliated Funds | | Real Estate-Related Securities | | Total |
| Revenues: | | | | | | | | | | | | | | | | | | | | | | |
| Rental revenue | | $ | 5,364 | | | $ | 4,437 | | | $ | 6,448 | | | $ | 1,699 | | | $ | 731 | | | $ | 2,989 | | | $ | — | | | $ | — | | | $ | — | | | $ | — | | | $ | 21,668 | |
| Other revenue | | — | | | — | | | — | | | — | | | — | | | — | | | — | | | 1,995 | | | — | | | — | | | 1,995 | |
| Total revenues | | 5,364 | | | 4,437 | | | 6,448 | | | 1,699 | | | 731 | | | 2,989 | | | — | | | 1,995 | | | — | | | — | | | 23,663 | |
| Expenses: | | | | | | | | | | | | | | | | | | | | | | |
| Property operating | | 1,394 | | | 1,302 | | | 2,685 | | | 410 | | | 773 | | | 997 | | | — | | | — | | | — | | | — | | | 7,561 | |
| Total segment expenses | | 1,394 | | | 1,302 | | | 2,685 | | | 410 | | | 773 | | | 997 | | | — | | | — | | | — | | | — | | | 7,561 | |
| Loss from unconsolidated international affiliated funds | | | | | | | | | | | | | | | | | | 859 | | | | | 859 | |
| Realized and unrealized gains from real estate-related securities | | | | | | | | | | | | | | | | | | | | (3,404) | | | (3,404) | |
| Realized and unrealized loss from real estate debt | | | | | | | | | | | | | | | | | | | | (706) | | | (706) | |
| Segment net operating income | | $ | 3,970 | | | $ | 3,135 | | | $ | 3,763 | | | $ | 1,289 | | | $ | (42) | | | $ | 1,992 | | | $ | — | | | $ | 1,995 | | | $ | 859 | | | $ | (4,110) | | | $ | 12,851 | |
| Depreciation and amortization | | (2,797) | | | (2,387) | | | (3,205) | | | (794) | | | (832) | | | (2,352) | | | — | | | — | | | — | | | — | | | (12,367) | |
| General and administrative expenses | | | | | | | | | | | | | | | | | | | | | | (2,096) | |
| Advisory fee due to affiliate | | | | | | | | | | | | | | | | | | | | | | (4,706) | |
| Interest income | | | | | | | | | | | | | | | | | | | | | | 330 | |
| Interest expense | | | | | | | | | | | | | | | | | | | | | | (1,796) | |
| Net loss | | | | | | | | | | | | | | | | | | | | | | $ | (7,784) | |
| Net income attributable to non-controlling interests in third party joint ventures | | | | | | | | | | | | | | | | | | | | | | 19 | |
| Net income attributable to preferred stock | | | | | | | | | | | | | | | | | | | | | | 4 | |
| Net loss attributable to common stockholders | | | | | | | | | | | | | | | | | | | | | | $ | (7,807) | |
| | | | | | | | | | | | | | | | | | | | | | |
| | | | | | | | | | | | | | | | | | | | | | | |
| | | | | Three Months Ended
March 31, | | |
| | | | | | | | | 2022 | | 2021 | | | | |
| Rental revenues | | | | | | | | | | | | | | | |
| Healthcare | | | | | | | | | $ | 4,437 | | | $ | 1,765 | | | | | |
| Industrial | | | | | | | | | 5,364 | | | 3,560 | | | | | |
| Multifamily | | | | | | | | | 6,448 | | | 2,380 | | | | | |
| Office | | | | | | | | | 2,989 | | | 1,874 | | | | | |
| Retail | | | | | | | | | 1,699 | | | 1,683 | | | | | |
| Single-family housing | | | | | | | | | 731 | | | — | | | | | |
| Total rental revenues | | | | | | | | | 21,668 | | | 11,262 | | | | | |
| Rental property operating expenses | | | | | | | | | | | | | | | |
| Healthcare | | | | | | | | | 1,302 | | | 321 | | | | | |
| Industrial | | | | | | | | | 1,394 | | | 1,109 | | | | | |
| Multifamily | | | | | | | | | 2,685 | | | 1,181 | | | | | |
| Office | | | | | | | | | 997 | | | 555 | | | | | |
| Retail | | | | | | | | | 410 | | | 348 | | | | | |
| Single-family housing | | | | | | | | | 773 | | | — | | | | | |
| Total rental property operating expenses | | | | | | | | | 7,561 | | | 3,514 | | | | | |
| | | | | | | | | | | | | | | |
| | | | | | | | | | | | | | | |
| | | | | | | | | | | | | | | |
| | | | | | | | | | | | | | | |
| | | | | | | | | | | | | | | |
| | | | | | | | | | | | | | | |
| Depreciation and amortization | | | | | | | | | (12,367) | | | (5,484) | | | | | |
| Income from commercial mortgage loans | | | | | | | | | 1,995 | | | — | | | | | |
| | | | | | | | | | | | | | | |
| Realized and unrealized (loss) income from real estate-related securities | | | | | | | | | (3,404) | | | 2,881 | | | | | |
| Realized and unrealized (loss) from real estate debt | | | | | | | | | (706) | | | — | | | | | |
| Income from equity investment in unconsolidated international affiliated funds | | | | | | | | | 859 | | | 689 | | | | | |
| General and administrative expenses | | | | | | | | | (2,096) | | | (1,057) | | | | | |
| Advisory fee due to affiliate | | | | | | | | | (4,706) | | | (1,064) | | | | | |
| Interest income | | | | | | | | | 330 | | | 60 | | | | | |
| Interest expense | | | | | | | | | (1,796) | | | (943) | | | | | |
| Net (loss) income | | | | | | | | | (7,784) | | | 2,830 | | | | | |
| Net income attributable to non-controlling interest in third party joint venture | | | | | | | | | 19 | | | — | | | | | |
| Net income attributable to preferred stock | | | | | | | | | 4 | | | 8 | | | | | |
| Net (loss) income attributable to common stockholders | | | | | | | | | $ | (7,807) | | | $ | 2,822 | | | | | |
Note 17.20. Subsequent Events
Distributions
Status of the Offering
On April 1, 2022,May 8, 2023, the Company sold approximately 12,086,101amended and restated its distribution reinvestment plan to allow for stockholders purchasing shares of its common stock (929,018 Class T shares, 2,619,257 Class S shares, 586,296 Class D shares and 7,951,531 Class I shares) at a purchase price of $12.74 for Class T, $12.61 for Class S, $12.77 for Class D, and $12.74 for Class I.in unregistered private offerings to participate in the distribution reinvestment plan.
On May 1, 2022,8, 2023, the Company sold approximately 10,167,070 of common stock (820,160 Class T shares, 2,568,872 Class S shares, 507,638 Class D sharesamended and 6,270,400 Class I shares) at a purchase price of $12.93 for Class T, $12.80 for Class S, $12.97 for Class D,restated its bylaws to reflect, among other things, certain modernizing language and $12.93 for Class I.
Proceeds from the Issuance of Common Stock
Subsequent to March 31, 2022,amended universal proxy rules promulgated by the Company received net proceeds of $284.8 million from the issuance of its common stock.Securities and Exchange Commission.
Independent Director Compensation Plan
On May 11, 2022, the Company's board of directors approved changes in its independent director compensation plan, effective July 1, 2022. As revised, each independent director will receive a $100,000 annual retainer, the chairperson of the audit committee will receive an additional $20,000 annual retainer and the lead independent director will receive an additional $5,000 annual retainer. Effective July 1, 2022, the Company will pay 50% of this compensation in cash in quarterly installments and the remaining 50% in the form of an annual grant of restricted stock based on the most recent transaction price. The restricted stock generally vests one year from the date of grant. Each independent director may elect to receive all or a portion of his or her cash compensation in the form of unrestricted stock. In addition, the revised independent director compensation plan requires each independent director to own shares of the Company's common stock in an amount not less than three times the amount of the annual cash retainer (prior to any election to receive the cash portion in unrestricted stock) commencing with later of the fifth anniversary of his or her initial appointment to the Board or May 11, 2027.
Item 2. Management’s Discussion and Analysis of Financial Condition and Results of Operations.
References herein to “Company,” “we,” “us,” or “our” refer to Nuveen Global Cities REIT, Inc. and its subsidiaries unless
the context specifically requires otherwise.
The following discussion should be read in conjunction with our unaudited consolidated financial statements and notes thereto appearing elsewhere in this Quarterly Report on Form 10-Q. In addition to historical data, this discussion contains forward-looking statements about our business, operations and financial performance based on current expectations that involve risks, uncertainties and assumptions. Our actual results may differ materially from those in this discussion as a result of various factors, including but not limited to those discussed under “Item 1A. Risk Factors” in our Annual Report on Form 10-K for the year ended December 31, 20212022 and elsewhere in this Quarterly Report on Form 10-Q.
Forward-Looking Statements
This Quarterly Report on Form 10-Q contains forward-looking statements about our business, operations and financial performance, including, in particular, statements about our plans, strategies and objectives. You can generally identify forward-looking statements by our use of forward-looking terminology such as “may,” “will,” “expect,” “intend,” “anticipate,” “estimate,” “believe,” “continue” or other similar words. These statements include our plans and objectives for future operations, including plans and objectives relating to future growth and availability of funds, and are based on current expectations that involve numerous risks, uncertainties and assumptions. Assumptions relating to these statements involve judgments with respect to, among other things, future economic, competitive and market conditions and future business decisions, all of which are difficult or impossible to accurately predict and many of which are beyond our control. Although we believe the assumptions underlying the forward-looking statements, and the forward-looking statements themselves, are reasonable, any of the assumptions could be inaccurate and, therefore, there can be no assurance that these forward-looking statements will prove to be accurate and our actual results, performance and achievements may be materially different from that expressed or implied by these forward-looking statements as a result of various factors, including but not limited to those discussed under Item 1A. “Risk Factors” in our Annual Report on Form 10-K for the year ended December 31, 2021,2022, and elsewhere in this Quarterly Report on Form 10-Q. In light of the significant uncertainties inherent in these forward-looking statements, the inclusion of this information should not be regarded as a representation by us or any other person that our objectives and plans, which we consider to be reasonable, will be achieved. Readers are cautioned not to place undue reliance on these forward-looking statements, which speak only as of the date this Quarterly Report on Form 10-Q is filed with the Securities and Exchange Commission (the “SEC”). Except as required by law, we do not undertake to update or revise any forward-looking statements contained in this Quarterly Report on Form 10-Q.
Overview
Nuveen Global Cities REIT, Inc. is a Maryland corporation formed on May 1, 2017 and qualifies as a real estate investment trust (“REIT”) for U.S. federal income tax purposes commencing with the taxable year ended December 31, 2018. We were formed to invest in properties in or around certain global cities selected for their resilience, long-term structural performance and ability to deliver an attractive and stable distribution yield. We expect that over time a majority of our real estate investments will be located in the United States and that a substantial but lesser portion of our portfolio will include real properties located in Canada, Europe and the Asia-Pacific region. We seek to complement our real property investments by investing a smaller portion of our portfolio in real estate-related assets. We are externally managed by our advisor, Nuveen Real Estate Global Cities Advisors, LLC (the "Advisor"), an investment advisory affiliate of Nuveen Real Estate. Nuveen Real Estate is the real estate investment management division of our sponsor, Nuveen, LLC ("Nuveen"). Nuveen is the asset management arm and wholly owned subsidiary of TIAA.
Public Offerings
On January 31, 2018, our Registration Statement on Form S-11 (File No. 333-252077) relating tofor our initial public offering (the “Initial Public Offering”) was first declared effective by the SEC. Pursuant thereto, we registered with the SEC an offering of up to $5.0 billion in shares of common stock (the “Initial Public Offering”), consisting of up to $4.0 billion in shares in our primary offering and up to $1.0 billion in shares pursuant to our distribution reinvestment plan.stock. The Initial Public Offering terminated on July 2, 2021.
On January 13, 2021, we filed a Registration Statement on Form S-11 (File No. 333-252077), the ("Follow-on(the "Follow-on Registration Statement") to register up to $5.0 billion of shares of common stock, consisting of up to $4.0 billion in shares in our primary offering and up to $1.0 billion in shares pursuant to our distribution reinvestment plan (the "Follow-on Public Offering"). The Follow-on Registration Statement was declared effective by the SEC on July 2, 2021. The Company isWe are offering to the public any combination of four classes of shares of our common stock, Class T shares, Class S shares, Class D shares and Class I shares, with a dollar value up to the maximum offering amount. The publicly offered share classes have different upfront selling commissions and ongoing stockholder servicing fees. The purchase price per share for each class of common stock varies and
generally equals our prior month’s net asset value (“NAV”) per share, as calculated monthly, plus applicable upfront selling commissions and dealer manager fees.
TIAA Investment
TIAA invested $200,000 through the purchase of 20,000 shares of common stock at $10.00 per share as our initial capitalization. Subsequent to our initial capitalization, TIAA purchased $300.0 million in shares (less the $200,000 initial capitalization amount).
Q1 20222023 Highlights
Operating results:
•Raised $290.9Declared monthly net distributions totaling $30.4 million of net proceeds during the three months ended March 31, 2022.2023. The details of the average annualized distributions rates and total returns are shown in the following table:
| | | Class I | | Class D | | Class T | | Class S | | Class I | | Class D | | Class T | | Class S |
| Average Annualized Distribution Rate | Average Annualized Distribution Rate | 5.43% | | 5.16% | | 4.58% | | 4.65% | Average Annualized Distribution Rate | 5.41% | | 5.14% | | 4.57% | | 4.64% |
| Year-to-Date Total Return, without upfront selling commissions | Year-to-Date Total Return, without upfront selling commissions | 4.61% | | 4.53% | | 4.39% | | 4.44% | Year-to-Date Total Return, without upfront selling commissions | (1.50)% | | (1.59)% | | (1.72)% | | (1.72)% |
| Year-to-Date Total Return, assuming maximum upfront selling commissions | Year-to-Date Total Return, assuming maximum upfront selling commissions | N/A | | N/A | | 0.78% | | 0.83% | Year-to-Date Total Return, assuming maximum upfront selling commissions | N/A | | (3.06)% | | (5.15)% | | (5.15)% |
| Inception-to-Date Total Return, without upfront selling commissions | Inception-to-Date Total Return, without upfront selling commissions | 12.39% | | 12.29% | | 13.10% | | 14.65% | Inception-to-Date Total Return, without upfront selling commissions | 10.11% | | 9.92% | | 10.05% | | 10.30% |
| Inception-to-Date Total Return, assuming maximum upfront selling commissions | Inception-to-Date Total Return, assuming maximum upfront selling commissions | N/A | | N/A | | 11.88% | | 12.93% | Inception-to-Date Total Return, assuming maximum upfront selling commissions | N/A | | 9.58% | | 9.14% | | 9.13% |
Investments:
•Acquired one self-storage property for a 100% interest in the Lakeland Industrial portfolio, a portfoliototal purchase price of five Class A and B infill industrial assets, well located$13.8 million, inclusive of closing costs, in the high-growth Sun Belt marketsmarket of Tampa and Lakeland, Florida. The purchase price was $54.9 million and at acquisition, the portfolio was 100% leased to ten tenants with a weighted average lease term of five years.Brighton, Colorado.
•AcquiredAllocated and invested $10.0 million in real-estate related securities with 66 holdings and a 100% interest in 610 Loop, a five property in-fill industrial portfolio in Houston, Texas for a purchase pricetotal fair market value of $76.1 million.$128.1 million as of March 31, 2023.
•Originated a floating-rate senior mortgageAllocated and mezzanine loan to finance the acquisition and reposition of five multi-family properties located in Tucson, Arizona, amounting to $92.4invested $10.0 million and have committed to fund an additional $9.2$12.3 million, for future renovations.respectively, in commercial mortgage-backed securities with a total fair market value of $110.1 million as of March 31, 2023.
Capital Activity and Financings:
•Raised $82.7 million of gross proceeds during the three months ended March 31, 2023.
•SoldAmended our Credit Agreement to increase the senior portion of a commercial loanCredit Facility to $455.0 million in aggregate commitments, with an unaffiliated party and retained the subordinated mortgage, receiving proceeds of $47.4 million.accordion feature that may increase aggregate commitments up to $800.0 million
•
Acquired $2.7 million of single-family homes in conjunction with our relationship with Sparrow, located in various target markets throughout the United States, including Florida, Georgia, North Carolina and Tennessee.
Portfolio
The following chart outlines the allocation of our investments based on fair value as of March 31, 2022:2023(1):
(1) Allocation by region/asset type includes property investments owned directly by us (80%) and investments in the International Affiliated Funds (5%).
The following charts further describe the diversification of our direct investments in real properties based on fair value as of March 31, 2022:2023(2):
(2) Allocation by region and by sector includes only property investments owned directly by the REIT.
The following map shows the location of our directly-held real estate investments as of March 31, 2022:

Direct property investment
The following map shows the location and property type of directly held real estate investments owned by ECF, in which we made an investment,are currently invested, as of MarchDecember 31, 2022:
Office 
Retail 
Logistics 
Alternatives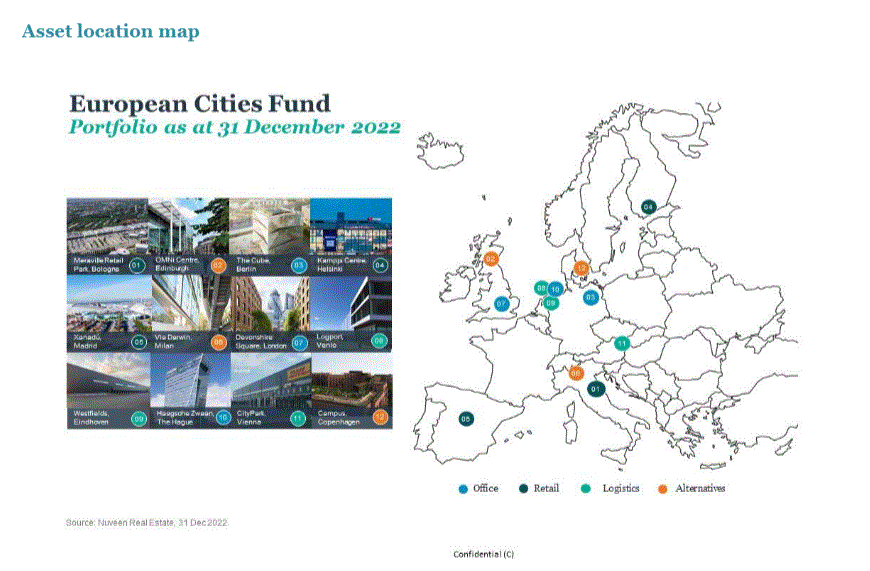
The following map shows the location and property type of directly held real estate investments owned by APCF, in which we made an investment,are currently invested, as of MarchDecember 31, 2022:
Office Logistics Multifamily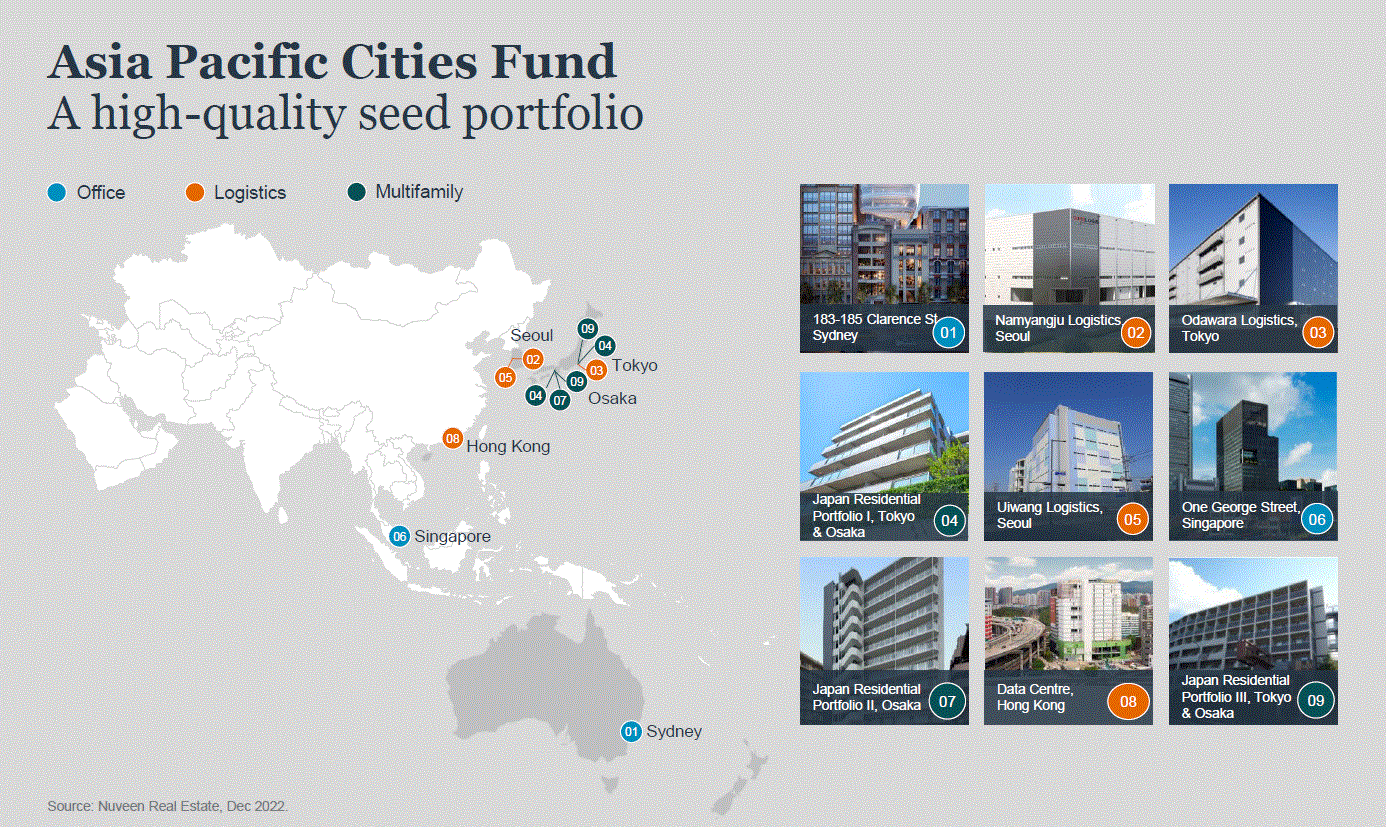
Investments in Real Estate
The following charts provide information on the nature and geographical locations of our direct investments in real properties as of March 31, 2022:2023: | | Sector and Property/Portfolio Name | Sector and Property/Portfolio Name | | Number of
Properties | | Location | | Acquisition Date | | Ownership
Interest | | | Sq Feet (in
thousands)
/ # of units | | Occupancy | Sector and Property/Portfolio Name | | Number of
Properties | | Location | | Acquisition Date | | Ownership
Interest | | Sq. Ft. (in
thousands)
/ # of units | | Occupancy |
| Multifamily: | Multifamily: | | | | | | | | | | | | | | Multifamily: | | | | | | | | | | | | |
| Kirkland Crossing | Kirkland Crossing | | 1 | | Aurora, IL | | Dec, 2017 | | 100 | % | | | 266 | | units | | 95 | % | Kirkland Crossing | | 1 | | Aurora, IL | | Dec, 2017 | | 100% | | 266 | units | | 94% |
| Tacara Steiner Ranch | Tacara Steiner Ranch | | 1 | | Austin, TX | | June, 2018 | | 100 | % | | | 246 | | units | | 94 | % | Tacara Steiner Ranch | | 1 | | Austin, TX | | June, 2018 | | 100% | | 246 | units | | 92% |
| Brookson Flats | Brookson Flats | | 1 | | Huntersville, NC | | June, 2021 | | 100 | % | | | 296 | | units | | 94 | % | Brookson Flats | | 1 | | Huntersville, NC | | June, 2021 | | 100% | | 296 | units | | 93% |
| Signature at Hartwell | Signature at Hartwell | | 1 | | Seneca, SC | | Nov, 2021 | | 96.5 | % | | | 185 | | units | | 100 | % | Signature at Hartwell | | 1 | | Seneca, SC | | Nov, 2021 | | 96.5% | | 185 | units | | 99% |
| The Reserve at Stonebridge Ranch | The Reserve at Stonebridge Ranch | | 1 | | McKinney, TX | | Dec, 2021 | | 100 | % | | | 301 | | units | | 92 | % | The Reserve at Stonebridge Ranch | | 1 | | McKinney, TX | | Dec, 2021 | | 100% | | 301 | units | | 94% |
| CASA Nord Portfolio | | CASA Nord Portfolio | | 4 | | Copenhagen, DK | | Dec, 2022 | | 100% | | 84 | units | | 100% |
| Total Multifamily | Total Multifamily | | 5 | | | | 1,294 | | units | | 95 | % | Total Multifamily | | 9 | | 1,378 | units | | 95% |
| Industrial: | Industrial: | | | | Industrial: | |
| West Phoenix Industrial | West Phoenix Industrial | | 1 | | Phoenix, AZ | | Dec, 2017 | | 100 | % | | | 265 | | sq ft. | | 100 | % | West Phoenix Industrial | | 1 | | Phoenix, AZ | | Dec, 2017 | | 100% | | 265 | | Sq. Ft | | 100% |
| Denver Industrial | Denver Industrial | | 3 | | Golden & Denver, CO | | Dec, 2017 | | 100 | % | | | 486 | | sq ft. | | 93 | % | Denver Industrial | | 3 | | Golden & Denver, CO | | Dec, 2017 | | 100% | | 486 | | Sq. Ft | | 100% |
| Henderson Interchange | Henderson Interchange | | 1 | | Henderson, NV | | Dec, 2018 | | 100 | % | | | 197 | | sq ft. | | 100 | % | Henderson Interchange | | 1 | | Henderson, NV | | Dec, 2018 | | 100% | | 197 | | Sq. Ft | | 100% |
| Globe Street Industrial | Globe Street Industrial | | 1 | | Moreno Valley, CA | | Oct, 2019 | | 100 | % | | | 252 | | sq ft. | | 100 | % | Globe Street Industrial | | 1 | | Moreno Valley, CA | | Oct, 2019 | | 100% | | 252 | | Sq. Ft | | 100% |
| 1 National Street | 1 National Street | | 1 | | Boston, MA | | Nov, 2020 | | 100 | % | | | 300 | | sq ft. | | 100 | % | 1 National Street | | 1 | | Boston, MA | | Nov, 2020 | | 100% | | 300 | | Sq. Ft | | 100% |
| Rittiman West 6 & 7 | Rittiman West 6 & 7 | | 2 | | San Antonio, TX | | Dec, 2020 | | 100 | % | | | 147 | | sq ft. | | 100 | % | Rittiman West 6 & 7 | | 2 | | San Antonio, TX | | Dec, 2020 | | 100% | | 147 | | Sq. Ft | | 96% |
| 10850 Train Ct. | 10850 Train Ct. | | 1 | | Houston, TX | | Dec, 2021 | | 100 | % | | | 113 | | sq ft. | | 100 | % | 10850 Train Ct. | | 1 | | Houston, TX | | Dec, 2021 | | 100% | | 113 | | Sq. Ft | | 100% |
| 5501 Mid Cities Pkwy | 5501 Mid Cities Pkwy | | 1 | | San Antonio, TX | | Dec, 2021 | | 100 | % | | | 88 | | sq ft. | | 100 | % | 5501 Mid Cities Pkwy | | 1 | | San Antonio, TX | | Dec, 2021 | | 100% | | 88 | | Sq. Ft | | 100% |
| Tampa Lakeland Industrial | Tampa Lakeland Industrial | | 3 | | Tampa, FL | | Jan, 2022 | | 100 | % | | | 366 | | sq ft. | | 100 | % | Tampa Lakeland Industrial | | 3 | | Tampa, FL | | Jan, 2022 | | 100% | | 366 | | Sq. Ft | | 100% |
| 610 Loop - Houston Industrial | | 5 | | Houston, TX | | Mar, 2022 | | 100 | % | | | 709 | | sq ft. | | 100 | % | |
| 610 Loop | | 610 Loop | | 5 | | Houston, TX | | Mar, 2022 | | 100% | | 709 | | Sq. Ft | | 99% |
| UP Minneapolis | | UP Minneapolis | | 3 | | Minneapolis, MN | | June, 2022 | | 100% | | 406 | | Sq. Ft | | 77% |
| Wilsonville Logistics Center | | Wilsonville Logistics Center | | 1 | | Wilsonville, OR | | July, 2022 | | 100% | | 508 | | Sq. Ft | | 100% |
| Alliance Logistics | | Alliance Logistics | | 7 | | Various | | Oct, 2022 | | 100% | | 1,236 | Sq. Ft | | 100% |
| Total Industrial | Total Industrial | | 19 | | | | 2,923 | | sq ft. | | 99 | % | Total Industrial | | 30 | | 5,073 | | Sq. Ft | | 98% |
| Retail: | Retail: | | | | Retail: | |
| Main Street at Kingwood | Main Street at Kingwood | | 1 | | Houston, TX | | Oct, 2018 | | 100 | % | | | 199 | | sq ft. | | 100 | % | Main Street at Kingwood | | 1 | | Houston, TX | | Oct, 2018 | | 100% | | 199 | | Sq. Ft | | 98% |
| GFI Grocery Anchored Portfolio | | GFI Grocery Anchored Portfolio | | 5 | | Various | | Sep, 2022 | | 95% | | 496 | | Sq. Ft | | 99% |
| Total Retail | Total Retail | | 1 | | | | 199 | | sq ft. | | 100 | % | Total Retail | | 6 | | 695 | | Sq. Ft | | 99% |
| Office: | Office: | | | | Office: | |
| Defoor Hills | Defoor Hills | | 1 | | Atlanta, GA | | June, 2018 | | 100 | % | | | 91 | | sq ft. | | 100 | % | Defoor Hills | | 1 | | Atlanta, GA | | June, 2018 | | 100% | | 91 | | Sq. Ft | | 100% |
| East Sego Lily | East Sego Lily | | 1 | | Salt Lake City, UT | | May, 2019 | | 100 | % | | | 149 | | sq ft. | | 99 | % | East Sego Lily | | 1 | | Salt Lake City, UT | | May, 2019 | | 100% | | 148 | | Sq. Ft | | 100% |
| Perimeter's Edge | Perimeter's Edge | | 1 | | Raleigh, NC | | Sept, 2021 | | 100 | % | | | 85 | | sq ft. | | 97 | % | Perimeter's Edge | | 1 | | Raleigh, NC | | Sept, 2021 | | 100% | | 85 | | Sq. Ft | | 97% |
| Total Office | Total Office | | 3 | | | | 325 | | sq ft. | | 99 | % | Total Office | | 3 | | 324 | | Sq. Ft | | 99% |
| Healthcare: | Healthcare: | | | | Healthcare: | |
| 9725 Datapoint | 9725 Datapoint | | 1 | | San Antonio, TX | | Dec, 2019 | | 100 | % | | | 205 | | sq ft. | | 100 | % | 9725 Datapoint | | 1 | | San Antonio, TX | | Dec, 2019 | | 100% | | 205 | | Sq. Ft | | 100% |
| Locust Grove | Locust Grove | | 1 | | Atlanta, GA | | Nov, 2020 | | 100 | % | | | 40 | | sq ft. | | 100 | % | Locust Grove | | 1 | | Atlanta, GA | | Nov, 2020 | | 100% | | 40 | | Sq. Ft | | 100% |
| Linden Oaks | Linden Oaks | | 1 | | Chicago, IL | | Nov, 2020 | | 100 | % | | | 43 | | sq ft. | | 100 | % | Linden Oaks | | 1 | | Chicago, IL | | Nov, 2020 | | 100% | | 43 | | Sq. Ft | | 100% |
| 2945 Wilderness Place | 2945 Wilderness Place | | 1 | | Boulder, CO | | Jan, 2021 | | 100 | % | | | 31 | | sq ft. | | 100 | % | 2945 Wilderness Place | | 1 | | Boulder, CO | | Jan, 2021 | | 100% | | 31 | | Sq. Ft | | 100% |
| Pacific Center | Pacific Center | | 1 | | San Diego, CA | | May, 2021 | | 100 | % | | | 92 | | sq ft. | | 100 | % | Pacific Center | | 1 | | San Diego, CA | | May, 2021 | | 100% | | 92 | | Sq. Ft | | 100% |
| Hillcroft Medical Clinic | Hillcroft Medical Clinic | | 1 | | Sugarland, TX | | June, 2021 | | 100 | % | | | 41 | | sq ft. | | 100 | % | Hillcroft Medical Clinic | | 1 | | Sugarland, TX | | June, 2021 | | 100% | | 41 | | Sq. Ft | | 100% |
| Buck's Town Medical Campus I | Buck's Town Medical Campus I | | 5 | | Philadelphia, PA | | Sept, 2021 | | 100 | % | | | 142 | | sq ft. | | 89 | % | Buck's Town Medical Campus I | | 5 | | Philadelphia, PA | | Sept, 2021 | | 100% | | 142 | | Sq. Ft | | 89% |
| 620 Roseville Parkway | 620 Roseville Parkway | | 1 | | Roseville, CA | | Oct, 2021 | | 100 | % | | | 194 | | sq ft. | | 51 | % | 620 Roseville Parkway | | 1 | | Roseville, CA | | Oct, 2021 | | 100% | | 194 | | Sq. Ft | | 81% |
| Buck's Town Medical Campus II | Buck's Town Medical Campus II | | 2 | | Langhorne, PA | | Oct, 2021 | | 100 | % | | | 69 | | sq ft. | | 83 | % | Buck's Town Medical Campus II | | 2 | | Langhorne, PA | | Oct, 2021 | | 100% | | 69 | | Sq. Ft | | 83% |
| Project Sullivan | | Project Sullivan | | 10 | | Various | | Various | | 100% | | 661 | | Sq. Ft | | 96% |
| Total Healthcare | Total Healthcare | | 14 | | | | 857 | | sq ft. | | 91 | % | Total Healthcare | | 24 | | 1,518 | | Sq. Ft | | 95% |
| Self-Storage: | | Self-Storage: | |
| Out O' Space Storage | | Out O' Space Storage | | 1 | | Palm Bay, FL | | June, 2022 | | 100% | | 240 | | Units | | 88% |
| Imperial Sugar Land | | Imperial Sugar Land | | 1 | | Sugarland, TX | | June, 2022 | | 100% | | 791 | | Units | | 83% |
| Advantage Storage | | Advantage Storage | | 1 | | Houston, TX | | Aug, 2022 | | 100% | | 781 | | Units | | 88% |
| Pflugerville Self-Storage | | Pflugerville Self-Storage | | 1 | | Pflugerville, TX | | Dec, 2022 | | 100% | | 546 | | Units | | 84% |
| Brighton Storage | | Brighton Storage | | 1 | | Brighton, CO | | Mar, 2023 | | 100% | | 716 | | Units | | 88% |
| Total Self-Storage | | Total Self-Storage | | 5 | | 3,074 | Units | | 86% |
| Single-Family Housing: | Single-Family Housing: | | | | Single-Family Housing: | |
| Single-Family Rentals | | Single-Family Rentals | | 384 | | Various | | Various | | 100% | | 775 | | Sq. Ft | | 91% |
| Total Single-Family Housing | | Total Single-Family Housing | | 384 | | 775 | | Sq. Ft | | 91% |
| Total Investment Properties | | Total Investment Properties | | 461 | |
| | | | | | | | | | | | | | | | | | | | | | | | | | | | | | | | | | | | | | | | | | | |
| Single-Family Rentals | | 265 | | Various | | Various | | 100 | % | | | | 540 | | sq ft. | | 72 | % |
| Total Single-Family Housing | | 265 | | | | | | | | | | 540 | | sq ft. | | 72 | % |
| Total Investment Properties | | 307 | | | | | | | | | | | | | |
The following schedule details the expiring leases at our industrial, retail, office and healthcare properties by annualized base rent and square footage as of March 31, 20222023 ($ and square feet data in thousands). The table below excludes our multifamily properties, and single-family rentals and self-storage properties as substantially all leases at such properties expire within 12 months.
| | Year | Year | | Number of Expiring Leases | | Annualized Base Rent(1) | | % of Total Annualized Base Rent Expiring | | Square Feet | | % of Total
Square Feet
Expiring | Year | | Number of Expiring Leases | | Annualized Base Rent(1) | | % of Total Annualized Base Rent Expiring | | Square Feet | | % of Total
Square Feet
Expiring |
| 2022 (remaining) | | 13 | | | 852 | | | 2 | % | | 109 | | | 3 | % | |
| 2023 | | 9 | | 732 | | | 2 | % | | 77 | | | 2 | % | |
| 2023 (Remaining) | | 2023 (Remaining) | | 23 | | 2,724 | | | 3 | % | | 196 | | | 3 | % |
| 2024 | 2024 | | 20 | | 2,688 | | | 7 | % | | 296 | | | 9 | % | 2024 | | 62 | | 7,176 | | | 8 | % | | 898 | | | 13 | % |
| 2025 | 2025 | | 25 | | 11,352 | | | 28 | % | | 1,102 | | | 32 | % | 2025 | | 71 | | 14,220 | | | 17 | % | | 1,339 | | | 19 | % |
| 2026 | 2026 | | 18 | | 2,844 | | | 7 | % | | 239 | | | 7 | % | 2026 | | 53 | | 7,740 | | | 9 | % | | 895 | | | 13 | % |
| 2027 | 2027 | | 29 | | | 7,104 | | | 17 | % | | 557 | | | 16 | % | 2027 | | 55 | | | 13,020 | | | 16 | % | | 939 | | | 13 | % |
| 2028 | 2028 | | 9 | | | 5,292 | | | 13 | % | | 478 | | | 14 | % | 2028 | | 40 | | | 14,904 | | | 18 | % | | 1,008 | | | 14 | % |
| 2029 | 2029 | | 5 | | | 456 | | | 1 | % | | 36 | | | 1 | % | 2029 | | 11 | | | 2,676 | | | 3 | % | | 379 | | | 5 | % |
| 2030 | 2030 | | 7 | | | 3,120 | | | 8 | % | | 161 | | | 5 | % | 2030 | | 8 | | | 3,480 | | | 4 | % | | 164 | | | 2 | % |
| 2031 | | 2031 | | 7 | | | 1,908 | | | 2 | % | | 102 | | | 1 | % |
| 2032 | | 2032 | | 7 | | | 6,276 | | | 7 | % | | 710 | | | 10 | % |
| Thereafter | Thereafter | | 14 | | | 6,192 | | | 15 | % | | 372 | | | 11 | % | Thereafter | | 21 | | | 10,620 | | | 13 | % | | 464 | | | 7 | % |
| Total | Total | | 149 | | | 40,632 | | | 100 | % | | 3,427 | | | 100 | % | Total | | 358 | | | 84,744 | | | 100 | % | | 7,094 | | | 100 | % |
(1)The annualized March 31, 20222023 base rent per leased square foot of the applicable year excluding tenant recoveries, straight-line rent and above-market and below-market lease amortization.
Investments in Real Estate-Related Securities
We invest in real estate-related securities including shares of common stock of publicly-listed REITs. As of March 31, 2022,2023, we had 10366 holdings and have invested $88.5$137.3 million in securities that are valued at $102.7$128.1 million.
Investments in Real Estate Debt
We invest in commercial mortgage-backed securities (“CMBS”) to the extent permitted by the REIT rules.. CMBS are securities that evidence interests in, or are secured by, a single commercial mortgage loan or a pool of commercial mortgage loans. CMBS are generally pass-throughpass-throughs and represent beneficial ownership interests in trusts whose assets consist of defined portfolios of one or more commercial mortgage loans. Losses are usually borne by the most subordinate class, which receive payments only after the senior classes have received payments they are entitled to. CMBS are subject to the risks of the underlying mortgage loans. The majority of these securitiesour CMBS are back by a single loan (77%asset, single borrower deals (~92%), and nearly all securitiesour CMBS are rated Investment Grade (BBB- or higher) with ~2% being non-Investment Grade (BB+ or lower). The greatest concentration by property sector of our CMBS is in industrial properties. Additionally, to minimize interest rate risk, the portfolio is concentrated in floating-rate securities (85%(~85%) that had a purchase yield of 3.58% which is expected to increase as thewhose base index rates (LIBOR and SOFR) increase.are ~4.85% and help to generate a current portfolio yield of 9.97%. As of March 31, 2022,2023, we have invested $60.1$114.6 million in CMBS that are valued at $59.4$110.1 million on the balance sheet.our Consolidated Balance Sheet.
Investments in International Affiliated Funds
European Cities Partnership SCSp
ECF was formed in March 2016 as an open-end, Euro-denominated fund that seeks to build a diversified portfolio of high quality and stabilized commercial real estate with good fundamentals (i.e., core real estate) located in or around certain investment cities in Europe selected for their resilience, potential for long-term structural performance and ability to deliver an attractive and stable distribution yield. As of the latest available information,March 31, 2023, ECF hashad total equity commitments of $1.3$1.2 billion (€1.2 billion) and hashad called $1.3$1.2 billion (€1.2 billion) of these commitments. ECF has 13had 12 assets with a gross asset value of $2.1$2.0 billion (€1.9 billion) and has a loan to value ("LTV") ratio of 35.2%38.1%. The ECF portfolio is well diversified and as of December 31, 20212022, had a balanced country exposure with 21%24.0% in UK, 20%16.6% in Netherlands, 12%12.8% in Spain, 12.5% in Finland, 12% in Spain, 12%12.0% in Germany, 11%11.8% in Italy, 5.7% in Denmark and 4.6% in Austria resulting in a 12-month net total return of (0.8)% and a since inception net total return of 3.9%.
in Italy, 5% in Denmark, 4% in France, and 3% in Austria resulting in an annualized since inception gross income return of 4.1% and a gross total return of 6.0%.
The following table summarizes the equity investment in Unconsolidated International Affiliated Fundsunconsolidated international affiliated funds from ECF as of March 31, 20222023 ($ in thousands): | | | | | | | | |
| | Investment in ECF |
Balance as of December 31, 20212022 | | $ | 79,09778,353 | |
| | |
Income distributiondistributions | | (463)(1,243) | |
IncomeLoss from equity investment in unconsolidated international affiliated fund | | 917(4,261) | |
| Foreign currency translation adjustment | | (1,966)892 | |
Balance as ofat March 31, 20222023 | | $ | 77,58573,741 | |
Income (loss)(Loss) income from equity investments in Unconsolidated International Affiliated Fundsunconsolidated international affiliated funds from ECF was $0.9 million and $(0.2) million for the three months ended March 31, 2023 and 2022, was $(4.3) million and 2021,$0.9 million, respectively.
Asia Pacific Cities Fund
APCF was launched in November 2018 as an open-end, U.S. dollar-denominated fund that seeks durable income and capital appreciation from a balanced and diversified portfolio of real estate investments in a defined list of investment cities in the Asia-Pacific region. As of the latest available information,March 31, 2023, APCF hashad total equity commitments of $990.0 million and hashad called $696.5$876.5 million of these commitments. APCF has 14 assetshad nine investments (23 assets) with a gross asset value of $1.3$1.6 billion and has a loan to valuean LTV ratio of 40.7%39.8%. As of December 31, 2021,2022, APCF had 39%32.7% exposure in Singapore, 11% in Australia, 29%28.7% in Japan, and 21%17.0% in South Korea, 12.9% in Hong Kong and 8.7% in Australia resulting in an annualized since inception total return of 6.9%8.6%(1).
(1) Return is FX neutral
The following table summarizes the equity investment in Unconsolidated International Affiliated Fundsunconsolidated international affiliated funds from APCF as of March 31, 20222023 ($ in thousands):
| | | | | | | | |
| | Investment in APCF |
Balance as of December 31, 20212022 | | $ | 51,94848,871 | |
| | |
Income distributiondistributions | | (119)(313) | |
| Income from equity investment in unconsolidated international affiliated fund | | (58)3,906 | |
| | |
Balance as ofat March 31, 20222023 | | $ | 51,77152,464 | |
(Loss) incomeIncome (loss) from equity investments in Unconsolidated International Affiliated Fundsunconsolidated international affiliated funds from APCF for each of the three months ended March 31, 2023 and 2022 and 2021 was $(0.1)$3.9 million and $0.9$(0.1) million, respectively.
Investments in Commercial Mortgage Loans
On November 9, 2021 we originated a floating rate seniorThe following table summarizes our investments in commercial mortgage and mezzanine loan to financeloans as of March 31, 2023 ($ in thousands):
| | | | | | | | | | | | | | | | | | | | | | | | | | | | | | | | | | | | | | | | | | | | | | | | | | | | | | | | | | | | | | |
| Investment Name | | Origination Date | | Loan Type | | Property Type | | Location | | Interest Rate | | Maturity Date | | Periodic Payment Terms | | Commitment Amount | | Principal Receivable | | Fair Value |
9-90 Corporate Center(1) | | 11/9/2021 | | Senior | | Office | | Framingham, MA | | LIBOR + 175 bps | | 11/9/2024 | | Interest only | | $72,033 | | $62,809 | | $62,287 |
| 9-90 Corporate Center | | 11/9/2021 | | Mezzanine | | Office | | Framingham, MA | | LIBOR + 575 bps | | 11/9/2024 | | Interest only | | $23,344 | | $20,936 | | $20,389 |
Panorama House(1) | | 11/16/2021 | | Senior | | Multifamily | | Roseville, CA | | SOFR + 165 bps | | 12/9/2025 | | Interest only | | $66,488 | | $66,488 | | $65,810 |
| Panorama House | | 11/16/2021 | | Mezzanine | | Multifamily | | Roseville, CA | | SOFR + 597 bps | | 12/9/2025 | | Interest only | | $22,163 | | $22,163 | | $21,630 |
| Tucson IV | | 3/28/2022 | | Senior | | Multifamily | | Tuscon, AZ | | SOFR + 295 bps | | 4/9/2025 | | Interest only | | $76,260 | | $71,947 | | $72,187 |
| Tucson IV | | 3/28/2022 | | Mezzanine | | Multifamily | | Tuscon, AZ | | SOFR + 295 bps | | 4/9/2025 | | Interest only | | $25,420 | | $23,982 | | $22,189 |
Dolce Living Royal Palm(1) | | 7/8/2022 | | Senior | | Multifamily | | Kissimmee, FL | | SOFR + 185 bps | | 7/9/2024 | | Interest only | | $51,432 | | $51,432 | | $51,290 |
| Dolce Living Royal Palm | | 7/8/2022 | | Mezzanine | | Multifamily | | Kissimmee, FL | | SOFR + 525 bps | | 7/9/2024 | | Interest only | | $17,144 | | $17,144 | | $16,970 |
Luxe Scottsdale(1) | | 7/19/2022 | | Mezzanine | | Multifamily | | Scottsdale, AZ | | SOFR + 570 bps | | 8/9/2025 | | Interest only | | $17,043 | | $17,072 | | $16,789 |
| Total | | | | | | | | | | | | | | | | | | | | $349,541 |
(1) During the acquisition of a four building life science/office campus in Farmington, Massachusetts, amounting to $62.3 million and have committed to fund an additional $30.4 million for future renovations of the property. The advance rate was 65% LTV with an in-place debt yield of 8.47%. On November 16, 2021 we originated a second floating rate senior mortgage and mezzanine loan in the amount of $76.9 million to finance the acquisition of a multifamily property in Seattle, Washington, with additional commitments to fund $11.1 million for future renovations. The advance rate was 74% LTV with an in-place debt yield of 5.14%. The secondary market execution for both of these loan facilities will be to sell the senior mortgage position and increase the mezzanine yield.
On March 24,thefour senior portion of a loanloans to an unaffiliated party and retained the subordinate mortgage,parties, receiving total proceeds of $47.4$208.5 million, which isare net of disposition fees. On March 28, 2022 we originated a floating ratefees and additional fundings. The senior mortgageloan sales, with the exception of Luxe Scottsdale, did not qualify for sale accounting under US GAAP and mezzanine loan to financeas such, the acquisition and reposition of five multi-family properties located in Tucson, AZ, amounting to $92.35 million and have committed to fund an additional $9.33 million for future renovations of the property. The advance rate was 70.9% LTV with an in-place debt yield of 5.25%. The secondary market execution is anticipated to be note-on-note.loans were not de-recognized.
In accordance with the adoption of the fair value option allowed under ASC 825, Financial Instruments, and at theour election, of the Company, the existing commercial mortgage loans are stated at fair value and were initially valued at the face amount of the loan funding. Subsequently, the commercial mortgage loans will be valued at least quarterly by an independent third-party valuation firm with additional oversight being performed by the Advisor’s internal valuation department. The value will be
based on market factors, such as market interest rates and spreads for comparable loans, the performance of the underlying collateral (such as the loan-to-value ratio and the cash flow of the underlying collateral), and the credit quality of the borrower.
For the three months ended March 31, 2023, we had unrealized losses on our commercial mortgage loans of $0.9 million. For the three months ended March 31, 2022, we did not have any realized or unrealized gains or losses on our commercial mortgage loans.
For the three months ended March 31, 2023 and 2022, we recognized interest income and loan origination fee income from our investment in commercial mortgage loans of $6.5 million and $2.0 million, respectively.
Factors Impacting Our Operating Results
Results of operations are affected by a number of factors and depend on the rental revenue we receive from the properties that we acquire, the timing of lease expirations, general market conditions, operating expenses, the competitive environment for real estate assets and income from our investments in real estate-related securities, real estate debt, commercial mortgages and the International Affiliated Funds. TheReal estate has produced strong U.S. economic recovery is benefitingreturns over the last few years and has priced in the effects of higher inflation and monetary policy to a more limited extent than other asset classes. Higher market rents, particularly from industrial, self-storage and housing properties, are translating into strong net operating income growth, and investors are
continuing to view real estate prices overall. COVID-19 pandemic-related restrictions have largely been removed. The U.S. real estate recovery is generally tracking with the broader economic recovery; however, we expect certain regions, cities, and property types to continue to outperform and others to underperform.as a key portfolio diversifier in a high-inflation environment. U.S. commercial real estate should benefit even during a rising interest rate environment, as real-estate assets will continue to be a higher-yielding alternative to fixed-income assets in the short term.
Competitive Environment
We face competition from a diverse mix of market participants, including but not limited to, other companies with similar business models, independent investors, hedge funds and other real estate investors. Competition from others may diminish our opportunity to acquire a desired property on favorable terms or at all. In addition, this competition may put pressure on us to reduce the rental rates below those that we expect to charge for the properties that we acquire, which would adversely affect our financial results.
Rental Revenues
We receive income primarily from rental revenue generated by the properties that we acquire. The amount of rental revenue depends upon a number of factors, including: our ability to enter into leases with increasing or market value rents for the properties that we acquire; and rent collection, which primarily relates to each future tenant’s financial condition and ability to make rent payments to us on time.
Competitive Environment
We face competition from a diverse mix of market participants, including but not limited to, other companies with similar business models, independent investors, hedge funds and other real estate investors. Competition from others may diminish our opportunities to acquire a desired property on favorable terms or at all. In addition, this competition may put pressure on us to reduce the rental rates below those that we expect to charge for the properties that we acquire, which would adversely affect our financial results.
Operating Expenses
Our operating expenses include general and administrative expenses, including legal, accounting and other expenses related to corporate governance, public reporting and compliance with the various provisions of U.S. securities laws. As we have with the leases associated with our industrial, retail, office and healthcare properties, we generally expect to structure our leases so that the tenant is responsible for taxes, maintenance, insurance and structural repairs with respect to the premises throughout the lease term. Increases or decreases in such operating expenses will impact our overall financial performance.
Our Qualification as a REIT
We elected to be taxed as a REIT for U.S. federal income tax purposes commencing with the taxable year ended December 31, 2018. Shares of our common stock are subject to restrictions on ownership and transfer that are intended, among other purposes, to assist us in qualifying and maintaining our qualification as a REIT. In orderqualifying for us to qualifytaxation as a REIT under the Internal Revenue Code (the “Code”), we are requiredsubject to among other things,federal corporate income tax to the extent we distribute as dividends at least 90%less than 100% of our REIT taxable income determined without regard to the dividends-paid deduction and excluding(including any net capital gains,gains) to our stockholders and meet certain tests regarding the nature of our income and assets. In order to satisfy a requirement that five or fewer individuals do not own (or be treated as owning) more than 50% of our stock, subject to certain exceptions, no person or entity may own, or be deemed to own, by virtue of the applicable constructive ownership provisions of the Code, more than 9.8% (in value or number of shares, whichever is more restrictive) of the aggregate of our outstanding shares of stock or more than 9.8% (in value or number of shares, whichever is more restrictive) of our outstanding common stock.
Tax legislation commonly referred to as the Tax Cuts & Jobs Act (the "TCJA") was enacted on December 22, 2017. Among other things, the TCJA reduced the U.S. federal corporate income tax rate from 35% to 21% and created new taxes on certain foreign-sourced earnings. Federal legislation intended to ameliorate the economic impact of the COVID-19 pandemic, the Coronavirus Aid, Relief and Economic Security Act (the "CARES Act"), was enacted on March 27, 2020, which, among other things, makes technical corrections to, or modifies on a temporary basis, certain of the provisions of the TCJA. Management has evaluated the effects of TCJA, as modified by the CARES Act and concluded that the TCJA will not materially impact its consolidated financial statements. We also estimate that the taxes on foreign-sourced earnings imposed under the TCJA are not likely to apply to our foreign investments.
Results of Operations
The following table sets forth the results of our operations for the three months ended March 31, 20222023 and 20212022 ($ in thousands):
| | | | Three Months Ended
March 31, | | | | Three Months Ended March 31, | |
| | | 2022 | | 2021 | | 2022 vs 2021 | | | 2023 | | 2022 | | 2023 vs 2022 |
| Revenues | Revenues | | | | | | | Revenues | | | | | | |
| Rental revenue | Rental revenue | | $ | 21,668 | | | $ | 11,262 | | | $ | 10,406 | | Rental revenue | | $ | 42,334 | | | $ | 21,668 | | | $ | 20,666 | |
| Income from commercial mortgage loan | | 1,995 | | | — | | | 1,995 | | |
| Income from commercial mortgage loans | | Income from commercial mortgage loans | | 6,485 | | | 1,995 | | | 4,490 | |
| Total revenues | Total revenues | | 23,663 | | | 11,262 | | | 12,401 | | Total revenues | | 48,819 | | | 23,663 | | | 25,156 | |
| Expenses | Expenses | | | Expenses | | |
| Rental property operating | Rental property operating | | 7,561 | | | 3,514 | | | 4,047 | | Rental property operating | | 14,939 | | | 7,561 | | | 7,378 | |
| General and administrative | General and administrative | | 2,096 | | | 1,057 | | | 1,039 | | General and administrative | | 2,437 | | | 2,096 | | | 341 | |
| Advisory fee due to affiliate | Advisory fee due to affiliate | | 4,706 | | | 1,064 | | | 3,642 | | Advisory fee due to affiliate | | 8,042 | | | 4,706 | | | 3,336 | |
| Depreciation and amortization | Depreciation and amortization | | 12,367 | | | 5,484 | | | 6,883 | | Depreciation and amortization | | 21,260 | | | 12,367 | | | 8,893 | |
| Total expenses | Total expenses | | 26,730 | | | 11,119 | | | 15,611 | | Total expenses | | 46,678 | | | 26,730 | | | 19,948 | |
| Other income (expense) | Other income (expense) | | | Other income (expense) | | |
| Realized and unrealized (loss) income from real estate-related securities | | (3,404) | | | 2,881 | | | (6,285) | | |
| Realized and unrealized gain (loss) from real estate-related securities | | Realized and unrealized gain (loss) from real estate-related securities | | 2,996 | | | (3,404) | | | 6,400 | |
| Realized and unrealized loss from real estate debt | Realized and unrealized loss from real estate debt | | (706) | | | — | | | (706) | | Realized and unrealized loss from real estate debt | | (403) | | | (706) | | | 303 | |
| Income from equity investment in unconsolidated international affiliated funds | | 859 | | | 689 | | | 170 | | |
| Unrealized loss on commercial mortgage loans | | Unrealized loss on commercial mortgage loans | | (949) | | | — | | | (949) | |
| Unrealized loss on note payable | | Unrealized loss on note payable | | (30) | | | — | | | (30) | |
| (Loss) income from equity investment in unconsolidated international affiliated funds | | (Loss) income from equity investment in unconsolidated international affiliated funds | | (355) | | | 859 | | | (1,214) | |
| Interest income | Interest income | | 330 | | | 60 | | | 270 | | Interest income | | 1,884 | | | 330 | | | 1,554 | |
| Interest expense | Interest expense | | (1,796) | | | (943) | | | (853) | | Interest expense | | (8,629) | | | (1,796) | | | (6,833) | |
| Net (loss) income | | (7,784) | | | 2,830 | | | (10,614) | | |
| Net income attributable to non-controlling interest in third party joint venture | | 19 | | | — | | | 19 | | |
| Total other income (expense) | | Total other income (expense) | | (5,486) | | | (4,717) | | | (769) | |
| Net loss | | Net loss | | (3,345) | | | (7,784) | | | 4,439 | |
| Net (loss) income attributable to non-controlling interests in third party joint ventures | | Net (loss) income attributable to non-controlling interests in third party joint ventures | | (36) | | | 19 | | | (55) | |
| Net income attributable to preferred stock | Net income attributable to preferred stock | | 4 | | | 8 | | | (4) | | Net income attributable to preferred stock | | 4 | | | 4 | | | — | |
| Net (loss) income attributable to common stockholders | | $ | (7,807) | | | $ | 2,822 | | | $ | (10,610) | | |
| Net loss attributable to common stockholders | | Net loss attributable to common stockholders | | $ | (3,313) | | | $ | (7,807) | | | $ | 4,494 | |
Rental Revenue and Rental Property Operating Expenses
Due to acquisitions of real estate we have made since March 31, 2021,2022, our rental revenues and rental property operating expenses for the three months ended March 31, 20222023 and 20212022 are not comparable. However, certain properties in our portfolio were owned for both the three months ended March 31, 20222023 and 20212022 and are further discussed below in "Same"Same Property Results of Operations.Operations."
Depreciation and AmortizationIncome from Commercial Mortgage Loans
During the three months ended March 31, 2022, depreciation and amortization2023, income from commercial mortgage loans increased by $6.9$4.5 million in comparison to the corresponding period in 20212022 due to acquisitionsthe origination of real estate.three commercial mortgages in July 2022, as well as the impact of rising interest rates.
General and Administrative Expenses
During the three months ended March 31, 2022,2023, general and administrative expenses increased by $1.0$0.3 million in comparison to the corresponding periodsperiod in 20212022 primarily due to an increase in legal andfees, appraisal fees and fund administration and a disposition fee associated withcosts related to the saleincrease in the size of the senior portion of our commercial mortgage loan.portfolio.
Advisory Fee Due to Affiliate
During the three months ended March 31, 2022,2023, the advisory fee due to affiliate increased by $3.6$3.3 million as compared to the corresponding periodsperiod in 20212022 due to the growth of our NAV.
Depreciation and Amortization
During the three months ended March 31, 2023, depreciation and amortization increased by $8.9 million in comparison to the corresponding period in 2022 primarily due to acquisitions of real estate.
Realized and Unrealized IncomeGain (Loss) from Real Estate-Related Securities
Realized and unrealized incomegain (loss) from real estate-related securities decreased $6.3went from a loss of $(3.4) million for the three months ended March 31, 2022, compared to a gain of $3.0 million for the corresponding period in 2021.three months ended March 31, 2023. The decreasechange from a loss to a gain was due to an overall market decline driven by the uncertainty surrounding inflation, interest rates and geopolitics in Eastern Europe.more favorable market conditions.
Realized and Unrealized Loss from Real Estate Debt
Realized and unrealized loss from real estate debt was $0.7decreased by $0.3 million as compared to the corresponding period in 2022, driven by widening spreads and the impact of rising interest rates on fixed-rate securities.
Unrealized Loss on Commercial Mortgage Loans
We incurred an unrealized loss on commercial mortgage loans of $0.9 million for the three months ended March 31, 2023, driven by the widening of floating rate spreads. We did not incur any gains or losses during the corresponding period in 2022.
(Loss) Income from Equity Investment in Unconsolidated International Affiliated Funds
(Loss) income from equity investments in unconsolidated international affiliated funds went from income of $0.9 million for the three months ended March 31, 2022, to a loss of $(0.4) million for the three months ended March 31, 2023. The change from income to loss was primarily driven by valuation losses in the investment and office markets for ECF, partially offset by foreign currency gains due to our recent allocations to CMBS.the strengthening of the Euro.
Interest Income from Equity Investment in Unconsolidated International Affiliated Funds
During the three months ended March 31, 2022,2023, interest income from the International Affiliated Funds increased slightly as$1.6 million compared to the corresponding periodsperiod in 2021. The increase was primarily2022 due to valuation gains on properties within ECF and APCF driven by improved market conditions.increased bond income from our CMBS investments.
Interest Expense
During the three months ended March 31, 2022,2023, interest expense increased $1.8$6.8 million compared to the corresponding period in 20212022 due to additional borrowings on our Credit Facilitycredit facility, new borrowings on our mortgages and Mortgages Payables duringnote payable, and the current year.impact of rising interest rates.
Same Property Results of Operations
We evaluate our consolidated results of operations on a same property basis, which allows us to analyze our property operating results excluding acquisitions during the periods under comparison. Properties in our portfolio are considered same property if they were owned for the full periods presented, otherwise they are considered non-same property. Newly acquired or recently developed properties that have not achieved stabilized occupancy are excluded from same property results and are considered non-same property. We do not consider our real estate-related securities, real estate debt, commercial mortgage loans and International Affiliated Funds segments to be same property.
For the three months ended March 31, 2022 and 2021,2023, our same property portfolio consisted of six11 industrial, twofive multifamily, twothree office, one retail and three14 healthcare properties.
Same property operating results are measured by calculating same property net operating income (“NOI”). Same property NOI is a supplemental non-GAAP disclosure of our operating results that we believe is meaningful as it enables management to evaluate the impact of occupancy, rents, leasing activity and other controllable property operating results at our real estate properties. We define same property NOI as operating revenues less operating expenses, which exclude (i) depreciation and amortization, (ii) interest expense and other non-property related revenue and expense items such as (a) general and administrative expenses, (b) management fee, (c) interest income, (d) income from real estate-related securities, (e) income from equity investment in unconsolidated international affiliated funds and (f) income from commercial mortgage loan.loans.
Our same property NOI may not be comparable to that of other REITs and should not be considered to be more relevant or accurate in evaluating our operating performance than the current GAAP methodology used in calculating net income (loss).
The following table reconciles GAAP net income attributable to our stockholders to same property NOI for the three months ended March 31, 20222023 and 20212022 ($ in thousands): | | | | Three Months Ended
March 31, | | | Three Months Ended March 31, | |
| | | 2022 | | 2021 | | | 2023 | | 2022 | |
| Net (loss) income attributable to common stockholders | | $ | (7,807) | | | $ | 2,822 | | | |
| Net loss attributable to common stockholders | | Net loss attributable to common stockholders | | $ | (3,313) | | | $ | (7,807) | | |
| Adjustments to reconcile to same property NOI | Adjustments to reconcile to same property NOI | | | | Adjustments to reconcile to same property NOI | | |
| General and administrative | General and administrative | | 2,096 | | | 1,057 | | | General and administrative | | 2,437 | | | 2,096 | | |
| Advisory fee due to affiliate | Advisory fee due to affiliate | | 4,706 | | | 1,064 | | | Advisory fee due to affiliate | | 8,042 | | | 4,706 | | |
| Depreciation and amortization | Depreciation and amortization | | 12,367 | | | 5,484 | | | Depreciation and amortization | | 21,260 | | | 12,367 | | |
| Loss (income) from real estate-related securities | | 3,404 | | | (2,881) | | | |
| Realized and unrealized (gain) loss from real estate-related securities | | Realized and unrealized (gain) loss from real estate-related securities | | (2,996) | | | 3,404 | | |
| Income from commercial mortgage loans | Income from commercial mortgage loans | | (1,995) | | | — | | | Income from commercial mortgage loans | | (6,485) | | | (1,995) | | |
| Loss from real estate debt | | 706 | | | — | | | |
| Income from equity investment in unconsolidated international affiliated funds | | (859) | | | (689) | | | |
| Realized and unrealized loss from real estate debt | | Realized and unrealized loss from real estate debt | | 403 | | | 706 | | |
| Loss (income) from equity investments in unconsolidated international affiliated funds | | Loss (income) from equity investments in unconsolidated international affiliated funds | | 355 | | | (859) | | |
| Unrealized loss on commercial mortgage loans | | Unrealized loss on commercial mortgage loans | | 949 | | | — | | |
| Unrealized loss on note payable | | Unrealized loss on note payable | | 30 | | | — | | |
| Interest income | Interest income | | (330) | | | (60) | | | Interest income | | (1,884) | | | (330) | | |
| Interest expense | Interest expense | | 1,796 | | | 943 | | | Interest expense | | 8,629 | | | 1,796 | | |
| Income attributable to non-controlling interest in third party joint venture | | 19 | | | — | | | |
| Preferred Stock | | 4 | | | 8 | | | |
| (Loss) income attributable to non-controlling interests in third party joint ventures | | (Loss) income attributable to non-controlling interests in third party joint ventures | | (36) | | | 19 | | |
| Series A Preferred Stock | | Series A Preferred Stock | | 4 | | | 4 | | |
| NOI | NOI | | $ | 14,107 | | | $ | 7,748 | | | NOI | | $ | 27,395 | | | $ | 14,107 | | |
| Non-same property NOI | Non-same property NOI | | 6,135 | | | 192 | | | Non-same property NOI | | 12,787 | | | 1,033 | | |
| Same property NOI | Same property NOI | | $ | 7,972 | | | $ | 7,556 | | | Same property NOI | | $ | 14,608 | | | $ | 13,074 | | |
The following table details the components of same property NOI for the three months ended March 31, 20222023 and 20212022 ($ in thousands): | | | | Three Months Ended March 31, | | 2022 vs 2021 | | | Three Months Ended March 31, | | 2023 vs 2022 |
| | | 2022 | | 2021 | | $ | | % | | | 2023 | | 2022 | | $ | | % |
| Rental Revenue | | | | | | | | |
| Same property rental revenue | | Same property rental revenue | | | | | | |
| Multifamily | Multifamily | | | $ | 2,659 | | | $ | 2,381 | | | $ | 278 | | | 12 | % | Multifamily | | $ | 7,149 | | | $ | 6,479 | | | $ | 670 | | | 10 | % |
| Healthcare | | Healthcare | | 5,582 | | | 5,087 | | | 495 | | | 10 | % |
| Industrial | Industrial | | | 3,901 | | | 3,559 | | | 342 | | | 10 | % | Industrial | | 4,587 | | | 4,310 | | | 277 | | | 6 | % |
| Office | Office | | | 1,799 | | | 1,874 | | | (75) | | | (4) | % | Office | | 2,414 | | | 2,276 | | | 138 | | | 6 | % |
| Retail | Retail | | | 1,699 | | | 1,683 | | | 16 | | | 1 | % | Retail | | 1,729 | | | 1,609 | | | 120 | | | 7 | % |
| Total revenues | | Total revenues | | 21,461 | | | 19,761 | | | 1,700 | | | 9 | % |
| Same property operating expenses | | Same property operating expenses | | |
| Multifamily | | Multifamily | | 2,970 | | | 2,718 | | | 252 | | | 9 | % |
| Healthcare | Healthcare | | | 1,588 | | | 1,518 | | | 70 | | | 5 | % | Healthcare | | 1,519 | | | 1,686 | | | (167) | | | (10) | % |
| Total revenues | | | 11,646 | | | 11,015 | | | 631 | | | 6 | % | |
| Property operating expenses | | | | |
| Multifamily | | | 1,225 | | | 1,181 | | | 44 | | | 4 | % | |
| Industrial | Industrial | | | 1,149 | | | 1,109 | | | 40 | | | 4 | % | Industrial | | 1,361 | | | 1,260 | | | 101 | | | 8 | % |
| Office | Office | | | 535 | | | 555 | | | (20) | | | (4) | % | Office | | 636 | | | 613 | | | 23 | | | 4 | % |
| Retail | Retail | | | 410 | | | 348 | | | 62 | | | 18 | % | Retail | | 367 | | | 410 | | | (43) | | | (10) | % |
| Healthcare | | | 355 | | | 266 | | | 89 | | | 33 | % | |
| Total expenses | Total expenses | | | 3,674 | | | 3,459 | | | 215 | | | 6 | % | Total expenses | | 6,853 | | | 6,687 | | | 166 | | | 2 | % |
| Same property NOI | Same property NOI | | | $ | 7,972 | | | $ | 7,556 | | | $ | 416 | | | 6 | % | Same property NOI | | $ | 14,608 | | | $ | 13,074 | | | $ | 1,534 | | | 12 | % |
Same Property—Revenue
Our rental revenue includes contracted rental income from our tenants based on the leases and tenant reimbursement income for costs related to common area maintenance, real estate taxes and other recoverable costs. For the three months ended March 31, 2022,2023, rental revenues increased $0.6$1.7 million across the same property portfolio as compared to the corresponding period in 2021.2022. The increase was primarily related to increases in occupancy at our same property multifamily investments, decreases in rent concessions at some of our same property multifamily investments, and increased market rents at our same property industrial, healthcare, and multifamily investments.
Same Property—Expenses
Same property rental property operating expenses primarily includes real estate taxes, utilities and other maintenance expenses associated with our real properties. For the three months ended March 31, 2022,2023, property operating expenses increased $0.2 million across the same property portfolio as compared to the corresponding period in 2021.2022. The increase was primarily due to slightlyincreases were driven by a higher maintenance expensereal estate tax accrual at one of our retail and healthcare same store investments.
Liquidity and Capital Resources
Our primary needs for liquidity and capital resources are to fund our investments, make distributions to our stockholders, repurchase shares of our common stock pursuant to our share repurchase plan, pay our offering and operating fees and expenses and pay interest on any outstanding indebtedness we may incur. We will obtain the funds required to purchase investments and conduct our operations from the net proceeds of the Follow-on Public Offering and any future offerings we may conduct, from secured and unsecured borrowings from banks and other lenders and from any undistributed funds from operations. For the three months ended March 31, 2023, we raised $82.7 million of gross proceeds in our Follow-on Public Offering.
Generally, cash needs for items other than asset acquisitions are expected to be met from operations and use of proceeds from our Credit Facility, and cash needs for asset acquisitions and loan originations are funded by public offerings of our common stock, proceeds from real estate-related securities, real estate debt and debt financings. However, there may be a delay between the sale of our shares and our purchase of assets, which could result in a delay in the benefits to our stockholders, if any, of returns generated from our investment operations. Our target leverage ratio is approximately 30% to 50% of our gross real estate assets (measured using the fair market value of gross real estate assets, including equity in our securities portfolio), including property and entity-level debt, but excluding debt on the securities portfolio, although it may exceed this level during our offering stage. Our charter restricts the amount of indebtedness we may incur to 300% of our net assets, which approximates 75% of the aggregate cost of our investments, but does not restrict the amount of indebtedness we may incur with respect to any single investment. However, we may borrow in excess of this amount if such excess is approved by a majority of our independent directors, and disclosed to stockholders in the next quarterly report, along with justification for such excess.
If we are unable to raise substantial funds we will make fewer investments resulting in less diversification in terms of the type, number and size of investments we make and the value of an investment in us will fluctuate with the performance of the specific assets we acquire. Further, weWe have certain fixed operating expenses, including certain expenses as a publicly offered REIT, regardless of whether we are able to raise substantial funds. Our inability to raise substantial funds would increase our fixed operating expenses as a percentage of gross income, reducing our net income and limiting our ability to make distributions.
Our operating expenses include, among other things, stockholder servicing fees we pay to the Dealer Manager, legal, audit and valuation expenses, federal and state filing fees, printing expenses, administrative fees, transfer agent fees, marketing and distribution expenses and fees related to acquiring, financing, appraising and managing our properties. We do not have any office or personnel expenses as we do not have any employees. We may reimburse the Advisor for certain out-of-pocket expenses in connection with our operations and we did not have any cost to reimburse for the three months ended March 31, 2022.2023. The Advisor has advanced all of our organization and offering expenses on our behalf (other than upfront selling commissions, dealer manager fees and stockholder servicing fees) through the first anniversary of the commencement of the Initial Public Offering. These expenses include legal, accounting, printing, mailing and filing fees and expenses, due diligence expenses of participating broker-dealers supported by detailed and itemized invoices, costs in connection with preparing sales materials, design and website expenses, fees and expenses of our transfer agent, fees to attend retail seminars sponsored by participating broker-dealers and reimbursements for customary travel, lodging and meals, but exclude selling commissions, dealer manager fees and stockholder servicing fees. We willagreed to reimburse the Advisor for all such advanced expenses it incurred in 60 equal monthly installments commencing on the earlier of the date the Company'sour NAV reaches $1.0 billion or January 31, 2023. Our NAV reached $1.0 billion in October 2021. For purposes of calculating our NAV, the organization and offering expenses paid by the Advisor are not recognized as expenses or as a component of equity and will not be reflected in our NAV until we reimbursethey are payable to the Advisor for these costs.Advisor.
As of March 31, 2022,2023, the Advisor and its affiliates had incurred organization and offering expenses on our behalf of $4.6 million. Organization costs of $1.1 million have been expensed as incurred and offering costs of $3.5 million are a
component of equity in the form of additional paid in capital. As of March 31, 2022,2023, we have not reimbursed the Advisor $1.1 million for such costs.
We elected to be taxed as a REIT under Sections 856 through 860 of the Code, commencing with our taxable year ended December 31, 2018 and intend to operate in a manner that will allow us to continue to qualify as a REIT. In order to maintain our qualificationqualifying for taxation as a REIT, we are requiredsubject to among other things,federal corporate income tax to the extent we distribute as dividends at least 90%less than 100% of our REIT taxable income determined without regard to the dividends-paid deduction and excluding(including any net capital gains,gains) to our stockholders and meet certain tests regarding the nature of our income and assets.
Credit Facility
On October 24, 2018, we entered into a credit agreement (the “Credit(“Credit Agreement”) with Wells Fargo Bank, National Association (“Wells Fargo”), as administrative agent and lead arranger. The Credit Agreement initially provided for aggregate commitments of up to $60.0 million for unsecured revolving loans, with an accordion feature that may increase the aggregate commitments to up to $500.0 million (the “Credit Facility”). On December 17, 2018 and June 11, 2019, we amended the Credit Agreement to increase the Credit Facility to $150.0 million and $210.0 million in aggregate commitments, respectively, with all other terms remaining the same. Loans outstanding under the Credit Agreement bear interest, at our Operating Partnership’s option, at either an adjusted base rate or an adjusted LIBOR rate, in each case, plus an applicable margin. The applicable margin ranges from 1.30% to 1.90% for borrowings at the adjusted LIBOR rate, in each case, based on the total leverage ratio of the Operating Partnership and its subsidiaries.
On September 30, 2021, we amended the Credit Agreement to increase the Credit Facility to $335.0 million in aggregate commitments, comprised of a $235.0 million revolving facility, and a senior delayed draw term loan facility in the aggregate amount of up to $100.0 million (the “DDTL Facility”). Loans under the DDTL Facility may be borrowed in up to three advances, each in a minimum amount of $30.0 million. The Credit Facility will terminate, and all amounts outstanding thereunder will be due and payable in full, on September 30, 2024 (the “Revolving Termination Date”), with two additional one-year extension options held by our Operating Partnership, including the payment of an extension fee of 0.125% of the aggregate commitment. The DDTL Facility will mature, and all amounts outstanding thereunder will be due and payable in full, on September 30, 2026.
On February 17, 2023, we amended our Credit Agreement to increase the Credit Facility to $455.0 million in aggregate commitments, comprised of a $321.0 million revolving facility and a delayed draw term loan facility of $134.0 million, with an accordion feature that may increase aggregate commitments up to $800.0 million. The Credit Facility will convert to SOFR effective May 1, 2023, with all other terms remaining the same.
Loans outstanding under the Credit Facility bear interest, at the Operating Partnership’s option, at either an adjusted base rate or an adjusted LIBOR rate, in each case, plus an applicable margin. The applicable margin ranges from 0.30% to 0.90% for Credit Facility borrowings for base rate loans, in each case, based on the total leverage ratio of the Operating Partnership and its subsidiaries. The applicable margin ranges from 1.30% to 1.90% for Credit Facility borrowings at the adjusted LIBOR rate, in each case, based on the total leverage ratio of the Operating Partnership and its subsidiaries. Loans outstanding under the DDTL Facility bear interest, at the Operating Partnership’s option, at either an adjusted base rate or an adjusted LIBOR rate, in each case, plus an applicable margin. The applicable margin ranges from 0.25% to 0.85% for DDTL Facility borrowings for base rate loans, in each case, based on the total leverage ratio of the Operating Partnership and its subsidiaries. The applicable margin ranges from 1.25% to 1.85% for DDTL Facility borrowings at the adjusted LIBOR rate, in each case, based on the total leverage ratio of the Operating Partnership and its subsidiaries. There is an unused fee of 0.15% if the usage is greater than or equal to 50% of the aggregate commitments and 0.25% of the usage is less than 50% of the aggregate commitments. There is a ticking fee on the DDTL Facility equal to 0.15% of the undisbursed portion of the DDTL Facility. An upfront fee of 40 basis points was payable at closing.
In July 2017, the Financial Conduct Authority (the authority that regulates LIBOR) announced it intends to stop compelling banks to submit rates for the calculation of LIBOR after 2021. The Alternative Reference Rates Committee has proposed that the Secured Overnight Financing Rate ("SOFR")SOFR is the rate that represents best practice as the alternative to USD-LIBOR for use in derivatives and other financial contracts that are currently indexed to USD-LIBOR. On April 3, 2023, the Financial Conduct Authority announced that it will compel the ICE Benchmark Administration, which is supervised by the Financial Conduct Authority, to publish an unrepresentative synthetic USD-LIBOR through September 30, 2024 for use in legacy contracts. The consequence of these developments cannot be entirely predicted but could include an increase in debt, derivatives, and the cost of our variable rate indebtedness.
As of March 31, 2022,2023, we had $270.0$190.5 million in borrowings and had outstanding accrued interest of $0.3 million.$3.2 million under the Credit Facility. For the three months ended March 31, 20222023 and 2021,2022, we incurred $0.8$2.7 million and $0.4$0.8 million, respectively, in interest expense onunder the Credit Facility.
As of March 31, 2022,2023, we arewere in compliance with all loan covenants with respect to the Credit Agreement.
Mortgages Payable
On November 8, 2019, we entered into a loan agreement ("Main Street Loan") secured by Main Street at Kingwood with Nationwide Life Insurance Company ("Nationwide") as the lender. The Mortgage Payable provides for an aggregate principal
amount of $48.0 million and will mature on December 1, 2026. Interest is accrued on the unpaid principal balance of the Main Street Loan at the rate of 3.15% per annum.
On May 13, 2021, we entered into an additional loan agreement secured by Tacara at Steiner Ranch (the "Tacara Loan") with Brighthouse Life Insurance as the lender. The Tacara Loan provides for an aggregate principal amount of $28.8 million and will mature on June 1, 2028. Interest is accrued on the unpaid principal balance of the Tacara Loan at the rate of 2.62% per annum.
On November 30, 2021, we entered into loan agreements secured by Signature at Hartwell (the “Hartwell Loans”, together with the Main Street Loan and Tacara Loan, the “Mortgages Payable”) with Allstate Insurance Company and American Heritage Life Insurance Company as the lenders. The Hartwell Loans provide for an aggregate principal amount of $29.5 million and mature on December 1, 2028. Interest is accrued on the unpaid principal balance of the Hartwell Loans at a rate of 3.01% per annum.Mortgages Payable
As of March 31, 2022,2023, we had $106.3$196.7 million in borrowings and $0.3 million in accrued interest outstanding under our Mortgages Payable.mortgages payable. For the three months ended March 31, 2022,2023, we incurred $0.8$1.5 million in interest expense related to our mortgages payable.
The following table summarizes our outstanding mortgages payable as of March 31, 2023 ($ in thousands): | | | | | | | | | | | | | | | | | | | | | | | | | | |
| Indebtedness | | Lender | | Interest Rate(1) | | Maturity Date | | Maximum Principal Amount |
| Fixed rate mortgages payable: | | | | | | | | |
| Main Street at Kingwood | | Nationwide Life Insurance Company | | 3.15% | | 12/01/26 | | $ | 48,000 | |
| Tacara Steiner Ranch | | Brighthouse Life Insurance | | 2.62% | | 06/01/28 | | 28,750 | |
| Signature at Hartwell | | Allstate/American Heritage | | 3.01% | | 12/01/28 | | 29,500 | |
| GFI Grocery Anchored Portfolio | | Nationwide/Amerant/Synovus | | 2.98% - 3.40% | | Various | | 69,599 | |
| Total fixed rate mortgages payable | | | | | | | | 175,849 | |
| Variable rate mortgage payable: | | | | | | | | |
| CASA Nord Portfolio | | Nyrkredit Realkredit | | C + 0.70%(2) | | 12/31/32 | | 20,804 | |
| Total mortgages payable | | | | | | | | 196,653 | |
| Deferred financing costs, net | | | | | | | | (840) | |
| Discount on assumed mortgage notes | | | | | | | | (6,974) | |
| Mortgages payable, net | | | | | | | | $ | 188,839 | |
(1) The term "C" refers to the relevant floating benchmark rates, which is the three-month Copenhagen Interbank Offered Rate ("CIBOR") for the CASA Nord portfolio mortgage payable.
(2) CASA Nord entered into an interest rate swap on January 3, 2023, which fixed the rate at 3.18%.
Note Payable
We finance the acquisition of certain mortgage loans through the use of "note-on-note" transactions. The notes bear interest based on competitive market rates determined at the time of issuance. The notes involve leverage risk and also the risk that the market value of the collateral will decline below the amount of the funding advanced. As of March 31, 2023, we had one note outstanding with Capital One.
As of March 31, 2023, we had $69.3 million in principal outstanding on the note as well as $0.2 million in accrued interest outstanding. Interest expense incurred for the three months ended March 31, 2023 was $1.1 million based on a rate of SOFR + 1.65%.
Cash Flows
The following table provides a breakdown of the net change in our cash and cash equivalents and restricted cash for the three months ended March 31, 20222023 and 20212022 ($ in thousands): | | | Three Months Ended
March 31, | | Three Months Ended March 31, |
| | 2022 | | 2021 | | 2023 | | 2022 |
| Cash flows provided by operating activities | Cash flows provided by operating activities | | $ | 23,612 | | | $ | 5,924 | | Cash flows provided by operating activities | | $ | 17,097 | | | $ | 23,612 | |
| Cash flows used in investing activities | Cash flows used in investing activities | | (289,904) | | | (12,988) | | Cash flows used in investing activities | | (44,913) | | | (289,904) | |
| Cash flows provided by financing activities | Cash flows provided by financing activities | | 409,294 | | | 49,243 | | Cash flows provided by financing activities | | 20,234 | | | 409,294 | |
| Net increase in cash and cash equivalents and restricted cash | | $ | 143,002 | | | $ | 42,179 | | |
| Net (decrease) increase in cash and cash equivalents and restricted cash | | Net (decrease) increase in cash and cash equivalents and restricted cash | | $ | (7,582) | | | $ | 143,002 | |
Cash flows provided by operating activities increased $17.7decreased $6.5 million during the three months ended March 31, 20222023 compared to the corresponding period in 2021.2022. The increasedecrease was due to additional cash flows froma decrease in the operationschange in accounts payable, accrued expenses, and other liabilities of our investments in real estate as a result of$8.0 million offset by growth in the size of our portfolio.
Cash flows used in investing activities increased 276.9decreased $245.0 million during the three months ended March 31, 20222023 compared to the corresponding period in 20212022 due primarily to a $125.2$118.5 million increasedecrease in fundings related to the acquisitionacquisitions of real estate investments, a decrease in loan originationoriginations and fundings of $93.1$90.2 million, allocations toand reduced purchases of real estate debt of $45.9 million and an increase in net purchase and sale activity on our real-estate related securities$25.6 million.
Cash flows provided by financing activities decreased by $389.1 million during the three months ended March 31, 2022.
Cash flows provided by financing activities increased by 360.1 million during the three months ended March 31, 20222023 compared to the corresponding period in 20212022 primarily due to a $145.7$265.9 million and $104.2 million increasedecrease in proceeds from the issuance of common stock and subscriptions received in advance, respectively, along with a decrease in proceeds from the sale of loan participations of $47.8 million, a decrease in net increase in borrowings on the Credit Facility of $67.0$31.5 million, and proceeds from the sale of a loan participation of $47.8 million, offset by an increase in common stock repurchases of $5.4 million in distributions paid to stockholders.$38.7 million.
Funds from Operations and Adjusted Funds from Operations
We believe funds from operations (“FFO”) is a meaningful supplemental non-GAAP operating metric, which should be considered along with, but not as an alternative to, net income (loss) and cash provided by operating activities as a measure of operating performance. Our consolidated financial statements are presented under historical cost accounting which, among other things, requires depreciation of real estate investments to be calculated on a straight-line basis. As a result, our operating results imply that the value of our real estate investments will decrease evenly over a set time period. However, we believe that the value of real estate investments will fluctuate over time based on market conditions and as such, depreciation under historical cost accounting may be less informative. FFO is a standard REIT industry metric defined by the National Association of Real Estate Investment Trusts (“NAREIT”).
FFO, as defined by NAREIT and presented below, is calculated as net income or loss (computed in accordance with GAAP), excluding gains or losses from sales of depreciable real property and impairment write-downs on depreciable real property, plus real estate-related depreciation and amortization.
We also believe that Adjusted FFO (“AFFO”) is a meaningful supplemental non-GAAP disclosure of our operating results which should be considered along with, but not as an alternative to, net income (loss) and cash provided by operating activities as a measure of operating performance. AFFO further adjusts FFO in order for our operating results to reflect the specific characteristics of our business by adjusting for items we believe are not related to our core operations. Our adjustments to FFO to arrive to AFFO include straight-line rental income, amortization of above-and below-market lease intangibles, amortization of deferred financing costs and mortgage discount, organization costs, unrealized gains or losses from changes in fair value of real estate-related securities and real estate debt, unrealized loss on commercial mortgage loans and note payable, amortization of restricted stock awards and unrealized loss or income from investments in international affiliated funds. AFFO is not defined by NAREIT and our calculation of AFFO may not be comparable to the disclosures made by other REITs.
The following table presents a reconciliation of net income (loss) under GAAP to FFO and to AFFO ($ in thousands): | | | | Three Months Ended
March 31, | | | Three Months Ended March 31, |
| | | 2022 | | 2021 | | | 2023 | | 2022 |
| Net (loss) income | | $ | (7,784) | | | $ | 2,830 | | |
| Net loss | | Net loss | | $ | (3,345) | | | $ | (7,784) | |
| Adjustments: | Adjustments: | | | Adjustments: | | |
| Real estate depreciation and amortization | Real estate depreciation and amortization | | 12,367 | | | 5,484 | | Real estate depreciation and amortization | | 21,260 | | | 12,367 | |
| Amount attributable to non-controlling interests for above adjustments | Amount attributable to non-controlling interests for above adjustments | | (33) | | | — | | Amount attributable to non-controlling interests for above adjustments | | (91) | | | (33) | |
| Funds from Operations attributable to common stockholders | Funds from Operations attributable to common stockholders | | 4,550 | | | 8,314 | | Funds from Operations attributable to common stockholders | | 17,824 | | | 4,550 | |
| Straight-line rental income | Straight-line rental income | | (617) | | | (304) | | Straight-line rental income | | (1,301) | | | (617) | |
| Amortization of above-and-below market lease intangibles | Amortization of above-and-below market lease intangibles | | (669) | | | (198) | | Amortization of above-and-below market lease intangibles | | (1,029) | | | (669) | |
| Unrealized loss (gain) from changes in fair value of real estate-related securities | | 7,018 | | | (1,773) | | |
| Amortization of deferred financing costs | | Amortization of deferred financing costs | | 264 | | | — | |
| Amortization of mortgage discount | | Amortization of mortgage discount | | 310 | | | — | |
| Unrealized (gain) loss from changes in fair value of real estate-related securities | | Unrealized (gain) loss from changes in fair value of real estate-related securities | | (3,716) | | | 7,018 | |
| Unrealized loss from changes in fair value of real estate debt | Unrealized loss from changes in fair value of real estate debt | | 702 | | | — | | Unrealized loss from changes in fair value of real estate debt | | 403 | | | 702 | |
| | Unrealized loss on commercial mortgage loans | | Unrealized loss on commercial mortgage loans | | 949 | | | — | |
| Unrealized loss on note payable | | Unrealized loss on note payable | | 30 | | | — | |
| Amortization of restricted stock awards | Amortization of restricted stock awards | | 93 | | | 17 | | Amortization of restricted stock awards | | 53 | | | 93 | |
| Unrealized income from investment in international affiliated funds | | (277) | | | (438) | | |
| Unrealized loss (income) from investments in international affiliated funds | | Unrealized loss (income) from investments in international affiliated funds | | 1,717 | | | (277) | |
| Adjusted Funds from Operations attributable to stockholders | Adjusted Funds from Operations attributable to stockholders | | $ | 10,800 | | | $ | 5,618 | | Adjusted Funds from Operations attributable to stockholders | | $ | 15,504 | | | $ | 10,800 | |
FFO and AFFO should not be considered to be more relevant or accurate than the current GAAP methodology in calculating net income (loss) or in evaluating our operating performance. In addition, FFO and AFFO should not be considered as alternatives to net income (loss) as indications of our performance or as alternatives to cash flows from operating activities as indications of our liquidity, but rather should be reviewed in conjunction with these and other GAAP measurements. Further, FFO and AFFO are not intended to be used as liquidity measures indicative of cash flow available to fund our cash needs, including our ability to make distributions to our stockholders.
Distribution Policy
We intend to distribute sufficient income so that we satisfy the requirements for qualification as a REIT. In order to qualify as a REIT, we are required to distribute 90% of our annual REIT taxable income, determined without regard to the dividends-paid deduction and excluding net capital gains, to our stockholders. Our distribution policy is set by our board of directors and is subject to change based on available cash flows. We cannot guarantee the amount of distributions paid, if any. Our stockholders will not be entitled to receive a distribution if the shares are repurchased prior to the applicable time of the record date. In connection with a distribution to our stockholders, our board of directors approves a quarterly distribution for a certain dollar amount for each class of our common stock. We then calculate each stockholder’s specific distribution amount for the quarter using applicable record and declaration dates, and the distributions begin to accrue on the date we admit our stockholders.date.
We initially established monthly record dates for quarterly distributions to stockholders of record as of the last day of each applicable month typically payable within 30 days following month end. On January 17, 2020, our board of directors amended ourOur distribution policy to reflect that we intendreflects our intention to pay distributions monthly, rather than quarterly going forward, subject to the discretion of the board of directors. The net distribution varies for each class based on the applicable stockholder servicing fee and advisory fee, which is deducted from the monthly distribution per share and paid directly to the applicable distributor.recipient.
Distributions
Based on theWe declare monthly record dates established by the boarddistributions for each class of directors, we accrue for distribution on a monthly basis. As of March 31, 2022, we accrued $6.8 million for March 2022 in Distribution Payable on the Consolidated Balance Sheets.
For the three months ended March 31, 2022 and 2021, we declared andour common stock which are generally paid distributions in the amount of $17.5 million and $6.3 million, respectively.
within 30 days after month-end. Each class of our common stock received the same gross distribution per share, which was $0.2077$0.2128 per share for the three months ended March 31, 2022.2023. The net distribution varies for each class based on the applicable advisorystockholder servicing fee and stockholder servicingadvisory fee, which are deducted from the monthly distribution per share.
The following tables detail the aggregate distribution declared and paid for each of our share classes for the three months ended March 31, 2022:2023: | | | Three Months Ended March 31, 2022 | | Three Months Ended March 31, 2023 |
| | Class T Common Stock | | Class S Common Stock | | Class D Common Stock | | Class I Common Stock | | Class N Common Stock | | Class T Common Stock | | Class S Common Stock | | Class D Common Stock | | Class I Common Stock | | Class N Common Stock |
| Gross distribution per share of common stock | Gross distribution per share of common stock | | $ | 0.2077 | | | $ | 0.2077 | | | $ | 0.2077 | | | $ | 0.2077 | | | $ | 0.2077 | | Gross distribution per share of common stock | | $ | 0.2128 | | | $ | 0.2128 | | | $ | 0.2128 | | | $ | 0.2128 | | | $ | 0.2128 | |
| Advisory fee per share of common stock | Advisory fee per share of common stock | | (0.0127) | | | (0.0125) | | | (0.0127) | | | 0.0127 | | | (0.0068) | | Advisory fee per share of common stock | | (0.0376) | | | (0.0371) | | | (0.0376) | | | (0.0376) | | | (0.0209) | |
| Stockholder servicing fee per share of common stock | Stockholder servicing fee per share of common stock | | (0.0094) | | | (0.0093) | | | (0.0028) | | | — | | | — | | Stockholder servicing fee per share of common stock | | (0.0268) | | | (0.0267) | | | (0.0077) | | | — | | | — | |
| Net distribution per share of common stock | Net distribution per share of common stock | | $ | 0.1856 | | | $ | 0.1859 | | | $ | 0.1922 | | | $ | 0.2204 | | | $ | 0.2009 | | Net distribution per share of common stock | | $ | 0.1484 | | | $ | 0.1490 | | | $ | 0.1675 | | | $ | 0.1752 | | | $ | 0.1919 | |
For the three months ended March 31, 2023 and 2022, we declared and paid distributions of $30.4 million and $17.5 million, respectively. The March 2023 distribution was declared and paid in April 2023.
The following tables summarizes our distributions declared and paid during the three months ended March 31, 20222023 and 20212022 ($ in thousands): | | | | | | | | | | | | | | | | | | | | | | | |
| Three Months Ended March 31, 2023 | | Three Months Ended March 31, 2022 |
| Amount | | Percentage | | Amount | | Percentage |
| Distributions | | | | | | | |
| Paid in cash | $ | 16,544 | | | 54.49 | % | | $ | 10,787 | | | 61.56 | % |
| Reinvested in shares | 13,818 | | | 45.51 | % | | 6,736 | | | 38.44 | % |
| Total distributions | $ | 30,362 | | | 100.00 | % | | $ | 17,523 | | | 100.00 | % |
| Sources of distributions | | | | | | | |
| Cash flows from operating activities | $ | 17,097 | | | 56.31 | % | | $ | 17,523 | | | 100.00 | % |
| Debt and financing proceeds | 13,265 | | | 43.69 | % | | — | | | — | % |
| Total sources of distributions | $ | 30,362 | | | 100.00 | % | | $ | 17,523 | | | 100.00 | % |
| Total cash flows from operating activities | $ | 17,097 | | | | | $ | 23,612 | | | |
| | | | | | | |
| | | | | | | | | | | | | | | | | | | | | | | |
| | Three Months Ended
March 31, 2022 | | Three Months Ended
March 31, 2021 |
| Amount | | Percentage | | Amount | | Percentage |
| Distributions | | | | | | | |
| Paid in cash | $ | 10,787 | | | 61.56 | % | | $ | 5,503 | | | 87.36 | % |
| Reinvested in shares | 6,736 | | | 38.44 | % | | 796 | | | 12.64 | % |
| Total distributions | $ | 17,523 | | | 100.00 | % | | $ | 6,299 | | | 100.00 | % |
| Sources of distributions | | | | | | | |
| Cash flows from operating activities | $ | 17,523 | | | 100.00 | % | | $ | 5,924 | | | 94.05 | % |
| Debt and financing proceeds | — | | | — | % | | 375 | | | 5.95 | % |
| Total sources of distributions | $ | 17,523 | | | 100.00 | % | | $ | 6,299 | | | 100.00 | % |
| Total cash flows from operating activities | $ | 23,612 | | | | | $ | 5,924 | | | |
| | | | | | | |
Net Asset Value
Our board of directors, including a majority of our independent directors, has adopted valuation guidelines that contain a comprehensive set of methodologies to be used in connection with the calculation of our NAV. The overarching principle of these guidelines is to produce a valuation that represents a fair and accurate estimate of the value of our investments or the price that would be received for our investments in an arm’s-length transaction between market participants, less our liabilities. These valuation guidelines are largely based upon standard industry practices used by private, open-end real estate funds and are administered by the Advisor.
As a public company, we are required to issue financial statements based on historical cost in accordance with GAAP, which are subject to an independent audit. To calculate our NAV for purposes of establishing a purchase and repurchase price for our shares, we have adopted a model that adjusts the value of our assets from historical cost to fair value in accordance with the GAAP principles set forth in FASB Accounting Standards Codification Topic 820, Fair Value Measurements and Disclosures. However, our valuation procedures and our NAV are not subject to independent audit. Our NAV may differ from equity reflected on our audited financial statements, even if we are required to adopt a fair value basis of accounting for GAAP financial statement purposes in the future. Because these fair value calculations involve significant professional judgment in the application of both observable and unobservable attributes, the calculated fair value of our assets may differ from their actual realizable value or future fair value. Furthermore, no rule or regulation requires that we calculate NAV in a certain way. While we believe our NAV calculation methodologies are consistent with standard industry principles, there is no established practice among public REITs, whether listed or not, for calculating NAV in order to establish a purchase and repurchase price. As a result, other public REITs may use different methodologies or assumptions to determine NAV.
The following valuation methods are used for purposes of calculating our NAV:
•Investments in real property are valued by our independent valuation advisor, SitusAMC Real Estate Valuation Services, LLC (“SitusAMC”), using the income approach’s discounted cash flow method. The discounted cash flow method takes into consideration all contractual rent payments over the life of the lease term offset by any capitalized expenditures. SitusAMC may supplement the discounted cash flow analysis with a sales comparison approach and the income approach’s direct capitalization method, but typically reconciles exclusively to the discounted cash flow method. Following the table below that sets forth our NAV calculation is a sensitivity analysis for our investments in real property.
•Investments in commercial mortgage loans are valued by SitusAMC using the income approach’s discounted cash flow method. When used to value commercial mortgage loans, this method discounts the scheduled monthly interest payments at a market discount rate. The market discount rate takes into consideration a number of factors specific to the property (remaining term, loan-to-value ratio and quality of property) and market (capital market flows, current Treasury rates and quoted lending spreads).
•Investments in International Affiliated Funds are included in our NAV at the value reported by each funds’ manager, which is calculated in accordance with the manager’s valuation policy. Investments in the International Affiliated Funds are generally valued using a discounted cash flow analysis supplemented by a direct capitalization analysis as provided by an independent third party.
•Investments in real estate-related securities are valued on the basis of publicly available market quotations or at fair value determined in accordance with GAAP.
•Investments in real estate debt consist of CMBS. We calculateclassify CMBS as trading securities and the Advisor generally values such CMBS on the basis of publicly available market quotations or at fair value determined in accordance with GAAP. We generally determine the fair value of our investments in real estate debt by utilizing third-party service providers whenever available.
•Liabilities include the fees payable to the Advisor and the Dealer Manager, accounts payable, accrued operating expenses, property-level mortgages, any portfolio-level credit facilities and other liabilities. Other than property-level mortgages, we include the cost basis of our liabilities as part of NAV, which approximates fair value. These carrying amounts are meant to reasonably approximate fair value due to the liquid and short-term nature of the instruments. We include as part of NAV the fair value of our property-level mortgages, which are valued quarterly by SitusAMC using the income approach’s discounted cash flow method.
At the beginning of each calendar year, the Advisor develops a valuation plan with the objective of having each of our wholly owned properties valued each quarter by an appraisal, except for newly acquired properties as described below. Our independent valuation advisor relies in part on property-level information provided by the Advisor, including (1) historical and projected operating revenues and expenses of the property, (2) lease agreements with respect to the property and (3) information regarding recent or planned capital expenditures. Appraisals are performed in accordance with the Code of Professional Ethics of the Appraisal Institute and the Uniform Standards of Professional Appraisal Practices of The Appraisal Foundation, or the similar industry standards for the country where the property appraisal is conducted. Each appraisal must be reviewed, approved and signed by an individual with the professional designation of MAI (Member of the Appraisal Institute) or similar designation or, for international appraisals, a public or other certified expert for real estate valuations. Our independent valuation advisor generally performs the appraisals, but in its discretion, may engage other independent valuation firms to provide appraisals of certain of our properties. Any appraisal provided by a firm other than our independent valuation advisor is performed in accordance with our valuation guidelines and is not incorporated into the calculation of our NAV until our independent valuation advisor has confirmed the reasonableness of such appraisal.
Wholly owned properties and joint ventures may be valued more frequently than quarterly under certain circumstances. If, in the opinion of the Advisor an event becomes known to the Advisor (including through communication with our independent valuation advisor) that is likely to have any material impact on previously provided estimated values of the affected properties, the Advisor will notify our independent valuation advisor. If in the opinion of our independent valuation advisor, such event is likely to have an impact on a previously provided value of the affected properties, our independent valuation advisor will recommend intra-quarter valuation adjustments that will be incorporated into our NAV calculation. For example, an unexpected termination or renewal of a material lease, a material change in vacancies, an unanticipated structural or environmental event at a property or capital market events may cause the value of a wholly owned property to change materially. Once the independent valuation advisor has communicated the adjusted estimate of property value to the Advisor, the Advisor will cause such adjusted value to be included in our monthly NAV calculation. Any such adjustments will be estimates of the market impact of material events to the appraised value of the property, based on assumptions and judgments that may or may not prove to be correct and may also be based on limited information readily available at that time. In general, we expect that any estimates of value or interim appraisals will be performed as soon as possible after a determination by the Advisor that a material change has occurred and the financial effects of such change are quantifiable by the independent valuation advisor. However, rapidly changing market conditions or material events may not be immediately reflected in our NAV. The resulting potential disparity in our NAV may inure to the benefit of stockholders whose shares are repurchased or new purchasers of our common stock, depending on whether our published NAV per share infor such class is overstated or understated.
In accordance with the valuation guidelines, our fund administrator calculates our NAV per share for each class of our common stock as of the last calendar day of each month, using a process that have been approvedreflects several components (each as described above), including the estimated fair value of (1) each of our properties based upon individual appraisal reports provided periodically by third-party independent valuation firms and reviewed by our boardindependent valuation advisor, (2) our real estate-related assets for which third-party market quotes are available, (3) our other real estate-related assets, if any, and (4) our other assets and liabilities. The NAV per share for our share classes may differ because stockholder servicing fees allocable to a specific class of directors. shares are only included in the NAV calculation for that class and the advisory fee allocable to the Class N shares differs from the advisory fee allocable to the other share classes.
At the end of each month, before taking into consideration additional issuances of shares of capital stock, share repurchases or class-specific expense accruals for that month, any change in our aggregate NAV (whether an increase or decrease) is allocated among each class of shares based on each class’s relative percentage of the previous aggregate NAV plus issuances of shares that were effective on the first calendar day of such month. The NAV calculation is available generally within 15 calendar days after the end of the applicable month. Changes in our monthly NAV include, without limitation, accruals of our net portfolio income, interest expense, the advisory fee, distributions, unrealized/realized gains and losses on assets, any applicable organization and offering costs and any expense reimbursements. Changes in our monthly NAV also includes material non-recurring events, such as capital expenditures and material property acquisitions and dispositions occurring during the month. On an ongoing basis, the Advisor will adjust the accruals to reflect actual operating results and the outstanding receivable, payable and other account balances resulting from the accumulation of monthly accruals for which financial information is available.
We believereimburse the Advisor for any organization and offering expenses that it incurs on our behalf as and when incurred. These expenses include legal, accounting, printing, mailing and filing fees and expenses, due diligence expenses of participating broker-dealers supported by detailed and itemized invoices, costs in connection with preparing sales materials, design and website expenses, fees and expenses of our transfer agent, fees to attend retail seminars sponsored by participating broker-dealers and reimbursements for customary travel, lodging and meals, but exclude upfront selling commissions, dealer manager fees and stockholder servicing fees. After the termination of each public offering, the Advisor has agreed to reimburse us to the extent that the organization and offering expenses that we incur with respect to that offering exceed 15% of the gross proceeds from such offering. In connection with our initial public offering, the Advisor advanced $4.6 million of our organization and offering expenses on our behalf from our inception through December 2018. We will reimburse the Advisor for these organization and offering expenses ratably over the 60 months following the earlier of the date our NAV first reaches $1 billion or January 31, 2023, which occurred on October 31, 2021. Such expenses will not be deducted from our NAV until they are payable to the Advisor.
Following the aggregation of the net asset values of our investments, the addition of any other assets (such as cash on hand) and the deduction of any other liabilities, our fund administrator incorporates any class-specific adjustments to our NAV, including additional issuances and repurchases of our common stock and accruals of class-specific stockholder servicing fees and advisory fees. For each applicable class of shares, each of the stockholder servicing fee and the advisory fee is calculated as a meaningful supplemental non-GAAP operating metric. percentage of the aggregate NAV for such class of shares. The declaration of distributions reduces the NAV for each class of our common stock in an amount equal to the accrual of our liability to pay any such distribution to our stockholders of record of each class. NAV per share for each class is calculated by dividing such class’s NAV at the end of each month by the number of shares outstanding for that class at the end of such month.
The purchase price per share for each class of our common stock will generally equal our prior month’s NAV per share, as determined monthly, plus applicable selling commissions and dealer manager fees. Our NAV for each class of shares is based on the net asset values of our investments (including real estate-related securities, real estate debt, commercial mortgage loans and international affiliate funds), the addition of any other assets (such as cash on hand) and the deduction of any liabilities and stockholder servicing fees applicable to such class of shares.
The following table provides a breakdown of the
major components of our NAV as of March 31, 20222023 ($ and shares in thousands, except per share data): | | | | | | | | |
| Components of NAV | | March 31, 20222023 |
| Investments in real property | | $ | 1,394,0292,222,739 | |
| Investments in real estate-related securities | | 102,734130,758 | |
| Investments in real estate-related debt | | 110,226 | |
| Investments in international affiliated funds | | 129,996126,205 | |
| Investments in commercial mortgage loans | | 185,834 | |
Investments in real estate debt | | 59,357170,154 | |
| Cash and cash equivalents | | 116,97141,907 | |
| Restricted cash | | 156,60725,932 | |
| Other assets | | 7,49410,996 | |
| Debt obligations | | (373,860)(436,158) | |
| Subscriptions received in advance | | (156,146)(24,657) | |
| Other liabilities | | (27,355)(98,850) | |
Stockholder servicing fees payable the following month(1) | | (413)(599) | |
Non-controlling interests in joint ventureventures | | (1,191)(5,366) | |
| Net Asset Value | | $ | 1,594,0572,273,287 | |
| Net Asset Value attributable to preferred stock | | $ | 129 | |
| Net Asset Value attributable to common stockholders | | $ | 1,593,9282,273,158 | |
| Number of outstanding shares of common stock | | 122,538182,465 | |
(1)Stockholder servicing fees only apply to Class T, Class S and Class D shares. For purposes of NAV we recognize the stockholder servicing fee as a reduction of NAV on a monthly basis as such fee is paid. Under GAAP, we accrue the full cost of the stockholder servicing fee as an offering cost at the time we sell Class T, Class S and Class D shares. As of March 31, 2022,2023, we have accrued under GAAP approximately $30.2$47.0 million of stockholder servicing fees payable to the Dealer Manager related to the Class T, Class S and Class D shares sold.
The following table provides a breakdown of our total NAV and NAV per share by share class as of March 31, 20222023 ($ in thousands, except per share data): | | NAV Per Share | NAV Per Share | | Class T Shares | | Class S Shares | | Class D Shares | | Class I Shares | | Class N Shares | | Total | NAV Per Share | | Class T Shares | | Class S Shares | | Class D Shares | | Class I Shares | | Class N Shares | | Total |
| Net asset value attributable to common stockholders | Net asset value attributable to common stockholders | | $ | 153,254 | | | $ | 395,604 | | | $ | 81,706 | | | $ | 565,763 | | | $ | 397,601 | | | $ | 1,593,928 | | Net asset value attributable to common stockholders | | $ | 220,522 | | | $ | 566,988 | | | $ | 99,565 | | | $ | 1,002,911 | | | $ | 383,172 | | | $ | 2,273,158 | |
| Number of outstanding shares | Number of outstanding shares | | 11,850 | | | 30,913 | | | 6,301 | | | 43,743 | | | 29,731 | | | 122,538 | | Number of outstanding shares | | 17,750 | | | 46,145 | | | 7,993 | | | 80,846 | | | 29,731 | | | 182,465 | |
| NAV per shares as of March 31, 2022 | | $ | 12.93 | | | $ | 12.80 | | | $ | 12.97 | | | $ | 12.93 | | | $ | 13.37 | | | |
| NAV per share as of March 31, 2023 | | NAV per share as of March 31, 2023 | | $ | 12.42 | | | $ | 12.29 | | | $ | 12.46 | | | $ | 12.41 | | | $ | 12.89 | | |
Set forth below are the weighted averages of the key assumptions in the discounted cash flow methodology used in the March 31, 20222023 valuations, based on property types. Once we own more than one retail property, we will include the key assumptions for such property types. | | Property Type | Property Type | | Discount Rate | | Exit Capitalization Rate | Property Type | | Discount Rate | | Exit Capitalization Rate |
| Industrial | Industrial | | 5.75% | | 4.61% | Industrial | | 6.56% | | 5.43% |
| Multifamily | Multifamily | | 6.49 | | 4.58 | Multifamily | | 6.45 | | 4.88 |
| Office | Office | | 6.86 | | 6.27 | Office | | 7.37 | | 6.67 |
| Healthcare | Healthcare | | 7.27 | | 6.13 | Healthcare | | 7.08 | | 6.03 |
| Retail | | Retail | | 6.44 | | 5.60 |
| Self-Storage | | Self-Storage | | 7.28 | | 5.35 |
| Single-Family Housing | Single-Family Housing | | 7.11 | | 4.91 | Single-Family Housing | | 7.00 | | 5.25 |
These assumptions are determined by our independent valuation advisor. A change in these assumptions would impact the calculation of the value of our property investments. For example, assuming all other factors remain unchanged, the changes
listed below would result in the following effects on our investment values: | | Input | Input | | Hypothetical
Change | | Industrial
Investment
Values | | Multifamily
Investment
Values | | Office
Investment
Values | | Healthcare Investment Values | | Single Family Housing Investment Value | Input | | Hypothetical
Change | | Industrial
Investment
Values | | Multifamily
Investment
Values | | Office
Investment
Values | | Healthcare Investment Values | | Retail Investment Values | | Self-Storage Investment Values | | Single Family Housing Investment Values |
| Discount Rate | Discount Rate | | 0.25% decrease | | +2.04% | | +2.07% | | +1.99% | | +2.06% | | +1.66% | Discount Rate | | 0.25% decrease | | 2.02% | | 1.95% | | 1.98% | | 2.03% | | 1.94% | | 1.78% | | 2.03% |
| (weighted average) | (weighted average) | | 0.25% increase | | (1.99)% | | (1.96)% | | (1.91)% | | (1.98)% | | (2.14)% | (weighted average) | | 0.25% increase | | (2.01)% | | (1.95)% | | (1.89)% | | (1.98)% | | (1.90)% | | (1.98)% | | (2.03)% |
| Exit Capitalization Rate | Exit Capitalization Rate | | 0.25% decrease | | +4.19% | | +4.06% | | +2.73% | | +2.82% | | +3.15% | Exit Capitalization Rate | | 0.25% decrease | | 3.31% | | 3.49% | | 2.49% | | 2.99% | | 2.91% | | 3.17% | | 3.38% |
| (weighted average) | (weighted average) | | 0.25% increase | | (3.79)% | | (3.57)% | | (2.57)% | | (2.69)% | | (3.43)% | (weighted average) | | 0.25% increase | | (3.04)% | | (3.23)% | | (2.23)% | | (2.63)% | | (2.66)% | | (2.77)% | | (3.38)% |
The following table reconciles stockholders’ equity per our Consolidated Balance Sheets to our NAV ($ in thousands): | | | | | | | | |
| | March 31, 20222023 |
| Reconciliation of Stockholders’ Equity to NAV | | |
| Stockholders’ equity under US GAAP | | $ | 1,238,7061,839,974 | |
| Redeemable non-controlling interest | | 276360 | |
| Total partners' capital of Nuveen OP | | 1,238,9821,840,334 | |
| Adjustments: | | |
Organization and offering costs(1) | | 4,8803,316 | |
Accrued stockholder servicing fees(2) | | 30,19446,966 | |
Unrealized net real estate and real estate debt appreciation(3) | | 243,439 | |
Unrealized mortgage payable appreciation(4)
| | 1,784238,404 | |
Accumulated depreciation and amortization(5)(4) | | 81,846155,009 | |
| Straight-line rent receivable | | (7,068)(10,742) | |
| Net Asset Value | | $ | 1,594,0572,273,287 | |
| | |
(1)The Advisor and its affiliates agreed to advance organization and offering costs on our behalf through December 31, 2018 and had incurred organization and offering expenses of $4.6 million. Organization costs of $1.1 million are expensed and Offering costs of $3.5 million is a component of equity in the form of additional paid-in capital. For NAV, such costs will be recognized as a reduction to NAV as they are reimbursed over 60 months commencing on the earlier ofin October 2021, the date the NAV reachesreached $1.0 billion or Januarybillion. As of March 31, 2023.2023, we have reimbursed the Advisor $1.1 million for such costs.
(2) Accrued stockholder servicing fee represents the accrual for the full cost of the stockholder servicing fee for Class T, Class S and Class D shares. Under GAAP, we accrue the full cost of the stockholder servicing fee payable over the life of each share (assuming such share remains outstanding the length of time required to pay the maximum stockholder servicing fee) as an offering cost at the time we sold the shares. For purposes of NAV, we recognize the stockholder servicing fee as a reduction of NAV on a monthly basis as such fee is paid.
(3) Our investments in real estate are presented under historical cost in our GAAP consolidated financial statements. Additionally, our mortgage notes and revolving credit facility (collectively referred to as “Debt”) are presented at their carrying value in our GAAP consolidated financial statements. As such, any changes in the fair market value of our investments in real estate and Debt are not included in our GAAP results. For purposes of determining our NAV, our investments in real estate and our Debt are recorded at fair value.
(4) Our investments in mortgages payable are presented under historical cost in our GAAP consolidated financial statements. As such, any changes in the fair market value of our mortgages payable are not included in our GAAP results. For purposes of determining our NAV, our mortgages payable are recorded at fair value.
(5) In accordance with GAAP, we depreciate our investments in real estate and amortize certain other assets and liabilities. Such depreciation and amortization is not recorded for purposes of determining our NAV.
Limitations and Risks
As with any valuation methodology, our methodology is based upon a number of estimates and assumptions that may not be accurate or complete. Different parties with different assumptions and estimates could derive a different NAV per share. Accordingly, with respect to our NAV per share, we can provide no assurance that:
(1)a stockholder would be able to realize this NAV per share upon attempting to resell his or her shares;
(2)we would be able to achieve, for our stockholders, the NAV per share, upon a listing of our shares of common stock on a national securities exchange, selling our real estate portfolio, or merging with another company; or
(3)the NAV per share, or the methodologies relied upon to estimate the NAV per share, will be found by any regulatory authority to comply with any regulatory requirements.
Furthermore, the NAV per share was calculated as of a particular point in time. The NAV per share will fluctuate over time in response to, among other things, changes in real estate market fundamentals, capital markets activities and attributes specific to the properties and assets within our portfolio.
Critical Accounting Estimates
The preparation of the consolidated financial statements in accordance with GAAP involves significant judgements and assumptions and require estimates about matters that are inherently uncertain. These judgments affect our reported amounts of assets and liabilities and our disclosure of contingent assets and liabilities at the dates of the consolidated financial statements and the reported amounts of revenue and expenses during the reporting periods. With different estimates or assumptions, materially different amounts could be reported in our consolidated financial statements. Additionally, other companies may utilize different estimates that may impact the comparability of our results of operations to those of companies in similar businesses. We consider our accounting policies over investments in real estate and revenue recognition to be our critical accounting estimates. See Note 2 “Summary of Significant Accounting Policies” to the consolidated financial statements in this Quarterly Report on Form 10-Q for further descriptions of such critical accounting estimates along with other significant accounting policy disclosures.
Contractual Obligations
The following table aggregates our contractual obligations and commitments with payments due subsequent toafter March 31, 20222023 ($ in thousands): | | Obligations | Obligations | | Total | | Less than
1 year | | 1-3 Years | | 3-5 Years | | More than
5 Years | Obligations | | Total | | Less than
1 year | | 1-3 Years | | 3-5 Years | | More than
5 Years |
| Indebtedness | Indebtedness | | $ | 405,750 | | | $ | — | | | $ | 270,000 | | | $ | — | | | $ | 135,750 | | Indebtedness | | $ | 456,416 | | | $ | 293 | | | $ | 127,791 | | | $ | 204,280 | | | $ | 124,052 | |
| | Organization and offering costs | Organization and offering costs | | 4,880 | | | — | | | — | | | 1,301 | | | 3,579 | | Organization and offering costs | | 3,551 | | | 820 | | | 2,458 | | | 273 | | | — | |
Interest expense(1) | Interest expense(1) | | 33,351 | | | 6,649 | | | 13,297 | | | 11,046 | | | 2,359 | | Interest expense(1) | | 67,264 | | | 15,130 | | | 29,980 | | | 14,114 | | | 8,040 | |
Ground leases(2) | | Ground leases(2) | | 18,306 | | | 373 | | | 751 | | | 774 | | | 16,408 | |
| Total | Total | | $ | 443,981 | | | $ | 6,649 | | | $ | 283,297 | | | $ | 12,347 | | | $ | 141,688 | | Total | | $ | 545,537 | | | $ | 16,616 | | | $ | 160,980 | | | $ | 219,441 | | | $ | 148,500 | |
(1)Represents interest expense for our fixed and variable rate Mortgages Payablemortgages payable, note payable and Credit Facility, with the assumption that the Credit Facility is paid off at maturity. The weighted-average interest raterates on the Credit Facility and note payable for the three months ended March 31, 2022 was 1.32%.2023 were 5.82% and 6.18%, respectively.
(2) Represents minimum future payments for land under non-cancelable operating and finance leases at a number of our properties expiring in various years through 2070.
Off-Balance Sheet Arrangements
We have no off-balance sheet arrangements.
ItemITEM 3. Quantitative and Qualitative Disclosures About Market Risk.
Interest Rate Risk
We may beare exposed to interest rate changes primarily as a result of long-term debtrisk with respect to our variable-rate indebtedness used to maintain liquidity, fund capital expenditures and expand our investment portfolio and operations. Market fluctuationsAn increase in real estate financing may affect the availability and cost of funds needed to expand our investment portfolio.interest rates would directly result in higher interest expense costs. In addition, restrictions upon the availability of real estate financing or high interest rates for real estate loans could adversely affect our ability to dispose of real estate in the future. We may seek to limitmanage or mitigate our risk to the impactexposure of interest risk by utilizing a mix of fixed and floating rate changes on earningsfinancings with staggered maturities and cash flowsthrough interest rate protection agreements to fix or cap a portion of our variable rate debt. As of March 31, 2023, the outstanding principal balance of our variable rate indebtedness was $259.8 million and consisted of our Credit Facility and note payable, which is indexed to lower our overall borrowing costs. Weone-month U.S. Dollar-denominated LIBOR and one-month US Dollar-denominated SOFR, respectively.
may use derivative financial instruments to hedge exposuresThe fair market value of the Credit Facility is sensitive to changes in LIBOR. For the three months ended March 31, 2023, a 10% increase in the one-month U.S. denominated LIBOR would have resulted in increased interest ratesexpense of approximately $0.3 million. Similarly, due to the variable rate on loans securedour Credit Facility, a 100 basis point increase in LIBOR will reduce our net income by $0.5 million the three months ended March 31, 2023. Similarly, a 100 basis point decrease will increase our assets. Also, we are exposednet income by $0.5 million for the three months ended March 31, 2023.
The fair market value of the note payable is sensitive to credit, market and currency risk.changes in SOFR. For the three months ended March 31, 2023, a 10% increase in the one-month U.S. denominated SOFR would have resulted in increased interest expense of approximately $0.1 million. Similarly, due to the variable rate on our note payable, a 100 basis point increase in LIBOR will reduce our net income by $0.2 million the three months ended March 31, 2023. Similarly, a 100 basis point decrease will increase our net income by $0.2 million for the three months ended March 31, 2023.
Market Risk
Market risk is the adverse effect on the value of a financial instrument that results from a change in interest rates. The market risk associated with interest-rate contracts is managed by establishing and monitoring parameters that limit the types and degree of market risk that may be undertaken. With regard to variable rate financing, we assess our interest rate cash flow risk by continually identifying and monitoring changes in interest rate exposures that may adversely impact expected future cash flows and by evaluating hedging opportunities. We maintain risk management control systems to monitor interest rate cash flow risk attributable to both our outstanding and forecasted debt obligations as well as our potential offsetting hedge positions. While this hedging strategy is designed to minimize the impact on our net income and funds from operations from changes in interest rates, the overall returns on your investment may be reduced. Our board of directors has not yet established policies and procedures regarding our use of derivative financial instruments for hedging or other purposes. These risks have been heightened as a result of the COVID-19 pandemic.
Credit Risk
Credit risk is the failure of the counterparty to perform under the terms of the derivative contract. If the fair value of a derivative contract is positive, the counterparty will owe us, which creates credit risk for us. If the fair value of a derivative contract is negative, we will owe the counterparty and, therefore, do not have credit risk. We seek to minimize the credit risk in derivative instruments by entering into transactions with high-quality counterparties. We did not have derivatives as of March 31, 2022.2023.
Foreign Currency Risk
We may be exposed to currency risks related to our direct international investments includingalong with our investments in the International Affiliated Funds. We may seek to manage or mitigate our risk to the exposure of the effects of currency changes through the use of a wide variety of derivative financial instruments. We did not have derivatives as of March 31, 2022.
Interest Rate Risk
We are exposed to interest rate risk with respect to our variable-rate indebtedness, whereas an increase in interest rates would directly result in higher interest expense costs. We may seek to manage or mitigate our risk to the exposure of interest risk through interest rate protection agreements to fix or cap a portion of our variable rate debt. As of March 31, 2022, the outstanding principal balance of our variable rate indebtedness was $270.0 million and consisted of our Credit Facility, which is indexed to one-month U.S. Dollar-denominated LIBOR.
The fair market value of the Credit Facility is sensitive to changes in LIBOR. For the three months ended March 31, 2022, a 10% increase in the one-month U.S. denominated LIBOR would have resulted in increased interest expense of approximately $22,000. Similarly, due to the variable rate on our Credit Facility, a 100 basis point increase in LIBOR will reduce our net income by $0.6 million and a similar basis point decrease will increase our net income by $0.6 million.
COVID-19 Developments
As of March 31, 2022, the 7-day averages of COVID-19 cases and deaths are 111,400 and 1,900, respectively. These numbers are small fractions of their January 2021 highs, 256,000 and 3,500. As of March 31, 2022, 214 million American adults have received at least one dose of the COVID-19 vaccine and 220 million have received a COVID-19 vaccine booster shot. Mitigation strategies have almost entirely been rolled back in most states, though some strategies remain in place to control the spread of the Omicron variant.
We experienced a year of historically strong growth in 2021, fueled by a combination of unprecedented fiscal and monetary stimulus and a once-in-a-century global economic reopening. Growth was suppressed mainly by the unexpected surge in COVID-19 over the summer of 2021 that interrupted the global recovery and exacerbated issues with products reaching consumers. We anticipate that many factors contributing positively to growth will fade in 2022, but we believe that the strong consumer demand and the inflation they helped create remain as we head into a new year. While the positive demand shock of 2021 has receded, it has not gone away entirely. The hole left by expiring stimulus is filled by robust wage growth in a prematurely tight labor market. For the first time in recent history, workers have a clear upper hand over employers in negotiations over terms of employment. We think the economic benefits of this realignment outweigh the potential costs.
Because our properties are located in the United States, the COVID-19 pandemic will impact our properties and operating results to the extent that its continued spread within the United States reduces occupancy, increases the cost of operation or results in limited hours or necessitates the closure of such properties. In addition, measures taken in response to the COVID-19 pandemic may negatively impact the ability of our properties to continue to obtain necessary goods and services or provide2023.
adequate staffing, which may also adversely affect our properties and operating results. Similarly, our investments in the International Affiliated Funds may be negatively impacted by the impact of the COVID-19 pandemic on the foreign countries where their investments are located.
The extent to which the COVID-19 pandemic may impact our investments and operations will depend on future developments, which are highly uncertain and cannot be predicted with confidence, including the spread of new variants of COVID-19 and new information that may emerge concerning the severity of the coronavirus and the actions taken to contain the coronavirus or treat its impact. To the extent our investments and operating results are impacted, this may impact our liquidity and need for capital resources within the next twelve months.
ItemITEM 4. Controls and Procedures.
Evaluation of Disclosure Controls and Procedures
An evaluation of the effectiveness of the design and operation of our “disclosure controls and procedures” (as defined in Rule 13a-15(e) under the Securities Exchange Act of 1934, as amended (the “Exchange Act”)), as of the end of the period covered by this Quarterly Report on Form 10-Q, was made under the supervision and with the participation of our management, including our Chief Executive Officer (“CEO”) and Chief Financial Officer (“CFO”). Based upon this evaluation, our CEO and CFO have concluded that our disclosure controls and procedures (a) are effective to ensure that information required to be disclosed by us in reports filed or submitted under the Exchange Act is recorded, processed, summarized and reported within the time periods specified by SEC rules and forms and (b) include, without limitation, controls and procedures designed to ensure that information required to be disclosed by us in reports filed or submitted under the Exchange Act is accumulated and communicated to our management, including our CEO and CFO, as appropriate to allow timely decisions regarding required disclosure.
Changes in Internal Controls over Financial Reporting
There have been no changes in our “internalinternal control over financial reporting”reporting (as defined in Rule 13a-15(f) of the Exchange Act) that occurred during the period covered by this Quarterly Report on Form 10-Q that have materially affected, or are reasonably likely to materially affect, our internal control over financial reporting. We have not experienced any material impact to our internal control over financial reporting to date as a result of most of the employees of the Advisor and its affiliates working remotely due to the COVID-19 pandemic. We are continually monitoring and assessing the COVID-19 pandemic on our internal controls to minimize the impact to their design and operating effectiveness.
Because of its inherent limitations, internal control over financial reporting may not prevent or detect misstatements. In addition, projections of any evaluation of effectiveness to future periods are subject to the risk that controls may become inadequate because of changes in conditions or that the degree of compliance with the policies or procedures may deteriorate.
PART II—OTHER INFORMATION
Item 1. Legal Proceedings.
Neither we nor the Advisor areis currently involved in any material litigation.
Item 1A. Risk Factors.
There have been no material changes toFor information regarding factors that could affect our results of operations, financial condition and liquidity, see the risk factors containeddiscussed in Part I, Item 1A of1A. “Risk Factors” in our Annual Report on Form 10-K for the year ended December 31, 2021.2022.
Item 2. Unregistered Sales of Equity Securities and Use of Proceeds.
Unregistered Sales of Equity Securities
None.
Share Repurchase Plan
We have adopted a share repurchase plan, whereby on a monthly basis, stockholders may request that we repurchase all or any portion of their shares. We may choose to repurchase all, some or none of the shares that have been requested to be repurchased at the end of any particular month, in our discretion, subject to any limitations in the share repurchase plan. The total amount of aggregate repurchases of Class T, Class S, Class D, and Class I shares will be limited to 2% of the aggregate NAV per month and 5% of the aggregate NAV per calendar quarter. Shares would be repurchased at a price equal to the transaction price on the applicable repurchase date, subject to any early repurchase deduction. Shares that have not been outstanding for at least one year would be repurchased at 95% of the transaction price. Due to the illiquid nature of investments in real estate, we may not have sufficient liquid resources to fund repurchase requests and have established limitations on the amount of funds we may use for repurchases during any calendar month and quarter. Further, we may modify, suspend or terminate the share repurchase plan.
During the three months ended March 31, 2022,2023, we repurchased shares of our common stock in the following amounts, which represented all of the share repurchase requests received for the same period. | | | | | | | | | | | | | | | | | | | | | | | | | | | | | | | | | | | | |
| Month of: | | | | | | Total Number of Shares Repurchased | | Repurchases as a Percentage of NAV(1) | | Average Price Paid per Share | | Total Number of Shares Repurchased as Part of Publicly Announced Plans or Programs | | Maximum Number of Shares Pending Repurchase Pursuant to Publicly Announced Plans or Programs(2) |
| January 2022 | | | | | | 15,003 | | | 0.0152 | % | | $ | 12.59 | | | 15,003 | | | — | |
| February 2022 | | | | | | 69,137 | | | 0.0641 | % | | 12.66 | | | 69,137 | | | — | |
| March 2022 | | | | | | 75,889 | | | 0.0675 | % | | 12.90 | | | 75,889 | | | — | |
| | | | | | 160,029 | | | N/M | | $ | 11.46 | | | 160,029 | | | — | |
| | | | | | | | | | | | | | | | | | | | | | | | | | | | | | | | | | | | |
| Month of: | | | | | | Total Number of Shares Repurchased | | Repurchases as a Percentage of NAV(1) | | Average Price Paid per Share | | Total Number of Shares Repurchased as Part of Publicly Announced Plans or Programs | | Maximum Number of Shares Pending Repurchase Pursuant to Publicly Announced Plans or Programs(2) |
| January 2023 | | | | | | 1,404,374 | | | 0.0603 | % | | $ | 12.73 | | | 1,404,374 | | | — | |
| February 2023 | | | | | | 777,305 | | | 0.0335 | % | | 12.68 | | | 777,305 | | | — | |
| March 2023 | | | | | | 2,978,776 | | | 0.1310 | % | | 12.61 | | | 2,978,776 | | | — | |
| | | | | | 5,160,455 | | | N/M | | $ | 12.65 | | | 5,160,455 | | | — | |
(1)Represents aggregate NAV of shares repurchased under our share repurchase plan over aggregate NAV of all shares outstanding, in each case, based on the NAV as of the last calendar day of the prior month.
(2)All repurchase requests under our share repurchase plan were satisfied.
Item 3. Defaults Upon Senior Securities.
None.
Item 4. Mine Safety Disclosures.
None.
Item 5. Other Information.Information
None.
On May 8, 2023, we amended and restated our distribution reinvestment plan to allow for stockholders purchasing shares of our common stock in unregistered private offerings to participate in the distribution reinvestment plan.
On May 8, 2023, we amended and restated our bylaws to reflect, among other things, certain modernizing language and amended universal proxy rules promulgated by the Securities and Exchange Commission.
Item 6. Exhibits.
| | | | | | | | |
Exhibit No. Number | | Description |
| 3.1 | | |
| | |
| 3.2 | | |
| |
4.1 | |
| | |
| 3.3* | | |
| | |
| 4.1* | | |
| | |
| 31.1* | | |
| | |
| 31.2* | | |
| | |
| 32.1** | | |
| | |
| 101.INS | | Inline XBRL Instance Document |
| | |
| 101.SCH | | Inline XBRL Taxonomy Extension Schema Document |
| | |
| 101.CAL | | Inline XBRL Taxonomy Extension Calculation Linkbase Document |
| | |
| 101.DEF | | Inline XBRL Taxonomy Extension Definition Linkbase Document |
| | |
| 101.LAB | | Inline XBRL Taxonomy Extension Label Linkbase Document |
| | |
| 101.PRE | | Inline XBRL Taxonomy Extension Presentation Linkbase Document |
| | |
101.DEF104 | | Cover Page Interactive Data File (formatted as inline XBRL Taxonomy Extension Definition Linkbase Documentand contained in Exhibit 101 |
* Filed herewith.
SIGNATURES
Pursuant to the requirements of the Securities Exchange Act of 1934, as amended, the Registrant has duly caused this report to be signed on its behalf by the undersigned thereunto duly authorized. | | | | | | | | |
| Nuveen Global Cities REIT, Inc. |
| | |
| By: | /s/ Michael J.L. Sales |
| | Michael J.L. Sales |
| | Chief Executive Officer and Chairman of the Board |
| | |
| By: | /s/ James E. Sinople |
| | James E. Sinople |
| | Chief Financial Officer and Treasurer |
Date: May 13, 202212, 2023