UNITED STATES
SECURITIES AND EXCHANGE COMMISSION
Washington, D.C. 20549
FORM 10-Q
| | | | | |
| (Mark One) | |
| ☒ | QUARTERLY REPORT PURSUANT TO SECTION 13 OR 15(d) OF THE SECURITIES EXCHANGE ACT OF 1934 |
| For the quarterly period ended September 30, 20222023 |
| OR |
| ☐ | TRANSITION REPORT PURSUANT TO SECTION 13 OR 15(d) OF THE SECURITIES EXCHANGE ACT OF 1934 |
| For the transition period from to |
Commission File Number: 001-39548
BENTLEY SYSTEMS, INCORPORATED
(Exact name of registrant as specified in its charter)
| | | | | | | | |
| Delaware | | 95-3936623 |
| (State or other jurisdiction of incorporation or organization) | | (I.R.S. Employer Identification No.) |
| | |
| 685 Stockton Drive | | |
| Exton, Pennsylvania | | 19341 |
| (Address of principal executive offices) | | (Zip Code) |
Registrant’s telephone number, including area code: (610) 458-5000
Securities registered pursuant to Section 12(b) of the Act:
| | | | | | | | | | | | | | |
| Title of each class | | Trading Symbol | | Name of each exchange on which registered |
| Class B Common Stock, par value $0.01 per share | | BSY | | The Nasdaq Stock Market LLC |
Indicate by check mark whether the registrant (1) has filed all reports required to be filed by Section 13 or 15(d) of the Securities Exchange Act of 1934 during the preceding 12 months (or for such shorter period that the registrant was required to file such reports), and (2) has been subject to such filing requirements for the past 90 days. Yes ☒ No ☐
Indicate by check mark whether the registrant has submitted electronically every Interactive Data File required to be submitted pursuant to Rule 405 of Regulation S‑T (§232.405 of this chapter) during the preceding 12 months (or for such shorter period that the registrant was required to submit such files). Yes ☒ No ☐
Indicate by check mark whether the registrant is a large accelerated filer, an accelerated filer, a non‑accelerated filer, a smaller reporting company, or an emerging growth company. See the definitions of “large accelerated filer,” “accelerated filer,” “smaller reporting company,” and “emerging growth company” in Rule 12b‑2 of the Exchange Act.
| | | | | |
| Large accelerated filer ☒ | Accelerated filer ☐ |
| Non-accelerated filer ☐ | Smaller reporting company ☐ |
| Emerging growth company ☐ |
If an emerging growth company, indicate by check mark if the registrant has elected not to use the extended transition period for complying with any new or revised financial accounting standards provided pursuant to Section 13(a) of the Exchange Act. ☐
Indicate by check mark whether the registrant is a shell company (as defined in Rule 12b‑2 of the Exchange Act). Yes ☐ No ☒
As of November 1, 2022,October 31, 2023, the registrant had 11,601,75711,567,627 shares of Class A and 276,790,956284,354,543 shares of Class B Common Stock outstanding.
BENTLEY SYSTEMS, INCORPORATED AND SUBSIDIARIES
FORM 10-Q
TABLE OF CONTENTS
CAUTIONARY NOTE REGARDING FORWARD-LOOKING STATEMENTS
This report includes forward‑looking statements. All statements contained in this report other than statements of historical facts, including statements regarding our future results of operations and financial position, our business strategy, and plans and our objectives for future operations, are forward‑looking statements. The words “believe,” “may,” “will,” “could,” “would,” “seeks,” “estimate,” “continue,” “anticipate,” “intend,” “expect,” and similar expressions, as well as statements regarding our focus for the future, are intended to identify forward‑looking statements. We have based these forward‑looking statements largely on our current expectations, projections, and assumptions about future events and financial trends that we believe may affect our financial condition, results of operations, business strategy, short‑term and long‑term business operations and objectives, and financial needs. These forward‑looking statements are subject to a number of risks, uncertainties, and assumptions, including those described in the section titled “Risk Factors.” Moreover, we operate in a very competitive and rapidly changing environment. New risks emerge from time to time. It is not possible for our management to predict all risks, nor can we assess the impact of all factors on our business or the extent to which any factor, or combination of factors, may cause actual results to differ materially from those contained in any forward‑looking statements we may make. In light of these risks, uncertainties, and assumptions, the future events and trends discussed in this report may not occur and actual results could differ materially and adversely from those anticipated or implied in the forward‑looking statements. The forward‑looking statements, as well as our report as a whole, are subject to risks and uncertainties.
These statements are only current predictions and are subject to known and unknown risks, uncertainties, and other factors that may cause our or our industry’s actual results, levels of activity, performance, or achievements to be materially different from those anticipated by the forward‑looking statements. We discuss many of these risks in this report in greater detail in the section titled “Risk Factors” and elsewhere in this report. You should not rely upon forward‑looking statements as predictions of future events.
Although we believe that the expectations reflected in the forward‑looking statements are reasonable, we cannot guarantee future results, levels of activity, performance, achievements, events, or circumstances reflected in the forward‑looking statements will occur. Except as required by law, we undertake no obligation to update any of these forward‑looking statements after the date of this report to conform these statements to actual results or revised expectations.
PART I. FINANCIAL INFORMATION
Item 1. Unaudited Consolidated Financial Statements
BENTLEY SYSTEMS, INCORPORATED AND SUBSIDIARIES
Consolidated Balance Sheets
(in thousands, except share and per share data)
(unaudited)
| | | | | | | | | | | | | | |
| | September 30, 2022 | | December 31, 2021 |
| Assets | | | | |
| Current assets: | | | | |
| Cash and cash equivalents | | $ | 72,856 | | | $ | 329,337 | |
| Accounts receivable | | 214,459 | | | 241,807 | |
| Allowance for doubtful accounts | | (10,802) | | | (6,541) | |
| Prepaid income taxes | | 17,414 | | | 16,880 | |
| Prepaid and other current assets | | 32,224 | | | 34,348 | |
| Total current assets | | 326,151 | | | 615,831 | |
| Property and equipment, net | | 30,753 | | | 31,823 | |
| Operating lease right-of-use assets | | 41,499 | | | 50,818 | |
| Intangible assets, net | | 301,173 | | | 245,834 | |
| Goodwill | | 2,193,053 | | | 1,588,477 | |
| Investments | | 21,690 | | | 6,438 | |
| Deferred income taxes | | 52,751 | | | 71,376 | |
| Other assets | | 74,367 | | | 48,646 | |
| Total assets | | $ | 3,041,437 | | | $ | 2,659,243 | |
| Liabilities and Stockholders’ Equity | | | | |
| Current liabilities: | | | | |
| Accounts payable | | $ | 16,860 | | | $ | 16,483 | |
| Accruals and other current liabilities | | 337,442 | | | 323,603 | |
| Deferred revenues | | 186,358 | | | 224,610 | |
| Operating lease liabilities | | 15,078 | | | 17,482 | |
| Income taxes payable | | 8,405 | | | 6,696 | |
| Current portion of long-term debt | | 5,000 | | | 5,000 | |
| Total current liabilities | | 569,143 | | | 593,874 | |
| Long-term debt | | 1,776,610 | | | 1,430,992 | |
| Deferred compensation plan liabilities | | 71,013 | | | 94,890 | |
| Long-term operating lease liabilities | | 28,776 | | | 35,274 | |
| Deferred revenues | | 15,252 | | | 7,983 | |
| Deferred income taxes | | 43,817 | | | 65,014 | |
| Income taxes payable | | 8,893 | | | 7,725 | |
| Other liabilities | | 7,734 | | | 14,269 | |
| Total liabilities | | 2,521,238 | | | 2,250,021 | |
| Commitments and contingencies (Note 18) | | | | |
| Stockholders’ equity: | | | | |
| Preferred stock, $0.01 par value, authorized 100,000,000 shares; none issued or outstanding as of September 30, 2022 and December 31, 2021 | | — | | | — | |
| Class A Common Stock, $0.01 par value, authorized 100,000,000 shares; issued and outstanding 11,601,757 shares as of September 30, 2022 and December 31, 2021, and Class B Common Stock, $0.01 par value, authorized 1,800,000,000 shares; issued and outstanding 276,816,008 and 270,924,962 shares as of September 30, 2022 and December 31, 2021, respectively | | 2,884 | | | 2,825 | |
| Additional paid-in capital | | 1,005,075 | | | 937,805 | |
| Accumulated other comprehensive loss | | (101,929) | | | (91,774) | |
| Accumulated deficit | | (385,831) | | | (439,634) | |
| Total stockholders’ equity | | 520,199 | | | 409,222 | |
| Total liabilities and stockholders’ equity | | $ | 3,041,437 | | | $ | 2,659,243 | |
See accompanying notes to consolidated financial statements.
BENTLEY SYSTEMS, INCORPORATED AND SUBSIDIARIES
Consolidated Statements of Operations
(in thousands, except share and per share data)
(unaudited)
| | | | | | | | | | | | | | | | | | | | | | | | | | |
| | Three Months Ended | | Nine Months Ended |
| | September 30, | | September 30, |
| | 2022 | | 2021 | | 2022 | | 2021 |
| Revenues: | | | | | | | | |
| Subscriptions | | $ | 235,307 | | | $ | 215,135 | | | $ | 708,731 | | | $ | 589,702 | |
| Perpetual licenses | | 9,460 | | | 11,866 | | | 31,213 | | | 33,373 | |
| Subscriptions and licenses | | 244,767 | | | 227,001 | | | 739,944 | | | 623,075 | |
| Services | | 23,565 | | | 24,387 | | | 72,190 | | | 74,239 | |
| Total revenues | | 268,332 | | | 251,388 | | | 812,134 | | | 697,314 | |
| Cost of revenues: | | | | | | | | |
| Cost of subscriptions and licenses | | 37,371 | | | 31,056 | | | 107,904 | | | 89,882 | |
| Cost of services | | 21,812 | | | 23,176 | | | 66,758 | | | 67,090 | |
| Total cost of revenues | | 59,183 | | | 54,232 | | | 174,662 | | | 156,972 | |
| Gross profit | | 209,149 | | | 197,156 | | | 637,472 | | | 540,342 | |
| Operating expense (income): | | | | | | | | |
| Research and development | | 63,827 | | | 57,334 | | | 189,966 | | | 157,913 | |
| Selling and marketing | | 46,114 | | | 44,392 | | | 141,676 | | | 114,846 | |
| General and administrative | | 37,794 | | | 35,329 | | | 128,981 | | | 110,233 | |
| Deferred compensation plan | | (4,576) | | | 88,965 | | | (21,873) | | | 89,327 | |
| Amortization of purchased intangibles | | 10,446 | | | 8,676 | | | 30,869 | | | 16,703 | |
| Total operating expenses | | 153,605 | | | 234,696 | | | 469,619 | | | 489,022 | |
| Income (loss) from operations | | 55,544 | | | (37,540) | | | 167,853 | | | 51,320 | |
| Interest expense, net | | (8,382) | | | (3,836) | | | (23,046) | | | (8,608) | |
| Other income (expense), net | | 180 | | | (957) | | | 14,318 | | | 9,748 | |
| Income (loss) before income taxes | | 47,342 | | | (42,333) | | | 159,125 | | | 52,460 | |
| (Provision) benefit for income taxes | | (9,664) | | | (5,025) | | | (8,221) | | | 5,090 | |
| Loss from investment accounted for using the equity method, net of tax | | (681) | | | (664) | | | (1,846) | | | (2,939) | |
| Net income (loss) | | 36,997 | | | (48,022) | | | 149,058 | | | 54,611 | |
| Less: Net income (loss) attributable to participating securities | | (11) | | | (3) | | | (31) | | | (6) | |
| Net income (loss) attributable to Class A and Class B common stockholders | | $ | 36,986 | | | $ | (48,025) | | | $ | 149,027 | | | $ | 54,605 | |
| Per share information: | | | | | | | | |
| Net income (loss) per share, basic | | $ | 0.12 | | | $ | (0.16) | | | $ | 0.48 | | | $ | 0.18 | |
| Net income (loss) per share, diluted | | $ | 0.12 | | | $ | (0.16) | | | $ | 0.46 | | | $ | 0.17 | |
| Weighted average shares, basic | | 310,116,104 | | | 308,195,379 | | | 308,959,801 | | | 305,119,985 | |
| Weighted average shares, diluted | | 325,170,383 | | | 308,195,379 | | | 332,077,834 | | | 314,658,136 | |
| | | | | | | | |
| | | | | | | | | | | | | | |
| | September 30, 2023 | | December 31, 2022 |
| Assets | | | | |
| Current assets: | | | | |
| Cash and cash equivalents | | $ | 66,963 | | | $ | 71,684 | |
| Accounts receivable | | 243,488 | | | 296,376 | |
| Allowance for doubtful accounts | | (8,312) | | | (9,303) | |
| Prepaid income taxes | | 25,972 | | | 18,406 | |
| Prepaid and other current assets | | 46,128 | | | 38,732 | |
| Total current assets | | 374,239 | | | 415,895 | |
| Property and equipment, net | | 38,309 | | | 32,251 | |
| Operating lease right-of-use assets | | 41,434 | | | 40,249 | |
| Intangible assets, net | | 259,979 | | | 292,271 | |
| Goodwill | | 2,251,312 | | | 2,237,184 | |
| Investments | | 30,332 | | | 22,270 | |
| Deferred income taxes | | 61,664 | | | 52,636 | |
| Other assets | | 77,574 | | | 72,249 | |
| Total assets | | $ | 3,134,843 | | | $ | 3,165,005 | |
| Liabilities and Stockholders’ Equity | | | | |
| Current liabilities: | | | | |
| Accounts payable | | $ | 26,389 | | | $ | 15,176 | |
| Accruals and other current liabilities | | 403,428 | | | 362,048 | |
| Deferred revenues | | 211,815 | | | 226,955 | |
| Operating lease liabilities | | 11,430 | | | 14,672 | |
| Income taxes payable | | 18,879 | | | 4,507 | |
| Current portion of long-term debt | | 8,750 | | | 5,000 | |
| Total current liabilities | | 680,691 | | | 628,358 | |
| Long-term debt | | 1,580,752 | | | 1,775,696 | |
| Deferred compensation plan liabilities | | 79,537 | | | 77,014 | |
| Long-term operating lease liabilities | | 31,355 | | | 27,670 | |
| Deferred revenues | | 15,189 | | | 16,118 | |
| Deferred income taxes | | 43,530 | | | 51,235 | |
| Income taxes payable | | 7,317 | | | 8,105 | |
| Other liabilities | | 4,311 | | | 7,355 | |
| Total liabilities | | 2,442,682 | | | 2,591,551 | |
| Commitments and contingencies (Note 18) | | | | |
| Stockholders’ equity: | | | | |
| Preferred stock, $0.01 par value, authorized 100,000,000 shares; none issued or outstanding as of September 30, 2023 and December 31, 2022 | | — | | | — | |
| Class A Common Stock, $0.01 par value, authorized 100,000,000 shares; issued and outstanding 11,567,627 and 11,601,757 shares as of September 30, 2023 and December 31, 2022, respectively, and Class B Common Stock, $0.01 par value, authorized 1,800,000,000 shares; issued and outstanding 283,676,579 and 277,412,730 shares as of September 30, 2023 and December 31, 2022, respectively | | 2,952 | | | 2,890 | |
| Additional paid-in capital | | 1,108,816 | | | 1,030,466 | |
| Accumulated other comprehensive loss | | (95,128) | | | (89,740) | |
| Accumulated deficit | | (325,183) | | | (370,866) | |
| Non-controlling interest | | 704 | | | 704 | |
| Total stockholders’ equity | | 692,161 | | | 573,454 | |
| Total liabilities and stockholders’ equity | | $ | 3,134,843 | | | $ | 3,165,005 | |
See accompanying notes to consolidated financial statements.
BENTLEY SYSTEMS, INCORPORATED AND SUBSIDIARIES
Consolidated Statements of Comprehensive Income (Loss)Operations
(in thousands)thousands, except share and per share data)
(unaudited)
| | | | | | | | | | | | | | | | | | | | | | | | | | |
| | Three Months Ended | | Nine Months Ended |
| | September 30, | | September 30, |
| | 2022 | | 2021 | | 2022 | | 2021 |
| Net income (loss) | | $ | 36,997 | | | $ | (48,022) | | | $ | 149,058 | | | $ | 54,611 | |
| Other comprehensive loss, net of taxes: | | | | | | | | |
| Foreign currency translation adjustments | | (12,809) | | | (27,014) | | | (10,192) | | | (55,709) | |
| Actuarial gain on retirement plan, net of tax effect of $(5), $(8), $(15), and $(25), respectively | | 11 | | | 20 | | | 37 | | | 62 | |
| Total other comprehensive loss, net of taxes | | (12,798) | | | (26,994) | | | (10,155) | | | (55,647) | |
| Comprehensive income (loss) | | $ | 24,199 | | | $ | (75,016) | | | $ | 138,903 | | | $ | (1,036) | |
| | | | | | | | | | | | | | | | | | | | | | | | | | |
| | Three Months Ended | | Nine Months Ended |
| | September 30, | | September 30, |
| | 2023 | | 2022 | | 2023 | | 2022 |
| Revenues: | | | | | | | | |
| Subscriptions | | $ | 270,751 | | | $ | 235,307 | | | $ | 807,839 | | | $ | 708,731 | |
| Perpetual licenses | | 11,887 | | | 9,460 | | | 33,152 | | | 31,213 | |
| Subscriptions and licenses | | 282,638 | | | 244,767 | | | 840,991 | | | 739,944 | |
| Services | | 23,974 | | | 23,565 | | | 76,781 | | | 72,190 | |
| Total revenues | | 306,612 | | | 268,332 | | | 917,772 | | | 812,134 | |
| Cost of revenues: | | | | | | | | |
| Cost of subscriptions and licenses | | 42,088 | | | 37,371 | | | 124,175 | | | 107,904 | |
| Cost of services | | 22,588 | | | 21,812 | | | 74,111 | | | 66,758 | |
| Total cost of revenues | | 64,676 | | | 59,183 | | | 198,286 | | | 174,662 | |
| Gross profit | | 241,936 | | | 209,149 | | | 719,486 | | | 637,472 | |
| Operating expense (income): | | | | | | | | |
| Research and development | | 65,465 | | | 63,827 | | | 203,382 | | | 189,966 | |
| Selling and marketing | | 53,757 | | | 46,114 | | | 160,262 | | | 141,676 | |
| General and administrative | | 42,678 | | | 37,794 | | | 128,743 | | | 128,981 | |
| Deferred compensation plan | | (3,160) | | | (4,576) | | | 4,763 | | | (21,873) | |
| Amortization of purchased intangibles | | 9,517 | | | 10,446 | | | 29,567 | | | 30,869 | |
| Total operating expenses | | 168,257 | | | 153,605 | | | 526,717 | | | 469,619 | |
| Income from operations | | 73,679 | | | 55,544 | | | 192,769 | | | 167,853 | |
| Interest expense, net | | (10,047) | | | (9,134) | | | (30,623) | | | (23,521) | |
| Other income, net | | 5,953 | | | 932 | | | 7,207 | | | 14,793 | |
| Income before income taxes | | 69,585 | | | 47,342 | | | 169,353 | | | 159,125 | |
| Provision for income taxes | | (16,514) | | | (9,664) | | | (22,107) | | | (8,221) | |
| Loss from investments accounted for using the equity method, net of tax | | (44) | | | (681) | | | (44) | | | (1,846) | |
| Net income | | $ | 53,027 | | | $ | 36,997 | | | $ | 147,202 | | | $ | 149,058 | |
| Per share information: | | | | | | | | |
| Net income per share, basic | | $ | 0.17 | | | $ | 0.12 | | | $ | 0.47 | | | $ | 0.48 | |
| Net income per share, diluted | | $ | 0.16 | | | $ | 0.12 | | | $ | 0.46 | | | $ | 0.46 | |
| Weighted average shares, basic | | 313,069,132 | | | 310,116,104 | | | 311,915,808 | | | 308,959,801 | |
| Weighted average shares, diluted | | 332,825,186 | | | 325,170,383 | | | 332,144,893 | | | 332,077,834 | |
| | | | | | | | |
See accompanying notes to consolidated financial statements.
BENTLEY SYSTEMS, INCORPORATED AND SUBSIDIARIES
Consolidated Statements of Stockholders’ EquityComprehensive Income
(in thousands, except share data)thousands)
(unaudited)
| | | | | | | | | | | | | | | | | | | | | | | | | | | | | | | | | | | |
| Three Months Ended September 30, 2022 |
| | | | | | | Accumulated | | | | |
| Class A and Class B | | Additional | | Other | | | | Total |
| Common Stock | | Paid-in | | Comprehensive | | Accumulated | | Stockholders’ |
| Shares | | Par Value | | Capital | | Loss | | Deficit | | Equity |
| Balance, June 30, 2022 | 288,154,159 | | | $ | 2,882 | | | $ | 981,203 | | | $ | (89,131) | | | $ | (397,961) | | | $ | 496,993 | |
| Net income | — | | | — | | | — | | | — | | | 36,997 | | | 36,997 | |
| Other comprehensive loss | — | | | — | | | — | | | (12,798) | | | — | | | (12,798) | |
| Dividends declared | — | | | — | | | — | | | — | | | (8,592) | | | (8,592) | |
| Shares issued in connection with deferred compensation plan | 97,591 | | | 1 | | | (1) | | | — | | | — | | | — | |
| Deferred compensation plan elective participant deferrals | — | | | — | | | 1,586 | | | — | | | — | | | 1,586 | |
| Shares issued in connection with Executive Bonus Plan | 125,195 | | | 1 | | | 4,416 | | | — | | | — | | | 4,417 | |
| Shares issued in connection with employee stock purchase plan | 197,657 | | | 2 | | | 5,722 | | | — | | | (152) | | | 5,572 | |
| Stock option exercises, net | 218,018 | | | 2 | | | 992 | | | — | | | (59) | | | 935 | |
| | | | | | | | | | | |
| | | | | | | | | | | |
| Stock-based compensation expense | — | | | — | | | 11,158 | | | — | | | — | | | 11,158 | |
| Shares related to restricted stock, net | 58,270 | | | — | | | (1) | | | — | | | (1,060) | | | (1,061) | |
| Repurchase of Class B Common Stock under approved program | (433,125) | | | (4) | | | — | | | — | | | (15,004) | | | (15,008) | |
| Balance, September 30, 2022 | 288,417,765 | | | $ | 2,884 | | | $ | 1,005,075 | | | $ | (101,929) | | | $ | (385,831) | | | $ | 520,199 | |
| | | | | | | | | | | | | | | | | | | | | | | | | | | | | | | | | | | |
| Nine Months Ended September 30, 2022 |
| | | | | | | Accumulated | | | | |
| Class A and Class B | | Additional | | Other | | | | Total |
| Common Stock | | Paid-in | | Comprehensive | | Accumulated | | Stockholders’ |
| Shares | | Par Value | | Capital | | Loss | | Deficit | | Equity |
| Balance, December 31, 2021 | 282,526,719 | | | $ | 2,825 | | | $ | 937,805 | | | $ | (91,774) | | | $ | (439,634) | | | $ | 409,222 | |
| Net income | — | | | — | | | — | | | — | | | 149,058 | | | 149,058 | |
| Other comprehensive loss | — | | | — | | | — | | | (10,155) | | | — | | | (10,155) | |
| Dividends declared | — | | | — | | | — | | | — | | | (25,623) | | | (25,623) | |
| Shares issued in connection with deferred compensation plan, net | 3,523,386 | | | 35 | | | (27) | | | — | | | (24,254) | | | (24,246) | |
| Deferred compensation plan elective participant deferrals | — | | | — | | | 4,694 | | | — | | | — | | | 4,694 | |
| Shares issued in connection with Executive Bonus Plan, net | 284,992 | | | 3 | | | 16,307 | | | — | | | (5,197) | | | 11,113 | |
| Shares issued in connection with employee stock purchase plan | 307,406 | | | 3 | | | 10,332 | | | — | | | (273) | | | 10,062 | |
| Stock option exercises, net | 2,272,603 | | | 23 | | | 6,832 | | | — | | | (8,459) | | | (1,604) | |
| Acquisition option exercises, net | 185,178 | | | 2 | | | (2) | | | — | | | — | | | — | |
| Shares issued for stock grants, net | 13,632 | | | — | | | 450 | | | — | | | — | | | 450 | |
| Stock-based compensation expense | — | | | — | | | 28,687 | | | — | | | — | | | 28,687 | |
| Shares related to restricted stock, net | 199,975 | | | 2 | | | (3) | | | — | | | (3,208) | | | (3,209) | |
| Repurchase of Class B Common Stock under approved program | (896,126) | | | (9) | | | — | | | — | | | (28,241) | | | (28,250) | |
| Balance, September 30, 2022 | 288,417,765 | | | $ | 2,884 | | | $ | 1,005,075 | | | $ | (101,929) | | | $ | (385,831) | | | $ | 520,199 | |
| | | | | | | | | | | | | | | | | | | | | | | | | | |
| | Three Months Ended | | Nine Months Ended |
| | September 30, | | September 30, |
| | 2023 | | 2022 | | 2023 | | 2022 |
| Net income | | $ | 53,027 | | | $ | 36,997 | | | $ | 147,202 | | | $ | 149,058 | |
| Other comprehensive loss, net of taxes: | | | | | | | | |
| Foreign currency translation adjustments | | (7,294) | | | (12,809) | | | (5,416) | | | (10,192) | |
| Actuarial (loss) gain on retirement plan, net of tax effect of $(8), $(5), $(15), and $(15), respectively | | (6) | | | 11 | | | 28 | | | 37 | |
| Total other comprehensive loss, net of taxes | | (7,300) | | | (12,798) | | | (5,388) | | | (10,155) | |
| Comprehensive income | | $ | 45,727 | | | $ | 24,199 | | | $ | 141,814 | | | $ | 138,903 | |
See accompanying notes to consolidated financial statements.
BENTLEY SYSTEMS, INCORPORATED AND SUBSIDIARIES
Consolidated Statements of Stockholders’ Equity
(in thousands, except share data)
(unaudited)
| | | Three Months Ended September 30, 2021 | | Three Months Ended September 30, 2023 |
| | | Accumulated | | | | Accumulated | |
| | Class A and Class B | | Additional | | Other | | Total | | Class A and Class B | | Additional | | Other | | Non- | | Total |
| | Common Stock | | Paid-in | | Comprehensive | | Accumulated | | Stockholders’ | | Common Stock | | Paid-In | | Comprehensive | | Accumulated | | Controlling | | Stockholders’ |
| | Shares | | Par Value | | Capital | | Loss | | Deficit | | Equity | | Shares | | Par Value | | Capital | | Loss | | Deficit | | Interest | | Equity |
| Balance, June 30, 2021 | 281,189,127 | | | $ | 2,812 | | | $ | 910,951 | | | $ | (54,886) | | | $ | (386,346) | | | $ | 472,531 | | |
| Net loss | — | | | — | | | — | | | — | | | (48,022) | | | (48,022) | | |
| Balance, June 30, 2023 | | Balance, June 30, 2023 | 294,712,983 | | | $ | 2,947 | | | $ | 1,085,066 | | | $ | (87,828) | | | $ | (357,117) | | | $ | 704 | | | $ | 643,772 | |
| Net income | | Net income | — | | | — | | | — | | | — | | | 53,027 | | | — | | | 53,027 | |
| Other comprehensive loss | Other comprehensive loss | — | | | — | | | — | | | (26,994) | | | — | | | (26,994) | | Other comprehensive loss | — | | | — | | | — | | | (7,300) | | | — | | | — | | | (7,300) | |
| | Dividends declared | Dividends declared | — | | | — | | | — | | | — | | | (8,485) | | | (8,485) | | Dividends declared | — | | | — | | | — | | | — | | | (14,768) | | | — | | | (14,768) | |
| Shares issued in connection with deferred compensation plan, net | Shares issued in connection with deferred compensation plan, net | 88,920 | | | 1 | | | — | | | — | | | (3,773) | | | (3,772) | | Shares issued in connection with deferred compensation plan, net | 63,267 | | | — | | | — | | | — | | | (2,127) | | | — | | | (2,127) | |
| Deferred compensation plan elective participant deferrals | Deferred compensation plan elective participant deferrals | — | | | — | | | 527 | | | — | | | — | | | 527 | | Deferred compensation plan elective participant deferrals | — | | | — | | | 61 | | | — | | | — | | | — | | | 61 | |
| Deferred compensation plan modification | — | | | — | | | (4,739) | | | — | | | — | | | (4,739) | | |
| Shares issued in connection with Executive Bonus Plan, net | 41,172 | | | — | | | 4,292 | | | — | | | (1,870) | | | 2,422 | | |
| Shares issued in connection with employee stock purchase plan | 104,716 | | | 1 | | | 3,845 | | | — | | | (438) | | | 3,408 | | |
| Shares issued in connection with executive bonus plan, net | | Shares issued in connection with executive bonus plan, net | 34,313 | | | — | | | 3,251 | | | — | | | (1,430) | | | — | | | 1,821 | |
| Shares issued and repurchased in connection with employee stock purchase plan, net | | Shares issued and repurchased in connection with employee stock purchase plan, net | 162,459 | | | 2 | | | 5,429 | | | — | | | (623) | | | — | | | 4,808 | |
| Stock option exercises, net | Stock option exercises, net | 612,277 | | | 6 | | | 699 | | | — | | | (5,951) | | | (5,246) | | Stock option exercises, net | 185,255 | | | 2 | | | 888 | | | — | | | (419) | | | — | | | 471 | |
| | Stock-based compensation expense | Stock-based compensation expense | — | | | — | | | 5,835 | | | — | | | — | | | 5,835 | | Stock-based compensation expense | — | | | — | | | 14,122 | | | — | | | — | | | — | | | 14,122 | |
| Shares related to restricted stock, net | Shares related to restricted stock, net | 2,352 | | | — | | | — | | | — | | | (5,644) | | | (5,644) | | Shares related to restricted stock, net | 85,929 | | | 1 | | | (1) | | | — | | | (1,726) | | | — | | | (1,726) | |
| Balance, September 30, 2021 | 282,038,564 | | | $ | 2,820 | | | $ | 921,410 | | | $ | (81,880) | | | $ | (460,529) | | | $ | 381,821 | | |
| | Balance, September 30, 2023 | | Balance, September 30, 2023 | 295,244,206 | | | $ | 2,952 | | | $ | 1,108,816 | | | $ | (95,128) | | | $ | (325,183) | | | $ | 704 | | | $ | 692,161 | |
| | | Nine Months Ended September 30, 2021 | | Nine Months Ended September 30, 2023 |
| | | Accumulated | | | | Accumulated | |
| | Class A and Class B | | Additional | | Other | | Total | | Class A and Class B | | Additional | | Other | | Non- | | Total |
| | Common Stock | | Paid-in | | Comprehensive | | Accumulated | | Stockholders’ | | Common Stock | | Paid-In | | Comprehensive | | Accumulated | | Controlling | | Stockholders’ |
| | Shares | | Par Value | | Capital | | Loss | | Deficit | | Equity | | Shares | | Par Value | | Capital | | Loss | | Deficit | | Interest | | Equity |
| Balance, December 31, 2020 | 272,154,504 | | | $ | 2,722 | | | $ | 741,113 | | | $ | (26,233) | | | $ | (376,003) | | | $ | 341,599 | | |
| Balance, December 31, 2022 | | Balance, December 31, 2022 | 289,014,487 | | | $ | 2,890 | | | $ | 1,030,466 | | | $ | (89,740) | | | $ | (370,866) | | | $ | 704 | | | $ | 573,454 | |
| Net income | Net income | — | | | — | | | — | | | — | | | 54,611 | | | 54,611 | | Net income | — | | | — | | | — | | | — | | | 147,202 | | | — | | | 147,202 | |
| Other comprehensive loss | Other comprehensive loss | — | | | — | | | — | | | (55,647) | | | — | | | (55,647) | | Other comprehensive loss | — | | | — | | | — | | | (5,388) | | | — | | | — | | | (5,388) | |
| Shares issued related to acquisition | 3,141,342 | | | 31 | | | 182,359 | | | — | | | — | | | 182,390 | | |
| Purchase of capped call options, net of tax of $12,584 | — | | | — | | | (39,021) | | | — | | | — | | | (39,021) | | |
| Dividends declared | Dividends declared | — | | | — | | | — | | | — | | | (25,076) | | | (25,076) | | Dividends declared | — | | | — | | | — | | | — | | | (43,992) | | | — | | | (43,992) | |
| Shares issued in connection with deferred compensation plan, net | Shares issued in connection with deferred compensation plan, net | 2,290,999 | | | 23 | | | — | | | — | | | (65,707) | | | (65,684) | | Shares issued in connection with deferred compensation plan, net | 2,845,448 | | | 28 | | | (28) | | | — | | | (38,456) | | | — | | | (38,456) | |
| Deferred compensation plan elective participant deferrals | Deferred compensation plan elective participant deferrals | — | | | — | | | 2,020 | | | — | | | — | | | 2,020 | | Deferred compensation plan elective participant deferrals | — | | | — | | | 1,712 | | | — | | | — | | | — | | | 1,712 | |
| Deferred compensation plan modification | — | | | — | | | (4,739) | | | — | | | — | | | (4,739) | | |
| Shares issued in connection with Executive Bonus Plan, net | 190,619 | | | 2 | | | 16,013 | | | — | | | (6,586) | | | 9,429 | | |
| Shares issued in connection with employee stock purchase plan | 104,716 | | | 1 | | | 3,845 | | | — | | | (438) | | | 3,408 | | |
| Shares issued in connection with executive bonus plan, net | | Shares issued in connection with executive bonus plan, net | 171,510 | | | 2 | | | 13,055 | | | — | | | (5,756) | | | — | | | 7,301 | |
| Shares issued in connection with employee stock purchase plan, net | | Shares issued in connection with employee stock purchase plan, net | 315,840 | | | 3 | | | 9,985 | | | — | | | (845) | | | — | | | 9,143 | |
| Stock option exercises, net | Stock option exercises, net | 4,269,335 | | | 42 | | | 4,987 | | | — | | | (34,978) | | | (29,949) | | Stock option exercises, net | 2,422,082 | | | 24 | | | 10,566 | | | — | | | (6,408) | | | — | | | 4,182 | |
| Shares issued for stock grants | 7,824 | | | — | | | 450 | | | — | | | — | | | 450 | | |
| Shares issued for stock grants, net | | Shares issued for stock grants, net | 12,639 | | | — | | | 600 | | | — | | | — | | | — | | | 600 | |
| Stock-based compensation expense | Stock-based compensation expense | — | | | — | | | 14,383 | | | — | | | — | | | 14,383 | | Stock-based compensation expense | — | | | — | | | 42,465 | | | — | | | — | | | — | | | 42,465 | |
| Shares related to restricted stock, net | Shares related to restricted stock, net | (120,775) | | | (1) | | | — | | | — | | | (6,352) | | | (6,353) | | Shares related to restricted stock, net | 462,200 | | | 5 | | | (5) | | | — | | | (6,062) | | | — | | | (6,062) | |
| Balance, September 30, 2021 | 282,038,564 | | | $ | 2,820 | | | $ | 921,410 | | | $ | (81,880) | | | $ | (460,529) | | | $ | 381,821 | | |
| | Balance, September 30, 2023 | | Balance, September 30, 2023 | 295,244,206 | | | $ | 2,952 | | | $ | 1,108,816 | | | $ | (95,128) | | | $ | (325,183) | | | $ | 704 | | | $ | 692,161 | |
See accompanying notes to consolidated financial statements.
BENTLEY SYSTEMS, INCORPORATED AND SUBSIDIARIES
Consolidated Statements of Cash FlowsStockholders’ Equity
(in thousands)thousands, except share data)
(unaudited)
| | | | | | | | | | | | | | |
| | Nine Months Ended |
| | September 30, |
| | 2022 | | 2021 |
| Cash flows from operating activities: | | | | |
| Net income | | $ | 149,058 | | | $ | 54,611 | |
| Adjustments to reconcile net income to net cash provided by operating activities: | | | | |
| Depreciation and amortization | | 53,644 | | | 35,946 | |
| Bad debt allowance | | 5,199 | | | 466 | |
| Deferred income taxes | | (13,670) | | | (17,788) | |
| Stock-based compensation expense | | 51,359 | | | 32,853 | |
| Deferred compensation plan | | (21,873) | | | 89,327 | |
| Amortization and write-off of deferred debt issuance costs | | 5,468 | | | 4,160 | |
| Change in fair value of derivative | | (29,318) | | | (9,198) | |
| Foreign currency remeasurement loss | | 14,445 | | | 103 | |
| Other non-cash items, net | | (1,006) | | | 2,939 | |
| Changes in assets and liabilities, net of effect from acquisitions: | | | | |
| Accounts receivable | | 12,550 | | | 26,305 | |
| Prepaid and other assets | | 7,779 | | | 11,310 | |
| Accounts payable, accruals, and other liabilities | | 28,765 | | | 29,047 | |
| Deferred revenues | | (26,725) | | | (40,496) | |
| Income taxes payable, net of prepaid income taxes | | 2,523 | | | (12,168) | |
| Net cash provided by operating activities | | 238,198 | | | 207,417 | |
| Cash flows from investing activities: | | | | |
| Purchases of property and equipment and investment in capitalized software | | (12,982) | | | (11,152) | |
| Proceeds from sale of aircraft | | 2,380 | | | — | |
| Acquisitions, net of cash acquired | | (719,539) | | | (1,033,695) | |
| Other investing activities | | (10,304) | | | (3,000) | |
| Net cash used in investing activities | | (740,445) | | | (1,047,847) | |
| Cash flows from financing activities: | | | | |
| Proceeds from credit facilities | | 753,376 | | | 682,083 | |
| Payments of credit facilities | | (408,714) | | | (860,228) | |
| Proceeds from convertible senior notes, net of discounts and commissions | | — | | | 1,233,377 | |
| Payments of debt issuance costs | | — | | | (5,643) | |
| Purchase of capped call options | | — | | | (51,555) | |
| | | | |
| Repayment of term loan | | (3,750) | | | — | |
| Payments of financing leases | | (123) | | | (147) | |
| Payments of acquisition debt and other consideration | | (6,996) | | | (741) | |
| Payments of dividends | | (25,828) | | | (25,076) | |
| Proceeds from stock purchases under employee stock purchase plan | | 10,335 | | | 3,846 | |
| Proceeds from exercise of stock options | | 6,855 | | | 5,039 | |
| Payments for shares acquired including shares withheld for taxes | | (42,213) | | | (111,306) | |
| Repurchase of Class B Common Stock under approved program | | (28,250) | | | — | |
| Net cash provided by financing activities | | 254,692 | | | 869,649 | |
| Effect of exchange rate changes on cash and cash equivalents | | (8,926) | | | 4,530 | |
| (Decrease) increase in cash and cash equivalents | | (256,481) | | | 33,749 | |
| Cash and cash equivalents, beginning of year | | 329,337 | | | 122,006 | |
| Cash and cash equivalents, end of period | | $ | 72,856 | | | $ | 155,755 | |
| | | | | | | | | | | | | | | | | | | | | | | | | | | | | | | | | | | | | |
| Three Months Ended September 30, 2022 |
| | | | | | | Accumulated | | | | | | |
| Class A and Class B | | Additional | | Other | | | | | | Total |
| Common Stock | | Paid-In | | Comprehensive | | Accumulated | | | | Stockholders’ |
| Shares | | Par Value | | Capital | | Loss | | Deficit | | | | Equity |
| Balance, June 30, 2022 | 288,154,159 | | | $ | 2,882 | | | $ | 981,203 | | | $ | (89,131) | | | $ | (397,961) | | | | | $ | 496,993 | |
| Net income | — | | | — | | | — | | | — | | | 36,997 | | | | | 36,997 | |
| Other comprehensive loss | — | | | — | | | — | | | (12,798) | | | — | | | | | (12,798) | |
| Dividends declared | — | | | — | | | — | | | — | | | (8,592) | | | | | (8,592) | |
| Shares issued in connection with deferred compensation plan | 97,591 | | | 1 | | | (1) | | | — | | | — | | | | | — | |
| Deferred compensation plan elective participant deferrals | — | | | — | | | 1,586 | | | — | | | — | | | | | 1,586 | |
| Shares issued in connection with executive bonus plan, net | 125,195 | | | 1 | | | 4,416 | | | — | | | — | | | | | 4,417 | |
| Shares issued in connection with employee stock purchase plan, net | 197,657 | | | 2 | | | 5,722 | | | — | | | (152) | | | | | 5,572 | |
| Stock option exercises, net | 218,018 | | | 2 | | | 992 | | | — | | | (59) | | | | | 935 | |
| | | | | | | | | | | | | |
| | | | | | | | | | | | | |
| Stock-based compensation expense | — | | | — | | | 11,158 | | | — | | | — | | | | | 11,158 | |
| Shares related to restricted stock, net | 58,270 | | | — | | | (1) | | | — | | | (1,060) | | | | | (1,061) | |
| Repurchases of Class B Common Stock under approved program | (433,125) | | | (4) | | | — | | | — | | | (15,004) | | | | | (15,008) | |
| | | | | | | | | | | | | |
| | | | | | | | | | | | | |
| Balance, September 30, 2022 | 288,417,765 | | | $ | 2,884 | | | $ | 1,005,075 | | | $ | (101,929) | | | $ | (385,831) | | | | | $ | 520,199 | |
| | | | | | | | | | | | | | | | | | | | | | | | | | | | | | | | | | | | | |
| Nine Months Ended September 30, 2022 |
| | | | | | | Accumulated | | | | | | |
| Class A and Class B | | Additional | | Other | | | | | | Total |
| Common Stock | | Paid-In | | Comprehensive | | Accumulated | | | | Stockholders’ |
| Shares | | Par Value | | Capital | | Loss | | Deficit | | | | Equity |
| Balance, December 31, 2021 | 282,526,719 | | | $ | 2,825 | | | $ | 937,805 | | | $ | (91,774) | | | $ | (439,634) | | | | | $ | 409,222 | |
| Net income | — | | | — | | | — | | | — | | | 149,058 | | | | | 149,058 | |
| Other comprehensive loss | — | | | — | | | — | | | (10,155) | | | — | | | | | (10,155) | |
| Dividends declared | — | | | — | | | — | | | — | | | (25,623) | | | | | (25,623) | |
| Shares issued in connection with deferred compensation plan, net | 3,523,386 | | | 35 | | | (27) | | | — | | | (24,254) | | | | | (24,246) | |
| Deferred compensation plan elective participant deferrals | — | | | — | | | 4,694 | | | — | | | — | | | | | 4,694 | |
| Shares issued in connection with executive bonus plan, net | 284,992 | | | 3 | | | 16,307 | | | — | | | (5,197) | | | | | 11,113 | |
| Shares issued in connection with employee stock purchase plan, net | 307,406 | | | 3 | | | 10,332 | | | — | | | (273) | | | | | 10,062 | |
| Stock option exercises, net | 2,272,603 | | | 23 | | | 6,832 | | | — | | | (8,459) | | | | | (1,604) | |
| Acquisition option exercises, net | 185,178 | | | 2 | | | (2) | | | — | | | — | | | | | — | |
| Shares issued for stock grants, net | 13,632 | | | — | | | 450 | | | — | | | — | | | | | 450 | |
| Stock-based compensation expense | — | | | — | | | 28,687 | | | — | | | — | | | | | 28,687 | |
| Shares related to restricted stock, net | 199,975 | | | 2 | | | (3) | | | — | | | (3,208) | | | | | (3,209) | |
| Repurchases of Class B Common Stock under approved program | (896,126) | | | (9) | | | — | | | — | | | (28,241) | | | | | (28,250) | |
| | | | | | | | | | | | | |
| | | | | | | | | | | | | |
| Balance, September 30, 2022 | 288,417,765 | | | $ | 2,884 | | | $ | 1,005,075 | | | $ | (101,929) | | | $ | (385,831) | | | | | $ | 520,199 | |
See accompanying notes to consolidated financial statements.
BENTLEY SYSTEMS, INCORPORATED AND SUBSIDIARIES
Consolidated Statements of Cash Flows
(in thousands)
(unaudited)
| | | | | | | | | | | | | | |
| | Nine Months Ended |
| | September 30, |
| | 2022 | | 2021 |
| Supplemental information: | | | | |
| Cash paid for income taxes | | $ | 20,696 | | | $ | 32,359 | |
| Income tax refunds | | 2,194 | | | 7,820 | |
| Interest paid | | 17,647 | | | 3,281 | |
| Non-cash investing and financing activities: | | | | |
| Cost method investment, non-cash exchange | | 6,022 | | | — | |
| Shares issued related to acquisition | | — | | | 182,390 | |
| Contingent acquisition consideration | | — | | | 5,581 | |
| Deferred, non-contingent consideration, net | | 157 | | | 10,081 | |
Convertible senior notes expenses included in Accounts payable | | — | | | 375 | |
Capped call options expenses included in Accounts payable | | — | | | 50 | |
| | | | |
| Share-settled Executive Bonus Plan awards | | 16,310 | | | 16,015 | |
| Deferred compensation plan elective participant deferrals | | 4,694 | | | 2,020 | |
See accompanying notes to consolidated financial statements. | | | | | | | | | | | | | | |
| | Nine Months Ended |
| | September 30, |
| | 2023 | | 2022 |
| Cash flows from operating activities: | | | | |
| Net income | | $ | 147,202 | | | $ | 149,058 | |
| Adjustments to reconcile net income to net cash provided by operating activities: | | | | |
| Depreciation and amortization | | 52,787 | | | 53,644 | |
| Deferred income taxes | | (14,632) | | | (13,670) | |
| Stock-based compensation expense | | 56,092 | | | 51,359 | |
| Deferred compensation plan | | 4,763 | | | (21,873) | |
| Amortization of deferred debt issuance costs | | 5,469 | | | 5,468 | |
| Change in fair value of derivative | | (4,102) | | | (29,318) | |
| Foreign currency remeasurement loss | | 3,198 | | | 14,445 | |
| Other | | 2,464 | | | 4,193 | |
| Changes in assets and liabilities, net of effect from acquisitions: | | | | |
| Accounts receivable | | 56,065 | | | 12,550 | |
| Prepaid and other assets | | (1,246) | | | 7,779 | |
| Accounts payable, accruals, and other liabilities | | 33,437 | | | 28,765 | |
| Deferred revenues | | (17,688) | | | (26,725) | |
| Income taxes payable, net of prepaid income taxes | | 5,834 | | | 2,523 | |
| Net cash provided by operating activities | | 329,643 | | | 238,198 | |
| Cash flows from investing activities: | | | | |
| Purchases of property and equipment and investment in capitalized software | | (18,906) | | | (12,982) | |
| Proceeds from sale of aircraft | | — | | | 2,380 | |
| Acquisitions, net of cash acquired | | (23,110) | | | (719,539) | |
| Purchases of investments | | (11,352) | | | (10,304) | |
| Proceeds from investments | | 2,123 | | | — | |
| Net cash used in investing activities | | (51,245) | | | (740,445) | |
| Cash flows from financing activities: | | | | |
| Proceeds from credit facilities | | 442,566 | | | 753,376 | |
| Payments of credit facilities | | (634,718) | | | (408,714) | |
| | | | |
| | | | |
| | | | |
| | | | |
| | | | |
| Repayments of term loan | | (3,750) | | | (3,750) | |
| Payments of contingent and non-contingent consideration | | (3,039) | | | (6,996) | |
| Payments of dividends | | (43,992) | | | (25,828) | |
| Proceeds from stock purchases under employee stock purchase plan | | 9,988 | | | 10,335 | |
| Proceeds from exercise of stock options | | 10,590 | | | 6,855 | |
| Payments for shares acquired including shares withheld for taxes | | (57,527) | | | (42,213) | |
| Repurchases of Class B Common Stock under approved program | | — | | | (28,250) | |
| Other | | (137) | | | (123) | |
| Net cash (used in) provided by financing activities | | (280,019) | | | 254,692 | |
| Effect of exchange rate changes on cash and cash equivalents | | (3,100) | | | (8,926) | |
| Decrease in cash and cash equivalents | | (4,721) | | | (256,481) | |
| Cash and cash equivalents, beginning of year | | 71,684 | | | 329,337 | |
| Cash and cash equivalents, end of period | | $ | 66,963 | | | $ | 72,856 | |
BENTLEY SYSTEMS, INCORPORATED AND SUBSIDIARIES
Consolidated Statements of Cash Flows
(in thousands)
(unaudited)
| | | | | | | | | | | | | | |
| | Nine Months Ended |
| | September 30, |
| | 2023 | | 2022 |
| Supplemental information: | | | | |
| Cash paid for income taxes | | $ | 29,467 | | | $ | 20,696 | |
| Income tax refunds | | 764 | | | 2,194 | |
| Interest paid | | 29,370 | | | 17,647 | |
| Non-cash investing and financing activities: | | | | |
| Cost method investment | | 3,500 | | | 6,022 | |
| | | | |
| | | | |
| Deferred, non-contingent consideration, net | | 525 | | | 157 | |
| | | | |
| | | | |
| | | | |
| Share-settled executive bonus plan awards | | 13,057 | | | 16,310 | |
| Deferred compensation plan elective participant deferrals | | 1,712 | | | 4,694 | |
See accompanying notes to consolidated financial statements.
BENTLEY SYSTEMS, INCORPORATED
Notes to Consolidated Financial Statements
(in thousands, except share and per share data)
(unaudited)
Note 1: Basis of Presentation
Basis of Presentation — The accompanying unaudited consolidated financial statements include the accounts of Bentley Systems, Incorporated and its wholly-owned subsidiaries (“Bentley”Bentley Systems, Incorporated” or the “Company”) and its wholly-owned subsidiaries,, and have been prepared in accordance with accounting principlesUnited States generally accepted in the United States of Americaaccounting principles (“U.S. GAAP”) and in accordance with the rules and regulations of the United States Securities and Exchange Commission (“SEC”) regarding interim financial reporting. Accordingly, they do not include all the information and notes required by U.S. GAAP for annual financial statements. These unaudited consolidated financial statements should be read in conjunction with the audited consolidated financial statements and notes thereto included in Part II, Item 8 of the Company’s 20212022 Annual Report on Form 10‑K on file with the SEC.K. In management’s opinion, the accompanying unaudited consolidated financial statements contain all adjustments (consisting of normal, recurring and non-recurring adjustments) that were considered necessary for the fair statement of the Company’s financial position, results of operations, and cash flows atas of the dates and for the periods indicated. The preparation of financial statements in conformity with U.S. GAAP requires management to make estimates and assumptions that affect reported amounts in the financial statements and accompanying notes. Actual results could differ materially from those estimates. The December 31, 20212022 consolidated balance sheet included herein is derived from the Company’s audited consolidated financial statements.
Certain reclassifications of prior period amounts have been made to conform to the current period presentation.
Business Combinations — On January 31, 2022, the Company completed the acquisition of Power Line Systems, a leader in software for the design of overhead electric power transmission lines and their structures, for $695,968 in cash, net of cash acquired. On June 17, 2021, the Company completed the acquisition of Seequent Holdings Limited (“Seequent”), a leader in software for geological and geophysical modeling, geotechnical stability, and cloud services for geodata management and collaboration, for $883,336 in cash, net of cash acquired, plus 3,141,342 shares of the Company’s Class B Common Stock (see Note 4).
Deferred Compensation — Under the Company’s unfunded amended and restated Bentley Systems, Incorporated Nonqualified Deferred Compensation Plan (the “DCP”), certain officers and key employees may defer all or any part of their incentive compensation, and the Company may make discretionary awards on behalf of such participants. Elective participant deferrals and discretionary Company awards are received in the form of phantom shares of the Company’s Class B Common Stock, which are valued for tax and accounting purposes in the same manner as actual shares of Class B Common Stock, and are recorded as stock‑based compensation expense in the consolidated statements of operations (see Note 15).
In August 2021, the Company’s Board of Directors approved an amendment to the DCP, which offered to certain active executives in the DCP a one‑time, short‑term election to reallocate a limited portion of their DCP holdings from phantom shares of the Company’s Class B Common Stock into other phantom investment funds. The offer to reallocate was subject to a proration mechanism which adjusted the aggregate elections to a maximum of 1,500,000 phantom shares of the Company’s Class B Common Stock. This resulted in a reduction of 1,500,000 shares in both the basic and diluted count of Company shares.
While DCP participants’ investments in phantom shares remain equity classified, as they will be settled in shares of Class B Common Stock upon eventual distribution, the amendment and elections resulted in a change to liability classification for the reallocated phantom investments, as they will be settled in cash upon eventual distribution. As a result, during For the three and nine months ended September 30, 2021, the Company reclassified cumulative compensation cost of $4,739 from Additional paid-in capital to Accruals and other current liabilities or Deferred compensation plan liabilities in the consolidated balance sheet and recognized a compensation charge of $90,721 to Deferred compensation plan expenses in the consolidated statements of operations to record the reallocated deferred compensation plan liabilities at their fair value of $95,460. Subsequent2023, payments related to the one‑time reallocation, these diversified deferred compensation plan liabilities are marked to market at the end of each reporting period, with changesCompany’s interest rate swap were recognized in the liabilities recorded as an expense (income) to Deferred compensation planOther income (expense), net in the consolidated statements of operations (see Note 12).and the corresponding prior period amounts, which were previously recognized in Interest expense, net, were reclassified to conform to the current period presentation. For the three and nine months ended September 30, 2022, the amounts reclassified were not material, and Income before income taxes and Net income in the consolidated statements of operations did not change as a result of these reclassifications.
Note 2: Recent Accounting Pronouncements
Recently Adopted Accounting Guidance
In March 2020, the Financial Accounting Standards Board (“FASB”) issued Accounting Standards Update (“ASU”) No. 2020‑04, Reference Rate Reform (Topic 848): Facilitation of the Effects of Reference Rate Reform on Financial Reporting (“ASU 2020‑04”), which provides optional expedients and exceptions for applying U.S. GAAP to contracts, hedging relationships, and other transactions affected by reference rate reform if certain criteria are met. ASU 2020‑04 applies only to contracts, hedging relationships, and other transactions that reference the London Interbank Offered Rate (“LIBOR”) or another reference rate expected to be discontinued because of reference rate reform between March 12, 2020 and December 31, 2022. In December 2022, the FASB issued ASU No. 2022‑06, Reference Rate Reform (Topic 848): Deferral of the Sunset Date of Topic 848, which provides optional guidance to ease the potential burden in accounting for (or recognizing the effects of) reference rate reform on financial reporting by extending the sunset date of Topic 848 to December 31, 2024. The expedients and exceptions provided by ASU 2020‑04these ASUs do not apply to contract modifications made and hedging relationships entered into or evaluated after December 31, 2022,2024, except for hedging relationships existing as of December 31, 2022,2024, that an entity has elected certain optional expedients for and that are retained through the end of the hedging relationship. The Company had no transactions that were impacted by ASU 2020‑04adopted these ASUs during the nine months ended September 30, 2022.
Recently Adopted Accounting Guidance
In October 2021, the FASB issued ASU No. 2021‑08, Business Combinations (Topic 805): Accounting for Contract Assets and Contract Liabilities from Contracts with Customers (“ASU 2021‑08”), which improves the comparability of accounting for acquired revenue contracts with customers in a business combination. The new guidance is meant to reduce diversity in practice and inconsistencies related to recognition of an acquired contract liability and revenue contract payment terms and their effect on subsequent revenue recognized by the acquirer. During the fourthsecond quarter of 2021,2023 (see Note 10) and the Company early adopted the ASU effective January 1, 2021 using the modified retrospective method of adoption and retrospectively recasted interim prior period amounts presented in the accompanying unaudited consolidated financial statements for acquisitions subsequent to January 1, 2021. The adoption of this ASU did not have a material impact on the accompanying unauditedCompany’s consolidated financial statements.
Note 3: Revenue from Contracts with Customers
NatureDisaggregation of Products and ServicesRevenues
The Company generatesCompany’s revenues from subscriptions, perpetual licenses, and services.
Subscriptions
SELECT subscriptions — The Company provides prepaid annual recurring subscriptions that accounts (which are based on distinct contractual and billing relationships with the Company, where affiliated entities of a single parent company may each have an independent account with the Company) can elect to add to a new or previously purchased perpetual license. SELECT provides accounts with benefits, including upgrades, comprehensive technical support, pooled licensing benefits, annual portfolio balancing exchange rights, learning benefits, certain Azure‑based cloud collaboration services, mobility advantages, and access to other available benefits. SELECT subscriptions revenues are recognized as distinct performance obligations are satisfied. The performance obligations within the SELECT offering, outsideconsist of the portfolio balancing exchange right, are concurrently delivered and have the same pattern of recognition. These performance obligations are accounted for ratably over the term as a single performance obligation.following:
| | | | | | | | | | | | | | | | | | | | | | | |
| Three Months Ended | | Nine Months Ended |
| September 30, | | September 30, |
| 2023 | | 2022 | | 2023 | | 2022 |
| Subscriptions: | | | | | | | |
Enterprise subscriptions (1) | $ | 111,318 | | | $ | 89,041 | | | $ | 318,896 | | | $ | 252,461 | |
| SELECT subscriptions | 63,406 | | | 63,609 | | | 190,834 | | | 196,786 | |
| Term license subscriptions | 96,027 | | | 82,657 | | | 298,109 | | | 259,484 | |
| Subscriptions | 270,751 | | | 235,307 | | | 807,839 | | | 708,731 | |
| Perpetual licenses | 11,887 | | | 9,460 | | | 33,152 | | | 31,213 | |
| Subscriptions and licenses | 282,638 | | | 244,767 | | | 840,991 | | | 739,944 | |
| Services: | | | | | | | |
| Recurring | 3,606 | | | 4,557 | | | 12,733 | | | 13,431 | |
| Other | 20,368 | | | 19,008 | | | 64,048 | | | 58,759 | |
| Services | 23,974 | | | 23,565 | | | 76,781 | | | 72,190 | |
| Total revenues | $ | 306,612 | | | $ | 268,332 | | | $ | 917,772 | | | $ | 812,134 | |
(1)Enterprise subscriptions — The Company provides enterprise subscription offerings, which provide its enterprise accounts with complete and unlimited global access includes revenue attributable to the Company’s comprehensive portfolio of solutions. Enterprise 365 (“E365”) subscriptions are charged to accounts based upon daily usage. of $107,681 and $80,298 for the three months ended September 30, 2023 and 2022, respectively, and $301,260 and $221,801 for the nine months ended September 30, 2023 and 2022, respectively.
The daily usage fee includes a term license component, SELECT maintenanceCompany recognizes perpetual licenses and support, hosting, and Success Blueprints, which are designed to achieve business outcomes through more efficient and effective use of the Company’s software. E365 revenues are recognized based upon usage incurred by the account. Usage is defined as distinct user access on a daily basis. E365 subscriptions can contain quarterly usage floors or collars. The term of E365 subscriptions aligns with calendar quarters and revenue is recognized based on actual usage. Alternatively, Enterprise License Subscriptions (“ELS”) provide access for a prepaid fee, which is based on the account’s usage of software in the preceding year, to effectively create a fee‑certain consumption‑based arrangement. ELS contain a term license component, SELECT maintenance and support, and performance consulting days. The SELECT maintenance and support benefits under ELS do not include a portfolio balancing performance obligation. Revenue is allocated to the various performance obligations based on their respective standalone selling price (“SSP”). Revenue allocated to the term license component is recognized upon deliveryof subscriptions as revenue when either the licenses are delivered or at the start of the subscription term whileterm. For the three months ended September 30, 2023 and 2022, the Company recognized $147,340 and $125,140 of license related revenues, for the SELECT maintenancerespectively, of which $135,453 and support and the performance consulting days are recognized as delivered over the subscription term. Billings in advance are recorded as Deferred revenues in the consolidated balance sheets.
Term license subscriptions — The Company provides annual, quarterly, and monthly term licenses for its software products. Term license subscriptions contain a term license component and SELECT maintenance and support. Revenue is allocated to the various performance obligations based on their SSP. Annual term licenses (“ATL”) are generally prepaid annually for named user access to specific products and include the Company’s Virtuoso subscriptions sold via the Company’s Virtuosity eStore for practitioner licenses. Virtuoso subscriptions are bundles with customizable training and expert consultation administered through “keys” or credits. Quarterly term license (“QTL”) subscriptions allow accounts to pay quarterly in arrears for license usage that is beyond their prepaid subscriptions. Monthly term license (“MTL”) subscriptions are identical to QTL subscriptions, except for the term of the license, and the manner in which they are monetized. MTL subscriptions require a Cloud Services Subscription (“CSS”), which is described below. For ATL, revenue allocated$115,680, respectively, were attributable to the term license component is recognized upon delivery at the start of the subscription term while revenue for the SELECT maintenance and support is recognized as delivered over the subscription term. For Virtuoso keys, revenue is recognized as services are delivered. BillingsCompany’s subscription‑based commercial offerings recorded in advance are recorded as Deferred revenuesSubscriptions in the consolidated balance sheets.statements of operations. For usage‑the nine months ended September 30, 2023 and 2022, the Company recognized $444,186 and $380,237 of license related revenues, respectively, of which $411,034 and $349,024, respectively, were attributable to the term license component of the Company’s subscription‑based QTLcommercial offerings recorded in Subscriptions in the consolidated statements of operations.
The Company derived 8% and MTL subscriptions,7% of its total revenues are recognized based upon usage incurred bythrough channel partners for the account. Usage is defined as peak usage over the respective terms. The terms of QTLthree months ended September 30, 2023 and MTL subscriptions align with calendar quarters and calendar months,2022, respectively, and revenue is recognized based on actual usage.7% of its total revenues through channel partners for the nine months ended September 30, 2023 and 2022.
Visas and Passports are quarterly or annual term licenses enabling usersRevenue from external customers is attributed to access specific project or enterprise information and entitles users to certain functionalityindividual countries based upon the location of the Company’s ProjectWise and AssetWise systems. The Company’s standard offeringscustomer. Revenues by geographic region are usage based with monetization through the Company’s CSS program as described below.follows:
| | | | | | | | | | | | | | | | | | | | | | | |
| Three Months Ended | | Nine Months Ended |
| September 30, | | September 30, |
| 2023 | | 2022 | | 2023 | | 2022 |
Americas (1) | $ | 162,367 | | | $ | 141,599 | | | $ | 489,548 | | | $ | 440,218 | |
| Europe, the Middle East, and Africa (“EMEA”) | 86,956 | | | 75,416 | | | 263,232 | | | 227,696 | |
| Asia-Pacific (“APAC”) | 57,289 | | | 51,317 | | | 164,992 | | | 144,220 | |
| Total revenues | $ | 306,612 | | | $ | 268,332 | | | $ | 917,772 | | | $ | 812,134 | |
CSS is a program designed to streamline(1)Americas includes the procurement, administration,United States (“U.S.”), Canada, and payment process. The program requires an estimation of annual usage for CSS eligible offerings and a deposit of funds in advance. Actual consumption is monitored and invoiced againstLatin America (including the deposit on a calendar quarter basis. CSS balances not utilized for eligible products or services may roll over to future periods or are refundable. Paid and unconsumed CSS balances are recorded in Accruals and other current liabilities in the consolidated balance sheets. Software and services consumed under CSS are recognized pursuantCaribbean). Revenue attributable to the applicable revenue recognition guidanceU.S. totaled $129,510 and $122,372 for the respective software or servicethree months ended September 30, 2023 and classified as subscriptions or services based on their respective nature.
Perpetual licenses
Perpetual licenses may be sold with or without attaching a SELECT subscription. Historically, attachment2022, respectively, and retention of the SELECT subscription has been high given the benefits of the SELECT subscription discussed above. Perpetual licenses revenues are recognized upon delivery of the license to the user.
Services
The Company provides professional services, including training, implementation, configuration, customization,$384,807 and strategic consulting services. The Company performs projects on both a time and materials and a fixed fee basis. Certain of the Company’s fixed‑fee arrangements, including its Success Services offerings, are structured as subscription‑like, packaged offerings that are annually recurring in nature. Success Services are standard service offerings that provide a level of dedicated professional services above the standard technical support offered to all accounts as part of their SELECT or enterprise agreement. Revenues are recognized as services are performed.
The Company primarily utilizes its direct internal sales force and also has arrangements through independent channel partners to promote and sell Bentley products and subscriptions to end‑users. Channel partners are authorized to promote the sale of an authorized set of Bentley products and subscriptions within an authorized geography under a Channel Partner Agreement.
Significant Judgments and Estimates
The Company’s contracts with customers may include promises to transfer licenses (perpetual or term‑based), maintenance, and services to a user. Judgment is required to determine if the promises are separate performance obligations, and if so, the allocation of the transaction price to each performance obligation. When an arrangement includes multiple performance obligations which are concurrently delivered and have the same pattern of transfer to the customer, the Company accounts for those performance obligations as a single performance obligation. For contracts with more than one performance obligation, the transaction price is allocated among the performance obligations in an amount that depicts the relative SSP of each obligation. Judgment is required to determine the SSP for each distinct performance obligation. In instances where SSP is not directly observable, such as when the Company does not sell the product or service separately, the Company determines the SSP using information that may include market conditions and other observable inputs. The Company uses a range of amounts to estimate SSP when it sells each of the products and services separately and needs to determine whether there is a discount that should be allocated based on the relative SSP of the various products and services.
The Company’s SELECT agreement provides users with perpetual licenses a right to exchange software for other eligible perpetual licenses on an annual basis upon renewal. The Company refers to this option as portfolio balancing and has concluded that the portfolio balancing feature represents a material right resulting in the deferral of the associated revenue. Judgment is required to estimate the percentage of users who may elect to portfolio balance and considers inputs such as historical user elections. This feature is available once per term and must be exercised prior to the respective renewal term. The Company recognizes the associated revenue upon election or when the portfolio balancing right expires. This right is included in the initial and subsequent renewal terms and the Company reestablishes the revenue deferral$346,961 for the material right upon the beginning of the renewal term. As ofnine months ended September 30, 2023 and 2022, and December 31, 2021, the Company has deferred $16,874 and $18,020, respectively, related to portfolio balancing exchange rights which is included in respectively.Deferred revenues in the consolidated balance sheets.
Contract Assets and Contract Liabilities
| | | September 30, 2022 | | December 31, 2021 | | September 30, 2023 | | December 31, 2022 |
| | | Contract assets | Contract assets | $ | 491 | | | $ | 336 | | Contract assets | $ | 472 | | | $ | 575 | |
| Deferred revenues | Deferred revenues | 201,610 | | | 232,593 | | Deferred revenues | 227,004 | | | 243,073 | |
As of September 30, 20222023 and December 31, 2021,2022, the Company’s contract assets relate to performance obligations completed in advance of the right to invoice and are included in Prepaid and other current assets in the consolidated balance sheets. Contract assets were not impaired as of September 30, 2022 and2023 or December 31, 2021.2022.
Deferred revenues consist of billings made or payments received in advance of revenue recognition from subscriptions and services. The timing of revenue recognition may differ from the timing of billings to users.
For the nine months ended September 30, 2023, $183,335 of revenues that were included in the December 31, 2022 deferred revenues balance were recognized. There were additional deferrals of $169,368 for the nine months ended September 30, 2023, which were primarily related to new billings and acquisitions. For the nine months ended September 30, 2022, $174,194 of revenues that were included in the December 31, 2021 deferred revenues balance were recognized. There were additional deferrals of $158,125 for the nine months ended September 30, 2022, which were primarily related to new billings and acquisitions (see Note 4). For the nine months endedacquisitions.
As of September 30, 2021, $164,539 of revenues that were2023 and December 31, 2022, the Company has deferred $17,873 and $17,338, respectively, related to portfolio balancing exchange rights which is included in Deferred revenues in the December 31, 2020 deferred revenuesconsolidated balance were recognized. There were additional deferrals of $161,578, which were primarily related to new billings and acquisitions (see Note 4).sheets.
Remaining Performance Obligations
The Company’s contracts with customers include amounts allocated to performance obligations that will be satisfied at a later date. As of September 30, 2022,2023, amounts allocated to these remaining performance obligations are $201,610,$227,004, of which the Company expects to recognize approximately 92%93% over the next 12 months with the remaining amount thereafter.
Disaggregation of RevenuesNote 4: Acquisitions
The Company’s revenues consistaggregate details of the following:Company’s acquisition activity are as follows:
| | | | | | | | | | | | | | | | | | | | | | | |
| Three Months Ended | | Nine Months Ended |
| September 30, | | September 30, |
| 2022 | | 2021 | | 2022 | | 2021 |
| Subscriptions: | | | | | | | |
| SELECT subscriptions | $ | 63,609 | | | $ | 66,648 | | | $ | 196,786 | | | $ | 199,722 | |
Enterprise subscriptions (1) | 89,041 | | | 75,381 | | | 252,461 | | | 214,058 | |
| Term license subscriptions | 82,657 | | | 73,106 | | | 259,484 | | | 175,922 | |
| Subscriptions | 235,307 | | | 215,135 | | | 708,731 | | | 589,702 | |
| Perpetual licenses | 9,460 | | | 11,866 | | | 31,213 | | | 33,373 | |
| Subscriptions and licenses | 244,767 | | | 227,001 | | | 739,944 | | | 623,075 | |
| Services: | | | | | | | |
| Recurring | 4,557 | | | 5,160 | | | 13,431 | | | 16,243 | |
| Other | 19,008 | | | 19,227 | | | 58,759 | | | 57,996 | |
| Services | 23,565 | | | 24,387 | | | 72,190 | | | 74,239 | |
| Total revenues | $ | 268,332 | | | $ | 251,388 | | | $ | 812,134 | | | $ | 697,314 | |
| | | | | | | | | | | | | |
| Acquisitions Completed during |
| Nine Months Ended | | |
| September 30, | | |
| 2023 | | 2022 | | |
| |
| | | | | |
| Number of acquisitions | 2 | | | 4 | | | |
Cash paid at closing (1) | $ | 23,375 | | | $ | 738,810 | | | |
| Cash acquired | (265) | | | (19,271) | | | |
| Net cash paid | $ | 23,110 | | | $ | 719,539 | | | |
(1)Enterprise subscriptions includes revenue attributable to E365 subscriptions of $80,298 and $60,102 forOf the three months ended September 30, 2022 and 2021, respectively, and $221,801 and $162,120cash paid at closing for the nine months ended September 30, 2023 and 2022, $1,000 and 2021, respectively.
The Company recognizes perpetual licenses$3,000, respectively, was deposited into an escrow account to secure any potential indemnification and the term license component of subscriptions as revenue when either the licenses are delivered or at the startother obligations of the subscription term. For the three months ended September 30, 2022 and 2021, the Company recognized $125,140 and $109,000 of license related revenues, respectively, of which $115,680 and $97,134, respectively, were attributable to the term license component of the Company’s subscription‑based commercial offerings recorded in Subscriptions in the consolidated statements of operations. For the nine months ended September 30, 2022 and 2021, the Company recognized $380,237 and $293,277 of license related revenues, respectively, of which $349,024 and $259,904, respectively, were attributable to the term license component of the Company’s subscription‑based commercial offerings recorded in Subscriptions in the consolidated statements of operations.
The Company derived 7% of its total revenues through channel partners for the three and nine months ended September 30, 2022 and 2021.
Revenue from external customers is attributed to individual countries based upon the location of the customer. Revenues by geographic region are as follows:
| | | | | | | | | | | | | | | | | | | | | | | |
| Three Months Ended | | Nine Months Ended |
| September 30, | | September 30, |
| 2022 | | 2021 | | 2022 | | 2021 |
Americas (1) | $ | 141,599 | | | $ | 127,996 | | | $ | 440,218 | | | $ | 349,752 | |
| Europe, the Middle East, and Africa (“EMEA”) | 75,416 | | | 76,502 | | | 227,696 | | | 219,507 | |
| Asia-Pacific (“APAC”) | 51,317 | | | 46,890 | | | 144,220 | | | 128,055 | |
| Total revenues | $ | 268,332 | | | $ | 251,388 | | | $ | 812,134 | | | $ | 697,314 | |
(1)Americas includes the United States (“U.S.”), Canada, and Latin America (including the Caribbean). Revenue attributable to the U.S. totaled $122,372 and $105,089 for the three months ended September 30, 2022 and 2021, respectively, and $346,961 and $289,718 for the nine months ended September 30, 2022 and 2021, respectively.seller.
Note 4: Acquisitions
For the nine months ended September 30, 2022 and the year ended December 31, 2021, the Company completed a number of acquisitions, for an aggregate purchase price of $738,814 and $1,269,844, respectively. On January 31, 2022, the Company completed the acquisition of Power Line Systems (“PLS”), a leader in software for the design of overhead electric power transmission lines and their structures, for $695,968 in cash, net of cash acquired. On June 17, 2021, the Company completed the acquisition of Seequent, a leader in software for geological and geophysical modeling, geotechnical stability, and cloud services for geodata management and collaboration, for $883,336 in cash, net of cash acquired, plus 3,141,342 shares of the Company’s Class B Common Stock. The operating results of the acquired businesses except for Seequent, were not material, individually or in the aggregate, to the Company’s consolidated statements of operations.
The aggregate details of the Company’s acquisition activity are as follows:
| | | | | | | | | | | | | |
| Acquisitions Completed in |
| Nine Months Ended | | Year Ended | | |
| September 30, 2022 | | December 31, 2021 | | |
| |
| | | | | |
| Number of acquisitions | 4 | | | 13 | | | |
Cash paid at closing (1) | $ | 738,810 | | | $ | 1,072,820 | | | |
| Cash acquired | (19,271) | | | (37,837) | | | |
| Net cash paid | $ | 719,539 | | | $ | 1,034,983 | | | |
(1)Of the cash paid at closing for the nine months ended September 30, 2022 and year ended December 31, 2021, $3,000 and $8,701, respectively, was deposited into an escrow account to secure any potential indemnification and other obligations of the seller.
The fair value of the contingent consideration from acquisitions is included in the consolidated balance sheets as follows:
| | | | | | | | | | | |
| September 30, 2022 | | December 31, 2021 |
| |
| | | |
| Accruals and other current liabilities | $ | 1,244 | | | $ | 5,382 | |
| Other liabilities | — | | | 1,231 | |
| Contingent consideration from acquisitions | $ | 1,244 | | | $ | 6,613 | |
| | | | | | | | | | | |
| September 30, 2023 | | December 31, 2022 |
| |
| | | |
| Accruals and other current liabilities | $ | 3 | | | $ | 1,196 | |
| | | |
| Contingent consideration from acquisitions | $ | 3 | | | $ | 1,196 | |
The fair value of non-contingent consideration from acquisitions is included in the consolidated balance sheets as follows:
| | | September 30, 2022 | | December 31, 2021 | | September 30, 2023 | | December 31, 2022 |
| | | Accruals and other current liabilities | Accruals and other current liabilities | $ | 2,923 | | | $ | 4,751 | | Accruals and other current liabilities | $ | 3,966 | | | $ | 2,434 | |
| Other liabilities | Other liabilities | 2,995 | | | 6,177 | | Other liabilities | — | | | 2,977 | |
| Non-contingent consideration from acquisitions | Non-contingent consideration from acquisitions | $ | 5,918 | | | $ | 10,928 | | Non-contingent consideration from acquisitions | $ | 3,966 | | | $ | 5,411 | |
The operating results of the acquired businesses are included in the Company’s consolidated financial statements from the closing date of each respective acquisition. The purchase price for each acquisition has been allocated to the net tangible and intangible assets and liabilities based on their estimated fair values at the respective acquisition date.
The Company is in the process of finalizing the purchase accounting for four acquisitionsone acquisition completed during the nine months ended September 30, 2023 and one acquisition completed during the year ended December 31, 2022. Identifiable assets acquired and liabilities assumed were provisionally recorded at their estimated fair values on the respective acquisition date. The initial accounting for these business combinations is not complete because the evaluation necessary to assess the fair values of certain net assets acquired is still in process. The provisional amounts are subject to revision until the evaluations are completed to the extent that additional information is obtained about the facts and circumstances that existed as of the acquisition date. The allocation of the purchase price may be modified from the date of the acquisition as more information is obtained about the fair values of assets acquired and liabilities assumed, however, such measurement period cannot exceed one year.
Acquisition costs are expensed as incurred and are recorded in General and administrative in the consolidated statements of operations. For the three months ended September 30, 20222023 and 2021,2022, the Company’s acquisition expenses were insignificant, and for the nine months ended September 30, 2023 and 2022 were $5,803 and 2021 were $10,824, and $18,037, respectively, which include costs related to legal, accounting, valuation, insurance, general administrative, and other consulting and transaction fees. For the three and nine months ended September 30, 2022, $350 and $10,149, respectively, of the Company’s acquisition expenses related to the acquisition of Power Line Systems. For the three and nine months ended September 30, 2021, $389 and $16,285, respectively, of the Company’s acquisition expenses related to the acquisition of Seequent.PLS.
The following summarizes the fair values of the assets acquired and liabilities assumed, as well as the weighted average useful lives assigned to acquired intangible assets at the respective date of each acquisition (including contingent consideration):
| | | | | | | | | | | | | |
| Acquisitions Completed in | | |
| Nine Months Ended | | Year Ended | | |
| September 30, 2022 | | December 31, 2021 | | |
| Consideration: | | | | | |
| Cash paid at closing | $ | 738,810 | | | $ | 1,072,820 | | | |
Shares issued at closing (1)(2) | — | | | 182,390 | | | |
| Contingent consideration | — | | | 4,544 | | | |
| Deferred, non-contingent consideration, net | 157 | | | 10,090 | | | |
| Other | (153) | | | — | | | |
| Total consideration | $ | 738,814 | | | $ | 1,269,844 | | | |
| Assets acquired and liabilities assumed: | | | | | |
| Cash | $ | 19,271 | | | $ | 37,837 | | | |
| Accounts receivable and other current assets | 1,798 | | | 24,174 | | | |
| Operating lease right-of-use assets | 1,237 | | | 12,095 | | | |
| Property and equipment | 963 | | | 4,383 | | | |
| Other assets | — | | | 874 | | | |
| Software and technology (weighted average useful life of 5 years) | 10,557 | | | 43,560 | | | |
| Customer relationships (weighted average useful life of 10 and 9 years, respectively) | 80,328 | | | 158,555 | | | |
| Trademarks (weighted average useful life of 9 and 10 years, respectively) | 5,734 | | | 38,256 | | | |
| | | | | |
| In-process research and development | — | | | 3,700 | | | |
| Total identifiable assets acquired excluding goodwill | 119,888 | | | 323,434 | | | |
| Accruals and other current liabilities | (918) | | | (27,649) | | | |
| Deferred revenues | (11,563) | | | (26,245) | | | |
| Operating lease liabilities | (1,237) | | | (11,988) | | | |
| Deferred income taxes | (6,865) | | | (53,342) | | | |
| Other liabilities | — | | | (716) | | | |
| Total liabilities assumed | (20,583) | | | (119,940) | | | |
| Net identifiable assets acquired excluding goodwill | 99,305 | | | 203,494 | | | |
| Goodwill | 639,509 | | | 1,066,350 | | | |
| Net assets acquired | $ | 738,814 | | | $ | 1,269,844 | | | |
(1)Of the total 3,141,342 shares issued at closing, 83,627 shares are subject to forfeiture if post‑closing employment service conditions are not met and accordingly are being recorded as stock‑based compensation expense over the related forfeiture period of two years (see Note 15).
(2)A fair value adjustment of $16,943 was applied to the stock consideration due to restrictions on the transfer of securities. | | | | | | | | | | | | | |
| Acquisitions Completed in | | |
| Nine Months Ended | | Year Ended | | |
| September 30, 2023 | | December 31, 2022 | | |
| Consideration: | | | | | |
| Cash paid at closing | $ | 23,375 | | | $ | 763,228 | | | |
| | | | | |
| Contingent consideration | — | | | 1,390 | | | |
| Deferred, non-contingent consideration, net | 525 | | | 749 | | | |
| Other | 56 | | | (269) | | | |
| Total consideration | $ | 23,956 | | | $ | 765,098 | | | |
| Assets acquired and liabilities assumed: | | | | | |
| Cash | $ | 265 | | | $ | 20,221 | | | |
| Accounts receivable and other current assets | 1,706 | | | 8,890 | | | |
| Operating lease right-of-use assets | 397 | | | 1,237 | | | |
| Property and equipment | — | | | 1,316 | | | |
| Deferred income taxes | 2,151 | | | — | | | |
| Other assets | 6 | | | 7 | | | |
| Software and technology (weighted average useful life of 3 and 5 years, respectively) | 2,600 | | | 10,608 | | | |
| Customer relationships (weighted average useful life of 6 and 10 years, respectively) | 3,900 | | | 82,278 | | | |
| Trademarks (weighted average useful life of 5 and 8 years, respectively) | 1,000 | | | 6,972 | | | |
| | | | | |
| | | | | |
| Total identifiable assets acquired excluding goodwill | 12,025 | | | 131,529 | | | |
| Accruals and other current liabilities | (584) | | | (4,079) | | | |
| Deferred revenues | (4,599) | | | (14,176) | | | |
| Operating lease liabilities | (397) | | | (1,237) | | | |
| Deferred income taxes | — | | | (5,745) | | | |
| | | | | |
| Total liabilities assumed | (5,580) | | | (25,237) | | | |
| Net identifiable assets acquired excluding goodwill | 6,445 | | | 106,292 | | | |
| Goodwill | 17,511 | | | 658,806 | | | |
| Net assets acquired | $ | 23,956 | | | $ | 765,098 | | | |
The fair values of the working capital, other assets (liabilities), and property and equipment approximated their respective carrying values as of the acquisition date.
Deferred revenues were determined in accordance with the Company’s revenue recognition policies (see Note 3).policies.
The fair values of the intangible assets were primarily determined using the income approach. When applying the income approach, indications of fair values were developed by discounting future net cash flows to their present values at market‑based rates of return. The cash flows were based on estimates used to price the acquisitions and the discount rates applied were benchmarked with reference to the implied rate of return from the Company’s pricing model and the weighted average cost of capital.
Goodwill recorded in connection with the acquisitions was attributable to synergies expected to arise from cost saving opportunities, as well as future expected cash flows. The Company expects $524,360$7,289 of the goodwill recorded relating to the 20222023 acquisitions will be deductible for income tax purposes.
Unaudited Pro Forma Financial Information
Had the acquisition of Seequent been made at the beginning of 2020, unaudited pro forma total revenues for the nine months ended September 30, 2021 would have been $749,923. Net (loss) income, net (loss) income per share, basic, and net (loss) income per share, diluted for the nine months ended September 30, 2021 would not have been materially different than the amounts reported primarily due to the pro forma adjustments to reflect the amortization of purchased intangibles and the cost to finance the transaction, net of the related tax effects.
The unaudited pro forma financial information is for informational purposes only and is not indicative of the results of operations that would have been achieved if the acquisition had taken place at the beginning of 2021. The unaudited pro forma financial information combines the historical results of the Company, the adjusted historical results of Seequent considering the date the Company completed the acquisition of Seequent, and the effects of the pro forma adjustments described above.
Note 5: Property and Equipment, Net
Property and equipment, net consist of the following:
| | | September 30, 2022 | | December 31, 2021 | | September 30, 2023 | | December 31, 2022 |
| Land | Land | $ | 2,811 | | | $ | 2,811 | | Land | $ | 2,811 | | | $ | 2,811 | |
| Building and improvements | Building and improvements | 35,747 | | | 35,188 | | Building and improvements | 36,293 | | | 35,717 | |
| Computer equipment and software | Computer equipment and software | 50,027 | | | 47,651 | | Computer equipment and software | 64,639 | | | 54,636 | |
| Furniture, fixtures, and equipment | Furniture, fixtures, and equipment | 14,021 | | | 14,274 | | Furniture, fixtures, and equipment | 14,848 | | | 14,600 | |
| Aircraft | Aircraft | 2,038 | | | 4,075 | | Aircraft | 2,038 | | | 2,038 | |
| Other | Other | 38 | | | 61 | | Other | 93 | | | 156 | |
| Property and equipment, at cost | Property and equipment, at cost | 104,682 | | | 104,060 | | Property and equipment, at cost | 120,722 | | | 109,958 | |
| Less: Accumulated depreciation | Less: Accumulated depreciation | (73,929) | | | (72,237) | | Less: Accumulated depreciation | (82,413) | | | (77,707) | |
| Total property and equipment, net | Total property and equipment, net | $ | 30,753 | | | $ | 31,823 | | Total property and equipment, net | $ | 38,309 | | | $ | 32,251 | |
Depreciation expense was $2,613$3,135 and $3,028$2,613 for the three months ended September 30, 20222023 and 2021,2022, respectively, and $8,025$8,769 and $8,142$8,025 for the nine months ended September 30, 2023 and 2022, and 2021, respectively.
Related Party Equipment Sale
In January 2022, the audit committeeAudit Committee of the Company’s boardBoard of directorsDirectors authorized the Company to sell 50% of its interest in the Company’s aircraft at fair market value to an entity controlled by the Company’s Chief Executive Officer. The transaction was completed on February 1, 2022 for $2,380 and resulted in a gain of $2,029, which was recorded in Other income, (expense), net in the consolidated statementstatements of operations for the nine months ended September 30, 2022.2022 (see Note 20). Subsequent to the transaction, ongoing operating and fixed costs of the aircraft are shared on a proportional use basis subject to a cost-sharing agreement. Such costs were not material during the nine months ended September 30, 2023 and 2022. Pursuant to FASB Accounting Standards Codification (“ASC”) Topic 850, Related Party Disclosures, theThe Company determined this transaction was with a related party.
Note 6: Goodwill and Other Intangible Assets
The changes in the carrying amount of goodwill are as follows:
| | | | | |
Balance, December 31, 20212022 | $ | 1,588,4772,237,184 | |
| Acquisitions | 639,50917,511 | |
| |
| Foreign currency translation adjustments | (32,556)(3,179) | |
| Other adjustments | (2,377)(204) | |
Balance, September 30, 20222023 | $ | 2,193,0532,251,312 | |
Details of intangible assets other than goodwill are as follows:
| | | September 30, 2022 | | December 31, 2021 | | September 30, 2023 | | December 31, 2022 |
| | Estimated
Useful Life | | Gross
Carrying
Amount | | Accumulated
Amortization | | Net Book
Value | | Gross
Carrying
Amount | | Accumulated
Amortization | | Net Book
Value | | Estimated
Useful Life | | Gross
Carrying
Amount | | Accumulated
Amortization | | Net Book
Value | | Gross
Carrying
Amount | | Accumulated
Amortization | | Net Book
Value |
| Intangible assets subject to amortization: | Intangible assets subject to amortization: | | | | | | | | | | | | | | Intangible assets subject to amortization: | | | | | | | | | | | | | |
| Software and technology | Software and technology | 3-5 years | | $ | 91,357 | | | $ | (51,503) | | | $ | 39,854 | | | $ | 101,588 | | | $ | (63,225) | | | $ | 38,363 | | Software and technology | 3-5 years | | $ | 88,675 | | | $ | (55,305) | | | $ | 33,370 | | | $ | 92,390 | | | $ | (51,938) | | | $ | 40,452 | |
| Customer relationships | Customer relationships | 3-10 years | | 317,332 | | | (102,898) | | | 214,434 | | | 245,325 | | | (83,799) | | | 161,526 | | Customer relationships | 3-10 years | | 323,223 | | | (135,237) | | | 187,986 | | | 323,164 | | | (114,387) | | | 208,777 | |
| Trademarks | Trademarks | 3-10 years | | 68,016 | | | (24,894) | | | 43,122 | | | 63,080 | | | (20,893) | | | 42,187 | | Trademarks | 3-10 years | | 70,510 | | | (31,979) | | | 38,531 | | | 69,803 | | | (26,904) | | | 42,899 | |
| Non-compete agreements | Non-compete agreements | 5 years | | 350 | | | (190) | | | 160 | | | 350 | | | (139) | | | 211 | | Non-compete agreements | 5 years | | 350 | | | (258) | | | 92 | | | 350 | | | (207) | | | 143 | |
| | 477,055 | | | (179,485) | | | 297,570 | | | 410,343 | | | (168,056) | | | 242,287 | | |
| Intangible assets not subject to amortization: | | |
| In-process research and development | | 3,603 | | | — | | | 3,603 | | | 3,547 | | | — | | | 3,547 | | |
| | Total intangible assets | Total intangible assets | | $ | 480,658 | | | $ | (179,485) | | | $ | 301,173 | | | $ | 413,890 | | | $ | (168,056) | | | $ | 245,834 | | Total intangible assets | | $ | 482,758 | | | $ | (222,779) | | | $ | 259,979 | | | $ | 485,707 | | | $ | (193,436) | | | $ | 292,271 | |
The aggregate amortization expense for purchased intangible assets with finite lives was reflected in the Company’s consolidated statements of operations as follows:
| | | Three Months Ended | | Nine Months Ended | | Three Months Ended | | Nine Months Ended |
| | September 30, | | September 30, | | September 30, | | September 30, |
| | 2022 | | 2021 | | 2022 | | 2021 | | 2023 | | 2022 | | 2023 | | 2022 |
| Cost of subscriptions and licenses | Cost of subscriptions and licenses | $ | 3,129 | | | $ | 2,771 | | | $ | 9,305 | | | $ | 5,017 | | Cost of subscriptions and licenses | $ | 3,161 | | | $ | 3,129 | | | $ | 9,471 | | | $ | 9,305 | |
| Amortization of purchased intangibles | Amortization of purchased intangibles | 10,446 | | | 8,676 | | | 30,869 | | | 16,703 | | Amortization of purchased intangibles | 9,517 | | | 10,446 | | | 29,567 | | | 30,869 | |
| Total amortization expense | Total amortization expense | $ | 13,575 | | | $ | 11,447 | | | $ | 40,174 | | | $ | 21,720 | | Total amortization expense | $ | 12,678 | | | $ | 13,575 | | | $ | 39,038 | | | $ | 40,174 | |
Note 7: Investments
Investments consist of the following:
| | | | | | | | | | | |
| September 30, 2023 | | December 31, 2022 |
| |
| | | |
| Cost method investments | $ | 27,957 | | | $ | 22,174 | |
| Equity method investments | 2,375 | | | 96 | |
| Total investments | $ | 30,332 | | | $ | 22,270 | |
Note 7: Investments
As of September 30, 2022 and December 31, 2021, the Company’s investments consist of cost method investments of $21,690 and $6,438, respectively. The carrying amount of the Company’s equity method investment was zero as of September 30, 2022 and December 31, 2021.
Cost Method Investments
Through its iTwin Ventures, initiative, the Company invests in technology development companies, generally in the form of equity interests or convertible notes. In March 2023, the Company acquired an equity interest in Worldsensing, a leading global connectivity hardware platform company for infrastructure monitoring, via contribution of its sensemetrics’ Thread connectivity device business (the “Thread business”) and cash. The non‑cash contribution of the Thread business resulted in an insignificant gain, which was recorded in Other income, net in the consolidated statements of operations for the nine months ended September 30, 2023 (see Note 20). In July 2022, the Company acquired an equity interest in Teralytics Holdings AG (“Teralytics”), a global platform company for human mobility analysis, via contributionanalysis.
During the second quarter of its Streetlytics mobility data business (“Streetlytics”)2023, the Company recognized impairment charges of $7,318 to write-down certain cost method investments to their fair value primarily as a result of the investees’ decline in operating performance and cash.the overall decline in the venture investment valuation environment. The transaction resultedimpairment charges were recorded in an insignificant gain fromOther income, net in the divestitureconsolidated statements of Streetlytics,operations for the nine months ended September 30, 2023 (see Note 20).
During the third quarter of 2023, the Company recognized gains on investments of $2,360, which was recorded in Other income, (expense), net in the consolidated statements of operations for the three and nine months ended September 30, 2022. As of2023 (see Note 20).
During the nine months ended September 30, 2022,2023, the Company invested a total of $12,591, including $8,928 of cash and non-cash for our investment in Teralytics was $11,130. Including the contribution of Streetlytics, forWorldsensing. During the nine months ended September 30, 2022, the Company invested a total of $14,921.$14,921, including $11,130 of cash and non-cash for our investment in Teralytics. As of September 30, 2023, our investment balance in Worldsensing and Teralytics was $8,928 and $7,270, respectively. As of December 31, 2022, our investment balance in Teralytics was $11,130.
Equity Method InvestmentInvestments
Digital Construction Works, Inc. (“DCW”), a 50%‑ownedThe Company is party to joint venture with Topcon Positioning Systems, Inc., operates as a digital integrator of software and cloud servicesventures, which are accounted for using the construction industry. DCW’s focus is to transform the construction industry from its legacy document‑centric paradigm by simplifying and enabling digital automated workflows and processes, technology integration, and digital twinning services for infrastructure.equity method. For the nine months ended September 30, 2023 and 2022, the Company invested $2,261 and $1,700, in DCW. Pursuant to FASB ASC Topic 850, Related Party Disclosures, the Company has determined that DCW is a related party. For the nine months ended September 30, 2022, transactions between the Company and DCW were not material to the Company’s consolidated financial statements.respectively.
Note 8: Leases
The Company’s operating leases consist of office facilities, office equipment, and automobiles, and the Company’s finance lease consists of computer equipment. The finance lease is not material for the periods presented and it expired during the second quarter of 2022.automobiles. As of September 30, 2022,2023, the Company’s leases have remaining terms of less than one year to eightten years, some of which include one or more options to renew, with renewal terms from one year to tenfive years and some of which include options to terminate the leases from less than one year to five years.
For contracts with lease and non‑lease components, the Company has elected not to allocate the contract consideration, and account for the lease and non-lease components as a single lease component. Payments under the Company’s lease arrangements are primarily fixed, however, certain lease agreements contain variable payments, which are expensed as incurred and not included in the operating lease assets and liabilities. Variable lease cost may include common area maintenance, property taxes, utilities, and fluctuations in rent due to a change in an index or rate. The Company has elected not to recognize a right‑of‑use asset or lease liability for short‑term leases (leases with a term of twelve months or less). Short‑term leases are recognized in the consolidated statements of operations on a straight‑line basis over the lease term.
The components of operating lease cost reflected in the consolidated statements of operations were as follows:
| | | Three Months Ended | | Nine Months Ended | | Three Months Ended | | Nine Months Ended |
| | September 30, | | September 30, | | September 30, | | September 30, |
| | 2022 | | 2021 | | 2022 | | 2021 | | 2023 | | 2022 | | 2023 | | 2022 |
Operating lease cost (1) | Operating lease cost (1) | $ | 4,703 | | | $ | 4,836 | | | $ | 15,651 | | | $ | 14,224 | | Operating lease cost (1) | $ | 4,312 | | | $ | 4,703 | | | $ | 13,474 | | | $ | 15,651 | |
| Variable lease cost | Variable lease cost | 1,115 | | | 1,082 | | | 3,356 | | | 2,970 | | Variable lease cost | 1,133 | | | 1,115 | | | 3,481 | | | 3,356 | |
| Short-term lease cost | Short-term lease cost | 6 | | | 4 | | | 16 | | | 15 | | Short-term lease cost | — | | | 6 | | | — | | | 16 | |
| Total operating lease cost | Total operating lease cost | $ | 5,824 | | | $ | 5,922 | | | $ | 19,023 | | | $ | 17,209 | | Total operating lease cost | $ | 5,445 | | | $ | 5,824 | | | $ | 16,955 | | | $ | 19,023 | |
|
(1)Operating lease cost includes rent cost related to operating leases for office facilities of $4,553$4,180 and $4,619$4,553 for the three months ended September 30, 20222023 and 2021,2022, respectively, and $15,120$12,926 and $13,588$15,120 for the nine months ended September 30, 20222023 and 2021,2022, respectively.
Supplemental operating cash flow and other information related to leases was as follows:
| | | | | | | | | | | |
| Nine Months Ended |
| September 30, |
| |
| 2022 | | 2021 |
| Cash paid for amounts included in the measurement of lease liabilities: | | | |
| Operating cash flows from operating leases | $ | 14,295 | | | $ | 14,602 | |
Right-of-use assets obtained in exchange for new operating lease liabilities (1) | $ | 7,763 | | | $ | 5,286 | |
| | | | | | | | | | | |
| Nine Months Ended |
| September 30, |
| 2023 | | 2022 |
| Cash paid for operating leases included in operating cash flows | $ | 13,830 | | | $ | 14,295 | |
Right-of-use assets obtained in exchange for new operating lease liabilities (1) | $ | 14,794 | | | $ | 7,763 | |
(1)Right‑of‑use assets obtained in exchange for new operating lease liabilities does not include the impact from acquisitions of $1,237$397 and $12,074$1,237 for the nine months ended September 30, 20222023 and 2021,2022, respectively.
The weighted average remaining lease term for operating leases was 3.94.7 years and 4.13.9 years as of September 30, 20222023 and December 31, 2021,2022, respectively. The weighted average discount rate was 3.2%4.6% and 2.5%3.4% as of September 30, 20222023 and December 31, 2021,2022, respectively.
Maturities of operating lease liabilities are as follows:
| | | | | | |
| | September 30, 2022 |
| Remainder of 2022 | | $ | 4,552 | |
| 2023 | | 14,841 | |
| 2024 | | 9,906 | |
| 2025 | | 6,918 | |
| 2026 | | 4,402 | |
| Thereafter | | 6,238 | |
| Total future lease payments | | 46,857 | |
| Less: Imputed interest | | (3,003) | |
| Total operating lease liabilities | | $ | 43,854 | |
As of September 30, 2022,2023, the Company had additional minimum operating lease minimum lease payments of $3,878$961 for executed leases that have not yet commenced, primarily for office locations.
Supplemental balance sheet information related to the financing lease was as follows:
| | | | | | | |
| | | December 31, 2021 |
| | | |
| | | |
Property and equipment | | | $ | 484 | |
Accumulated depreciation | | | (453) | |
Property and equipment, net | | | $ | 31 | |
| | | |
| | | |
| | | |
Total financing lease liabilities included in Accruals and other current liabilities
| | | $ | 98 | |
Note 9: Accruals and Other Current Liabilities
Accruals and other current liabilities consist of the following:
| | | September 30, 2022 | | December 31, 2021 | | September 30, 2023 | | December 31, 2022 |
| | | CSS deposits | $ | 202,152 | | | $ | 162,046 | | |
| Cloud Services Subscription (“CSS”) deposits | | Cloud Services Subscription (“CSS”) deposits | $ | 269,047 | | | $ | 201,082 | |
| Accrued benefits | Accrued benefits | 36,756 | | | 36,656 | | Accrued benefits | 36,814 | | | 35,493 | |
| Accrued compensation | Accrued compensation | 34,383 | | | 37,725 | | Accrued compensation | 34,631 | | | 40,296 | |
| Due to customers | Due to customers | 13,729 | | | 12,798 | | Due to customers | 16,738 | | | 13,720 | |
| Accrued indirect taxes | | Accrued indirect taxes | 5,804 | | | 9,766 | |
| Accrued professional fees | | Accrued professional fees | 4,152 | | | 4,984 | |
| Non-contingent consideration from acquisitions | | Non-contingent consideration from acquisitions | 3,966 | | | 2,434 | |
| Accrued acquisition stay bonus | Accrued acquisition stay bonus | 8,102 | | | 9,461 | | Accrued acquisition stay bonus | 3,765 | | | 9,135 | |
| Accrued cloud provisioning costs | Accrued cloud provisioning costs | 4,792 | | | 5,862 | | Accrued cloud provisioning costs | 3,469 | | | 4,224 | |
| Accrued professional fees | 4,518 | | | 6,940 | | |
| Non-contingent consideration from acquisitions | 2,923 | | | 4,751 | | |
| Employee stock purchase plan contributions | Employee stock purchase plan contributions | 2,693 | | | 4,818 | | Employee stock purchase plan contributions | 2,923 | | | 5,230 | |
| Accrued indirect taxes | 2,627 | | | 7,520 | | |
| Deferred compensation plan liabilities | Deferred compensation plan liabilities | 1,977 | | | 7,309 | | Deferred compensation plan liabilities | 2,182 | | | 2,067 | |
| Contingent consideration from acquisitions | Contingent consideration from acquisitions | 1,244 | | | 5,382 | | Contingent consideration from acquisitions | 3 | | | 1,196 | |
| Other accrued and current liabilities | Other accrued and current liabilities | 21,546 | | | 22,335 | | Other accrued and current liabilities | 19,934 | | | 32,421 | |
| Total accruals and other current liabilities | Total accruals and other current liabilities | $ | 337,442 | | | $ | 323,603 | | Total accruals and other current liabilities | $ | 403,428 | | | $ | 362,048 | |
Note 10: Long‑TermLong-Term Debt
Long‑term debt consists of the following:
| | | | | | | | | | | |
| September 30, 2022 | | December 31, 2021 |
| |
| | | |
| Bank credit facility: | | | |
| Revolving loan facility | $ | 344,661 | | | $ | — | |
| Term loan: | | | |
| Principal | 196,250 | | | 200,000 | |
| Unamortized debt issuance costs | (431) | | | (534) | |
| Term loan net carrying value | 195,819 | | | 199,466 | |
| Bank credit facility net carrying value | 540,480 | | | 199,466 | |
| 2026 Notes: | | | |
| Principal | 690,000 | | | 690,000 | |
| Unamortized debt issuance costs | (11,953) | | | (14,677) | |
| 2026 Notes net carrying value | 678,047 | | | 675,323 | |
| 2027 Notes: | | | |
| Principal | 575,000 | | | 575,000 | |
| Unamortized debt issuance costs | (11,917) | | | (13,797) | |
| 2027 Notes net carrying value | 563,083 | | | 561,203 | |
| Total net carrying value | 1,781,610 | | | 1,435,992 | |
| Less: Current portion of long-term debt | (5,000) | | | (5,000) | |
| Total long-term debt | $ | 1,776,610 | | | $ | 1,430,992 | |
| | | | | | | | | | | |
| September 30, 2023 | | December 31, 2022 |
| |
| | | |
| Credit facility: | | | |
| Revolving loan facility due November 2025 | $ | 153,445 | | | $ | 345,597 | |
| Term loan due November 2025 | 191,250 | | | 195,000 | |
| Convertible senior notes due January 2026 (the “2026 Notes”) | 687,830 | | | 687,830 | |
| Convertible senior notes due July 2027 (the “2027 Notes”) | 575,000 | | | 575,000 | |
| Unamortized debt issuance costs | (18,023) | | | (22,731) | |
| Total debt | 1,589,502 | | | 1,780,696 | |
| Less: Current portion of long-term debt | (8,750) | | | (5,000) | |
| Long-term debt | $ | 1,580,752 | | | $ | 1,775,696 | |
Bank Credit Facility
The Company has anis party to a Credit Agreement dated December 19, 2017 (as amended and restated Credit Agreement,from time to time), which provides for an $850,000 senior secured revolving loan facility with a maturity date ofthat matures on November 15, 2025 (the “Credit Facility”). The Credit Facility also provides up to $50,000 of letters of credit and other borrowings subject to availability, including an $85,000 U.S. dollar swingline sub‑facility and a $200,000 incremental “accordion” sub‑facility. Debt issuance costs are amortized to interest expense through the maturity date.
Under the Credit Facility, the Company has a $200,000 senior secured term loan as described further below (the “Credit Facility”).
The Company’s $200,000 senior secured term loan haswith a maturity of November 15, 2025 (the “2021 Term“Term Loan”). The 2021 Term Loan requires principal repayment at the end of each calendar quarter. Beginning with March 31, 2022 and ending with December 31, 2023, the Company is required to repay $1,250 per quarter. Beginning with March 31, 2024 and ending with the last such date prior to the maturity date, the Company is required to repay $2,500 per quarter. The Company incurred $540 of debt issuance costs related to the 2021 Term Loan. The Company used borrowings under the 2021 Term Loan to pay down borrowings under the swingline sub‑facility and revolving loan facility under the Credit Facility.
In addition to the senior secured revolving loan facility, the Credit Facility also provides up to $50,000 of letters of credit and other borrowings subject to availability, including a $85,000 U.S. Dollar swingline sub‑facility and a $200,000 incremental “accordion” sub‑facility. The Company had $150 of letters of credit and surety bonds outstanding as of September 30, 20222023 and December 31, 2021.2022 under the Credit Facility. As of September 30, 20222023 and December 31, 2021,2022, the Company had $505,189$696,405 and $849,850,$504,253, respectively, available under the Credit Facility.
Effective June 23, 2023, the Company amended the Credit Facility to replace the referenced interest rate based on LIBOR with the Secured Overnight Financing Rate (“SOFR”).
Revolving loan borrowings under the Credit Facility bear interest at variable rates that reset every one, three, or six months depending on the period selected by the Company. Under the Term SOFR elections, revolving loan borrowings bear an interest rate of the applicable term SOFR rate plus 10 basis points (“bps”), plus a spread ranging from 125 bps to 225 bps as determined by the Company’s net leverage ratio. Under the non‑Term SOFR elections, revolving loan borrowings bear a base interest rate of the highest of (i) the prime rate, (ii) the overnight bank funding effective rate plus 50 bps, or (iii) the applicable term SOFR rate plus 10 bps, plus a spread ranging from 25 bps to 125 bps as determined by the Company’s net leverage ratio.
Swingline borrowings under the Credit Facility bear interest that resets daily. Interest on U.S. dollar swingline borrowings bear an interest rate of the daily simple SOFR rate plus 3.5 bps, plus a spread ranging from 125 bps to 225 bps as determined by the Company’s net leverage ratio. The Company cannot make optional currency swingline borrowings without the consent of the applicable swingline lender.
Term loan borrowings under the Credit Facility bear interest at variable rates that reset every one, three, or six months depending on the period selected by the Company. Under the Term SOFR elections, term loan borrowings bear an interest rate of the applicable term SOFR rate plus 10 bps, plus a spread ranging from 100 bps to 200 bps as determined by the Company’s net leverage ratio. Under the non‑Term SOFR elections, term loan borrowings bear a base interest rate of the highest of (i) the prime rate, (ii) the overnight bank funding effective rate plus 50 bps, or (iii) the applicable term SOFR rate plus 10 bps, plus a spread ranging from 0 bps to 100 bps as determined by the Company’s net leverage ratio.
In addition, a commitment fee for the unused Credit Facility ranges from 20 bps to 30 bps as determined by the Company’s net leverage ratio.
Borrowings under the Credit Facility are guaranteed by all of the Company’s material first tier domestic subsidiaries and are secured by a first priority security interest in substantially all of the Company’s and the guarantors’ U.S. assets and 65% of the stock of their directly owned foreign subsidiaries.
The agreement governing the Credit Facility contains customary positive and negative covenants, including restrictions on our ability to pay dividends and make other restricted payments, as well as events of default, including, without limitation, payment defaults, breaches of representations and warranties, covenants defaults, cross-defaults to certain other indebtedness in excess of $50,000, certain events of bankruptcy and insolvency, judgment defaults in excess of $10,000, failure of any security document supporting the Credit Facility to be in full force and effect, and a change of control. The Credit Facility also contains both affirmative and negativecustomary financial covenants, including maximum net leverage ratios.ratio. As of September 30, 20222023 and December 31, 2021,2022, the Company was in compliance with all covenants in its Credit Facility.
Convertible Senior Notes
2026 Notes
On January 26, 2021, the Company completed a private offeringVoluntary prepayments of $690,000 of 0.125% convertible senior notes due 2026 (the “2026 Notes”). The 2026 Notes were issued pursuant to an indenture, dated as of January 26, 2021, between the Company and Wilmington Trust, National Association, as trustee (the “2026 Indenture”). Interest will accrue from January 26, 2021 and will be payable semi‑annually in arrears in cash on January 15 and July 15 of each year, with the first payment due on July 15, 2021. The 2026 Notes will mature on January 15, 2026, unless earlier converted, redeemed or repurchased. The Company incurred $18,055 of expenses in connection with the 2026 Notes offering consisting of the payment of initial purchasers’ discounts and commissions, professional fees, and other expenses (“transaction costs”). The Company used $25,530 of the net proceeds from the sale of the 2026 Notes to pay the premiums of the capped call options described further below, and approximately $250,500 to repayamounts outstanding indebtedness under the Credit Facility, and to pay related fees and expenses. The Company used the remainder of the net proceeds from the sale of the 2026 Notes for general corporate purposes and towards funding certain acquisitions, including Seequent (see Note 4).
Prior to October 15, 2025, the 2026 Notes will be convertible at the option of the holder only under the following circumstances: (1) during any calendar quarter (and only during such quarter) commencing after the calendar quarter ending on June 30, 2021, if the last reported sale price per share of the Company’s Class B Common Stock exceeds 130% of the conversion price for each of at least 20 trading days, whether or not consecutive, during the 30 consecutive trading days ending on, and including, the last trading day of the immediately preceding calendar quarter; (2) during the five consecutive business days immediately after any ten consecutive trading day period (such ten consecutive trading day period, the “measurement period”) in which the trading price per $1 principal amount of 2026 Notes for each trading day of the measurement period was less than 98% of the product of the last reported sale price per share of the Company’s Class B Common Stock on such trading day and the conversion rate on such trading day; (3) upon the occurrence of certain corporate events or distributions on the Company’s Class B Common Stock, as described in the 2026 Indenture; and (4) if the Company calls the 2026 Notes for redemption. On or after October 15, 2025 until 5:00 p.m., New York City time, on the second scheduled trading day immediately before the maturity date, the 2026 Notes will be convertible at the option of the holder at any time.
The Company will settle conversions by paying or delivering, as applicable, cash, shares of the Company’s Class B Common Stock or a combination of cash and shares of the Company’s Class B Common Stock, at the Company’s election, based on the applicable conversion rate. The initial conversion rate is 15.5925 shares of the Company’s Class B Common Stock per $1 principal amount of 2026 Notes, which represents an initial conversion price of approximately $64.13 per share, and is subject to adjustment as described in the 2026 Indenture. If a “make-whole fundamental change” (as defined in the 2026 Indenture) occurs, then the Company will, in certain circumstances, increase the conversion rate for a specified period of time.
The Company will have the option to redeem the 2026 Notes in whole or in part, are permitted at any time, so long as the Company gives notice as required by the Credit Facility. However, if prepayment is made with respect to a SOFR‑based loan and the prepayment is made on or after January 20, 2024 and on or before the 40th scheduled trading day immediately before the maturitya date if the last reported sale price per share of the Company’s Class B common stock exceeds 130% of the conversion price on (1) each of at least 20 trading days, whether or not consecutive, during any 30 consecutive trading days ending on, and including, the trading day immediately before theother than an interest payment date, the Company sends the related redemption notice; and (2) the trading day immediately before the date the Company sends such notice. The redemption price will be equal to the principal amount of the 2026 Notes to be redeemed, plus accrued and unpaid interest, if any, to, but excluding, the redemption date.
Upon a fundamental change (as defined in the 2026 Indenture), holders may,is subject to certain exceptions, require the Company to purchase their 2026customary breakage costs.
Convertible Senior Notes in whole or in part for cash at a price equal to the principal amount of the 2026 Notes to be purchased, plus accrued and unpaid interest, if any, to, but excluding, the fundamental change repurchase date (as defined in the 2026 Indenture). In addition, upon a Make‑Whole Fundamental Change (as defined in the 2026 Indenture), the Company will, under certain circumstances, increase the applicable conversion rate for a holder that elects to convert its 2026 Notes in connection with such Make‑Whole Fundamental Change. No adjustment to the conversion rate will be made if the stock price in such Make‑Whole Fundamental Change is either less than $44.23 per share or greater than $210.00 per share. The Company will not increase the conversion rate to an amount that exceeds 22.6090 shares per $1 principal amount of 2026 Notes, subject to adjustment. The 2026 Indenture also contains a customary merger covenant.
The 2026 Notes were accounted for as debt, with no bifurcation of the embedded conversion feature. Transaction costs were recorded as a direct deduction from the related debt liability in the consolidated balance sheet and are amortized to interest expense over the term of the 2026 Notes. The effective interest rate for the 2026 Notes is 0.658%.
As of September 30, 2022, none of the conditions of the 2026 Notes to early convert has been met.
The 2026 Notes contain both affirmative2023 and negative covenants. As of September 30,December 31, 2022, the Company was in compliance with all covenants in the 2026 Notes.
Capped Call Options — In connection with the pricing of the 2026 Notes, the Company entered into capped call options with certain of the initial purchasers or their respective affiliates and certain other financial institutions. The Company incurred $150 of expenses in connection with the capped call options. The capped call options are expected to reduce potential dilution to the Company’s Class B Common Stock upon any conversion of 2026 Notes and/or offset any cash payments the Company is required to make in excess of the principal amount of converted notes, as the case may be, with such reduction and/or offset subject to a cap. The cap price of the capped call options is initially $72.9795 per share, which represents a premium of 65% above the last reported sale price per share of the Company’s Class B Common Stock on the Nasdaq Global Select Market on January 21, 2021 and is subject to customary adjustments under the terms of the capped call options.
The capped call options were entered into in conjunction with the issuance of the 2026 Notes, however, they are legally separate agreements that can be separately exercised, with the receipt of shares under the capped call options having no effect on the 2026 Notes and are legally detachable. As the capped call options are both legally detachable and separately exercisable from the 2026 Notes, the Company accounts for the capped call options separately from the 2026 Notes. The capped call options are indexed to the Company’s own common stock and classified in stockholders’ equity. As such, the premiums paid for the capped call options have been included as a net reduction to Additional paid-in capital in the consolidated balance sheet.
2027 Notes
On June 28, 2021, the Company completed a private offering of $575,000 of 0.375% convertible senior notes due 2027 (the “2027 Notes”). The 2027 Notes, were issued pursuant to an indenture, dated as of June 28, 2021, between the Company and Wilmington Trust, National Association, as trustee (the “2027 Indenture”). Interest will accrue from June 28, 2021 and will be payable semi‑annually in arrears in cash on January 1 and July 1 of each year, with the first payment due on January 1, 2022. The 2027 Notes will mature on July 1, 2027, unless earlier converted, redeemed or repurchased. The Company incurred $15,065 of expenses in connection with the 2027 Notes offering consisting of transaction costs. The Company used $25,875 of the net proceeds from the sale of the 2027 Notes to pay the premiums of the capped call options described further below, and $536,062 to repay outstanding indebtedness under the Credit Facility and to pay related fees and expenses.
Prior to April 1, 2027, the 2027 Notes will be convertible at the option of the holder only under the following circumstances: (1) during any calendar quarter (and only during such quarter) commencing after the calendar quarter ending on September 30, 2021, if the last reported sale price per share of the Company’s Class B Common Stock exceeds 130% of the conversion price for each of at least 20 trading days, whether or not consecutive, during the 30 consecutive trading days ending on, and including, the last trading day of the immediately preceding calendar quarter; (2) during the five consecutive business days immediately after any ten consecutive trading day period (such ten consecutive trading day period, the “measurement period”) in which the trading price per $1 principal amount of 2027 Notes for each trading day of the measurement period was less than 98% of the product of the last reported sale price per share of the Company’s Class B Common Stock on such trading day and the conversion rate on such trading day; (3) upon the occurrence of certain corporate events or distributions on the Company’s Class B Common Stock, as described in the 2027 Indenture; and (4) if the Company calls the 2027 Notes for redemption. On or after April 1, 2027 until 5:00 p.m., New York City time, on the second scheduled trading day immediately before the maturity date, the 2027 Notes will be convertible at the option of the holder at any time.
The Company will settle conversions by paying or delivering, as applicable, cash, shares of the Company’s Class B Common Stock or a combination of cash and shares of the Company’s Class B Common Stock, at the Company’s election, based on the applicable conversion rate. The initial conversion rate is 12.0153 shares of the Company’s Class B Common Stock per $1 principal amount of 2027 Notes, which represents an initial conversion price of approximately $83.23 per share, and is subject to adjustment as described in the 2027 Indenture. If a “make-whole fundamental change” (as defined in the 2027 Indenture) occurs, then the Company will, in certain circumstances, increase the conversion rate for a specified period of time.
The Company will have the option to redeem the 2027 Notes in whole or in part at any time on or after July 5, 2024 and on or before the 40th scheduled trading day immediately before the maturity date if the last reported sale price per share of the Company’s Class B common stock exceeds 130% of the conversion price on (1) each of at least 20 trading days, whether or not consecutive, during any 30 consecutive trading days ending on, and including, the trading day immediately before the date the Company sends the related redemption notice; and (2) the trading day immediately before the date the Company sends such notice. The redemption price will be equal to the principal amount of the 2027 Notes to be redeemed, plus accrued and unpaid interest, if any, to, but excluding, the redemption date.
Upon a fundamental change (as defined in the 2027 Indenture), holders may, subject to certain exceptions, require the Company to purchase their 2027 Notes in whole or in part for cash at a price equal to the principal amount of the 2027 Notes to be purchased, plus accrued and unpaid interest, if any, to, but excluding, the fundamental change repurchase date (as defined in the 2027 Indenture). In addition, upon a Make‑Whole Fundamental Change (as defined in the 2027 Indenture), the Company will, under certain circumstances, increase the applicable conversion rate for a holder that elects to convert its 2027 Notes in connection with such Make‑Whole Fundamental Change. No adjustment to the conversion rate will be made if the stock price in such Make‑Whole Fundamental Change is either less than $61.65 per share or greater than $325.00 per share. The Company will not increase the conversion rate to an amount that exceeds 16.2206 shares per $1 principal amount of 2027 Notes, subject to adjustment. The 2027 Indenture also contains a customary merger covenant.
The 2027 Notes were accounted for as debt, with no bifurcation of the embedded conversion feature. Transaction costs were recorded as a direct deduction from the related debt liability in the consolidated balance sheet and are amortized to interest expense over the term of the 2027 Notes. The effective interest rate for the 2027 Notes is 0.864%.
As of September 30, 2022, none of the conditions of the 2026 Notes or 2027 Notes to early convert hashad been met.
Derivative Arrangements
The 2027 Notes contain both affirmativeCompany records derivative instruments as an asset or liability measured at fair value and negative covenants. Asdepending on the nature of September 30, 2022, the Company was in compliance with all covenantshedge, the corresponding changes in the 2027 Notes.fair value of these instruments are recorded in the consolidated statements of operations or comprehensive income. If the derivative is determined to be a hedge, changes in the fair value of the derivative are offset against the change in the fair value of the hedged assets or liabilities through the consolidated statements of operations or recognized in Other comprehensive income (loss), net of taxes until the hedged item is recognized in the consolidated statements of operations. The ineffective portion of a derivative’s change in fair value is recognized in earnings. Also, changes in the entire fair value of a derivative that is not designated as a hedge are recognized in earnings.
Capped Call Options — In connection with the pricing of the 2027 Notes,Effective on April 2, 2020, the Company entered into capped call optionsan interest rate swap with certaina notional amount of the initial purchasers or their respective affiliates$200,000 and certain other financial institutions. The Company incurred $50 of expenses in connection with the capped call options. The capped call options are expecteda ten‑year term to reduce potential dilution to the Company’s Class B Common Stock upon any conversion of 2027 Notes and/or offset any cash payments the Company is required to make in excess of the principal amount of converted notes, as the case may be, with such reduction and/or offset subject to a cap. The cap price of the capped call options is initially $95.5575 per share, which represents a premium of 55% above the last reported sale price per share of the Company’s Class B Common Stock on the Nasdaq Global Select Market on June 23, 2021 and is subject to customary adjustments under the terms of the capped call options.
The capped call options were entered into in conjunction with the issuance of the 2027 Notes, however, they are legally separate agreements that can be separately exercised, with the receipt of shares under the capped call options having no effect on the 2027 Notes, and are legally detachable. As the capped call options are both legally detachable and separately exercisable from the 2027 Notes, the Company accounts for the capped call options separately from the 2027 Notes. The capped call options are indexed to the Company’s own common stock and classified in stockholders’ equity. As such, the premiums paid for the capped call options have been included as a net reduction to Additional paid-in capital in the consolidated balance sheet.
Interest Expense
Interest expense consists of the following:
| | | | | | | | | | | | | | | | | | | | | | | |
| Three Months Ended | | Nine Months Ended |
| September 30, | | September 30, |
| 2022 | | 2021 | | 2022 | | 2021 |
| Bank credit facility: | | | | | | | |
Revolving loan facility (1) | $ | 4,441 | | | $ | 911 | | | $ | 10,206 | | | $ | 2,490 | |
Term loan (1) | 2,119 | | | — | | | 4,577 | | | — | |
| Interest rate swap | (752) | | | 325 | | | (475) | | | 942 | |
| Amortization and write-off of deferred debt issuance costs | 288 | | | 253 | | | 864 | | | 1,049 | |
| 6,096 | | | 1,489 | | | 15,172 | | | 4,481 | |
| 2026 Notes: | | | | | | | |
| 0.125% Coupon interest | 216 | | | 221 | | | 662 | | | 592 | |
| Amortization of deferred debt issuance costs | 908 | | | 909 | | | 2,724 | | | 2,470 | |
| 1,124 | | | 1,130 | | | 3,386 | | | 3,062 | |
| 2027 Notes: | | | | | | | |
| 0.375% Coupon interest | 569 | | | 551 | | | 1,647 | | | 563 | |
| Amortization of deferred debt issuance costs | 626 | | | 627 | | | 1,880 | | | 641 | |
| 1,195 | | | 1,178 | | | 3,527 | | | 1,204 | |
| Other obligations | 76 | | | 64 | | | 1,234 | | | 97 | |
| Total interest expense | $ | 8,491 | | | $ | 3,861 | | | $ | 23,319 | | | $ | 8,844 | |
(1)The revolving loan facility and term loan weighted average interest rate was 4.34% and 2.33% for the three months ended September 30, 2022 and 2021, respectively, and 3.20% and 2.02% for the nine months ended September 30, 2022 and 2021, respectively.
Interest rate risk associated with the Credit Facility is managed through an interest rate swap which has a termination date of April 2, 2030. UnderFacility. Effective on June 26, 2023, the terms ofCompany amended the interest rate swap agreement to replace the LIBOR rate to SOFR under the ISDA Fallback Protocols included within the agreement. Subsequent to the amendment, the Company will continue to pay a fixed its LIBOR borrowinginterest rate at 0.73% onof 72.9 bps, and will receive a notional amountfloating interest rate equal to daily SOFR plus an ARRC spread adjustment of $200,000.11.448 bps. The interest rate swap is not designated as a hedging instrument for accounting purposes. The Company accounts for the interest rate swap as either an asset or a liability inon the consolidated balance sheets and carries the derivative at fair value. Gains and lossesvalue (see Note 17). Gain (loss) from the change in fair value and payments related to the interest rate swap are recognized inOther income (expense), netin the consolidated statements of operations. Asoperations (see Note 20). The bank counterparty to the derivative potentially exposes the Company to credit-related losses in the event of nonperformance. To mitigate that risk, the Company only contracts with counterparties who meet the Company’s minimum requirements under its counterparty risk assessment process. The Company monitors counterparty risk on at least a quarterly basis and adjusts its exposure as necessary. The Company does not enter into derivative instrument transactions for trading or speculative purposes.
Interest Expense, Net
Interest expense, net consists of the following:
| | | | | | | | | | | | | | | | | | | | | | | |
| Three Months Ended | | Nine Months Ended |
| September 30, | | September 30, |
| 2023 | | 2022 | | 2023 | | 2022 |
| Contractual interest expense | $ | (8,678) | | | $ | (7,345) | | | $ | (27,352) | | | $ | (17,092) | |
| Amortization of deferred debt issuance costs | (1,823) | | | (1,822) | | | (5,469) | | | (5,468) | |
| Other interest (expense) income | (47) | | | (76) | | | 958 | | | (1,234) | |
| Interest income | 501 | | | 109 | | | 1,240 | | | 273 | |
| Interest expense, net | $ | (10,047) | | | $ | (9,134) | | | $ | (30,623) | | | $ | (23,521) | |
The weighted average interest rate on borrowings under the Credit Facility were 7.44% and 4.34% for the three months ended September 30, 2023 and 2022, respectively, and December 31, 2021,7.04% and 3.20% for the Company recorded a swap related asset at fair value of $39,435nine months ended September 30, 2023 and $10,117, respectively, in Other assets in the consolidated balance sheets.2022, respectively.
Note 11: Executive Bonus Plan
Certain of the Company’s key employees, including its named executive officers, participate in the amended and restated Bentley Systems, Incorporated Bonus Pool Plan (the “Bonus Plan”). Pursuant to the Bonus Plan, participants are eligible to receive incentive bonuses that are determined based on the Company’s adjusted Management Report Operating Income (“MROI”), as defined in the plan agreement and before deduction for such plan payments. For purposes of the Bonus Plan, the bonus pool thereunder may be funded with up to an aggregate of 20% of the Company’s adjusted MROI, subject to approval by the board of directors, with payments made to plan participants based on each such participant’s allocated interest in the bonus pool. The plan permits the deduction of certain holdback amounts from the plan’s pool, from which amounts can then be allocated to fund items including equity and/or cash incentive compensation for non‑plan participants and participant charitable contributions.
A participant may defer any portion, or all, of such participant’s incentive bonus payable pursuant to the Bonus Plan into the DCP (see Note 12). A participant’s non‑deferred incentive bonus is payable in cash, however, the Bonus Plan provides, in part, that a participant may elect to receive any portion, or all, of such participant’s non‑deferred incentive bonus in the form of shares of fully vested Class B Common Stock issued under the Bentley Systems, Incorporated 2020 Omnibus Incentive Plan, subject to the limitation described below. The Company records the election of non‑deferred incentive bonus in the form of shares of fully vested Class B Common Stock as stock‑based compensation expense in the consolidated statements of operations (see Note 15). Such election must be made prior to the start of the applicable calendar quarter for which the incentive bonus is to be paid, and the number of shares of Class B Common Stock payable in respect of such elected amount is calculated using a volume-weighted average price of the Company’s Class B Common Stock for the period commencing on the tenth trading day prior to the end of the applicable calendar quarter and ending on the tenth trading day following the end of the applicable calendar quarter. Notwithstanding participants’ elections to receive shares of fully vested Class B Common Stock in respect of their non‑deferred incentive bonus payments, if, in any calendar quarter, the aggregate U.S. Dollar value of shares of fully vested Class B Common Stock payable in respect of the non‑deferred incentive bonuses exceeds $7,500, the portion of each participant’s non‑deferred incentive bonus payable in shares of fully vested Class B Common Stock will be reduced pro rata such that the $7,500 limit is not exceeded, and, for each affected participant, the amount of such reduction will be payable in cash.
For the three months ended September 30, 20222023 and 2021,2022, the incentive compensation, including cash payments, election to receive shares of fully vested Class B Common Stock, and deferred compensation to plan participants, recognized under this planthe amended and restated Bentley Systems, Incorporated Bonus Pool Plan (the “Bonus Plan”) (net of all applicable holdbacks) was $8,454$5,081 and $8,128,$8,454, respectively, and $24,984$17,326 and $24,686$24,984 for the nine months ended September 30, 20222023 and 2021,2022, respectively.
Note 12: Retirement Plans
Deferred Compensation Plan
Under the Company’s DCP, certain officersDeferred compensation plan (income) expense was $(3,160) and key employees may defer all or any part of their incentive compensation, and the Company may make discretionary awards on behalf of such participants. Elective participant deferrals and discretionary Company awards are received in the form of phantom shares of the Company’s Class B Common Stock, which are valued for tax and accounting purposes in the same manner as actual shares of Class B Common Stock, and are recorded as stock‑based compensation expense in the consolidated statements of operations (see Note 15).
In August 2021, the Company’s board of directors approved an amendment to the DCP, which offered to certain active executives in the DCP a one‑time, short‑term election to reallocate a limited portion of their DCP holdings from phantom shares of the Company’s Class B Common Stock into other phantom investment funds. The offer to reallocate was subject to a proration mechanism which adjusted the aggregate elections to a maximum of 1,500,000 phantom shares of the Company’s Class B Common Stock. This resulted in a reduction of 1,500,000 shares in both the basic and diluted count of Company shares.
While DCP participants’ investments in phantom shares remain equity classified, as they will be settled in shares of Class B Common Stock upon eventual distribution, the amendment and elections resulted in a change to liability classification$(4,576) for the reallocated phantom investments, as they will be settled in cash upon eventual distribution. As a result, duringthree months ended September 30, 2023 and 2022, respectively, and $4,763 and $(21,873) for the three and nine months ended September 30, 2021, the Company reclassified cumulative compensation cost of $4,739 from Additional paid-in capital to Accruals2023 and other current liabilities or Deferred compensation plan liabilities in the consolidated balance sheet and recognized a compensation charge of $90,721 to Deferred compensation plan expenses in the consolidated statements of operations to record the reallocated deferred compensation plan liabilities at their fair value of $95,460.
DCP participants’ holdings in phantom investment funds are classified as liabilities in either Accruals and other current liabilities or Deferred compensation plan liabilities in the consolidated balance sheets as they will be settled in cash upon eventual distribution. The deferred compensation plan liabilities are marked to market at the end of each reporting period, with changes in the liabilities recorded as an expense (income) to Deferred compensation plan in the consolidated statements of operations.
Deferred compensation plan income was $4,576 and $21,873 for the three and nine months ended September 30, 2022, respectively. Deferred compensation plan expense was $88,965 and $89,327 for the three and nine months ended September 30, 2021, respectively.
For the three months ended September 30, 20222023 and 2021, DCP2022, elective participant deferrals into the Company’s unfunded amended and restated Bentley Systems, Incorporated Nonqualified Deferred Compensation Plan (the “DCP”) were $1,586$61 and $527,$1,586, respectively, and $4,694$1,712 and $2,020$4,694 for the nine months ended September 30, 20222023 and 2021,2022, respectively. No discretionary contributions were made to the DCP during the three and nine months ended September 30, 20222023 and 2021.2022. As of September 30, 20222023 and December 31, 2021,2022, phantom shares of the Company’s Class B Common Stock issuable by the DCP were 21,535,74817,911,610 and 25,384,449,21,587,831, respectively.
The total liabilities related to the DCP is included in the consolidated balance sheets as follows:
| | | September 30, 2022 | | December 31, 2021 | | September 30, 2023 | | December 31, 2022 |
| | | Accruals and other current liabilities | Accruals and other current liabilities | $ | 1,977 | | | $ | 7,309 | | Accruals and other current liabilities | $ | 2,182 | | | $ | 2,067 | |
| Deferred compensation plan liabilities | Deferred compensation plan liabilities | 71,013 | | | 94,890 | | Deferred compensation plan liabilities | 79,537 | | | 77,014 | |
| Total DCP liabilities | Total DCP liabilities | $ | 72,990 | | | $ | 102,199 | | Total DCP liabilities | $ | 81,719 | | | $ | 79,081 | |
Note 13: Common Stock
BSY Stock Repurchase Program
On May 11, 2022, the Company announced that its boardBoard of directorsDirectors approved the BSY Stock Repurchase Program (the “Repurchase Program”) authorizing the Company to repurchase up to $200,000 of the Company’s Class B Common Stock through June 30, 2024. TheOn December 14, 2022, the Company’s Board of Directors amended the Repurchase Program is used to offset dilution fromallow the issuanceCompany also to repurchase its outstanding convertible senior notes. This additional authorization did not increase the overall dollar limit of the Company’s Class B Common Stock under the Company’s stock‑based plans to enhance stockholder value.Repurchase Program. The shares and notes proposed to be acquired in the Repurchase Program may be repurchased from time to time in open market transactions, through privately negotiated transactions, or by other means in accordance with federal securities laws. The Company intends to fund repurchases from available working capital and cash provided by operating activities. The timing, as well as the number and value of shares and/or notes repurchased under the Repurchase Program, will be determined by the Company at its discretion and will depend on a variety of factors, including management’s assessment of the intrinsic value of the Company’s shares, the market price of the Company’s Class B Common Stock and outstanding notes, general market and economic conditions, available liquidity, compliance with the Company’s debt and other agreements, and applicable legal requirements. The exact number of shares and/or notes to be repurchased by the Company is not guaranteed, and the Repurchase Program may be suspended, modified, or discontinued at any time without prior notice. The Company did not repurchase shares under the Repurchase Program for the nine months ended September 30, 2023. For the nine months ended September 30, 2022, the Company repurchased 896,126 shares for $28,250.$28,250 under the Repurchase Program. As of September 30, 2023, $169,752 was available under the Company’s Board of Directors authorization for future repurchases of Class B Common Stock and/or outstanding convertible senior notes under the Repurchase Program.
Common Stock Issuances, Sales, and Repurchases
On June 17, 2021,For the nine months ended September 30, 2023, the Company issued 3,141,3422,422,082 shares of the Company’s Class B Common Stock pursuant to colleagues who exercised their stock options, net of 234,472 shares withheld at exercise to pay for the acquisitioncost of Seequent (see Note 4).
the stock options, as well as for $6,408 of applicable income tax withholdings. The Company received $10,590 in proceeds from the exercise of stock options. For the nine months ended September 30, 2022, the Company issued 2,272,603 shares of Class B Common Stock to colleagues who exercised their stock options, net of 362,826 shares withheld at exercise to pay for the cost of the stock options, as well as for $8,459 of applicable income tax withholdings. The Company received $6,855 in proceeds from the exercise of stock options. For the nine months ended September 30, 2021, the Company issued 4,269,335 shares of Class B Common Stock to colleagues who exercised their stock options, net of 993,302 shares withheld at exercise to pay for the cost of the stock options, as well as for $34,988 of applicable income tax withholdings. The Company received $5,039 in proceeds from the exercise of stock options.
For the nine months ended September 30, 2022, the Company issued 185,178 shares of Class B Common Stock related to the exercise of acquisition options, (see Note 15), net of 714,822 shares withheld at exercise to pay for the cost of the options. The Company did not receive any proceeds from the exercise of these options.
For the nine months ended September 30, 20222023 and 2021,2022, the Company issued 284,992171,510 and 190,619284,992 shares of Class B Common Stock, respectively, in connection with Bonus Plan incentive compensation, net of shares withheld. Of the total 306,824 shares awarded for the nine months ended September 30, 2023, 135,314 shares were sold back to the Company in the same period to pay for applicable income tax withholdings of $5,756. Of the total 409,108 shares awarded for the nine months ended September 30, 2022, 124,116 shares were sold back to the Company in the same period to pay for applicable income tax withholdings of $5,197. Of
For the total 322,160nine months ended September 30, 2023 and 2022, the Company issued 2,845,448 and 3,523,386 shares awardedof Class B Common Stock, respectively, to DCP participants in connection with distributions from the plan. The distribution in shares for the nine months ended September 30, 2021, 131,5412023 totaled 3,781,387 shares of which 935,939 shares were sold back to the Company in the same period to pay for applicable income tax withholdings of $6,586.
For the nine months ended September 30, 2022 and 2021, the Company issued 3,523,386 and 2,290,999 shares of Class B Common Stock, respectively, to DCP participants in connection with distributions from the plan.$38,456. The distribution in shares for the nine months ended September 30, 2022 totaled 4,023,718 shares of which 500,332 shares were sold back to the Company in the same period to pay for applicable income tax withholdings of $24,246. The distribution in shares for the nine months ended September 30, 2021 totaled 3,674,787 shares of which 1,383,788 shares were sold back to the Company in the same period to pay for applicable income tax withholdings of $65,684.
Dividends
The Company declared cash dividends during the periods presented as follows:
| | | Dividend | | | Dividend | |
| | Per Share | | Amount (1) | | Per Share | | Amount |
| 2023: | | 2023: | | | |
| Third quarter | | Third quarter | $ | 0.05 | | | $ | 14,768 | |
| Second quarter | | Second quarter | 0.05 | | | 14,702 | |
| First quarter | | First quarter | 0.05 | | | 14,522 | |
| 2022: | 2022: | | | | 2022: | |
| Third quarter | Third quarter | $ | 0.03 | | | $ | 8,592 | | Third quarter | $ | 0.03 | | | $ | 8,592 | |
| Second quarter | Second quarter | 0.03 | | | 8,678 | | Second quarter | 0.03 | | | 8,678 | |
| First quarter | First quarter | 0.03 | | | 8,353 | | First quarter | 0.03 | | | 8,353 | |
| 2021: | | |
| Third quarter | $ | 0.03 | | | $ | 8,485 | | |
| Second quarter | 0.03 | | | 8,372 | | |
| First quarter | 0.03 | | | 8,219 | | |
(1)Includes declared dividends for certain restricted stock awards and restricted stock units, and are net of forfeitures.
Global Employee Stock Purchase Plan
TheDuring the nine months ended September 30, 2023, colleagues who elected to participate in the Bentley Systems, Incorporated Global Employee Stock Purchase Plan (the “ESPP”) provides eligible colleaguespurchased a total of the Company with an opportunity to contribute up to 15% of their eligible compensation toward the purchase of the Company’s Class B Common Stock at a discounted price, up to a maximum of $25 per year and subject to any other plan limitations. Unless otherwise determined by the board of directors, offering periods will run from January 1st (or the first trading day thereafter) through June 30th (or the first trading day prior to such date), and from July 1st (or the first trading day thereafter) through December 31st (or the first trading day prior to such date). The purchase price per share at which315,840 shares of Class B Common Stock, are soldnet of shares withheld, resulting in an offering period under the ESPP will be equalcash proceeds to the lesserCompany of 85%$9,988. Of the total 333,324 shares purchased, 17,484 shares were sold back to the Company to pay for applicable income tax withholdings of the fair market value of a share of Class B Common Stock (i) on the first trading day of the offering period, or (ii) on the purchase date (i.e., the last trading day of the purchase period).$845. During the nine months ended September 30, 2022, colleagues who elected to participate in the ESPP purchased a total of 307,406 shares of Class B Common Stock, net of shares withheld, resulting in cash proceeds to the Company of $10,335. Of the total 314,471 shares purchased, 7,065 shares were sold back to the Company to pay for applicable income tax withholdings of $273. During the nine months ended September 30, 2021, colleagues who elected to participate in the ESPP purchased a total of 104,716 shares of Class B Common Stock, net of shares withheld, resulting in cash proceeds to the Company of $3,845. Of the total 111,486 shares purchased, 6,770 shares were sold back to the Company to pay for applicable income tax withholdings of $438. As of September 30, 20222023 and December 31, 2021, $2,6932022, $2,923 and $4,818$5,230 of ESPP withholdings via colleague payroll deduction were recorded in Accruals and other current liabilities in the consolidated balance sheets, respectively. As of September 30, 2023, shares of Class B Common Stock available for future issuance under the ESPP were 24,272,038.
Note 14: Accumulated Other Comprehensive Loss
Accumulated other comprehensive loss consists of the following during the three months ended September 30, 20222023 and 2021:2022:
| | | | | | | | | | | | | | | | | |
| Foreign | | Actuarial (Loss) | | |
| Currency | | Gain on | | |
| Translation | | Retirement Plan | | Total |
| Balance, June 30, 2023 | $ | (87,530) | | | $ | (298) | | | $ | (87,828) | |
| Other comprehensive (loss) income, before taxes | (7,294) | | | 2 | | | (7,292) | |
| Tax expense | — | | | (8) | | | (8) | |
| Other comprehensive loss, net of taxes | (7,294) | | | (6) | | | (7,300) | |
| Balance, September 30, 2023 | $ | (94,824) | | | $ | (304) | | | $ | (95,128) | |
| | | | | | | | | | | | | | | | | |
| Foreign | | Actuarial (Loss) | | |
| Currency | | Gain on | | |
| Translation | | Retirement Plan | | Total |
| Balance, June 30, 2022 | $ | (88,250) | | | $ | (881) | | | $ | (89,131) | |
| Other comprehensive (loss) income, before taxes | (12,809) | | | 16 | | | (12,793) | |
| Tax expense | — | | | (5) | | | (5) | |
| Other comprehensive (loss) income, net of taxes | (12,809) | | | 11 | | | (12,798) | |
| Balance, September 30, 2022 | $ | (101,059) | | | $ | (870) | | | $ | (101,929) | |
| | | | | | | | | | | | | | | | | |
| Foreign | | Actuarial (Loss) | | |
| Currency | | Gain on | | |
| Translation | | Retirement Plan | | Total |
| Balance, June 30, 2021 | $ | (53,914) | | | $ | (972) | | | $ | (54,886) | |
| Other comprehensive (loss) income, before taxes | (27,014) | | | 28 | | | (26,986) | |
| Tax expense | — | | | (8) | | | (8) | |
| Other comprehensive (loss) income, net of taxes | (27,014) | | | 20 | | | (26,994) | |
| Balance, September 30, 2021 | $ | (80,928) | | | $ | (952) | | | $ | (81,880) | |
Accumulated other comprehensive loss consists of the following during the nine months ended September 30, 20222023 and 2021:2022:
| | | | | | | | | | | | | | | | | |
| Foreign | | Actuarial (Loss) | | |
| Currency | | Gain on | | |
| Translation | | Retirement Plan | | Total |
| Balance, December 31, 2022 | $ | (89,408) | | | $ | (332) | | | $ | (89,740) | |
| Other comprehensive (loss) income, before taxes | (5,416) | | | 43 | | | (5,373) | |
| Tax expense | — | | | (15) | | | (15) | |
| Other comprehensive (loss) income, net of taxes | (5,416) | | | 28 | | | (5,388) | |
| Balance, September 30, 2023 | $ | (94,824) | | | $ | (304) | | | $ | (95,128) | |
| | | | | | | | | | | | | | | | | |
| Foreign | | Actuarial (Loss) | | |
| Currency | | Gain on | | |
| Translation | | Retirement Plan | | Total |
| Balance, December 31, 2021 | $ | (90,867) | | | $ | (907) | | | $ | (91,774) | |
| Other comprehensive (loss) income, before taxes | (10,192) | | | 52 | | | (10,140) | |
| Tax expense | — | | | (15) | | | (15) | |
| Other comprehensive (loss) income, net of taxes | (10,192) | | | 37 | | | (10,155) | |
| Balance, September 30, 2022 | $ | (101,059) | | | $ | (870) | | | $ | (101,929) | |
| | | | | | | | | | | | | | | | | |
| Foreign | | Actuarial (Loss) | | |
| Currency | | Gain on | | |
| Translation | | Retirement Plan | | Total |
| Balance, December 31, 2020 | $ | (25,219) | | | $ | (1,014) | | | $ | (26,233) | |
| Other comprehensive (loss) income, before taxes | (55,709) | | | 87 | | | (55,622) | |
| Tax expense | — | | | (25) | | | (25) | |
| Other comprehensive (loss) income, net of taxes | (55,709) | | | 62 | | | (55,647) | |
| Balance, September 30, 2021 | $ | (80,928) | | | $ | (952) | | | $ | (81,880) | |
Note 15: Equity Awards and Instruments
Stock-Based Compensation Expense
Total stock‑based compensation expense consists of the following:
| | | Three Months Ended | | Nine Months Ended | | Three Months Ended | | Nine Months Ended |
| | September 30, | | September 30, | | September 30, | | September 30, |
| | 2022 | | 2021 | | 2022 | | 2021 | | 2023 | | 2022 | | 2023 | | 2022 |
Restricted stock and restricted stock units (“RSUs”) expense (1) | Restricted stock and restricted stock units (“RSUs”) expense (1) | $ | 10,441 | | | $ | 4,681 | | | $ | 25,003 | | | $ | 11,139 | | Restricted stock and restricted stock units (“RSUs”) expense (1) | $ | 13,988 | | | $ | 10,441 | | | $ | 41,441 | | | $ | 25,003 | |
| Bonus Plan expense (see Note 11) | Bonus Plan expense (see Note 11) | 7,305 | | | 5,586 | | | 21,444 | | | 17,181 | | Bonus Plan expense (see Note 11) | 3,847 | | | 7,305 | | | 11,729 | | | 21,444 | |
| ESPP expense (see Note 13) | ESPP expense (see Note 13) | 565 | | | 539 | | | 2,394 | | | 1,416 | | ESPP expense (see Note 13) | 634 | | | 565 | | | 1,809 | | | 2,394 | |
| Stock grants expense | | Stock grants expense | — | | | — | | | 600 | | | 450 | |
| Stock option expense | Stock option expense | 395 | | | 773 | | | 1,762 | | | 2,494 | | Stock option expense | — | | | 395 | | | 343 | | | 1,762 | |
| Stock grants expense | — | | | — | | | 450 | | | 450 | | |
DCP elective participant deferrals expense (2) (see Note 12) | 85 | | | 173 | | | 306 | | | 173 | | |
DCP elective participant deferrals expense (1) (see Note 12) | | DCP elective participant deferrals expense (1) (see Note 12) | 35 | | | 85 | | | 170 | | | 306 | |
Total stock-based compensation expense (3)(2) | Total stock-based compensation expense (3)(2) | $ | 18,791 | | | $ | 11,752 | | | $ | 51,359 | | | $ | 32,853 | | Total stock-based compensation expense (3)(2) | $ | 18,504 | | | $ | 18,791 | | | $ | 56,092 | | | $ | 51,359 | |
(1)Includes acquisition‑related shares (see Note 4).
(2)DCP elective participant deferrals expense excludes deferred incentive bonus payable pursuant to the Bonus Plan.
(3)(2)As of September 30, 20222023 and December 31, 2021, $7,3822022, $4,656 and $6,749$7,300 remained in Accruals and other current liabilities in the consolidated balance sheets, respectively.
Total stock‑based compensation expense is included in the consolidated statements of operations as follows:
| | | Three Months Ended | | Nine Months Ended | | Three Months Ended | | Nine Months Ended |
| | September 30, | | September 30, | | September 30, | | September 30, |
| | 2022 | | 2021 | | 2022 | | 2021 | | 2023 | | 2022 | | 2023 | | 2022 |
| Cost of subscriptions and licenses | Cost of subscriptions and licenses | $ | 757 | | | $ | 323 | | | $ | 1,927 | | | $ | 822 | | Cost of subscriptions and licenses | $ | 1,254 | | | $ | 757 | | | $ | 3,420 | | | $ | 1,927 | |
| Cost of services | Cost of services | 460 | | | 235 | | | 1,407 | | | 685 | | Cost of services | 671 | | | 460 | | | 2,385 | | | 1,407 | |
| Research and development | Research and development | 6,754 | | | 5,227 | | | 17,693 | | | 14,069 | | Research and development | 4,977 | | | 6,754 | | | 14,687 | | | 17,693 | |
| Selling and marketing | Selling and marketing | 2,014 | | | 1,582 | | | 5,657 | | | 3,885 | | Selling and marketing | 3,244 | | | 2,014 | | | 9,057 | | | 5,657 | |
| General and administrative | General and administrative | 8,806 | | | 4,385 | | | 24,675 | | | 13,392 | | General and administrative | 8,358 | | | 8,806 | | | 26,543 | | | 24,675 | |
| Total stock-based compensation expense | Total stock-based compensation expense | $ | 18,791 | | | $ | 11,752 | | | $ | 51,359 | | | $ | 32,853 | | Total stock-based compensation expense | $ | 18,504 | | | $ | 18,791 | | | $ | 56,092 | | | $ | 51,359 | |
Stock‑based compensation expense is measured at the grant date fair value of the award and is recognized ratably over the requisite service period, which is generally the vesting period. Specifically for performance‑based RSUs, stock‑based compensation expense is measured at the grant date fair value of the award and is recognized ratably over the requisite service period based on the number of awards expected to vest at each reporting date. The Company accounts for forfeitures of equity awards as those forfeitures occur.
Stock Options
The following is a summary of stock option activity and related information under the Company’s applicable equity incentive plans:
| | | | | | | | | | | | | | | | | | | | | | | |
| | | | | Weighted | | |
| | | Weighted | | Average | | |
| | | Average | | Remaining | | Aggregate |
| Stock | | Exercise Price | | Contractual | | Intrinsic |
| Options | | Per Share | | Life (in years) | | Value |
| Outstanding, December 31, 2021 | 6,917,925 | | | $ | 5.26 | | | | | |
| Exercised | (2,635,429) | | | 4.77 | | | | | |
| Forfeited and expired | (105,500) | | | 5.64 | | | | | |
| Outstanding, September 30, 2022 | 4,176,996 | | | $ | 5.56 | | | 1.1 | | $ | 104,542 | |
| Exercisable, September 30, 2022 | 3,225,496 | | | $ | 5.51 | | | 1.0 | | $ | 80,897 | |
| | | | | | | | | | | | | | | | | | | | | | | |
| | | | | Weighted | | |
| | | Weighted | | Average | | |
| | | Average | | Remaining | | Aggregate |
| Stock | | Exercise Price | | Contractual | | Intrinsic |
| Options | | Per Share | | Life (in years) | | Value |
| Outstanding, December 31, 2022 | 3,794,515 | | | $ | 5.57 | | | | | |
| Exercised | (2,656,554) | | | 5.50 | | | | | |
| Forfeited and expired | (17,500) | | | 5.68 | | | | | |
| Outstanding, September 30, 2023 | 1,120,461 | | | $ | 5.74 | | | 0.5 | | $ | 49,771 | |
| Exercisable, September 30, 2023 | 1,120,461 | | | $ | 5.74 | | | 0.5 | | $ | 49,771 | |
For the nine months ended September 30, 20222023 and 2021,2022, the Company received cash proceeds of $6,855$10,590 and $5,039,$6,855, respectively, related to the exercise of stock options. The total intrinsic value of stock options exercised for the nine months ended September 30, 2023 and 2022 was $102,667 and 2021 was $89,532, and $250,795, respectively.
As of September 30, 2022,2023, there was $749 ofno remaining unrecognized compensation expense related to unvested stock options, which is expected to be recognized over a weighted average period of approximately 0.5 years.
Acquisition Options — In addition to stock options granted under the Company’s equity incentive plans, in connection with an acquisition completed in March 2018, the Company issued to certain selling shareholder entities options to acquire an aggregate of up to 900,000 shares of Class B Common Stock. The options had a five‑year term, were exercisable on March 27, 2022, and had an initial exercise price of $6.805 per share. The exercise price of the options was subject to a cap and collar adjustment mechanism that automatically reduces (but not to less than $0.01) or increases the exercise price based on the difference between the exercise price and the fair market value of the Company’s Class B Common Stock on the exercise date. During the nine months ended September 30, 2022, 900,000 shares were exercised. No acquisition options remain outstanding as of September 30, 2022.options.
Restricted Stock and RSUs
Under the equity incentive plans, the Company may grant both time‑based and performance‑based shares of restricted Class B Common Stock and RSUs to eligible colleagues. Time‑based awards generally vest ratably on each of the first four anniversaries of the grant date. Performance‑based awards vesting is determined by the achievement of certain business profitability and growth targets, which includeincluding growth in annualized recurring revenues as well as(“ARR”), and actual bookings for perpetual licenses and non‑recurring services, and certain non‑financial performance targets.among others. Performance targets are generally set for performance periods of one year to three years.
The following is a summary of unvested restricted stock and RSU activity and related information under the Company’s applicable equity incentive plans:
| | | Time- | | Performance- | | Time- | | Performance- |
| | Based | | Based | | Based | | Based |
| | Time- | | Performance- | | Weighted | | Weighted | | Time- | | Weighted | | Weighted |
| | Total | | Based | | Based | | Average | | Average | | Total | | Based | | Average | | Average |
| | Restricted | | Restricted | | Restricted | | Grant Date | | Grant Date | | Restricted | | Restricted | | Performance- | | Grant Date | | Grant Date |
| | Stock | | Stock | | Stock | | Fair Value | | Fair Value | | Stock | | Stock | | Based | | Fair Value | | Fair Value |
| | and RSUs | | and RSUs | | and RSUs | | Per Share | | Per Share | | and RSUs | | and RSUs | | RSUs | | Per Share | | Per Share |
| Unvested, December 31, 2021 | 1,708,545 | | | 1,611,862 | | | 96,683 | | (4) | $ | 32.81 | | | $ | 49.93 | | |
| Unvested, December 31, 2022 | | Unvested, December 31, 2022 | 3,068,851 | | | 2,706,078 | | (3) | 362,773 | | (4) | $ | 36.67 | | | $ | 38.21 | |
| Granted | Granted | 1,598,661 | | (1) | 1,235,888 | | (3) | 362,773 | | (5) | 38.82 | | 38.21 | Granted | 1,199,644 | | (1) | 1,003,180 | | | 196,464 | | (5) | 41.17 | | 39.03 |
| Vested | Vested | (477,283) | | | (386,113) | | | (91,170) | | (4) | 26.40 | | | 49.93 | | Vested | (780,084) | | | (622,924) | | | (157,160) | | | 33.46 | | | 38.20 | |
| Forfeited and canceled | Forfeited and canceled | (147,816) | | | (142,303) | | | (5,513) | | | 33.64 | | | 49.93 | | Forfeited and canceled | (180,944) | | | (143,620) | | | (37,324) | | | 33.16 | | | 33.41 | |
| Unvested, September 30, 2022 | 2,682,107 | | (2) | 2,319,334 | | | 362,773 | | | 37.02 | | | 38.21 | | |
| Unvested, September 30, 2023 | | Unvested, September 30, 2023 | 3,307,467 | | (2) | 2,942,714 | | | 364,753 | | | 39.06 | | | 39.15 | |
(1)For the nine months ended September 30, 2022,2023, the Company only granted RSUs.
(2)Includes 50,91759,089 RSUs which are expected to be settled in cash.
(3)Includes 199,076 time‑based RSUs granted during the three months ended March 31, 2022 to certain officers and key employees, which cliff vest on January 31, 2025.
(4)Relates to the 2021 annual performance period. Total stock‑based compensation expense associated with these awards was fully recognized as of December 31, 2021.
(5)Primarily relates to the 2022 annual performance period, except for 185,186 performance‑based RSUs granted during the three monthsyear ended MarchDecember 31, 2022 with extraordinary terms, which are described below.
(5)Primarily relates to the 2023 annual performance period, except for 13,367 additional shares earned based on the achievement of 2022 performance goals for performance‑based RSUs granted during the year ended December 31, 2022.
During the three monthsyear ended MarchDecember 31, 2022, the Company granted 185,186 performance‑based RSUs to certain officers and key employees, which vest subject to the achievement of certain performance goals over a three‑year performance period (the “Performance Period”). For each year of the Performance Period, one‑third of the performance‑based RSUs will be subject to a cliff, whereby no vesting of that portion will occur unless the Company’s applicable margin metrics (which, for 2022, was Adjusted EBITDA margin and for 2023 and 2024, will be Adjusted operating income inclusive of stock-based compensation expense (“Adjusted OI w/SBC”) margin, excluding the impact of currency exchange fluctuations) also equals or exceeds the relevant target level for such year. Provided Adjusted EBITDAthat the applicable margin targets are met, the total number of performance‑based RSUs that will vest is determined by the achievement of certain business profitability and growth targets, which include growth in annualized recurring revenues,ARR, as well as actual bookings for perpetual licenses and non‑recurring services. Final actual vesting will be determined on January 31, 2025.
During The 2022 Adjusted EBITDA margin target for the three months ended March 31, 2022, the Company granted 120,599 performance‑based RSUs to certain officers and key employees, which vest subject to the achievement of certain performance goals related to the 2022 annual performance period. Provided Adjusted EBITDA margin targets are met, the total number of performance‑based RSUs that will vest is determined by the achievement of certain business profitability and growth targets, which include growth in annualized recurring revenues, as well as actual bookings for perpetual licenses and non‑recurring services. To the extent performance exceeds the applicable targets for 2022, these grantees could realize a maximum of 1.25x the number of annual performance‑based RSUs granted or 150,749 performance‑based RSUs.was met.
In 2016, the Company granted RSUs subject to performance‑based vesting as determined by the achievement of certain business growth targets. Certain colleagues elected to defer delivery of such shares upon vesting. During the nine months ended September 30, 2023 and 2022, 1,562 and 2021, 10,888 and 10,864 shares, respectively, were delivered to colleagues, and 2328 and 3323 additional shares, respectively, were earned as a result of dividends. As of September 30, 20222023 and December 31, 2021, 9,3562022, 7,829 and 20,2219,363 shares, respectively, of these vested and deferred RSUs remained outstanding.
The weighted average grant date fair values of RSUs granted were $38.68$40.82 and $51.03,$38.68, for the nine months ended September 30, 20222023 and 2021,2022, respectively.
For the nine months ended September 30, 20222023 and 2021,2022, restricted stock and RSUs were issued net of 81,301137,675 and 103,57381,301 shares, respectively, which were sold back to the Company to settle applicable income tax withholdings of $6,062 and $3,208, and $6,352, respectively.
As of September 30, 2022,2023, there was $70,919$82,609 of unrecognized compensation expense related to unvested time‑based restricted stock and RSUs, which is expected to be recognized over a weighted average period of approximately 1.91.7 years. There was no remaining unrecognized compensation expense related to unvested performance‑based restricted stock. As of September 30, 2022,2023, there was $8,604$5,648 of unrecognized compensation expense related to unvested performance‑based RSUs, which is expected to be recognized over a weighted average period of approximately 1.90.8 years.
Stock Grants
For the nine months ended September 30, 20222023 and 2021,2022, the Company granted 13,63212,639 and 7,82413,632 fully vested shares of Class B Common Stock, respectively, with a fair value of $450.
$600 and $450, respectively.
Equity Awards Subsequent to September 30, 20222023
In October 2022,2023, the Company granted 336,809265,759 time‑based RSUs, which generally vest ratably on each of the first four anniversaries of the grant date. The unrecognized compensation expense related to these RSUs is approximately $11,800,$13,000, which is expected to be recognized over a weighted average period of approximately 4.0 years.
Note 16: Income Taxes
The following is a summary of Income (loss) before income taxes, Provision (benefit) for income taxes, and effective tax rate for the periods presented:
| | | | | | | | | | | | | | | | | | | | | | | |
| Three Months Ended | | Nine Months Ended |
| September 30, | | September 30, |
| 2022 | | 2021 | | 2022 | | 2021 |
| Income (loss) before income taxes | $ | 47,342 | | | $ | (42,333) | | | $ | 159,125 | | | $ | 52,460 | |
| Provision (benefit) for income taxes | $ | 9,664 | | | $ | 5,025 | | | $ | 8,221 | | | $ | (5,090) | |
| Effective tax rate | 20.4 | % | | (11.9) | % | | 5.2 | % | | (9.7) | % |
| | | | | | | | | | | | | | | | | | | | | | | |
| Three Months Ended | | Nine Months Ended |
| September 30, | | September 30, |
| 2023 | | 2022 | | 2023 | | 2022 |
| Income before income taxes | $ | 69,585 | | | $ | 47,342 | | | $ | 169,353 | | | $ | 159,125 | |
| Provision for income taxes | $ | 16,514 | | | $ | 9,664 | | | $ | 22,107 | | | $ | 8,221 | |
| Effective tax rate | 23.7 | % | | 20.4 | % | | 13.1 | % | | 5.2 | % |
For the three months ended September 30, 2022,2023, the effective tax rate was higher as compared to the three months ended September 30, 2021prior year period primarily due to an increase in the 2021forecasted effective tax effect, netrate impact of officer compensation limitation provisions, relatedthe U.S. Global Intangible Low-Taxed Income (“GILTI”) inclusion due to the 2021 compensation chargemandatory capitalization of $90,721 to Deferred compensation planresearch and development expenses to record reallocated deferred compensation plan liabilities at fair value (see Note 12).for U.S. tax purposes. For the three months ended September 30, 20222023 and 2021,2022, the Company also recorded discrete tax benefits of $4,280$4,428 and $6,920,$4,280, respectively, primarily associated with windfall tax benefits from stock‑based compensation, net of the impact from officer compensation limitation provisions.
For the nine months ended September 30, 2022,2023, the effective tax rate was higher as compared to the nine months ended September 30, 2021prior year period primarily due to an increase in the 2021forecasted effective tax effect, netrate impact of officer compensation limitation provisions, relatedthe GILTI inclusion due to the 2021 compensation chargemandatory capitalization of $90,721 to Deferred compensation planresearch and development expenses to record reallocated deferred compensation plan liabilities at fair value (see Note 12).for U.S. tax purposes and a decrease in discrete tax benefits recognized in the current year period. For the nine months ended September 30, 20222023 and 2021,2022, the Company also recorded discrete tax benefits of $36,032$31,895 and $42,825,$36,032, respectively, primarily associated with windfall tax benefits from stock‑based compensation, net of the impact from officer compensation limitation provisions.
During the nine months ended September 30, 2022, the Company repatriated $150,000 of undistributed previously taxed earnings generated by its foreign subsidiaries to the U.S. The repatriations were used to fund the acquisition of Power Line Systems (see Note 4). The cash repatriations did not have a material impact on Provision for income taxes for the nine months ended September 30, 2022.
Note 17: Fair Value of Financial Instruments
Derivatives Not Designated As Hedging InstrumentA financial asset or liability classification is determined based on the lowest level input that is significant to the fair value measurement. The fair value hierarchy consists of the following three levels:
The Company has an interest rate swap with a notional amount of $200,000Level 1 inputs are quoted prices (unadjusted) in active markets for identical assets or liabilities.
Level 2 inputs are quoted prices for similar assets and a termination date of April 2, 2030 to reduce the interest rate risk associated with the Company’s Credit Facility. The interest rate swap is not designated as a hedging instrument for accounting purposes. The Company accountsliabilities in active markets or inputs that are observable for the interest rate swap as either an asset or a liability, ineither directly or indirectly through market corroboration, for substantially the consolidated balance sheetsfull term of the financial instrument.
Level 3 inputs are unobservable inputs based on management’s own assumptions used to measure assets and carries the derivativeliabilities at fair value.
The following is a summary of the interest rate swap activity:
| | | | | | | | | | | | | | | | | | | | | | | | | | | | | |
| Three Months Ended | | Nine Months Ended | | |
| September 30, | | September 30, | | Recognized in Consolidated |
| 2022 | | 2021 | | 2022 | | 2021 | | Statements of Operations |
| Interest rate swap: | | | | | | | | | |
| Gain from change in fair value | $ | 9,828 | | | $ | 1,463 | | | $ | 29,318 | | | $ | 9,198 | | | Other income (expense), net |
| (Refunds) payments | (752) | | | 325 | | | (475) | | | 942 | | | Interest expense, net |
Fair Value
The Company applies the provisions of FASB ASC Topic 820, Fair Value Measurement, for fair value measurements of financial assets and financial liabilities and for fair value measurements of non‑financial items that are recognized or disclosed at fair value in the consolidated financial statements.
The Company’s financial instruments include cash equivalents, account receivables, certain other assets, accounts payable, accruals, certain other current and long‑term liabilities, and long‑term debt.
The following methods and assumptions were used by the Company in estimating its fair value disclosures for financial instruments as of September 30, 2022 and December 31, 2021:
Current assets and current liabilities — In general, the carrying amounts reported on the Company’s consolidated balance sheets for current assets and current liabilities approximate their fair values due to the short‑term nature of those instruments.
The following methods and assumptions were used by the Company in estimating its fair value measurements for Level 2 and Level 3 financial instruments as of September 30, 2023 and December 31, 2022:
Acquisition contingent consideration — The fair value of these liabilities is generally determined using a cost or income approach and is measured based on significant inputs not observable in the market, which represents a Level 3 measurement within the fair value hierarchy. The valuation of contingent consideration uses assumptions the Company believes would be made by a market participant.
Interest rate swap — The fair value of the Company’s interest rate swap asset or liability is determined using an income approach and is measured based on the implied forward rates fromfor the U.S. Dollar one‑month LIBOR yield curve and are classified asremaining term of the interest rate swap. The Company considers these valuation inputs to be Level 2 withininputs in the fair value hierarchy.
Long-term debt — The fair value of the Company’s borrowings under its Credit Facility approximated its carrying value based upon discounted cash flows at current market rates for instruments with similar remaining terms. The Company considers these valuation inputs to be Level 2 inputs in the fair value hierarchy. As of September 30, 2023, the estimated fair value of the 2026 Notes and 2027 Notes was $671,962 and $492,815, respectively. As of December 31, 2022, the estimated fair value of the 2026 Notes and 2027 Notes was $582,595$622,431 and $439,680, respectively. As of December 31, 2021, the estimated fair value of the 2026 Notes and 2027 Notes was $720,284 and $531,915,$470,856, respectively. The estimated fair value of the 2026 Notes and 2027 Notes is based on quoted market prices of the Company’s instrument in markets that are not active and are classified as Level 2 within the fair value hierarchy. Considerable judgment is necessary to interpret the market data and develop estimates of fair values. Accordingly, the estimates presented are not necessarily indicative of the amounts at which these instruments could be purchased, sold, or settled.
Deferred compensation plan liabilities — The fair value of deferred compensation plan liabilities, including the liability classified phantom investments in the DCP, are marked to market at the end of each reporting period.
A financial asset or liability classification is determined based on the lowest level input that is significant to the fair value measurement. The fair value hierarchy consists of the following three levels:
Level 1 inputs are quoted prices (unadjusted) in active markets for identical assets or liabilities.
Level 2 inputs are quoted prices for similar assets and liabilities in active markets or inputs that are observable for the asset or liability, either directly or indirectly through market corroboration, for substantially the full term of the financial instrument.
Level 3 inputs are unobservable inputs based on management’s own assumptions used to measure assets and liabilities at fair value.
Financial assets and financial liabilities carried at fair value measured on a recurring basis consist of the following:
| | September 30, 2022 | Level 1 | | Level 2 | | Level 3 | | Total | |
| September 30, 2023 | | September 30, 2023 | Level 1 | | Level 2 | | Level 3 | | Total |
| Assets: | Assets: | | | | | | | | Assets: | | | | | | | |
Money market funds (1) | Money market funds (1) | $ | 18 | | | $ | — | | | $ | — | | | $ | 18 | | Money market funds (1) | $ | 3,023 | | | $ | — | | | $ | — | | | $ | 3,023 | |
Interest rate swap (2) | Interest rate swap (2) | — | | | 39,435 | | | — | | | 39,435 | | Interest rate swap (2) | — | | | 41,302 | | | — | | | 41,302 | |
| Total assets | Total assets | $ | 18 | | | $ | 39,435 | | | $ | — | | | $ | 39,453 | | Total assets | $ | 3,023 | | | $ | 41,302 | | | $ | — | | | $ | 44,325 | |
| Liabilities: | Liabilities: | | | | | | | | Liabilities: | | | | | | | |
Acquisition contingent consideration (3) | Acquisition contingent consideration (3) | $ | — | | | $ | — | | | $ | 1,244 | | | $ | 1,244 | | Acquisition contingent consideration (3) | $ | — | | | $ | — | | | $ | 3 | | | $ | 3 | |
Deferred compensation plan liabilities (4) | Deferred compensation plan liabilities (4) | 72,990 | | | — | | | — | | | 72,990 | | Deferred compensation plan liabilities (4) | 81,719 | | | — | | | — | | | 81,719 | |
Cash-settled equity awards (5)(3) | Cash-settled equity awards (5)(3) | 279 | | | — | | | — | | | 279 | | Cash-settled equity awards (5)(3) | 715 | | | — | | | — | | | 715 | |
| Total liabilities | Total liabilities | $ | 73,269 | | | $ | — | | | $ | 1,244 | | | $ | 74,513 | | Total liabilities | $ | 82,434 | | | $ | — | | | $ | 3 | | | $ | 82,437 | |
| | December 31, 2021 | Level 1 | | Level 2 | | Level 3 | | Total | |
| December 31, 2022 | | December 31, 2022 | Level 1 | | Level 2 | | Level 3 | | Total |
| Assets: | Assets: | | | | | | | | Assets: | | | | | | | |
Money market funds (1) | Money market funds (1) | $ | 21 | | | $ | — | | | $ | — | | | $ | 21 | | Money market funds (1) | $ | 19 | | | $ | — | | | $ | — | | | $ | 19 | |
Interest rate swap (2) | Interest rate swap (2) | — | | | 10,117 | | | — | | | 10,117 | | Interest rate swap (2) | — | | | 37,200 | | | — | | | 37,200 | |
| Total assets | Total assets | $ | 21 | | | $ | 10,117 | | | $ | — | | | $ | 10,138 | | Total assets | $ | 19 | | | $ | 37,200 | | | $ | — | | | $ | 37,219 | |
| Liabilities: | Liabilities: | | | | | | | | Liabilities: | | | | | | | |
Acquisition contingent consideration (3) | Acquisition contingent consideration (3) | $ | — | | | $ | — | | | $ | 6,613 | | | $ | 6,613 | | Acquisition contingent consideration (3) | $ | — | | | $ | — | | | $ | 1,196 | | | $ | 1,196 | |
Deferred compensation plan liabilities (4) | Deferred compensation plan liabilities (4) | 102,199 | | | — | | | — | | | 102,199 | | Deferred compensation plan liabilities (4) | 79,081 | | | — | | | — | | | 79,081 | |
Cash-settled equity awards (5)(3) | Cash-settled equity awards (5)(3) | 353 | | | — | | | — | | | 353 | | Cash-settled equity awards (5)(3) | 536 | | | — | | | — | | | 536 | |
| Total liabilities | Total liabilities | $ | 102,552 | | | $ | — | | | $ | 6,613 | | | $ | 109,165 | | Total liabilities | $ | 79,617 | | | $ | — | | | $ | 1,196 | | | $ | 80,813 | |
(1)Included in Cash and cash equivalents in the consolidated balance sheets.
(2)Included in Other assets in the consolidated balance sheets.
(3)Included in OtherAccruals and other current liabilities in the consolidated balance sheets.
(4)Included in Deferred compensation plan liabilities, except for current liabilities of $1,244$2,182 and $5,382$2,067 as of September 30, 20222023 and December 31, 2021,2022, respectively, which are included in Accruals and other current liabilities in the consolidated balance sheets. Acquisition contingent consideration liability is measured at fair value and is based on significant inputs not observable in the market, which represents a Level 3 measurement within the fair value hierarchy. The valuation of contingent consideration uses assumptions the Company believes would be made by a market participant.
(4)Included in Deferred compensation plan liabilities, except for current liabilities of $1,977 and $7,309 as of September 30, 2022 and December 31, 2021, respectively, which are included in Accruals and other current liabilities in the consolidated balance sheets.
(5)Included in Accruals and other current liabilities in the consolidated balance sheets.
The following is a reconciliation of the changes in fair value of the Company’s financial liabilities which have been classified as Level 3 in the fair value hierarchy:
| | | Nine Months Ended | | Year Ended | | Nine Months Ended | | Year Ended |
| | September 30, 2022 | | December 31, 2021 | | September 30, 2023 | | December 31, 2022 |
| | | Balance, beginning of year | Balance, beginning of year | $ | 6,613 | | | $ | 4,299 | | Balance, beginning of year | $ | 1,196 | | | $ | 6,613 | |
| Payments | Payments | (5,160) | | | (2,371) | | Payments | (1,206) | | | (5,261) | |
| Addition | Addition | — | | | 4,544 | | Addition | — | | | 1,390 | |
| Change in fair value | Change in fair value | (6) | | | 294 | | Change in fair value | — | | | (1,427) | |
| Foreign currency translation adjustments | Foreign currency translation adjustments | (203) | | | (153) | | Foreign currency translation adjustments | 13 | | | (119) | |
| Balance, end of period | Balance, end of period | $ | 1,244 | | | $ | 6,613 | | Balance, end of period | $ | 3 | | | $ | 1,196 | |
The Company did not have any transfers between levels within the fair value hierarchy.
Note 18: Commitments and Contingencies
Purchase CommitmentCommitments — In the normal course of business, the Company enters into various purchase commitments for goods and services. As ofDuring the nine months ended September 30, 2022,2023, the Company entered into approximately $158,000 of non‑cancelable future cash purchase commitmentcommitments for services related to the cloud provisioning of the Company’s software solutions was $23,998and for other software costs through May 2023.2026 and September 2028, respectively. As of September 30, 2023, the non‑cancelable future cash purchase commitments were approximately $137,000. The Company expects to fully consume its contractual commitmentcommitments in the ordinary course of operations.
Operating Leases — The Company leases certain office facilities, office equipment, and automobiles under operating leases having initial or remaining non‑cancelable terms in excess of one year (see Note 8).
Litigation — From time to time, the Company is involved in certain legal actions arising in the ordinary course of business. In management’s opinion, based upon the advice of counsel, the outcome of such actions is not expected to have a material adverse effect on the Company’s future financial position, results of operations, or cash flows.
Note 19: Geographic Data
Revenues by geographic region are presented in Note 3. Long‑lived assets (other than goodwill), net of depreciation and amortization by geographic region (see Notes 5, 6, and 8) are as follows:
| | | September 30, 2022 | | December 31, 2021 | | September 30, 2023 | | December 31, 2022 |
| | Americas (1) | Americas (1) | $ | 170,712 | | | $ | 99,500 | | Americas (1) | $ | 152,822 | | | $ | 164,729 | |
| EMEA | EMEA | 30,348 | | | 44,730 | | EMEA | 37,103 | | | 32,372 | |
| APAC | APAC | 172,365 | | | 184,245 | | APAC | 149,797 | | | 167,670 | |
| Total long-lived assets | Total long-lived assets | $ | 373,425 | | | $ | 328,475 | | Total long-lived assets | $ | 339,722 | | | $ | 364,771 | |
(1)Americas includes the U.S., Canada, and Latin America (including the Caribbean).
Note 20: Interest Expense,Other Income, Net
Interest expense,Other income, net consists of the following:
| | | | | | | | | | | | | | | | | | | | | | | |
| Three Months Ended | | Nine Months Ended |
| September 30, | | September 30, |
| 2022 | | 2021 | | 2022 | | 2021 |
| Interest expense (see Note 10) | $ | (8,491) | | | $ | (3,861) | | | $ | (23,319) | | | $ | (8,844) | |
| Interest income | 109 | | | 25 | | | 273 | | | 236 | |
| Interest expense, net | $ | (8,382) | | | $ | (3,836) | | | $ | (23,046) | | | $ | (8,608) | |
Note 21: Other Income (Expense), Net
Other income (expense), net consists of the following:
| | | Three Months Ended | | Nine Months Ended | | Three Months Ended | | Nine Months Ended |
| | September 30, | | September 30, | | September 30, | | September 30, |
| | 2022 | | 2021 | | 2022 | | 2021 | | 2023 | | 2022 | | 2023 | | 2022 |
| Gain (loss) from: | Gain (loss) from: | | | | | | | | Gain (loss) from: | | | | | | | |
| Change in fair value of interest rate swap (see Note 17) | Change in fair value of interest rate swap (see Note 17) | $ | 9,828 | | | $ | 1,463 | | | $ | 29,318 | | | $ | 9,198 | | Change in fair value of interest rate swap (see Note 17) | $ | 4,765 | | | $ | 9,828 | | | $ | 4,102 | | | $ | 29,318 | |
Foreign exchange (1) | Foreign exchange (1) | (11,027) | | | (2,446) | | | (18,815) | | | (248) | | Foreign exchange (1) | (3,154) | | | (11,027) | | | 404 | | | (18,815) | |
| Sale of aircraft (see Note 5) | Sale of aircraft (see Note 5) | — | | | — | | | 2,029 | | | — | | Sale of aircraft (see Note 5) | — | | | — | | | — | | | 2,029 | |
| | Change in fair value of acquisition contingent consideration | 506 | | | — | | | 6 | | | — | | |
| Other income, net | 873 | | | 26 | | | 1,780 | | | 798 | | |
| Total other income (expense), net | $ | 180 | | | $ | (957) | | | $ | 14,318 | | | $ | 9,748 | | |
| Change in fair value of acquisition contingent consideration (see Note 17) | | Change in fair value of acquisition contingent consideration (see Note 17) | — | | | 506 | | | — | | | 6 | |
| Receipts related to interest rate swap | | Receipts related to interest rate swap | 2,336 | | | 752 | | | 6,420 | | | 475 | |
Other income (expense), net (2) | | Other income (expense), net (2) | 2,006 | | | 873 | | | (3,719) | | | 1,780 | |
| Total other income, net | | Total other income, net | $ | 5,953 | | | $ | 932 | | | $ | 7,207 | | | $ | 14,793 | |
(1)Foreign exchange loss(loss) gain is primarily attributable to foreign currency translation derived mainly from U.S. Dollardollar denominated cash and cash equivalents, account receivables, customer deposits, and intercompany balances held by foreign subsidiaries. Intercompany finance transactions primarily denominated in U.S. Dollarsdollars resulted in unrealized foreign exchange losses(losses) gains of $5,730$(1,574) and $2,741$(5,730) for the three months ended September 30, 20222023 and 2021,2022, respectively, and $12,293$684 and $1,298$(12,293) for the nine months ended September 30, 20222023 and 2021,2022, respectively.
(2)Other income (expense), net includes investment impairment charges of $(7,318) for the nine months ended September 30, 2023, partially offset by gains on investments of $2,360 recorded during the three months ended September 30, 2023 (see Note 7).
Note 22:21: Net Income (Loss) Per Share
The Company issues certain performance-based RSUs determined to be participating securities because holders of such shares have non-forfeitable dividend rights in the event of the Company’s declaration of a dividend for common shares. As of September 30, 20222023 and 2021,2022, there were 362,773364,753 and 99,683362,773 participating securities outstanding, respectively.
Undistributed net income (loss) allocated to participating securities are subtracted from net income (loss) in determining basic net income (loss) attributable to common stockholders. Basic net income (loss) per share is computed by dividing basic net income (loss) attributable to common stockholders by the weighted average number of shares, inclusive of undistributed shares held in the DCP as phantom shares of the Company’s Class B Common Stock.
For the Company’s diluted net income (loss) per share numerator, interest expense, net of tax, attributable to the assumed conversion of the convertible senior notes is added back to basic net income (loss) attributable to common stockholders. For the Company’s diluted net income (loss) per share denominator, the basic weighted average number of shares is adjusted byfor the effect of dilutive securities, including awards under the Company’s equity compensation plans and ESPP, and byfor the dilutive effect of the assumed conversion of the convertible senior notes. Diluted net income (loss) per share attributable to common stockholders is computed by dividing diluted net income (loss) attributable to common stockholders by the weighted average number of fully diluted common shares.
Except with respect to voting and conversion, the rights of the holders of the Company’s Class A Common Stock and the Company’s Class B Common Stock are identical. Each class of shares has the same rights to dividends and allocation of income (loss) and, therefore, net income (loss) per share would not differ under the two‑class method.
The details of basic and diluted net income (loss) per share are as follows:
| | | | | | | | | | | | | | | | | | | | | | | | | | |
| | Three Months Ended | | Nine Months Ended |
| | September 30, | | September 30, |
| | 2022 | | 2021 | | 2022 | | 2021 |
| Numerator: | | | | | | | | |
| Net income (loss) | | $ | 36,997 | | | $ | (48,022) | | | $ | 149,058 | | | $ | 54,611 | |
| Less: Net income (loss) attributable to participating securities | | (11) | | | (3) | | | (31) | | | (6) | |
| Net income (loss) attributable to Class A and Class B common stockholders, basic | | 36,986 | | | (48,025) | | | 149,027 | | | 54,605 | |
| Add: Interest expense, net of tax, attributable to assumed conversion of convertible senior notes | | 832 | | | — | | (1) | 5,116 | | | — | |
| Net income (loss) attributable to Class A and Class B common stockholders, diluted | | $ | 37,818 | | | $ | (48,025) | | | $ | 154,143 | | | $ | 54,605 | |
| | | | | | | | |
| Denominator: | | | | | | | | |
| Weighted average shares, basic | | 310,116,104 | | | 308,195,379 | | | 308,959,801 | | | 305,119,985 | |
| Dilutive effect of stock options, restricted stock, and RSUs | | 4,126,936 | | | — | | | 5,278,839 | | | 9,430,643 | |
| Dilutive effect of ESPP | | 168,518 | | | — | | | 171,571 | | | 107,508 | |
| Dilutive effect of assumed conversion of convertible senior notes | | 10,758,825 | | | — | | | 17,667,623 | | | — | |
| Weighted average shares, diluted | | 325,170,383 | | | 308,195,379 | | | 332,077,834 | | | 314,658,136 | |
| | | | | | | | |
| Net income (loss) per share, basic | | $ | 0.12 | | | $ | (0.16) | | | $ | 0.48 | | | $ | 0.18 | |
| Net income (loss) per share, diluted | | $ | 0.12 | | | $ | (0.16) | | | $ | 0.46 | | | $ | 0.17 | |
(1)The effect of interest expense, net of tax, attributable to assumed conversion of convertible senior notes for the three months ended September 30, 2021 has been excluded from the calculation of diluted net loss per share due to the net loss for the period.
| | | | | | | | | | | | | | | | | | | | | | | | | | |
| | Three Months Ended | | Nine Months Ended |
| | September 30, | | September 30, |
| | 2023 | | 2022 | | 2023 | | 2022 |
| Numerator: | | | | | | | | |
| Net income | | $ | 53,027 | | | $ | 36,997 | | | $ | 147,202 | | | $ | 149,058 | |
| Less: Net income attributable to participating securities | | (18) | | | (11) | | | (56) | | | (31) | |
| Net income attributable to Class A and Class B common stockholders, basic | | 53,009 | | | 36,986 | | | 147,146 | | | 149,027 | |
| Add: Interest expense, net of tax, attributable to assumed conversion of convertible senior notes | | 1,716 | | | 832 | | | 5,157 | | | 5,116 | |
| Net income attributable to Class A and Class B common stockholders, diluted | | $ | 54,725 | | | $ | 37,818 | | | $ | 152,303 | | | $ | 154,143 | |
| | | | | | | | |
| Denominator: | | | | | | | | |
| Weighted average shares, basic | | 313,069,132 | | | 310,116,104 | | | 311,915,808 | | | 308,959,801 | |
| Dilutive effect of stock options, restricted stock, and RSUs | | 2,115,802 | | | 4,126,936 | | | 2,534,773 | | | 5,278,839 | |
| Dilutive effect of ESPP | | 6,466 | | | 168,518 | | | 60,526 | | | 171,571 | |
| Dilutive effect of assumed conversion of convertible senior notes | | 17,633,786 | | | 10,758,825 | | | 17,633,786 | | | 17,667,623 | |
| Weighted average shares, diluted | | 332,825,186 | | | 325,170,383 | | | 332,144,893 | | | 332,077,834 | |
| | | | | | | | |
| Net income per share, basic | | $ | 0.17 | | | $ | 0.12 | | | $ | 0.47 | | | $ | 0.48 | |
| Net income per share, diluted | | $ | 0.16 | | | $ | 0.12 | | | $ | 0.46 | | | $ | 0.46 | |
The following potential common shares were excluded from the calculation of diluted net income (loss) per share attributable to common stockholders because their effect would have been anti‑dilutive for the periods presented:
| | | | | | | | | | | | | | | | | | | | | | | |
| Three Months Ended | | Nine Months Ended |
| September 30, | | September 30, |
| 2022 | | 2021 | | 2022 | | 2021 |
| RSUs | 297,789 | | | 8,174,124 | | | 279,789 | | | 90,400 | |
| ESPP | — | | | 97,804 | | | — | | | — | |
| Convertible senior notes | 6,908,798 | | | 17,667,623 | | | — | | | 12,076,899 | |
| Total anti-dilutive securities | 7,206,587 | | | 25,939,551 | | (1) | 279,789 | | | 12,167,299 | |
(1)The effect of dilutive securities for the three months ended September 30, 2021 have been excluded from the calculation of diluted net loss per share as those potential common shares would have been anti‑dilutive due to the net loss for the period, except for 90,400 RSUs that were anti‑dilutive under the two‑class method calculation of diluted net income (loss) per share. | | | | | | | | | | | | | | | | | | | | | | | |
| Three Months Ended | | Nine Months Ended |
| September 30, | | September 30, |
| 2023 | | 2022 | | 2023 | | 2022 |
| RSUs | — | | | 297,789 | | | — | | | 279,789 | |
| | | | | | | |
| Convertible senior notes | — | | | 6,908,798 | | | — | | | — | |
| Total anti-dilutive securities | — | | | 7,206,587 | | | — | | | 279,789 | |
Item 2. Management’s Discussion and Analysis of Financial Condition and Results of Operations
The following discussion should be read in conjunction with our unaudited consolidated financial statements and notes thereto appearing in Part I, Item 1 of this Quarterly Report on Form 10‑Q and with our audited consolidated financial statements and notes thereto included in Part II, Item 8 of our 20212022 Annual Report on Form 10‑K on file with the United States Securities and Exchange Commission (“SEC”). In addition to historical information, this discussion contains forward‑looking statements that involve risks, uncertainties, and assumptions that could cause actual results to differ materially from management’s expectations. Factors that could cause such differences are set forth in Part II, Item 1A. Risk Factors of this Quarterly Report on Form 10‑Q.K.
All amounts presented in this Management’s Discussion and Analysis of Financial Condition and Results of Operations, except share and per share amounts, are presented in thousands. Additionally, many of the amounts and percentages have been rounded for convenience of presentation. Minor differences in totals and percentage calculations may exist due to rounding.
Overview:
Overview
We are a leading global provider of software for infrastructure engineering, enablingand enable infrastructure professionals and their organizations, by “going digital” through our software and cloud services offerings, to better design, build, and operate better infrastructure. Our users engineer, construct, and operate projects and assets across the work of civil, structural, geoprofessional,following infrastructure sectors: public works/utilities, resources, industrial, and plant engineering practitioners, their project delivery enterprises, and owner‑operators of infrastructure assets.
commercial/facilities.
Our enduring commitment is to develop and support the most comprehensive portfolio of integrated software offerings across professional disciplines, project and asset lifecycles, infrastructure sectors, and geographies. Our software enables digital workflows across engineering disciplines, distributed project teams, from offices to the field, and across computing form factors, including desktops, on‑premises servers, cloud‑native services, mobile devices, and web browsers. We deliver our solutions via on‑premises, cloud, and hybrid environments. Our users engineer, construct,software enables digital workflows across engineering disciplines, across distributed project teams, and operate projects and assets across the following infrastructure sectors:
•public works (including roads, rail, bridges, tunnels, airports, ports, and federal, state, and municipal agencies)/utilities (including networks for electricity, gas, communications, and water, wastewater, and drainage). We estimate that this sector represents 49% of the net infrastructure asset value of the global top 500 infrastructure owners based on the 2021 edition of the Bentley Infrastructure 500 TopOwners, our annual compilation of the world’s largest infrastructure owners ranked by netdepreciated value of their tangible fixed assets;
•industrial (including discrete and process manufacturing, oil and gas “downstream,” and power generation). We estimate that this sector represents 18% of the global top 500 infrastructure owners’ net infrastructure asset value;
•resources (including mining, oil and gas “upstream,” offshore, pipelines, environmental management, and renewable energy). We estimate that this sector represents 22% of the global top 500 infrastructure owners’ net infrastructure asset value; and
•commercial/facilities (including office buildings, retail facilities, hospitals, and campuses). We estimate that thissector represents 11% of the global top 500 infrastructure owners’ net infrastructure asset value.
We offer solutions for enterprises and professionals across the infrastructure lifecycle. Our engineering applications and geoprofessional applications support the breadth of engineering and geoprofessional disciplines and are primarily desktop applications for professional practitioners. Our project delivery and asset performance Enterprise Systems are provided via cloud and hybrid environments, developed respectively to extend enterprise collaboration during project delivery, and to manage and leverage engineering information during operations and maintenance. Our Industry Solutions solve domain‑specific problems for owners of infrastructure assets, and the project delivery ecosystems that support these owners. Our cloud-native iTwin Platform solutions enable digital twin workflows, which can span project and asset lifecycles.
We continue to make substantial investments in research and development because we believe the infrastructure engineering software market presents compelling opportunities for the application of new technologies that advance our current solutions. Our research and development roadmap balances technology advances and new offerings with continuous enhancements to existing offerings. Our allocation of research and development resources is guided by management‑established priorities, input from product managers, and user and sales force feedback.
We bring our offerings to market primarily through direct sales channels that generated approximately 92% of our 2021 total revenues.
Our sources of revenue growth, excluding the impact from acquisitions, come from additional subscriptions revenues from existing accounts using the same products and represent the majority of our revenue growth, additional subscriptions revenues from existing accounts using new products, and subscriptions revenues from new accounts. For the year ended December 31, 2021, subscriptions represented 84% of our total revenues, and together with certain services revenues that are recurring in nature and represented 2% of our total revenues, brought the proportion of our recurring revenues to 86% of our total revenues. The remaining 14% of our revenues were generated from the sale of perpetual licenses and the delivery of non‑recurring services. We have a highly‑diversified account base, with our largest account representing no more than 2.5% of our total revenues in 2021. Our 2021 total revenues were also diversified by account type, size, and geography. Additionally, we believe that we have a loyal account base, with over 70% of our 2021 total revenues from organizations that have been our accounts for over ten years. Between 2001 and 2021, our total revenues had an approximately 8% compound annual growth rate.
Our Commercial Offerings:
Our solutions are made available to our accounts in a broad range of commercial offerings designed to accommodate the diverse preferences of our accounts, which range from owned versus subscribed, short‑term subscriptions versus longer term annual subscriptions, and fee‑certain arrangements versus variable or consumption‑based arrangements with consumption measurement durations of less than one year. We contract our commercial offerings under a single form of standard contract, which includes liability and other risk protections in our favor, and appropriate standard addendumsoffices to the primary contract, which specifically address the commercial offerings provided. Our standard commercial offerings are summarized in the table below, with further descriptions following the table:field.
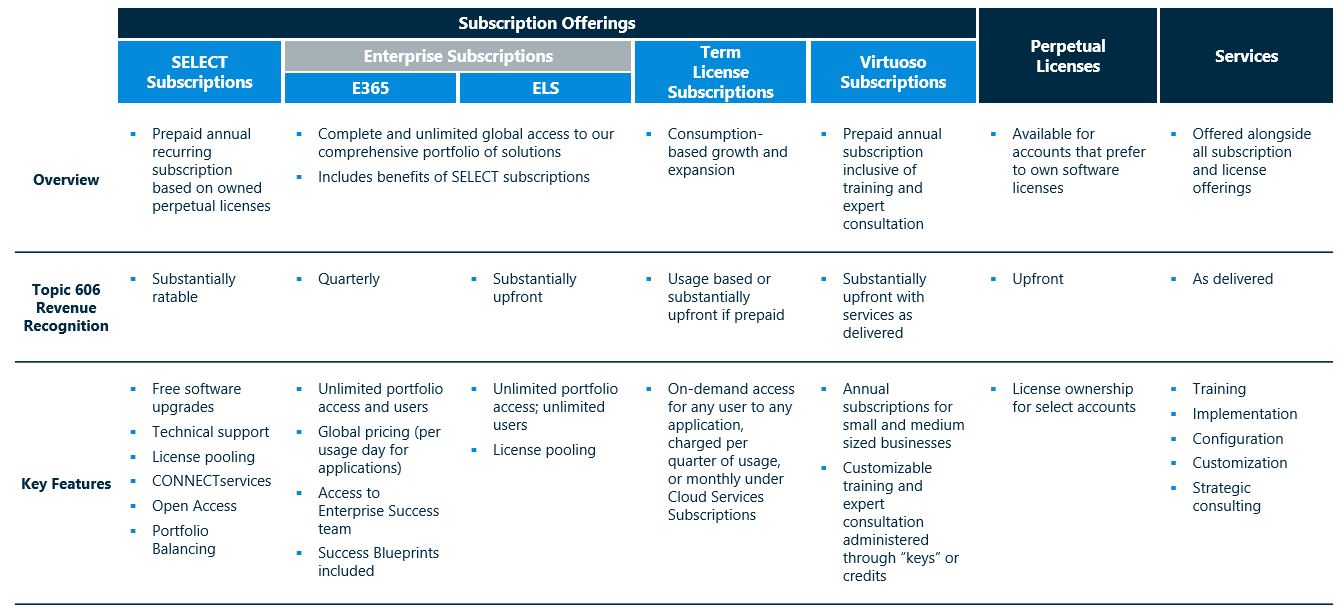
SELECT Subscriptions. Our SELECT subscription is a prepaid annual recurring subscription thataccompanies a new or previously purchased perpetual license. We believe that our offerings, in particular our infrastructure digital twin solutions, empower the SELECT benefits summarized below supportachievement of sustainable development goals by helping our favorable rates of account retentionusers – infrastructure professionals – realize outcomes that are more sustainable and growth:
•Software upgrades;
•Comprehensive technical support;
•License pooling providing accounts with efficiency advantages;
•Portfolio balancing providing accounts the opportunity to exchange unused or under used licenses with other of our license offerings;
•Learning benefits, Azure‑based cloud collaboration services, and mobility advantages; and
•Access to our entire application portfolio with usage of licenses not previously purchased monetized quarterly in arrears based on consumption. See the section titled “—Term License Subscriptions” below.
Enterprise Subscriptions. Our enterprise subscription offerings provide our enterprise accounts withcomplete and unlimited global access to our comprehensive portfolio of solutions.
•Enterprise 365 (“E365”) Subscriptions. Under our E365 subscription, accounts are charged based upon daily usage. E365 subscriptions can contain quarterly usage floors or collars. The daily usage fee includes a term license component, SELECT maintenance and support, hosting, and Success Blueprints, which are designed to achieve business outcomes through more efficient and effective use of our software.
•Enterprise License Subscriptions (“ELS”). Under our ELS offering, accounts are charged based upon a fixed annual fee. Subsequent annual renewals are based on the account’s usage of software in the preceding year, effectively resulting in a fee‑certain annual consumption‑based arrangement. We are completing efforts to transition ELS subscribers to E365 subscriptions, primarily to simplify pricing, more closely align consumption to monetization, and to establish Success Blueprints as recurring to ensure better business outcomes for our users. In transitioning subscribers to E365, we recognize a greater proportion of our revenues on a quarterly basis rather than substantially upfront.
Term License Subscriptions
Annual Term Licenses (“ATL”) Subscription. Annual term licenses are generally prepaid annuallyfor named user access to specific products and include our Virtuoso subscriptions sold via our Virtuosity eStore for practitioner licenses. Virtuoso subscriptions are bundles with customizable training and expert consultation administered through “keys” or credits. ATL are also used to monetize site or enterprise wide access for certain of our AssetWise solutions within given usage bands.
Quarterly Term License (“QTL”) Subscription. Through quarterly term licenses, accounts payquarterly in arrears for licenses they have used representing usage beyond their contracted quantities. Much like our enterprise subscription programs, a QTL allows smaller- and medium‑sized accounts to match usage to ongoing project requirements.
Monthly Term License (“MTL”) Subscription. Monthly term licenses are identical to QTLsubscriptions, except for the term of the license, and the manner in which they are monetized. MTL subscriptions require a Cloud Services Subscription, which is discussed below.resilient.
Visas and Passports. Visas and Passports are quarterly or annual term licenses enabling users toaccess specific project or enterprise information and entitles our users to certain functionality of our ProjectWise and AssetWise systems. Generally, a Passport provides desktop, web, and mobile application access to project information and certain functions, and a Visa provides similar access, plus added functionality depending upon the product to which the Visa is aligned.
While certain legacy arrangements are supported, our standard offering requires Visas and Passports to be fulfilled and contracted via a CSS, which is discussed below.
Cloud Services Subscription (“CSS”). CSS is designed to streamline the procurement, administration, and payment process for us and our accounts. A CSS requires an upfront annual estimation of MTL, Visa and Passport consumption, and any Success Services expected for the upcoming year. A deposit for the annual estimated consumption is submitted in advance. Actual consumption is monitored and invoiced against the deposit on a calendar quarter basis. Accounts are charged only for what gets used and deposited amounts never expire.
Perpetual Licenses
We historically have sold perpetual licenses and continue to offer them to our accounts as an available option for most of our applications. Perpetual licenses are available for accounts that prefer to own their software licenses and may be sold with or without attaching a SELECT subscription. Historically, attachment and retention of the SELECT subscription has been high given the benefits of the SELECT subscription.
Services
We provide professional services, including training, implementation, configuration, customization, and strategic consulting services. We perform projects on both a time and materials and a fixed fee basis. Certain of our fixed‑fee arrangements, including our Success Services offerings, are structured as subscription‑like, packaged offerings that are annually recurring in nature. Success Services are standard service offerings that provide a level of dedicated professional services above the standard technical support offered to all accounts as part of their SELECT or enterprise agreement.
Key Business Metrics:
We regularly review the following key metrics to evaluate our business, measure our performance, identify trends in our business, prepare financial projections, and make strategic decisions.
| | | | | | | | | | | |
| September 30, |
| 2022 | | 2021 |
| Annualized recurring revenues (“ARR”) | $ | 983,656 | | | $ | 903,845 | |
| Last twelve-months recurring revenues | $ | 950,367 | | | $ | 789,972 | |
| Twelve-months ended constant currency: | | | |
| ARR growth rate | 14 | % | | 26 | % |
| Account retention rate | 99 | % | | 98 | % |
| Recurring revenues dollar-based net retention rate | 110 | % | | 106 | % |
Results of Operations
| | | | | | | | | | | | | | | | | | | | | | | | | | |
| | Three Months Ended | | Nine Months Ended |
| | September 30, | | September 30, |
| | 2023 | | 2022 | | 2023 | | 2022 |
| Revenues: | | | | | | | | |
| Subscriptions | | $ | 270,751 | | | $ | 235,307 | | | $ | 807,839 | | | $ | 708,731 | |
| Perpetual licenses | | 11,887 | | | 9,460 | | | 33,152 | | | 31,213 | |
| Subscriptions and licenses | | 282,638 | | | 244,767 | | | 840,991 | | | 739,944 | |
| Services | | 23,974 | | | 23,565 | | | 76,781 | | | 72,190 | |
| Total revenues | | 306,612 | | | 268,332 | | | 917,772 | | | 812,134 | |
| Cost of revenues: | | | | | | | | |
| Cost of subscriptions and licenses | | 42,088 | | | 37,371 | | | 124,175 | | | 107,904 | |
| Cost of services | | 22,588 | | | 21,812 | | | 74,111 | | | 66,758 | |
| Total cost of revenues | | 64,676 | | | 59,183 | | | 198,286 | | | 174,662 | |
| Gross profit | | 241,936 | | | 209,149 | | | 719,486 | | | 637,472 | |
| Operating expense (income): | | | | | | | | |
| Research and development | | 65,465 | | | 63,827 | | | 203,382 | | | 189,966 | |
| Selling and marketing | | 53,757 | | | 46,114 | | | 160,262 | | | 141,676 | |
| General and administrative | | 42,678 | | | 37,794 | | | 128,743 | | | 128,981 | |
| Deferred compensation plan | | (3,160) | | | (4,576) | | | 4,763 | | | (21,873) | |
| Amortization of purchased intangibles | | 9,517 | | | 10,446 | | | 29,567 | | | 30,869 | |
| Total operating expenses | | 168,257 | | | 153,605 | | | 526,717 | | | 469,619 | |
| Income from operations | | 73,679 | | | 55,544 | | | 192,769 | | | 167,853 | |
| Interest expense, net | | (10,047) | | | (9,134) | | | (30,623) | | | (23,521) | |
| Other income, net | | 5,953 | | | 932 | | | 7,207 | | | 14,793 | |
| Income before income taxes | | 69,585 | | | 47,342 | | | 169,353 | | | 159,125 | |
| Provision for income taxes | | (16,514) | | | (9,664) | | | (22,107) | | | (8,221) | |
| Loss from investments accounted for using the equity method, net of tax | | (44) | | | (681) | | | (44) | | | (1,846) | |
| Net income | | $ | 53,027 | | | $ | 36,997 | | | $ | 147,202 | | | $ | 149,058 | |
| Per share information: | | | | | | | | |
| Net income per share, basic | | $ | 0.17 | | | $ | 0.12 | | | $ | 0.47 | | | $ | 0.48 | |
| Net income per share, diluted | | $ | 0.16 | | | $ | 0.12 | | | $ | 0.46 | | | $ | 0.46 | |
| Weighted average shares, basic | | 313,069,132 | | | 310,116,104 | | | 311,915,808 | | | 308,959,801 | |
| Weighted average shares, diluted | | 332,825,186 | | | 325,170,383 | | | 332,144,893 | | | 332,077,834 | |
| | | | | | | | |
Comparison of the Three and Nine Months Ended September 30, 2023 and 2022
Revenues
| | | | | | | | | | | | | | | | | | | | | | | | | | | | | |
| | | | | Comparison |
| Three Months Ended | | | | | | Constant |
| September 30, | | | | | | Currency |
| 2023 | | 2022 | | Amount | | % | | %(1) |
| Subscriptions | $ | 270,751 | | | $ | 235,307 | | | $ | 35,444 | | | 15.1 | % | | 11.7 | % |
| Perpetual licenses | 11,887 | | | 9,460 | | | 2,427 | | | 25.7 | % | | 23.1 | % |
| Subscriptions and licenses | 282,638 | | | 244,767 | | | 37,871 | | | 15.5 | % | | 12.1 | % |
| Services | 23,974 | | | 23,565 | | | 409 | | | 1.7 | % | | (0.5 | %) |
| Total revenues | $ | 306,612 | | | $ | 268,332 | | | $ | 38,280 | | | 14.3 | % | | 11.0 | % |
| | | | | | | | | | | | | | | | | | | | | | | | | | | | | |
| | | | | Comparison |
| Nine Months Ended | | | | | | Constant |
| September 30, | | | | | | Currency |
| 2023 | | 2022 | | Amount | | % | | %(1) |
| Subscriptions | $ | 807,839 | | | $ | 708,731 | | | $ | 99,108 | | | 14.0 | % | | 13.6 | % |
| Perpetual licenses | 33,152 | | | 31,213 | | | 1,939 | | | 6.2 | % | | 6.5 | % |
| Subscriptions and licenses | 840,991 | | | 739,944 | | | 101,047 | | | 13.7 | % | | 13.3 | % |
| Services | 76,781 | | | 72,190 | | | 4,591 | | | 6.4 | % | | 7.7 | % |
| Total revenues | $ | 917,772 | | | $ | 812,134 | | | $ | 105,638 | | | 13.0 | % | | 12.8 | % |
(1)Constant currency is a non-GAAP financial measure. Refer to the “Non-GAAP Financial Measures” section for additional information, including our definition and our use of constant currency.
The increase in total revenues for the three and nine months ended September 30, 2023 was primarily driven by increases in subscriptions revenues, and to a lesser extent, perpetual licenses and services revenues.
Subscriptions. For the three months ended September 30, 2023, the increase in subscriptions revenues was driven by improvements in our business performance of approximately $35,444 ($27,438 on a constant currency basis). Our business performance excludes the impact of our platform acquisitions and includes the impact from programmatic acquisitions, which generally are immaterial, individually and in the aggregate.
For the nine months ended September 30, 2023, the increase in subscriptions revenues was primarily driven by improvements in our business performance of approximately $94,807 ($91,790 on a constant currency basis) and the impact from our platform acquisition of approximately $4,301 ($4,330 on a constant currency basis). The platform acquisition impact relates to our acquisition of PLS and is inclusive of PLS’ organic performance.
For the three and nine months ended September 30, 2023, the improvements in business performance were primarily driven by expansion from accounts with revenues in the prior period (“existing accounts”), and growth of 3% attributable to new accounts, most notably smaller- and medium-sized accounts. Improvements in business performance for the three and nine months ended September 30, 2023 were led by our civil and structural engineering applications, geoprofessional applications, and our Enterprise Systems for project delivery.
Perpetual licenses. For the three and nine months ended September 30, 2023, the increase in perpetual licenses revenues was driven by improvements in business performance of approximately $2,427 ($2,184 on a constant currency basis) and $1,939 ($2,026 on a constant currency basis), respectively.
For the three and nine months ended September 30, 2023, the improvements in our business performance were primarily driven by growth in new accounts.
Services. For the three months ended September 30, 2023, services revenues increased by approximately $409 (decreased by approximately $107 on a constant currency basis) due to business performance.
For the nine months ended September 30, 2023, the increase in services revenues was driven by improvements in our business performance of approximately $4,591 ($5,551 on a constant currency basis).
For the three and nine months ended September 30, 2023, the improvements in business performance were primarily driven by contributions from Cohesive digital integrator services of approximately $1,168 ($852 on a constant currency basis) and $6,347 ($7,297 on a constant currency basis), respectively.
Revenues by Geographic Region
Revenue from external customers is attributed to individual countries based upon the location of the customer. Revenues by geographic region are as follows:
| | | | | | | | | | | | | | | | | | | | | | | | | | | | | |
| | | | | Comparison |
| Three Months Ended | | | | | | Constant |
| September 30, | | | | | | Currency |
| 2023 | | 2022 | | Amount | | % | | %(1) |
| Americas | $ | 162,367 | | | $ | 141,599 | | | $ | 20,768 | | | 14.7 | % | | 13.9 | % |
| EMEA | 86,956 | | | 75,416 | | | 11,540 | | | 15.3 | % | | 7.3 | % |
| APAC | 57,289 | | | 51,317 | | | 5,972 | | | 11.6 | % | | 8.4 | % |
| Total revenues | $ | 306,612 | | | $ | 268,332 | | | $ | 38,280 | | | 14.3 | % | | 11.0 | % |
| | | | | | | | | | | | | | | | | | | | | | | | | | | | | |
| | | | | Comparison |
| Nine Months Ended | | | | | | Constant |
| September 30, | | | | | | Currency |
| 2023 | | 2022 | | Amount | | % | | %(1) |
| Americas | $ | 489,548 | | | $ | 440,218 | | | $ | 49,330 | | | 11.2 | % | | 11.0 | % |
| EMEA | 263,232 | | | 227,696 | | | 35,536 | | | 15.6 | % | | 14.6 | % |
| APAC | 164,992 | | | 144,220 | | | 20,772 | | | 14.4 | % | | 15.2 | % |
| Total revenues | $ | 917,772 | | | $ | 812,134 | | | $ | 105,638 | | | 13.0 | % | | 12.8 | % |
(1)Constant currency is a non-GAAP financial measure. Refer to the “Non-GAAP Financial Measures” section for additional information, including our definition and our use of constant currency.
Americas. For the three months ended September 30, 2023, the increase in revenues from the Americas was driven by improvements in our business performance of approximately $20,768 ($19,690 on a constant currency basis).
For the nine months ended September 30, 2023, the increase in revenues from the Americas was primarily driven by improvements in our business performance of approximately $45,640 ($44,865 on a constant currency basis) and the impact from our platform acquisition of approximately $3,690 ($3,697 on a constant currency basis).
The improvements in business performance for the three and nine months ended September 30, 2023 were primarily due to expansion of our subscriptions revenues from existing accounts in the U.S.
EMEA. For the three and nine months ended September 30, 2023, the increase in revenues from EMEA was primarily driven by improvements in our business performance of approximately $11,540 ($5,529 on a constant currency basis) and $35,087 ($32,694 on a constant currency basis), respectively.
The improvements in business performance for the three and nine months ended September 30, 2023 were primarily due to expansion of our subscriptions revenues from existing accounts in the U.K., the Middle East, and to a lesser extent South Africa, partially offset by reductions in Russia due to exiting our operations beginning in the second quarter of 2022.
APAC. For the three and nine months ended September 30, 2023, the increase in revenues from APAC was primarily driven by improvements in our business performance of approximately $5,972 ($4,294 on a constant currency basis) and $20,610 ($21,809 on a constant currency basis), respectively.
The improvements in business performance for the three and nine months ended September 30, 2023 were primarily due to expansion of our subscriptions revenues from existing accounts in India, Australia, and Southeast Asia.
Revenues in China for the three and nine months ended September 30, 2023 increased as compared to the same periods in the prior year, primarily due to expansion of our perpetual licenses revenues. The future results in China remain uncertain as a result of continued geopolitical challenges, the obstacles there to cloud‑deployed software, and the financial timing impact of the preference there for license sales, rather than subscriptions, of locally-developed solutions based on our platforms.
Cost of Revenues
| | | | | | | | | | | | | | | | | | | | | | | | | | | | | |
| | | | | Comparison |
| Three Months Ended | | | | | | Constant |
| September 30, | | | | | | Currency |
| 2023 | | 2022 | | Amount | | % | | %(1) |
| Cost of subscriptions and licenses | $ | 42,088 | | | $ | 37,371 | | | $ | 4,717 | | | 12.6 | % | | 10.7 | % |
| Cost of services | 22,588 | | | 21,812 | | | 776 | | | 3.6 | % | | 0.9 | % |
| Total cost of revenues | $ | 64,676 | | | $ | 59,183 | | | $ | 5,493 | | | 9.3 | % | | 7.1 | % |
| | | | | | | | | | | | | | | | | | | | | | | | | | | | | |
| | | | | Comparison |
| Nine Months Ended | | | | | | Constant |
| September 30, | | | | | | Currency |
| 2023 | | 2022 | | Amount | | % | | %(1) |
| Cost of subscriptions and licenses | $ | 124,175 | | | $ | 107,904 | | | $ | 16,271 | | | 15.1 | % | | 15.6 | % |
| Cost of services | 74,111 | | | 66,758 | | | 7,353 | | | 11.0 | % | | 13.0 | % |
| Total cost of revenues | $ | 198,286 | | | $ | 174,662 | | | $ | 23,624 | | | 13.5 | % | | 14.6 | % |
(1)Constant currency is a non-GAAP financial measure. Refer to the “Non-GAAP Financial Measures” section for additional information, including our definition and our use of constant currency.
Cost of subscriptions and licenses. For the three months ended September 30, 2023, on a constant currency basis, cost of subscriptions and licenses increased primarily due to an increase in headcount‑related costs of approximately $2,871, mainly due to increases in headcount and annual compensation costs, and an increase in channel partner compensation of approximately $767.
For the nine months ended September 30, 2023, on a constant currency basis, cost of subscriptions and licenses increased primarily due to an increase in headcount‑related costs of approximately $11,103, mainly due to increases in headcount and annual compensation costs, an increase in cloud‑related costs of approximately $2,987, and an increase in channel partner compensation of approximately $1,963.
Cost of services. For the three months ended September 30, 2023, on a constant currency basis, cost of services increased primarily due to an increase in headcount-related costs of approximately $484, mainly due to increases in headcount, partially offset by lower acquisition-related retention incentives.
For the nine months ended September 30, 2023, on a constant currency basis, cost of services increased primarily due to an increase in headcount-related costs of approximately $8,790, mainly due to third-party personnel cost, and to a lesser extent, increases in headcount, partially offset by lower acquisition-related retention incentives.
Operating Expense (Income)
| | | | | | | | | | | | | | | | | | | | | | | | | | | | | |
| | | | | Comparison |
| Three Months Ended | | | | | | Constant |
| September 30, | | | | | | Currency |
| 2023 | | 2022 | | Amount | | % | | %(1) |
| Research and development | $ | 65,465 | | | $ | 63,827 | | | $ | 1,638 | | | 2.6 | % | | 1.7 | % |
| Selling and marketing | 53,757 | | | 46,114 | | | 7,643 | | | 16.6 | % | | 15.0 | % |
| General and administrative | 42,678 | | | 37,794 | | | 4,884 | | | 12.9 | % | | 11.3 | % |
| Deferred compensation plan | (3,160) | | | (4,576) | | | 1,416 | | | (30.9 | %) | | NM |
| Amortization of purchased intangibles | 9,517 | | | 10,446 | | | (929) | | | (8.9 | %) | | (9.7 | %) |
| Total operating expenses | $ | 168,257 | | | $ | 153,605 | | | $ | 14,652 | | | 9.5 | % | | 8.3 | % |
| | | | | | | | | | | | | | | | | | | | | | | | | | | | | |
| | | | | Comparison |
| Nine Months Ended | | | | | | Constant |
| September 30, | | | | | | Currency |
| 2023 | | 2022 | | Amount | | % | | %(1) |
| Research and development | $ | 203,382 | | | $ | 189,966 | | | $ | 13,416 | | | 7.1 | % | | 8.8 | % |
| Selling and marketing | 160,262 | | | 141,676 | | | 18,586 | | | 13.1 | % | | 14.3 | % |
| General and administrative | 128,743 | | | 128,981 | | | (238) | | | (0.2 | %) | | 0.2 | % |
| Deferred compensation plan | 4,763 | | | (21,873) | | | 26,636 | | | NM | | NM |
| Amortization of purchased intangibles | 29,567 | | | 30,869 | | | (1,302) | | | (4.2 | %) | | (3.7 | %) |
| Total operating expenses | $ | 526,717 | | | $ | 469,619 | | | $ | 57,098 | | | 12.2 | % | | 13.3 | % |
Percentage changes that are considered not meaningful are denoted with NM.
(1)Constant currency is a non-GAAP financial measure. Refer to the “Non-GAAP Financial Measures” section for additional information, including our definition and our use of constant currency.
Research and development. For the three and nine months ended September 30, 2023, on a constant currency basis, research and development expenses increased primarily due to an increase in headcount-related costs of approximately $1,358 and $16,652, respectively, mainly due to increases in annual compensation costs and headcount, partially offset by a decrease in stock‑based compensation expense.
Selling and marketing. For the three and nine months ended September 30, 2023, on a constant currency basis, selling and marketing expenses increased primarily due to an increase in headcount-related costs of approximately $6,094 and $18,716, respectively, mainly due to increases in headcount and annual compensation costs, and to a lesser extent, an increase in stock‑based compensation expense.
General and administrative. For the three months ended September 30, 2023, on a constant currency basis, general and administrative expenses increased primarily due to an increase in headcount-related costs of approximately $2,009, mainly due to increases in annual compensation costs and headcount, and to a lesser extent, increases in third-party personnel costs, and higher acquisition expenses of approximately $931.
For the nine months ended September 30, 2023, on a constant currency basis, general and administrative expenses increased primarily due to an increase in headcount-related costs of approximately $13,685, mainly due to increases in headcount and annual compensation costs. Partially offsetting these increases were lower non‑income related taxes of approximately $5,328 and lower acquisition expenses of approximately $4,920. Costs resulting from our decision to wind down business and exit the Russian market beginning in the second quarter of 2022 were approximately $2,758 lower in the current year period.
Deferred compensation plan. For the three and nine months ended September 30, 2023 and 2022, deferred compensation plan (income) expense was attributable to the marked to market impact on deferred compensation plan liability balances period over period.
Amortization of purchased intangibles. For the three and nine months ended September 30, 2023, on a constant currency basis, amortization of purchased intangibles decreased primarily due to previously acquired intangible assets that continue to become fully amortized and lower acquisition activity as compared to the prior year.
Interest Expense, Net
| | | | | | | | | | | | | | | | | | | | | | | |
| Three Months Ended | | Comparison |
| September 30, | | | | |
| 2023 | | 2022 | | Amount | | % |
| Interest expense | $ | (10,548) | | | $ | (9,243) | | | $ | (1,305) | | | 14.1 | % |
| Interest income | 501 | | | 109 | | | 392 | | | NM |
| Interest expense, net | $ | (10,047) | | | $ | (9,134) | | | $ | (913) | | | 10.0 | % |
| | | | | | | | | | | | | | | | | | | | | | | |
| Nine Months Ended | | Comparison |
| September 30, | | | | |
| 2023 | | 2022 | | Amount | | % |
| Interest expense | $ | (31,863) | | | $ | (23,794) | | | $ | (8,069) | | | 33.9 | % |
| Interest income | 1,240 | | | 273 | | | 967 | | | NM |
| Interest expense, net | $ | (30,623) | | | $ | (23,521) | | | $ | (7,102) | | | 30.2 | % |
Percentage changes that are considered not meaningful are denoted with NM.
For the three and nine months ended September 30, 2023, interest expense, net increased primarily due to a higher weighted average interest rate on borrowings under the revolving loan facility and on the Term Loan, partially offset by lower weighted average debt outstanding.
Other Income, Net
| | | | | | | | | | | | | | | | | | | | | | | |
| Three Months Ended | | Nine Months Ended |
| September 30, | | September 30, |
| 2023 | | 2022 | | 2023 | | 2022 |
| Gain (loss) from: | | | | | | | |
| Change in fair value of interest rate swap | $ | 4,765 | | | $ | 9,828 | | | $ | 4,102 | | | $ | 29,318 | |
Foreign exchange (1) | (3,154) | | | (11,027) | | | 404 | | | (18,815) | |
| Sale of aircraft | — | | | — | | | — | | | 2,029 | |
| | | | | | | |
| Change in fair value of acquisition contingent consideration | — | | | 506 | | | — | | | 6 | |
| Receipts related to interest rate swap | 2,336 | | | 752 | | | 6,420 | | | 475 | |
Other income (expense), net (2) | 2,006 | | | 873 | | | (3,719) | | | 1,780 | |
| Total other income, net | $ | 5,953 | | | $ | 932 | | | $ | 7,207 | | | $ | 14,793 | |
(1)Foreign exchange (loss) gain is primarily attributable to foreign currency translation derived mainly from U.S. dollar denominated cash and cash equivalents, account receivables, customer deposits, and intercompany balances held by foreign subsidiaries. Intercompany finance transactions primarily denominated in U.S. dollars resulted in unrealized foreign exchange (losses) gains of $(1,574) and $(5,730) for the three months ended September 30, 2023 and 2022, respectively, and $684 and $(12,293) for the nine months ended September 30, 2023 and 2022, respectively.
(2)Other income (expense), net includes investment impairment charges of $(7,318) for the nine months ended September 30, 2023, partially offset by gains on investments of $2,360 recorded during the three months ended September 30, 2023.
Provision for Income Taxes
| | | | | | | | | | | | | | | | | | | | | | | |
| Three Months Ended | | Nine Months Ended |
| September 30, | | September 30, |
| 2023 | | 2022 | | 2023 | | 2022 |
| Income before income taxes | $ | 69,585 | | | $ | 47,342 | | | $ | 169,353 | | | $ | 159,125 | |
| Provision for income taxes | $ | 16,514 | | | $ | 9,664 | | | $ | 22,107 | | | $ | 8,221 | |
| Effective tax rate | 23.7 | % | | 20.4 | % | | 13.1 | % | | 5.2 | % |
For the three months ended September 30, 2023, the effective tax rate was higher compared to the prior year period primarily due to an increase in the forecasted effective tax rate impact of the GILTI inclusion due to the mandatory capitalization of research and development expenses for U.S. tax purposes. For the three months ended September 30, 2023 and 2022, we recorded discrete tax benefits of $4,428 and $4,280, respectively, primarily associated with windfall tax benefits from stock‑based compensation, net of the impact from officer compensation limitation provisions.
For the nine months ended September 30, 2023, the effective tax rate was higher compared to the prior year period primarily due to an increase in the forecasted effective tax rate impact of the GILTI inclusion due to the mandatory capitalization of research and development expenses for U.S. tax purposes and a decrease in discrete tax benefits recognized in the current year period. For the nine months ended September 30, 2023 and 2022, we recorded discrete tax benefits of $31,895 and $36,032, respectively, primarily associated with windfall tax benefits from stock‑based compensation, net of the impact from officer compensation limitation provisions.
Key Business Metrics
In addition to our results of operations discussed above, we believe the following presentation of key business metrics provides additional useful information to investors regarding our results of operations. To the extent material, we disclose below the additional purposes, if any, for which our management uses these key business metrics. Our key business metrics may vary significantly from period to period for reasons unrelated to our operating performance and may differ from similarly titled measures presented by other companies.
| | | | | | | | | | | |
| September 30, |
| 2023 | | 2022 |
| ARR | $ | 1,124,774 | | | $ | 983,656 | |
| Last twelve-months recurring revenues | $ | 1,076,434 | | | $ | 950,367 | |
Twelve-months ended constant currency (1): | | | |
| ARR growth rate | 12.5 | % | | 14 | % |
| Account retention rate | 97 | % | | 99 | % |
| Recurring revenues dollar-based net retention rate | 110 | % | | 110 | % |
(1)Constant currency is a non-GAAP financial measure. Refer to the “Non-GAAP Financial Measures” section for additional information, including our definition and our use of constant currency.
Recurring revenues
Recurring revenues are the basis for our other revenue-related key business metrics. We believe this measure is useful in evaluating our ability to consistently retain and grow our revenues within our existing accounts.
Recurring revenues are subscriptions revenues that recur monthly, quarterly, or annually with specific or automatic renewal clauses and professional services revenues in which the underlying contract is based on a fixed fee and contains automatic annual renewal provisions.
ARR
ARR is a key business metric that we believe is useful in evaluating the scale and growth of our business as well as to assist in the evaluation of underlying trends in our business. Furthermore, we believe ARR, considered in connection with our last twelve‑month recurring revenues dollar‑based net retention rate, is a leading indicator of revenue growth.
ARR is defined as the sum of the annualized value of our portfolio of contracts that produce recurring revenues as of the last day of the reporting period, and the annualized value of the last three months of recognized revenues for our contractually recurring consumption‑based software subscriptions with consumption measurement durations of less than one year, calculated using the spot foreign exchange rates. We believe that the last three months of recognized revenues, on an annualized basis, for our recurring software subscriptions with consumption measurement period durations of less than one year is a reasonable estimate of the annual revenues, given our consistently high retention rate and stability of usage under such subscriptions.
ARR resulting from the annualization of recurring contracts with consumption measurement durations of less than one year, as a percentage of total ARR, was 41%46% and 37%41% as of September 30, 20222023 and 2021,2022, respectively. Within our consumption‑measured ARR, the continuous uptake ofcontinued transition to our E365 subscription offering has increased daily consumption‑measured ARR, representing 39% and 33% of total ARR as of September 30, 2022.2023 and 2022, respectively. For the nine months ended September 30, 2022, ARR was reduced by $11,190 due to our decision to exit the Russian market.
Constant currency ARR growth rate is the growth rate of ARR measured on a constant currency basis. During the twelve months ended September 30, 2022, our ARR growth rate was favorably impacted by 2.5% due to the ARR onboarding from our platform acquisition of PLS. We believe that ARR growth is an important metric indicating the scale and growth of our business. Furthermore, we believe ARR, considered in connection with our recurring revenues dollar‑based net retention rate, is a leading indicator of revenue growth.
In March 2022, in response to the Russia‑Ukraine war, we announced a pause of sales in Russia and Belarus, in addition to our strict compliance with applicable sanctions, regimes, and other regulatory restrictions on business activities in those countries. As a result of the conflict, we deemed our overall business recurrence in the affected countries to have been reduced by approximately 50%, and accordingly, reduced our related ARR by $5,190 as of March 31, 2022. During the second quarter of 2022, the marked shifts in the Russian business environment and economic outlook led us to conclude it was no longer viable for us to continue operations in Russia. Accordingly, we made the decision to wind down business and exit the Russian market, which resulted in a further reduction in our ARR by $6,000.
Last twelve‑months recurring revenues.Last twelve‑months recurring revenues is calculated as recurring revenues recognized over the preceding
Last twelve‑month period. We define recurring revenues as subscriptions revenues that recur monthly, quarterly, or annually with specific or automatic renewal clauses and services revenues in which the underlying contract is based on a fixed fee and contains automatic annual renewal provisions.
We believe that last twelve‑months recurring revenues is an important indicator ofa key business metric that we believe is useful in evaluating our performance during the immediately preceding twelve‑month time period.ability to consistently retain and grow our recurring revenues. We believe that we will continue to experience favorable growth in recurring revenues primarily due to our strong account retention and recurring revenues dollar‑based net retention rates, as well as the addition of new accounts with recurring revenues.
Last twelve‑months recurring revenues is calculated as recurring revenues recognized over the preceding twelve‑month period.
The last twelve‑months recurring revenues for the periods ended September 30, 20222023 compared to the last twelve‑months of the precedingcomparative twelve‑month period increased by $160,395.$126,067. This increase was primarily due to growth in ARR, which is primarily the result of growing our recurring revenues within our existing accounts as expressed in our recurring revenues dollar‑based net retention rate, as well as additional recurring revenues resulting from new accounts and acquisitions, including the favorable impact from our platform acquisitionsacquisition of Power Line Systems and Seequent Holdings Limited (“Seequent”).PLS. For the twelve months ended September 30, 2023 and 2022, 89% and 88%, respectively, of our revenues were recurring revenues.
Constant currency metrics. In reporting period‑over‑period results, we calculate the effects of foreign currency fluctuations and constant currency information by translating current period results using prior period average foreign currency exchange rates. Our definition of constant currency may differ from other companies reporting similarly named measures, and these constant currency performance measures should be viewed in addition to, and not as a substitute for, our operating performance measures calculated in accordance with accounting principles generally accepted in the United States of America (“U.S. GAAP”).Account retention rate
ARR growth rate. Our ARR growthAccount retention rate is a key business metric that we believe is useful in evaluating the growth ratelong‑term value of our ARR, measured on a constant currency basis. Our ARR growth rate was favorably impacted by 2.5% dueaccount relationships and our ability to the ARR onboarding fromretain our platform acquisition of Power Line Systems during the twelve months ended September 30, 2022.account base. We believe that ARR growth is an important metric indicating the scaleour consistent and growth ofhigh account retention rates illustrate our business.ability to retain and cultivate long‑term relationships with our accounts.
Account retention rate. Our account retention rate for any given twelve-month period is calculated using the average currency exchange rates for the prior period, as follows: the prior period recurring revenues from all accounts with recurring revenues in the current and prior period, divided by total recurring revenues from all accounts during the prior period.
Our account retention rate is an important indicator that provides insight intoas of September 30, 2023 was negatively impacted due to our decision to exit the long‑term value of our account relationships and our ability to retain our account base. We believe that our consistent and high account retention rates illustrate our ability to retain and cultivate long‑term relationships with our accounts.Russian market by approximately 1%.
Recurring revenues dollar‑based net retention rate. Ourrate
Recurring revenues dollar‑based net retention rate is a key business metric that we believe is useful in evaluating our ability to consistently retain and grow our recurring revenues.
Recurring revenues dollar‑based net retention rate is calculated, using the average exchange rates for the prior period, as follows: the recurring revenues for the current period, including any growth or reductions from existing accounts, but excluding recurring revenues from any new accounts added during the current period, divided by the total recurring revenues from all accounts during the prior period. A period is defined as any trailing twelve months. Related to our platform acquisitions, recurring revenues into new accounts will be captured as existing accounts starting with the second anniversary of the acquisition when such data conforms to the calculation methodology. This may cause variability in the comparison. We believe our recurring revenues dollar‑based net retention rate is a key indicator of our success in growing our revenues within our existing accounts.
Given that recurring revenues represented 88%89% of our total revenues for the twelve months ended September 30, 2022,2023, this metric helps explain our revenue performance, excluding the impact from acquisitions, as primarily growth into existing accounts. We believe that our consistent and high recurring revenues dollar‑based net retention rate illustrates our ability to consistently retain accounts and grow them.
Our calculation of these metrics may not be comparable to other companies with similarly‑titled metrics.
Non-GAAP Financial Measures:Measures
In addition to our results determined in accordance with U.S. GAAP discussed above, we also usebelieve the following presentation of financial measures not in accordance with GAAP provides useful information to investors regarding our results of operations. To the extent material, we disclose below the additional purposes, if any, for which our management uses these non‑GAAP financial measures and provide reconciliations between these non‑GAAP financial measures and their most directly comparable GAAP financial measures. Non‑GAAP financial information should be considered in addition to, not as a substitute for, or in isolation from, the financial information prepared in accordance with GAAP, including operating income, or other measures of performance. Our non‑GAAP financial measures may vary significantly from period to period for reasons unrelated to our operating performance and may differ from similarly titled measures presented by other companies.
Adjusted OI w/SBC
Adjusted OI w/SBC is a non-GAAP financial measure and is used to measure the operational strength and performance of our business, as well as to assist in the evaluation of underlying trends in our business.
Adjusted OI w/SBC is our primary performance measure, which excludes certain expenses and charges, including the non-cash amortization expense resulting from the acquisition of intangible assets, as we believe these may not be indicative of the Company’s core business operating results. We intentionally include stock-based compensation expense in this measure as we believe it better captures the economic costs of our business.
Management uses this non-GAAP financial measure to understand and compare operating results across accounting periods, for internal budgeting and forecasting purposes, to evaluate financial performance, and in our ongoing operations and for internal planning and forecasting purposes.comparison of our financial results to those of other companies. It is also a significant performance measure in certain of our executive incentive compensation programs.
| | | | | | | | | | | | | | | | | | | | | | | |
| Three Months Ended | | Nine Months Ended |
| September 30, | | September 30, |
| 2022 | | 2021 | | 2022 | | 2021 |
| Adjusted EBITDA | $ | 89,740 | | | $ | 84,468 | | | $ | 273,877 | | | $ | 236,778 | |
| Adjusted Net Income | 61,825 | | | 56,289 | | | 215,189 | | | 194,971 | |
Adjusted EBITDA. We define Adjusted EBITDAOI w/SBC is defined as netoperating income (loss) adjusted for interestthe following: amortization of purchased intangibles, expense net, provision (benefit)(income) relating to deferred compensation plan liabilities, acquisition expenses, and realignment expenses (income), for the respective periods.
Adjusted operating income
Adjusted operating income taxes, depreciation andis a non-GAAP financial measure that we believe is useful to investors in making comparisons to other companies, although this measure may not be directly comparable to similar measures used by other companies.
Adjusted operating income is defined as operating income adjusted for the following: amortization stock‑based compensation,of purchased intangibles, expense (income) relating to deferred compensation plan liabilities, acquisition expenses, realignment expenses (income), other non‑operating (income) expense, net, and (income) loss from investment accounted for using the equity method, net of tax.
Adjusted Net Income. We define Adjusted Net Income as net income (loss) adjusted for the following: amortization of purchased intangibles and developed technologies, stock‑based compensation expense, (income) relating to deferred compensation plan liabilities, acquisition expenses, realignment expenses (income), other non‑operating (income) expense, net,for the tax effect of the above adjustments to net income (loss), and (income) loss from investment accounted for using the equity method, net of tax. The income tax effect of non‑GAAP adjustments was determined using the applicable rates in the taxing jurisdictions in which income or expense occurred, and represent both current and deferred income tax expense or benefit based on the nature of the non‑GAAP adjustments, including the tax effects of non‑cash stock‑based compensation expense.respective periods.
Adjusted EBITDA and Adjusted Net Income are not presentations made in accordance with U.S. GAAP, and our use of the terms Adjusted EBITDA and Adjusted Net Income may vary from the use of similarly titled measures by others in our industry due to the potential inconsistencies in the method of calculation and differences due to items subject to interpretation. We believe the presentation of Adjusted EBITDA and Adjusted Net Income provides useful information to management and investors regarding financial and business trends related to our results of operations and that when non‑GAAP financial information is viewed with U.S. GAAP financial information, investors are provided with a more meaningful understanding of our ongoing operating performance. We also use Adjusted EBITDA and Adjusted Net Income to compare our results to those of our competitors and to consistently measure our performance from period to period. During the second quarter of 2022, we modified our definitions of Adjusted EBITDA and Adjusted Net Income to adjust for realignment expenses (income) relating to our Russian market exit costs as described further below. Amounts for all periods herein reflect application of the aforementioned definitions modification.
Adjusted EBITDA and Adjusted Net Income should not be considered as alternatives to net income (loss), operating income, or any other performance measures derived in accordance with U.S. GAAP as measures of operating performance. Adjusted EBITDA and Adjusted Net Income have important limitations as analytical tools and should not be considered in isolation or as a substitute for analysis of our results as reported under U.S. GAAP.
Reconciliation of net income (loss) to Adjusted EBITDA:
| | | | | | | | | | | | | | | | | | | | | | | |
| Three Months Ended | | Nine Months Ended |
| September 30, | | September 30, |
| 2022 | | 2021 | | 2022 | | 2021 |
| Net income (loss) | $ | 36,997 | | | $ | (48,022) | | | $ | 149,058 | | | $ | 54,611 | |
| Interest expense, net | 8,382 | | | 3,836 | | | 23,046 | | | 8,608 | |
| Provision (benefit) for income taxes | 9,664 | | | 5,025 | | | 8,221 | | | (5,090) | |
| Depreciation and amortization | 17,914 | | | 16,666 | | | 53,644 | | | 35,946 | |
Stock-based compensation (2) | 18,626 | | | 11,588 | | | 50,974 | | | 32,186 | |
Deferred compensation plan (3) | (4,576) | | | 88,965 | | | (21,873) | | | 89,327 | |
Acquisition expenses (4) | 3,203 | | | 4,789 | | | 21,056 | | | 27,999 | |
Realignment (income) expenses (5) | (971) | | | — | | | 2,223 | | | — | |
Other (income) expense, net (6) | (180) | | | 957 | | | (14,318) | | | (9,748) | |
| Loss from investment accounted for using the equity method, net of tax | 681 | | | 664 | | | 1,846 | | | 2,939 | |
| Adjusted EBITDA | $ | 89,740 | | | $ | 84,468 | | | $ | 273,877 | | | $ | 236,778 | |
Reconciliation of netoperating income (loss) to Adjusted Net Income:OI w/SBC and to Adjusted operating income:
| | | | | | | | | | | | | | | | | | | | | | | |
| Three Months Ended | | Nine Months Ended |
| September 30, | | September 30, |
| 2022 | | 2021 | | 2022 | | 2021 |
| Net income (loss) | $ | 36,997 | | | $ | (48,022) | | | $ | 149,058 | | | $ | 54,611 | |
| Non-GAAP adjustments, prior to income taxes: | | | | | | | |
Amortization of purchased intangibles and developed technologies (1) | 13,575 | | | 11,539 | | | 40,174 | | | 22,003 | |
Stock-based compensation (2) | 18,626 | | | 11,588 | | | 50,974 | | | 32,186 | |
Deferred compensation plan (3) | (4,576) | | | 88,965 | | | (21,873) | | | 89,327 | |
Acquisition expenses (4) | 3,203 | | | 4,789 | | | 21,056 | | | 27,999 | |
Realignment (income) expenses (5) | (971) | | | — | | | 2,223 | | | — | |
Other (income) expense, net (6) | (180) | | | 957 | | | (14,318) | | | (9,748) | |
| Total non-GAAP adjustments, prior to income taxes | 29,677 | | | 117,838 | | | 78,236 | | | 161,767 | |
| Income tax effect of non-GAAP adjustments | (5,530) | | | (14,191) | | | (13,951) | | | (24,346) | |
| Loss from investment accounted for using the equity method, net of tax | 681 | | | 664 | | | 1,846 | | | 2,939 | |
| Adjusted Net Income | $ | 61,825 | | | $ | 56,289 | | | $ | 215,189 | | | $ | 194,971 | |
| | | | | | | | | | | | | | | | | | | | | | | |
| Three Months Ended | | Nine Months Ended |
| September 30, | | September 30, |
| 2023 | | 2022 | | 2023 | | 2022 |
| Operating income | $ | 73,679 | | | $ | 55,544 | | | $ | 192,769 | | | $ | 167,853 | |
Amortization of purchased intangibles (1) | 12,678 | | | 13,575 | | | 39,038 | | | 40,174 | |
Deferred compensation plan (2) | (3,160) | | | (4,576) | | | 4,763 | | | (21,873) | |
Acquisition expenses (3) | 2,980 | | | 3,203 | | | 15,278 | | | 21,056 | |
Realignment expenses (income) (4) | 150 | | | (971) | | | (1,800) | | | 2,223 | |
| Adjusted OI w/SBC | 86,327 | | | 66,775 | | | 250,048 | | | 209,433 | |
Stock-based compensation expense (5) | 18,039 | | | 18,626 | | | 54,907 | | | 50,974 | |
| Adjusted operating income | $ | 104,366 | | | $ | 85,401 | | | $ | 304,955 | | | $ | 260,407 | |
Further explanation of certain of our adjustments in arriving at Adjusted EBITDAOI w/SBC and Adjusted Net Incomeoperating income are as follows:
(1)Amortization of purchased intangibles and developed technologies. Amortization of purchased intangibles varies in amount and frequency and is significantly impacted by the timing and size of our acquisitions. Management finds it useful to exclude these non‑cash charges from our operating expenses to assist in budgeting, planning, and forecasting future periods. The use of intangible assets and developed technologies contributed to our revenues earned during the periods presented and will also contribute to our revenues in future periods. Amortization of purchased intangible assets and developed technologies will recur in future periods.
(2)Stock‑based compensation. We exclude certain stock‑based compensation expenses from our non‑GAAP measures primarily because they are non‑cash expenses and management finds it useful to exclude certain non‑cash charges to assess the appropriate level of various operating expenses to assist in budgeting, planning, and forecasting future periods. Moreover, because of the variety of award types and subjective assumptions that companies can use under Financial Accounting Standards Board Accounting Standards Codification Topic 718, Compensation—Stock Compensation, we believe excluding stock‑based compensation expenses allows investors to make meaningful comparisons between our recurring core business results of operations and those of other companies.
(3)(2)Deferred compensation plan. In August 2021, our board of directors approved an amendment to the amended and restated Bentley Systems, Incorporated Nonqualified Deferred Compensation Plan (the “DCP”), which offered to certain active executives in the DCP a one‑time, short‑term election to reallocate a limited portion of their DCP holdings from phantom shares of the Company’s Class B Common Stock into other phantom investment funds. The offer to reallocate was subject to a proration mechanism which adjusted the aggregate elections to a maximum of 1,500,000 phantom shares of the Company’s Class B Common Stock. This one‑time reallocation opportunity was offered only to certain active executives (but not to Directors or Bentley family members) in order to encourage retention, as otherwise these executives could only have materially diversified their investments in Company equity (primarily held in the DCP) by voluntarily terminating employment to trigger DCP distributions. These executives in aggregate accordingly diversified 24% of their phantom shares of the Company’s Class B Common Stock. While DCP participants’ investments in phantom shares remain equity classified, as they will be settled in shares of Class B Common Stock upon eventual distribution, the amendment and elections resulted in a change to liability classification for the reallocated phantom investments, as they will be settled in cash upon eventual distribution. As a result, during the three and nine months ended September 30, 2021, we recognized a one‑time compensation charge of $90,721 to Deferred compensation plan expenses in the consolidated statements of operations to record the reallocated deferred compensation plan liabilities at their fair value. Deferred compensation plan liabilities are marked to market at the end of each reporting period, with changes in the liabilities recorded as an expense (income) to Deferred compensation plan in the consolidated statements of operations. We exclude Deferred compensation plan expense (income) when we evaluate our continuing operational performance because it is not reflective of our ongoing business and results of operation. We believe it is useful for investors to understand the effects of this item on our total operating expenses. Deferred compensation plan liabilities are marked to market at the end of each reporting period, with changes in the liabilities recorded as an expense (income) to Deferred compensation plan in the consolidated statements of operations.
(4)(3)Acquisition expenses. We incur expenses for professional services rendered in connection with business combinations, which are included in our U.S. GAAP presentation of general and administrative expense (See Note 4 to our consolidated financial statements included in Part I, Item 1 of this Quarterly Report on Form 10‑Q). Also included in our acquisition expenses are retention incentives paid to executives of the acquired companies. For the three and nine months ended September 30, 2022, $350 and $10,149, respectively, of our acquisition expenses related to our platform acquisition of Power Line Systems. For the three and nine months ended September 30, 2021, $389 and $16,285, respectively, of our acquisition expenses related to our platform acquisition of Seequent. We exclude these acquisition expenses when we evaluate our continuing operational performance as we would not have otherwise incurred these expenses in the periods presented as part of our continuing operations. For the three and nine months ended September 30, 2022, $350 and $10,149, respectively, of our acquisition expenses related to our platform acquisition of PLS.
(5)(4)Realignment expenses (income) expenses. During the second quarter of 2022, the marked shifts in the Russian business environment and economic outlook led us to conclude it was no longer viable for us to continue operations in Russia. Accordingly, we made the decision to wind down business and exit the Russian market. As a result, we incurred exit costs, which were comprised of termination benefits for colleagues whose positions were eliminated and asset impairments (“Russian market exit costs”). We exclude these charges and subsequent adjustments to our estimates when we evaluate our continuing operational performance because they are not reflective of our ongoing business and results of operations. We believe it is useful for investors to understand the effects of these items on our total operating expenses. In the ordinary course of operating our business, we incur severance expenses that are not included in this adjustment.
(6)Other (income) expense, net. The table below contains the details of Other (income) expense, net. We exclude these items because they are not reflective of our ongoing business and results of operations. We believe it is useful for investors to understand the effects of these items on our results of operations.
| | | | | | | | | | | | | | | | | | | | | | | |
| Three Months Ended | | Nine Months Ended |
| September 30, | | September 30, |
| 2022 | | 2021 | | 2022 | | 2021 |
| (Gain) loss from: | | | | | | | |
| Change in fair value of interest rate swap | $ | (9,828) | | | $ | (1,463) | | | $ | (29,318) | | | $ | (9,198) | |
Foreign exchange (a) | 11,027 | | | 2,446 | | | 18,815 | | | 248 | |
| Sale of aircraft | — | | | — | | | (2,029) | | | — | |
| | | | | | | |
| Change in fair value of acquisition contingent consideration | (506) | | | — | | | (6) | | | — | |
| Other income, net | (873) | | | (26) | | | (1,780) | | | (798) | |
| Total other (income) expense, net | $ | (180) | | | $ | 957 | | | $ | (14,318) | | | $ | (9,748) | |
(a)Foreign exchange loss is primarily attributable to foreign currency translation derived mainly from United States (“U.S.”) Dollar denominated cash and cash equivalents, account receivables, customer deposits, and intercompany balances held by foreign subsidiaries. Intercompany finance transactions denominated in U.S. Dollars resulted in unrealized foreign exchange losses of $5,730 and $2,741 for the three months ended September 30, 2022 and 2021, respectively, and $12,293 and $1,298 for the nine months ended September 30, 2022 and 2021, respectively.
Key Factors Impacting Comparability and Performance:
Acquisitions. Since our founding, we have purposefully pursued a strategy of regularly acquiring and integrating specialized infrastructure engineering software businesses. As a public company, we have been able to make platform acquisitions which appreciably increase our scale and/or the scope of our platform capabilities. Our relatively numerous and frequent programmatic acquisitions, which most often “fill white space” within our ecosystem and add their particular value principally by virtue of our existing platform comprehensiveness, and accordingly we consider this programmatic aspect of our growth as characteristically within our mainstream business performance (unlike platform acquisitions).
We completed four and 12 acquisitions for the nine months ended September 30, 2022 and 2021, respectively. Our three and nine months ended September 30, 2022 consolidated financial statements were meaningfully impacted by our platform acquisition of Power Line Systems, which was completed on January 31, 2022 for $695,968 in cash, net of cash acquired. Our three and nine months ended September 30, 2022 and 2021 consolidated financial statements were meaningfully impacted by our platform acquisition of Seequent, which was completed on June 17, 2021 for $883,336 in cash, net of cash acquired, plus 3,141,342 shares of our Class B Common Stock. For the three and nine months ended September 30, 2022, $350Realignment expenses (income) were comprised of asset impairments and $10,149, respectively,termination benefits as a result of our acquisition expenses relateddecision to wind down business and exit the acquisitionRussian market beginning in the second quarter of Power Line Systems.2022. For the three and nine months ended September 30, 2021, $389 and $16,285, respectively,2023, Realignment expenses (income) primarily relates to the continued wind down of our acquisition expenses related to the acquisition of Seequent.Russian entities.
DCP Amendment(5)Stock‑based compensation expense. In August 2021, our board of directors approved an amendment to the DCP, which offered toWe exclude non-cash stock‑based compensation expenses from certain active executives in the DCP a one‑time, short‑term election to reallocate a limited portion of their DCP holdings from phantom shares of our Class B Common Stock into other phantom investment funds. The offer to reallocate was subject to a proration mechanism which adjusted the aggregate elections to a maximum of 1,500,000 phantom shares of the Company’s Class B Common Stock. This one‑time reallocation opportunity was offered only to certain active executives (but not to Directors or Bentley family members) in order to encourage retention, as otherwise these executives could only have materially diversified their investments in Company equity (primarily held in the DCP) by voluntarily terminating employment to trigger DCP distributions. These executives in aggregate accordingly diversified 24% of their phantom shares of the Company’s Class B Common Stock. While DCP participants’ investments in phantom shares remain equity classified, as they will be settled in shares of Class B Common Stock upon eventual distribution, the amendment and elections resulted in a change to liability classification for the reallocated phantom investments, as they will be settled in cash upon eventual distribution. As a result, during the three and nine months ended September 30, 2021, we recognized a one‑time compensation charge of $90,721 to Deferred compensation plan expenses in the consolidated statements of operations to record the reallocated deferred compensation plan liabilities at their fair value. Subsequent to the one‑time reallocation, these diversified deferred compensation plan liabilities are marked to market at the end of each reporting period, with changes in the liabilities recorded as an expense (income) to Deferred compensation plan in the consolidated statements of operations.
BSY Stock Repurchase Program. On May 11, 2022, we announced that our board of directors approved the BSY Stock Repurchase Program (the “Repurchase Program”) authorizing us to repurchase up to $200,000 of our Class B Common Stock through June 30, 2024. The Repurchase Program is used to offset dilution from the issuance of our Class B Common Stock under our stock‑based plans to enhance stockholder value. For the nine months ended September 30, 2022, we repurchased 896,126 shares for $28,250.
Impact of foreign currency. A portion of our total revenues and operating expenses were derived from outside the U.S. and, as such, were denominated in various foreign currencies, including most significantly: Euros, British Pounds, Australian Dollars, Canadian Dollars, Chinese Yuan Renminbi, and New Zealand Dollars. Our financial results are therefore affected by changes in foreign currency rates. In 2021, 47% of our total revenues were denominated in various foreign currencies. Correspondingly, in 2021, 42% of our total operating expenses were denominated in various foreign currencies. Other than the natural hedge attributable to matching revenues and expenses in the same currencies, we do not currently hedge foreign currency exposure. Accordingly, our results of operations have been, and in the future will be, affected by changes in foreign exchange rates.
We identify the effects of foreign currency on our operations and present constant currency growth rates and fluctuationsnon‑GAAP measures because we believe exchange rates are an important factorthis is useful to investors in understanding period‑over‑periodmaking comparisons and enhance the understanding of our results and evaluation of our performance. In reporting period-over-period results, we calculate the effects of foreign currency fluctuations and constant currency information by translating current period results using prior period average foreign currency exchange rates. Our definition of constant currency may differ fromto other companies reporting similarly named measures, and these constant currency performance measures should be viewed in addition to, and not as a substitute for, our operating performance measures calculated in accordance with U.S. GAAP.companies.
Results of Operations:Constant currency
Our selected consolidated statementsConstant currency and constant currency growth rates are non-GAAP financial measures that present our results of operations data for eachexcluding the estimated effects of foreign currency exchange rate fluctuations. We have operations outside the U.S. that are conducted in local currencies. As a result, the comparability of the periods indicated are as follows:
| | | | | | | | | | | | | | | | | | | | | | | | | | |
| | Three Months Ended | | Nine Months Ended |
| | September 30, | | September 30, |
| | 2022 | | 2021 | | 2022 | | 2021 |
| Revenues: | | | | | | | | |
| Subscriptions | | $ | 235,307 | | | $ | 215,135 | | | $ | 708,731 | | | $ | 589,702 | |
| Perpetual licenses | | 9,460 | | | 11,866 | | | 31,213 | | | 33,373 | |
| Subscriptions and licenses | | 244,767 | | | 227,001 | | | 739,944 | | | 623,075 | |
| Services | | 23,565 | | | 24,387 | | | 72,190 | | | 74,239 | |
| Total revenues | | 268,332 | | | 251,388 | | | 812,134 | | | 697,314 | |
| Cost of revenues: | | | | | | | | |
| Cost of subscriptions and licenses | | 37,371 | | | 31,056 | | | 107,904 | | | 89,882 | |
| Cost of services | | 21,812 | | | 23,176 | | | 66,758 | | | 67,090 | |
| Total cost of revenues | | 59,183 | | | 54,232 | | | 174,662 | | | 156,972 | |
| Gross profit | | 209,149 | | | 197,156 | | | 637,472 | | | 540,342 | |
| Operating expense (income): | | | | | | | | |
| Research and development | | 63,827 | | | 57,334 | | | 189,966 | | | 157,913 | |
| Selling and marketing | | 46,114 | | | 44,392 | | | 141,676 | | | 114,846 | |
| General and administrative | | 37,794 | | | 35,329 | | | 128,981 | | | 110,233 | |
| Deferred compensation plan | | (4,576) | | | 88,965 | | | (21,873) | | | 89,327 | |
| Amortization of purchased intangibles | | 10,446 | | | 8,676 | | | 30,869 | | | 16,703 | |
| Total operating expenses | | 153,605 | | | 234,696 | | | 469,619 | | | 489,022 | |
| Income (loss) from operations | | 55,544 | | | (37,540) | | | 167,853 | | | 51,320 | |
| Interest expense, net | | (8,382) | | | (3,836) | | | (23,046) | | | (8,608) | |
| Other income (expense), net | | 180 | | | (957) | | | 14,318 | | | 9,748 | |
| Income (loss) before income taxes | | 47,342 | | | (42,333) | | | 159,125 | | | 52,460 | |
| (Provision) benefit for income taxes | | (9,664) | | | (5,025) | | | (8,221) | | | 5,090 | |
| Loss from investment accounted for using the equity method, net of tax | | (681) | | | (664) | | | (1,846) | | | (2,939) | |
| Net income (loss) | | 36,997 | | | (48,022) | | | 149,058 | | | 54,611 | |
| Less: Net income (loss) attributable to participating securities | | (11) | | | (3) | | | (31) | | | (6) | |
| Net income (loss) attributable to Class A and Class B common stockholders | | $ | 36,986 | | | $ | (48,025) | | | $ | 149,027 | | | $ | 54,605 | |
| Per share information: | | | | | | | | |
| Net income (loss) per share, basic | | $ | 0.12 | | | $ | (0.16) | | | $ | 0.48 | | | $ | 0.18 | |
| Net income (loss) per share, diluted | | $ | 0.12 | | | $ | (0.16) | | | $ | 0.46 | | | $ | 0.17 | |
| Weighted average shares, basic | | 310,116,104 | | | 308,195,379 | | | 308,959,801 | | | 305,119,985 | |
| Weighted average shares, diluted | | 325,170,383 | | | 308,195,379 | | | 332,077,834 | | | 314,658,136 | |
| | | | | | | | |
financial results reported in U.S. dollars is affected by changes in foreign currency exchange rates. We use constant currency and constant currency growth rates to evaluate the underlying performance of the business, and we believe it is helpful for investors to present operating results on a comparable basis period over period to evaluate its underlying performance.In reporting period‑over‑period results, we calculate the effects of foreign currency fluctuations and constant currency information by translating current period results using prior period average foreign currency exchange rates. Our definition of constant currency may differ from other companies reporting similarly named measures, and these constant currency performance measures should be viewed in addition to, and not as a substitute for, our operating performance measures calculated in accordance with U.S. GAAP.
Comparison of the Three and Nine Months Ended September 30, 2022 and 2021
Revenues
| | | | | | | | | | | | | | | | | | | | | | | | | | | | | |
| | | | | Comparison |
| Three Months Ended | | | | | | Constant |
| September 30, | | | | | | Currency |
| 2022 | | 2021 | | Amount | | % | | % |
| Subscriptions | $ | 235,307 | | | $ | 215,135 | | | $ | 20,172 | | | 9.4 | % | | 17.6 | % |
| Perpetual licenses | 9,460 | | | 11,866 | | | (2,406) | | | (20.3 | %) | | (12.6 | %) |
| Subscriptions and licenses | 244,767 | | | 227,001 | | | 17,766 | | | 7.8 | % | | 16.0 | % |
| Services | 23,565 | | | 24,387 | | | (822) | | | (3.4 | %) | | 1.9 | % |
| Total revenues | $ | 268,332 | | | $ | 251,388 | | | $ | 16,944 | | | 6.7 | % | | 14.7 | % |
| | | | | | | | | | | | | | | | | | | | | | | | | | | | | |
| | | | | Comparison |
| Nine Months Ended | | | | | | Constant |
| September 30, | | | | | | Currency |
| 2022 | | 2021 | | Amount | | % | | % |
| Subscriptions | $ | 708,731 | | | $ | 589,702 | | | $ | 119,029 | | | 20.2 | % | | 26.6 | % |
| Perpetual licenses | 31,213 | | | 33,373 | | | (2,160) | | | (6.5 | %) | | 0.4 | % |
| Subscriptions and licenses | 739,944 | | | 623,075 | | | 116,869 | | | 18.8 | % | | 25.2 | % |
| Services | 72,190 | | | 74,239 | | | (2,049) | | | (2.8 | %) | | 0.8 | % |
| Total revenues | $ | 812,134 | | | $ | 697,314 | | | $ | 114,820 | | | 16.5 | % | | 22.6 | % |
The increase in total revenues for the three and nine months ended September 30, 2022 was primarily driven by improvements in our business performance and the impact from our platform acquisitions in subscriptions revenues, partially offset by the overall negative foreign currency effects due to a stronger U.S. Dollar relative to our other currencies. We define business performance as our organic growth results inclusive of the impact from certain programmatic acquisitions, which generally are immaterial, individually and in the aggregate.
•Subscriptions. For the three months ended September 30, 2022, the increase in subscriptions revenues was primarily driven by improvements in our business performance, on a constant currency basis, of approximately $27,500 and the impact from our platform acquisition of approximately $10,400.
For the nine months ended September 30, 2022, the increase in subscriptions revenues was primarily driven by the impact from our platform acquisitions of approximately $84,900 and improvements in our business performance, on a constant currency basis, of approximately $69,000.
For the three months ended September 30, 2022, the acquisition impact relates to our platform acquisition of Power Line Systems and is inclusive of its organic performance. For the nine months ended September 30, 2022, the acquisition impact relates to our platform acquisitions of Seequent and Power Line Systems and is inclusive of their respective organic performance.
The improvements in business performance, on a constant currency basis, were primarily driven by expansion within our existing accounts, and growth of 3% attributable to new accounts exclusive of platform acquisitions, most notability smaller- and medium-sized accounts. Improvements in business performance for the three months ended September 30, 2022 were led by our engineering applications. Improvements in business performance for the nine months ended September 30, 2022 were led by our structural and civil engineering applications and our Enterprise Systems for project delivery.
•Perpetual licenses. For the three months ended September 30, 2022, the decrease in perpetual licenses revenues was primarily driven by a reduction in business performance, due to continued efforts to migrating users to subscription offerings.
For the nine months ended September 30, 2022, perpetual licenses revenues were impacted by our Seequent platform acquisition by approximately $1,800, partially offset by a reduction in business performance, on a constant currency basis, of approximately $1,700.
•Services. For the nine months ended September 30, 2022, services revenues were impacted by our Seequent and Power Line Systems platform acquisitions by approximately $1,200, partially offset by a reduction in business performance, on a constant currency basis, of approximately $700.
For the nine months ended September 30, 2022, the reduction in business performance, on a constant currency basis, was impacted by the ongoing transition of historically classified services revenues into subscriptions revenues for accounts converting to our E365 subscription offering with embedded Success Services, partially offset by favorable contributions from Cohesive digital integrator services of approximately $6,300.
Revenues by Geographic Region
Revenue from external customers is attributed to individual countries based upon the location of the customer. Revenues by geographic region are as follows:
| | | | | | | | | | | | | | | | | | | | | | | | | | | | | |
| | | | | Comparison |
| Three Months Ended | | | | | | Constant |
| September 30, | | | | | | Currency |
| 2022 | | 2021 | | Amount | | % | | % |
| Americas | $ | 141,599 | | | $ | 127,996 | | | $ | 13,603 | | | 10.6 | % | | 12.2 | % |
| Europe, the Middle East, and Africa (“EMEA”) | 75,416 | | | 76,502 | | | (1,086) | | | (1.4 | %) | | 13.9 | % |
| Asia-Pacific (“APAC”) | 51,317 | | | 46,890 | | | 4,427 | | | 9.4 | % | | 22.8 | % |
| Total revenues | $ | 268,332 | | | $ | 251,388 | | | $ | 16,944 | | | 6.7 | % | | 14.7 | % |
| | | | | | | | | | | | | | | | | | | | | | | | | | | | | |
| | | | | Comparison |
| Nine Months Ended | | | | | | Constant |
| September 30, | | | | | | Currency |
| 2022 | | 2021 | | Amount | | % | | % |
| Americas | $ | 440,218 | | | $ | 349,752 | | | $ | 90,466 | | | 25.9 | % | | 27.0 | % |
| EMEA | 227,696 | | | 219,507 | | | 8,189 | | | 3.7 | % | | 15.2 | % |
| APAC | 144,220 | | | 128,055 | | | 16,165 | | | 12.6 | % | | 22.9 | % |
| Total revenues | $ | 812,134 | | | $ | 697,314 | | | $ | 114,820 | | | 16.5 | % | | 22.6 | % |
•Americas. For the three months ended September 30, 2022, the increase in revenues from the Americas was primarily driven by improvements in our business performance, on a constant currency basis, of approximately $8,600 and an increase in subscriptions revenues from our Power Line Systems platform acquisition of approximately $6,800.
For the nine months ended September 30, 2022, the increase in revenues from the Americas was primarily driven by an increase in subscriptions revenues from our Seequent and Power Line Systems platform acquisitions of approximately $53,600 and improvements in our business performance, on a constant currency basis, of approximately $38,900.
The improvements in business performance, on a constant currency basis, for the three and nine months ended September 30, 2022 were primarily due to expansion of our subscriptions revenues from existing accounts in the U.S.
•EMEA. For the three months ended September 30, 2022, EMEA revenues were impacted by improvements in our business performance, on a constant currency basis, of approximately $8,000.
The improvements in business performance, on a constant currency basis, for the three months ended September 30, 2022 were primarily due to expansion of our subscriptions revenues from existing accounts in Central Europe, the Middle East, and Africa, partially offset by reductions in Russia.
For the nine months ended September 30, 2022, the increase in revenues from EMEA was primarily driven by an increase in subscriptions revenues from our Seequent and Power Line Systems platform acquisitions of approximately $16,900 and improvements in our business performance, on a constant currency basis, of approximately $14,900.
The improvements in business performance, on a constant currency basis, for the nine months ended September 30, 2022 were primarily due to expansion of our subscriptions revenues from existing accounts in Central Europe, the United Kingdom, the Middle East, and Africa, partially offset by reductions in Russia.
•APAC. For the three months ended September 30, 2022, the increase in revenues from APAC was primarily driven by improvements in our business performance, on a constant currency basis, of approximately $9,600.
For the nine months ended September 30, 2022, the increase in revenues from APAC was primarily driven by an increase in subscriptions revenues from our Seequent and Power Line Systems platform acquisitions of approximately $14,500 and improvements in our business performance, on a constant currency basis, of approximately $12,900.
The improvements in business performance, on a constant currency basis, for the three and nine months ended September 30, 2022 were primarily due to expansion of our subscriptions revenues from existing accounts in India, and Southeast Asia, partially offset by reductions in China.
Cost of Revenues
| | | | | | | | | | | | | | | | | | | | | | | | | | | | | |
| | | | | Comparison |
| Three Months Ended | | | | | | Constant |
| September 30, | | | | | | Currency |
| 2022 | | 2021 | | Amount | | % | | % |
| Cost of subscriptions and licenses | $ | 37,371 | | | $ | 31,056 | | | $ | 6,315 | | | 20.3 | % | | 27.9 | % |
| Cost of services | 21,812 | | | 23,176 | | | (1,364) | | | (5.9 | %) | | 1.2 | % |
| Total cost of revenues | $ | 59,183 | | | $ | 54,232 | | | $ | 4,951 | | | 9.1 | % | | 16.5 | % |
| | | | | | | | | | | | | | | | | | | | | | | | | | | | | |
| | | | | Comparison |
| Nine Months Ended | | | | | | Constant |
| September 30, | | | | | | Currency |
| 2022 | | 2021 | | Amount | | % | | % |
| Cost of subscriptions and licenses | $ | 107,904 | | | $ | 89,882 | | | $ | 18,022 | | | 20.1 | % | | 25.7 | % |
| Cost of services | 66,758 | | | 67,090 | | | (332) | | | (0.5 | %) | | 4.4 | % |
| Total cost of revenues | $ | 174,662 | | | $ | 156,972 | | | $ | 17,690 | | | 11.3 | % | | 16.6 | % |
Cost of subscriptions and licenses. For the three months ended September 30, 2022, on a constant currency basis, cost of subscriptions and licenses increased primarily due to an increase in headcount‑related costs of approximately $3,300, mainly due to annual salary adjustments and additional headcount, an increase in cloud‑related costs of approximately $2,200, and an increase in channel partner compensation and royalties of approximately $2,000.
For the nine months ended September 30, 2022, on a constant currency basis, cost of subscriptions and licenses increased primarily due to an increase in headcount‑related costs of approximately $10,300, mainly due to our platform acquisition of Seequent and annual salary adjustments, an increase in amortization expense for software and technology of approximately $4,500, and an increase in cloud‑related costs of approximately $3,900.
Cost of services. For the nine months ended September 30, 2022, on a constant currency basis, cost of services increased primarily due to an increase in headcount‑related costs of approximately $3,900, mainly due to digital integrator business acquisitions and annual salary adjustments, partially offset by a decrease in facilities costs of approximately $700.
Operating Expense (Income)
| | | | | | | | | | | | | | | | | | | | | | | | | | | | | |
| | | | | Comparison |
| Three Months Ended | | | | | | Constant |
| September 30, | | | | | | Currency |
| 2022 | | 2021 | | Amount | | % | | % |
| Research and development | $ | 63,827 | | | $ | 57,334 | | | $ | 6,493 | | | 11.3 | % | | 18.0 | % |
| Selling and marketing | 46,114 | | | 44,392 | | | 1,722 | | | 3.9 | % | | 11.0 | % |
| General and administrative | 37,794 | | | 35,329 | | | 2,465 | | | 7.0 | % | | 11.9 | % |
| Deferred compensation plan | (4,576) | | | 88,965 | | | (93,541) | | | * | | * |
| Amortization of purchased intangibles | 10,446 | | | 8,676 | | | 1,770 | | | 20.4 | % | | 24.9 | % |
| Total operating expenses | $ | 153,605 | | | $ | 234,696 | | | $ | (81,091) | | | (34.6 | %) | | (30.7 | %) |
*Not meaningful
| | | | | | | | | | | | | | | | | | | | | | | | | | | | | |
| | | | | Comparison |
| Nine Months Ended | | | | | | Constant |
| September 30, | | | | | | Currency |
| 2022 | | 2021 | | Amount | | % | | % |
| Research and development | $ | 189,966 | | | $ | 157,913 | | | $ | 32,053 | | | 20.3 | % | | 25.5 | % |
| Selling and marketing | 141,676 | | | 114,846 | | | 26,830 | | | 23.4 | % | | 28.9 | % |
| General and administrative | 128,981 | | | 110,233 | | | 18,748 | | | 17.0 | % | | 20.1 | % |
| Deferred compensation plan | (21,873) | | | 89,327 | | | (111,200) | | | * | | * |
| Amortization of purchased intangibles | 30,869 | | | 16,703 | | | 14,166 | | | 84.8 | % | | 92.9 | % |
| Total operating expenses | $ | 469,619 | | | $ | 489,022 | | | $ | (19,403) | | | (4.0 | %) | | 0.0 | % |
*Not meaningful
Research and development. For the three months ended September 30, 2022, on a constant currency basis, research and development expenses increased primarily due to an increase in headcount-related costs of approximately $9,000. The increase in headcount-related costs was primarily comprised of approximately $6,500 of increases in salaries, mainly due to annual salary adjustments and additional headcount, and variable compensation costs.
For the nine months ended September 30, 2022, on a constant currency basis, research and development expenses increased primarily due to an increase in headcount-related costs of approximately $35,200. The increase in headcount-related costs was primarily comprised of approximately $29,600 of increases in salaries, mainly due to our platform acquisition of Seequent, annual salary adjustments, and variable compensation costs, as well as an increase in stock-based compensation expense of approximately $4,100.
Selling and marketing. For the three months ended September 30, 2022, on a constant currency basis, selling and marketing expenses increased primarily due to an increase in headcount-related costs of approximately $4,100. The increase in headcount-related costs was primarily comprised of approximately $2,400 of increases in salaries, mainly due to annual salary adjustments, and variable compensation costs, an increase in travel-related costs of approximately $1,100, and increase in stock-based compensation expense of approximately $600.
For the nine months ended September 30, 2022, on a constant currency basis, selling and marketing expenses increased primarily due to an increase in headcount-related costs of approximately $27,300 and an increase in promotional costs of approximately $3,500. The increase in headcount-related costs was primarily comprised of approximately $21,400 of increases in salaries, mainly due to our platform acquisition of Seequent and annual salary adjustments, and variable compensation costs, an increase in travel-related costs of approximately $3,800, and an increase in stock-based compensation expense of approximately $2,100.
General and administrative. For the three months ended September 30, 2022, on a constant currency basis, general and administrative expenses increased primarily due to an increase in headcount-related costs of approximately $7,700. The increase in headcount-related costs was primarily comprised of an increase in stock‑based compensation expense of approximately $4,700 and an increase in salaries costs of approximately $3,300, mainly due to annual salary adjustments. Partially offsetting this increase were a decrease in facilities costs of approximately $1,700 and lower acquisition expenses of approximately $1,400.
For the nine months ended September 30, 2022, on a constant currency basis, general and administrative expenses increased primarily due to an increase in headcount-related costs of approximately $26,400. The increase in headcount-related costs was primarily comprised of an increase in salaries costs of approximately $12,700, mainly due to our platform acquisition of Seequent and annual salary adjustments, and an increase in stock‑based compensation expense of approximately $11,800. Partially offsetting these increases were lower acquisition expenses of approximately $7,200, primarily due to expenses of $10,149 related to the acquisition of Power Line Systems for the nine months ended September 30, 2022 as compared to expenses of $16,285 related to the acquisition of Seequent for the nine months ended September 30, 2021.
Deferred compensation plan. For the three and nine months ended September 30, 2022, deferred compensation plan income was $4,576 and $21,873, respectively. These amounts were attributable to the marked to market impact on deferred compensation plan liability balances period-over-period. For the three and nine months ended September 30, 2021, deferred compensation plan expense was $88,965 and $89,327, respectively. These amounts were primarily attributable to a one‑time compensation charge of $90,721 as discussed further below, partially offset by the marked to market impact on deferred compensation plan liability balances period-over-period.
In August 2021, our board of directors approved an amendment to the DCP, which offered to certain active executives in the DCP a one‑time, short‑term election to reallocate a limited portion of their DCP holdings from phantom shares of the Company’s Class B Common Stock into other phantom investment funds. The offer to reallocate was subject to a proration mechanism which adjusted the aggregate elections to a maximum of 1,500,000 phantom shares of the Company’s Class B Common Stock. This one‑time reallocation opportunity was offered only to certain active executives (but not to Directors or Bentley family members) in order to encourage retention, as otherwise these executives could only have materially diversified their investments in Company equity (primarily held in the DCP) by voluntarily terminating employment to trigger DCP distributions. These executives in aggregate accordingly diversified 24% of their phantom shares of the Company’s Class B Common Stock. While DCP participants’ investments in phantom shares remain equity classified, as they will be settled in shares of Class B Common Stock upon eventual distribution, the amendment and elections resulted in a change to liability classification for the reallocated phantom investments, as they will be settled in cash upon eventual distribution. As a result, during the three and nine months ended September 30, 2021, we recognized a one‑time compensation charge of $90,721 to Deferred compensation plan expenses in the consolidated statements of operations to record the reallocated deferred compensation plan liabilities at their fair value.
Amortization of purchased intangibles. For the three and nine months ended September 30, 2022, on a constant currency basis, amortization of purchased intangibles increased primarily due to amortization from recently acquired purchased intangibles.
Interest Expense, Net
| | | | | | | | | | | | | | | | | | | | | | | |
| Three Months Ended | | Nine Months Ended |
| September 30, | | September 30, |
| 2022 | | 2021 | | 2022 | | 2021 |
| Interest expense | $ | (8,491) | | | $ | (3,861) | | | $ | (23,319) | | | $ | (8,844) | |
| Interest income | 109 | | | 25 | | | 273 | | | 236 | |
| Interest expense, net | $ | (8,382) | | | $ | (3,836) | | | $ | (23,046) | | | $ | (8,608) | |
| | | | | | | | | | | | | | | | | | | | | | | |
| Three Months Ended | | Nine Months Ended |
| September 30, | | September 30, |
| 2022 | | 2021 | | 2022 | | 2021 |
| Revolving loan facility | $ | (4,441) | | | $ | (911) | | | $ | (10,206) | | | $ | (2,490) | |
| Term loan | (2,119) | | | — | | | (4,577) | | | — | |
| Interest rate swap | 752 | | | (325) | | | 475 | | | (942) | |
| Convertible senior notes, coupon interest | (785) | | | (772) | | | (2,309) | | | (1,155) | |
| Amortization and write-off of deferred debt issuance costs | (1,822) | | | (1,789) | | | (5,468) | | | (4,160) | |
| Other, net | 33 | | | (39) | | | (961) | | | 139 | |
| Interest expense, net | $ | (8,382) | | | $ | (3,836) | | | $ | (23,046) | | | $ | (8,608) | |
For the three and nine months ended September 30, 2022, interest expense, net increased primarily due to a higher outstanding average balance combined with a higher average interest rate under the revolving loan facility, and interest expense on the term loan, which we entered into on December 22, 2021.
Other Income (Expense), Net
| | | | | | | | | | | | | | | | | | | | | | | |
| Three Months Ended | | Nine Months Ended |
| September 30, | | September 30, |
| 2022 | | 2021 | | 2022 | | 2021 |
| Gain (loss) from: | | | | | | | |
| Change in fair value of interest rate swap | $ | 9,828 | | | $ | 1,463 | | | $ | 29,318 | | | $ | 9,198 | |
Foreign exchange (1) | (11,027) | | | (2,446) | | | (18,815) | | | (248) | |
| Sale of aircraft | — | | | — | | | 2,029 | | | — | |
| | | | | | | |
| Change in fair value of acquisition contingent consideration | 506 | | | — | | | 6 | | | — | |
| Other income, net | 873 | | | 26 | | | 1,780 | | | 798 | |
| Total other income (expense), net | $ | 180 | | | $ | (957) | | | $ | 14,318 | | | $ | 9,748 | |
(1)Foreign exchange loss is primarily attributable to foreign currency translation derived mainly from U.S. Dollar denominated cash and cash equivalents, account receivables, customer deposits, and intercompany balances held by foreign subsidiaries. Intercompany finance transactions denominated in U.S. Dollars resulted in unrealized foreign exchange losses of $5,730 and $2,741 for the three months ended September 30, 2022 and 2021, respectively, and $12,293 and $1,298 for the nine months ended September 30, 2022 and 2021, respectively.
Provision (Benefit) for Income Taxes
| | | | | | | | | | | | | | | | | | | | | | | |
| Three Months Ended | | Nine Months Ended |
| September 30, | | September 30, |
| 2022 | | 2021 | | 2022 | | 2021 |
| Income (loss) before income taxes | $ | 47,342 | | | $ | (42,333) | | | $ | 159,125 | | | $ | 52,460 | |
| Provision (benefit) for income taxes | $ | 9,664 | | | $ | 5,025 | | | $ | 8,221 | | | $ | (5,090) | |
| Effective tax rate | 20.4 | % | | (11.9) | % | | 5.2 | % | | (9.7) | % |
For the three months ended September 30, 2022, the effective tax rate was higher as compared to the three months ended September 30, 2021 primarily due to the 2021 tax effect, net of officer compensation limitation provisions, related to the 2021 compensation charge of $90,721 to Deferred compensation plan expenses to record reallocated deferred compensation plan liabilities at fair value. For the three months ended September 30, 2022 and 2021, we also recorded discrete tax benefits of $4,280 and $6,920, respectively, primarily associated with windfall tax benefits from stock‑based compensation, net of the impact from officer compensation limitation provisions.
For the nine months ended September 30, 2022, the effective tax rate was higher as compared to the nine months ended September 30, 2021 primarily due to the 2021 tax effect, net of officer compensation limitation provisions, related to the 2021 compensation charge of $90,721 to Deferred compensation plan expenses to record reallocated deferred compensation plan liabilities at fair value. For the nine months ended September 30, 2022 and 2021, we also recorded discrete tax benefits of $36,032 and $42,825, respectively, primarily associated with windfall tax benefits from stock‑based compensation, net of the impact from officer compensation limitation provisions.
Net Income (Loss)
| | | | | | | | | | | | | | | | | | | | | | | |
| Three Months Ended | | Nine Months Ended |
| September 30, | | September 30, |
| 2022 | | 2021 | | 2022 | | 2021 |
| Net income (loss) | $ | 36,997 | | | $ | (48,022) | | | $ | 149,058 | | | $ | 54,611 | |
For the three months ended September 30, 2022, net income (loss) increased by $85,019, or 177.0%, compared to the three months ended September 30, 2021. For the nine months ended September 30, 2022, net income (loss) increased by $94,447, or 172.9%, compared to the nine months ended September 30, 2021. Net income as a percentage of total revenues was 13.8% and (19.1)% for the three months ended September 30, 2022 and 2021, respectively, and 18.4% and 7.8% for the nine months ended September 30, 2022 and 2021. The changes are due to the factors described above.
Adjusted EBITDA and Adjusted Net Income
| | | | | | | | | | | | | | | | | | | | | | | |
| Three Months Ended | | Nine Months Ended |
| September 30, | | September 30, |
| 2022 | | 2021 | | 2022 | | 2021 |
| Adjusted EBITDA | $ | 89,740 | | | $ | 84,468 | | | $ | 273,877 | | | $ | 236,778 | |
| Adjusted Net Income | $ | 61,825 | | | $ | 56,289 | | | $ | 215,189 | | | $ | 194,971 | |
For the three and nine months ended September 30, 2022, Adjusted EBITDA increased by $5,272 and $37,099 compared to the three and nine months ended September 30, 2021, respectively. For the three months ended September 30, 2022 and 2021, Adjusted EBITDA as a percentage of total revenues was 33.4% and 33.6%, respectively. For the nine months ended September 30, 2022 and 2021, Adjusted EBITDA as a percentage of total revenues was 33.7% and 34.0%, respectively.
For the three and nine months ended September 30, 2022, Adjusted Net Income increased by $5,536 and $20,218 compared to the three and nine months ended September 30, 2021, respectively. For the three months ended September 30, 2022 and 2021, Adjusted Net Income as a percentage of total revenues was 23.0% and 22.4%, respectively. For the nine months ended September 30, 2022 and 2021, Adjusted Net Income as a percentage of total revenues was 26.5% and 28.0%, respectively.
For additional information, including the limitations of using non‑GAAP financial measures, and reconciliations of the non‑GAAP financial measures to the most directly comparable financial measures stated in accordance with U.S. GAAP, see the section titled “—Non‑GAAP Financial Measures.”
Liquidity and Capital Resources:Resources
Our primary source of operating cash is from the sale of subscriptions, perpetual licenses, and services. Our primary use of cash is payment of our operating costs, which consist primarily of colleague-related expenses, such as compensation and benefits, as well as general operating expenses for marketing, facilities, and overheadheadcount‑related costs. In addition to operating expenses, we also use cash to service our debt obligations, to pay quarterly dividends, to repurchase our Class B Common Stock (discussed further below),and convertible debt, and for capital expenditures in support of our operations. We also use cash to fund our acquisitions of software assets and businesses, and other investment activities, of BSY Investments, including our iTwin Ventures forinitiative which over a period of approximately 5 years, we expect to invest up to $100 million of corporate venture capital funding formakes seed, early, and growth stage investments in technology companies with promising and emerging opportunities for infrastructure digital twin solutions strategicallypotentially relevant to our business. In connection with the acquisition of Power Line Systems in January 2022, we used available cash and borrowings under our Credit Facility (described below) to fund the transaction.
On May 11, 2022, we announced that our board of directors approvedWe have the Repurchase Program authorizing us to repurchase up to $200,000 of our Class B Common Stock through June 30, 2024. The Repurchase Program is used to offset dilution from the issuance of our Class B Common Stock under our stock‑based plans to enhance stockholder value. The shares proposed to be acquired in the Repurchase Program may be repurchased from time to time in open market transactions, through privately negotiated transactions, or by other means in accordance with federal securities laws. We intend to fund repurchases from available working capital and cash provided by operating activities. The timing, as well as the number and value of shares repurchased under the Repurchase Program, will be determined at our discretion and will depend on a variety of factors, including management’s assessment of the intrinsic value of our shares, the market price of our Class B Common Stock, general market and economic conditions, available liquidity, compliance with our debt and other agreements, and applicable legal requirements. The exact number of shares to be repurchased by us is not guaranteed, and the Repurchase Program may be suspended, modified, or discontinued at any time without prior notice. For the nine months ended September 30, 2022, we repurchased 896,126 shares for $28,250.
Additionally, during the second quarter of 2022, we exercised our right to require that certain equity awardees receive gross or net quantities of shares of our Class B Common Stock, most meaningfully for the issuance of sharesincluding in connection with share issuances under our Executive Bonus Plan incentive compensation and distributions from the DCP, andDCP. In the case of a gross issuance or distribution, an awardee is required to reimburse promptly reimburse to us the cash required for theirhis or her tax withholding amounts. Historically, these shares were issued onConversely, under a net basis, holding backissuance or distribution, shares are withheld in consideration of remitting withholding taxes on behalf of an equity awardees,awardee, thereby requiring us to remit cash for the tax withholdings.
Our cash and cash equivalent balances are concentrated in a few locations around During the world, with substantial amounts held outside of the U.S. As ofnine months ended September 30, 2022 and December 31, 2021, 94% and 48%, respectively,2023, we allowed impacted equity awardees the option to receive net quantities of shares of our total cash and cash equivalents were located outside of the U.S.Class B Common Stock. During the nine months ended September 30, 2022, we repatriated $150,000permitted impacted awardees to elect to receive net quantities of undistributed previously taxed earnings generated byshares of our foreign subsidiaries to the U.S. The repatriations were used to fund the acquisition of Power Line Systems. We expect to meet our U.S. liquidity needs through ongoing cash flows or external borrowings including available liquidity under the Credit Facility. We regularly review our capital structure and consider a variety of potential financing alternatives and planning strategies to ensure that we have the proper liquidity availableClass B Common Stock in the locations in which it is neededfirst quarter, but exercised our right to require that these awardees receive gross quantities of our Class B Common Stock during the second and third quarters. We will continue to fund our operations and growth investments with cash that has not been permanently reinvested outside the U.S.evaluate whether share awards will be required to be received by awardees on a gross basis, or if net settlement may be elected by awardees.
We believe that existing domestic and international cash and cash equivalent balances, together with cash generated from operations, and liquidity under the Credit Facility, will be sufficient to meet our domestic and international working capital and capital expenditure requirements through the next twelve months. However, our future capital requirements may be materially different than those currently planned in our budgeting and forecasting activities and depend on many factors, including our strategy of regularly acquiring and integrating specialized infrastructure engineering software businesses, our rate of revenue growth, the timing and extent of spending on research and development, the expansion of our sales and marketing activities, the timing of new product introductions, market acceptance of our products, competitive factors, our discretionary payments of dividends or repurchases of our Class B Common Stock and convertible debt, currency fluctuations, and overall economic conditions, globally. To the extent that current and anticipated future sources of liquidity are insufficient to fund our future business activities and requirements, we may be required to seek additional equity or debt financing. The sale of additional equity would result in additional dilution to our stockholders, while the incurrence of additional debt financing, including convertible debt, would result in additional debt service obligations. Such debt instruments also could introduce new or modified covenants that might restrict our operations.operations and/or our ability to pay dividends, consummate acquisitions, or otherwise pursue our business strategies. We cannot provide assurance that we could obtain additional financing on favorable terms or at all.
Cash and cash equivalents
We consider all highly liquid investments with an original maturity ofthree months or less at the date of purchase to be cash equivalents. Our cash and cash equivalents consisted of cash held in checking accounts and money market funds maintained at various financial institutions. Our domestic and foreign holdings of cash and cash equivalents are as follows:
| | | | | | | | | | | |
| September 30, | | December 31, |
| |
| 2022 | | 2021 |
| Cash and cash equivalents held domestically | $ | 4,349 | | | $ | 170,267 | |
| Cash and cash equivalents held by foreign subsidiaries | 68,507 | | | 159,070 | |
| Total cash and cash equivalents | $ | 72,856 | | | $ | 329,337 | |
The amount of cash and cash equivalents held by foreign subsidiaries is subject to translation adjustments caused by changes in foreign currency exchange rates as of the end of each respective reporting period, the offset to which is recorded in Accumulated other comprehensive loss on our consolidated balance sheets.
Bank Credit FacilityCash and cash equivalents
We have an amended and restated Credit Agreement, which provides for an $850,000 senior secured revolving loan facility with a maturity date of November 15, 2025 and a $200,000 senior secured term loan as described further below (the “Credit Facility”). | | | | | | | | | | | |
| September 30, 2023 | | December 31, 2022 |
| Cash and cash equivalents held domestically | $ | 2,679 | | | $ | 3,883 | |
| Cash and cash equivalents held by foreign subsidiaries | 64,284 | | | 67,801 | |
| Total cash and cash equivalents | $ | 66,963 | | | $ | 71,684 | |
Our $200,000 senior secured term loan has a maturity of November 15, 2025 (the “2021 Term Loan”). The 2021 Term Loan requires principal repayment at the end of each calendar quarter. Beginning with March 31, 2022 and ending with December 31, 2023, we are required to repay $1,250 per quarter. Beginning with March 31, 2024 and ending with the last such date prior to the maturity date, we are required to repay $2,500 per quarter. We incurred $540 ofLong-term debt issuance costs related to the 2021 Term Loan. We used borrowings under the 2021 Term Loan to pay down borrowings under the swingline sub‑facility and revolving loan facility under the Credit Facility.
In addition to the senior secured revolving loan facility, the Credit Facility also provides up to $50,000 of letters of credit and other borrowings subject to availability, including a $85,000 U.S. Dollar swingline sub‑facility and a $200,000 incremental “accordion” sub‑facility. We had $150 of letters of credit and surety bonds outstanding as of September 30, 2022 and December 31, 2021. As of September 30, 2022 and December 31, 2021, we had $505,189 and $849,850, respectively, available under the Credit Facility. | | | | | | | | | | | |
| September 30, 2023 | | December 31, 2022 |
| Current portion of long-term debt | $ | 8,750 | | | $ | 5,000 | |
| Long-term debt | 1,580,752 | | | 1,775,696 | |
| Total debt | $ | 1,589,502 | | | $ | 1,780,696 | |
Borrowings under the Credit Facility are guaranteed by all of our first tier domestic subsidiaries and are secured by a first priority security interest in substantially all of our and the guarantors’ U.S. assets and 65% of the stock of their directly owned foreign subsidiaries. The Credit Facility contains both affirmative and negative covenants, including maximum net leverage ratios. As of September 30, 2022 and December 31, 2021, we were in compliance with all covenants in our Credit Facility.
Interest rate risk associated with the Credit Facility is managed through an interest rate swap which has a termination date of April 2, 2030. Under the terms of the interest rate swap, we fixed our London Interbank Offered Rate borrowing rate at 0.73% on a notional amount of $200,000. The interest rate swap is not designated as a hedging instrument for accounting purposes. We account for the interest rate swap as either an asset or a liability in the consolidated balance sheets and carry the derivative at fair value. Gains and losses from the change in fair value are recognized in Other income (expense), net in the consolidated statements of operations. As of September 30, 2022 and December 31, 2021, we recorded a swap related asset at fair value of $39,435 and $10,117, respectively, in Other assets in the consolidated balance sheets.
The weighted average interest rate under the Credit Facility was 4.34% and 2.33% for the three months ended September 30, 2022 and 2021, respectively, and 3.20% and 2.02% for the nine months ended September 30, 2022 and 2021, respectively.
Convertible Senior Notes
2027 Notes. On June 28, 2021, we completed a private offering of $575,000 of 0.375% convertible senior notes due 2027 (the “2027 Notes”). The 2027 Notes were issued pursuant to an indenture, dated as of June 28, 2021, between the Company and Wilmington Trust, National Association, as trustee (the “2027 Indenture”). Interest will accrue from June 28, 2021 and will be payable semi‑annually in arrears in cash on January 1 and July 1 of each year, with the first payment due on January 1, 2022. The 2027 Notes will mature on July 1, 2027, unless earlier converted, redeemed or repurchased. We incurred $15,065 of expenses in connection with the 2027 Notes offering consisting of the payment of initial purchasers’ discounts and commissions, professional fees, and other expenses (“transaction costs”). We used $25,875 of the net proceeds from the sale of the 2027 Notes to pay the premiums of the capped call options described further below, and $536,062 to repay outstanding indebtedness under the Credit Facility and to pay related fees and expenses.
Prior to April 1, 2027, the 2027 Notes will be convertible at the option of the holder only under the following circumstances: (1) during any calendar quarter (and only during such quarter) commencing after the calendar quarter ending on September 30, 2021, if the last reported sale price per share of our Class B Common Stock exceeds 130% of the conversion price for each of at least 20 trading days, whether or not consecutive, during the 30 consecutive trading days ending on, and including, the last trading day of the immediately preceding calendar quarter; (2) during the five consecutive business days immediately after any ten consecutive trading day period (such ten consecutive trading day period, the “measurement period”) in which the trading price per $1 principal amount of 2027 Notes for each trading day of the measurement period was less than 98% of the product of the last reported sale price per share of our Class B Common Stock on such trading day and the conversion rate on such trading day; (3) upon the occurrence of certain corporate events or distributions on our Class B Common Stock, as described in the 2027 Indenture; and (4) if we call the 2027 Notes for redemption. On or after April 1, 2027 until 5:00 p.m., New York City time, on the second scheduled trading day immediately before the maturity date, the 2027 Notes will be convertible at the option of the holder at any time.
We will settle conversions by paying or delivering, as applicable, cash, shares of our Class B Common Stock or a combination of cash and shares of our Class B Common Stock, at our election, based on the applicable conversion rate. The initial conversion rate is 12.0153 shares of our Class B Common Stock per $1 principal amount of 2027 Notes, which represents an initial conversion price of approximately $83.23 per share, and is subject to adjustment as described in the 2027 Indenture. If a “make-whole fundamental change” (as defined in the 2027 Indenture) occurs, then we will, in certain circumstances, increase the conversion rate for a specified period of time.
We will have the option to redeem the 2027 Notes in whole or in part at any time on or after July 5, 2024 and on or before the 40th scheduled trading day immediately before the maturity date if the last reported sale price per share of our Class B common stock exceeds 130% of the conversion price on (1) each of at least 20 trading days, whether or not consecutive, during any 30 consecutive trading days ending on, and including, the trading day immediately before the date we send the related redemption notice; and (2) the trading day immediately before the date we send such notice. The redemption price will be equal to the principal amount of the 2027 Notes to be redeemed, plus accrued and unpaid interest, if any, to, but excluding, the redemption date.
Upon a fundamental change (as defined in the 2027 Indenture), holders may, subject to certain exceptions, require us to purchase their 2027 Notes in whole or in part for cash at a price equal to the principal amount of the 2027 Notes to be purchased, plus accrued and unpaid interest, if any, to, but excluding, the fundamental change repurchase date (as defined in the 2027 Indenture). In addition, upon a Make‑Whole Fundamental Change (as defined in the 2027 Indenture), we will, under certain circumstances, increase the applicable conversion rate for a holder that elects to convert its 2027 Notes in connection with such Make‑Whole Fundamental Change. No adjustment to the conversion rate will be made if the stock price in such Make‑Whole Fundamental Change is either less than $61.65 per share or greater than $325.00 per share. We will not increase the conversion rate to an amount that exceeds 16.2206 shares per $1 principal amount of 2027 Notes, subject to adjustment. The 2027 Indenture also contains a customary merger covenant.
The 2027 Notes were accounted for as debt, with no bifurcation of the embedded conversion feature. Transaction costs were recorded as a direct deduction from the related debt liability in the consolidated balance sheet and are amortized to interest expense over the term of the 2027 Notes. The effective interest rate for the 2027 Notes is 0.864%.
As of September 30, 2022, none of the conditions of the 2027 Notes to early convert has been met.
The 2027 Notes contain both affirmative and negative covenants. As of September 30, 2022, we were in compliance with all covenants in the 2027 Notes.
Capped Call Options. In connection with the pricing of the 2027 Notes, we entered into capped call options with certain of the initial purchasers or their respective affiliates and certain other financial institutions. We incurred $50 of expenses in connection with the capped call options. The capped call options are expected to reduce potential dilution to our Class B Common Stock upon any conversion of 2027 Notes and/or offset any cash payments we are required to make in excess of the principal amount of converted notes, as the case may be, with such reduction and/or offset subject to a cap. The cap price of the capped call options is initially $95.5575 per share, which represents a premium of 55% above the last reported sale price per share of our Class B Common Stock on the Nasdaq Global Select Market on June 23, 2021 and is subject to customary adjustments under the terms of the capped call options.
The capped call options were entered into in conjunction with the issuance of the 2027 Notes, however, they are legally separate agreements that can be separately exercised, with the receipt of shares under the capped call options having no effect on the 2027 Notes, and are legally detachable. As the capped call options are both legally detachable and separately exercisable from the 2027 Notes, we account for the capped call options separately from the 2027 Notes. The capped call options are indexed to our own common stock and classified in stockholders’ equity. As such, the premiums paid for the capped call options have been included as a net reduction to Additional paid-in capital in the consolidated balance sheet.
2026 Notes. On January 26, 2021, we completed a private offering of $690,000 of 0.125% convertible senior notes due 2026 (the “2026 Notes”). The 2026 Notes were issued pursuant to an indenture, dated as of January 26, 2021, between the Company and Wilmington Trust, National Association, as trustee (the “2026 Indenture”). Interest will accrue from January 26, 2021 and will be payable semi‑annually in arrears in cash on January 15 and July 15 of each year, with the first payment due on July 15, 2021. The 2026 Notes will mature on January 15, 2026, unless earlier converted, redeemed or repurchased. We incurred $18,055 of expenses in connection with the 2026 Notes offering consisting of transaction costs. We used $25,530 of the net proceeds from the sale of the 2026 Notes to pay the premiums of the capped call options described further below, and approximately $250,500 to repay outstanding indebtedness under the Credit Facility and to pay related fees and expenses. We used the remainder of the net proceeds from the sale of the 2026 Notes for general corporate purposes and towards funding certain acquisitions, including Seequent.
Prior to October 15, 2025, the 2026 Notes will be convertible at the option of the holder only under the following circumstances: (1) during any calendar quarter (and only during such quarter) commencing after the calendar quarter ending on June 30, 2021, if the last reported sale price per share of our Class B Common Stock exceeds 130% of the conversion price for each of at least 20 trading days, whether or not consecutive, during the 30 consecutive trading days ending on, and including, the last trading day of the immediately preceding calendar quarter; (2) during the five consecutive business days immediately after any ten consecutive trading day period (such ten consecutive trading day period, the “measurement period”) in which the trading price per $1 principal amount of 2026 Notes for each trading day of the measurement period was less than 98% of the product of the last reported sale price per share of our Class B Common Stock on such trading day and the conversion rate on such trading day; (3) upon the occurrence of certain corporate events or distributions on our Class B Common Stock, as described in the 2026 Indenture; and (4) if we call the 2026 Notes for redemption. On or after October 15, 2025 until 5:00 p.m., New York City time, on the second scheduled trading day immediately before the maturity date, the 2026 Notes will be convertible at the option of the holder at any time.
We will settle conversions by paying or delivering, as applicable, cash, shares of our Class B Common Stock or a combination of cash and shares of our Class B Common Stock, at our election, based on the applicable conversion rate. The initial conversion rate is 15.5925 shares of our Class B Common Stock per $1 principal amount of 2026 Notes, which represents an initial conversion price of approximately $64.13 per share, and is subject to adjustment as described in the 2026 Indenture. If a “make-whole fundamental change” (as defined in the 2026 Indenture) occurs, then we will, in certain circumstances, increase the conversion rate for a specified period of time.
We will have the option to redeem the 2026 Notes in whole or in part at any time on or after January 20, 2024 and on or before the 40th scheduled trading day immediately before the maturity date if the last reported sale price per share of our Class B common stock exceeds 130% of the conversion price on (1) each of at least 20 trading days, whether or not consecutive, during any 30 consecutive trading days ending on, and including, the trading day immediately before the date we send the related redemption notice; and (2) the trading day immediately before the date we send such notice. The redemption price will be equal to the principal amount of the 2026 Notes to be redeemed, plus accrued and unpaid interest, if any, to, but excluding, the redemption date.
Upon a fundamental change (as defined in the 2026 Indenture), holders may, subject to certain exceptions, require us to purchase their 2026 Notes in whole or in part for cash at a price equal to the principal amount of the 2026 Notes to be purchased, plus accrued and unpaid interest, if any, to, but excluding, the fundamental change repurchase date (as defined in the 2026 Indenture). In addition, upon a Make‑Whole Fundamental Change (as defined in the 2026 Indenture), we will, under certain circumstances, increase the applicable conversion rate for a holder that elects to convert its 2026 Notes in connection with such Make‑Whole Fundamental Change. No adjustment to the conversion rate will be made if the stock price in such Make‑Whole Fundamental Change is either less than $44.23 per share or greater than $210.00 per share. We will not increase the conversion rate to an amount that exceeds 22.6090 shares per $1 principal amount of 2026 Notes, subject to adjustment. The 2026 Indenture also contains a customary merger covenant.
The 2026 Notes were accounted for as debt, with no bifurcation of the embedded conversion feature. Transaction costs were recorded as a direct deduction from the related debt liability in the consolidated balance sheet and are amortized to interest expense over the term of the 2026 Notes. The effective interest rate for the 2026 Notes is 0.658%.
As of September 30, 2022, none of the conditions of the 2026 Notes to early convert has been met.
The 2026 Notes contain both affirmative and negative covenants. As of September 30, 2022, we were in compliance with all covenants in the 2026 Notes.
Capped Call Options. In connection with the pricing of the 2026 Notes, we entered into capped call options with certain of the initial purchasers or their respective affiliates and certain other financial institutions. We incurred $150 of expenses in connection with the capped call options. The capped call options are expected to reduce potential dilution to our Class B Common Stock upon any conversion of 2026 Notes and/or offset any cash payments we are required to make in excess of the principal amount of converted notes, as the case may be, with such reduction and/or offset subject to a cap. The cap price of the capped call options is initially $72.9795 per share, which represents a premium of 65% above the last reported sale price per share of our Class B Common Stock on the Nasdaq Global Select Market on January 21, 2021 and is subject to customary adjustments under the terms of the capped call options.
The capped call options were entered into in conjunction with the issuance of the 2026 Notes, however, they are legally separate agreements that can be separately exercised, with the receipt of shares under the capped call options having no effect on the 2026 Notes, and are legally detachable. As the capped call options are both legally detachable and separately exercisable from the 2026 Notes, we account for the capped call options separately from the 2026 Notes. The capped call options are indexed to our own common stock and classified in stockholders’ equity. As such, the premiums paid for the capped call options have been included as a net reduction to Additional paid-in capital in the consolidated balance sheet.
Comparison of the Nine Months Ended September 30, 20222023 and 20212022
Our cash flow activities for the nine months ended September 30, 20222023 and 20212022 consist of the following:
| | | Nine Months Ended September 30, | | Nine Months Ended September 30, |
| | 2022 | | 2021 | | 2023 | | 2022 |
| Net Cash Provided By (Used In): | Net Cash Provided By (Used In): | | | | Net Cash Provided By (Used In): | | | |
| Operating activities | Operating activities | $ | 238,198 | | | $ | 207,417 | | Operating activities | $ | 329,643 | | | $ | 238,198 | |
| Investing activities | Investing activities | (740,445) | | | (1,047,847) | | Investing activities | (51,245) | | | (740,445) | |
| Financing activities | Financing activities | 254,692 | | | 869,649 | | Financing activities | (280,019) | | | 254,692 | |
Operating activities
Net cash provided by operating activities was $238,198$329,643 for the nine months ended September 30, 2022.2023. Compared to the same period in the prior year, net cash provided by operating activities was higher by $30,781$91,445 due to an increase in net income of $94,447 and a net increase in net cash flows from the change in operating assets and liabilities of $10,894,$51,510, a net increase in non‑cash adjustments of $41,791, partially offset by a net decrease in non‑cash adjustments of $74,560. Both the increase in net income and the net decrease in non‑cash adjustments were impacted by the one‑time, non‑cash compensation charge of $90,721 to Deferred compensation plan expenses during the nine months ended September 30, 2021 to record reallocated deferred compensation plan liabilities at fair value as previously discussed.$1,856. The net increase in cash flows from the change in operating assets and liabilities was primarily relateddue to a decrease relatedin accounts receivable period over period due to cash paid for income taxes.the timing of collections from accounts and higher CSS deposits.
For the nine months ended September 30, 2021,2022, net cash provided by operating activities was $207,417 due to$238,198 resulting from net income of $54,611 increased by $138,808 of non‑cash adjustments and $13,998 from$149,058, changes in operating assets and liabilities.liabilities of $24,892, and non‑cash adjustments of $64,248.
Investing activities
Net cash used in investing activities was $740,445$51,245 for the nine months ended September 30, 2023 due to $23,110 in acquisition related payments, net of cash acquired, to complete two acquisitions, $18,906 related to purchases of property and equipment and investment in capitalized software, and $11,352 for purchases of investments.
For the nine months ended September 30, 2022, net cash used in investing activities was $740,445 primarily due to $719,539 in acquisition related payments, net of cash acquired, to complete four acquisitions.
Financing activities
Net cash used in financing activities was $280,019 for the nine months ended September 30, 2023 primarily due to the net paydown of the Credit Facility of $195,902, payments for shares acquired of $57,527, and payments of dividends of $43,992.
For the nine months ended September 30, 2021,2022, net cash used in investing activities was $1,047,847 primarily due to $1,033,695 in acquisition related payments, net of cash acquired, to complete 12 acquisitions.
Financing activities
Net cash provided by financing activities was $254,692 for the nine months ended September 30, 2022 primarily due to an increase in net borrowings under the Credit Facility of $340,912, partially offset by net payments for shares acquired of $70,463, including shares repurchased under the Repurchase Program, and payments of dividends of $25,828.
For the nine months ended September 30, 2021, net cash provided by financing activities was $869,649 primarily due to the net proceeds from the convertible senior notes of $1,233,377, partially offset by a decrease in net borrowings under the Credit Facility of $178,145, net payments for shares acquired of $111,306, and the purchase of capped call options of $51,555.
Item 3. Quantitative and Qualitative Disclosures About Market Risk
There have been no significantmaterial changes in our market risk exposure as described in Part II, Item 7A. Quantitative and Qualitative Disclosures About Market Risk in our 20212022 Annual Report on Form 10‑K on file with the SEC.K.
Item 4. Controls and Procedures
Evaluation of Effectiveness of Disclosure Controls and Procedures
Our management maintains disclosure controls and procedures as defined in Rules 13a‑15(e) and 15d‑15(e) under the Securities Exchange Act of 1934, as amended (the “Exchange Act”) that are designed to provide reasonable assurance that information required to be disclosed in our reports filed or submitted under the Exchange Act is processed, recorded, summarized, and reported within the time periods specified in the SEC’s rules and forms, and that such information is accumulated and communicated to our management, including our Chief Executive Officer and Chief Financial Officer (our principal executive officer and principal financial officer, respectively), as appropriate, to allow for timely decisions regarding required disclosure.
We evaluated, under the supervision and with the participation of management, including our principal executive and principal financial officers, the effectiveness of the design and operation of our disclosure controls and procedures as of the end of the period covered by this report. Based on this evaluation, our principal executive officer and principal financial officer concluded that, as of September 30, 2022,2023, our disclosure controls and procedures were effective at the reasonable assurance level.
Our management, including our Chief Executive Officer and Chief Financial Officer, does not expect that our disclosure controls and procedures or our internal control over financial reporting will necessarily prevent all errors and all fraud. A control system, no matter how well conceived and operated, can provide only reasonable, not absolute, assurance that the objectives of the control system are met. Because of the inherent limitations in all control systems, no evaluation of controls can provide absolute assurance that all control issues and instances of fraud, if any, within Bentley Systems, Incorporated have been detected.
Changes in Internal Control over Financial Reporting
There was no change in our internal control over financial reporting identified in management’s evaluation pursuant to Rules 13a or 15d of the Exchange Act that occurred during the quarter ended September 30, 20222023 that has materially affected, or is reasonably likely to materially affect, our internal control over financial reporting.
PART II. OTHER INFORMATION
Item 1. Legal Proceedings
We are subject from time to time to various legal proceedings and claims which arise in the ordinary course of our business. Although the outcome of these and other claims cannot be predicted with certainty, we do not believe that the ultimate resolution of pending matters will have a material adverse effect on our financial condition, results of operations, or cash flows. We currently believe that we do not have any material litigation pending against us.
Item 1A. Risk Factors
In addition to other information set forth in this report, you should carefully considerThere have been no material changes from the risk factors describedpreviously disclosed in Part I, Item 1A. Risk Factors in our 20212022 Annual Report on Form 10‑K on file with the SEC, which could materially affect our business, financial condition or future results. Additional risks and uncertainties not currently known to us or that we currently deem to be immaterial may also materially adversely affect our business, financial condition, or operating results.K.
Item 2. Unregistered Sales of Equity Securities, and Use of Proceeds, and Issuer Purchases of Equity Securities
Recent Sales of Unregistered Equity Securities
From July 1, 20222023 to September 30, 2022,2023, we issued 262,901218,438 shares of our Class B Common Stock pursuant to the vesting of restricted stock awards and restricted stock units.
RSUs.
From July 1, 20222023 to September 30, 2022,2023, we issued 97,59163,267 shares of our Class B Common Stock in connection with distributions from our amended and restated Bentley Systems, Incorporated Nonqualified Deferred Compensation Plan.
DCP.
None of the foregoing transactions involved any underwriters, underwriting discounts or commissions, or any public offering. Unless otherwise stated, the sales of the above securities were deemed to be exempt from registration under the Securities Act in reliance on Rule 701 promulgated under Section 3(b) of the Securities Act as transactions by an issuer pursuant to benefit plans and contracts relating to compensation as provided under Rule 701. All recipients had adequate access, through their relationships with us, to information about us. The issuance of these securities were made without any general solicitation or advertising.
Issuer Purchases of Equity Securities
The following table reflects our Class B Common Stock we repurchased during the three months ended September 30, 2022:
| | | | | | | | | | | | | | | | | | | | | | | | | | |
| | | | | | Total Number of | | Approximate Dollar |
| | | | | | Shares Purchased as | | Value of Shares that |
| | Total Number of | | Average Price | | Part of Publicly | | May Yet Be Purchased |
| Period | | Shares Purchased | | Paid per Share | | Announced Plan (1) | | Under the Plan (2) |
| July 1, 2022 to July 31, 2022 | | — | | | $ | — | | | — | | | $ | 186,767,654 | |
| August 1, 2022 to August 31, 2022 | | — | | | — | | | — | | | 186,767,654 | |
| September 1, 2022 to September 30, 2022 | | 433,125 | | | 34.63 | | | 433,125 | | | 171,767,665 | |
| | 433,125 | | | 34.63 | | | 433,125 | | | |
(1)Represents shares purchased in open‑market transactions under the BSY Stock Repurchase Program approved by our board of directors.
(2)These amounts correspond to the plan publicly announced and approved by our board of directors in May 2022 that authorizes the repurchase up to $200 million of our Class B Common Stock through June 30, 2024.
Item 5. Other Information
As disclosed inRule 10b5-1 Trading Plans
During the Company’s definitive proxy statement for its 2022 Annual Meeting of Stockholders, certainthree months ended September 30, 2023, none of the Company’s nameddirectors or executive officers including David J. Hollister,adopted or terminated any contract, instruction or written plan for the Company’s Chief Investment Officer, receive a portionpurchase or sale of their annual compensation underCompany securities that was intended to satisfy the amended and restated Bentley Systems, Incorporated Bonus Pool Plan (the “Bonus Plan”). Pursuant to the Bonus Plan, participants are eligible to receive incentive bonuses that are determined based on the Company’s Management Report Operating Income,affirmative defense conditions of Rule 10b5‑1(c) or adjusted operating income, as determined by the Company’s internal management accounts (“MROI”). For purposes of the Bonus Plan, the bonus pool thereunder may be funded with up to an aggregate of 20% of the Company’s adjusted MROI (as adjusted for accounting anomalies and other items identified as non‑GAAP charges), minus (a) the value of certain incentive compensation paid to or reserved for senior management members and others employees who do not participate in the Bonus Plan; (b) allowed charitable contributions recommended by the plan participants; and (c) any other amount recommended by a majority of participants, subject to approval by the Company’s nonemployee directors. Payments are determined and made quarterly to plan participants based on each such participant’s allocated interest in the bonus pool. With respect to fiscal year 2022 (and consistent with fiscal year 2021), David J. Hollister’s allocated percentage interest in the Bonus Plan bonus pool is 12.1% (4/33).“non-Rule 10b5‑1 trading arrangement.”
On November 2, 2022, the Sustainability Committee of the Company’s board of directors approved an amendment to the Bonus Plan such that with respect to current year payouts and thereafter, one‑third of David J. Hollister’s allocated percentage interest will be multiplied by a coefficient derived from the performance of the Company’s BSY Investments group (the Company’s executive team focused on portfolio development, mergers and acquisitions, venture capital investing, digital integrator business activities, and various incubating and accelerating business activities). This coefficient is generally determined by calculating the annual increase (or decrease) in value of the BSY Investments portfolio, taking into account applicable fees and an annual hurdle rate, in all cases, as approved by the Company’s nonemployee directors.
Item 6. Exhibits
| | | | | | | | |
| Exhibit | | |
| Number | | Description |
10.1* | | |
| 31.1* | | |
| 31.2* | | |
32.1*32* | | |
| 101.INS | | Inline XBRL Instance Document—the instance document does not appear in the Interactive Data File as its XBRL tags are embedded within the Inline XBRL document |
| 101.SCH | | Inline XBRL Taxonomy Extension Schema |
| 101.CAL | | Inline XBRL Taxonomy Extension Calculation Linkbase |
| 101.DEF | | Inline XBRL Taxonomy Extension Definition Linkbase |
| 101.LAB | | Inline XBRL Taxonomy Extension Label Linkbase |
| 101.PRE | | Inline XBRL Taxonomy Extension Presentation Linkbase |
| 104 | | Cover page formatted as Inline XBRL and contained in Exhibit 101 |
| | | | | |
| * | Filed or furnished herewith. The certification attached as Exhibit 32.132 that accompanies this Quarterly Report on Form 10‑Q is not deemed filed with the U.S. Securities and Exchange Commission and is not to be incorporated by reference into any filing of Bentley Systems, Incorporated under the Securities Act of 1933, as amended, or the Securities Exchange Act of 1934, as amended, whether made before or after the date of this Quarterly Report on Form 10‑Q, irrespective of any general incorporation language contained in such filing. |
SIGNATURE
Pursuant to the requirements of the Securities Exchange Act of 1934, the registrant has duly caused this report to be signed on its behalf by the undersigned thereunto duly authorized.
| | | | | | | | | | | |
| | Bentley Systems, Incorporated |
| | | |
Date: November 8, 20227, 2023 | | By: | /s/ WERNER ANDRE |
| | | Werner Andre |
| | | Chief Financial Officer and Chief Accounting Officer |
| | | (Principal Financial Officer and Principal Accounting Officer) |