|
| | | | |
| | UNITED STATES | |
| | SECURITIES AND EXCHANGE COMMISSION | |
| | Washington, D.C. 20549 | |
| | FORM 10-Q | |
| x | QUARTERLY REPORT PURSUANT TO SECTION 13 OR 15(d) OF THE SECURITIES EXCHANGE ACT OF 1934 | |
| | For the quarterly period ended March 31,September 30, 2018 | |
| ¨ | TRANSITION REPORT PURSUANT TO SECTION 13 OR 15(d) OF THE SECURITIES EXCHANGE ACT OF 1934 | |
| | For the transition period from ________________ to ________________ | |
| | Commission File Number: 001-38082 | |
| | | |
| | KKR Real Estate Finance Trust Inc. | |
| | (Exact name of registrant as specified in its charter) | |
| | Maryland | | 47-2009094 | |
| | (State or other jurisdiction of incorporation or organization) | | (I.R.S. Employer Identification No.) | |
| | 9 West 57th Street, Suite 4200 New York, NY | | 10019 | |
| | (Address of principal executive offices) | | (Zip Code) | |
| | (212) 750-8300 | |
| | (Registrant’s telephone number, including area code) | |
| | Not Applicable | |
| | (Former name, former address and former fiscal year, if changed since last report) | |
Indicate by check mark whether the registrant (1) has filed all reports required to be filed by Section 13 or 15(d) of the Securities Exchange Act of 1934 during the preceding 12 months (or for such shorter period that the registrant was required to file such reports), and (2) has been subject to such filing requirements for the past 90 days. x Yes ¨ No
Indicate by check mark whether the registrant has submitted electronically and posted on its corporate Web site, if any, every Interactive Data File required to be submitted and posted pursuant to Rule 405 of Regulation S-T during the preceding 12 months (or for such shorter period that the registrant was required to submit and post such files). x Yes ¨ No
Indicate by check mark whether the registrant is a large accelerated filer, an accelerated filer, a non-accelerated filer, a smaller reporting company or an emerging growth company. See the definitions of "large accelerated filer," "accelerated filer," "smaller reporting company" and "emerging growth company" in Rule 12b-2 of the Exchange Act.
Large accelerated filer ¨ Accelerated filer ¨
Non-accelerated filer (Do not check if a smaller reporting company) x Smaller reporting company ¨
Emerging growth company x
If an emerging growth company, indicate by check mark if the registrant has elected not to use the extended transition period for complying with any new or revised financial accounting standards provided pursuant to Section 13(a) of the Exchange Act. x
Indicate by check mark whether the registrant is a shell company (as defined in Rule 12b-2 of the Exchange Act). ¨ Yes x No
The number of shares of the registrant's common stock, par value $0.01 per share, outstanding as of May 8,November 5, 2018 was 53,057,429.58,022,176.
CAUTIONARY NOTE REGARDING FORWARD-LOOKING STATEMENTS
This Quarterly Report on Form 10-Q ("Form 10-Q") contains forward-looking statements within the meaning of Section 27A of the Securities Act of 1933, as amended (the "Securities Act”), and Section 21E of the Securities Exchange Act of 1934, as amended (the “Exchange Act”), which reflect our current views with respect to, among other things, our operations and financial performance. You can identify these forward-looking statements by the use of words such as "outlook," "believe," "expect," "potential," "continue," "may," "should," "seek," "approximately," "predict," "intend," "will," "plan," "estimate," "anticipate," the negative version of these words, other comparable words or other statements that do not relate strictly to historical or factual matters. By their nature, forward-looking statements speak only as of the date they are made, are not statements of historical fact or guarantees of future performance and are subject to risks, uncertainties, assumptions or changes in circumstances that are difficult to predict or quantify. Our expectations, beliefs and projections are expressed in good faith and we believe there is a reasonable basis for them. However, there can be no assurance that management's expectations, beliefs and projections will result or be achieved and actual results may vary materially from what is expressed in or indicated by the forward-looking statements.
There are a number of risks, uncertainties and other important factors that could cause our actual results to differ materially from the forward-looking statements contained in this Form 10-Q. Such risks, uncertainties and other important factors include, among others, the risks, uncertainties and factors set forth under Part I, Item 1A. "Risk Factors" in our Annual Report on Form 10-K for the fiscal year ended December 31, 2017 filed with the Securities and Exchange Commission on February 28, 2018 (the "Form 10-K"). Such risks and uncertainties include, but are not limited to, the following:
the general political, economic and competitive conditions in the United States and in any foreign jurisdictions in which we invest;
the level and volatility of prevailing interest rates and credit spreads;
adverse changes in the real estate and real estate capital markets;
general volatility of the securities markets in which we participate;
changes in our business, investment strategies or target assets;
difficulty in obtaining financing or raising capital;
adverse legislative or regulatory developments;
reductions in the yield on our investments and increases in the cost of our financing;
acts of God such as hurricanes, earthquakes and other natural disasters, acts of war and/or terrorism and other events that may cause unanticipated and uninsured performance declines and/or losses to us or the owners and operators of the real estate securing our investments;
deterioration in the performance of properties securing our investments that may cause deterioration in the performance of our investments and, potentially, principal losses to us;
defaults by borrowers in paying debt service on outstanding indebtedness;
the adequacy of collateral securing our investments and declines in the fair value of our investments;
adverse developments in the availability of desirable investment opportunities whether they are due to competition, regulation or otherwise;
difficulty in successfully managing our growth, including integrating new assets into our existing systems;
the cost of operating our platform, including, but not limited to, the cost of operating a real estate investment platform and the cost of operating as a publicly traded company;
the availability of qualified personnel and our relationship with our Manager;
subsidiaries of KKR & Co. L.P.Inc. control us and KKR's interests may conflict with those of our stockholders in the future;
our qualification as a real estate investment trust ("REIT") for U.S. federal income tax purposes and our exclusion from registration under the Investment Company Act of 1940, as amended (the "Investment Company Act"); and
authoritative accounting principles generally accepted in the United States of America ("GAAP") or policy changes from such standard-setting bodies such as the Financial Accounting Standards Board (the "FASB"), the Securities and Exchange Commission (the "SEC"), the Internal Revenue Service (the "IRS"), the New York Stock Exchange (the "NYSE") and other authorities that we are subject to, as well as their counterparts in any foreign jurisdictions where we might do business.
There may be other factors that may cause our actual results to differ materially from the forward-looking statements, including factors set forth under Part I, Item 1A. "Risk Factors" in the Form 10-K and Part II, Item 7. "Management's Discussion and Analysis of Financial Condition and Results of Operations" in this Form 10-Q. Report10-Q as such factors may be updated from time to time in our other periodic filings with the SEC, which are accessible on the SEC's website at www.sec.gov and on the investor relations section of our website at www.kkrreit.com. You should evaluate all forward-looking statements made in this Form 10-Q in the context of these risks and uncertainties.
We caution you that the risks, uncertainties and other factors referenced above may not contain all of the risks, uncertainties and other factors that are important to you. In addition, we cannot assure you that we will realize the results, benefits or developments that we expect or anticipate or, even if substantially realized, that they will result in the consequences or affect us or our business in the way expected. All forward-looking statements in this Form 10-Q apply only as of the date made and are expressly qualified in their entirety by the cautionary statements included in this Form 10-Q and in other filings we make with the SEC. We undertake no obligation to publicly update or revise any forward-looking statements to reflect subsequent events or circumstances, except as required by law.
Except where the context requires otherwise, the terms "Company," "we," "us," "our" and "KREF" refer to KKR Real Estate Finance Trust Inc., a Maryland corporation, and its subsidiaries; "Manager" refers to KKR Real Estate Finance Manager LLC, a Delaware limited liability company, our external manager; and "KKR" refers to KKR & Co. L.P.Inc., a Delaware limited partnership,corporation, and its subsidiaries.
KKR REAL ESTATE FINANCE TRUST INC.
FORM 10-Q
FOR THE QUARTER ENDED MARCH 31,SEPTEMBER 30, 2018
PART I — FINANCIAL INFORMATION
ITEM I. CONDENSED CONSOLIDATED FINANCIAL STATEMENTS
KKR Real Estate Finance Trust Inc. and Subsidiaries
Condensed Consolidated Balance Sheets (Unaudited)
(Amounts in thousands, except share and per share data)
| | | | | March 31,
2018 | | December 31, 2017(A) | | September 30,
2018 | | December 31, 2017(A) |
| Assets | | | | | | | | |
| Cash and cash equivalents | | $ | 23,124 |
| | $ | 103,120 |
| | $ | 192,771 |
| | $ | 103,120 |
|
| Restricted cash | | — |
| | 400 |
| | — |
| | 400 |
|
| Commercial mortgage loans, held-for-investment, net | | 2,273,190 |
| | 1,888,510 |
| | 3,261,878 |
| | 1,888,510 |
|
| Equity method investments, at fair value | | 18,295 |
| | 14,390 |
| | 24,745 |
| | 14,390 |
|
| Accrued interest receivable | | 8,796 |
| | 8,423 |
| | 12,395 |
| | 8,423 |
|
| Other assets | | 2,755 |
| | 7,239 |
| | 20,046 |
| | 7,239 |
|
| Commercial mortgage loans held in variable interest entities, at fair value | | 5,278,715 |
| | 5,372,811 |
| | 1,100,089 |
| | 5,372,811 |
|
| Total Assets | | $ | 7,604,875 |
| | $ | 7,394,893 |
| | $ | 4,611,924 |
| | $ | 7,394,893 |
|
| | |
| | | |
| | |
| Liabilities and Equity | |
| | | |
| | |
| Liabilities | | | | | | | | |
| Secured financing agreements, net | | $ | 1,282,583 |
| | $ | 964,800 |
| | $ | 2,115,954 |
| | $ | 964,800 |
|
| Convertible notes, net | | | 137,339 |
| | — |
|
| Loan participations sold, net | | 81,500 |
| | 81,472 |
| | 83,442 |
| | 81,472 |
|
| Accounts payable, accrued expenses and other liabilities | | 3,111 |
| | 2,465 |
| | 2,236 |
| | 2,465 |
|
| Dividends payable | | 21,458 |
| | 19,981 |
| | 25,235 |
| | 19,981 |
|
| Accrued interest payable | | 2,138 |
| | 1,623 |
| | 6,376 |
| | 1,623 |
|
| Due to affiliates | | 4,082 |
| | 4,442 |
| | 7,700 |
| | 4,442 |
|
| Variable interest entity liabilities, at fair value | | 5,157,430 |
| | 5,256,926 |
| | 1,086,939 |
| | 5,256,926 |
|
| Total Liabilities | | 6,552,302 |
| | 6,331,709 |
| | 3,465,221 |
| | 6,331,709 |
|
| | | | | | | | | |
| Commitments and Contingencies (Note 9) | |
| |
| |
| Commitments and Contingencies (Note 10) | | |
| |
|
| | | | | | | | | |
| Temporary Equity | | | | | | | | |
| Redeemable noncontrolling interests in equity of consolidated joint venture | | 1,329 |
| | 3,090 |
| | — |
| | 3,090 |
|
| Redeemable preferred stock | | 949 |
| | 949 |
| | 402 |
| | 949 |
|
| | | | | | | | | |
| Permanent Equity | | | | | | | | |
| Preferred stock, 50,000,000 authorized (1 share with par value of $0.01 issued and outstanding as of March 31, 2018 and December 31, 2017, respectively) | | — |
| | — |
| |
| Common stock, 300,000,000 authorized (53,075,575 and 53,685,440 shares with par value of $0.01 issued and outstanding as of March 31, 2018 and December 31, 2017, respectively) | | 531 |
| | 537 |
| |
| Preferred stock, 50,000,000 authorized (1 share with par value of $0.01 issued and outstanding as of September 30, 2018 and December 31, 2017) | | | — |
| | — |
|
| Common stock, 300,000,000 authorized (58,022,590 and 53,685,440 shares with par value of $0.01 issued and outstanding as of September 30, 2018 and December 31, 2017, respectively) | | | 580 |
| | 537 |
|
| Additional paid-in capital | | 1,053,869 |
| | 1,052,851 |
| | 1,154,113 |
| | 1,052,851 |
|
| Retained earnings | | 8,330 |
| | 6,280 |
| | 5,763 |
| | 6,280 |
|
| Repurchased stock, 636,263 and 26,398 shares repurchased as of March 31, 2018 and December 31, 2017, respectively | | (12,435 | ) | | (523 | ) | |
| Repurchased stock, 723,507 and 26,398 shares repurchased as of September 30, 2018 and December 31, 2017, respectively | | | (14,155 | ) | | (523 | ) |
| Total KKR Real Estate Finance Trust Inc. stockholders’ equity | | 1,050,295 |
| | 1,059,145 |
| | 1,146,301 |
| | 1,059,145 |
|
| Total Permanent Equity | | 1,050,295 |
| | 1,059,145 |
| | 1,146,301 |
| | 1,059,145 |
|
| Total Liabilities and Equity | | $ | 7,604,875 |
| | $ | 7,394,893 |
| | $ | 4,611,924 |
| | $ | 7,394,893 |
|
| |
| (A) | Derived from the audited consolidated financial statements as of December 31, 2017. |
See Notes to Condensed Consolidated Financial Statements.
KKR Real Estate Finance Trust Inc. and Subsidiaries
Condensed Consolidated Statements of Income (Unaudited)
(Amounts in thousands, except share and per share data)
| | | | | For the Three Months Ended March 31, | | For the Three Months Ended September 30, | | For the Nine Months Ended September 30, |
| | | 2018 | | 2017 | | 2018 | | 2017 | | 2018 | | 2017 |
| Net Interest Income | | | | | | | | | | | | |
| Interest income | | $ | 31,694 |
| | $ | 12,906 |
| | $ | 51,895 |
| | $ | 24,408 |
| | $ | 123,952 |
| | $ | 54,760 |
|
| Interest expense | | 10,690 |
| | 3,953 |
| | 23,337 |
| | 5,414 |
| | 52,825 |
| | 12,592 |
|
| Total net interest income | | 21,004 |
| | 8,953 |
| | 28,558 |
| | 18,994 |
| | 71,127 |
| | 42,168 |
|
| Other Income | | | | | | | | | | | | |
| Realized gain on sale of investments | | | — |
| | — |
| | 13,000 |
| | — |
|
| Change in net assets related to consolidated variable interest entities | | 8,489 |
| | 4,610 |
| | 379 |
| | 4,025 |
| | 2,460 |
| | 12,810 |
|
| Income from equity method investments | | 548 |
| | 16 |
| | 747 |
| | 115 |
| | 2,084 |
| | 461 |
|
| Other income | | 161 |
| | 164 |
| | 476 |
| | 177 |
| | 1,239 |
| | 616 |
|
| Total other income (loss) | | 9,198 |
| | 4,790 |
| | 1,602 |
| | 4,317 |
| | 18,783 |
| | 13,887 |
|
| | | | | | | | | | | | | |
| Operating Expenses | | | | | | | | | | | | |
| General and administrative | | 2,663 |
| | 952 |
| | 1,653 |
| | 1,339 |
| | 6,002 |
| | 3,254 |
|
| Management fees to affiliate | | 3,939 |
| | 2,036 |
| | 4,164 |
| | 3,989 |
| | 12,016 |
| | 9,513 |
|
| Incentive compensation to affiliate | | | 3,286 |
| | — |
| | 3,286 |
| | — |
|
| Total operating expenses | | 6,602 |
| | 2,988 |
| | 9,103 |
| | 5,328 |
| | 21,304 |
| | 12,767 |
|
| | | | | | |
| |
| | | | |
| Income (Loss) Before Income Taxes, Noncontrolling Interests and Preferred Dividends | | 23,600 |
| | 10,755 |
| | 21,057 |
| | 17,983 |
| | 68,606 |
| | 43,288 |
|
| Income tax expense | | 175 |
| | 122 |
| |
| Income tax expense (benefit) | | | 85 |
| | 120 |
| | 227 |
| | 388 |
|
| Net Income (Loss) | | 23,425 |
| | 10,633 |
| | 20,972 |
| | 17,863 |
| | 68,379 |
| | 42,900 |
|
| Redeemable Noncontrolling Interests in Income (Loss) of Consolidated Joint Venture | | 34 |
| | 46 |
| | — |
| | 54 |
| | 63 |
| | 134 |
|
| Noncontrolling Interests in Income (Loss) of Consolidated Joint Venture | | — |
| | 210 |
| | — |
| | 377 |
| | — |
| | 801 |
|
| Net Income (Loss) Attributable to KKR Real Estate Finance Trust Inc. and Subsidiaries | | 23,391 |
| | 10,377 |
| | 20,972 |
| | 17,432 |
| | 68,316 |
| | 41,965 |
|
| Preferred Stock Dividends | | 111 |
| | 13 |
| |
| Preferred Stock Dividends and Redemption Value Adjustment | | | 151 |
| | 93 |
| | 395 |
| | 181 |
|
| Net Income (Loss) Attributable to Common Stockholders | | $ | 23,280 |
| | $ | 10,364 |
| | $ | 20,821 |
| | $ | 17,339 |
| | $ | 67,921 |
| | $ | 41,784 |
|
| | | | | | | | | | | | | |
| Net Income (Loss) Per Share of Common Stock | | | | | | | | | | | | |
| Basic | | $ | 0.44 |
| | $ | 0.39 |
| | $ | 0.37 |
| | $ | 0.32 |
| | $ | 1.26 |
| | $ | 0.98 |
|
| Diluted | | $ | 0.44 |
| | $ | 0.39 |
| | $ | 0.37 |
| | $ | 0.32 |
| | $ | 1.25 |
| | $ | 0.98 |
|
| Weighted Average Number of Shares of Common Stock Outstanding | | | | | | | | | | | | |
| Basic | | 53,337,915 |
| | 26,879,428 |
| | 55,903,126 | | 53,696,967 | | 54,111,272 |
| | 42,501,356 |
|
| Diluted | | 53,378,467 |
| | 26,879,428 |
| | 55,921,655 |
| | 53,697,041 | | 54,132,331 |
| | 42,501,530 |
|
| | | | | | | | | | | | | |
| Dividends Declared per Share of Common Stock | | $ | 0.40 |
| | $ | 0.35 |
| | $ | 0.43 |
| | $ | 0.37 |
| | $ | 1.26 |
| | $ | 1.25 |
|
See Notes to Condensed Consolidated Financial Statements.
KKR Real Estate Finance Trust Inc. and Subsidiaries
Condensed Consolidated Statements of Changes in Equity
For the ThreeNine Months Ended March 31,September 30, 2018 and 2017
(Amounts in thousands, except share data) |
| | | | | | | | | | | | | | | | | | | | | | | | | | | | | | | | | | | | | | | | | | | | | | |
| | | Permanent Equity | | Temporary Equity |
| | | KKR Real Estate Finance Trust Inc. | | | | | | | | |
| | | Preferred Stock | | Common Stock | | | | | | | | | | | | | | | | |
| | | Shares | | Stated Value | | Shares | | Par Value | | Additional Paid-In Capital | | Retained Earnings | | Repurchased Stock | | Total KKR Real Estate Finance Trust Inc. Stockholders' Equity | | Noncontrolling Interests in Equity of Consolidated Joint Venture | | Total Permanent Equity | | Redeemable Noncontrolling Interests in Equity of Consolidated Joint Venture | | Redeemable Preferred Stock |
| Balance at December 31, 2016 | | 126 |
| | $ | 125 |
| | 24,158,392 |
| | $ | 242 |
| | $ | 479,417 |
| | $ | 17,914 |
| | $ | — |
| | $ | 497,698 |
| | $ | 7,339 |
| | $ | 505,037 |
| | $ | 3,030 |
| | $ | — |
|
| Issuance of stock | | — |
| | — |
| | 29,553,446 |
| | 295 |
| | 580,011 |
| | — |
| | — |
| | 580,306 |
| | — |
| | 580,306 |
| | — |
| | 949 |
|
| Repurchase of common stock | | — |
| | — |
| | (26,398 | ) | | — |
| | — |
| | — |
| | (523 | ) | | (523 | ) | | — |
| | (523 | ) | | — |
| | — |
|
| Redemption of preferred stock | | (125 | ) | | (125 | ) | | — |
| | — |
| | — |
| | — |
| | — |
| | (125 | ) | | — |
| | (125 | ) | | — |
| | — |
|
| Offering costs | | — |
| | — |
| | — |
| | — |
| | (6,642 | ) | | — |
| | — |
| | (6,642 | ) | | — |
| | (6,642 | ) | | — |
| | — |
|
| Preferred dividends declared | | — |
| | — |
| | — |
| | — |
| | — |
| | (6 | ) | | — |
| | (6 | ) | | — |
| | (6 | ) | | — |
| | (175 | ) |
| Common dividends declared | | — |
| | — |
| | — |
| | — |
| | — |
| | (50,588 | ) | | — |
| | (50,588 | ) | | — |
| | (50,588 | ) | | — |
| | — |
|
| Capital contributions | | — |
| | — |
| | — |
| | — |
| | — |
| | — |
| | — |
| | — |
| | (8,140 | ) | | (8,140 | ) | | (111 | ) | | — |
|
| Stock-based compensation | | — |
| | — |
| | — |
| | — |
| | 40 |
| | — |
| | — |
| | 40 |
| | — |
| | 40 |
| | — |
| | — |
|
| Net income (loss) | | — |
| | — |
| | — |
| | — |
| | — |
| | 41,790 |
| | — |
| | 41,790 |
| | 801 |
| | 42,591 |
| | 134 |
| | 175 |
|
| Balance at September 30, 2017 | | 1 |
| | $ | — |
| | 53,685,440 |
| | $ | 537 |
| | $ | 1,052,826 |
| | $ | 9,110 |
| | $ | (523 | ) | | $ | 1,061,950 |
| | $ | — |
| | $ | 1,061,950 |
| | $ | 3,053 |
| | $ | 949 |
|
| | | | | | | | | | | | | | | | | | | | | | | | | |
| Balance at December 31, 2017 | | 1 |
| | $ | — |
| | 53,685,440 |
| | $ | 537 |
| | $ | 1,052,851 |
| | $ | 6,280 |
| | $ | (523 | ) | | $ | 1,059,145 |
| | $ | — |
| | $ | 1,059,145 |
| | $ | 3,090 |
| | $ | 949 |
|
| Issuance of stock | | — |
| | — |
| | 5,000,000 |
| | 50 |
| | 99,450 |
| | — |
| | — |
| | 99,500 |
| | — |
| | 99,500 |
| | — |
| | — |
|
| Repurchase of common stock | | — |
| | — |
| | (697,109 | ) | | (7 | ) | | — |
| | — |
| | (13,632 | ) | | (13,639 | ) | | — |
| | (13,639 | ) | | — |
| | — |
|
| Offering costs | | — |
| | — |
| | — |
| | — |
| | (1,174 | ) | | — |
| | — |
| | (1,174 | ) | | — |
| | (1,174 | ) | | — |
| | — |
|
| Equity component of convertible notes | | — |
| | — |
| | — |
| | — |
| | 1,800 |
| | — |
| | — |
| | 1,800 |
| | — |
| | 1,800 |
| | — |
| | — |
|
| Preferred dividends declared | | — |
| | — |
| | — |
| | — |
| | — |
| | — |
| | — |
| | — |
| | — |
| | — |
| | — |
| | (395 | ) |
| Adjustment of redeemable preferred stock to redemption value | | — |
| | — |
| | — |
| | — |
| | — |
| | 547 |
| | — |
| | 547 |
| | — |
| | 547 |
| | — |
| | (547 | ) |
| Common dividends declared | | — |
| | — |
| | — |
| | — |
| | — |
| | (68,985 | ) | | — |
| | (68,985 | ) | | — |
| | (68,985 | ) | | — |
| | — |
|
| Capital distributions and redemptions | | — |
| | — |
| | — |
| | — |
| | — |
| | — |
| | — |
| | — |
| | — |
| | — |
| | (3,153 | ) | | — |
|
| Stock-based compensation | | — |
| | — |
| | 34,259 |
| | * | | 1,186 |
| | — |
| | — |
| | 1,186 |
| | — |
| | 1,186 |
| | — |
| | — |
|
| Net income (loss) | | — |
| | — |
| | — |
| | — |
| | — |
| | 67,921 |
| | — |
| | 67,921 |
| | — |
| | 67,921 |
| | 63 |
| | 395 |
|
| Balance at September 30, 2018 | | 1 |
| | $ | — |
| | 58,022,590 |
| | $ | 580 |
| | $ | 1,154,113 |
| | $ | 5,763 |
| | $ | (14,155 | ) | | $ | 1,146,301 |
| | $ | — |
| | $ | 1,146,301 |
| | $ | — |
| | $ | 402 |
|
|
| | | | | | | | | | | | | | | | | | | | | | | | | | | | | | | | | | | | | | | | | | | | | | |
| | | Permanent Equity | | Temporary Equity |
| | | KKR Real Estate Finance Trust Inc. | | | | | | | | |
| | | Preferred Stock | | Common Stock | | | | | | | | | | | | | | | | |
| | | Shares | | Stated Value | | Shares | | Par Value | | Additional Paid-In Capital | | Retained Earnings | | Repurchased Stock | | Total KKR Real Estate Finance Trust Inc. Stockholders' Equity | | Noncontrolling Interests in Equity of Consolidated Joint Venture | | Total Permanent Equity | | Redeemable Noncontrolling Interests in Equity of Consolidated Joint Venture | | Redeemable Preferred Stock |
| Balance at December 31, 2016 | | 126 |
| | $ | 125 |
| | 24,158,392 |
| | $ | 242 |
| | $ | 479,417 |
| | $ | 17,914 |
| | $ | — |
| | $ | 497,698 |
| | $ | 7,339 |
| | $ | 505,037 |
| | $ | 3,030 |
| | $ | — |
|
| Issuance of stock | | — |
| | — |
| | 7,386,208 |
| | 73 |
| | 147,291 |
| | — |
| | — |
| | 147,364 |
| | — |
| | 147,364 |
| | — |
| | 359 |
|
| Offering costs | | — |
| | — |
| | — |
| | — |
| | (61 | ) | | — |
| | — |
| | (61 | ) | | — |
| | (61 | ) | | — |
| | — |
|
| Preferred dividends declared | | — |
| | — |
| | — |
| | — |
| | — |
| | (4 | ) | | — |
| | (4 | ) | | — |
| | (4 | ) | | — |
| | (9 | ) |
| Common dividends declared | | — |
| | — |
| | — |
| | — |
| | — |
| | (8,455 | ) | | — |
| | (8,455 | ) | | — |
| | (8,455 | ) | | — |
| | — |
|
| Capital contributions | | — |
| | — |
| | — |
| | — |
| | — |
| | — |
| | — |
| | — |
| | (146 | ) | | (146 | ) | | (37 | ) | | — |
|
| Net income (loss) | | — |
| | — |
| | — |
| | — |
| | — |
| | 10,368 |
| | — |
| | 10,368 |
| | 210 |
| | 10,578 |
| | 46 |
| | 9 |
|
| Balance at March 31, 2017 | | 126 |
| | $ | 125 |
| | 31,544,600 |
| | $ | 315 |
| | $ | 626,647 |
| | $ | 19,823 |
| | $ | — |
| | $ | 646,910 |
| | $ | 7,403 |
| | $ | 654,313 |
| | $ | 3,039 |
| | $ | 359 |
|
| | | | | | | | | | | | | | | | | | | | | | | | | |
| Balance at December 31, 2017 | | 1 |
| | $ | — |
| | 53,685,440 |
| | $ | 537 |
| | $ | 1,052,851 |
| | $ | 6,280 |
| | $ | (523 | ) | | $ | 1,059,145 |
| | $ | — |
| | $ | 1,059,145 |
| | $ | 3,090 |
| | $ | 949 |
|
| Repurchase of common stock | | — |
| | — |
| | (609,865 | ) | | (6 | ) | | — |
| | — |
| | (11,912 | ) | | (11,918 | ) | | — |
| | (11,918 | ) | | — |
| | — |
|
| Preferred dividends declared | | — |
| | — |
| | — |
| | — |
| | — |
| | — |
| | — |
| | — |
| | — |
| | — |
| | — |
| | (111 | ) |
| Common dividends declared | | — |
| | — |
| | — |
| | — |
| | — |
| | (21,230 | ) | | — |
| | (21,230 | ) | | — |
| | (21,230 | ) | | — |
| | — |
|
| Capital distributions | | — |
| | — |
| | — |
| | — |
| | — |
| | — |
| | — |
| | — |
| | — |
| | — |
| | (1,795 | ) | | — |
|
| Stock-based compensation | | — |
| | — |
| | — |
| | — |
| | 1,018 |
| | — |
| | — |
| | 1,018 |
| | — |
| | 1,018 |
| | — |
| | — |
|
| Net income (loss) | | — |
| | — |
| | — |
| | — |
| | — |
| | 23,280 |
| | — |
| | 23,280 |
| | — |
| | 23,280 |
| | 34 |
| | 111 |
|
| Balance at March 31, 2018 | | 1 |
| | $ | — |
| | 53,075,575 |
| | $ | 531 |
| | $ | 1,053,869 |
| | $ | 8,330 |
| | $ | (12,435 | ) | | $ | 1,050,295 |
| | $ | — |
| | $ | 1,050,295 |
| | $ | 1,329 |
| | $ | 949 |
|
See Notes to Condensed Consolidated Financial Statements.
KKR Real Estate Finance Trust Inc. and Subsidiaries
Condensed Consolidated Statements of Cash Flows (Unaudited)
(Amounts in thousands)
| | | | | For the Three Months Ended March 31, | | For the Nine Months Ended September 30, |
| | | 2018 | | 2017 | | 2018 | | 2017 |
| Cash Flows From Operating Activities | | | | | | | | |
| Net income (loss) | | $ | 23,425 |
| | $ | 10,633 |
| | $ | 68,379 |
| | $ | 42,900 |
|
| Adjustments to reconcile net income (loss) to net cash provided by (used in) operating activities: | | | | | | | | |
| Amortization of deferred debt issuance costs and discounts | | 564 |
| | 435 |
| | 4,338 |
| | 1,731 |
|
| Accretion of net deferred loan fees and discounts | | (1,362 | ) | | (533 | ) | | (7,206 | ) | | (2,301 | ) |
| Interest paid-in-kind | | — |
| | (318 | ) | | — |
| | (864 | ) |
| Change in noncash net assets of consolidated variable interest entities | | (5,377 | ) | | (1,498 | ) | | 2,144 |
| | (3,453 | ) |
| (Gain) on sale of investment securities | | | (13,000 | ) | | — |
|
| (Income) from equity method investments | | (548 | ) | | (16 | ) | | (2,084 | ) | | (461 | ) |
| Stock-based compensation expense | | 1,018 |
| | — |
| | 1,190 |
| | 40 |
|
| Origination and purchase of commercial loans, held-for-sale | | | — |
| | (91,475 | ) |
| Proceeds from sale of commercial loans, held-for-sale | | | — |
| | 10,000 |
|
| Changes in operating assets and liabilities: | | | | | | | | |
| Accrued interest receivable, net | | (397 | ) | | (1,249 | ) | | (3,130 | ) | | (3,956 | ) |
| Other assets | | 97 |
| | (1,026 | ) | | (580 | ) | | 2,421 |
|
| Due to affiliates | | (360 | ) | | (1,466 | ) | | 1,758 |
| | 2,308 |
|
| Accounts payable, accrued expenses and other liabilities | | 495 |
| | 2,561 |
| | 867 |
| | (1,330 | ) |
| Accrued interest payable | | 516 |
| | 149 |
| | 4,753 |
| | 515 |
|
| Net cash provided by (used in) operating activities | | 18,071 |
| | 7,672 |
| | 57,429 |
| | (43,925 | ) |
| | | | | | | | | |
| Cash Flows From Investing Activities | | | | | | | | |
| Proceeds from sales of commercial mortgage-backed securities | | | 112,747 |
| | — |
|
| Proceeds from sale of commercial mortgage loans | | | — |
| | 60,991 |
|
| Proceeds from principal repayments of commercial mortgage loans, held-for-investment | | 39,557 |
| | — |
| | 318,996 |
| | 18,568 |
|
| Proceeds from principal repayments of preferred interest in joint venture, held-to-maturity | | | — |
| | 37,310 |
|
| Origination of commercial mortgage loans, held-for-investment | | (418,290 | ) | | (234,719 | ) | | (1,695,188 | ) | | (920,358 | ) |
| Investment in commercial mortgage-backed securities, equity method investee | | (4,000 | ) | | — |
| | (9,770 | ) | | (27,588 | ) |
| Proceeds from commercial mortgage-backed securities, equity method investee | | 482 |
| | — |
| | 1,157 |
| | 19,588 |
|
| Net cash provided by (used in) investing activities | | (382,251 | ) | | (234,719 | ) | | (1,272,058 | ) | | (811,489 | ) |
See Notes to Condensed Consolidated Financial Statements.
KKR Real Estate Finance Trust Inc. and Subsidiaries
Condensed Consolidated Statements of Cash Flows (Unaudited)
(Amounts in thousands)
| | | | | For the Three Months Ended March 31, | | For the Nine Months Ended September 30, |
| | | 2018 | | 2017 | | 2018 | | 2017 |
| Cash Flows From Financing Activities | | | | | | | | |
| Proceeds from borrowings under secured financing agreements | | 317,750 |
| | 147,000 |
| | 1,607,725 |
| | 776,447 |
|
| Net proceeds from issuance of convertible notes | | | 139,438 |
| | — |
|
| Proceeds from issuances of common stock | | — |
| | 147,723 |
| | 99,500 |
| | 581,255 |
|
| Redemption of preferred stock | | | — |
| | (125 | ) |
| Payments of common stock dividends | | (19,864 | ) | | (8,455 | ) | | (63,898 | ) | | (30,715 | ) |
| Payments of preferred stock dividends | | | (227 | ) | | (63 | ) |
| Principal repayments on borrowings under secured financing agreements | | | (451,026 | ) | | (460,432 | ) |
| Payments of debt issuance costs | | (389 | ) | | (291 | ) | | (9,702 | ) | | (3,051 | ) |
| Payments of stock issuance costs | | — |
| | (969 | ) | | (1,137 | ) | | (4,898 | ) |
| Payments of redeemable noncontrolling interest distributions | | (1,795 | ) | | (37 | ) | |
| Payments of redeemable noncontrolling interest distributions and redemptions | | | (3,153 | ) | | (111 | ) |
| Payments of noncontrolling interest distributions | | — |
| | (146 | ) | | — |
| | (8,140 | ) |
| Payments to reacquire common stock | | (11,918 | ) | | — |
| | (13,640 | ) | | (523 | ) |
| Net cash provided by (used in) financing activities | | 283,784 |
| | 284,825 |
| | 1,303,880 |
| | 849,644 |
|
| | | | | | | | | |
| Net Increase (Decrease) in Cash, Cash Equivalents, and Restricted Cash | | (80,396 | ) | | 57,778 |
| | 89,251 |
| | (5,770 | ) |
| Cash, Cash Equivalents, and Restricted Cash at Beginning of Period | | 103,520 |
| | 96,346 |
| | 103,520 |
| | 96,346 |
|
| Cash, Cash Equivalents, and Restricted Cash at End of Period | | $ | 23,124 |
| | $ | 154,124 |
| | $ | 192,771 |
| | $ | 90,576 |
|
| | | | | | | | | |
| Supplemental Disclosure of Cash Flow Information | | | | | | | | |
| Cash paid during the period for interest | | $ | 8,823 |
| | $ | 3,311 |
| | $ | 41,161 |
| | $ | 10,116 |
|
| Cash paid during the period for income taxes | | 98 |
| | 3 |
| | 754 |
| | 252 |
|
| | | | | | | | | |
| Supplemental Schedule of Non-Cash Investing and Financing Activities | | | | | | | | |
| Dividend declared, not yet paid | | $ | 21,458 |
| | $ | 13 |
| | $ | 25,235 |
| | $ | 19,992 |
|
| Loan Principal Payments Held by Servicer | | | 16,500 |
| | — |
|
| Loan Participations Sold, Net (Note 6) | | | 1,886 |
| | — |
|
| Funding of commercial loans, held for investment | | | (1,886 | ) | | — |
|
See Notes to Condensed Consolidated Financial Statements.
KKR Real Estate Finance Trust Inc.
Notes to Condensed Consolidated Financial Statements (Unaudited)
(dollars in tables in thousands, except per share amounts)
Note 1. Business and Organization
KKR Real Estate Finance Trust Inc. (together with its consolidated subsidiaries, referred to throughout this report as the "Company", "KREF", "we", "us" and "our") is a Maryland corporation that was formed and commenced operations on October 2, 2014 as a mortgage "real estate investment trust" ("REIT") that focuses primarily on originating and acquiring senior loans secured by commercial real estate assets.
KREF has elected and intends to maintain its qualification to be taxed as a REIT under the requirements of the Internal Revenue Code of 1986, as amended (the "Internal Revenue Code"), for U.S. federal income tax purposes. As such, KREF will generally not be subject to U.S. federal income tax on that portion of its income that it distributes to stockholders if it distributes at least 90% of its REIT taxable income, determined without regard to the deduction for dividends paid and excluding any net capital gains. See Note 1213 regarding taxes applicable to KREF.
KREF is externally managed by KKR Real Estate Finance Manager LLC ("Manager"), an indirect subsidiary of KKR & Co. L.P.Inc. (together with its subsidiaries, "KKR"), through a management agreement ("Management Agreement") pursuant to which the Manager provides a management team and other professionals who are responsible for implementing KREF’s business strategy, subject to the supervision of KREF’s board of directors. For its services, the Manager is entitled to management fees and incentive compensation, both defined in, and in accordance with the terms of, the Management Agreement (Note 10)11).
As of March 31,September 30, 2018, KKR beneficially owned 23,758,616 shares of KREF's common stock, of which 3,758,616 shares were held by KKR on behalf of a third-party investor.
As of March 31,September 30, 2018, KREF's principal business activities related to the origination and purchase of credit investments related to commercial real estate. Management assesses performance of KREF's current portfolio of leveraged and unleveraged commercial mortgage loans and commercial mortgage-backed securities ("CMBS") as a whole and makes operating decisions accordingly. As a result, management presents KREF's operations within a single reporting segment.
Note 2. Summary of Significant Accounting Policies
Basis of Presentation — The accompanying unaudited condensed consolidated financial statements and related notes of KREF are prepared in accordance with accounting principles generally accepted in the United States of America ("GAAP") for interim financial information and instructions to Form 10-Q. The condensed consolidated financial statements, including these notes, are unaudited and exclude some of the disclosures required in annual financial statements. Accordingly, certain information and footnote disclosures normally included in the consolidated financial statements have been condensed or omitted. The condensed consolidated financial statements include the accounts of KREF and its consolidated subsidiaries, and all intercompany transactions and balances have been eliminated. In the opinion of management, all adjustments considered necessary for a fair presentation of KREF’s financial position, results of operations and cash flows have been included and are of a normal and recurring nature. The operating results presented for interim periods are not necessarily indicative of the results that may be expected for any other interim period or for the entire year. These condensed consolidated financial statements should be read in conjunction with KREF’s Annual Report on Form 10-K for the fiscal year ended December 31, 2017 filed with the Securities and Exchange Commission on February 28, 2018 (the "Form 10-K").
Consolidation — KREF consolidates those entities for which (i) it controls significant operating, financial and investing decisions of the entity or (ii) management determines that KREF is the primary beneficiary of entities deemed to be variable interest entities ("VIEs").
Variable Interest Entities — VIEs are defined as entities in which equity investors do not have an interest with the characteristics of a controlling financial interest or do not have sufficient equity at risk for the entity to finance its activities without additional subordinated financial support from other parties. A VIE is required to be consolidated only by its primary beneficiary, which is defined as the party that has the power to direct the activities of the VIE that most significantly impact its economic performance and that has the obligation to absorb losses of, or the right to receive benefits from, the VIE that could be potentially significant to the VIE (Note 6)7).
KKR Real Estate Finance Trust Inc.
Notes to Condensed Consolidated Financial Statements (Unaudited)
(dollars in tables in thousands, except per share amounts)
To assess whether KREF has the power to direct the activities of a VIE that most significantly impact the VIE’s economic performance, KREF considers all the facts and circumstances, including its role in establishing the VIE and its ongoing rights and responsibilities. This assessment includes, first, identifying the activities that most significantly impact the VIE’s economic performance; and second, identifying which party, if any, has power to direct those activities. To assess whether KREF has the obligation to absorb losses of, or the right to receive benefits from, the VIE that could potentially be significant to the VIE, KREF considers all of its economic interests and applies judgment in determining whether these interests, in the aggregate, are considered potentially significant to the VIE.
CMBS — KREF consolidates those trusts that issue beneficial ownership interests in mortgage loans secured by commercial real estate (commonly known as CMBS) when KREF holds a variable interest in, and management considers KREF to be the primary beneficiary of, those trusts. Management believes the performance of the assets that underlie CMBS issuances most significantly impacts the economic performance of the trust, and the primary beneficiary is generally the entity that conducts activities that most significantly impact the performance of the underlying assets. In particular, the most subordinate tranches of CMBS expose the holder to the greater variability of economic performance when compared to more senior tranches since the subordinate tranches absorb a disproportionately higher amount of the credit risk related to the underlying assets. Generally, a trust designates the most junior subordinate tranche outstanding as the controlling class, which entitles the holder of the controlling class to unilaterally appoint and remove the special servicer for the trust. The special servicer is responsible for the servicing and administration of delinquent and nonperforming loans as well as real estate owned ("REO") properties held as collateral delivered on foreclosed loans. While the special servicer cannot prevent losses, its services to the trust are designed to mitigate credit losses to holders of the CMBS.
For the trusts that KREF consolidates, KREF holds non-investment grade rated and unrated tranches that represent the most subordinated tranches of the CMBS issued by those trusts, which include the controlling class. As the holder of the most subordinate tranche, KREF is in a first loss position and has the right to receive benefits. As the holder of the controlling class, KREF has the ability to unilaterally appoint and remove the special servicer for the trust. In these cases, management considers KREF to be the primary beneficiary and consolidates the CMBS trusts.
For VIEs in which management determines KREF is the primary beneficiary, all of the underlying assets, liabilities and equity of the trusts are recorded on KREF's books, and the initial investment, along with any associated unrealized holding gains and losses, are eliminated in consolidation. Similarly, the interest income earned from these trusts is eliminated in consolidation.
Management elected the fair value option for KREF's initial and subsequent recognition of the assets and liabilities of KREF's consolidated CMBS VIEs in order to provide users of the financial statements with better information regarding the effects of credit risk and other market factors on the CMBS beneficially held by KREF's stockholders. Since the changes in fair value include the interest income and interest expense associated with these CMBS VIEs, management does not consider the separate presentation of the components of fair value changes to be relevant. Management has elected to present these items in aggregate as "Other Income — Change in net assets related to consolidated variable interest entities" in the accompanying Condensed Consolidated Statements of Income; the residual difference between the fair value of the trusts' assets and liabilities represents KREF's beneficial interest in the CMBS VIEs.
Management separately presents the assets and liabilities of KREF's consolidated VIEs as individual line items on KREF's Condensed Consolidated Balance Sheets for entities in which the VIEs assets can only be used to settle the VIE’s obligations. The liabilities of KREF's consolidated VIEs consist solely of obligations to the CMBS holders of the consolidated trusts, excluding CMBS held by KREF as such interests are eliminated in consolidation, and the interest accrued thereon, presented as "Liabilities — Variable interest entity liabilities, at fair value." The assets of KREF's consolidated VIEs consist principally of commercial mortgage loans and the interest accrued thereon, and are likewise presented as a single line item entitled "Assets — Commercial mortgage loans held in variable interest entities, at fair value."
Assets of a CMBS trust, as a whole, can only be used to settle the obligations of the consolidated CMBS VIE. The assets of KREF's CMBS VIEs are not individually accessible by, and obligations of the CMBS VIEs are not recourse to, the bondholders.
KKR Real Estate Finance Trust Inc.
Notes to Condensed Consolidated Financial Statements (Unaudited)
(dollars in tables in thousands, except per share amounts)
REO assets generally represent a small percentage of the overall asset pool of a CMBS trust. In a new issue CMBS trust there are no REO assets, and no REO existed in KREF's consolidated VIE assets as of March 31,September 30, 2018. KREF derives the fair value of its Level 3 CMBS VIE assets from its Level 3 CMBS VIE liabilities, which management considers to possess more observable market value data than the CMBS VIE assets. See "— Fair Value — Valuation of Consolidated VIEs" for additional discussion regarding management's valuation of consolidated CMBS VIEs.
Commercial Mezzanine Loan Joint Venture —- KREF consolidatesconsolidated a joint venture that holdsheld a portion of KREF's investments in commercial mezzanine loans (“Mezzanine JV”), and in which a third-party ownsowned a 5.0% redeemable noncontrolling interest ("Mezzanine JV Redeemable Noncontrolling Interest”) (Note 67 ). Management determined the joint venture to be a VIE as the third-party owners of the redeemable noncontrolling interest dodid not have substantive participating or kick-out rights. KREF ownsowned 95.0% of the equity interests in the joint venture and participatesparticipated in the profits and losses. Management considersconsidered KREF to be the primary beneficiary of the joint venture as KREF holdsheld decision-making power over the activities that most significantly impact the economic performance of the joint venture. In June 2018, KREF acquired the 5.0% Mezzanine JV Redeemable Noncontrolling Interest for its carrying value of $1.3 million.
Noncontrolling Interests — Noncontrolling interests represent the ownership interests in certain consolidated subsidiaries held by entities or persons other than KREF. Those noncontrolling interests that allow the holder to redeem before liquidation or termination of the entity that issued those interests are considered redeemable noncontrolling interests.
The redeemable noncontrolling interests issued by subsidiaries of KREF are subject to certain restrictions and require KREF to transfer assets or issue equity to satisfy the redemption. As KREF does not control the circumstances under which the noncontrolling interests may redeem their interests, management considers these redeemable noncontrolling interests as temporary equity, presented as "Temporary Equity — Redeemable noncontrolling interests in equity of consolidated joint venture" in the accompanying Condensed Consolidated Balance Sheets and their share of "Net Income (Loss)" as "Redeemable Noncontrolling Interests in Income (Loss) of Consolidated Joint Venture" in the Condensed Consolidated Statements of Income. KREF recorded the redeemable noncontrolling interests at fair value upon issuance by subsidiaries of KREF, and accretesadjusts the carrying value of such interests to theequal their respective redemption values at each subsequent reporting period date if KREF determines the noncontrolling interests are redeemable or probable to become redeemable.
As noted above, in June 2018, KREF acquired the 5.0% Mezzanine JV Redeemable Noncontrolling Interest for its carrying value of March 31, 2018, $1.3 million.
KREF determined that the Special Non-Voting Preferred Stock (“SNVPS”) became redeemable noncontrolling interests were not currently redeemable or probable to become redeemable, and as a result did not adjustduring the second quarter of 2018; accordingly, KREF adjusted the carrying value of the redeemable noncontrolling interests.SNVPS to its redemption value of $0.4 million as of the balance sheet date.
Equity method investments, at fair value— Investments are accounted for under the equity method when KREF has significant influence over the operations of an investee, but KREF does not consolidate that investment. Equity method investments, for which management has not elected a fair value option, are initially recorded at cost and subsequently adjusted for KREF's share of net income or loss and cash contributions and distributions each period.
Management determined that KREF's investment in the Manager is an interest in a VIE as KREF did not have substantive participating or kick-out rights. KREF does not have the power to direct activities and the obligation to absorb losses of the Manager that could be significant to the Manager. KREF accounts for its investment in the Manager using the equity method since KREF is not the primary beneficiary of the Manager (Note 6)7).
Management determined that its investment in an aggregator vehicle alongside KKR Real Estate Credit Opportunity Partners L.P. ("RECOP") is an interest in a VIE, however KREF is not the primary beneficiary and does not have substantive participating or kick-out rights. Management elected the fair value option for KREF's investment in RECOP. KREF records its share of net asset value in RECOP as “Equity method investments, at fair value” in its Condensed Consolidated Balance Sheets and its share of unrealized gains or losses in "Income from equity method investments" in its Condensed Consolidated Statements of Income (Note 6)7).
Use of Estimates — The preparation of condensed consolidated financial statements in conformity with GAAP requires management to make estimates and assumptions that affect the reported amounts of assets and liabilities, the disclosure of contingent assets and liabilities at the date of the condensed consolidated financial statements and the reported amounts of
KKR Real Estate Finance Trust Inc.
Notes to Condensed Consolidated Financial Statements (Unaudited)
(dollars in tables in thousands, except per share amounts)
revenue and expenses during the reporting period. Management makes subjective estimates to project cash flows KREF expects to receive on its investments in loans and securities as well as the related market discount rates, which significantly impacts the interest income, impairments, allowance for loan loss and fair values recorded or disclosed. Actual results could differ from those estimates.
Fair Value — GAAP requires the categorization of the fair value of financial instruments into three broad levels that form a hierarchy based on the transparency of inputs to the valuation.
KKR Real Estate Finance Trust Inc.
Notes to Condensed Consolidated Financial Statements (Unaudited)
(dollars in tables in thousands, except per share amounts)
| |
| Level 1 | - Inputs are unadjusted, quoted prices in active markets for identical assets or liabilities at the measurement date. |
| |
| Level 2 | - Inputs are other than quoted prices that are observable for the asset or liability, either directly or indirectly. Level 2 inputs include quoted prices for similar instruments in active markets, and inputs other than quoted prices that are observable for the asset or liability. |
| |
| Level 3 | - Inputs are unobservable for the asset or liability, and include situations where there is little, if any, market activity for the asset or liability. |
KREF follows this hierarchy for its financial instruments. The classifications are based on the lowest level of input that is significant to the fair value measurement.
Estimates of fair value for cash and cash equivalents, restricted cash, and convertible notes are measured using observable, quoted market prices, or Level 1 inputs.
Valuation Process — The Manager reviews the valuation of Level 3 financial instruments as part of KKR's quarterly process. As of March 31,September 30, 2018, KKR’s valuation process for Level 3 measurements, as described below, subjected valuations to the review and oversight of various committees. KKR has a global valuation committee assisted by the asset class-specific valuation committees, including a real estate valuation committee that reviews and approves all preliminary Level 3 valuations for real estate assets, including the financial instruments held by KREF. The global valuation committee is responsible for coordinating and implementing KKR’s valuation process to ensure consistency in the application of valuation principles across portfolio investments and between periods. All Level 3 valuations are also subject to approval by the global valuation committee.
Valuation of Consolidated VIEs — Management categorizes the financial assets and liabilities of the CMBS trusts that KREF consolidates as Level 3 assets and liabilities in the fair value hierarchy and has elected the fair value option for financial assets and liabilities of each CMBS trust. Management has adopted the measurement alternative included in Accounting Standards Update ("ASU") No. 2014-13, Measuring the Financial Assets and the Financial Liabilities of a Consolidated Collateralized Financing Entity ("ASU 2014-13"). Pursuant to ASU 2014-13, management measures both the financial assets and financial liabilities of the CMBS trusts consolidated by KREF using the fair value of the financial liabilities, which management considers more observable than the fair value of the financial assets. As a result, KREF presents the CMBS issued by the consolidated trust, but not beneficially owned by KREF's stockholders, as financial liabilities in KREF's condensed consolidated financial statements, measured at their estimated fair value; KREF measures the financial assets as the total estimated fair value of the CMBS issued by the consolidated trust, regardless of whether such CMBS represent interests beneficially owned by KREF's stockholders. Under the measurement alternative prescribed by ASU 2014-13, KREF's "Net Income (Loss)" reflects the economic interests in the consolidated CMBS beneficially owned by KREF's stockholders, presented as "Change in net assets related to consolidated variable interest entities" in the Condensed Consolidated Statements of Income, which includes applicable (i) changes in the fair value of CMBS beneficially owned by KREF, (ii) interest and servicing fees earned from the CMBS trust and (iii) other residual returns or losses of the CMBS trust, if any (Note 6)7).
Management categorizes the commercial mezzanine loans held by separate joint ventures, VIEs consolidated by KREF as primary beneficiary, as Level 3 assets in the fair value hierarchy as such assets are illiquid, structured instruments that are specific to the properties and their corresponding operating performance (Note 11)12).
Other Valuation Matters — For Level 3 financial assets originated, or otherwise acquired, and financial liabilities assumed during the calendar month immediately preceding a quarter end that were conducted in an orderly transaction with an unrelated party, management generally believes that the transaction price provides the most observable indication of fair value given the illiquid nature of these financial instruments, unless management is aware of any circumstances that may cause a material
KKR Real Estate Finance Trust Inc.
Notes to Condensed Consolidated Financial Statements (Unaudited)
(dollars in tables in thousands, except per share amounts)
change in the fair value through the remainder of the reporting period. For instance, significant changes to the underlying property or its planned operations may cause material changes in the fair value of commercial mortgage loans acquired, or originated, by KREF.
KREF’s determination of fair value is based upon the best information available for a given circumstance and may incorporate assumptions that are management’s best estimates after consideration of a variety of internal and external factors. When an independent valuation firm expresses an opinion on the fair value of a financial instrument in the form of a range, management selects a value within the range provided by the independent valuation firm, generally the midpoint, to assess the reasonableness of management’s estimated fair value for that financial instrument.
KKR Real Estate Finance Trust Inc.
Notes to Condensed Consolidated Financial Statements (Unaudited)
(dollars in tables in thousands, except per share amounts)
See Note 1112 for additional information regarding the valuation of KREF's financial assets and liabilities.
Sales of Financial Assets and Financing Agreements — KREF will, from time to time, sell loans, securities and other assets as well as finance assets in the form of secured borrowings. In each case, management evaluates whether the transaction constitutes a sale through legal isolation of the transferred financial asset from KREF, the ability of the transferee to pledge or exchange the transferred asset without constraint and the transfer of control of the transferred asset. For transfers that constitute sales, KREF (i) recognizes the financial assets it retains and liabilities it has incurred, if any, (ii) derecognizes the financial assets it has sold, and derecognizes liabilities when extinguished and (iii) recognizes a realized gain, or loss, based upon the excess, or deficient, proceeds received over the carrying value of the transferred asset. KREF does not recognize a gain, or loss, on interests retained, if any, where management elected the fair value option prior to sale.
Balance Sheet Measurement
Cash, Cash Equivalents and Restricted Cash and Cash Equivalents — KREF considers cash equivalents as highly liquid short-term investments with maturities of 90 days or less when purchased. Substantially all amounts on deposit with major financial institutions exceed insured limits.
As of March 31, 2018 and December 31, 2017, KREF held $0 million and $0.4 million, respectively, of restricted cash related to good faith deposits and surety bond deposits. KREF receives good faith deposits from potential borrowers when originating or acquiring commercial mortgage loans, which KREF must return to the borrower in the event of a successful transaction or use to pay the costs it incurs in the event of a broken deal. Management considers these deposits restricted until the good faith deposit is returned to the borrower or management considers the deal broken.
The following table provides a reconciliation of cash, cash equivalents, and restricted cash and cash equivalents reported within the Condensed Consolidated Balance Sheets that sum to the total of the same such amounts shown in the Condensed Consolidated Statements of Cash Flows.
|
| | | | | | | |
| | March 31, 2018 | | December 31, 2017 |
| Cash and cash equivalents | $ | 23,124 |
| | $ | 103,120 |
|
| Restricted cash | — |
| | 400 |
|
| Total cash, cash equivalents and restricted cash shown in the Condensed Consolidated Statements of Cash Flows | $ | 23,124 |
| | $ | 103,520 |
|
KREF must also maintain sufficient cash and cash equivalents to satisfy liquidity covenants related to its secured financing agreements. However, such amounts are not restricted from use in KREF's current operations, and KREF does not present these cash and cash equivalents as restricted. As of March 31,September 30, 2018 and December 31, 2017, KREF was required to maintain unrestricted cash and cash equivalents of at least $16.1$19.3 million and $12.1 million, respectively, to satisfy its liquidity covenants (Note 4).
Commercial Mortgage Loans Held‑For‑Investment and Provision for Loan Losses — KREF recognizes its investments in commercial mortgage loans based on management's intent, and KREF's ability, to hold those investments through their contractual maturity. Management classifies those loans that management does not intend to sell in the foreseeable future, and KREF is able to hold until maturity, as held-for-investment. Loans that are held‑for‑investment are carried at their aggregate outstanding face amount, net of applicable (i) unamortized origination or acquisition premiums and discounts, (ii) unamortized deferred nonrefundable fees and other direct loan origination costs, (iii) allowance for loan losses and (iv) charge-offs or write-downs of impaired loans. If a loan is determined to be impaired, management writes down the loan through a charge to the provision for loan losses. See "—Expense Recognition — Loan Impairment— Commercial Mortgage Loans, Held-For-Investment" for additional discussion regarding management’s determination for loan losses. KREF applies the interest method to amortize origination or acquisition premiums and discounts and deferred nonrefundable fees or other direct loan origination costs, or on a straight line basis when it approximates the interest method. Loans for which management elects the fair value option at the time of origination, or acquisition, are carried at fair value on a recurring basis (Note 3).
Commercial Mortgage Loans Held‑For‑Sale — Loans that KREF originates, or acquires, which KREF is unable to hold, or management intends to sell or otherwise dispose of, in the foreseeable future are classified as held‑for‑sale and are carried at the lower of amortized cost or fair value.
Secured Financing Agreements— KREF's secured financing agreements, including Term Loan Financings, are treated as collateralized financing transactions and consist of floating rate, uncommitted repurchase facilities and Term Loan Financing arrangements carried at their contractual amounts, net of unamortized debt issuance costs (Note 4).
KKR Real Estate Finance Trust Inc.
Notes to Condensed Consolidated Financial Statements (Unaudited)
(dollars in tables in thousands, except per share amounts)
Secured Financing AgreementsConvertible Notes, Net — KREF's secured financing agreementsKREF accounts for its convertible debt with a cash conversion feature in accordance with ASC 470-20 “Debt with Conversion and Other Options” which requires the liability and equity components of convertible debt instruments that may be settled in cash upon conversion, including partial cash settlement, to be separately accounted for in a manner that reflects the issuer’s nonconvertible debt borrowing rate. The initial proceeds from the sale of convertible notes are treatedallocated between a liability component and an equity component in a manner that reflects interest expense at the rate of similar nonconvertible debt that could have been issued at such time. The equity component represents the excess initial proceeds received over the fair value of the liability component of the notes as collateralized financing transactionsof the date of issuance. KREF measured the estimated fair value of the debt component of the convertible notes due May 15, 2023 (“Convertible Notes”) as of the issuance date based on KREF’s nonconvertible debt borrowing rate. The equity component of the Convertible Notes is reflected within additional paid-in capital on our condensed consolidated balance sheet, and consist of floating rate, uncommitted repurchase facilities carried atthe resulting debt discount is amortized over the period during which such Convertible Notes are expected to be outstanding (through the maturity date) as additional non-cash interest expense using the interest method, or on a straight line basis when it approximates the interest method. The additional non-cash interest expense attributable to such convertible notes will increase in subsequent periods through the maturity date as the notes accrete to their contractual amounts, net of unamortized debt issuance costspar value over the same period (Note 4)5).
Loan Participations Sold, Net — In connection with its investments in senior loans, KREF finances certain investments through the syndication of non-recourse, or limited-recourse, loan participation to unaffiliated third parties. KREF’s presentation of the senior loan and related financing involved in the syndication depends upon whether GAAP recognized the transaction as a sale, though such differences in presentation do not generally impact KREF’s net stockholders’ equity or net income aside from timing differences in the recognition of certain transaction costs.
To the extent that GAAP recognizes a sale resulting from the syndication, KREF derecognizes the participation in the senior loan that KREF sold and continue to carry the retained portion of the loan as an investment. While KREF does not generally expect to recognize a material gain or loss on these sales, KREF would realize a gain or loss in an amount equal to the difference between the net proceeds received from the third party purchaser and its carrying value of the loan participation that KREF sold at time of sale. Furthermore, KREF recognizes interest income only on the portion of the senior loan that it retains as a result of the sale.
To the extent that GAAP does not recognize a sale resulting from the syndication, KREF does not derecognize the participation in the senior loan that it sold. Instead, KREF recognizes a loan participation sold liability in an amount equal to the principal of the loan participation syndicated less any unamortized discounts or financing costs resulting from the syndication. KREF continues to recognize interest income on the entire senior loan, including the interest attributable to the loan participation sold, as well as interest expense on the loan participation sold liability (Note 5)6).
Other Assets and Accounts Payable, Accrued Expenses and Other Liabilities — As of March 31,September 30, 2018, other assets included $2.3a $16.5 million loan principal payment receivable from a third-party servicer and $2.4 million of deferred debt issuance costs related to credit facilities, net of $0.2$0.8 million accumulated amortization. As of December 31, 2017, other assets included a $4.6 million loan principal payment receivable from a third-party servicer and $2.1 million of deferred debt issuance costs related to credit facilities, net of $0.5 million accumulated amortization. Accounts payable, accrued expenses and other liabilities included $2.2 million and $1.6 million of miscellaneous accounts payable and accrued expenses as of March 31, 2018 and December 31, 2017, respectively.
Special Non-Voting Preferred Stock ("SNVPS") — Equity instruments that are redeemable for cash or other assets are classified as temporary equity if the instrument is redeemable, at the option of the holder, at a fixed or determinable price on a fixed or determinable date or upon the occurrence of an event that is not solely within the control of the issuer. Redeemable equity instruments are initially carried at the fair value of the equity instrument at the issuance date, which is subsequently adjusted at each balance sheet date if the instrument is currently redeemable or probable of becoming redeemable. The fair value of the instrument is adjusted to reflect the instrument’s redemption amount at each balance sheet date if KREF determines the SNVPS is redeemable or it is probable that the SNVPS will become redeemable. KREF accounted for the SNVPS as redeemable preferred stock since a third party holds a redemption option, exercisable after May 5, 2018, and such redemption is not solely within KREF’s control. AsAccordingly, the Company adjusted the carrying value of March 31, 2018, KREF determined that the SNVPS was neither currently redeemable nor was it probable that the SNVPS would become redeemable, and did not adjustto its redemption value of $0.4 million as a result.of September 30, 2018. KREF presents the SNVPS as “Temporary Equity — Redeemable preferred stock” in the accompanying Condensed Consolidated Balance Sheets (Note 7)8).
Income Recognition
Interest Income — Loans where management expects to collect all contractually required principal and interest payments are considered performing loans. KREF accrues interest income on performing loans based on the outstanding principal amount
KKR Real Estate Finance Trust Inc.
Notes to Condensed Consolidated Financial Statements (Unaudited)
(dollars in tables in thousands, except per share amounts)
and contractual terms of the loan. Interest income also includes origination fees and direct loan origination costs for loans that KREF originates, but where management did not elect the fair value option, as a yield adjustment using the interest method over the loan term, or on a straight line basis when it approximates the interest method. KREF expenses origination fees and direct loan origination costs for loans acquired, but not originated, by KREF as well as loans for which management elected the fair value option, as incurred.
Realized Gain (Loss) on Sale of Investments — KREF recognizes the excess, or deficiency, of net proceeds received, less the net carrying value of such investments, as realized gains or losses, respectively. KREF reverses cumulative, unrealized gains or losses previously reported in its Condensed Consolidated Statements of Income with respect to the investment sold at the time of sale.
KKR Real Estate Finance Trust Inc.
Notes to Condensed Consolidated Financial Statements (Unaudited)
(dollars in tables in thousands, except per share amounts)
Expense Recognition
Loan Impairment — KREF holds commercial mortgage loans for both investment and sale, which management periodically evaluates for impairment.
Commercial Mortgage Loans, Held-For-Investment — For each loan in KREF's portfolio, management performs a quarterly evaluation of impairment indicators of loans classified as held‑for‑investment using applicable loan, property, market and sponsor information obtained from borrowers, loan servicers and local market participants. Such indicators may include the net present value of the underlying collateral, property operating cash flows, the sponsor’s financial wherewithal and competency in managing the property, macroeconomic trends, and property submarket-specific economic factors. The evaluation of these indicators of impairment requires significant judgment by management to determine whether failure to collect contractual amounts is probable.
If management deems that it is probable that KREF will be unable to collect all amounts owed according to the contractual terms of a loan, impairment of that loan is indicated. If management considers a loan to be impaired, management establishes an allowance for loan losses, through a valuation provision in earnings, which reduces the carrying value of the loan to the present value of expected future cash flows discounted at the loan’s contractual effective rate or the fair value of the collateral, if repayment is expected solely from the collateral. Significant judgment is required in determining impairment and in estimating the resulting loss allowance, and actual losses, if any, could materially differ from those estimates.
Management considers loans to be past due when a monthly payment is due and unpaid for 60 days or more. Loans are placed on nonaccrual status and considered non-performing when full payment of principal and interest is in doubt, which generally occurs when principal or interest is 120 days or more past due unless the loan is both well secured and in the process of collection. Management may return a loan to accrual status when repayment of principal and interest is reasonably assured under the terms of the restructured loan. As of March 31,September 30, 2018, KREF did not hold any loans that management placed on nonaccrual status or otherwise considered past due.
In addition to reviewing commercial mortgage loans held-for-investment for impairment, the Manager evaluates KREF's commercial mortgage loans to determine if an allowance for loan loss should be established. In conjunction with this review, the Manager assesses the risk factors of each loan, and assigns a risk rating based on a variety of factors, including, without limitation, underlying real estate performance and asset value, values of comparable properties, durability and quality of property cash flows, sponsor experience and financial wherewithal, and the existence of a risk-mitigating loan structure. Additional key considerations include loan-to-value ratios, debt service coverage ratios, loan structure, real estate and credit market dynamics, and risk of default or principal loss. Based on a five-point scale, KREF's loans are rated "1" through "5," from less risk to greater risk, which ratings are defined as follows:
1—Very Low Risk—The underlying property performance has surpassed underwritten expectations, and the sponsor’s business plan is generally complete. The property demonstrates stabilized occupancy and/or rental rates resulting in strong current cash flow and/or a very low loan-to-value ratio (<65%). At the level of performance, it is very likely that the underlying loan can be refinanced easily in the period’s prevailing capital market conditions.
2—Low Risk—The underlying property performance has matched or exceeded underwritten expectations, and the sponsor’s business plan may be ahead of schedule or has achieved some or many of the major milestones from a risk mitigation perspective. The property has achieved improving occupancy at market rents, resulting in sufficient current cash flow and/or a low loan-to-value ratio (65%-70%). Operating trends are favorable, and the underlying loan can be
KKR Real Estate Finance Trust Inc.
Notes to Condensed Consolidated Financial Statements (Unaudited)
(dollars in tables in thousands, except per share amounts)
refinanced in today’s prevailing capital market conditions. The sponsor/manager is well capitalized or has demonstrated a history of success in owning or operating similar real estate.
3—Average Risk—The underlying property performance is in-line with underwritten expectations, or the sponsor may be in the early stages of executing its business plan. Current cash flow supports debt service payments, or there is an ample interest reserve or loan structure in place to provide the sponsor time to execute the value-improvement plan. The property exhibits a moderate loan-to-value ratio (<75%). Loan structure appropriately mitigates additional risks. The sponsor/manager has a stable credit history and experience owning or operating similar real estate.
4—High Risk/Potential for Loss: A loan that has a risk of realizing a principal loss. The underlying property performance is behind underwritten expectations, or the sponsor is behind schedule in executing its business plan. The
KKR Real Estate Finance Trust Inc.
Notes to Condensed Consolidated Financial Statements (Unaudited)
(dollars in tables in thousands, except per share amounts)
underlying market fundamentals may have deteriorated, comparable property valuations may be declining or property occupancy has been volatile, resulting in current cash flow that may not support debt service payments. The loan exhibits a high loan-to-value ratio (>80%), and the loan covenants are unlikely to fully mitigate some risks. Interest payments may come from an interest reserve or sponsor equity.
5—Impaired/Loss Likely: A loan that has a very high risk of realizing a principal loss or has otherwise incurred a principal loss. The underlying property performance is significantly behind underwritten expectations, the sponsor has failed to execute its business plan and/or the sponsor has missed interest payments. The market fundamentals have deteriorated, or property performance has unexpectedly declined or valuations for comparable properties have declined meaningfully since loan origination. Current cash flow does not support debt service payments. With the current capital structure, the sponsor might not be incentivized to protect its equity without a restructuring of the loan. The loan exhibits a very high loan-to-value ratio (>90%), and default may be imminent.
Commercial Mortgage Loans, Held-For-Sale — For commercial mortgage loans held-for-sale, KREF applies the lower of cost or fair value accounting and may be required, from time to time, to record a nonrecurring fair value adjustment.
Interest Expense — Management expenses contractual interest due in accordance with KREF's financing agreements as incurred.
Deferred Debt Issuance Costs — Management capitalizes and amortizes deferred debt facility costs incurred when entering repurchase agreements on a straight-line basis over the expected term of the facility and incremental costs incurred when KREF draws on those facilities using the interest method over the expected term of the draw, or on a straight line basis when it approximates the interest method. KREF presents such expensed amounts, as well as deferred amounts written off, as additional interest expense in its Condensed Consolidated Statements of Income.
General and Administrative Expenses — Management expenses general and administrative costs, including legal, diligence and audit fees; information technology costs; insurance premiums; and other costs as incurred.
Management and Incentive Compensation to Affiliate — Management expenses compensation earned by the Manager on a quarterly basis in accordance with the Management Agreement (Note 10)11).
Income Taxes — Certain activities of KREF are conducted through joint ventures formed as limited liability companies, taxed as partnerships, and consolidated by KREF. Some of these joint ventures are subject to state and local income taxes (Note 12)13).
As of March 31,September 30, 2018 and December 31, 2017, KREF did not have any material deferred tax assets or liabilities arising from future tax consequences attributable to differences between the carrying amounts of existing assets and liabilities in accordance with GAAP and their respective tax bases.
KREF recognizes tax benefits for uncertain tax positions only if it is more likely than not that the position is sustainable based on its technical merits. Interest and penalties on uncertain tax positions are included as a component of the provision for income taxes in KREF's Condensed Consolidated Statements of Income. As of March 31,September 30, 2018, KREF did not have any material uncertain tax positions.
KKR Real Estate Finance Trust Inc.
Notes to Condensed Consolidated Financial Statements (Unaudited)
(dollars in tables in thousands, except per share amounts)
Stock-Based Compensation
KREF’sKREF's stock-based compensation consists of awards issued to employees of the Manager or its affiliates that vest over the life of the awards, as well as restricted stock units issued to certain members of KREF's board of directors. KREFThe Company early adopted ASU No. 2018-07, Improvement to Nonemployee Share-based Payment Accounting upon its issuance in June 2018. Accordingly, the Company recognizes the compensation cost of stock-based awards to employees of the Manager or its affiliates on a straight-line basis over the awards’ term at the then-currenttheir grant date fair value at each reporting date. KREF amortizes the grant-date fair value of stock-based awards to certain members of its board of directors on a straight-line basis over the awards’ term.value.
Upon the adoption of ASU 2016-09, Compensation—Stock CompensationImprovements to Employee Share-Based Payment Accounting (Topic 718)., KREF elected to account for forfeitures as they occur. Refer to Note 89 for additional information.
KKR Real Estate Finance Trust Inc.
Notes to Condensed Consolidated Financial Statements (Unaudited)
(dollars in tables in thousands, except per share amounts)
Earnings per Share
Diluted earnings per share, or Diluted EPS, is determined using the treasury stock method, and is based on the net earnings attributable to common stockholders, including restricted stock units, divided by the weighted-average number of shares of common stock, including restricted stock units. Refer to Note 78 for additional discussion of earnings per share.
KREF presents basic and diluted earnings per share ("EPS"). Basic EPS, or Net Income (Loss) Per Share of Common Stock, Basic, is calculated by dividing Net Income (Loss) Attributable to Common Stockholders by the Basic Weighted Average Number of Shares of Common Stock Outstanding, for the period.
Diluted EPS, or Net Income (Loss) Per Share of Common Stock, Diluted, is calculated by starting with Basic EPS and adding the weighted average dilutive shares issuable from restricted stock units, computed using the treasury stock method, to the weighted average common shares outstanding in the denominator.
Recent Accounting Pronouncements
In May 2014, the Financial Accounting Standards Board ("FASB") issued ASU No. 2014-09, Revenues from Contracts with Customers (Topic 606). The standard’s core principle is that a company will recognize revenue when it transfers promised goods or services to customers in an amount that reflects the consideration to which it expects to be entitled in exchange for those goods or services. In doing so, companies will need to use more judgment and make more estimates than under current guidance. These may include identifying performance obligations in the contract, estimating the amount of variable consideration to include in the transaction price and allocating the transaction price to each separate performance obligation. In adopting ASU 2014-09, entities have the option of using either a full retrospective or a modified approach to adopt the guidance in the ASU. KREF has adopted the modified approach. The adoption of this ASU beginning in the first quarter of 2018 did not have a material impact on the Company's condensed consolidated financial statements.
In January 2016, the FASB issued ASU No. 2016-01, Financial Instruments - Overall (Subtopic 825-10) - Recognition and Measurement of Financial Assets and Financial Liabilities. The standard: (i) requires that certain equity investments be measured at fair value, and modifies the assessment of impairment for certain other equity investments, (ii) changes certain disclosure requirements related to the fair value of financial instruments measured at amortized cost, (iii) changes certain disclosure requirements related to liabilities measured at fair value, (iv) requires separate presentation of financial assets and financial liabilities by measurement category and form of financial asset, and (v) clarifies that an entity should evaluate the need for a valuation allowance on a deferred tax asset related to available-for-sale securities in combination with the entity’s other deferred tax assets. An entity should apply ASU No. 2016-01 by means of a cumulative-effect adjustment to the balance sheet as of the beginning of the fiscal year of adoption. The adoption of ASU No. 2016-01 beginning in the first quarter of 2018 did not have a material impact on the Company's condensed consolidated financial statements.
In March 2016, the FASB issued ASU 2016-09, Improvements to Employee Share-Based Payment Accounting (Topic 718). ASU 2016-09 requires all income tax effects of share-based payment awards to be recognized in the income statement when the awards vest or are settled. It also allows an employer to repurchase more of an employee’s shares for tax withholding purposes than is permitted under current guidance without triggering liability accounting. Finally, the guidance allows a policy election to account for employee forfeitures as they occur. The guidance is effective for annual periods beginning after December 15, 2016, and interim periods within those annual periods. In 2017, KREF adopted this guidance and determined there was no material impact on the Company's condensed consolidated financial statements.
In June 2016, the FASB issued ASU No. 2016-13, Financial Instruments - Credit Losses. The standard amends the existing credit loss model to reflect a reporting entity's current estimate of all expected credit losses and requires a financial asset (or a group of financial assets) measured at amortized cost basis to be presented at a net amount expected to be collected through deduction of an allowance for credit losses from the amortized cost basis of the financial asset(s). ASU No. 2016-13 is effective for KREF in the first quarter of 2020. Early adoption is permitted beginning in the first quarter of 2019. While KREF is currently evaluating the impact that ASU 2016-13 will have on KREF's condensed consolidated financial statements, we expect that the adoption will result in an increased amount of provisions for potential loan losses as well as the recognition of such
KKR Real Estate Finance Trust Inc.
Notes to Condensed Consolidated Financial Statements (Unaudited)
(dollars in tables in thousands, except per share amounts)
provisions earlier in the credit cycle. KREF currently does not have any provision for loan losses recorded on the condensed consolidated financial statements.
In June 2018, the FASB issued ASU No. 2018-07, Improvements to Nonemployee Share-Based Payment Accounting. The standard aligns the measurement and classification guidance for share-based payments to nonemployees with the guidance for share-based payments to employees, with certain exceptions. Under the guidance, the measurement of equity-classified nonemployee awards will be fixed at the grant date. ASU No. 2018-07 is effective for public companies in the first quarter of 2019 with early adoption permitted. KREF early adopted this ASU upon its issuance to simplify its accounting for share-based payments to employees of the Manager or its affiliates. The adoption of this ASU did not have a material impact on the Company's condensed consolidated financial statements.
KKR Real Estate Finance Trust Inc.
Notes to Condensed Consolidated Financial Statements (Unaudited)
(dollars in tables in thousands, except per share amounts)
Note 3. Commercial Mortgage Loans
The following table summarizes KREF's investments in commercial mortgage loans as of March 31,September 30, 2018 and December 31, 2017:
| | | | | | | | | | | Weighted Average | | | | | | | | Weighted Average |
| Loan Type | | Outstanding Face Amount | | Carrying Value | | Loan Count | | Floating Rate Loan %(A) | | Coupon(A) | | Life (Years)(B) | | Outstanding Face Amount | | Carrying Value | | Loan Count | | Floating Rate Loan %(A) | | Coupon(A) | | Life (Years)(B) |
| March 31, 2018 | | | | | | | | | | | | |
| September 30, 2018 | | | | | | | | | | | | |
| Loans held-for-investment | | | | | | | | | | | | | | | | | | | | | | |
Senior loans(C) | | $ | 2,216,019 |
| | $ | 2,201,709 |
| | 23 |
| | 100.0 | % | | 5.9 | % | | 3.7 | | $ | 3,226,649 |
| | $ | 3,206,484 |
| | 27 |
| | 100.0 | % | | 5.8 | % | | 3.8 |
Mezzanine loans(D) | | 71,730 |
| | 71,481 |
| | 9 |
| | 63.4 |
| | 11.5 |
| | 4.2 | | 55,535 |
| | 55,394 |
| | 8 |
| | 52.8 |
| | 11.8 |
| | 4.3 |
| | | $ | 2,287,749 |
| | $ | 2,273,190 |
| | 32 |
| | 98.9 |
| | 6.0 |
| | 3.7 | | $ | 3,282,184 |
| | $ | 3,261,878 |
| | 35 |
| | 99.2 | % | | 5.9 | % | | 3.9 |
| December 31, 2017 | | | | | | | | | | | | | | | | | | | | | | |
| Loans held-for-investment | | | | | | | | | | | | | | | | | | | | | | |
Senior loans(C) | | $ | 1,794,963 |
| | $ | 1,782,054 |
| | 18 |
| | 100.0 | % | | 5.8 | % | | 3.7 | | $ | 1,794,963 |
| | $ | 1,782,054 |
| | 18 |
| | 100.0 | % | | 5.8 | % | | 3.7 |
Mezzanine loans(D) | | 106,730 |
| | 106,456 |
| | 10 |
| | 75.4 |
| | 11.3 |
| | 3.7 | | 106,730 |
| | 106,456 |
| | 10 |
| | 75.4 |
| | 11.3 |
| | 3.7 |
| | | $ | 1,901,693 |
| | $ | 1,888,510 |
| | 28 |
| | 98.6 |
| | 6.1 |
| | 3.7 | | $ | 1,901,693 |
| | $ | 1,888,510 |
| | 28 |
| | 98.6 | % | | 6.1 | % | | 3.7 |
| |
| (A) | Average weighted by outstanding face amount of loan. Weighted average coupon assumes applicable one-month LIBOR rates of 1.88%2.26% and 1.56% as of March 31,September 30, 2018 and December 31, 2017, respectively. |
| |
| (B) | The weighted average life of each loan is based on the expected timing of the receipt of contractual cash flows assuming all extension options are exercised by the borrower. |
| |
| (C) | Senior loans may include accommodation mezzanine loans in connection with the senior mortgage financing. Includes loan participations sold with a face amount of $82.0$83.9 million and $82.0 million, and a carrying value of $81.5$83.5 million and $81.5 million as of March 31,September 30, 2018 and December 31, 2017, respectively. |
| |
| (D) | A joint venture consolidated as a VIE in which a third party owns aIn June 2018, KREF acquired the 5.0% redeemable noncontrolling interest (Note 6) holdsin the Mezzanine JV that held six commercial mezzanine loans, held-for-investment, with a $26.2 million outstanding face amount and carrying value as of March 31,September 30, 2018. This joint ventureThe Mezzanine JV held seven commercial mezzanine loans, held-for-investment, with a $61.2 million outstanding face amount and carrying value as of December 31, 2017. |
Activity — For the threenine months ended March 31,September 30, 2018, the loan portfolio activity was as follows:
| | | | | Held-for-Investment | | Held-for-Sale | | Total | | Held-for-Investment | | Held-for-Sale | | Total |
| Balance at December 31, 2017 | | $ | 1,888,510 |
| | $ | — |
| | $ | 1,888,510 |
| | $ | 1,888,510 |
| | $ | — |
| | $ | 1,888,510 |
|
Purchases and originations, net(A) | | 418,290 |
| | — |
| | 418,290 |
| | 1,697,074 |
| | — |
| | 1,697,074 |
|
| Proceeds from principal repayments | | (35,000 | ) | | — |
| | (35,000 | ) | | (330,939 | ) | | — |
| | (330,939 | ) |
Accretion of loan discount and other amortization, net(B) | | 1,390 |
| | — |
| | 1,390 |
| | 7,233 |
| | — |
| | 7,233 |
|
| Balance at March 31, 2018 | | $ | 2,273,190 |
| | $ | — |
| | $ | 2,273,190 |
| |
| Balance at September 30, 2018 | | | $ | 3,261,878 |
| | $ | — |
| | $ | 3,261,878 |
|
| |
| (A) | Net of applicable premiums, discounts and deferred loan origination costs. |
| |
| (B) | Includes accretion of applicable discounts and deferred loan origination costs. |
As of March 31,September 30, 2018 and December 31, 2017, there was $14.6$20.3 million and $13.2 million, respectively, of unamortized deferred loan fees and discounts included in commercial mortgage loans, held-for-investment, net on the condensed consolidated balance sheets.Condensed Consolidated Balance Sheets.
KKR Real Estate Finance Trust Inc.
Notes to Condensed Consolidated Financial Statements (Unaudited)
(dollars in tables in thousands, except per share amounts)
Loan Risk Ratings — As further described in Note 2, our Manager evaluates KREF's commercial mortgage loan portfolio on a quarterly basis. In conjunction with the quarterly commercial mortgage loan portfolio review, KREF's Manager assesses the risk factors of each loan, and assigns a risk rating based on a variety of factors. Loans are rated “1” (very low risk) through “5” Impaired/Loss Likely), which ratings are defined in Note 2. The following table allocates the principal balance and net book value of the loan portfolio based on KREF's internal risk ratings:
| | | March 31, 2018 | | December 31, 2017 | |
| September 30, 2018 | | September 30, 2018 | | December 31, 2017 |
| Risk Rating | | Number of Loans | | Net Book Value | | Total Loan Exposure(A) | | Risk Rating | | Number of Loans | | Net Book Value | | Total Loan Exposure(A) | | Number of Loans | | Net Book Value | | Total Loan Exposure(A) | | Risk Rating | | Number of Loans | | Net Book Value | | Total Loan Exposure(A) |
| 1 | | — |
| | $ | — |
| | $ | — |
| | 1 | | — |
| | $ | — |
| | $ | — |
| | — |
| | $ | — |
| | $ | — |
| | 1 | | — |
| | $ | — |
| | $ | — |
|
| 2 | | 4 |
| | 161,659 |
| | 162,570 |
| | 2 | | 4 |
| | 155,092 |
| | 156,123 |
| | 8 |
| | 446,525 |
| | 448,821 |
| | 2 | | 4 |
| | 155,092 |
| | 156,123 |
|
| 3 | | 27 |
| | 2,095,105 |
| | 2,172,308 |
| | 3 | | 23 |
| | 1,717,000 |
| | 1,792,022 |
| | 27 |
| | 2,815,353 |
| | 2,899,972 |
| | 3 | | 23 |
| | 1,717,000 |
| | 1,792,022 |
|
| 4 | | 1 |
| | 16,426 |
| | 16,500 |
| | 4 | | 1 |
| | 16,418 |
| | 16,500 |
| | — |
| | — |
| | — |
| | 4 | | 1 |
| | 16,418 |
| | 16,500 |
|
| 5 | | — |
| | — |
| | — |
| | 5 | | — |
| | — |
| | — |
| | — |
| | — |
| | — |
| | 5 | | — |
| | — |
| | — |
|
| | | 32 |
| | $ | 2,273,190 |
| | $ | 2,351,378 |
| | 28 |
| | $ | 1,888,510 |
| | $ | 1,964,645 |
| | 35 |
| | $ | 3,261,878 |
| | $ | 3,348,793 |
| | 28 |
| | $ | 1,888,510 |
| | $ | 1,964,645 |
|
| |
| (A) | In certain instances, we finance our loans through the non-recourse sale of a senior interest that is not included in our consolidated financial statements. Total loan exposure includes the entire loan we originated and financed, including $63.6$66.6 million and $63.0 million of such non-consolidated interests as of March 31,September 30, 2018 and December 31, 2017, respectively. |
As of March 31,September 30, 2018, the average risk rating of KREF's portfolio was 2.9 (Average Risk), weighted by investment carrying value, with 99.3%100.0% of commercial mortgage loans held-for-investment, rated 3 (Average Risk) or better by KREF's Manager as compared to 2.9 (Average Risk) as of December 31, 2017.
Concentration of Credit Risk — The following tables present the geographies and property types of collateral underlying KREF's commercial mortgage loans as a percentage of the loans' carrying values, net of noncontrolling interests:
Loans Held-for-Investment
| | | | | March 31, 2018 | | December 31, 2017 | | March 31, 2018 | | December 31, 2017 | | September 30, 2018 | | December 31, 2017 | | September 30, 2018 | | December 31, 2017 |
| Geography | Geography | |
| | Collateral Property Type | |
| Geography | |
| | Collateral Property Type | |
|
| New York | | 32.3 | % | | 29.3 | % | | Office | | 42.2 | % | | 41.7 | % | | 25.4 | % | | 29.3 | % | | Office | | 53.0 | % | | 41.7 | % |
| Georgia | | | 13.3 |
| | 11.0 |
| | Multifamily | | 33.3 |
| | 24.7 |
|
| Washington | | | 10.2 |
| | — |
| | Condo (Residential) | | 5.6 |
| | 10.8 |
|
| California | | 12.7 |
| | 14.9 |
| | Multifamily | | 31.3 |
| | 24.7 |
| | 9.2 |
| | 14.9 |
| | Industrial | | 4.0 |
| | 6.8 |
|
| Georgia | | 9.3 |
| | 11.0 |
| | Retail | | 11.6 |
| | 13.8 |
| |
| Minnesota | | 9.1 |
| | 7.0 |
| | Condo (Residential) | | 9.0 |
| | 10.8 |
| | 6.8 |
| | 7.0 |
| | Retail | | 3.9 |
| | 13.8 |
|
| Florida | | | 5.9 |
| | 2.2 |
| | Hospitality | | 0.2 |
| | 2.2 |
|
| Massachusetts | | | 5.9 |
| | — |
| | Total | | 100.0 | % | | 100.0 | % |
| New Jersey | | 6.0 |
| | 7.1 |
| | Industrial | | 5.6 |
| | 6.8 |
| | 4.4 |
| | 7.1 |
| | | | |
| Pennsylvania | | | 4.3 |
| | — |
| | | | |
| Oregon | | 5.2 |
| | 6.3 |
| | Hospitality | | 0.3 |
| | 2.2 |
| | 3.7 |
| | 6.3 |
| | | | |
| Hawaii | | 4.4 |
| | 5.3 |
| | Total | | 100.0 | % | | 100.0 | % | | 3.1 |
| | 5.3 |
| | | | |
| Colorado | | 4.2 |
| | 5.1 |
| | | | | | 2.9 |
| | 5.1 |
| | | | |
| Washington D.C. | | 3.8 |
| | 4.2 |
| | | | | | 2.8 |
| | 4.2 |
| | | | |
| Washington | | 3.4 |
| | — |
| | | | | |
| Florida | | 3.3 |
| | 2.2 |
| | | | | |
| Texas | | 2.8 |
| | 3.4 |
| | | | | |
| Tennessee | | 2.3 |
| | 2.8 |
| | | | | | 1.6 |
| | 2.8 |
| | | | |
| Illinois | | 0.7 |
| | 0.9 |
| | | | | |
| Other U.S. | | 0.5 |
| | 0.5 |
| | | | | | 0.5 |
| | 4.8 |
| | | | |
| Total | | 100.0 | % | | 100.0 | % | | | | | | 100.0 | % | | 100.0 | % | | | | |
KKR Real Estate Finance Trust Inc.
Notes to Condensed Consolidated Financial Statements (Unaudited)
(dollars in tables in thousands, except per share amounts)
Note 4. Debt Obligations
The following table summarizes KREF's secured financingmaster repurchase agreements and other consolidated debt obligations in place as of March 31,September 30, 2018 and December 31, 2017:
| | | | | March 31, 2018 | | December 31, 2017 | | September 30, 2018 | | December 31, 2017 |
| | | Facility | | Collateral | | Facility | | Facility | | Collateral | | Facility |
| | | | | | | | | | Weighted Average(B) | | | | | | | |
| | | | | | | | | | | Weighted Average(B) | | | | | | | |
| | |
| | | Month Issued | | Outstanding Face Amount | | Carrying Value(A) | | Maximum Facility Size | | Final Stated Maturity | | Funding Cost | | Life (Years) | | Outstanding Face Amount | | Amortized Cost Basis | | Carrying Value | | Weighted Average Life (Years)(C) | | Carrying Value(A) | | Month Issued | | Outstanding Face Amount | | Carrying Value(A) | | Maximum Facility Size | | Final Stated Maturity | | Funding Cost | | Life (Years) | | Outstanding Face Amount | | Amortized Cost Basis | | Carrying Value | | Weighted Average Life (Years)(C) | | Carrying Value(A) |
| Secured Financing Agreements | | | | | | | | | | | | | | | | | | | | | | |
Master Repurchase Agreements(D) | Master Repurchase Agreements(D) | | | | | | | | | | | | | | | Master Repurchase Agreements(D) | | | | | | | | | | | | | | |
Wells Fargo(E) | | Oct 2015 | | $ | 597,000 |
| | $ | 593,838 |
| | $ | 750,000 |
| | Apr 2022 | | 4.1 | % | | 1.9 | | $ | 844,809 |
| | $ | 839,505 |
| | $ | 839,505 |
| | 3.8 | | $ | 482,146 |
| | Oct 2015 | | $ | 791,297 |
| | $ | 787,487 |
| | $ | 1,000,000 |
| | Apr 2022 | | 4.4 | % | | 1.8 | | $ | 1,096,789 |
| | $ | 1,090,273 |
| | $ | 1,090,273 |
| | 3.9 | | $ | 482,146 |
|
Morgan Stanley(F) | | Dec 2016 | | 554,347 |
| | 552,994 |
| | 600,000 |
| | Dec 2021 | | 4.2 |
| | 1.9 | | 829,017 |
| | 823,482 |
| | 823,482 |
| | 3.6 | | 421,904 |
| | Dec 2016 | | 483,558 |
| | 482,064 |
| | 600,000 |
| | Dec 2021 | | 4.6 |
| | 1.5 | | 709,123 |
| | 705,658 |
| | 705,658 |
| | 3.2 | | 421,904 |
|
Goldman Sachs(G) | | Sep 2016 | | 135,750 |
| | 135,750 |
| | 400,000 |
| | Oct 2020 | | 4.1 |
| | 1.5 | | 219,394 |
| | 217,695 |
| | 217,695 |
| | 4.5 | | 60,750 |
| | Sep 2016 | | 268,709 |
| | 268,709 |
| | 400,000 |
| | Oct 2020 | | 4.4 |
| | 1.4 | | 362,191 |
| | 359,960 |
| | 359,960 |
| | 4.3 | | 60,750 |
|
| Asset Specific Financing | | Asset Specific Financing | | | | | | | | | | | | | | |
BMO Facility(H) | | | Aug 2018 | | — |
| | (316 | ) | | 200,000 |
| | n.a | | 0.2 |
| | 0.0 | | — |
| | — |
| | — |
| | 0.0 | | — |
|
| Revolving Credit Agreement | Revolving Credit Agreement | | | | | | | | | | | | | | | | | Revolving Credit Agreement | | | | | | | | | | | | | | | | |
Barclays(H) | | May 2017 | | — |
| | — |
| | 75,000 |
| | May 2020 | | 1.5 |
| | 0.0 | | n.a. |
| | n.a. |
| | n.a. |
| | n.a. | | — |
| |
Barclays(I) | | | May 2017 | | — |
| | — |
| | 75,000 |
| | May 2020 | | 1.1 |
| | 0.0 | | n.a. |
| | n.a. |
| | n.a. |
| | n.a. | | — |
|
| | | 1,287,097 |
| | 1,282,582 |
| | 1,825,000 |
| | 4.2 | % | | 1.8 | | | | | | | | 964,800 |
| | 1,543,564 |
| | 1,537,944 |
| | 2,275,000 |
| | 4.4 | % | | 1.6 | | 2,168,103 |
| | 2,155,891 |
| | 2,155,891 |
| | 964,800 |
|
| VIE Liabilities | VIE Liabilities | | | | | | | | | | | | | | | | VIE Liabilities | | | | | | | | | | | | | | | |
CMBS(I) | | Various | | 4,985,276 |
| | 5,157,430 |
| | n.a. |
| | Mar 2048 to Feb 2049 | | 4.4 | % | | 6.9 | | 5,294,435 |
| | n.a. |
| | 5,278,715 |
| | 6.9 | | 5,256,926 |
| |
CMBS(J) | | | Various | | 1,095,731 |
| | 1,086,939 |
| | n.a. |
| | May 2048 to Feb 2049 | | 4.4 | % | | 6.3 | | 1,130,672 |
| | n.a. |
| | 1,100,089 |
| | 6.3 | | 5,256,926 |
|
| | | 4,985,276 |
| | 5,157,430 |
| | n.a. |
| | 4.4 |
| | 6.9 | | | | | | | | 5,256,926 |
| | 1,095,731 |
| | 1,086,939 |
| | n.a. |
| | 4.4 |
| | 6.3 | | | | | | | | 5,256,926 |
|
| Total / Weighted Average | Total / Weighted Average | | $ | 6,272,373 |
| | $ | 6,440,012 |
| | $ | 1,825,000 |
| | 4.4 | % | | 5.9 | | | | | | | | $ | 6,221,726 |
| Total / Weighted Average | | $ | 2,639,295 |
| | $ | 2,624,883 |
| | $ | 2,275,000 |
| | 4.4 | % | | 3.6 | | | | | | | | $ | 6,221,726 |
|
| |
| (A) | Net of $4.5$5.6 million and $4.5 million unamortized debt issuance costs as of March 31,September 30, 2018 and December 31, 2017, respectively. |
| |
| (B) | Average weighted by the outstanding face amount of borrowings. |
| |
| (C) | Average based on the fully extended loan maturity, weighted by the outstanding face amount of the collateral. |
| |
| (D) | Borrowings under these repurchase agreements are collateralized by senior loans, held-for-investment, and bear interest equal to the sum of (i) a floating rate index, equal to one-month LIBOR, subject to certain floors of not less than zero, or an index approximating LIBOR, and (ii) a margin, based on the collateral. As of March 31,September 30, 2018 and December 31, 2017, the percentage of the outstanding face amount of the collateral sold and not borrowed under these repurchase agreements, or average "haircut" weighted by outstanding face amount of collateral, was 32.0%28.8% and 32.9%, respectively (or 26.4%25.6% and 27.3%, respectively, if KREF had borrowed the maximum amount approved by its repurchase agreement counterparties as of such dates). |
| |
| (E) | The current stated maturity of the facility is April 2020, which does not reflect two, twelve-month facility term extensions available to KREF, which is contingent upon certain covenants and thresholds. In September 2018, KREF and Wells Fargo Bank, National Association ("Wells Fargo") amended the master repurchase agreement to increase the maximum facility size from $750.0 million to $1,000.0 million. As of March 31,September 30, 2018, the collateral-based margin was between 1.75%1.50% and 2.15%. |
| |
| (F) | In November 2017, KREF and Morgan Stanley Bank, N.A. ("Morgan Stanley") amended and restated the master repurchase agreement to extend the facility maturity date and to increase the maximum facility size from $500.0 million to $600.0 million and, subject to customary conditions, permits KREF to request the facility be further increased to $750.0 million. The current stated maturity of the facility is December 2020, which does not reflect one, twelve-month facility term extension available to KREF, which is contingent upon certain covenants and thresholds and, even if such covenants and thresholds are satisfied, is at the sole discretion of Morgan Stanley. As of March 31,September 30, 2018, the collateral-based margin was between 2.00% and 2.45%. |
| |
| (G) | In November 2017,July 2018, KREF and Goldman Sachs Bank USA ("Goldman Sachs") amended andthe November 2017 restated the master repurchasepurchase agreement to extend the facility maturity datemodify certain terms and to increase the maximum facility size from $250.0 million to $400.0 million.provisions. The amended and restated facility includes a $250.0$350.0 million term facility with a maturity date of October 2020 and a $150.0$50.0 million swingline facility with a revolving period of one year, and a three-year term on a per-asset basis as those assets are pledged to the facility. As of March 31,September 30, 2018, the carrying value excluded $1.1$1.5 million unamortized debt issuance costs presented as " — Other assets" in KREF's Condensed Consolidated Balance Sheets. As of March 31,September 30, 2018, the collateral-based margin was between 1.70% and 2.00%. |
(H) In August 2018, KREF entered into a $200.0 million loan financing facility with BMO Harris Bank ("BMO Facility") with a third party lender. The facility provides asset-based financing on a non-mark to market basis with matched-term up to five years with partial recourse to KREF. There were no amounts outstanding on this facility as of September 30, 2018.
| |
(H)(I) | In May 2017, KREF entered into a $75.0 million corporate secured revolving credit facility administered by Barclays Bank PLC ("Barclays "). The current stated maturity of the facility is May 2019, which does not reflect one, twelve-month facility term extension available to KREF at the discretion of Barclays. Borrowings under the facility bear interest at a per annum rate equal to the sum of (i) a floating rate index and (ii) a fixed margin. Amounts borrowed under this facility are 100% recourse to KREF. As of March 31,September 30, 2018, the carrying value excluded $1.1$0.8 million unamortized debt issuance costs presented as " — Other assets" in KREF's Condensed Consolidated Balance Sheets. |
| |
(I)(J) | Facility amounts represent consolidated CMBS issued by five trusts that KREF consolidates, buttrust(s) that are not beneficially owned by KREF's stockholders. The facility and collateral carrying amounts included $18.7$3.8 million accrued interest payable and $19.8$4.0 million accrued interest receivable as of March 31,September 30, 2018. As of December 31, 2017, the facility and collateral carrying amounts included $18.7 million accrued interest payable and $19.7 million accrued interest receivable. The final stated maturity date represents the rated final distribution date of CMBS issued by trusts that KREF consolidates, but that are not beneficially owned by KREF's stockholders. Refer to Note 67 for additional discussion of KREF's VIE assets and liabilities. See Note 13 for activities subsequent to March 31, 2018. |
The preceding table excludes loan participations sold (Note 5)6).
KKR Real Estate Finance Trust Inc.
Notes to Condensed Consolidated Financial Statements (Unaudited)
(dollars in tables in thousands, except per share amounts)
As of March 31,September 30, 2018 and December 31, 2017, KREF had outstanding repurchase agreements where the amount at risk with any individual counterparty, or group of related counterparties, exceeded 10.0% of KREF’s stockholders' equity. The amount at risk under repurchase agreements is the net counterparty exposure, defined as the excess of the carrying amount (or market value, if higher than the carrying amount) of the assets sold under agreement to repurchase, including accrued interest plus any cash or other assets on deposit to secure the repurchase obligation, over the amount of the repurchase liability, adjusted for accrued interest. The following table summarizes certain characteristics of KREF's repurchase agreements where the amount at risk with any individual counterparty, or group of related counterparties, exceeded 10.0% of KREF’s stockholders' equity as of March 31,September 30, 2018 and December 31, 2017:
| | | | | Outstanding Face Amount | | Net Counterparty Exposure | | Percent of Stockholders' Equity | | Weighted Average Life (Years)(A) | | Outstanding Face Amount | | Net Counterparty Exposure | | Percent of Stockholders' Equity | | Weighted Average Life (Years)(A) |
| March 31, 2018 | | | | | | | | |
| September 30, 2018 | | | | | | | | |
| Wells Fargo | | $ | 597,000 |
| | $ | 247,062 |
| | 23.5 | % | | 1.9 | | $ | 791,297 |
| | $ | 304,871 |
| | 26.6 | % | | 1.8 |
| Morgan Stanley | | 554,347 |
| | 271,963 |
| | 25.9 |
| | 1.9 | | 483,558 |
| | 224,557 |
| | 19.6 |
| | 1.5 |
| Total / Weighted Average | | $ | 1,151,347 |
| | $ | 519,025 |
| | 49.4 | % | | 1.9 | | $ | 1,274,855 |
| | $ | 529,428 |
| | 46.2 | % | | 1.7 |
| December 31, 2017 | | | | | | | | | | | | | | |
| Wells Fargo | | $ | 485,250 |
| | $ | 203,303 |
| | 19.2 | % | | 1.6 | | $ | 485,250 |
| | $ | 203,303 |
| | 19.2 | % | | 1.6 |
| Morgan Stanley | | 423,347 |
| | 251,463 |
| | 23.7 |
| | 2.0 | | 423,347 |
| | 251,463 |
| | 23.7 |
| | 2.0 |
| Total / Weighted Average | | $ | 908,597 |
| | $ | 454,766 |
| | 42.9 | % | | 1.8 | | $ | 908,597 |
| | $ | 454,766 |
| | 42.9 | % | | 1.8 |
| |
| (A) | Average weighted by the outstanding face amount of borrowings under the secured financing agreement. |
Debt obligations included in the tables above are obligations of KREF’s consolidated subsidiaries, which own the related collateral, and such collateral is generally not available to other creditors of KREF. In particular, holders of CMBS, including KREF, are unable to directly own the mortgages, properties or other collateral held by the issuing trusts that KREF present as "Assets — Commercial mortgage loans held in variable interest entities, at fair value" in its Condensed Consolidated Balance Sheets.
While KREF is generally not required to post margin under repurchase agreement terms for changes in general capital market conditions such as changes in credit spreads or interest rates, KREF may be required to post margin for changes in conditions specific to loans that serve as collateral for those repurchase agreements. Such changes may include declines in the appraised value of property that secures a loan or a negative change in the borrower's ability or willingness to repay a loan. To the extent that KREF is required to post margin, KREF's liquidity could be significantly impacted. Both KREF and its lenders work cooperatively to monitor the performance of the properties and operations related to KREF's loan investments to mitigate investment-specific credit risks. Additionally, KREF incorporates terms in the loans it originates to further mitigate risks related to loan nonperformance.
Activity — For the three months ended March 31, 2018, the activity related to the carrying value of KREF’s secured financing agreements and other consolidated debt obligations were as follows: |
| | | | | | | | | | | | |
| | | Secured Financing Agreements, Net | | Variable Interest Entity Liabilities, at Fair Value | | Total |
| Balance as of December 31, 2017 | | $ | 964,800 |
| | $ | 5,256,926 |
| | $ | 6,221,726 |
|
| Principal borrowings | | 317,750 |
| | — |
| | 317,750 |
|
| Principal repayments | | — |
| | (11,540 | ) | | (11,540 | ) |
| Deferred debt issuance costs | | (327 | ) | | — |
| | (327 | ) |
| Amortization of deferred debt issuance costs | | 359 |
| | — |
| | 359 |
|
| Fair value adjustment | | — |
| | (88,528 | ) | | (88,528 | ) |
Other(A) | | — |
| | 572 |
| | 572 |
|
| Balance as of March 31, 2018 | | $ | 1,282,582 |
| | $ | 5,157,430 |
| | $ | 6,440,012 |
|
(A) Amounts principally consist of changes in accrued interest payable and cost adjustments.
KKR Real Estate Finance Trust Inc.
Notes to Condensed Consolidated Financial Statements (Unaudited)
(dollars in tables in thousands, except per share amounts)
Term Loan Financing
In April 2018, KREF, through its consolidated subsidiaries, entered into a term loan financing agreement (“Term Loan Facility”) with third party lenders for an initial borrowing capacity of $200.0 million that was subsequently increased to $600.0 million as of September 30, 2018. The facility provides asset-based financing on a non-mark to market basis with matched term up to five years and is non-recourse to KREF. Borrowings under the facility are collateralized by senior loans, held-for-investment, and bear interest equal to one-month LIBOR plus a margin. As of September 30, 2018, the weighted average margin and interest rate on the facility were 1.4% and 3.7%, respectively. The following table summarizes our borrowings under the Term Loan Facility:
|
| | | | | | | | | | | | | | | | |
| | | September 30, 2018 |
| Term Loan Facility | | Count | | Outstanding Face Amount | | Carrying Value | | Wtd. Avg. Yield/Cost(A) | | Guarantee(B) | | Wtd. Avg. Term(C) |
| Collateral assets | | 6 | | $ | 717,500 |
| | $ | 711,982 |
| | L + 3.0% | | n.a. | | May 2023 |
| Financing provided | | n.a | | 582,483 |
| | 578,010 |
| | L + 1.7% | | n.a. | | May 2023 |
| |
| (A) | Floating rate loans and related liabilities are indexed to one-month LIBOR. KREF's net interest rate exposure is in direct proportion to its interest in the net assets indexed to that rate. In addition to cash coupon, yield/cost includes the amortization of deferred origination/financing costs. |
| |
| (B) | Financing under the Term Loan Facility is non-recourse to KREF. |
| |
| (C) | The weighted-average term is determined using the maximum maturity date of the corresponding loans, assuming all extension options are exercised by the borrower. |
Activity — For the nine months ended September 30, 2018, the activity related to the carrying value of KREF’s secured financing agreements, term loan financing and other consolidated debt obligations were as follows: |
| | | | | | | | | | | | |
| | | Secured Financing Agreements, Net(A) | | Variable Interest Entity Liabilities, at Fair Value | | Total |
| Balance as of December 31, 2017 | | $ | 964,800 |
| | $ | 5,256,926 |
| | $ | 6,221,726 |
|
| Principal borrowings | | 1,607,725 |
| | — |
| | 1,607,725 |
|
| Principal repayments/ sales/ deconsolidation | | (451,026 | ) | | (4,062,624 | ) | | (4,513,650 | ) |
| Deferred debt issuance costs | | (8,562 | ) | | — |
| | (8,562 | ) |
| Amortization of deferred debt issuance costs | | 3,017 |
| | — |
| | 3,017 |
|
| Fair value adjustment | | — |
| | (92,499 | ) | | (92,499 | ) |
Other(B) | | — |
| | (14,864 | ) | | (14,864 | ) |
| Balance as of September 30, 2018 | | $ | 2,115,954 |
| | $ | 1,086,939 |
| | $ | 3,202,893 |
|
(A) Includes Term Loan Financing Facility and Asset Specific Financing Facility.
(B) Amounts principally consist of changes in accrued interest payable and cost adjustments.
Maturities — KREF’s secured financing agreements, term loan financing and other consolidated debt obligations in place as of March 31,September 30, 2018 had current contractual maturities as follows:
| | | Year | | Nonrecourse(A) | | Recourse(B) | | Total | | Nonrecourse(A) | | Recourse(B) | | Total |
| 2018 | | $ | 38,179 |
| | $ | 75,000 |
| | $ | 113,179 |
| | $ | 2,779 |
| | $ | — |
| | $ | 2,779 |
|
| 2019 | | 61,593 |
| | 590,997 |
| | 652,590 |
| | 13,098 |
| | 505,432 |
| | 518,530 |
|
| 2020 | | 455,101 |
| | 568,600 |
| | 1,023,701 |
| | 179,359 |
| | 985,632 |
| | 1,164,991 |
|
| 2021 | | 75,545 |
| | — |
| | 75,545 |
| | 484,634 |
| | — |
| | 484,634 |
|
| 2022 | | 81,124 |
| | 52,500 |
| | 133,624 |
| | 18,565 |
| | 52,500 |
| | 71,065 |
|
| Thereafter | | 4,273,734 |
| | — |
| | 4,273,734 |
| | 979,779 |
| | — |
| | 979,779 |
|
| | | $ | 4,985,276 |
| | $ | 1,287,097 |
| | $ | 6,272,373 |
| | $ | 1,678,214 |
| | $ | 1,543,564 |
| | $ | 3,221,778 |
|
| |
| (A) | Amounts related to consolidated CMBS VIE liabilities that represent securities not beneficially owned by KREF's stockholders. |
| |
| (B) | Amounts borrowed subject to a maximum 25.0% recourse limit. |
KKR Real Estate Finance Trust Inc.
Notes to Condensed Consolidated Financial Statements (Unaudited)
(dollars in tables in thousands, except per share amounts)
Covenants — KREF is required to comply with customary loan covenants and event of default provisions related to its secured financing agreements, including, but not limited to, negative covenants relating to restrictions on operations with respect to KREF’s status as a REIT, and financial covenants. Such financial covenants include an interest income to interest expense ratio covenant (1.5 to 1.0); a minimum consolidated tangible net worth covenant (75.0% of the aggregate cash proceeds of any equity issuances made and any capital contributions received by KREF and certain subsidiaries)subsidiaries or $800.0 million dependent upon the facility); a cash liquidity covenant (the greater of $10.0 million or 5.0% of KREF's recourse indebtedness, dependent upon the facility)indebtedness); a total indebtedness covenant (75.0% of KREF's total assets, net of VIE liabilities); a maximum debt-to-equity ratio (3.5 to 1.0); and a minimum fixed charge coverage ratio (1.5 to 1.0). As of March 31,September 30, 2018 and December 31, 2017, KREF was in compliance with its financial loan covenants.
KKR Real Estate Finance Trust Inc.
Notes to Condensed Consolidated Financial Statements (Unaudited)
(dollars in tables in thousands, except per share amounts)
Note 5. Convertible Notes, Net
In May 2018, the Company issued $143.75 million of 6.125% convertible senior notes due on May 15, 2023. The Convertible Notes bear interest at a rate of 6.125% per year, payable semi-annually in arrears on May 15 and November 15 of each year, beginning on November 15, 2018. The Convertible Notes mature on May 15, 2023, unless earlier repurchased or converted. The Convertible Notes’ issuance costs of $5.1 million are amortized through interest expense over the life of the Convertible Notes.
The initial conversion rate for the Convertible Notes is 43.9386 shares of KREF’s common stock per $1,000 principal amount of Notes, which is equivalent to an initial conversion price of approximately $22.76 per share of KREF’s common stock, which represents a 10% conversion premium over the last reported sale price of $20.69 per share of KREF’s common stock on The New York Stock Exchange on May 15, 2018. The conversion rate is subject to adjustment under certain circumstances. In addition, upon a make-whole fundamental change as defined within the indenture governing the Convertible Notes, the Company will, under certain circumstances, increase the applicable conversion rate for a holder that elects to convert its Notes in connection with such make-whole fundamental change. Prior to February 15, 2023, the Notes will be convertible only upon satisfaction of certain conditions and during certain periods, and thereafter, at any time until the close of business on the second scheduled trading day immediately preceding the maturity date. KREF will satisfy any conversion elections by paying or delivering, as the case may be, cash, shares of KREF’s common stock or a combination of cash and shares of KREF’s common stock, at its election. KREF has the intent and ability to settle the Convertible Notes in cash and, as a result, the Convertible Notes did not have an impact on our diluted earnings per share.
Upon the issuance of the Convertible Notes, the Company recorded a $1.8 million discount based on the implied value of the conversion option and an assumed effective interest rate of 6.50%, as well as $5.1 million of initial issuance costs, inclusive of the $0.8 million paid to an affiliate of KREF (Note 11) . Inclusive of the amortization of this discount and the issuance costs, KREF’s total cost of the May 2018 Convertible Notes issuance is 6.92% per annum.
The following table details our interest expense related to the Convertible Notes:
|
| | | | | | | | | | | | | | | | |
| | | Three Months Ended September 30, | | Nine Months Ended September 30, |
| | | 2018 | | 2017 | | 2018 | | 2017 |
| Cash coupon | | $ | 2,201 |
| | $ | — |
| | $ | 3,253 |
| | $ | — |
|
| Discount and issuance cost amortization | | 349 |
| | — |
| | 512 |
| | — |
|
| Total interest expense | | $ | 2,550 |
| | — |
| | $ | 3,765 |
| | — |
|
The following table details the net book value of our Convertible Notes on our Condensed Consolidated Balance Sheets:
|
| | | | | | | | |
| | | September 30, 2018 | | December 31, 2017 |
| Face value | | $ | 143,750 |
| | $ | — |
|
| Deferred financing costs | | (4,745 | ) | | — |
|
| Unamortized discount | | (1,666 | ) | | — |
|
| Net book value | | $ | 137,339 |
| | $ | — |
|
Accrued interest payable for the Convertible Notes was $3.3 million and $0.0 million as of September 30, 2018 and December 31, 2017, respectively. Refer to Note2 for additional discussion of our accounting policies for the Convertible Notes.
KKR Real Estate Finance Trust Inc.
Notes to Condensed Consolidated Financial Statements (Unaudited)
(dollars in tables in thousands, except per share amounts)
Note 5.6. Loan Participations Sold
KREF finances certain investments through the syndication of a non-recourse, or limited-recourse, loan participation to unaffiliated third parties. The following table summarizes the loan participation sold liabilities that KREF recognized since the corresponding syndications of the participations in the senior loans were not treated as sales:
| | | | | March 31, 2018 | | September 30, 2018 |
| Loan Participations Sold | | Count | | Principal Balance | | Carrying Value | | Yield/Cost(A) | | Guarantee(B) | | Term | | Count | | Principal Balance | | Carrying Value | | Yield/Cost(A) | | Guarantee(B) | | Term |
| Total loan | | 1 |
| | $ | 95,250 |
| | $ | 94,781 |
| | L + 3.0% | | n.a. | | September 2022 | | 1 | | $ | 97,440 |
| | $ | 97,024 |
| | L + 3.0% | | n.a. | | September 2022 |
Senior participation(C) | | 1 |
| | 82,000 |
| | 81,500 |
| | L + 1.8% | | n.a. | | September 2022 | | 1 | | 83,886 |
| | 83,442 |
| | L + 1.8% | | n.a. | | September 2022 |
| |
| (A) | Floating rate loans and related liabilities are indexed to one-month LIBOR. KREF's net interest rate exposure is in direct proportion to its interest in the net assets of the senior loan. |
| |
| (B) | As of March 31,September 30, 2018, the loan participation sold was subject to partial recourse of $10.0 million, which amount may be reduced to zero upon achievement of certain property performance metrics. |
| |
| (C) | During the threenine months ended March 31,September 30, 2018, KREF recorded $0.7$2.3 million of interest income and $0.7$2.4 million of interest expense related to the loan participation KREF sold, but continue to consolidate under GAAP. |
KKR Real Estate Finance Trust Inc.
Notes to Condensed Consolidated Financial Statements (Unaudited)
(dollars in tables in thousands, except per share amounts)
Note 6.7. Variable Interest Entities
CMBS — KREF's stockholders beneficially owned CMBS with an unpaid principal balance and fair value of $309.2$34.9 million and $120.2$13.0 million, respectively, as of March 31,September 30, 2018. KREF's stockholders beneficially owned CMBS with an unpaid principal balance and fair value of $309.2 million and $114.9 million, respectively, as of December 31, 2017.
In April 2018, KREF sold its controlling beneficial interest in four of the five CMBS trusts held for $112.7 million for a gain of $13.0 million during the nine months ended September 30, 2018, which is included in "Other Income — Realized gain on sale of investments" in the accompanying Condensed Consolidated Statements of Income. The initial cost basis of the CMBS trusts sold was $94.4 million and the fair value as of December 31, 2017 was $99.7 million.
KREF was required to consolidate each of the five CMBS trusts acquired from the date of acquisition through March 31, 2018the date of sale since KREF retained the controlling class and management determined KREF was the primary beneficiary of those trusts. Further, management irrevocably elected the fair value option for each of the five trusts and carries the fair values of the trusts'trust's(s') assets and liabilities at fair value in its Condensed Consolidated Balance Sheets; recognizes changes in the trusts'trust's(s') net assets, including fair value adjustments and net interest earned, in its Condensed Consolidated Statements of Income; and records cash interest received from the trusts, net of cash interest paid to CMBS not beneficially owned by KREF, as operating cash flows.
The following table presents the KREF recognized Trusts'Trust's(s') Assets and Liabilities:
| | | | | March 31, 2018 | | December 31, 2017 | | September 30, 2018 | | December 31, 2017 |
| Trusts' Assets | | | | | | | | |
Commercial mortgage loans held in variable interest entities, at fair value(A) | | $ | 5,278,715 |
| | $ | 5,372,811 |
| | $ | 1,100,089 |
| | $ | 5,372,811 |
|
| Accrued interest receivable | | 19,779 |
| | 19,740 |
| | 4,015 |
| | 19,740 |
|
| | |
|
| |
|
| |
|
| |
|
|
| Trusts' Liabilities | | | | | | | | |
Variable interest entity liabilities, at fair value(B) | | 5,157,430 |
| | 5,256,926 |
| | 1,086,939 |
| | 5,256,926 |
|
| Accrued interest payable | | 19,700 |
| | 18,661 |
| | 3,828 |
| | 18,661 |
|
| |
| (A) | Includes accrued interest receivable. |
| |
| (B) | Includes accrued interest payable. |
The following table presents "Other Income — Change in net assets related to consolidated variable interest entities":
| | | | | Three Months Ended March 31, | | Three Months Ended September 30, | | Nine Months Ended September 30, |
| | | 2018 | | 2017 | | 2018 | | 2017 | | 2018 | | 2017 |
| Net interest earned | | $ | 3,112 |
| | $ | 3,112 |
| | $ | 584 |
| | $ | 3,138 |
| | $ | 4,604 |
| | $ | 9,357 |
|
| Unrealized gain (loss) | | 5,377 |
| | 1,498 |
| | (205 | ) | | 887 |
| | (2,144 | ) | | 3,453 |
|
| Change in net assets related to consolidated variable interest entities | | $ | 8,489 |
| | $ | 4,610 |
| | $ | 379 |
| | $ | 4,025 |
| | $ | 2,460 |
| | $ | 12,810 |
|
See Note 1112 for additional information regarding the valuation of financial assets and liabilities held by KREF's consolidated VIEs.
KKR Real Estate Finance Trust Inc.
Notes to Condensed Consolidated Financial Statements (Unaudited)
(dollars in tables in thousands, except per share amounts)
Concentration of Credit Risk — The following tables present the geographies and property types of collateral underlying the CMBS trusts consolidated by KREF, as a percentage of the collateral unpaid principal balance and weighted by the fair value of the CMBS tranches beneficially owned by KREF's stockholders:
|
| | | | | | | | | | | | | | |
| | | September 30, 2018 | | December 31, 2017 | | | | September 30, 2018 | | December 31, 2017 |
| Geography | | | | Collateral Property Type | | |
| California | | 33.3 | % | | 23.2 | % | | Retail | | 28.4 | % | | 25.2 | % |
| Texas | | 11.1 |
| | 12.7 |
| | Office | | 27.4 |
| | 26.4 |
|
| New York | | 8.3 |
| | 9.1 |
| | Hospitality | | 13.0 |
| | 15.0 |
|
| Missouri | | 5.3 |
| | 4.6 |
| | Multifamily | | 9.9 |
| | 10.6 |
|
| Pennsylvania | | 5.2 |
| | 4.5 |
| | Industrial/ Flex | | 9.6 |
| | 9.6 |
|
| Florida | | 4.2 |
| | 5.5 |
| | Self Storage | | 5.9 |
| | 3.0 |
|
| Massachusetts* | | 3.6 |
| | 1.7 |
| | Mixed Use | | 3.8 |
| | 6.9 |
|
| Illinois | | 2.7 |
| | 7.1 |
| | Mobile Home | | 1.8 |
| | 2.7 |
|
| Georgia | | 2.6 |
| | 2.9 |
| | Other | | 0.2 |
| | 0.6 |
|
| New Hampshire* | | 2.4 |
| | 1.0 |
| | | | 100.0 | % | | 100.0 | % |
| Delaware* | | 2.0 |
| | 1.3 |
| | | | | | |
| Virginia* | | 1.7 |
| | 1.2 |
| | | | | | |
| Other U.S. | | 17.6 |
| | 25.2 |
| | | | | | |
| Total | | 100.0 | % | | 100.0 | % | | | | | | |
KKR Real Estate Finance Trust Inc.
Notes to Condensed Consolidated Financial Statements (Unaudited)
(dollars in tables in thousands, except per share amounts)
|
| | | | | | | | | | | | | | |
| | | March 31, 2018 | | December 31, 2017 | | | | March 31, 2018 | | December 31, 2017 |
| Geography | | | | Collateral Property Type | | |
| California | | 22.7 | % | | 23.2 | % | | Office | | 26.4 | % | | 26.4 | % |
| Texas | | 12.7 |
| | 12.7 |
| | Retail | | 25.1 |
| | 25.2 |
|
| New York | | 9.1 |
| | 9.1 |
| | Hospitality | | 15.0 |
| | 15.0 |
|
| Illinois | | 7.3 |
| | 7.1 |
| | Multifamily | | 10.6 |
| | 10.6 |
|
| Florida | | 5.5 |
| | 5.5 |
| | Industrial | | 9.6 |
| | 9.6 |
|
| Missouri | | 4.5 |
| | 4.6 |
| | Mixed Use | | 7.0 |
| | 6.9 |
|
| Pennsylvania | | 4.5 |
| | 4.5 |
| | Self Storage | | 3.0 |
| | 3.0 |
|
| Georgia | | 2.9 |
| | 2.9 |
| | Mobile Home | | 2.7 |
| | 2.7 |
|
| Michigan | | 2.7 |
| | 2.7 |
| | Other | | 0.6 |
| | 0.6 |
|
| Arizona | | 2.5 |
| | — |
| | Total | | 100.0 | % | | 100.0 | % |
| Ohio | | 2.4 |
| | 2.4 |
| | | | | | |
| Other U.S. | | 23.2 |
| | 25.3 |
| | | | | | |
| Total | | 100.0 | % | | 100.0 | % | | | | | | |
Commercial Mezzanine Loan Joint Venture — KREF holdsheld a 95.0% interest, and iswas the primary beneficiary of, a joint venture consolidated as a VIE that investsinvested in commercial mezzanine loans (Note 3). Management considered KREF to be the primary beneficiary of the joint venture as KREF held decision-making power over the activities that most significantly impact the economic performance of the joint venture. In June 2018, KREF acquired the Mezzanine JV Redeemable Noncontrolling Interest for its carrying value of $1.3 million. As of March 31,September 30, 2018, the joint venture held six loans with an amortized cost basis of $26.2 million, presented within "Assets — Commercial mortgage loans, held-for-investment, net" in the accompanying Condensed Consolidated Balance Sheets. As of March 31, 2018, the joint venture did not have any liabilities.is no longer a VIE.
Equity method investments, at fair value — KREF holds two investments in entities that it records using the equity method.
As of March 31,September 30, 2018, KREF held a 3.5% interest in RECOP, an unconsolidated VIE of which KREF is not the primary beneficiary. The aggregator vehicle in which KREF invests is controlled and advised by affiliates of the Manager. RECOP intends to primarily acquire junior tranches of CMBS newly issued by third parties but may also make purchases on the secondary market. KREF will not pay any fees to RECOP, but KREF bears its pro rata share of RECOP's expenses. KREF reported its share of the net asset value of RECOP in its Condensed Consolidated Balance Sheets, presented as “Equity method investments, at fair value” and its share of net income, presented as “Income from equity method investments” in the Condensed Consolidated Statement of Income.
As of March 31,September 30, 2018, the non-voting limited liability company interests issued by the Manager, a VIE, and held by a TRSTaxable REIT Subsidiary ("TRS") of KREF for the benefit of the holder of the SNVPS represented 4.7% of the Manager’s outstanding limited liability company interests (Note 7)8). KREF reported its allocable percentage of the assets and liabilities of the Manager in its Condensed Consolidated Balance Sheets, presented as “Equity method investments, at fair value” and its share of net income, presented as “Income from equity method investments” in the Condensed Consolidated Statement of Income.
KKR Real Estate Finance Trust Inc.
Notes to Condensed Consolidated Financial Statements (Unaudited)
(dollars in tables in thousands, except per share amounts)
Note 7.8. Equity
Authorized Capital — On October 2, 2014, KREF's board of directors authorized KREF to issue up to 350,000,000 shares of stock, at $0.01 par value per share, consisting of 300,000,000 shares of common stock and 50,000,000 shares of preferred stock, subject to certain restrictions on transfer and ownership of shares. Restrictions placed on the transfer and ownership of shares relate to KREF's REIT qualification requirements.
Common Stock — As further described below, since December 2015, KREF issued the following shares of common stock at $20.00 per share, less applicable transaction costs, except as otherwise indicated:stock:
| | | Pricing Date | | Shares Issued | | Net Proceeds | | Shares Issued | | Net Proceeds |
| As of December 31, 2015 | | 13,636,416 |
| | $ | 272,728 |
| | 13,636,416 |
| | $ | 272,728 |
|
| February 2016 | | 2,000,000 |
| | 40,000 |
| | 2,000,000 |
| | 40,000 |
|
| May 2016 | | 3,000,138 |
| | 57,130 |
| | 3,000,138 |
| | 57,130 |
|
June 2016(A) | | 21,838 |
| | — |
| | 21,838 |
| | — |
|
| August 2016 | | 5,500,000 |
| | 109,875 |
| | 5,500,000 |
| | 109,875 |
|
| As of December 31, 2016 | | 24,158,392 |
| | 479,733 |
| | 24,158,392 |
| | 479,733 |
|
| February 2017 | | 7,386,208 |
| | 147,662 |
| | 7,386,208 |
| | 147,662 |
|
| April 2017 | | 10,379,738 |
| | 207,595 |
| | 10,379,738 |
| | 207,595 |
|
| May 2017- Initial Public Offering | | 11,787,500 |
| | 219,356 |
| | 11,787,500 |
| | 219,356 |
|
| As of December 31, 2017 | | 53,711,838 |
| | $ | 1,054,346 |
| | 53,711,838 |
| | 1,054,346 |
|
| August 2018 | | | 5,000,000 |
| | 98,326 |
|
| As of September 30, 2018 | | | 58,711,838 |
| | $ | 1,152,672 |
|
| |
| (A) | KREF did not receive any proceeds with respect to 21,838 shares of common stock issued to certain current and former employees of, and non-employee consultants to, KKR and third-party investors in the private placement completed in March 2016, in accordance with KREF'sKREF's Stockholders Agreement dated as of March 29, 2016. |
In March 2016, KREF obtained $277.4 million of capital commitments in connection with the completion of a private placement priced at $20.00 per share. Of these capital commitments, $190.1 million consisted of approximately $178.4 million from third parties and approximately $11.8 million from certain current and former employees of, and non-employee consultants to, KKR. KKR committed a total of $400.0 million and third parties committed a total of $248.0 million subsequent to the private placement completion. In connection with the completion of the private placement, KREF formed an advisory board consisting of certain third-party investors. The advisory board possessed certain protective approval rights over KREF's activities outside its ordinary course of business, including certain business combinations and equity issuances. The advisory board dissolved upon KREF's public listing on May 5, 2017.
In February 2017 and April 2017, KREF called a portion of capital from investors in the private placements closed during the year ended December 31, 2016 and issued 7,386,208 and 10,379,738 common shares, at $20.00 per share, for net proceeds of $147.7 million and $207.6 million, respectively.
In connection with the capital commitments described above, third-party investors and certain current and former employees of, and non-employee consultants to, KKR were allocated non-voting limited liability company interests of the Manager. For each $100.0 million shares of KREF’s common stock acquired by investors through the private placement, the investors were allocated non-voting limited liability company interests, representing 6.67% of the Manager’s then-outstanding total limited liability company interests. Each investor was allocated its pro rata share of the non-voting limited liability company interests of the Manager based on the investor’s shares of KREF’s common stock.
In May 2017, KREF completed its initial public offering of 11,787,500 shares of its common stock at a price to the public of $20.50 per share, which included 1,537,500 shares of common stock issued in connection with the underwriters' exercise in full of their option to purchase additional shares. The value of KREF's common stock prior to its listing on the New York Stock Exchange was based upon its equity value using a combination of net asset value (market) and discounted cash flow (income) approaches.
AsIn August 2018, KREF completed an underwritten public offering of March 31, 2018, KKR beneficially owned 23,758,6165,000,000 shares of KREF'sits common stock of which 3,758,616 shares were held by KKR on behalf of a third-party investor (Note 1).
KKR Real Estate Finance Trust Inc.
Notes to Condensed Consolidated Financial Statements (Unaudited)
(dollars in tables in thousands, except per share amounts)
As of September 30, 2018, KKR beneficially owned 23,758,616 shares of KREF's common stock, of which 3,758,616 shares were held by KKR on behalf of a third-party investor (Note 1).
During the threenine months ended March 31,September 30, 2018, and 2017, no34,259 shares of common stock waswere issued related to the vesting of restricted stock units. Upon any payment of shares as a result of restricted stock unit vesting, the related tax withholding obligation will generally be satisfied by the Company, reducing the number of shares to be delivered by a number of shares necessary to satisfy the related applicable tax withholding obligation. Refer to Note 9 for further detail.
Share Repurchase Program — KREF adopted a program to repurchase in the open market up to $100.0 million in shares of KREF's common stock over the 12 month period commencing in June 2017. Of this amount, a total of $50.0 million iswas covered by a pre-set trading plan meeting the requirements of Rule 10b5-1 under the Exchange Act (the "10b5-1 Plan"), which providesprovided for repurchases of KREF's common stock when the market price per share of common stock iswas below book value per share (calculated in accordance with GAAP), with the remaining $50.0 million available at any time during the repurchase period. This program expired on June 12, 2018. In May 2018, KREF's board of directors approved a new share repurchase program, effective following the expiration of the above-described share repurchase program. The new share repurchase program permits KREF to repurchase up to $100.0 million of KREF's common stock during the period from June 13, 2018 through June 30, 2019. Of this total authorized amount, $50.0 million will be covered by a pre-set trading plan meeting the requirements of Rule 10b5-1 under the Exchange Act and provide for repurchases of our common stock when the market price per share of our common stock is below book value per share (calculated in accordance with GAAP as of the end of the most recent quarterly period for which financial statements are available), and the remaining $50.0 million may be used for repurchases in the open market, pursuant to pre-set trading plans meeting the requirements of Rule 10b5-1 under the Exchange Act, in privately negotiated transactions or otherwise. During the threenine months ended March 31,September 30, 2018, KREF repurchased 609,865697,109 shares of common stock under the 10b5-1 PlanPlans at an average price per share of $19.54 for a total of $11.9$13.6 million. As of March 31,September 30, 2018, $37.6$49.3 million remained available for repurchases under this 10b5-1 Plan.
Of the 53,711,83858,711,838 common shares KREF issued, there were 53,075,57558,022,590 common shares outstanding as of March 31,September 30, 2018, net of 636,263723,507 common shares repurchased.repurchased and the delivery of 34,259 shares of common stock in connection with vested restricted stock units.
Dividends — During the threenine months ended March 31,September 30, 2018, KREF's board of directors declared the following dividends on shares of its common stock and special voting preferred stock:
| | | | | Amount | | Amount |
| Declaration Date | | Record Date | | Payment Date | | Per Share | | Total | | Record Date | | Payment Date | | Per Share | | Total |
| March 12, 2018 | | March 29, 2018 | | April 13, 2018 | | 0.40 |
| | 21,230 |
| | March 29, 2018 | | April 13, 2018 | | $ | 0.40 |
| | $ | 21,230 |
|
| May 7, 2018 | | | June 29, 2018 | | July 13, 2018 | | 0.43 |
| | 22,804 |
|
| September 11, 2018 | | | September 28, 2018 | | October 12, 2018 | | 0.43 |
| | 24,951 |
|
| | | | | $ | 21,230 |
| | | | $ | 68,985 |
|
Preferred Stock — On January 23, 2015, KREF issued 125 shares of Series A cumulative, non-voting preferred stock with a par value of $0.01 per share and a stated value of $1,000.00 per share ("Series A Preferred Stock") that arewere senior to common stock. Holders of Series A Preferred Stock arewere entitled to cumulative distributions of 12.5% of the stated value per annum, payable semi-annually in arrears on or before June 30 and December 31 of each year, but arewere unable to convert Series A Preferred Stock into common stock or vote on matters brought to KREF's stockholders. In May 2017, KREF redeemed all 125 issued and outstanding shares of Series A Preferred Stock for $0.1 million, representing the sum of $1,000.00 per share and all accrued and unpaid dividends.
Special Voting Preferred Stock — In March 2016, KREF issued one share of special voting preferred stock to KKR Fund Holdings L.P. ("KKR Fund Holdings") for $20.00 per share, which KKR Fund Holdings transferred to its subsidiary, KKR REFT Asset Holdings LLC. The holder of the special voting preferred stock has special voting rights related to the election of members to KREF's board of directors until KKR and its affiliates cease to own at least 25.0% of KREF's issued and outstanding common stock. As of March 31,September 30, 2018, KKR and its affiliates beneficially owned 23,758,616 shares of KREF's common stock representing 45%41% of KREF’s issued and outstanding common stock.
KKR Real Estate Finance Trust Inc.
Notes to Condensed Consolidated Financial Statements (Unaudited)
(dollars in tables in thousands, except per share amounts)
Special Non-Voting Preferred Stock — In connection with KREF's existing investors’ subscription for shares of KREF's common stock in the private placements prior to the initial public offering of KREF's equity on May 5, 2017, those investors were also allocated a class of non-voting limited liability company interest in the Manager ("Non-Voting Manager Units"). In February 2017, KREF issued an investor one share of SNVPS, at $0.01 per share, in lieu of that investor receiving Non-Voting Manager Units to facilitate compliance by the investor with regulatory requirements applicable to it. The corresponding Non-Voting Manager Units are held by a TRS of KREF. All distributions received by that subsidiary from these Non-Voting Manager Units are passed through to the investor as preferred distributions on its SNVPS, less applicable taxes and withholdings. Except for the Non-Voting Manager Units, an indirect subsidiary of KKR owns and controls the limited liability company interests of the Manager.
Dividends on the SNVPS are payable quarterly, and will accrue whether or not KREF has earnings, there are assets legally available for the payment of those dividends or those dividends have been declared. Any dividend payment made on the SNVPS shall first be credited against the earliest accumulated but unpaid dividend due with respect to the SNVPS. Upon redemption of the SNVPS or liquidation of KREF, the holder of the SNVPS is entitled to payment of $0.01 per share, together with any accumulated but unpaid preferred distributions, including respective call or put amounts (as defined), before any holder of junior security interests, which includes KREF's
KKR Real Estate Finance Trust Inc.
Notes to Condensed Consolidated Financial Statements (Unaudited)
(dollars in tables in thousands, except per share amounts)
common stock. As KREF does not control the circumstances under which the holder of the SNVPS may redeem its interests, management considers the SNVPS as temporary equity (Note 2).
KREF will redeem the SNVPS at the option of the holder. Upon redemption, KREF will pay a price in cash equal to $0.01 per share of the SNVPS, together with any accumulated but unpaid preferred distributions, including respective call or put amounts (as defined), and the SNVPS will be canceled automatically and cease to be outstanding.
Redeemable noncontrolling interests represent a 5.0% third-party interest in a joint venture consolidated as a VIE that holds a portion of KREF’s investments in certain commercial mezzanine loans (Note 3). The redeemable noncontrolling interests issued by the joint venture are subject to certain restrictions and require KREF to transfer assets or issue equity to satisfy the redemption. As KREF does not control the circumstances under which the noncontrolling interests may redeem their interests, management considers these redeemable noncontrolling interests as temporary equity (Note 2).
Earnings per Share — The following table illustrates the computation of basic and diluted earnings per share for the three and nine months ended March 31,September 30, 2018 and 2017:
| | | | | Three Months Ended March 31, | | Three Months Ended September 30, | | Nine Months Ended September 30, |
| | | 2018 | | 2017 | | 2018 | | 2017 | | 2018 | | 2017 |
| Numerator | | | | | | | | | | | | |
| Net income (loss) attributable to common stockholders | | $ | 23,280 |
| | $ | 10,364 |
| | $ | 20,821 |
| | $ | 17,339 |
| | $ | 67,921 |
| | $ | 41,784 |
|
| | | | | | | | | | | | | |
| Denominator | | | | | | | | | | | | |
| Basic weighted average common shares outstanding | | 53,337,915 |
| | 26,879,428 |
| | 55,903,126 |
| | 53,696,967 |
| | 54,111,272 |
| | 42,501,356 |
|
| Dilutive restricted stock units | | 40,552 |
| | — |
| | 18,529 |
| | 74 |
| | 21,059 |
| | 174 |
|
| Diluted weighted average common shares outstanding | | 53,378,467 |
| | 26,879,428 |
| | 55,921,655 |
| | 53,697,041 |
| | 54,132,331 |
| | 42,501,530 |
|
| Net income (loss) attributable to common stockholders, per: | | | | | | | | | | | | |
| Basic common share | | $ | 0.44 |
| | $ | 0.39 |
| | $ | 0.37 |
| | $ | 0.32 |
| | $ | 1.26 |
| | $ | 0.98 |
|
| Diluted common share | | $ | 0.44 |
| | $ | 0.39 |
| | $ | 0.37 |
| | $ | 0.32 |
| | $ | 1.25 |
| | $ | 0.98 |
|
KKR Real Estate Finance Trust Inc.
Notes to Condensed Consolidated Financial Statements (Unaudited)
(dollars in tables in thousands, except per share amounts)
Note 8.9. Stock-based Compensation
KREF is externally managed by the Manager and does not currently have any employees. However, as of March 31,September 30, 2018, the Manager, certain individuals employed by the Manager and affiliates of the Manager, and certain members of KREF's board of directors were compensated, in part, through the issuance of stock-based awards.
As of March 31,September 30, 2018, KREF had restricted stock unit (“RSU”) awards outstanding under the KKR Real Estate Finance Trust Inc. 2016 Omnibus Incentive Plan that was adopted on February 12, 2016 and amended and restated on November 17, 2016 (the "Incentive Plan") to certain members of KREF’s board of directors and employees of the Manager or its affiliates, none of whom are KREF employees. RSUs awarded to employees of the Manager or its affiliates, generally vest over three consecutive one-year periods and awards to certain members of KREF's board of directors vest over a one-year period, pursuant to the terms of the respective award agreements and the terms of the Incentive Plan. RSU awards are not entitled to dividends until KREF issues shares of its common stock, which are issuable on a one-to-one basis upon the RSU award vesting.
The following table summarizes the activity in the Company’sKREF’s outstanding RSUs and the weighted-average grant date fair value per RSU:
| | | | | Restricted Stock Units | | Weighted Average Grant Date Fair Value Per RSU(A) | | Restricted Stock Units | | Weighted Average Grant Date Fair Value Per RSU(A) |
| Unvested as of December 31, 2017 | | 154,878 |
| | $ | 18.61 |
| | 154,878 |
| | $ | 18.61 |
|
| Granted | | — |
| | — |
| | 11,878 |
| | 20.70 |
|
| Vested | | — |
| | — |
| | (54,037 | ) | | 20.47 |
|
| Forfeited/ cancelled | | (2,500 | ) | | n.a. |
| | (2,740 | ) | | 20.47 |
|
| Unvested as of March 31,2018 | | 152,378 |
| | $ | 18.27 |
| |
| Unvested as of September 30, 2018 | | | 109,979 |
| | $ | 20.49 |
|
| |
| (A) | The grant-date fair value is based upon the last sale price of KREF’s common stock at the date of grant, reduced by the present value of dividends expected prior to RSU vesting.grant. |
These RSUs beginbegan to vest on April 1, 2018 for certain individuals employed by the Manager and affiliates of the Manager and each year thereafter. RSUs awarded to KREF’s board of directors generally vest annually.
KREF expects the unvested RSUs outstanding to vest during the following years:
| | | Year | | Restricted Stock Units | | Restricted Stock Units |
| 2018 | | 54,878 |
| | — |
|
| 2019 | | 50,000 |
| | 60,927 |
|
| 2020 | | 50,000 |
| | 49,052 |
|
| Total | | 154,878 |
| | 109,979 |
|
Upon adoption of ASU No. 2018-07 in June 2018, KREF recognizes the compensation cost of RSUs awarded to employees of the Manager, or one or more of its affiliates, on a straight-line basis over the awards’ term at the then-currenttheir grant date fair value, at each reporting date. KREF amortizesconsistent with the grant-date fair value of RSUs awarded to certain members of itsKREF's board of directors on a straight-line basis over the awards’ term.directors.
During the three and nine months ended March 31,September 30, 2018, and 2017, the CompanyKREF recognized $1.0$0.3 million and $0.0$1.6 million, respectively, of stock-based compensation expense included in “General and administrative” expense in the consolidated statementsCondensed Consolidated Statements of income.Income. During the three and nine months ended September 30, 2017, KREF recognized $0.0 million and $0.0 million, respectively, of stock-based compensation expense. As of March 31,September 30, 2018, there was $1.7 million of total unrecognized stock-based compensation expense related to unvested share-based compensation arrangements based on the closing price of our common stock of $20.06$20.47 on March 29, 2018.June 21, 2018, the date of the adoption of ASU No. 2018-07. This cost is expected to be recognized over a weighted average period of 2 years.
KKR Real Estate Finance Trust Inc.
Notes to Condensed Consolidated Financial Statements (Unaudited)
(dollars in tables in thousands, except per share amounts)
During the nine months ended September 30, 2018, KREF delivered 34,259 shares of common stock for 54,037 vested RSUs. Upon any payment of shares as a result of restricted stock unit vesting, the related tax withholding obligation will generally be satisfied by KREF, reducing the number of shares to be delivered by a number of shares necessary to satisfy the related applicable tax withholding obligation. The amount, results in a cash payment related to this tax liability and a corresponding adjustment to additional paid in capital on the Condensed Consolidated Statement of Changes in Stockholders' Equity. The adjustment was $0.4 million for the nine months ended September 30, 2018, and is included as a reduction of capital related to the Company's equity incentive plan in the Condensed Consolidated Statement of Changes in Stockholders' Equity.
Refer to Note 1011 for additional information regarding the Incentive Plan.
KKR Real Estate Finance Trust Inc.
Notes to Condensed Consolidated Financial Statements (Unaudited)
(dollars in tables in thousands, except per share amounts)
Note 9.10. Commitments and Contingencies
As of March 31,September 30, 2018, KREF was subject to the following commitments and contingencies:
Litigation — From time to time, KREF may be involved in various claims and legal actions arising in the ordinary course of business. KREF establishes an accrued liability for legal proceedings only when those matters present loss contingencies that are both probable and reasonably estimable.
As of March 31,September 30, 2018, KREF was not involved in any material legal proceedings regarding claims or legal actions against KREF.
Indemnifications — In the normal course of business, KREF enters into contracts that contain a variety of representations and warranties that provide general indemnifications and other indemnities relating to contractual performance. In addition, certain of KREF’s subsidiaries have provided certain indemnities relating to environmental and other matters and has provided nonrecourse carve-out guarantees for fraud, willful misconduct and other customary wrongful acts, each in connection with the financing of certain real estate investments that KREF has made. KREF’s maximum exposure under these arrangements is unknown as this would involve future claims that may be made against KREF that have not yet occurred. However, KREF expects the risk of material loss to be low.
Capital Commitments — As of March 31,September 30, 2018, KREF had future funding requirements of $306.6$369.9 million related to its investments in commercial mortgage loans. These future funding commitments primarily relate to construction projects, capital improvements, tenant improvements and leasing commissions. Generally, funding commitments are subject to certain conditions that must be met, such as customary construction draw certifications, minimum credit metrics or executions of new leases before advances are made to the borrower.
In January 2017, KREF committed $40.0 million to invest in an aggregator vehicle alongside RECOP. As of March 31,September 30, 2018, KREF had a remaining commitment of $22.0$16.2 million to RECOP.
KKR Real Estate Finance Trust Inc.
Notes to Condensed Consolidated Financial Statements (Unaudited)
(dollars in tables in thousands, except per share amounts)
Note 10.11. Related Party Transactions
Management Agreement — The Management Agreement between KREF and the Manager is a three-year agreement that provides for automatic one-year renewal periods starting October 8, 2017, subject to certain termination and nonrenewal rights, which in the case of KREF are exercisable by a two-thirds vote by the independent directors of KREF's board of directors. If the independent directors of KREF's board of directors declines to renew the Management Agreement other than for cause, KREF is required to pay the Manager a termination fee equal to three times the total 24-month trailing average annual management fee and incentive compensation earned by the Manager through the most recently completed calendar quarter.
Pursuant to the Management Agreement, the Manager, as agent to KREF and under the supervision of KREF's board of directors, manages the investments, subject to investment guidelines approved by KREF's board of directors; financing activities; and day-to-day business and affairs of KREF and its subsidiaries.
For its services to KREF, the Manager is entitled to a quarterly management fee equal to the greater of $62,500 or 0.375% of a weighted average adjusted equity and quarterly incentive compensation equal to 20.0% of the excess of (a) the trailing 12-month adjusted earnings over (b) 7.0% of the trailing 12-month weighted average adjusted equity (“Hurdle Rate”), less incentive compensation KREF already paid to the Manager with respect to the first three calendar quarters of such trailing 12-month period. The quarterly incentive compensation is calculated and paid in arrears with a three months lag. During the three and nine months ended September 30, 2018, KREF incurred 3.3 million of incentive fees payable to the Manager, of which $2.4 million was attributed to the gain recognized as a result of the April 2018 CMBS sale (Note 7).
Adjusted equity generally represents the proceeds received by KREF and its subsidiaries from equity issuances, without duplication and net of offering costs, and adjusted earnings, reduced by distributions, equity repurchases, and incentive compensation paid. Adjusted earnings generally represents the net income, or loss, attributable to equity interests in KREF and its subsidiaries, without duplication, as well as realized losses not otherwise included in such net income, or loss, excluding non-cash equity compensation expense, incentive compensation, depreciation and amortization and unrealized gains or losses, from and after the effective date to the end of the most recently completed calendar quarter. KREF's board of directors, after majority approval by independent directors, may also exclude one-time events pursuant to changes in GAAP and certain material non-cash income or expense items from adjusted earnings. For purposes of calculating incentive compensation, both adjusted equity and adjusted earnings exclude the effects of equity issued by KREF and its subsidiaries that provides for fixed
KKR Real Estate Finance Trust Inc.
Notes to Condensed Consolidated Financial Statements (Unaudited)
(dollars in tables in thousands, except per share amounts)
distributions or other debt characteristics. There were no incentive fees accrued to the Manager during the three months ended March 31, 2018.
KREF is also required to reimburse the Manager or its affiliates for documented costs and expenses incurred by it and its affiliates on behalf of KREF except those specifically required to be borne by the Manager under the Management Agreement. The Manager is responsible for, and KREF does not reimburse the Manager or its affiliates for, the expenses related to investment personnel of the Manager and its affiliates who provide services to KREF. However, KREF does reimburse the Manager for KREF's allocable share of compensation paid to certain of the Manager’s non-investment personnel, based on the percentage of time devoted by such personnel to KREF's affairs.
Incentive Plan — KREF's compensation committee or board of directors may administer the Incentive Plan, which provides for awards of stock options; stock appreciation rights; restricted stock; RSUs; limited partnership interests of KKR Real Estate Finance Holdings L.P. (the "Operating Partnership"), a wholly owned subsidiary of KREF, that are directly or indirectly convertible into or exchangeable or redeemable for shares of KREF's common stock pursuant to the limited partnership agreement of the Operating Partnership (“OP Interests”); awards payable by (i) delivery of KREF's common stock or other equity interests, or (ii) reference to the value of KREF's common stock or other equity interests, including OP Interests; cash-based awards; or performance compensation awards.
No more than 7.5% of the issued and outstanding shares of common stock on a fully diluted basis, assuming the exercise of all outstanding stock options granted under the Incentive Plan and the conversion of all warrants and convertible securities into shares of common stock, or a total of 4,028,3874,403,387 shares of common stock, will be available for awards under the Incentive Plan. In addition, (i) the maximum number of shares of common stock subject to awards granted during a single fiscal year to any non-employee director (as defined in the Incentive Plan), taken together with any cash fees paid to such non-employee director during the fiscal year, may not exceed $1.0 million and (ii) the maximum amount that can be paid to any participant for a single fiscal year during a performance period (or with respect to each single fiscal year if a performance period extends beyond a single fiscal year) pursuant to a performance compensation award denominated in cash will be $10.0 million.
KKR Real Estate Finance Trust Inc.
Notes to Condensed Consolidated Financial Statements (Unaudited)
(dollars in tables in thousands, except per share amounts)
No awards may be granted under the Incentive Plan on and after February 12, 2026. The Incentive Plan will continue to apply to awards granted prior to such date. No awards wereDuring the nine months ended ended September 30, 2018, KREF granted during the quarter ended March 31, 2018.11,878 RSUs to newly appointed directors of KREF's board. During the year ended December 31, 2017, KREF granted 154,878 RSUs. As of March 31,September 30, 2018, 3,876,0094,259,149 shares of common stock remained available for awards under the Incentive Plan.
Due to Affiliates — The following table contains the amounts presented in KREF's Condensed Consolidated Balance Sheets that it owes to affiliates:
| | | | | March 31, | | December 31, | | September 30, | | December 31, |
| | | 2018 | | 2017 | | 2018 | | 2017 |
| Management fees | | $ | 3,743 |
| | $ | 3,748 |
| | $ | 4,164 |
| | $ | 3,748 |
|
| Incentive compensation | | | 3,286 |
| | — |
|
| Expense reimbursements and other | | 339 |
| | 694 |
| | 250 |
| | 694 |
|
| | | $ | 4,082 |
| | $ | 4,442 |
| | $ | 7,700 |
| | $ | 4,442 |
|
Affiliates Expenses — The following table contains the amounts included in KREF's Condensed Consolidated Statements of Income that arose from transactions with affiliates:the Manager:
| | | | | Three Months Ended March 31, | | Three Months Ended September 30, | | Nine Months Ended September 30, |
| | | 2018 | | 2017 | | 2018 | | 2017 | | 2018 | | 2017 |
| Management fees | | $ | 3,939 |
| | $ | 2,036 |
| | $ | 4,164 |
| | $ | 3,989 |
| | $ | 12,016 |
| | $ | 9,513 |
|
| Incentive compensation | | | 3,286 |
| | — |
| | 3,286 |
| | — |
|
Expense reimbursements and other(A) | | 368 |
| | 347 |
| | 37 |
| | 366 |
| | 767 |
| | 931 |
|
| | | $ | 4,307 |
| | $ | 2,383 |
| | $ | 7,487 |
| | $ | 4,355 |
| | $ | 16,069 |
| | $ | 10,444 |
|
| |
| (A) | KREF presents these amounts in "Operating Expenses — General and administrative" in its Condensed Consolidated Statements of Income. Affiliate expense reimbursements presented in the table above exclude the out-of-pocket costs paid by the Manager to parties unaffiliated with the Manager on behalf of KREF, and for which KREF reimburses the Manager in cash. For the three and nine months ended March 31,September 30, 2018, these cash reimbursements were $0.3 million and $2.5 million, respectively. For the three and nine months ended September 30, 2017, these cash reimbursements were $1.2$0.9 million and $0.0$1.1 million, respectively. |
In connection with the Term Loan Facility (Note 4), KREF is obligated to pay KKR Capital Markets ("KCM"), an affiliate of the Manager, a structuring fee equal to 0.75% of the respective committed loan advances, as defined. During the nine months ended September 30, 2018, KREF incurred $4.5 million structuring fee in connection with the facility. Such amount was capitalized as deferred financing cost and amortized to interest expense over the life of the facility.
In connection with the BMO Facility, and in consideration for structuring and sourcing this arrangement, KREF will pay KCM, a structuring fee equal to 0.35% of the respective committed loan advances under the agreement.
During the nine months ended September 30, 2018, KREF paid KCM $0.8 million in commissions in connection with the issuance of the Convertible Notes. Such amount is included in the $5.1 million Convertible Notes’ issuance cost and is amortized to interest expense over the life of the Convertible Notes.
KKR Real Estate Finance Trust Inc.
Notes to Condensed Consolidated Financial Statements (Unaudited)
(dollars in tables in thousands, except per share amounts)
Note 11.12. Fair Value of Financial Instruments
The carrying values and fair values of KREF’s financial assets and liabilities recorded at fair value on a recurring basis, as well as other financial instruments not carried at fair value, as of March 31,September 30, 2018 were as follows:
| | | | | | | | | Fair Value | | | | | | Fair Value |
| | | Principal Balance(A) | | Carrying Value(B) | | Level 1 | | Level 2 | | Level 3 | | Total | | Principal Balance(A) | | Carrying Value(B) | | Level 1 | | Level 2 | | Level 3 | | Total |
| Assets | | | | | | | | | | | | | | | | | | | | | | | | |
| Cash and cash equivalents | | $ | 23,124 |
| | $ | 23,124 |
| | $ | 23,124 |
| | $ | — |
| | $ | — |
| | $ | 23,124 |
| | $ | 192,771 |
| | $ | 192,771 |
| | $ | 192,771 |
| | $ | — |
| | $ | — |
| | $ | 192,771 |
|
Commercial mortgage loans, held-for-investment, net(C) | | 2,287,749 |
| | 2,273,190 |
| | — |
| | — |
| | 2,278,072 |
| | 2,278,072 |
| | 3,282,184 |
| | 3,261,878 |
| | — |
| | — |
| | 3,266,234 |
| | 3,266,234 |
|
| Equity method investments, at fair value | | 18,295 |
| | 18,295 |
| | — |
| | — |
| | 18,295 |
| | 18,295 |
| | 24,745 |
| | 24,745 |
| | — |
| | — |
| | 24,745 |
| | 24,745 |
|
| Commercial mortgage loans held in variable interest entities, at fair value | | 5,294,435 |
| | 5,278,715 |
| | — |
| | — |
| | 5,278,715 |
| | 5,278,715 |
| | 1,130,672 |
| | 1,100,089 |
| | — |
| | — |
| | 1,100,089 |
| | 1,100,089 |
|
| | | $ | 7,623,603 |
| | $ | 7,593,324 |
| | $ | 23,124 |
| | $ | — |
| | $ | 7,575,082 |
| | $ | 7,598,206 |
| | $ | 4,630,372 |
| | $ | 4,579,483 |
| | $ | 192,771 |
| | $ | — |
| | $ | 4,391,068 |
| | $ | 4,583,839 |
|
| Liabilities | | | | | | | | | | | | | | | | | | | | | | | | |
| Secured financing agreements, net | | $ | 1,287,097 |
| | $ | 1,282,583 |
| | $ | — |
| | $ | — |
| | $ | 1,287,097 |
| | $ | 1,287,097 |
| | $ | 2,126,047 |
| | $ | 2,115,954 |
| | $ | — |
| | $ | — |
| | $ | 2,126,047 |
| | $ | 2,126,047 |
|
| Convertible notes, net | | | 143,750 |
| | 137,339 |
| | 146,208 |
| | — |
| | — |
| | 146,208 |
|
| Loan participations sold, net | | 82,000 |
| | 81,500 |
| | — |
| | — |
| | 81,918 |
| | 81,918 |
| | 83,886 |
| | 83,442 |
| | — |
| | — |
| | 83,257 |
| | 83,257 |
|
| Variable interest entity liabilities, at fair value | | 4,985,276 |
| | 5,157,430 |
| | — |
| | — |
| | 5,157,430 |
| | 5,157,430 |
| | 1,095,731 |
| | 1,086,939 |
| | — |
| | — |
| | 1,086,939 |
| | 1,086,939 |
|
| | | $ | 6,354,373 |
| | $ | 6,521,513 |
| | $ | — |
| | $ | — |
| | $ | 6,526,445 |
| | $ | 6,526,445 |
| | $ | 3,449,414 |
| | $ | 3,423,674 |
| | $ | 146,208 |
| | $ | — |
| | $ | 3,296,243 |
| | $ | 3,442,451 |
|
| |
| (A) | The principal balance of commercial mortgage loans excludes premiums and unamortized discounts. |
| |
| (B) | The carrying value of commercial mortgage loans is presented net of $14.6$20.3 million unamortized origination discounts and deferred nonrefundable fees. The carrying value of secured financing agreements is presented net of $4.5$10.1 million unamortized debt issuance costs. |
| |
| (C) | Includes senior loans for which KREF sold a loan participation that was not treated as a sale under GAAP, with a carrying value of $81.5$83.4 million and a fair value of $81.9$83.3 million as of March 31,September 30, 2018. |
The carrying values and fair values of KREF’s financial assets recorded at fair value on a recurring basis, as well as other financial instruments for which fair value is disclosed, as of December 31, 2017 were as follows:
|
| | | | | | | | | | | | | | | | | | | | | | | | |
| | | | | | | Fair Value |
| | | Principal Balance(A) | | Carrying Value(B) | | Level 1 | | Level 2 | | Level 3 | | Total |
| Assets | | | | | | | | | | | | |
| Cash and cash equivalents | | $ | 103,120 |
| | $ | 103,120 |
| | $ | 103,120 |
| | $ | — |
| | $ | — |
| | $ | 103,120 |
|
| Restricted cash | | 400 |
| | 400 |
| | 400 |
| | — |
| | — |
| | 400 |
|
Commercial mortgage loans, held-for-investment, net(C) | | 1,901,693 |
| | 1,888,510 |
| | — |
| | — |
| | 1,894,870 |
| | 1,894,870 |
|
| Equity method investments, at fair value | | 14,390 |
| | 14,390 |
| | — |
| | — |
| | 14,390 |
| | 14,390 |
|
| Commercial mortgage loans held in variable interest entities, at fair value | | 5,305,976 |
| | 5,372,811 |
| | — |
| | — |
| | 5,372,811 |
| | 5,372,811 |
|
| | | $ | 7,325,579 |
| | $ | 7,379,231 |
| | $ | 103,520 |
| | $ | — |
| | $ | 7,282,071 |
| | $ | 7,385,591 |
|
| Liabilities | | | | | | | | | | | | |
| Secured financing agreements, net | | $ | 969,347 |
| | $ | 964,800 |
| | $ | — |
| | $ | — |
| | $ | 969,347 |
| | $ | 969,347 |
|
| Loan participations sold, net | | 82,000 |
| | 81,472 |
| | — |
| | — |
| | 81,836 |
| | 81,836 |
|
| Variable interest entity liabilities, at fair value | | 4,996,817 |
| | 5,256,926 |
| | — |
| | — |
| | 5,256,926 |
| | 5,256,926 |
|
| | | $ | 6,048,164 |
| | $ | 6,303,198 |
| | $ | — |
| | $ | — |
| | $ | 6,308,109 |
| | $ | 6,308,109 |
|
| |
| (A) | The principal balance of commercial mortgage loans excludes premiums and discounts. |
| |
| (B) | The carrying value of commercial mortgage loans is presented net of $13.2 million origination discounts and deferred nonrefundable fees. The carrying value of secured financing agreements is presented net of $4.5 million unamortized debt issuance costs. |
| |
| (C) | Includes senior loans for which KREF sold a loan participation that was not treated as a sale under GAAP, with a carrying value of $81.5 million and a fair value of $81.8 million as of December 31, 2017. |
KKR Real Estate Finance Trust Inc.
Notes to Condensed Consolidated Financial Statements (Unaudited)
(dollars in tables in thousands, except per share amounts)
KREF reported the following financial assets and liabilities at fair value on a recurring basis using Level 3 inputs as of March 31,September 30, 2018.
| | | | | Assets | | Liabilities | | | | Assets | | Liabilities | | |
| | | Commercial Mortgage Loans Held in Variable Interest Entities, at Fair Value | | Variable Interest Entity Liabilities, at Fair Value | | Net | | Commercial Mortgage Loans Held in Variable Interest Entities, at Fair Value | | Variable Interest Entity Liabilities, at Fair Value | | Net |
| Balance as of December 31, 2017 | | $ | 5,372,811 |
| | $ | 5,256,926 |
| | $ | 115,885 |
| | $ | 5,372,811 |
| | $ | 5,256,926 |
| | $ | 115,885 |
|
| Gains (losses) included in net income | | | | | | | | | | | | |
| Included in change in net assets related to consolidated variable interest entities | | (83,151 | ) | | (88,528 | ) | | 5,377 |
| |
| Purchases and repayments | | | | | | | |
| Realized gain (loss) | | | 13,000 |
| | — |
| | 13,000 |
|
| Unrealized gain (loss) included in change in net assets related to consolidated variable interest entities | | | (94,643 | ) | | (92,499 | ) | | (2,144 | ) |
| Purchases and sales/repayments | | | | | | | |
| Purchases | | — |
| | — |
| | — |
| | — |
| | — |
| | — |
|
| Repayments | | (11,540 | ) | | (11,540 | ) | | — |
| |
| Sales/Repayments/Deconsolidation | | | (4,175,371 | ) | | (4,062,624 | ) | | (112,747 | ) |
Other(A) | | 595 |
| | 572 |
| | 23 |
| | (15,708 | ) | | (14,864 | ) | | (844 | ) |
| Balance as of March 31, 2018 | | $ | 5,278,715 |
| | $ | 5,157,430 |
| | $ | 121,285 |
| |
| Balance as of September 30, 2018 | | | $ | 1,100,089 |
| | $ | 1,086,939 |
| | $ | 13,150 |
|
| |
| (A) | Amounts principally consist of changes in accrued interest. |
The following table contains the Level 3 inputs used to value assets and liabilities on a recurring and nonrecurring basis or where KREF discloses fair value as of March 31,September 30, 2018:
| | | | | Fair Value | | Valuation Methodologies | | Unobservable Inputs(A) | | Weighted Average(B) | | Range | | Fair Value | | Valuation Methodologies | | Unobservable Inputs(A) | | Weighted Average(B) | | Range |
Assets(C) | | | | | | |
| Commercial mortgage loans, held-for-investment, net | | $ | 2,278,072 |
| | Discounted cash flow | | Loan-to-value ratio | | 68.7% | | 45.5% - 94.2% | | $ | 3,266,234 |
| | Discounted cash flow | | Loan-to-value ratio | | 67.8% | | 49.4% - 80.3% |
| | | | | Discount rate | | 5.4% | | 2.3% - 13.9% | | | | Discount rate | | 6.7% | | 2.6% - 13.9% |
Commercial mortgage loans held in variable interest entities, at fair value(D) | | 5,278,715 |
| | Discounted cash flow | | Yield | | 7.6% | | 2.6% - 29.8% | | 1,100,089 |
| | Discounted cash flow | | Yield | | 8.3% | | 2.4% - 37.1% |
| | | $ | 7,556,787 |
| | | $ | 4,366,323 |
| |
| Liabilities | | | | | | |
| Secured financing agreements, net | | $ | 1,287,097 |
| | Market comparable | | Credit spread | | 2.0% | | 1.8% - 2.5% | | $ | 2,126,047 |
| | Market comparable | | Credit spread | | 1.8% | | 1.4% - 2.5% |
| Loan participations sold, net | | 81,918 |
| | Discounted cash flow | | Loan-to-value ratio | | 54.5% | | 54.5% - 54.5% | | 83,257 |
| | Discounted cash flow | | Loan-to-value ratio | | 52.9% | | 52.9% - 52.9% |
| | | | | Discount rate | | 3.3% | | 2.3% - 4.3% | | | | Discount rate | | 3.6% | | 2.6% - 4.6% |
| Variable interest entity liabilities, at fair value | | 5,157,430 |
| | Discounted cash flow | | Yield | | 5.8% | | 2.6% - 26.0% | | 1,086,939 |
| | Discounted cash flow | | Yield | | 6.4% | | 2.4% - 16.5% |
| | | $ | 6,526,445 |
| | | $ | 3,296,243 |
| |
| |
| (A) | An increase (decrease) in the valuation input results in a decrease (increase) in value. |
| |
| (B) | Represents the average of the input value, weighted by the unpaid principal balance of the financial instrument. |
| |
| (C) | KREF carries a $18.1$24.4 million investment in an aggregator vehicle alongside RECOP (Note 6)7) at its pro rata share of the aggregator's net asset value, which management believes approximates fair value. |
| |
| (D) | Management measures the fair value of "Commercial mortgage loans held in variable interest entities, at fair value" using the fair value of the CMBS trust liabilities. The Level 3 inputs presented in the table above reflect the inputs used to value the CMBS trust liabilities, including the CMBS beneficially owned by KREF stockholders eliminated in consolidation of the CMBS trusts. |
KKR Real Estate Finance Trust Inc.
Notes to Condensed Consolidated Financial Statements (Unaudited)
(dollars in tables in thousands, except per share amounts)
Valuation Methodologies
Commercial Mortgage Loans and Participation Sold - Management generally considers KREF's commercial mortgage loans Level 3 assets in the fair value hierarchy as such assets are illiquid, structured investments that are specific to the property and its operating performance. These loans are valued using a discounted cash flow model using discount rates derived from observable market data applied to the capital structure of the respective sponsor and estimated property value. On a quarterly basis, management engages an independent valuation firm to express an opinion on the fair value of each loan categorized as a Level 3 asset in the form of a range. Management selects a value within the range provided by the independent valuation firm to assess the reasonableness of the fair value as determined by management. In the event that management's estimate of fair value differs from the opinion of fair value provided by the independent valuation firm, KREF ultimately relies solely upon the valuation prepared by the investment personnel of the Manager.
Commercial Mortgage-Backed Securities — As of March 31,September 30, 2018, management categorized CMBS investments as Level 3 assets and liabilities in the fair value hierarchy and obtained prices from an independent valuation firm, which uses a discounted cash flow model, to value each CMBS. The key input is the expected yield of each CMBS using both observable and unobservable factors, which may include recently offered or completed trades and published yields of similar securities, security-specific characteristics (e.g. securities ratings issued by nationally recognized statistical rating organizations, credit support by other subordinate securities issued by the CMBS and coupon type) and other characteristics. Management performs quarterly reviews of the inputs received from the independent valuation firm based on consideration given to a number of observable market data points including, but not limited to, trading activity in the marketplace of like-kind securities, benchmark security evaluations and bid list results from various sources. If prices received from the independent valuation firm are inconsistent with values determined in connection with management's independent review, management makes inquiries to the independent valuation firm about the prices received and related methods. In the event management determines the price obtained from an independent valuation firm to be unreliable or an inadequate representation of the fair value of the CMBS (based on consideration given to the observable market data points detailed above), management then compiles evidence independently and presents the independent valuation firm with such evidence supporting a different value. As a result, the independent valuation firm may revise their price accordingly. However, if management continues to disagree with the price from the independent valuation firm, in light of evidence presented that management compiled independently and believes to be compelling, management considers the quotation unreliable or an inadequate representation of the fair value of the CMBS.
In the event that the quotation from the independent valuation firm is not available or determined to be unreliable or an inadequate representation of the fair value of the CMBS (based on the procedures detailed above), valuations are prepared using inputs based on non-binding broker quotes obtained from independent, well-known, major financial brokers that are CMBS market makers. In validating any non-binding broker quote used in this circumstance, management compares the non-binding quote to the observable market data points at such time and used to validate prices received from the independent valuation firm in addition to understanding the valuation methodologies used by the market makers. These market participants utilize a similar methodology as the independent valuation firm to value each CMBS, with the key input of expected yield determined independently based on both observable and unobservable factors (as described above). To avoid reliance on any single broker-dealer, management receives a minimum of two non-binding quotes, of which the average is used.
The fair values of the CMBS not beneficially owned by KREF stockholders neither impact the net assets of KREF nor the net income attributable to KREF's stockholders.
Secured Financing Agreements — Management considers KREF's repurchase facilities Level 3 liabilities in the fair value hierarchy as such liabilities represent borrowings on illiquid collateral with terms specific to each borrower. Given the short-to-moderate term of the floating rate facilities, management generally expects the fair value of KREF's repurchase facilities to approximate their outstanding principal balances. On a quarterly basis, management engages an independent valuation firm to express an opinion on the fair value of KREF's repurchase facilities. The independent valuation firm employs a market-based methodology to compare the pricing of KREF's financing agreements with other similar financing agreements entered into by other mortgage REIT and recent financing transactions.
KKR Real Estate Finance Trust Inc.
Notes to Condensed Consolidated Financial Statements (Unaudited)
(dollars in tables in thousands, except per share amounts)
Assets and Liabilities Measured at Fair Value on a Nonrecurring Basis
Certain assets not measured at fair value on an ongoing basis but subject to fair value adjustments only in certain circumstances, such as when there is evidence of impairment, are measured at fair value on a nonrecurring basis. For commercial mortgage loans held-for-sale, KREF applies the lower of cost or fair value accounting and may be required, from time to time, to record a nonrecurring fair value adjustment. For commercial mortgage loans held-for-investment and preferred interest in joint venture held-to-maturity, KREF applies the amortized cost method of accounting, but may be required, from time to time, to record a nonrecurring fair value adjustment in the form of a valuation provision or impairment. KREF did not report any significant financial assets or liabilities at fair value on a nonrecurring basis as of March 31,September 30, 2018 or December 31, 2017.
Assets and Liabilities for Which Fair Value is Only Disclosed
KREF does not carry its secured financing agreements at fair value as management did not elect the fair value option for these liabilities. As of March 31,September 30, 2018, the fair value of KREF's floating rate repurchase facilities approximated the outstanding principal balance.
Note 12.13. Income Taxes
KREF has elected to be taxed as a REIT under Sections 856 through 860 of the Internal Revenue Code commencing with its taxable year ended December 31, 2014. A REIT is generally not subject to U.S. federal and state income tax on that portion of its income that is distributed to stockholders if it distributes at least 90% of its REIT taxable income, determined without regard to the deduction for dividends paid and excluding any net capital gains. A REIT will also be subject to a nondeductible excise tax to the extent certain percentages of its taxable income are not distributed within specified dates. KREF expects to distribute 100% of its net taxable income for the foreseeable future, while retaining sufficient capital to support its ongoing needs.
KREF consolidates subsidiaries that incur U.S. federal, state and local income taxes, based on the tax jurisdiction in which each subsidiary operates. During each of the threenine months ended March 31,September 30, 2018 and 2017, KREF recorded a current income tax provision of $0.2 million and $0.1$0.4 million, respectively, related to operations of its taxable REIT subsidiaries and various other state and local taxes. There were no deferred tax assets or liabilities as of March 31,September 30, 2018 and December 31, 2017.
As of March 31,September 30, 2018, tax years 2014 through 2017 remain subject to examination by taxing authorities.
KKR Real Estate Finance Trust Inc.
Notes to Condensed Consolidated Financial Statements (Unaudited)
(dollars in tables in thousands, except per share amounts)
Note 13.14. Subsequent Events
The following events occurred subsequent to March 31,September 30, 2018:
Investing Activities
KREF originated the following senior loan subsequent to March 31,September 30, 2018:
| | | Description/ Location | | Property Type | | Month Originated | | Maximum Face Amount | | Initial Face Amount Funded | | Interest Rate(A) | | Maturity Date(B) | | LTV | | Property Type | | Month Originated | | Maximum Face Amount | | Initial Face Amount Funded | | Interest Rate(A) | | Maturity Date(B) | | LTV |
| Long Island City, New York | | Office | | May 2018 | | $ | 350,000 |
| | $ | 211,735 |
| | L + 3.3% | | June 2023 | | 71% | |
| Senior Loan, Queens, NY | | | Multifamily | | October 2018 | | $ | 45,000 |
| | $ | 42,000 |
| | L + 2.8% | | November 2023 | | 70% |
| Senior Loan, Philadelphia, NY | | | Multifamily | | October 2018 | | $ | 77,000 |
| | $ | 77,000 |
| | L + 2.7 | | November 2023 | | 73% |
| Total/Weighted Average | | | $ | 122,000 |
| | $ | 119,000 |
| | L + 2.7% | | 72% |
| |
| (A) | Floating rate based on one-month USD LIBOR. |
| |
| (B) | Maturity date assumes all extension options are exercised, if applicable. |
Funding of Previously Closed Loans
KREF funded approximately $14.7$19.2 million for previously closed loans subsequent to March 31,September 30, 2018.
CMBS SaleLoan Repayments
In AprilOctober 2018, KREF sold its controlling beneficial interest in four of the five CMBS trusts held for $112.7 million. Such investments had an unpaid principal balance and fair value of $274.2received approximately $8.4 million and $105.2 million, respectively, as of March 31, 2018 and $274.2 million and $99.7 million, respectively, as of December 31, 2017. Accordingly, KREF realized $11.9 million in gain on the sale of such investments in the second quarter of 2018, out of which $5.4 million was unrealized in the quarter ended March 31, 2018.from loan repayments.
Subsequent to the sale, KREF continues to hold CMBS with a fair value of $15.0 million as of March 31, 2018, including a controlling beneficial interest in one CMBS trust. In addition, KREF has a $40.0 million commitment to invest in the aggregator vehicle alongside RECOP that invests in CMBS, of which $18.0 million was funded.
Financing Activities
In AprilOctober 2018, KREF borrowed $25.0 million in proceeds under the Goldman Sachs master repurchase facility.
Term Loan Financing Facility
In April 2018, KREF entered into a term loan financing arrangement (“Term Loan Facility”) with third party lenders. The Term Loan Facility provides asset-based financingincreased borrowing capacity on a non-mark to market basis with matched-term up to five years and is non-recourse to the Company. As of May 9, 2018, the Term Loan Facility, hadwhich provides financing on a maximum facility amount ofmatched-term, non-mark to market and non-recourse basis by $400.0 million and an outstanding balance of $306.1 million.
to $1.0 billion. In connection with this facility, and in consideration for structuring and sourcing this arrangement,November 2018, KREF will pay KKR Capital Markets LLC, an affiliate of the Manager, a structuring fee equal to 0.75% of the respective committed loan advancesborrowed $65.5 million under the agreement.Term Loan Facility.
KKR Real Estate Finance Trust Inc.
Notes to Condensed Consolidated Financial Statements (Unaudited)
(dollars in tables in thousands, except per share amounts)
In October and November 2018, KREF net borrowed $15.5 million under its master repurchase facilities.
Corporate Activities
Dividends
In AprilOctober 2018, KREF paid $21.2$25.0 million in dividends on its common and special voting preferred stock, or $0.40$0.43 per share, with respect to the firstthird quarter of 2018, to stockholders of record on March 29,September 28, 2018.
In May 2018, KREF’s Board of Directors declared a dividend of $0.43 per share of common stock and special voting preferred stock with respect to the second quarter of 2018. The dividend is payable on July 13, 2018 to KREF’s common stockholders and its special voting preferred stockholders of record as of June 29, 2018.
Share Buyback
Subsequent to March 31, 2018, KREF repurchased 52,405 shares of its common stock for a total of $1.0 million at a weighted average price per share of $19.70.
On May 7, 2018, KREF’s Board of Directors approved a new share repurchase program, effective following the expiration of its current share repurchase program on June 12, 2018. The Board of Directors has authorized the repurchase of up to $100.0 million of KREF’s common stock during the period from June 13, 2018 through June 30, 2019. Of this amount, a total of $50.0 million will be covered by a pre-set trading plan meeting the requirements of Rule 10b5-1 under the Exchange Act and provide for repurchases of KREF’s common stock when the market price per share of KREF’s common stock is below book value per share (calculated in accordance with GAAP as of end of the most recent quarterly period for which financial statements are available). The remaining $50.0 million may be used for repurchases in the open market, pursuant to pre-set trading plans meeting the requirements of Rule 10b5-1 under the Exchange Act, in privately negotiated transactions or otherwise.
ITEM 2. MANAGEMENT'S DISCUSSION AND ANALYSIS OF FINANCIAL CONDITION AND RESULTS OF OPERATIONS
The following discussion and analysis should be read in conjunction with our unaudited condensed consolidated financial statements and the related notes included elsewhere in this Form 10-Q, and the Prospectus,Form 10-K, including the audited consolidated financial statements and the related notes and “Management’s Discussion and Analysis of Financial Condition and Results of Operations” contained therein. The historical condensed consolidated financial data discussed below reflects the historical results and financial position of KREF. In addition, this discussion and analysis contains forward-looking statements and involves numerous risks and uncertainties, including those described under “Cautionary Note Regarding Forward-Looking Statements" in this Form 10-Q and under "Part I, Item 1A. and "Risk Factors" in the Form 10-K. Actual results may differ materially from those contained in any forward-looking statements.
Overview
Our Company and Our Investment Strategy
We are a real estate finance company that focuses primarily on originating and acquiring senior loans secured by commercial real estate ("CRE") assets. We are a Maryland corporation that was formed and commenced operations on October 2, 2014, and we have elected to qualify as a REIT for U.S. federal income tax purposes. Our investment strategy is to originate or acquire senior loans collateralized by institutional-quality CRE assets that are owned and operated by experienced and well-capitalized sponsors and located in liquid markets with strong underlying fundamentals. The assets in which we invest include senior loans, mezzanine loans, preferred equity and the junior-most bonds ("CMBS B-Pieces") of commercial mortgage-backed securities ("CMBS") and other real estate-related securities. Our investment allocation strategy is influenced by prevailing market conditions at the time we invest, including interest rate, economic and credit market conditions. In addition, we may invest in assets other than our target assets in the future, in each case subject to maintaining our qualification as a REIT for U.S. federal income tax purposes and our exclusion from registration under the Investment Company Act of 1940. Our investment objective is capital preservation and generating attractive risk-adjusted returns for our stockholders over the long term, primarily through dividends.
Our Manager
We are externally managed by our Manager, KKR Real Estate Finance Manager LLC, a subsidiary of KKR. KKR is a leading global investment firm with a 40-year history of leadership, innovation, and investment excellence and has committed $400.0 million in equity capital to us. KKR manages multiple alternative asset classes, including private equity, real estate, energy, infrastructure and credit, and, through itswith strategic manager partnerships that manage hedge funds. Our Manager manages our investments and our day-to-day business and affairs in conformity with our investment guidelines and other policies that are approved and monitored by our board of directors. Our Manager is responsible for, among other matters, (i) the selection, origination or purchase and sale of our portfolio investments, (ii) our financing activities and (iii) providing us with investment advisory services. Our Manager is also responsible for our day-to-day operations and performs (or causes to be performed) such services and activities relating to our investments and business and affairs as may be appropriate. Our investment decisions are approved by an investment committee of our Manager that is comprised of senior investment professionals of KKR, including senior investment professionals of KKR's global real estate group. For a summary of certain terms of the management agreement, see Note 1011 to our condensed consolidated financial statements included in this Form 10-Q.
Key Financial Measures and Indicators
As a real estate finance company, we believe the key financial measures and indicators for our business are earnings per share, dividends declared, Core Earnings, Net Core Earnings and book value per share.
Earnings Per Share and Dividends Declared
The following table sets forth the calculation of basic and diluted net income per share and dividends declared per share (amounts in thousands, except share and per share data):
| | | | | Three Months Ended | | Three Months Ended |
| | | March 31, 2018 | | December 31, 2017 | | September 30, 2018 | | June 30, 2018 |
Net income(A) | | $ | 23,280 |
| | $ | 17,034 |
| | $ | 20,821 |
| | $ | 23,483 |
|
| Weighted-average number of shares of common stock outstanding | | | | | | | | |
| Basic | | 53,337,915 |
| | 53,685,440 |
| | 55,903,126 |
| | 53,064,585 |
|
| Diluted | | 53,378,467 |
| | 53,688,027 |
| | 55,921,655 |
| | 53,069,866 |
|
| Net income per share, basic | | $ | 0.44 |
| | $ | 0.32 |
| | $ | 0.37 |
| | $ | 0.44 |
|
| Net income per share, diluted | | $ | 0.44 |
| | $ | 0.32 |
| | $ | 0.37 |
| | $ | 0.44 |
|
Dividends declared per share(B) | | $ | 0.40 |
| | $ | 0.37 |
| | $ | 0.43 |
| | $ | 0.43 |
|
| |
| (A) | Represents net income attributable to common stockholders. |
| |
| (B) | During the three months ended March 31,September 30, 2018, we declared a dividend of $0.40$0.43 per share of common stock paid on AprilOctober 12, 2018 to stockholders of record on September 28, 2018 related to income generated during the three months ended September 30, 2018. During the three months ended June 30, 2018, we declared a dividend of $0.43 per share of common stock paid on July 13, 2018 to shareholdersstockholders of record on MarchJune 29, 2018 related to income generated during the three months ended March 31,June 30, 2018. During the three months ended December 31, 2017, we declared a dividend of $0.37 per share of common stock paid on January 12, 2018 to shareholders of record on December 29, 2017 related to income generated during the three months ended December 31, 2017. |
Core Earnings and Net Core Earnings
We use Core Earnings and Net Core Earnings to evaluate our performance excluding the effects of certain transactions and GAAP adjustments we believe are not necessarily indicative of our current loan activity and operations. Core Earnings and Net Core Earnings are measures that are not prepared in accordance with GAAP. We define Core Earnings as net income (loss) attributable to our stockholders or, without duplication, owners of our subsidiaries, computed in accordance with GAAP, including realized losses not otherwise included in GAAP net income (loss) and excluding (i) non-cash equity compensation expense, (ii) the incentive compensation payable to our Manager, (iii) depreciation and amortization, (iv) any unrealized gains or losses or other similar non-cash items that are included in net income for the applicable reporting period, regardless of whether such items are included in other comprehensive income or loss, or in net income, and (v) one-time events pursuant to changes in GAAP and certain material non-cash income or expense items after discussions between our Manager and our board of directors (and subject to the approval by a majority of our independent directors). The exclusion of depreciation and amortization from the calculation of Core Earnings only applies to debt investments related to real estate to the extent we foreclose upon the property or properties underlying such debt investments. Net Core Earnings is Core Earnings less incentive compensation payable to our Manager.
We believe providing Core Earnings and Net Core Earnings on a supplemental basis to our net income as determined in accordance with GAAP is helpful to stockholders in assessing the overall performance of our business. Core Earnings and Net Core Earnings should not be considered as a substitute for GAAP net income. We caution readers that our methodology for calculating Core Earnings and Net Core Earnings may differ from the methodologies employed by other REITs to calculate the same or similar supplemental performance measures, and as a result, our Core Earnings and Net Core Earnings may not be comparable to similar measures presented by other REITs.
We also use Core Earnings to determine the management and incentive fees we pay our Manager. For information on the fees we payits services to KREF, our Manager is entitled to a quarterly management fee equal to the greater of $62,500 or 0.375% of a weighted average adjusted equity and quarterly incentive compensation equal to 20.0% of the excess of (a) the trailing 12-month Core Earnings over (b) 7.0% of the trailing 12-month weighted average adjusted equity (“Hurdle Rate”), less incentive compensation KREF already paid to the Manager with respect to the first three calendar quarter of such trailing 12-month period. The quarterly incentive compensation is calculated and paid in arrears with a three month lag. During the third quarter of 2018, the Company incurred $3.3 million of incentive fees payable to the Manager, of which $2.4 million, or $0.04 per share, was related to the gain
recognized as a result of the April 2018 CMBS sale, see Note 107 to our condensed consolidated financial statements included in this Form 10-Q.
The following tables provide a reconciliation of GAAP net income attributable to common stockholders to Core Earnings and Net Core Earnings (amounts in thousands, except share and per share data):
| | | | | Three Months Ended | | Three Months Ended |
| | | March 31, 2018 | | December 31, 2017 | | September 30, 2018 | | June 30, 2018 |
| Net Income (Loss) Attributable to Common Stockholders | | $ | 23,280 |
| | $ | 17,034 |
| | $ | 20,821 |
| | $ | 23,483 |
|
| Adjustments | | | | | | | | |
| Non-cash equity compensation expense | | 1,018 |
| | 25 |
| | 295 |
| | 273 |
|
| Incentive compensation to affiliate | | — |
| | — |
| | 3,286 |
| | — |
|
| Depreciation and amortization | | — |
| | — |
| | — |
| | — |
|
| Unrealized (gains) or losses | | (5,377 | ) | | 79 |
| | 205 |
| | 1,822 |
|
Core Earnings(A) | | 18,921 |
| | 17,138 |
| |
| Non-cash convertible notes discount amortization | | | 91 |
| | 42 |
|
Reversal of previously unrealized gain now realized(A) | | | — |
| | 11,900 |
|
Core Earnings(B) | | | 24,698 |
| | 37,520 |
|
| Incentive compensation to affiliate | | — |
| | — |
| | 3,286 |
| | — |
|
| Net Core Earnings | | $ | 18,921 |
| | $ | 17,138 |
| | $ | 21,412 |
| | $ | 37,520 |
|
| Weighted average number of shares of common stock outstanding | | | | | | | | |
| Basic | | 53,337,915 |
| | 53,685,440 |
| | 55,903,126 |
| | 53,064,585 |
|
| Diluted | | 53,378,467 | | 53,688,027 | | 55,921,655 | | 53,069,866 |
| Core Earnings per Diluted Weighted Average Share | | $ | 0.35 |
| | $ | 0.32 |
| | $ | 0.44 |
| | $ | 0.71 |
|
| Net Core Earnings per Diluted Weighted Average Share | | $ | 0.35 |
| | $ | 0.32 |
| | $ | 0.38 |
| | $ | 0.71 |
|
| |
| (A) | Excludes $1.1Includes $5.5 million and $1.1$6.4 million of unrealized gains related to the first quarter of 2018 and to prior periods, respectively, that were realized during the three months ended June 30, 2018.
|
| |
| (B) | Excludes $0.2 million and $0.2 million, or $0.02$0.00 and $0.02$0.00 per diluted weighted average share outstanding, of net original issue discount on CMBS B-Pieces accreted as a component of taxable income during the three months endedMarch 31, September 30, 2018 and December 31, 2017,June 30, 2018, respectively. |
Book Value per Share
We believe that book value per share is helpful to stockholders in evaluating the growth of our company as we have scaled our equity capital base and continue to invest in our target assets. The following table calculates our book value per share of common stock (amounts in thousands, except share and per share data):
| | | | | March 31, 2018 | | December 31, 2017 | | September 30, 2018 | | December 31, 2017 |
| KKR Real Estate Finance Trust Inc. stockholders' equity | | $ | 1,050,295 |
| | $ | 1,059,145 |
| | $ | 1,146,301 |
| | $ | 1,059,145 |
|
| Shares of common stock issued and outstanding at period end | | 53,075,575 |
| | 53,685,440 |
| | 58,022,590 |
| | 53,685,440 |
|
| Book value per share of common stock | | $ | 19.79 |
| | $ | 19.73 |
| | $ | 19.76 |
| | $ | 19.73 |
|
During the fourth quarter of 2018, the Company expects to recognize a $2.3 million increase to the redemption value of our Special Non-Voting Preferred Stock, which became redeemable in the second quarter, from $0.4 million to $2.7 million. This increase is related to the increase in our Manager’s third quarter earnings primarily due to the recognition of $3.3 million of incentive fees, of which $2.4 million was related to the second quarter CMBS sale. In accordance with GAAP, the non-cash redemption value adjustment will reduce our fourth quarter Net Income Attributable to Common Stockholders and will be added back to Core Earnings. Accordingly, the non-cash adjustment will reduce our fourth quarter book value per share. We expect the redemption value to normalize in the first half of 2019.
Our Portfolio
We have established a portfolio of diversified investments, consisting of performing senior loans, mezzanine loans and CMBS B-Pieces, which had a value of $2,473.8$3,382.6 million as of March 31,September 30, 2018. Loan fundings during the quarter totaled $421.1$698.0 million and repayments totaled $35.0$281.4 million. We generated interest income of $31.7$51.9 million and incurred interest expense of $10.7$23.3 million during the third quarter, which resulted in $21.0$28.6 million of net interest income during the three months ended March 31,September 30, 2018.
As we continue to scale our portfolio, we expect that our originations will continue to be heavily weighted toward floating-rate loans. As of September 30, 2018, 98% of our loans by total loan exposure earned a floating rate of interest. We expect the majority of our future investment activity to focus on originating floating-rate senior loans that we finance with our repurchase and other term financing facilities, with a secondary focus on originated floating-rate loans for which we syndicate a senior position and retain a subordinated interest for our portfolio. As a result, we expect that the percentage of our target portfolio comprised of CMBS B-Pieces will decrease over time and the percentage of floating-rate investments, including senior loans, will increase over time. As of March 31,September 30, 2018, our portfolio had experienced no impairments and did not contain any legacy assets that were originated prior to October 2014. As of March 31,September 30, 2018, all of our investments were located in the United States. The following charts illustrate the diversification of our portfolio, based on type of investment, interest rate, underlying property type and geographic location, as of March 31,September 30, 2018:
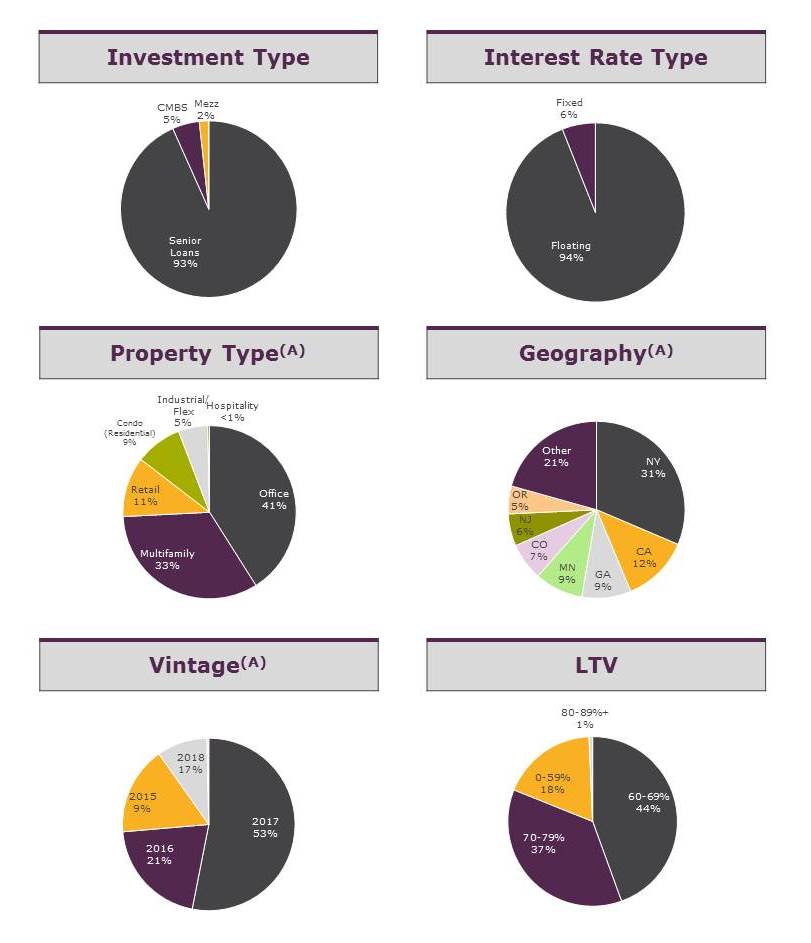
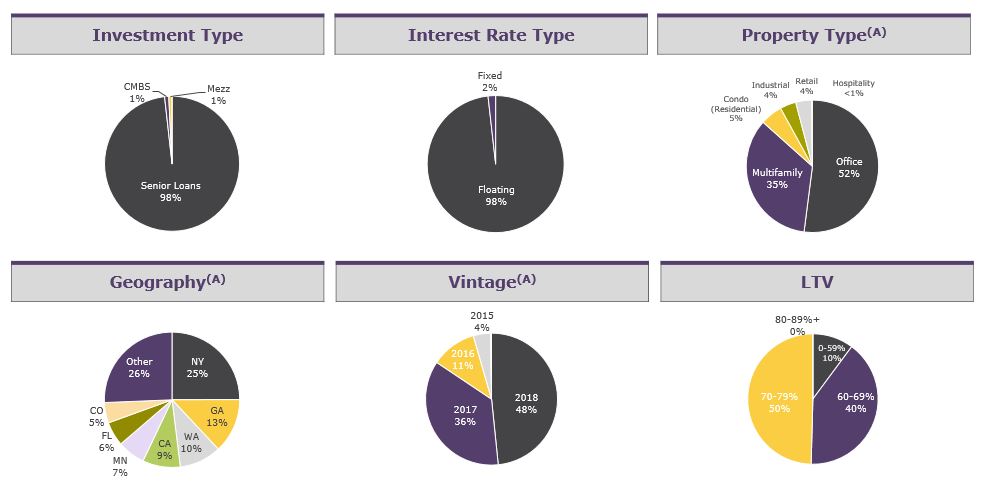
The charts above are based on total assets. Total assets reflect (i) the principal amount of our senior and mezzanine loans; and (ii) the cost basis of our CMBS B-Pieces, net of VIE liabilities. In accordance with GAAP, we carry our CMBS B-PiecesB-Piece investments at fair value, which we valued above our cost basis as of March 31, 2018. Duringvalue. In April 2018, we sold our controlling beneficial interest in four of our five CMBS trusts for net proceeds of $112.7 million. Refer to Subsequent Events Note 13 toDuring the condensed consolidated financial statements for further detail regardingthree and nine months ended September 30, 2018, we had a $0.2 million and $2.1 million unrealized loss on the sale.remaining CMBS investment, respectively.
(A) Excludes CMBS B-Pieces. Our CMBS B-Piece portfolio diversification is as follows and is inclusive of our $18.0$23.8 million investment in RECOP:
| |
| • | Property Type: Office (26.7%(28.3%), Retail (24.7%(24.2%), Hospitality (15.0%), Multifamily (10.3%), and Other (23.3%(32.5%). As of March 31,September 30, 2018, no other individual property type comprised more than 10% of our total CMBS B‑Piece portfolio. |
| |
| • | Geography: California (22.6%), Texas (12.1%(25.3%), New York (10.1%(13.0%), Illinois (6.8%), Florida (5.4%Texas (8.8%), and Other (43.1%(52.9%). As of March 31,September 30, 2018, no other individual geography comprised more than 5% of our total CMBS B‑Piece portfolio. |
| |
| • | Vintage: 2015 (57.1%(23.7%), 2016 (29.9%(11.6%), and 2017 (13.0%(64.7%). |
The following table details our quarterly loan activity (dollars in thousands):
| | | | | Three Months Ended | | Three Months Ended |
| | | March 31, 2018 | | December 31, 2017 | | September 30, 2017 | | June 30, 2017 | | September 30, 2018 | | June 30, 2018 | | March 31, 2018 | | December 31, 2017 |
Loan originations(A) | | $ | 411,425 |
| | $ | 331,800 |
| | $ | 629,300 |
| | $ | 224,000 |
| | $ | 680,500 |
| | $ | 728,713 |
| | $ | 411,425 |
| | $ | 331,800 |
|
Loan fundings | | $ | 421,056 |
| | $ | 285,291 |
| | $ | 589,273 |
| | $ | 181,912 |
| | $ | 698,047 |
| | $ | 590,441 |
| | $ | 421,056 |
| | $ | 285,291 |
|
Loan repayments(B)(C) | | (35,000 | ) | | (19,598 | ) | | (46,732 | ) | | (1,685 | ) | | (281,436 | ) | | (14,503 | ) | | (35,000 | ) | | (19,598 | ) |
| Net fundings | | 386,056 |
| | 265,693 |
| | 542,541 |
| | 180,227 |
| | 416,611 |
| | 575,938 |
| | 386,056 |
| | 265,693 |
|
| Loan participations sold | | — |
| | (81,472 | ) | | — |
| | — |
| | — |
| | — |
| | — |
| | (81,472 | ) |
| Non-consolidated senior interest | | — |
| | — |
| | — |
| | (60,991 | ) | |
| Total activity | | $ | 386,056 |
| | $ | 184,221 |
| | $ | 542,541 |
| | $ | 119,236 |
| | $ | 416,611 |
| | $ | 575,938 |
| | $ | 386,056 |
| | $ | 184,221 |
|
| |
| (A) | Includes new loan originations and additional funding commitments made under existing loans. |
| |
| (B) | Excludes fundings on loan participations sold. |
| |
| (C) | Includes 100.0% of the proceeds from the repayment of one of the mezzanine loans held within our commercial mezzanine loan joint venture during the three months ended March 31, 2018 and our share of the redemption payment from our preferred equity investment during the three months ended September 31, 2017.2018. |
The following table details overall statistics for our loan portfolio as of March 31,September 30, 2018 (dollars in thousands):
| | | | | | | Total Loan Exposure(A) | | | | Total Loan Exposure(A) |
| | | Balance Sheet Portfolio | | Total Loan
Portfolio | | Floating Rate Loans | | Fixed Rate Loans | | Balance Sheet Portfolio | | Total Loan
Portfolio | | Floating Rate Loans | | Fixed Rate Loans |
| Number of loans | | 32 |
| | 32 |
| | 26 |
| | 6 |
| | 35 |
| | 35 |
| | 29 |
| | 6 |
|
| Principal balance | | $ | 2,287,749 |
| | $ | 2,351,378 |
| | $ | 2,325,148 |
| | $ | 26,230 |
| | $ | 3,282,184 |
| | $ | 3,348,793 |
| | $ | 3,322,563 |
| | $ | 26,230 |
|
| Carrying value | | $ | 2,273,190 |
| | $ | 2,336,819 |
| | $ | 2,310,589 |
| | $ | 26,230 |
| | $ | 3,261,878 |
| | $ | 3,328,486 |
| | $ | 3,302,256 |
| | $ | 26,230 |
|
Unfunded loan commitments(B) | | $ | 306,591 |
| | $ | 306,591 |
| | $ | 306,591 |
| | $ | — |
| | $ | 369,877 |
| | $ | 369,877 |
| | $ | 369,877 |
| | $ | — |
|
Weighted-average cash coupon(C) | | 6.0 | % | | 6.0 | % | | L + 4.1 | % | | 10.6 | % | | 5.9 | % | | 5.9 | % | | L + 3.6 | % | | 10.6 | % |
Weighted-average all-in yield(C) | | 6.5 | % | | 6.5 | % | | L + 4.5 | % | | 11.4 | % | | 6.4 | % | | 6.4 | % | | L + 4.0 | % | | 11.4 | % |
Weighted-average maximum maturity (years)(D) | | 3.7 |
| | 3.5 |
| | 3.5 |
| | 5.7 |
| | 3.9 |
| | 3.9 |
| | 3.8 |
| | 5.3 |
|
LTV(E) | | 67 | % | | 69 | % | | 67 | % | | 77 | % | | 68 | % | | 68 | % | | 68 | % | | 77 | % |
| |
| (A) | In certain instances, we finance our loans through the non-recourse sale of a senior interest that is not included in our condensed consolidated financial statements. Total loan exposure includes the entire loan we originated and financed, including $63.6$66.6 million of such non-consolidated interests that are not included within our balance sheet portfolio. |
| |
| (B) | Unfunded commitments will primarily be funded to finance property improvements or lease-related expenditures by the borrowers. These future commitments will be funded over the term of each loan, subject in certain cases to an expiration date. |
| |
| (C) | As of March 31,September 30, 2018, 100.0% of floating rate loans by principal balance are indexed to one-month USD LIBOR. In addition to cash coupon, all-in yield includes the amortization of deferred origination fees, loan origination costs and purchase discounts. Cash coupon and all-in yield for the total portfolio assume applicable floating benchmark rates as of March 31,September 30, 2018. L = one-month USD LIBOR rate; spot rate of 2.26% included in portfolio-wide averages represented as fixed rates. |
| |
| (D) | Maximum maturity assumes all extension options are exercised by the borrower; however, our loans may be repaid prior to such date. As of March 31,September 30, 2018, based on total loan exposure, 97.1%80.3% of our loans were subject to yield maintenance or other prepayment restrictions and 2.9%19.7% were open to repayment by the borrower without penalty. |
| |
| (E) | Based on LTV as of the dates loans were originated or acquired by us. |
The table below sets forth additional information relating to our portfolio as of March 31,September 30, 2018 (dollars in millions):
|
| | | | | | | | | | | | | | | | | | | | | | | | | | | |
| | Investment(A) | | Investment Date | | Committed Principal Amount | | Current Principal Amount | | Net Equity(B) | | Location | | Property Type | | Coupon(C)(D) | | Max Remaining Term (Years)(C)(E) | | LTV(C)(F) |
| | Senior Loans(G) | | | | | | | | | | | | | | | | | | |
| 1 | Senior Loan | | 8/4/2017 | | $ | 239.2 |
| | $ | 205.5 |
| | $ | 84.4 |
| | New York, NY | | Condo (Residential) | | L + 4.8% | | 2.3 |
| | 69 | % |
| 2 | Senior Loan | | 11/13/2017 | | 181.8 |
| | 137.9 |
| | 33.7 |
| | Minneapolis, MN | | Office | | L + 3.8 | | 4.7 |
| | 75 |
|
| 3 | Senior Loan | | 10/26/2015 | | 177.0 |
| | 119.8 |
| | 43.9 |
| | Portland, OR | | Retail | | L + 5.5 | | 2.6 |
| | 61 |
|
| 4 | Senior Loan | | 9/9/2016 | | 168.0 |
| | 150.5 |
| | 47.0 |
| | San Diego, CA | | Office | | L + 4.2 | | 3.5 |
| | 71 |
|
| 5 | Senior Loan | | 4/11/2017 | | 162.1 |
| | 133.0 |
| | 35.3 |
| | Irvine, CA | | Office | | L + 3.9 | | 4.1 |
| | 62 |
|
| 6 | Senior Loan | | 10/23/2017 | | 150.0 |
| | 138.4 |
| | 62.2 |
| | North Bergen, NJ | | Multifamily | | L + 4.3 | | 4.6 |
| | 57 |
|
| 7 | Senior Loan | | 9/27/2016 | | 138.6 |
| | 122.5 |
| | 40.7 |
| | Brooklyn, NY | | Retail | | L + 5.0 | | 3.5 |
| | 59 |
|
| 8 | Senior Loan | | 3/30/2017 | | 132.3 |
| | 105.7 |
| | 31.9 |
| | Brooklyn, NY | | Office | | L + 4.4 | | 4.0 |
| | 68 |
|
| 9 | Senior Loan | | 8/15/2017 | | 119.0 |
| | 95.3 |
| | 13.2 |
| | Atlanta, GA | | Office | | L + 3.0 | | 4.4 |
| | 66 |
|
| 10 | Senior Loan | | 8/23/2017 | | 105.0 |
| | 100.0 |
| | 24.4 |
| | Honolulu, HI | | Multifamily | | L + 4.0 | | 4.4 |
| | 66 |
|
| 11 | Senior Loan | | 9/14/2016 | | 103.5 |
| | 87.1 |
| | 32.7 |
| | Crystal City, VA | | Office | | L + 4.5 | | 3.5 |
| | 59 |
|
| 12 | Senior Loan | | 3/8/2018 | | 89.0 |
| | 87.0 |
| | 86.6 |
| | Westbury, NY | | Multifamily | | L + 3.1 | | 5.0 |
| | 69 |
|
| 13 | Senior Loan | | 3/29/2018 | | 86.0 |
| | 86.0 |
| | 85.4 |
| | New York, NY | | Multifamily | | L + 2.6 | | 5.0 |
| | 48 |
|
| 14 | Senior Loan | | 2/28/2017 | | 85.9 |
| | 79.4 |
| | 15.6 |
| | Denver, CO | | Multifamily | | L + 3.8 | | 3.9 |
| | 75 |
|
| 15 | Senior Loan | | 8/4/2017 | | 81.0 |
| | 81.0 |
| | 19.7 |
| | Denver, CO | | Multifamily | | L + 4.0 | | 4.3 |
| | 73 |
|
| 16 | Senior Loan | | 3/20/2018 | | 80.9 |
| | 79.0 |
| | 19.0 |
| | Seattle, WA | | Office | | L + 3.5 | | 5.0 |
| | 65 |
|
| 17 | Senior Loan | | 3/28/2018 | | 80.0 |
| | 67.8 |
| | 67.5 |
| | Orlando, FL | | Multifamily | | L + 2.8 | | 5.0 |
| | 70 |
|
| 18 | Senior Loan | | 2/15/2017 | | 79.2 |
| | 61.9 |
| | 17.1 |
| | Austin, TX | | Multifamily | | L + 4.2 | | 3.9 |
| | 71 |
|
| 19 | Senior Loan | | 1/16/2018 | | 75.5 |
| | 70.0 |
| | 17.0 |
| | St Paul, MN | | Office | | L + 3.6 | | 4.9 |
| | 73 |
|
| 20 | Senior Loan | | 7/21/2017 | | 75.1 |
| | 61.4 |
| | 15.0 |
| | Queens, NY | | Industrial | | L + 3.7 | | 4.3 |
| | 72 |
|
| 21 | Senior Loan | | 10/7/2016 | | 74.5 |
| | 70.3 |
| | 21.3 |
| | New York, NY | | Multifamily | | L + 4.4 | | 3.6 |
| | 68 |
|
| 22 | Senior Loan | | 12/17/2015 | | 73.0 |
| | 67.5 |
| | 18.2 |
| | Atlanta, GA | | Industrial | | L + 4.0 | | 2.8 |
| | 73 |
|
| 23 | Senior Loan | | 5/12/2017 | | 61.9 |
| | 48.8 |
| | 16.7 |
| | Atlanta, GA | | Office | | L + 4.0 | | 4.2 |
| | 71 |
|
| 24 | Senior Loan | | 5/19/2016 | | 55.0 |
| | 52.8 |
| | 13.3 |
| | Nashville, TN | | Office | | L + 4.3 | | 3.8 |
| | 70 |
|
| | Total/Weighted Average Senior Loans Unlevered | | | | $ | 2,673.4 |
| | $ | 2,308.6 |
| | $ | 861.8 |
| | | | | | L + 4.0% | | 4.0 |
| | 67 | % |
| | Mezzanine Loans | | | | | | | | | | | | | | | | | | |
| 1 | Mezzanine Loan | | 6/23/2015 | | $ | 16.5 |
| | $ | 16.5 |
| | $ | 16.4 |
| | Chicago, IL | | Retail | | L + 9.2 | | 2.3 |
| | 82 | % |
| 2-7 | Other Mezzanine Loans | | Various | | 26.2 |
| | 26.2 |
| | 24.9 |
| | Various | | Various | | 10.6 | | 7.1 |
| | 77 |
|
| | Total/Weighted Average Mezzanine Loans Unlevered | | | | $ | 42.7 |
| | $ | 42.7 |
| | $ | 41.3 |
| | | | | | 10.8% | | 5.3 |
| | 79 | % |
| | CMBS B-Pieces | | | | | | | | | | | | | | | | | | |
| 1 | CMBS B-Piece | | 2/10/2016 | | $ | 86.0 |
| | $ | 86.0 |
| | $ | 36.4 |
| | Various | | Various | | 4.6% | | 7.8 |
| | 64 | % |
| 2 | CMBS B-Piece | | 10/23/2015 | | 46.2 |
| | 46.2 |
| | 20.9 |
| | Various | | Various | | 4.7 | | 7.5 |
| | 64 |
|
| 3 | CMBS B-Piece | | 8/15/2015 | | 52.7 |
| | 52.7 |
| | 17.6 |
| | Various | | Various | | 4.6 | | 7.4 |
| | 69 |
|
| 4 | CMBS B-Piece | | 6/24/2015 | | 66.1 |
| | 66.1 |
| | 16.7 |
| | Various | | Various | | 3.3 | | 7.8 |
| | 66 |
|
| 5 | CMBS B-Piece | | 5/21/2015 | | 58.2 |
| | 58.2 |
| | 12.9 |
| | Various | | Various | | 3.0 | | 7.1 |
| | 65 |
|
| 6 | RECOP(H) | | 2/13/2017 | | 40.0 |
| | 18.0 |
| | 18.0 |
| | Various | | Various | | 4.5 | | 9.8 |
| | 59 |
|
| | Total/Weighted Average CMBS B-Pieces Unlevered | | | | $ | 349.2 |
| | $ | 327.2 |
| | $ | 122.5 |
| | | | | | 4.3% | | 7.9 |
| | 64 | % |
|
| | | | | | | | | | | | | | | | | | | | | | | | | | | |
| | Investment(A) | | Investment Date | | Committed Principal Amount | | Current Principal Amount | | Net Equity(B) | | Location | | Property Type | | Coupon(C)(D) | | Max Remaining Term (Years)(C)(E) | | LTV(C)(F) |
| | Senior Loans(G) | | | | | | | | | | | | | | | | | | |
| 1 | Senior Loan | | 5/9/2018 | | $ | 350.0 |
| | $ | 232.8 |
| | $ | 128.8 |
| | Queens, NY | | Office | | L + 3.3% | | 4.7 |
| | 71 | % |
| 2 | Senior Loan | | 7/31/2018 | | 341.0 |
| | 332.6 |
| | 81.3 |
| | Atlanta, GA / Tampa, FL | | Multifamily | | L + 3.2 | | 4.9 |
| | 75 |
|
| 3 | Senior Loan | | 8/4/2017 | | 239.2 |
| | 181.6 |
| | 71.9 |
| | New York, NY | | Condo (Residential) | | L + 4.8 | | 1.8 |
| | 62 |
|
| 4 | Senior Loan | | 5/23/2018 | | 213.7 |
| | 195.4 |
| | 31.2 |
| | Boston, MA | | Office | | L + 2.4 | | 4.7 |
| | 69 |
|
| 5 | Senior Loan | | 11/13/2017 | | 181.8 |
| | 151.3 |
| | 39.2 |
| | Minneapolis, MN | | Office | | L + 3.8 | | 4.2 |
| | 75 |
|
| 6 | Senior Loan | | 9/13/2018 | | 172.0 |
| | 162.1 |
| | 38.8 |
| | Seattle, WA | | Office | | L + 3.7 | | 5.0 |
| | 65 |
|
| 7 | Senior Loan | | 9/9/2016 | | 168.0 |
| | 157.5 |
| | 41.9 |
| | San Diego, CA | | Office | | L + 4.2 | | 3.0 |
| | 71 |
|
| 8 | Senior Loan | | 6/19/2018 | | 165.0 |
| | 140.9 |
| | 25.8 |
| | Philadelphia, PA | | Office | | L + 2.5 | | 4.8 |
| | 71 |
|
| 9 | Senior Loan | | 4/11/2017 | | 162.1 |
| | 138.9 |
| | 41.2 |
| | Irvine, CA | | Office | | L + 3.9 | | 3.6 |
| | 62 |
|
| 10 | Senior Loan | | 10/26/2015 | | 155.0 |
| | 123.0 |
| | 47.3 |
| | Portland, OR | | Retail | | L + 5.5 | | 2.1 |
| | 61 |
|
| 11 | Senior Loan | | 10/23/2017 | | 150.0 |
| | 143.6 |
| | 37.9 |
| | North Bergen, NJ | | Multifamily | | L + 4.3 | | 4.1 |
| | 57 |
|
| 12 | Senior Loan | | 3/30/2017 | | 132.3 |
| | 113.4 |
| | 39.7 |
| | Brooklyn, NY | | Office | | L + 4.4 | | 3.5 |
| | 68 |
|
| 13 | Senior Loan | | 8/15/2017 | | 119.0 |
| | 97.4 |
| | 13.5 |
| | Atlanta, GA | | Office | | L + 3.0 | | 3.9 |
| | 66 |
|
| 14 | Senior Loan | | 8/23/2017 | | 105.0 |
| | 100.0 |
| | 24.5 |
| | Honolulu, HI | | Multifamily | | L + 4.0 | | 3.9 |
| | 66 |
|
| 15 | Senior Loan | | 9/14/2016 | | 103.5 |
| | 90.1 |
| | 23.0 |
| | Crystal City, VA | | Office | | L + 4.5 | | 3.0 |
| | 59 |
|
| 16 | Senior Loan | | 9/7/2018 | | 93.0 |
| | 93.0 |
| | 92.5 |
| | Seattle, WA | | Multifamily | | L + 2.6 | | 4.9 |
| | 79 |
|
| 17 | Senior Loan | | 3/8/2018 | | 89.0 |
| | 87.1 |
| | 12.8 |
| | Westbury, NY | | Multifamily | | L + 3.1 | | 4.5 |
| | 69 |
|
| 18 | Senior Loan | | 3/29/2018 | | 86.0 |
| | 86.0 |
| | 12.4 |
| | New York, NY | | Multifamily | | L + 2.6 | | 4.5 |
| | 48 |
|
| 19 | Senior Loan | | 2/28/2017 | | 85.9 |
| | 82.4 |
| | 15.7 |
| | Denver, CO | | Multifamily | | L + 3.8 | | 3.4 |
| | 75 |
|
| 20 | Senior Loan | | 8/4/2017 | | 81.0 |
| | 81.0 |
| | 19.8 |
| | Denver, CO | | Multifamily | | L + 4.0 | | 3.8 |
| | 73 |
|
| 21 | Senior Loan | | 3/20/2018 | | 80.7 |
| | 80.7 |
| | 20.9 |
| | Seattle, WA | | Office | | L + 3.5 | | 4.5 |
| | 65 |
|
| 22 | Senior Loan | | 3/28/2018 | | 80.0 |
| | 70.7 |
| | 12.8 |
| | Orlando, FL | | Multifamily | | L + 2.8 | | 4.5 |
| | 70 |
|
| 23 | Senior Loan | | 1/16/2018 | | 75.5 |
| | 70.3 |
| | 17.4 |
| | St Paul, MN | | Office | | L + 3.6 | | 4.4 |
| | 73 |
|
| 24 | Senior Loan | | 7/21/2017 | | 75.1 |
| | 61.9 |
| | 15.6 |
| | Queens, NY | | Industrial | | L + 3.7 | | 3.8 |
| | 72 |
|
| 25 | Senior Loan | | 10/7/2016 | | 74.5 |
| | 72.8 |
| | 23.8 |
| | New York, NY | | Multifamily | | L + 4.4 | | 3.1 |
| | 68 |
|
| 26 | Senior Loan | | 7/24/2018 | | 74.5 |
| | 68.8 |
| | 68.3 |
| | Atlanta, GA | | Industrial | | L + 2.7 | | 4.9 |
| | 74 |
|
| 27 | Senior Loan | | 5/12/2017 | | 61.9 |
| | 53.8 |
| | 14.1 |
| | Atlanta, GA | | Office | | L + 4.0 | | 3.7 |
| | 71 |
|
| 28 | Senior Loan | | 5/19/2016 | | 55.0 |
| | 53.5 |
| | 14.1 |
| | Nashville, TN | | Office | | L + 4.3 | | 3.3 |
| | 70 |
|
| | Total/Weighted Average Senior Loans Unlevered | | | | $ | 3,769.7 |
| | $ | 3,322.6 |
| | $ | 1,026.1 |
| | | | | | L + 3.6% | | 4.0 |
| | 68 | % |
| | Mezzanine Loans | | | | | | | | | | | | | | | | | | |
| 1-6 | Other Mezzanine Loans | | Various | | 26.2 |
| | 26.2 |
| | 26.2 |
| | Various | | Various | | 10.6 | | 6.6 |
| | 77 |
|
| | Total/Weighted Average Mezzanine Loans Unlevered | | | | $ | 26.2 |
| | $ | 26.2 |
| | $ | 26.2 |
| | | | | | 10.6% | | 6.6 |
| | 77 | % |
| | CMBS B-Pieces | | | | | | | | | | | | | | | | | | |
| 1 | CMBS B-Piece | | 2/10/2016 | | $ | — |
| | $ | — |
| | $ | 6.9 |
| | Various | | Various | | 1.4% | | 7.3 |
| | 64 | % |
| 2 | CMBS B-Piece | | 5/21/2015 | | 34.9 |
| | 34.9 |
| | 3.1 |
| | Various | | Various | | 3.0 | | 6.6 |
| | 65 |
|
| 3 | RECOP(H) | | 2/13/2017 | | 40.0 |
| | 23.8 |
| | 23.8 |
| | Various | | Various | | 4.5 | | 9.4 |
| | 58 |
|
| | Total/Weighted Average CMBS B-Pieces Unlevered | | | | $ | 74.9 |
| | $ | 58.7 |
| | $ | 33.8 |
| | | | | | 3.7% | | 8.9 |
| | 60 | % |
| |
| * | Numbers presented may not foot due to rounding. |
| |
| (A) | Our total portfolio represents the current principal amount on senior and mezzanine loans and the net equity of our CMBS B-Piece investments. |
| |
| (B) | Net equity reflects (i) the amortized cost basis of our loans, net of borrowings and a 5% noncontrolling interest in the entity that holds certain of our mezzanine loans;borrowings; (ii) the cost basis of our CMBS B-Pieces, net of VIE liabilities; and (iii) the cost basis of our investment in RECOP. |
| |
| (C) | Weighted average is weighted by current principal amount for our senior and mezzanine loans and by net equity for our CMBS B-Pieces. Weighted average coupon calculation includes one-month USD LIBOR for floating-rate mezzanine loans. |
| |
| (D) | L = one-month USD LIBOR rate; spot rate of 1.88%2.26% included in mezzanine loan and portfolio-wide averages represented as fixed rates. |
| |
| (E) | Max remaining term (years) assumes all extension options are exercised, if applicable. |
| |
| (F) | For our senior and mezzanine loans, the LTV is based on the initial loan amount divided by the as-is appraised value as of the date the loan was originated. For Senior Loan 1,3, LTV is based on the total loancurrent principal amount of $239.2 million divided by the adjusted appraised gross sellout value net sell-out value of $345.4 million.sales cost. For our CMBS B-Pieces, LTV is based on the weighted average LTV of the underlying loan pool at issuance. |
| |
| (G) | Senior loans include senior mortgages and similar credit quality investments, including junior participations in our originated senior loans for which we have syndicated the senior participations and retained the junior participations for our portfolio. |
| |
| (H) | Represents our investment in an aggregator vehicle alongside RECOP that invests in CMBS. Committed principal represents our total commitment to the aggregator vehicle whereas current principal represents the current funded amount. |
Portfolio Surveillance and Credit Quality
Senior and Mezzanine Loans
Our Manager actively manages our portfolio and assesses the risk of any loan impairment by quarterly evaluating the performance of the underlying property, the valuation of comparable assets as well as the financial wherewithal of the associated borrower. Our loan documents generally give us the right to receive regular property, borrower and guarantor financial statements; approve annual budgets and tenant leases; and enforce loan covenants and remedies. In addition, our Manager evaluates the macroeconomic environment, prevailing real estate fundamentals and micro-market dynamics where the underlying property is located. Through site inspections, local market experts and various data sources, as part of its risk assessment, our Manager monitors criteria such as new supply and tenant demand, market occupancy and rental rate trends, and capitalization rates and valuation trends.
In addition to ongoing asset management, our Manager performs a quarterly review of our portfolio whereby each loan is assigned a risk rating of 1 through 5, from lowest risk to highest risk. Our Manager is responsible for reviewing, assigning and updating the risk ratings for each loan on a quarterly basis. The risk ratings are based on many factors, including, but not limited to, underlying real estate performance and asset value, values of comparable properties, durability and quality of property cash flows, sponsor experience and financial wherewithal, and the existence of a risk-mitigating loan structure. Additional key considerations include LTVs, debt service coverage ratios, real estate and credit market dynamics, and risk of default or principal loss. Based on a five-point scale, our loans are rated "1" through "5," from less risk to greater risk, which ratings are defined as follows:
1—Very Low Risk—The underlying property performance has surpassed underwritten expectations, and the sponsor’s business plan is generally complete. The property demonstrates stabilized occupancy and/or rental rates resulting in strong current cash flow and/or a very low LTV (<65%). At the level of performance, it is very likely that the underlying loan can be refinanced easily in the period’s prevailing capital market conditions.
2—Low Risk—The underlying property performance has matched or exceeded underwritten expectations, and the sponsor’s business plan may be ahead of schedule or has achieved some or many of the major milestones from a risk mitigation perspective. The property has achieved improving occupancy at market rents, resulting in sufficient current cash flow and/or a low LTV (65%-70%). Operating trends are favorable, and the underlying loan can be refinanced in today’s prevailing capital market conditions. The sponsor/manager is well capitalized or has demonstrated a history of success in owning or operating similar real estate.
3—Average Risk—The underlying property performance is in-line with underwritten expectations, or the sponsor may be in the early stages of executing its business plan. Current cash flow supports debt service payments, or there is an ample interest reserve or loan structure in place to provide the sponsor time to execute the value-improvement plan. The property exhibits a moderate LTV (<75%). Loan structure appropriately mitigates additional risks. The sponsor/manager has a stable credit history and experience owning or operating similar real estate.
4—High Risk/Potential for Loss: A loan that has a risk of realizing a principal loss. The underlying property performance is behind underwritten expectations, or the sponsor is behind schedule in executing its business plan. The underlying market fundamentals may have deteriorated, comparable property valuations may be declining or property occupancy has been volatile, resulting in current cash flow that may not support debt service payments. The loan exhibits a high LTV (>80%), and the loan covenants are unlikely to fully mitigate some risks. Interest payments may come from an interest reserve or sponsor equity.
5—Impaired/Loss Likely: A loan that has a very high risk of realizing a principal loss or has otherwise incurred a principal loss. The underlying property performance is significantly behind underwritten expectations, the sponsor has failed to execute its business plan and/or the sponsor has missed interest payments. The market fundamentals have deteriorated, or property performance has unexpectedly declined or valuations for comparable properties have declined meaningfully since loan origination. Current cash flow does not support debt service payments. With the current capital structure, the sponsor might not be incentivized to protect its equity without a restructuring of the loan. The loan exhibits a very high LTV (>90%), and default may be imminent.
| | | (dollars in thousands) | | March 31, 2018 | | September 30, 2018 |
| Risk Rating | | Number of Loans | | Net Book Value | | Total Loan Exposure(A) | | Number of Loans | | Net Book Value | | Total Loan Exposure(A) |
| 1 | | — |
| | $ | — |
| | $ | — |
| | — |
| | $ | — |
| | $ | — |
|
| 2 | | 4 |
| | 161,659 |
| | 162,570 |
| | 8 |
| | 446,525 |
| | 448,821 |
|
| 3 | | 27 |
| | 2,095,105 |
| | 2,172,308 |
| | 27 |
| | 2,815,353 |
| | 2,899,972 |
|
| 4 | | 1 |
| | 16,426 |
| | 16,500 |
| | — |
| | — |
| | — |
|
| 5 | | — |
| | — |
| | — |
| | — |
| | — |
| | — |
|
| | | | 35 |
| | $ | 3,261,878 |
| | $ | 3,348,793 |
|
|
| | | | | | | | | | | |
| (dollars in thousands) | | June 30, 2018 |
| Risk Rating | | Number of Loans | | Net Book Value | | Total Loan Exposure(A) |
| 1 | | — |
| | $ | — |
| | $ | — |
|
| 2 | | 7 |
| | 388,758 |
| | 390,938 |
|
| 3 | | 27 |
| | 2,439,510 |
| | 2,520,789 |
|
| 4 | | 1 |
| | 16,434 |
| | 16,500 |
|
| 5 | | — |
| | — |
| | — |
|
| | | 35 |
| | $ | 2,844,702 |
| | $ | 2,928,227 |
|
| |
| (A) | In certain instances, we finance our loans through the non-recourse sale of a senior interest that is not included in our condensed consolidated financial statements. Total loan exposure includes the entire loan we originated and financed, including $63.6$66.6 million and $64.5 million of such non-consolidated interests as of March 31, 2018.June 30, 2018 and September 30, 2018, respectively. |
As of March 31,September 30, 2018, the average risk rating of KREF's portfolio was 2.9 (Average Risk), weighted by investment carrying value, with 99.3%100.0% of commercial mortgage loans held-for-investment, rated 3 (Average Risk) or better by our Manager as compared to 2.9 (Average Risk) as of June 30, 2018 and December 31, 2017. As of March 31,September 30, 2018, June 30, 2018 and December 31, 2017, no investments were rated 5 (Impaired/Loss Likely).
CMBS B-Piece Investments
Our Manager has processes and procedures in place to monitor and assess the credit quality of our CMBS B-Piece investments and promote the regular and active management of these investments. This includes reviewing the performance of the real estate assets underlying the loans that collateralize the investments and determining the impact of such performance on the credit and return profile of the investments. Our Manager holds monthly surveillance calls with the special servicer of our CMBS B-Piece investments to monitor the performance of our portfolio and discuss issues associated with the loans underlying our CMBS B-Piece investments. At each meeting, our Manager is provided with a due diligence submission for each loan underlying our CMBS B-Piece investments, which includes both property- and loan-level information. These meetings assist our Manager in monitoring our portfolio, identifying any potential loan issues, determining if a re-underwriting of any loan is warranted and examining the timing and severity of any potential losses or impairments.
In addition to monthly surveillance, our Manager is involved in major decision approval requests by borrowers relating to the loans that collateralize our CMBS B-Piece investments. Our Manager engages a third-party special servicer to administer each request, which in turn presents each request to our Manager for review and approval. This process helps our Manager anticipate potential loan issues and proactively formulate responses as it relates to each loan approval request. As part of this process, our Manager receives updated financial information, rent rolls and performance metrics for each loan, which allows our Manager to regularly assess the performance of our loan collateral. In addition to monitoring loans that collateralize our CMBS B-Piece investments, our Manager also actively monitors watch list loans, loans that have been transferred into special servicing, and loan defaults in the CMBS B-Piece market generally, which helps our Manager anticipate potential market- and/or asset-specific issues that may affect our portfolio.
Valuations for our CMBS B-Piece investments are prepared using inputs from an independent valuation firm and confirmed by our Manager via quotes from two or more broker-dealers that actively make markets in CMBS. As part of the quarterly valuation process, our Manager also reviews pricing indications for comparable CMBS and monitors the credit metrics of the loans that collateralize our CMBS B-Piece investments.
As of March 31,September 30, 2018, there were no delinquenciesone underlying loan representing 1.88% of one of the CMBS pools was delinquent greater than 60 days associated with any loans underlying our CMBS B-Piece investments.days.
Portfolio Financing
Secured Financing Agreements
The following table details our secured financing agreements (dollars in thousands):
| | | | | March 31, 2018 | | September 30, 2018 |
| | | Maximum | | Collateral | | Secured Financing Borrowings | | Maximum | | Collateral | | Secured Financing Borrowings |
| Lender | | Facility Size(A) | | Assets(B) | | Potential(C) | | Outstanding | | Available | | Facility Size(A) | | Assets(B) | | Potential(C) | | Outstanding | | Available |
| Wells Fargo | | $ | 750,000 |
| | $ | 844,809 |
| | $ | 633,606 |
| | $ | 597,000 |
| | $ | 36,606 |
| | $ | 1,000,000 |
| | $ | 1,096,789 |
| | $ | 822,591 |
| | $ | 791,297 |
| | $ | 31,294 |
|
Morgan Stanley(D) | | 600,000 |
| | 829,017 |
| | 595,091 |
| | 554,347 |
| | 40,744 |
| | 600,000 |
| | 709,123 |
| | 513,685 |
| | 483,558 |
| | 30,127 |
|
| Goldman Sachs | | 400,000 |
| | 219,394 |
| | 164,545 |
| | 135,750 |
| | 28,795 |
| | 400,000 |
| | 362,191 |
| | 276,457 |
| | 268,709 |
| | 7,748 |
|
| BMO Facility | | | 200,000 |
| | — |
| | — |
| | — |
| | — |
|
| Barclays | | 75,000 |
|
| n.a. |
|
| 75,000 |
|
| — |
|
| 75,000 |
| | 75,000 |
| | n.a. |
| | 75,000 |
| | — |
| | 75,000 |
|
| Term Loan Facility | | | 600,000 |
| | 717,500 |
| | 595,839 |
| | 582,483 |
| | 13,356 |
|
| | | $ | 1,825,000 |
| | $ | 1,893,220 |
| | $ | 1,468,242 |
| | $ | 1,287,097 |
| | $ | 181,145 |
| | $ | 2,875,000 |
| | $ | 2,885,603 |
| | $ | 2,283,572 |
| | $ | 2,126,047 |
| | $ | 157,525 |
|
| |
| (A) | Maximum facility size represents the largest amount of borrowings available under a given facility once sufficient collateral assets have been approved by the lender and pledged by us. |
| |
| (B) | Represents the principal balance of the collateral assets. |
| |
| (C) | Potential borrowings represents the total amount we could draw under each facility based on collateral already approved and pledged. When undrawn, these amounts are available to us under the terms of each credit facility. |
| |
| (D) | The maximum facility size can be further increased to $750.0 million upon our request and subject to customary conditions. |
Term Loan Financing
In connection with our efforts to diversify our financing sources, we entered into a term loan financing agreement in April 2018 with third party lenders for an initial borrowing capacity of $200.0 million that was increased to $600.0 million as of September 30, 2018 (“Term Loan Facility”). The facility provides us with asset-based financing on a non-mark to market basis with matched term up to five years and is non-recourse to the Company. Borrowings under the facility are collateralized by senior loans, held-for-investment, and bear interest equal to one-month LIBOR plus a margin. As of September 30, 2018, the weighted average margin and interest rate on the facility were 1.4% and 3.7%, respectively. The following table summarizes our borrowings under the Term Loan Facility (dollars in thousands):
|
| | | | | | | | | | | | | | | | |
| | | September 30, 2018 |
| Term Loan Facility | | Count | | Outstanding Face Amount | | Carrying Value | | Wtd. Avg. Yield/Cost(A) | | Guarantee(B) | | Wtd. Avg. Term(C) |
| Collateral assets | | 6 | | $ | 717,500 |
| | $ | 711,982 |
| | L + 3.0% | | n.a. | | May 2023 |
| Financing provided | | n.a. | | 582,483 |
| | 578,010 |
| | L + 1.7% | | n.a. | | May 2023 |
| |
| (A) | Floating rate loans and related liabilities are indexed to one-month LIBOR. The Company's net interest rate exposure is in direct proportion to its interest in the net assets indexed to that rate. In addition to cash coupon, yield/cost includes the amortization of deferred origination/financing costs. |
| |
| (B) | Financing under the Term Loan Facility is non-recourse to the Company. |
| |
| (C) | The weighted-average term is determined using the maximum maturity date of the corresponding loans, assuming all extension options are exercised by the borrower. |
Loan Participations Sold
The following table details our loan participations sold (dollars in thousands):
| | | | | March 31, 2018 | | September 30, 2018 |
| Loan Participations Sold | | Count | | Principal Balance | | Carrying Value | | Yield/Cost(A) | | Guarantee(B) | | Term | | Count | | Principal Balance | | Carrying Value | | Yield/Cost(A) | | Guarantee(B) | | Term |
| Total loan | | 1 |
| | $ | 95,250 |
| | $ | 94,781 |
| | L + 3.0% | | n.a. | | September 2022 | | 1 | | $ | 97,440 |
| | $ | 97,024 |
| | L + 3.0% | | n.a. | | September 2022 |
Senior participation(C) | | 1 |
| | 82,000 |
| | 81,500 |
| | L + 1.8% | | n.a. | | September 2022 | | 1 | | 83,886 |
| | 83,442 |
| | L + 1.8% | | n.a. | | September 2022 |
| |
| (A) | Our floating rate loans and related liabilities were indexed to one-month LIBOR. Our net interest rate exposure is in direct proportion to our net assets. |
| |
| (B) | As of March 31,September 30, 2018, our loan participation sold was subject to partial recourse of $10.0 million, which amount may be reduced to zero upon achievement of certain property performance metrics. |
| |
| (C) | During the threenine months ended March 31,September 30, 2018, we recorded $0.7$2.3 million of interest income and $0.7$2.4 million of interest expense related to the loan participation we sold, but continue to consolidate under GAAP. |
Non-Consolidated Senior Interests
In certain instances, we finance our loans through the non-recourse sale of a senior loan interest that is not included in our condensed consolidated financial statements. These non-consolidated senior interests provide structural leverage for our net investments, which are reflected in the form of mezzanine loans or other subordinate interests on our balance sheets and in our statements of income. The following table details the subordinate interests retained on our balance sheet and the related non-consolidated senior interests as of March 31,September 30, 2018 (dollars in thousands):
| | | | | March 31, 2018 | | September 30, 2018 |
| Non-Consolidated Senior Interests | | Count | | Principal Balance | | Carrying Value | | Yield/Cost(A) | | Guarantee | | Term | | Count | | Principal Balance | | Carrying Value | | Yield/Cost(A) | | Guarantee | | Term |
| Total loan | | 1 |
| | $ | 79,379 |
| | n.a. | | L + 3.8% | | n.a. | | March 2022 | | 1 | | $ | 82,359 |
| | n.a. | | L + 3.8% | | n.a. | | March 2022 |
| Senior participation | | 1 |
| | 63,629 |
| | n.a. | | L + 2.1% | | n.a. | | March 2022 | | 1 | | 66,609 |
| | n.a. | | L + 2.1% | | n.a. | | March 2022 |
| |
| (A) | Our floating rate loans and related liabilities were indexed to one-month LIBOR. Our net interest rate exposure is in direct proportion to our net assets. |
Results of Operations
The following table summarizes the changes in our the results of operations for the three and nine months ended March 31,September 30, 2018 to the three and nine months ended March 31,September 30, 2017 (dollars in thousands):
| | | | | For the Three Months Ended March 31, | | Increase (Decrease) | | For the Three Months Ended September 30, | | Increase (Decrease) | | For the Nine Months Ended September 30, | | Increase (Decrease) |
| | | 2018 | | 2017 | | Dollars | | Percentage | | 2018 | | 2017 | | Dollars | | Percentage | | 2018 | | 2017 | | Dollars | | Percentage |
| Net Interest Income | | | | | | | | | | | | | | | | | | | | | | | | |
| Interest income | | $ | 31,694 |
| | $ | 12,906 |
| | $ | 18,788 |
| | 59.3 | % | | $ | 51,895 |
| | $ | 24,408 |
| | $ | 27,487 |
| | 112.6 | % | | $ | 123,952 |
| | $ | 54,760 |
| | $ | 69,192 |
| | 126.4 | % |
| Interest expense | | 10,690 |
| | 3,953 |
| | 6,737 |
| | 63.0 |
| | 23,337 |
| | 5,414 |
| | 17,923 |
| | 331.0 |
| | 52,825 |
| | 12,592 |
| | 40,233 |
| | 319.5 |
|
| Total net interest income | | 21,004 |
| | 8,953 |
| | 12,051 |
| | 57.4 |
| | 28,558 |
| | 18,994 |
| | 9,564 |
| | 50.4 |
| | 71,127 |
| | 42,168 |
| | 28,959 |
| | 68.7 |
|
| Other Income | | | | | | | | | | | | | | | | | | | | | | | | |
| Realized gain on sale of investments | | | — |
| | — |
| | — |
| | — |
| | 13,000 |
| | — |
| | 13,000 |
| | 100.0 |
|
| Change in net assets related to consolidated variable interest entities | | 8,489 |
| | 4,610 |
| | 3,879 |
| | 45.7 |
| | 379 |
| | 4,025 |
| | (3,646 | ) | | (90.6 | ) | | 2,460 |
| | 12,810 |
| | (10,350 | ) | | (80.8 | ) |
| Income from equity method investments | | 548 |
| | 16 |
| | 532 |
| | 97.1 |
| | 747 |
| | 115 |
| | 632 |
| | 549.6 |
| | 2,084 |
| | 461 |
| | 1,623 |
| | 352.1 |
|
| Other income | | 161 |
| | 164 |
| | (3 | ) | | (1.9 | ) | | 476 |
| | 177 |
| | 299 |
| | 168.9 |
| | 1,239 |
| | 616 |
| | 623 |
| | 101.1 |
|
| Total other income (loss) | | 9,198 |
| | 4,790 |
| | 4,408 |
| | 47.9 |
| | 1,602 |
| | 4,317 |
| | (2,715 | ) | | (62.9 | ) | | 18,783 |
| | 13,887 |
| | 4,896 |
| | 35.3 |
|
| Operating Expenses | | | | | | | | | | | | | | | | | | | | | | | | |
| General and administrative | | 2,663 |
| | 952 |
| | 1,711 |
| | 64.3 |
| | 1,653 |
| | 1,339 |
| | 314 |
| | 23.5 |
| | 6,002 |
| | 3,254 |
| | 2,748 |
| | 84.4 |
|
| Management fees to affiliate | | 3,939 |
| | 2,036 |
| | 1,903 |
| | 48.3 |
| | 4,164 |
| | 3,989 |
| | 175 |
| | 4.4 |
| | 12,016 |
| | 9,513 |
| | 2,503 |
| | 26.3 |
|
| Incentive compensation to affiliate | | | 3,286 |
| | — |
| | 3,286 |
| | 100.0 |
| | 3,286 |
| | — |
| | 3,286 |
| | 100.0 |
|
| Total operating expenses | | 6,602 |
| | 2,988 |
| | 3,614 |
| | 54.7 |
| | 9,103 |
| | 5,328 |
| | 3,775 |
| | 70.9 |
| | 21,304 |
| | 12,767 |
| | 8,537 |
| | 66.9 |
|
| Income (Loss) Before Income Taxes, Noncontrolling Interests and Preferred Dividends | | 23,600 |
| | 10,755 |
| | 12,845 |
| | 54.4 |
| | 21,057 |
| | 17,983 |
| | 3,074 |
| | 17.1 |
| | 68,606 |
| | 43,288 |
| | 25,318 |
| | 58.5 |
|
| Income tax expense | | 175 |
| | 122 |
| | 53 |
| | 30.3 |
| |
| Income tax expense (benefit) | | | 85 |
| | 120 |
| | (35 | ) | | (29.2 | ) | | 227 |
| | 388 |
| | (161 | ) | | (41.5 | ) |
| Net Income (Loss) | | 23,425 |
| | 10,633 |
| | 12,792 |
| | 54.6 |
| | 20,972 |
| | 17,863 |
| | 3,109 |
| | 17.4 |
| | 68,379 |
| | 42,900 |
| | 25,479 |
| | 59.4 |
|
| Redeemable Noncontrolling Interests in Income (Loss) of Consolidated Joint Venture | | 34 |
| | 46 |
| | (12 | ) | | (35.3 | ) | | — |
| | 54 |
| | (54 | ) | | (100.0 | ) | | 63 |
| | 134 |
| | (71 | ) | | (53.0 | ) |
| Noncontrolling Interests in Income (Loss) of Consolidated Joint Venture | | — |
| | 210 |
| | (210 | ) | | 100.0 |
| | — |
| | 377 |
| | (377 | ) | | (100.0 | ) | | — |
| | 801 |
| | (801 | ) | | (100.0 | ) |
| Net Income (Loss) Attributable to KKR Real Estate Finance Trust Inc. and Subsidiaries | | 23,391 |
| | 10,377 |
| | 13,014 |
| | 55.6 |
| | 20,972 |
| | 17,432 |
| | 3,540 |
| | 20.3 |
| | 68,316 |
| | 41,965 |
| | 26,351 |
| | 62.8 |
|
| Preferred Stock Dividends | | 111 |
| | 13 |
| | 98 |
| | 88.3 |
| |
| Preferred Stock Dividends and Redemption Value Adjustment | | | 151 |
| | 93 |
| | 58 |
| | 62.4 |
| | 395 |
| | 181 |
| | 214 |
| | 118.2 |
|
| Net Income (Loss) Attributable to Common Stockholders | | $ | 23,280 |
| | $ | 10,364 |
| | $ | 12,916 |
| | 55.5 |
| | $ | 20,821 |
| | $ | 17,339 |
| | $ | 3,482 |
| | 20.1 | % | | $ | 67,921 |
| | $ | 41,784 |
| | $ | 26,137 |
| | 62.6 | % |
Net Interest Income
Net interest income increased $12.1$9.6 million and $29.0 million during the three and nine months ended March 31,September 30, 2018, asrespectively, compared to the three months ended March 31,corresponding periods in 2017, primarily due to increased interest income in connection with additional capital deployed in investments as we continued to scale our portfolio. This increase was partially offset by increased interest expense resulting from interest on amounts outstanding under our repurchasefinancing facilities used to finance investments in commercial loans. The partial offset to interestInterest income includes $1.4$4.0 million and $0.5$1.0 million of net deferred loan fees and origination discounts accreted during the three months ended March 31,September 30, 2018 and 2017, respectively, and $7.2 million and $2.3 million during the corresponding period in 2017.nine months ended September 30, 2018 and 2017, respectively.
Other Income
Total other income increased $4.4decreased $2.7 million during the three months ended March 31,September 30, 2018, as compared to the three months ended March 31,September 30, 2017, primarily due to a $5.4$2.6 million decrease in net interest earned on CMBS B-Pieces, which is included in net assets related to consolidated VIEs, during the three months ended September 30, 2018, compared to the same period in 2017 as a result of the April 2018 sale of CMBS B-Pieces, partially offset by a $0.2 million unrealized gainloss on our investments in CMBS B-PiecesB- Pieces during the three months ended March 31,September 30, 2018, as compared to a $1.5$0.9 million unrealized gain during the corresponding 2017 period. Additionally, other incomeperiod in 2017. Income from equity method investments increased $0.5$0.6 million during the three months ended March 31,September 30, 2018, as compared to the same period during 2017 due to an increase in income from our equity method investments as we continued to fund the existing commitment to RECOP during 2018.
Total other income increased $4.9 million during the nine months ended September 30, 2018, compared to the corresponding period in 2017, primarily due to a $13.0 million realized gain from the sale of CMBS B-Pieces in April 2018. This realized gain was partially offset by a $2.1 million unrealized loss on our investments in CMBS B-Pieces for the nine months ended September 30, 2018, as compared to a $3.5 million unrealized gain during the corresponding 2017 period. Additionally, net interest earned on CMBS B-Pieces, which is included in net assets related to consolidated VIEs, decreased $4.8 million during the nine months ended September 30, 2018, as a result of the April 2018 sale of CMBS B- Pieces. Other income also increased during the nine months ended September 30, 2018, as compared to the same period during 2017, due to an increase in income from equity investments as we entered intocontinued to contribute additional capital to RECOP during 2017.2018.
Operating Expenses
Total operating expenses increased $3.6$3.8 million and $8.5 million during the three and nine months ended March 31,September 30, 2018, asrespectively, compared to the three months ended March 31,corresponding periods in 2017. This increase was primarily due to increased management fees$3.3 million of incentive compensation recorded during the three and nine months ended March 31,September 30, 2018, of $1.9compared to the corresponding periods in 2017 wherein the Company did not generate incentive fees. Additionally, management fees increased $0.2 million and $2.5 million during the three and nine months ended September 30, 2018, respectively, resulting from an increase in our equity frombase as we continue to scale our portfolio.
General and administrative expenses increased $0.3 million and $2.7 million during the private placement of our common stockthree and our initial public offering, as well as an additional $1.7 million ofnine months ended September 30, 2018, respectively, compared to the corresponding periods in 2017. The increase in general and administrative expenses was primarily attributed to an increase in non-cash stock-based compensation expense of $0.3 million and $1.6 million during the three and nine months ended March 31,September 30, 2018, which expenses primarily consisted of $1.0 million of non-cash restricted stock units amortization relatedrespectively, compared to shares awarded under our Incentive Planthe corresponding periods in December 2017 and an increase of $0.7 million of generalincreased operating expenses related to legal, audit, insurance, information technology, and other increased costs as we scaledcontinue to scale our portfolio and became a public company.business.
The following tables provide additional information regarding total operating expenses (dollars in thousands):
| | | | | Three Months Ended | | Three Months Ended |
| | | March 31, 2018 | | December 31, 2017 | | September 30, 2017 | | June 30, 2017 | | March 31, 2017 | | September 30, 2018 | | June 30, 2018 | | March 31, 2018 | | December 31, 2017 | | September 30, 2017 |
| Professional services | | $ | 713 |
| | $ | 838 |
| | $ | 635 |
| | $ | 489 |
| | $ | 485 |
| | $ | 666 |
| | $ | 959 |
| | $ | 713 |
| | $ | 838 |
| | $ | 635 |
|
| Operating and other costs | | 932 |
| | 819 |
| | 679 |
| | 459 |
| | 467 |
| | 692 |
| | 454 |
| | 932 |
| | 819 |
| | 679 |
|
| Stock-based compensation | | 1,018 |
| | 25 |
| | 25 |
| | 15 |
| | — |
| | 295 |
| | 273 |
| | 1,018 |
| | 25 |
| | 25 |
|
| Total general and administrative expenses | | 2,663 |
| | 1,682 |
| | 1,339 |
| | 963 |
| | 952 |
| | 1,653 |
| | 1,686 |
| | 2,663 |
| | 1,682 |
| | 1,339 |
|
| Management fees to affiliate | | 3,939 |
| | 3,979 |
| | 3,989 |
| | 3,488 |
| | 2,036 |
| | 4,164 |
| | 3,913 |
| | 3,939 |
| | 3,979 |
| | 3,989 |
|
| Incentive compensation to affiliate | | — |
| | — |
| | — |
| | — |
| | — |
| | 3,286 |
| | — |
| | — |
| | — |
| | — |
|
| Total operating expenses | | $ | 6,602 |
| | $ | 5,661 |
| | $ | 5,328 |
| | $ | 4,451 |
| | $ | 2,988 |
| | $ | 9,103 |
| | $ | 5,599 |
| | $ | 6,602 |
| | $ | 5,661 |
| | $ | 5,328 |
|
Liquidity and Capital Resources
Overview
Our primary liquidity needs include: our ongoing commitments to repay the principal of and interest on our borrowings and pay other financing costs; financing our assets; meeting future funding obligations; making distributions to our stockholders; funding our operations, which includes making payments to our Manager in accordance with the management agreement; and satisfying other general business needs.
Our primary sources of liquidity and capital sources from our inception through March 31,September 30, 2018 have been derived from: $1,060.9$1,159.2 million in net proceeds from equity issuances; $1,287.1$2,126.0 million in net advances from our repurchase facilities; $152.4 million in proceeds from syndicated financing; $138.7 million in net proceeds from issuance of convertible notes; and cash flows from operations. We may seek additional sources of liquidity from repurchase facilities, syndicated financing, other borrowings (including borrowings not related to a specific investment) and future offerings of equity and debt securities. In addition, we may apply our existing cash and cash equivalents and cash flows from operations to any liquidity needs. As of March 31,September 30, 2018, our cash and cash equivalents were $23.1$192.8 million.
See Notes 4, 5, 6, and 78 to our condensed consolidated financial statements for additional details regarding our secured financing agreements, convertible notes, loan participation sold and stock issuances.
Debt-to-Equity Ratio and Total Leverage Ratio
The following table presents our debt-to-equity ratio and total leverage ratio:
|
| | | | |
| | | March 31,September 30, 2018 | | December 31, 2017 |
Debt-to-equity ratio(A) | | 1.2x1.3x | | 0.8x |
Total leverage ratio(B) | | 1.3x1.9x | | 1.0x |
| |
| (A) | Represents (i) total outstanding secured debt agreements (excluding non-recourse term loan facility) and convertible notes, less cash to (ii) total stockholders’ equity, in each case, at period end. |
| |
| (B) | Represents (i) total outstanding secured debt agreements, convertible notes, loan participations sold, non-consolidated senior interests, less cash to (ii) total stockholders’ equity, in each case, at period end. |
Sources of Liquidity
Our primary sources of liquidity include cash and cash equivalents and available borrowings under our secured financing agreements. Amounts available under these sources as of the date presented are summarized in the following table (dollars in thousands):
| | | | | March 31, 2018 | | December 31, 2017 | | September 30, 2018 | | December 31, 2017 |
| Cash and cash equivalents | | $ | 23,124 |
| | $ | 103,120 |
| | $ | 192,771 |
| | $ | 103,120 |
|
| Available borrowings under master repurchase agreements | | 106,145 |
| | 65,555 |
| | 69,169 |
| | 65,555 |
|
| Available borrowings under asset specific financing | | | — |
| | — |
|
| Available borrowings under revolving credit agreements | | 75,000 |
| | 75,000 |
| | 75,000 |
| | 75,000 |
|
| Available borrowings under term loan financing | | | 13,356 |
| | — |
|
Loan principal payments receivable, net(A) | | — |
| | 4,557 |
| | 16,500 |
| | 4,557 |
|
| | | | $ | 366,796 |
| | $ | 248,232 |
|
| |
| (A) | Represents loan principal paid by the borrower to our third-party servicer, but not yet received by us as of September 30, 2018and December 31, 2017. We generally receive these loan principal repayments from our third-party servicer in the following month's remittance, net of amounts we repay under our financing agreements. |
In addition to our currentprimary sources of liquidity, we have access to further liquidity through public offerings of debt and equity securities. Our existing loan portfolio also provides us with liquidity as loans are repaid or sold, in whole or in part, and the proceeds from repayment become available for us to invest.
Consolidated Debt Obligations
Our consolidated debt obligations are detailed in Note 4 to our condensed consolidated financial statements.
Master Repurchase Agreements
Currently, our primary source of financing is our master repurchase facilities, which we use to finance the origination of senior loans. After a mortgage asset is identified by us, the lender agrees to advance a certain percentage of the face value of the mortgage to us in exchange for a secured interest in the mortgage.
Repurchase agreements effectively allow us to borrow against loans, participations and securities that we own in an amount generally equal to (i) the market value of such loans, participations and/or securities multiplied by (ii) the applicable advance rate. Under these agreements, we sell our loans, participations and securities to a counterparty and agree to repurchase the same loans and securities from the counterparty at a price equal to the original sales price plus an interest factor. The transaction is treated as a secured loan from the financial institution for GAAP purposes. During the term of a repurchase agreement, we receive the principal and interest on the related loans, participations and securities and pay interest to the lender under the master repurchase agreement. At any point in time, the amounts and the cost of our repurchase borrowings will be based upon the assets being financed—higher risk assets will result in lower advance rates (i.e., levels of leverage) at higher borrowing costs and vice versa. In addition, these facilities include various financial covenants and limited recourse guarantees, including those described below.
Each of our existing master repurchase facilities includes "credit mark" features. "Credit mark" provisions in repurchase facilities are designed to keep the lenders' credit exposure constant as a percentage of the underlying collateral value of the assets pledged as security to them. If the underlying collateral value decreases, the gross amount of leverage available to us will be reduced as our assets are marked to market, which would reduce our liquidity. The lender under the applicable repurchase facility sets the valuation and any revaluation of the collateral assets in its sole, good faith discretion. As a contractual matter, the lender has the right to reset the value of the assets at any time based on then-current market conditions, but the market convention is to reassess valuations on a monthly, quarterly and annual basis using the financial information delivered pursuant to the facility documentation regarding the real property, borrower and guarantor under such underlying loans. Generally, if the lender determines (subject to certain conditions) that the market value of the collateral in a repurchase transaction has decreased by more than a defined minimum amount, the lender may require us to provide additional collateral or lead to margin calls that may require us to repay all or a portion of the funds advanced. We closely monitor our liquidity and intend to maintain sufficient liquidity on our balance sheet in order to meet any margin calls in the event of any significant decreases in asset values. As of March 31,September 30, 2018 and December 31, 2017, the weighted average haircut under our repurchase agreements was 32.0%28.8% and 32.9%, respectively (or 26.4%25.6% and 27.3%, respectively, if we had borrowed the maximum amount approved by its repurchase agreement counterparties as of such dates). In addition, our existing master repurchase facilities are not entirely term-matched financings and may mature before our CRE debt investments that represent underlying collateral to those financings. As we negotiate renewals and extensions of these liabilities, we may experience lower advance rates and higher pricing under the renewed or extended agreements.
Revolving Credit Agreement
We may also use our secured revolving credit facility as a source of financing, which is designed to provide short term liquidity to purchase loans or other eligible assets, pay operating expenses, and borrow amounts for general corporate purposes. Any amounts borrowed are full recourse to us. Borrowings under the facility bear interest at a per annum rate equal to the sum of (i) a floating rate index and (ii) a fixed margin.
Term Loan Financing
We also use Term Loan Financing arrangements that provide asset-based, non-recourse financing on a non-mark to market basis with matched term to diversify our financing sources and reduce our exposure to market volatility. In April 2018, we entered into a term loan financing agreement with third party lenders for an initial borrowing capacity of $200.0 million that was subsequently increased to $600.0 million as of September 30, 2018 (“Term Loan Facility”). The facility provides us with asset-based financing on a non-mark to market basis with matched term up to five years and is non-recourse to the Company. Borrowings under the facility are collateralized by senior loans, held-for-investment, and bear interest equal to one-month LIBOR plus a margin. As of September 30, 2018, the weighted average margin and interest rate on the facility were 1.4% and 3.7%, respectively.
Asset Specific Financing
In August 2018, KREF entered into a $200.0 million loan financing facility with BMO Harris Bank (“BMO Facility”). The facility provides asset-based financing on a non-mark to market basis with matched-term up to five years with partial recourse to KREF. There were no amounts outstanding on this facility as of September 30, 2018. In connection with this facility, and in consideration for structuring and sourcing this arrangement, KREF will pay KCM, an affiliate of the Manager, a structuring fee equal to 0.35% of the respective committed loan advances under the agreement.
Borrowing Activities
The following tables provide additional information regarding our borrowings (dollars in thousands): | | | | | | | Three Months Ended | | | | Nine Months Ended |
| | | | | March 31, 2018 | | | | September 30, 2018 |
| | | Outstanding Face Amount at March 31, 2018 | | Average Daily Amount Outstanding(A) | | Maximum Amount Outstanding | | Weighted Average Daily Interest Rate | | Outstanding Face Amount at September 30, 2018 | | Average Daily Amount Outstanding(A) | | Maximum Amount Outstanding | | Weighted Average Daily Interest Rate |
| Wells Fargo | | $ | 597,000 |
| | $ | 502,467 |
| | $ | 597,000 |
| | 3.7 | % | | $ | 791,297 |
| | $ | 580,989 |
| | $ | 791,297 |
| | 3.8 | % |
| Morgan Stanley | | 554,347 |
| | 447,869 |
| | 554,347 |
| | 3.9 |
| | 483,558 |
| | 458,469 |
| | 564,525 |
| | 4.1 |
|
| Goldman Sachs | | 135,750 |
| | 68,250 |
| | 135,750 |
| | 4.0 |
| | 268,709 |
| | 155,103 |
| | 268,709 |
| | 4.0 |
|
| BMO Facility | | | — |
| | — |
| | — |
| | — |
|
| Barclays |
| — |
|
| — |
|
| — |
|
| — |
| | — |
| | — |
| | — |
| | — |
|
| Term Loan Facility | | | 582,483 |
| | 446,662 |
| | 582,483 |
| | 3.5 |
|
| Total/Weighted Average | | $ | 1,287,097 |
| | $ | 1,018,585 |
| | | | 3.8 | % | | $ | 2,126,047 |
| | $ | 1,474,338 |
| | | | 3.9 | % |
| |
(A) | Represents the average for the period the debt was outstanding. |
| | | | | Average Daily Amount Outstanding(A) | | Average Daily Amount Outstanding(A) |
| | | Three Months Ended | | Three Months Ended |
| | | March 31, 2018 | | December 31, 2017 | | September 30, 2018 | | June 30, 2018 | | March 31, 2018 |
| Wells Fargo | | $ | 502,467 |
| | $ | 485,250 |
| | $ | 639,568 |
| | $ | 599,425 |
| | $ | 502,467 |
|
| Morgan Stanley | | 447,869 |
| | 374,727 |
| | 429,275 |
| | 498,467 |
| | 447,869 |
|
| Goldman Sachs | | 68,250 |
| | 39,788 |
| | 235,135 |
| | 160,091 |
| | 68,250 |
|
| BMO Facility | | | — |
| | — |
| | — |
|
| Barclays | | — |
| | — |
| | — |
| | — |
| | — |
|
| Term Loan Facility | | | 550,307 |
| | 325,961 |
| | — |
|
| |
(A) | Represents the average for the period the debt was outstanding. |
Covenants—Each of our repurchase facilities contains customary terms and conditions for repurchase facilities of this type, including, but not limited to, negative covenants relating to restrictions on our operations with respect to our status as a REIT, and financial covenants, such as:
an interest income to interest expense ratio covenant (1.5 to 1.0);
a minimum consolidated tangible net worth covenant (75.0% of the aggregate net cash proceeds of any equity issuances made and any capital contributions received by us and KKR Real Estate Finance Holdings L.P. (our "Operating Partnership") or $800.0 million dependent upon the facility));
a cash liquidity covenant (the greater of $10.0 million or 5.0% of our recourse indebtedness, dependent upon the facility)indebtedness);
a total indebtedness covenant (75.0% of our total assets, net of VIE liabilities);
a maximum debt-to-equity ratio covenant (3.5 to 1.0); and
a minimum fixed charge coverage ratio covenant (1.5 to 1.0).
As of March 31,September 30, 2018, we were in compliance with the covenants of our repurchase facilities.
Guarantees—In connection with each master repurchase agreement, our Operating Partnership has entered into a limited guarantee in favor of each lender, under which our Operating Partnership guarantees the obligations of the borrower under the respective master repurchase agreement (i) in the case of certain defaults, up to a maximum liability of 25.0% of the then-outstanding repurchase price of the eligible loans, participations or securities, as applicable, or (ii) up to a maximum liability of 100.0% in the case of certain "bad boy" defaults. The borrower in each case is a special purpose subsidiary of the Company. With respect to our secured revolving credit facility, the amounts borrowed are full recourse to us.
CMBS-related Liabilities
In connection with our investments in CMBS B-Pieces, we consolidate the trust entities, called VIEs, that hold the pools of senior loans underlying the CMBS because we are considered the primary beneficiary of such entities. As a result of this consolidation, our financial statements include the liabilities of these VIEs. However, these liabilities are not recourse to us, and our risk of loss is limited to the value of our investment in the related CMBS B-Piece. See Note 67 to the condensed consolidated financial statements for a summary of these liabilities as of March 31,September 30, 2018.
Loan Participations Sold
In connection with our investments in senior loans, we finance certain investments through the syndication of a non-recourse, or limited-recourse, loan participation to an unaffiliated third party. Our presentation of the senior loan and related financing involved in the syndication depends upon whether GAAP recognized the transaction as a sale, though such differences in presentation do not generally impact our net stockholders’ equity or net income aside from timing differences in the recognition of certain transaction costs.
To the extent that GAAP recognizes a sale resulting from the syndication, we derecognize the participation in the senior loan that we sold and continue to carry the retained portion of the loan as an investment. While we do not generally expect to recognize a material gain or loss on these sales, we would realize a gain or loss in an amount equal to the difference between the net proceeds received from the third party purchaser and our carrying value of the loan participation we sold at time of sale. Furthermore, we recognize interest income only on the portion of the senior loan that we retain as a result of the sale.
To the extent that GAAP does not recognize a sale resulting from the syndication, we do not derecognize the participation in the senior loan that we sold. Instead, we recognize a loan participation sold liability in an amount equal to the principal of the loan participation syndicated less any unamortized discounts or financing costs resulting from the syndication. We continue to recognize interest income on the entire senior loan, including the interest attributable to the loan participation sold, as well as interest expense on the loan participation sold liability.
Cash Flows
The following table sets forth changes in cash and cash equivalents for the threenine months ended March 31,September 30, 2018 and 2017 (dollars in thousands):
| | | | For The Three Months Ended March 31, | | | For The Nine Months Ended September 30, | | |
| | 2018 | | 2017 | | Increase (Decrease) | 2018 | | 2017 | | Increase (Decrease) |
| Cash Flows From Operating Activities | $ | 18,071 |
| | $ | 7,672 |
| | $ | 10,399 |
| $ | 57,429 |
| | $ | (43,925 | ) | | $ | 101,354 |
|
| Cash Flows From Investing Activities | (382,251 | ) | | (234,719 | ) | | (147,532 | ) | (1,272,058 | ) | | (811,489 | ) | | (460,569 | ) |
| Cash Flows From Financing Activities | 283,784 |
| | 284,825 |
| | (1,041 | ) | 1,303,880 |
| | 849,644 |
| | 454,236 |
|
| Net Increase (Decrease) in Cash, Cash Equivalents, and Restricted Cash | $ | (80,396 | ) | | $ | 57,778 |
| | $ | (138,174 | ) | $ | 89,251 |
| | $ | (5,770 | ) | | $ | 95,021 |
|
Cash Flows from Operating Activities
Our cash flows from operating activities were primarily driven by our net interest income, which is driven by the income generated by our investments less financing costs. The following table sets forth interest received by, and paid for, our investments for the threenine months ended March 31,September 30, 2018 and 2017 (dollars in thousands):
| | | | For The Three Months Ended March 31, | For the Nine Months Ended September 30, |
| | 2018 | | 2017 | 2018 | | 2017 |
| Interest Received: | | | | | | |
| Senior and mezzanine loans | $ | 29,123 |
| | $ | 10,616 |
| $ | 108,314 |
| | $ | 44,324 |
|
| CMBS B-Pieces | 3,088 |
| | 3,088 |
| 5,456 |
| | 9,356 |
|
| Preferred equity interest | — |
| | 727 |
| — |
| | 1,986 |
|
| | 32,211 |
| | 14,431 |
| 113,770 |
| | 55,666 |
|
| Interest Paid: | | | | | | |
| Borrowings secured by senior loans | 8,823 |
| | 3,311 |
| 41,161 |
| | 10,116 |
|
| Net interest collections | $ | 23,388 |
| | $ | 11,120 |
| $ | 72,609 |
| | $ | 45,550 |
|
Our net interest collections were partially offset by cash used to pay management fees, as follows (dollars in thousands):
| | | | For The Three Months Ended March 31, | | | For the Nine Months Ended September 30, | | |
| | 2018 | | 2017 | | Increase (Decrease) | 2018 | | 2017 | | Increase (Decrease) |
| Management fees to affiliate | $ | 3,944 |
| | $ | 3,491 |
| | $ | 453 |
| |
| Management Fees to affiliate | | $ | 11,609 |
| | $ | 7,332 |
| | $ | 4,277 |
|
| Net decrease in cash and cash equivalents | $ | 3,944 |
| | $ | 3,491 |
| | $ | 453 |
| $ | 11,609 |
| | $ | 7,332 |
| | $ | 4,277 |
|
Cash Flows from Investing Activities
Our cash flows from investing activities were primarily driven by the amounts of cash usedoutflows to originatefund new loan originations and fund or purchase newour commitments under existing loan investments. During the threenine months ended March 31,September 30, 2018, we funded or purchased $418.3$1,695.2 million of senior and mezzanine loans and received $39.6$319.0 million of principal repayments on certain loans. We also made a net investment in CMBS, held through an equity method investee, of $3.5$8.6 million. During April 2018, we sold four of our five CMBS trusts for net proceeds of $112.7 million. During the threenine months ended March 31,September 30, 2017, we funded $234.7or purchased $920.4 million of senior and mezzanine loans.loans, received $61.0 million from the sale of a commercial mortgage loan and received $55.9 million of principal repayments on certain mezzanine loans, and our preferred equity interests. We also made a net investment in CMBS, held through an equity method investee, of $8.0 million.
Cash Flows from Financing Activities
Our cash flows from financing activities were primarily driven by proceeds from borrowings under repurchase agreements and other financing arrangements of $317.8$1,607.7 million during the threenine months ended March 31,September 30, 2018. As a resultAdditionally, we completed our convertible debt offering and common stock offering which resulted in net proceeds of our payment of dividends, our cash flows from financing activities decreased by $19.9$139.4 million and $98.4 million, respectively, during the threenine months ended March 31, 2018 compared toSeptember 30, 2018. These inflows were partially offset by principal repayments of $451.0 million on borrowings under secured financing agreements and payments of $64.1 million in dividends during the same period in 2017.nine months ended September 30, 2018. Our cash flows from financing activities during the threenine months ended March 31,September 30, 2017 were primarily driven by ourthe issuance of our common stock for net proceeds of $147.7$576.4 million and $147.0$776.4 million proceeds from borrowing under our repurchase agreements. As a resultThese inflows were partially offset by $460.4 million of the payment of dividends, our cash flows fromprincipal repayments on borrowings under secured financing activities decreased by $8.5 million during the three months ended March 31, 2017.agreements.
Contractual Obligations and Commitments
The following table presents our contractual obligations and commitments (including interest payments) as of March 31,September 30, 2018 (dollars in thousands):
| | | | Total | | Less than 1 year | | 1 to 3 years | | 3 to 5 years | | Thereafter | Total | | Less than 1 year | | 1 to 3 years | | 3 to 5 years | | Thereafter |
| Recourse Obligations: | | | | | | | | | | | | | | | | | | |
Master Repurchase Facilities(A): | | | | | | | | | | | | | | | | | | |
| Wells Fargo | $ | 662,853 |
| | $ | 21,931 |
| | $ | 640,922 |
| | $ | — |
| | $ | — |
| $ | 885,618 |
| | $ | 31,412 |
| | $ | 854,206 |
| | $ | — |
| | $ | — |
|
| Morgan Stanley | 621,006 |
| | 22,199 |
| | 598,807 |
| | — |
| | — |
| 546,253 |
| | 20,879 |
| | 525,374 |
| | — |
| | — |
|
| Goldman Sachs | 151,362 |
| | 5,199 |
| | 146,163 |
| | — |
| | — |
| 301,334 |
| | 10,865 |
| | 290,469 |
| | — |
| | — |
|
| Asset Specific Financing | | | | | | | | | | |
| BMO Facility | | — |
| | — |
| | — |
| | — |
| | — |
|
Revolving Credit Agreement(B): | | | | | | | | | | | | | | | | | | |
| Barclays | — |
| | — |
| | — |
| | — |
| | — |
| — |
| | — |
| | — |
| | — |
| | — |
|
| Total secured financing agreements | 1,435,221 |
| | 49,329 |
| | 1,385,892 |
| | — |
| | — |
| 1,733,205 |
| | 63,156 |
| | 1,670,049 |
| | — |
| | — |
|
| Convertible Notes | | 178,993 |
| | 8,805 |
| | 17,633 |
| | 152,555 |
| | — |
|
Future funding obligations(C) | 306,591 |
| | 165,995 |
| | 140,596 |
| | — |
| | — |
| 369,877 |
| | 192,336 |
| | 177,541 |
| | — |
| | — |
|
RECOP commitment(D) | 22,000 |
| | 22,000 |
| | — |
| | — |
| | — |
| 16,230 |
| | 16,230 |
| | — |
| | — |
| | — |
|
| Total recourse obligations | 1,763,812 |
| | 237,324 |
| | 1,526,488 |
| | — |
| | — |
| 2,298,305 |
| | 280,527 |
| | 1,865,223 |
| | 152,555 |
| | — |
|
Non-Recourse Obligations(E): | | | | | | | | | | |
| CMBS | 6,480,782 |
| | 270,924 |
| | 951,869 |
| | 553,685 |
| | 4,704,304 |
| |
| Non-Recourse Obligations: | | | | | | | | | | |
| Term Loan Financing | | 645,028 |
| | 20,829 |
| | 624,199 |
| | — |
| | — |
|
CMBS(E) | | 1,377,833 |
| | 57,720 |
| | 169,811 |
| | 121,257 |
| | 1,029,045 |
|
| Total | $ | 8,244,594 |
| | $ | 508,248 |
| | $ | 2,478,357 |
| | $ | 553,685 |
| | $ | 4,704,304 |
| $ | 4,321,166 |
| | $ | 359,076 |
| | $ | 2,659,233 |
| | $ | 273,812 |
| | $ | 1,029,045 |
|
| |
| (A) | The allocation of repurchase facilities is based on the current maturity date of each individual borrowing under the facilities. The amounts include the related future interest payment obligations, which are estimated by assuming the amounts outstanding under our repurchase facilities and the interest rates in effect as of March 31,September 30, 2018 will remain constant into the future. This is only an estimate, as actual amounts borrowed and rates may vary over time. Amounts borrowed are subject to a maximum 25.0% recourse limit. |
| |
| (B) | Any amounts borrowed are 100.0% recourse to us. |
| |
| (C) | We have future funding obligations related to our investments in senior loans. These future funding obligations primarily relate to construction projects, capital improvements, tenant improvements and leasing commissions. Generally, funding obligations are subject to certain conditions that must be met, such as customary construction draw certifications, minimum debt service coverage ratios, minimal debt yield tests, or executions of new leases before advances are made to the borrower. As such, the allocation of our future funding obligations is based on the earlier of the expected funding or commitment expiration date. |
| |
| (D) | Amounts committed to invest in an aggregator vehicle alongside RECOP, which has a two year investment period ending February 2019. |
| |
| (E) | Amounts relate to VIE liabilities that represent securities not beneficially owned by our stockholders. |
We are required to pay our Manager a base management fee, an incentive fee and reimbursements for certain expenses pursuant to our management agreement. The table above does not include the amounts payable to our Manager under our management agreement as they are not fixed and determinable. See Note 1011 to our condensed consolidated financial statements included in this Form 10-Q for additional terms and details of the fees payable under our management agreement.
As a REIT, we generally must distribute substantially all of our REIT taxable income, determined without regard to the deduction for dividends paid and excluding net capital gains, to stockholders in the form of dividends to comply with the REIT provisions of the Code. Our taxable income does not necessarily equal our net income as calculated in accordance with GAAP, or our Core Earnings as described above under " — Key Financial Measures and Indicators — Core Earnings and Net Core Earnings."
Subsequent Events
Our subsequent events are detailed in Note 1314 to our condensed consolidated financial statements.
Off-Balance Sheet Arrangements
As described in Note 67 to our consolidated financial statements, we have off-balance sheet arrangements related to VIEs that we account for using the equity method of accounting and in which we hold an economic interest or have a capital commitment. Our maximum risk of loss associated with our interests in VIEs is limited to the carrying value of our investment
in the entity and any unfunded capital commitments. As of March 31,September 30, 2018, we held $18.3$24.7 million of interests in such entities, which does not include a remaining commitment of $22.0$16.2 million to RECOP that we are required to fund when called.
Critical Accounting Policies
Our discussion and analysis of our financial condition and results of operations is based upon our condensed consolidated financial statements, which have been prepared in accordance with GAAP. The preparation of these condensed consolidated financial statements requires our Manager to make estimates and assumptions that affect the reported amounts of assets, liabilities, revenue and expenses, and related disclosure of contingent assets and liabilities. Actual results could differ from these estimates. There have been no material changes to our Critical Accounting Policies described in our annual report on Form 10-K filed with the SEC on February 28, 2018.
Refer to Note 2 to our consolidated financial statements for the description of our significant accounting policies.
Recent Accounting Pronouncements
For a discussion of recently issued accounting pronouncements, see Note 2 to our condensed consolidated financial statements included in this Form 10-Q.
ITEM 3. QUANTITATIVE AND QUALITATIVE DISCLOSURES ABOUT MARKET RISK
We seek to manage our risks related to the credit quality of our assets, interest rates, liquidity, prepayment rates and market value, while at the same time seeking to provide an opportunity to stockholders to realize attractive risk-adjusted returns. While risks are inherent in any business enterprise, we seek to quantify and justify risks in light of available returns and to maintain capital levels consistent with the risks we undertake.
Credit Risk
Our investments are subject to credit risk, including the risk of default. The performance and value of our investments depend upon the sponsors' ability to operate the properties that serve as our collateral so that they produce cash flows adequate to pay interest and principal due to us. To monitor this risk, our Manager reviews our investment portfolio and is in regular contact with the sponsors, monitoring performance of the collateral and enforcing our rights as necessary.
Credit Yield Risk
Credit yields measure the return demanded on financial instruments by the lending market based on their risk of default. Increasing supply of credit-sensitive financial instruments and reduced demand will generally cause the market to require a higher yield on such financial instruments, resulting in a lower price for the financial instruments we hold.
As of March 31,September 30, 2018, a 100 basis point increase in credit yields would decrease our net book value by approximately $6.0$0.5 million, and a 100 basis point decrease in credit yields would increase our net book value by approximately $6.4$0.5 million, based on the investments we held on that date.
Interest Rate Risk
Generally, the composition of our investments is such that rising interest rates will increase our net income, while declining interest rates will decrease net income. As of March 31,September 30, 2018, 94.0%98.2% of our investments by total assets earned a floating rate of interest. The remaining 6.0%1.8% of our investments earned a fixed rate of interest. If interest rates were to decline, the value of these fixed-rate investments may increase and if interest rates were to increase, the value of these fixed-rate investments may fall; however, the interest income generated by these investments would not be affected by market interest rates. The interest rates we pay under our current repurchase agreements are floating rate. Accordingly, our interest expense will generally increase as interest rates increase and decrease andas interest rates decrease.
As of March 31,September 30, 2018, a 50 basis point increase in short-term interest rates, based on a shift in the yield curve, would increase our cash flows by approximately $3.0$3.8 million during the 2018 fiscal year, whereas a 50 basis point decrease in short-term interest rates would decrease our cash flows by approximately $3.0$3.8 million during the 2018 fiscal year, based on the net floating-rate exposure of the investments we held on that date.
Prepayment Risk
Prepayment risk is the risk that principal will be repaid at an earlier date than anticipated, potentially causing the return on certain investments to be less than expected. As we receive prepayments of principal on our assets, any premiums paid on such assets are amortized against interest income. In general, an increase in prepayment rates accelerates the amortization of purchase premiums, thereby reducing the interest income earned on the assets. Conversely, discounts on such assets are accreted into interest income. In general, an increase in prepayment rates accelerates the accretion of purchase discounts, thereby increasing the interest income earned on the assets. Additionally, we may not be able to reinvest the principal repaid at the same or higher yield of the original investment.
Financing Risk
We finance our target assets with borrowed funds under our repurchase facilities and by syndicating senior participations in our originated senior loans. Over time, as market conditions change, we may use other forms of leverage in addition to these methods of financing. Weakness or volatility in the financial markets, the commercial real estate and mortgage markets andor the economy generally could adversely affect one or more of our lenders or potential lenders and could cause one or more of our lenders or potential lenders to be unwilling or unable to provide us with financing, or to decrease the amount of our available financing through a market to market, or to increase the costs of that financing.
Real Estate Risk
The market values of commercial mortgage assets are subject to volatility and may be adversely affected by a number of factors, including, but not limited to, national, regional and local economic conditions (which may be adversely affected by industry slowdowns and other factors); local real estate conditions; changes or continued weakness in specific industry segments; construction quality, age and design; demographic factors; and retroactive changes to building or similar codes. In addition, decreases in property values reduce the value of the collateral and the potential proceeds available to a borrower to repay the underlying loans, which could also cause us to suffer losses.
ITEM 4. CONTROLS AND PROCEDURES
Evaluation of Disclosure Controls and Procedures
We maintain disclosure controls and procedures (as such term is defined in Rules 13a-15(e) and 15d-15(e) under the Exchange Act) that are designed to ensure that the information required to be disclosed by us in the reports filed or submitted by us under the Exchange Act is recorded, processed, summarized and reported within the time periods specified in the SEC’s rules and forms and that such information is accumulated and communicated to management, including the Co-Chief Executive Officers and the Chief Financial Officer, as appropriate, to allow timely decisions regarding required disclosure. Any controls and procedures, no matter how well designed and operated, can provide only reasonable assurances of achieving the desired controls.
Our management, with the participation of our Co-Chief Executive Officers and the Chief Financial Officer, has evaluated the effectiveness of the design and operation of our disclosure controls and procedures as of March 31,September 30, 2018. Based upon that evaluation, our Co-Chief Executive Officers and Chief Financial Officer concluded that, as of March 31,September 30, 2018, the design and operation of our disclosure controls and procedures were effective to accomplish their objectives at the reasonable assurance level.
Changes in Internal Controls over Financial Reporting
No changes in our internal control over financial reporting (as such term is defined in Rule 13a-15(f) of the Exchange Act) occurred during the three monthsquarter ended March 31,September 30, 2018 that materially affected, or are reasonably likely to materially affect, our internal control over financial reporting.
PART II — OTHER INFORMATION
ITEM 1. LEGAL PROCEEDINGS
The section entitled “Litigation ” appearing in Note 910 of our condensed consolidated financial statements included in this Form 10-Q is incorporated herein by reference.
ITEM 1A. RISK FACTORS
For a discussion of our potential risks and uncertainties, see the information under Part I, Item 1A. “Risk Factors” in the Form 10-K. There have been no material changes to our principal risks that we believe are material to our business, results of operations, and financial condition from the risk factors previously disclosed in the Form 10-K, which is accessible on the SEC’s website at www.sec.gov.
ITEM 2. UNREGISTERED SALES OF EQUITY SECURITIES AND USE OF PROCEEDS
Issuer Purchases of Equity Securities
Our board of directors has authorized the repurchase of up to $100.0 million of our common stock over the 12 month period commencing June 12, 2017. Of this amount, a total of $50.0 million is covered by a pre-set trading plan meeting the requirements of Rule 10b5-1 under the Exchange Act, which provides for repurchases of our common stock when the market price per share of our common stock is below book value per share (calculated in accordance with GAAP), with the remaining $50.0 million available at any time during the repurchase period. As of March 31, 2018, $37.6 million remained available for repurchases under this 10b5-1 plan.
The following table sets forth information regarding purchases of shares of our common stock by us or on our behalf during the three months ended March 31, 2018:
|
| | | | | | | | | | | | | | | | |
| Period Beginning | | Period Ending | | Total number of shares purchased | | Average price paid per share | | Total number of shares repurchased as part of publicly announced program | | Approximate dollar value of shares that may yet be purchased under the program |
| January 1, 2018 | | January 31, 2018 | | 185,025 |
| | $ | 19.73 |
| | 211,423 |
| | $ | 95,826,000 |
|
| February 1, 2018 | | February 28, 2018 | | 361,516 |
| | 19.34 |
| | 572,939 |
| | 88,834,000 |
|
| March 1, 2018 | | March 31, 2018 | | 63,324 |
| | 19.48 |
| | 636,263 |
| | 87,600,000 |
|
In May 2018, our board of directors approved a new share repurchase program, effective following the expiration of the above-described share repurchase program on June 12, 2018. The new share repurchase program permits us to repurchase of up to $100.0 million of our common stock during the period from June 13, 2018 through June 30, 2019. Of this total authorized amount, $50.0 million will beis covered by a pre-set trading plan meeting the requirements of Rule 10b5-1 under the Exchange Act and provideprovides for repurchases of our common stock when the market price per share of our common stock is below book value per share (calculated in accordance with GAAP as of the end of the most recent quarterly period for which financial statements are available), and the remaining $50.0 million may be used for repurchases in the open market, pursuant to pre-set trading plans meeting the requirements of Rule 10b5-1 under the Exchange Act, in privately negotiated transactions or otherwise. As of September 30, 2018, $49.3 million remained available for repurchases under this 10b5-1 plan.
The following table sets forth information regarding purchases of shares of our common stock by us or on our behalf during the three months ended September 30, 2018:
|
| | | | | | | | | | | | | | | | | | | | |
| Period Beginning | | Period Ending | | Total number of shares purchased | | Average price paid per share | | Total number of shares purchased as part of publicly announced program | | Amounts paid for shares purchased as part of publicly announced program | | Approximate dollar value of shares that may yet be purchased under the program |
| July 1, 2018 | | July 31, 2018 | | 9,300 |
| | $ | 19.78 |
| | 723,507 |
| | $ | 184,000 |
| | $ | 99,311,000 |
|
| August 1, 2018 | | August 31, 2018 | | — |
| | — |
| | 723,507 |
| | — |
| | 99,311,000 |
|
| September 1, 2018 | | September 30, 2018 | | — |
| | — |
| | 723,507 |
| | — |
| | 99,311,000 |
|
| Total/Average | | | | 9,300 |
| | $ | 19.78 |
| | | | $ | 184,000 |
| | |
ITEM 3. DEFAULTS UPON SENIOR SECURITIES
None.
ITEM 4. MINE SAFETY DISCLOSURES
Not applicable.
ITEM 5. OTHER INFORMATION
None.The Company expects to hold its 2019 Annual Meeting of Stockholders on or around April 26, 2019 (the “2019 Annual Meeting”). Because the date of the 2019 Annual Meeting is more than 30 days before the anniversary date of the Company’s 2018 Annual Meeting, in accordance with Rule 14a-5(f) under the Exchange Act, the Company is informing stockholders of this change.
For stockholders who wish to present a proposal to be considered for inclusion in our proxy statement to be delivered in connection with the 2019 Annual Meeting, pursuant to Rule 14a-8 under the Exchange Act, the proposal must be delivered to our Secretary at the Company’s principal executive offices prior to the close of business on December 6, 2018, which we have determined to be a reasonable time before we expect to begin to print and mail our proxy materials for the 2019 Annual Meeting. Such stockholder proposals must otherwise comply with the requirements of Rule 14a-8 of the Exchange Act.
Additionally, under the Company’s Amended and Restated Bylaws, any stockholder proposal submitted for consideration at the 2019 Annual Meeting but not submitted for inclusion in our Proxy Statement for our 2019 Annual Meeting pursuant to Rule 14a-8 under the Exchange Act, including stockholder nominations for candidates for election as directors, must be delivered to the Secretary at the principal executive offices of the Company not earlier than November 27, 2018, nor later than 5:00 p.m., Eastern Time, on December 27, 2018.
ITEM 6. EXHIBITS
|
| | | |
Exhibit Number | | Exhibit Description |
| | | | |
| | 31.1 | | |
| | | | |
| | 31.2 | | |
| | | | |
| | 31.3 | | |
| | | | |
| | 32.1 | | |
| | | | |
| | 32.2 | | |
| | | | |
| | 32.3 | | |
| | | | |
| | 101.INS | | XBRL Instance Document - the instance document does not appear in the Interactive Data File because its XBRL tags are embedded within the Inline XBRL document. |
| | | | |
| | 101.SCH | | XBRL Taxonomy Extension Schema Document. |
| | | | |
| | 101.CAL | | XBRL Taxonomy Extension Calculation Linkbase Document. |
| | | | |
| | 101.DEF | | XBRL Taxonomy Extension Definition Linkbase Document. |
| | | | |
| | 101.LAB | | XBRL Taxonomy Extension Label Linkbase Document. |
| | | | |
| | 101.PRE | | XBRL Taxonomy Extension Presentation Linkbase Document. |
_______________________
Certain agreements and other documents filed as exhibits to this Form 10-Q contain representations and warranties that the parties thereto made to each other. These representations and warranties have been made solely for the benefit of the other parties to such agreements and may have been qualified by certain information that has been disclosed to the other parties to such agreements and other documents and that may not be reflected in such agreements and other documents. In addition, these representations and warranties may be intended as a way of allocating risks among parties if the statements contained therein prove to be incorrect, rather than as actual statements of fact. Accordingly, there can be no reliance on any such representations and warranties as characterizations of the actual state of facts. Moreover, information concerning the subject matter of any such representations and warranties may have changed since the date of such agreements and other documents.
SIGNATURES
Pursuant to the requirements of the Securities Exchange Act of 1934, the registrant has duly caused this report to be signed on its behalf by the undersigned thereunto duly authorized.
|
| | | |
| | | KKR REAL ESTATE FINANCE TRUST INC. |
| | | | |
| Date: | May 9,November 5, 2018 | By: | /s/ Christen E.J. Lee |
| | | | Name: Christen E.J. Lee |
| | | | Title: Co-Chief Executive Officer and Co-President |
| | | | (Co-Principal Executive Officer) |
| | | | |
| Date: | May 9,November 5, 2018 | By: | /s/ Matthew A. Salem |
| | | | Name: Matthew A. Salem |
| | | | Title: Co-Chief Executive Officer and Co-President |
| | | | (Co-Principal Executive Officer) |
| | | | |
| Date: | May 9,November 5, 2018 | By: | /s/ Mostafa Nagaty |
| | | | Name: Mostafa Nagaty |
| | | | Title: Chief Financial Officer and Treasurer |
| | | | (Principal Financial and Accounting Officer) |