UNITED STATES
SECURITIES AND EXCHANGE COMMISSION
WASHINGTON D.C. 20549
|
| | |
| (Mark One) | | |
| x |
| Quarterly Report Pursuant to Section 13 or 15(d) of the Securities Exchange Act of 1934 |
| | | |
For the Quarterly Period Ended JuneSeptember 30, 2019 |
| or |
o |
| Transition Report Pursuant to Section 13 or 15(d) of the Securities Exchange Act of 1934 |
For the Transition Period from to . |
Commission file number 001-37427
HORIZON GLOBAL CORPORATION
(Exact name of registrant as specified in its charter) |
| | |
| | | |
Delaware (State or other jurisdiction of incorporation or organization) | | 47-3574483 (IRS Employer Identification No.) |
2600 W. Big Beaver Road, Suite 555
Troy, Michigan 48084
(Address of principal executive offices, including zip code)
(248) 593-8820
(Registrant’s telephone number, including area code)
Securities registered pursuant to Section 12(b) of the Act:
|
| | | | |
| Title of each class | | Trading Symbol(s) | | Name of each exchange on which registered |
| Common Stock, $0.01 par value | | HZN | | New York Stock Exchange |
Indicate by check mark whether the Registrant (1) has filed all reports required to be filed by Section 13 or 15(d) of the Securities Exchange Act of 1934 during the preceding 12 months (or for such shorter period that the Registrant was required to file such reports), and (2) has been subject to such filing requirements for the past 90 days. Yes x No o.
Indicate by check mark whether the registrant has submitted electronically every Interactive Data File required to be submitted pursuant to Rule 405 of Regulation S-T during the preceding 12 months (or for such shorter period that the registrant was required to submit such files). Yes x No o.
Indicate by check mark whether the registrant is a large accelerated filer, an accelerated filer, a non-accelerated filer, smaller reporting company, or an emerging growth company. See definitions of “large accelerated filer,” “accelerated filer,” “smaller reporting company,” and “emerging growth company” in Rule 12b-2 of the Exchange Act.
|
| | | | | | | | |
Large accelerated filer o | | Accelerated filer x | | Non-accelerated filer o | | Smaller reporting company o | | Emerging growth company x |
| | | | | | | | | |
If an emerging growth company, indicate by check mark if the registrant has elected not to use the extended transition period for complying with any new or revised financial accounting standards provided pursuant to Section 13(a) of the Exchange Act. Yes x No o
Indicate by check mark whether the registrant is a shell company (as defined in Rule 12b-2 of the Exchange Act). Yes o No x
As of August 2,November 7, 2019, the number of outstanding shares of the Registrant’s common stock was 25,320,91225,387,388 shares.
HORIZON GLOBAL CORPORATION
Index
Forward-Looking Statements
This Quarterly Report on Form 10-Q may contain “forward-looking statements” as defined in the Private Securities Litigation Reform Act of 1995. Forward-looking statements speak only as of the date they are made and give our current expectations or forecasts of future events. These forward-looking statements can be identified by the use of forward-looking words, such as “may,” “could,” “should,” “estimate,” “project,” “forecast,” “intend,” “expect,” “anticipate,” “believe,” “target,” “plan” or other comparable words, or by discussions of strategy that may involve risks and uncertainties.
These forward-looking statements are subject to numerous assumptions, risks and uncertainties which could materially affect our business, financial condition or future results including, but not limited to, risks and uncertainties with respect to: the Company’s leverage; liabilities and restrictions imposed by the Company’s debt instruments; market demand; competitive factors; supply constraints; material and energy costs; technology factors; litigation; government and regulatory actions including the impact of any tariffs, quotas or surcharges; the Company’s accounting policies; future trends; general economic and currency conditions; various conditions specific to the Company’s business and industry; the Company’s ability to regain compliance with the New York Stock Exchange’s continued listing standards and maintain such compliance; the Company’s ability to successfully complete the sale of its Asia-Pacific segment; the success of the Company’s action plan, including the actual amount of savings and timing thereof; the success of our business improvement initiatives in Europe-Africa, including the amount of savings and timing thereof; the Company’s exposure to product liability claims from customers and end users, and the costs associated therewith; the Company’s ability to meet its covenants in the agreements governing its debt, includingdebt; or the contractually obligated prepayment on its first lien term loan, or obtain any amendments or waivers thereto;Company’s ability to maintain compliance with the New York Stock Exchange’s continued listing standards and other risks that are discussed in Item 1A, “Risk Factors” in the Company’s Annual Report on Form 10-K for the year ended December 31, 2018. The risks described in our Annual Report and elsewhere in this report are not the only risks facing our Company. Additional risks and uncertainties not currently known to us or that we currently deemed to be immaterial also may materially adversely affect our business, financial position and results of operations or cash flows.
The cautionary statements set forth above should be considered in connection with any subsequent written or oral forward-looking statements that we or persons acting on our behalf may issue. We caution readers not to place undue reliance on the statements, which speak only as of the date of this report. We do not undertake any obligation to review or confirm analysts’ expectations or estimates or to release publicly any revisions to any forward-looking statement to reflect events or circumstances after the date of this report or to reflect the occurrence of unanticipated events, except as otherwise required by law.
We disclose important factors that could cause our actual results to differ materially from our expectations implied by our forward-looking statements under Item 2, “Management’s Discussion and Analysis of Financial Condition and Results of Operations,” and elsewhere in this report. These cautionary statements qualify all forward-looking statements attributed to us or persons acting on our behalf. When we indicate that an event, condition or circumstance could or would have an adverse effect on us, we mean to include effects upon our business, financial and other conditions, results of operations, prospects and ability to service our debt.
PART I. FINANCIAL INFORMATION
Item 1. Condensed Consolidated Financial Statements
HORIZON GLOBAL CORPORATION
CONDENSED CONSOLIDATED BALANCE SHEETS
(unaudited—dollars in thousands)
| |
| | June 30,
2019 |
| December 31,
2018 | | | | | |
| | | (unaudited) | | | | September 30,
2019 |
| December 31,
2018 |
| Assets | |
| |
| |
| |
|
| Current assets: | |
| |
| |
| |
|
| Cash and cash equivalents | | $ | 16,760 |
|
| $ | 27,650 |
| | $ | 16,360 |
|
| $ | 27,650 |
|
| Receivables, net of allowance for doubtful accounts of approximately $4.4 million and $5.1 million at June 30, 2019 and December 31, 2018, respectively. | | 137,660 |
|
| 108,340 |
| |
| Receivables, net of allowance for doubtful accounts of approximately $5.0 million and $4.8 million at September 30, 2019 and December 31, 2018, respectively | | | 93,480 |
|
| 95,170 |
|
| Inventories | | 177,830 |
|
| 173,690 |
| | 141,150 |
|
| 152,200 |
|
| Prepaid expenses and other current assets | | 9,250 |
|
| 9,690 |
| | 9,480 |
|
| 8,270 |
|
| Current assets held-for-sale | | | — |
| | 36,080 |
|
| Total current assets | | 341,500 |
| | 319,370 |
| | 260,470 |
| | 319,370 |
|
| Property and equipment, net | | 97,830 |
|
| 102,280 |
| | 78,670 |
|
| 86,500 |
|
| Operating lease right-of-use assets | | 72,220 |
| | — |
| | 56,170 |
| | — |
|
| Goodwill | | 12,700 |
|
| 12,660 |
| | 4,200 |
|
| 4,500 |
|
| Other intangibles, net | | 71,900 |
|
| 78,050 |
| | 60,350 |
|
| 69,400 |
|
| Deferred income taxes | | 2,510 |
| | 2,690 |
| | 440 |
| | 660 |
|
| Non-current assets held-for-sale | | | — |
| | 34,790 |
|
| Other assets | | 6,080 |
|
| 6,300 |
| | 5,700 |
|
| 6,130 |
|
| Total assets | | $ | 604,740 |
| | $ | 521,350 |
| | $ | 466,000 |
| | $ | 521,350 |
|
| Liabilities and Shareholders' Equity | |
| |
| |
| |
|
| Current liabilities: | |
| |
| |
| |
|
| Short-term borrowings and current maturities, long-term debt | | $ | 166,760 |
|
| $ | 13,860 |
| | $ | 24,270 |
|
| $ | 13,860 |
|
| Accounts payable | | 111,800 |
|
| 123,130 |
| | 79,440 |
|
| 102,350 |
|
| Short-term operating lease liabilities | | 13,190 |
| | — |
| | 9,850 |
| | — |
|
| Current liabilities held-for-sale | | | — |
| | 28,080 |
|
| Accrued liabilities | | 71,250 |
|
| 65,820 |
| | 53,020 |
|
| 58,520 |
|
| Total current liabilities | | 363,000 |
| | 202,810 |
| | 166,580 |
| | 202,810 |
|
| Gross long-term debt | | | 214,930 |
| | 382,220 |
|
| Unamortized debt issuance costs and discount | | | (34,200 | ) | | (31,570 | ) |
| Long-term debt | | 238,780 |
|
| 350,650 |
| | 180,730 |
| | 350,650 |
|
| Deferred income taxes | | 13,160 |
|
| 14,150 |
| | 8,280 |
|
| 12,620 |
|
| Long-term operating lease liabilities | | 59,020 |
| | — |
| | 50,890 |
| | — |
|
| Non-current liabilities held-for-sale | | | — |
| | 1,740 |
|
| Other long-term liabilities | | 19,100 |
|
| 19,960 |
| | 20,770 |
|
| 19,750 |
|
| Total liabilities | | 693,060 |
| | 587,570 |
| | 427,250 |
| | 587,570 |
|
| Contingencies (See Note 12) | |
|
| |
|
| |
| Shareholders' deficit: | | | | | |
| Contingencies (See Note 13) | | |
|
| |
|
|
| Shareholders' equity (deficit): | | | | | |
| Preferred stock, $0.01 par: Authorized 100,000,000 shares; Issued and outstanding: None | | — |
| | — |
| | — |
| | — |
|
| Common stock, $0.01 par: Authorized 400,000,000 shares; 26,003,240 shares issued and 25,316,734 outstanding at June 30, 2019, and 25,866,747 shares issued and 25,180,241 outstanding at December 31, 2018. | | 250 |
| | 250 |
| |
| Common stock warrants exercisable for 6,554,150 shares issued and outstanding at June 30, 2019; none issued and outstanding at December 31, 2018 | | 10,720 |
| | — |
| |
| Common stock, $0.01 par: Authorized 400,000,000 shares; 26,073,894 shares issued and 25,387,388 outstanding at September 30, 2019, and 25,866,747 shares issued and 25,180,241 outstanding at December 31, 2018 | | | 250 |
| | 250 |
|
| Common stock warrants exercisable for 6,487,674 shares issued and outstanding at September 30, 2019; none issued and outstanding at December 31, 2018 | | | 10,720 |
| | — |
|
| Paid-in capital | | 161,920 |
| | 160,990 |
| | 162,760 |
| | 160,990 |
|
| Treasury stock, at cost: 686,506 shares at June 30, 2019 and December 31, 2018 | | (10,000 | ) | | (10,000 | ) | |
| Treasury stock, at cost: 686,506 shares at September 30, 2019 and December 31, 2018 | | | (10,000 | ) | | (10,000 | ) |
| Accumulated deficit | | (255,900 | ) | | (222,720 | ) | | (110,390 | ) | | (222,720 | ) |
| Accumulated other comprehensive income | | 7,770 |
| | 7,760 |
| |
| Total Horizon Global shareholders' deficit | | (85,240 | ) | | (63,720 | ) | |
| Accumulated other comprehensive (loss) income | | | (11,250 | ) | | 7,760 |
|
| Total Horizon Global shareholders' equity (deficit) | | | 42,090 |
| | (63,720 | ) |
| Noncontrolling interest | | (3,080 | ) | | (2,500 | ) | | (3,340 | ) | | (2,500 | ) |
| Total shareholders' deficit | | (88,320 | ) | | (66,220 | ) | |
| Total shareholders' equity (deficit) | | | 38,750 |
| | (66,220 | ) |
| Total liabilities and shareholders' equity | | $ | 604,740 |
| | $ | 521,350 |
| | $ | 466,000 |
| | $ | 521,350 |
|
The accompanying notes are an integral part of these condensed consolidated financial statements.
HORIZON GLOBAL CORPORATION
CONDENSED CONSOLIDATED STATEMENTS OF OPERATIONS
(unaudited—dollars in thousands, except share and per share data)
| | | | | Three months ended
June 30, | | Six months ended
June 30, | | Three months ended
September 30, | | Nine months ended
September 30, |
| | | 2019 | | 2018 | | 2019 | | 2018 | | 2019 | | 2018 | | 2019 | | 2018 |
| Net sales | | $ | 223,160 |
| | $ | 233,340 |
| | $ | 432,820 |
| | $ | 450,150 |
| | $ | 177,850 |
| | $ | 194,030 |
| | $ | 548,170 |
| | $ | 576,250 |
|
| Cost of sales | | (179,110 | ) | | (185,770 | ) | | (356,690 | ) | | (364,130 | ) | | (149,560 | ) | | (159,500 | ) | | (460,010 | ) | | (472,120 | ) |
| Gross profit | | 44,050 |
| | 47,570 |
| | 76,130 |
| | 86,020 |
| | 28,290 |
| | 34,530 |
| | 88,160 |
| | 104,130 |
|
| Selling, general and administrative expenses | | (37,010 | ) | | (55,740 | ) | | (78,540 | ) | | (103,920 | ) | | (41,100 | ) | | (37,680 | ) | | (113,140 | ) | | (134,210 | ) |
| Impairment of goodwill and intangible assets | | — |
| | (55,700 | ) | | — |
| | (99,130 | ) | | — |
| | (26,640 | ) | | — |
| | (125,770 | ) |
| Net gain (loss) on dispositions of property and equipment | | 10 |
| | (270 | ) | | 1,470 |
| | (380 | ) | | 50 |
| | (110 | ) | | 1,500 |
| | (520 | ) |
| Operating profit (loss) | | 7,050 |
| | (64,140 | ) | | (940 | ) | | (117,410 | ) | |
| Other income (expense), net | | 400 |
| | (6,610 | ) | | (5,210 | ) | | (7,730 | ) | |
| Operating loss | | | (12,760 | ) | | (29,900 | ) | | (23,480 | ) | | (156,370 | ) |
| Other expense, net | | | (1,640 | ) | | (1,040 | ) | | (6,610 | ) | | (7,410 | ) |
| Interest expense | | (15,430 | ) | | (6,190 | ) | | (26,370 | ) | | (12,140 | ) | | (24,120 | ) | | (7,590 | ) | | (50,270 | ) | | (19,580 | ) |
| Loss before income tax | | (7,980 | ) | | (76,940 | ) | | (32,520 | ) | | (137,280 | ) | |
| Income tax (expense) benefit | | (160 | ) | | 9,780 |
| | (1,240 | ) | | 12,360 |
| |
| Net loss | | (8,140 | ) | | (67,160 | ) | | (33,760 | ) | | (124,920 | ) | |
| Loss from continuing operations before income tax | | | (38,520 | ) | | (38,530 | ) | | (80,360 | ) | | (183,360 | ) |
| Income tax benefit | | | 1,020 |
| | 1,420 |
| | 2,330 |
| | 15,770 |
|
| Net loss from continuing operations | | | (37,500 | ) | | (37,110 | ) | | (78,030 | ) | | (167,590 | ) |
| Income from discontinued operations, net of tax | | | 182,750 |
| | 4,110 |
| | 189,520 |
| | 9,670 |
|
| Net income (loss) | | | 145,250 |
| | (33,000 | ) | | 111,490 |
|
| (157,920 | ) |
| Less: Net loss attributable to noncontrolling interest | | (60 | ) | | (230 | ) | | (580 | ) | | (480 | ) | | (260 | ) | | (240 | ) | | (840 | ) | | (720 | ) |
| Net loss attributable to Horizon Global | | $ | (8,080 | ) | | $ | (66,930 | ) | | $ | (33,180 | ) | | $ | (124,440 | ) | |
| Net loss per share attributable to Horizon Global: | | | | | | | | | |
| Basic | | $ | (0.32 | ) | | $ | (2.68 | ) | | $ | (1.31 | ) | | $ | (4.98 | ) | |
| Diluted | | $ | (0.32 | ) | | $ | (2.68 | ) | | $ | (1.31 | ) | | $ | (4.98 | ) | |
| Net income (loss) attributable to Horizon Global | | | $ | 145,510 |
| | $ | (32,760 | ) | | $ | 112,330 |
| | $ | (157,200 | ) |
| Net income (loss) per share attributable to Horizon Global: | | | | | | | | | |
| Basic: | | | | | | | | | |
| Continuing operations | | | $ | (1.47 | ) | | $ | (1.47 | ) | | $ | (3.05 | ) | | $ | (6.67 | ) |
| Discontinued operations | | | 7.21 |
| | 0.16 |
| | 7.50 |
| | 0.39 |
|
| Total | | | 5.74 |
| | (1.31 | ) | | 4.45 |
| | (6.28 | ) |
| Diluted: | | | | | | | | | |
| Continuing operations | | | (1.47 | ) | | (1.47 | ) | | (3.05 | ) | | (6.67 | ) |
| Discontinued operations | | | 7.21 |
| | 0.16 |
| | 7.50 |
| | 0.39 |
|
| Total | | | 5.74 |
| | (1.31 | ) | | 4.45 |
| | (6.28 | ) |
| Weighted average common shares outstanding: | | | | | | | | | | | | | | | | |
| Basic | | 25,282,791 |
| | 25,017,725 |
| | 25,235,704 |
| | 24,990,573 |
| | 25,329,492 |
| | 25,101,847 |
| | 25,267,310 |
| | 25,028,072 |
|
| Diluted | | 25,282,791 |
| | 25,017,725 |
| | 25,235,704 |
| | 24,990,573 |
| | 25,329,492 |
| | 25,101,847 |
| | 25,267,310 |
| | 25,028,072 |
|
The accompanying notes are an integral part of these condensed consolidated financial statements.
HORIZON GLOBAL CORPORATION
CONDENSED CONSOLIDATED STATEMENTS OF COMPREHENSIVE LOSS
(unaudited—dollars in thousands)
|
| | | | | | | | | | | | | | | | |
| | | Three months ended
June 30, | | Six months ended
June 30, |
| | | 2019 | | 2018 | | 2019 | | 2018 |
| Net loss | | $ | (8,140 | ) | | $ | (67,160 | ) | | $ | (33,760 | ) | | $ | (124,920 | ) |
| Other comprehensive income (loss), net of tax: | | | | | | | | |
| Foreign currency translation and other | | 80 |
| | (6,880 | ) | | 1,290 |
| | (3,720 | ) |
| Derivative instruments | | (210 | ) | | 790 |
| | (1,280 | ) | | 2,320 |
|
| Total other comprehensive income (loss), net of tax | | (130 | ) | | (6,090 | ) | | 10 |
| | (1,400 | ) |
| Total comprehensive loss | | (8,270 | ) | | (73,250 | ) | | (33,750 | ) | | (126,320 | ) |
| Less: Comprehensive loss attributable to noncontrolling interest | | (60 | ) | | (310 | ) | | (580 | ) | | (550 | ) |
| Comprehensive loss attributable to Horizon Global | | $ | (8,210 | ) | | $ | (72,940 | ) | | $ | (33,170 | ) | | $ | (125,770 | ) |
|
| | | | | | | | | | | | | | | | |
| | | Three months ended
September 30, | | Nine months ended
September 30, |
| | | 2019 | | 2018 | | 2019 | | 2018 |
| Net income (loss) | | $ | 145,250 |
| | $ | (33,000 | ) | | $ | 111,490 |
| | $ | (157,920 | ) |
| Other comprehensive loss, net of tax: | | | | | | | | |
| Foreign currency translation and other | | (1,320 | ) | | (680 | ) | | (30 | ) | | (4,400 | ) |
| Derivative instruments | | (440 | ) | | 640 |
| | (1,720 | ) | | 2,960 |
|
| Total other comprehensive loss, net of tax | | (1,760 | ) | | (40 | ) | | (1,750 | ) | | (1,440 | ) |
| Total comprehensive income (loss) | | 143,490 |
| | (33,040 | ) | | 109,740 |
| | (159,360 | ) |
| Less: Comprehensive loss attributable to noncontrolling interest | | (250 | ) | | (240 | ) | | (830 | ) | | (790 | ) |
| Comprehensive income (loss) attributable to Horizon Global | | $ | 143,740 |
| | $ | (32,800 | ) | | $ | 110,570 |
| | $ | (158,570 | ) |
The accompanying notes are an integral part of these condensed consolidated financial statements.
HORIZON GLOBAL CORPORATION
CONDENSED CONSOLIDATED STATEMENTS OF CASH FLOWS
(unaudited—dollars in thousands)
| | | | | Six months ended
June 30, |
| Nine months ended
September 30, |
| | | 2019 | | 2018 |
| 2019 |
| 2018 |
| Cash Flows from Operating Activities: | | | | |
|
|
|
|
| Net loss | | $ | (33,760 | ) | | $ | (124,920 | ) | |
| Adjustments to reconcile net loss to net cash used for operating activities: | | | | | |
| Net income (loss) | | | $ | 111,490 |
| | $ | (157,920 | ) |
| Less: Net income from discontinued operations | | | 189,520 |
| | 9,670 |
|
| Net loss from continuing operations | | | (78,030 | ) | | (167,590 | ) |
| | | |
| |
|
| Adjustments to reconcile net loss from continued operations to net cash used for operating activities: | |
|
|
|
|
| Net (gain) loss on dispositions of property and equipment | | (1,470 | ) | | 380 |
|
| (1,500 | ) | | 520 |
|
| Depreciation | | 9,320 |
| | 8,240 |
|
| 11,980 |
| | 9,410 |
|
| Amortization of intangible assets | | 3,460 |
| | 4,140 |
|
| 4,800 |
| | 5,640 |
|
| Write off of operating lease assets | | | 4,250 |
| | — |
|
| Impairment of goodwill and intangible assets | | — |
| | 99,130 |
|
| — |
| | 125,770 |
|
| Amortization of original issuance discount and debt issuance costs | | 9,900 |
| | 3,870 |
|
| 18,570 |
| | 6,050 |
|
| Deferred income taxes | | (30 | ) | | (1,850 | ) |
| (3,390 | ) | | (3,370 | ) |
| Non-cash compensation expense | | 940 |
| | 1,210 |
|
| 1,790 |
| | 1,430 |
|
| Paid-in-kind interest | | 4,370 |
| | — |
|
| 7,620 |
| | — |
|
| Increase in receivables | | (32,330 | ) | | (40,450 | ) |
| (4,680 | ) | | (31,950 | ) |
| (Increase) decrease in inventories | | (10,630 | ) | | 530 |
| |
| Decrease in inventories | |
| 1,920 |
| | 5,630 |
|
| (Increase) decrease in prepaid expenses and other assets | | (940 | ) | | 1,510 |
|
| (2,770 | ) | | 1,150 |
|
| (Decrease) increase in accounts payable and accrued liabilities | | (360 | ) | | 12,590 |
| |
| Decrease in accounts payable and accrued liabilities | |
| (15,560 | ) | | (27,450 | ) |
| Other, net | | 2,770 |
| | 260 |
|
| (10,800 | ) | | 220 |
|
| Net cash used for operating activities | | (48,760 | ) | | (35,360 | ) | |
| Net cash used for operating activities for continuing operations | | | (65,800 | ) | | (74,540 | ) |
| Cash Flows from Investing Activities: | | | | | | | | |
| Capital expenditures | | (6,630 | ) | | (7,790 | ) | | (8,460 | ) | | (9,660 | ) |
| Net proceeds from sale of business | | 4,970 |
| | — |
| | 214,570 |
| | — |
|
| Net proceeds from disposition of property and equipment | | 1,580 |
| | 140 |
| | 1,470 |
| | (280 | ) |
| Net cash used for investing activities | | (80 | ) | | (7,650 | ) | |
| Net cash provided by (used for) investing activities for continuing operations | | | 207,580 |
| | (9,940 | ) |
| Cash Flows from Financing Activities: | | | | | | | | |
| Proceeds from borrowings on credit facilities | | 14,100 |
| | 2,630 |
| | 13,780 |
| | 12,550 |
|
| Repayments of borrowings on credit facilities | | (840 | ) | | (8,670 | ) | | (6,520 | ) | | (14,390 | ) |
| Proceeds from Second Lien Term Loan, net of issuance costs | | 35,520 |
| | — |
| | 35,520 |
| | 45,430 |
|
| Repayments of borrowings on First Lien Term Loan, inclusive of transaction costs | | (10,090 | ) | | (3,940 | ) | | (173,430 | ) | | (6,490 | ) |
| Proceeds from ABL Revolving Debt, net of issuance costs | | 60,340 |
| | 66,110 |
| | 68,790 |
| | 72,430 |
|
| Repayments of borrowings on ABL Revolving Debt | | (72,080 | ) | | (13,510 | ) | | (112,510 | ) | | (34,830 | ) |
| Proceeds from issuance of Series A Preferred Stock | | 5,340 |
| | — |
| | 5,340 |
| | — |
|
| Proceeds from issuance of Warrants | | 5,380 |
| | — |
| | 5,380 |
| | — |
|
| Other, net | | (10 | ) | | (210 | ) | | (10 | ) | | (300 | ) |
| Net cash provided by financing activities | | 37,660 |
| | 42,410 |
| |
| Net cash (used for) provided by financing activities for continuing operations | | | (163,660 | ) | | 74,400 |
|
| Discontinued Operations: | | | | | |
| Net cash provided by discontinued operating activities | | | 11,430 |
| | 8,500 |
|
| Net cash used for discontinued investing activities | | | (1,120 | ) | | (720 | ) |
| Net cash provided by (used for) discontinued financing activities | | | — |
| | — |
|
| Net cash provided by discontinued operations | | | 10,310 |
| | 7,780 |
|
| Effect of exchange rate changes on cash | | 290 |
| | (80 | ) | | 280 |
| | 40 |
|
| Cash and Cash Equivalents: | | | | | | | | |
| Decrease for the period | | (10,890 | ) | | (680 | ) | | (11,290 | ) | | (2,260 | ) |
| At beginning of period | | 27,650 |
| | 29,570 |
| | 27,650 |
| | 29,570 |
|
| At end of period | | $ | 16,760 |
| | $ | 28,890 |
| | $ | 16,360 |
|
| $ | 27,310 |
|
| Supplemental disclosure of cash flow information: | | | | | | | | |
| Cash paid for interest | | $ | 11,750 |
| | $ | 7,550 |
| | $ | 19,730 |
| | $ | 13,430 |
|
| Cash paid for taxes | | $ | 4,950 |
| | $ | 3,770 |
| | $ | 480 |
| | $ | 2,170 |
|
The accompanying notes are an integral part of these condensed consolidated financial statements.
HORIZON GLOBAL CORPORATION
CONDENSED CONSOLIDATED STATEMENTS OF SHAREHOLDERS’ EQUITY
(unaudited—dollars in thousands)
| | | | | Common
Stock | | Common Stock Warrants | | Paid-in
Capital | | Treasury Stock | | Accumulated Deficit | | Accumulated
Other
Comprehensive
Income (Loss) | | Total Horizon Global Shareholders’ Deficit | | Noncontrolling Interest | | Total Shareholders’ Deficit | | Common
Stock | | Common Stock Warrants | | Paid-in
Capital | | Treasury Stock | | Accumulated Deficit | | Accumulated
Other
Comprehensive
Income (Loss) | | Total Horizon Global Shareholders’ Deficit | | Noncontrolling Interest | | Total Shareholders’ Deficit |
| Balance at January 1, 2019 | | $ | 250 |
| | $ | — |
| | $ | 160,990 |
| | $ | (10,000 | ) | | $ | (222,720 | ) | | $ | 7,760 |
| | $ | (63,720 | ) | | $ | (2,500 | ) | | $ | (66,220 | ) | | $ | 250 |
| | $ | — |
| | $ | 160,990 |
| | $ | (10,000 | ) | | $ | (222,720 | ) | | $ | 7,760 |
| | $ | (63,720 | ) | | $ | (2,500 | ) | | $ | (66,220 | ) |
| Net loss | | — |
| | — |
| | — |
| | — |
| | (25,100 | ) | | — |
| | (25,100 | ) | | (520 | ) | | (25,620 | ) | | — |
| | — |
| | — |
| | — |
| | (25,100 | ) | | — |
| | (25,100 | ) | | (520 | ) | | (25,620 | ) |
| Other comprehensive income, net of tax | | — |
| | — |
| | — |
| | — |
| | — |
| | 140 |
| | 140 |
| | — |
| | 140 |
| | — |
| | — |
| | — |
| | — |
| | — |
| | 140 |
| | 140 |
| | — |
| | 140 |
|
| Shares surrendered upon vesting of employees; share based payment awards to cover tax obligations | | — |
| | — |
| | (10 | ) | | — |
| | — |
| | — |
| | (10 | ) | | — |
| | (10 | ) | |
| Shares surrendered upon vesting of employees share based payment awards to cover tax obligations | | | — |
| | — |
| | (10 | ) | | — |
| | — |
| | — |
| | (10 | ) | | — |
| | (10 | ) |
| Non-cash compensation expense | | — |
| | — |
| | 350 |
| | — |
| | — |
| | — |
| | 350 |
| | — |
| | 350 |
| | — |
| | — |
| | 350 |
| | — |
| | — |
| | — |
| | 350 |
| | — |
| | 350 |
|
| Issuance of Warrants | | — |
| | 5,380 |
| | — |
| | — |
| | — |
| | — |
| | 5,380 |
| | — |
| | 5,380 |
| | — |
| | 5,380 |
| | — |
| | — |
| | — |
| | — |
| | 5,380 |
| | — |
| | 5,380 |
|
| Balance at March 31, 2019 | | 250 |
|
| 5,380 |
|
| 161,330 |
|
| (10,000 | ) |
| (247,820 | ) |
| 7,900 |
|
| (82,960 | ) |
| (3,020 | ) |
| (85,980 | ) | | 250 |
|
| 5,380 |
|
| 161,330 |
|
| (10,000 | ) |
| (247,820 | ) |
| 7,900 |
|
| (82,960 | ) |
| (3,020 | ) |
| (85,980 | ) |
| Net Loss | | — |
| | — |
| | — |
| | — |
| | (8,080 | ) | | — |
| | (8,080 | ) | | (60 | ) | | (8,140 | ) | | — |
| | — |
| | — |
| | — |
| | (8,080 | ) | | — |
| | (8,080 | ) | | (60 | ) | | (8,140 | ) |
| Other comprehensive income, net of tax | | — |
| | — |
| | — |
| | — |
| | — |
| | (130 | ) | | (130 | ) | | — |
| | (130 | ) | | — |
| | — |
| | — |
| | — |
| | — |
| | (130 | ) | | (130 | ) | | — |
| | (130 | ) |
| Non-cash compensation expense | | — |
| | — |
| | 590 |
| | — |
| | — |
| | — |
| | 590 |
| | — |
| | 590 |
| | — |
| | — |
| | 590 |
| | — |
| | — |
| | — |
| | 590 |
| | — |
| | 590 |
|
| Issuance of Warrants | | | | 5,340 |
| | | | | | | | | | 5,340 |
| | | | 5,340 |
| | — |
| | 5,340 |
| | — |
| | — |
| | — |
| | — |
| | 5,340 |
| | — |
| | 5,340 |
|
| Balance at June 30, 2019 | | $ | 250 |
|
| $ | 10,720 |
|
| $ | 161,920 |
|
| $ | (10,000 | ) |
| $ | (255,900 | ) |
| $ | 7,770 |
|
| $ | (85,240 | ) |
| $ | (3,080 | ) |
| $ | (88,320 | ) | |
| Balance as of June 30, 2019 | | | 250 |
| | 10,720 |
| | 161,920 |
| | (10,000 | ) | | (255,900 | ) | | 7,770 |
| | (85,240 | ) | | (3,080 | ) | | (88,320 | ) |
| Net income | | | — |
| | — |
| | — |
| | — |
| | 145,510 |
| | — |
| | 145,510 |
| | (260 | ) | | 145,250 |
|
| Other comprehensive loss, net of tax | | | — |
| | — |
| | — |
| | — |
| | — |
| | (1,760 | ) | | (1,760 | ) | | — |
| | (1,760 | ) |
| Non-cash compensation expense | | | — |
| | — |
| | 840 |
| | — |
| | — |
| | — |
| | 840 |
| | — |
| | 840 |
|
| Amounts reclassified from AOCI | | | — |
| | — |
| | — |
| | — |
| | — |
| | (17,260 | ) | | (17,260 | ) | | — |
| | (17,260 | ) |
| Balance at September 30, 2019 | | | $ | 250 |
|
| $ | 10,720 |
|
| $ | 162,760 |
|
| $ | (10,000 | ) |
| $ | (110,390 | ) |
| $ | (11,250 | ) |
| $ | 42,090 |
|
| $ | (3,340 | ) |
| $ | 38,750 |
|
| | | | | Common
Stock | | Common Stock Warrants | | Paid-in
Capital | | Treasury Stock | | Accumulated Deficit | | Accumulated
Other
Comprehensive
Income (Loss) | | Total Horizon Global Shareholders’ Equity | | Noncontrolling Interest | | Total Shareholders’ Equity | | Common
Stock | | Common Stock Warrants | | Paid-in
Capital | | Treasury Stock | | Accumulated Deficit | | Accumulated
Other
Comprehensive
Income (Loss) | | Total Horizon Global Shareholders’ Equity | | Noncontrolling Interest | | Total Shareholders’ Equity |
| Balance at January 1, 2018 | | $ | 250 |
| | $ | — |
| | $ | 159,490 |
| | $ | (10,000 | ) | | $ | (17,860 | ) | | $ | 10,010 |
| | $ | 141,890 |
| | $ | (1,490 | ) | | $ | 140,400 |
| |
| Balance at December 31, 2017, as reported | | | $ | 250 |
| | $ | — |
| | $ | 159,490 |
| | $ | (10,000 | ) | | $ | (17,860 | ) | | $ | 10,010 |
| | $ | 141,890 |
| | $ | (1,490 | ) | | $ | 140,400 |
|
| Impact of ASU 2018-02 | | | — |
| | — |
| | 340 |
| | — |
| | (900 | ) | | 560 |
| | — |
| | — |
| | — |
|
| Balance at January 1, 2018, as restated | | | 250 |
|
| — |
|
| 159,830 |
|
| (10,000 | ) |
| (18,760 | ) |
| 10,570 |
|
| 141,890 |
|
| (1,490 | ) |
| 140,400 |
|
| Net loss | | — |
| | — |
| | — |
| | — |
| | (57,510 | ) | | — |
| | (57,510 | ) | | (250 | ) | | (57,760 | ) | | — |
| | — |
| | — |
| | — |
| | (57,510 | ) | | — |
| | (57,510 | ) | | (250 | ) | | (57,760 | ) |
| Other comprehensive income, net of tax | | — |
| | — |
| | — |
| | — |
| | — |
| | 4,680 |
| | 4,680 |
| | 10 |
| | 4,690 |
| | — |
| | — |
| | — |
| | — |
| | — |
| | 4,680 |
| | 4,680 |
| | 10 |
| | 4,690 |
|
| Shares surrendered upon vesting of employees; share based payment awards to cover tax obligations | | — |
| | — |
| | (200 | ) | | — |
| | — |
| | — |
| | (200 | ) | | — |
| | (200 | ) | |
| Shares surrendered upon vesting of employees share based payment awards to cover tax obligations | | | — |
| | — |
| | (200 | ) | | — |
| | — |
| | — |
| | (200 | ) | | — |
| | (200 | ) |
| Non-cash compensation expense | | — |
| | — |
| | 720 |
| | — |
| | — |
| | — |
| | 720 |
| | — |
| | 720 |
| | — |
| | — |
| | 720 |
| | — |
| | — |
| | — |
| | 720 |
| | — |
| | 720 |
|
| Balance at March 31, 2018 | | 250 |
|
| — |
|
| 160,010 |
|
| (10,000 | ) |
| (75,370 | ) |
| 14,690 |
| | 89,580 |
| | (1,730 | ) | | 87,850 |
| | 250 |
|
| — |
|
| 160,350 |
|
| (10,000 | ) |
| (76,270 | ) |
| 15,250 |
| | 89,580 |
| | (1,730 | ) | | 87,850 |
|
| Net loss | | — |
| | — |
| | — |
| | — |
| | (66,930 | ) | | — |
| | (66,930 | ) | | (230 | ) | | (67,160 | ) | | — |
| | — |
| | — |
| | — |
| | (66,930 | ) | | — |
| | (66,930 | ) | | (230 | ) | | (67,160 | ) |
| Other comprehensive income, net of tax | | — |
| | — |
| | — |
| | — |
| | — |
| | (6,010 | ) | | (6,010 | ) | | (80 | ) | | (6,090 | ) | | — |
| | — |
| | — |
| | — |
| | — |
| | (6,010 | ) | | (6,010 | ) | | (80 | ) | | (6,090 | ) |
| Shares surrendered upon vesting of employees; share based payment awards to cover tax obligations | | — |
| | — |
| | (10 | ) | | — |
| | — |
| | — |
| | (10 | ) | | — |
| | (10 | ) | |
| Shares surrendered upon vesting of employees share based payment awards to cover tax obligations | | | — |
| | — |
| | (10 | ) | | — |
| | — |
| | — |
| | (10 | ) | | — |
| | (10 | ) |
| Non-cash compensation expense | | — |
| | — |
| | 490 |
| | — |
| | — |
| | — |
| | 490 |
| | — |
| | 490 |
| | — |
| | — |
| | 490 |
| | — |
| | — |
| | — |
| | 490 |
| | — |
| | 490 |
|
| Balance at June 30, 2018 | | $ | 250 |
| | $ | — |
| | $ | 160,490 |
| | $ | (10,000 | ) | | $ | (142,300 | ) | | $ | 8,680 |
| | $ | 17,120 |
| | $ | (2,040 | ) | | $ | 15,080 |
| | 250 |
| | — |
| | 160,830 |
| | (10,000 | ) | | (143,200 | ) | | 9,240 |
| | 17,120 |
| | (2,040 | ) | | 15,080 |
|
| Net loss | | | — |
| | — |
| | — |
| | — |
| | (32,760 | ) | | — |
| | (32,760 | ) | | (240 | ) | | (33,000 | ) |
| Other comprehensive income, net of tax | | | — |
| | — |
| | — |
| | — |
| | — |
| | (40 | ) | | (40 | ) | | — |
| | (40 | ) |
| Shares surrendered upon vesting of employees share based payment awards to cover tax obligations | | | — |
| | — |
| | (90 | ) | | — |
| | — |
| | — |
| | (90 | ) | | — |
| | (90 | ) |
| Non-cash compensation expense | | | — |
| | — |
| | 220 |
| | — |
| | — |
| | — |
| | 220 |
| | — |
| | 220 |
|
| Balance at September 30, 2018 | | | $ | 250 |
| | $ | — |
| | $ | 160,960 |
| | $ | (10,000 | ) | | $ | (175,960 | ) | | $ | 9,200 |
| | $ | (15,550 | ) | | $ | (2,280 | ) | | $ | (17,830 | ) |
The accompanying notes are an integral part of these condensed consolidated financial statements.
HORIZON GLOBAL CORPORATION
NOTES TO CONDENSED CONSOLIDATED FINANCIAL STATEMENTS (Continued)
(unaudited)
1. General
Nature of operationsOperations and basisBasis of presentation.Presentation
Horizon Global Corporation (“Horizon,” “Horizon Global,” “we,” or the “Company”) is a global designer, manufacturer and distributor of a wide variety of high quality, custom-engineered towing, trailering, cargo management and other related accessories. These products are designed to support original equipment manufacturers (“OEMs”) and original equipment servicers (“OESs”) (collectively, “OEs”), aftermarket and retail customers within the agricultural, automotive, construction, horse/livestock, industrial, marine, military, recreational, trailer and utility markets. The Company groups its business into operating segments by the region in which sales and manufacturing efforts are focused. TheAs a result of the Company’s sale of its Horizon Asia-Pacific operating segment (“APAC”), the Company’s operating segments are Horizon Americas Horizon Europe-Africa, and Horizon Asia-Pacific.Europe-Africa. See Note 16,17, “Segment Information,” for further information on each of the Company’s operating segments. Historical information has been retrospectively adjusted to reflect the classification of APAC as discontinued operations. Discontinued operations are further discussed in Note 3, “Discontinued Operations”.
The accompanying unaudited condensed consolidated financial statements have been prepared pursuant to the rules and regulations of the U.S. Securities and Exchange Commission (the “SEC”) for interim financial information and should be read in conjunction with the consolidated financial statements and notes thereto included in the Company’s Annual Report on Form 10-K for the year ended December 31, 2018. Accordingly, they do not include all of the information and footnotes required by accounting principles generally accepted in the United States (“U.S. GAAP”) for complete financial statements. It is management’s opinion that these financial statements contain all adjustments, including adjustments of a normal and recurring nature, necessary for a fair presentation of financial position and results of operations. Results of operations for interim periods are not necessarily indicative of results for the full year.
2. New Accounting Pronouncements
Accounting pronouncements recently adopted
In June 2018, the Financial Accounting Standards Board (“FASB”) issued Accounting Standards Update (“ASU”) 2018-07, “Compensation - Stock Compensation (Topic 718)” (“ASU 2018-07”). ASU 2018-07 expands the scope of Accounting Standard Codification (“ASC”) 718 to include all share-based payment arrangements related to the acquisition of goods and services from both non-employees and employees. ASU 2018-07 is effective for fiscal years, and interim periods within those years, beginning after December 15, 2018 with early adoption permitted. The Company adopted ASU 2018-07 on January 1, 2019, and there was no impact on the Company’s condensed consolidated financial statements.
In August 2017, the FASB issued ASU 2017-12, “Derivatives and Hedging (Topic 815): Targeted Improvements to Accounting for Hedging Activities” (“ASU 2017-12”). ASU 2017-12 eliminates the requirement to separately measure and report hedge ineffectiveness and generally requires, for qualifying hedges, the entire change in the fair value of a hedging instrument to be presented in the same income statement line as the hedged item. The guidance also modifies the accounting for components excluded from the assessment of hedge effectiveness, eases documentation and assessment requirements and modifies certain disclosure requirements. ASU 2017-12 is effective for fiscal years beginning after December 15, 2018, including interim periods within those annual periods, with early adoption permitted and should be applied on a modified retrospective basis. The Company adopted ASU 2017-12 on January 1, 2019, and there was no impact on the Company’s condensed consolidated financial statements.
In February 2016, the FASB issued ASU 2016-02, “Leases (Topic 842)” (“ASU 2016-02”), which supersedes the lease requirements in “Leases (Topic 840).” The objective of this update is to establish the principles that lessees and lessors shall apply to report useful information to users of financial statements about the amount, timing, and uncertainty of cash flows arising from a lease. Under this guidance, lessees are required to recognize on the balance sheet a lease liability and a right-of-use (“ROU”) asset for all leases, with the exception of short-term leases with terms of twelve months or less. The lease liability represents the lessee’s obligation to make lease payments arising from a lease and will be measured as the present value of the lease payments. The ROU asset represents the lessee’s right to use a specified asset for the lease term, and will be measured at the lease liability amount, adjusted for lease prepayment, lease incentives received and the lessee’s initial direct costs.
The Company has elected the package of practical expedients, excluding the lease term hindsight, as permitted by the transition guidance. The Company has made an accounting policy election to exempt leases with an initial term of twelve months or less from balance sheet recognition. Instead, short-term leases will be expensed over the lease term.
The Company adopted the standard on January 1, 2019, by applying the modified retrospective method without restatement of comparative periods' financial information, as permitted by the transition guidance. The standard had a material impact on the Company’s condensed consolidated balance sheet, but did not have an impact on its condensed consolidated statements of operations
HORIZON GLOBAL CORPORATION
NOTES TO CONDENSED CONSOLIDATED FINANCIAL STATEMENTS (Continued)
(unaudited)
Company’s condensed consolidated balance sheet, but did not have a material impact on its condensed consolidated statements of operations and cash flows. The most significant impact was the recognition of ROU assets and lease liabilities for operating leases, while the Company’s accounting for finance leases remained substantially unchanged.
See Note 1112 “Leases,” for the impact of the adoption which resulted in the recognition of ROU assets and corresponding lease liabilities.
3. Discontinued Operations
On September 19, 2019, the Company completed the sale of its subsidiaries that comprised APAC to Hayman Pacific BidCo Pty Ltd., an affiliate of Pacific Equity Partners, for $209.6 million in net cash proceeds after payment of transaction costs, in a net debt free sale. The sale resulted in the recognition of a gain of $180.5 million, of which $17.3 million was related to the cumulative translation adjustment that was reclassified to earnings, which is reflected within the income from discontinued operations, net of taxes line of the condensed consolidated statement of operations.
The Company classified APAC assets and liabilities as held-for-sale as of December 31, 2018 in the accompanying condensed consolidated balance sheet and has classified APAC’s operating results and the gain on the sale as discontinued operations in the accompanying condensed consolidated statement of operations for all periods presented in accordance with ASC 205, “Discontinued Operations.” Prior to being classified as held-for-sale, APAC was included as a separate operating segment.
The following tables presents the Company’s results from discontinued operations:
|
| | | | | | | | | | | | | | | | |
| | | Three Months Ended September 30, | | Nine Months Ended September 30, |
| | | 2019 | | 2018 | | 2019 | | 2018 |
| | | (dollars in thousands) | | (dollars in thousands) |
| Net sales | | $ | 29,750 |
| | $ | 33,810 |
| | $ | 92,300 |
| | $ | 101,760 |
|
| Cost of sales | | (22,250 | ) | | (24,720 | ) | | (68,530 | ) | | (76,250 | ) |
| Selling, general and administrative expenses | | (3,050 | ) | | (3,130 | ) | | (9,580 | ) | | (10,510 | ) |
| Interest expense | | (80 | ) | | (60 | ) | | (310 | ) | | (210 | ) |
| Other expense. net | | (210 | ) | | (470 | ) | | (400 | ) | | (1,800 | ) |
| Income before income tax expense | | 4,160 |
| | 5,430 |
| | 13,480 |
| | 12,990 |
|
| Income tax expense | | (1,900 | ) | | (1,320 | ) | | (4,450 | ) | | (3,320 | ) |
Gain on sale of discontinued operations
| | $ | 180,490 |
| | $ | — |
| | $ | 180,490 |
| | $ | — |
|
| Income from discontinued operations, net of tax | | $ | 182,750 |
| | $ | 4,110 |
| | $ | 189,520 |
| | $ | 9,670 |
|
The following tables presents the Company’s assets and liabilities held for sale:
HORIZON GLOBAL CORPORATION
NOTES TO CONDENSED CONSOLIDATED FINANCIAL STATEMENTS (Continued)
|
| | | | |
| | | December 31, 2018 |
| | | (dollars in thousands) |
| Assets | | |
| Current assets: | | |
| Receivables, net of allowance for doubtful accounts | | $ | 13,170 |
|
| Inventories | | 21,490 |
|
| Prepaid expenses and other current assets | | 1,420 |
|
| Total current assets | | 36,080 |
|
| Non-current assets: | | |
| Property and equipment, net | | 15,780 |
|
| Goodwill | | 8,160 |
|
| Other intangibles, net | | 8,650 |
|
| Deferred income taxes | | 2,030 |
|
| Other assets | | 170 |
|
| Total non-current assets | | 34,790 |
|
| Assets held-for-sale | | $ | 70,870 |
|
| Liabilities | | |
| Current liabilities: | | |
| Accounts payable | | $ | 20,780 |
|
| Accrued liabilities | | 7,300 |
|
| Total current liabilities | | 28,080 |
|
| Non-current liabilities: | | |
| Deferred income taxes | | 1,530 |
|
| Other long-term liabilities | | 210 |
|
| Total non-current liabilities | | 1,740 |
|
| Total liabilities held-for-sale | | $ | 29,820 |
|
HORIZON GLOBAL CORPORATION
NOTES TO CONDENSED CONSOLIDATED FINANCIAL STATEMENTS (Continued)
4. Revenues
Revenue Recognition
The Company disaggregates revenue from contracts with customers by major sales channel. The Company determined that disaggregating revenue into these categories best depicts how the nature, amount, timing, and uncertainty of revenue and cash flows are affected by economic factors. The Automotive OEM channel represents sales to automotive vehicle manufacturers. The Automotive OES channel primarily represents sales to automotive vehicle dealerships. The Aftermarket channel represents sales to automotive installers and warehouse distributors. The Retail channel represents sales to direct-to-consumer retailers. The Industrial channel represents sales to non-automotive manufacturers and dealers of agricultural equipment, trailers, and other custom assemblies. The E-Commerce channel represents sales to direct-to-consumer retailers who utilize the internet to purchase the Company’s products. The Other channel represents sales that do not fit into a category described above and these sales are considered ancillary to the Company’s core operating activities.
The following tables present the Company’s net sales disaggregated by major sales channel as follows:channel:
| | | | | Three Months Ended June 30, 2019 | | Three Months Ended September 30, 2019 |
| | | Horizon Americas | | Horizon Europe-Africa | | Horizon
Asia-Pacific | | Total | | Horizon Americas | | Horizon Europe-Africa | | Total |
| | | (dollars in thousands) | | (dollars in thousands) |
| Net Sales | | | | | | | | | | | | | | |
| Automotive OEM | | $ | 23,670 |
| | $ | 45,910 |
| | $ | 5,610 |
| | $ | 75,190 |
| | $ | 21,050 |
| | $ | 43,200 |
| | $ | 64,250 |
|
| Automotive OES | | 1,810 |
| | 16,030 |
| | 14,380 |
| | 32,220 |
| | 1,960 |
| | 16,510 |
| | 18,470 |
|
| Aftermarket | | 28,850 |
| | 20,080 |
| | 5,150 |
| | 54,080 |
| | 26,920 |
| | 19,840 |
| | 46,760 |
|
| Retail | | 33,180 |
| | — |
| | 2,150 |
| | 35,330 |
| | 26,600 |
| | — |
| | 26,600 |
|
| Industrial | | 6,930 |
| | 860 |
| | 3,280 |
| | 11,070 |
| | 7,650 |
| | 780 |
| | 8,430 |
|
| E-commerce | | 14,480 |
| | 580 |
| | — |
| | 15,060 |
| | 12,040 |
| | 560 |
| | 12,600 |
|
| Other | | — |
| | 210 |
| | — |
| | 210 |
| | — |
| | 740 |
| | 740 |
|
| Total | | $ | 108,920 |
| | $ | 83,670 |
| | $ | 30,570 |
| | $ | 223,160 |
| | $ | 96,220 |
| | $ | 81,630 |
| | $ | 177,850 |
|
| | | | | Three Months Ended June 30, 2018 | | Three Months Ended September 30, 2018 |
| | | Horizon Americas | | Horizon Europe-Africa | | Horizon
Asia-Pacific | | Total | | Horizon Americas | | Horizon Europe-Africa | | Total |
| | | (dollars in thousands) | | (dollars in thousands) |
| Net Sales | | | | | | | | | | | | | | |
| Automotive OEM | | $ | 19,950 |
| | $ | 47,360 |
| | $ | 6,120 |
| | $ | 73,430 |
| | $ | 20,320 |
| | $ | 40,650 |
| | $ | 60,970 |
|
| Automotive OES | | 1,660 |
| | 12,890 |
| | 16,260 |
| | 30,810 |
| | 1,700 |
| | 12,600 |
| | 14,300 |
|
| Aftermarket | | 31,710 |
| | 24,410 |
| | 6,300 |
| | 62,420 |
| | 38,470 |
| | 19,980 |
| | 58,450 |
|
| Retail | | 34,580 |
| | — |
| | 2,080 |
| | 36,660 |
| | 29,600 |
| | — |
| | 29,600 |
|
| Industrial | | 10,300 |
| | — |
| | 3,660 |
| | 13,960 |
| | 11,160 |
| | — |
| | 11,160 |
|
| E-commerce | | 9,570 |
| | 1,270 |
| | — |
| | 10,840 |
| | 13,750 |
| | 1,290 |
| | 15,040 |
|
| Other | | 310 |
| | 4,910 |
| | — |
| | 5,220 |
| | 510 |
| | 4,000 |
| | 4,510 |
|
| Total | | $ | 108,080 |
| | $ | 90,840 |
| | $ | 34,420 |
| | $ | 233,340 |
| | $ | 115,510 |
| | $ | 78,520 |
| | $ | 194,030 |
|
HORIZON GLOBAL CORPORATION
NOTES TO CONDENSED CONSOLIDATED FINANCIAL STATEMENTS (Continued)
(unaudited)
| | | | | Six Months Ended June 30, 2019 | | Nine Months Ended September 30, 2019 |
| | | Horizon Americas | | Horizon Europe-Africa | | Horizon
Asia-Pacific | | Total | | Horizon Americas | | Horizon Europe-Africa | | Total |
| | | (dollars in thousands) | | (dollars in thousands) |
| Net Sales | | | | | | | | | | | | | | |
| Automotive OEM | | $ | 43,910 |
| | $ | 94,830 |
| | $ | 12,370 |
| | $ | 151,110 |
| | $ | 64,970 |
| | $ | 137,900 |
| | $ | 202,870 |
|
| Automotive OES | | 3,420 |
| | 29,330 |
| | 27,600 |
| | 60,350 |
| | 5,380 |
| | 45,840 |
| | 51,220 |
|
| Aftermarket | | 53,000 |
| | 36,370 |
| | 10,910 |
| | 100,280 |
| | 79,910 |
| | 56,200 |
| | 136,110 |
|
| Retail | | 61,620 |
| | — |
| | 4,870 |
| | 66,490 |
| | 88,230 |
| | — |
| | 88,230 |
|
| Industrial | | 16,210 |
| | 1,560 |
| | 6,810 |
| | 24,580 |
| | 23,860 |
| | 2,340 |
| | 26,200 |
|
| E-commerce | | 26,260 |
| | 1,100 |
| | — |
| | 27,360 |
| | 38,300 |
| | 1,650 |
| | 39,950 |
|
| Other | | — |
| | 2,650 |
| | — |
| | 2,650 |
| | 20 |
| | 3,570 |
| | 3,590 |
|
| Total | | $ | 204,420 |
| | $ | 165,840 |
| | $ | 62,560 |
| | $ | 432,820 |
| | $ | 300,670 |
| | $ | 247,500 |
| | $ | 548,170 |
|
| | | | | Six Months Ended June 30, 2018 | | Nine Months Ended September 30, 2018 |
| | | Horizon Americas | | Horizon Europe-Africa | | Horizon
Asia-Pacific | | Total | | Horizon Americas | | Horizon Europe-Africa | | Total |
| | | (dollars in thousands) | | (dollars in thousands) |
| Net Sales | | | | | | | | | | | | | | |
| Automotive OEM | | $ | 40,000 |
| | $ | 94,280 |
| | $ | 12,510 |
| | $ | 146,790 |
| | $ | 60,320 |
| | $ | 134,930 |
| | $ | 195,250 |
|
| Automotive OES | | 2,530 |
| | 27,380 |
| | 29,980 |
| | 59,890 |
| | 4,230 |
| | 39,980 |
| | 44,210 |
|
| Aftermarket | | 58,230 |
| | 45,200 |
| | 13,040 |
| | 116,470 |
| | 96,700 |
| | 65,180 |
| | 161,880 |
|
| Retail | | 66,730 |
| | — |
| | 5,190 |
| | 71,920 |
| | 96,330 |
| | — |
| | 96,330 |
|
| Industrial | | 20,520 |
| | — |
| | 7,230 |
| | 27,750 |
| | 31,680 |
| | — |
| | 31,680 |
|
| E-commerce | | 15,590 |
| | 2,590 |
| | — |
| | 18,180 |
| | 29,340 |
| | 3,880 |
| | 33,220 |
|
| Other | | 700 |
| | 8,450 |
| | — |
| | 9,150 |
| | 1,220 |
| | 12,460 |
| | 13,680 |
|
| Total | | $ | 204,300 |
| | $ | 177,900 |
| | $ | 67,950 |
| | $ | 450,150 |
| | $ | 319,820 |
| | $ | 256,430 |
| | $ | 576,250 |
|
During the three and sixnine months ended JuneSeptember 30, 2019 and 2018, adjustments to estimates of variable consideration for previously recognized revenue were insignificant. At JuneSeptember 30, 2019 and December 31, 2018, total opening and closing balances of contract assets and deferred revenue were not material.
45. Goodwill and Other Intangible Assets
Changes in the carrying amount of goodwill for the sixnine months ended JuneSeptember 30, 2019 are summarized as follows:
| | | | | Horizon Americas | | Horizon
Asia-Pacific | | Total | |
| (dollars in thousands) | | | Horizon Americas |
| | | (dollars in thousands) | | |
| Balance at December 31, 2018 | | $ | 4,500 |
| | $ | 8,160 |
| | $ | 12,660 |
| | $ | 4,500 |
|
| Foreign currency translation | | 30 |
| | 10 |
| | 40 |
| | (300 | ) |
| Balance at June 30, 2019 | | $ | 4,530 |
| | $ | 8,170 |
| | $ | 12,700 |
| |
| Balance at September 30, 2019 | | | $ | 4,200 |
|
HORIZON GLOBAL CORPORATION
NOTES TO CONDENSED CONSOLIDATED FINANCIAL STATEMENTS (Continued)
(unaudited)
The gross carrying amounts and accumulated amortization of the Company’s other intangibles are summarized below.as follows.
| | | | | June 30, 2019 | | December 31, 2018 | | As of
September 30, 2019 |
| Intangible Category by Useful Life | | Gross Carrying Amount | | Accumulated Amortization | | Gross Carrying Amount | | Accumulated Amortization | | Gross Carrying Amount | | Accumulated Amortization | | Net Carrying Amount |
| | | (dollars in thousands) | | (dollars in thousands) |
| Finite-lived intangible assets: | | | | | | | | | | | | | | |
| Customer relationships, 2 – 20 years | | $ | 174,200 |
| | $ | (131,030 | ) | | $ | 177,910 |
| | $ | (127,740 | ) | |
| Technology and other, 3 – 15 years | | 21,260 |
| | (15,540 | ) | | 21,000 |
| | (15,910 | ) | |
| Trademark/Trade names, 1 – 8 years | | 730 |
| | (280 | ) | | 730 |
| | (250 | ) | |
| Customer relationships (2 – 20 years) | | | $ | 162,940 |
| | $ | (129,020 | ) | | $ | 33,920 |
|
| Technology and other (3 – 15 years) | | | 20,590 |
| | (14,630 | ) | | 5,960 |
|
| Trademark/Trade names (1 – 8 years) | | | 150 |
| | (150 | ) | | — |
|
| Total finite-lived intangible assets | | 196,190 |
| | (146,850 | ) | | 199,640 |
| | (143,900 | ) | | 183,680 |
| | (143,800 | ) | | 39,880 |
|
| Trademark/Trade names, indefinite-lived | | 22,560 |
| | — |
| | 22,310 |
| | — |
| | 20,470 |
| | — |
| | 20,470 |
|
| Total other intangible assets | | $ | 218,750 |
| | $ | (146,850 | ) | | $ | 221,950 |
| | $ | (143,900 | ) | | $ | 204,150 |
| | $ | (143,800 | ) | | $ | 60,350 |
|
|
| | | | | | | | | | | | |
| | | As of
December 31, 2018 |
| Intangible Category by Useful Life | | Gross Carrying Amount | | Accumulated Amortization | | Net Carrying Amount |
| | | (dollars in thousands) |
| Finite-lived intangible assets: | | | | | | |
| Customer relationships (2 – 20 years) | | $ | 168,230 |
| | $ | (124,510 | ) | | $ | 43,720 |
|
| Technology and other (3 – 15 years) | | 20,490 |
| | (15,400 | ) | | 5,090 |
|
| Trademark/Trade names (1 – 8 years) | | 150 |
| | (150 | ) | | — |
|
| Total finite-lived intangible assets | | 188,870 |
| | (140,060 | ) | | 48,810 |
|
| Trademark/Trade names, indefinite-lived | | 20,590 |
| | — |
| | 20,590 |
|
| Total other intangible assets | | $ | 209,460 |
| | $ | (140,060 | ) | | $ | 69,400 |
|
On March 1, 2019, the Company entered into an agreement of sale of certain business assets in its Europe-Africa operating segment, via a share and asset sale (the “Sale”). Under the terms of the Sale, effective March 1, 2019, the Company disposed of certain non-automotive business assets that operated using the Terwa brand for $5.5 million, which included a $0.5 million note receivable. The Sale resulted in a $3.6 million loss recorded in Other expense, net in the condensed consolidated statements of operations, including a $3.0 million reduction of net intangibles related to customer relationships.
Amortization expense related to intangible assets as included in the accompanying condensed consolidated statements of operations is summarized as follows:
|
| | | | | | | | | | | | | | | | |
| | | Three months ended June 30, | | Six months ended June 30, |
| | | 2019 | | 2018 | | 2019 | | 2018 |
| | | (dollars in thousands) |
| Technology and other, included in cost of sales | | $ | 270 |
| | $ | 290 |
| | $ | 720 |
| | $ | 560 |
|
| Customer relationships and Trademark/Trade names, included in selling, general and administrative expenses | | 1,120 |
| | 1,620 |
| | 2,740 |
| | 3,580 |
|
| Total amortization expense | | $ | 1,390 |
| | $ | 1,910 |
| | $ | 3,460 |
| | $ | 4,140 |
|
5. Inventories
Inventories consist of the following components:
|
| | | | | | | | |
| | | June 30,
2019 | | December 31,
2018 |
| | | (dollars in thousands) |
| Finished goods | | $ | 104,480 |
| | $ | 103,090 |
|
| Work in process | | 19,420 |
| | 19,660 |
|
| Raw materials | | 53,930 |
| | 50,940 |
|
| Total inventories | | $ | 177,830 |
| | $ | 173,690 |
|
|
| | | | | | | | | | | | | | | | |
| | | Three months ended September 30, | | Nine months ended September 30, |
| | | 2019 | | 2018 | | 2019 | | 2018 |
| | | (dollars in thousands) |
| Technology and other, included in cost of sales | | $ | 260 |
| | $ | 430 |
| | $ | 980 |
| | $ | 990 |
|
| Customer relationships and Trademark/Trade names, included in selling, general and administrative expenses | | 1,410 |
| | 1,600 |
| | 3,820 |
| | 4,650 |
|
| Total amortization expense | | $ | 1,670 |
| | $ | 2,030 |
| | $ | 4,800 |
| | $ | 5,640 |
|
HORIZON GLOBAL CORPORATION
NOTES TO CONDENSED CONSOLIDATED FINANCIAL STATEMENTS (Continued)
(unaudited)
6. Inventories
Inventories consist of the following components:
|
| | | | | | | | |
| | | September 30,
2019 | | December 31,
2018 |
| | | (dollars in thousands) |
| Finished goods | | $ | 80,440 |
| | $ | 89,000 |
|
| Work in process | | 12,880 |
| | 16,160 |
|
| Raw materials | | 47,830 |
| | 47,040 |
|
| Total inventories | | $ | 141,150 |
| | $ | 152,200 |
|
HORIZON GLOBAL CORPORATION
NOTES TO CONDENSED CONSOLIDATED FINANCIAL STATEMENTS (Continued)
7. Property and Equipment, Net
Property and equipment, net consists of the following components:
| | | | | June 30,
2019 | | December 31,
2018 | | September 30,
2019 | | December 31,
2018 |
| | | (dollars in thousands) | | (dollars in thousands) |
| Land and land improvements | | $ | 460 |
| | $ | 460 |
| | $ | 440 |
| | $ | 460 |
|
| Buildings | | 24,010 |
| | 21,440 |
| | 20,460 |
| | 18,680 |
|
| Machinery and equipment | | 162,660 |
| | 161,750 |
| | 120,840 |
| | 121,230 |
|
| | | 187,130 |
| | 183,650 |
| | 141,740 |
| | 140,370 |
|
| Less: Accumulated depreciation | | 89,300 |
| | 81,370 |
| |
| Accumulated depreciation | | | (63,070 | ) | | (53,870 | ) |
| Property and equipment, net | | $ | 97,830 |
| | $ | 102,280 |
| | $ | 78,670 |
| | $ | 86,500 |
|
Depreciation expense included in the accompanying condensed consolidated statements of operations is as follows:
| | | | | | | | | | | | Three months ended
September 30, | | Nine months ended
September 30, |
| | | Three months ended
June 30, | | Six months ended
June 30, | | (dollars in thousands) |
| | | 2019 | | 2018 | | 2019 | | 2018 | | 2019 | | 2018 | | 2019 | | 2018 |
| | | (dollars in thousands) | | (dollars in thousands) |
| Depreciation expense, included in cost of sales | | $ | 4,460 |
| | $ | 3,810 |
| | $ | 8,380 |
| | $ | 7,600 |
| | $ | 3,170 |
| | $ | 2,960 |
| | $ | 9,760 |
| | $ | 8,630 |
|
| Depreciation expense, included in selling, general and administrative expense | | 590 |
| | 300 |
| | 940 |
| | 640 |
| | 1,420 |
| | 270 |
| | 2,220 |
| | 780 |
|
| Total depreciation expense | | $ | 5,050 |
| | $ | 4,110 |
| | $ | 9,320 |
| | $ | 8,240 |
| | $ | 4,590 |
| | $ | 3,230 |
| | $ | 11,980 |
| | $ | 9,410 |
|
7.8. Accrued and Other Long-term Liabilities
Accrued liabilities consist of the following components:
| | | | | June 30,
2019 | | December 31,
2018 | | September 30,
2019 | | December 31,
2018 |
| | | (dollars in thousands) | | (dollars in thousands) |
| Customer incentives | | | $ | 12,700 |
| | $ | 9,990 |
|
| Customer claims | | $ | 16,110 |
| | $ | 14,160 |
| | 10,370 |
| | 14,130 |
|
| Accrued compensation | | 14,250 |
| | 10,230 |
| | 8,890 |
| | 5,680 |
|
| Customer incentives | | 12,740 |
| | 10,100 |
| |
| Accrued professional services | | 4,260 |
| | 4,770 |
| | 3,940 |
| | 4,380 |
|
| Restructuring | | 3,980 |
| | 7,530 |
| | 2,450 |
| | 7,530 |
|
| Deferred purchase price | | 3,260 |
| | 3,400 |
| | 750 |
| | 3,400 |
|
| Short-term tax liabilities | | 1,260 |
| | 1,930 |
| | 750 |
| | 1,130 |
|
| Cross currency swap | | — |
| | 1,610 |
| | — |
| | 1,610 |
|
| Other | | 15,390 |
| | 12,090 |
| | 13,170 |
| | 10,670 |
|
| Total accrued liabilities | | $ | 71,250 |
| | $ | 65,820 |
| | $ | 53,020 |
| | $ | 58,520 |
|
HORIZON GLOBAL CORPORATION
NOTES TO CONDENSED CONSOLIDATED FINANCIAL STATEMENTS (Continued)
(unaudited)
Other long-term liabilities consist of the following components:
| | | | | June 30,
2019 | | December 31,
2018 | | September 30,
2019 | | December 31,
2018 |
| | | (dollars in thousands) | | (dollars in thousands) |
| Long-term tax liabilities | | $ | 6,490 |
| | $ | 6,270 |
| | $ | 6,220 |
| | $ | 6,270 |
|
| Deferred purchase price | | | 2,440 |
| | 30 |
|
| Restructuring | | 2,200 |
| | 2,580 |
| | 1,980 |
| | 2,580 |
|
| Deferred purchase price | | 250 |
| | 30 |
| |
| Other | | 10,160 |
| | 11,080 |
| | 10,130 |
| | 10,870 |
|
| Total other long-term liabilities | | $ | 19,100 |
| | $ | 19,960 |
| | $ | 20,770 |
| | $ | 19,750 |
|
89. Long-term Debt
The Company’s long-term debt consists of the following:
| | | | | June 30,
2019 | | December 31,
2018 | | September 30,
2019 | | December 31,
2018 |
| | | (dollars in thousands) | | (dollars in thousands) |
| ABL Facility | | $ | 51,190 |
| | $ | 61,570 |
| | $ | 19,660 |
| | $ | 61,570 |
|
| First Lien Term Loan | | 187,000 |
| | 190,520 |
| | 25,010 |
| | 190,520 |
|
| Second Lien Term Loan | | 53,170 |
| | — |
| | 55,060 |
| | — |
|
| Convertible Notes | | 125,000 |
| | 125,000 |
| | 125,000 |
| | 125,000 |
|
| Bank facilities, capital leases and other long-term debt | | 31,790 |
| | 18,990 |
| | 14,470 |
| | 18,990 |
|
| | | 448,150 |
| | 396,080 |
| |
| Gross debt | | | 239,200 |
| | 396,080 |
|
| Less: | | | | | |
| Current maturities, long-term debt | | | 24,270 |
| | 13,860 |
|
| Gross long-term debt | | | 214,930 |
| | 382,220 |
|
| Less: | | | | | | | | |
| Unamortized debt issuance costs and original issuance discount on First Lien Term Loan | | 6,750 |
| | 7,380 |
| | 790 |
| | 7,380 |
|
| Unamortized debt issuance costs and discount on Second Lien Term Loan | | 14,720 |
| | — |
| | 13,800 |
| | — |
|
| Unamortized debt issuance costs and discount on Convertible Notes | | 21,140 |
| | 24,190 |
| | 19,610 |
| | 24,190 |
|
| Current maturities, long-term debt | | 166,760 |
| | 13,860 |
| |
| Unamortized debt issuance costs and discount | | | 34,200 |
| | 31,570 |
|
| Long-term debt | | $ | 238,780 |
| | $ | 350,650 |
| | $ | 180,730 |
| | $ | 350,650 |
|
ABL Facility
In February 2019, the Company amended its existing revolving credit facility (the “ABL Facility”) to permit the Company to enter into the Senior Term Loan Agreement (as defined below) and make certain indebtedness, asset sale, investment and restricted payment baskets covenants more restrictive.
In March 2019, the Company amended the ABL Facility to permit the Company to enter into the Second Lien Term Loan Agreement (as defined below) and provide for certain other modifications of the ABL Facility. In particular, the ABL Facility was modified to (a) increase the interest rate by 1.0%, (b) reduce the total facility size to $90.0 million and (c) limit the ability to add debtincur additional indebtedness in the future.
In September 2019, the Company amended its existing ABL Facility to provide consent for the sale of APAC, provide consent for the Company’s prepayment of First Lien Term Loan, as discussed below, and increase the existing block by $5.0 million to a total block of $10.0 million, making the effective facility size $80.0 million.
HORIZON GLOBAL CORPORATION
NOTES TO CONDENSED CONSOLIDATED FINANCIAL STATEMENTS (Continued)
The ABL Facility consists of (i) a U.S. sub-facility, in an aggregate principal amount of up to $85.0 million (subject to availability under a U.S.-specific borrowing base) (the “U.S. Facility”), (ii) a Canadian sub-facility, in an aggregate principal amount of up to $2.0 million (subject to availability under a Canadian-specific borrowing base) (the “Canadian Facility”), and (iii) a U.K. sub-facility in an aggregate principal amount of up to $3.0 million (subject to availability under a U.K.-specific borrowing base) (the “U.K. Facility”). The ABL Facility also includes a $20.0 million U.S. letter of credit sub-facility. All facilities under the ABL
HORIZON GLOBAL CORPORATION
NOTES TO CONDENSED CONSOLIDATED FINANCIAL STATEMENTS (Continued)
(unaudited)
Facility mature on June 30, 2020 and are presented in “short-term borrowings and current maturities, long-term debt” in the accompanying JuneSeptember 30, 2019 condensed consolidated balance sheet.
The Company incurred debt issuance costs of approximately $1.4$0.5 million in connection with the MarchSeptember 2019 amendment of the ABL Facility. These debt issuance costs will be amortized into interest expense over the contractual term of the loan. The Company recognized $0.4$0.3 million and $0.5$0.8 million of amortization of debt issuance costs for the three and sixnine months ended JuneSeptember 30, 2019, respectively, and $0.1 million and $0.2$0.4 million for the three and sixnine months ended JuneSeptember 30, 2018, respectively which are included in the accompanying condensed consolidated statements of operations. There were $1.6$2.0 million and $0.8 million of unamortized debt issuance costs included in other assets in the accompanying condensed consolidated balance sheets as of JuneSeptember 30, 2019 and December 31, 2018, respectively.
There was $51.2$19.7 million and $61.6 million outstanding under the ABL Facility as of JuneSeptember 30, 2019 and December 31, 2018, respectively, with a weighted average interest rate of 6.4%7.0% and 4.4%, respectively. Total letters of credit issued under the ABL Facility at JuneSeptember 30, 2019 and December 31, 2018 were $5.0$7.8 million and $3.4 million, respectively. The Company had $27.4$44.5 million and $10.3 million of availability under the ABL Facility as of JuneSeptember 30, 2019 and December 31, 2018, respectively.
First Lien Term Loan (formerly “Term Loan”)
In February 2019, the Company amended and restated the existing term loan agreement (the “First Lien Term Loan AgreementAgreement”) to permit the Company to enter into the Senior Term Loan Agreement and tightened certain indebtedness, asset sale, investment and restricted payment baskets.
In March 2019, the Company amended the existing Term Loan Agreementterm loan agreement (“Sixth Term Amendment”) (the “First Lien Term Loan Agreement”) to permit the Company to enter into the Second Lien Term Loan Agreement;Agreement, amend certain financial covenants to provide for relief based on the Company’s 2018 and 2019 budget,make them less restrictive and make certain other affirmative and negative covenants more restrictive.
Pursuant to the Sixth Term Amendment, the prior net leverage covenant ratio was eliminated and replaced with a first lien leverage covenant starting with the 12-month period ending September 2019 as follows:
September 30, 2019: 8.25:1.00
December 31, 2019: 6.25:1.00
March 31, 2020: 5.50:1.00
June 30, 2020: 5.00:1.00
September 30, 2020 and each fiscal quarter ending thereafter: 4.75:1.00
The Sixth Term Amendment also added a fixed charge coverage covenant starting with fiscal quarter ending March 31, 2020, a minimum liquidity covenant of $15.0 million starting March 31, 2019, and a maximum capital expenditure covenant of $15.0 million for 2019 and $25.0 million annually thereafter. The interest rate on the First Lien Term Loan Agreement was also amended to add 3.0% paid-in-kind interest in addition to the existing cash pay interest.
OnIn May 7, 2019, the Company entered into the Seventh Amendmentseventh amendment to Credit Agreementcredit agreement (the “Seventh Term Amendment”) to amend the First Lien Term Loan Agreement, which extended its $100.0 million prepayment requirement from on or before March 31, 2020, to on or before May 15, 2020.
Debt issuance costsIn September 2019, the Company amended the existing First Lien Term Loan Agreement (“Eighth Term Amendment”) to provide consent for the sale of approximately $5.6 million were incurredthe Company’s APAC segment, provide consent for the Company to meet its prepayment obligation of the First Lien Term Loan, remove prepayment penalties and make certain negative covenants less restrictive. In September 2019, the Company paid down a portion of its First Lien Term Loan’s outstanding principal plus fees and paid-in-kind interest in connectionthe amount of $172.9 million.
Pursuant to the Eighth Term Amendment, the prior first lien leverage covenant was eliminated and replaced with the Sixth Term Amendment. secured net leverage ratio starting with the fiscal quarter ending December 31, 2020 as follows:
December 31, 2020: 6.00 to 1.00
March 31, 2021: 6.00 to 1.00
June 30, 2021 and each fiscal quarter ending thereafter: 5.00 to 1.00
In accordance with ASC 470-50, “Modifications and Extinguishments,” the Company recorded approximately $0.7 million of issuance costs in selling, general and administrative expense in the accompanying condensed consolidated statements of operations during the sixnine months ended JuneSeptember 30, 2019 and capitalizedwrote off approximately $4.9$5.2 million of debt issuance costs that will be amortized into interest expense overdue to the contractual termmodification of the loan usingFirst Lien Term Loan for the effective interest method. Debt issuance costs incurred in connection withSeptember 19, 2019 amendment, which were recorded to selling, general and administrative expense within the Seventh Term Amendment were immaterial.accompanying condensed consolidated statements of operations.
HORIZON GLOBAL CORPORATION
NOTES TO CONDENSED CONSOLIDATED FINANCIAL STATEMENTS (Continued)
The Company recorded approximately $0.5$5.2 million and $3.5$8.7 million of unamortized debt issuance costs to interest expense for the three and sixnine months ended JuneSeptember 30, 2019, respectively, due to the extinguishment of debt for certain lenders in the loan syndicate in connection with the Sixth, Seventh and SeventhEighth Term Amendments.
HORIZON GLOBAL CORPORATION
NOTES TO CONDENSED CONSOLIDATED FINANCIAL STATEMENTS (Continued)
(unaudited)
The Company recognized approximately $2.0$1.7 million and $2.8$4.4 million of amortization of debt issuance and discount cost for the three and sixnine months ended JuneSeptember 30, 2019, respectively, and $0.4$0.6 million and $0.8$1.4 million for the three and sixnine months ended JuneSeptember 30, 2018, respectively, which is included in the accompanying condensed consolidated statements of operations.
The Company recognized $1.9$3.0 million of paid-in-kind interest on the First Lien Term Loan for the sixnine months ended JuneSeptember 30, 2019. The Company had an aggregate principal amount outstanding of $187.0$25.0 million and $190.5 million as of JuneSeptember 30, 2019 and December 31, 2018, respectively, under the First Lien Term Loan bearing interest at 8.3%8.1% and 8.8%, respectively.
All of the indebtedness under the First Lien Term Loan is and will be guaranteed by the Company’s existing and future material domestic subsidiaries and is and will be secured by substantially all of the assets of the Company and such guarantors.
Senior Term Loan Agreement
In February 2019, the Company entered into a Credit Agreement (the “Senior Term Loan Agreement”) with Cortland Capital Markets Services LLC, as administrative agent and collateral agent, and the lenders party thereto. The Senior Term Loan Agreement provided for a short-term loan facility in the aggregate principal amount of $10.0 million, all of which was borrowed by the Company. Certain of the lenders under the Company’s First Lien Term Loan Agreement were the lenders under the Senior Term Loan Agreement.
The Senior Term Loan Agreement required the Company to obtain additional financing in amounts and on terms acceptable to the lenders. The Senior Term Loan Agreement was repaid on March 15, 2019, in conjunction with the additional financing further detailed below. The Company incurred debt issuance costs of approximately $0.5 million in connection with the Senior Term Loan Agreement, which were recorded to selling, general and administrative expense within the accompanying condensed consolidated statements of operations.
Second Lien Term Loan Agreement
In March 2019, the Company entered into a Credit Agreement (the “Second Lien Term Loan Agreement”) with Cortland Capital Markets Services LLC, as administrative agent and collateral agent, and Corre Partners Management L.L.C., as representative of the lenders, and the lenders party thereto. The Second Lien Term Loan Agreement provides for a term loan facility in the aggregate principal amount of $51.0 million and matures on September 30, 2021. The interest on the Second Lien Term Loan may be paid, at the Company’s election, in cash, at the customary eurocurrency rate plus a margin of 10.50% per annum, or in-kind, at the customary eurocurrency rate plus a margin of 11.50%. The Second Lien Term Loan Agreement is secured by a second lien on substantially the same collateral as the First Lien Term Loan and is subject to various affirmative and negative covenants including a secured net leverage ratio tested quarterly commencingfurther detailed below.
In September 2019, the Company amended the existing Second Lien Term Loan Agreement (“Second Lien Amendment”) to remove the prepayment requirement related to the use of APAC sale proceeds and made certain negative covenants less restrictive. Pursuant to the Second Lien Amendment, the prior first lien leverage covenant was eliminated and replaced with the secured net leverage ratio starting with the fiscal quarter ending on December 31, 2019, which shall not exceed (x) 6.75 to 1.002020, as ofoutlined in the last day of any fiscal quarter ending on or prior to June 30, 2020 and (y) 5.25 to 1.00 as of the last day of any fiscal quarter ending on or after September 30, 2020.above section, First Lien Term Loan.
The proceeds, net of applicable fees, of the Second Lien Term Loan Agreement were used to repay all amounts outstanding under the Senior Term Loan Agreement and to provide additional liquidity and working capital for the Company.
Pursuant to the Second Lien Term Loan Agreement, the Company was required to issue 6.25 million detachable warrants to purchase common stock of the Company, which can be exercised on a cashless basis over a five-year term with an exercise price of $1.50 per share. 3,601,902 warrants were issued in March 2019, and the Company also issued 90,667 shares of Series A Preferred Stock in the interim that were convertible into additional warrants upon receipt of shareholder approval of the issuance of such additional warrants and the shares of common stock issuable upon exercise thereof. Upon receipt of such shareholder approval on June 25, 2019, the 90,667 shares of Series A Preferred Stock were converted into 2,952,248 warrants.
In accordance with guidance in ASC 480, “Distinguishing Liabilities from Equity” (“ASC 480”), and ASC 815, “Derivatives and Hedging” (“ASC 815”), the (i) Second Lien Term Loan; (ii) Series A Preferred Stock, and (iii) warrants are all freestanding
HORIZON GLOBAL CORPORATION
NOTES TO CONDENSED CONSOLIDATED FINANCIAL STATEMENTS (Continued)
instruments and proceeds were allocated to each instrument on March 15, 2019 on a relative fair value basis: (i) $40.3 million; (ii) $5.3 million and (iii) $5.4 million, respectively.
The Series A Preferred Stock was not within the scope of ASC 480-10 and did not meet the criteria for liability classification. The Series A Preferred Stock was classified as temporary equity as of March 31, 2019, as the Series A Preferred Stock was entitled to receive two times its liquidation value in cash upon occurrence of a liquidation or deemed liquidation event, which is outside the control of the Company. After receipt of shareholder approval at the Company’s annual meeting of shareholders on June 25, 2019, the Series A Preferred Stock was automatically converted into 2,952,248 warrants and $5.3 million was reclassified to Common
HORIZON GLOBAL CORPORATION
NOTES TO CONDENSED CONSOLIDATED FINANCIAL STATEMENTS (Continued)
(unaudited)
stock warrants within Shareholders’ equity in the June 30, 2019Company’s condensed consolidated balance sheet. The warrants also do not meet the criteria for liability classification under ASC 480. However, the warrants meet the definition of a derivative under ASC 815, are determined to be indexed to the Company’s common stock and meet the requirements for equity classification pursuant to ASC 815-40.
The Company determined the fair value of the Second Lien Term Loan using a discount rate build up approach. The fair values of the Series A Preferred Stock and warrants were determined using an option pricing method. The debt discount of $10.7 million created by the relative fair value allocation of the equity component is being amortized as additional non-cash interest expense using the effective interest method over the contractual term of the loan.
Debt issuance costs of approximately $3.8 million and original issuance discount of approximately $1.0 million were incurred in connection with entry into the Second Lien Term Loan Agreement. The debt issuance and original issuance discount costs will be amortized into interest expense over the contractual term of the loan using the effective interest method. The Company had total unamortized debt issuance and discount costs of $14.7$13.8 million, all of which are recorded as a reduction of the debt balance on the Company’s accompanying condensed consolidated balance sheet as of JuneSeptember 30, 2019. The Company recognized $2.5$4.6 million of paid-in-kind interest on its Second Lien Term Loan for the sixnine months ended JuneSeptember 30, 2019.
Convertible Notes
In February 2017, the Company completed a public offering of 2.75% Convertible Senior Notes (the “Convertible Notes”) in an aggregate principal amount of $125.0 million. Interest is payable on January 1 and July 1 of each year, beginning on July 1, 2017. The Convertible Notes are convertible into 5,005,000 shares of the Company’s common stock, based on an initial conversion price of $24.98 per share. The Convertible Notes will mature on July 1, 2022 unless earlier converted.
Upon conversion by the holders, the Company may elect to settle such conversion in shares of its common stock, cash, or a combination thereof. Because the Company may elect to settle conversion in cash, the Company separated the Convertible Notes into their liability and equity components by allocating the issuance proceeds to each of those components in accordance with ASC 470-20, “Debt-Debt with Conversion and Other Options.” The Company first determined the fair value of the liability component by estimating the value of a similar liability that does not have an associated equity component. The Company then deducted that amount from the issuance proceeds to arrive at a residual amount, which represents the equity component. The Company accounted for the equity component as a debt discount (with an offset to paid-in capital in excess of par value). The debt discount created by the equity component is being amortized as additional non-cash interest expense using the effective interest method over the contractual term of the Convertible Notes ending on July 1, 2022.
In connection with the issuance of the Convertible Notes, the Company entered into convertible note hedge transactions (the “Convertible Note Hedges”) in privately negotiated transactions with certain of the underwriters or their affiliates (in this capacity, the “option counterparties”). The Convertible Note Hedges provide the Company with the option to acquire, on a net settlement basis, 5,005,000 shares of its common stock, which is equal to the number of shares of common stock that notionally underlie the Convertible Notes, at a strike price of $24.98, which corresponds to the conversion price of the Convertible Notes. The Convertible Note Hedges have an expiration date that is the same as the maturity date of the Convertible Notes, subject to earlier exercise. The Convertible Note Hedges have customary anti-dilution provisions similar to the Convertible Notes. The Convertible Note Hedges have a default settlement method of net-share settlement but may be settled in cash or shares, depending on the Company’s method of settlement for conversion of the corresponding Convertible Notes. If the Company exercises the Convertible Note Hedges, the shares of common stock it will receive from the option counterparties to the Convertible Note Hedges will cover the shares of common stock that it would be required to deliver to the holders of the converted Convertible Notes in excess of the principal amount thereof. The aggregate cost of the Convertible Note Hedges was $29.0 million (or $7.5 million net of the total proceeds from the Warrants sold, as discussed below), before the allocation of issuance costs of approximately $0.7 million. The Convertible Note Hedges are accounted for as equity transactions in accordance with ASC 815-40, “Derivatives and Hedging-Contracts in
HORIZON GLOBAL CORPORATION
NOTES TO CONDENSED CONSOLIDATED FINANCIAL STATEMENTS (Continued)
Entity’s own Equity.”
In connection with the issuance of the Convertible Notes, the Company also sold net-share-settled warrants (the “Warrants”) in privately negotiated transactions with the option counterparties for the purchase of up to 5,005,000 shares of its common stock at a strike price of $29.60 per share, for total proceeds of $21.5 million, before the allocation of $0.6 million of issuance costs. The Company also recorded the Warrants within shareholders’ equity in accordance with ASC 815-40. The Warrants have customary anti-dilution provisions similar to the Convertible Notes. As a result of the issuance of the Warrants, the Company will experience dilution to its diluted earnings per share if its average closing stock price exceeds $29.60 for any fiscal quarter. The Warrants expire
HORIZON GLOBAL CORPORATION
NOTES TO CONDENSED CONSOLIDATED FINANCIAL STATEMENTS (Continued)
(unaudited)
on various dates from October 2022 through February 2023 and must be net-settled in shares of the Company’s common stock. Therefore, upon exercise of the Warrants, the Company will issue shares of its common stock to the purchasers of the Warrants that represent the value by which the price of the common stock exceeds the strike price stipulated within the particular warrant agreement.
Covenant and Liquidity Matters
The First Lien Term Loan requires a prepayment of $100.0 million on or before May 15, 2020. The ABL Facility matures on June 30, 2020, and as of JuneSeptember 30, 2019, had an outstanding balance of $51.2$19.7 million. As ofThe Company believes it has sufficient liquidity to operate its business. However, today the Companyit does not have the cash or liquidity to make the required First Lien Term Loan prepayment or pay off the balance of the ABL Facility at maturity. If the Company cannot generate sufficient cash from operations to make the aforementioned payments as they become due andpayment at maturity, or meet its financial covenants under the Company’s credit agreements,enter into new or additional financing arrangements, it wouldmay result in an event of default.default because of the inability to meet all of its obligations under its credit agreements. Such a default, if not cured, would allow the lenders to accelerate the maturity of the debt, making it due and payable at that time, which would result in a cross default of other debt obligations.
In an effort to address the aforementioned risks, on June 7, 2019, the Company announced that it was going to pursue various alternatives to reduce debt. In conjunction with evaluating all possible strategic alternatives, the board created an ad hoc committee of select directors to oversee the process and engaged an investment bank to assist therewith. To that end, the Company initiated a formal process to explore the sale of its Horizon Asia-Pacific operating segment as an option to raise the funds necessary to comply with the prepayment obligation under the First Lien Term Loan. The proceeds anticipated from said sale are expected to be sufficient to fund the required prepayment. The Company is in active discussions with potential buyers and believes it is probable that the Company will complete the transaction prior to the required May 15, 2020 prepayment obligation date.
The Company is in compliance with all of its financial covenants as of JuneSeptember 30, 2019.
Bank facilities
There were $16.1 million and $2.9 million outstanding under the Company’s Australian loan agreement as of June 30, 2019 and December 31, 2018, respectively.
910. Derivative Instruments
Foreign Currency Exchange Rate Risk
As of JuneSeptember 30, 2019, the Company was party to forward contracts to hedge changes in foreign currency exchange rates with notional amounts of approximately $13.9$3.9 million. The Company uses foreign currency forward contracts to mitigate the risk associated with fluctuations in currency rates impacting cash flows related to certain payments for contract manufacturing in its lower-cost manufacturing facilities. The foreign currency forward contracts hedge currency exposure between the Mexican peso and the U.S. dollar and between the Australian dollar and the U.S. dollar and mature at specified monthly settlement dates through December 2019. At inception, the Company designated the foreign currency forward contracts as cash flow hedges. Upon the performance of contract manufacturing or purchase of certain inventories the Company de-designates the foreign currency forward contract.
On August 16, 2017, the Company’s Australian subsidiary entered into a cross currency swap arrangement to hedge changes in foreign currency exchange rates. As of June 30, 2019, the notional amount of the cross currency swap was approximately $2.2 million. The Australian subsidiary uses the cross currency swap to mitigate the risk associated with fluctuations in currency rates related to a non-U.S. functional currency intercompany loan of NZ$10.0 million. The floating-to-floating cross currency swap hedges currency exposure between the New Zealand dollar and the Australian dollar and matures on June 30, 2020. The Australian subsidiary makes quarterly principal payments of NZ$0.8 million, plus interest at the three-month Bank Bill Benchmark Rate in New Zealand plus a margin of 0.3% per annum, in exchange for A$0.8 million, plus interest at the three-month BBSY in Australia per annum. At inception, the cross currency swap was not designated as a hedging instrument.
HORIZON GLOBAL CORPORATION
NOTES TO CONDENSED CONSOLIDATED FINANCIAL STATEMENTS (Continued)
(unaudited)
Financial Statement Presentation
The fair value carrying amount of the Company’s derivative instruments were recorded as follows:
| | | | | | | Asset / (Liability) Derivatives | | | | Asset / (Liability) Derivatives |
| | | Balance Sheet Caption | | June 30,
2019 | | December 31,
2018 | | Balance Sheet Caption | | September 30,
2019 | | December 31,
2018 |
| | | | | (dollars in thousands) | | | | (dollars in thousands) |
| Derivatives designated as hedging instruments | | | | | | | | | | |
| Foreign currency forward contracts | | Prepaid expenses and other current assets | | $ | 670 |
| | $ | 1,910 |
| | Prepaid expenses and other current assets | | $ | 220 |
| | $ | 1,910 |
|
| Cross currency swap | | Accrued liabilities | | — |
| | (2,480 | ) | | Accrued liabilities | | — |
| | (2,480 | ) |
| Total derivatives designated as hedging instruments | | 670 |
| | (570 | ) | | 220 |
| | (570 | ) |
| Derivatives not designated as hedging instruments | | | | | | | | |
| Foreign currency forward contracts | | Prepaid expenses and other current assets | | 180 |
| | 290 |
| | Prepaid expenses and other current assets | | 100 |
| | 70 |
|
| Cross currency swap | | Accrued liabilities | | (70 | ) | | (90 | ) | |
| Total derivatives de-designated as hedging instruments | | 110 |
| | 200 |
| | 100 |
| | 70 |
|
| Total derivatives | | $ | 780 |
| | $ | (370 | ) | | $ | 320 |
| | $ | (500 | ) |
HORIZON GLOBAL CORPORATION
NOTES TO CONDENSED CONSOLIDATED FINANCIAL STATEMENTS (Continued)
The following table summarizes the amount of gain recognized in AOCI on derivatives (net of tax):
| | | | Amount of Gain Recognized in AOCI on Derivatives (net of tax) | Amount of Gain Recognized in AOCI on Derivatives (net of tax) |
| | As of June 30, | | As of December 31, | As of September 30, | | As of December 31, |
| | 2019 | | 2018 | 2019 | | 2018 |
| | (dollars in thousands) | (dollars in thousands) |
Derivatives classified as cash flow hedges: | | Foreign currency forward contracts | $ | 680 |
| | $ | 1,870 |
| $ | 220 |
| | $ | 1,870 |
|
| Cross currency swap | $ | — |
| | $ | 90 |
| $ | — |
| | $ | 90 |
|
The following tables summarize the amounts reclassified from AOCI into earnings:
|
| | | | | | | | | | | | | | | | |
| | | Three months ended June 30, |
| | | 2019 | 2018 |
| | | Cost of sales | | Interest expense | | Cost of sales | | Interest expense |
| | | (dollars in thousands) |
| Total Amounts of Expense Line Items Presented in the Statement of Operations in Which the Effects of Cash Flow Hedges are Recorded | | $ | (179,110 | ) | | $ | (15,430 | ) | | $ | (185,770 | ) | | $ | (6,190 | ) |
| Amount of Gain Reclassified from AOCI into Earnings | | |
| Derivatives classified as cash flow hedges: | | |
| Foreign currency forward contracts | | $ | 630 |
| | $ | — |
| | $ | 80 |
| | $ | — |
|
| Cross currency swap | | $ | — |
| | $ | — |
| | $ | — |
| | $ | 6,290 |
|
HORIZON GLOBAL CORPORATION
NOTES TO CONDENSED CONSOLIDATED FINANCIAL STATEMENTS (Continued)
(unaudited)
|
| | | | | | | | | | | | | | | | |
| | | Three months ended September 30, |
| | | 2019 | 2018 |
| | | Cost of sales | | Interest expense | | Cost of sales | | Interest expense |
| | | (dollars in thousands) |
| Total Amounts of Expense Line Items Presented in the Statement of Operations in Which the Effects of Cash Flow Hedges are Recorded | | $ | (149,560 | ) | | $ | (24,120 | ) | | $ | (159,500 | ) | | $ | (7,590 | ) |
| Amount of Gain Reclassified from AOCI into Earnings | | |
| Derivatives classified as cash flow hedges: | | |
| Foreign currency forward contracts | | $ | 350 |
| | $ | — |
| | $ | 440 |
| | $ | — |
|
| Cross currency swap | | $ | — |
| | $ | — |
| | $ | — |
| | $ | 780 |
|
| | | | | Six months ended June 30, | | Nine months ended September 30, |
| | | 2019 | 2018 | | 2019 | 2018 |
| | | Cost of sales | | Interest expense | | Cost of sales | | Interest expense | | Cost of sales | | Interest expense | | Cost of sales | | Interest expense |
| | | (dollars in thousands) | | (dollars in thousands) |
| Total Amounts of Expense Line Items Presented in the Statement of Operations in Which the Effects of Cash Flow Hedges are Recorded | | $ | (356,690 | ) | | $ | (26,370 | ) | | $ | (364,130 | ) | | $ | (12,140 | ) | | $ | (460,010 | ) | | $ | (50,270 | ) | | $ | (472,120 | ) | | $ | (19,580 | ) |
| Amount of Gain Reclassified from AOCI into Earnings | Amount of Gain Reclassified from AOCI into Earnings | | | Amount of Gain Reclassified from AOCI into Earnings | | |
| Derivatives classified as cash flow hedges: | | | | | | | | | | | | | | | | |
| Foreign currency forward contracts | | $ | 1,410 |
| | $ | — |
| | $ | 210 |
| | $ | — |
| | $ | 1,550 |
| | $ | — |
| | $ | 590 |
| | $ | — |
|
| Cross currency swap | | $ | — |
| | $ | 900 |
| | $ | — |
| | $ | 3,220 |
| | $ | — |
| | $ | 900 |
| | $ | — |
| | $ | 4,000 |
|
The following table summarizes the gain or loss recognized in earnings for derivatives not designated as hedging instruments:
|
| | | | | | | | | | | | | | | | | | |
| | | Gain (Loss) Recognized in Earnings | | Location of Gain (Loss) Recognized in Earnings |
| | | Three months ended June 30, | | Six months ended June 30, | |
| | | 2019 | | 2018 | | 2019 | | 2018 | |
| | | (dollars in thousands) | | |
| Derivatives not designated as hedging instruments: |
| Foreign currency forward contracts | | $ | 60 |
| | $ | (60 | ) | | $ | (160 | ) | | $ | 20 |
| | Cost of sales |
| Cross currency swap | | $ | 30 |
| | $ | 120 |
| | $ | 20 |
| | $ | (60 | ) | | Other income (expense), net |
Over the next 12 months, the Company expects to reclassify approximately $0.6$0.2 million of pre-tax deferred gains, related to the foreign currency forward contracts, from AOCI to cost of sales as contract manufacturing and inventory purchases are settled.
HORIZON GLOBAL CORPORATION
NOTES TO CONDENSED CONSOLIDATED FINANCIAL STATEMENTS (Continued)
Fair Value Measurements
The fair value of the Company’s derivatives are estimated using an income approach based on valuation techniques to convert future amounts to a single, discounted amount. The Company’s derivatives are recorded at fair value in its condensed consolidated balance sheets and are valued using pricing models that are primarily based on market observable external inputs, including spot and forward currency exchange rates, benchmark interest rates, and discount rates consistent with the instrument’s tenor, and consider the impact of the Company’s own credit risk, if any. Changes in counterparty credit risk are also considered in the valuation of derivative financial instruments. Fair value measurements and the fair value hierarchy level for the Company’s assets and liabilities measured at fair value on a recurring basis as of JuneSeptember 30, 2019 and December 31, 2018 are shown below:
| | | | | Frequency | | Asset / (Liability) | | Quoted Prices in Active Markets for Identical Assets
(Level 1) | | Significant Other Observable Inputs
(Level 2) | | Significant Unobservable Inputs
(Level 3) | | Frequency | | Asset / (Liability) | | Quoted Prices in Active Markets for Identical Assets
(Level 1) | | Significant Other Observable Inputs
(Level 2) | | Significant Unobservable Inputs
(Level 3) |
| | | | | (dollars in thousands) | | | | (dollars in thousands) |
| June 30, 2019 | | | | | | | | | |
| September 30, 2019 | | | | | | | | | |
| Foreign currency forward contracts | | Recurring | | $ | 850 |
| | $ | — |
| | $ | 850 |
| | $ | — |
| | Recurring | | $ | 320 |
| | $ | — |
| | $ | 320 |
| | $ | — |
|
| Cross currency swaps | | Recurring | | $ | (70 | ) | | $ | — |
| | $ | (70 | ) | | $ | — |
| |
| December 31, 2018 | | | | | | | | | | | | | |
|
| | |
| Foreign currency forward contracts | | Recurring | | $ | 2,200 |
| | $ | — |
| | $ | 2,200 |
| | $ | — |
| | Recurring | | $ | 1,980 |
| | $ | — |
| | $ | 1,980 |
| | $ | — |
|
| Cross currency swaps | | Recurring | | $ | (2,570 | ) | | $ | — |
| | $ | (2,570 | ) | | $ | — |
| | Recurring | | $ | (2,480 | ) | | $ | — |
| | $ | (2,480 | ) | | $ | — |
|
HORIZON GLOBAL CORPORATION
NOTES TO CONDENSED CONSOLIDATED FINANCIAL STATEMENTS (Continued)
(unaudited)
10.11. Restructuring
The Company’s restructuring activities are undertaken as necessary to execute management’s strategy and streamline operations, consolidate and take advantage of available capacity and resources, and ultimately achieve productivity improvements and net cost reductions. The Company's restructuring charges consist primarily of employee costs (principally severance and/or termination benefits) and facility closure and other costs.
To the extent these programs involve voluntary separations, no liabilities are generally recorded until offers to employees are accepted. If employees are involuntarily terminated, a liability is generally recorded at the communication date. Estimates of restructuring charges are based on information available at the time such charges are recorded. Related charges are recorded in cost of sales and selling, general and administrative expenses.
The following table provides a summary of the Company’s consolidated restructuring liabilities and related activity for each type of exit cost as of and for the sixnine months ended JuneSeptember 30, 2019:
| | | | | Employee Costs | | Facility Closure and Other Costs | | Total | | Employee Costs | | Facility Closure and Other Costs | | Total |
| | | (dollars in thousands) | | (dollars in thousands) |
| Balance at January 1, 2019 | | $ | 4,990 |
| | $ | 5,120 |
| | $ | 10,110 |
| | $ | 4,990 |
| | $ | 5,120 |
| | $ | 10,110 |
|
Payments and other(1) | | (2,940 | ) | | $ | (990 | ) | | (3,930 | ) | | (3,810 | ) | | $ | (1,870 | ) | | (5,680 | ) |
| Balance at June 30, 2019 | | $ | 2,050 |
| | $ | 4,130 |
| | $ | 6,180 |
| |
| Balance at September 30, 2019 | | | $ | 1,180 |
| | $ | 3,250 |
| | $ | 4,430 |
|
(1)Other consists primarily of changes in the liability balance due to foreign currency translation.translation in addition to reversals of charges.
The $6.2$4.4 million restructuring liability at JuneSeptember 30, 2019 includes $4.0$2.4 million of accrued liabilities and $2.2$2.0 million of other long-term liabilities.
HORIZON GLOBAL CORPORATION
NOTES TO CONDENSED CONSOLIDATED FINANCIAL STATEMENTS (Continued)
(unaudited)
1112. Leases
The Company leases certain facilities, automobiles and equipment under non-cancellable operating leases. Our leases have remaining lease terms of one year to thirteentwelve years, some of which include options to extend the leases for up to five years, and some of which include options to terminate the leases within one year. Leases with an initial term of twelve months or less are not recorded on the condensed consolidated balance sheets; the Company recognizes lease expense for these leases on a straight-line basis over the lease term.
Most leases include one or more options to renew. The exercise of lease renewal options is typically at the Company’s sole discretion; therefore, the majority of renewals to extend the lease terms are not included in the Company’s ROU assets and lease liabilities as they are not reasonably certain of exercise. The Company regularly evaluates the renewal options and when they are reasonably certain of exercise, the Company includes the renewal period in the lease term. The Company combines lease and non-lease components which are accounted for as a single lease component as the Company has elected the practical expedient to group lease and non-lease components for all leases.
As most of the Company’s leases do not provide an implicit rate, the Company uses the incremental borrowing rate based on the information available at the lease commencement date in determining the present value of the lease payments. The Company has a centrally managed treasury function; therefore, based on the applicable lease terms and the current economic environment, the Company applies a portfolio approach by reporting segment for determining the incremental borrowing rate.
Operating lease cost was $5.8$4.3 million and $11.1$13.3 million for the three and sixnine months ended JuneSeptember 30, 2019, respectively. Operating cash flows from operating leases were $4.4$4.6 million and $9.8$14.3 million for the three and sixnine months ended JuneSeptember 30, 2019, respectively. ROU assets obtained in exchange for operating lease obligations were $14.5$0.2 million and $15.6$15.0 million for the three and sixnine months ended JuneSeptember 30, 2019, respectively. The weighted average remaining term of these leases was approximately 6.66.7 years and the weighted average discount rate used to measure lease liabilities was approximately 8.2%8.7%.
In September 2019, the Company ceased use of its Troy, Michigan headquarters office lease. In conjunction with the lease abandonment, the Company accelerated the recognition of expense of its ROU asset and wrote it off, which resulted in a $4.3 million charge recorded in selling, general and administrative expense in the accompanying condensed consolidated statements of operations during the three and nine months endedSeptember 30, 2019.
Maturities of lease liabilities were as follows as of JuneSeptember 30, 2019:
| | | Years ending December 31, | | Operating Leases | | Operating Leases |
| | | (dollars in thousands) | | (dollars in thousands) |
| 2019 | | $ | 10,800 |
| | $ | 4,990 |
|
| 2020 | | 17,600 |
| | 14,120 |
|
| 2021 | | 15,650 |
| | 13,180 |
|
| 2022 | | 12,230 |
| | 11,270 |
|
| 2023 | | 9,310 |
| | 9,000 |
|
| 2024 and thereafter | | 30,470 |
| | 29,900 |
|
| Total lease payments | | 96,060 |
| | 82,460 |
|
| Less imputed interest | | (23,850 | ) | | (21,720 | ) |
| Present value of lease liabilities | | $ | 72,210 |
| | $ | 60,740 |
|
HORIZON GLOBAL CORPORATION
NOTES TO CONDENSED CONSOLIDATED FINANCIAL STATEMENTS (Continued)
(unaudited)
Minimum payments for operating leases having initial or remaining non-cancellable lease terms in excess of one year at December 31, 2018, under ASC 840, are summarized below:
below. This historical information has been retrospectively adjusted to reflect the removal of discontinued operations. Discontinued operations are further discussed in Note 3, “Discontinued Operations”.
| | | December 31, | | Minimum Payments | | Minimum Payments |
| | | (dollars in thousands) | | (dollars in thousands) |
| 2019 | | $ | 15,820 |
| | $ | 12,380 |
|
| 2020 | | 14,790 |
| | 11,350 |
|
| 2021 | | 12,590 |
| | 10,120 |
|
| 2022 | | 7,900 |
| | 7,350 |
|
| 2023 | | 4,830 |
| | 4,350 |
|
| Thereafter | | 13,090 |
| | 12,480 |
|
| Total | | $ | 69,020 |
| | $ | 58,030 |
|
12.13. Contingencies
During the fourth quarter of 2018, the Company was notified by two OEM customers of potential claims related to product sold by Horizon Europe-Africa arising from potentially faulty components provided by a third party supplier. The claims resulted from the failure of products not functioning to specifications, but the claims do not allege any damage and only seek replacement of the product. OneDuring the first quarter of 2019, one of the claims has since resulted in a recall campaign, while the manner in which the other claim will be resolved iswas pending. The Company performed an assessment of the facts and circumstances for all asserted and unasserted claims and considered all factors including the Company’s recall insurance. Based on this assessment through March 31, 2019, the Company determined the probable range of the liability to be between $16.8 million and $20.0 million, with no amount within that range a better estimate than any other amount. As a result, the Company initially recorded a liability of $16.8 million and an asset of $11.1 million, which resulted in a $4.3 million charge during the sixfirst quarter of 2019.
On November 6, 2019, the Company reached a commercial settlement with an OEM customer that settles the exposure for certain claims related to the potentially faulty components for $5.5 million. Based on the facts and circumstances, the Company has determined that this settlement is a type I subsequent event which was recorded in its consolidated financial statements during the third quarter of 2019. As a result, the Company reduced its exposure related the claim by $4.3 million during the three months ended JuneSeptember 30, 2019.
As of JuneSeptember 30, 2019, the liability is $13.3$8.6 million due to ongoing replacement costs of potentially faulty components and is presented in “accrued liabilities” and the asset balance of $9.6$5.0 million is presented in “prepaid expenses and other current assets” in the accompanying JuneSeptember 30, 2019 condensed consolidated balance sheet. The asset recorded represents the amount the Company believes is probable of recovery and has appropriate legal basis for recovery in accordance with its recall insurance policy, which is further demonstrated by the initial recovery of $1.5$6.3 million of incurred costs related to the claim.claim during the second and third quarter of 2019. The Company will continue its efforts to seek a reasonable commercial resolution, but we cannot give any assurances that the final resolution of the claims, if adverse to the Company, will not have a material adverse effect to its financial position, results of operations or cash flows.
13. Loss14. Earnings (Loss) per Share
Basic loss per share is computed using net lossincome (loss) attributable to Horizon Global and the number of weighted average shares outstanding. Diluted loss per share is computed using net lossincome (loss) attributable to Horizon Global and the number of weighted average shares outstanding, adjusted to give effect to the assumed exercise of outstanding stock options and warrants, vesting of restricted shares outstanding, and conversion of the Convertible Notes.
HORIZON GLOBAL CORPORATION
NOTES TO CONDENSED CONSOLIDATED FINANCIAL STATEMENTS (Continued)
(unaudited)
The following table sets forth the reconciliation of the numerator and the denominator of basic lossincome (loss) per share attributable to Horizon Global and diluted lossincome (loss) per share attributable to Horizon Global:
| | | | | Three months ended
June 30, | | Six months ended
June 30, | | Three months ended
September 30, | | Nine months ended
September 30, |
| | | 2019 | | 2018 | | 2019 | | 2018 | | 2019 | | 2018 | | 2019 | | 2018 |
| | | (dollars in thousands, except share and per share data) | | (dollars in thousands, except share and per share data) |
| Numerator: | | | | | | | | | | | | | | | | |
| Net loss attributable to Horizon Global | | $ | (8,080 | ) | | $ | (66,930 | ) | | $ | (33,180 | ) | | $ | (124,440 | ) | |
| Net loss from continuing operations | | | $ | (37,500 | ) | | $ | (37,110 | ) | | $ | (78,030 | ) | | $ | (167,590 | ) |
| Income from discontinued operations, net of tax | | | $ | 182,750 |
| | $ | 4,110 |
| | $ | 189,520 |
| | $ | 9,670 |
|
| Less: Net loss attributable to noncontrolling interest | | | $ | (260 | ) | | $ | (240 | ) | | $ | (840 | ) | | $ | (720 | ) |
| Net income (loss) attributable to Horizon Global | | | $ | 145,510 |
| | $ | (32,760 | ) | | $ | 112,330 |
| | $ | (157,200 | ) |
| Denominator: | | | | | | | | | | | | | | | | |
| Weighted average shares outstanding, basic | | 25,282,791 |
| | 25,017,725 |
| | 25,235,704 |
| | 24,990,573 |
| | 25,329,492 |
| | 25,101,847 |
| | 25,267,310 |
| | 25,028,072 |
|
| Dilutive effect of stock-based awards | | — |
| | — |
| | — |
| | — |
| | — |
| | — |
| | — |
| | — |
|
| Weighted average shares outstanding, diluted | | 25,282,791 |
| | 25,017,725 |
| | 25,235,704 |
| | 24,990,573 |
| | 25,329,492 |
| | 25,101,847 |
| | 25,267,310 |
| | 25,028,072 |
|
| | | | | | | | | | | | | | | | | |
| Basic loss per share attributable to Horizon Global | | $ | (0.32 | ) | | $ | (2.68 | ) | | $ | (1.31 | ) | | $ | (4.98 | ) | |
| Diluted loss per share attributable to Horizon Global | | $ | (0.32 | ) | | $ | (2.68 | ) | | $ | (1.31 | ) | | $ | (4.98 | ) | |
| Basic income (loss) per share attributable to Horizon Global | | | | | | | | | |
| Continuing Operations | | | $ | (1.47 | ) | | $ | (1.47 | ) | | $ | (3.05 | ) | | $ | (6.67 | ) |
| Discontinued Operations | | | $ | 7.21 |
| | $ | 0.16 |
| | $ | 7.50 |
| | $ | 0.39 |
|
| Total | | | $ | 5.74 |
| | $ | (1.31 | ) | | $ | 4.45 |
| | $ | (6.28 | ) |
| Diluted income (loss) per share attributable to Horizon Global | | |
| |
| |
| |
|
| Continuing Operations | | | $ | (1.47 | ) | | $ | (1.47 | ) | | $ | (3.05 | ) | | $ | (6.67 | ) |
| Discontinued Operations | | | $ | 7.21 |
| | $ | 0.16 |
| | $ | 7.50 |
| | $ | 0.39 |
|
| Total | | | $ | 5.74 |
| | $ | (1.31 | ) | | $ | 4.45 |
| | $ | (6.28 | ) |
HORIZON GLOBAL CORPORATION
NOTES TO CONDENSED CONSOLIDATED FINANCIAL STATEMENTS (Continued)
Due to net losses from continuing operations for the three and sixnine months ended JuneSeptember 30, 2019 and 2018, the effect of certain dilutive securities were excluded from the computation of weighted average diluted shares outstanding as inclusion would have resulted in anti-dilution. A summary of these anti-dilutive common stock equivalents is provided in the table below:
| | | | | Three months ended
June 30, | | Six months ended
June 30, | | Three months ended
September 30, | | Nine months ended
September 30, |
| | | 2019 | | 2018 | | 2019 | | 2018 | | 2019 | | 2018 | | 2019 | | 2018 |
| Number of options | | 55,389 |
| | 308,348 |
| | 65,181 |
| | 321,341 |
| | 53,321 |
| | 220,726 |
| | 61,184 |
| | 285,538 |
|
| Exercise price of options | | $9.20 - $11.29 |
| | $9.20 - $11.29 |
| | $9.20 - $11.29 |
| | $9.20 - $11.29 |
| | $9.20 - $11.29 |
| | $9.20 - $11.29 |
| | $9.20 - $11.29 |
| | $9.20 - $11.29 |
|
| Restricted stock units | | 1,259,552 |
| | 835,560 |
| | 868,263 |
| | 737,865 |
| | 1,524,778 |
| | 629,507 |
| | 1,101,855 |
| | 685,286 |
|
| Convertible Notes | | 5,005,000 |
| | 5,005,000 |
| | 5,005,000 |
| | 5,005,000 |
| | 5,005,000 |
| | 5,005,000 |
| | 5,005,000 |
| | 5,005,000 |
|
| Convertible Notes warrants | | 5,005,000 |
| | 5,005,000 |
| | 5,005,000 |
| | 5,005,000 |
| | 5,005,000 |
| | 5,005,000 |
| | 5,005,000 |
| | 5,005,000 |
|
| Second Lien Term Loan warrants | | 3,764,113 |
| | — |
| | 2,210,855 |
| | — |
| | 6,545,479 |
| | — |
| | 3,671,607 |
| | — |
|
For purposes of determining diluted lossincome (loss) per share, the Company has elected a policy to assume that the principal portion of the Convertible Notes, as described in Note 8,9, “Long-term Debt,” is settled in cash and the conversion premium is settled in shares. Therefore, the Company has adopted a policy of calculating the diluted lossincome (loss) per share effect of the Convertible Notes using the treasury stock method. As a result, the dilutive effect of the Convertible Notes is limited to the conversion premium, which is reflected in the calculation of diluted loss per share as if it were a freestanding written call option on the Company’s shares. Using the treasury stock method, the Warrants issued in connection with the issuance of the Convertible Notes are considered to be dilutive when they are in the money relative to the Company’s average common stock price during the period. The Convertible Note Hedges purchased in connection with the issuance of the Convertible Notes are always considered to be anti-dilutive and therefore do not impact the Company’s calculation of diluted lossincome (loss) per share.
14.15. Equity Awards
Description of the Plan
Horizon employees and non-employee directors participate in the Horizon Global Corporation 2015 Equity and Incentive Compensation Plan (as amended and restated, the “Horizon 2015 Plan”). The Horizon 2015 Plan authorizes the Compensation Committee of the Horizon Board of Directors to grant stock options (including “incentive stock options” as defined in Section 422
HORIZON GLOBAL CORPORATION
NOTES TO CONDENSED CONSOLIDATED FINANCIAL STATEMENTS (Continued)
(unaudited)
of the U.S. Internal Revenue Code), restricted shares, restricted stock units, performance shares, performance stock units, cash incentive awards, and certain other awards based on or related to our common stock to Horizon employees and non-employee directors. No more than 4.4 million Horizon common shares may be delivered under the Horizon 2015 Plan.
HORIZON GLOBAL CORPORATION
NOTES TO CONDENSED CONSOLIDATED FINANCIAL STATEMENTS (Continued)
Stock Options
The following table summarizes Horizon stock option activity from December 31, 2018 to JuneSeptember 30, 2019:
| | | | | Number of Stock Options | | Weighted Average Exercise Price | | Average Remaining Contractual Life (Years) | | Aggregate Intrinsic Value | | Number of Stock Options | | Weighted Average Exercise Price | | Average Remaining Contractual Life (Years) | | Aggregate Intrinsic Value |
| Outstanding at December 31, 2018 | | 92,967 |
| | $ | 10.40 |
| |
| | | | 92,967 |
| | $ | 10.40 |
| |
| | |
| Granted | | — |
| | — |
| |
| | | | — |
| | — |
| |
| | |
| Exercised | | — |
| | — |
| | | | — |
| | — |
| | |
| Canceled, forfeited | | (39,646 | ) | | 10.31 |
| | | | (39,646 | ) | | 10.31 |
| | |
| Expired | | — |
| | — |
| | | | — |
| | — |
| | |
| Outstanding at June 30, 2019 | | 53,321 |
| | $ | 10.43 |
| | 6.1 | | $ | — |
| |
| Outstanding at September 30, 2019 | | | 53,321 |
| | $ | 10.43 |
| | 5.8 | | $ | — |
|
As of JuneSeptember 30, 2019, the unrecognized compensation cost related to stock options is immaterial. For the three and sixnine months ended JuneSeptember 30, 2019 and 2018, the stock-based compensation expense recognized by the Company related to stock options was immaterial. There was no aggregate intrinsic value of the outstanding options at JuneSeptember 30, 2019. Stock-based compensation expense is included in selling, general and administrative expenses in the accompanying condensed consolidated statements of operations.
Restricted Shares
During the first sixnine months of 2019, the Company granted an aggregate of 1,438,9241,527,322 restricted stock units and performance stock units to certain key employees. The total grants consisted of: (i) 265,194353,592 time-based restricted stock units that vest on May 15,2020;15, 2020; (ii) 5,000 time-based restricted stock units that vest on May 15, 2021; (iii) 411,373 time-based restricted stock units that vest on March 19, 2022 and (iv) 757,357 market-based performance stock units that vest on March 19, 2022 (the “2019 PSUs”).
During 2018, the Company granted an aggregate of 477,963 restricted stock units and performance stock units to certain key employees and non-employee directors. The total grants consisted of: (i) 5,680 time-based restricted stock units that vested on July 1, 2018; (ii) 43,799 time-based restricted stock units that vest ratably on (1) March 1, 2019, (2) March 1, 2020 and (3) March 1, 2021; (iii) 101,204 time-based restricted stock units that vest ratably on (1) March 1, 2019, (2) March 1, 2020, (3) March 1, 2021 and (4) March 1, 2022; (iv) 145,003 market-based performance stock units that vest on March 1, 2021 (the “2018 PSUs”); (v) 43,416 time-based restricted stock units that vest on March 1, 2021; (vi) 17,575 time-based restricted stock units that vest on May 8, 2019; (vii) 84,210 time-based restricted stock units that vested on May 15, 2018; (viii) 11,404 time-based restricted stock units that vest on May 15, 2020; (ix) 14,472 time-based restricted stock units that vest on August 1, 2020; (x) 8,400 time-based restricted stock units that vest on October 1, 2020, and (xi) 2,800 time-based restricted stock units that vest on December 3, 2020.
The performance criteria for the market-based performance stock units is based on the Company’s total shareholder return (“TSR”) relative to the TSR of the common stock of a pre-defined industry peer group. For the 2019 PSUs, TSR is measured over a period beginning January 1, 2019 and ending December 31, 2021. For the 2018 PSUs, TSR is measured over a period beginning January 1, 2018 and ending December 31, 2020. TSR is calculated as the Company’s average closing stock price for the 20-trading days at the end of the performance period plus Company dividends, divided by the Company’s average closing stock price for the 20-trading days prior to the start of the performance period. Depending on the performance achieved, the amount of shares earned can vary from 0% of the target award to a maximum of 200% of the target award. The Company estimated the grant-date fair value of the awards subject to a market condition using a Monte Carlo simulation model, using the following weighted-average assumptions: risk-free interest rate of 2.43% and 2.34% for the 2019 PSUs and 2018 PSUs, respectively, and annualized volatility of 84.1% and 37.4% for the 2019 PSUs and 2018 PSUs, respectively. Due to the lack of adequate stock price history of Horizon common stock during 2018, the volatility was based on the median of the peer group. In 2019, the Company had sufficient historical data that was used to calculate the volatility. The grant date fair value of the performance stock units were $3.69 and $7.08 for the 2019 PSUs and 2018 PSUs, respectively.
HORIZON GLOBAL CORPORATION
NOTES TO CONDENSED CONSOLIDATED FINANCIAL STATEMENTS (Continued)
(unaudited)
The grant date fair value of restricted stock units is expensed over the vesting period. Restricted stock unit fair values are based on the closing trading price of the Company’s common stock on the date of grant. Changes in the number of restricted shares outstanding for the period ended JuneSeptember 30, 2019 were as follows:
| | | | | Number of Restricted Shares | | Weighted Average Grant Date Fair Value | | Number of Restricted Shares | | Weighted Average Grant Date Fair Value |
| Outstanding at December 31, 2018 | | 419,928 |
| | $ | 9.75 |
| | 419,928 |
| | $ | 9.75 |
|
| Granted | | 1,438,924 |
| | 3.45 |
| | 1,527,322 |
| | 3.46 |
|
| Vested | | (141,803 | ) | | 7.19 |
| | (145,981 | ) | | 7.40 |
|
| Canceled, forfeited | | (208,634 | ) | | 4.17 |
| | (287,829 | ) | | 4.02 |
|
| Outstanding at June 30, 2019 | | 1,508,415 |
| | $ | 4.35 |
| |
| Outstanding at September 30, 2019 | | | 1,513,440 |
| | $ | 4.31 |
|
As of JuneSeptember 30, 2019, there was $4.9$4.1 million in unrecognized compensation costs related to unvested restricted stock units that is expected to be recognized over a weighted-average period of 2.22.0 years.
The Company recognized approximately $0.6$0.9 million and $1.0$1.8 million of stock-based compensation expense related to restricted shares during the three and sixnine months ended JuneSeptember 30, 2019, respectively, and approximately $0.5$0.1 million and $1.2$1.5 million during the three and sixnine months ended JuneSeptember 30, 2018. Stock-based compensation expense is included in selling, general and administrative expenses in the accompanying condensed consolidated statements of operations.
15.16. Shareholders’ Equity
Preferred Stock
The Company is authorized to issue 100,000,000 shares of preferred stock, par value of $0.01 per share. There were no preferred shares outstanding at JuneSeptember 30, 2019 or December 31, 2018.
Common Stock
The Company is authorized to issue 400,000,000 shares of common stock, par value of $0.01 per share. At JuneSeptember 30, 2019, there were 26,003,24026,073,894 shares of common stock issued and 25,316,73425,387,388 shares of common stock outstanding. At December 31, 2018, there were 25,866,747 shares of common stock issued and 25,180,241 shares of common stock outstanding.
Common Stock Warrants
In connection with the Second Lien Term Loan the Company entered into in March 2019, the Company became obligated to issue 6.25 million detachable warrants to purchase common stock of the Company, which can be exercised on a cashless basis over a five year term with an exercise price of $1.50 per share.
The Company also issued 90,667 shares of Series A Preferred Stock in March 2019 in connection with the Second Lien Term Loan that were convertible into additional warrants upon receipt of shareholder approval of the issuance of such additional warrants and the shares of common stock issuable upon exercise thereof. The Series A Preferred Stock was presented as Temporary equity in the March 31, 2019 condensed consolidated balance sheet. Upon receipt of such shareholder approval on June 25, 2019, the 90,667 shares of Series A Preferred Stock were converted into 2,952,248 warrants. See Note 8,9, “Long-term Debt,” for additional information. As of JuneSeptember 30, 2019, warrants to purchase 6,554,1506,487,674 shares of common stock were issued and remain outstanding.
HORIZON GLOBAL CORPORATION
NOTES TO CONDENSED CONSOLIDATED FINANCIAL STATEMENTS (Continued)
(unaudited)
Accumulated Other Comprehensive Income (“AOCI”)
Changes in AOCI by component, net of tax, for the sixnine months ended JuneSeptember 30, 2019 are summarized as follows:
| | | | | Derivative Instruments | | Foreign Currency Translation | | Total | | Derivative Instruments | | Foreign Currency Translation | | Total |
| | | (dollars in thousands) | | (dollars in thousands) |
| Balance at January 1, 2019 | | $ | 1,960 |
| | $ | 5,800 |
| | $ | 7,760 |
| | $ | 1,960 |
| | $ | 5,800 |
| | $ | 7,760 |
|
Net unrealized gains arising during the period (a) | | 970 |
| | 1,290 |
| | 2,260 |
| | 730 |
| | (30 | ) | | 700 |
|
Less: Net realized gains reclassified to net loss (b) | | 2,250 |
| | — |
| | 2,250 |
| | 2,450 |
| | — |
| | 2,450 |
|
| Amounts reclassified from AOCI | | | (20 | ) | | (17,240 | ) | | (17,260 | ) |
| Net current-period change | | (1,280 | ) | | 1,290 |
| | 10 |
| | (1,740 | ) | | (17,270 | ) | | (19,010 | ) |
| Balance at June 30, 2019 | | $ | 680 |
| | $ | 7,090 |
| | $ | 7,770 |
| |
| Balance at September 30, 2019 | | | $ | 220 |
| | $ | (11,470 | ) | | $ | (11,250 | ) |
Changes in AOCI by component, net of tax, for the nine months ended September 30, 2018 are summarized as follows:
|
| | | | | | | | | | | | |
| | | Derivative Instruments | | Foreign Currency Translation | | Total |
| | | (dollars in thousands) |
| Balance at January 1, 2018 | | $ | (310 | ) | | $ | 10,880 |
| | $ | 10,570 |
|
Net unrealized gains (losses) arising during the period (a) | | 6,850 |
| | (4,330 | ) | | 2,520 |
|
Less: Net realized losses reclassified to net loss (b) | | 3,890 |
| | — |
| | 3,890 |
|
| Net current-period change | | 2,960 |
| | (4,330 | ) | | (1,370 | ) |
| Balance at September 30, 2018 | | $ | 2,650 |
| | $ | 6,550 |
| | $ | 9,200 |
|
__________________________
(a)Derivative instruments, net of income tax expense of $0.0$(1.3) million. See Note 9,10, “Derivative Instruments,” for further details.
(b) Derivative instruments, net of income tax expense of $0.0$0.9 million. See Note 9,10, “Derivative Instruments,” for further details.
Changes in AOCI by component, net of tax, for the six months ended June 30, 2018 are summarized as follows:
|
| | | | | | | | | | | | |
| | | Derivative Instruments | | Foreign Currency Translation | | Total |
| | | (dollars in thousands) |
| Balance at January 1, 2018 | | $ | (390 | ) | | $ | 10,400 |
| | $ | 10,010 |
|
Net unrealized gains (losses) arising during the period (a) | | 5,060 |
| | (3,650 | ) | | 1,410 |
|
Less: Net realized losses reclassified to net loss (b) | | 2,740 |
| | — |
| | 2,740 |
|
| Net current-period change | | 2,320 |
| | (3,650 | ) | | (1,330 | ) |
| Balance at June 30, 2018 | | $ | 1,930 |
| | $ | 6,750 |
| | $ | 8,680 |
|
__________________________
(a) Derivative instruments, net of income tax expense of $1.0 million. See Note 9, “Derivative Instruments,” for further details.
(b) Derivative instruments, net of income tax expense of $0.7 million. See Note 9, “Derivative Instruments,” for further details.
1617. Segment Information
The Company groups its business into operating segments by the region in which sales and manufacturing efforts are focused, which are grouped on the basis of similar product, market and operating factors. Each operating segment has discrete financial information evaluated regularly by the Company’s chief operating decision maker in determining resource allocation and assessing performance. The Company reports the results of its business in threetwo operating segments: Horizon Americas Horizon Europe-Africa, and Horizon Asia-Pacific.Europe-Africa. Horizon Americas is comprised of the Company’s North American and South American operations. Horizon Europe-Africa is comprised of the European and South African operations, while Horizon Asia-Pacific is comprised of the Australia, Thailand, and New Zealand operations. See below for further information regarding the types of products and services provided within each operating segment.
Previously, the Company had three reportable segments. However, as a result of its sale in the third quarter of 2019, we have removed APAC as a separate operating segment and its results are presented as a discontinued operation in the accompanying condensed consolidated financial statements. Historical information has been retrospectively adjusted to reflect these changes. Please see Note 3, “Discontinued Operations,” for additional information.
Horizon Americas - A market leader in the design, manufacture and distribution of a wide variety of high-quality, custom engineered towing, trailering and cargo management products and related accessories. These products are designed to support OEMs, OESs, aftermarket and retail customers in the agricultural, automotive, construction, industrial, marine, military, recreational vehicle, trailer and utility end markets. Products include brake controllers, cargo management, heavy-duty towing products, jacks and couplers, protection/securing systems, trailer structural and electrical components, tow bars, vehicle roof racks, vehicle trailer hitches and additional accessories.
HORIZON GLOBAL CORPORATION
NOTES TO CONDENSED CONSOLIDATED FINANCIAL STATEMENTS (Continued)
Horizon Europe‑Africa - With a product offering similar to Horizon Americas, Horizon Europe-Africa focuses its sales and manufacturing efforts in the Europe and Africa regions of the world.
HORIZON GLOBAL CORPORATION
NOTES TO CONDENSED CONSOLIDATED FINANCIAL STATEMENTS (Continued)
(unaudited)
Horizon Asia‑Pacific - With a product offering similar to Horizon Americas, Horizon Asia-Pacific focuses its sales and manufacturing efforts inThe following table presents the Asia-Pacific region of the world.
Segment activity is as follows:Company’s operating segment activity:
| | | | | Three months ended
June 30, | | Six months ended
June 30, | | Three months ended
September 30, | | Nine months ended
September 30, |
| | | 2019 | | 2018 | | 2019 | | 2018 | | 2019 | | 2018 | | 2019 | | 2018 |
| | | (dollars in thousands) | | (dollars in thousands) |
| Net Sales | | | | | | | | | | | | | | | | |
| Horizon Americas | | $ | 108,920 |
| | $ | 108,080 |
| | $ | 204,420 |
| | $ | 204,300 |
| | $ | 96,220 |
| | $ | 115,510 |
| | $ | 300,670 |
| | $ | 319,820 |
|
| Horizon Europe-Africa | | 83,670 |
| | 90,840 |
| | 165,840 |
| | 177,900 |
| | 81,630 |
| | 78,520 |
| | 247,500 |
| | 256,430 |
|
| Horizon Asia-Pacific | | 30,570 |
| | 34,420 |
| | 62,560 |
| | 67,950 |
| |
| Total | | $ | 223,160 |
| | $ | 233,340 |
| | $ | 432,820 |
| | $ | 450,150 |
| | $ | 177,850 |
| | $ | 194,030 |
| | $ | 548,170 |
| | $ | 576,250 |
|
| Operating Profit (Loss) | | | | | | | | | | | | | | | | |
| Horizon Americas | | $ | 9,490 |
| | $ | 2,570 |
| | $ | 7,990 |
| | $ | (2,540 | ) | | $ | (2,230 | ) | | $ | 7,270 |
| | $ | 5,760 |
| | $ | 4,730 |
|
| Horizon Europe-Africa | | 1,580 |
| | (55,690 | ) | | (1,610 | ) | | (100,780 | ) | | 1,730 |
| | (31,370 | ) | | 120 |
| | (132,150 | ) |
| Horizon Asia-Pacific | | 4,400 |
| | 4,670 |
| | 9,780 |
| | 9,060 |
| |
| Corporate | | (8,420 | ) | | (15,690 | ) | | (17,100 | ) | | (23,150 | ) | | (12,260 | ) | | (5,800 | ) | | (29,360 | ) | | (28,950 | ) |
| Total | | $ | 7,050 |
| | $ | (64,140 | ) | | $ | (940 | ) | | $ | (117,410 | ) | | $ | (12,760 | ) | | $ | (29,900 | ) | | $ | (23,480 | ) | | $ | (156,370 | ) |
17.18. Income Taxes
At the end of each interim reporting period, the Company makes an estimate of the annual effective income tax rate. Tax items included in the annual effective income tax rate are pro-rated for the full year and tax items discrete to a specific quarter are included in the effective income tax rate for that quarter. Effective tax rates vary from period to period as separate calculations are performed for those countries where the Company's operations are profitable and whose results continue to be tax-effected and for those countries where full deferred tax valuation allowances exist and are maintained. In determining the estimated annual effective tax rate, the Company analyzes various factors, including but not limited to, forecasts of projected annual earnings, taxing jurisdictions in which the pretax income and/or pretax losses will be generated, available tax planning strategies and estimated domestic tax impacts attributable to the 2017 Tax Cuts and Jobs Act (the “Tax Act”).
The effective income tax rate from continuing operations was (2.0)%2.6% and (3.81)%2.9% for the three and sixnine months ended JuneSeptember 30, 2019, respectively. ForThe difference between the three and six months ended June 30, 2018, the effective income tax rates were 12.7% and 9.0% respectively. The lower 2019 effective tax rate is attributableand the U.S. statutory tax rate of 21% primarily relates to the valuation allowance recorded in the U.S. at year end 2018,and several foreign jurisdictions, which resultedresults in no income tax benefit recognized for jurisdictional pretax losses. For the three and nine months ended September 30, 2018, the effective income tax rates were 3.7% and 8.6%, respectively.
As a result of the Company’s sale of APAC, the Company recorded $30.3 million tax expense, which is presented in income from discontinued operations, net of tax, in the accompanying condensed consolidated statements of operations for three and nine month ended September 30, 2019. During the third quarter of 2019, the Company recognized the benefit of a worthless stock deduction for one of its German subsidiaries. A tax benefit was recorded to fully offset the $30.3 million expense recognized on sale, which is presented in income from discontinued operations, net of tax, in the accompanying condensed consolidated statements of operations for three and nine month ended September 30, 2019. The Company believes that it is more likely than not that the Company will realize the income tax benefit of this worthless stock deduction in 2019, to the extent of tax expense associated with the Company’s sale of APAC.
The Company evaluates the realizability of its deferred tax assets on a quarterly basis. In completing this evaluation, the Company considers all available evidence in order to determine whether, based on the weight of the evidence, a valuation allowance is necessary. Full valuation allowances against deferred tax assets in the U.S. and applicable foreign countries will be maintained until sufficient positive evidence exists to reduce or eliminate them. The factors considered by management in its determination of the probability of the realization of the deferred tax assets include, but are not limited to, recent historical financial results, historical taxable income, projected future taxable income, the expected timing of the reversals of existing temporary differences, tax planning strategies and projected future impacts attributable to the Tax Act. If, based upon the weight of available evidence,
HORIZON GLOBAL CORPORATION
NOTES TO CONDENSED CONSOLIDATED FINANCIAL STATEMENTS (Continued)
it is more likely than not the deferred tax assets will not be realized, a valuation allowance is recorded. As of JuneSeptember 30, 2019, the Company believes that it is more likely than not that the recorded deferred tax assets will be realized. The Company has recently experienced pre-tax losses. If the Company continues to experience losses, management may determine a valuation allowance against certain of its deferred tax assets is necessary.
HORIZON GLOBAL CORPORATION
NOTES TO CONDENSED CONSOLIDATED FINANCIAL STATEMENTS (Continued)
(unaudited)
18.19. Other Income (Expense),Expense, Net
Other income (expense),expense, net consists of the following components:
| | | | | Three months ended
June 30, | | Six months ended
June 30, | | Three months ended
September 30, | | Nine months ended
September 30, |
| | | 2019 | | 2018 | | 2019 | | 2018 | | 2019 | | 2018 | | 2019 | | 2018 |
| | | (dollars in thousands) | | (dollars in thousands) |
| Loss on sale of business | | $ | — |
| | $ | — |
| | $ | (3,630 | ) | | $ | — |
| | $ | — |
| | $ | — |
| | $ | (3,630 | ) | | $ | — |
|
| Foreign currency gain / (loss) | | 730 |
| | (1,200 | ) | | (600 | ) | | (520 | ) | | (1,180 | ) | | (530 | ) | | (1,800 | ) | | (1,070 | ) |
| Customer pay discounts | | (410 | ) | | (510 | ) | | (920 | ) | | (790 | ) | | (300 | ) | | (610 | ) | | (1,220 | ) | | (1,400 | ) |
| Accretion arising from lease recovery | | (30 | ) | | (80 | ) | | (70 | ) | | (150 | ) | | (30 | ) | | (50 | ) | | (100 | ) | | (200 | ) |
| Brazil acquisition indemnification asset | | — |
| | (320 | ) | | — |
| | (1,120 | ) | | — |
| | (290 | ) | | — |
| | (1,410 | ) |
| Brink acquisition termination fees | | — |
| | (4,500 | ) | | — |
| | (5,130 | ) | |
| Brink acquisition ticking fee | | | — |
| | — |
| | — |
| | (5,130 | ) |
| Other | | 110 |
| | — |
| | 10 |
| | (20 | ) | | (130 | ) | | 440 |
| | 140 |
| | 1,800 |
|
| Total | | $ | 400 |
| | $ | (6,610 | ) | | $ | (5,210 | ) | | $ | (7,730 | ) | | $ | (1,640 | ) | | $ | (1,040 | ) | | $ | (6,610 | ) | | $ | (7,410 | ) |
Item 2. Management’s Discussion and Analysis of Financial Condition and Results of Operations
The following discussion and analysis of our financial condition contains forward-looking statements regarding industry outlook and our expectations regarding the performance of our business. These forward-looking statements are subject to numerous risks and uncertainties, including, but not limited to, the risks and uncertainties described under the heading “Forward-Looking Statements,” at the beginning of this report. Our actual results may differ materially from those contained in or implied by any forward-looking statements. You should read the following discussion together with the Company’s reports on file with the Securities and Exchange Commission, as well as our Annual Report on Form 10-K for the year ended December 31, 2018 (See Item 1A. Risk Factors).
Overview
Horizon Global Corporation (“Horizon,” “Horizon Global,” “we,” or the “Company”), headquartered in Troy, Michigan, is a leading designer, manufacturer and distributor of a wide variety of high-quality, custom-engineered towing, trailering, cargo management and other related accessory products on a global basis, primarily serving the automotive aftermarket, retail and original equipment manufacturers (“OEMs”) and original equipment servicers (“OESs”) (collectively, “OEs”) channels. The Company supports its customers within the agricultural, automotive, construction, horse/livestock, industrial, marine, military, recreational, trailer and utility markets primarily through a regional service model.
Horizon Global reports its business in threetwo operating segments: Horizon Americas Horizon Europe-Africa and Horizon Asia-Pacific.Europe-Africa. See Note 16, 17, “Segment Information,” included in Part I, Item 1, “Notes to Condensed Consolidated Financial Statements,” within this quarterly report on Form 10-Q for further description of the Company’s operating segments.
Critical factors affecting our ability to succeed include: our
Our ability to realize the expected economic benefits of the changes made to our manufacturing and distribution footprint and management team during 2018 and 2019; our2019
Our ability to quickly and cost-effectively introduce new products; ourproducts
Our ability to continue to integrate acquired companies or products that have historically supplemented existing product lines, add new distribution channels and expand our geographic coverage and realize desired operating efficiencies; and ourefficiencies
HORIZON GLOBAL CORPORATION
NOTES TO CONDENSED CONSOLIDATED FINANCIAL STATEMENTS (Continued)
Our ability to manage our cost structure more efficiently via supply base management, internal sourcing and/or purchasing of materials, selective outsourcing and/or purchasing of support functions, working capital management, and leverage of our administrative functions.
If we are unable to do any of the foregoing successfully, our financial condition and results of operations could be materially and adversely impacted.
We report shipping and handling expenses associated with Horizon Americas’ distribution network as an element of selling, general and administrative expenses in our consolidated statements of operations. As such, gross margins for Horizon Americas may not be comparable to those of Horizon Europe-Africa, and Horizon Asia-Pacific, which primarily rely on third-party distributors, for which all costs are included in cost of sales.
HORIZON GLOBAL CORPORATION
NOTES TO CONDENSED CONSOLIDATED FINANCIAL STATEMENTS (Continued)
(unaudited)
Segment Information and Supplemental Analysis
Previously, the Company had three reportable segments. However, as a result of the divestiture of Horizon Asia-Pacific (“APAC”) in the third quarter of 2019, we have removed APAC as a separate operating segment and its results are presented as a discontinued operation. Historical information has been retrospectively adjusted to reflect these changes. Please see Note 3, “Discontinued Operations,” and Note 17, “Segment Information” for additional information.
The following table summarizes financial information for our operating segments for the three months ended JuneSeptember 30, 2019 (“Q2 2019”3Q19”) and 2018 (“Q2 2018”3Q18”):
| | | | | Three months ended June 30, | | Change | | Constant Currency Change | | Three months ended September 30, | | Change | | Constant Currency Change |
| | | 2019 | | As a Percentage of Net Sales | | 2018 | | As a Percentage of Net Sales | | $ | | % | | $ | | % | | 2019 | | As a Percentage of Net Sales | | 2018 | | As a Percentage of Net Sales | | $ | | % | | $ | | % |
| | | (dollars in thousands) | | | | | | (dollars in thousands) |
| Net Sales | | | | | | | | | | | | | | | | | | | | | | | | | | | | | | | | |
| Horizon Americas | | $ | 108,920 |
| | 48.8 | % | | $ | 108,080 |
| | 46.3 | % | | $ | 840 |
| | 0.8 | % | | $ | 1,010 |
| | 0.9 | % | | $ | 96,220 |
| | 54.1 | % | | $ | 115,510 |
| | 59.5 | % | | $ | (19,290 | ) | | (16.7 | %) | | $ | (19,280 | ) | | (16.7 | %) |
| Horizon Europe-Africa | | 83,670 |
| | 37.5 | % | | 90,840 |
| | 38.9 | % | | (7,170 | ) | | (7.9 | %) | | (1,860 | ) | | (2.0 | %) | | 81,630 |
| | 45.9 | % | | 78,520 |
| | 40.5 | % | | 3,110 |
| | 4.0 | % | | 6,990 |
| | 8.9 | % |
| Horizon Asia-Pacific | | 30,570 |
| | 13.7 | % | | 34,420 |
| | 14.8 | % | | (3,850 | ) | | (11.2 | %) | | (2,150 | ) | | (6.2 | %) | |
| Total | | $ | 223,160 |
| | 100.0 | % | | $ | 233,340 |
| | 100.0 | % | | $ | (10,180 | ) | | (4.4 | %) | | $ | (3,000 | ) | | (1.3 | %) | | $ | 177,850 |
| | 100.0 | % | | $ | 194,030 |
| | 100.0 | % | | $ | (16,180 | ) | | (8.3 | %) | | $ | (12,290 | ) | | (6.3 | %) |
| Gross Profit | | | | | | | | | | | | | | | | | | | | | | | | | | | | | | | | |
| Horizon Americas | | $ | 26,890 |
| | 24.7 | % | | $ | 26,920 |
| | 24.9 | % | | $ | (30 | ) | | (0.1 | %) | | $ | 10 |
| | — | % | | $ | 17,270 |
| | 17.9 | % | | $ | 27,780 |
| | 24.0 | % | | $ | (10,510 | ) | | (37.8 | %) | | $ | (10,460 | ) | | (37.7 | %) |
| Horizon Europe-Africa | | 9,410 |
| | 11.2 | % | | 12,200 |
| | 13.4 | % | | (2,790 | ) | | (22.9 | %) | | (2,040 | ) | | (16.7 | %) | | 11,020 |
| | 13.5 | % | | 6,750 |
| | 8.6 | % | | 4,270 |
| | 63.3 | % | | 4,800 |
| | 71.1 | % |
| Horizon Asia-Pacific | | 7,750 |
| | 25.4 | % | | 8,450 |
| | 24.5 | % | | (700 | ) | | (8.3 | %) | | (390 | ) | | (4.6 | %) | |
| Total | | $ | 44,050 |
| | 19.7 | % | | $ | 47,570 |
| | 20.4 | % | | $ | (3,520 | ) | | (7.4 | %) | | $ | (2,420 | ) | | (5.1 | %) | | $ | 28,290 |
| | 15.9 | % | | $ | 34,530 |
| | 17.8 | % | | $ | (6,240 | ) | | (18.1 | %) | | $ | (5,660 | ) | | (16.4 | %) |
| Selling, General and Administrative Expenses | | | | | | | | | | | | | | | | | | | | | | | | | | | | | | | | |
| Horizon Americas | | $ | 17,450 |
| | 16.0 | % | | $ | 24,270 |
| | 22.5 | % | | $ | (6,820 | ) | | (28.1 | %) | | $ | (6,780 | ) | | (27.9 | %) | | $ | 19,500 |
| | 20.3 | % | | $ | 20,460 |
| | 17.7 | % | | $ | (960 | ) | | (4.7 | %) | | $ | (940 | ) | | (4.6 | %) |
| Horizon Europe-Africa | | 7,800 |
| | 9.3 | % | | 11,990 |
| | 13.2 | % | | (4,190 | ) | | (34.9 | %) | | (3,880 | ) | | (32.4 | %) | | 9,330 |
| | 11.4 | % | | 11,370 |
| | 14.5 | % | | (2,040 | ) | | (17.9 | %) | | (1,600 | ) | | (14.1 | %) |
| Horizon Asia-Pacific | | 3,340 |
| | 10.9 | % | | 3,790 |
| | 11.0 | % | | (450 | ) | | (11.9 | %) | | (260 | ) | | (6.9 | %) | |
Corporate(1) | | 8,420 |
| | 3.8 | % | | 15,690 |
| | 6.7 | % | | (7,270 | ) | | (46.3 | %) | | N/A |
| | N/A |
| |
| Corporate | | | 12,270 |
| | 6.9 | % | | 5,850 |
| | 3.0 | % | | 6,420 |
| | 109.7 | % | | N/A |
| | N/A |
|
| Total | | $ | 37,010 |
| | 16.6 | % | | $ | 55,740 |
| | 23.9 | % | | $ | (18,730 | ) | | (33.6 | %) | | $ | (10,920 | ) | | (14.0 | %) | | $ | 41,100 |
| | 23.1 | % | | $ | 37,680 |
| | 19.4 | % | | $ | 3,420 |
| | 9.1 | % | | $ | (2,540 | ) | | 15.8 | % |
| Operating Profit (Loss) | | | | | | | | | | | | | | | | | | | | | | | | | | | | | | | | |
| Horizon Americas | | $ | 9,490 |
| | 8.7 | % | | $ | 2,570 |
| | 2.4 | % | | $ | 6,920 |
| | 269.3 | % | | $ | 6,920 |
| | 269.3 | % | | $ | (2,230 | ) | | (2.3 | )% | | $ | 7,270 |
| | 6.3 | % | | $ | (9,500 | ) | | (130.7 | %) | | $ | (9,480 | ) | | (130.4 | %) |
| Horizon Europe-Africa | | 1,580 |
| | 1.9 | % | | (55,690 | ) | | (61.3 | )% | | 57,270 |
| | (102.8 | %) | | 57,880 |
| | (103.9 | %) | | 1,730 |
| | 2.1 | % | | (31,370 | ) | | (40.0 | )% | | 33,100 |
| | (105.5 | %) | | 33,200 |
| | (105.8 | %) |
| Horizon Asia-Pacific | | 4,400 |
| | 14.4 | % | | 4,670 |
| | 13.6 | % | | (270 | ) | | (5.8 | %) | | (160 | ) | | (3.4 | %) | |
Corporate(1) | | (8,420 | ) | | (3.8 | )% | | (15,690 | ) | | (6.7 | )% | | 7,270 |
| | (46.3 | %) | | N/A |
| | N/A |
| |
| Corporate | | | (12,260 | ) | | (6.9 | )% | | (5,800 | ) | | (3.0 | )% | | (6,460 | ) | | 111.4 | % | | N/A |
| | N/A |
|
| Total | | $ | 7,050 |
| | 3.2 | % | | $ | (64,140 | ) | | (27.5 | )% | | $ | 71,190 |
| | (111.0 | %) | | $ | 64,640 |
| | (10.2 | %) | | $ | (12,760 | ) | | (7.2 | )% | | $ | (29,900 | ) | | (15.4 | )% | | $ | 17,140 |
| | (57.3 | %) | | $ | 23,720 |
| | 22.0 | % |
Non-GAAP Financial Measures
The Company’s management utilizes Adjusted EBITDA as the key measure of company and segment performance and for planning and forecasting purposes, as management believes this measure is most reflective of the operational profitability or loss of the Company and its operating segments and provides management and investors with information to evaluate the operating performance of its business and is representative of its performance used to measure certain of its financial covenants, further discussed in the Liquidity and Capital Resources section below. Adjusted EBITDA should not be considered a substitute for results prepared in accordance with U.S. GAAP and should not be considered an alternative to net income attributable to Horizon Global, which is the most directly comparable financial measure to Adjusted EBITDA that is prepared in accordance with U.S. GAAP. Adjusted EBITDA, as determined and measured by Horizon Global, should also not be compared to similarly titled measures reported by other companies. The Company also uses operating income (loss) to measure stand alone segment performance.
Adjusted EBITDA is defined as net income attributable to Horizon Global before interest expense, income taxes, depreciation and amortization, and before certain items, as applicable, such as severance, restructuring, relocation and related business disruption costs, impairment of goodwill and other intangibles, non-cash stock compensation, certain product liability recall and litigation claims, acquisition and integration costs, gains (losses) on business divestitures and other assets, board transition support and non-cash unrealized remeasurement costs.
The following table summarizes Adjusted EBITDA for our operating segments for 3Q19:
|
| | | | | | | | | | | | | | | | |
| | | Three months ended
September 30, 2019 |
| | | Horizon Americas | | Horizon Europe-Africa | | Corporate | | Consolidated |
| | | (dollars in thousands) |
| Net income attributable to Horizon Global | | | | | | | | $ | 145,510 |
|
| Net loss attributable to noncontrolling interest | | | | | | | | (260 | ) |
| Net income | | | | | | | | 145,250 |
|
| Interest expense | | | | | | | | 24,120 |
|
| Income tax benefit | | | | | | | | (1,020 | ) |
| Depreciation and amortization | | | | | | | | 6,250 |
|
| EBITDA | | (940 | ) | | 1,380 |
| | 174,160 |
| | 174,600 |
|
| Net loss attributable to noncontrolling interest | | — |
| | 260 |
| | — |
| | 260 |
|
| Income from discontinued operations, net of tax | | — |
| | — |
| | (182,750 | ) | | (182,750 | ) |
| Severance | | — |
| | — |
| | 1,620 |
| | 1,620 |
|
| Restructuring, relocation and related business disruption costs | | (200 | ) | | — |
| | 4,250 |
| | 4,050 |
|
| Non-cash stock compensation | | — |
| | — |
| | 850 |
| | 850 |
|
| (Gain) loss on business divestitures and other assets | | 320 |
| | — |
| | (1,320 | ) | | (1,000 | ) |
| Product liability and litigation claims | | 820 |
| | (4,270 | ) | | — |
| | (3,450 | ) |
| Debt issuance costs | | — |
| | — |
| | 530 |
| | 530 |
|
| Unrealized remeasurement costs | | 240 |
| | 650 |
| | 300 |
| | 1,190 |
|
| Other (income) expense, net | | 310 |
| | 2,720 |
| | (1,980 | ) | | 1,050 |
|
| Adjusted EBITDA | | $ | 550 |
| | $ | 740 |
| | $ | (4,340 | ) | | $ | (3,050 | ) |
The following table summarizes Adjusted EBITDA for our operating segments for 3Q18:
|
| | | | | | | | | | | | | | | | |
| | | Three months ended
September 30, 2018 |
| | | Horizon Americas | | Horizon Europe-Africa | | Corporate | | Consolidated |
| | | (dollars in thousands) |
| Net loss attributable to Horizon Global | | | | | | | | $ | (32,760 | ) |
| Net loss attributable to noncontrolling interest | | | | | | | | (240 | ) |
| Net loss | | | | | | | | (33,000 | ) |
| Interest expense | | | | | | | | 7,590 |
|
| Income tax benefit | | | | | | | | (1,420 | ) |
| Depreciation and amortization | | | | | | | | 5,090 |
|
| EBITDA | | 8,030 |
| | (31,560 | ) | | 1,790 |
| | (21,740 | ) |
| Net loss attributable to noncontrolling interest | | — |
| | 230 |
| | — |
| | 230 |
|
| Income from discontinued operations, net of tax | | — |
| | — |
| | (4,110 | ) | | (4,110 | ) |
| Severance | | 660 |
| | — |
| | — |
| | 660 |
|
Restructuring, relocation and related business disruption costs
| | 4,220 |
| | 1,370 |
| | — |
| | 5,590 |
|
| Impairment of goodwill and other intangibles | | — |
| | 26,640 |
| | — |
| | 26,640 |
|
| Non-cash stock compensation | | — |
| | — |
| | 230 |
| | 230 |
|
| Acquisition and integration costs | | — |
| | 70 |
| | 1,130 |
| | 1,200 |
|
| (Gain) loss on business divestitures and other assets | | 650 |
| | — |
| | — |
| | 650 |
|
| Unrealized remeasurement costs | | 110 |
| | 530 |
| | (110 | ) | | 530 |
|
Other (income) expense, net
| | 570 |
| | 2,650 |
| | (3,290 | ) | | (70 | ) |
| Adjusted EBITDA | | $ | 14,240 |
| | $ | (70 | ) | | $ | (4,360 | ) | | $ | 9,810 |
|
Results of Operations Three Months Ended JuneSeptember 30, 2019 Compared to Three Months Ended JuneSeptember 30, 2018
Consolidated net sales decreased $10.2$16.2 million, or 4.4%8.3%, to $223.2$177.9 million in Q2 2019,3Q19, as compared with $233.3$194.0 million in Q2 2018.3Q18. As noted in the following segment results discussions, revenue decreased in Horizon Europe-Africa and Horizon Asia-Pacific compared to the prior-year period. The decrease in net sales was primarily attributable to a decrease in net sales in Horizon Americas of $7.2$19.3 million primarily attributable to lower shipping volumes in the aftermarket, retail and e-commerce sales channels, partially offset by an increase in net sales of $3.1 million in Horizon Europe-Africa and $3.9 million in Horizon Asia-Pacific were attributable to $5.3 million and $1.7 million of unfavorable currency translation in Horizon Europe-Africa and Horizon Asia-Pacific, respectively, reflecting the strengthening of the U.S. dollar against several currencies, primarily the Euro and Australian dollar.Europe-Africa. After adjusting for currency translation impacts, Horizon Europe-Africa and Horizon Asia-Pacificnet sales were downup $7.0 million primarily attributable to lowerhigher volumes in the automotive OEM and aftermarket sales channels, partially offset by higher volumes in E-commerce and automotive OEM sales channels in Horizon Americas and automotive OES sales volumes in Horizon Europe-Africa.channels.
Gross profit margin (gross profit as a percentage of net sales) was 19.7%15.9% and 20.4%17.8% for Q2 20193Q19 and Q2 2018,3Q18, respectively. As noted in the following segment results discussions, negativelyNegatively impacting gross profit margin were lower gross profitunfavorable costs and operating inefficiencies in all segments,Horizon Americas, driven by tariff costs and the timing and inability to fully recover operating input cost increases through customer pricing actions, partially offset by favorable margins in Europe-Africa primarily driven by favorable currency translation between the U.S. dollar and euro.
Selling, general and administrative (“SG&A”) expenses increased $3.4 million primarily attributable to $5.3 million of lease abandonment and leasehold improvement charges related to unfavorable inputthe Company’s departure from its headquarters lease, partially offset by back office and support costs driven by increased commoditysavings in Horizon Americas and freight costs and tariffs, as wellHorizon Europe-Africa as a shift in revenue mix from higher margin retailresult of prior year restructuring and aftermarket sales to lower margin OEM sales.business rationalization projects.
Operating margin (operating profit (loss) as a percentage of net sales) was 3.2%(7.2)% and (27.5)(15.4)% in Q2 20193Q19 and Q2 2018,3Q18, respectively. Operating loss improved by $71.2$17.1 million to an operating profitloss of $7.1$12.8 million in Q2 2019,3Q19, from an operating loss of $64.1$29.9 million in Q2 2018,3Q18, primarily attributable to a prior-year period goodwill impairment charge of approximately $55.7$26.6 million in Horizon Europe-Africa. In addition, selling, generalEurope-Africa, offset by lower net sales and administrative (“SG&A”) expenses decreased $18.7 million due to realized savings from prior-year restructuring and business rationalization projects.gross profit.
Other income (expense),expense, net increased $7.0$0.6 million to $0.4$1.6 million in Q2 2019,3Q19, as compared to $(6.6)$1.0 million in 2018,3Q18 primarily attributable to financing costs$0.7 million of additional foreign currency loss in connection with the pursuit of the Brink Group acquisition, which was expected to close in Q2 2018; however, the parties to the acquisition agreement mutually agreed to terminate the transaction.3Q19.
Interest expense increased $9.2$16.5 million to $15.4$24.1 million in Q2 2019,3Q19, compared to $6.2$7.6 million in Q2 2018.3Q18. Interest expense increased because of $50.0 million of additional borrowings on our term loanthe First Lien Term Loan (as defined below) in July 2018 and $51.0 million of additional borrowings on a second term loanthe Second Lien Term Loan (as defined below) in March 2019, which resulted in higher borrowings as well as an increase in LIBOR, which impacts the Company’s floating rate indebtedness.higher interest rates compared to 3Q18. In addition, as a result of our Q2 2019 term loan debt amendment, the Company recorded a $0.5$5.2 million chargeof unamortized debt issuance costs due to interest expense related to the expensing of prior capitalizedits debt fees.refinancing and modifications.
The effective income tax rate for Q2 2019continuing operations for 3Q19 and 20183Q18 was (2.0)%2.6% and 12.7%3.7%, respectively. The lower effective income tax rate in Q2 20193Q19 is driven byprimarily attributable to a decrease in tax benefits related to the year-end 2018 recognition of certain jurisdictional valuation allowances including the U.S., offset by certain aspects of U.S. tax reform, resulting in estimateda decreased 2019 tax expense.benefit.
Net loss attributablefrom continuing operations decreased by $0.4 million to Horizon Global was $8.1 million in Q2 2019, an improvement of $58.9 million, from a net loss of $66.9$37.5 million in Q2 2018. The decrease in3Q19, compared to a net loss from continuing operations of $37.1 million in 3Q18 related to the operating results discussed above.
Income from discontinued operations, net of tax is primarily attributable to the $180.5 million gain that was recognized when the Company completed the sale of APAC during 3Q19. As a result, APAC has been presented as discontinued operations in our condensed consolidated financial statements in accordance with FASB ASC No. 205, Discontinued Operations. See Note 3, “Discontinued operations,” included in Part I, Item 1, “Notes to Condensed Consolidated Financial Statements,” within this quarterly report on Form 10-Q for further description of a $71.2 million decrease in operating loss, partially offset by higher interest expense.the Company’s discontinued operations.
See below for a discussion of operating results by segment.
Horizon Americas.Americas
Net sales by sales channel, in thousands, for Horizon Americas during Q2 20193Q19 and Q2 20183Q18 are as follows:
| | | | | Three months ended June 30, | | Change | | Three months ended September 30, | | Change |
| | | 2019 | | 2018 | | $ | | % | | 2019 | | 2018 | | $ | | % |
| Net Sales | | | | | | | | | | | | | | | | |
| Automotive OEM | | $ | 23,670 |
| | $ | 19,950 |
| | $ | 3,720 |
| | 18.6 | % | | $ | 21,050 |
| | $ | 20,320 |
| | $ | 730 |
| | 3.6 | % |
| Automotive OES | | 1,810 |
| | 1,660 |
| | 150 |
| | 9.0 | % | | 1,960 |
| | 1,700 |
| | 260 |
| | 15.3 | % |
| Aftermarket | | 28,850 |
| | 31,710 |
| | (2,860 | ) | | (9.0 | )% | | 26,920 |
| | 38,470 |
| | (11,550 | ) | | (30.0 | )% |
| Retail | | 33,180 |
| | 34,580 |
| | (1,400 | ) | | (4.0 | )% | | 26,600 |
| | 29,600 |
| | (3,000 | ) | | (10.1 | )% |
| Industrial | | 6,930 |
| | 10,300 |
| | (3,370 | ) | | (32.7 | )% | | 7,650 |
| | 11,160 |
| | (3,510 | ) | | (31.5 | )% |
| E-commerce | | 14,480 |
| | 9,570 |
| | 4,910 |
| | 51.3 | % | | 12,040 |
| | 13,750 |
| | (1,710 | ) | | (12.4 | )% |
| Other | | — |
| | 310 |
| | (310 | ) | | N/A |
| | — |
| | 510 |
| | (510 | ) | | N/A |
|
| Total | | $ | 108,920 |
| | $ | 108,080 |
| | $ | 840 |
| | 0.8 | % | | $ | 96,220 |
| | $ | 115,510 |
| | $ | (19,290 | ) | | (16.7 | )% |
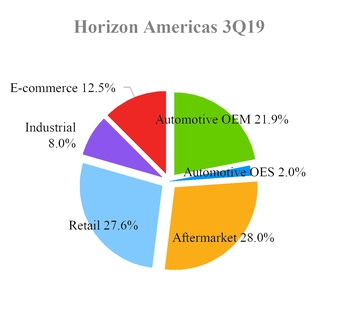
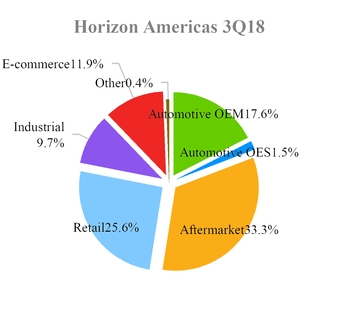
Net sales increased 0.8%decreased $19.3 million to $96.2 million in Q2 2019,3Q19, as compared to Q2 2018. Net sales$115.5 million in the retail and aftermarket channels decreased 4.0% and 9.0%, respectively,3Q18, primarily attributable to a $20.7 million decrease due to lower shippingsales volumes in these channels attributable to afrom softening in demand atprimarily in the start of the U.S. selling season, whichaftermarket, retail and industrial channels, and a $2.4 million increase in sales returns and allowances. The net sales decrease was partially offset by a 51.3% increase$4.3 million in E-commerce sales as a result of improved fill rates. In total, net sales increased as a result of $4.0 million of 2019 pricing increases. The price increases, which were implemented to offsetrecover increased steelmaterial and other materialinput costs and offset higher import tariffs, which took effect during 2018. The pricing increases2018 and were offset by $1.6 million of lower sales volumes and $1.1 million of increased sales returns and allowances.during 2019.
Horizon Americas’ gross profit remained consistent at $26.9decreased by $10.5 million or 24.7% of net sales,to $17.3 million in Q2 2019,3Q19 compared with $26.9to $27.8 million or 24.9% of net sales,3Q18. The decrease in Q2 2018. The consistent gross profit margin reflects the changes in sales detailed above. In addition,Additionally, gross profit was impacted by the following:
| |
| – | $3.83.3 million unfavorable material input costs primarily related to higher freight and tariff costs |
| |
| – | $3.0 million unfavorable manufacturing variances and absorption;costs; and |
| |
| – | $3.23.0 million unfavorable inputhigher scrap costs primarily related to higher commodity, freight and tariff costs;inventory reserves; partially offset by |
| |
| – | $4.02.7 million favorable current year pricing increases;of prior-year comparable period restructuring and footprint rationalization projects and related cost inefficiencies that did not reoccur; and |
| |
| – | $3.62.4 million of additionalin lower outbound freight costs incurred in the prior-year period related to restructuring and footprint rationalization projects primarily related to the distribution center move to Kansas City. |
SG&A expenses decreased $6.8$1.0 million to $17.5$19.5 million, or 16.0%20.3% of net sales, in Q2 2019,3Q19, as compared to $24.3$20.5 million, or 22.5%17.7% of net sales, in Q2 2018.3Q18. The decrease in SG&A expenses was attributable to the following:
| |
| – | $1.83.5 million benefit related to synergies and cost savings from prior yearin prior-year comparable period organizational restructuring efforts;efforts and costs that did not reoccur, partially offset by |
| |
| – | $4.51.6 million of additional costs incurred in the prior year related to restructuringprofessional fees and footprint rationalization projects primarily related to the distribution center move to Kansas City;litigation claims; and |
| |
| – | $0.70.8 million reduction in advertising and marketing expenses.increased allowance for doubtful accounts |
Horizon Americas’ had an operating profit increased $6.9 million to $9.5loss of $2.2 million, or 8.7%(2.3)% of net sales, in Q2 2019,3Q19, which decreased $9.5 million compared to an operating profit of $2.6$7.3 million, or 2.4%6.3% of net sales, in Q2 2018.3Q18. Operating profit and operating margin increaseddecreased primarily due to the cost savings realized from the impacts of prior-year period business reorganization projectsdecreased net sales and ongoing operational improvement projects.additional operating costs discussed above.
Horizon Europe-Africa.Europe-Africa
Net sales by sales channel, in thousands, for Horizon Europe-Africa during Q2 20193Q19 and Q2 20183Q18 are as follows:
| | | | | Three months ended June 30, | | Change | | Three months ended September 30, | | Change |
| | | 2019 | | 2018 | | $ | | % | | 2019 | | 2018 | | $ | | % |
| Net Sales | | | | | | | | | | | | | | | | |
| Automotive OEM | | $ | 45,910 |
| | $ | 47,360 |
| | $ | (1,450 | ) | | (3.1 | )% | | $ | 43,200 |
| | $ | 40,650 |
| | $ | 2,550 |
| | 6.3 | % |
| Automotive OES | | 16,030 |
| | 12,890 |
| | 3,140 |
| | 24.4 | % | | 16,510 |
| | 12,600 |
| | 3,910 |
| | 31.0 | % |
| Aftermarket | | 20,080 |
| | 24,410 |
| | (4,330 | ) | | (17.7 | )% | | 19,840 |
| | 19,980 |
| | (140 | ) | | (0.7 | )% |
| Industrial | | 860 |
| | — |
| | 860 |
| | N/A |
| | 780 |
| | — |
| | 780 |
| �� | N/A |
|
| E-commerce | | 580 |
| | 1,270 |
| | (690 | ) | | (54.3 | )% | | 560 |
| | 1,290 |
| | (730 | ) | | (56.6 | )% |
| Other | | 210 |
| | 4,910 |
| | (4,700 | ) | | (95.7 | )% | | 740 |
| | 4,000 |
| | (3,260 | ) | | (81.5 | )% |
| Total | | $ | 83,670 |
| | $ | 90,840 |
| | $ | (7,170 | ) | | (7.9 | )% | | $ | 81,630 |
| | $ | 78,520 |
| | $ | 3,110 |
| | 4.0 | % |
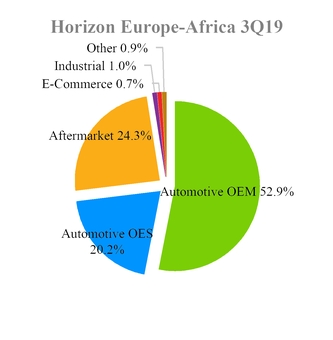
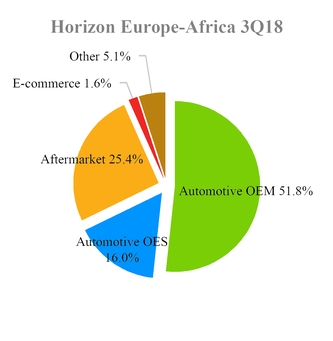
Net sales decreasedincreased by $7.2$3.1 million, or 7.9%4.0%, to $83.7$81.6 million in Q2 2019,3Q19 compared to $90.8$78.5 million in Q2 2018.3Q18. Net sales were impacted by $5.3$3.9 million of unfavorable foreign currency translation, primarily driven by the weakening of the euro in relation to the U.S. dollar. After adjusting for currency translation impacts, Horizon Europe-Africa net sales were down $1.9 millionup $7.0 million. The increase is primarily related to a $1.5higher sales volumes in the Automotive OEM and Automotive OES channels, partially offset by $3.1 million decrease related to the Company’s divestiture of aits non-automotive business during Q1 2019 and lower sales volumes in the aftermarket channel, partially offset by $1.6 millionfirst quarter of 2019 pricing increases.2019.
Horizon Europe-Africa’s gross profit decreasedincreased by $2.8 million to $9.4$4.3 million, or 11.2%63.3%, to $11.0 million, or 13.5% of net sales, in Q2 2019, from $12.23Q19, compared to $6.8 million, or 13.4%8.6% of net sales, in Q2 2018.3Q18. The decreaseincrease in gross profit margin reflects the changes in sales detailed above. In addition, gross profit was impacted by the following:
| |
| – | $0.74.3 million unfavorable input costs primarilyfavorable expense recovery related to higher commodity costs; |
| |
– | $0.6 million increase in personnel costs due to warranty claim work during Q2 2019; |
| |
– | $0.8 million unfavorable currency exchange due to the weakeningsettlement of the euro in relation to the U.S. dollar; and |
| |
– | unfavorablepotential product mix favoring the lower margin percentage yieldingliability claims (see Note 13, “Contingencies”) with one OEM channel.customer |
SG&A expenses decreased by $4.2$2.0 million to $7.8$9.3 million, or 9.3%11.4% of net sales, in Q2 2019,3Q19, as compared to $12.0$11.4 million, or 13.2%14.5% of net sales, in Q2 2018.3Q18. The decreaseincrease in SG&A expenses was primarily attributable to the following:
| |
| – | $1.41.3 million of additional costs incurred in the prior-year period related to restructuring and footprint rationalization projects primarily related to the shift in production to our Braşov, Romania production facility;that did not reoccur; and |
| |
| – | $0.50.7 million reduction in intangible amortization due to the write-off of customer relationships in connection with the sale of certain non-automotive business assets;personnel and |
| |
– | $1.0 million decrease in legal, sales and marketing and other professional fees. compensation costs |
Horizon Europe-Africa’s operating loss decreasedprofit (loss) increased by $57.3$33.1 million to an operating profit of $1.6$1.7 million, or 1.9%2.1% of net sales, in Q2 2019,3Q19, as compared to an operating loss of $55.7$31.4 million, or (61.3)(40.0)% of net sales, in Q2 2018,3Q18, partially as a result of the operating performance discussed above. In addition, operating loss was impacted by the following:a $26.6 million goodwill impairment charge recorded in 3Q18.
| |
– | $55.7 million goodwill impairment charge recorded in Q2 2018; and |
| |
– | $0.6 million unfavorable currency exchange due to the weakening of the euro in relation to the U.S. dollar. |
Horizon Asia-Pacific.
Net sales by sales channel, in thousands, for Horizon Asia-Pacific during Q2 2019 and Q2 2018 are as follows:
|
| | | | | | | | | | | | | | | |
| | | Three months ended June 30, | | Change |
| | | 2019 | | 2018 | | $ | | % |
| Net Sales | | | | | | | | |
| Automotive OEM | | $ | 5,610 |
| | $ | 6,120 |
| | $ | (510 | ) | | (8.3 | )% |
| Automotive OES | | 14,380 |
| | 16,260 |
| | (1,880 | ) | | (11.6 | )% |
| Aftermarket | | 5,150 |
| | 6,300 |
| | (1,150 | ) | | (18.3 | )% |
| Retail | | 2,150 |
| | 2,080 |
| | 70 |
| | 3.4 | % |
| Industrial | | 3,280 |
| | 3,660 |
| | (380 | ) | | (10.4 | )% |
| Total | | $ | 30,570 |
| | $ | 34,420 |
| | $ | (3,850 | ) | | (11.2 | )% |
Net sales decreased by $3.9 million, or 11.2%, to $30.6 million in Q2 2019, compared to $34.4 million in Q2 2018. The decrease is primarily due to unfavorable foreign currency translation of $1.7 million primarily related to the weakening of the Australian dollar in relation to the U.S. dollar. The decrease is also due to $2.4 million of lower sales volumes in the New Zealand automotive OES and aftermarket sales channels.
Horizon Asia-Pacific’s gross profit decreased by $0.7 million to $7.8 million, or 25.4% of net sales, in Q2 2019, from $8.5 million, or 24.5% of net sales, in Q2 2018. The decrease in gross profit margin reflects a $1.0 million decrease from sales volume detailed above. In addition, gross profit was impacted by the following:
| |
– | $0.3 million unfavorable currency exchange due to the weakening of the Australian dollar in relation to the U.S. dollar, partially offset by |
| |
– | $0.2 million favorable 2019 pricing increases. |
SG&A decreased by $0.5 million to $3.3 million, or 10.9% of net sales, in Q2 2019, as compared to $3.8 million, or 11.0% of net sales, in Q2 2018. The decrease in SG&A expenses was primarily attributable to $0.2 million unfavorable currency exchange due to the weakening of the Australian dollar in relation to the U.S. dollar and $0.3 million of lower sales and marketing and incentive compensation costs.
Horizon Asia-Pacific’s operating profit decreased by $0.3 million to $4.4 million, or 14.4% of net sales, in Q2 2019, as compared to $4.7 million, or 13.6% of net sales in Q2 2018. The decrease is primarily related to the decline in sales volumes, partially offset by SG&A decrease detailed above.
Corporate Expenses.Expenses Corporate expenses included in operating loss decreased $7.3increased $6.5 million to $8.4$12.3 million in Q2 2019,3Q19, as compared to $15.7$5.8 million expense in Q2 2018,3Q18, primarily attributable to $8.9$5.3 million of costs in connection with the termination of the Brink Group acquisition in the prior year, partially offset by an additional $2.1 million in additional professional services expenselease abandonment and leasehold improvement charges related to the Company new debt issuance and amendments entered into duringCompany’s departure from its headquarters lease, coupled with $1.6 million of severance costs related to the first quarter of 2019.separation agreement reached with our former chief executive officer.
The following table summarizes financial information for our operating segments for the sixnine months ended JuneSeptember 30, 2019 (“Q2 20193Q19 YTD”) and 2018 (“Q2 2018nine months ended September 2018(“3Q18 YTD”):
| | | | | Six months ended June 30, | | Change | | Constant Currency Change | | Nine months ended September 30, | | Change | | Constant Currency Change |
| | | 2019 | | As a Percentage
of Net Sales | | 2018 | | As a Percentage
of Net Sales | | $ | | % | | $ | | % | | 2019 | | As a Percentage
of Net Sales | | 2018 | | As a Percentage
of Net Sales | | $ | | % | | $ | | % |
| | | (dollars in thousands) | | | | | | (dollars in thousands) | | | | |
| Net Sales | | | | | | | | | | | | | | | | | | | | | | | | | | | | | | | | |
| Horizon Americas | | $ | 204,420 |
| | 47.2 | % | | $ | 204,300 |
| | 45.4 | % | | $ | 120 |
| | 0.1 | % | | $ | 620 |
| | 0.3 | % | | $ | 300,670 |
| | 54.8 | % | | $ | 319,820 |
| | 55.5 | % | | $ | (19,150 | ) | | (6.0 | )% | | $ | (18,670 | ) | | (5.8 | )% |
| Horizon Europe-Africa | | 165,840 |
| | 38.3 | % | | 177,900 |
| | 39.5 | % | | (12,060 | ) | | (6.8 | )% | | 460 |
| | 0.3 | % | | 247,500 |
| | 45.2 | % | | 256,430 |
| | 44.5 | % | | (8,930 | ) | | (3.5 | )% | | 7,440 |
| | 2.9 | % |
| Horizon Asia-Pacific | | 62,560 |
| | 14.5 | % | | 67,950 |
| | 15.1 | % | | (5,390 | ) | | (7.9 | )% | | (1,160 | ) | | (1.7 | )% | |
| Total | | $ | 432,820 |
| | 100.0 | % | | $ | 450,150 |
| | 100.0 | % | | $ | (17,330 | ) | | (3.8 | )% | | $ | (80 | ) | | — | % | | $ | 548,170 |
| | 100.0 | % | | $ | 576,250 |
| | 100.0 | % | | $ | (28,080 | ) | | (4.9 | )% | | $ | (11,230 | ) | | (1.9 | )% |
| Gross Profit | | | | | | | | | | | | | | | | | | | | | | | | | | | | | | | | |
| Horizon Americas | | $ | 44,800 |
| | 21.9 | % | | $ | 45,970 |
| | 22.5 | % | | $ | (1,170 | ) | | (2.5 | )% | | $ | (1,030 | ) | | (2.2 | )% | | $ | 62,080 |
| | 20.6 | % | | $ | 73,750 |
| | 23.1 | % | | $ | (11,670 | ) | | (15.8 | )% | | $ | (11,480 | ) | | (15.6 | )% |
| Horizon Europe-Africa | | 15,060 |
| | 9.1 | % | | 23,630 |
| | 13.3 | % | | (8,570 | ) | | (36.3 | )% | | (7,350 | ) | | (31.1 | )% | | 26,080 |
| | 10.5 | % | | 30,380 |
| | 11.8 | % | | (4,300 | ) | | (14.2 | )% | | (2,730 | ) | | (9.0 | )% |
| Horizon Asia-Pacific | | 16,270 |
| | 26.0 | % | | 16,420 |
| | 24.2 | % | | (150 | ) | | (0.9 | )% | | 720 |
| | 4.4 | % | |
| Total | | $ | 76,130 |
| | 17.6 | % | | $ | 86,020 |
| | 19.1 | % | | $ | (9,890 | ) | | (11.5 | )% | | $ | (7,660 | ) | | (8.9 | )% | | $ | 88,160 |
| | 16.1 | % | | $ | 104,130 |
| | 18.1 | % | | $ | (15,970 | ) | | (15.3 | )% | | $ | (14,210 | ) | | (13.6 | )% |
| Selling, General and Administrative Expenses | | | | | | | | | | | | | | | | | | | | | | | | | | | | | | | | |
| Horizon Americas | | $ | 36,860 |
| | 18.0 | % | | $ | 48,270 |
| | 23.6 | % | | $ | (11,410 | ) | | (23.6 | )% | | $ | (11,280 | ) | | (23.4 | )% | | $ | 56,360 |
| | 18.7 | % | | $ | 68,730 |
| | 21.5 | % | | $ | (12,370 | ) | | (18.0 | )% | | $ | (12,210 | ) | | (17.8 | )% |
| Horizon Europe-Africa | | 18,080 |
| | 10.9 | % | | 25,110 |
| | 14.1 | % | | (7,030 | ) | | (28.0 | )% | | (6,010 | ) | | (23.9 | )% | | 27,410 |
| | 11.1 | % | | 36,480 |
| | 14.2 | % | | (9,070 | ) | | (24.9 | )% | | (7,190 | ) | | (19.7 | )% |
| Horizon Asia-Pacific | | 6,500 |
| | 10.4 | % | | 7,390 |
| | 10.9 | % | | (890 | ) | | (12.0 | )% | | (420 | ) | | (5.7 | )% | |
Corporate(1) | | 17,100 |
| | 4.0 | % | | 23,150 |
| | 5.1 | % | | (6,050 | ) | | (26.1 | )% | | N/A |
| | N/A |
| |
| Corporate | | | 29,370 |
| | 5.4 | % | | 29,000 |
| | 5.0 | % | | 370 |
| | 1.3 | % | | N/A |
| | N/A |
|
| Total | | $ | 78,540 |
| | 18.1 | % | | $ | 103,920 |
| | 23.1 | % | | $ | (25,380 | ) | | (24.4 | )% | | $ | (17,710 | ) | | (7.4 | )% | | $ | 113,140 |
| | 20.6 | % | | $ | 134,210 |
| | 23.3 | % | | $ | (21,070 | ) | | (15.7 | )% | | $ | (19,400 | ) | | (1.2 | )% |
| Operating Profit (Loss) | | | | | | | | | | | | | | | | | | | | | | | | | | | | | | | | |
| Horizon Americas | | $ | 7,990 |
| | 3.9 | % | | $ | (2,540 | ) | | (1.2 | %) | | $ | 10,530 |
| | (414.6 | )% | | $ | 10,530 |
| | (414.6 | )% | | $ | 5,760 |
| | 1.9 | % | | $ | 4,730 |
| | 1.5 | % | | $ | 1,030 |
| | 21.8 | % | | $ | 1,060 |
| | 22.4 | % |
| Horizon Europe-Africa | | (1,610 | ) | | (1.0 | )% | | (100,780 | ) | | (56.6 | %) | | 99,170 |
| | (98.4 | )% | | 99,460 |
| | (98.7 | )% | | 120 |
| | — | % | | (132,150 | ) | | (51.5 | %) | | 132,270 |
| | (100.1 | )% | | 132,060 |
| | (99.9 | )% |
| Horizon Asia-Pacific | | 9,780 |
| | 15.6 | % | | 9,060 |
| | 13.3 | % | | 720 |
| | 7.9 | % | | 1,100 |
| | 12.1 | % | |
Corporate(1) | | (17,100 | ) | | (4.0 | )% | | (23,150 | ) | | (5.1 | %) | | 6,050 |
| | (26.1 | )% | | N/A |
| | N/A |
| |
| Corporate | | | (29,360 | ) | | (5.4 | )% | | (28,950 | ) | | (5.0 | %) | | (410 | ) | | 1.4 | % | | N/A |
| | N/A |
|
| Total | | $ | (940 | ) | | (0.2 | )% | | $ | (117,410 | ) | | (26.1 | %) | | $ | 116,470 |
| | (99.2 | )% | | $ | 111,090 |
| | (4.6 | )% | | $ | (23,480 | ) | | (4.3 | )% | | $ | (156,370 | ) | | (27.1 | %) | | $ | 132,890 |
| | (85.0 | )% | | $ | 133,120 |
| | 0.1 | % |
(1) Corporate calculated as a percentage of total net sales.
The following table summarizes Adjusted EBITDA for our operating segments for 3Q19 YTD:
|
| | | | | | | | | | | | | | | | |
| | | Nine months ended
September 30, 2019 |
| | | Horizon Americas | | Horizon Europe-Africa | | Corporate | | Consolidated |
| | | (dollars in thousands) |
| Net income attributable to Horizon Global | | | | | | | | $ | 112,330 |
|
| Net loss attributable to noncontrolling interest | | | | | | | | (840 | ) |
| Net income | | | | | | | | 111,490 |
|
| Interest expense | | | | | | | | 50,270 |
|
| Income tax benefit | | | | | | | | (2,330 | ) |
| Depreciation and amortization | | | | | | | | 16,790 |
|
| EBITDA | | 10,100 |
| | (3,770 | ) | | 169,890 |
| | 176,220 |
|
| Net loss attributable to noncontrolling interest | | — |
| | 840 |
| | — |
| | 840 |
|
| Income from discontinued operations, net of tax | | — |
| | — |
| | (189,520 | ) | | (189,520 | ) |
| Severance | | (200 | ) | | 10 |
| | 1,620 |
| | 1,430 |
|
Restructuring, relocation and related business disruption costs
| | 1,110 |
| | (1,410 | ) | | 4,250 |
| | 3,950 |
|
| Non-cash stock compensation | | — |
| | — |
| | 1,820 |
| | 1,820 |
|
| (Gain) loss on business divestitures and other assets | | 1,280 |
| | 3,630 |
| | — |
| | 4,910 |
|
| Board transition support | | — |
| | — |
| | 1,450 |
| | 1,450 |
|
| Product liability and litigation claims | | 820 |
| | 50 |
| | — |
| | 870 |
|
| Debt issuance costs | | — |
| | — |
| | 2,660 |
| | 2,660 |
|
| Unrealized remeasurement costs | | 160 |
| | 1,210 |
| | 440 |
| | 1,810 |
|
Other (income) expense, net
| | 730 |
| | 8,140 |
| | (7,120 | ) | | 1,750 |
|
| Adjusted EBITDA | | $ | 14,000 |
| | $ | 8,700 |
| | $ | (14,510 | ) | | $ | 8,190 |
|
The following table summarizes Adjusted EBITDA for our operating segments for 3Q18 YTD:
|
| | | | | | | | | | | | | | | | |
| | | Nine months ended
September 30, 2018 |
| | | Horizon Americas | | Horizon Europe-Africa | | Corporate | | Consolidated |
| | | (dollars in thousands) |
| Net loss attributable to Horizon Global | | | | | | | | $ | (157,200 | ) |
| Net loss attributable to noncontrolling interest | | | | | | | | (720 | ) |
| Net loss | | | | | | | | (157,920 | ) |
| Interest expense | | | | | | | | 19,580 |
|
| Income tax benefit | | | | | | | | (15,770 | ) |
| Depreciation and amortization | | | | | | | | 15,070 |
|
| EBITDA | | 7,260 |
| | (132,630 | ) | | (13,670 | ) | | (139,040 | ) |
| Net loss attributable to noncontrolling interest | | — |
| | 720 |
| | — |
| | 720 |
|
| Income from discontinued operations, net of tax | | — |
| | — |
| | (9,670 | ) | | (9,670 | ) |
| Severance | | 5,010 |
| | 1,560 |
| | 2,750 |
| | 9,320 |
|
Restructuring, relocation and related business disruption costs
| | 11,830 |
| | 2,820 |
| | — |
| | 14,650 |
|
| Impairment of goodwill and other intangibles | | — |
| | 125,770 |
| | — |
| | 125,770 |
|
| Non-cash stock compensation | | — |
| | — |
| | 1,440 |
| | 1,440 |
|
| Acquisition and integration costs | | — |
| | 1,390 |
| | 16,130 |
| | 17,520 |
|
| (Gain) loss on business divestitures and other assets | | 1,490 |
| | — |
| | — |
| | 1,490 |
|
| Unrealized remeasurement costs | | 110 |
| | 750 |
| | 200 |
| | 1,060 |
|
Other (income) expense, net
| | 2,160 |
| | 8,310 |
| | (10,710 | ) | | (240 | ) |
| Adjusted EBITDA | | $ | 27,860 |
| | $ | 8,690 |
| | $ | (13,530 | ) | | $ | 23,020 |
|
Results of Operations SixNine Months Ended JuneSeptember 30, 2019 Compared with SixNine Months Ended JuneSeptember 30, 2018
Overall, net sales decreased $17.3$28.1 million, or 3.8%4.9%, to $432.8$548.2 million for Q2 20193Q19 YTD, as compared with $450.2$576.3 million in Q2 2018 YTD, primarily driven by a3Q18 YTD. As noted in the following segment results discussions, the decrease in net sales was primarily attributable to a decrease in ourHorizon Americas and Horizon Europe-Africa and Horizon Asia-Pacific operating segments due to unfavorable currency exchange of $12.5$19.2 million and $4.2$8.9 million, respectively.
Gross profit margin (gross profit as a percentage of sales) approximated 17.6%16.1% and 19.1%18.1% for Q2 20193Q19 YTD and Q2 20183Q18 YTD, respectively. Negatively impacting gross profit margin were unfavorable input costs driven by increased commoditytariff costs and tariffsthe timing and inability to fully recover operating input cost increases through customer pricing actions in both our Horizon Americas and Horizonunfavorable net sales and cost mix in Europe-Africa, operating segments.primarily driven by unfavorable currency translation in 3Q19 YTD compared to 3Q18 YTD.
Operating margin (operating loss as a percentage of sales) approximated (0.2)(4.3)% and (26.1)(27.1)% for Q2 20193Q19 YTD and Q2 20183Q18 YTD, respectively. Operating loss decreased $116.5$132.9 million to an operating loss of $0.9$23.5 million for Q2 20193Q19 YTD, compared to an operating loss of $117.4$156.4 million for Q2 20183Q18 YTD, primarily due to the impairment of goodwill and intangible assets totaling approximately $99.1$125.8 million in our Horizon Europe-Africa operating segment in the prior-year period.3Q18 YTD. In addition, higher commodity costs in Horizon Americas and Horizon Europe-Africa operating segments negatively impacted operating profit.
SG&A expenses decreased $21.1 million primarily due to realized savings from prior-year restructuring and business rationalization projects.
Other income (expense), net decreased $2.5$0.8 million to $5.2$6.6 million for Q2 20193Q19 YTD compared to $7.7$7.4 million for Q2 20183Q18 YTD, primarily due to prior-year period costs in connection with the termination of the Brink Group acquisition. Partiallyacquisition of $5.1 million, partially offset by a $3.6 million loss on sale related to the Company’s divestiture of non-automotive business assets in Europe-Africa in the first quarter of 2019.
Interest expense increased $14.2$30.7 million, to $26.4$50.3 million, for Q2 20193Q19 YTD, as compared to $12.1$19.6 million for Q2 20183Q18 YTD. Interest expense increased because of $50.0 million of additional borrowings on our term loanthe First Lien Term Loan in July 2018 and $51.0 million of additional borrowings on a second term loanthe Second Lien Term Loan in March 2019, which resulted in higher borrowings as well as an increase in LIBOR, which impactshigher interest rates compared to 3Q18 YTD. In addition, the Company’s floating rate indebtedness.Company recorded $8.7 million of unamortized debt issuance costs due to its debt refinancing and modifications.
The effective income tax rate for Q2 20193Q19 YTD and Q2 20183Q18 YTD was (3.8)%2.9% and 9.0%8.6%, respectively. The lower effective income tax rate for Q2 20193Q19 YTD is driven by awas primarily attributable to an decrease in tax benefits related to the year-end 2018 recognition of certain jurisdictional valuation allowances including the U.S., offset by certain aspects of U.S. tax reform, resulting in estimateda decreased 2019 tax expense.benefit.
Net loss from continuing operations decreased by $91.2$89.6 million, to a net loss of $33.8$78.0 million for Q2 20193Q19 YTD, compared to a net loss of $124.9$167.6 million for Q2 20183Q18 YTD. The decrease is attributable to a $116.5$132.9 million decrease in operating loss, primarily driven by the impairment of goodwill and intangible assets in 3Q18 YTD.
Income from discontinued operations, net of tax is primarily attributable to the prior-year period.$180.5 million gain that was recognized when the Company completed the sale of its Horizon Asia-Pacific operating segment (“APAC”) during 3Q 2019. As a result, APAC has been presented as discontinued operations in our condensed consolidated financial statements in accordance with FASB ASC No. 205, Discontinued Operations. See Note 3, “Discontinued operations,” included in Part I, Item 1, “Notes to Condensed Consolidated Financial Statements,” within this quarterly report on Form 10-Q for further description of the Company’s discontinued operations.
See below for a discussion of operating results by segment.
Horizon Americas.Americas
Net sales by sales channel, in thousands, for Horizon Americas during Q2 20193Q19 YTD and Q2 20183Q18 YTD are as follows:
| | | | | Six months ended June 30, | | Change | | Nine months ended September 30, | | Change |
| | | 2019 | | 2018 | | $ | | % | | 2019 | | 2018 | | $ | | % |
| Net Sales | | | | | | | | | | | | | | | | |
| Automotive OEM | | $ | 43,910 |
| | $ | 40,000 |
| | $ | 3,910 |
| | 9.8 | % | | $ | 64,970 |
| | $ | 60,320 |
| | $ | 4,650 |
| | 7.7 | % |
| Automotive OES | | 3,420 |
| | 2,530 |
| | 890 |
| | 35.2 | % | | 5,380 |
| | 4,230 |
| | 1,150 |
| | 27.2 | % |
| Aftermarket | | 53,000 |
| | 58,230 |
| | (5,230 | ) | | (9.0 | )% | | 79,910 |
| | 96,700 |
| | (16,790 | ) | | (17.4 | )% |
| Retail | | 61,620 |
| | 66,730 |
| | (5,110 | ) | | (7.7 | )% | | 88,230 |
| | 96,330 |
| | (8,100 | ) | | (8.4 | )% |
| Industrial | | 16,210 |
| | 20,520 |
| | (4,310 | ) | | (21.0 | )% | | 23,860 |
| | 31,680 |
| | (7,820 | ) | | (24.7 | )% |
| E-commerce | | 26,260 |
| | 15,590 |
| | 10,670 |
| | 68.4 | % | | 38,300 |
| | 29,340 |
| | 8,960 |
| | 30.5 | % |
| Other | | — |
| | 700 |
| | (700 | ) | | N/A |
| | 20 |
| | 1,220 |
| | (1,200 | ) | | N/A |
|
| Total | | $ | 204,420 |
| | $ | 204,300 |
| | $ | 120 |
| | 0.1 | % | | $ | 300,670 |
| | $ | 319,820 |
| | $ | (19,150 | ) | | (6.0 | )% |
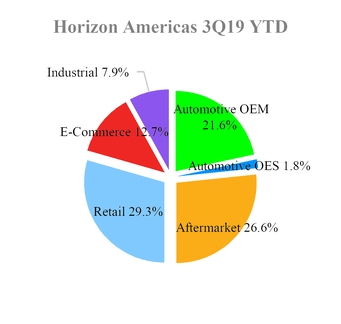
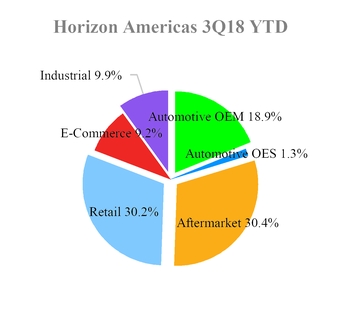
Net sales increased $0.1decreased $19.1 million or 0.1%, to $204.4$300.7 million in Q2 20193Q19 YTD, as compared to $204.3$319.8 million in Q2 2018 YTD. Net3Q18 YTD, primarily attributable to a $24.5 million decrease due to lower sales volumes from softening in demand primarily in the aftermarket, retail aftermarket and industrial channels, decreased 7.7%, 9.0% and 21.0%, respectively, due to lower shipping volumes attributable to a softening in demand at the start of the U.S. selling season, which waspartially offset by a 68.4%an increase in volumes in the E-commerce and automotive OEM sales due to improved fill rates. In total,channels, as well as a $4.7 million increase in sales returns and allowances. The net sales increased as a result of $5.5decrease was partially offset by $11.2 million in 2019 pricing increases, partially offset by $2.5 million of lower sales volumes and $2.3 million of increased sales returns and allowances. The price increaseswhich were implemented to offsetrecover increased steelmaterial and other materialinput costs and offset higher import tariffs, which took effect during 2018.2018 and were increased during 2019.
Horizon Americas’ gross profit decreased $1.2$11.7 million to $44.8$62.1 million or 21.9% of net sales in Q2 20193Q19 YTD, as compared to $46.0$73.8 million or 22.5% of netin 3Q18 YTD. The decrease in gross profit margin reflects the changes in sales in Q2 2018 YTD. Grossdetailed above. Additionally, gross profit was impacted by the following:
| |
| – | $11.89.1 million of unfavorable material input costs includingprimarily related to higher commodityfreight and tariff costs |
| |
| – | $8.5 million unfavorable manufacturing costs; and |
| |
| – | $4.6 million higher scrap costs and inventory reserves; partially offset by |
| |
| – | $5.38.0 million of additional costs incurred in the prior-year comparable period related to restructuring and footprint rationalization projects primarilyand related to the distribution center move to Kansas City; |
| |
– | $5.5 million of 2019 pricing increases, |
| |
– | $1.3 million in lower freight costscost inefficiencies that did not reoccur; and |
| |
| – | $1.83.6 million in lower personnel costs.outbound freight costs |
SG&A expenses decreased $11.4$12.4 million to $36.9$56.4 million, or 18.0%18.7% of net sales in Q2 20193Q19 YTD, as compared to $48.3$68.7 million, or 23.6%21.5% of net sales, in Q2 20183Q18 YTD. The decrease in SG&A expenses was attributable to the following:
| |
| – | $11.08.8 million benefitdecrease related to the synergies and cost savings from prior-year organizational restructuring efforts and business footprint rationalization;rationalization that did nor reoccur; |
| |
| – | $4.0 million of lower personnel and compensation costs; and |
| |
| – | $1.21.4 million of lower sales and marketing costs; partially offset by |
| |
– | $1.0 of additional rent expense.costs |
Horizon Americas’ operating profit increased approximately $10.5$1.0 million to an operating profit of $8.0$5.8 million, or 3.9%1.9% of net sales, in Q2 20193Q19 YTD, as compared to an operating lossprofit of $2.5$4.7 million, or (1.2)%1.5% of net sales, in Q2 20183Q18 YTD. Operating profit and operating margin increased primarily due to decreased SG&A costs related toimpacts of the synergies and cost savings from prior-year comparable period organizational restructuring efforts and business footprint rationalization.rationalization efforts, partially offset by the lower net sales and additional operating costs discussed above.
Horizon Europe-Africa.Europe-Africa
Net sales by sales channel, in thousands, for Horizon Europe-Africa during Q2 20193Q19 YTD and Q2 20183Q18 YTD are as follows:
| | | | | Six months ended June 30, | | Change | | Nine months ended September 30, | | Change |
| | | 2019 | | 2018 | | $ | | % | | 2019 | | 2018 | | $ | | % |
| Net Sales | | | | | | | | | | | | | | | | |
| Automotive OEM | | $ | 94,830 |
| | $ | 94,280 |
| | $ | 550 |
| | 0.6 | % | | $ | 137,900 |
| | $ | 134,930 |
| | $ | 2,970 |
| | 2.2 | % |
| Automotive OES | | 29,330 |
| | 27,380 |
| | 1,950 |
| | 7.1 | % | | 45,840 |
| | 39,980 |
| | 5,860 |
| | 14.7 | % |
| Aftermarket | | 36,370 |
| | 45,200 |
| | (8,830 | ) | | (19.5 | )% | | 56,200 |
| | 65,180 |
| | (8,980 | ) | | (13.8 | )% |
| Industrial | | 1,560 |
| | — |
| | 1,560 |
| | N/A |
| | 2,340 |
| | — |
| | 2,340 |
| | N/A |
|
| E-commerce | | 1,100 |
| | 2,590 |
| | (1,490 | ) | | (57.5 | )% | | 1,650 |
| | 3,880 |
| | (2,230 | ) | | (57.5 | )% |
| Other | | 2,650 |
| | 8,450 |
| | (5,800 | ) | | (68.6 | )% | | 3,570 |
| | 12,460 |
| | (8,890 | ) | | (71.3 | )% |
| Total | | $ | 165,840 |
| | $ | 177,900 |
| | $ | (12,060 | ) | | (6.8 | )% | | $ | 247,500 |
| | $ | 256,430 |
| | $ | (8,930 | ) | | (3.5 | )% |
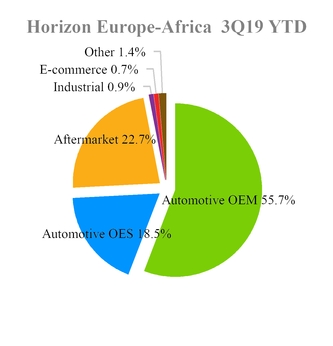
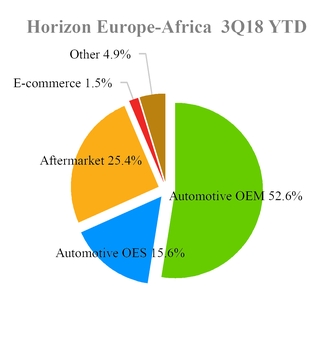
Net sales decreased $12.1$8.9 million, or 6.8%3.5%, to $165.8$247.5 million in Q2 20193Q19 YTD, as compared to $177.9$256.4 million in Q2 20183Q18 YTD, primarily due to unfavorable currency exchangedriven by the weakening of approximately $12.5 million as the euro weakened in relation to the U.S. dollar. After considering currency impact, net sales were relatively flat comparedincreased $7.4 million. The increase was primarily attributable to increased automotive OEM and OES sales volumes, partially offset by lower aftermarket shipping volumes related to softer demand and the prior-year period.$8.9 million impact of the Company’s sale of its non-automotive business in the first quarter of 2019.
Horizon Europe-Africa’s gross profit decreased $8.6$4.3 million to $15.1$26.1 million, or 9.1%10.5% of net sales in Q2 20193Q19 YTD, from approximately $23.6$30.4 million, or 13.3%11.8% of net sales, in Q2 20183Q18 YTD. GrossThe decrease in gross profit margin reflects the changes in sales detailed above, which is attributable to a sales mix shift from higher margin aftermarket sales to lower margin OE sales. In addition, gross profit was negatively impacted by the following:
| |
| – | $4.31.9 million expense related to customer claims from product soldunfavorable material input and freight costs, partially offset by Horizon Europe-Africa arising from potentially faulty components provided by a supplier; |
| |
| – | $1.25.8 million unfavorablefavorable currency exchange due to the weakeningchange of the Euro in relation to the U.S. dollar; |
| |
– | $1.3 million unfavorable commodity and freight costs, and |
| |
– | $0.8 million additional personnel costs.dollar |
SG&A expenses decreased $7.0$9.1 million to $18.1$27.4 million, or 10.9%11.1% of net sales in Q2 20193Q19 YTD, as compared to $25.1$36.5 million, or 14.1%14.2% of net sales, in Q2 20183Q18 YTD. The decrease in SG&A expenses was primarily attributable to the following:
| |
| – | $1.0 million unfavorable currency exchange due to the weakening of the Euro in relation to the U.S. dollar; |
| |
– | $4.44.1 million of additional costs incurred in the prior-year comparable period related to restructuring and footprint rationalization projects primarily related to the shift in production to our Brasov, Romania production facility; and |
| |
| – | $0.41.9 million favorable currency exchange due to the change of the Euro in relation to the U.S. dollar; |
| |
| – | $1.9 million reduction in legalfunctional support and other professional fees.personnel costs due to lower headcount; |
| |
| – | $1.0 million reduction in selling and warehouse expense primarily attributable to personnel costs |
Horizon Europe-Africa’s operating loss decreasedprofit (loss) increased approximately $99.2$132.3 million to an operating lossprofit of approximately $1.6 million,$120.0 thousand, or 1.0%0.05% of net sales in Q2 20193Q19 YTD, as compared to an operating loss of $100.8$132.2 million, or 56.6%51.5% of net sales, in Q2 20183Q18 YTD, primarily due to the impairment of goodwill and trademark and trade namesintangible assets of approximately $99.1$125.8 million in prior year.
Horizon Asia-Pacific.
Net sales by sales channel, in thousands, for Horizon Asia-Pacific during the six months ended June 30, 2019 and 2018 are as follows:
|
| | | | | | | | | | | | | | | |
| | | Six months ended June 30, | | Change |
| | | 2019 | | 2018 | | $ | | % |
| Net Sales | | | | | | | | |
| Automotive OEM | | $ | 12,370 |
| | $ | 12,510 |
| | $ | (140 | ) | | (1.1 | )% |
| Automotive OES | | 27,600 |
| | 29,980 |
| | (2,380 | ) | | (7.9 | )% |
| Aftermarket | | 10,910 |
| | 13,040 |
| | (2,130 | ) | | (16.3 | )% |
| Retail | | 4,870 |
| | 5,190 |
| | (320 | ) | | (6.2 | )% |
| Industrial | | 6,810 |
| | 7,230 |
| | (420 | ) | | (5.8 | )% |
| Other | | — |
| | — |
| | — |
| | N/A |
|
| Total | | $ | 62,560 |
| | $ | 67,950 |
| | $ | (5,390 | ) | | (7.9 | )% |
Net sales decreased $5.4 million, or 7.9%, to $62.6 million in Q2 2019 YTD, compared to $68.0 million in Q2 2018 YTD. The decrease is primarily due to unfavorable foreign currency translation of $4.2 million primarily related to the weakening of the Australian dollar in relation to the U.S. dollar and lower sales volumes in the New Zealand automotive OES and aftermarket sales channels.
Horizon Asia-Pacific’s gross profit decreased $0.1 million to $16.3 million, or 26.0% of net sales in Q2 2019 YTD, from approximately $16.4 million, or 24.2% of net sales in Q2 2018 YTD. The decrease in gross profit was driven by the following:
| |
– | $0.9 million unfavorable currency exchange driven by the weakening Australian and New Zealand dollars in relation to the U.S. dollar, offset by |
| |
– | $0.3 million of 2019 pricing increases; and |
| |
– | $0.4 million of favorable inventory scrap adjustments in prior-year period. |
SG&A decreased $0.9 million, or 12.0%, to $6.5 million, or 10.4% of net sales in Q2 2019 YTD, as compared to $7.4 million, or 10.9% of net sales in Q2 2018 YTD. The decrease is primarily due to decreased SG&A costs related to the synergies and cost savings from prior-year organizational restructuring efforts.
Horizon Asia-Pacific’s operating profit increased $0.7 million to $9.8 million, or 15.6% of net sales in Q2 2019 YTD, as compared to $9.1 million, or 13.3% of net sales in Q2 2018 YTD, primarily due to decreased SG&A expenses and small 2019 pricing increases.
comparable period, coupled with operational results described above.
Corporate Expenses.Expenses Corporate expenses included in operating profit (loss) decreasedloss increased approximately $6.1$0.4 million to $17.1$29.4 million for Q2 20193Q19 YTD from $23.2$29.0 million for Q2 20183Q18 YTD. The decrease between years isincrease was primarily attributable to approximately $9.8the $5.3 million of lease abandonment and leasehold improvement charges related to the Company’s termination of its headquarters lease, an additional $5.8 million in additional professional fees and other costs related to the Company new debt issuance, amendments, consents and related structure changes entered into during 3Q 19 YTD. Offsetting the increase was $11.0 million of expenses related to the prior-year termination of the Brink Group acquisition, and $1.0 million in personnel costs. Partially offsetting the decrease was an additional $3.3 million in additional professional services expense related to the Company new debt issuance and amendments entered into during the first quarter of 2019 and $1.3 million in additional expenses in connection with the pursuit of a sale of the Horizon Asia-Pacific segment.which did not reoccur.
Liquidity and Capital Resources
Our capital and working capital requirements are funded through a combination of cash flows from operations, cash on hand and various borrowings and factoring arrangements described below, including our asset-based revolving credit facility (“ABL Facility”). We utilize intercompany loans and equity contributions to fund our worldwide operations. See Note 8,9, “Long-term Debt” included in Part I, Item 1, “Notes to Condensed Consolidated Financial Statements,” within this quarterly report on Form 10-Q. As of JuneSeptember 30, 2019, and December 31, 2018, there was $16.4$13.5 million and $26.1 million, respectively, of cash held at foreign subsidiaries. There may be country specific regulations that may restrict or result in increased costs in the repatriation of these funds.
Based on our current and anticipated levels of operations and the condition in our markets and industry, we believe that our cash on hand, cash flow from operations and availability under our ABL Facility will enable us to meet our working capital, capital expenditures, debt service and other funding requirements. Our ability to fund our working capital needs, debt payments and other obligations, and to comply with financial covenants, including borrowing base limitations under our ABL Facility, depends on our future operating performance and cash flow and many factors outside of our control, including the costs of raw materials, the state of the automotive accessories market and financial and economic conditions and other factors. Any future acquisitions, joint ventures or other similar transactions will likely require additional capital and there can be no assurance that any such capital will be available to us on acceptable terms, if at all.
In 2018, the Company experienced a combination of increased distribution costs and constrained shipments from the Americas distribution network, primarily resulting from the start-up of its new Kansas City, Kansas aftermarket and retail distribution center. Due to these factors, as well as costs associated with remediating these factors, during the first quarter of 2019, the Company entered into a Senior Term Loan Agreement (“Bridge Loan”) of $10.0 million and a Second Lien Term Loan (“Second Lien Term Loan”) of $51.0 million to repay the Bridge Loan, and amended the First Lien Term Loan (“Sixth Term Amendment”) to amend certain financial covenants to provide for relief based on the Company’s 2018 and 2019 budget and make certain other affirmative and negative covenants more restrictive. In Q2the second quarter of 2019, the Company entered into the Seventh Term Amendment (as defined below) to amend the First Lien Term Loan agreement to extend its $100.0 million prepayment requirement from on or before March 31, 2020 to on or before May 15, 2020. Because of the Sixth, Seventh, and SeventhEighth Term Amendments, the Company is in compliance with all of its financial covenants as of JuneSeptember 30, 2019. Refer to Item 1, “Condensed Consolidated Financial Statements,” included within this Quarterly Report on Form 10-Q for additional information.
Cash Flows - Operating Activities
Net cash used for operating activities during Q2 20193Q19 YTD and Q2 20183Q18 YTD was $48.8$65.8 million, and $35.4$74.5 million, respectively. During Q2 20193Q19 YTD, the Company used $4.5$44.7 million in cash flows, based on the reported net loss of $8.1$78.0 million and after considering the effects of non-cash items related to gains and losses on dispositions of property and equipment, depreciation, amortization of intangible assets, write off of operating lease assets, stock compensation, changes in deferred income taxes, amortization of original issuance discount and debt issuance costs, paid-in-kind interest, and other, net. During Q2 20183Q18 YTD, the Company generated $9.5used $21.9 million in cash flows, based on the reported net loss of $124.9$167.6 million and after considering the effects of similar non-cash items and goodwill impairment.
Changes in operating assets and liabilities used $44.3$21.1 million and $25.8$52.6 million of cash during Q2 20193Q19 YTD and Q2 20183Q18 YTD, respectively. Increases in accounts receivable resulted in a net use of cash of $32.3$4.7 million and $40.5$32.0 million during Q2 20193Q19 YTD and Q2 20183Q18 YTD, respectively. The increase in accounts receivable for both periods is a result of the higher sales activity during the second and third quarter compared to the fourth quarter due to the seasonality of the business.
Changes in inventory resulted in a usesource of cash of $10.6$1.9 million during Q2 20193Q19 YTD and source of cash of approximately $0.5$5.6 million during Q2 20183Q18 YTD. The increasedecrease in inventory during Q2 20193Q19 YTD was due to softening of demand at the start of the typically strong selling season. The decrease in inventory during Q2 20183Q18 YTD was due to the seasonality of our business.
Changes in accounts payable and accrued liabilities resulted in a use of cash of $0.4$15.6 million during Q2 20193Q19 YTD and a sourceuse of cash of $12.6$27.5 million during Q2 20183Q18 YTD. The use of cash for Q2 20193Q19 YTD compared to the sourceuse of cash during Q2 20183Q18 YTD is primarily related to the timing of purchases and vendor payments within the quarter.
Cash Flows - Investing Activities
Net cash provided by investing activities during 3Q19 YTD was $207.6 million and net cash used for investing activities was $9.9 million during Q2 20193Q18 YTD. During 3Q19 YTD, net proceeds from the sale of APAC was $0.1$209.6 million, and $7.7 million during Q2 2018 YTD. During Q2 2019 YTD, net proceeds from the sale of certain non-automotive business assets were $5.0 million. Q2 20193Q19 YTD saw lower capital expenditure needs as compared to $7.8$9.7 million incurred during Q2 20183Q18 YTD for growth, capacity and productivity-related projects, primarily within the Westfalia Group.
group.
Cash Flows - Financing Activities
Net cash used for financing activities was approximately $163.7 million and net cash provided by financing activities was approximately $37.7 million and $42.4$74.4 million during the Q2 20193Q19 YTD and Q2 20183Q18 YTD, respectively. During Q2 20193Q19 YTD, net proceeds from borrowings on our Second Lien Term Loan were $35.5 million, net of issuance costs; net repayments on our ABL Facility totaled $11.7$43.7 million, while we used cash of $10.1$173.4 million for repayments and debt issuance and transaction costs to amend our First Lien Term Loan. During Q2 20183Q18 YTD, net borrowings from our ABL Facility totaled $52.6$37.6 million. During Q2 20183Q18 YTD, we used cash of approximately $3.9$6.5 million for repayments on our First Lien Term Loan.
Factoring Arrangements
We have factoring arrangements with financial institutions to sell certain accounts receivable under non-recourse agreements. Total receivables sold during the year under the factoring arrangements were approximately $133.2$199.2 million and $135.9$193.3 million as of JuneSeptember 30, 2019 and 2018, respectively. We utilize factoring arrangements as part of our business funding to meet the Company’s working capital needs. The costs of participating in these arrangements are immaterial to our results.
Our Debt and Other Commitments
In March 2019, the Company entered into the Sixth Term Amendment to permit the Company to enter into the Second Lien Term Loan Agreement, amend certain financial covenants to provide for relief based on the Company’s 2018 and 2019 budget and make certain other affirmative and negative covenants more restrictive.
In March 2019, the Company entered into the Second Lien Term Loan Agreement that provides for a term loan facility in the aggregate principal amount of $51.0 million and matures on September 30, 2021. The interest on the Second Lien Term Loan may be paid, at the Company’s election, in cash, at the customary eurocurrency rate plus a margin of 10.50% per annum, or in-kind, at the customary eurocurrency rate plus a margin of 11.50%. The Second Lien Term Loan Agreement is subject to various affirmative and negative covenants including a secured net leverage ratio tested quarterly commencing with the fiscal quarter ending on December 31, 2019, which shall not exceed (x) 6.75 to 1.00 as of the last day of any fiscal quarter ending on or prior to June 30, 2020 and (y) 5.25 to 1.00 as of the last day of any fiscal quarter ending on or after September 30, 2020.further detailed below.
The Sixth Term Amendment eliminated the prior net leverage covenant ratio in the First Lien Term Loan and replaced it with a first lien leverage covenant starting with the 12-month period ending September 2019 as follows:
September 30, 2019: 8.25:1.00
December 31, 2019: 6.25:1.00
March 31, 2020: 5.50:1.00
June 30, 2020: 5.00:1.00
September 30, 2020 and each fiscal quarter ending thereafter: 4.75:1.00
The Sixth Term Amendment also added a fixed charge coverage covenant starting with fiscal quarter ending March 31, 2020, a minimum liquidity covenant of $15.0 million effective March 31, 2019, and a maximum capital expenditure covenant of $15.0 million for 2019 and $25.0 million annually thereafter. The interest rate on the First Lien Term Loan Agreement is also amended to add 3.0% paid in kind interest in addition to the existing cash pay interest.
On May 7, 2019, the Company entered into the Seventh Amendment to Credit Agreement (the “Seventh Term Amendment”) to amend the First Lien Term Loan Agreement, which extended its $100.0 million prepayment requirement from on or before March 31, 2020 to on or before May 15, 2020.
In September 2019, the Company amended its existing ABL Facility to provide consent for the sale of APAC, provide consent for the Company’s prepayment of First Lien Term Loan, as discussed below, and increase the existing block by $5.0 million to a total block of $10 million, making the effective facility size $80.0 million.
In September 2019, the Company amended the existing First Lien Term Loan Agreement (“Eighth Term Amendment”) to provide consent for the sale of the Company’s APAC segment, provide consent for the Company to meet its prepayment obligation of the First Lien Term Loan, remove prepayment penalties and make certain negative covenants less restrictive. In September 2019, the Company paid down a portion of its First Lien Term Loan’s outstanding principal plus fees and paid-in-kind interest in the amount of $172.9 million.
Pursuant to the Eighth Term Amendment, the prior first lien leverage covenant was eliminated and replaced with the secured net leverage ratio starting with the fiscal quarter ending December 31, 2020 as follows:
December 31, 2020: 6.00 to 1.00
March 31, 2021: 6.00 to 1.00
June 30, 2021 and each fiscal quarter ending thereafter: 5.00 to 1.00
In September 2019, the Company amended the existing Second Lien Term Loan Agreement (“Second Lien Amendment”) to remove the prepayment requirement related to the use of APAC sale proceeds and made certain negative covenants less restrictive. Pursuant to the Second Lien Amendment, the prior first lien leverage covenant was eliminated and replaced with the secured net leverage ratio starting with the fiscal quarter ending December 31, 2020, consistent with the Eighth Term Amendment above.
We and certain of our subsidiaries are party to the ABL Facility, an asset-based revolving credit facility, that provides for $90.0 million of funding on a revolving basis, subject to borrowing base availability. The ABL Facility matures in June 2020 and bears interest on outstanding balances at variable rates as outlined in the agreement.
As of JuneSeptember 30, 2019, approximately $51.2$19.7 million was outstanding on the ABL Facility bearing interest at a weighted average rate of 6.4%7.0% and $187.0$25.0 million was outstanding on the First Lien Term Loan bearing interest at 8.30%8.1%. The Company had $27.4$44.5 million of availability under the ABL Facility as of JuneSeptember 30, 2019.
The agreements governing the ABL Facility contain various negative and affirmative covenants and other requirements affecting us and our subsidiaries, including restrictions on incurrence of debt, liens, mergers, investments, loans, advances, guarantee obligations, acquisitions, asset dispositions, sale-leaseback transactions, hedging agreements, dividends and other restricted payments, transactions with affiliates, restrictive agreements and amendments to charters, bylaws, and other material documents. The ABL Facility does not include any financial maintenance covenants other than a springing minimum fixed charge coverage ratio of at least 1.00 to 1.00 on a trailing twelve-month basis, which will be tested only upon the occurrence of an event of default or certain other conditions as specified in the agreement.
We are subject to variable interest rates on our First Lien Term Loan and ABL Facility. At JuneSeptember 30, 2019, one-month LIBOR and three-month LIBOR approximated 2.40%2.02% and 2.32%,2.09% respectively.
In addition to our long-term debt, we have other cash commitments related to leases. We account for these lease transactions as operating leases and rent expense related thereto for Q2 20193Q19 YTD approximated $11.1$13.3 million. We expect to continue to utilize leasing as a financing strategy in the future to meet capital expenditure needs and to reduce debt levels.
The First Lien Term Loan requires a prepayment of $100.0 million on or before May 15, 2020. The ABL Facility matures on June 30, 2020, and as of JuneSeptember 30, 2019, had an outstanding balance of $51.2$19.7 million. As ofThe Company believes it has sufficient liquidity to operate its business. However, today the Companyit does not have the cash or liquidity to make the required First Lien Term Loan prepayment or pay off the balance of the ABL Facility at maturity. The Company intends to enter into a replacement revolving credit facility prior to the maturity of the ABL Facility. However, there can be no assurance that the company will be able to enter into a replacement revolving credit facility with commercially reasonable terms or at all. If the Company cannot generate sufficient cash from operations to make the aforementioned payments as they become due andpayment at maturity, or meet its financial covenants under the Company’s credit agreements,enter into new or additional financing arrangements, it wouldmay result in an event of default.default because of the inability to meet all of its obligations under its credit agreements. Such a default, if not cured, would allow the lenders to accelerate the maturity of the debt, making it due and payable at that time, which would result in a cross default of other debt obligations.
In an effort to address the aforementioned risks, on June 7, 2019, the Company announced that it was going to pursue various alternatives to reduce debt. In conjunction with evaluating all possible strategic alternatives, the board created an ad hoc committee of select directors to oversee the process and engaged an investment bank to assist therewith. To that end, the Company initiated a formal process to explore the sale of its Horizon Asia-Pacific operating segment as an option to raise the funds necessary to comply with the prepayment obligation under the First Lien Term Loan. The proceeds anticipated from said sale are expected to be sufficient to fund the required prepayment. The Company is in active discussions with potential buyers and believes it is probable that the Company will complete the transaction prior to the required May 15, 2020 prepayment obligation date.
The Company is in compliance with all of its financial covenants as of JuneSeptember 30, 2019.
Refer to Note 8,9, “Long-term Debt,” in Part I, Item 1, “Notes to Condensed Consolidated Financial Statements,” included within this quarterly report on Form 10-Q for additional information.
Consolidated EBITDA (defined as “Consolidated EBITDA” in our First Lien Term Loan Agreement and Second Lien Term Loan Agreement, collectively “Term Loan Agreements”) is a comparable measure to how the Company assesses performance. As discussed further in the Segment Information and Supplemental Analysis section of above, we use certain non-GAAP financial measures to assess performance and measure our covenants compliance in accordance with the Term Loan Agreements, which includes Adjusted EBITDA at the operating segment level. For the measurement of our Term Loan Agreements financial covenants, the definition of Consolidated EBITDA limits the amount of non-recurring expenses or costs including restructuring, moving and severance that can be excluded to $10 million in any cumulative four fiscal quarter period. Similarly, the definition limits the amount of fees, costs and expenses incurred in connection with any proposed asset sale that can be excluded to $5 million in any cumulative four fiscal quarter period.
The reconciliations of net income (loss) attributable to Horizon Global to EBITDA, EBITDA to Adjusted EBITDA and Adjusted EBITDA to Consolidated EBITDA for the three months ended September 30, 2019 and 2018; the nine months ended September 30, 2019 and 2018; and the last twelve months ended September 30, 2019 and 2018, are as follows:
|
| | | | | | | | | | | | | | | | | | | | | | | | | | | | | | | | | | | | |
| | | Three months ended
September 30, | | Nine months ended
September 30, | | Last twelve months ended
September 30, |
| | | 2019 | | 2018 | | Change | | 2019 | | 2018 | | Change | | 2019 | | 2018 | | Change |
| | | (dollars in thousands) |
| Net income (loss) attributable to Horizon Global | | $ | 145,510 |
| | $ | (32,760 | ) | | $ | 178,270 |
| | $ | 112,330 |
| | $ | (157,200 | ) | | $ | 269,530 |
| | $ | 65,620 |
| | $ | (178,680 | ) | | $ | 244,300 |
|
| Net loss attributable to noncontrolling interest | | (260 | ) | | (240 | ) | | (20 | ) | | (840 | ) | | (720 | ) | | (120 | ) | | (1,070 | ) | | (420 | ) | | (650 | ) |
| Net income (loss) | | 145,250 |
| | (33,000 | ) | | 178,250 |
| | 111,490 |
| | (157,920 | ) | | 269,410 |
| | 64,550 |
| | (179,100 | ) | | 243,650 |
|
| Interest expense | | 24,120 |
| | 7,590 |
| | 16,530 |
| | 50,270 |
| | 19,580 |
| | 30,690 |
| | 58,140 |
| | 25,240 |
| | 32,900 |
|
| Income tax benefit | | (1,020 | ) | | (1,420 | ) | | 400 |
| | (2,330 | ) | | (15,770 | ) | | 13,440 |
| | 1,930 |
| | (3,330 | ) | | 5,260 |
|
| Depreciation and amortization | | 6,250 |
| | 5,090 |
| | 1,160 |
| | 16,790 |
| | 15,070 |
| | 1,720 |
| | 22,300 |
| | 21,310 |
| | 990 |
|
| EBITDA | | 174,600 |
| | (21,740 | ) | | 196,340 |
| | 176,220 |
| | (139,040 | ) | | 315,260 |
| | 146,920 |
| | (135,880 | ) | | 282,800 |
|
| Net loss attributable to noncontrolling interest | | 260 |
| | 240 |
| | 20 |
| | 840 |
| | 720 |
| | 120 |
| | 1,070 |
| | 420 |
| | 650 |
|
| Income from discontinued operations, net of tax | | (182,750 | ) | | (4,110 | ) | | (178,640 | ) | | (189,520 | ) | | (9,670 | ) | | (179,850 | ) | | (192,690 | ) | | (14,210 | ) | | (178,480 | ) |
| EBITDA from continuing operations | | (7,890 | ) | | (25,610 | ) | | 17,720 |
| | (12,460 | ) | | (147,990 | ) | | 135,530 |
| | (44,700 | ) | | (149,670 | ) | | 104,970 |
|
| Adjustments pursuant to Term Loan Agreements: | | | | | | | | | | | | | | | | | | |
| Losses on sale of receivables | | 320 |
| | 640 |
| | (320 | ) | | 1,280 |
| | 1,490 |
| | (210 | ) | | 1,510 |
| | 1,730 |
| | (220 | ) |
| Non-cash equity grant expenses | | 850 |
| | 230 |
| | 620 |
| | 1,820 |
| | 1,440 |
| | 380 |
| | 1,970 |
| | 2,030 |
| | (60 | ) |
| Other non-cash expenses or losses | | 1,180 |
| | 27,470 |
| | (26,290 | ) | | 5,560 |
| | 128,250 |
| | (122,690 | ) | | 9,300 |
| | 128,420 |
| | (119,120 | ) |
| Term Loans related fees, costs and expenses | | — |
| | — |
| | — |
| | 2,920 |
| | — |
| | 2,920 |
| | 2,920 |
| | — |
| | 2,920 |
|
| Lender agent related professional fees, costs, and expenses | | 760 |
| | — |
| | 760 |
| | 760 |
| | — |
| | 760 |
| | 760 |
| | — |
| | 760 |
|
| Non-recurring expenses or costs (a) | | 2,890 |
| | 7,510 |
| | (4,620 | ) | | 8,480 |
| | 41,560 |
| | (33,080 | ) | | 20,570 |
| | 47,060 |
| | (26,490 | ) |
| Asset sale related fees, costs, and expenses (b) | | (1,320 | ) | | — |
| | (1,320 | ) | | — |
| | — |
| | — |
| | — |
| | — |
| | — |
|
| Non-cash losses on asset sales | | (50 | ) | | 110 |
| | (160 | ) | | (150 | ) | | 520 |
| | (670 | ) | | 180 |
| | 1,330 |
| | (1,150 | ) |
| Other expense, net | | 210 |
| | (540 | ) | | 750 |
| | (20 | ) | | (2,250 | ) | | 2,230 |
| | 330 |
| | (2,190 | ) | | 2,520 |
|
| Adjusted EBITDA | | (3,050 | ) | | 9,810 |
| | (12,860 | ) | | 8,190 |
| | 23,020 |
| | (14,830 | ) | | (7,160 | ) | | 28,710 |
| | (35,870 | ) |
| Non-recurring expense limitation (a) (b) | | N/A |
| | N/A |
| | N/A |
| | N/A |
| | (31,560 | ) | | 31,560 |
| | (10,570 | ) | | (37,060 | ) | | 26,490 |
|
| Other expense, net | | (210 | ) | | 540 |
| | (750 | ) | | 20 |
| | 2,250 |
| | (2,230 | ) | | (330 | ) | | 2,190 |
| | (2,520 | ) |
| Consolidated EBITDA | | $ | (3,260 | ) | | $ | 10,350 |
| | $ | (13,610 | ) | | $ | 8,210 |
| | $ | (6,290 | ) | | $ | 14,500 |
| | $ | (18,060 | ) | | $ | (6,160 | ) | | $ | (11,900 | ) |
(a) Non-recurring expenses or costs including severance, restructuring and relocation are not to, in aggregate, exceed $10 million in adjustments in determining Consolidated EBITDA in any four fiscal quarter period.
(b) Fees, costs and expenses incurred in connection with any proposed asset sale are not to, in aggregate, exceed $5 million in adjustments in determining Consolidated EBITDA in any four fiscal quarter period.
Credit Rating
We and certain of our outstanding debt obligations are rated by Standard & Poor’s and Moody’s. On June 14, 2019, Moody’s issued a rating of Caa3 for our $210 million senior secured term loan and a rating of C for our corporate family rating. Moody’s also assigned the Company a stable outlook. On March 21, 2019, Standard & Poor’s issued a rating of CCC for our $210 million senior secured term loan, a rating of CCC for our corporate credit rating and a rating of CCC- for our Convertible Notes. On August 21, 2019, Standard & Poor’s also assignedrevised the Company a negative outlook.Company’s outlook to developing.
If our credit ratings were to decline, our ability to access certain financial markets may become limited, our cost of borrowings may increase, the perception of us in the view of our customers, suppliers and security holders may worsen and as a result, we may be adversely affected.
Market Risk
We conduct business in various locations throughout the world and are subject to market risk due to changes in the value of foreign currencies. The functional currencies of our foreign subsidiaries are primarily the local currency in the country of domicile. We manage these operating activities at the local level and revenues and costs are generally denominated in local currencies; however, results of operations and assets and liabilities reported in U.S. dollars will fluctuate with changes in exchange rates between such local currencies and the U.S. dollar.
We use derivative financial instruments to manage currency risks associated with our procurement activities denominated in currencies other than the functional currency of our subsidiaries and the impact of currency rate volatility on our earnings. As of JuneSeptember 30, 2019, we were party to forward contracts, and cross currency swaps, to hedge changes in foreign currency exchange rates, with notional amounts of approximately $13.9 million and $2.2 million, respectively.$3.9 million. See Note 9,10, “Derivative Instruments,” included in Part I, Item 1, “Notes to Condensed Consolidated Financial Statements,” within this quarterly report on Form 10-Q.
We are also subject to interest risk as it relates to our long-term debt. We may in the future use interest rate swap agreements to fix the variable portion of our debt to manage this risk.
Outlook
Our global business remains susceptible to economic conditions that could adversely affect our results. In the near term, the economies that most significantly affect our demand, including the United States and European Union, and Australia, are expected to continue to grow. We have been impacted by recently enacted tariffs on imports from China that continued in Q2 2019.3Q19. The Company endeavors to recover incremental input costs through pricing actions, but the recoveries generally occur over time. The impact of potential increases in these tariffs during 2019 is uncertain, as well as the potential for recoveries through pricing actions. If geopolitical tensions, particularly in East Asia, escalate, it may affect global consumer sentiment affecting the expected economic growth in the near term. Additionally, we face some slowing of the U.K. aftermarket due to the continued uncertainty surrounding Brexit.
Due to its historical performance and liquidity needs, during the first quarter of 2019, the Company entered into the Bridge Loan of $10.0 million and the Second Lien Term Loan of $51.0 million to repay the Bridge Loan and entered into the Sixth Term Amendment to amend certain financial covenants to provide for relief based on the Company’s 2018 and 2019 budgetoperating performance and make certain other affirmative and negative covenants more restrictive. In spiteaddition, the Company used certain of thisthe proceeds from the 3Q19 sale of APAC to pay down $163.3 million of its First Lien Term Loan, satisfying its $100.0 million prepayment requirement under the First Lien Term Loan. In conjunction with the sale of APAC and pay down of the First Lien Term Loan discussed above, the Company entered into certain amendments and consents from its various lender groups to remove its quarterly principal payment obligation, as well as amend certain of its financial covenants related to the First Lien Term Loan and Second Lien Term Loan to not be measured until the fourth quarter 2020. The 3Q19 amendments discussed above allowed the Company to keep $36.3 million of the proceeds from the sale of APAC to provide for its liquidity needs. Although we were able to obtain new financing and amendments to our existing agreements, we remain focused on maintaining liquidity to fund our operations during the year.operations.
The Company is in compliance with all of its financial covenants as of JuneSeptember 30, 2019. Refer to Item 1, “Condensed Consolidated Financial Statements,” included within this Quarterly Report on Form 10-Q for additional information.
Over the past year, the Company has undergone significant effort to advance its turnaround via the action plan and other restructuring and business rationalization projects, primarily in the Americas and Europe-Africa. The management changes and business rationalization have allowed us to begin to operate more efficiently and focus on driving operational improvements. We are focused on simplifying our business and unwinding complexity to improve our customer service experience.
While we expect the new leadership in Europe-Africa to enhance the focus on operational improvements, progress is expected to take longer to realize in this segment. We will continue to move forward other initiatives to further improve operating efficiency and increase profitability. In the short term, the costs associated with executing these initiatives, including severance, unrecoverable lease obligations, professional service fees and other incurred costs, may continue to affect our results and cash flows.
We believe the unique global footprint we enjoy in our market space will benefit us as our OE customers continue to demonstrate a preference for stronger relationships with few suppliers. We believe that our strong brand positions, portfolio of product offerings, and existing customer relationships present a long-term opportunity for us and provide leverage to see balanced growth in the OE and aftermarket business.
While a strong global economy offers opportunities for growth and cost leverage, we are committed to delivering on our internal projects to drive margin improvement. We believe our internal projects, if executed well, will have a positive impact on our margins in future periods.
Our strategic priorities are to stabilize the operations in the near term and improve margins, reduce our leverage, and drive top-line growth. We believe those strategic priorities can be realized during 2019.
Impact of New Accounting Standards
See Note 2, “New Accounting Pronouncements,” included in Part I, Item 1, “Notes to Condensed Consolidated Financial Statements,” within this quarterly report on Form 10-Q.
Critical Accounting Policies
Our financial statements are prepared in accordance with accounting principles generally accepted within the United States of Americas (“U.S. GAAP”). Certain of our accounting policies require the application of significant judgment by management in
selecting the appropriate assumptions for calculating financial estimates that affect both the amounts and timing of the recording of assets, liabilities, net sales and expenses. By their nature, these judgments are subject to an inherent degree of uncertainty. These judgments are based on our historical experience, our evaluation of business and macroeconomic trends, and information from other outside sources, as appropriate.
During the first quarter of 2019, the Company adopted the U.S. GAAP provisions of Accounting Standards Codification (“ASC”) 842, “Leases” (“ASC 842”). Refer to Note 2, “New Accounting Pronouncements” and Note 11,12, “Leases” in Part I, Item 1, “Notes to the Condensed Consolidated Financial Statements,” included within this quarterly report on Form 10-Q, related to the impact of the adoption on the Company’s financial statements and accounting policies.
Except for accounting policies related to our adoption of ASC 842 in 2019, there were no material changes to the items that we disclosed as our critical accounting policies in Item 7, “Management’s Discussion and Analysis of Financial Condition and Results of Operations,” in our Annual Report on Form 10-K for the year ended December 31, 2018.
Emerging Growth Company
The Jumpstart Our Business Startups Act of 2012, or the JOBS Act, establishes a class of company called an “emerging growth company,” which generally is a company whose initial public offering was completed after December 8, 2011 and had total annual gross revenues of less than $1.07 billion during its most recently completed fiscal year. We currently qualify as an emerging growth company.
As an emerging growth company, we are eligible to take advantage of certain exemptions from various reporting requirements that are not available to public reporting companies that do not qualify for this classification, including without limitation the following:
| |
| ▪ | An emerging growth company is exempt from any requirement that may be adopted by the Public Company Accounting Oversight Board regarding mandatory audit firm rotation or a supplement to the auditor’s report providing additional information about the audit and financial statements, commonly known as an “auditor discussion and analysis.” |
| |
| ▪ | An emerging growth company is not required to hold a nonbinding advisory stockholder vote on executive compensation or any golden parachute payments not previously approved by stockholders. |
| |
| ▪ | An emerging growth company is not required to comply with the requirement of auditor attestation of management’s assessment of internal control over financial reporting, which is required for other public reporting companies by Section 404 of the Sarbanes-Oxley Act. |
| |
| ▪ | An emerging growth company is eligible for reduced disclosure obligations regarding executive compensation in its periodic and annual reports, including without limitation exemption from the requirement to provide a compensation discussion and analysis describing compensation practices and procedures. |
| |
| ▪ | A company that is an emerging growth company is eligible for reduced financial statement disclosure in registration statements, which must include two years of audited financial statements rather than the three years of audited financial statements that are required for other public reporting companies. |
For as long as we continue to be an emerging growth company, we expect that we will take advantage of the reduced disclosure obligations available to us as a result of this classification. We will remain an emerging growth company until the earlier of (i) December 31, 2020, the last day of the fiscal year following the fifth anniversary of the date of the first sale of our common stock pursuant to an effective registration statement under the Securities Act; (ii) the last day of the fiscal year in which we have total annual gross revenues of $1.07 billion (subject to further adjustment for inflation) or more; (iii) the date on which we have issued more than $1 billion in nonconvertible debt during the previous three years; or (iv) the date on which we are deemed to be a large accelerated filer under applicable SEC rules. We expect that we will remain an emerging growth company for the foreseeable future, but cannot retain our emerging growth company status indefinitely and will no longer qualify as an emerging growth company on or before December 31, 2020.
Emerging growth companies may elect to take advantage of the extended transition period provided in Section 7(a)(2)(B) of the Securities Act for complying with new or revised accounting standards. This allows an emerging growth company to delay the adoption of certain accounting standards until those standards would otherwise apply to private companies. We have elected to “opt out” of such extended transition period, and, as a result, we will comply with new or revised accounting standards on the relevant dates on which adoption of such standards is required for companies that are not “emerging growth companies.” Section 107 of the JOBS Act provides that our decision to opt out of the extended transition period for complying with new or revised accounting standards is irrevocable.
Item 3. Quantitative and Qualitative Disclosures About Market Risk
In the normal course of business, we are exposed to market risk associated with fluctuations in interest rates, commodity prices, insurable risks due to property damage, employee and liability claims, and other uncertainties in the financial and credit markets, which may impact demand for our products.
We conduct business in various locations throughout the world and are subject to market risk due to changes in the value of foreign currencies. The functional currencies of our foreign subsidiaries are primarily the local currency in the country of domicile. We manage these operating activities at the local level and revenues and costs are generally denominated in local currencies; however, results of operations and assets and liabilities reported in U.S. dollars will fluctuate with changes in exchange rates between the
local currencies and the U.S. dollar. A 10% change in average exchange rates versus the U.S. dollar would have resulted in an approximate $23.2$25.3 million and $25.0$26.3 million change to our net sales for the sixnine months ended JuneSeptember 30, 2019 and 2018, respectively.
We are exposed to market risk from changes in the interest rates on a significant portion of our outstanding debt. Outstanding balances under our First Lien Term Loan, at the Company’s election, bear interest at variable rates based on a margin over defined LIBOR. Based on the amount outstanding on the First Lien Term Loan as of JuneSeptember 30, 2019 and 2018, a 100 basis point change in LIBOR would result in an approximate $1.9$0.3 million and $1.5$1.9 million, respectively, to our annual interest expense.
We use derivative financial instruments to manage our currency risks. We are also subject to interest risk as it relates to long-term debt. See Part I, Item 2, “Management’s Discussion and Analysis of Financial Condition and Results of Operations,” for details about our primary market risks, and the objectives and strategies used to manage these risks. Also see Note 89, “Long-term Debt,” and Note 910, “Derivative Instruments,” in Part I, Item 1, “Notes to Condensed Consolidated Financial Statements,” included within this quarterly report on Form 10-Q for additional information.
Item 4. Controls and Procedures
The Company maintains disclosure controls and procedures that are designed to ensure that information required to be disclosed in the reports that the Company files or submits under the Securities Exchange Act of 1934, as amended, or the Exchange Act, is recorded, processed, summarized, and reported within the time periods specified in the SEC’s rules and forms, and that such information is accumulated and communicated to the Company’s management, including its Chief Executive Officer and Chief Financial Officer, as appropriate, to allow timely decisions regarding required disclosures.
Evaluation of disclosure controls and procedures
As of JuneSeptember 30, 2019, an evaluation was carried out by management, with the participation of the Chief Executive Officer and Chief Financial Officer, of the effectiveness of the Company’s disclosure controls and procedures (as such term is defined in Rule 13a-15(e) and Rule 15d-15(e) of the Exchange Act) pursuant to Rule 13a-15 of the Exchange Act. The Company’s disclosure controls and procedures are designed only to provide reasonable assurance that they will meet their objectives. Based upon that evaluation, the Chief Executive Officer and Chief Financial Officer concluded that, as of JuneSeptember 30, 2019, the Company’s disclosure controls and procedures are effective to provide reasonable assurance that they would meet their objectives.
Changes in internal control over financial reporting
Beginning January 1, 2019, the Company implemented Accounting Standards Update 2016-02, “Leases (Topic 842)”. Topic 842 had a material impact on the right-of-use assets and corresponding lease liabilities recognized on the Company’s condensed consolidated balance sheets. The Company did modify and add new controls designed to address risks associated with recognizing leases under the new standard. The Company has therefore augmented internal control over financial reporting as follows:
| |
| ▪ | enhanced the risk assessment process to take into account risks associated with the new lease standard; and |
| |
| ▪ | added controls that address risks associated with the evaluation of all leases for balance sheet recognition, including the revision of the Company’s lease contract review controls. |
There were no other changes in the Company’s internal control over financial reporting that occurred during the fiscal quarter ended JuneSeptember 30, 2019, that has materially affected, or is reasonably likely to materially affect, its internal control over financial reporting.
PART II. OTHER INFORMATION
Item 1. Legal Proceedings
We are subject to claims and litigation in the ordinary course of business, but we do not believe that any such claim or litigation is likely to have a material adverse effect on our financial position, results of operations, or cash flows. For additional information regarding legal proceedings, refer to Note 1213, “Contingencies,” included in Item 8, “Financial Statements and Supplementary Data,” within this quarterly report on Form 10-Q.
Item 1A. Risk Factors
A discussion of our risk factors can be found in the section entitled “Risk Factors,” in our Annual Report on Form 10-K for the year ended December 31, 2018, which could materially affect our business, financial condition or future results. There have been no significant changes in our risk factors as disclosed in our 2018 Form 10-K.
Item 2. Unregistered Sales of Equity Securities and Use of Proceeds
The Company’s purchases of its shares of common stock during the secondthird quarter of 2019 were as follows:
|
| | | | | | | | | | | |
| Period | | Total Number of Shares Purchased | | Average Price Paid per Share | | Total Number of Shares Purchased as Part of Publicly Announced Plans or Programs | | Maximum Number of Shares that May Yet be Purchased Under the Plans or Programs (a) |
| April 1 - 30, 2019 | | — |
| | | | — |
| | 813,494 |
|
| May 1 - 31, 2019 | | — |
| | | | — |
| | 813,494 |
|
| June 1 - 30, 2019 | | — |
| | | | — |
| | 813,494 |
|
| Total | | — |
| |
| | — |
| | |
__________________________
(a) The Company has a share repurchase program that was announced in May 2017 to purchase up to 1.5 million shares of the Company’s common stock. At the end of the secondthird quarter of 2019, 813,494 shares of common stock remains to be purchased under this program. The share repurchase program expires on May 5, 2020.
Item 3. Defaults Upon Senior Securities
Not applicable.
Item 4. Mine Safety Disclosures
Not applicable.
Item 5. Other Information
None.
Item 6. Exhibits.
Exhibits Index:
|
| |
3.12.1(c) | |
| 3.1(b) | |
| 3.2(a) | |
3.3(b)10.1 | |
10.1(c) | |
10.2 | Omnibus Consent, Waiver and Amendment dated as of June 6, 2019 to the Amended and Restated Loan Agreement dated as of December 22, 2015, by and among Horizon Global Corporation, Horizon Global Americas Inc., Cequent UK Limited, Cequent Towing Products of Canada Ltd., the other parties thereto, the lenders party thereto and Bank of America, N.A., as administrative agent. |
10.310.2 | |
10.4 | |
| 10.3 | |
| 10.4 | |
| 10.5 | |
| 31.1 | |
| 31.2 | |
| 32.1 | |
| 32.2 | |
| 101.INS | XBRL Instance Document. |
| 101.SCH | XBRL Taxonomy Extension Schema Document. |
| 101.CAL | XBRL Taxonomy Extension Calculation Linkbase Document. |
| 101.DEF | XBRL Taxonomy Extension Definition Linkbase Document. |
| 101.LAB | XBRL Taxonomy Extension Label Linkbase Document. |
| 101.PRE | XBRL Taxonomy Extension Presentation Linkbase Document. |
|
| | |
| (a) | | Incorporated by reference to the Exhibit filed with our Current Report on Form 8-K filed on February 20, 2019 (File No. 001-37427). |
| (b) | | Incorporated by reference to the Exhibit filed with our CurrentQuarterly Report on Form 8-K10-Q filed on March 18,August 8, 2019 (File No. 001-37427). |
| (c) | | Incorporated by reference to the Exhibit filed with our QuarterlyCurrent Report on Form 10-Q8-K filed on May 9,September 25, 2019 (File No. 001-37427). |
Signatures
Pursuant to the requirements of the Securities Exchange Act of 1934, the registrant has duly caused this report to be signed on its behalf by the undersigned thereunto duly authorized.
|
| | | | |
| | | HORIZON GLOBAL CORPORATION (Registrant) |
| | | | | |
| | | | | /s/ JAMIE PIERSONG.PIERSON |
| | | | | |
| Date: | August 8,November 12, 2019 | By: | | Jamie G. Pierson Chief Financial Officer |