UNITED STATES SECURITIES AND EXCHANGE COMMISSION
Washington, D.C. 20549
FORM 10-Q
xQuarterly report pursuant to Section 13 or 15(d) of the Securities Exchange Act of 1934
For the quarterly period ended June 30, 2021
For the Quarterly Period Ended: September 30, 2017
oTransition report pursuant to Section 13 or 15(d) of the Securities Exchange Act of 1934
Commission File Number: 333-203369
NRG YieldClearway Energy LLC
(Exact name of registrant as specified in its charter)
Delaware32-0407370
(State or other jurisdiction
of incorporation or organization)
(I.R.S. Employer
Identification No.)
Delaware
(State or other jurisdiction
of incorporation or organization)
32-0407370
(I.R.S. Employer
Identification No.)
300 Carnegie Center, Suite 300PrincetonNew Jersey08540
804 Carnegie Center, Princeton, New Jersey
(Address of principal executive offices)
08540
(Zip Code)
(609) 524-4500608-1525
(Registrant’s telephone number, including area code)

Securities registered pursuant to Section 12(b) of the Act: None.
Indicate by check mark whether the registrant (1) has filed all reports required to be filed by Section 13 or 15(d) of the Securities Exchange Act of 1934 during the preceding 12 months (or for such shorter period that the registrant was required to file such reports), and (2) has been subject to such filing requirements for the past 90 days. (Note: The registrant is a voluntary filer and not subject to the filing requirements of Section 13 or 15(d) of the Securities Exchange Act of 1934. Although not subject to these filing requirements, the registrant has filed all reports that would have been required to be filed by Section 13 or 15(d) of the Securities Exchange Act of 1934 during the preceding 12 months had the registrant been subject to such requirements.) YesxNooNoo
Indicate by check mark whether the registrant has submitted electronically and posted on its corporate Web site, if any, every Interactive Data File required to be submitted and posted pursuant to Rule 405 of Regulation S-T (§232.405 of this chapter) during the preceding 12 months (or for such shorter period that the registrant was required to submit and post such files). YesxNoo
Indicate by check mark whether the registrant is a large accelerated filer, an accelerated filer, a non-accelerated filer, a smaller reporting company or an emerging growth company. See the definitions of “large accelerated filer,” “accelerated filer,” “smaller reporting company,” and "emerging growth company" in Rule 12b-2 of the Exchange Act.
Large accelerated filero
Accelerated filero
Non-accelerated filerx
Smaller reporting companyo
Emerging growth companyo
(Do not check if a smaller reporting company)

If an emerging growth company, indicate by check mark if the registrant has elected not to use the extended transition period for complying with any new or revised financial accounting standards provided pursuant to Section 13(a) of the Exchange Act.  o
Indicate by check mark whether the registrant is a shell company (as defined in Rule 12b-2 of the Exchange Act).
YesoNox
As of OctoberJuly 31, 2017,2021, there were 34,586,25034,599,645 Class A units outstanding, 42,738,750 Class B units outstanding, 64,717,08781,655,667 Class C units outstanding, and 42,738,75042,633,750 Class D units outstanding. There is no public market for the registrant's outstanding units.
NOTE: WHEREAS NRG YIELD LLC MEETS THE CONDITIONS SET FORTH IN GENERAL INSTRUCTION H(1)(a) AND (b) OF FORM 10-Q, THIS FORM 10-Q IS BEING FILED WITH THE REDUCED DISCLOSURE FORMAT PURSUANT TO GENERAL INSTRUCTION H(2).


TABLE OF CONTENTS
Index


2

CAUTIONARY STATEMENT REGARDING FORWARD-LOOKING INFORMATION
This Quarterly Report on Form 10-Q of NRG YieldClearway Energy LLC, together with its consolidated subsidiaries, or the Company, includes forward-looking statements within the meaning of Section 27A of the Securities Act of 1933, as amended, or the Securities Act, and Section 21E of the Securities Exchange Act of 1934, as amended, or the Exchange Act. The words "believes," "projects," "anticipates," "plans," "expects," "intends," "estimates" and similar expressions are intended to identify forward-looking statements. These forward-looking statements involve known and unknown risks, uncertainties and other factors that may cause the Company's actual results, performance and achievements, or industry results, to be materially different from any future results, performance or achievements expressed or implied by such forward-looking statements. These factors, risks and uncertainties include the factors described under Item 1A — Risk Factors in Part I of the Company's Annual Report on Form 10-K for the year ended December 31, 2016, and under Item 1A - Risk Factors in Part II on the Company's Quarterly Report on Form 10-Q for the quarter ended June 30, 2017,2020, as well as the following:
The Company's ability to maintain and grow its quarterly distributions;
Potential risks related to COVID-19 or any other pandemic;
Potential risks related to the Company as a result of the NRG Transformation Plan;Company's relationships with GIP and CEG;
The Company's ability to successfully identify, evaluate and consummate acquisitions from, and dispositions to, third parties;
The Company's ability to acquire assets from NRG;GIP or CEG;
The Company's ability to raise additional capital due to its indebtedness, corporate structure, market conditions or otherwise;
Changes in law, including judicial decisions;
Hazards customary to the power production industry and power generation operations such as fuel and electricity price volatility, unusual weather conditions (including wind and solar conditions), catastrophic weather-related or other damage to facilities, unscheduled generation outages, maintenance or repairs, unanticipated changes to fuel supply costs or availability due to higher demand, shortages, transportation problems or other developments, environmental incidents, or electric transmission or gas pipeline system constraints and the possibility that the Company may not have adequate insurance to cover losses as a result of such hazards;
The Company's ability to operate its businesses efficiently, manage maintenance capital expenditures and costs effectively, and generate earnings and cash flows from its asset-based businesses in relation to its debt and other obligations;
The willingness and ability of counterparties to the Company's offtake agreements to fulfill their obligations under such agreements;
The Company's ability to enter into contracts to sell power and procure fuel on acceptable terms and prices as current offtake agreements expire;
Government regulation, including compliance with regulatory requirements and changes in market rules, rates, tariffs and environmental laws;
Changes in law, including judicial decisions;
Operating and financial restrictions placed on the Company that are contained in the project-level debt facilities and other agreements of certain subsidiaries and project-level subsidiaries generally, in the NRG YieldClearway Energy Operating LLC amended and restated revolving credit facility and in the indentures governing the Senior Notes;
Cyber terrorism and inadequate cybersecurity, or the occurrence of a catastrophic loss and the possibility that the Company may not have adequate insurance to cover losses resulting from such hazards or the inability of the Company's insurers to provide coverage;
The Company's ability to engage in successful mergers and acquisitions activity; and
The Company's ability to borrow additional funds and access capital markets, as well as the Company's substantial indebtedness and the possibility that the Company may incur additional indebtedness going forward.
Forward-looking statements speak only as of the date they were made, and the Company undertakes no obligation to publicly update or revise any forward-looking statements, whether as a result of new information, future events or otherwise. The foregoing review of factors that could cause the Company's actual results to differ materially from those contemplated in any forward-looking statements included in this Quarterly Report on Form 10-Q should not be construed as exhaustive.


3

GLOSSARY OF TERMS
When the following terms and abbreviations appear in the text of this report, they have the meanings indicated below:
2016 Form 10-KNRG Yield LLC's Annual Report on Form 10-K for the year ended December 31, 2016
2024
2025 Senior Notes$500600 million aggregate principal amount of 5.375%5.750% unsecured senior notes due 2024,2025, issued by NRG YieldClearway Energy Operating LLC, which were repaid in March 2021
2026 Senior Notes$350 million aggregate principal amount of 5.00% unsecured senior notes due 2026, issued by NRG YieldClearway Energy Operating LLC
ASC2028 Senior Notes
$850 million aggregate principal amount of 4.750% unsecured senior notes due 2028, issued by Clearway Energy Operating LLC
2031 Senior Notes$925 million aggregate principal amount of 3.750% unsecured senior notes due 2031, issued by Clearway Energy Operating LLC
Adjusted EBITDAA non-GAAP measure, represents earnings before interest, tax, depreciation and amortization adjusted for mark-to-market gains or losses, asset write offs and impairments; and factors which the Company does not consider indicative of future operating performance
Adjusted Gross MarginA non-GAAP measure, represents total operating revenues, excluding contract amortization and mark-to-market for economic hedges, less cost of fuels. See Item 2 Management’s Discussion and Analysis of Financial Condition and Results of Operations – Management’s discussion of the results of operations for the quarters ended June 30, 2021 and 2020 for a discussion of this measure
AOCLAccumulated Other Comprehensive Loss
ASCThe FASB Accounting Standards Codification, which the FASB established as the source of

authoritative GAAP
ASUAccounting Standards Updates - updates to the ASC
ATM ProgramProgramsAt-The-Market Equity Offering ProgramPrograms
August 2017 Drop Down AssetsThe remaining 25% interest in NRG Wind TE Holdco, an 814 net MW portfolio of twelve wind projects, acquired from NRG on August 1, 2017
Buffalo BearBuffalo Bear, LLC, the operating subsidiary of Tapestry Wind LLC, which owns the Buffalo Bear project
CAFD
A non-GAAP measure, Cash Available Forfor Distribution which the Company definesis defined as net income before interest expense, income taxes, depreciation and amortization,of June 30, 2021 as Adjusted EBITDA plus cash distributionsdistributions/return of investment from unconsolidated affiliates, adjustments to reflect CAFD generated by unconsolidated investments that were not able to distribute project dividends prior to PG&E's emergence from bankruptcy on July 1, 2020 and subsequent release post-bankruptcy, cash receipts from notes receivable, cash distributions from noncontrolling interests, adjustments to reflect sales-type lease cash payments, less cash distributions to noncontrolling interests, maintenance capital expenditures, pro-rata Adjusted EBITDA from unconsolidated affiliates, cash interest paid, income taxes paid, principal amortization of indebtedness, and changes in prepaid and accrued capacity payments,
and adjusted for development expenses
CompanyCEGNRG YieldClearway Energy Group LLC (formerly Zephyr Renewables LLC)
CEG Master Services AgreementMaster Services Agreements entered into as of August 31, 2018 between the Company, Clearway Energy, Inc., Clearway Energy Operating LLC, and CEG
CEG ROFO AgreementRight of First Offer Agreement, entered into as of August 31, 2018, by and between Clearway Energy Group LLC and Clearway Energy, Inc., and solely for purposes of Section 2.4, GIP III Zephyr Acquisition Partners, L.P., as amended by the First Amendment dated February 14, 2019, the Second Amendment dated August 1, 2019, the Third Amendment dated December 6, 2019, the Fourth Amendment dated November 2, 2020 and the Fifth Amendment dated August 2, 2021
CARES ActThe Coronavirus Aid, Relief, and Economic Security Act
Clearway Energy LLCThe holding company through which the projects are owned by Clearway Energy Group LLC, the holder of Class B and Class D units of the Company, and Clearway Energy, Inc., the holder of the Class A and Class C units
Clearway Energy Group LLCThe holder of all of Clearway Energy, Inc.'s Class B and Class D common shares stock,and Clearway Energy LLC'sthe Company’s Class B and Class D units and, from time to time, possibly shares of Clearway Energy, Inc.’s Class A and/or Class C common stock
Clearway Energy Operating LLCThe holder of the project assets that are owned by Clearway Energy LLC
CODCommercial Operation Date
CompanyClearway Energy LLC, together with its consolidated subsidiaries
CVSRCalifornia Valley Solar Ranch
CVSR Drop DownThe Company's acquisition from NRG of the remaining 51.05% interest of CVSR Holdco
CVSR HoldcoCVSR Holdco LLC, the indirect owner of CVSR
DGPV Holdco 1NRG DGPV Holdco 1 LLC
DGPV Holdco 2NRG DGPV Holdco 2 LLC
DGPV Holdco 3NRG DGPV Holdco 3 LLC
4

Distributed Solar

Solar power projects, typically less than 20 MW in size (on an alternating current, or AC, basis), that primarily sell power produced to customers for usage on site, or are interconnected to sell power into the local distribution grid
Drop Down AssetsCollectively, assets under common control acquired by the Company from NRG from January 1, 2014 through the period ended August 31, 2018 and from CEG from August 31, 2018 through the period ended June 2014 Drop Down Assets, January 2015 Drop Down Assets, November 2015 Drop Down Assets, CVSR Drop Down, March 2017 Drop Down Assets and August 2017 Drop Down Assets30, 2021
Economic Gross MarginEnergy and capacity revenue less cost of fuels
El SegundoNRG West Holdings LLC, the subsidiary of Natural Gas Repowering LLC, which owns the El Segundo Energy Center project
ERCOTElectric Reliability Council of Texas, the ISO and the regional reliability coordinator of the various electricity systems within Texas
EWGExempt Wholesale Generator
EPAUnited States Environmental Protection Agency
Exchange ActThe Securities Exchange Act of 1934, as amended
FASBFinancial Accounting Standards Board
FERCGAAPFederal Energy Regulatory Commission
GAAPAccounting principles generally accepted in the U.S.
GenConnGenConn Energy LLC
HLBVGIPCollectively, Global Infrastructure Partners III-C Intermediate AIV 3, L.P., Global Infrastructure Partners III-A/B AIV 3, L.P., Global Infrastructure Partners III-C Intermediate AIV 2, L.P., Global Infrastructure Partners III-C2 Intermediate AIV, L.P. and GIP III Zephyr Friends & Family, LLC
HLBVHypothetical Liquidation at Book Value
IASBInternational Accounting Standards Board
ISOIndependent System Operator, also referred to as RTO
January 2015 Drop Down AssetsThe Laredo Ridge, Tapestry and Walnut Creek projects, which were acquired by Yield Operating LLC from NRG on January 2, 2015
Kansas SouthNRG Solar Kansas South LLC, the operating subsidiary of NRG Solar Kansas South Holdings LLC, which owns the Kansas South project
Laredo RidgeLaredo Ridge Wind, LLC, the operating subsidiary of Mission Wind Laredo, LLC, which owns the Laredo Ridge project
LIBORLondon Inter-Bank Offered Rate


March 2017 Drop Down AssetsLIBOR(i) Agua Caliente Borrower 2 LLC, which owns a 16% interest (approximately 31% of NRG's 51% interest) in the Agua Caliente solar farm and (ii) NRG's 100% ownership in the Class A equity interests in the Utah Solar Portfolio (defined below), both acquired by the Company on March 27, 2017London Inter-Bank Offered Rate
Marsh LandingMBTANRG Marsh Landing LLC, formerly GenOn Marsh Landing LLCMigratory Bird Treaty Act
May 9, 2017 Form 8-KNRG Yield LLC Current Report on Form 8-K filed with the SEC on May 9, 2017 in connection with Yield Operating LLC's acquisition of the March 2017 Drop Down Assets
MMBtuMesquite StarMesquite Star Special LLC
MMBtuMillion British Thermal Units
MWMt. StormMegawattsNedPower Mount Storm LLC
MWhMWMegawatt
MWhSaleable megawatt hours, net of internal/parasitic load megawatt-hours
MWtMegawatts Thermal Equivalent
NERCNorth American Electric Reliability Corporation
Net ExposureCounterparty credit exposure to NRG Yield,Clearway Energy, Inc. net of collateral
November 2015 Drop Down AssetsNOLs75% of the Class B interests of NRG Wind TE Holdco, which owns a portfolio of 12 wind facilities totaling 814 net MW, which was acquired by YieldNet Operating LLC from NRG on November 3, 2015Losses
November 2017 Drop Down AssetsNPPD38 MW portfolio of distributed and small utility-scale solar assets, primarily comprised of assets from NRG's SolarNebraska Public Power Partners (SPP) funds, in addition to other projects developed since the acquisition of SPP by NRG, which was acquired by NRG Yield Operating LLC from NRG on November 1, 2017District
NRGNRG Energy, Inc.
NRG Power MarketingOCLNRG Power Marketing LLCOther comprehensive loss
NRG Transformation PlanO&MA three-year, three-part improvement plan announced by NRG on July 12, 2017, which includes exploring strategic alternatives for NRG's renewables platformOperations and its interest in Yield, Inc.Maintenance
NRG Wind TE HoldcoPG&ENRG Wind TE Holdco LLCPacific Gas and Electric Company
OCI/OCLPPAOther comprehensive income/loss
O&MOperation and Maintenance
PinnaclePinnacle Wind, LLC, the operating subsidiary of Tapestry Wind LLC, which owns the Pinnacle project
PPAPower Purchase Agreement
PUCTPTCPublic Utility Commission of TexasProduction Tax Credit
QFRENOMQualifying Facility under the Public Utility Regulatory Policies Act of 1978Clearway Renewable Operation & Maintenance LLC
ROFO AgreementSecond Amended and Restated Right of First Offer Agreement between Yield, Inc. and NRG
ROFO AssetsSpecified assets subject to sale, as described in the ROFO Agreement
RPV HoldcoNRG RPV Holdco 1 LLC
RTORegional Transmission OriginatorOrganization
SECSCESouthern California Edison
SECU.S. Securities and Exchange Commission
Senior NotesCollectively, the 20242026 Senior Notes, the 2028 Senior Notes and the 20262031 Senior Notes
SPPSolar Power Partners
TalogaSRECTaloga Wind, LLC, the operating subsidiary of Tapestry Wind LLC, which owns the Taloga projectSolar Renewable Energy Credit
TapestryTax ActCollectionTax Cuts and Jobs Act of the Pinnacle, Buffalo Bear and Taloga projects2017
Thermal BusinessThe Company's thermal business, which consists of thermal infrastructure assets that provide steam, hot water and/or chilled water, and in some instances electricity, to commercial businesses, universities, hospitals and governmental units
U.S.
U.S.United States of America
Utah Solar PortfolioCollection consists of Four Brothers Solar, LLC, Granite Mountain Holdings, LLC, and Iron Springs Holdings, LLC, which are equity investments owned by Four Brothers Capital, LLC, Granite Mountain Capital, LLC, and Iron Springs Capital, LLC, respectively and are part of the March 2017 Drop Down Assets acquisition that closed on March 27, 2017


Utility Scale Solar


Solar power projects, typically 20 MW or greater in size (on an alternating current, or AC, basis), that are interconnected into the transmission or distribution grid to sell power at a wholesale level
VaRValue at Risk
VIEVariable Interest Entity
Walnut CreekNRG Walnut Creek, LLC, the operating subsidiary of WCEP Holdings, LLC, which owns the Walnut Creek project
Yield, Inc.NRG Yield, Inc.
Yield Operating LLCNRG Yield Operating LLC, the holder of the project assets that belong to NRG Yield LLC


5

PART I - FINANCIAL INFORMATION
ITEM 1 — FINANCIAL STATEMENTS
NRG YIELDCLEARWAY ENERGY LLC
CONSOLIDATED STATEMENTS OF OPERATIONS
(Unaudited)
Three months ended June 30,Six months ended June 30,
(In millions)2021202020212020
Operating Revenues
Total operating revenues$380 $329 $617 $587 
Operating Costs and Expenses
Cost of operations, exclusive of depreciation, amortization and accretion shown separately below107 87 217 180 
Depreciation, amortization and accretion128 99 256 201 
General and administrative11 19 20 
Transaction and integration costs
Development costs
Total operating costs and expenses246 198 497 404 
Operating Income134 131 120 183 
Other Income (Expense)
Equity in earnings of unconsolidated affiliates16 12 
Gain on sale of unconsolidated affiliate49 49 
Other income, net
Loss on debt extinguishment(42)(3)
Interest expense(103)(93)(148)(260)
Total other expense, net(94)(27)(176)(208)
Net Income (Loss)40 104 (56)(25)
Less: Loss attributable to noncontrolling interests and redeemable interests(35)(27)(102)(66)
Net Income Attributable to Clearway Energy LLC$75 $131 $46 $41 

 Three months ended September 30, Nine months ended September 30,
(In millions)2017 
2016 (a)
 2017 
2016 (a)
Operating Revenues       
Total operating revenues$265
 $272
 $767
 $789
Operating Costs and Expenses       
Cost of operations78
 76
 239
 238
Depreciation and amortization88
 75
 241
 224
General and administrative4
 3
 14
 8
Acquisition-related transaction and integration costs
 
 2
 
Total operating costs and expenses170
 154
 496
 470
Operating Income95
 118
 271
 319
Other Income (Expense)       
Equity in earnings of unconsolidated affiliates28
 16
 63
 34
Other income, net1
 1
 3
 3
Interest expense(72) (68) (227) (204)
Total other expense, net(43) (51) (161) (167)
Net Income52
 67
 110
 152
Less: Net loss attributable to noncontrolling interests(23) (38) (56) (67)
Net Income Attributable to NRG Yield LLC$75
 $105
 $166
 $219
(a) Retrospectively adjusted as discussed in Note 1, Nature of Business.

See accompanying notes to consolidated financial statements.


NRG YIELD LLC
CONSOLIDATED STATEMENTS OF COMPREHENSIVE INCOME
(Unaudited)
 Three months ended September 30, Nine months ended September 30,
(In millions)2017 
2016 (a)
 2017 
2016 (a)
Net Income$52
 $67
 $110
 $152
Other Comprehensive Gain (Loss)       
Unrealized gain (loss) on derivatives7
 20
 7
 (49)
Other comprehensive gain (loss)7
 20
 7
 (49)
Comprehensive Income59
 87
 117
 103
Less: Comprehensive loss attributable to noncontrolling interests(23) (30) (56) (67)
Comprehensive Income Attributable to NRG Yield LLC$82
 $117
 $173
 $170

(a) Retrospectively adjusted as discussed in Note 1, Nature of Business.

See accompanying notes to consolidated financial statements.


NRG YIELD LLC
CONSOLIDATED BALANCE SHEETS
(In millions)September 30, 2017 
December 31, 2016 (a)
ASSETS(unaudited)  
Current Assets   
Cash and cash equivalents$178
 $321
Restricted cash140
 165
Accounts receivable — trade126
 92
Accounts receivable — affiliate1
 1
Inventory38
 39
Derivative instruments
 2
Notes receivable15
 16
Prepayments and other current assets22
 20
Total current assets520
 656
Property, plant and equipment, net5,247
 5,460
Other Assets   
Equity investments in affiliates1,183
 1,152
Intangible assets, net1,234
 1,286
Derivative instruments
 1
Other non-current assets56
 65
Total other assets2,473
 2,504
Total Assets$8,240
 $8,620
LIABILITIES AND MEMBERS' EQUITY   
Current Liabilities   
Current portion of long-term debt — external$300
 $291
Accounts payable — trade27
 23
Accounts payable — affiliate45
 40
Derivative instruments23
 32
Accrued expenses and other current liabilities94
 85
Total current liabilities489
 471
Other Liabilities   
Long-term debt — external4,914
 5,098
Long-term debt — affiliate618
 618
Accounts payable — affiliate3
 9
Derivative instruments43
 44
Other non-current liabilities87
 76
Total non-current liabilities5,665
 5,845
Total Liabilities6,154
 6,316
Commitments and Contingencies   
Members' Equity   
Contributed capital1,897
 2,127
Retained earnings86
 36
Accumulated other comprehensive loss(78) (85)
Noncontrolling interest181
 226
Total Members' Equity2,086
 2,304
Total Liabilities and Members’ Equity$8,240
 $8,620
(a) Retrospectively adjusted as discussed in Note 1, Nature of Business.


See accompanying notes to consolidated financial statements.

6


NRG YIELDCLEARWAY ENERGY LLC
CONSOLIDATED STATEMENTS OF CASH FLOWSCOMPREHENSIVE INCOME (LOSS)
(Unaudited)
Three months ended June 30,Six months ended June 30,
(In millions)2021202020212020
Net Income (Loss)$40 $104 $(56)$(25)
Other Comprehensive Income (Loss)
Unrealized gain (loss) on derivatives13 (9)
Other comprehensive income (loss)13 (9)
Comprehensive Income (Loss)40 109 (43)(34)
Less: Comprehensive loss attributable to noncontrolling interests and redeemable interests(38)(27)(102)(66)
Comprehensive Income Attributable to Clearway Energy LLC$78 $136 $59 $32 

 Nine months ended September 30,
 2017 
2016(a)
 (In millions)
Cash Flows from Operating Activities   
Net income$110
 $152
Adjustments to reconcile net income to net cash provided by operating activities:   
Equity in earnings of unconsolidated affiliates(63) (34)
Distributions from unconsolidated affiliates52
 43
Depreciation and amortization241
 224
Amortization of financing costs7
 6
Amortization of intangibles and out-of-market contracts52
 57
Changes in derivative instruments(2) (5)
Loss on disposal of asset components8
 5
Changes in prepaid and accrued liabilities for tolling agreements5
 2
Changes in other working capital(35) (6)
Net Cash Provided by Operating Activities375
 444
Cash Flows from Investing Activities   
Payments for the Drop Down Assets(176) (77)
Capital expenditures(23) (16)
Cash receipts from notes receivable11
 11
Return of investment from unconsolidated affiliates32
 16
Investments in unconsolidated affiliates(48) (69)
Net Cash Used in Investing Activities(204) (135)
Cash Flows from Financing Activities   
Net contributions from noncontrolling interests13
 7
Net distributions and return of capital to NRG prior to the acquisition of Drop Down Assets(49) (126)
Proceeds from the issuance of Class C units33
 
Payments of distributions(149) (127)
Payments of debt issuance costs(4) (6)
Proceeds from the revolving credit facility
 60
Payments for the revolving credit facility
 (366)
Proceeds from the issuance of long-term debt — external41
 550
Payments for long-term debt(224) (204)
Net Cash Used in Financing Activities(339) (212)
Net Decrease in Cash, Cash Equivalents and Restricted Cash(168) 97
Cash, Cash Equivalents and Restricted Cash at Beginning of Period486
 241
Cash, Cash Equivalents and Restricted Cash at End of Period$318
 $338
(a) Retrospectively adjusted as discussed in Note 1, Nature of Business.


See accompanying notes to consolidated financial statements.

8


NRG YIELDCLEARWAY ENERGY LLC
CONSOLIDATED BALANCE SHEETS
(In millions)June 30, 2021December 31, 2020
ASSETS(unaudited)
Current Assets
Cash and cash equivalents$138 $268 
Restricted cash332 197 
Accounts receivable — trade203 143 
Accounts receivable — affiliates
Inventory43 42 
Prepayments and other current assets50 58 
Total current assets767 708 
Property, plant and equipment, net7,537 7,217 
Other Assets
Equity investments in affiliates639 741 
Intangible assets for power purchase agreements, net2,188 1,231 
Other intangible assets, net136 139 
Derivative instruments
Right of use assets, net349 337 
Other non-current assets143 114 
Total other assets3,459 2,563 
Total Assets$11,763 $10,488 
LIABILITIES AND MEMBERS' EQUITY
Current Liabilities
 Current portion of long-term debt — external$518 $384 
Current portion of long-term debt — affiliate
Accounts payable — trade59 72 
Accounts payable — affiliates16 20 
Derivative instruments44 38 
Accrued interest expense55 44 
Accrued expenses and other current liabilities64 79 
Total current liabilities757 638 
Other Liabilities
Long-term debt — external7,434 6,585 
Derivative instruments145 135 
Long-term lease liabilities361 345 
Other non-current liabilities179 173 
Total non-current liabilities8,119 7,238 
Total Liabilities8,876 7,876 
Commitments and Contingencies00
Members' Equity
Contributed capital1,578 1,723 
Accumulated deficit(4)(50)
Accumulated other comprehensive loss(22)(33)
Noncontrolling interest1,335 972 
Total Members' Equity2,887 2,612 
Total Liabilities and Members’ Equity$11,763 $10,488 

See accompanying notes to consolidated financial statements.
9

CLEARWAY ENERGY LLC
CONSOLIDATED STATEMENTS OF CASH FLOWS
(Unaudited)
Six months ended June 30,
(In millions)20212020
Cash Flows from Operating Activities
Net Loss$(56)$(25)
Adjustments to reconcile net loss to net cash provided by operating activities:
Equity in earnings of unconsolidated affiliates(12)(3)
Distributions from unconsolidated affiliates16 10 
Depreciation, amortization and accretion256 201 
Amortization of financing costs and debt discounts
Amortization of intangibles70 45 
Loss on debt extinguishment42 
Reduction (increase) in carrying amount of right-of-use assets(1)
Gain on sale of unconsolidated affiliate(49)
Changes in derivative instruments15 100 
Cash used in changes in other working capital
Changes in prepaid and accrued liabilities for tolling agreements(76)(77)
Changes in other working capital(26)(28)
Net Cash Provided by Operating Activities241 183 
Cash Flows from Investing Activities
Acquisitions, net of cash acquired(211)
Acquisition of Drop Down Asset(132)
Consolidation of DGPV Holdco 3 LLC17 
Capital expenditures(93)(83)
Asset purchase from affiliate(21)
Cash receipts from notes receivable
Return of investment from unconsolidated affiliates20 23 
Investments in unconsolidated affiliates(10)
Proceeds from sale of assets90 
Other13 
Net Cash (Used in) Provided by Investing Activities(420)40 
Cash Flows from Financing Activities
Net contributions from noncontrolling interests162 154 
Contributions from CEG103 
Buyout of Repowering Partnership II LLC noncontrolling interest(70)
Net proceeds from the issuance of Class C units38 
Payments of distributions(132)(84)
Proceeds from the revolving credit facility300 265 
Payments for the revolving credit facility(233)(265)
Proceeds from the issuance of long-term debt — external1,016 286 
Proceeds from the issuance of long-term debt — affiliate
Payments of debt issuance costs(13)(2)
Payments for long-term debt — external(1,028)(502)
Payments for long-term debt — affiliate(45)
Other
Net Cash Provided by (Used in) Financing Activities184 (222)
Net Increase in Cash, Cash Equivalents and Restricted Cash
Cash, Cash Equivalents and Restricted Cash at beginning of period465 414 
Cash, Cash Equivalents and Restricted Cash at end of period$470 $415 
See accompanying notes to consolidated financial statements.
10

CLEARWAY ENERGY LLC
CONSOLIDATED STATEMENTS OF MEMBERS' EQUITY
For the Six Months Ended June 30, 2021
(Unaudited)
(In millions)Contributed CapitalRetained Earnings (Accumulated Deficit)Accumulated
Other
Comprehensive
Loss
Noncontrolling InterestTotal
Members' Equity
Balances at December 31, 2020$1,723 $(50)$(33)$972 $2,612 
Net loss— (29)— (68)(97)
Unrealized gain on derivatives— — 10 13 
(Distributions) contributions from CEG, non-cash(2)— — 29 27 
Contributions from CEG, cash103 — — — 103 
Contributions from noncontrolling interests, net of distributions, cash— — — 126 126 
Agua Caliente acquisition— — — 273 273 
Rattlesnake Drop Down(118)— — — (118)
Distributions paid to CEG on Class B and Class D units(28)— — — (28)
Distributions paid to Clearway Energy, Inc.(38)— — — (38)
Balance as of March 31, 2021$1,640 $(79)$(23)$1,335 $2,873 
Net income (loss)— 75 — (36)39 
Unrealized gain (loss) on derivatives— — (2)(1)
Contributions from CEG, non-cash— — — 
Contributions from noncontrolling interests, net of distributions, cash— — — 38 38 
Rattlesnake Drop Down— — — 
Distributions paid to CEG on Class B and Class D units(28)— — — (28)
Distributions paid to Clearway Energy, Inc.(38)— — — (38)
Balance as of June 30, 2021$1,578 $(4)$(22)$1,335 $2,887 

11

CLEARWAY ENERGY LLC
CONSOLIDATED STATEMENTS OF MEMBERS' EQUITY
For the Six Months Ended June 30, 2020
(Unaudited)
(In millions)Contributed CapitalRetained Earnings (Accumulated Deficit)Accumulated
Other
Comprehensive
Loss
Noncontrolling InterestTotal
Members' Equity
Balances at December 31, 2019$1,882 $$(37)$323 $2,173 
Net loss— (90)— (39)(129)
Unrealized loss on derivatives— — (14)— (14)
Contributions from CEG, cash— — — 
Contributions from tax equity interests, net of distributions, cash— — — 150 150 
Net proceeds from the sales of units, Clearway Energy, Inc.10 — — — 10 
Distributions to tax equity investors, non-cash— — — (1)(1)
Distributions paid to CEG on Class B and Class D units(24)— — (24)
Distributions paid to Clearway Energy, Inc.(18)— — (18)
Balances at March 31, 2020$1,850 $(85)$(51)$437 $2,151 
Net income (Loss)— 131 — (27)104 
Unrealized gain on derivatives— — — 
Contributions from CEG, non-cash— — — 
Contributions from CEG, cash— — — 
Distributions to tax equity interests, net of contributions, cash— — — (3)(3)
Net proceeds from the sales of units, Clearway Energy, Inc.28 — — — 28 
Distributions to tax equity investors, non-cash— — — (2)(2)
Consolidation of DGPV Holdco 3(51)— — (43)
Buyout of Repowering Partnership II LLC noncontrolling interest(60)— — (10)(70)
Distributions paid to CEG on Class B and Class D units(24)— — — (24)
Distributions paid to Clearway Energy, Inc.(18)— — — (18)
Balances at June 30, 2020$1,733 $46 $(46)$405 $2,138 

12

CLEARWAY ENERGY LLC
NOTES TO CONSOLIDATED FINANCIAL STATEMENTS
(Unaudited)
Note 1Nature of Business
NRG YieldClearway Energy LLC, together with its consolidated subsidiaries, or the Company, was formed by NRG as a Delaware limited liability company on March 5, 2013, to serve as the primary vehicle through which NRG owns, operatesis an energy infrastructure investor in and acquiresowner of modern, sustainable and long-term contracted renewable and conventional generation and thermal infrastructure assets. NRG owns 100% of NRG Yield LLC's Class B units and Class D units and receives distributions through its ownership of these units. Yield, Inc. owns 100% of NRG Yield LLC's Class A units and Class C units.
assets across North America. The Company owns a diversified portfolio of contracted renewable and conventional generation and thermalis indirectly owned by Global Infrastructure Partners III. Global Infrastructure Management, LLC is an independent fund manager that invests in infrastructure assets in energy and transport sectors, and Global Infrastructure Partners III is its third equity fund. The Company is sponsored by GIP through GIP's portfolio company, CEG.     
The Company is one of the largest renewable energy owners in the U.S. The Company’s contracted generation portfolio collectively represents 5,080with over 4,700 net MW as of September 30, 2017. Eachinstalled wind and solar generation projects. The Company's over 8,000 net MW of these assets sells substantially allalso includes approximately 2,500 net MW of its output pursuant to long-term offtake agreements with creditworthy counterparties. The weighted average remaining contract duration of these offtake agreements was approximately 16 years as of September 30, 2017 based on CAFD. The Company also owns thermal infrastructure assets with an aggregate steam and chilled water capacity of 1,319 net MWt and electricenvironmentally-sound, highly efficient generation capacity of 123 net MW. These thermal infrastructure assets provide steam, hot and/or chilled water, and, in some instances, electricity to commercial businesses, universities, hospitals and governmental units in multiple locations, principally through long-term contracts or pursuant to rates regulated by state utility commissions.
The following table represents the structure of the Company as of September 30, 2017:
yieldorgpicturerevisedasof95.jpg


On July 12, 2017, NRG announced that it had adopted and initiated a three-year, three-part improvement plan, or the NRG Transformation Plan. As part of the NRG Transformation Plan, NRG announced that it is exploring strategic alternatives for its renewables platform and its interest in Yield, Inc. NRG, through its holdings of Class B common stock and Class D common stock, has a 55.1% voting interest in Yield, Inc. and receives distributions from the Company through its ownership of Class B units and Class D units. NRG stated that the strategic alternatives span a variety of ownership structures and partnership types, including the potential partial or full monetization of NRG's renewables platform and NRG's interest in Yield, Inc. NRG is Yield, Inc.'s controlling stockholder and the Company has been highly dependent on NRG for, among other things, growth opportunities and management and administration services. See Part I, Item 1A, Risk Factors in the Company's 2016 Form 10-K,facilities as well as Part II, Item 1A, Risk Factors in the Company's Form 10-Q for the quarter ended June 30, 2017, for risks related to the NRG Transformation Plana portfolio of district energy systems. Through this environmentally-sound, diversified and the Company's relationship with NRG.
As of September 30, 2017, the Company's operating assets are comprised of the following projects:
Projects Percentage Ownership 
Net Capacity (MW)(a)
 Offtake Counterparty Expiration
Conventional        
El Segundo 100% 550
 Southern California Edison 2023
GenConn Devon 50% 95
 Connecticut Light & Power 2040
GenConn Middletown 50% 95
 Connecticut Light & Power 2041
Marsh Landing 100% 720
 Pacific Gas and Electric 2023
Walnut Creek 100% 485
 Southern California Edison 2023
    1,945
    
Utility Scale Solar        
Agua Caliente 16% 46
 Pacific Gas and Electric 2039
Alpine 100% 66
 Pacific Gas and Electric 2033
Avenal 50% 23
 Pacific Gas and Electric 2031
Avra Valley 100% 26
 Tucson Electric Power 2032
Blythe 100% 21
 Southern California Edison 2029
Borrego 100% 26
 San Diego Gas and Electric 2038
CVSR 100% 250
 Pacific Gas and Electric 2038
Desert Sunlight 250 25% 63
 Southern California Edison 2035
Desert Sunlight 300 25% 75
 Pacific Gas and Electric 2040
Kansas South 100% 20
 Pacific Gas and Electric 2033
Roadrunner 100% 20
 El Paso Electric 2031
TA High Desert 100% 20
 Southern California Edison 2033
      Utah Solar Portfolio (b) (e)
 50% 265
 PacifiCorp 2036
    921
    
Distributed Solar        
Apple I LLC Projects 100% 9
 Various 2032
AZ DG Solar Projects 100% 5
 Various 2025 - 2033
    14
    
Wind        
Alta I 100% 150
 Southern California Edison 2035
Alta II 100% 150
 Southern California Edison 2035
Alta III 100% 150
 Southern California Edison 2035
Alta IV 100% 102
 Southern California Edison 2035
Alta V 100% 168
 Southern California Edison 2035
Alta X (b)
 100% 137
 Southern California Edison 2038
Alta XI (b)
 100% 90
 Southern California Edison 2038
Buffalo Bear 100% 19
 Western Farmers Electric Co-operative 2033
Crosswinds (b) (f)
 99% 21
 Corn Belt Power Cooperative 2027
Elbow Creek (b) (f)
 100% 122
 NRG Power Marketing LLC 2022
Elkhorn Ridge (b) (f)
 66.7% 54
 Nebraska Public Power District 2029
Forward (b) (f)
 100% 29
 Constellation NewEnergy, Inc. 2017
Goat Wind (b) (f)
 100% 150
 Dow Pipeline Company 2025
Hardin (b) (f)
 99% 15
 Interstate Power and Light Company 2027
Laredo Ridge 100% 80
 Nebraska Public Power District 2031
Lookout (b) (f)
 100% 38
 Southern Maryland Electric Cooperative 2030


Projects Percentage Ownership 
Net Capacity (MW)(a)
 Offtake Counterparty Expiration
Odin (b) (f)
 99.9% 20
 Missouri River Energy Services 2028
Pinnacle 100% 55
 Maryland Department of General Services and University System of Maryland 2031
San Juan Mesa (b) (f)
 75% 90
 Southwestern Public Service Company 2025
Sleeping Bear (b) (f)
 100% 95
 Public Service Company of Oklahoma 2032
South Trent 100% 101
 AEP Energy Partners 2029
Spanish Fork (b) (f)
 100% 19
 PacifiCorp 2028
Spring Canyon II (b)
 90.1% 29
 Platte River Power Authority 2039
Spring Canyon III (b)
 90.1% 25
 Platte River Power Authority 2039
Taloga 100% 130
 Oklahoma Gas & Electric 2031
Wildorado (b) (f)
 100% 161
 Southwestern Public Service Company 2027
    2,200
    
Thermal        
NRG Dover Energy Center LLC 100% 103
 NRG Power Marketing LLC 2018
Thermal generation 100% 20
 Various Various
    123
    
Total net generation capacity(c)
   5,203
    
         
Thermal equivalent MWt (d)
 100% 1,319
 Various Various
(a) Net capacity represents the maximum, or rated, generating capacity of the facility multiplied by the Company's percentage ownership in the facility as of September 30, 2017.
(b) Projects are part of tax equity arrangements.
(c) The Company's total generation capacity is net of 6 MWs for noncontrolling interest for Spring Canyon II and III. The Company's generation capacity including this noncontrolling interest was 5,209 MWs.
(d) For thermal energy, net capacity represents MWt for steam or chilled water and excludes 134 MWt available under the right-to-use provisions contained in agreements between two of the Company's thermal facilities and certain of its customers.
(e) Represents interests in Four Brothers Solar, LLC, Granite Mountain Holdings, LLC, and Iron Springs Holdings, LLC, all acquired as part of the March 2017 Drop Down Assets (ownership percentage is based upon cash to be distributed).
(f)Projects are part of NRG Wind TE Holdco portfolio.
In addition to the facilities owned or leased in the table above,primarily contracted portfolio, the Company entered into partnershipsendeavors to own or purchase solar power generation projects, as well as other ancillary related assets from a related party via intermediate funds.  The Company does not consolidate these partnershipsprovide its investors with stable and accounts for them as equity method investments. The Company's net interest in these projects is 226 MW based on cash to be distributed as of September 30, 2017. For further discussions, refer to Note 4, Investments Accounted for by the Equity Method and Variable Interest Entities of this Form 10-Q and Note 5, Investments Accounted for by the Equity Method and Variable Interest Entities to the consolidated financial statements for the year ended December 31, 2016 included in the Company's May 9, 2017 Form 8-K.
growing dividend income.Substantially all of the Company's generation assets are under long-term contractual arrangements for the output or capacity from these assets. The thermal assets are comprised

Clearway Energy, Inc. consolidates the results of district energy systems and combined heat and power plants that produce steam, hot water and/or chilled water and, in some instances, electricity at a central plant. Certain district energy systems are subject to rate regulation by state public utility commissions (although they may negotiate certain rates) while the other district energy systems have rates determined by negotiated bilateral contracts.
As described in Note 3, Business Acquisitions, on August 1, 2017, the Company acquired the remaining 25%through its controlling interest, in NRG Wind TE Holdco, a portfolio of 12 wind projects, referred towith CEG's interest shown as the August 2017 Drop Down Assets, from NRG for total cash consideration of $44 million, including working capital adjustment of $3 million. The purchase agreement also included potential additional payments to NRG dependent upon actual energy prices for merchant periods beginning in 2027, which were estimated and accrued as contingent consideration in the amount of $8 million as of September 30, 2017. On March 27, 2017, the Company acquired the following interests from NRG, referred to as the March 2017 Drop Down Assets: (i) Agua Caliente Borrower 2 LLC, which owns a 16%non-controlling interest in the Agua Caliente solar farm, onefinancial statements. The holders of Clearway Energy, Inc.'s outstanding shares of Class A and Class C common stock are entitled to dividends as declared. CEG receives its distributions from the Company through its ownership of the ROFO assetsCompany's Class B and (ii) NRG'sClass D units.
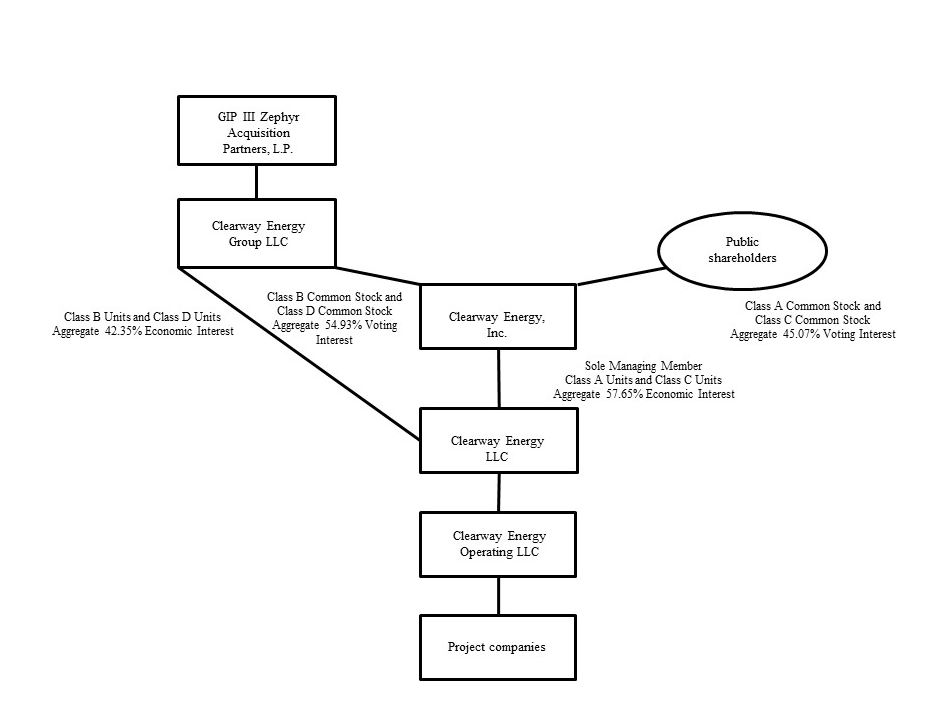
Clearway Energy, Inc. owns 57.65% of the economic interests in seven utility-scale solar farms located in Utah that were part of NRG's November 2, 2016 acquisitionthe Company, with CEG owning 42.35% of projects from SunEdison, or the Utah Solar Portfolio. Theeconomic interests of the Company paid total cash considerationas of $130 million, plus a $2 million working capital adjustment, and assumed non-recourse debt of $328 million, which is consolidated, as well as its pro-rata share of non-recourse project-level debt of $135 million. The acquisition was funded with cash on hand.June 30, 2021.


13

The acquisitionsfollowing table represents the structure of the August 2017 Drop Down Assets and March 2017 Drop Down Assets were accounted forCompany as transfers of entities under common control. The accounting guidance requires retrospective combinationJune 30, 2021:
cwen-20210630_g1.jpg
Basis of the entities for all periods presented as if the combinations had been in effect from the beginning of the financial statement period or from the date the entities were under common control (if later than the beginning of the financial statement period).Presentation
The accompanying unaudited interim consolidated financial statements have been prepared in accordance with the SEC’s regulations for interim financial information and with the instructions to Form 10-Q. Accordingly, they do not include all of the information and notes required by GAAP for complete financial statements. The following notes should be read in conjunction with the accounting policies and other disclosures as set forth in the notes to the consolidated financial statements for the year ended December 31, 2016 included in the Company's May 9, 20172020 Form 8-K.10-K. Interim results are not necessarily indicative of results for a full year.
In the opinion of management, the accompanying unaudited interim consolidated financial statements contain all material adjustments consisting of normal and recurring accruals necessary to present fairly the Company's consolidated financial position as of SeptemberJune 30, 2017,2021, and the results of operations, comprehensive income (loss) and cash flows for the three and ninesix months ended SeptemberJune 30, 20172021 and 2016.2020.


Note 2Summary of Significant Accounting Policies
Use of Estimates
The preparation of consolidated financial statements in accordance with GAAP requires management to make estimates and assumptions. These estimates and assumptions impact the reported amounts of assets and liabilities and disclosures of contingent assets and liabilities as of the date of the consolidated financial statements, and the reported amounts of revenues and expenses during the reporting period. Actual results could be different from these estimates.
14

Cash and Cash Equivalents, and Restricted Cash
Cash and cash equivalents include highly liquid investments with an original maturity of three months or less at the time of purchase. Cash and cash equivalents held at project subsidiaries was $125 million and $149 million as of June 30, 2021 and December 31, 2020, respectively.
The following table provides a reconciliation of cash, cash equivalents and restricted cash reported within the consolidated balance sheets that sum to the total of the same such amounts shown in the statements of cash flows:
 June 30, 2021December 31, 2020
 (In millions)
Cash and cash equivalents$138 $268 
Restricted cash332 197 
Cash, cash equivalents and restricted cash shown in the statement of cash flows$470 $465 
Restricted cash consists primarily of funds held to satisfy the requirements of certain debt agreements and funds held within the Company's projects that are restricted in their use. As of June 30, 2021, these restricted funds were comprised of $131 million designated to fund operating expenses, approximately $38 million designated for current debt service payments, and $130 million restricted for reserves including debt service, performance obligations and other reserves, as well as capital expenditures. The remaining $33 million is held in distribution reserve accounts.
In 2020, the members of the partnerships holding the Oahu Solar and Kawailoa Solar projects submitted applications to the state of Hawaii for refundable tax credits based on the cost of construction of the projects. In April 2021, the members of the partnerships contributed their respective portions of the tax credits in the amount of $49 million to the Oahu Solar and Kawailoa project companies, which is reflected in restricted cash on the Company's consolidated balance sheet with an offsetting adjustment to noncontrolling interests. In accordance with the projects' related agreements, the cash will be held in a restricted account and utilized to offset future invoiced amounts under the projects' PPAs.
Accumulated Depreciation, Accumulated Amortization
The following table presents the accumulated depreciation included in the property, plant and equipment, net, and accumulated amortization included in intangible assets, net, respectively, as of SeptemberJune 30, 20172021 and December 31, 2016:2020:
 September 30, 2017 December 31, 2016
 (In millions)
Property, Plant and Equipment Accumulated Depreciation$1,189
 $951
Intangible Assets Accumulated Amortization216
 163
Noncontrolling Interests
The following table reflects the changes in the Company's noncontrolling interest balance:
 (In millions)
Balance as of December 31, 2016 as reported$313
Less: Adjustment for August 2017 Drop Down Assets(87)
Balance as of December 31, 2016 as recast226
Capital contributions from tax equity investors, net of distributions11
Comprehensive loss(56)
Balance as of September 30, 2017$181
June 30, 2021December 31, 2020
(In millions)
Property, Plant and Equipment Accumulated Depreciation$2,573 $2,323 
Intangible Assets Accumulated Amortization556 487 
Distributions
The following table lists the distributions paid on NRG Yield LLC'sthe Company's Class A, B, C and D units during the ninesix months ended SeptemberJune 30, 2017:2021:
 Third Quarter 2017 Second Quarter 2017 First Quarter 2017
Distributions per Class A, B, C and D unit$0.28
 $0.27
 $0.26
Second Quarter 2021First Quarter 2021
Distributions per Class A, B, C and D unit$0.329 $0.324 
On October 31, 2017,July 23, 2021 the Company declared a distribution on its Class A, Class B, Class C and Class D units of $0.288$0.3345 per unit payable on DecemberSeptember 15, 20172021 to unit holders of record as of DecemberSeptember 1, 2017.2021.

Revenue Recognition

Revenue from Contracts with Customers
ChangesThe Company applies the guidance in Capital StructureASC 606, Revenue from Contracts with Customers, orTopic 606, when recognizing revenue associated with its contracts with customers. The Company's policies with respect to its various revenue streams are detailed below. In general, the Company applies the invoicing practical expedient to recognize revenue for the
At-the-Market Equity Offering Program, or
15

revenue streams detailed below, except in circumstances where the ATM Program
NRG Yield, Inc. is party to an equity distribution agreement with Barclays Capital Inc., Credit Suisse Securities (USA) LLC, J.P. Morgan Securities LLC and RBC Capital Markets, LLC, as sales agents. Pursuantinvoiced amount does not represent the value transferred to the termscustomer.
Thermal Revenues
Steam and chilled water revenue is recognized as the Company transfers the product to the customer, based on customer usage as determined by meter readings taken at month-end. Some locations read customer meters throughout the month and recognize estimated revenue for the period between meter read date and month-end. For thermal contracts, the Company’s performance obligation to deliver steam and chilled water is satisfied over time and revenue is recognized based on the invoiced amount. The Thermal Business subsidiaries collect, and remit state and local taxes associated with sales to their customers, as required by governmental authorities. These taxes are presented on a net basis in the income statement.
As contracts for steam and chilled water are long-term contracts, the Company has performance obligations under these contracts that have not yet been satisfied. These performance obligations have transaction prices that are both fixed and variable, and that vary based on the contract duration, customer type, inception date and other contract-specific factors. For the fixed price contracts, the Company cannot accurately estimate the amount of its unsatisfied performance obligations as it will vary based on customer usage, which will depend on factors such as weather and customer activity.
Power Purchase Agreements, or PPAs
The majority of the equity distribution agreement, NRG Yield, Inc. may offerCompany’s revenues are obtained through PPAs or other contractual agreements. Energy, capacity and sell shares of its Class C common stock par value $0.01 per share,where applicable, renewable attributes, from time to time through the sales agents up to an aggregate sales price of $150 million through an at-the-market equity offering program, or the ATM Program. NRG Yield, Inc. may also sell shares of its Class C common stock to anymajority of the sales agents,Company’s renewable energy assets and certain conventional energy plants is sold through long-term PPAs and tolling agreements to a single counterparty, which is often a utility or commercial customer. The majority of these PPAs are accounted for as principals forleases as the Company retained its own account, athistorical lease assessments and classification upon adoption of ASC 842. ASC 842 requires the minimum lease payments received to be amortized over the term of the lease and contingent rentals are recorded when the achievement of the contingency becomes probable. Judgment is required by management in determining the economic life of each generating facility, in evaluating whether certain lease provisions constitute minimum payments or represent contingent rent and other factors in determining whether a price agreed uponcontract contains a lease and whether the lease is an operating lease or capital lease. Certain of these leases have no minimum lease payments and all of the rental income under these leases is recorded as contingent rent on an actual basis when the electricity is delivered.
Renewable Energy Credits, or RECs
Renewable energy credits, or RECs, are usually sold through long-term PPAs. Revenue from the sale of self-generated RECs is recognized when the related energy is generated and simultaneously delivered even in cases where there is a certification lag as it has been deemed to be perfunctory.
In a bundled contract to sell energy, capacity and/or self-generated RECs, all performance obligations are deemed to be delivered at the same time and hence, timing of sale. Duringrecognition of revenue for all performance obligations is the first ninesame and occurs over time. In such cases, it is often unnecessary to allocate transaction price to multiple performance obligations.
16

Disaggregated Revenues
The following tables represent the Company’s disaggregation of revenue from contracts with customers along with the reportable segment for each category for the three and six months ended June 30, 2021 and 2020, respectively:
Three months ended June 30, 2021
(In millions)Conventional GenerationRenewablesThermalTotal
Energy revenue(a)
$$261 $29 $292 
Capacity revenue(a)
113 15 128 
Contract amortization(6)(30)(1)(37)
Other revenue22 28 
Mark-to-market for economic hedges(31)(31)
Total operating revenue109 222 49 380 
Less: Mark-to-market for economic hedges31 31 
Less: Lease revenue(115)(228)(343)
Less: Contract amortization30 37 
Total revenue from contracts with customers$$55 $50 $105 
(a) The following amounts of 2017, Yield, Inc. issued 1,921,866 sharesenergy and capacity revenue relate to leases and are accounted for under ASC 842:

(In millions)Conventional GenerationRenewablesThermalTotal
Energy revenue$$228 $$230 
Capacity revenue113 113 
Total$115 $228 $$343 

Six months ended June 30, 2021
(In millions)Conventional GenerationRenewablesThermalTotal
Energy revenue(a)
$$387 $58 $448 
Capacity revenue(a)
220 28 248 
Contract amortization(12)(55)(2)(69)
Other revenue31 14 45 
Mark-to-market for economic hedges(55)(55)
Total operating revenue211 308 98 617 
Less: Mark-to-market for economic hedges55 55 
Less: Lease revenue(223)(373)(1)(597)
Less: Contract amortization12 55 69 
Total revenue from contracts with customers$$45 $99 $144 
(a) The following amounts of Class C common stockenergy and capacity revenue relate to leases and are accounted for under ASC 842:
(In millions)Conventional GenerationRenewablesThermalTotal
Energy revenue$$373 $$377 
Capacity revenue220 220 
Total$223 $373 $$597 


17

Three months ended June 30, 2020
(In millions)Conventional GenerationRenewablesThermalTotal
Energy revenue(a)
$$195 $22 $218 
Capacity revenue(a)
112 12 124 
Contract amortization(6)(16)(22)
Other revenue12 
Mark-to-market for economic hedges(3)(3)
Total operating revenue107 180 42 329 
Less: Mark-to-market for economic hedges
Less: Lease revenue(113)(181)(294)
Less: Contract amortization16 22 
Total revenue from contracts with customers$$18 $42 $60 

(a) The following amounts of energy and capacity revenue relate to leases and are accounted for under ASC 842:
(In millions)Conventional GenerationRenewablesThermalTotal
Energy revenue$$181 $$182 
Capacity revenue11200112
Total$113 $181 $$294 
Six months ended June 30, 2020
(In millions)Conventional GenerationRenewablesThermalTotal
Energy revenue(a)
$$320 $50 $373 
Capacity revenue(a)
219 26 245 
Contract amortization(12)(31)(1)(44)
Other revenue15 21 
Mark-to-market for economic hedges(8)(8)
Total operating revenue210 287 90 587 
Less: Mark-to-market for economic hedges
Less: Lease revenue(222)(296)(1)(519)
Less: Contract amortization12 31 44 
Total revenue from contracts with customers$$30 $90 $120 
(a) The following amounts of energy and capacity revenue relate to leases and are accounted for under ASC 842:
(In millions)Conventional GenerationRenewablesThermalTotal
Energy revenue$$296 $$300 
Capacity revenue21900219
Total$222 $296 $$519 
Contract Amortization
Assets and liabilities recognized from power sales agreements assumed through acquisitions related to the ATM Programsale of electric capacity and energy in future periods for gross proceedswhich the fair value has been determined to be significantly less (more) than market are amortized to revenue over the term of $35 million, with commission feeseach underlying contract based on actual generation and/or contracted volumes or on a straight-line basis, where applicable.
18

Contract Balances
The following table reflects the contract assets and liabilities included on the Company’s balance sheet as of $346 thousand. Yield, Inc. used the net proceeds to acquire 1,921,866 Class C units from the Company. At SeptemberJune 30, 2017, approximately $115 million remains available for issuance under the ATM Program.2021 and December 31, 2020:
June 30, 2021December 31, 2020
(In millions)
Accounts receivable, net - Contracts with customers$66 $57 
Accounts receivable, net - Leases137 86 
Total accounts receivable, net$203 $143 
Reclassifications
Certain prior-year amounts have been reclassified for comparative purposes.Recently Adopted Accounting Standards
Recent Accounting Developments
ASU 2017-12 In August 2017,March 2020, the FASB issued ASU No. 2017-12, Derivatives and Hedging (Topic 815), Targeted Improvements to Accounting for Hedging Activities, or ASU No. 2017-12. ASU No. 2017-12 amends ASU No. 2016-15.2020-4, Facilitation of the Effects of Reference Rate Reform on Financial Reporting. The amendments of ASU No. 2016-15 were issuedprovide for optional expedients and exceptions for applying GAAP to simplify the application of hedge accounting guidance and more closely aligning financial reporting forcontracts, hedging relationships with economic results of an entity's risk management activities. The issues addressed by ASU No. 2017-12 include but are not limited to alignment of risk management activities and financial reporting, risk component hedging, accounting for the hedged item in fair value hedges of interest rate risk, recognition and presentation of the effects of hedging instruments, amounts excluded from the assessment of hedge effectiveness, and other simplificationstransactions affected by reference rate reform if certain criteria is met. These amendments apply only to contracts that reference LIBOR or another reference rate expected to be discontinued because of hedge accounting guidance.reference rate reform. The amendments of ASU No. 2017-12 areguidance is effective for fiscal years beginning after December 15, 2018, and interim periods therein. Early adoption is permitted in any interim period and the effect of the adoption should be reflectedall entities as of the beginning of the fiscal year of adoption.March 12, 2020 through December 31, 2022. The Company does not expect thatintends to apply the adoption of ASU No. 2017-12 will have a material impact on our consolidated results of operations, cash flows, and statement of financial position.

ASU 2016-18 — In November 2016, the FASB issued ASU No. 2016-18, Statement of Cash Flows (Topic 230), Restricted Cash, or ASU No. 2016-18. The amendments of ASU No. 2016-18 require an entity to include amounts generally described as restricted cash and restricted cash equivalents with cash and cash equivalents when reconciling the beginning of period and end of period total amounts on the statement of cash flows. The amendments of ASU No. 2016-18 are effective for annual reporting periods beginning after December 15, 2017, and interim periods within those annual periods. Early adoption is permitted and the adoption of ASU No. 2016-18 will be applied retrospectively. The Company early adopted ASU No. 2016-18all its eligible contract modifications where applicable during the second quarter of 2017. Net cash flows used in investing activities for the nine months ended September 30, 2016 decreased by $7 million. The sum of Company's cash and cash equivalents and restricted cash reported within the consolidated balance sheet as of December 31, 2016 equals the beginning balances of cash, cash equivalents and restricted cash shown in the consolidated statement of cash flows for the nine months ended September 30, 2017. The sum of Company's cash and cash equivalents and restricted cash reported within the consolidated balance sheet as of September 30, 2017 equals to the ending balances of cash, cash equivalents and restricted cash shown in the consolidated statement of cash flows for the nine months ended September 30, 2017.reference rate reform period.
ASU 2016-02 — In February 2016, the FASB issued ASU No. 2016-02, Leases (Topic 842), or Topic 842, with the objective to increase transparency and comparability among organizations by recognizing lease assets and lease liabilities on the balance sheet and to improve financial reporting by expanding the related disclosures. The guidance in Topic 842 provides that a lessee that may have previously accounted for a lease as an operating lease under current GAAP should recognize the assets and liabilities that arise from a lease on the balance sheet. In addition, Topic 842 expands the required quantitative and qualitative disclosures with regards to lease arrangements. The Company expects to adopt the standard effective January 1, 2019 utilizing the required modified retrospective approach for the earliest period presented. The Company expects to elect certain of the practical expedients permitted, including the expedient that permits the Company to retain its existing lease assessment and classification. The Company is currently working through an adoption plan and evaluating the anticipated impact on the Company's results of operations, cash flows and financial position. While the Company is currently evaluating the impact the new guidance will have on its financial position and results of operations, the Company expects to recognize lease liabilities and right of use assets. The extent of the increase to assets and liabilities associated with these amounts remains to be determined pending the Company’s review of its existing lease contracts and service contracts which may contain embedded leases. While this review is still in process, the Company believes the adoption of Topic 842 may be material to its financial statements.


ASU 2014-09 — In May 2014, the FASB issued ASU No. 2014-09, Revenue from Contracts with Customers (Topic 606), or ASU No. 2014-09, which was further amended through various updates issued by the FASB thereafter.  The amendments of ASU No. 2014-09 completed the joint effort between the FASB and the IASB, to develop a common revenue standard for GAAP and IFRS, and to improve financial reporting.  The guidance under Topic 606 provides that an entity should recognize revenue to depict the transfer of goods or services to customers in an amount that reflects the consideration to which the entity expects to be entitled to in exchange for the goods or services provided and establishes a five step model to be applied by an entity in evaluating its contracts with customers.  The Company expects to adopt the standard effective January 1, 2018 and apply the guidance retrospectively to contracts at the date of adoption. The Company will recognize the cumulative effect of applying Topic 606 at the date of initial application, as prescribed under the modified retrospective transition method. The Company also expects to elect the practical expedient available under Topic 606 for measuring progress toward complete satisfaction of a performance obligation and for disclosure requirements of remaining performance obligations.  The practical expedient allows an entity to recognize revenue in the amount to which the entity has the right to invoice such that the entity has a right to the consideration in an amount that corresponds directly with the value to the customer for performance completed to date by the entity. The majority of the Company's revenues are obtained through PPAs, which are currently accounted for as operating leases. In connection with the implementation of Topic 842, as described above, the Company expects to elect certain of the practical expedients permitted, including the expedient that permits the Company to retain its existing lease assessment and classification. As leases are excluded from the scope of Topic 606, the Company expects the standard to have an immaterial impact on the Company's results of operations, cash flows and financial position.
Note 3 — Business Acquisitions and Dispositions
20172021 Acquisitions
November 2017Rattlesnake Drop Down Assets On November 1, 2017,January 12, 2021, the Company acquired CEG's equity interest and a 38third party investor's minority interest in CWSP Rattlesnake Holding LLC for $132 million. CWSP Rattlesnake Holding LLC indirectly consolidates the Rattlesnake wind project, a 160 MW solar portfolio primarily comprisedwind facility with 144 MW of assets from NRG's Solar Power Partners (SPP) fundsdeliverable capacity in Adams County, Washington, as further described in Note 4, Investments Accounted for by the Equity Method and other projects developedVariable Interest Entities. The project has a 20-year PPA with Avista Corporation, which began when the facility reached commercial operations in December 2020. The Rattlesnake operations are included in the Company's Renewables segment. The acquisition was determined to be an asset acquisition and not a business combination, therefore the Company consolidated the financial information for Rattlesnake on a prospective basis. The membership interests acquired by NRG, for cash consideration of $71 million, excluding working capital adjustments, plus assumed non-recourse debt of $26 million. As of September 30, 2017, the November 2017 Drop Down Assets' debt was $33 million, of which $7 million was paid by NRG in October 2017.
The purchase price for the November 2017 Drop Down Assets was funded with cash on hand. The assets and liabilities transferred to the Company relate to interests under common control by NRGGIP and were recorded at historical cost in accordance with ASC 805-50, Business Combinations - Related Issues.cost. The difference between the cash paid of $132 million and the historical valuecost of the entities' equityCompany's acquired interests of $14 million was recorded as an adjustment to contributed capital. Because the transaction constituted a transfer of net assets under common control, the guidance requires retrospective combination of the entities for all periods presented as if the combination has been in effect since the inception of common control.

19


The following is a summary of assets and liabilities transferred in connection with the acquisition of the November 2017 Drop Down Assets as of September 30, 2017:
 (In millions)
Assets: 
Current assets$11
Property, plant and equipment84
Non-current assets32
Total assets127
Liabilities: 
Debt (Current and non-current) (a)
31
Other current and non-current liabilities3
Total liabilities assumed34
Net assets acquired$93
January 12, 2021:
(In millions)Rattlesnake
Current Assets$
Property, plant and equipment200 
Right-of-use asset12 
Total assets acquired220 
Debt(a)
176 
Long-term lease liabilities12 
Other current and non-current liabilities18 
Total liabilities assumed206 
Net assets acquired$14 
(a)Net of $2Repaid at acquisition date utilizing $107 million of netcontributed by tax equity investor recorded in noncontrolling interest and $103 million contributed by CEG, both recorded as contributed capital. Of the $210 million contributed, $176 million was utilized to pay down the acquired debt, issuance costs.$29 million was utilized to fund project reserve accounts and $5 million was utilized to pay associated fees.
Supplemental Pro Forma Information
As described above, the Company's acquisition of the November 2017 Drop Down Assets was accounted for as a transfer of entities under common control. The following unaudited supplemental pro forma information represents the consolidated results of operations as ifAgua Caliente Acquisition — On February 3, 2021, the Company acquired the November 2017 Drop Down Assets on January 1, 2016, including the impact of acquisition accounting with respect to NRG's acquisition of the projects.
 For the three months ended For the nine months ended
 September 30, 2017 September 30, 2016 September 30, 2017 September 30, 2016
        
Total operating revenues$269
 $275
 $777
 $798
Net income30
 69
 90
 155
August 2017 Drop Down Assets On August 1, 2017, the Company acquired the remaining 25% interest in NRG Wind TE Holdco, a portfolio of 12 wind projects, from NRG for total cash consideration of $44 million, including working capital adjustment of $3 million. The purchase agreement also included potential additional payments to NRG dependent upon actual energy prices for merchant periods beginning in 2027, which were estimated and accrued as contingent consideration in the amount of $8 million as of September 30, 2017.
The Company originally acquired 75% of NRG Wind TE Holdco on November 3, 2015, or November 2015 Drop Down Assets, which were consolidated with 25% of the net assets recorded as noncontrolling interest. The assets and liabilities transferred to the Company related to interests under common control by NRG and were recorded at historical cost in accordance with ASC 805-50, Business Combination - Related Issues. The difference between the cash paid of $44 million, net of the contingent consideration of $8 million, and the historical value of the remaining 25% of $87 million as of July 31, 2017, was recorded as an adjustment to NRG's contributed capital. Since the transaction constituted a transfer of entities under common control, the accounting guidance requires retrospective combination of the entities for all periods presented as if the combination has been in effect from the beginning of the financial statement period or from the date the entities were under common control (if later than the beginning of the financial statement period).
March 2017 Drop Down Assets On March 27, 2017, the Company acquired the following interests from NRG: (i) Agua Caliente Borrower 21 LLC whichfrom NRG Energy, Inc. for $202 million. Agua Caliente Borrower 1 LLC indirectly owns a 16%35% equity interest (approximately 31% of NRG's 51% interest) in the Agua Caliente, a 290 MW solar farm, one of the ROFO Assets, representing ownership of approximately 46 net MW of capacity and (ii) NRG's interests in the Utah Solar Portfolio. Agua Caliente isproject located in Yuma County, AZ and sells power subject toDateland, Arizona in which the Company previously owned a 16% equity interest. The project has a 25-year PPA with Pacific Gas and Electric,PG&E, with 22approximately 19 years remaining on that contract.under the agreement. Following the close of the transaction, the Company owns a 51% equity interest in Agua Caliente and consolidates Agua Caliente. The seven utility-scale solar farmsAgua Caliente operations are included in the Utah Solar Portfolio are owned by the following entities: Four Brothers Capital, LLC, Iron Springs Capital, LLC, and Granite Mountain Capital, LLC. These utility-scale solar farms achieved commercial operations in 2016, sell power subject to 20-year PPAs with PacifiCorp, a subsidiary of Berkshire Hathaway and are part of a tax equity structure with Dominion Solar Projects III, Inc., or Dominion, through which the Company is entitled to receive 50% of cashCompany's Renewables segment. The acquisition was determined to be distributed, as further described below. The Company paidan asset acquisition and the cash consideration of $130$202 million, plus $2net of restricted cash acquired of $91 million, represented a net cash outflow of $111 million, which was allocated to the fair value of the assets and liabilities acquired on the acquisition date. A third party investor holds the remaining 49% equity interest in Agua Caliente, which is reflected in noncontrolling interest and was valued at historical carrying amount increased for the incremental fair value determined at the acquisition date.
The following is a summary of assets and liabilities acquired in connection with the acquisition as of February 3, 2021:
(In millions)Agua Caliente
Restricted cash$91 
Property, plant and equipment154 
Intangible asset for power purchase agreement1,022 
Other currents assets
Total assets acquired1,276 
Accounts payable and other current liabilities
Debt716 
Total liabilities assumed721 
Noncontrolling interest273 
Equity method investment removed(80)
Net assets acquired$202 
Fair value measurements
The fair values of the property, plant and equipment, and intangible assets at the acquisition date were measured primarily based on significant inputs that are not observable in the market and thus represent a Level 3 measurement as defined in ASC 820, Fair Value Measurement. Significant inputs were as follows:
Property, plant and equipment The estimated fair values were determined primarily based on an income method using discounted cash flows and validated using a cost approach based on the replacement cost of the assets less economic obsolescence. The income approach was applied by determining the enterprise value for each acquired entity and subtracting the fair value of the intangible assets and working capital paid through September 30, 2017. The acquisitionto determine the implied value of the March 2017 Droptangible fixed assets. This methodology was primarily relied upon as the forecasted cash flows incorporate the specific attributes of each asset including

20


age, useful life, equipment condition, and technology. The income approach also allows for an accurate reflection of current and expected market dynamics such as supply and demand and the regulatory environment as of the acquisition date.
Down AssetsIntangible assets The fair value of the PPA acquired was fundeddetermined utilizing a variation of the income approach where the incremental future cash flows resulting from the acquired PPA compared to the cash flows based on current market prices were discounted to present value at the weighted average cost of debt of the utility off-taker, as the PPA was determined to be a debt-like instrument for the off-taker. The values were corroborated with available market data. The PPA value will be amortized over a period of 19 years.
Long-term debt The fair value of the long-term debt was determined by discounting future cash on hand.flows at current interest rates for similar instruments with equivalent credit quality.
Noncontrolling interest The Company recorded the noncontrolling interest utilizing the cost accumulation model, as the acquisition was an asset acquisition, which maintained the carrying value for the pre-existing equity, with the value increased incrementally based on the value of the Company's newly acquired interest.
Mt. Storm Wind Acquisition — On April 23, 2021, the Company acquired 100% of the equity interests in NedPower Mount Storm LLC, or Mt. Storm, from Castleton Commodities International for approximately $96 million before working capital and purchase price adjustments in the net amount of $4 million, representing a total cash outflow of $100 million. Mt. Storm is a 264 MW wind project located in Grant County, West Virginia. Mt. Storm has a 10 year energy hedge with an investment-grade counterparty. The acquisition was determined to be an asset acquisition and the purchase price was allocated to the fair value of the assets acquired and liabilities assumed on the acquisition date as follows:
(In millions)Mt. Storm
Current Assets$
Property, plant and equipment108 
Intangible asset
Total assets acquired113 
Accounts payable and other liabilities
Derivative instruments
Total liabilities assumed13 
Net assets acquired$100 
Fair value measurements
The fair values of the property, plant and equipment, derivative instrument and intangible asset at the acquisition date were measured primarily based on significant inputs that are not observable in the market and thus represent a Level 3 measurement as defined in ASC 820, Fair Value Measurement.
Property, plant and equipment The estimated fair values of property, plant and equipment were determined primarily based on an income method using discounted cash flows.
Intangible assetsThe estimated fair value of the intangible asset was using a market approach based on quoted prices of renewable energy credits in the applicable market.
Derivative instruments The estimated fair value of the derivative instruments was determined based on the discounted cash flows associated with the acquired commodity contract.

2020 Dispositions
Sale of RPV Holdco 1 LLC — On May 14, 2020, the Company sold its interests in RPV Holdco 1 LLC, or RPV Holdco, to Spruce Power for net proceeds of approximately $75 million. The Company previously accounted for its interest in RPV Holdco as an equity method investments.investment. The Company also assumed non-recourse debtsale of $41 million and $287 million on Agua Caliente Borrower 2the investment resulted in a gain of approximately $49 million.
Sale of Energy Center Dover LLC and Energy Center Smyrna LLC Assets — On March 3, 2020, the Utah Solar Portfolio, respectively, as further describedCompany, through Clearway Thermal LLC, sold 100% of its interests in Note 7, Long-term Debt, as well as its pro-rata shareEnergy Center Dover LLC and Energy Center Smyrna LLC to DB Energy Assets, LLC for cash proceeds of non-recourse project-level debt of Agua Caliente Solar LLC, as further described in approximately $15 million.
21


Note 4 Investments Accounted for by the Equity Method and Variable Interest Entities.
The assets and liabilities transferred to the Company relate to interests under common control by NRG and were recorded at historical cost in accordance with ASC 805-50, Business Combination - Related Issues. The difference between the cash paid and the historical value of the entities' equity of $8 million was recorded as an adjustment to contributed capital. Since the transaction constituted a transfer of entities under common control, the accounting guidance requires retrospective combination of the entities for all periods presented as if the combination has been in effect from the beginning of the financial statement period or from the date the entities were under common control (if later than the beginning of the financial statement period). Accordingly, in connection with the retrospective adjustment of prior periods, the Company adjusted its financial statements to reflect its results of operations, financial position and cash flows as if it recorded its interests in the Agua Caliente Borrower 2 LLC on January 1, 2016, and its interests in the Utah Solar Portfolio on November 2, 2016.
The following is a summary of assets and liabilities transferred in connection with the acquisition of the March 2017 Drop Down Assets as of March 27, 2017:
 (In millions)
Assets: 
Cash$6
Equity investment in projects456
   Total assets acquired462
Liabilities: 
Debt (Current and non-current) (a)
320
Other current and non-current liabilities3
   Total liabilities assumed323
      Net assets acquired$139
(a)Net of $8 million of debt issuance costs.
The following tables present a summary of the Company's historical information combining the financial information for the March 2017 Drop Down Assets and August 2017 Drop Down Assets transferred in connection with the acquisition:
 Three months ended September 30, 2016 Nine months ended September 30, 2016
 As Previously Reported March 2017 Drop Down Assets August 2017 Drop Down Assets As Currently Reported As Previously Reported March 2017 Drop Down Assets August 2017 Drop Down Assets As Currently Reported
(In millions)               
Total operating revenues$272
 $
 $
 $272
 $789
 $
 $
 $789
Operating income118
 
 
 118
 319
 
 
 319
Net income64
 3
 
 67
 147
 5
 
 152
Net income attributable to Yield LLC100
 3
 2
 105
 209
 5
 5
 219
2016 Acquisitions
CVSR Drop Down Prior to September 1, 2016, the Company had a 48.95% interest in CVSR, which was accounted for as an equity method investment.On September 1, 2016, the Company acquired from NRG the remaining 51.05% interest of CVSR Holdco LLC, which indirectly owns the CVSR solar facility, for total cash consideration of $78.5 million plus an immaterial working capital adjustment. The Company also assumed additional debt of $496 million, which represents 51.05% of the CVSR project level debt and 51.05% of the notes issued under the CVSR Holdco Financing Agreement, as of the closing date, as further described in Note 10, Long-term Debt, to the consolidated financial statements for the year ended December 31, 2016 included in the Company's May 9, 2017 Form 8-K. The acquisition was funded with cash on hand.


The assets and liabilities transferred to the Company relate to interests under common control by NRG and were recorded at historical cost in accordance with ASC 805-50, Business Combinations - Related Issues. The difference between the cash paid and historical value of the CVSR Drop Down of $112 million, as well as $6 million of AOCL, was recorded as a distribution to NRG with the offset to contributed capital. Because the transaction constituted a transfer of net assets under common control, the guidance requires retrospective combination of the entities for all periods presented as if the combination has been in effect since the inception of common control. In connection with the retrospective adjustment of prior periods, the Company now consolidates CVSR and 100% of its debt, consisting of $771 million of project level debt and $200 million of notes issued under the CVSR Holdco Financing Agreement as of September 1, 2016. In connection with the retrospective adjustment of prior periods, the Company has removed the equity method investment from all prior periods and adjusted its financial statements to reflect its results of operations, financial position and cash flows as if it had consolidated CVSR from the beginning of the financial statement period.
Note 4 — Investments Accounted for by the Equity Method and Variable Interest Entities
Entities that are Consolidated
The Company has a controlling financial interest in certain entities which have been identified as VIEs under ASC 810, Consolidations, or ASC 810.Consolidation. These arrangements are primarily related to tax equity arrangements entered into with third parties in order to monetize certain tax creditsattributes associated with wind and solar facilities, as further described inunder Item 15 — Note 5, Investments Accounted for by the Equity Method and Variable Interest Entities, to the consolidated financial statements for the year ended December 31, 2016included in the Company's May 9, 20172020 Form 8-K.10-K.
Summarized financial information for the Company's consolidated VIEs consisted of the following as of SeptemberJune 30, 2017:2021:
(In millions)Alta TE HoldcoBuckthorn Renewables, LLC
DGPV Funds(a)
Kawailoa PartnershipLangford TE Partnership LLCLighthouse Renewable Holdco LLC
Other current and non-current assets$59 $$96 $42 $15 $41 
Property, plant and equipment344 206 611 138 135 437 
Intangible assets218 16 
Total assets621 210 723 180 152 478 
Current and non-current liabilities38 10 77 106 17 126 
Total liabilities38 10 77 106 17 126 
Noncontrolling interest26 51 51 74 313 
Net assets less noncontrolling interests$557 $149 $642 $23 $61 $39 
(a)DGPV Funds is comprised of DGPV Fund 2 LLC, Clearway & EFS Distributed Solar LLC, DGPV Fund 4 LLC, Golden Puma Fund LLC, Renew Solar CS4 Fund LLC and Chestnut Fund LLC.
(In millions)Oahu
Solar Partnership
Pinnacle Repowering Partnership LLCRattlesnake TE Holdco LLCRosie TargetCo LLCWildorado
 TE Holdco
Other (a)
Other current and non-current assets$50 $12 $31 $27 $21 $16 
Property, plant and equipment175 100 196 255 232 178 
Intangible assets19 
Total assets225 131 227 282 253 195 
Current and non-current liabilities117 102 21 101 18 44 
Total liabilities117 102 21 101 18 44 
Noncontrolling interest35 27 98 147 127 99 
Net assets less noncontrolling interests$73 $$108 $34 $108 $52 
(a)Other is comprised of Crosswind Transmission, LLC, Hardin Hilltop Wind LLC, Elbow Creek TE Holdco and Spring Canyon TE Holdco projects.
22

(In millions)NRG Wind TE Holdco Alta Wind TE Holdco Spring Canyon
Other current and non-current assets$175
 $17
 $4
Property, plant and equipment417
 443
 96
Intangible assets2
 265
 
Total assets594
 725
 100
Current and non-current liabilities206
 9
 6
Total liabilities206
 9
 6
Noncontrolling interest22
 96
 63
Net assets less noncontrolling interests$366
 $620
 $31
The discussion below describes material changes to VIEs during the six months ended June 30, 2021.
Rattlesnake TE Holdco LLC —As described in Note 3, Acquisitions and Dispositions, on January 12, 2021, the Company acquired CEG's equity interest and a third party investor's minority interest in CWSP Rattlesnake Holding LLC for $132 million. CWSP Rattlesnake Holding LLC owns Rattlesnake Class B LLC, which owns the Class B membership interests in Rattlesnake TE Holdco LLC, which is a VIE. Rattlesnake Class B LLC is the primary beneficiary and managing member and consolidates its interest in Rattlesnake TE Holdco LLC, which owns the Rattlesnake wind project. Subsequent to the acquisition, on January 12, 2021 the third party tax equity investor contributed $107 million into Rattlesnake TE Holdco LLC in exchange for the Class A membership interests. The proceeds from the tax equity contribution along with cash contributed by CEG were used to repay a portion of the $176 million of the outstanding principal under the Rattlesnake Class B LLC credit facility.
The Company utilizes the HLBV method to determine the net income or loss allocated to tax equity noncontrolling interest.
Pinnacle Repowering Partnership LLC On February 26, 2021, the Company entered into an amended agreement with CWSP Pinnacle Holding LLC, an indirect subsidiary of CEG, with respect to Pinnacle Repowering Partnership LLC in order to facilitate the repowering of the Pinnacle wind project, a 55 MW wind facility located in Mineral County, West Virginia. On March 10, 2021, the Company contributed its interest in the Pinnacle wind project to Pinnacle Repowering Partnership LLC concurrent with entering into a financing agreement as further described in Note 7, Long-term Debt. The Company owns 100% of the Class A membership interests in Pinnacle Repowering Partnership LLC, which is a VIE, and the Company consolidates its interest as the primary beneficiary and managing member. CWSP Pinnacle Holding LLC owns 100% of the Class B membership interests in Pinnacle Repowering Partnership LLC and is entitled to allocations of 15% of the cash distributions from the partnership. On March 10, 2021, CWSP Pinnacle Holding LLC contributed $27 million in equipment to the partnership, which was a transfer of assets under common control and recorded at historical cost in property, plant and equipment, with a corresponding non-cash contribution in Pinnacle Repowering Partnership LLC's noncontrolling interests. Additionally, on March 10, 2021, the Pinnacle wind project acquired equipment from CEG for $21 million in cash consideration.
Entities that are not Consolidated
The Company has interests in entities that are considered VIEs under ASC 810, but for which it is not considered the primary beneficiary.The Company accounts for its interests in these entities and entities in which it has a significant investment under the equity method of accounting, as further described inunder Item 15 — Note 5,Investments Accounted for by the Equity Method and Variable Interest Entities, to the consolidated financial statements for the year ended December 31, 2016included in the Company's May 9, 2017 2020Form 8-K.10-K.
The Company's maximum exposure to loss as of SeptemberJune 30, 20172021 is limited to its equity investment in the unconsolidated entities, as further summarized in the table below:
NameEconomic
 Interest
Investment Balance
(In millions)
Avenal50%$(3)
Desert Sunlight25%244 
Elkhorn Ridge67%34 
GenConn(a)
50%88 
San Juan Mesa75%29 
Utah Solar Portfolio(b)
50%247 
$639 
(In millions)Maximum exposure to loss
Four Brothers Solar, LLC$221
Granite Mountain Holdings, LLC81
Iron Springs Holdings, LLC56
GenConn Energy LLC102
NRG DGPV Holdco 1 LLC71
NRG RPV Holdco 1 LLC65
NRG DGPV Holdco 2 LLC54
NRG DGPV Holdco 3 LLC20
(a) GenConn is a variable interest entity.


NRG DGPV Holdco 2 LLC The Company contributed $37 million into NRG DGPV Holdco 2 LLC, or DGPV Holdco 2 during the nine months ended September 30, 2017, with an additional $2 million due to NRG in accounts payable — affiliate as of September 30, 2017, to be funded in tranches as the project milestones are completed. The Company co-owns approximately 107 MW of distributed solar capacity,(b) Economic interest based on cash to be distributed, with a weighted average contract life of approximately 21 years as of September 30, 2017.
On October 12, 2017, the Company and NRG amended the DGPV Holdco 2 partnership agreement to increase the aggregate commitment of $50 million to $60 million in order to accommodate funding of additional projects.
NRG DGPV Holdco 3 LLCOn September 26, 2017, the Company entered into an additional partnership with NRG by forming NRG DGPV Holdco 3 LLC, or DGPV Holdco 3, in which the Company would invest up to $50 million in an operating portfolio of distributed solar assets, primarily comprised of community solar projects, developed by NRG. The Company invested $4 million during September 2017 with an additional $16 million due to NRG in accounts payable - affiliate as of September 30, 2017, to be funded in tranches as the project milestones are completed. The Company co-owns approximately 33 MW of distributed solar capacity, based on cash to be distributed, with a weighted average contract life of approximately 20 years as of September 30, 2017.
Utah Solar Portfolio As described in Note 3, Business Acquisitions, on March 27, 2017, as part of the March 2017 Drop Down Assets acquisition, the Company acquired from NRG 100% of the Class A equity interests in the Utah Solar Portfolio, comprised ofdistributed. Four Brothers Solar, LLC, Granite Mountain Holdings, LLC and Iron Springs Holdings, LLC. The Class B interests of the Utah Solar PortfolioLLC are owned by a tax equity investor, or TE Investor, who receives 99% of allocations of taxable incomestructures and other items until the flip point, which occurs when the TE Investor obtains a specified return on its initial investment, at which time the allocations to the TE Investor change to 50%. The Company generally receives 50% of distributable cash throughout the term of the tax-equity arrangements. The three entities comprising the Utah Solar Portfolio are VIEs. As the Company is not the primary beneficiary, the Company uses the equity method of accounting to account for its interests in the Utah Solar Portfolio. The Company utilizes the HLBV method to determine its share of the income or losses in the investees.

The following tables present summarized financial information for the Utah Solar Portfolio:
23
  Three months ended September 30, Nine months ended September 30,
(In millions) 2017 2016 2017 2016
Income Statement Data:        
Utah Solar Portfolio        
Operating revenues $23
 $
 $60
 $
Operating income 9
 
 17
 
Net income 9
 
 17
 
  September 30, 2017 December 31, 2016
Balance Sheet Data: (In millions)
Utah Solar Portfolio    
Current assets $25
 $20
Non-current assets 1,091
 1,105
Current liabilities 9
 14
Non-current liabilities 21
 38

Non-recourse project-level debt of unconsolidated affiliates
Agua Caliente Financing As described in Note 3, Business Acquisitions, the Company acquired a 16% interest in the Agua Caliente solar facility through its acquisition of Agua Caliente Borrower 2 LLC. As of September 30, 2017, Agua Caliente Solar LLC, the direct owner of the Agua Caliente solar facility, had $833 million outstanding under the Agua Caliente financing agreement with the Federal Financing Bank, or FFB, borrowed to finance the costs of constructing the facility.  The Company's pro-rata share of the Agua Caliente financing arrangement was $133 million as of September 30, 2017. Amounts borrowed under the Agua Caliente financing agreement accrue interest at a fixed rate based on U.S. Treasury rates plus a spread of 0.375%, mature in 2037 and are secured by the assets of Agua Caliente Solar LLC. The loans provided by the FFB are guaranteed by the U.S. DOE. 


Note 5Fair Value of Financial Instruments
Fair Value Accounting under ASC 820
ASC 820 establishes a fair value hierarchy that prioritizes the inputs to valuation techniques used to measure fair value into three levels as follows:
Level 1—quoted prices (unadjusted) in active markets for identical assets or liabilities that the Company has the ability to access as of the measurement date.
Level 2—inputs other than quoted prices included within Level 1 that are directly observable for the asset or liability or indirectly observable through corroboration with observable market data.
Level 3—unobservable inputs for the asset or liability only used when there is little, if any, market activity for the asset or liability at the measurement date.
In accordance with ASC 820, the Company determines the level in the fair value hierarchy within which each fair value measurement in its entirety falls, based on the lowest level input that is significant to the fair value measurement.
For cash and cash equivalents, restricted cash, accounts receivable accounts receivable affiliate,trade, accounts payable — trade, current portion of the accounts payable — affiliates, accrued expenses and other liabilities, the carrying amounts approximate fair value because of the short-term maturity of those instruments and are classified as Level 1 within the fair value hierarchy.
The estimated carrying amounts and fair values of the Company’s recorded financial instruments not carried at fair market value are as follows:
 As of September 30, 2017 As of December 31, 2016
 Carrying Amount Fair Value Carrying Amount Fair Value
(In millions) 
Assets:       
Notes receivable (a)
$18
 $18
 $30
 $30
Liabilities:       
Long-term debt — affiliate618
 626
 618
 608
Long-term debt — external, including current portion (b)
$5,268
 $5,301
 $5,451
 $5,435
As of June 30, 2021As of December 31, 2020
Carrying AmountFair ValueCarrying AmountFair Value
(In millions)
Liabilities:
Long-term debt, including current portion — affiliate$$$$
Long-term debt, including current portion — external (a)
$8,030 $8,006 $7,048 $7,020 
(a) Includes the long-term portion of notes receivable, which is recorded in other noncurrent assets on the Company's consolidated balance sheets.
(b)Excludes deferred financingnet debt issuance costs, which are recorded as a reduction to long-term debt on the Company's consolidated balance sheets.
24

The fair value of the Company's publicly-traded long-term debt is based on quoted market prices and is classified as Level 2 within the fair value hierarchy. The fair value of debt securities, non-publicly traded long-term debt and certain notes receivable of the Company are based on expected future cash flows discounted at market interest rates, or current interest rates for similar instruments with equivalent credit quality and are classified as Level 3 within the fair value hierarchy. The following table presents the level within the fair value hierarchy for long-term debt, including current portion as of SeptemberJune 30, 20172021 and December 31, 2016:2020:
 As of September 30, 2017 As of December 31, 2016
 Level 2 Level 3 Level 2 Level 3
 (In millions)
Long-term debt, including current portion$884
 $5,043
 $833
 $5,210


As of June 30, 2021As of December 31, 2020
Level 2Level 3Level 2Level 3
 (In millions)
Long-term debt, including current portion$2,166 $5,841 $1,906 $5,115 
Recurring Fair Value Measurements
The Company records its derivative assets and liabilities at fair market value on its consolidated balance sheet. The following table presents assets and liabilities measured and recorded at fair value on the Company's consolidated balance sheets on a recurring basis and their level within the fair value hierarchy:
As of June 30, 2021As of December 31, 2020
Fair Value (a)
Fair Value (a)
(In millions)Level 2Level 3Level 2Level 3
Derivative assets:
Interest rate contracts$$$$
Other financial instruments (b)
24 29 
Total assets$$24 $$29 
Derivative liabilities:
Commodity contracts$$103 $$44 
Interest rate contracts86 129 
Total liabilities$86 $103 $129 $44 
 As of September 30, 2017 As of December 31, 2016
 
Fair Value (a)
 
Fair Value (a)
 
Fair Value (a)
(In millions)Level 2 Level 1 Level 2
Derivative assets:     
Commodity contracts$
 $1
 $1
Interest rate contracts
 
 1
Total assets
 1
 2
Derivative liabilities:     
Commodity contracts2
 
 1
Interest rate contracts64
 
 75
Total liabilities$66
 $
 $76
(a) There were no derivative assets classified as Level 1 or Level 3 and no liabilities classified as Level 1 as of SeptemberJune 30, 2017. There were no derivative assets or liabilities classified as Level 3 as of September 30, 20172021 and December 31, 2016.2020.
(b) SREC contract acquired on November 2, 2020.
The following table reconciles the beginning and ending balances for instruments that are recognized at fair value in the condensed consolidated financial statements using significant unobservable inputs:
Three months ended June 30,Six months ended June 30,
2021202020212020
(In millions)Fair Value Measurement Using Significant Unobservable Inputs (Level 3)Fair Value Measurement Using Significant Unobservable Inputs (Level 3)
Beginning balance$(39)$(14)$(15)$(9)
Total losses for the period included in earnings(33)(3)(57)(8)
Purchases(9)(9)
Settlements
Ending balance$(79)$(17)$(79)$(17)
Change in unrealized losses included in earnings for derivatives and other financial instruments held as of June 30, 2021$(33)0$(57)0

25

Derivative and Financial Instruments Fair Value Measurements
The Company's contracts are non-exchange-traded and valued using prices provided by external sources. For the Company’sThe Company uses quoted observable forward prices to value its energy markets, management receives quotes from multiple sources.contracts. To the extent that multiple quotesobservable forward prices are received,not available, the quoted prices reflect the average of the bid-ask mid-pointforward prices obtained from all sources believedthe prior year, adjusted for inflation. As of June 30, 2021, contracts valued with prices provided by models and other valuation techniques make up 54% of derivative liabilities and 100% of other financial instruments.
The Company’s significant positions classified as Level 3 include physical power contracts executed in illiquid markets. The significant unobservable inputs used in developing fair value include illiquid power tenors and location pricing, which is derived by extrapolating pricing as a basis to provideliquid locations. The tenor pricing and basis spread are based on observable market data when available or derived from historic prices and forward market prices from similar observable markets when not available.
The following table quantifies the most liquid market forsignificant unobservable inputs used in developing the commodity.fair value of the Company's Level 3 positions as of June 30, 2021:
June 30, 2021
Fair ValueInput/Range
AssetsLiabilitiesValuation TechniqueSignificant Unobservable InputLowHighWeighted Average
(In millions)
Power Contracts$$(103)Discounted Cash FlowForward Market Price (per MWh)12.56 58.94 25.95 
Other Financial Instruments$24 $Discounted Cash FlowForecast annual generation levels of certain DG solar facilities80,872 MWh129,913 MWh124,783 MWh
The following table provides sensitivity of fair value measurements to increases/(decreases) in significant unobservable inputs as of June 30, 2021:
Significant Observable InputPositionChange In InputImpact on Fair Value Measurement
Forward Market Price PowerBuyIncrease/(Decrease)Higher/(Lower)
Forward Market Price PowerSellIncrease/(Decrease)Lower/(Higher)
Forecast Generation LevelsSellIncrease/(Decrease)Higher/(Lower)
The fair value of each contract is discounted using a risk freerisk-free interest rate. In addition, a credit reserve is applied to reflect credit risk, which is, for interest rate swaps, calculated based on credit default swaps using the bilateral method. For commodities, to the extent that the net exposure under a specific master agreement is an asset, the Company uses the counterparty’s default swap rate. If the net exposure under a specific master agreement is a liability, the Company uses NRG'sa proxy of its own default swap rate. For interest rate swaps and commodities, the credit reserve is added to the discounted fair value to reflect the exit price that a market participant would be willing to receive to assume the liabilities or that a market participant would be willing to pay for the assets. As of SeptemberJune 30, 2017,2021, the creditnon-performance reserve resultedwas a $9 million gain recorded primarily to total operating revenues in a $1 million increase in fair value in interest expense.the consolidated statement of operations. It is possible that future market prices could vary from those used in recording assets and liabilities and such variations could be material.
26

Concentration of Credit Risk
In addition to the credit risk discussion inas disclosed under Item 15 — Note 2, Summary of Significant Accounting Policies, to the consolidated financial statements for the year ended December 31, 2016 included in the Company's May 9, 20172020 Form 8-K,10-K, the following item is a discussion of the concentration of credit risk for the Company's financial instruments. Credit risk relates to the risk of loss resulting from non-performance or non-payment by counterparties pursuant to the terms of their contractual obligations. The Company monitors and manages credit risk through credit policies that include: (i) an established credit approval process; (ii) daily monitoring of counterparties' credit limits;limits on as needed basis; (iii) as applicable, the use of credit mitigation measures such as margin, collateral, prepayment arrangements, or volumetric limits; (iv) the use of payment netting agreements; and (v) the use of master netting agreements that allow for the netting of positive and negative exposures of various contracts associated with a single counterparty. Risks surrounding counterparty performance and credit could ultimately impact the amount and timing of expected cash flows. The Company seeks to mitigate counterparty risk by having a diversified portfolio of counterparties.


Counterparty credit exposure includes credit risk exposure under certain long-term agreements, including solar and other PPAs. As external sources or observable market quotes are not available to estimate such exposure, the Company estimates the exposure related to these contracts based on various techniques including, but not limited to, internal models based on a fundamental analysis of the market and extrapolation of observable market data with similar characteristics. Based on these valuation techniques, as of September 30, 2017, credit risk exposure to these counterparties attributable to the Company's ownership interests was approximately $2.9 billion for the next five years. The majorityA significant portion of these power contracts are with utilities with strong credit quality and public utility commission or other regulatory support. However, such regulated utility counterparties can be impacted by changes in government regulations or adverse financial conditions, which the Company is unable to predict. Certain subsidiaries of the Company sell the output of their facilities to PG&E, a significant counterparty of the Company, under long-term PPAs, and PG&E's credit rating is below investment grade.
Note 6Accounting for Derivative Instruments and Hedging Activities
This footnote should be read in conjunction with the complete description under Item 15 — Note 7, Accounting for Derivative Instruments and Hedging Activities, to the consolidated financial statements for the year ended December 31, 2016included in the Company's May 9, 20172020 Form 8-K.
Energy-Related Commodities
As of September 30, 2017, the Company had energy-related derivative instruments extending through 2020. At September 30, 2017, these contracts were not designated as cash flow or fair value hedges.10-K.
Interest Rate Swaps
The Company enters into interest rate swap agreements in order to hedge the variability of expected future cash interest payments. As of SeptemberJune 30, 2017,2021, the Company had interest rate derivative instruments on non-recourse debt extending through 2036,2044, a portion of which arewere designated as cash flow hedges. Under the interest rate swap agreements, the Company pays a fixed rate and the counterparties to the agreements pay a variable interest rate.
Energy-Related Commodities
As of June 30, 2021, the Company had energy-related derivative instruments extending through 2032. At June 30, 2021, these contracts were not designated as cash flow or fair value hedges.
Volumetric Underlying Derivative Transactions
The following table summarizes the net notional volume buybuy/(sell) of the Company's open derivative transactions broken out by commodity:commodity as of June 30, 2021 and December 31, 2020:
Total Volume
June 30, 2021December 31, 2020
CommodityUnits(In millions)
Natural GasMMBtu
PowerMWh(13)(8)
InterestDollars$1,486 $1,600 
27

   Total Volume
   September 30, 2017 December 31, 2016
CommodityUnits (In millions)
Natural GasMMBtu 2
 3
InterestDollars $1,983
 $2,070
Fair Value of Derivative Instruments
There were no derivative asset positions on the balance sheet as of September 30, 2017. The following table summarizes the fair value within the derivative instrument valuation on the balance sheet:
Fair Value
Derivative AssetsDerivative Liabilities
June 30, 2021December 31, 2020June 30, 2021December 31, 2020
(In millions)
Derivatives Designated as Cash Flow Hedges:
Interest rate contracts current$$$$
Interest rate contracts long-term15 
Total Derivatives Designated as Cash Flow Hedges$$$14 $23 
Derivatives Not Designated as Cash Flow Hedges:
Interest rate contracts current23 25 
Interest rate contracts long-term49 81 
Commodity contracts current14 
Commodity contracts long-term89 39 
Total Derivatives Not Designated as Cash Flow Hedges175 150 
Total Derivatives$$$189 $173 
28

 Fair Value
 Derivative Assets Derivative Liabilities
 December 31, 2016 September 30, 2017 December 31, 2016
 (In millions)
Derivatives Designated as Cash Flow Hedges:     
Interest rate contracts current$
 $7
 $26
Interest rate contracts long-term1
 13
 39
Total Derivatives Designated as Cash Flow Hedges1
 20
 65
Derivatives Not Designated as Cash Flow Hedges:     
Interest rate contracts current
 15
 5
Interest rate contracts long-term
 29
 5
Commodity contracts current2
 1
 1
Commodity contracts long-term
 1
 
Total Derivatives Not Designated as Cash Flow Hedges2
 46
 11
Total Derivatives$3
 $66
 $76


The Company has elected to present derivative assets and liabilities on the balance sheet on a trade-by-trade basis and does not offset amounts at the counterparty master agreement level. As of SeptemberJune 30, 2017, there were no offsetting amounts at the counterparty master agreement level nor outstanding collateral paid or received. As of2021 and December 31, 2016,2020, there was no outstanding collateral paid or received. The following tables summarize the offsetting of derivatives by the counterparty master agreement level as of June 30, 2021 and December 31, 2016:
2020:
As of June 30, 2021Gross Amounts of Recognized Assets/LiabilitiesDerivative InstrumentsNet Amount
Commodity contracts(In millions)
Derivative liabilities$(103)$$(103)
Total commodity contracts(103)(103)
Interest rate contracts
Derivative assets$$(4)$
Derivative liabilities(86)(82)
Total interest rate contracts(82)(82)
Total derivative instruments$(185)$$(185)
As of December 31, 2020As of December 31, 2020Gross Amounts of Recognized Assets/LiabilitiesDerivative InstrumentsNet Amount
Commodity contractsCommodity contracts(In millions)
As of December 31, 2016Gross Amounts of Recognized Assets/Liabilities Derivative Instruments Net Amount
Commodity contracts:(In millions)
Derivative assets$2
 $
 $2
Derivative liabilities(1) 
 (1)Derivative liabilities$(44)$$(44)
Total commodity contracts1
 
 1
Total commodity contracts(44)(44)
Interest rate contracts:     Interest rate contracts:
Derivative assets1
 (1) 
Derivative assets$$$
Derivative liabilities(75) 1
 (74)Derivative liabilities(129)(129)
Total interest rate contracts(74) 
 (74)Total interest rate contracts(128)(128)
Total derivative instruments$(73) $
 $(73)Total derivative instruments$(172)$$(172)
Accumulated Other Comprehensive Loss
The following table summarizes the effects on the Company’s accumulated OCL balance attributable to interest rate swaps designated as cash flow hedge derivatives:
Three months ended September 30, Nine months ended September 30,Three months ended June 30,Six months ended June 30,
2017 
2016 
 2017 20162021202020212020
(In millions)(In millions)
Accumulated OCL beginning balance
$(86) $(168) $(86) $(99)Accumulated OCL beginning balance$(22)$(51)$(35)$(37)
Reclassified from accumulated OCL to income due to realization of previously deferred amounts5
 6
 13
 13
Reclassified from accumulated OCL to income due to realization of previously deferred amounts
Mark-to-market of cash flow hedge accounting contracts2
 14
 (6) (62)Mark-to-market of cash flow hedge accounting contracts(3)(13)
Accumulated OCL ending balance(79) (148) (79) (148)Accumulated OCL ending balance(22)(46)(22)(46)
Accumulated OCL attributable to noncontrolling interests(1) (2) (1) (2)Accumulated OCL attributable to noncontrolling interests
Accumulated OCL attributable to NRG Yield LLC$(78) $(146) $(78) $(146)
Accumulated OCL attributable to Clearway Energy LLCAccumulated OCL attributable to Clearway Energy LLC$(22)$(46)$(22)$(46)
Losses expected to be realized from OCL during the next 12 months$17
   $17
  Losses expected to be realized from OCL during the next 12 months$(12)0$(12)0
Amounts reclassified from accumulated OCL into income and amounts recognized in income from the ineffective portion of cash flow hedges are recorded to interest expense. There was no ineffectiveness for the nine months ended September 30, 2017 and 2016.
Accounting guidelines require a high degree of correlation between the derivative and the hedged item throughout the period in order to qualify as a cash flow hedge. As of December 31, 2016, the Company's regression analysis for Viento Funding II interest rate swaps, while positively correlated, did not meet the required threshold for cash flow hedge accounting. As a result, the Company de-designated the Viento Funding II cash flow hedges as of December 31, 2016, and will prospectively mark these derivatives to market through the income statement.
29

The Company's regression analysis for Marsh Landing, Walnut Creek and Avra Valley interest rate swaps, while positively correlated, no longer contain matching terms for cash flow hedge accounting. As a result, the Company voluntarily de-designated the Marsh Landing, Walnut Creek and Avra Valley cash flow hedges as of April 28, 2017, and will prospectively mark these derivatives to market through the income statement.


Impact of Derivative Instruments on the Statements of Income
The Company has interest rate derivative instruments that are not designated as cash flow hedges. The effect of interest rate hedges is recorded to interest expense. For the three months ended September 30, 2017Gains and 2016, the impactlosses related to the consolidated statements of income was a gain of $7 million and $2 million, respectively. For the nine months ended September 30, 2017 and 2016, the impact toCompany's derivatives are recorded in the consolidated statementsstatement of income was a loss of $2 millionoperations as follows:
Three months ended June 30,Six months ended June 30,
2021202020212020
(In millions)
Interest Rate Contracts (Interest expense)$(11)$(13)$36 $(92)
Commodity Contracts (Mark-to-market for economic hedging activities) (a)(28)(3)(50)(8)
(a) Relates to long-term power hedges at Elbow Creek Wind Project LLC, or Elbow Creek, Mesquite Star Special LLC, or Mesquite Star, and $7 million, respectively.NedPower Mount Storm LLC, or Mt. Storm.
A portion of the Company’s derivative commodity contracts relates to its Thermal Business for the purchase of fuelfuel/electricity commodities based on the forecasted usage of the thermal district energy centers. Realized gains and losses on these contracts are reflected in the fuel costs that are permitted to be billed to customers through the related customer contracts or tariffs and, accordingly, no gains or losses are reflected in the consolidated statements of incomeoperations for these contracts.
See Note 5, Fair Value of Financial Instruments, for a discussion regarding concentration of credit risk.


30

Note 7Long-term Debt
This footnotenote should be read in conjunction with the complete description under Item 15 — Note 10, Long-term Debt,to the consolidated financial statements for the year ended December 31, 2016 included in the Company's May 9, 20172020 Form 8-K.10-K. Long-term debt consisted of the following:
(In millions, except rates)June 30, 2021December 31, 2020June 30, 2021 interest rate % (a)Letters of Credit Outstanding at June 30, 2021
Intercompany Note with Clearway Energy, Inc.$$1.490 
2025 Senior Notes600 5.750 
2026 Senior Notes350 350 5.000 
2028 Senior Notes850 850 4.750 
2031 Senior Notes925 3.750 
Clearway Energy LLC and Clearway Energy Operating LLC Revolving Credit Facility, due 2023 (b)
67 L+1.75088 
Project-level debt:
Agua Caliente Solar LLC, due 2037712 2.395- 3.63344 
Alta Wind Asset Management LLC, due 203114 14 L+2.62526 
Alta Wind I-V lease financing arrangements, due 2034 and 2035772 800 5.696- 7.015
Alta Wind Realty Investments LLC, due 203125 25 7.000
Borrego, due 2024 and 203857 57 Various
Buckthorn Solar, due 2025125 126 L+1.75023 
Carlsbad Energy Holdings LLC, due 2027156 156 L+1.62582 
Carlsbad Energy Holdings LLC, due 2038407 407 4.120 
Carlsbad Holdco, due 2038210 210 4.210 10 
CVSR Holdco Notes, due 2037169 176 4.680 13 
CVSR, due 2037662 675 2.339 - 3.775
DG-CS Master Borrower LLC, due 2040462 467 3.510 30 
Duquesne, due 205995 95 4.620 
El Segundo Energy Center, due 2023213 250 L+1.875 - L+2.500138 
Energy Center Minneapolis Series D, E, F, G, H Notes, due 2025-2037327 327 Various
Kawailoa Solar Portfolio LLC, due 202680 81 L+1.37515 
Laredo Ridge, due 202875 78 L+2.125
Marsh Landing, due 2023129 146 L+2.37599 
NIMH Solar, due 2024185 191 L+2.0016 
Oahu Solar Holdings LLC, due 202688 89 L+1.37511 
Pinnacle Repowering Partnership Holdco LLC, due 202190 L+1.00
Rosie Class B LLC, due 202780 80 L+1.7521 
Tapestry Wind LLC, due 203188 143 L+1.37511 
Utah Solar Holdings, due 2036284 290 3.590 16 
Walnut Creek, due 2023110 126 L+1.75103 
WCEP Holdings, LLC, due 202332 35 L+3.00
Other187 199 Various38 
Subtotal project-level debt:5,834 5,243 
Total debt8,027 7,044 
Less current maturities(519)(385)
Less net debt issuance costs(78)(79)
Add premiums(c)
Total long-term debt$7,434 $6,585 

  September 30, 2017 December 31, 2016 
September 30, 2017, interest rate % (a)
 Letters of Credit Outstanding at September 30, 2017
  (In millions, except rates)  
Long-term debt - affiliate, due 2019 $337
 $337
 3.580  
Long-term debt - affiliate, due 2020 281
 281
 3.325  
2024 Senior Notes 500
 500
 5.375  
2026 Senior Notes 350
 350
 5.000  
Project-level debt:        
Agua Caliente Borrower 2, due 2038 41
 
 5.430 17
Alpine, due 2022 138
 145
 L+1.750 37
Alta Wind I - V lease financing arrangements, due 2034 and 2035 940
 965
 5.696 - 7.015 103
CVSR, due 2037 746
 771
 2.339 - 3.775 
CVSR Holdco Notes, due 2037 194
 199
 4.680 13
El Segundo Energy Center, due 2023 400
 443
 L+1.75 - L+2.375 102
Energy Center Minneapolis, due 2017 and 2025 82
 96
 5.950 -7.250 
Energy Center Minneapolis Series D Notes, due 2031 125
 125
 3.550 
Laredo Ridge, due 2028 96
 100
 L+1.875 10
Marsh Landing, due 2017 and 2023 334
 370
 L+1.750 - L+1.875 34
Tapestry, due 2021 165
 172
 L+1.625 20
Utah Solar Portfolio, due 2022 284
 287
 L+2.625 13
Viento, due 2023 169
 178
 L+3.00 27
Walnut Creek, due 2023 279
 310
 L+1.625 49
Other 425
 440
 Various 37
Subtotal project-level debt: 4,418
 4,601
    
Total debt 5,886
 6,069
    
  Less current maturities (300) (291)    
Less net debt issuance costs (54) (62)    
Total long-term debt $5,532
 $5,716
    
(a)As of SeptemberJune 30, 2017,2021, L+equals 3 month LIBOR plus x%, except for the Utah Solar Portfolio,Clearway Energy Operating LLC Revolving Credit Facility, due 2023, Marsh Landing, due 2023, Pinnacle Repowering Partnership HoldCo LLC, due 2021, and Walnut Creek, due 2023, where L+equals 1 month LIBOR plus x%.
(b) Applicable rate is determined by the borrower leverage ratio, as defined in the credit agreement.
(c) Premiums relate to the 2028 Senior Notes.
31


The financing arrangements listed above contain certain covenants, including financial covenants that the Company is required to be in compliance with during the term of the respective arrangement. As of SeptemberJune 30, 2017,2021, the Company was in compliance with all of the required covenants.
The discussion below describes material changes to or additions of long-term debt for the ninesix months ended SeptemberJune 30, 2017.2021.
NRG YieldClearway Energy LLC and NRG YieldClearway Energy Operating LLC Revolving Credit Facility
As of SeptemberJune 30, 2017, there were no outstanding2021, the Company had $67 million of borrowings under the revolving credit facility and the Company had $68$88 million ofin letters of credit outstanding.
Thermal Financing
On March 16, 2017, NRG Energy Center Minneapolis LLC, a subsidiary of NRG Thermal LLC, amended During the shelfsix months ended June 30, 2021, the Company borrowed $300 million under the revolving credit facility, of its existing Thermal financing arrangement to allow forand subsequently repaid $233 million, utilizing cash on hand and proceeds from the issuance of an additional $10the 2031 Senior Notes as described below. During July 2021, the company repaid the outstanding $67 million balance under the revolving credit facility and as of July 31, 2021, the Company had 0 loans outstanding under the revolving credit facility and a total of $75 million in letters of credit outstanding.
2031 Senior Notes
On March 9, 2021, Clearway Energy Operating LLC completed the sale of $925 million of Series Fsenior unsecured notes due 2031, or the 2031 Senior Notes. The 2031 Senior Notes bear interest at a 4.60%3.750% and mature on February 15, 2031. Interest on the 2031 Senior Notes is payable semi-annually on February 15 and August 15 of each year, and interest rate, or Series Fpayments will commence on August 15, 2021. The 2031 Senior Notes increasingare unsecured obligations of Clearway Energy Operating LLC and are guaranteed by the totalCompany and by certain of Clearway Energy Operating LLC's wholly owned current and future subsidiaries. The net proceeds from the 2031 Senior Notes were used to repurchase the 2025 Senior Notes, as well as to repay amounts outstanding under the Company’s revolving credit facility and for general corporate purposes.
2025 Senior Notes Tender Offer and Redemption
On March 9, 2021, the Company completed the repurchase of an aggregate principal amount of notes available for issuance under the shelf facility to $80 million. The Series F Notes will be secured by substantially all$411 million, or 68.6%, of the assets of NRG Energy Center Minneapolis LLC. NRG


Thermal LLC has guaranteed the indebtedness and its guarantee is secured by a pledge2025 Senior Notes outstanding as part of the equity interestscash tender offer announced on March 2, 2021. Additionally, $6 million of the 2025 Senior Notes that were subject to guaranteed delivery procedures were subsequently repurchased on March 11, 2021. On March 17, 2021, the Company exercised its right to optionally redeem the remaining principal amount of $183 million that were not validly tendered and purchased in all of NRG Thermal LLC’s subsidiaries.
Financing Relatedthe tender offer, pursuant to the terms of the indenture governing the 2025 Senior Notes. The 2025 Senior Notes repurchased and redeemed in March 2017 Drop Down Assets2021 were effectuated at a premium of approximately 106% for total consideration of $636 million and, as a result, the Company recorded a loss on extinguishment in the amount of $36 million. The Company recorded an additional $5 million loss on extinguishment to write off the remaining unamortized deferred financing fees related to the 2025 Senior Notes.
Intercompany Note with Clearway Energy, Inc.
On February 18, 2020, the Company entered into an intercompany demand promissory note with Clearway Energy, Inc. in the principal amount of $3 million. The unpaid principal amount bears interest at a rate equal to the short-term applicable federal rate, which is payable on the last day of each quarter, or at other times as agreed upon by the Company and Clearway Energy, Inc. The outstanding balance as of June 30, 2021 is $1 million.
Project - level Debt
Agua Caliente Borrower 2, due 2038Solar LLC
On February 17, 2017, Agua Caliente Borrower 1 LLC, an indirect subsidiaryAs part of NRG, and Agua Caliente Borrower 2 LLC, issued $130 millionthe acquisition of senior secured notes under the Agua Caliente Borrower 1 LLC and the consolidation of Agua Caliente, Borrower 2 LLC financing agreement, or Agua Caliente Holdco Financing Agreement, that bear interest at 5.43% and mature on December 31, 2038. Asas further described in Note 3, Business Acquisitions and Dispositions, on March 27, 2017, the Company acquired Agua Caliente Borrower 2 LLC from NRG as partconsolidated non-recourse debt of the March 2017 Drop Down Assets acquisition and assumed NRG's portion of senior secured notes under the Agua Caliente Holdco Financing Agreement. Agua Caliente Borrower 2 LLC holds $41$716 million of the Agua Caliente Holdco debt as of September 30, 2017. The debt is joint and several with respectrelated to Agua Caliente Borrower 1Solar, LLC on February 3, 2021. The debt consists of a credit agreement with the Federal Financing Bank and Agua Caliente Borrower 2accrues interest at fixed rates between 2.395% and 3.633%, which matures in 2037.
Pinnacle Repowering Partnership HoldCo LLC and is secured by
On March 10, 2021, the equity interestsCompany entered into a financing agreement for non-recourse debt for a total commitment of each borrower in$126 million related to the Agua Caliente solar facility.
Utah Solar Portfolio, due 2022
As partrepowering of the March 2017 Drop Down Assets acquisition, the Company assumed non-recoursePinnacle wind project. The debt consists of $287 million relating to the Utah Solar Portfolioa construction loan at an interest rate of LIBOR plus 2.625%1.00%. The debt matures on December 16, 2022. The $287 million consisted of $222 million outstanding at the time of NRG's acquisition of the Utah Solar Portfolio on November 2, 2016, and additionalCompany's initial borrowings of $65$79 million net of debt issuance costs, incurred during 2016. The Company holds $284were utilized to repay $53 million of the Utah Solar Portfolio debt asoutstanding balance under the Tapestry Wind LLC financing agreement, which related to the Pinnacle wind project, to pay vendor invoices and fees and to acquire certain equipment from Clearway Renew LLC to be utilized in the repowering project. The Company
32

will continue to draw on the construction loan to fund the repowering activities of September 30, 2017.the Pinnacle wind project up to the total commitment amount.
33

Note 8 — Segment Reporting
The Company’s segment structure reflects how management currently operates and allocates resources. The Company's businesses are primarily segregated based on conventional power generation, renewable businesses which consist of solar and wind, and the thermal and chilled water business. The Corporate segment reflects the Company's corporate costs.costs and includes eliminating entries. The Company's chief operating decision maker, its Chief Executive Officer, evaluates the performance of its segments based on operational measures including adjusted earnings before interest, taxes, depreciation and amortization, or Adjusted EBITDA, and CAFD, as well as economic gross margin and net income (loss).
Three months ended June 30, 2021
(In millions)Conventional GenerationRenewablesThermal
Corporate (a)
Total
Operating revenues$109 $222 $49 $$380 
Cost of operations, exclusive of depreciation, amortization and accretion shown separately below23 54 31 (1)107 
Depreciation, amortization and accretion31 89 128 
General and administrative
Transaction and integration costs
Development costs
Operating income (loss)55 78 (8)134 
Equity in earnings of unconsolidated affiliates
Other income, net(1)
Interest expense(16)(58)(4)(25)(103)
Net Income (Loss)$40 $27 $$(33)$40 
Total Assets$2,500 $8,617 $621 $25 $11,763 
(a)Includes eliminations
Three months ended June 30, 2020
(In millions)Conventional GenerationRenewablesThermalCorporateTotal
Operating revenues$107 $180 $42 $$329 
Cost of operations, exclusive of depreciation, amortization and accretion shown separately below22 39 26 87 
Depreciation, amortization and accretion33 59 99 
General and administrative11 
Development costs
Operating income (loss)52 81 (8)131 
Equity in earnings of unconsolidated affiliates15 16 
Gain on sale of unconsolidated affiliate49 49 
Other income, net
Interest expense(22)(42)(5)(24)(93)
Net Income$31 $54 $$18 $104 


34

Three months ended September 30, 2017Six months ended June 30, 2021
(In millions)Conventional Generation Renewables Thermal Corporate Total(In millions)Conventional GenerationRenewablesThermal
Corporate (a)
Total
Operating revenues$88
 $131
 $46
 $
 $265
Operating revenues$211 $308 $98 $$617 
Cost of operations16
 33
 29
 
 78
Depreciation and amortization27
 56
 5
 
 88
Cost of operations, exclusive of depreciation, amortization and accretion shown separately belowCost of operations, exclusive of depreciation, amortization and accretion shown separately below50 106 62 (1)217 
Depreciation, amortization and accretionDepreciation, amortization and accretion65 176 15 256 
General and administrative
 
 
 4
 4
General and administrative17 19 
Transaction and integration costsTransaction and integration costs
Development costsDevelopment costs
Operating income (loss)45
 42
 12
 (4) 95
Operating income (loss)96 25 18 (19)120 
Equity in earnings of unconsolidated affiliates3
 25
 
 
 28
Equity in earnings of unconsolidated affiliates12 
Other income, net1


 1
Other income, net
Loss on debt extinguishmentLoss on debt extinguishment(1)(41)(42)
Interest expense(13) (39) (2) (18) (72)Interest expense(27)(62)(9)(50)(148)
Net Income (Loss)$36
 $28
 $10
 $(22) $52
Net Income (Loss)$73 $(29)$10 $(110)$(56)
Total Assets$1,920
 $5,821
 $420
 $79
 $8,240

(a)Includes eliminations

Six months ended June 30, 2020
(In millions)Conventional GenerationRenewablesThermalCorporateTotal
Operating revenues$210 $287 $90 $$587 
Cost of operations, exclusive of depreciation, amortization and accretion shown separately below46 75 59 180 
Depreciation, amortization and accretion66 121 14 201 
General and administrative16 20 
Transaction and integration costs
Development costs
Operating income (loss)98 90 12 (17)183 
Equity in earnings of unconsolidated affiliates
Gain on sale of unconsolidated affiliate49 49 
Other income, net
Loss on debt extinguishment(3)(3)
Interest expense(52)(151)(10)(47)(260)
Net Income (Loss)$49 $(60)$$(17)$(25)


 Three months ended September 30, 2016
(In millions)Conventional Generation Renewables Thermal Corporate Total
Operating revenues$82
 $142
 $48
 $
 $272
Cost of operations14
 31
 31
 
 76
Depreciation and amortization20
 50
 5
 
 75
General and administrative
 
 
 3
 3
Operating income (loss)48
 61
 12
 (3) 118
Equity in earnings of unconsolidated affiliates3
 13
 
 
 16
Other income, net1


 1
Interest expense(13) (37) (2) (16) (68)
Net Income (Loss)$39
 $37
 $10
 $(19) $67
 Nine months ended September 30, 2017
(In millions)Conventional Generation Renewables Thermal Corporate Total
Operating revenues$246
 $391
 $130
 $
 $767
Cost of operations53
 100
 86
 
 239
Depreciation and amortization77
 149
 15
 
 241
General and administrative
 
 
 14
 14
Acquisition-related transaction and integration costs
 
 
 2
 2
Operating income (loss)116
 142
 29
 (16) 271
Equity in earnings of unconsolidated affiliates9
 54
 
 
 63
Other income, net1
 1
 
 1
 3
Interest expense(39) (128) (7) (53) (227)
Net Income (Loss)$87
 $69
 $22
 $(68) $110
Total Assets$1,920
 $5,821
 $420
 $79
 $8,240
 Nine months ended September 30, 2016
(In millions)Conventional Generation Renewables Thermal Corporate Total
Operating revenues$246
 $412
 $131
 $
 $789
Cost of operations53
 98
 87
 
 238
Depreciation and amortization60
 149
 15
 
 224
General and administrative
 
 
 8
 8
Operating income (loss)133
 165
 29
 (8) 319
Equity in earnings of unconsolidated affiliates10
 24
 
 
 34
Other income, net1
 2
 
 
 3
Interest expense(36) (115) (5) (48) (204)
Net Income (Loss)$108
 $76
 $24
 $(56) $152


Note 9 — Related Party Transactions
In addition to the transactions and relationships described elsewhere in thesethe notes to the consolidated financial statements, NRG and certain subsidiaries of NRGCEG provide services to the Company and itsCompany's project entities. Amounts due to NRGCEG subsidiaries are recorded as accounts payable - affiliate— affiliates and amounts due to the Company from NRG or itsCEG subsidiaries are recorded as accounts receivable - affiliate— affiliates in the Company's balance sheet.
Power Purchase Agreements (PPAs) between The disclosures below summarize the CompanyCompany's material related party transactions with CEG and NRG Power Marketing
Elbow Creek and Doverits subsidiaries that are parties to PPAs with NRG Power Marketing and generate revenue under the PPAs, which are recorded to operating revenuesincluded in the Company's consolidated statements of operations. For the threeoperating revenues and nine months ended September 30, 2017, Elbow Creek and Dover, collectively, generated revenue of $3 million and $10 million, respectively. For the three and nine months ended September 30, 2016, Elbow Creek and Dover, collectively, generated revenue of $4 million and $10 million, respectively.operating costs.
35

Energy Marketing Services Agreement by and between Thermal entities and NRG Power Marketing
NRG Energy Center Dover LLC, NRG Energy Center Minneapolis, NRG Energy Center Phoenix LLC, and NRG Energy Center Paxton LLC, or Thermal entities, are parties to Energy Marketing Services Agreements with NRG Power Marketing, a wholly-owned subsidiary of NRG. Under the agreements, NRG Power Marketing procures fuel and fuel transportation for the operation of Thermal entities. For the three and nine months ended September 30, 2017, Thermal entities purchased $1 million and $7 million, respectively, of natural gas from NRG Power Marketing. For the three and nine months ended September 30, 2016, Thermal entities purchased $1 million and $6 million, respectively, of natural gas from NRG Power Marketing.
Operation and Maintenance (O&M) Services Agreements by and between Company's subsidiaries and NRG
Certain of the Company's subsidiaries are party to O&M Services Agreements with NRG, pursuant to which NRG subsidiaries provide necessary and appropriate services to operate and maintain the subsidiaries' plant operations, businesses and thermal facilities. NRG is reimbursed for the provided services, as well as for all reasonable and related expenses and expenditures, and payments to third parties for services and materials rendered to or on behalf of the parties to the agreements. NRG is not entitled to any management fee or mark-up under the agreements. The following table summarizes material O&M costs recorded in the cost of operations line in the Company's consolidated statements of operations:
  Three months ended September 30, Nine months ended September 30,
(in millions) 2017 2016 2017 2016
O&M costs $10
 $9
 $29
 $28
There were balances of $21 million and $22 million due from the entities above to NRG in accounts payable — affiliate as of September 30, 2017 and December 31, 2016, respectively. As of September 30, 2017, $3 million was recorded in long term liabilities of the consolidated balance sheet.
O&MServices Agreements by and between GenConn and NRG
GenConn incurs fees under two O&M agreements with wholly-owned subsidiaries of NRG. For the three months and nine months ended September 30, 2017 and September 30, 2016, the aggregate fees incurred under the agreements were $1 million and $4 million for each period in each year, respectively.
Administrative Services Agreement by and between Marsh Landing and NRG West Coast LLC
On December 19, 2016, Marsh Landing entered into an administrative services agreement with NRG West Coast LLC, a wholly owned subsidiary of NRG. The administrative services agreement was previously between Marsh Landing and GenOn Energy Services, LLC, a wholly-owned subsidiary of NRG and was subsequently assigned to and assumed by NRG West Coast LLC. The Company reimbursed costs under this agreement of $4 million and $10 million for the three and nine months ended September 30, 2017, respectively. The Company reimbursed costs under the agreement of $4 million and $9 million for the three and nine months ended September 30, 2016, respectively.


Administrative Services Agreements by and between the Company and NRG RenewClearway Renewable Operation & Maintenance LLC
Various wholly-owned subsidiaries of the Company in the Renewables segment are party to administrative services agreements with NRG RenewClearway Renewable Operation and& Maintenance LLC, or RENOM, a wholly-owned subsidiary of NRG,CEG, which provides operation and maintenance, or O&M, services on behalf ofto these entities.subsidiaries. The Company incurred total expenses for these services in the amount of $6$14 million and $16$9 million for the three and nine months ended SeptemberJune 30, 2017,2021 and 2020, respectively. The Company incurred total expenses for these services of $4$27 million and $9$18 million for the three and ninesix months ended SeptemberJune 30, 2016,2021 and 2020, respectively. There was a balance of $4 million and $5$10 million due to RENOM as of SeptemberJune 30, 20172021 and December 31, 2016, respectively.2020.
ManagementAdministrative Services AgreementAgreements by and between the Company and NRGCEG
NRG providesVarious wholly-owned subsidiaries of the Company are parties to administrative services agreements with Clearway Asset Services and Clearway Solar Asset Management, two wholly-owned subsidiaries of CEG, which provide various operation, management,administrative services to the Company's subsidiaries. The Company incurred expenses under these agreements of $4 million and $2 million for the three months ended June 30, 2021 and 2020, respectively. The Company incurred expenses under these agreements of $7 million and $4 million for the six months ended June 30, 2021 and 2020, respectively.
CEG Master Services Agreements
The Company is a party to Master Services Agreements with CEG, or MSAs, pursuant to which CEG and certain of its affiliates or third party service providers provide certain services to the Company, including operational and administrative services, which include human resources, accounting, tax, legal, information systems, treasury,external affairs, accounting, procurement and risk management services,and the Company provides certain services to CEG, including accounting, internal audit, tax and treasury services, in exchange for the payment of fees in respect of such services. Amounts due to CEG or its subsidiaries related to these MSAs are recorded as set forth in the Management Services Agreement. As of September 30, 2017, the base management fee was approximately $8 million per year, subject to an inflation-based adjustment annually at an inflation factor basedaccounts payable — affiliates on the year-over-year U.S. consumer price index.Company's consolidated balance sheet. The fee is also subject to adjustments followingCompany incurred net expenses of $1 million and $0.6 million under these agreements for the consummationthree months ended June 30, 2021 and 2020, respectively. The Company incurred net expenses of acquisitions and as a result of a change in the scope of services provided under the Management Services Agreement. Costs incurred under this agreement were $2 million and $8$1.2 million under these agreements for the three and ninesix months ended SeptemberJune 30, 2017,2021 and 2020, respectively. Costs incurred under this agreement for the three and nine months ended September 30, 2016 were $1 million and $6 million, respectively. The costs incurred under the Management Service Agreement included certain direct expenses incurred by NRG on behalf of the Company in addition to the base management fee.


36


Note 10 — Condensed Consolidating Financial InformationContingencies
As of September 30, 2017, Yield Operating LLC had outstanding $500 million of the 2024 Senior Notes and $350 million of the 2026 Senior Notes, collectively Senior Notes, as described in Note 10, Long-term Debt to the consolidated financial statements for the year ended December 31, 2016 included in the Company's May 9, 2017 Form 8-K. These Senior Notes are guaranteed by NRG Yield LLC, as well as certain of the Company's subsidiaries, or guarantor subsidiaries. These guarantees are both joint and several. The non-guarantor subsidiaries include the rest of the Company's subsidiaries, including those that are subject to project financing.
Unless otherwise noted below, each of the following guarantor subsidiaries fully and unconditionally guaranteed the Senior Notes as of September 30, 2017:
NRG Yield LLC
Alta Wind 1-5 Holding Company, LLC
Alta Wind Company, LLC
NRG Energy Center Omaha Holdings LLC
NRG Energy Center Omaha LLC
NYLD Fuel Cell Holdings LLC
UB Fuel Cell, LLC
NRG South Trent Holdings LLC
NRG Yield DGPV Holding LLC
NRG Yield RPV Holding LLC
Yield Operating LLC conducts its business through and derives its income from its subsidiaries. Therefore, its ability to make required payments with respect to its indebtedness and other obligations depends on the financial results and condition of its subsidiaries and Yield Operating LLC's ability to receive funds from its subsidiaries. There are no restrictions on the ability of any of the guarantor subsidiaries to transfer funds to Yield Operating LLC. However, there may be restrictions for certain non-guarantor subsidiaries.
The following condensed consolidating financial information presents the financial information of NRG Yield LLC, Yield Operating LLC, the issuer of the Senior Notes, the guarantor subsidiaries and the non-guarantor subsidiaries in accordance with Rule 3-10 under the SEC Regulation S-X. The financial information may not necessarily be indicative of results of operations or financial position had the guarantor subsidiaries or non-guarantor subsidiaries operated as independent entities.
In this presentation, NRG Yield LLC consists of parent company operations. Guarantor subsidiaries and non-guarantor subsidiaries of NRG Yield LLC are reported on an equity basis. For companies acquired, the fair values of the assets and liabilities acquired have been presented on a push-down accounting basis. As described in Note 1, Nature of Business, the Company completed the acquisition of the August 2017 Drop Down Assets, March 2017 Drop Down Assets and CVSR Drop Down Asset from NRG on August 1, 2017, March 27, 2017 and September 1, 2016, respectively. The guidance requires retrospective combination of the entities for all periods presented as if the combination has been in effect since the inception of common control. Accordingly, the Company prepared its condensed consolidating financial statements to reflect the transfers as if they had taken place from the beginning of the financial statements period.


NRG YIELD LLC AND SUBSIDIARIES
CONDENSED CONSOLIDATING STATEMENTS OF INCOME
For the Three Months Ended September 30, 2017
(Unaudited)
 NRG Yield LLC Other Guarantor Subsidiaries Non-Guarantor Subsidiaries NRG Yield Operating LLC (Note Issuer) 
Eliminations(a)
 Consolidated
 (In millions)
Operating Revenues           
Total operating revenues$
 $6
 $259
 $
 $
 $265
Operating Costs and Expenses           
Cost of operations
 3
 75
 
 
 78
Depreciation and amortization
 1
 87
 
 
 88
General and administrative
 
 
 4
 
 4
Total operating costs and expenses
 4
 162
 4
 
 170
Operating Income (Loss)
 2
 97
 (4) 
 95
Other Income (Expense)           
Equity in earnings (losses) of consolidated affiliates75
 (4) 
 59
 (130) 
Equity in earnings of unconsolidated affiliates
 7
 6
 15
 
 28
Other income, net
 
 1
 
 
 1
Interest expense
 
 (54) (18) 
 (72)
Total other income (expense), net75
 3
 (47) 56
 (130) (43)
Net Income75
 5
 50
 52
 (130) 52
Less: Net loss attributable to noncontrolling interests
 
 (1) (23) 1
 (23)
Net Income Attributable to NRG Yield LLC$75
 $5
 $51
 $75
 $(131) $75
(a) All significant intercompany transactions have been eliminated in consolidation.


NRG YIELD LLC AND SUBSIDIARIES
CONDENSED CONSOLIDATING STATEMENTS OF INCOME
For the Nine Months ended September 30, 2017
(Unaudited)
 NRG Yield LLC Other Guarantor Subsidiaries Non-Guarantor Subsidiaries NRG Yield Operating LLC (Note Issuer) 
Eliminations(a)
 Consolidated
 (In millions)
Operating Revenues           
Total operating revenues$
 $16
 $751
 $1
 $(1) $767
Operating Costs and Expenses           
Cost of operations
 10
 229
 1
 (1) 239
Depreciation and amortization
 3
 238
 
 
 241
General and administrative
 
 
 14
 
 14
Acquisition-related transaction and integration costs
 
 
 2
 
 2
Total operating costs and expenses
 13
 467
 17
 (1) 496
Operating Income (Loss)
 3
 284
 (16) 
 271
Other Income (Expense)           
Equity in earnings of consolidated affiliates165
 6
 
 153
 (324) 
Equity in earnings of unconsolidated affiliates
 9
 28
 26
 
 63
Other income, net1
 
 2
 
 
 3
Interest expense
 
 (173) (54) 
 (227)
Total other income (expense), net166
 15
 (143) 125
 (324) (161)
Net Income166
 18
 141
 109
 (324) 110
Less: Net loss attributable to noncontrolling interests
 
 (3) (56) 3
 (56)
Net Income Attributable to NRG Yield LLC$166
 $18
 $144
 $165
 $(327) $166
(a) All significant intercompany transactions have been eliminated in consolidation.


NRG YIELD LLC AND SUBSIDIARIES
CONDENSED CONSOLIDATING STATEMENTS OF COMPREHENSIVE INCOME
For the Three Months Ended September 30, 2017
(Unaudited)
 NRG Yield LLC Guarantor Subsidiaries Non-Guarantor Subsidiaries 
NRG Yield Operating LLC
(Note Issuer)
 
Eliminations(a)
 Consolidated
 (In millions)
Net Income$75
 $5
 $50
 $52
 $(130) $52
Other Comprehensive Income           
Unrealized gain on derivatives7
 
 7
 7
 (14) 7
Other comprehensive income7
 
 7
 7
 (14) 7
Comprehensive Income82
 5
 57
 59
 (144) 59
Less: Comprehensive loss attributable to noncontrolling interests
 
 (1) (23) 1
 (23)
Comprehensive Income Attributable to NRG Yield LLC$82
 $5
 $58
 $82
 $(145) $82
(a) All significant intercompany transactions have been eliminated in consolidation.

For the Nine Months ended September 30, 2017
(Unaudited)
 NRG Yield LLC Guarantor Subsidiaries Non-Guarantor Subsidiaries 
NRG Yield Operating LLC
(Note Issuer)
 
Eliminations(a)
 Consolidated
 (In millions)
Net Income$166
 $18
 $141
 $109
 $(324) $110
Other Comprehensive Income           
Unrealized loss on derivatives7
 
 7
 7
 (14) 7
Other comprehensive loss7
 
 7
 7
 (14) 7
Comprehensive Income173
 18
 148
 116
 (338) 117
Less: Comprehensive loss attributable to noncontrolling interests
 
 (3) (56) 3
 (56)
Comprehensive Income Attributable to NRG Yield LLC$173
 $18
 $151
 $172
 $(341) $173
(a) All significant intercompany transactions have been eliminated in consolidation.


NRG YIELD LLC AND SUBSIDIARIES
CONDENSED CONSOLIDATING BALANCE SHEETS
September 30, 2017
(Unaudited)

  NRG Yield LLC Other Guarantor Subsidiaries Non-Guarantor Subsidiaries NRG Yield Operating LLC
(Note Issuer)
 
Eliminations(a)
 Consolidated
ASSETS (In millions)
Current Assets            
Cash and cash equivalents $76
 $
 $102
 $
 $
 $178
Restricted cash 
 
 140
 
 
 140
Accounts receivable — trade 
 3
 123
 
 
 126
Accounts receivable — affiliate 1


 1
Inventory 
 1
 37
 
 
 38
Notes receivable 
 
 15
 
 
 15
Prepayments and other current assets 
 
 22
 
 
 22
Total current assets 77
 4
 439
 
 
 520
Net property, plant and equipment 
 59
 5,188
 
 
 5,247
Other Assets            
Investment in consolidated subsidiaries 1,828
 482
 
 3,134
 (5,444) 
Equity investments in affiliates 
 210
 598
 375
 
 1,183
Intangible assets, net 
 55
 1,179
 
 
 1,234
Other non-current assets 
 
 56
 
 
 56
Total other assets 1,828
 747
 1,833
 3,509
 (5,444) 2,473
Total Assets $1,905
 $810
 $7,460
 $3,509
 $(5,444) $8,240

(a) All significant intercompany transactions have been eliminated in consolidation.


NRG YIELD LLC AND SUBSIDIARIES
CONDENSED CONSOLIDATING BALANCE SHEETS
September 30, 2017
(Continued)
  NRG Yield LLC Other Guarantor Subsidiaries Non-Guarantor Subsidiaries NRG Yield Operating LLC
(Note Issuer)
 
Eliminations(a)
 Consolidated
LIABILITIES AND MEMBERS' EQUITY (In millions)
Current Liabilities            
Current portion of long-term debt — external $
 $
 $300
 $
 $
 $300
Accounts payable 
 2
 25
 
 
 27
Accounts payable — affiliate 
 5
 19
 21
 
 45
Derivative instruments 
 
 23
 
 
 23
Accrued expenses and other current liabilities 
 1
 80
 13
 
 94
Total current liabilities 
 8
 447
 34
 
 489
Other Liabilities            
Long-term debt — external 
 
 4,074
 840
 
 4,914
Long-term debt — affiliate 
 
 
 618
 
 618
Accounts payable — affiliate 
 
 3
 
 
 3
Derivative instruments 
 
 43
 
 
 43
Other non-current liabilities 
 
 79
 8
 
 87
Total non-current liabilities 
 
 4,199
 1,466
 
 5,665
Total Liabilities 
 8
 4,646
 1,500
 
 6,154
Commitments and Contingencies            
Members' Equity            
Contributed capital 1,897
 853
 2,734
 2,077
 (5,664) 1,897
Retained earnings (accumulated deficit) 86
 (49) 100
 (171) 120
 86
Accumulated other comprehensive loss (78) (2) (80) (78) 160
 (78)
Noncontrolling interest 
 
 60
 181
 (60) 181
Total Members' Equity 1,905
 802
 2,814
 2,009
 (5,444) 2,086
Total Liabilities and Members’ Equity $1,905
 $810
 $7,460
 $3,509
 $(5,444) $8,240

(a) All significant intercompany transactions have been eliminated in consolidation.


NRG YIELD LLC AND SUBSIDIARIES
CONDENSED CONSOLIDATING STATEMENTS OF CASH FLOWS
For the Nine Months ended September 30, 2017
(Unaudited)
  NRG Yield LLC Other Guarantor Subsidiaries Non-Guarantor Subsidiaries NRG Yield Operating LLC (Note Issuer) Consolidated
  (In millions)
Net Cash Provided by (Used in) Operating Activities $
 $38
 $414
 $(77) $375
Cash Flows from Investing Activities          
Intercompany transactions between Yield LLC and subsidiaries (13) 
 
 13
 
Payments for the Drop Down Assets 
 
 
 (176) (176)
Capital expenditures 
 (3) (20) 
 (23)
Cash receipts from notes receivable 
 
 11
 
 11
Return of investment from unconsolidated affiliates 
 7
 9
 16
 32
Net investments in unconsolidated affiliates 
 (41) (7) 
 (48)
Net Cash Used in Investing Activities (13) (37) (7) (147) (204)
Cash Flows from Financing Activities          
Transfer of funds under intercompany cash management arrangement (6) (1) 
 7
 
Net contributions from noncontrolling interests 
 
 
 13
 13
Net distributions and return of capital to NRG prior to the acquisition of Drop Down Assets 
 
 (42) (7) (49)
(Payments of) proceeds from distributions (149) 
 (211) 211
 (149)
Payment of debt issuance costs 
 
 (4) 
 (4)
Proceeds from Issuance of Class C units 33


 33
Proceeds from the issuance of long-term debt — external 
 
 41
 
 41
Payments for long-term debt 
 
 (224) 
 (224)
Net Cash (Used in) Provided by Financing Activities (122) (1) (440) 224
 (339)
Net Decrease in Cash, Cash Equivalents and Restricted Cash (135) 
 (33) 
 (168)
Cash, Cash Equivalents and Restricted Cash at Beginning of Period 211
 
 275
 
 486
Cash, Cash Equivalents and Restricted Cash at End of Period $76
 $
 $242
 $
 $318


NRG YIELD LLC AND SUBSIDIARIES
CONDENSED CONSOLIDATING STATEMENTS OF OPERATIONS
For the Three Months Ended September 30, 2016
(Unaudited)
 
NRG Yield LLC (a)
 Other Guarantor Subsidiaries 
Non-Guarantor Subsidiaries (a) 
 
NRG Yield Operating LLC
(Note Issuer) (a)
 
Eliminations (b)
 
Consolidated (a)
 (In millions)
Operating Revenues           
Total operating revenues$
 $7
 $265
 $
 $
 $272
Operating Costs and Expenses           
Cost of operations
 3
 73
 
 
 76
Depreciation and amortization
 2
 73
 
 
 75
General and administrative
 
 
 3
 
 3
Total operating costs and expenses
 5
 146
 3
 
 154
Operating Income (Loss)
 2
 119
 (3) 
 118
Other Income (Expense)           
Equity in earnings of consolidated affiliates105
 4
 
 73
 (182) 
Equity in earnings of unconsolidated affiliates
 (1) 3
 14
 
 16
Other income, net
 
 1
 
 
 1
Interest expense
 
 (51) (17) 
 (68)
Total other income (expense), net105
 3
 (47) 70
 (182) (51)
Net Income105
 5
 72
 67
 (182) 67
Less: Net loss attributable to noncontrolling interests
 
 (1) (38) 1
 (38)
Net Income Attributable to NRG Yield LLC$105
 $5
 $73
 $105
 $(183) $105
(a) Retrospectively adjusted as discussed in Note 1, Nature of Business.
(b) All significant intercompany transactions have been eliminated in consolidation.


NRG YIELD LLC AND SUBSIDIARIES
CONDENSED CONSOLIDATING STATEMENTS OF INCOME
For the Nine Months Ended September 30, 2016
(Unaudited)
 
NRG Yield LLC  (a)
 Other Guarantor Subsidiaries 
Non-Guarantor Subsidiaries (a)
 
NRG Yield Operating LLC
(Note Issuer) (a)
 
Eliminations (b)
 
Consolidated (a)
 (In millions)
Operating Revenues           
Total operating revenues$
 $17
 $772
 $
 $
 $789
Operating Costs and Expenses           
Cost of operations
 10
 228
 
 
 238
Depreciation and amortization
 4
 220
 
 
 224
General and administrative
 
 
 8
 
 8
Total operating costs and expenses
 14
 448
 8
 
 470
Operating Income (Loss)
 3
 324
 (8) 
 319
Other Income (Expense)           
Equity in income of consolidated affiliates219
 21
 
 184
 (424) 
Equity in earnings of unconsolidated affiliates
 7
 3
 24
 
 34
Other income, net
 
 3
 
 
 3
Interest expense
 
 (156) (48) 
 (204)
Total other income (expense), net219
 28
 (150) 160
 (424) (167)
Net Income219
 31
 174
 152
 (424) 152
Less: Net loss attributable to noncontrolling interests
 
 (1) (67) 1
 (67)
Net Income Attributable to NRG Yield LLC$219
 $31
 $175
 $219
 $(425) $219
(a)Retrospectively adjusted as discussed in Note 1, Nature of Business.
(b)All significant intercompany transactions have been eliminated in consolidation.


NRG YIELD LLC AND SUBSIDIARIES
CONDENSED CONSOLIDATING STATEMENTS OF COMPREHENSIVE INCOME
For the Three Months Ended September 30, 2016
(Unaudited)
 
NRG Yield LLC (a)
 Other Guarantor Subsidiaries 
Non-Guarantor Subsidiaries (a)
 
NRG Yield Operating LLC
(Note Issuer) (a)
 
Eliminations (b)
 
Consolidated (a)
 (In millions)
Net Income$105
 $5
 $72
 $67
 $(182) $67
Other Comprehensive Income           
Unrealized gain on derivatives11
 
 19
 20
 (30) 20
Other comprehensive income11
 
 19
 20
 (30) 20
Comprehensive Income116
 5
 91
 87
 (212) 87
Less: Comprehensive loss attributable to noncontrolling interests
 
 (1) (30) 1
 (30)
Comprehensive Income Attributable to NRG Yield LLC$116
 $5
 $92
 $117
 $(213) $117
(a) Retrospectively adjusted as discussed in Note 1, Nature of Business.
(b)All significant intercompany transactions have been eliminated in consolidation.

For the Nine Months Ended September 30, 2016
(Unaudited)
 
NRG Yield LLC (a)
 Other Guarantor Subsidiaries 
Non-Guarantor Subsidiaries (a)
 
NRG Yield Operating LLC
(Note Issuer) (a)
 
Eliminations (b)
 
Consolidated (a)
 (In millions)
Net Income$219
 $31
 $174
 $152
 $(424) $152
Other Comprehensive Loss           
Unrealized loss on derivatives(49) 
 (45) (49) 94
 (49)
Other comprehensive loss(49) 
 (45) (49) 94
 (49)
Comprehensive Income170
 31
 129
 103
 (330) 103
Less: Comprehensive loss attributable to noncontrolling interests
 
 (1) (67) 1
 (67)
Comprehensive Income Attributable to NRG Yield LLC$170
 $31
 $130
 $170
 $(331) $170
(a) Retrospectively adjusted as discussed in Note 1, Nature of Business.
(b)All significant intercompany transactions have been eliminated in consolidation.


NRG YIELD LLC AND SUBSIDIARIES
CONDENSED CONSOLIDATING BALANCE SHEETS
December 31, 2016
  
NRG Yield LLC(a)
 Other Guarantor Subsidiaries 
Non-Guarantor Subsidiaries(a)
 
NRG Yield Operating LLC
(Note Issuer)
(a)
 
Eliminations (b)
 
Consolidated(a)
ASSETS (In millions)
Current Assets            
Cash and cash equivalents $211
 $
 $110
 $
 $
 $321
Restricted cash 
 
 165
 
 
 165
Accounts receivable — trade 
 2
 90
 
 
 92
Accounts receivable — affiliate 
 
 1
 
 
 1
Inventory 
 2
 37
 
 
 39
Derivative instruments 
 
 2
 
 
 2
Notes receivable 
 
 16
 
 
 16
Prepayments and other current assets 
 
 19
 1
 
 20
Total current assets 211
 4
 440
 1
 
 656
             
Net property, plant and equipment 
 59
 5,401
 
 
 5,460
Other Assets            
Investment in consolidated subsidiaries 1,867
 527
 
 3,212
 (5,606) 
Equity investments in affiliates 
 171
 600
 381
 
 1,152
Intangible assets, net 
 56
 1,230
 
 
 1,286
Derivative instruments 
 
 1
 
 
 1
Other non-current assets 
 
 64
 1
 
 65
Total other assets 1,867
 754
 1,895
 3,594
 (5,606) 2,504
Total Assets $2,078
 $817
 $7,736
 $3,595
 $(5,606) $8,620
(a) Retrospectively adjusted as discussed in Note 1, Nature of Business.
(b)All significant intercompany transactions have been eliminated in consolidation.


NRG YIELD LLC AND SUBSIDIARIES
CONDENSED CONSOLIDATING BALANCE SHEETS
December 31, 2016
(Continued)
  
NRG Yield LLC(a)
 Other Guarantor Subsidiaries 
Non-Guarantor Subsidiaries(a)
 
NRG Yield Operating LLC
(Note Issuer)
(a)
 
Eliminations (b)
 
Consolidated(a)
LIABILITIES AND MEMBERS' EQUITY (In millions)
Current Liabilities            
Current portion of long-term debt — external $
 $
 $291
 $
 $
 $291
Accounts payable 
 2
 18
 3
 
 23
Accounts payable — affiliate 
 7
 15
 18
 
 40
Derivative instruments 
 
 32
 
 
 32
Accrued expenses and other current liabilities 
 1
 60
 24
 
 85
Total current liabilities 
 10
 416
 45
 
 471
Other Liabilities            
Long-term debt — external 
 
 4,259
 839
 
 5,098
Long-term debt — affiliate 
 
 
 618
 
 618
Accounts payable — affiliate 
 
 9
 
 
 9
Derivative instruments 
 
 44
 
 
 44
Other non-current liabilities 
 
 76
 
 
 76
Total non-current liabilities 
 
 4,388
 1,457
 
 5,845
Total Liabilities 
 10
 4,804
 1,502
 
 6,316
Commitments and Contingencies            
Members' Equity            
Contributed capital 2,127
 874
 2,920
 2,103
 (5,897) 2,127
Retained earnings (Accumulated deficit) 36
 (65) 35
 (151) 181
 36
Accumulated other comprehensive loss (85) (2) (87) (85) 174
 (85)
Noncontrolling Interest 
 
 64
 226
 (64) 226
Total Members' Equity 2,078
 807
 2,932
 2,093
 (5,606) 2,304
Total Liabilities and Members’ Equity $2,078
 $817
 $7,736
 $3,595
 $(5,606) $8,620
(a) Retrospectively adjusted as discussed in Note 1, Nature of Business.
(b)All significant intercompany transactions have been eliminated in consolidation.


NRG YIELD LLC AND SUBSIDIARIES
CONDENSED CONSOLIDATING STATEMENTS OF CASH FLOWS
For the Nine Months Ended September 30, 2016
(Unaudited)
  
NRG Yield LLC (a)
 Other Guarantor Subsidiaries 
Non-Guarantor Subsidiaries (a)
 NRG Yield Operating LLC (Note Issuer) 
Consolidated (a)
  (In millions)
Net Cash Provided by Operating Activities $
 $45
 $365
 $34
 $444
Cash Flows from Investing Activities          
Intercompany transactions from Yield LLC to subsidiaries 145
 
 
 (145) 
Acquisition of Drop Down Assets, net of cash acquired 
 
 
 (77) (77)
Capital expenditures 
 
 (16) 
 (16)
Cash receipts from notes receivable 
 
 11
 
 11
Return of investment from unconsolidated affiliates 
 3
 
 13
 16
Net investments in unconsolidated affiliates 
 (48) 
 (21) (69)
Net Cash Provided by (Used in) Investing Activities 145
 (45) (5) (230) (135)
Cash Flows from Financing Activities          
Transfer of funds under intercompany cash management arrangement 54
 
 
 (54) 
Net contributions from noncontrolling interests 
 
 
 7
 7
Net distributions and return of capital to NRG prior to the acquisition of Drop Down Assets 
 
 (126) 
 (126)
(Payments of) proceeds from distributions (127) 
 (204) 204
 (127)
Payment of debt issuance costs 
 
 (1) (5) (6)
Proceeds from the revolving credit facility 
 
 
 60
 60
Payments for the revolving credit facility 
 
 
 (366) (366)
Proceeds from the issuance of long-term debt - external 
 
 200
 350
 550
Payments for long-term debt 
 
 (204) 
 (204)
Net Cash (Used in) Provided by Financing Activities (73) 
 (335) 196
 (212)
Net (Decrease) Increase in Cash, Cash Equivalents and Restricted Cash 72
 
 25
 
 97
Cash, Cash Equivalents and Restricted Cash at Beginning of Period 15
 
 226
 
 241
Cash, Cash Equivalents and Restricted Cash at End of Period $87
 $
 $251
 $
 $338
(a) Retrospectively adjusted as discussed in Note 1, Nature of Business.


Note 11 — Contingencies
This note should be read in conjunction with the complete description under Item 15 — Note 14, Commitments and Contingencies, to the consolidated financial statements included in the Company's 20162020 Form 10-K.
Contingencies
The Company's material legal proceedings are described below. The Company believes that it has valid defenses to these legal proceedings and intends to defend them vigorously. The Company records reserves for estimated losses from contingencies when information available indicates that a loss is probable and the amount of the loss, or range of loss, can be reasonably estimated. As applicable, the Company has established an adequate reserve for the matters discussed below. In addition, legal costs are expensed as incurred. Management assesses such matters based on current information and makes a judgment concerning its potential outcome, considering the nature of the claim, the amount and nature of damages sought, and the probability of success. The Company is unable to predict the outcome of the legal proceedings below or reasonably estimate the scope or amount of any associated costs and potential liabilities. As additional information becomes available, management adjusts its assessment and estimates of such contingencies accordingly. Because litigation is subject to inherent uncertainties and unfavorable rulings or developments, it is possible that the ultimate resolution of the Company's liabilities and contingencies could be at amounts that are different from its currently recorded reserves and that such difference could be material.
In addition to the legal proceedings noted below, the Company and its subsidiaries are party to other litigation or legal proceedings arising in the ordinary course of business. In management's opinion, the disposition of these ordinary course matters will not materially adversely affect the Company's consolidated financial position, results of operations, or cash flows.
Braun v. NRG Yield, Inc. Nebraska Public Power District Litigation
On January 11, 2019, Nebraska Public Power District, or NPPD, sent written notice to certain of the Company’s subsidiaries which own the Laredo Ridge and Elkhorn Ridge wind projects alleging an event of default under each of the PPAs between NPPD and the projects. NPPD alleges that the Company moved forward with certain transactions without obtaining the consent of NPPD. NPPD threatened to terminate the applicable PPAs by February 11, 2019 if the alleged default was not cured. The Company filed a motion for a temporary restraining order and preliminary injunction in the U.S. District Court for the District of Nebraska relating to the Laredo Ridge project, and a similar motion in the District Court of Knox County, Nebraska for the Elkhorn Ridge project, to enjoin NPPD from taking any actions related to the PPAs. On February 19, 2019, the U.S. District Court in the Laredo Ridge matter approved a stipulation between the parties to provide for an injunction preventing NPPD from terminating the PPA pending disposition of the litigation. On February 26, 2019, the Knox County District Court approved a similar stipulation relating to the Elkhorn Ridge project. On April 19, 2016, plaintiffs13, 2020, the U.S. District Court granted the wind projects' motion for summary judgment and permanently enjoined NPPD from terminating the PPAs in reliance on the alleged events of default. The U.S. District Court decision was appealed by NPPD on May 11, 2020 and the case in the Knox County District Court remains pending, but has been stayed pending the outcome of the U.S. District Court case. Argument before the U.S. Court of Appeals for the Eight Circuit was held on March 18, 2021. The Company believes the allegations of NPPD are meritless and the Company is vigorously defending its rights under the PPAs.

Buckthorn Solar Litigation
On October 8, 2019, the City of Georgetown, Texas, or Georgetown, filed a putative class action lawsuit against NRG Yield, Inc.,petition in the currentDistrict Court of Williamson County, Texas naming Buckthorn Westex, LLC, the Company’s subsidiary that owns the Buckthorn Westex solar project, as the defendant, alleging fraud by nondisclosure and former membersbreach of its board of directors individually,contract in connection with the project and other parties in California Superior Court in Kern County, CA.  Plaintiffs allege various violationsthe PPA, and seeking (i) rescission and/or cancellation of the Securities ActPPA, (ii) declaratory judgment that the alleged breaches constitute an event of default under the PPA entitling Georgetown to terminate, and (iii) recovery of all damages, costs of court, and attorneys’ fees. On November 15, 2019, Buckthorn Westex filed an original answer and counterclaims (i) denying Georgetown’s claims, (ii) alleging Georgetown has breached its contracts with Buckthorn Westex by failing to pay amounts due, toand (iii) seeking relief in the defendants’form of (x) declaratory judgment that Georgetown’s alleged failure to disclose material facts related to low wind production prior to NRG Yield, Inc.'s June 22, 2015 Class C common stock offering. Plaintiffs seek compensatory damages, rescission, attorney’spay amounts due constitute breaches of and an event of default under the PPA and that Buckthorn did not commit any events of default under the PPA, (y) recovery of costs, expenses, interest, and attorneys’ fees, and costs. The defendants filed demurrers(z) such other relief to which it is entitled at law or in equity. Buckthorn Westex believes the allegations of Georgetown are meritless, and a motion challenging jurisdiction on October 18, 2016. On October 26, 2017, the court approved the parties' stipulation which provides the plaintiffs' oppositionBuckthorn Westex is due on December 6, 2017 and the defendants' reply is due on February 8, 2018.
Ahmed v. NRG Energy, Inc. and the NRG Yield Board of Directors — On September 15, 2016, plaintiffs filed a putative class action lawsuit against NRG Energy, Inc., the directors of NRG Yield, Inc., and other parties in the Delaware Chancery Court. The complaint alleges that the defendants breached their respective fiduciary duties with regard to the recapitalization of NRG Yield, Inc. common stock in 2015. The plaintiffs generally seek economic damages, attorney’s fees and injunctive relief. The defendants filed a motion to dismiss the lawsuit on December 21, 2016. Plaintiffs filed their objection to the motion to dismiss on February 15, 2017. The defendants' reply was filed on March 24, 2017. The court heard oral argument on the defendants' motion to dismiss on June 20, 2017. On September 7, 2017, the court requested additional briefing which the parties provided on September 21, 2017.
GenOn Noteholders' Lawsuit — On December 13, 2016, certain indenture trustees for an ad hoc group of holders, or the Noteholders, of the GenOn Energy, Inc., or GenOn, 7.875% Senior Notes due 2017, 9.500% Notes due 2018, and 9.875% Notes due 2020, and the GenOn Americas Generation, LLC 8.50% Senior Notes due 2021 and 9.125% Senior Notes due 2031, along with certain of the Noteholders, filed a complaint in the Superior Court of the State of Delaware against NRG and GenOn alleging certain claims related to the Services Agreement between NRG and GenOn. On April 30, 2017, the Noteholders filed an amended complaint that asserts additional claims of fraudulent transfer, insider preference and breach of fiduciary duties. In addition to NRG and GenOn, the amended complaint names NRG Yield LLC and certain current and former officers and directors of GenOn as defendants. The plaintiffs, among other things, generally seek return of all monies paidvigorously defending its rights under the Services Agreement and any other damages that the court deems appropriate. On April 28, 2017, the bondholders filed an amended complaint adding the GenOn directors and officers as defendants and asserting claims that they breached certain fiduciary duties. Plaintiffs specifically allege that the transfer of Marsh Landing to NRG Yield LLC constituted a fraudulent transfer. On June 12, 2017, certain GenOn entities, NRG and certain holders of the GenOn and GenOn Americas Generation, LLC senior notes entered into a restructuring support and lock-up agreement. Pursuant to the terms of the restructuring support and lock-up agreement, this matter should ultimately be resolved if GenOn's plan of reorganization, originally submitted on June 29, 2017, is approved by the United States Bankruptcy Court for the Southern District of Texas, Houston Division.

PPA.

37

ITEM 2 — Management's Discussion and Analysis of Financial Condition and the Results of Operations
The following discussion analyzes the Company's historical financial condition and results of operations, which were recast to include the effect of the August 2017 Drop Down Assets and the March 2017 Drop Down Assets.operations.
As you read this discussion and analysis, refer to the Company's Consolidated Financial Statements to this Form 10-Q, which present the results of operations for the three and ninesix months ended SeptemberJune 30, 2017,2021 and 2016.2020. Also refer to the Company's May 9, 20172020 Form 8-K,10-K, which includes detailed discussions of various items impacting the Company's business, results of operations and financial condition.
The discussion and analysis below has been organized as follows:
Executive Summary, including a description of the business and significant events that are important to understanding the results of operations and financial condition;
Known trends that may affect the Company’s results of operations and financial condition in the future;
Results of operations, including an explanation of significant differences between the periods in the specific line items of the consolidated statements of income;operations;
Financial condition addressing liquidity position, sources and uses of cash, capital resources and requirements, commitments, and off-balance sheet arrangements;
Known trends that may affect the Company’s results of operations and financial condition in the future; and
Critical accounting policies which are most important to both the portrayal of the Company's financial condition and results of operations, and which require management's most difficult, subjective or complex judgment.

38


Executive Summary
Introduction and Overview
NRG YieldClearway Energy LLC was formed by NRG as a Delaware limited liability company on March 5, 2013, to serve astogether with its consolidated subsidiaries, or the primary vehicle through which NRG owns, operatesCompany, is an energy infrastructure investor in and acquiresowner of modern, sustainable and long-term contracted renewable and conventional generation and thermal infrastructure assets.assets across North America. The Company believes it is well positioned to be a premier company for investors seeking stable and growing distributions income from a diversified portfolio of lower-risk high-quality assets.
The Company owns a diversified portfolio of contracted renewable and conventional generation and thermalindirectly owned by Global Infrastructure Partners III. Global Infrastructure Management, LLC is an independent fund manager that invests in infrastructure assets in the energy and transport sectors, and Global Infrastructure Partners III is its third equity fund. The Company is sponsored by GIP through GIP's portfolio company, CEG.

The Company is one of the largest renewable energy owners in the U.S. The Company’s contracted generation portfolio collectively represents 5,080with over 4,700 net MW of installed wind and solar generation projects. The Company's over 8,000 net MW of assets also includes approximately 2,500 net MW of environmentally-sound, highly efficient generation facilities as well as a portfolio of September 30, 2017. Each of these assets sells substantiallydistrict energy systems. Through this environmentally-sound, diversified and primarily contracted portfolio, the Company endeavors to provide its investors with stable and growing dividend income.Substantially all of itsthe Company's generation assets are under long-term contractual arrangements for the output pursuant to long-term offtake agreements with creditworthy counterparties.or capacity from these assets. The weighted average remaining contract duration of these offtake agreements was approximately 16 13 years as of SeptemberJune 30, 2017, 2021based on CAFDCAFD.

As of June 30, 2021, the Company's operating assets are comprised of the following projects:
ProjectsPercentage Ownership
Net Capacity (MW)(a)
 CounterpartyExpiration
Conventional
Carlsbad100%527 San Diego Gas & Electric2038
El Segundo100%550 SCE2023
GenConn Devon50%95 Connecticut Light & Power2040
GenConn Middletown50%95 Connecticut Light & Power2041
Marsh Landing100%720 PG&E2023
Walnut Creek100%485 SCE2023
Total Conventional2,472 
Utility Scale Solar
Agua Caliente51%148 PG&E2039
Alpine100%66 PG&E2033
Avenal50%23 PG&E2031
Avra Valley100%27 Tucson Electric Power2032
Blythe100%21 SCE2029
Borrego100%26 San Diego Gas and Electric2038
Buckthorn Solar (b)
100%154 City of Georgetown, TX2043
CVSR100%250 PG&E2038
Desert Sunlight 25025%63 SCE2034
Desert Sunlight 30025%75 PG&E2039
Kansas South100%20 PG&E2033
   Kawailoa (b) .
48%24 Hawaiian Electric Company2041
   Oahu Solar Projects (b)
95%58 Hawaiian Electric Company2041
Roadrunner100%20 El Paso Electric2031
Rosamond Central (b)
50%96 Various2035
TA High Desert100%20 SCE2033
      Utah Solar Portfolio (b)
50%265 PacifiCorp2036
Total Solar1,356 
Distributed Solar
DGPV Fund Projects (b)
100%286 Various2030 - 2044
Solar Power Partners (SPP) Projects100%25 Various2026 -2037
Other DG Projects100%21 Various2023 -2039
Total Distributed Solar332 
39

ProjectsPercentage Ownership
Net Capacity (MW)(a)
 CounterpartyExpiration
Wind
Alta I100%150 SCE2035
Alta II100%150 SCE2035
Alta III100%150 SCE2035
Alta IV100%102 SCE2035
Alta V100%168 SCE2035
Alta X (b)
100%137 SCE2038
Alta XI (b)
100%90 SCE2038
Buffalo Bear100%19 Western Farmers Electric Co-operative2033
Crosswinds99%21 Corn Belt Power Cooperative2027
Elbow Creek (b)
100%122 Various2029
Elkhorn Ridge66.7%54 Nebraska Public Power District2029
Forward100%29 Constellation NewEnergy, Inc.2022
Goat Wind100%150 Dow Pipeline Company2025
Hardin99%15 Interstate Power and Light Company2027
Langford (b)
100%160 Goldman Sachs2033
Laredo Ridge100%80 Nebraska Public Power District2031
Lookout100%38 Southern Maryland Electric Cooperative2030
Mesquite Star (b)
50%210 Various2032 - 2035
Mt. Storm100%264 Citigroup2031
Ocotillo100%59 N/A
Odin99.9%20 Missouri River Energy Services2028
Pinnacle (b)
100%55 Maryland Department of General Services and University System of Maryland2031
Rattlesnake (b) (d)
100%160 Avista Corporation2040
San Juan Mesa75%90 Southwestern Public Service Company2025
Sleeping Bear100%95 Public Service Company of Oklahoma2032
South Trent100%101 AEP Energy Partners2029
Spanish Fork100%19 PacifiCorp2028
Spring Canyon II (b)
90.1%31 Platte River Power Authority2039
Spring Canyon III (b)
90.1%26 Platte River Power Authority2039
Taloga100%130 Oklahoma Gas & Electric2031
Wildorado (b)
100%161 Southwestern Public Service Company2027
Total Wind3,056 
 
Thermal generation100%39 VariousVarious
Total net generation capacity7,255 
Thermal equivalent MWt(c)
97%1,400 VariousVarious
(a) Net capacity represents the maximum, or rated, generating capacity of the facility multiplied by the Company's percentage ownership in the facility as of June 30, 2021.
(b) Projects are part of tax equity arrangements and ownership percentage is based on cash to be distributed, as further described in Item 1 — Note 4, Investments Accounted for by the Equity Method and Variable Interest Entities.
(C) Net MWt capacity excludes 43 MWt available under the right-to-use provisions contained in agreements between one of the Company's thermal facilities and certain of its customers.
(d) Rattlesnake has a deliverable capacity of 144 MW.


40

Significant Events
Corporate Level Financing
On March 9, 2021, Clearway Energy Operating LLC completed the sale of $925 million of senior unsecured notes due 2031, or the 2031 Senior Notes. The 2031 Senior Notes bear interest at 3.750% and mature on February 15, 2031. The net proceeds from the 2031 Senior Notes were used to repurchase the 2025 Senior Notes as described below, as well as to repay amounts outstanding under the Company’s revolving credit facility and for general corporate purposes.
In March 2021, the Company repurchased and redeemed an aggregate principal amount of $600 million of the 2025 Senior Notes, through the cash tender offer announced on March 2, 2021 and the redemption of the remaining amount on March 17, 2021. The repurchases and redemption were effectuated at a premium of approximately 106% for total consideration of $636 million.
Project-Level Financing Activities
On March 10, 2021, the Company entered into a financing agreement for non-recourse debt for a total commitment of $126 million related to the repowering of the Pinnacle wind project. The debt consists of a construction loan at an interest rate of LIBOR plus 1.00%. The Company's initial borrowings of $79 million were utilized to repay $53 million of the outstanding balance under the Tapestry financing agreement, which related to the Pinnacle wind project, and to reimburse Clearway Renew LLC for previous contributions and pay vendor invoices and fees.
Third Party Acquisitions
On April 23, 2021, the Company also owns thermal infrastructure assetsacquired 100% of the equity interests in NedPower Mount Storm LLC, or Mt. Storm, from Castleton Commodities International for approximately $96 million, excluding working capital and purchase price adjustments. Mt. Storm is a 264 MW wind project located in Grant County, West Virginia. Mt. Storm has a 10-year energy hedge with an aggregate steam and chilled water capacity of 1,319 net MWt and electric generation capacity of 123 net MW. These thermal infrastructure assets provide steam, hot water and/or chilled water, andinvestment-grade counterparty.
On February 3, 2021, the Company acquired an additional 35% equity interest in some instances electricity, to commercial businesses, universities, hospitals and governmental unitsthe Agua Caliente solar project from NRG Energy, Inc. for $202 million. Agua Caliente is a 290 MW solar project located in multiple locations, principally through long-term contracts or pursuant to rates regulated by state utility commissions.
NRG Transformation Plan
On July 12, 2017, NRG announced that it had adopted and initiatedDateland, Arizona in which the Company previously owned a three-year, three-part improvement plan, or16% equity interest. The project has a 25-year PPA with PG&E, with approximately 19 years remaining under the NRG Transformation Plan. As partagreement. Following the close of the NRG Transformation Plan, NRG announced that it is exploring strategic alternatives fortransaction, the Company owns a 51% equity interest in Agua Caliente. The Company removed its renewables platformequity method investment and consolidates its interest in Agua Caliente from the Company. NRG, through its holdingsdate of Class B common stock and Class D common stock, has a 55.1% voting interest in Yield, Inc. and receives distributionsthe acquisition.
41

Drop Down Transactions
On August 2, 2021, the CEG ROFO Agreement was amended to remove the 100 MW Wildflower utility scale solar project from the ROFO pipeline.
On February 26, 2021, the Company, through its ownershipan indirect subsidiary, entered into an amended partnership agreement with CEG to repower the Pinnacle wind project, a 55 MW wind facility located in Mineral County, West Virginia. The amended agreement commits the Company to invest an estimated $67 million in net corporate capital, subject to closing adjustments, and no longer requires an additional payment in 2031. The existing Pinnacle wind power purchase agreements will continue to run through 2031. Commercial operations and corporate capital funding for the Pinnacle wind repowering are expected to occur in the second half of Class B units2021.
On January 12, 2021, the Company acquired 100% of CEG's equity interest and Class D units. NRG stated that the strategic alternatives span a variety of ownership structures and partnership types, including the potential partial or full monetization of NRG's renewables platform and NRG'sthird party investor's minority interest in CWSP Rattlesnake Holding LLC, which indirectly owns the Company. NRG is Yield, Inc.'s controlling stockholderRattlesnake wind project, a 160 MW wind facility located in Adams County, Washington that achieved commercial operations in December 2020, for $132 million in cash consideration. The Company's net capital commitment was $119 million after proceeds from a state sales and use tax refund, which were received in May 2021. The project has a 20-year PPA, which began when the facility reached commercial operations.
Resource Adequacy Agreement at Marsh Landing
On May 3, 2021, the Company has been highly dependentcontracted with a California Load Serving Entity to sell 100 MW of Resource Adequacy commencing in May 2023. The contract is for seven and a half years and is at terms which would maintain project level CAFD on NRG for, among other things, growth opportunities and management and administration services. See Part I, Item 1A, Risk Factors in the Company's 2016 Form 10-K as well as Part II, Item 1A, Risk Factors in the Company's Form 10-Q for the quarter ended June 30, 2017, for risks relatedan unlevered basis if applied to the NRG Transformation Plan andfull capacity of the Company's relationship with NRG.plant.
Regulatory MattersFebruary 2021 Winter Events in Texas
The Company’s regulatory matters are describedIn February 2021, Texas experienced extreme winter weather conditions in the Company’s 2016 Form 10-K in Item 1, Business Regulatory Matters and Item 1A, Risk Factors.
As owners of power plants and participants in wholesale and thermal energy markets,which certain of the Company's subsidiaries are subjectwind projects were unable to regulation by various federaloperate and state government agencies. These include FERCexperienced outages due to the weather conditions at that time. Due to this event, and the PUCT, as well as other public utility commissions in certain states where the Company's assets are located. Eachinclusive of the Company's U.S. generating facilities qualifies as a EWG or QF. In addition,amounts related to third party equity investors, the Company is subject to the market rules, procedures and protocolsrecorded a reduction of the various ISO and RTO marketsapproximately $50 million in which it participates. Likewise, the Company must also comply with the mandatory reliability requirements imposed by NERC and the regional reliability entitiesrevenue in the regions wherefirst quarter of 2021 to settle obligations for wind facilities during the Company operates.extreme weather conditions. After factoring in third party equity investor contributions, the cash impact during the first quarter of 2021 was approximately $25 million.
The Company's operations within the ERCOT footprint are not subject to rate regulation by FERC, as they are deemed to operate solely within the ERCOT market and not in interstate commerce. These operations are subject to regulation by the PUCT.
Environmental Matters
The Company’s environmental matters are described in the Company’s 2016 Form 10-K in Item 1, Business Environmental Matters and Item 1A, Risk Factors.
The Company is subject to a wide range of environmental laws induring the development, construction, ownership and operation of projects.facilities. These existing and future laws generally require that governmental permits and approvals be obtained before construction and maintained during operation of facilities. The Company is also subjectobligated to comply with all environmental laws regardingand regulations applicable within each jurisdiction and required to implement environmental programs and procedures to monitor and control risks associated with the protectionconstruction, operation and decommissioning of wildlife, including migratory birds, eagles, threatened and endangered species.regulated or permitted energy assets. Federal and state environmental laws have historically become more stringent over time, although this trend could slow or pausechange in the near term with respectfuture.
The Company is and will continue to federal lawsevaluate the impact of the legislation and regulations as they are revised but cannot fully predict the impact of each until anticipated revisions and legal challenges are resolved.To the extent newly proposed legislation and regulations restrict or otherwise impact the Company's operations, the proposed legislation and regulations could have a negative impact on the Company's financial performance.

Proposed and Final State Solar Photovoltaic Module Disposal and Recycling Regulations
In January 2021, the State of Hawaii issued a public notice of proposed rule changes which, among other items, include a proposed new solar panel universal waste rule. This proposed rule would create a new universal waste category for solar panels and allow solar panel waste management to be conducted under the currentexisting regulatory framework. On June 7, 2021, this new rule went into effect, resulting in the addition of solar panels as a new category of universal wastes. The rule also adopts specific waste management standards within the existing universal waste framework and makes managing hazardous waste solar panels simpler and less costly. This rule will also allow some generators to qualify for a generator status subject to reduced regulation because universal wastes do not count toward generator status.

Proposed Federal MBTA Incidental Take Legislation and Regulations
42

On January 20, 2021, President Biden issued an executive order to review and consider suspending, revising, or rescinding agency actions taken between January 20, 2017 and January 20, 2021 determined to be inconsistent with certain public health and environmental goals.This includes a review of both the Solicitor’s Opinion and the U.S. presidential administration.Fish and Wildlife Services’ (FWS) January 7, 2021 final rule codifying the Solicitor’s Opinion M-37050 defining the scope of certain prohibitions under the MBTA.In response to this directive, on February 9, 2021, the FWS delayed the effective date of the January 2021 final rule and requested public comment to inform its review and a potential extended delay.

In May 2021, FWS published a draft rule to revoke the Trump Administration’s January 7, 2021 final rule in an effort to return to implementing the MBTA as prohibiting incidental take and applying enforcement discretion. Comments on the draft rule were due June 7, 2021. The proposed rule follows the Administration’s prior revocation of Solicitor’s Opinion M-37050 issued under the Trump Administration. A return to the position that incidental take is prohibited under the MBTA, or the development of legislation or regulations contrary to the FWS’s January 2021 rule, could increase potential liability and impose additional permitting requirements on certain of the Company's operations.

Regulatory Matters
The Company’s regulatory matters are described in the Company’s 2020 Form 10-K in Item 1, Business Regulatory Matters and Item 1A, Risk Factors.
Trends Affecting Results of Operations and Future Business Performance
The Company’s trends are described in the Company’s May 9, 20172020 Form 8-K10-K in Item 7, Management’s Discussion and Analysis of Financial Condition and Results of Operations - Trends Affecting Results of Operations and Future Business Performance.

Recent Developments Affecting Industry Conditions and the Company’s Business

Operational Matters
El Segundo Forced OutageCOVID-19 Update
In January 2017,response to the El Segundo Energy Center beganongoing coronavirus (COVID-19) pandemic, the Company has implemented preventative measures and developed corporate and regional response plans to protect the health and safety of its employees, customers and other business counterparties, while supporting the Company’s suppliers and customers’ operations to the best of its ability in the circumstances. The Company also has modified certain business practices (including discontinuing all non-essential business travel, implementing a forced outagetemporary work-from-home policy for employees who can execute their work remotely and encouraging employees to adhere to local and regional social distancing, more stringent hygiene and cleaning protocols across the Company’s facilities and operations and self-quarantining recommendations) to support efforts to reduce the spread of COVID-19 and to conform to government restrictions and best practices encouraged by governmental and regulatory authorities. The Company continues to evaluate these measures, response plans and business practices in light of the evolving effects of COVID-19.
There is considerable uncertainty regarding the extent to which COVID-19, including variants such as the Delta variant, will continue to spread and the extent and duration of governmental and other measures implemented to try to slow the spread of the virus, such as large-scale travel bans and restrictions, border closures, quarantines, shelter-in-place orders and business and government shutdowns. Restrictions of this nature may cause the Company, its suppliers and other business counterparties to experience operational delays and delays in the delivery of materials and supplies and may cause milestones or deadlines relating to various projects to be missed.
As of the date of this report, the Company has not experienced any material financial or operational impacts related to COVID-19, or variants thereof. All of the Company’s facilities have remained operational. The Company has experienced a decrease in volumetric sales on Units 5 and 6a weather normalized basis at certain Thermal locations in part due to increasing vibrationsCOVID-19 related impacts, which has not resulted in any material financial impacts to the Company. The Company believes that all of its accounts receivable balances as of June 30, 2021 are collectible. The Company will continue to assess collectability based on successiveany future developments.
The Company cannot predict the full impact that COVID-19 will have on the Company’s financial expectations, its financial condition, results of operations and cash flows, its ability to make distributions to its unit holders and its ability to satisfy its debt service obligations at Unit 5. In consultationthis time, due to numerous uncertainties. The ultimate impacts will depend on future developments, including, among others, the ultimate geographic spread of the virus and related variants, the consequences of governmental and other measures designed to prevent the spread of the virus, the development of effective treatments, including vaccines, the duration of the pandemic, actions taken by governmental authorities, customers, suppliers and other third parties,
43

workforce availability and the timing and extent to which normal economic and operating conditions resume. For additional discussion regarding risks associated with the Company’s operations and maintenance service provider, a subsidiary of NRG, the Company elected to replace the rotor on Unit 5. Both Unit 5 and 6 returned to service on February 24, 2017. In July 2017, the Company executed a warranty settlement agreement with the original equipment manufacturer that reduced total cost from $12 million to approximately $5 million.

Walnut Creek Forced Outage
During the first half of 2017, Walnut Creek experienced forced outages due to mechanical failures of turbine parts that caused downstream damage to severalCOVID-19 pandemic, see Part I, Item 1A Risk Factors of the plant's Units, primarily Unit 1. The repairs necessary to return Unit 1 to service were completed in the second quarter of 2017 and the plant has performed reliably since then. The estimated cost of this outage is approximately $8 million before the recovery of insurance proceeds, a significant portion of which the Company believes is recoverable by year end. In the third quarter of 2017, the Company, through Walnut Creek, executed an amendment to the contractual service agreement with the original equipment manufacturer to improve long term reliability. The amendment provides for the original equipment manufacturer to perform all required, currently available and future turbine reliability upgrades in exchange for an investment of approximately $15 million that will be paid over the next five years.Company's 2020 Form 10-K.
ROFO Asset Update
44
Puente Power Project — On October 5, 2017, the California Energy Commission, or CEC, the agency responsible for permitting NRG’s Puente Power Project, a ROFO Asset, issued a statement on behalf of the committee of two Commissioners overseeing the permitting process stating their intention to issue a proposed decision that would deny a permit for the Puente Power Project.  On October 16, 2017, NRG filed a motion to suspend the permitting proceeding for at least six months.  A hearing on the motion was held on October 31, 2017, after which the CEC took the matter under submission subject to a written decision to be issued at an unspecified later date. If the CEC Commissioners accept the recommendation, and formally deny a permit for the Puente Power Project, then the project will not move forward.


Consolidated Results of Operations
The following table provides selected financial information:
Three months ended June 30,Six months ended June 30,
(In millions)20212020Change20212020Change
Operating Revenues
Energy and capacity revenues$420 $342 $78 $696 $618 $78 
Other revenues28 12 16 45 21 24 
Contract amortization(37)(22)(15)(69)(44)(25)
Mark-to-market economic hedging activities(31)(3)(28)(55)(8)(47)
Total operating revenues380 329 51 617 587 30 
Operating Costs and Expenses
Cost of fuels16 13 35 30 
Operations and maintenance69 54 15 137 110 27 
Other costs of operations22 20 45 40 
Depreciation, amortization and accretion128 99 29 256 201 55 
General and administrative11 (2)19 20 (1)
Transaction and integration costs— 
Development costs— — 
Total operating costs and expenses246 198 48 497 404 93 
Operating Income134 131 120 183 (63)
Other Income (Expense)
Equity in earnings of unconsolidated affiliates16 (8)12 
Gain on sale of unconsolidated affiliate— 49 (49)— 49 (49)
Other income, net— (1)
Loss on debt extinguishment— — — (42)(3)(39)
Derivative (expense) interest income(11)(13)36 (92)128 
Other interest expense(92)(80)(12)(184)(168)(16)
Total other expense, net(94)(27)(67)(176)(208)32 
Net Income (Loss)40 104 (64)(56)(25)(31)
Less: Loss attributable to noncontrolling interests and redeemable interests(35)(27)(8)(102)(66)(36)
Net Income Attributable to Clearway Energy LLC$75 $131 $(56)$46 $41 $
 Three months ended September 30, Nine months ended September 30,
(In millions)2017 2016 Change 2017 2016 Change
Operating Revenues           
Energy and capacity revenues$283
 $289
 $(6) $819
 $840
 $(21)
Contract amortization(18) (17) (1) (52) (51) (1)
Total operating revenues265
 272
 (7) 767
 789
 (22)
Operating Costs and Expenses           
Cost of fuels15
 18
 (3) 45
 48
 (3)
Emissions credit amortization


 6
 (6)
Operations and maintenance46
 41
 5
 143
 134
 9
Other costs of operations17
 17
 
 51
 50
 1
Depreciation and amortization88
 75
 13
 241
 224
 17
General and administrative4
 3
 1
 14
 8
 6
Acquisition-related transaction and integration costs
 
 
 2
 
 2
Total operating costs and expenses170
 154
 16
 496
 470
 26
Operating Income95
 118
 (23) 271
 319
 (48)
Other Income (Expense)    
     
Equity in earnings of unconsolidated affiliates28
 16
 12
 63
 34
 29
Other income, net1
 1
 
 3
 3
 
Interest expense(72) (68) (4) (227) (204) (23)
Total other expense, net(43) (51) 8
 (161) (167) 6
Net Income52
 67
 (15) 110
 152
 (42)
Less: Net loss attributable to noncontrolling interests(23) (38) 15
 (56) (67) 11
Net Income Attributable to NRG Yield LLC$75
 $105
 $(30) $166
 $219
 $(53)
 Three months ended September 30, Nine months ended September 30,
Business metrics:2017 2016 2017 2016
Renewables MWh generated/sold (in thousands) (a)
1,544
 1,744
 5,295
 5,563
Conventional MWh generated (in thousands) (a)(b)
717
 628
 1,172
 1,265
Thermal MWt sold (in thousands)463
 496
 1,450
 1,497
Thermal MWh sold (in thousands) (c)
9
 12
 27
 61
Three months ended June 30,Six months ended June 30,
Business metrics:2021202020212020
Renewables MWh generated/sold (in thousands) (a)
3,370 2,259 5,900 3,934 
Thermal MWt sold (in thousands)457 395 1,068 1,000 
Thermal MWh sold (in thousands)13 11 26 38 
Conventional MWh generated (in thousands) (a) (b)
282 204 447 381 
Conventional equivalent availability factor97.2 %95.1 %90.2 %92.0 %
(a)Volumes do not include the MWh generated/sold by the Company's equity method investments.
(b) Volumes generated are not sold by the Company as the Conventional facilities sell capacity rather than energy.
(c)MWh sold do not include 34 MWh and 110 MWh during the three months ended September 30, 2017 and 2016, respectively, and 52 MWh and 184 MWh during the nine months ended September 30, 2017 and 2016, respectively, generated by NRG Dover, a subsidiary of the Company, under the PPA with NRG Power Marketing, as further described in Note 9, Related Party Transactions.

45


Management’s Discussion of the Results of Operations for the Three Months Ended SeptemberJune 30, 20172021 and 20162020
Gross Margin
The Company calculates gross margin in order to evaluate operating performance as operating revenues less cost of sales, which includes cost of fuel, contract and emission credit amortization and mark-to-market for economic hedging activities.
EconomicAdjusted Gross Margin
In addition to gross margin,total operating revenues, the Company evaluates its operating performance using the measure of economic gross margin,Adjusted Gross Margin, which is not a GAAP measure and may not be comparable to other companies’ presentations or deemed more useful than the GAAP information provided elsewhere in this report. Economic gross marginAdjusted Gross Margin is defined as total operating revenues, excluding contract amortization and mark-to-market for economic hedges, less cost of fuels. Adjusted Gross Margin should be viewed as a supplement to and not a substitute for the Company'Company's presentation of gross margin,total operating revenues, which is the most directly comparable GAAP measure. Economic gross margin is not intended to represent gross margin. The Company believes that economic gross marginAdjusted Gross Margin is useful to investors as it is a key operational measure reviewed by the Company's chief operating decision maker. Economic gross marginCost of fuels is defined as energytypically recovered through customer revenue contracts and capacitytherefore, Adjusted Gross Margin excludes any revenue less costeffect of fuels. Economic gross margin excludes the following components from GAAP gross margin: contract amortization, mark-to-market results, emissions credit amortization and (losses) gains on economic hedging activities. Mark-to-market results consist of unrealized gains and losses on contracts that are not yet settled.fluctuations in these expenses.
The below tables present the composition of gross margin,total operating revenues, as well as the reconciliation to economic gross margin,Adjusted Gross Margin, for the three months ended SeptemberJune 30, 20172021 and 2016:2020:
(In millions)Conventional GenerationRenewablesThermalTotal
Three months ended June 30, 2021
Total operating revenues$109 $222 $49 $380 
Less:
Cost of fuels(1)— (15)(16)
Contract amortization30 37 
Mark-to-market economic hedging activities— 31 — 31 
Adjusted Gross Margin$114 $283 $35 $432 
Three months ended June 30, 2020
Total operating revenues$107 $180 $42 $329 
Less:
Cost of fuels(1)— (12)(13)
Contract amortization16 — 22 
Mark-to-market for economic hedging activities— — 
Adjusted Gross Margin$112 $199 $30 $341 
Operating Revenues
 Conventional Generation Renewables Thermal Total
 (In millions) 
Three months ended September 30, 2017       
Energy and capacity revenues$89
 $147
 $47
 $283
Cost of fuels
 
 (15) (15)
Contract amortization(1) (16) (1) (18)
Gross margin88
 131
 31
 250
Contract amortization1
 16
 1
 18
Economic gross margin$89
 $147
 $32
 $268
        
Three months ended September 30, 2016       
Energy and capacity revenues$83
 $158
 $48
 $289
Cost of fuels
 (1) (17) (18)
Contract amortization(1) (16) 
 (17)
Gross margin82
 141
 31
 254
Contract amortization1
 16
 
 17
Economic gross margin$83
 $157
 $31
 $271
Gross margin decreasedOperating revenues increased by $4$51 million during the three months ended SeptemberJune 30, 2017,2021, compared to the same period in 2016,2020, due to a combination of the following:drivers summarized in the table below:
 (In millions)
Decrease in the Renewables segment due to a 12% decrease in volume generated by wind projects, primarily at NRG Wind TE Holdco, Alta Wind and Tapestry, as well as a 6% decrease in solar generation, primarily at CVSR in connection with lower insolation$(10)
Increase in the Conventional segment due to fewer outages at Walnut Creek in 2017, as well as increased start revenues at El Segundo and Marsh Landing6
Decrease in gross margin

$(4)


Segment(In millions)
RenewablesIncrease due to higher wind production at Alta as well as the acquisitions of Agua Caliente, Mesquite Star, Rattlesnake Flat and Rosamond Central and consolidation of the DGPV investments$42 
ThermalIncrease primarily driven by higher volumes and higher gas prices passed through to customers
ConventionalIncrease primarily due to an increase in start revenue at Marsh Landing and improved availability at the California natural gas portfolio
$51 
Operations and Maintenance Expense
Operations and maintenance expense increased by $5$15 million during the three months ended SeptemberJune 30, 2017,2021, compared to the same period in 2016,2020, primarily due to the forced outages that took place at Walnut Creek inacquisition of solar and wind projects during the second half of 2020 and first half of 2017.2021.
46

Depreciation, Amortization and AmortizationAccretion Expense
Depreciation, amortization and amortizationaccretion expense increased by $13$29 million during the three months ended SeptemberJune 30, 2017,2021, compared to the same period in 2016,2020, primarily due to change in estimated useful lives for certain components of fixed assetsa $30 million increase in the Renewables segment. The increase in the Renewables segment related to a $7 million increase related to the consolidation of the DGPV investments and Conventional segmentsa $14 million increase related to the acquisition of Aqua Caliente and Rattlesnake in the first quarter of 2021 and wind facilities acquired in the second half of 2017.2020. In addition, approximately $9 million of accelerated depreciation was recorded in the second quarter of 2021 related to the repowering of the Pinnacle wind facility.
Equity in Earnings of Unconsolidated Affiliates
Equity in earnings of unconsolidated affiliates increaseddecreased by $12$8 million during the three months ended SeptemberJune 30, 2017,2021, compared to the same period in 2016,2020, primarily due to an increasethe consolidation of the DGPV investments on November 2, 2020, the acquisition of the additional interest and consolidation of Agua Caliente in February 2021 and the sale of the interests in RPV Holdco 1 LLC in May 2020, which had earnings fromin the Utah Solar Portfolio,second quarter of 2020.
Gain on Sale of Unconsolidated Affiliate
On May 14, 2020, the Company sold its interests in RPV Holdco 1 LLC, or RPV Holdco, to Spruce Power, which was acquired by NRGresulted in November 2016, as well as an increase in earnings from Desert Sunlight, partially offset by a decrease in earnings from Avenalgain on sale of investment of approximately $49 million. For further discussion on this transaction, see Item 1- Note 3, Acquisitions and Dispositions.
Interest Expense
Interest expense increased by $4$10 million during the three months ended SeptemberJune 30, 2017,2021, compared to the same period in 2016,2020, due to:to the following:
(In millions)
Increase in interest expense due to increased principal balances of project level debt primarily due to acquisitions in the Renewables segment, partially offset by lower interest expense in the Conventional segment due to lower principal balances of debt outstanding$11 
Increase in Corporate interest expense due to additional issuance of the 2028 Senior Notes in May 2020, partially offset by lower interest expense related to revolver borrowings
Change in fair value of interest rate swaps(2)
$10 
 (In millions)
Issuance of the new long-term debt, primarily including 2026 Senior Notes in August 2016, Energy Center Minneapolis Series D Notes due 2031 issued in October 2016, and Agua Caliente Borrower 2 due 2038
issued in February 2017
$6
Utah Solar Portfolio debt assumed in connection with the acquisition of the March 2017 Drop Down Assets4
Lower principal balances on certain project level debt in 2017, as well as higher revolver borrowings in 2016(4)
Amortization of de-designated interest rate swaps, partially offset by the change in fair value of interest rate swaps(2)
Increase in interest expense$4

Income Attributable to Noncontrolling Interests and Redeemable Interests
For the three months ended SeptemberJune 30, 2017,2021, the Company had a losslosses of $23$35 million attributable to noncontrolling interests with respect to its tax equity financing arrangements and the applicationredeemable interests comprised of the HLBV method. following:
(In millions)
Losses attributable to tax equity financing arrangements and the application of the HLBV method$(36)
Net income attributable to third party investors in Lighthouse Renewable Holdco LLC, Agua Caliente, Lighthouse Renewable Holdco LLC and Kawailoa Renewables, LLC partnerships
$(35)
For the three months ended SeptemberJune 30, 2016,2020, the Company had a losslosses of $38$27 million attributable to noncontrolling interests with respect to its tax equity financing arrangements and the applicationredeemable interests comprised of the HLBV method, which generally allocates more loss to the noncontrolling interest in the first several years after fund formation, reflecting the allocation of tax items such as production tax credits and tax depreciation to the fund investors.following:


(In millions)
Losses attributable to tax equity financing arrangements and the application of the HLBV method$(31)
Income attributable to CEG's interest in the Kawailoa, Oahu and Repowering partnerships
Income attributable to third party investor in Kawailoa Renewables, LLC
$(27)

47

Management’s Discussion of the Results of Operations for the NineSix Months Ended SeptemberJune 30, 20172021 and 20162020
Gross Margin
The Company calculates gross margin in order to evaluate operating performance as operating revenues less cost of sales, which includes cost of fuel, contract and emission credit amortization and mark-to-market for economic hedging activities.
EconomicAdjusted Gross Margin
In addition to gross margin,total operating revenues, the Company evaluates its operating performance using the measure of economic gross margin,Adjusted Gross Margin, which is not a GAAP measure and may not be comparable to other companies’ presentations or deemed more useful than the GAAP information provided elsewhere in this report. Economic gross marginAdjusted Gross Margin is defined as total operating revenues, excluding contract amortization and mark-to-market for economic hedges, less cost of fuels. Adjusted Gross Margin should be viewed as a supplement to and not a substitute for the Company'Company's presentation of gross margin,total operating revenues, which is the most directly comparable GAAP measure. Economic gross margin is not intended to represent gross margin. The Company believes that economic gross marginAdjusted Gross Margin is useful to investors as it is a key operational measure reviewed by the Company's chief operating decision maker. Economic gross marginCost of fuels is defined as energytypically recovered through customer revenue contracts and capacitytherefore, Adjusted Gross Margin excludes any revenue less costeffect of fuels. Economic gross margin excludes the following components from GAAP gross margin: contract amortization, mark-to-market results, emissions credit amortization and (losses) gains on economic hedging activities. Mark-to-market results consist of unrealized gains and losses on contracts that are not yet settled.fluctuations in these expenses.
The below tables present the composition of gross margin,total operating revenues, as well as the reconciliation to economic gross margin,Adjusted Gross Margin, for the ninesix months ended SeptemberJune 30, 20172021 and 2016:2020:
(In millions)Conventional GenerationRenewablesThermalTotal
Six months ended June 30, 2021
Total operating revenues$211 $308 $98 $617 
Less:
Cost of fuels(3)— (32)(35)
Contract amortization12 55 69 
Mark-to-market for economic hedges— 55 — 55 
Adjusted Gross Margin$220 $418 $68 $706 
Six months ended June 30, 2020
Total operating revenues$210 $287 $90 $587 
Less:
Cost of fuels(2)— (28)(30)
Contract amortization12 31 44 
Mark-to-market for economic hedging activities— — 
Adjusted Gross Margin$220 $326 $63 $609 
48

 Conventional Generation Renewables Thermal Total
(In millions) 
Nine months ended September 30, 2017       
Energy and capacity revenues$250
 $437
 $132
 $819
Cost of fuels
 
 (45) (45)
Contract amortization(4) (46) (2) (52)
Gross margin246
 391
 85
 722
Contract amortization4
 46
 2
 52
Economic gross margin$250
 $437
 $87
 $774
        
Nine months ended September 30, 2016       
Energy and capacity revenues$250
 $458
 $132
 $840
Cost of fuels(1) (1) (46) (48)
Contract amortization(4) (46) (1) (51)
Emissions credit amortization(6) 
 
 (6)
Gross margin239
 411
 85
 735
Contract amortization4
 46
 1
 51
Emissions credit amortization6
 
 
 6
Economic gross margin$249
 $457
 $86
 $792
Operating Revenues
Gross margin decreasedOperating revenues increased by $13$30 million during the ninesix months ended SeptemberJune 30, 2017,2021, compared to the same period in 2016,2020, due to a combination of the following:drivers summarized in the table below:
 (In millions)
Decrease in the Renewables segment due to a 4% decrease in volume generated by wind projects, primarily in connection with lower wind resource at the Alta Wind, and NRG Wind TE Holdco projects, as well as a 5% decrease in solar generation, primarily at CVSR in connection with lower insolation$(20)
Increase in the Conventional segment, primarily due to Emissions credit amortization of NOx allowances at Walnut Creek and El Segundo in compliance with amendments to the Regional Clean Air Incentives Market program in 20167
Decrease in gross margin$(13)


Segment(In millions)
RenewablesIncrease due to higher wind production at Alta as well as the acquisitions of Agua Caliente, Mesquite Star, Rattlesnake Flat and Rosamond Central, and the consolidation of the DGPV investments, offset in part by $50 million of net settlements of obligations for wind facilities that were unable to produce the required output during extreme weather conditions in Texas in February 2021$22 
ThermalIncrease primarily driven by higher volumes and higher gas prices passed through to customers
ConventionalIncrease primarily due to an increase in start revenue at Marsh Landing and improved availability at the California natural gas portfolio
$30 
Operations and Maintenance Expense

Operations and maintenance expense increased by $9$27 million during the ninesix months ended SeptemberJune 30, 2017,2021, compared to the same period in 2016,2020, primarily due to forced outages at Walnut Creekthe acquisition of solar and El Segundo in 2017.wind projects during the second half of 2020 and first half of 2021.
Depreciation, Amortization and AmortizationAccretion Expense
Depreciation, amortization and amortizationaccretion expense increased by $17$55 million during the ninesix months ended SeptemberJune 30, 2017,2021, compared to the same period in 2016,2020, primarily due to a $54 million increase in the Renewables segment. The increase in the Renewables segment related to a $15 million increase due to the combinationconsolidation of the following:
 (In millions)
Increase in depreciation expense due to an update in estimated useful lives for certain components of fixed assets in the first half of 2017 in the Conventional and Renewables segments$23
Decrease in depreciation expense at NRG Wind TE Holdco, primarily due to the effect of assets impairment at Elbow Creek, Goat and Forward that took place in December 2016, as further described in Note 9 - Asset Impairments to the Company's 2016 Form 10-K.
(6)
Increase in depreciation and amortization expense$17
DGPV investments in 2020 and a $26 million increase related to the acquisition of Aqua Caliente and Rattlesnake in the first quarter of 2021 and wind facilities acquired in the second half of 2020. In addition, approximately $18 million of accelerated depreciation was recorded in 2021 related to the repowering of the Pinnacle wind facility partially offset by accelerated depreciation of $5 million recorded in the first half of 2020 for the repowering of the Wildorado wind facility.
Equity in Earnings of Unconsolidated Affiliates
Equity in earnings of unconsolidated affiliates increased by $29$9 million during the ninesix months ended SeptemberJune 30, 2017,2021, compared to the same period in 2016,2020, primarily due to the acquisitiondriven by increased earnings from Desert Sunlight in 2021 and consolidation of the Utah Solar PortfolioDGPV investments on November 2, 2020, which had losses in November 2016,2020 partially offset by acquisition of additional interest and consolidation of Agua Caliente in February 2021 and sale of the interests in RPV Holdco 1 LLC in May 2020, which had earnings in 2020.
Gain on Sale of Unconsolidated Affiliate
On May 14, 2020, the Company sold its interests in RPV Holdco 1 LLC, or RPV Holdco, to Spruce Power, which resulted in a decrease in earnings from the Company's partnerships with NRG. gain on sale of investment of approximately $49 million. For further discussion on this transaction, see Item 1- Note 3, Acquisitions and Dispositions.
Interest Expense Loss on Debt Extinguishment
Interest expenseLoss on debt extinguishment increased by $23$39 million during the ninesix months ended SeptemberJune 30, 2017,2021, compared to the same period in 2016,2020, primarily driven by the write-off of previously deferred finance costs and payment of premiums related to the redemption of the 2025 Senior Notes in 2021.
49

Interest Expense
Interest expense decreased by $112 million during the six months ended June 30, 2021, compared to the same period in 2020, primarily due to:to the following:
(In millions)
Change in fair value of interest rate swaps due to an increase in forward rates in 2021 as compared to a decrease in rates during March 2020 at the onset of the COVID-19 pandemic$(128)
Increase in interest expense due to increased principal balances of project level debt primarily due to acquisitions in the Renewables segment, partially offset by lower interest expense in the Conventional segment due to lower principal balances of debt outstanding14 
Increase in Corporate interest expense due to additional issuance of the 2028 Senior Notes in May 2020, partially offset by lower interest expense related to revolver borrowings
$(112)
 (In millions)
Issuance of the new long-term debt in the second half of 2016, including primarily 2026 Senior Notes, CVSR Holdco Notes due 2037, and Energy Center Minneapolis Series D Notes due 2031$20
Utah Solar Portfolio debt assumed in connection with the acquisition of the March 2017 Drop Down Assets12
Amortization of de-designated interest rate swaps, as well as the change in fair value of interest rate swaps2
Higher revolver borrowings in 2016 combined with the lower principal balances on project level debt in 2017(11)
Increase in interest expense$23
IncomeLoss Attributable to Noncontrolling Interests and Redeemable Interests
For the ninesix months ended SeptemberJune 30, 2017,2021, the Company had a loss of $56$102 million attributable to noncontrolling interests with respect to its tax equity financing arrangements and the applicationredeemable interests comprised of the HLBV method. following:
(In millions)
Losses attributable to tax equity financing arrangements and the application of the HLBV method$(77)
Losses attributable to third party investor in Lighthouse Renewable Holdco LLC(39)
Income attributable to third party investor in Agua Caliente
Income attributable to third party investor in Rosie TargetCo LLC
Income attributable to third party investor in Kawailoa Renewables, LLC
$(102)

For the ninesix months ended SeptemberJune 30, 2016,2020, the Company had a loss of $67$66 million attributable to noncontrolling interests with respect to its tax equity financing arrangements and applicationredeemable interests comprised of the HLBV method, which generally allocates more loss to the noncontrolling interest in the first several years after fund formation, reflecting the allocation of tax items such as production tax credits and tax depreciation to the fund investors.

following:

(In millions)
Losses attributable to tax equity financing arrangements and the application of the HLBV method$(75)
Income attributable to CEG's interest in the Kawailoa, Oahu and Repowering partnerships
$(66)
50

Liquidity and Capital Resources
The Company's principal liquidity requirements are to meet its financial commitments, finance current operations, fund capital expenditures, including acquisitions from time to time, service debt and pay distributions. As a normal part of the Company's business, depending on market conditions, the Company will from time to time consider opportunities to repay, redeem, repurchase or refinance its indebtedness. Changes in the Company's operating plans, lower than anticipated sales, increased expenses, acquisitions or other events may cause the Company to seek additional debt or equity financing in future periods. There can be no guarantee that financing will be available on acceptable terms or at all. Debt financing, if available, could impose additional cash payment obligations and additional covenants and operating restrictions.
Current Liquidity Position
As of SeptemberJune 30, 20172021 and December 31, 20162020, the Company's liquidity was approximately $745$810 million and $921$894 million, respectively, comprised of cash, restricted cash and availability under the Company's revolving credit facility.
(In millions)June 30, 2021December 31, 2020
Cash and cash equivalents:
Clearway Energy, Inc. and Clearway Energy LLC, excluding subsidiaries$13 $119 
Subsidiaries125 149 
Restricted cash:
Operating accounts131 73 
Reserves, including debt service, distributions, performance obligations and other reserves201 124 
Total cash, cash equivalents and restricted cash$470 $465 
Revolving credit facility availability340 429 
Total liquidity$810 $894 
The Company's liquidity includes $140$332 million and $165$197 million of restricted cash balances as of SeptemberJune 30, 20172021 and December 31, 20162020, respectively. Restricted cash consists primarily of funds to satisfy the requirements of certain debt agreementsarrangements and funds held within the Company's projects that are restricted in their use. The Company's various financing arrangements are described in Note 7, Long-term Debt. As of SeptemberJune 30, 2017,2021, these restricted funds were comprised of $131 million designated to fund operating expenses, approximately $38 million designated for current debt service payments, and $130 million restricted for reserves including debt service, performance obligations and other reserves, as well as capital expenditures. The remaining $33 million is held in distribution reserve accounts.
As of June 30, 2021, the Company had $427$67 million of available borrowings under itsthe revolving credit facility.
As of September 30, 2017, there were no outstanding borrowingsfacility and there were $68$88 million ofin letters of credit outstanding. During the six months ended June 30, 2021, the Company borrowed $300 million under the revolving credit facility, and subsequently repaid $233 million utilizing cash on hand and the proceeds from the issuance of the 2031 Senior Notes. During July 2021, the company repaid the outstanding $67 million balance under the revolving credit facility and as of July 31, 2021, the Company had no loans outstanding under the Company's revolving credit facility.facility and a total of $75 million in letters of credit outstanding.
Management believes that the Company's liquidity position, cash flows from operations, and availability under its revolving credit facility will be adequate to meet the Company's financial commitments; debt service obligations; growth, operating and maintenance capital expenditures; and to fund distributions to Yield,Clearway Energy, Inc. and NRG.CEG.  Management continues to regularly monitor the Company's ability to finance the needs of its operating, financing and investing activity within the dictates of prudent balance sheet management.
Credit Ratings
Credit rating agencies rate a firm's public debt securities. These ratings are utilized by the debt markets in evaluating a firm's credit risk. Ratings influence the price paid to issue new debt securities by indicating to the market the Company's ability to pay principal, interest and preferred dividends. Rating agencies evaluate a firm's industry, cash flow, leverage, liquidity, and hedge profile, among other factors, in their credit analysis of a firm's credit risk.
As of SeptemberJune 30, 2017,2021, the Company's 20242026 Senior Notes, 2028 Senior Notes and 20262031 Senior Notes arewere rated BB by S&P and Ba2 by Moody's, respectively. The ratings outlook is stable.Moody's.
51

Sources of Liquidity
The Company's principal sources of liquidity include cash on hand, cash generated from operations, proceeds from sales of assets, borrowings under new and existing financing arrangements and the issuance of additional equity and debt securities as appropriate given market conditions. As described inItem 1—1 — Note 7, Long-term Debt, to this Form 10-Q and Item 15 — Note 10, Long-term Debt, to the consolidated financial statements included in the Company's May 9, 20172020 Form 8-K10-K, the Company's financing arrangements consist of corporate level debt, which includes Senior Notes and the revolving credit facility, the Senior Notes,facility; the ATM Program, its intercompany borrowings with Yield, Inc.Programs; and project-level financings for its various assets.
At-the-Market Equity Offering ProgramRevolving Credit Facility
NRG Yield, Inc.The Company has a total of $340 million available under the revolving credit facility as of June 30, 2021. The facility will continue to be used for general corporate purposes including financing of future acquisitions and posting letters of credit.
2031 Senior Notes
On March 9, 2021, Clearway Energy Operating LLC completed the sale of $925 million of senior unsecured notes due 2031, or the 2031 Senior Notes. The 2031 Senior Notes bear interest at 3.750% and mature on February 15, 2031. Interest on the 2031 Senior Notes is party to an equity distribution agreement with Barclays Capital Inc., Credit Suisse Securities (USA) LLC, J.P. Morgan Securitiespayable semi-annually on February 15 and August 15 of each year, and interest payments will commence on August 15, 2021. The 2031 Senior Notes are unsecured obligations of Clearway Energy Operating LLC and RBC Capital Markets,are guaranteed by the Company and by certain of Clearway Energy Operating LLC's wholly owned current and future subsidiaries. The net proceeds from the 2031 Senior Notes were used to repurchase the 2025 Senior Notes, as well as to repay amounts outstanding under the Company’s revolving credit facility and for general corporate purposes.
Pinnacle Repowering Partnership Holdco LLC as sales agents. PursuantFinancing
On March 10, 2021, the Company entered into a financing agreement for non-recourse debt for a total commitment of $126 million related to the termsrepowering of the equity distribution agreement, NRG Yield, Inc. may offer and sell sharesPinnacle wind project. The debt consists of its Class C common stock par value $0.01 per share, from timea construction loan at an interest rate of LIBOR plus 1.00%. The company's initial borrowings of $79 million were utilized to time through the sales agents up to an aggregate sales price of $150,000,000 through an at-the-market equity offering program, or the ATM Program. NRG Yield, Inc. may also sell shares of its Class C common stock to anyrepay $53 million of the sales agents, as principals for its own account, at a price agreed upon at the time of sale. During the three months ended September 30, 2017, Yield, Inc. issued 987,727 shares of Class C common stockoutstanding balance under the ATM ProgramTapestry financing agreement, which related to the Pinnacle wind project, and to reimburse Clearway Renew LLC for gross proceedsequipment purchases and pay vendor invoices and fees.
Oahu and Kawailoa Hawaii Refundable Tax Credits
In 2020, the members of $18 million. During the nine months ended September 30, 2017, Yield, Inc. issued 1,921,866 sharespartnerships holding the Oahu Solar and Kawailoa Solar projects submitted applications to the state of Class C common stockHawaii for refundable tax credits based on the cost of construction of the projects. In April 2021, the members of the partnerships contributed their respective portions of the tax credits in the amount of $49 million to the Oahu Solar and Kawailoa project companies, which is reflected in restricted cash on the Company's consolidated balance sheet with an offsetting adjustment to noncontrolling interests. In accordance with the projects' related agreements, the cash will be held in a restricted account and utilized to offset future invoiced amounts under the ATM Program for gross proceeds of $35 million and incurred commission fees of $346 thousand. Yield, Inc. used the net proceeds to acquire 1,921,866 Class C units from Yield LLC.projects' PPAs.


Thermal Financing
On March 16, 2017, NRG Energy Center Minneapolis LLC, a subsidiary of NRG Thermal LLC, amended the shelf facility of its existing Thermal financing arrangement to allow for the issuance of an additional $10 million of Series F notes at a 4.60% interest rate, or the Series F Notes, increasing the total principal amount of notes available for issuance under the shelf facility to $80 million. The Series F Notes will be secured by substantially all of the assets of NRG Energy Center Minneapolis LLC. NRG Thermal LLC has guaranteed the indebtedness and its guarantee is secured by a pledge of the equity interests in all of NRG Thermal LLC’s subsidiaries.
Uses of Liquidity
The Company's requirements for liquidity and capital resources, other than for operating its facilities, are categorized as: (i) debt service obligations, as described more fully in Item 1 — Note 7, Long-term Debt,;to the Consolidated Financial Statements; (ii) capital expenditures; (iii) acquisitions and investments; and (iv) distributions.

Capital Expenditures
The Company's capital spending program is mainly focused on maintenance capital expenditures, consisting of costs to maintain the assets currently operating, such as costs to replace or refurbish assets, and growth capital expenditures consisting of costs to construct new assets, costs to complete the construction of assets where construction is in process, and capital expenditures related to acquiring additional thermal customers.
For the ninesix months ended SeptemberJune 30, 20172021, the Company used approximately $23$93 million to fund capital expenditures, including growth expenditures of $2$58 million in the ThermalRenewables segment, $18 million of which were incurred in connection with expansionthe Rosamond Central solar project, $17 million incurred in connection with the Rattlesnake wind project, $13 million incurred in connection with the repowering of its customer base. For the nine months ended September 30, 2016, the Company used approximately $16 million to fund capital expenditures, of which $12Pinnacle wind project and $10 million related to maintenance expenditures. the Mesquite Star wind project. The Company develops annualalso incurred $23 million of growth capital spending plans based on projected requirements forexpenditures in the Thermal and Conventional segments in connection with various development projects. In addition, the Company incurred $12 million in maintenance and growth capital.capital
52

expenditures. The Company estimated an additional $5 million and $32estimates $28 million of maintenance expenditures for the remainder of 2017 and full 2018, respectively. 2021. These estimates are subject to continuing review and adjustment and actualadjustment. Actual capital expenditures may vary from these estimates.
Acquisitions and Investments
The Company intends to acquire generation and thermal infrastructure assets developed and constructed by NRG and third parties in the future,CEG, as well as generation and thermal infrastructure assets from third parties where the Company believes its knowledge of the market and operating expertise provides a competitive advantage, and to utilize such acquisitions as a means to grow its CAFD.
On February 24, 2017, the Company amended and restated the ROFO Agreement, expanding the ROFO Assets pipeline with the addition of 234 net MW of utility-scale solar projects, consisting of Buckthorn, a 154 net MW solar facility in Texas, and Hawaii solar projects, which have a combined capacity of 80 net MW.
On October 17, 2017, NRG offered the Company the opportunity to purchase 100% of its ownership interest in Buckthorn pursuant to the ROFO Agreement. The Buckthorn acquisition is subject to negotiation and approval by the Company's independent directors.
As discussed in Item 1 — Note 3, Business Acquisitions, the Company completed the following acquisitions in 2017:
November 2017Rattlesnake Drop Down Assets On November 1, 2017,January 12, 2021, the Company acquired 100% of CEG's equity interest and a 38third party investor's minority interest in CWSP Rattlesnake Holding LLC, which indirectly owns the Rattlesnake wind project, a 160 MW solar portfolio primarily comprised of assetswind facility located in Adams County, Washington for $132 million in cash consideration. The Company's net capital commitment was $119 million after proceeds from NRG's Solar Power Partners (SPP) fundsa state sales and other projects developed by NRG, for cash consideration of $71 million, excluding working capital adjustments, plus assumed non-recourse debt of $26 million. As of September 30, 2017, the November 2017 Drop Down Assets' debt was $33 million, ofuse tax refund, which $7 million was paid by NRGwere received in October 2017.May 2021.
August 2017 Drop Down Assets Agua Caliente Acquisition On August 1, 2017,February 3, 2021, the Company acquired the remaining 25%an additional 35% equity interest in NRG Wind TE Holdco, a portfolio of 12 wind projects, from NRG for total cash consideration of $44 million, including a working capital adjustment of $3 million. The transaction also includes potential additional payments to NRG dependent upon actual energy prices for merchant periods beginning in 2027.
March 2017 Drop Down Assets On March 27, 2017, the Company acquired the following interests from NRG: (i) Agua Caliente Borrower 2 LLC, which owns a 16% interest (approximately 31% of NRG's 51% interest) in the Agua Caliente solar farm, one of the ROFO Assets, representing ownership of approximately 46 netproject from NRG Energy, Inc. for $202 million. Agua Caliente is a 290 MW of capacity, and (ii) NRG's interests in seven utility-scale solar farmsproject located in Utah, which are part of a tax equity structure with Dominion Solar Projects III, Inc., or Dominion, fromDateland, Arizona in which the Company would receive 50%previously owned a 16% equity interest.
Pinnacle Wind Repowering — On February 26, 2021, the Company, through an indirect subsidiary, entered into an amended partnership agreement with CEG to repower the Pinnacle wind project, a 55 MW wind facility located in Mineral County, West Virginia. The amended agreement commits the Company to invest an estimated $67 million in net corporate capital, subject to closing adjustments, and no longer requires an additional payment in 2031. Commercial operations and corporate capital funding for the Pinnacle wind repowering are expected to occur in the second half of 2021. Additionally, on March 10, 2021, the Pinnacle wind project acquired equipment from CEG for $21 million in cash to be distributed. Theconsideration.
Mt. Storm Acquisition — On April 23, 2021, the Company paid cash considerationacquired 100% of $130the equity interests in NedPower Mount Storm LLC, or Mt. Storm, from Castleton Commodities International for approximately $96 million plus $2 million ofbefore working capital and assumed non-recourse project debt. The purchase price foradjustments in the acquisition was funded withnet amount of $4 million, representing a total cash on hand.outflow of $100 million. Mt. Storm is a 264 MW wind project located in Grant County, West Virginia.


InvestmentLighthouse Partnership with NRG
AgreementsOn September 26, 2017,December 21, 2020, subsidiaries of the Company entered into a partnership with NRG by forming NRG DGPV Holdco 3 LLC, or DGPV Holdco 3,the Lighthouse Partnership Agreements providing for the Company's co-investment in which the Company would invest up to $50 million in an operatinga portfolio of distributed solar assets, primarily comprised of community solarrenewable energy projects developed by NRG.CEG. The Company invested $4expects to invest approximately $142 million during September 2017in 2021 for 50% cash equity interests in the Mesquite Sky and Black Rock wind projects, subject to closing adjustments and the projects achieving certain milestones.


Debt Repurchases
2025 Senior Notes Tender Offer and RedemptionOn March 9, 2021, the Company completed the repurchase of an aggregate principal amount of $411 million, or 68.6%, of the 2025 Senior Notes outstanding as part of the cash tender offer announced on March 2, 2021. Additionally, $6 million of the 2025 Senior Notes that were subject to guaranteed delivery procedures were repurchased on March 11, 2021. Concurrently with an additional $16the launch of the tender offer, the Company exercised its right to optionally redeem the remaining principal amount of $183 million duenot validly tendered and purchased in the tender offer, pursuant to NRGthe terms of the indenture governing the 2025 Senior Notes. The 2025 Senior Notes repurchased and redeemed in accounts payable - affiliate as of September 30, 2017, to be funded in tranches as the project milestones are completed. The Company co-owns approximately 33 MW of distributed solar capacity, based on cash to be distributed, withMarch 2021 were effectuated at a weighted average contract lifepremium of approximately 20 years106% for total consideration of $636 million and as of September 30, 2017.
During the nine months ended September 30, 2017,a result, the Company invested $37recorded a loss on extinguishment in the amount of $36 million. In addition, the Company recorded a $5 million in NRG DGPV Holdco 2 LLC.loss on extinguishment to write off the remaining unamortized deferred financing fees related to the 2025 Senior Notes.
Cash Distributions to Yield,Clearway Energy, Inc. and NRG
The Company intends to distribute to its unit holders in the form of a quarterly distribution all of the CAFD it generates each quarter, less reserves for the prudent conduct of the business, including among others, maintenance capital expenditures to maintain the operating capacity of the assets. CAFD is defined as net income before interest expense, income taxes, depreciation and amortization, plus cash distributions from unconsolidated affiliates, cash receipts from notes receivable, less cash distributions to noncontrolling interests, maintenance capital expenditures, pro-rata EBITDA from unconsolidated affiliates, cash interest paid, income taxes paid, principal amortization of indebtedness and changes in prepaid and accrued capacity payments. DividendsDistributions on the Class A common stock and Class C common stockthe units are subject to available capital, market conditions, and compliance with associated laws, regulations and other contractual obligations. The Company expects that, based on current circumstances, comparable cash dividendsdistributions will continue to be paid in the foreseeable future.
53

The following table lists the distributions paid on the Company's Class A, B, C and D units during the ninesix months ended SeptemberJune 30, 2017:2021:
 Third Quarter 2017 Second Quarter 2017 First Quarter 2017
Distributions per Class A, B, C and D unit$0.28
 $0.27
 $0.26
Second Quarter 2021First Quarter 2021
Distributions per Class A, B, C and D unit$0.329 $0.324 
On October 31, 2017,July 23, 2021, the Company declared a distribution on its Class A, Class B, Class C and Class D units of $0.288$0.3345 per unit payable on DecemberSeptember 15, 20172021 to unit holders of record as of DecemberSeptember 1, 2017.2021.

Financial Disclosures About Guarantors and Issuers of Guaranteed Registered Securities
As of June 30, 2021, Clearway Energy Operating LLC’s outstanding registered senior notes consisted of $350 million of the 2026 Senior Notes, as further described in Note 7, Long-term Debt. The 2026 Senior Notes are guaranteed by the Company, as well as certain of the Company's wholly owned subsidiaries, or guarantor subsidiaries. These guarantees are full, irrevocable, unconditional, absolute, joint and several, and cover all payment obligations arising under the 2026 Senior Notes. The non-guarantor subsidiaries include the rest of the Company's subsidiaries, including the subsidiaries that are subject to project financing.
54

Clearway Energy Operating LLC conducts much of its business through and derives much of its income from its subsidiaries. Therefore, its ability to make required payments with respect to its indebtedness and other obligations depends on the financial results and condition of its subsidiaries and Clearway Energy Operating LLC's ability to receive funds from its subsidiaries. There are no restrictions on the ability of any of the guarantor subsidiaries to transfer funds to Clearway Energy Operating LLC. However, there may be restrictions for certain non-guarantor subsidiaries.
The following tables present summarized financial information for Clearway Energy Operating LLC, the issuer of the 2026 Senior Notes and the guarantor subsidiaries in accordance with Rule 3-10 under the SEC Regulation S-X. The financial information may not necessarily be indicative of results of operations or financial position had the guarantor subsidiaries operated as independent entities. Transactions between Clearway Energy Operating LLC and the guarantors have been eliminated and the summarized financial information does not reflect investments of Clearway Energy Operating LLC and the guarantors in the non-guarantor subsidiaries.
Balance Sheet data:June 30, 2021
(in millions)Clearway Energy Operating LLC (2026 Senior Notes Issuer)Other Guarantor SubsidiariesTotal
Current assets$12 $$16 
Property, plant and equipment, net50 54 
Non-current assets332 10 342 
Current liabilities38 39 
Non-current liabilities$2,176 $$2,178 
Balance Sheet data:December 31, 2020
(in millions)Clearway Energy Operating LLC (2026 Senior Notes Issuer)Other Guarantor SubsidiariesTotal
Current assets$14 $$19 
Property, plant and equipment, net52 55 
Non-current assets336 10 346 
Current liabilities35 36 
Non-current liabilities$1,789 $19 $1,808 
Income Statement data:Six months ended June 30, 2021
(in millions)Clearway Energy Operating LLC (2026 Senior Notes Issuer)Other Guarantor SubsidiariesTotal
Operating revenues$$$
Gross profit— 
Net (loss) income(94)(92)
Net (loss) income attributable to controlling interest$(86)$$(84)
Income Statement data:Six months ended June 30, 2020
(in millions)Clearway Energy Operating LLC (2026 Senior Notes Issuer)Other Guarantor SubsidiariesTotal
Operating revenues$$$
Gross profit— 
Net loss(94)(92)
Net loss attributable to controlling interest$(86)$$(84)

55

Cash Flow Discussion
The following table reflects the changes in cash flows for the ninesix months ended SeptemberJune 30, 2017,2021, compared to the ninesix months ended SeptemberJune 30, 2016:2020:
Six months ended June 30,
20212020Change
(In millions)
Net cash provided by operating activities$241 $183 $58 
Net cash (used in) provided by investing activities(420)40 (460)
Net cash provided by (used in) financing activities$184 $(222)$406 
 Nine months ended September 30,  
 2017 2016 Change
 (In millions)
Net cash provided by operating activities$375
 $444
 $(69)
Net cash used in investing activities(204) (135) (69)
Net cash used in financing activities(339) (212) (127)

Net Cash Provided Byby Operating Activities
Changes to net cash provided by operating activities were driven by:(In millions)
Increase in operating income adjusted for non-cash items$50 
Increase in dividend distributions received from unconsolidated affiliates
Increase in working capital driven primarily by the timing of accounts receivable collections and payments of accounts payable
$58 
Changes to net cash provided by operating activities were driven by:(In millions)
Decrease in operating income adjusted for non-cash items$(52)
Decrease in working capital driven primarily by timing of cash receipts from customers in the first nine months of 2017 compared to the same period in 2016(26)
Higher distributions from unconsolidated affiliates primarily due to the acquisition of the Utah Solar Portfolio, which was acquired by the Company in March 2017 and by NRG in November 20169
 $(69)


Net Cash (Used in) Provided by Investing Activities
Changes to net cash (used in) provided by investing activities were driven by:(In millions)
Cash paid for the Rattlesnake Drop Down acquisition in 2021$(132)
Cash paid for the Agua Caliente and Mt. Storm acquisitions, net of cash acquired in 2021(211)
Proceeds received from the sale of RPV Holdco, Energy Center Dover LLC and Energy Center Smyrna LLC in 2020(90)
Cash paid to CEG in 2021 for equipment for the Pinnacle wind project repowering(21)
Changes in capital expenditures(10)
Other
$(460)
Net Cash Used In Investing Activities
Changes to net cash used in investing activities were driven by:(In millions)
Payments for the August 2017 Drop Down Assets and March 2017 Drop Down Assets compared to the payments made for the CVSR Drop Down in 2016$(99)
Decrease in investments in unconsolidated affiliates in 2017 primarily due to the timing of funding of the projects37
Higher capital expenditures in 2017 compared to the same period in 2016 due primarily to maintenance expenditures at Walnut Creek as a result of the forced outages(7)
 $(69)
Net Cash Used inProvided by (Used in) Financing Activities
Changes in net cash provided by (used in) financing activities were driven by:(In millions)
Increase in proceeds from issuance of long-term debt net of payments primarily due to issuance of the 2031 Senior Notes and the Pinnacle financing agreement in 2021$249 
Increase in net contributions from CEG and noncontrolling interest members110 
Buyout of Repowering Partnership II LLC noncontrolling interest in 202070 
Increase in dividends paid to unit holders in 2021(48)
Net proceeds from equity issuance in 2020(38)
Increase in net proceeds under the revolving line of credit in 202167 
Other(4)
$406 

56
Changes in net cash used in financing activities were driven by:(In millions)
Proceeds from the issuance of Class C units$33
Net borrowings under the revolving credit facility in 2016306
Higher borrowings in 2016, primarily related to the proceeds from the issuance of 2026 Senior Notes and CVSR Holdco Notes due 2037 combined with higher repayments of long-term debt and increased financing fees in 2017(527)
Increase in net contributions from noncontrolling interests due to higher production-based payments in 2017 compared to 20166
Increase in distributions paid to unit holders(22)
Lower payments of distributions to NRG for the Drop Down Assets relating to the pre-acquisition period in 2017 compared to 201677
 $(127)

Off-Balance Sheet Arrangements
Obligations under Certain Guarantee Contracts
The Company may enter into guarantee arrangements in the normal course of business to facilitate commercial transactions with third parties.
Retained or Contingent Interests
The Company does not have any material retained or contingent interests in assets transferred to an unconsolidated entity.
Obligations Arising Out of a Variable Interest in an Unconsolidated Entity
Variable interest in equity investments — As of SeptemberJune 30, 2017,2021, the Company has several investments with an ownership interest percentage of 50% or less in energy and an energy-related entitiesentity that areis accounted for under the equity method. Utah Solar Portfolio, GenConn DGPV Holdco 1, RPV Holdco, DGPV Holdco 2, and DGPV Holdco 3 areis a variable interest entitiesentity for which the Company is not the primary beneficiary.
The Company's pro-rata share of non-recourse debt held by unconsolidated affiliates was approximately $643$358 million as of SeptemberJune 30, 2017.2021. This indebtedness may restrict the ability of these subsidiaries to issue dividends or distributions to the Company. For a complete description of debt held by unconsolidated affiliates seeNote 5, Investments Accounted for by the Equity Method and Variable Interest Entities to the consolidated financial statements for the year ended December 31, 2016 included in the Company's May 9, 2017 Form 8-K.
Contractual Obligations and Commercial Commitments
The Company has a variety of contractual obligations and other commercial commitments that represent prospective cash requirements in addition to the Company's capital expenditure programs, as disclosed in the Company's 20162020 Form 10-K. See also Note 3, Business Acquisitions to this Form 10-Q for a discussion of additional contingencies that occurred during 2017.


Fair Value of Derivative Instruments
The Company may enter into fuel purchase contracts and other energy-related derivativefinancial instruments to mitigate variability in earnings due to fluctuations in spot market prices and to hedge fuel requirements at certain generation facilities. In addition, in order to mitigate interest rate risk associated with the issuance of variable rate debt, the Company enters into interest rate swap agreements.
The tables below disclose the activities of non-exchange traded contracts accounted for at fair value in accordance with ASC 820. Specifically, these tables disaggregate realized and unrealized changes in fair value; disaggregate estimated fair values at SeptemberJune 30, 20172021, based on their level within the fair value hierarchy defined in ASC 820; and indicate the maturities of contracts at SeptemberJune 30, 20172021. For a full discussion of the Company's valuation methodology of its contracts, see Derivative Fair Value Measurements in Item 1 1 Note 5, Fair Value of Financial Instruments.
Derivative Activity (Losses) Gains(In millions)
Fair value of contracts as of December 31, 2020$(172)
Contracts realized or otherwise settled during the period17 
Contracts acquired during the period(9)
Changes in fair value(21)
Fair value of contracts as of June 30, 2021$(185)
Derivative Activity (Losses)/Gains(In millions)
Fair value of contracts as of December 31, 2016$(73)
Contracts realized or otherwise settled during the period21
Changes in fair value(14)
Fair value of contracts as of September 30, 2017$(66)
Fair value of contracts as of June 30, 2021
Maturity
Fair Value Hierarchy (Losses) Gains1 Year or Less
Greater Than
1 Year to 3 Years
Greater Than
3 Years to 5 Years
Greater Than
5 Years
Total Fair
Value
(In millions)
Level 2$(30)$(33)$(10)$(9)$(82)
Level 3(14)(25)(21)(43)(103)
Total$(44)$(58)$(31)$(52)$(185)
 Fair value of contracts as of September 30, 2017
 Maturity  
Fair Value Hierarchy Losses1 Year or Less Greater Than
1 Year to 3 Years
 Greater Than
3 Years to 5 Years
 Greater Than
5 Years
 Total Fair
Value
 (In millions)
Level 2$23
 $25
 $12
 $6
 $66
The Company has elected to disclose derivative assets and liabilities on a trade-by-trade basis and does not offset amounts at the counterparty master agreement level. NRG, on behalf ofAs discussed below in Quantitative and Qualitative Disclosures about Market Risk - Commodity Price Risk, the Company, measures the sensitivity of the portfolio to potential changes in market prices using VaR, a statistical model which attempts to predict risk of loss based on market price and volatility. NRG'sThe Company's risk management policy places a limit on one-day holding period VaR, which limits the net open position.
57

         ��                                                                                        

Critical Accounting Policies and Estimates
The Company's discussion and analysis of the financial condition and results of operations are based upon the consolidated financial statements, which have been prepared in accordance with GAAP. The preparation of these financial statements and related disclosures in compliance with GAAP requires the application of appropriate technical accounting rules and guidance as well as the use of estimates and judgments that affect the reported amounts of assets, liabilities, revenues and expenses, and related disclosures of contingent assets and liabilities. The application of these policies necessarily involves judgments regarding future events, including the likelihood of success of particular projects, legal and regulatory challenges, and the fair value of certain assets and liabilities. These judgments, in and of themselves, could materially affect the financial statements and disclosures based on varying assumptions, which may be appropriate to use. In addition, the financial and operating environment may also have a significant effect, not only on the operation of the business, but on the results reported through the application of accounting measures used in preparing the financial statements and related disclosures, even if the nature of the accounting policies has not changed.
On an ongoing basis, the Company evaluates these estimates, utilizing historic experience, consultation with experts and other methods the Company considers reasonable. In any event, actualActual results may differ substantially from the Company's estimates. Any effects on the Company's business, financial position or results of operations resulting from revisions to these estimates are recorded in the period in which the information that gives rise to the revision becomes known.
The Company identifies its most critical accounting policies as those that are the most pervasive and important to the portrayal of the Company's financial position and results of operations, and that require the most difficult, subjective and/or complex judgments by management regarding estimates about matters that are inherently uncertain. The Company's critical accounting policies include income taxes and valuation allowance for deferred tax assets, impairment of long lived assets and other intangible assets and acquisition accounting.
The Company tests its long-lived assets for impairment whenever indicators of impairment exist. Certain of the Company’s projects have useful lives that extend well beyond the contract period and therefore, management’s view of long-term merchant power prices in the post-contract periods may have a significant impact on the expected future cash flows for these projects. The Company’s annual budget is utilized to determine the cash flows associated with the Company’s long-lived assets, which


incorporates various assumptions, including the Company’s long-term view of natural gas prices and its impact on merchant power prices and fuel costs. The Company’s annual budget process is finalized and approved by the Board of Directors in the fourth quarter. It is possible that the updated long term cash flows will not support the carrying value of certain assets, and the Company will be required to test such assets for impairment. During the preparation of the budget, the Company noted that management’s view of long term merchant power prices has decreased, and accordingly, it is possible that certain of the Company's long-lived assets will be impaired during the fourth quarter of 2017.assets.
Recent Accounting Developments
See Item 1 1 Note 2, Summary of Significant Accounting Policies, for a discussion of recent accounting developments.

58


ITEM 3 — Quantitative and Qualitative Disclosures About Market Risk
The Company is exposed to several market risks in its normal business activities. Market risk is the potential loss that may result from market changes associated with the Company's power generation or with an existing or forecasted financial or commodity transaction. The types of market risks the Company is exposed to are commodity price risk, interest rate risk, liquidity risk, and credit risk. The following disclosures about market risk provide an update to, and should be read in conjunction with, Item 37A —Quantitative and Qualitative Disclosures About Market Risk, of the Company's 2020 Form 10-K.
Interest Rate Risk
The Company is exposed to fluctuations in interest rates through its issuance of variable rate debt. Exposures to interest rate fluctuations may be mitigated by entering into derivative instruments known as interest rate swaps, caps, collars and put or call options. These contracts reduce exposure to interest rate volatility and result in primarily fixed rate debt obligations when taking into account the combination of the variable rate debt and the interest rate derivative instrument. See Item 1 Note 6, Derivative Instruments and Hedging Activities, for more information.
Most of the Company's project subsidiaries enter into interest rate swaps, intended to hedge the risks associated with interest rates on non-recourse project level debt. See Item 15 — Note 10, Long-term Debt, to the Company's audited consolidated financial statements for the year ended December 31, 2020 included in the 2020 Form 10-K for more information about interest rate swaps of the Company's project subsidiaries.
If all of the interest rate swaps had been discontinued on June 30, 2021, the Company would have owed the counterparties $88 million. Based on the credit ratings of the counterparties, the Company believes its exposure to credit risk due to nonperformance by counterparties to its hedge contracts to be insignificant.
The Company has been omittedlong-term debt instruments that subject it to the risk of loss associated with movements in market interest rates. As of June 30, 2021, a 1% change in interest rates would result in an approximately $2 million change in market interest expense on a rolling twelve-month basis.
As of June 30, 2021, the fair value of the Company's debt was $8,007 million and the carrying value was $8,031 million. The Company estimates that a 1% decrease in market interest rates would have increased the fair value of its long-term debt by approximately $497 million.
Liquidity Risk
Liquidity risk arises from this reportthe general funding needs of the Company's activities and in the management of the Company's assets and liabilities.
Commodity Price Risk
Commodity price risks result from exposures to changes in spot prices, forward prices, volatilities, and correlations between various commodities, such as electricity, natural gas and emissions credits. The Company manages the commodity price risk of its merchant generation operations by entering into derivative or non-derivative instruments to hedge the variability in future cash flows from forecasted power sales or purchases of fuel. The portion of forecasted transactions hedged may vary based upon management's assessment of market, weather, operation and other factors.
Based on a sensitivity analysis using simplified assumptions, the impact of a $0.50 per MMBtu decrease in natural gas prices across the term of the derivative contracts would cause no change to the net value of natural gas derivatives, and an increase of $.50 per MMBtu in natural gas prices across the term of the derivative contracts would cause an increase of approximately $1 million to the net value of natural gas derivatives as of June 30, 2021. The impact of a $0.50 per MWh increase or decrease in power prices across the term of the derivatives contracts would cause a change of approximately $5 million to the net value of power derivatives as of June 30, 2021.
59

Counterparty Credit Risk
Credit risk relates to the risk of loss resulting from non-performance or non-payment by counterparties pursuant to the reduced disclosure format permittedterms of their contractual obligations. The Company monitors and manages credit risk through credit policies that include: (i) an established credit approval process; and (ii) the use of credit mitigation measures such as prepayment arrangements or volumetric limits. Risks surrounding counterparty performance and credit could ultimately impact the amount and timing of expected cash flows. The Company seeks to mitigate counterparty risk by General Instruction H(2)having a diversified portfolio of counterparties. See Item 1- Note 5, Fair Value of Financial Instruments, to Form 10-Q.the consolidated financial statements for more information about concentration of credit risk.

ITEM 4 — Controls and Procedures
Conclusion Regarding the Effectiveness of Disclosure ControlsandProcedures
Under the supervision and with the participation of the Company's management, including its principal executive officer, principal financial officer and principal accounting officer, the Company conducted an evaluation of the effectiveness of the design and operation of its disclosure controls and procedures, as such term is defined in Rules 13a-15(e) or 15d-15(e) of the Exchange Act. Based on this evaluation, the Company's principal executive officer, principal financial officer and principal accounting officer concluded that the disclosure controls and procedures were effective as of the end of the period covered by this Quarterly Report on Form 10-Q.
Changes in Internal Control over Financial Reporting
There were no changes in the Company’s internal control over financial reporting (as such term is defined in Rule 13a-15(f) under the Exchange Act) that occurred induring the third quarter of 2017ended June 30, 2021 that materially affected, or are reasonably likely to materially affect, the Company’s internal control over financial reporting.


60

PART II - OTHER INFORMATION


ITEM 1 — LEGAL PROCEEDINGS
For a discussion of the material legal proceedings in which the Company was involved through SeptemberJune 30, 2017,2021, see Item 1 — Note 11, 10, Contingencies, to this Form 10-Q.

ITEM 1A — RISK FACTORS
Information regarding risk factors appears in Part I, Item 1A, Risk Factors, in the Company's 20162020 Form 10-K and Part II, Item 1A of the Company's Form 10-Q for the quarter ended June 30, 2017.10-K. There have been no material changes in the Company's risk factors since those reported in its 20162020 Form 10-K and its Form 10-Q for the quarter ended June 30, 2017.10-K.

ITEM 2 — UNREGISTERED SALES OF EQUITY SECURITIES AND USE OF PROCEEDS
Item 2 has been omitted from this report for the Registrants pursuant to the reduced disclosure format permitted by General Instruction H(2) to Form 10-Q.None.

ITEM 3 — DEFAULTS UPON SENIOR SECURITIES
Item 3 has been omitted from this report for the Registrants pursuant to the reduced disclosure format permitted by General Instruction H(2) to Form 10-Q.None.

ITEM 4 — MINE SAFETY DISCLOSURES
Not applicable.

ITEM 5 — OTHER INFORMATION
None.

61


ITEM 6 — EXHIBITS
NumberDescriptionMethod of Filing
31.14.1Incorporated herein by reference to Exhibit 4.1 to the Company's Current Report on Form 8-K filed on May 19 2021.
4.2Incorporated herein by reference to Exhibit 4.2 to the Company's Current Report on Form 8-K filed on May 19, 2021.
4.3Incorporated herein by reference to Exhibit 4.3 to the Company's Current Report on Form 8-K filed on May 19, 2021.
10.1Incorporated herein by reference to Exhibit 10.1 to the Company's Current Report on Form 8-K filed on May 4, 2021.
10.2Filed herewith.
22Filed herewith.
31.1Filed herewith.
31.2Filed herewith.
31.3Filed herewith.
32Furnished herewith.
101 INSInline XBRL Instance Document.Filed herewith.
101 SCHInline XBRL Taxonomy Extension Schema.Filed herewith.
101 CALInline XBRL Taxonomy Extension Calculation Linkbase.Filed herewith.
101 DEFInline XBRL Taxonomy Extension Definition Linkbase.Filed herewith.
101 LABInline XBRL Taxonomy Extension Label Linkbase.Filed herewith.
101 PREInline XBRL Taxonomy Extension Presentation Linkbase.Filed herewith.
104Cover Page Interactive Data File (the cover page interactive data file does not appear in Exhibit 104 because its Inline XBRL tags are embedded within the Inline XBRL document).Filed herewith.


62

SIGNATURES
Pursuant to the requirements of Section 13 or 15(d) of the Securities Exchange Act of 1934, the registrant has duly caused this report to be signed on its behalf by the undersigned thereunto duly authorized.

NRG YIELDCLEARWAY ENERGY LLC

(Registrant) 
/s/ CHRISTOPHER S. SOTOS
Christopher S. Sotos
Chief Executive Officer
(Principal Executive Officer)
/s/ CHAD PLOTKIN  
Chad Plotkin
Chief Financial Officer
(Principal Financial Officer)
/s/ DAVID CALLENSARAH RUBENSTEIN
David CallenSarah Rubenstein
Date: November 2, 2017August 3, 2021
ChiefVice President, Accounting Officer& Controller
(Principal Accounting Officer)


61
63