TABLE OF CONTENTS
Index
2
CAUTIONARY STATEMENT REGARDING FORWARD-LOOKING INFORMATION
This Quarterly Report on Form 10-Q of NRG YieldClearway Energy LLC, together with its consolidated subsidiaries, or the Company, includes forward-looking statements within the meaning of Section 27A of the Securities Act of 1933, as amended, or the Securities Act, and Section 21E of the Securities Exchange Act of 1934, as amended, or the Exchange Act. The words "believes," "projects," "anticipates," "plans," "expects," "intends," "estimates"“believes,” “projects,” “anticipates,” “plans,” “expects,” “intends,” “estimates” and similar expressions are intended to identify forward-looking statements. These forward-looking statements involve known and unknown risks, uncertainties and other factors that may cause the Company'sCompany’s actual results, performance and achievements, or industry results, to be materially different from any future results, performance or achievements expressed or implied by such forward-looking statements. These factors, risks and uncertainties include the factors described under Item 1A — Risk Factors in Part I of the Company'sCompany’s Annual Report on Form 10-K for the year ended December 31, 2016, and under Item 1A - Risk Factors in Part II on the Company's Quarterly Report on Form 10-Q for the quarter ended June 30, 2017,2022, as well as the following:
•The Company'sCompany’s ability to maintain and grow its quarterly distributions;
•Potential risks related to the Company as a result of the NRG Transformation Plan;Company's relationships with GIP, TotalEnergies and CEG;
•The Company'sCompany’s ability to successfully identify, evaluate and consummate acquisitions from, and dispositions to, third parties;
•The Company'sCompany’s ability to acquire assets from NRG;CEG;
•The Company'sCompany’s ability to raiseborrow additional funds and access capital due to itsmarkets, as well as the Company’s substantial indebtedness corporate structure, market conditions or otherwise;and the possibility that the Company may incur additional indebtedness going forward;
•Changes in law, including judicial decisions;
•Hazards customary to the power production industry and power generation operations such as fuel and electricity price volatility, unusual weather conditions (including wind and solar conditions), catastrophic weather-related or other damage to facilities, unscheduled generation outages, maintenance or repairs, unanticipated changes to fuel supply costs or availability due to higher demand, shortages, transportation problems or other developments, environmental incidents, or electric transmission or gas pipeline system constraints and the possibility that the Company may not have adequate insurance to cover losses as a result of such hazards;
•The Company'sCompany’s ability to operate its businesses efficiently, manage maintenance capital expenditures and costs effectively, and generate earnings and cash flows from its asset-based businesses in relation to its debt and other obligations;
•The willingness and ability of counterparties to the Company'sCompany’s offtake agreements to fulfill their obligations under such agreements;
•The Company'sCompany’s ability to enter into contracts to sell power and procure fuel on acceptable terms and prices as current offtake agreements expire;
•Government regulation, including compliance with regulatory requirements and changes in market rules, rates, tariffs and environmental laws;
•Operating and financial restrictions placed on the Company that are contained in the project-level debt facilities and other agreements of certain subsidiaries and project-level subsidiaries generally, in the NRG YieldClearway Energy Operating LLC amended and restated revolving credit facility and in the indentures governing the Senior Notes; and
•Cyber terrorism and inadequate cybersecurity, or the occurrence of a catastrophic loss and the possibility that the Company may not have adequate insurance to cover losses resulting from such hazards or the inability of the Company'sCompany’s insurers to provide coverage;
Forward-looking statements speak only as of the date they were made, and the Company undertakes no obligation to publicly update or revise any forward-looking statements, whether as a result of new information, future events or otherwise. The foregoing review of factors that could cause the Company'sCompany’s actual results to differ materially from those contemplated in any forward-looking statements included in this Quarterly Report on Form 10-Q should not be construed as exhaustive.
3
GLOSSARY OF TERMS
When the following terms and abbreviations appear in the text of this report, they have the meanings indicated below:
| 2028 Senior Notes | $850 million aggregate principal amount of 4.75% unsecured senior notes due 2028, issued by Clearway Energy Operating LLC | ||||||||
| 2031 Senior Notes | $925 million aggregate principal amount of 3.75% unsecured senior notes due 2031, issued by Clearway Energy Operating LLC | ||||||||
| 2032 Senior Notes | $350 million aggregate principal amount of 3.75% unsecured senior notes due 2032, issued by Clearway Energy Operating LLC | ||||||||
| Adjusted EBITDA | A non-GAAP measure, represents earnings before interest (including loss on debt extinguishment), tax, depreciation and amortization adjusted for mark-to-market gains or losses, asset write offs and impairments; and factors which the Company does not consider indicative of future operating performance | ||||||||
The FASB Accounting Standards Codification, which the FASB established as the source of authoritative GAAP | |||||||||
| ASU | Accounting Standards Updates - updates to the ASC | ||||||||
| ATM Program | At-The-Market Equity Offering Program | ||||||||
| Senior secured bridge credit agreement entered into by Clearway Energy Operating LLC that provided a term loan facility in an aggregate principal amount of $335 million that was repaid on May 3, 2022 | |||||||||
| Battery energy storage system | |||||||||
| The capability of a generating asset to restore the grid in the event of a blackout without relying on the external electric power transmission network | |||||||||
| CAFD | A non-GAAP measure, Cash Available | ||||||||
| Five wind projects representing 413 MW of capacity, which includes Broken Bow and Crofton Bluffs located in Nebraska, Cedro Hill located in Texas and Mountain Wind Power I and II located in Wyoming | |||||||||
| CEG | Clearway Energy Group LLC (formerly Zephyr Renewables LLC) | ||||||||
| CEG Master Services Agreements | Master Services Agreements entered into as of August 31, 2018 and amended on February 2, 2023 between the Company, Clearway, Inc., Clearway Energy Operating LLC and CEG | ||||||||
| Clearway, Inc. | Clearway Energy, Inc., the holder of the Company’s Class A and Class C units | ||||||||
| Clearway Energy Group LLC | The holder of all of Clearway, Inc.’s Class B and Class D common stock, the Company’s Class B and Class D units and, from time to time, possibly shares of Clearway, Inc.’s Class A and/or Class C common stock | ||||||||
| Clearway Energy Operating LLC | The holder of the project assets that are owned by the Company | ||||||||
| Clearway Renew | Clearway Renew LLC, a subsidiary of CEG | ||||||||
| Company | Clearway Energy LLC, together with its consolidated subsidiaries | ||||||||
| CVSR | California Valley Solar Ranch | ||||||||
| CVSR Holdco LLC, the indirect owner of CVSR | |||||||||
| Distributed Solar | Solar power projects, typically less than 20 MW in size (on an alternating current, or AC, basis), that primarily sell power produced to customers for usage on site, or are interconnected to sell power into the local distribution grid | ||||||||
| Drop Down Assets | Assets under common control acquired by the Company from CEG | ||||||||
| Exchange Act | The Securities Exchange Act of 1934, as amended | ||||||||
| FASB | Financial Accounting Standards Board | ||||||||
| Accounting principles generally accepted in the U.S. | |||||||||
| GenConn | GenConn Energy LLC | ||||||||
4
| Global Infrastructure Partners | ||||||||
| HLBV | Hypothetical Liquidation at Book Value | |||||||
| KKR Thor Bidco, LLC, an affiliate of Kohlberg Kravis Roberts & Co. L.P. | |||||||||
| London Inter-Bank Offered Rate | |||||||||
| Mesquite Star Special LLC | |||||||||
| Mt. Storm | NedPower Mount Storm LLC | ||||||||
| MW | Megawatt | ||||||||
| MWh | Saleable megawatt hours, net of internal/parasitic load megawatt-hours | ||||||||
| MWt | Megawatts Thermal Equivalent | ||||||||
| Net Exposure | Counterparty credit exposure to | ||||||||
| Normal Purchases and Normal Sales | |||||||||
| Other comprehensive income/loss | |||||||||
| O&M | |||||||||
| Pacific Gas and Electric Company | |||||||||
| PPA | Power Purchase Agreement | ||||||||
| Resource adequacy | |||||||||
| Clearway Renewable Operation & Maintenance LLC | |||||||||
| Rosie BESS Devco LLC | |||||||||
| SCE | Southern California Edison | ||||||||
| SEC | U.S. Securities and Exchange Commission | ||||||||
| Senior Notes | Collectively, the | ||||||||
| Secured Overnight Financing Rate | |||||||||
| SPP | Solar Power Partners | ||||||||
| Solar Renewable Energy Credit | |||||||||
| Thermal Business | The | ||||||||
TotalEnergies | TotalEnergies SE | ||||||||
| U.S. | United States of America | ||||||||
| Utah Solar Portfolio | Seven utility-scale solar farms located in Utah, representing 530 MW of capacity | ||||||||
| Utility Scale Solar | Solar power projects, typically 20 MW or greater in size (on an alternating current, or AC, basis), that are interconnected into the transmission or distribution grid to sell power at a wholesale level | ||||||||
| Variable Interest Entity | |||||||||
5
PART I -— FINANCIAL INFORMATION
ITEM 1 — FINANCIAL STATEMENTS
CONSOLIDATED STATEMENTS OF OPERATIONSINCOME
(Unaudited)
| Three months ended September 30, | Nine months ended September 30, | ||||||||||||||
| (In millions) | 2017 | 2016 (a) | 2017 | 2016 (a) | |||||||||||
| Operating Revenues | |||||||||||||||
| Total operating revenues | $ | 265 | $ | 272 | $ | 767 | $ | 789 | |||||||
| Operating Costs and Expenses | |||||||||||||||
| Cost of operations | 78 | 76 | 239 | 238 | |||||||||||
| Depreciation and amortization | 88 | 75 | 241 | 224 | |||||||||||
| General and administrative | 4 | 3 | 14 | 8 | |||||||||||
| Acquisition-related transaction and integration costs | — | — | 2 | — | |||||||||||
| Total operating costs and expenses | 170 | 154 | 496 | 470 | |||||||||||
| Operating Income | 95 | 118 | 271 | 319 | |||||||||||
| Other Income (Expense) | |||||||||||||||
| Equity in earnings of unconsolidated affiliates | 28 | 16 | 63 | 34 | |||||||||||
| Other income, net | 1 | 1 | 3 | 3 | |||||||||||
| Interest expense | (72 | ) | (68 | ) | (227 | ) | (204 | ) | |||||||
| Total other expense, net | (43 | ) | (51 | ) | (161 | ) | (167 | ) | |||||||
| Net Income | 52 | 67 | 110 | 152 | |||||||||||
| Less: Net loss attributable to noncontrolling interests | (23 | ) | (38 | ) | (56 | ) | (67 | ) | |||||||
| Net Income Attributable to NRG Yield LLC | $ | 75 | $ | 105 | $ | 166 | $ | 219 | |||||||
| Three months ended June 30, | Six months ended June 30, | ||||||||||||||||||||||
| (In millions) | 2023 | 2022 | 2023 | 2022 | |||||||||||||||||||
| Operating Revenues | |||||||||||||||||||||||
| Total operating revenues | $ | 406 | $ | 368 | $ | 694 | $ | 582 | |||||||||||||||
| Operating Costs and Expenses | |||||||||||||||||||||||
| Cost of operations, exclusive of depreciation, amortization and accretion shown separately below | 118 | 112 | 226 | 240 | |||||||||||||||||||
| Depreciation, amortization and accretion | 128 | 126 | 256 | 250 | |||||||||||||||||||
| General and administrative | 9 | 9 | 19 | 21 | |||||||||||||||||||
| Transaction and integration costs | 2 | 3 | 2 | 5 | |||||||||||||||||||
| Development costs | — | 1 | — | 2 | |||||||||||||||||||
| Total operating costs and expenses | 257 | 251 | 503 | 518 | |||||||||||||||||||
| Gain on sale of business | — | 1,291 | — | 1,291 | |||||||||||||||||||
| Operating Income | 149 | 1,408 | 191 | 1,355 | |||||||||||||||||||
| Other Income (Expense) | |||||||||||||||||||||||
| Equity in earnings of unconsolidated affiliates | 3 | 10 | — | 14 | |||||||||||||||||||
| Other income, net | 9 | 5 | 17 | 5 | |||||||||||||||||||
| Loss on debt extinguishment | — | — | — | (2) | |||||||||||||||||||
| Interest expense | (55) | (47) | (154) | (94) | |||||||||||||||||||
| Total other expense, net | (43) | (32) | (137) | (77) | |||||||||||||||||||
| Net Income | 106 | 1,376 | 54 | 1,278 | |||||||||||||||||||
| Less: Net loss attributable to noncontrolling interests and redeemable noncontrolling interests | — | (6) | (30) | (46) | |||||||||||||||||||
| Net Income Attributable to Clearway Energy LLC | $ | 106 | $ | 1,382 | $ | 84 | $ | 1,324 | |||||||||||||||
See accompanying notes to consolidated financial statements.
6
CLEARWAY ENERGY LLC
CONSOLIDATED STATEMENTS OF COMPREHENSIVE INCOME
(Unaudited)
| Three months ended September 30, | Nine months ended September 30, | ||||||||||||||
| (In millions) | 2017 | 2016 (a) | 2017 | 2016 (a) | |||||||||||
| Net Income | $ | 52 | $ | 67 | $ | 110 | $ | 152 | |||||||
| Other Comprehensive Gain (Loss) | |||||||||||||||
| Unrealized gain (loss) on derivatives | 7 | 20 | 7 | (49 | ) | ||||||||||
| Other comprehensive gain (loss) | 7 | 20 | 7 | (49 | ) | ||||||||||
| Comprehensive Income | 59 | 87 | 117 | 103 | |||||||||||
| Less: Comprehensive loss attributable to noncontrolling interests | (23 | ) | (30 | ) | (56 | ) | (67 | ) | |||||||
| Comprehensive Income Attributable to NRG Yield LLC | $ | 82 | $ | 117 | $ | 173 | $ | 170 | |||||||
| (In millions) | September 30, 2017 | December 31, 2016 (a) | |||||
| ASSETS | (unaudited) | ||||||
| Current Assets | |||||||
| Cash and cash equivalents | $ | 178 | $ | 321 | |||
| Restricted cash | 140 | 165 | |||||
| Accounts receivable — trade | 126 | 92 | |||||
| Accounts receivable — affiliate | 1 | 1 | |||||
| Inventory | 38 | 39 | |||||
| Derivative instruments | — | 2 | |||||
| Notes receivable | 15 | 16 | |||||
| Prepayments and other current assets | 22 | 20 | |||||
| Total current assets | 520 | 656 | |||||
| Property, plant and equipment, net | 5,247 | 5,460 | |||||
| Other Assets | |||||||
| Equity investments in affiliates | 1,183 | 1,152 | |||||
| Intangible assets, net | 1,234 | 1,286 | |||||
| Derivative instruments | — | 1 | |||||
| Other non-current assets | 56 | 65 | |||||
| Total other assets | 2,473 | 2,504 | |||||
| Total Assets | $ | 8,240 | $ | 8,620 | |||
| LIABILITIES AND MEMBERS' EQUITY | |||||||
| Current Liabilities | |||||||
| Current portion of long-term debt — external | $ | 300 | $ | 291 | |||
| Accounts payable — trade | 27 | 23 | |||||
| Accounts payable — affiliate | 45 | 40 | |||||
| Derivative instruments | 23 | 32 | |||||
| Accrued expenses and other current liabilities | 94 | 85 | |||||
| Total current liabilities | 489 | 471 | |||||
| Other Liabilities | |||||||
| Long-term debt — external | 4,914 | 5,098 | |||||
| Long-term debt — affiliate | 618 | 618 | |||||
| Accounts payable — affiliate | 3 | 9 | |||||
| Derivative instruments | 43 | 44 | |||||
| Other non-current liabilities | 87 | 76 | |||||
| Total non-current liabilities | 5,665 | 5,845 | |||||
| Total Liabilities | 6,154 | 6,316 | |||||
| Commitments and Contingencies | |||||||
| Members' Equity | |||||||
| Contributed capital | 1,897 | 2,127 | |||||
| Retained earnings | 86 | 36 | |||||
| Accumulated other comprehensive loss | (78 | ) | (85 | ) | |||
| Noncontrolling interest | 181 | 226 | |||||
| Total Members' Equity | 2,086 | 2,304 | |||||
| Total Liabilities and Members’ Equity | $ | 8,240 | $ | 8,620 | |||
| Three months ended June 30, | Six months ended June 30, | ||||||||||||||||||||||
| (In millions) | 2023 | 2022 | 2023 | 2022 | |||||||||||||||||||
| Net Income | $ | 106 | $ | 1,376 | $ | 54 | $ | 1,278 | |||||||||||||||
| Other Comprehensive Income | |||||||||||||||||||||||
| Unrealized gain on derivatives and changes in accumulated OCI/OCL | 4 | 7 | — | 23 | |||||||||||||||||||
| Other comprehensive income | 4 | 7 | — | 23 | |||||||||||||||||||
| Comprehensive Income | 110 | 1,383 | 54 | 1,301 | |||||||||||||||||||
| Less: Comprehensive income (loss) attributable to noncontrolling interests and redeemable noncontrolling interests | 1 | (5) | (30) | (42) | |||||||||||||||||||
| Comprehensive Income Attributable to Clearway Energy LLC | $ | 109 | $ | 1,388 | $ | 84 | $ | 1,343 | |||||||||||||||
See accompanying notes to consolidated financial statements.
CLEARWAY ENERGY LLC
CONSOLIDATED BALANCE SHEETS
| (In millions) | June 30, 2023 | December 31, 2022 | |||||||||
| ASSETS | (Unaudited) | ||||||||||
| Current Assets | |||||||||||
| Cash and cash equivalents | $ | 547 | $ | 657 | |||||||
| Restricted cash | 371 | 339 | |||||||||
| Accounts receivable — trade | 215 | 153 | |||||||||
| Accounts receivable — affiliates | 1 | — | |||||||||
| Inventory | 51 | 47 | |||||||||
| Derivative instruments | 34 | 26 | |||||||||
| Prepayments and other current assets | 64 | 54 | |||||||||
| Total current assets | 1,283 | 1,276 | |||||||||
| Property, plant and equipment, net | 7,748 | 7,421 | |||||||||
| Other Assets | |||||||||||
| Equity investments in affiliates | 352 | 364 | |||||||||
| Intangible assets for power purchase agreements, net | 2,397 | 2,488 | |||||||||
| Other intangible assets, net | 74 | 77 | |||||||||
| Derivative instruments | 83 | 63 | |||||||||
| Right-of-use assets, net | 550 | 527 | |||||||||
| Other non-current assets | 131 | 96 | |||||||||
| Total other assets | 3,587 | 3,615 | |||||||||
| Total Assets | $ | 12,618 | $ | 12,312 | |||||||
| LIABILITIES AND MEMBERS’ EQUITY | |||||||||||
| Current Liabilities | |||||||||||
| Current portion of long-term debt — external | $ | 330 | $ | 322 | |||||||
| Current portion of long-term debt — affiliate | 2 | 2 | |||||||||
| Accounts payable — trade | 63 | 55 | |||||||||
| Accounts payable — affiliates | 62 | 24 | |||||||||
| Derivative instruments | 44 | 50 | |||||||||
| Accrued interest expense | 54 | 54 | |||||||||
| Accrued expenses and other current liabilities | 54 | 95 | |||||||||
| Total current liabilities | 609 | 602 | |||||||||
| Other Liabilities | |||||||||||
| Long-term debt — external | 6,708 | 6,491 | |||||||||
| Deferred income taxes | 4 | 4 | |||||||||
| Derivative instruments | 259 | 303 | |||||||||
| Long-term lease liabilities | 578 | 548 | |||||||||
| Other non-current liabilities | 208 | 197 | |||||||||
| Total other liabilities | 7,757 | 7,543 | |||||||||
| Total Liabilities | 8,366 | 8,145 | |||||||||
| Redeemable noncontrolling interest in subsidiaries | 15 | 7 | |||||||||
| Commitments and Contingencies | |||||||||||
| Members’ Equity | |||||||||||
| Contributed capital | 1,275 | 1,308 | |||||||||
| Retained earnings | 1,126 | 1,240 | |||||||||
| Accumulated other comprehensive income | 21 | 21 | |||||||||
| Noncontrolling interest | 1,815 | 1,591 | |||||||||
| Total Members’ Equity | 4,237 | 4,160 | |||||||||
| Total Liabilities and Members’ Equity | $ | 12,618 | $ | 12,312 | |||||||
See accompanying notes to consolidated financial statements.
8
CLEARWAY ENERGY LLC
CONSOLIDATED STATEMENTS OF CASH FLOWS
(Unaudited)
| Nine months ended September 30, | |||||||
| 2017 | 2016(a) | ||||||
| (In millions) | |||||||
| Cash Flows from Operating Activities | |||||||
| Net income | $ | 110 | $ | 152 | |||
| Adjustments to reconcile net income to net cash provided by operating activities: | |||||||
| Equity in earnings of unconsolidated affiliates | (63 | ) | (34 | ) | |||
| Distributions from unconsolidated affiliates | 52 | 43 | |||||
| Depreciation and amortization | 241 | 224 | |||||
| Amortization of financing costs | 7 | 6 | |||||
| Amortization of intangibles and out-of-market contracts | 52 | 57 | |||||
| Changes in derivative instruments | (2 | ) | (5 | ) | |||
| Loss on disposal of asset components | 8 | 5 | |||||
| Changes in prepaid and accrued liabilities for tolling agreements | 5 | 2 | |||||
| Changes in other working capital | (35 | ) | (6 | ) | |||
| Net Cash Provided by Operating Activities | 375 | 444 | |||||
| Cash Flows from Investing Activities | |||||||
| Payments for the Drop Down Assets | (176 | ) | (77 | ) | |||
| Capital expenditures | (23 | ) | (16 | ) | |||
| Cash receipts from notes receivable | 11 | 11 | |||||
| Return of investment from unconsolidated affiliates | 32 | 16 | |||||
| Investments in unconsolidated affiliates | (48 | ) | (69 | ) | |||
| Net Cash Used in Investing Activities | (204 | ) | (135 | ) | |||
| Cash Flows from Financing Activities | |||||||
| Net contributions from noncontrolling interests | 13 | 7 | |||||
| Net distributions and return of capital to NRG prior to the acquisition of Drop Down Assets | (49 | ) | (126 | ) | |||
| Proceeds from the issuance of Class C units | 33 | — | |||||
| Payments of distributions | (149 | ) | (127 | ) | |||
| Payments of debt issuance costs | (4 | ) | (6 | ) | |||
| Proceeds from the revolving credit facility | — | 60 | |||||
| Payments for the revolving credit facility | — | (366 | ) | ||||
| Proceeds from the issuance of long-term debt — external | 41 | 550 | |||||
| Payments for long-term debt | (224 | ) | (204 | ) | |||
| Net Cash Used in Financing Activities | (339 | ) | (212 | ) | |||
| Net Decrease in Cash, Cash Equivalents and Restricted Cash | (168 | ) | 97 | ||||
| Cash, Cash Equivalents and Restricted Cash at Beginning of Period | 486 | 241 | |||||
| Cash, Cash Equivalents and Restricted Cash at End of Period | $ | 318 | $ | 338 | |||
| Six months ended June 30, | |||||||||||
| (In millions) | 2023 | 2022 | |||||||||
| Cash Flows from Operating Activities | |||||||||||
| Net Income | $ | 54 | $ | 1,278 | |||||||
| Adjustments to reconcile net income to net cash provided by operating activities: | |||||||||||
| Equity in earnings of unconsolidated affiliates | — | (14) | |||||||||
| Distributions from unconsolidated affiliates | 11 | 17 | |||||||||
| Depreciation, amortization and accretion | 256 | 250 | |||||||||
| Amortization of financing costs and debt discounts | 6 | 7 | |||||||||
| Amortization of intangibles | 94 | 82 | |||||||||
| Loss on debt extinguishment | — | 2 | |||||||||
| Gain on sale of business | — | (1,291) | |||||||||
| Reduction in carrying amount of right-of-use assets | 8 | 7 | |||||||||
| Changes in derivative instruments and amortization of accumulated OCI/OCL | (51) | 92 | |||||||||
| Cash used in changes in other working capital: | |||||||||||
| Changes in prepaid and accrued liabilities for tolling agreements | (56) | (74) | |||||||||
| Changes in other working capital | (87) | (76) | |||||||||
| Net Cash Provided by Operating Activities | 235 | 280 | |||||||||
| Cash Flows from Investing Activities | |||||||||||
| Acquisition of Drop Down Assets, net of cash acquired | (7) | (51) | |||||||||
| Capital expenditures | (109) | (81) | |||||||||
| Return of investment from unconsolidated affiliates | 10 | 6 | |||||||||
| Investments in unconsolidated affiliates | (10) | — | |||||||||
| Proceeds from sale of business | — | 1,457 | |||||||||
| Net Cash (Used in) Provided by Investing Activities | (116) | 1,331 | |||||||||
| Cash Flows from Financing Activities | |||||||||||
| Contributions from noncontrolling interests, net of distributions | 209 | 16 | |||||||||
| Contributions from (distributions to) CEG, net | 66 | (23) | |||||||||
| Payments of distributions | (153) | (141) | |||||||||
| Tax-related distributions | (45) | — | |||||||||
| Distributions to CEG of escrowed amounts | — | (64) | |||||||||
| Proceeds from the revolving credit facility | — | 80 | |||||||||
| Payments for the revolving credit facility | — | (325) | |||||||||
| Proceeds from the issuance of long-term debt — external | 42 | 214 | |||||||||
| Payments of debt issuance costs | (8) | (4) | |||||||||
| Payments for long-term debt — external | (306) | (722) | |||||||||
| Payments for long-term debt — affiliate | — | (1) | |||||||||
| Other | (2) | (7) | |||||||||
| Net Cash Used in Financing Activities | (197) | (977) | |||||||||
| Net (Decrease) Increase in Cash, Cash Equivalents and Restricted Cash | (78) | 634 | |||||||||
| Cash, Cash Equivalents and Restricted Cash at Beginning of Period | 996 | 654 | |||||||||
| Cash, Cash Equivalents and Restricted Cash at End of Period | $ | 918 | $ | 1,288 | |||||||
See accompanying notes to consolidated financial statements.
9
CLEARWAY ENERGY LLC
CONSOLIDATED STATEMENTS OF MEMBERS’ EQUITY
For the Six Months Ended June 30, 2023
(Unaudited)
| (In millions) | Contributed Capital | Retained Earnings | Accumulated Other Comprehensive Income | Noncontrolling Interest | Total Members’ Equity | ||||||||||||||||||||||||
| Balances at December 31, 2022 | $ | 1,308 | $ | 1,240 | $ | 21 | $ | 1,591 | $ | 4,160 | |||||||||||||||||||
| Net loss | — | (22) | — | (33) | (55) | ||||||||||||||||||||||||
| Unrealized loss on derivatives and changes in accumulated OCI | — | — | (3) | (1) | (4) | ||||||||||||||||||||||||
| Contributions from CEG, net of distributions, cash | 30 | — | — | 30 | |||||||||||||||||||||||||
| Contributions from noncontrolling interests, net of distributions, cash | — | — | — | 215 | 215 | ||||||||||||||||||||||||
| Transfers of assets under common control | (59) | — | — | 53 | (6) | ||||||||||||||||||||||||
| Distributions paid to Clearway, Inc. | — | (44) | — | — | (44) | ||||||||||||||||||||||||
| Distributions paid to CEG Class B and Class D unit holders | — | (32) | — | — | (32) | ||||||||||||||||||||||||
| Balances at March 31, 2023 | 1,279 | 1,142 | 18 | 1,825 | 4,264 | ||||||||||||||||||||||||
| Net income (loss) | — | 106 | — | (6) | 100 | ||||||||||||||||||||||||
| Unrealized gain on derivatives | — | — | 3 | 1 | 4 | ||||||||||||||||||||||||
| Distributions to CEG, cash | (4) | — | — | — | (4) | ||||||||||||||||||||||||
| Distributions to noncontrolling interests, net of contributions, cash | — | — | — | (5) | (5) | ||||||||||||||||||||||||
| Tax-related distributions | — | (45) | — | — | (45) | ||||||||||||||||||||||||
| Distributions paid to Clearway, Inc. | — | (45) | — | — | (45) | ||||||||||||||||||||||||
| Distributions paid to CEG Class B and Class D unit holders | — | (32) | — | — | (32) | ||||||||||||||||||||||||
| Balances at June 30, 2023 | $ | 1,275 | $ | 1,126 | $ | 21 | $ | 1,815 | $ | 4,237 | |||||||||||||||||||
See accompanying notes to consolidated financial statements.
10
CLEARWAY ENERGY LLC
CONSOLIDATED STATEMENTS OF MEMBERS' EQUITY
For the Six Months Ended June 30, 2022
(Unaudited)
| (In millions) | Contributed Capital | Retained Earnings (Accumulated Deficit) | Accumulated Other Comprehensive(Loss) Income | Noncontrolling Interest | Total Members’ Equity | ||||||||||||||||||||||||
| Balances at December 31, 2021 | $ | 1,495 | $ | 43 | $ | (13) | $ | 1,692 | $ | 3,217 | |||||||||||||||||||
| Net loss | — | (58) | — | (42) | (100) | ||||||||||||||||||||||||
| Unrealized gain on derivatives | — | — | 13 | 3 | 16 | ||||||||||||||||||||||||
| Distributions to CEG, net of contributions, cash | (3) | — | — | — | (3) | ||||||||||||||||||||||||
| Contributions from noncontrolling interests, net of distributions, cash | — | — | — | 28 | 28 | ||||||||||||||||||||||||
| Transfers of assets under common control | (46) | — | — | 9 | (37) | ||||||||||||||||||||||||
| Distributions paid to Clearway, Inc. | (40) | — | — | — | (40) | ||||||||||||||||||||||||
| Distributions paid to CEG Class B and Class D unit holders | (5) | (25) | — | — | (30) | ||||||||||||||||||||||||
| Balances at March 31, 2022 | 1,401 | (40) | — | 1,690 | 3,051 | ||||||||||||||||||||||||
| Net income (loss) | — | 1,382 | — | (10) | 1,372 | ||||||||||||||||||||||||
| Unrealized gain on derivatives | — | — | 6 | 1 | 7 | ||||||||||||||||||||||||
| Contributions from (distributions to) CEG, cash | 11 | — | — | (31) | (20) | ||||||||||||||||||||||||
| Distributions to noncontrolling interests, net of contributions, cash | — | — | — | (10) | (10) | ||||||||||||||||||||||||
| Distributions paid to Clearway, Inc. | (41) | — | — | — | (41) | ||||||||||||||||||||||||
| Distributions paid to CEG Class B and Class D unit holders | (30) | — | — | — | (30) | ||||||||||||||||||||||||
| Balances at June 30, 2022 | $ | 1,341 | $ | 1,342 | $ | 6 | $ | 1,640 | $ | 4,329 | |||||||||||||||||||
See accompanying notes to consolidated financial statements.
11
CLEARWAY ENERGY LLC
NOTES TO CONSOLIDATED FINANCIAL STATEMENTS
(Unaudited)
Note 1 — Nature of Business
assets across North America. The Company ownsis sponsored by GIP and TotalEnergies through the portfolio company, Clearway Energy Group LLC, or CEG, which is equally owned by GIP and TotalEnergies. GIP is an independent infrastructure fund manager that makes equity and debt investments in infrastructure assets and businesses. TotalEnergies is a diversified portfolioglobal multi-energy company.
The Company is one of contractedthe largest renewable and conventional generation and thermal infrastructure assetsenergy owners in the U.S. with over 5,500 net MW of installed wind and solar generation projects. The Company’s contracted generation portfolio collectively represents 5,080over 8,000 net MW as of September 30, 2017. Eachassets also includes approximately 2,500 net MW of these assets sells substantially all ofenvironmentally-sound, highly efficient natural gas-fired generation facilities. Through this environmentally-sound, diversified and primarily contracted portfolio, the Company endeavors to increase distributions to its output pursuant to long-term offtake agreements with creditworthy counterparties.unit holders. The weighted average remaining contract duration of these offtake agreements was approximately 16 years as of September 30, 2017 based on CAFD. The Company also owns thermal infrastructure assets with an aggregate steam and chilled water capacity of 1,319 net MWt and electric generation capacity of 123 net MW. These thermal infrastructure assets provide steam, hot and/or chilled water, and, in some instances, electricity to commercial businesses, universities, hospitals and governmental units in multiple locations, principally through long-term contracts or pursuant to rates regulated by state utility commissions.
| Projects | Percentage Ownership | Net Capacity (MW)(a) | Offtake Counterparty | Expiration | ||||||
| Conventional | ||||||||||
| El Segundo | 100 | % | 550 | Southern California Edison | 2023 | |||||
| GenConn Devon | 50 | % | 95 | Connecticut Light & Power | 2040 | |||||
| GenConn Middletown | 50 | % | 95 | Connecticut Light & Power | 2041 | |||||
| Marsh Landing | 100 | % | 720 | Pacific Gas and Electric | 2023 | |||||
| Walnut Creek | 100 | % | 485 | Southern California Edison | 2023 | |||||
| 1,945 | ||||||||||
| Utility Scale Solar | ||||||||||
| Agua Caliente | 16 | % | 46 | Pacific Gas and Electric | 2039 | |||||
| Alpine | 100 | % | 66 | Pacific Gas and Electric | 2033 | |||||
| Avenal | 50 | % | 23 | Pacific Gas and Electric | 2031 | |||||
| Avra Valley | 100 | % | 26 | Tucson Electric Power | 2032 | |||||
| Blythe | 100 | % | 21 | Southern California Edison | 2029 | |||||
| Borrego | 100 | % | 26 | San Diego Gas and Electric | 2038 | |||||
| CVSR | 100 | % | 250 | Pacific Gas and Electric | 2038 | |||||
| Desert Sunlight 250 | 25 | % | 63 | Southern California Edison | 2035 | |||||
| Desert Sunlight 300 | 25 | % | 75 | Pacific Gas and Electric | 2040 | |||||
| Kansas South | 100 | % | 20 | Pacific Gas and Electric | 2033 | |||||
| Roadrunner | 100 | % | 20 | El Paso Electric | 2031 | |||||
| TA High Desert | 100 | % | 20 | Southern California Edison | 2033 | |||||
Utah Solar Portfolio (b) (e) | 50 | % | 265 | PacifiCorp | 2036 | |||||
| 921 | ||||||||||
| Distributed Solar | ||||||||||
| Apple I LLC Projects | 100 | % | 9 | Various | 2032 | |||||
| AZ DG Solar Projects | 100 | % | 5 | Various | 2025 - 2033 | |||||
| 14 | ||||||||||
| Wind | ||||||||||
| Alta I | 100 | % | 150 | Southern California Edison | 2035 | |||||
| Alta II | 100 | % | 150 | Southern California Edison | 2035 | |||||
| Alta III | 100 | % | 150 | Southern California Edison | 2035 | |||||
| Alta IV | 100 | % | 102 | Southern California Edison | 2035 | |||||
| Alta V | 100 | % | 168 | Southern California Edison | 2035 | |||||
Alta X (b) | 100 | % | 137 | Southern California Edison | 2038 | |||||
Alta XI (b) | 100 | % | 90 | Southern California Edison | 2038 | |||||
| Buffalo Bear | 100 | % | 19 | Western Farmers Electric Co-operative | 2033 | |||||
Crosswinds (b) (f) | 99 | % | 21 | Corn Belt Power Cooperative | 2027 | |||||
Elbow Creek (b) (f) | 100 | % | 122 | NRG Power Marketing LLC | 2022 | |||||
Elkhorn Ridge (b) (f) | 66.7 | % | 54 | Nebraska Public Power District | 2029 | |||||
Forward (b) (f) | 100 | % | 29 | Constellation NewEnergy, Inc. | 2017 | |||||
Goat Wind (b) (f) | 100 | % | 150 | Dow Pipeline Company | 2025 | |||||
Hardin (b) (f) | 99 | % | 15 | Interstate Power and Light Company | 2027 | |||||
| Laredo Ridge | 100 | % | 80 | Nebraska Public Power District | 2031 | |||||
Lookout (b) (f) | 100 | % | 38 | Southern Maryland Electric Cooperative | 2030 | |||||
| Projects | Percentage Ownership | Net Capacity (MW)(a) | Offtake Counterparty | Expiration | ||||||
Odin (b) (f) | 99.9 | % | 20 | Missouri River Energy Services | 2028 | |||||
| Pinnacle | 100 | % | 55 | Maryland Department of General Services and University System of Maryland | 2031 | |||||
San Juan Mesa (b) (f) | 75 | % | 90 | Southwestern Public Service Company | 2025 | |||||
Sleeping Bear (b) (f) | 100 | % | 95 | Public Service Company of Oklahoma | 2032 | |||||
| South Trent | 100 | % | 101 | AEP Energy Partners | 2029 | |||||
Spanish Fork (b) (f) | 100 | % | 19 | PacifiCorp | 2028 | |||||
Spring Canyon II (b) | 90.1 | % | 29 | Platte River Power Authority | 2039 | |||||
Spring Canyon III (b) | 90.1 | % | 25 | Platte River Power Authority | 2039 | |||||
| Taloga | 100 | % | 130 | Oklahoma Gas & Electric | 2031 | |||||
Wildorado (b) (f) | 100 | % | 161 | Southwestern Public Service Company | 2027 | |||||
| 2,200 | ||||||||||
| Thermal | ||||||||||
| NRG Dover Energy Center LLC | 100 | % | 103 | NRG Power Marketing LLC | 2018 | |||||
| Thermal generation | 100 | % | 20 | Various | Various | |||||
| 123 | ||||||||||
Total net generation capacity(c) | 5,203 | |||||||||
Thermal equivalent MWt (d) | 100 | % | 1,319 | Various | Various | |||||
Clearway Energy, Inc., or Clearway, Inc., consolidates the results of district energy systems and combined heat and power plants that produce steam, hot water and/or chilled water and, in some instances, electricity at a central plant. Certain district energy systems are subject to rate regulation by state public utility commissions (although they may negotiate certain rates) while the other district energy systems have rates determined by negotiated bilateral contracts.
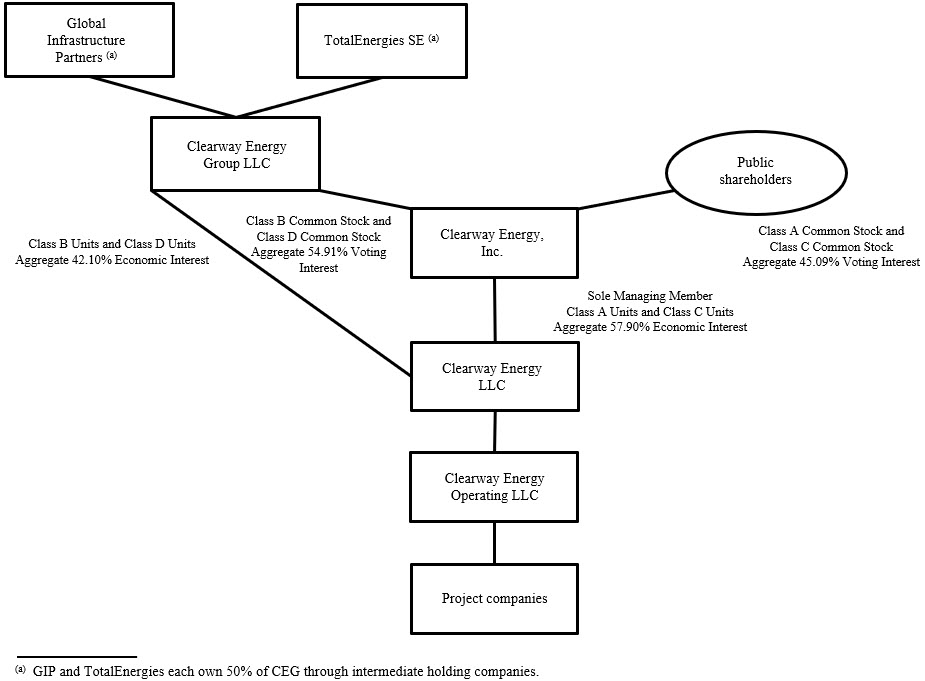
As of June 30, 2023, Clearway, Inc. owned 57.90% of the economic interests of the Company, with CEG owning 42.10% of the economic interests of the Company.
12
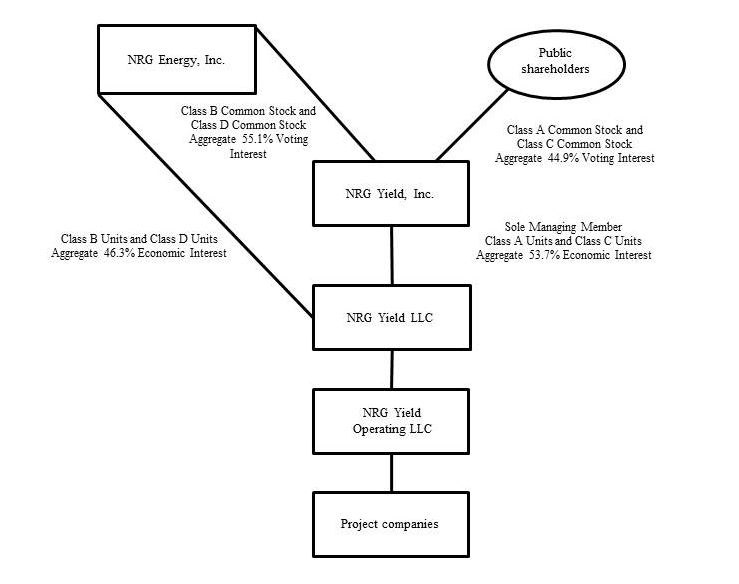
The following table represents a summarized structure of the Company as of SeptemberJune 30, 2017. On March 27, 2017, the Company acquired the following interests from NRG, referred to as the March 2017 Drop Down Assets: (i) Agua Caliente Borrower 2 LLC, which owns a 16% interest in the Agua Caliente solar farm, one2023:
Basis of the ROFO assets and (ii) NRG's interests in seven utility-scale solar farms located in Utah that were part of NRG's November 2, 2016 acquisition of projects from SunEdison, or the Utah Solar Portfolio. The Company paid total cash consideration of $130 million, plus a $2 million working capital adjustment, and assumed non-recourse debt of $328 million, which is consolidated, as well as its pro-rata share of non-recourse project-level debt of $135 million. The acquisition was funded with cash on hand.
The accompanying unaudited interim consolidated financial statements have been prepared in accordance with the SEC’s regulations for interim financial information and with the instructions to Form 10-Q. Accordingly, they do not include all of the information and notes required by GAAP for complete financial statements. The following notes should be read in conjunction with the accounting policies and other disclosures as set forth in the notes to the consolidated financial statements for the year ended December 31, 2016 included in the Company's May 9, 2017Company’s 2022 Form 8-K.10-K. Interim results are not necessarily indicative of results for a full year.
In the opinion of management, the accompanying unaudited interim consolidated financial statements contain all material adjustments consisting of normal and recurring accruals necessary to present fairly the Company'sCompany’s consolidated financial position as of SeptemberJune 30, 2017,2023, and the results of operations, comprehensive income (loss) and cash flows for the three and ninesix months ended SeptemberJune 30, 20172023 and 2016.2022.
Note 2 — Summary of Significant Accounting Policies
Use of Estimates
The preparation of consolidated financial statements in accordance with GAAP requires management to make estimates and assumptions. These estimates and assumptions impact the reported amounts of assets and liabilities and disclosures of contingent assets and liabilities as of the date of the consolidated financial statements, andstatements. They also impact the reported amounts of revenues and expensesnet earnings during the reporting period.periods. Actual results could be different from these estimates.
13
Cash, Cash Equivalents and Restricted Cash
Cash and cash equivalents include highly liquid investments with an original maturity of three months or less at the time of purchase. Cash and cash equivalents held at project subsidiaries was $134 million and $121 million as of June 30, 2023 and December 31, 2022, respectively.
The following table provides a reconciliation of cash, cash equivalents and restricted cash reported within the consolidated balance sheets that sum to the total of the same such amounts shown in the consolidated statements of cash flows:
| June 30, 2023 | December 31, 2022 | ||||||||||
| (In millions) | |||||||||||
| Cash and cash equivalents | $ | 547 | $ | 657 | |||||||
| Restricted cash | 371 | 339 | |||||||||
| Cash, cash equivalents and restricted cash shown in the consolidated statements of cash flows | $ | 918 | $ | 996 | |||||||
Restricted cash consists primarily of funds held to satisfy the requirements of certain debt agreements and funds held within the Company’s projects that are restricted in their use. As of June 30, 2023, these restricted funds were comprised of $104 million designated to fund operating expenses, $168 million designated for current debt service payments and $85 million restricted for reserves including debt service, performance obligations and other reserves as well as capital expenditures. The remaining $14 million is held in distributions reserve accounts.
Accumulated Depreciation and Accumulated Amortization
The following table presents the accumulated depreciation included in the property, plant and equipment, net, and accumulated amortization included in intangible assets, net, respectively, as of September 30, 2017 and December 31, 2016:net:
| September 30, 2017 | December 31, 2016 | ||||||
| (In millions) | |||||||
| Property, Plant and Equipment Accumulated Depreciation | $ | 1,189 | $ | 951 | |||
| Intangible Assets Accumulated Amortization | 216 | 163 | |||||
| (In millions) | |||
| Balance as of December 31, 2016 as reported | $ | 313 | |
| Less: Adjustment for August 2017 Drop Down Assets | (87 | ) | |
| Balance as of December 31, 2016 as recast | 226 | ||
| Capital contributions from tax equity investors, net of distributions | 11 | ||
| Comprehensive loss | (56 | ) | |
| Balance as of September 30, 2017 | $ | 181 | |
| June 30, 2023 | December 31, 2022 | ||||||||||
| (In millions) | |||||||||||
| Property, Plant and Equipment Accumulated Depreciation | $ | 3,232 | $ | 3,024 | |||||||
| Intangible Assets Accumulated Amortization | 972 | 877 | |||||||||
Distributions
The following table lists the distributions paid on NRG Yield LLC'sthe Company's Class A, B, C and D units during the ninesix months ended SeptemberJune 30, 2017:2023:
| Third Quarter 2017 | Second Quarter 2017 | First Quarter 2017 | |||||||||
| Distributions per Class A, B, C and D unit | $ | 0.28 | $ | 0.27 | $ | 0.26 | |||||
| Second Quarter 2023 | First Quarter 2023 | |||||||||||||||||||||||||
| Distributions per Class A, B, C and D unit | $ | 0.3818 | $ | 0.3745 | ||||||||||||||||||||||
On October 31, 2017,August 7, 2023, the Company declared a distribution on its Class A, Class B, Class C and Class D units of $0.288$0.3891 per unit payable on DecemberSeptember 15, 20172023 to unit holders of record as of DecemberSeptember 1, 2017.2023.
Redeemable Noncontrolling Interests
To the extent that a third party has the right to redeem their interests for cash or other assets, the Company has included the noncontrolling interest attributable to the third party as a component of temporary equity distribution agreement, NRG Yield, Inc. may offer and sell shares of its Class C common stock par value $0.01 per share, from time to time throughin the sales agents up to an aggregate sales price of $150 million through an at-the-market equity offering program, or the ATM Program. NRG Yield, Inc. may also sell shares of its Class C common stock to anymezzanine section of the sales agents, as principalsconsolidated balance sheet. The following table reflects the changes in the Company’s redeemable noncontrolling interest balance:
| (In millions) | ||||||||
| Balance at December 31, 2022 | $ | 7 | ||||||
| Cash distributions to redeemable noncontrolling interests | (1) | |||||||
| Comprehensive income attributable to redeemable noncontrolling interests | 9 | |||||||
| Balance at June 30, 2023 | $ | 15 | ||||||
14
Revenue Recognition
Disaggregated Revenues
The following tables represent the Company’s disaggregation of revenue from contracts with customers along with the reportable segment for its own account, ateach category:
| Three months ended June 30, 2023 | |||||||||||||||||||||||||||||
| (In millions) | Conventional Generation | Renewables | Total | ||||||||||||||||||||||||||
Energy revenue (a) | $ | 3 | $ | 275 | $ | 278 | |||||||||||||||||||||||
Capacity revenue (a) | 96 | 5 | 101 | ||||||||||||||||||||||||||
Other revenue (a) | 21 | 27 | 48 | ||||||||||||||||||||||||||
| Contract amortization | (5) | (42) | (47) | ||||||||||||||||||||||||||
| Mark-to-market for economic hedges | — | 26 | 26 | ||||||||||||||||||||||||||
| Total operating revenues | 115 | 291 | 406 | ||||||||||||||||||||||||||
| Less: Mark-to-market for economic hedges | — | (26) | (26) | ||||||||||||||||||||||||||
| Less: Lease revenue | (104) | (237) | (341) | ||||||||||||||||||||||||||
| Less: Contract amortization | 5 | 42 | 47 | ||||||||||||||||||||||||||
| Total revenue from contracts with customers | $ | 16 | $ | 70 | $ | 86 | |||||||||||||||||||||||
(a) The following amounts of energy, capacity and other revenue relate to leases and are accounted for under ASC 842:
| (In millions) | Conventional Generation | Renewables | Total | ||||||||||||||
| Energy revenue | $ | 1 | $ | 233 | $ | 234 | |||||||||||
| Capacity revenue | 82 | 4 | 86 | ||||||||||||||
Other revenue (b) | 21 | — | 21 | ||||||||||||||
| Total | $ | 104 | $ | 237 | $ | 341 | |||||||||||
(b) On May 31, 2023, the Marsh Landing Black Start addition reached commercial operations and the Company will receive an annual fixed fee over a price agreed upon at the time of sale. During the first nine months of 2017, Yield, Inc. issued 1,921,866 shares of Class C common stockfive-year term under the ATM Programrelated agreement. The agreement was determined to be a sales-type lease resulting in the Company recording a lease receivable of $21 million included in total operating revenues, offset by net investment costs of $13 million included in cost of operations, resulting in a net pre-tax profit of $8 million.
15
| Three months ended June 30, 2022 | |||||||||||||||||||||||||||||||||||
| (In millions) | Conventional Generation | Renewables | Thermal | Total | |||||||||||||||||||||||||||||||
Energy revenue (a) | $ | 3 | $ | 306 | $ | 11 | $ | 320 | |||||||||||||||||||||||||||
Capacity revenue (a) | 106 | 1 | 4 | 111 | |||||||||||||||||||||||||||||||
| Other revenue | — | 27 | 3 | 30 | |||||||||||||||||||||||||||||||
| Contract amortization | (6) | (35) | — | (41) | |||||||||||||||||||||||||||||||
| Mark-to-market for economic hedges | — | (52) | — | (52) | |||||||||||||||||||||||||||||||
| Total operating revenues | 103 | 247 | 18 | 368 | |||||||||||||||||||||||||||||||
| Less: Mark-to-market for economic hedges | — | 52 | — | 52 | |||||||||||||||||||||||||||||||
| Less: Lease revenue | (109) | (268) | — | (377) | |||||||||||||||||||||||||||||||
| Less: Contract amortization | 6 | 35 | — | 41 | |||||||||||||||||||||||||||||||
| Total revenue from contracts with customers | $ | — | $ | 66 | $ | 18 | $ | 84 | |||||||||||||||||||||||||||
(a) The following amounts of energy and capacity revenue relate to leases and are accounted for gross proceedsunder ASC 842:
| (In millions) | Conventional Generation | Renewables | Total | ||||||||||||||||||||
| Energy revenue | $ | 3 | $ | 268 | $ | 271 | |||||||||||||||||
| Capacity revenue | 106 | — | 106 | ||||||||||||||||||||
| Total | $ | 109 | $ | 268 | $ | 377 | |||||||||||||||||
| Six months ended June 30, 2023 | |||||||||||||||||||||||||||||
| (In millions) | Conventional Generation | Renewables | Total | ||||||||||||||||||||||||||
Energy revenue (a) | $ | 4 | $ | 473 | $ | 477 | |||||||||||||||||||||||
Capacity revenue (a) | 196 | 10 | 206 | ||||||||||||||||||||||||||
Other revenue (a) | 21 | 39 | 60 | ||||||||||||||||||||||||||
| Contract amortization | (11) | (83) | (94) | ||||||||||||||||||||||||||
| Mark-to-market for economic hedges | — | 45 | 45 | ||||||||||||||||||||||||||
| Total operating revenues | 210 | 484 | 694 | ||||||||||||||||||||||||||
| Less: Mark-to-market for economic hedges | — | (45) | (45) | ||||||||||||||||||||||||||
| Less: Lease revenue | (205) | (393) | (598) | ||||||||||||||||||||||||||
| Less: Contract amortization | 11 | 83 | 94 | ||||||||||||||||||||||||||
| Total revenue from contracts with customers | $ | 16 | $ | 129 | $ | 145 | |||||||||||||||||||||||
(a) The following amounts of $35 million, with commission feesenergy, capacity and other revenue relate to leases and are accounted for under ASC 842:
| (In millions) | Conventional Generation | Renewables | Total | ||||||||||||||
| Energy revenue | $ | 2 | $ | 385 | $ | 387 | |||||||||||
| Capacity revenue | 182 | 8 | 190 | ||||||||||||||
Other revenue (b) | 21 | $ | — | 21 | |||||||||||||
| Total | $ | 205 | $ | 393 | $ | 598 | |||||||||||
(b) Includes revenue recognized for the Marsh Landing Black Start addition that reached commercial operations on May 31, 2023, as described above.
16
| Six months ended June 30, 2022 | |||||||||||||||||||||||||||||||||||
| (In millions) | Conventional Generation | Renewables | Thermal | Total | |||||||||||||||||||||||||||||||
Energy revenue (a) | $ | 3 | $ | 501 | $ | 48 | $ | 552 | |||||||||||||||||||||||||||
Capacity revenue (a) | 220 | 1 | 18 | 239 | |||||||||||||||||||||||||||||||
| Other revenue | — | 41 | 11 | 52 | |||||||||||||||||||||||||||||||
| Contract amortization | (12) | (71) | — | (83) | |||||||||||||||||||||||||||||||
| Mark-to-market for economic hedges | — | (178) | — | (178) | |||||||||||||||||||||||||||||||
| Total operating revenues | 211 | 294 | 77 | 582 | |||||||||||||||||||||||||||||||
| Less: Mark-to-market for economic hedges | — | 178 | — | 178 | |||||||||||||||||||||||||||||||
| Less: Lease revenue | (223) | (430) | (1) | (654) | |||||||||||||||||||||||||||||||
| Less: Contract amortization | 12 | 71 | — | 83 | |||||||||||||||||||||||||||||||
| Total revenue from contracts with customers | $ | — | $ | 113 | $ | 76 | $ | 189 | |||||||||||||||||||||||||||
(a) The following amounts of $346 thousand. Yield, Inc. usedenergy and capacity revenue relate to leases and are accounted for under ASC 842:
| (In millions) | Conventional Generation | Renewables | Thermal | Total | |||||||||||||||||||
| Energy revenue | $ | 3 | $ | 430 | $ | 1 | $ | 434 | |||||||||||||||
| Capacity revenue | 220 | — | — | 220 | |||||||||||||||||||
| Total | $ | 223 | $ | 430 | $ | 1 | $ | 654 | |||||||||||||||
Contract Balances
The following table reflects the net proceeds to acquire 1,921,866 Class C units fromcontract assets and liabilities included on the Company. At September 30, 2017, approximately $115 million remains available for issuance under the ATM Program.Company’s consolidated balance sheets:
| June 30, 2023 | December 31, 2022 | ||||||||||
| (In millions) | |||||||||||
| Accounts receivable, net - Contracts with customers | $ | 62 | $ | 37 | |||||||
| Accounts receivable, net - Leases | 153 | 116 | |||||||||
| Total accounts receivable, net | $ | 215 | $ | 153 | |||||||
17
Note 3 — Business Acquisitions and Dispositions
distributions in the consolidated statements of members’ equity.
The following is a summary of assets and liabilities transferred in connection with the acquisition of the November 2017 Drop Down Assets as of September 30, 2017:
| (In millions) | |||
| Assets: | |||
| Current assets | $ | 11 | |
| Property, plant and equipment | 84 | ||
| Non-current assets | 32 | ||
| Total assets | 127 | ||
| Liabilities: | |||
Debt (Current and non-current) (a) | 31 | ||
| Other current and non-current liabilities | 3 | ||
| Total liabilities assumed | 34 | ||
| Net assets acquired | $ | 93 | |
February 17, 2023:
| (In millions) | Daggett 3 | |||||||
| Restricted cash | $ | 14 | ||||||
| Property, plant and equipment | 534 | |||||||
| Right-of-use-assets, net | 31 | |||||||
| Derivative assets | 27 | |||||||
| Total assets acquired | 606 | |||||||
Long-term debt (a) | 480 | |||||||
| Long-term lease liabilities | 33 | |||||||
Other current and non-current liabilities (b) | 78 | |||||||
| Total liabilities assumed | 591 | |||||||
| Net assets acquired | $ | 15 | ||||||
(a)NetIncludes a $181 million construction loan, $75 million sponsor equity bridge loan and $229 million tax equity bridge loan, offset by $5 million in unamortized debt issuance costs. See Note 7, Long-term Debt, for further discussion of $2the long-term debt assumed in the acquisition.
(b) Includes $32 million of net debt issuanceproject costs that were subsequently funded by CEG. Subsequent to the acquisition date, CEG funded an additional $11 million in project costs.
| For the three months ended | For the nine months ended | ||||||||||||||
| September 30, 2017 | September 30, 2016 | September 30, 2017 | September 30, 2016 | ||||||||||||
| Total operating revenues | $ | 269 | $ | 275 | $ | 777 | $ | 798 | |||||||
| Net income | 30 | 69 | 90 | 155 | |||||||||||
Entities that are not Consolidated
The assets and liabilities transferred to the Company relate to interests under common control by NRG and were recorded at historical cost in accordance with ASC 805-50, Business Combination - Related Issues. The difference between the cash paid and the historical value of the entities' equity of $8 million was recorded ashas an adjustment to contributed capital. Since the transaction constituted a transfer of entities under common control, the accounting guidance requires retrospective combination of the entities for all periods presented as if the combination has been in effect from the beginning of the financial statement period or from the date the entities were under common control (if later than the beginning of the financial statement period). Accordingly, in connection with the retrospective adjustment of prior periods, the Company adjusted its financial statements to reflect its results of operations, financial position and cash flows as if it recorded its interests in the Agua Caliente Borrower 2 LLC on January 1, 2016, and its interests in the Utah Solar Portfolio on November 2, 2016.
| (In millions) | |||
| Assets: | |||
| Cash | $ | 6 | |
| Equity investment in projects | 456 | ||
| Total assets acquired | 462 | ||
| Liabilities: | |||
Debt (Current and non-current) (a) | 320 | ||
| Other current and non-current liabilities | 3 | ||
| Total liabilities assumed | 323 | ||
| Net assets acquired | $ | 139 | |
| Three months ended September 30, 2016 | Nine months ended September 30, 2016 | ||||||||||||||||||||||||||||||
| As Previously Reported | March 2017 Drop Down Assets | August 2017 Drop Down Assets | As Currently Reported | As Previously Reported | March 2017 Drop Down Assets | August 2017 Drop Down Assets | As Currently Reported | ||||||||||||||||||||||||
| (In millions) | |||||||||||||||||||||||||||||||
| Total operating revenues | $ | 272 | $ | — | $ | — | $ | 272 | $ | 789 | $ | — | $ | — | $ | 789 | |||||||||||||||
| Operating income | 118 | — | — | 118 | 319 | — | — | 319 | |||||||||||||||||||||||
| Net income | 64 | 3 | — | 67 | 147 | 5 | — | 152 | |||||||||||||||||||||||
| Net income attributable to Yield LLC | 100 | 3 | 2 | 105 | 209 | 5 | 5 | 219 | |||||||||||||||||||||||
to the consolidated financial statements included in the Company’s 2022 Form 10-K.
18
Rosie Central BESS — On June 30, 2023, the Company, through its indirect subsidiary, Rosie Class B LLC, the indirect owner of the Rosamond Central solar project, became the owner of the Class B membership interests of Rosie BESS Devco LLC, or Rosie Central BESS, in order to facilitate and fund the construction of a 147 MW battery energy storage system, or BESS, that will be co-located at the Rosamond Central solar facility. Clearway Renew indirectly owns the Class A membership interests. The Company accounts for its investment in Rosie Central BESS as an equity method investment. The Company’s investment consists of $10 million contributed into Rosie Central BESS, funded through contributions from the Company and its cash equity investor in Rosie TargetCo LLC, which consolidates Rosie Class B LLC. On July 3, 2023, Rosie Class B LLC contributed an additional $20 million into Rosie Central BESS, as further described in Note 7, Long-term Debt.
Additionally, on June 30, 2023, Rosamond Central entered into an asset purchase agreement with Clearway Renew to acquire the BESS project assets at mechanical completion for a purchase price of $360 million, of which $72 million is payable at mechanical completion with the remaining $288 million payable at substantial completion. The Company will fund $17 million of the purchase price at mechanical completion and $67 million of the purchase price at substantial completion with the remaining purchase price funded through contributions from the cash equity investor in Rosie TargetCo LLC and the tax equity investor in Rosie TE Holdco LLC. The BESS project is anticipated to reach mechanical completion in the second half of 2023 and to reach substantial completion in the first half of 2024.
The Company’s maximum exposure to loss as of June 30, 2023 is limited to its equity investment in the unconsolidated entities, as further summarized in the table below:
| Name | Economic Interest | Investment Balance | ||||||
| (In millions) | ||||||||
| Avenal | 50% | $ | 5 | |||||
| Desert Sunlight | 25% | 227 | ||||||
| Elkhorn Ridge | 67% | 18 | ||||||
GenConn (a) | 50% | 80 | ||||||
| Rosie Central BESS | 50% | 10 | ||||||
| San Juan Mesa | 75% | 12 | ||||||
| $ | 352 | |||||||
(a)GenConn is a variable interest entity.
Entities that are Consolidated
The discussion below describes material changes to VIEs during the six months ended June 30, 2023.
Daggett Renewable Holdco LLC — As described in Note 5, Investments Accounted for by3, Acquisitions and Dispositions, on February 17, 2023, Daggett Solar Investment LLC, an indirect subsidiary of the Equity MethodCompany, acquired the Class A membership interests in Daggett TargetCo LLC while a cash equity investor acquired the Class B membership interests. The Company and Variable Interest Entities, the cash equity investor then contributed their Class A and B membership interests, respectively, into Daggett Renewable Holdco LLC, a partnership between the Company and the cash equity investor, and concurrently, Daggett TargetCo LLC became a wholly-owned subsidiary of Daggett Renewable Holdco LLC. The Company consolidates Daggett Renewable Holdco LLC as a VIE as the Company is the primary beneficiary, through its role as managing member. The Company recorded the noncontrolling interest of the cash equity investor in Daggett Renewable Holdco LLC at historical carrying amount, with the offset to contributed capital. Daggett TargetCo LLC consolidates, as the consolidated financial statements forindirect owner of the year ended December 31, 2016 included inprimary beneficiary, a tax equity fund, Daggett TE Holdco LLC, which owns the Company's May 9, 2017 Form 8-K.Daggett 3 solar project. The tax equity investor’s interest is shown as noncontrolling interest and the HLBV method is utilized to allocate the income or losses of Daggett TE Holdco LLC.
19
Summarized financial information for the Company'sCompany’s consolidated VIEs consisted of the following as of SeptemberJune 30, 2017:2023:
| (In millions) | Alta TE Holdco LLC | Buckthorn Holdings, LLC | DGPV Funds (a) | Daggett Renewable Holdco LLC (b) | Langford TE Partnership LLC | Lighthouse Renewable Holdco LLC (c) | |||||||||||||||||||||||||||||
| Other current and non-current assets | $ | 59 | $ | 6 | $ | 88 | $ | 142 | $ | 12 | $ | 123 | |||||||||||||||||||||||
| Property, plant and equipment | 290 | 189 | 510 | 570 | 119 | 819 | |||||||||||||||||||||||||||||
| Intangible assets | 193 | — | 13 | — | 2 | — | |||||||||||||||||||||||||||||
| Total assets | 542 | 195 | 611 | 712 | 133 | 942 | |||||||||||||||||||||||||||||
| Current and non-current liabilities | 37 | 11 | 66 | 492 | 53 | 299 | |||||||||||||||||||||||||||||
| Total liabilities | 37 | 11 | 66 | 492 | 53 | 299 | |||||||||||||||||||||||||||||
| Noncontrolling interest | 39 | 22 | 27 | 234 | 62 | 511 | |||||||||||||||||||||||||||||
| Net assets less noncontrolling interest | $ | 466 | $ | 162 | $ | 518 | $ | (14) | $ | 18 | $ | 132 | |||||||||||||||||||||||
| (In millions) | NRG Wind TE Holdco | Alta Wind TE Holdco | Spring Canyon | ||||||||
| Other current and non-current assets | $ | 175 | $ | 17 | $ | 4 | |||||
| Property, plant and equipment | 417 | 443 | 96 | ||||||||
| Intangible assets | 2 | 265 | — | ||||||||
| Total assets | 594 | 725 | 100 | ||||||||
| Current and non-current liabilities | 206 | 9 | 6 | ||||||||
| Total liabilities | 206 | 9 | 6 | ||||||||
| Noncontrolling interest | 22 | 96 | 63 | ||||||||
| Net assets less noncontrolling interests | $ | 366 | $ | 620 | $ | 31 | |||||
(c) Lighthouse Renewable Holdco LLC consolidates Mesquite Star Tax Equity Holdco LLC, Black Rock TE Holdco LLC, Mililani TE Holdco LLC and Waiawa TE Holdco LLC, which are considered VIEs under ASC 810, but for which it is not considered the primary beneficiary. The Company accounts for its interests in these entities under the equity method of accounting, as further described in Note 5, Investments Accounted for by the Equity Method and Variable Interest Entities, to the consolidated financial statements for the year ended December 31, 2016 included in the Company's May 9, 2017 Form 8-K.VIEs.
| (In millions) | Lighthouse Renewable Holdco 2 LLC(a) | Oahu Solar LLC | Pinnacle Repowering TE Holdco LLC | Rattlesnake TE Holdco LLC | Rosie TargetCo LLC | Wildorado TE Holdco LLC | Other (b) | ||||||||||||||||||||||||||||||||||
| Other current and non-current assets | $ | 42 | $ | 39 | $ | 6 | $ | 14 | $ | 45 | $ | 20 | $ | 14 | |||||||||||||||||||||||||||
| Property, plant and equipment | 353 | 160 | 100 | 180 | 234 | 202 | 148 | ||||||||||||||||||||||||||||||||||
| Intangible assets | — | — | 15 | — | — | — | 1 | ||||||||||||||||||||||||||||||||||
| Total assets | 395 | 199 | 121 | 194 | 279 | 222 | 163 | ||||||||||||||||||||||||||||||||||
| Current and non-current liabilities | 130 | 22 | 5 | 17 | 97 | 19 | 71 | ||||||||||||||||||||||||||||||||||
| Total liabilities | 130 | 22 | 5 | 17 | 97 | 19 | 71 | ||||||||||||||||||||||||||||||||||
| Noncontrolling interest | 232 | 24 | 42 | 83 | 128 | 105 | 67 | ||||||||||||||||||||||||||||||||||
| Net assets less noncontrolling interest | $ | 33 | $ | 153 | $ | 74 | $ | 94 | $ | 54 | $ | 98 | $ | 25 | |||||||||||||||||||||||||||
| (In millions) | Maximum exposure to loss | ||
| Four Brothers Solar, LLC | $ | 221 | |
| Granite Mountain Holdings, LLC | 81 | ||
| Iron Springs Holdings, LLC | 56 | ||
| GenConn Energy LLC | 102 | ||
| NRG DGPV Holdco 1 LLC | 71 | ||
| NRG RPV Holdco 1 LLC | 65 | ||
| NRG DGPV Holdco 2 LLC | 54 | ||
| NRG DGPV Holdco 3 LLC | 20 | ||
| Three months ended September 30, | Nine months ended September 30, | |||||||||||||||
| (In millions) | 2017 | 2016 | 2017 | 2016 | ||||||||||||
| Income Statement Data: | ||||||||||||||||
| Utah Solar Portfolio | ||||||||||||||||
| Operating revenues | $ | 23 | $ | — | $ | 60 | $ | — | ||||||||
| Operating income | 9 | — | 17 | — | ||||||||||||
| Net income | 9 | — | 17 | — | ||||||||||||
| September 30, 2017 | December 31, 2016 | |||||||||||||||
| Balance Sheet Data: | (In millions) | |||||||||||||||
| Utah Solar Portfolio | ||||||||||||||||
| Current assets | $ | 25 | $ | 20 | ||||||||||||
| Non-current assets | 1,091 | 1,105 | ||||||||||||||
| Current liabilities | 9 | 14 | ||||||||||||||
| Non-current liabilities | 21 | 38 | ||||||||||||||
Note 5 — Fair Value of Financial Instruments
Fair Value Accounting under ASC 820
ASC 820 establishes a fair value hierarchy that prioritizes the inputs to valuation techniques used to measure fair value into three levels as follows:
•Level 1—quoted prices (unadjusted) in active markets for identical assets or liabilities that the Company has the ability to access as of the measurement date.
•Level 2—inputs other than quoted prices included within Level 1 that are directly observable for the asset or liability or indirectly observable through corroboration with observable market data.
•Level 3—unobservable inputs for the asset or liability only used when there is little, if any, market activity for the asset or liability at the measurement date.
In accordance with ASC 820, the Company determines the level in the fair value hierarchy within which each fair value measurement in its entirety falls, based on the lowest level input that is significant to the fair value measurement.
20
For cash and cash equivalents, restricted cash, accounts receivable — trade, accounts receivable — affiliate,affiliates, accounts payable current portion of the— trade, accounts payable — affiliates and accrued expenses and other current liabilities, the carrying amounts approximate fair value because of the short-term maturity of those instruments and are classified as Level 1 within the fair value hierarchy.
The estimated carrying amounts and estimated fair values of the Company’s recorded financial instruments not carried at fair market value or that do not approximate fair value are as follows:
| As of September 30, 2017 | As of December 31, 2016 | ||||||||||||||
| Carrying Amount | Fair Value | Carrying Amount | Fair Value | ||||||||||||
| (In millions) | |||||||||||||||
| Assets: | |||||||||||||||
Notes receivable (a) | $ | 18 | $ | 18 | $ | 30 | $ | 30 | |||||||
| Liabilities: | |||||||||||||||
| Long-term debt — affiliate | 618 | 626 | 618 | 608 | |||||||||||
Long-term debt — external, including current portion (b) | $ | 5,268 | $ | 5,301 | $ | 5,451 | $ | 5,435 | |||||||
| As of June 30, 2023 | As of December 31, 2022 | ||||||||||||||||||||||
| Carrying Amount | Fair Value | Carrying Amount | Fair Value | ||||||||||||||||||||
| (In millions) | |||||||||||||||||||||||
| Long-term debt, including current portion — affiliate | $ | 2 | $ | 2 | $ | 2 | $ | 2 | |||||||||||||||
Long-term debt, including current portion — external (a) | 7,097 | 6,516 | 6,874 | 6,288 | |||||||||||||||||||
(a) Includes the long-term portion of notes receivable, which is recorded in other noncurrent assets on the Company's consolidated balance sheets.
The fair value of the Company'sCompany’s publicly-traded long-term debt is based on quoted market prices and is classified as Level 2 within the fair value hierarchy. The fair value of debt securities, non-publicly traded long-term debt and certain notes receivable of the Company are based on expected future cash flows discounted at market interest rates, or current interest rates for similar instruments with equivalent credit quality and are classified as Level 3 within the fair value hierarchy. The following table presents the level within the fair value hierarchy for long-term debt, including current portion as of September 30, 2017 and December 31, 2016:portion:
| As of September 30, 2017 | As of December 31, 2016 | ||||||||||||||
| Level 2 | Level 3 | Level 2 | Level 3 | ||||||||||||
| (In millions) | |||||||||||||||
| Long-term debt, including current portion | $ | 884 | $ | 5,043 | $ | 833 | $ | 5,210 | |||||||
| As of June 30, 2023 | As of December 31, 2022 | ||||||||||||||||||||||
| Level 2 | Level 3 | Level 2 | Level 3 | ||||||||||||||||||||
| (In millions) | |||||||||||||||||||||||
| Long-term debt, including current portion | $ | 1,841 | $ | 4,677 | $ | 1,836 | $ | 4,454 | |||||||||||||||
Recurring Fair Value Measurements
The Company records its derivative assets and liabilities at fair market value on its consolidated balance sheet. The following table presents assets and liabilities measured and recorded at fair value on the Company'sCompany’s consolidated balance sheets on a recurring basis and their level within the fair value hierarchy:
| As of September 30, 2017 | As of December 31, 2016 | ||||||||||
Fair Value (a) | Fair Value (a) | Fair Value (a) | |||||||||
| (In millions) | Level 2 | Level 1 | Level 2 | ||||||||
| Derivative assets: | |||||||||||
| Commodity contracts | $ | — | $ | 1 | $ | 1 | |||||
| Interest rate contracts | — | — | 1 | ||||||||
| Total assets | — | 1 | 2 | ||||||||
| Derivative liabilities: | |||||||||||
| Commodity contracts | 2 | — | 1 | ||||||||
| Interest rate contracts | 64 | — | 75 | ||||||||
| Total liabilities | $ | 66 | $ | — | $ | 76 | |||||
| As of June 30, 2023 | As of December 31, 2022 | ||||||||||||||||||||||||||||||||||||||||
Fair Value (a) | Fair Value (a) | ||||||||||||||||||||||||||||||||||||||||
| (In millions) | Level 2 | Level 3 | Level 2 | Level 3 | |||||||||||||||||||||||||||||||||||||
| Derivative assets: | |||||||||||||||||||||||||||||||||||||||||
| Interest rate contracts | $ | 117 | $ | — | $ | 89 | $ | — | |||||||||||||||||||||||||||||||||
Other financial instruments (b) | — | 12 | — | 17 | |||||||||||||||||||||||||||||||||||||
| Total assets | $ | 117 | $ | 12 | $ | 89 | $ | 17 | |||||||||||||||||||||||||||||||||
| Derivative liabilities: | |||||||||||||||||||||||||||||||||||||||||
| Commodity contracts | $ | — | $ | 303 | $ | — | $ | 353 | |||||||||||||||||||||||||||||||||
| Total liabilities | $ | — | $ | 303 | $ | — | $ | 353 | |||||||||||||||||||||||||||||||||
(a)There were no derivative assets classified as Level 1 or Level 3 and no liabilities classified as Level 1 as of SeptemberJune 30, 2017. There were no derivative assets or liabilities classified as Level 3 as of September 30, 20172023 and December 31, 2016.2022.
(b)Includes SREC contract.
21
The following table reconciles the beginning and ending balances for instruments that are recognized at fair value in the consolidated financial statements using significant unobservable inputs:
| Three months ended June 30, | Six months ended June 30, | |||||||||||||||||||||||||
| 2023 | 2022 | 2023 | 2022 | |||||||||||||||||||||||
| (In millions) | Fair Value Measurement Using Significant Unobservable Inputs (Level 3) | Fair Value Measurement Using Significant Unobservable Inputs (Level 3) | ||||||||||||||||||||||||
| Beginning balance | $ | (316) | $ | (280) | $ | (336) | $ | (154) | ||||||||||||||||||
| Settlements | 5 | 22 | 9 | 28 | ||||||||||||||||||||||
| Additions due to loss of NPNS exception | — | — | — | (22) | ||||||||||||||||||||||
| Total gains (losses) for the period included in earnings | 20 | (74) | 36 | (184) | ||||||||||||||||||||||
| Ending balance | $ | (291) | $ | (332) | $ | (291) | $ | (332) | ||||||||||||||||||
| Change in unrealized gains included in earnings for derivatives and other financial instruments held as of June 30, 2023 | $ | 20 | $ | 36 | ||||||||||||||||||||||
Derivative and Financial Instruments Fair Value Measurements
The Company's contracts are non-exchange-traded and valued using prices provided by external sources. For the Company’s energy markets, management receives quotes from multiple sources.The Company uses quoted observable forward prices to value its commodity contracts. To the extent that multiple quotesobservable forward prices are received,not available, the quoted prices reflect the average of the bid-ask mid-pointforward prices obtained from all sources believedthe prior year, adjusted for inflation. As of June 30, 2023, contracts valued with prices provided by models and other valuation techniques make up 100% of derivative liabilities and other financial instruments.
The Company’s significant positions classified as Level 3 include physical commodity contracts executed in illiquid markets. The significant unobservable inputs used in developing fair value include illiquid power tenors and location pricing, which is derived by extrapolating pricing as a basis to provideliquid locations. The tenor pricing and basis spread are based on observable market data when available or derived from historic prices and forward market prices from similar observable markets when not available.
The following table quantifies the most liquid market forsignificant unobservable inputs used in developing the commodity.fair value of the Company’s Level 3 positions:
| June 30, 2023 | |||||||||||||||||||||||
| Fair Value | Input/Range | ||||||||||||||||||||||
| Assets | Liabilities | Valuation Technique | Significant Unobservable Input | Low | High | Weighted Average | |||||||||||||||||
| (In millions) | |||||||||||||||||||||||
| Commodity Contracts | $ | — | $ | (303) | Discounted Cash Flow | Forward Market Price (per MWh) | $ | 21.02 | $ | 71.74 | $ | 38.17 | |||||||||||
| Other Financial Instruments | 12 | — | Discounted Cash Flow | Forecast annual generation levels of certain DG solar facilities | 60,801 MWh | 121,602 MWh | 115,622 MWh | ||||||||||||||||
The following table provides the impact on the fair value measurements to increases/(decreases) in significant unobservable inputs as of June 30, 2023:
| Significant Unobservable Input | Position | Change In Input | Impact on Fair Value Measurement | ||||||||
| Forward Market Price Power | Sell | Increase/(Decrease) | Lower/(Higher) | ||||||||
| Forecast Generation Levels | Sell | Increase/(Decrease) | Higher/(Lower) | ||||||||
22
The fair value of each contract is discounted using a risk freerisk-free interest rate. In addition, a credit reserve is applied to reflect credit risk, which is, for interest rate swaps, calculated based on credit default swaps using the bilateral method. For commodities, to the extent that the net exposureNet Exposure under a specific master agreement is an asset, the Company uses the counterparty’s default swap rate. If the net exposureNet Exposure under a specific master agreement is a liability, the Company uses NRG'sa proxy of its own default swap rate. For interest rate swaps and commodities, the credit reserve is added to the discounted fair value to reflect the exit price that a market participant would be willing to receive to assume the liabilities or that a market participant would be willing to pay for the assets. As of SeptemberJune 30, 2017,2023, the creditnon-performance reserve resultedwas a $26 million gain recorded primarily to total operating revenues in a $1 million increase in fair value in interest expense.the consolidated statements of income. It is possible that future market prices could vary from those used in recording assets and liabilities and such variations could be material.
Concentration of Credit Risk
In addition to the credit risk discussion inas disclosed under Item 15 — Note 2, Summary of Significant Accounting Policies, to the consolidated financial statements for the year ended December 31, 2016 included in the Company's May 9, 2017Company’s 2022 Form 8-K,10-K, the following item is a discussion of the concentration of credit risk for the Company'sCompany’s financial instruments. Credit risk relates to the risk of loss resulting from non-performance or non-payment by counterparties pursuant to the terms of their contractual obligations. The Company monitors and manages credit risk through credit policies that include: (i) an established credit approval process; (ii) daily monitoring of counterparties' credit limits;limits on an as needed basis; (iii) as applicable, the use of credit mitigation measures such as margin, collateral, prepayment arrangements, or volumetric limits; (iv) the use of payment netting agreements; and (v) the use of master netting agreements that allow for the netting of positive and negative exposures of various contracts associated with a single counterparty. Risks surrounding counterparty performance and credit could ultimately impact the amount and timing of expected cash flows. The Company seeks to mitigate counterparty risk by having a diversified portfolio of counterparties.
Counterparty credit exposure includes credit risk exposure under certain long-term agreements, including solar and other PPAs. As external sources or observable market quotes are not available to estimate such exposure, the Company estimates the exposure related to these contracts based on various techniques including, but not limited to, internal models based on a fundamental analysis of the market and extrapolation of observable market data with similar characteristics. Based on these valuation techniques, as of September 30, 2017, credit risk exposure to these counterparties attributable to the Company's ownership interests was approximately $2.9 billion for the next five years. The majorityA significant portion of these powercommodity contracts are with utilities with strong credit quality and public utility commission or other regulatory support. However, such regulated utility counterparties can be impacted by changes in government regulations or adverse financial conditions, which the Company is unable to predict. Certain subsidiaries of the Company sell the output of their facilities to PG&E, a significant counterparty of the Company, under long-term PPAs, and PG&E’s credit rating is below investment-grade.
Note 6 — Accounting for Derivative Instruments and Hedging Activities
This footnote should be read in conjunction with the complete description under Item 15 — Note 7, Accounting for Derivative Instruments and Hedging Activities, to the consolidated financial statements for the year ended December 31, 2016included in the Company's May 9, 2017Company’s 2022 Form 8-K.
Interest Rate Swaps
The Company enters into interest rate swap agreements in order to hedge the variability of expected future cash interest payments. As of SeptemberJune 30, 2017,2023, the Company had interest rate derivative instruments on non-recourse debt extending through 2036,2040, a portion of which arewere designated as cash flow hedges. Under the interest rate swap agreements, the Company pays a fixed rate and the counterparties to the agreements pay a variable interest rate.
Energy-Related Commodities
As of June 30, 2023, the Company had energy-related derivative instruments extending through 2033. At June 30, 2023, these contracts were not designated as cash flow or fair value hedges.
Volumetric Underlying Derivative Transactions
The following table summarizes the net notional volume buybuy/(sell) of the Company'sCompany’s open derivative transactions broken out by commodity:
| Total Volume | |||||||||||||||||
| June 30, 2023 | December 31, 2022 | ||||||||||||||||
| Commodity | Units | (In millions) | |||||||||||||||
| Power | MWh | (17) | (18) | ||||||||||||||
| Interest | Dollars | $ | 1,667 | $ | 1,084 | ||||||||||||
23
| Total Volume | |||||||||
| September 30, 2017 | December 31, 2016 | ||||||||
| Commodity | Units | (In millions) | |||||||
| Natural Gas | MMBtu | 2 | 3 | ||||||
| Interest | Dollars | $ | 1,983 | $ | 2,070 | ||||
Fair Value of Derivative Instruments
| Fair Value | |||||||||||||||||||||||
| Derivative Assets | Derivative Liabilities | ||||||||||||||||||||||
| June 30, 2023 | December 31, 2022 | June 30, 2023 | December 31, 2022 | ||||||||||||||||||||
| (In millions) | |||||||||||||||||||||||
| Derivatives Designated as Cash Flow Hedges: | |||||||||||||||||||||||
| Interest rate contracts current | $ | 7 | $ | 7 | $ | — | $ | — | |||||||||||||||
| Interest rate contracts long-term | 16 | 18 | — | — | |||||||||||||||||||
| Total Derivatives Designated as Cash Flow Hedges | $ | 23 | $ | 25 | $ | — | $ | — | |||||||||||||||
| Derivatives Not Designated as Cash Flow Hedges: | |||||||||||||||||||||||
| Interest rate contracts current | $ | 27 | $ | 19 | $ | — | $ | — | |||||||||||||||
| Interest rate contracts long-term | 67 | 45 | — | — | |||||||||||||||||||
| Commodity contracts current | — | — | 44 | 50 | |||||||||||||||||||
| Commodity contracts long-term | — | — | 259 | 303 | |||||||||||||||||||
| Total Derivatives Not Designated as Cash Flow Hedges | $ | 94 | $ | 64 | $ | 303 | $ | 353 | |||||||||||||||
| Total Derivatives | $ | 117 | $ | 89 | $ | 303 | $ | 353 | |||||||||||||||
| Fair Value | |||||||||||
| Derivative Assets | Derivative Liabilities | ||||||||||
| December 31, 2016 | September 30, 2017 | December 31, 2016 | |||||||||
| (In millions) | |||||||||||
| Derivatives Designated as Cash Flow Hedges: | |||||||||||
| Interest rate contracts current | $ | — | $ | 7 | $ | 26 | |||||
| Interest rate contracts long-term | 1 | 13 | 39 | ||||||||
| Total Derivatives Designated as Cash Flow Hedges | 1 | 20 | 65 | ||||||||
| Derivatives Not Designated as Cash Flow Hedges: | |||||||||||
| Interest rate contracts current | — | 15 | 5 | ||||||||
| Interest rate contracts long-term | — | 29 | 5 | ||||||||
| Commodity contracts current | 2 | 1 | 1 | ||||||||
| Commodity contracts long-term | — | 1 | — | ||||||||
| Total Derivatives Not Designated as Cash Flow Hedges | 2 | 46 | 11 | ||||||||
| Total Derivatives | $ | 3 | $ | 66 | $ | 76 | |||||
The Company has elected to present derivative assets and liabilities on the balance sheet on a trade-by-trade basis and does not offset amounts at the counterparty master agreement level. As of SeptemberJune 30, 2017, there were no offsetting amounts at2023 and December 31, 2022, the counterparty master agreement level noramount of outstanding collateral paid or received. As of December 31, 2016, therereceived was no outstanding collateral paid or received.immaterial. The following tables summarize the offsetting of derivatives by the counterparty master agreement level as of December 31, 2016:counterparty:
| Gross Amounts Not Offset in the Statement of Financial Position | |||||||||||||||||
| As of June 30, 2023 | Gross Amounts of Recognized Assets/Liabilities | Derivative Instruments | Net Amount | ||||||||||||||
| Commodity contracts | (In millions) | ||||||||||||||||
| Derivative liabilities | $ | (303) | $ | — | $ | (303) | |||||||||||
| Total commodity contracts | $ | (303) | $ | — | $ | (303) | |||||||||||
| Interest rate contracts | |||||||||||||||||
| Derivative assets | $ | 117 | $ | — | $ | 117 | |||||||||||
| Total interest rate contracts | $ | 117 | $ | — | $ | 117 | |||||||||||
| Total derivative instruments | $ | (186) | $ | — | $ | (186) | |||||||||||
| Gross Amounts Not Offset in the Statement of Financial Position | |||||||||||||||||
| As of December 31, 2022 | Gross Amounts of Recognized Assets/Liabilities | Derivative Instruments | Net Amount | ||||||||||||||
| Commodity contracts | (In millions) | ||||||||||||||||
| Derivative liabilities | $ | (353) | $ | — | $ | (353) | |||||||||||
| Total commodity contracts | $ | (353) | $ | — | $ | (353) | |||||||||||
| Interest rate contracts | |||||||||||||||||
| Derivative assets | $ | 89 | $ | — | $ | 89 | |||||||||||
| Total interest rate contracts | $ | 89 | $ | — | $ | 89 | |||||||||||
| Total derivative instruments | $ | (264) | $ | — | $ | (264) | |||||||||||
24
| As of December 31, 2016 | Gross Amounts of Recognized Assets/Liabilities | Derivative Instruments | Net Amount | ||||||||
| Commodity contracts: | (In millions) | ||||||||||
| Derivative assets | $ | 2 | $ | — | $ | 2 | |||||
| Derivative liabilities | (1 | ) | — | (1 | ) | ||||||
| Total commodity contracts | 1 | — | 1 | ||||||||
| Interest rate contracts: | |||||||||||
| Derivative assets | 1 | (1 | ) | — | |||||||
| Derivative liabilities | (75 | ) | 1 | (74 | ) | ||||||
| Total interest rate contracts | (74 | ) | — | (74 | ) | ||||||
| Total derivative instruments | $ | (73 | ) | $ | — | $ | (73 | ) | |||
Accumulated Other Comprehensive LossIncome (Loss)
The following table summarizes the effects on the Company’s accumulated OCLOCI (OCL) balance attributable to interest rate swaps designated as cash flow hedge derivatives:derivatives:
| Three months ended September 30, | Nine months ended September 30, | ||||||||||||||
| 2017 | 2016 | 2017 | 2016 | ||||||||||||
| (In millions) | |||||||||||||||
Accumulated OCL beginning balance | $ | (86 | ) | $ | (168 | ) | $ | (86 | ) | $ | (99 | ) | |||
| Reclassified from accumulated OCL to income due to realization of previously deferred amounts | 5 | 6 | 13 | 13 | |||||||||||
| Mark-to-market of cash flow hedge accounting contracts | 2 | 14 | (6 | ) | (62 | ) | |||||||||
| Accumulated OCL ending balance | (79 | ) | (148 | ) | (79 | ) | (148 | ) | |||||||
| Accumulated OCL attributable to noncontrolling interests | (1 | ) | (2 | ) | (1 | ) | (2 | ) | |||||||
| Accumulated OCL attributable to NRG Yield LLC | $ | (78 | ) | $ | (146 | ) | $ | (78 | ) | $ | (146 | ) | |||
| Losses expected to be realized from OCL during the next 12 months | $ | 17 | $ | 17 | |||||||||||
| Three months ended June 30, | Six months ended June 30, | ||||||||||||||||||||||
| 2023 | 2022 | 2023 | 2022 | ||||||||||||||||||||
| (In millions) | |||||||||||||||||||||||
| Accumulated OCI (OCL) beginning balance | $ | 23 | $ | 3 | $ | 27 | $ | (13) | |||||||||||||||
| Reclassified from accumulated OCI (OCL) to income due to realization of previously deferred amounts | (1) | 2 | (1) | 5 | |||||||||||||||||||
| Mark-to-market of cash flow hedge accounting contracts | 5 | 5 | 1 | 18 | |||||||||||||||||||
| Accumulated OCI ending balance | 27 | 10 | 27 | 10 | |||||||||||||||||||
| Accumulated OCI attributable to noncontrolling interests | 6 | 4 | 6 | 4 | |||||||||||||||||||
| Accumulated OCI attributable to Clearway Energy LLC | $ | 21 | $ | 6 | $ | 21 | $ | 6 | |||||||||||||||
| Gains expected to be realized from OCI during the next 12 months | $ | 6 | $ | 6 | |||||||||||||||||||
Amounts reclassified from accumulated OCLOCI (OCL) into income and amounts recognized in income from the ineffective portion of cash flow hedges are recorded to interest expense. There was no ineffectiveness for the nine months ended September 30, 2017 and 2016.
Impact of Derivative Instruments on the Consolidated Statements of Income
| Three months ended June 30, | Six months ended June 30, | ||||||||||||||||||||||
| 2023 | 2022 | 2023 | 2022 | ||||||||||||||||||||
| (In millions) | |||||||||||||||||||||||
| Interest Rate Contracts (Interest expense) | $ | 22 | $ | 36 | $ | 1 | $ | 77 | |||||||||||||||
Commodity Contracts (Mark-to-market for economic hedging activities) (a) | 32 | (49) | 50 | (174) | |||||||||||||||||||
(a) Relates to long-term commodity contracts at Elbow Creek, Mesquite Star, Mt. Storm, Langford and Mesquite Sky. During the six months ended June 30, 2022, the commodity contract for these contracts.Langford, which previously met the NPNS exception, no longer qualified for NPNS treatment and, accordingly, is accounted for as a derivative and marked to fair value through operating revenues.
See Note 5, Fair Value of Financial Instruments, for a discussion regarding concentration of credit risk.
Note 7 — Long-term Debt
This footnotenote should be read in conjunction with the complete description under Item 15 — Note 10, Long-term Debt,to the consolidated financial statements for the year ended December 31, 2016 included in the Company's May 9, 2017Company’s 2022 Form 8-K. Long-term debt10-K. The Company’s borrowings, including short-term and long-term portions, consisted of the following:
| September 30, 2017 | December 31, 2016 | September 30, 2017, interest rate % (a) | Letters of Credit Outstanding at September 30, 2017 | ||||||||||
| (In millions, except rates) | |||||||||||||
| Long-term debt - affiliate, due 2019 | $ | 337 | $ | 337 | 3.580 | ||||||||
| Long-term debt - affiliate, due 2020 | 281 | 281 | 3.325 | ||||||||||
| 2024 Senior Notes | 500 | 500 | 5.375 | ||||||||||
| 2026 Senior Notes | 350 | 350 | 5.000 | ||||||||||
| Project-level debt: | |||||||||||||
| Agua Caliente Borrower 2, due 2038 | 41 | — | 5.430 | 17 | |||||||||
| Alpine, due 2022 | 138 | 145 | L+1.750 | 37 | |||||||||
| Alta Wind I - V lease financing arrangements, due 2034 and 2035 | 940 | 965 | 5.696 - 7.015 | 103 | |||||||||
| CVSR, due 2037 | 746 | 771 | 2.339 - 3.775 | — | |||||||||
| CVSR Holdco Notes, due 2037 | 194 | 199 | 4.680 | 13 | |||||||||
| El Segundo Energy Center, due 2023 | 400 | 443 | L+1.75 - L+2.375 | 102 | |||||||||
| Energy Center Minneapolis, due 2017 and 2025 | 82 | 96 | 5.950 -7.250 | — | |||||||||
| Energy Center Minneapolis Series D Notes, due 2031 | 125 | 125 | 3.550 | — | |||||||||
| Laredo Ridge, due 2028 | 96 | 100 | L+1.875 | 10 | |||||||||
| Marsh Landing, due 2017 and 2023 | 334 | 370 | L+1.750 - L+1.875 | 34 | |||||||||
| Tapestry, due 2021 | 165 | 172 | L+1.625 | 20 | |||||||||
| Utah Solar Portfolio, due 2022 | 284 | 287 | L+2.625 | 13 | |||||||||
| Viento, due 2023 | 169 | 178 | L+3.00 | 27 | |||||||||
| Walnut Creek, due 2023 | 279 | 310 | L+1.625 | 49 | |||||||||
| Other | 425 | 440 | Various | 37 | |||||||||
| Subtotal project-level debt: | 4,418 | 4,601 | |||||||||||
| Total debt | 5,886 | 6,069 | |||||||||||
| Less current maturities | (300 | ) | (291 | ) | |||||||||
| Less net debt issuance costs | (54 | ) | (62 | ) | |||||||||
| Total long-term debt | $ | 5,532 | $ | 5,716 | |||||||||
| (In millions, except rates) | June 30, 2023 | December 31, 2022 | June 30, 2023 interest rate % (a) | Letters of Credit Outstanding at June 30, 2023 | |||||||||||||||||||
| Intercompany Note with Clearway, Inc. | $ | 2 | $ | 2 | 4.430 | ||||||||||||||||||
| 2028 Senior Notes | 850 | 850 | 4.750 | ||||||||||||||||||||
| 2031 Senior Notes | 925 | 925 | 3.750 | ||||||||||||||||||||
| 2032 Senior Notes | 350 | 350 | 3.750 | ||||||||||||||||||||
Clearway Energy LLC and Clearway Energy Operating LLC Revolving Credit Facility, due 2028 (b) | — | — | S+1.850 | $ | 188 | ||||||||||||||||||
| Non-recourse project-level debt: | |||||||||||||||||||||||
| Agua Caliente Solar LLC, due 2037 | 640 | 649 | 2.395-3.633 | 45 | |||||||||||||||||||
| Alta Wind Asset Management LLC, due 2031 | 11 | 12 | L+2.625 | — | |||||||||||||||||||
| Alta Wind I-V lease financing arrangements, due 2034 and 2035 | 679 | 709 | 5.696-7.015 | 47 | |||||||||||||||||||
| Alta Wind Realty Investments LLC, due 2031 | 21 | 22 | 7.000 | — | |||||||||||||||||||
| Borrego, due 2024 and 2038 | 50 | 51 | Various | — | |||||||||||||||||||
| Buckthorn Solar, due 2025 | 119 | 119 | S+2.100 | 22 | |||||||||||||||||||
| Capistrano Wind Portfolio, due 2029 and 2031 | 145 | 156 | S+2.100-S+2.150 | 34 | |||||||||||||||||||
| Carlsbad Energy Holdings LLC, due 2027 | 114 | 115 | S+1.900 | 82 | |||||||||||||||||||
| Carlsbad Energy Holdings LLC, due 2038 | 407 | 407 | 4.120 | — | |||||||||||||||||||
| Carlsbad Holdco, LLC, due 2038 | 197 | 197 | 4.210 | 6 | |||||||||||||||||||
| CVSR, due 2037 | 612 | 627 | 2.339-3.775 | — | |||||||||||||||||||
| CVSR Holdco Notes, due 2037 | 151 | 160 | 4.680 | 12 | |||||||||||||||||||
| Daggett 3, due 2023 and 2028 | 446 | — | S+1.262 | 35 | |||||||||||||||||||
| DG-CS Master Borrower LLC, due 2040 | 406 | 413 | 3.510 | 30 | |||||||||||||||||||
| Marsh Landing, due 2023 | — | 19 | — | ||||||||||||||||||||
| Mililani I, due 2027 | 47 | 47 | S+1.600 | 5 | |||||||||||||||||||
| NIMH Solar, due 2024 | 156 | 163 | S+2.150 | 16 | |||||||||||||||||||
| Oahu Solar Holdings LLC, due 2026 | 82 | 83 | S+1.525 | 11 | |||||||||||||||||||
| Rosie Class B LLC, due 2029 | 77 | 76 | S+1.375 | 15 | |||||||||||||||||||
| Utah Solar Holdings, due 2036 | 253 | 257 | 3.590 | 15 | |||||||||||||||||||
| Viento Funding II, LLC, due 2029 | 180 | 184 | S+1.475 | 25 | |||||||||||||||||||
| Waiawa, due 2028 | 46 | 97 | S+1.600 | 12 | |||||||||||||||||||
| Walnut Creek, due 2023 | — | 19 | — | ||||||||||||||||||||
| WCEP Holdings, LLC, due 2023 | — | 26 | — | ||||||||||||||||||||
| Other | 130 | 137 | Various | 250 | |||||||||||||||||||
| Subtotal non-recourse project-level debt | 4,969 | 4,745 | |||||||||||||||||||||
| Total debt | 7,096 | 6,872 | |||||||||||||||||||||
| Less current maturities | (332) | (324) | |||||||||||||||||||||
| Less net debt issuance costs | (59) | (61) | |||||||||||||||||||||
Add premiums (c) | 3 | 4 | |||||||||||||||||||||
| Total long-term debt | $ | 6,708 | $ | 6,491 | |||||||||||||||||||
(a)As of SeptemberJune 30, 2017,2023, S+ equals SOFR plus x% and L+equals 3 month LIBOR plus x%, except for.
(b) Applicable rate is determined by the Utah Solar Portfolio, where L+equals 1 month LIBOR plus x%borrower leverage ratio, as defined in the credit agreement.
(c) Premiums relate to the 2028 Senior Notes.
The financing arrangements listed above contain certain covenants, including financial covenants that the Company is required to be in compliance with during the term of the respective arrangement. As of SeptemberJune 30, 2017,2023, the Company was in compliance with all of the required covenants.
26
The discussion below describes material changes to or additions of long-term debt for the ninesix months ended SeptemberJune 30, 2017.2023.
On March 15, 2023, Clearway Energy Operating LLC refinanced the Amended and Restated Credit Agreement, which (i) replaced LIBOR with SOFR plus a credit spread adjustment of 0.10% as the applicable reference rate, (ii) increased the available revolving commitments to an aggregate principal amount of $700 million, (iii) extended the maturity date to March 15, 2028, (iv) increased the letter of credit sublimit to $594 million and (v) implemented certain other technical modifications.
As of SeptemberJune 30, 2017, there were2023, the Company had no outstanding borrowings under the revolving credit facility and the Company had $68$188 million ofin letters of credit outstanding.
Rosamond Central (Rosie Class B LLC)
On March 16, 2017, NRG Energy Center MinneapolisJune 30, 2023, Rosie Class B LLC amended its financing agreement to provide for (i) a term loan in the amount of $77 million, (ii) construction loans up to $115 million, which will convert to a term loan upon the BESS project reaching substantial completion, (iii) tax equity bridge loans up to $188 million, which will be repaid with tax equity proceeds received upon the BESS project reaching substantial completion, (iv) an increase to the letter of credit sublimit to $41 million and (v) an extension of the maturity date of the term loan and construction loans to five years subsequent to term conversions.
On July 3, 2023, Rosie Class B LLC received total loan proceeds of $138 million, which was comprised of $115 million in construction loans and $28 million in tax equity bridge loans, net of $5 million in debt issuance costs that were deferred. Also on July 3, 2023, Rosie Class B LLC issued a loan to a consolidated subsidiary of NRG Thermal LLC, amendedClearway Renew in the shelf facility of its existing Thermal financing arrangement to allow for the issuance of an additional $10 million of Series F notes at a 4.60% interest rate, or Series F Notes, increasing the totalaggregate principal amount of notes available for issuance under$117 million in order to finance the shelf facility to $80 million. The Series F Notes will be secured by substantially allconstruction of the assetsBESS project. The loan bears interest at 9.00% and matures when the project reaches substantial completion, which is anticipated in the first half of NRG Energy Center Minneapolis LLC. NRG
Waiawa
On March 30, 2023, when the Waiawa solar project reached substantial completion, the tax equity interestsinvestor contributed an additional $41 million and CEG contributed an additional $8 million, which was utilized, along with the $17 million in all of NRG Thermal LLC’s subsidiaries.
On February 17, 2017, Agua Caliente Borrower 1 LLC, an indirect subsidiary2023, as part of NRG, and Agua Caliente Borrower 2 LLC, issued $130 millionthe acquisition of senior secured notes under the Agua Caliente Borrower 1 LLC and Agua Caliente Borrower 2 LLC financing agreement, or Agua Caliente Holdco Financing Agreement, that bear interest at 5.43% and mature on December 31, 2038. AsDaggett 3, as further described in Note 3, Business Acquisitions and Dispositions, on March 27, 2017, the Company acquired Agua Caliente Borrower 2 LLC from NRG as partassumed the project’s financing agreement, which included a $181 million construction loan that converts to a term loan upon the project reaching substantial completion, $229 million tax equity bridge loan and $75 million sponsor equity bridge loan. The sponsor equity bridge loan was repaid at acquisition date, along with $8 million in associated fees, utilizing all of the March 2017 Drop Down Assets acquisitionproceeds from the Company and assumed NRG's portioncash equity investor, which were contributed back to the Company by CEG. The tax equity bridge loan will be repaid with the final proceeds received from the tax equity investor upon Daggett 3 reaching substantial completion, which is expected to occur in the second half of senior secured notes under2023, along with the Agua Caliente Holdco Financing Agreement. Agua Caliente Borrower 2 LLC holds $41$62 million of the Agua Caliente Holdco debt as of September 30, 2017. The debt is joint and several with respect to Agua Caliente Borrower 1 LLC and Agua Caliente Borrower 2 LLC and is securedthat was contributed into escrow by the tax equity interests of each borrower ininvestor at acquisition date. Subsequent to the Agua Caliente solar facility.
Note 8 — Segment Reporting
The Company’s segment structure reflects how management currently operates and allocates resources. The Company'sCompany’s businesses are primarily segregated based on conventional power generation, renewable businesses which consist of solar, and wind and the thermal and chilled water business.energy storage The Corporate segment reflects the Company'sCompany’s corporate costs.costs and includes eliminating entries. The Company'sCompany’s chief operating decision maker, its Chief Executive Officer, evaluates the performance of its segments based on operational measures including adjusted earnings before interest, taxes, depreciation and amortization, or Adjusted EBITDA, and CAFD, as well as economic gross margin and net income (loss).
| Three months ended June 30, 2023 | |||||||||||||||||||||||
| (In millions) | Conventional Generation | Renewables | Corporate (a) | Total | |||||||||||||||||||
| Operating revenues | $ | 115 | $ | 291 | $ | — | $ | 406 | |||||||||||||||
| Cost of operations, exclusive of depreciation, amortization and accretion shown separately below | 40 | 79 | (1) | 118 | |||||||||||||||||||
| Depreciation, amortization and accretion | 32 | 96 | — | 128 | |||||||||||||||||||
| General and administrative | — | — | 9 | 9 | |||||||||||||||||||
| Transaction and integration costs | — | — | 2 | 2 | |||||||||||||||||||
| Operating income (loss) | 43 | 116 | (10) | 149 | |||||||||||||||||||
| Equity in earnings of unconsolidated affiliates | 1 | 2 | — | 3 | |||||||||||||||||||
| Other income, net | 1 | 3 | 5 | 9 | |||||||||||||||||||
| Interest expense | (8) | (23) | (24) | (55) | |||||||||||||||||||
| Net Income (Loss) | $ | 37 | $ | 98 | $ | (29) | $ | 106 | |||||||||||||||
| Total Assets | $ | 2,169 | $ | 10,020 | $ | 429 | $ | 12,618 | |||||||||||||||
(a)Includes eliminations.
| Three months ended June 30, 2022 | |||||||||||||||||||||||||||||
| (In millions) | Conventional Generation | Renewables | Thermal | Corporate (a) | Total | ||||||||||||||||||||||||
| Operating revenues | $ | 103 | $ | 247 | $ | 18 | $ | — | $ | 368 | |||||||||||||||||||
| Cost of operations, exclusive of depreciation, amortization and accretion shown separately below | 28 | 73 | 11 | — | 112 | ||||||||||||||||||||||||
| Depreciation, amortization and accretion | 33 | 93 | — | — | 126 | ||||||||||||||||||||||||
| General and administrative | — | — | 1 | 8 | 9 | ||||||||||||||||||||||||
| Transaction and integration costs | — | — | — | 3 | 3 | ||||||||||||||||||||||||
| Development costs | — | — | 1 | — | 1 | ||||||||||||||||||||||||
| Total operating costs and expenses | 61 | 166 | 13 | 11 | 251 | ||||||||||||||||||||||||
| Gain on sale of business | — | — | — | 1,291 | 1,291 | ||||||||||||||||||||||||
| Operating income | 42 | 81 | 5 | 1,280 | 1,408 | ||||||||||||||||||||||||
| Equity in earnings of unconsolidated affiliates | 1 | 9 | — | — | 10 | ||||||||||||||||||||||||
| Other income, net | — | 4 | — | 1 | 5 | ||||||||||||||||||||||||
| Interest expense | (10) | (11) | (1) | (25) | (47) | ||||||||||||||||||||||||
| Net Income | $ | 33 | $ | 83 | $ | 4 | $ | 1,256 | $ | 1,376 | |||||||||||||||||||
(a)Includes eliminations.
28
| Three months ended September 30, 2017 | Six months ended June 30, 2023 | |||||||||||||||||||||||||||||||||||||||||
| (In millions) | Conventional Generation | Renewables | Thermal | Corporate | Total | (In millions) | Conventional Generation | Renewables | Corporate (a) | Total | ||||||||||||||||||||||||||||||||
| Operating revenues | $ | 88 | $ | 131 | $ | 46 | $ | — | $ | 265 | Operating revenues | $ | 210 | $ | 484 | $ | — | $ | 694 | |||||||||||||||||||||||
| Cost of operations | 16 | 33 | 29 | — | 78 | |||||||||||||||||||||||||||||||||||||
| Depreciation and amortization | 27 | 56 | 5 | — | 88 | |||||||||||||||||||||||||||||||||||||
| Cost of operations, exclusive of depreciation, amortization and accretion shown separately below | Cost of operations, exclusive of depreciation, amortization and accretion shown separately below | 69 | 158 | (1) | 226 | |||||||||||||||||||||||||||||||||||||
| Depreciation, amortization and accretion | Depreciation, amortization and accretion | 65 | 191 | — | 256 | |||||||||||||||||||||||||||||||||||||
| General and administrative | — | — | — | 4 | 4 | General and administrative | — | — | 19 | 19 | ||||||||||||||||||||||||||||||||
| Transaction and integration costs | Transaction and integration costs | — | — | 2 | 2 | |||||||||||||||||||||||||||||||||||||
| Operating income (loss) | 45 | 42 | 12 | (4 | ) | 95 | Operating income (loss) | 76 | 135 | (20) | 191 | |||||||||||||||||||||||||||||||
| Equity in earnings of unconsolidated affiliates | 3 | 25 | — | — | 28 | |||||||||||||||||||||||||||||||||||||
| Equity in earnings (losses) of unconsolidated affiliates | Equity in earnings (losses) of unconsolidated affiliates | 2 | (2) | — | — | |||||||||||||||||||||||||||||||||||||
| Other income, net | 1 | — | — | — | 1 | Other income, net | 2 | 4 | 11 | 17 | ||||||||||||||||||||||||||||||||
| Interest expense | (13 | ) | (39 | ) | (2 | ) | (18 | ) | (72 | ) | Interest expense | (19) | (87) | (48) | (154) | |||||||||||||||||||||||||||
| Net Income (Loss) | $ | 36 | $ | 28 | $ | 10 | $ | (22 | ) | $ | 52 | Net Income (Loss) | $ | 61 | $ | 50 | $ | (57) | $ | 54 | ||||||||||||||||||||||
| Total Assets | $ | 1,920 | $ | 5,821 | $ | 420 | $ | 79 | $ | 8,240 | ||||||||||||||||||||||||||||||||
(a) Includes eliminations.
| Six months ended June 30, 2022 | |||||||||||||||||||||||||||||
| (In millions) | Conventional Generation | Renewables | Thermal | Corporate (a) | Total | ||||||||||||||||||||||||
| Operating revenues | $ | 211 | $ | 294 | $ | 77 | $ | — | $ | 582 | |||||||||||||||||||
| Cost of operations, exclusive of depreciation, amortization and accretion shown separately below | 49 | 141 | 50 | — | 240 | ||||||||||||||||||||||||
| Depreciation, amortization and accretion | 66 | 184 | — | — | 250 | ||||||||||||||||||||||||
| General and administrative | — | — | 2 | 19 | 21 | ||||||||||||||||||||||||
| Transaction and integration costs | — | — | — | 5 | 5 | ||||||||||||||||||||||||
| Development costs | — | — | 2 | — | 2 | ||||||||||||||||||||||||
| Total operating costs and expenses | 115 | 325 | 54 | 24 | 518 | ||||||||||||||||||||||||
| Gain on sale of business | — | — | — | 1,291 | 1,291 | ||||||||||||||||||||||||
| Operating income (loss) | 96 | (31) | 23 | 1,267 | 1,355 | ||||||||||||||||||||||||
| Equity in earnings of unconsolidated affiliates | 2 | 12 | — | — | 14 | ||||||||||||||||||||||||
| Other income, net | — | 4 | — | 1 | 5 | ||||||||||||||||||||||||
| Loss on debt extinguishment | — | (2) | — | — | (2) | ||||||||||||||||||||||||
| Interest expense | (18) | (19) | (6) | (51) | (94) | ||||||||||||||||||||||||
| Net Income (Loss) | $ | 80 | $ | (36) | $ | 17 | $ | 1,217 | $ | 1,278 | |||||||||||||||||||
(a) Includes eliminations.
29
| Three months ended September 30, 2016 | |||||||||||||||||||
| (In millions) | Conventional Generation | Renewables | Thermal | Corporate | Total | ||||||||||||||
| Operating revenues | $ | 82 | $ | 142 | $ | 48 | $ | — | $ | 272 | |||||||||
| Cost of operations | 14 | 31 | 31 | — | 76 | ||||||||||||||
| Depreciation and amortization | 20 | 50 | 5 | — | 75 | ||||||||||||||
| General and administrative | — | — | — | 3 | 3 | ||||||||||||||
| Operating income (loss) | 48 | 61 | 12 | (3 | ) | 118 | |||||||||||||
| Equity in earnings of unconsolidated affiliates | 3 | 13 | — | — | 16 | ||||||||||||||
| Other income, net | 1 | — | — | — | 1 | ||||||||||||||
| Interest expense | (13 | ) | (37 | ) | (2 | ) | (16 | ) | (68 | ) | |||||||||
| Net Income (Loss) | $ | 39 | $ | 37 | $ | 10 | $ | (19 | ) | $ | 67 | ||||||||
| Nine months ended September 30, 2017 | |||||||||||||||||||
| (In millions) | Conventional Generation | Renewables | Thermal | Corporate | Total | ||||||||||||||
| Operating revenues | $ | 246 | $ | 391 | $ | 130 | $ | — | $ | 767 | |||||||||
| Cost of operations | 53 | 100 | 86 | — | 239 | ||||||||||||||
| Depreciation and amortization | 77 | 149 | 15 | — | 241 | ||||||||||||||
| General and administrative | — | — | — | 14 | 14 | ||||||||||||||
| Acquisition-related transaction and integration costs | — | — | — | 2 | 2 | ||||||||||||||
| Operating income (loss) | 116 | 142 | 29 | (16 | ) | 271 | |||||||||||||
| Equity in earnings of unconsolidated affiliates | 9 | 54 | — | — | 63 | ||||||||||||||
| Other income, net | 1 | 1 | — | 1 | 3 | ||||||||||||||
| Interest expense | (39 | ) | (128 | ) | (7 | ) | (53 | ) | (227 | ) | |||||||||
| Net Income (Loss) | $ | 87 | $ | 69 | $ | 22 | $ | (68 | ) | $ | 110 | ||||||||
| Total Assets | $ | 1,920 | $ | 5,821 | $ | 420 | $ | 79 | $ | 8,240 | |||||||||
| Nine months ended September 30, 2016 | |||||||||||||||||||
| (In millions) | Conventional Generation | Renewables | Thermal | Corporate | Total | ||||||||||||||
| Operating revenues | $ | 246 | $ | 412 | $ | 131 | $ | — | $ | 789 | |||||||||
| Cost of operations | 53 | 98 | 87 | — | 238 | ||||||||||||||
| Depreciation and amortization | 60 | 149 | 15 | — | 224 | ||||||||||||||
| General and administrative | — | — | — | 8 | 8 | ||||||||||||||
| Operating income (loss) | 133 | 165 | 29 | (8 | ) | 319 | |||||||||||||
| Equity in earnings of unconsolidated affiliates | 10 | 24 | — | — | 34 | ||||||||||||||
| Other income, net | 1 | 2 | — | — | 3 | ||||||||||||||
| Interest expense | (36 | ) | (115 | ) | (5 | ) | (48 | ) | (204 | ) | |||||||||
| Net Income (Loss) | $ | 108 | $ | 76 | $ | 24 | $ | (56 | ) | $ | 152 | ||||||||
Note 9 — Related Party Transactions
In addition to the transactions and relationships described elsewhere in thesethe notes to the consolidated financial statements, NRG and certain subsidiaries of NRGCEG provide services to the Company and its project entities. Amounts due to NRGCEG subsidiaries are recorded as accounts payable - affiliate— affiliates and amounts due to the Company from NRG or itsCEG subsidiaries are recorded as accounts receivable - affiliate— affiliates in the Company'sCompany’s consolidated balance sheet.
| Three months ended September 30, | Nine months ended September 30, | |||||||||||||||
| (in millions) | 2017 | 2016 | 2017 | 2016 | ||||||||||||
| O&M costs | $ | 10 | $ | 9 | $ | 29 | $ | 28 | ||||||||
Various wholly-owned subsidiaries of the Company in the Renewables segment are party to administrative services agreements with NRG RenewClearway Renewable Operation and& Maintenance LLC, or RENOM, a wholly-owned subsidiary of NRG,CEG, which provides operation and maintenance, or O&M, services on behalf ofto these entities.subsidiaries. The Company incurred total expenses for these services in the amount of $6$19 million and $16$15 million for the three and nine months ended SeptemberJune 30, 2017,2023 and 2022, respectively. The Company incurred total expenses for these services of $4$36 million and $9$30 million for the three and ninesix months ended SeptemberJune 30, 2016,2023 and 2022, respectively. There was a balance of $4$11 million and $5$14 million due to RENOM as of SeptemberJune 30, 20172023 and December 31, 2016,2022, respectively.
CEG Master Services Agreements
The Company is a party to the CEG Master Services Agreements, pursuant to which CEG and certain of its affiliates or third-party service providers provide certain services to the Company, including operational and administrative services, which include human resources, accounting, tax, legal, information systems, treasury,external affairs, accounting, procurement and risk management as set forthservices,and the Company provides certain services to CEG, including accounting, internal audit, tax and treasury services, in exchange for the Management Services Agreement. Aspayment of September 30, 2017, the base management fee was approximately $8 million per year, subject to an inflation-based adjustment annually at an inflation factor based on the year-over-year U.S. consumer price index.fees in respect of such services. The fee is also subject to adjustments following the consummationCompany incurred net expenses under these agreements of acquisitions and as a result of a change in the scope of services provided under the Management Services Agreement. Costs incurred under this agreement were $2 million and $8$1 million for each of the three months ended June 30, 2023, and 2022, respectively. The Company incurred net expenses under these agreements of $3 million and $2 million for the three and ninesix months ended SeptemberJune 30, 2017,2023 and 2022, respectively. Costs incurred under this agreement for the three and nine months ended September 30, 2016 were $1 million and $6 million, respectively. The costs incurred under the Management Service Agreement included certain direct expenses incurred by NRG on behalf of the Company in addition to the base management fee.
30
Note 10 — Condensed Consolidating Financial InformationContingencies
| NRG Yield LLC | Other Guarantor Subsidiaries | Non-Guarantor Subsidiaries | NRG Yield Operating LLC (Note Issuer) | Eliminations(a) | Consolidated | ||||||||||||||||||
| (In millions) | |||||||||||||||||||||||
| Operating Revenues | |||||||||||||||||||||||
| Total operating revenues | $ | — | $ | 6 | $ | 259 | $ | — | $ | — | $ | 265 | |||||||||||
| Operating Costs and Expenses | |||||||||||||||||||||||
| Cost of operations | — | 3 | 75 | — | — | 78 | |||||||||||||||||
| Depreciation and amortization | — | 1 | 87 | — | — | 88 | |||||||||||||||||
| General and administrative | — | — | — | 4 | — | 4 | |||||||||||||||||
| Total operating costs and expenses | — | 4 | 162 | 4 | — | 170 | |||||||||||||||||
| Operating Income (Loss) | — | 2 | 97 | (4 | ) | — | 95 | ||||||||||||||||
| Other Income (Expense) | |||||||||||||||||||||||
| Equity in earnings (losses) of consolidated affiliates | 75 | (4 | ) | — | 59 | (130 | ) | — | |||||||||||||||
| Equity in earnings of unconsolidated affiliates | — | 7 | 6 | 15 | — | 28 | |||||||||||||||||
| Other income, net | — | — | 1 | — | — | 1 | |||||||||||||||||
| Interest expense | — | — | (54 | ) | (18 | ) | — | (72 | ) | ||||||||||||||
| Total other income (expense), net | 75 | 3 | (47 | ) | 56 | (130 | ) | (43 | ) | ||||||||||||||
| Net Income | 75 | 5 | 50 | 52 | (130 | ) | 52 | ||||||||||||||||
| Less: Net loss attributable to noncontrolling interests | — | — | (1 | ) | (23 | ) | 1 | (23 | ) | ||||||||||||||
| Net Income Attributable to NRG Yield LLC | $ | 75 | $ | 5 | $ | 51 | $ | 75 | $ | (131 | ) | $ | 75 | ||||||||||
| NRG Yield LLC | Other Guarantor Subsidiaries | Non-Guarantor Subsidiaries | NRG Yield Operating LLC (Note Issuer) | Eliminations(a) | Consolidated | ||||||||||||||||||
| (In millions) | |||||||||||||||||||||||
| Operating Revenues | |||||||||||||||||||||||
| Total operating revenues | $ | — | $ | 16 | $ | 751 | $ | 1 | $ | (1 | ) | $ | 767 | ||||||||||
| Operating Costs and Expenses | |||||||||||||||||||||||
| Cost of operations | — | 10 | 229 | 1 | (1 | ) | 239 | ||||||||||||||||
| Depreciation and amortization | — | 3 | 238 | — | — | 241 | |||||||||||||||||
| General and administrative | — | — | — | 14 | — | 14 | |||||||||||||||||
| Acquisition-related transaction and integration costs | — | — | — | 2 | — | 2 | |||||||||||||||||
| Total operating costs and expenses | — | 13 | 467 | 17 | (1 | ) | 496 | ||||||||||||||||
| Operating Income (Loss) | — | 3 | 284 | (16 | ) | — | 271 | ||||||||||||||||
| Other Income (Expense) | |||||||||||||||||||||||
| Equity in earnings of consolidated affiliates | 165 | 6 | — | 153 | (324 | ) | — | ||||||||||||||||
| Equity in earnings of unconsolidated affiliates | — | 9 | 28 | 26 | — | 63 | |||||||||||||||||
| Other income, net | 1 | — | 2 | — | — | 3 | |||||||||||||||||
| Interest expense | — | — | (173 | ) | (54 | ) | — | (227 | ) | ||||||||||||||
| Total other income (expense), net | 166 | 15 | (143 | ) | 125 | (324 | ) | (161 | ) | ||||||||||||||
| Net Income | 166 | 18 | 141 | 109 | (324 | ) | 110 | ||||||||||||||||
| Less: Net loss attributable to noncontrolling interests | — | — | (3 | ) | (56 | ) | 3 | (56 | ) | ||||||||||||||
| Net Income Attributable to NRG Yield LLC | $ | 166 | $ | 18 | $ | 144 | $ | 165 | $ | (327 | ) | $ | 166 | ||||||||||
| NRG Yield LLC | Guarantor Subsidiaries | Non-Guarantor Subsidiaries | NRG Yield Operating LLC (Note Issuer) | Eliminations(a) | Consolidated | ||||||||||||||||||
| (In millions) | |||||||||||||||||||||||
| Net Income | $ | 75 | $ | 5 | $ | 50 | $ | 52 | $ | (130 | ) | $ | 52 | ||||||||||
| Other Comprehensive Income | |||||||||||||||||||||||
| Unrealized gain on derivatives | 7 | — | 7 | 7 | (14 | ) | 7 | ||||||||||||||||
| Other comprehensive income | 7 | — | 7 | 7 | (14 | ) | 7 | ||||||||||||||||
| Comprehensive Income | 82 | 5 | 57 | 59 | (144 | ) | 59 | ||||||||||||||||
| Less: Comprehensive loss attributable to noncontrolling interests | — | — | (1 | ) | (23 | ) | 1 | (23 | ) | ||||||||||||||
| Comprehensive Income Attributable to NRG Yield LLC | $ | 82 | $ | 5 | $ | 58 | $ | 82 | $ | (145 | ) | $ | 82 | ||||||||||
| NRG Yield LLC | Guarantor Subsidiaries | Non-Guarantor Subsidiaries | NRG Yield Operating LLC (Note Issuer) | Eliminations(a) | Consolidated | ||||||||||||||||||
| (In millions) | |||||||||||||||||||||||
| Net Income | $ | 166 | $ | 18 | $ | 141 | $ | 109 | $ | (324 | ) | $ | 110 | ||||||||||
| Other Comprehensive Income | |||||||||||||||||||||||
| Unrealized loss on derivatives | 7 | — | 7 | 7 | (14 | ) | 7 | ||||||||||||||||
| Other comprehensive loss | 7 | — | 7 | 7 | (14 | ) | 7 | ||||||||||||||||
| Comprehensive Income | 173 | 18 | 148 | 116 | (338 | ) | 117 | ||||||||||||||||
| Less: Comprehensive loss attributable to noncontrolling interests | — | — | (3 | ) | (56 | ) | 3 | (56 | ) | ||||||||||||||
| Comprehensive Income Attributable to NRG Yield LLC | $ | 173 | $ | 18 | $ | 151 | $ | 172 | $ | (341 | ) | $ | 173 | ||||||||||
| NRG Yield LLC | Other Guarantor Subsidiaries | Non-Guarantor Subsidiaries | NRG Yield Operating LLC (Note Issuer) | Eliminations(a) | Consolidated | |||||||||||||||||||
| ASSETS | (In millions) | |||||||||||||||||||||||
| Current Assets | ||||||||||||||||||||||||
| Cash and cash equivalents | $ | 76 | $ | — | $ | 102 | $ | — | $ | — | $ | 178 | ||||||||||||
| Restricted cash | — | — | 140 | — | — | 140 | ||||||||||||||||||
| Accounts receivable — trade | — | 3 | 123 | — | — | 126 | ||||||||||||||||||
| Accounts receivable — affiliate | 1 | — | — | — | — | 1 | ||||||||||||||||||
| Inventory | — | 1 | 37 | — | — | 38 | ||||||||||||||||||
| Notes receivable | — | — | 15 | — | — | 15 | ||||||||||||||||||
| Prepayments and other current assets | — | — | 22 | — | — | 22 | ||||||||||||||||||
| Total current assets | 77 | 4 | 439 | — | — | 520 | ||||||||||||||||||
| Net property, plant and equipment | — | 59 | 5,188 | — | — | 5,247 | ||||||||||||||||||
| Other Assets | ||||||||||||||||||||||||
| Investment in consolidated subsidiaries | 1,828 | 482 | — | 3,134 | (5,444 | ) | — | |||||||||||||||||
| Equity investments in affiliates | — | 210 | 598 | 375 | — | 1,183 | ||||||||||||||||||
| Intangible assets, net | — | 55 | 1,179 | — | — | 1,234 | ||||||||||||||||||
| Other non-current assets | — | — | 56 | — | — | 56 | ||||||||||||||||||
| Total other assets | 1,828 | 747 | 1,833 | 3,509 | (5,444 | ) | 2,473 | |||||||||||||||||
| Total Assets | $ | 1,905 | $ | 810 | $ | 7,460 | $ | 3,509 | $ | (5,444 | ) | $ | 8,240 | |||||||||||
| NRG Yield LLC | Other Guarantor Subsidiaries | Non-Guarantor Subsidiaries | NRG Yield Operating LLC (Note Issuer) | Eliminations(a) | Consolidated | |||||||||||||||||||
| LIABILITIES AND MEMBERS' EQUITY | (In millions) | |||||||||||||||||||||||
| Current Liabilities | ||||||||||||||||||||||||
| Current portion of long-term debt — external | $ | — | $ | — | $ | 300 | $ | — | $ | — | $ | 300 | ||||||||||||
| Accounts payable | — | 2 | 25 | — | — | 27 | ||||||||||||||||||
| Accounts payable — affiliate | — | 5 | 19 | 21 | — | 45 | ||||||||||||||||||
| Derivative instruments | — | — | 23 | — | — | 23 | ||||||||||||||||||
| Accrued expenses and other current liabilities | — | 1 | 80 | 13 | — | 94 | ||||||||||||||||||
| Total current liabilities | — | 8 | 447 | 34 | — | 489 | ||||||||||||||||||
| Other Liabilities | ||||||||||||||||||||||||
| Long-term debt — external | — | — | 4,074 | 840 | — | 4,914 | ||||||||||||||||||
| Long-term debt — affiliate | — | — | — | 618 | — | 618 | ||||||||||||||||||
| Accounts payable — affiliate | — | — | 3 | — | — | 3 | ||||||||||||||||||
| Derivative instruments | — | — | 43 | — | — | 43 | ||||||||||||||||||
| Other non-current liabilities | — | — | 79 | 8 | — | 87 | ||||||||||||||||||
| Total non-current liabilities | — | — | 4,199 | 1,466 | — | 5,665 | ||||||||||||||||||
| Total Liabilities | — | 8 | 4,646 | 1,500 | — | 6,154 | ||||||||||||||||||
| Commitments and Contingencies | ||||||||||||||||||||||||
| Members' Equity | ||||||||||||||||||||||||
| Contributed capital | 1,897 | 853 | 2,734 | 2,077 | (5,664 | ) | 1,897 | |||||||||||||||||
| Retained earnings (accumulated deficit) | 86 | (49 | ) | 100 | (171 | ) | 120 | 86 | ||||||||||||||||
| Accumulated other comprehensive loss | (78 | ) | (2 | ) | (80 | ) | (78 | ) | 160 | (78 | ) | |||||||||||||
| Noncontrolling interest | — | — | 60 | 181 | (60 | ) | 181 | |||||||||||||||||
| Total Members' Equity | 1,905 | 802 | 2,814 | 2,009 | (5,444 | ) | 2,086 | |||||||||||||||||
| Total Liabilities and Members’ Equity | $ | 1,905 | $ | 810 | $ | 7,460 | $ | 3,509 | $ | (5,444 | ) | $ | 8,240 | |||||||||||
| NRG Yield LLC | Other Guarantor Subsidiaries | Non-Guarantor Subsidiaries | NRG Yield Operating LLC (Note Issuer) | Consolidated | ||||||||||||||||
| (In millions) | ||||||||||||||||||||
| Net Cash Provided by (Used in) Operating Activities | $ | — | $ | 38 | $ | 414 | $ | (77 | ) | $ | 375 | |||||||||
| Cash Flows from Investing Activities | ||||||||||||||||||||
| Intercompany transactions between Yield LLC and subsidiaries | (13 | ) | — | — | 13 | — | ||||||||||||||
| Payments for the Drop Down Assets | — | — | — | (176 | ) | (176 | ) | |||||||||||||
| Capital expenditures | — | (3 | ) | (20 | ) | — | (23 | ) | ||||||||||||
| Cash receipts from notes receivable | — | — | 11 | — | 11 | |||||||||||||||
| Return of investment from unconsolidated affiliates | — | 7 | 9 | 16 | 32 | |||||||||||||||
| Net investments in unconsolidated affiliates | — | (41 | ) | (7 | ) | — | (48 | ) | ||||||||||||
| Net Cash Used in Investing Activities | (13 | ) | (37 | ) | (7 | ) | (147 | ) | (204 | ) | ||||||||||
| Cash Flows from Financing Activities | ||||||||||||||||||||
| Transfer of funds under intercompany cash management arrangement | (6 | ) | (1 | ) | — | 7 | — | |||||||||||||
| Net contributions from noncontrolling interests | — | — | — | 13 | 13 | |||||||||||||||
| Net distributions and return of capital to NRG prior to the acquisition of Drop Down Assets | — | — | (42 | ) | (7 | ) | (49 | ) | ||||||||||||
| (Payments of) proceeds from distributions | (149 | ) | — | (211 | ) | 211 | (149 | ) | ||||||||||||
| Payment of debt issuance costs | — | — | (4 | ) | — | (4 | ) | |||||||||||||
| Proceeds from Issuance of Class C units | 33 | — | — | — | 33 | |||||||||||||||
| Proceeds from the issuance of long-term debt — external | — | — | 41 | — | 41 | |||||||||||||||
| Payments for long-term debt | — | — | (224 | ) | — | (224 | ) | |||||||||||||
| Net Cash (Used in) Provided by Financing Activities | (122 | ) | (1 | ) | (440 | ) | 224 | (339 | ) | |||||||||||
| Net Decrease in Cash, Cash Equivalents and Restricted Cash | (135 | ) | — | (33 | ) | — | (168 | ) | ||||||||||||
| Cash, Cash Equivalents and Restricted Cash at Beginning of Period | 211 | — | 275 | — | 486 | |||||||||||||||
| Cash, Cash Equivalents and Restricted Cash at End of Period | $ | 76 | $ | — | $ | 242 | $ | — | $ | 318 | ||||||||||
NRG Yield LLC (a) | Other Guarantor Subsidiaries | Non-Guarantor Subsidiaries (a) | NRG Yield Operating LLC (Note Issuer) (a) | Eliminations (b) | Consolidated (a) | ||||||||||||||||||
| (In millions) | |||||||||||||||||||||||
| Operating Revenues | |||||||||||||||||||||||
| Total operating revenues | $ | — | $ | 7 | $ | 265 | $ | — | $ | — | $ | 272 | |||||||||||
| Operating Costs and Expenses | |||||||||||||||||||||||
| Cost of operations | — | 3 | 73 | — | — | 76 | |||||||||||||||||
| Depreciation and amortization | — | 2 | 73 | — | — | 75 | |||||||||||||||||
| General and administrative | — | — | — | 3 | — | 3 | |||||||||||||||||
| Total operating costs and expenses | — | 5 | 146 | 3 | — | 154 | |||||||||||||||||
| Operating Income (Loss) | — | 2 | 119 | (3 | ) | — | 118 | ||||||||||||||||
| Other Income (Expense) | |||||||||||||||||||||||
| Equity in earnings of consolidated affiliates | 105 | 4 | — | 73 | (182 | ) | — | ||||||||||||||||
| Equity in earnings of unconsolidated affiliates | — | (1 | ) | 3 | 14 | — | 16 | ||||||||||||||||
| Other income, net | — | — | 1 | — | — | 1 | |||||||||||||||||
| Interest expense | — | — | (51 | ) | (17 | ) | — | (68 | ) | ||||||||||||||
| Total other income (expense), net | 105 | 3 | (47 | ) | 70 | (182 | ) | (51 | ) | ||||||||||||||
| Net Income | 105 | 5 | 72 | 67 | (182 | ) | 67 | ||||||||||||||||
| Less: Net loss attributable to noncontrolling interests | — | — | (1 | ) | (38 | ) | 1 | (38 | ) | ||||||||||||||
| Net Income Attributable to NRG Yield LLC | $ | 105 | $ | 5 | $ | 73 | $ | 105 | $ | (183 | ) | $ | 105 | ||||||||||
NRG Yield LLC (a) | Other Guarantor Subsidiaries | Non-Guarantor Subsidiaries (a) | NRG Yield Operating LLC (Note Issuer) (a) | Eliminations (b) | Consolidated (a) | ||||||||||||||||||
| (In millions) | |||||||||||||||||||||||
| Operating Revenues | |||||||||||||||||||||||
| Total operating revenues | $ | — | $ | 17 | $ | 772 | $ | — | $ | — | $ | 789 | |||||||||||
| Operating Costs and Expenses | |||||||||||||||||||||||
| Cost of operations | — | 10 | 228 | — | — | 238 | |||||||||||||||||
| Depreciation and amortization | — | 4 | 220 | — | — | 224 | |||||||||||||||||
| General and administrative | — | — | — | 8 | — | 8 | |||||||||||||||||
| Total operating costs and expenses | — | 14 | 448 | 8 | — | 470 | |||||||||||||||||
| Operating Income (Loss) | — | 3 | 324 | (8 | ) | — | 319 | ||||||||||||||||
| Other Income (Expense) | |||||||||||||||||||||||
| Equity in income of consolidated affiliates | 219 | 21 | — | 184 | (424 | ) | — | ||||||||||||||||
| Equity in earnings of unconsolidated affiliates | — | 7 | 3 | 24 | — | 34 | |||||||||||||||||
| Other income, net | — | — | 3 | — | — | 3 | |||||||||||||||||
| Interest expense | — | — | (156 | ) | (48 | ) | — | (204 | ) | ||||||||||||||
| Total other income (expense), net | 219 | 28 | (150 | ) | 160 | (424 | ) | (167 | ) | ||||||||||||||
| Net Income | 219 | 31 | 174 | 152 | (424 | ) | 152 | ||||||||||||||||
| Less: Net loss attributable to noncontrolling interests | — | — | (1 | ) | (67 | ) | 1 | (67 | ) | ||||||||||||||
| Net Income Attributable to NRG Yield LLC | $ | 219 | $ | 31 | $ | 175 | $ | 219 | $ | (425 | ) | $ | 219 | ||||||||||
NRG Yield LLC (a) | Other Guarantor Subsidiaries | Non-Guarantor Subsidiaries (a) | NRG Yield Operating LLC (Note Issuer) (a) | Eliminations (b) | Consolidated (a) | ||||||||||||||||||
| (In millions) | |||||||||||||||||||||||
| Net Income | $ | 105 | $ | 5 | $ | 72 | $ | 67 | $ | (182 | ) | $ | 67 | ||||||||||
| Other Comprehensive Income | |||||||||||||||||||||||
| Unrealized gain on derivatives | 11 | — | 19 | 20 | (30 | ) | 20 | ||||||||||||||||
| Other comprehensive income | 11 | — | 19 | 20 | (30 | ) | 20 | ||||||||||||||||
| Comprehensive Income | 116 | 5 | 91 | 87 | (212 | ) | 87 | ||||||||||||||||
| Less: Comprehensive loss attributable to noncontrolling interests | — | — | (1 | ) | (30 | ) | 1 | (30 | ) | ||||||||||||||
| Comprehensive Income Attributable to NRG Yield LLC | $ | 116 | $ | 5 | $ | 92 | $ | 117 | $ | (213 | ) | $ | 117 | ||||||||||
NRG Yield LLC (a) | Other Guarantor Subsidiaries | Non-Guarantor Subsidiaries (a) | NRG Yield Operating LLC (Note Issuer) (a) | Eliminations (b) | Consolidated (a) | ||||||||||||||||||
| (In millions) | |||||||||||||||||||||||
| Net Income | $ | 219 | $ | 31 | $ | 174 | $ | 152 | $ | (424 | ) | $ | 152 | ||||||||||
| Other Comprehensive Loss | |||||||||||||||||||||||
| Unrealized loss on derivatives | (49 | ) | — | (45 | ) | (49 | ) | 94 | (49 | ) | |||||||||||||
| Other comprehensive loss | (49 | ) | — | (45 | ) | (49 | ) | 94 | (49 | ) | |||||||||||||
| Comprehensive Income | 170 | 31 | 129 | 103 | (330 | ) | 103 | ||||||||||||||||
| Less: Comprehensive loss attributable to noncontrolling interests | — | — | (1 | ) | (67 | ) | 1 | (67 | ) | ||||||||||||||
| Comprehensive Income Attributable to NRG Yield LLC | $ | 170 | $ | 31 | $ | 130 | $ | 170 | $ | (331 | ) | $ | 170 | ||||||||||
NRG Yield LLC(a) | Other Guarantor Subsidiaries | Non-Guarantor Subsidiaries(a) | NRG Yield Operating LLC (Note Issuer)(a) | Eliminations (b) | Consolidated(a) | |||||||||||||||||||
| ASSETS | (In millions) | |||||||||||||||||||||||
| Current Assets | ||||||||||||||||||||||||
| Cash and cash equivalents | $ | 211 | $ | — | $ | 110 | $ | — | $ | — | $ | 321 | ||||||||||||
| Restricted cash | — | — | 165 | — | — | 165 | ||||||||||||||||||
| Accounts receivable — trade | — | 2 | 90 | — | — | 92 | ||||||||||||||||||
| Accounts receivable — affiliate | — | — | 1 | — | — | 1 | ||||||||||||||||||
| Inventory | — | 2 | 37 | — | — | 39 | ||||||||||||||||||
| Derivative instruments | — | — | 2 | — | — | 2 | ||||||||||||||||||
| Notes receivable | — | — | 16 | — | — | 16 | ||||||||||||||||||
| Prepayments and other current assets | — | — | 19 | 1 | — | 20 | ||||||||||||||||||
| Total current assets | 211 | 4 | 440 | 1 | — | 656 | ||||||||||||||||||
| Net property, plant and equipment | — | 59 | 5,401 | — | — | 5,460 | ||||||||||||||||||
| Other Assets | ||||||||||||||||||||||||
| Investment in consolidated subsidiaries | 1,867 | 527 | — | 3,212 | (5,606 | ) | — | |||||||||||||||||
| Equity investments in affiliates | — | 171 | 600 | 381 | — | 1,152 | ||||||||||||||||||
| Intangible assets, net | — | 56 | 1,230 | — | — | 1,286 | ||||||||||||||||||
| Derivative instruments | — | — | 1 | — | — | 1 | ||||||||||||||||||
| Other non-current assets | — | — | 64 | 1 | — | 65 | ||||||||||||||||||
| Total other assets | 1,867 | 754 | 1,895 | 3,594 | (5,606 | ) | 2,504 | |||||||||||||||||
| Total Assets | $ | 2,078 | $ | 817 | $ | 7,736 | $ | 3,595 | $ | (5,606 | ) | $ | 8,620 | |||||||||||
NRG Yield LLC(a) | Other Guarantor Subsidiaries | Non-Guarantor Subsidiaries(a) | NRG Yield Operating LLC (Note Issuer)(a) | Eliminations (b) | Consolidated(a) | |||||||||||||||||||
| LIABILITIES AND MEMBERS' EQUITY | (In millions) | |||||||||||||||||||||||
| Current Liabilities | ||||||||||||||||||||||||
| Current portion of long-term debt — external | $ | — | $ | — | $ | 291 | $ | — | $ | — | $ | 291 | ||||||||||||
| Accounts payable | — | 2 | 18 | 3 | — | 23 | ||||||||||||||||||
| Accounts payable — affiliate | — | 7 | 15 | 18 | — | 40 | ||||||||||||||||||
| Derivative instruments | — | — | 32 | — | — | 32 | ||||||||||||||||||
| Accrued expenses and other current liabilities | — | 1 | 60 | 24 | — | 85 | ||||||||||||||||||
| Total current liabilities | — | 10 | 416 | 45 | — | 471 | ||||||||||||||||||
| Other Liabilities | ||||||||||||||||||||||||
| Long-term debt — external | — | — | 4,259 | 839 | — | 5,098 | ||||||||||||||||||
| Long-term debt — affiliate | — | — | — | 618 | — | 618 | ||||||||||||||||||
| Accounts payable — affiliate | — | — | 9 | — | — | 9 | ||||||||||||||||||
| Derivative instruments | — | — | 44 | — | — | 44 | ||||||||||||||||||
| Other non-current liabilities | — | — | 76 | — | — | 76 | ||||||||||||||||||
| Total non-current liabilities | — | — | 4,388 | 1,457 | — | 5,845 | ||||||||||||||||||
| Total Liabilities | — | 10 | 4,804 | 1,502 | — | 6,316 | ||||||||||||||||||
| Commitments and Contingencies | ||||||||||||||||||||||||
| Members' Equity | ||||||||||||||||||||||||
| Contributed capital | 2,127 | 874 | 2,920 | 2,103 | (5,897 | ) | 2,127 | |||||||||||||||||
| Retained earnings (Accumulated deficit) | 36 | (65 | ) | 35 | (151 | ) | 181 | 36 | ||||||||||||||||
| Accumulated other comprehensive loss | (85 | ) | (2 | ) | (87 | ) | (85 | ) | 174 | (85 | ) | |||||||||||||
| Noncontrolling Interest | — | — | 64 | 226 | (64 | ) | 226 | |||||||||||||||||
| Total Members' Equity | 2,078 | 807 | 2,932 | 2,093 | (5,606 | ) | 2,304 | |||||||||||||||||
| Total Liabilities and Members’ Equity | $ | 2,078 | $ | 817 | $ | 7,736 | $ | 3,595 | $ | (5,606 | ) | $ | 8,620 | |||||||||||
NRG Yield LLC (a) | Other Guarantor Subsidiaries | Non-Guarantor Subsidiaries (a) | NRG Yield Operating LLC (Note Issuer) | Consolidated (a) | ||||||||||||||||
| (In millions) | ||||||||||||||||||||
| Net Cash Provided by Operating Activities | $ | — | $ | 45 | $ | 365 | $ | 34 | $ | 444 | ||||||||||
| Cash Flows from Investing Activities | ||||||||||||||||||||
| Intercompany transactions from Yield LLC to subsidiaries | 145 | — | — | (145 | ) | — | ||||||||||||||
| Acquisition of Drop Down Assets, net of cash acquired | — | — | — | (77 | ) | (77 | ) | |||||||||||||
| Capital expenditures | — | — | (16 | ) | — | (16 | ) | |||||||||||||
| Cash receipts from notes receivable | — | — | 11 | — | 11 | |||||||||||||||
| Return of investment from unconsolidated affiliates | — | 3 | — | 13 | 16 | |||||||||||||||
| Net investments in unconsolidated affiliates | — | (48 | ) | — | (21 | ) | (69 | ) | ||||||||||||
| Net Cash Provided by (Used in) Investing Activities | 145 | (45 | ) | (5 | ) | (230 | ) | (135 | ) | |||||||||||
| Cash Flows from Financing Activities | ||||||||||||||||||||
| Transfer of funds under intercompany cash management arrangement | 54 | — | — | (54 | ) | — | ||||||||||||||
| Net contributions from noncontrolling interests | — | — | — | 7 | 7 | |||||||||||||||
| Net distributions and return of capital to NRG prior to the acquisition of Drop Down Assets | — | — | (126 | ) | — | (126 | ) | |||||||||||||
| (Payments of) proceeds from distributions | (127 | ) | — | (204 | ) | 204 | (127 | ) | ||||||||||||
| Payment of debt issuance costs | — | — | (1 | ) | (5 | ) | (6 | ) | ||||||||||||
| Proceeds from the revolving credit facility | — | — | — | 60 | 60 | |||||||||||||||
| Payments for the revolving credit facility | — | — | — | (366 | ) | (366 | ) | |||||||||||||
| Proceeds from the issuance of long-term debt - external | — | — | 200 | 350 | 550 | |||||||||||||||
| Payments for long-term debt | — | — | (204 | ) | — | (204 | ) | |||||||||||||
| Net Cash (Used in) Provided by Financing Activities | (73 | ) | — | (335 | ) | 196 | (212 | ) | ||||||||||||
| Net (Decrease) Increase in Cash, Cash Equivalents and Restricted Cash | 72 | — | 25 | — | 97 | |||||||||||||||
| Cash, Cash Equivalents and Restricted Cash at Beginning of Period | 15 | — | 226 | — | 241 | |||||||||||||||
| Cash, Cash Equivalents and Restricted Cash at End of Period | $ | 87 | $ | — | $ | 251 | $ | — | $ | 338 | ||||||||||
This note should be read in conjunction with the complete description under Item 15 — Note 14, Commitments and Contingencies, to the Company's 2016consolidated financial statements included in the Company’s 2022 Form 10-K.
The Company'sCompany’s material legal proceedings areproceeding is described below. The Company believes that it has a valid defensesdefense to thesethis legal proceedingsproceeding and intends to defend themit vigorously. The Company records reserves for estimated losses from contingencies when information available indicates that a loss is probable and the amount of the loss, or range of loss, can be reasonably estimated. As applicable, the Company has established an adequate reserve for the mattersmatter discussed below. In addition, legal costs are expensed as incurred. Management assesses such matters based on current information and makes a judgment concerning its potential outcome, considering the nature of the claim, the amount and nature of damages sought, and the probability of success. The Company is unable to predict the outcome of the legal proceedingsproceeding below or reasonably estimate the scope or amount of any associated costs and potential liabilities. As additional information becomes available, management adjusts its assessment and estimatesestimate of such contingenciescontingency accordingly. Because litigation is subject to inherent uncertainties and unfavorable rulings or developments, it is possible that the ultimate resolution of the Company'sCompany’s liabilities and contingencies could be at amounts that are different from its currently recorded reserves and that such difference could be material.
In addition to the legal proceedingsproceeding noted below, the Company and its subsidiaries are party to other litigation or legal proceedings arising in the ordinary course of business. In management'smanagement’s opinion, the disposition of these ordinary course matters will not materially adversely affect the Company'sCompany’s consolidated financial position, results of operations, or cash flows.
On April 19, 2016, plaintiffsOctober 8, 2019, the City of Georgetown, Texas, or Georgetown, filed a putative class action lawsuit against NRG Yield, Inc.,petition in the currentDistrict Court of Williamson County, Texas naming Buckthorn Westex, LLC, the Company’s subsidiary that owns the Buckthorn Westex solar project, as the defendant, alleging fraud by nondisclosure and former membersbreach of its board of directors individually,contract in connection with the project and other parties in California Superior Court in Kern County, CA. Plaintiffs allege various violationsthe PPA, and seeking (i) rescission and/or cancellation of the Securities ActPPA, (ii) declaratory judgment that the alleged breaches constitute an event of default under the PPA entitling Georgetown to terminate, and (iii) recovery of all damages, costs of court, and attorneys’ fees. On November 15, 2019, Buckthorn Westex filed an original answer and counterclaims (i) denying Georgetown’s claims, (ii) alleging Georgetown has breached its contracts with Buckthorn Westex by failing to pay amounts due, toand (iii) seeking relief in the defendants’form of (x) declaratory judgment that Georgetown’s alleged failure to disclose material facts related to low wind production prior to NRG Yield, Inc.'s June 22, 2015 Class C common stock offering. Plaintiffs seek compensatory damages, rescission, attorney’spay amounts due constitute breaches of and an event of default under the PPA and that Buckthorn did not commit any events of default under the PPA, (y) recovery of costs, expenses, interest, and attorneys’ fees, and costs. The defendants(z) such other relief to which it is entitled at law or in equity. In response to motions for partial summary judgment filed demurrers and a motion challenging jurisdiction on October 18, 2016. On October 26, 2017,by each party, the court approved the parties' stipulation which provides the plaintiffs' opposition is due on December 6, 2017 and the defendants' reply is due on February 8, 2018.
PPA.
31
ITEM 2 — Management'sManagement’s Discussion and Analysis of Financial Condition and the Results of Operations
The following discussion analyzes the Company'sCompany’s historical financial condition and results of operations, which were recast to include the effect of the August 2017 Drop Down Assets and the March 2017 Drop Down Assets.operations.
As you read this discussion and analysis, refer to the Company's Consolidated Financial StatementsCompany’s consolidated financial statements to this Form 10-Q, which present the results of operations for the three and ninesix months ended SeptemberJune 30, 2017,2023 and 2016.2022. Also refer to the Company's May 9, 2017Company’s 2022 Form 8-K,10-K, which includes detailed discussions of various items impacting the Company'sCompany’s business, results of operations and financial condition.
The discussion and analysis below has been organized as follows:
•Executive Summary, including a description of the business and significant events that are important to understanding the results of operations and financial condition;
•Results of operations, including an explanation of significant differences between the periods in the specific line items of the consolidated statements of income;
•Financial condition addressing liquidity position, sources and uses of cash, capital resources and requirements, commitments and off-balance sheet arrangements;
•Known trends that may affect the Company’s results of operations and financial condition in the future; and
•Critical accounting policies which are most important to both the portrayal of the Company'sCompany’s financial condition and results of operations, and which require management's most difficult, subjective or complex judgment.
32
Executive Summary
Introduction and Overview
The Company owns a diversified portfoliois one of contractedthe largest renewable and conventional generation and thermal infrastructure assetsenergy owners in the U.S. with over 5,500 net MW of installed wind and solar generation projects. The Company’s contracted generation portfolio collectively represents 5,080over 8,000 net MW as of September 30, 2017. Eachassets also includes approximately 2,500 net MW of environmentally-sound, highly efficient natural gas-fired generation facilities. Through this environmentally-sound, diversified and primarily contracted portfolio, the Company endeavors to increase distributions to its unit holders. The majority of the Company’s revenues are derived from long-term contractual arrangements for the output or capacity from these assets sells substantially all of its output pursuant to long-term offtake agreements with creditworthy counterparties.assets. The weighted average remaining contract duration of these offtake agreements was approximately 16 10 years as of SeptemberJune 30, 2017, 2023based on CAFD. The Company also owns thermal infrastructureCAFD.
As of June 30, 2023, the Company’s operating assets with an aggregate steam and chilled waterare comprised of the following projects:
| Projects | Percentage Ownership | Net Capacity (MW) (a) | Counterparty | Expiration | ||||||||||||||||||||||||||||
| Conventional | ||||||||||||||||||||||||||||||||
| Carlsbad | 100 | % | 527 | San Diego Gas & Electric | 2038 | |||||||||||||||||||||||||||
| El Segundo | 100 | % | 550 | SCE | 2023 - 2026 | |||||||||||||||||||||||||||
| GenConn Devon | 50 | % | 95 | Connecticut Light & Power | 2040 | |||||||||||||||||||||||||||
| GenConn Middletown | 50 | % | 95 | Connecticut Light & Power | 2041 | |||||||||||||||||||||||||||
| Marsh Landing | 100 | % | 720 | Various | 2023 - 2030 | |||||||||||||||||||||||||||
| Walnut Creek | 100 | % | 485 | SCE | 2023 - 2026 | |||||||||||||||||||||||||||
| Total Conventional | 2,472 | |||||||||||||||||||||||||||||||
| Utility Scale Solar | ||||||||||||||||||||||||||||||||
| Agua Caliente | 51 | % | 148 | PG&E | 2039 | |||||||||||||||||||||||||||
| Alpine | 100 | % | 66 | PG&E | 2033 | |||||||||||||||||||||||||||
| Avenal | 50 | % | 23 | PG&E | 2031 | |||||||||||||||||||||||||||
| Avra Valley | 100 | % | 27 | Tucson Electric Power | 2032 | |||||||||||||||||||||||||||
| Blythe | 100 | % | 21 | SCE | 2029 | |||||||||||||||||||||||||||
| Borrego | 100 | % | 26 | San Diego Gas and Electric | 2038 | |||||||||||||||||||||||||||
Buckthorn Solar (b) | 100 | % | 150 | City of Georgetown, TX | 2043 | |||||||||||||||||||||||||||
| CVSR | 100 | % | 250 | PG&E | 2038 | |||||||||||||||||||||||||||
| Desert Sunlight 250 | 25 | % | 63 | SCE | 2034 | |||||||||||||||||||||||||||
| Desert Sunlight 300 | 25 | % | 75 | PG&E | 2039 | |||||||||||||||||||||||||||
| Kansas South | 100 | % | 20 | PG&E | 2033 | |||||||||||||||||||||||||||
Mililani I (b) (c) | 50 | % | 20 | Hawaiian Electric Company | 2042 | |||||||||||||||||||||||||||
Oahu Solar Projects (b) | 100 | % | 61 | Hawaiian Electric Company | 2041 | |||||||||||||||||||||||||||
| Roadrunner | 100 | % | 20 | El Paso Electric | 2031 | |||||||||||||||||||||||||||
Rosamond Central (b) | 50 | % | 96 | Various | 2035 - 2047 | |||||||||||||||||||||||||||
| TA High Desert | 100 | % | 20 | SCE | 2033 | |||||||||||||||||||||||||||
| Utah Solar Portfolio | 100 | % | 530 | PacifiCorp | 2036 | |||||||||||||||||||||||||||
Waiawa (b) (c) | 50 | % | 36 | Hawaiian Electric Company | 2043 | |||||||||||||||||||||||||||
Total Utility Scale Solar (d) | 1,652 | |||||||||||||||||||||||||||||||
| Distributed Solar | ||||||||||||||||||||||||||||||||
DGPV Fund Projects (b) | 100 | % | 286 | Various | 2030 - 2044 | |||||||||||||||||||||||||||
| Solar Power Partners (SPP) Projects | 100 | % | 25 | Various | 2026 - 2037 | |||||||||||||||||||||||||||
| Other DG Projects | 100 | % | 21 | Various | 2023 - 2039 | |||||||||||||||||||||||||||
Total Distributed Solar (d) | 332 | |||||||||||||||||||||||||||||||
33
| Projects | Percentage Ownership | Net Capacity (MW) (a) | Counterparty | Expiration | ||||||||||||||||||||||||||||
| Wind | ||||||||||||||||||||||||||||||||
| Alta I | 100 | % | 150 | SCE | 2035 | |||||||||||||||||||||||||||
| Alta II | 100 | % | 150 | SCE | 2035 | |||||||||||||||||||||||||||
| Alta III | 100 | % | 150 | SCE | 2035 | |||||||||||||||||||||||||||
| Alta IV | 100 | % | 102 | SCE | 2035 | |||||||||||||||||||||||||||
| Alta V | 100 | % | 168 | SCE | 2035 | |||||||||||||||||||||||||||
Alta X (b) | 100 | % | 137 | SCE | 2038 | |||||||||||||||||||||||||||
Alta XI (b) | 100 | % | 90 | SCE | 2038 | |||||||||||||||||||||||||||
Black Rock (b) | 50 | % | 58 | Toyota and AEP | 2036 | |||||||||||||||||||||||||||
| Buffalo Bear | 100 | % | 19 | Western Farmers Electric Co-operative | 2033 | |||||||||||||||||||||||||||
| Capistrano Wind Portfolio | 100 | % | 413 | Various | 2030 - 2033 | |||||||||||||||||||||||||||
Elbow Creek (b) | 100 | % | 122 | Various | 2029 | |||||||||||||||||||||||||||
| Elkhorn Ridge | 66.7 | % | 54 | Nebraska Public Power District | 2029 | |||||||||||||||||||||||||||
| Forward | 100 | % | 29 | Constellation NewEnergy, Inc. | 2025 | |||||||||||||||||||||||||||
| Goat Wind | 100 | % | 150 | Dow Pipeline Company | 2025 | |||||||||||||||||||||||||||
Langford (b) | 100 | % | 160 | Goldman Sachs | 2033 | |||||||||||||||||||||||||||
| Laredo Ridge | 100 | % | 81 | Nebraska Public Power District | 2031 | |||||||||||||||||||||||||||
| Lookout | 100 | % | 38 | Southern Maryland Electric Cooperative | 2030 | |||||||||||||||||||||||||||
Mesquite Sky (b) | 50 | % | 170 | Various | 2033 - 2036 | |||||||||||||||||||||||||||
Mesquite Star (b) | 50 | % | 210 | Various | 2032 - 2035 | |||||||||||||||||||||||||||
| Mt. Storm | 100 | % | 264 | Citigroup | 2031 | |||||||||||||||||||||||||||
| Ocotillo | 100 | % | 55 | N/A | ||||||||||||||||||||||||||||
| Odin | 99.9 | % | 21 | Missouri River Energy Services | 2028 | |||||||||||||||||||||||||||
Pinnacle (b) | 100 | % | 54 | Maryland Department of General Services and University System of Maryland | 2031 | |||||||||||||||||||||||||||
Rattlesnake (b) (e) | 100 | % | 160 | Avista Corporation | 2040 | |||||||||||||||||||||||||||
| San Juan Mesa | 75 | % | 90 | Southwestern Public Service Company | 2025 | |||||||||||||||||||||||||||
| Sleeping Bear | 100 | % | 95 | Public Service Company of Oklahoma | 2032 | |||||||||||||||||||||||||||
| South Trent | 100 | % | 101 | AEP Energy Partners | 2029 | |||||||||||||||||||||||||||
| Spanish Fork | 100 | % | 19 | PacifiCorp | 2028 | |||||||||||||||||||||||||||
Spring Canyon II (b) | 90.1 | % | 31 | Platte River Power Authority | 2039 | |||||||||||||||||||||||||||
Spring Canyon III (b) | 90.1 | % | 26 | Platte River Power Authority | 2039 | |||||||||||||||||||||||||||
| Taloga | 100 | % | 130 | Oklahoma Gas & Electric | 2031 | |||||||||||||||||||||||||||
Wildorado (b) | 100 | % | 161 | Southwestern Public Service Company | 2027 | |||||||||||||||||||||||||||
Total Wind (d) | 3,658 | |||||||||||||||||||||||||||||||
| Total net generation capacity | 8,114 | |||||||||||||||||||||||||||||||
(a) Net capacity represents the maximum, or rated, generating capacity of 1,319 net MWtthe facility multiplied by the Company’s percentage ownership in the facility as of June 30, 2023.
(b) Projects are part of tax equity arrangements and electric generationownership percentage is based on cash to be distributed, as further described in Note 4, Investments Accounted for by the Equity Method and Variable Interest Entities.
(c)Includes storage capacity that matches the facility’s rated generating capacity.
(d)Typical average capacity factors are 25% for solar facilities and 25-45% for wind facilities. For the six months ended June 30, 2023, the Company's solar and wind facilities had weighted-average capacity factors of 27% and 31%, respectively. For the six months ended June 30, 2022, the Company’s solar and wind facilities had weighted-average capacity factors of 30% and 35%, respectively. The weight-average capacity factors can vary based on seasonality and weather conditions.
(e)Rattlesnake has a deliverable capacity of 123 net144 MW. These thermal infrastructure assets provide steam, hot water and/or chilled water, and in some instances electricity, to commercial businesses, universities, hospitals and governmental units in multiple locations, principally through long-term contracts or pursuant to rates regulated by state utility commissions.
34
Significant Events
Drop Down Transactions
•On July 12, 2017, NRG announced that it had adopted and initiated a three-year, three-part improvement plan, or the NRG Transformation Plan. As part of the NRG Transformation Plan, NRG announced that it is exploring strategic alternatives for its renewables platform and its interest in the Company. NRG, through its holdings of Class B common stock and Class D common stock, has a 55.1% voting interest in Yield, Inc. and receives distributions fromJune 30, 2023, the Company, through its ownership ofindirect subsidiary, Rosie Class B unitsLLC, the indirect owner of the Rosamond Central solar project, became the owner of the Class B membership interests of Rosie Central BESS in order to facilitate and fund the construction of a 147 MW BESS project that will be co-located at the Rosamond Central solar facility. Clearway Renew indirectly owns the Class D units. NRG stated that the strategic alternatives span a varietyA membership interests. The Company’s investment consists of ownership structures and partnership types, including the potential partial or full monetization of NRG's renewables platform and NRG's interest in the Company. NRG is Yield, Inc.'s controlling stockholder and$10 million contributed into Rosie Central BESS, funded through contributions from the Company has been highly dependentand its cash equity investor in Rosie TargetCo LLC, which consolidates Rosie Class B LLC. On July 3, 2023, Rosie Class B LLC contributed an additional $20 million into Rosie Central BESS. Additionally, on NRG for, among other things, growth opportunities and management and administration services. See Part I, Item 1A, Risk Factors in the Company's 2016 Form 10-K as well as Part II, Item 1A, Risk Factors in the Company's Form 10-Q for the quarter ended June 30, 2017,2023, Rosamond Central entered into an asset purchase agreement with Rosie Central BESS to acquire the BESS project assets at mechanical completion for risks related toa purchase price of $360 million, of which $72 million is payable at mechanical completion with the NRG Transformation Plan and the Company's relationship with NRG.
remaining $288 million payable at substantial completion. The Company’s regulatory matters are described in the Company’s 2016 Form 10-K in Item 1, Business — Regulatory Matters and Item 1A, Risk Factors.
•On May 19, 2023, the Company, through an indirect subsidiary, entered into an agreement with Clearway Renew to acquire Cedar Creek Holdco LLC, which is the indirect owner of the Cedar Creek wind project, a 160 MW project located in Bingham County, Idaho, for $107 million in cash, subject to regulation by various federal and state government agencies. These include FERC andcustomary working capital adjustments. Upon the PUCT, as well as other public utility commissions in certain states where the Company's assets are located. Eachclosing of the Company's U.S. generating facilities qualifies astransaction, the Company will indirectly own all of the Class B membership interests in Cedar Creek TE Holdco LLC, a EWG or QF. In addition,tax equity fund which will consolidate the CompanyCedar Creek wind project, while a tax equity investor will own all of the Class A membership interests. The consummation of the transaction is subject to customary closing conditions and certain third-party approvals and is expected in the market rules, proceduresfirst half of 2024.
•On May 3, 2023, the Company entered into an agreement with Clearway Renew to repower the Cedro Hill wind project, which is included in the Capistrano Wind Portfolio and protocolsis located in Bruni, Texas. The Company expects to invest approximately $63 million in net corporate capital, subject to closing adjustments. Contingent upon achieving repowering commercial operations in the second half of 2024, the 160 MW project will sell power to its existing counterparty, an investment-grade utility, for an additional 15 years ending in 2045 under an amended PPA.
•On February 17, 2023, the Company, through its indirect subsidiary, Daggett Solar Investment LLC, acquired the Class A membership interests in Daggett TargetCo LLC, the indirect owner of the various ISODaggett 3 solar project, a 300 MW solar project with matching storage capacity that is currently under construction, located in San Bernardino, California from Clearway Renew for cash consideration of $21 million. Simultaneously, a cash equity investor acquired the Class B membership interests in Daggett TargetCo LLC from Clearway Renew for cash consideration of $129 million. The Company and RTO markets in which it participates. Likewise,the cash equity investor then contributed their Class A and B membership interests, respectively, into Daggett Renewable Holdco LLC, a partnership between the Company must also complyand the cash equity investor, which consolidates Daggett TargetCo LLC. Daggett TargetCo LLC consolidates, as the indirect owner of the primary beneficiary, a tax equity fund, Daggett TE Holdco LLC, which owns the Daggett 3 solar project. See Note 3, Acquisitions and Dispositions, for further discussion of the transaction.
Corporate Financing Activities
•On March 15, 2023, Clearway Energy Operating LLC refinanced the Amended and Restated Credit Agreement. See Note 7, Long-term Debt, for further discussion of the amendment.
Project-level Financing Activities
•In connection with the mandatory reliability requirements imposed by NERC2022 Drop Down of Waiawa and the regional reliability entities2023 Drop Down of Daggett 3, the Company assumed non-recourse project-level debt. See Note 7, Long-term Debt, for further discussion of the non-recourse project-level debt associated with each project.
•On June 30, 2023, Rosie Class B LLC amended its financing agreement. On July 3, 2023, the Company received total loan proceeds of $138 million under the refinancing. Also on July 3, 2023, Rosie Class B LLC issued a loan to a consolidated subsidiary of Clearway Renew in the regions whereaggregate principal amount of $117 million in order to finance the Company operates.construction of the BESS project. See Note 7, Long-term Debt, for further discussion of the project financing activities.
35
Environmental Matters
The Company is subject to a wide range of environmental laws induring the development, construction, ownership and operation of projects.facilities. These existing and future laws generally require that governmental permits and approvals be obtained before construction and maintained during operation of facilities. The Company is also subjectobligated to comply with all environmental laws regardingand regulations applicable within each jurisdiction and required to implement environmental programs and procedures to monitor and control risks associated with the protectionconstruction, operation and decommissioning of wildlife, including migratory birds, eagles, threatened and endangered species.regulated or permitted energy assets. Federal and state environmental laws have historically become more stringent over time, although this trend could slow or pausechange in the near term with respect to federal laws under the current U.S. presidential administration.future.
The Company’s trendsenvironmental matters are further described in the Company’s 2022 Form 10-K in Item 1, Business — Environmental Matters and Item 1A, Risk Factors.
Regulatory Matters
The Company’s regulatory matters are described in the Company’s May 9, 20172022 Form 8-K10-K in Item 7, Management’s Discussion1, Business — Regulatory Matters and Analysis of Financial Condition and Results of Operations - Trends Affecting Results of Operations and Future Business Performance.Item 1A, Risk Factors.
36
Consolidated Results of Operations
The following table provides selected financial information:
| Three months ended September 30, | Nine months ended September 30, | Three months ended June 30, | Six months ended June 30, | |||||||||||||||||||||||||||||||||||||||||||||||||||||||
| (In millions) | 2017 | 2016 | Change | 2017 | 2016 | Change | (In millions) | 2023 | 2022 | Change | 2023 | 2022 | Change | |||||||||||||||||||||||||||||||||||||||||||||
| Operating Revenues | Operating Revenues | |||||||||||||||||||||||||||||||||||||||||||||||||||||||||
| Energy and capacity revenues | $ | 283 | $ | 289 | $ | (6 | ) | $ | 819 | $ | 840 | $ | (21 | ) | Energy and capacity revenues | $ | 379 | $ | 431 | $ | (52) | $ | 683 | $ | 791 | $ | (108) | |||||||||||||||||||||||||||||||
| Other revenue | Other revenue | 48 | 30 | 18 | 60 | 52 | 8 | |||||||||||||||||||||||||||||||||||||||||||||||||||
| Contract amortization | (18 | ) | (17 | ) | (1 | ) | (52 | ) | (51 | ) | (1 | ) | Contract amortization | (47) | (41) | (6) | (94) | (83) | (11) | |||||||||||||||||||||||||||||||||||||||
| Mark-to-market for economic hedges | Mark-to-market for economic hedges | 26 | (52) | 78 | 45 | (178) | 223 | |||||||||||||||||||||||||||||||||||||||||||||||||||
| Total operating revenues | 265 | 272 | (7 | ) | 767 | 789 | (22 | ) | Total operating revenues | 406 | 368 | 38 | 694 | 582 | 112 | |||||||||||||||||||||||||||||||||||||||||||
| Operating Costs and Expenses | Operating Costs and Expenses | |||||||||||||||||||||||||||||||||||||||||||||||||||||||||
| Cost of fuels | 15 | 18 | (3 | ) | 45 | 48 | (3 | ) | Cost of fuels | 16 | 7 | 9 | 16 | 29 | (13) | |||||||||||||||||||||||||||||||||||||||||||
| Emissions credit amortization | — | — | — | — | 6 | (6 | ) | |||||||||||||||||||||||||||||||||||||||||||||||||||
| Operations and maintenance | 46 | 41 | 5 | 143 | 134 | 9 | Operations and maintenance | 76 | 76 | — | 159 | 152 | 7 | |||||||||||||||||||||||||||||||||||||||||||||
| Other costs of operations | 17 | 17 | — | 51 | 50 | 1 | Other costs of operations | 26 | 29 | (3) | 51 | 59 | (8) | |||||||||||||||||||||||||||||||||||||||||||||
| Depreciation and amortization | 88 | 75 | 13 | 241 | 224 | 17 | ||||||||||||||||||||||||||||||||||||||||||||||||||||
| Depreciation, amortization and accretion | Depreciation, amortization and accretion | 128 | 126 | 2 | 256 | 250 | 6 | |||||||||||||||||||||||||||||||||||||||||||||||||||
| General and administrative | 4 | 3 | 1 | 14 | 8 | 6 | General and administrative | 9 | 9 | — | 19 | 21 | (2) | |||||||||||||||||||||||||||||||||||||||||||||
| Acquisition-related transaction and integration costs | — | — | — | 2 | — | 2 | ||||||||||||||||||||||||||||||||||||||||||||||||||||
| Transaction and integration costs | Transaction and integration costs | 2 | 3 | (1) | 2 | 5 | (3) | |||||||||||||||||||||||||||||||||||||||||||||||||||
| Development costs | Development costs | — | 1 | (1) | — | 2 | (2) | |||||||||||||||||||||||||||||||||||||||||||||||||||
| Total operating costs and expenses | 170 | 154 | 16 | 496 | 470 | 26 | Total operating costs and expenses | 257 | 251 | 6 | 503 | 518 | (15) | |||||||||||||||||||||||||||||||||||||||||||||
| Gain on sale of business | Gain on sale of business | — | 1,291 | (1,291) | — | 1,291 | (1,291) | |||||||||||||||||||||||||||||||||||||||||||||||||||
| Operating Income | 95 | 118 | (23 | ) | 271 | 319 | (48 | ) | Operating Income | 149 | 1,408 | (1,259) | 191 | 1,355 | (1,164) | |||||||||||||||||||||||||||||||||||||||||||
| Other Income (Expense) | Other Income (Expense) | |||||||||||||||||||||||||||||||||||||||||||||||||||||||||
| Equity in earnings of unconsolidated affiliates | 28 | 16 | 12 | 63 | 34 | 29 | Equity in earnings of unconsolidated affiliates | 3 | 10 | (7) | — | 14 | (14) | |||||||||||||||||||||||||||||||||||||||||||||
| Other income, net | 1 | 1 | — | 3 | 3 | — | Other income, net | 9 | 5 | 4 | 17 | 5 | 12 | |||||||||||||||||||||||||||||||||||||||||||||
| Interest expense | (72 | ) | (68 | ) | (4 | ) | (227 | ) | (204 | ) | (23 | ) | ||||||||||||||||||||||||||||||||||||||||||||||
| Loss on debt extinguishment | Loss on debt extinguishment | — | — | — | — | (2) | 2 | |||||||||||||||||||||||||||||||||||||||||||||||||||
| Derivative interest income | Derivative interest income | 22 | 36 | (14) | 1 | 77 | (76) | |||||||||||||||||||||||||||||||||||||||||||||||||||
| Other interest expense | Other interest expense | (77) | (83) | 6 | (155) | (171) | 16 | |||||||||||||||||||||||||||||||||||||||||||||||||||
| Total other expense, net | (43 | ) | (51 | ) | 8 | (161 | ) | (167 | ) | 6 | Total other expense, net | (43) | (32) | (11) | (137) | (77) | (60) | |||||||||||||||||||||||||||||||||||||||||
| Net Income | 52 | 67 | (15 | ) | 110 | 152 | (42 | ) | Net Income | 106 | 1,376 | (1,270) | 54 | 1,278 | (1,224) | |||||||||||||||||||||||||||||||||||||||||||
| Less: Net loss attributable to noncontrolling interests | (23 | ) | (38 | ) | 15 | (56 | ) | (67 | ) | 11 | ||||||||||||||||||||||||||||||||||||||||||||||||
| Net Income Attributable to NRG Yield LLC | $ | 75 | $ | 105 | $ | (30 | ) | $ | 166 | $ | 219 | $ | (53 | ) | ||||||||||||||||||||||||||||||||||||||||||||
| Less: Net loss attributable to noncontrolling interests and redeemable noncontrolling interests | Less: Net loss attributable to noncontrolling interests and redeemable noncontrolling interests | — | (6) | 6 | (30) | (46) | 16 | |||||||||||||||||||||||||||||||||||||||||||||||||||
| Net Income Attributable to Clearway Energy LLC | Net Income Attributable to Clearway Energy LLC | $ | 106 | $ | 1,382 | $ | (1,276) | $ | 84 | $ | 1,324 | $ | (1,240) | |||||||||||||||||||||||||||||||||||||||||||||
| Three months ended September 30, | Nine months ended September 30, | ||||||||||
| Business metrics: | 2017 | 2016 | 2017 | 2016 | |||||||
Renewables MWh generated/sold (in thousands) (a) | 1,544 | 1,744 | 5,295 | 5,563 | |||||||
Conventional MWh generated (in thousands) (a)(b) | 717 | 628 | 1,172 | 1,265 | |||||||
| Thermal MWt sold (in thousands) | 463 | 496 | 1,450 | 1,497 | |||||||
Thermal MWh sold (in thousands) (c) | 9 | 12 | 27 | 61 | |||||||
| Three months ended June 30, | Six months ended June 30, | ||||||||||||||||||||||
| Business metrics: | 2023 | 2022 | 2023 | 2022 | |||||||||||||||||||
Solar MWh generated/sold (in thousands) (a) | 1,544 | 1,538 | 2,410 | 2,598 | |||||||||||||||||||
Wind MWh generated/sold (in thousands) (a) | 2,433 | 2,878 | 5,177 | 5,137 | |||||||||||||||||||
Renewables MWh generated/sold (in thousands) (a) | 3,977 | 4,416 | 7,587 | 7,735 | |||||||||||||||||||
Thermal MWt sold (in thousands) (b) | — | 183 | — | 835 | |||||||||||||||||||
Thermal MWh sold (in thousands) (b) | — | 5 | — | 19 | |||||||||||||||||||
Conventional MWh generated (in thousands) (a) (c) | 139 | 289 | 227 | 421 | |||||||||||||||||||
| Conventional equivalent availability factor | 90.1 | % | 88.3 | % | 82.3 | % | 91.8 | % | |||||||||||||||
(a)Volumes do not include the MWh generated/sold by the Company'sCompany’s equity method investments.
(b) On May 1, 2022, the Company completed the sale of 100% of its interests in the Thermal Business to KKR.
(c) Volumes generated arein 2022 were not sold as the Conventional facilities sellsold only capacity rather than energy.energy prior to 2023.
37
Management’s Discussion of the Results of Operations for the Three Months Ended SeptemberJune 30, 20172023 and 20162022
| Conventional Generation | Renewables | Thermal | Total | ||||||||||||
| (In millions) | |||||||||||||||
| Three months ended September 30, 2017 | |||||||||||||||
| Energy and capacity revenues | $ | 89 | $ | 147 | $ | 47 | $ | 283 | |||||||
| Cost of fuels | — | — | (15 | ) | (15 | ) | |||||||||
| Contract amortization | (1 | ) | (16 | ) | (1 | ) | (18 | ) | |||||||
| Gross margin | 88 | 131 | 31 | 250 | |||||||||||
| Contract amortization | 1 | 16 | 1 | 18 | |||||||||||
| Economic gross margin | $ | 89 | $ | 147 | $ | 32 | $ | 268 | |||||||
| Three months ended September 30, 2016 | |||||||||||||||
| Energy and capacity revenues | $ | 83 | $ | 158 | $ | 48 | $ | 289 | |||||||
| Cost of fuels | — | (1 | ) | (17 | ) | (18 | ) | ||||||||
| Contract amortization | (1 | ) | (16 | ) | — | (17 | ) | ||||||||
| Gross margin | 82 | 141 | 31 | 254 | |||||||||||
| Contract amortization | 1 | 16 | — | 17 | |||||||||||
| Economic gross margin | $ | 83 | $ | 157 | $ | 31 | $ | 271 | |||||||
| (In millions) | |||||||||||
| Renewables Segment | Decrease driven primarily by lower than average wind production in 2023, compared with higher than average wind production in 2022. | $ | (46) | ||||||||
| Increase driven primarily by the acquisition of the Capistrano Wind Portfolio in August 2022. | 16 | ||||||||||
| Increase for solar acquisitions driven by Mililani I and Waiawa, which reached commercial operations in July 2022 and January 2023, respectively, offset by the disposition of Kawailoa in August 2022. | 2 | ||||||||||
| Conventional Segment | Increase driven by the sales-type lease revenue recognition of the Marsh Landing Black Start addition that commenced operations on May 31, 2023. | 21 | |||||||||
| Increase at El Segundo facility primarily driven by higher availability due to the timing of the 2023 annual planned maintenance outages. | 6 | ||||||||||
| Decrease at Walnut Creek and Marsh Landing facilities primarily driven by lower prices for capacity revenue due to the expiring PPAs during the second quarter of 2023 and commencement of RA capacity revenue. | (15) | ||||||||||
| Thermal Segment | Decrease in revenue due to the sale of the Thermal business on May 1, 2022. | (18) | |||||||||
| Mark-to-market for economic hedges | Increase primarily driven by decreases in forward power prices in the ERCOT and PJM markets. | 78 | |||||||||
| Contract amortization | Increase primarily driven by amortization of the intangible assets of PPAs related to the acquisition of the Capistrano Wind Portfolio in August 2022. | (6) | |||||||||
| $ | 38 | ||||||||||
| (In millions) | |||
| Decrease in the Renewables segment due to a 12% decrease in volume generated by wind projects, primarily at NRG Wind TE Holdco, Alta Wind and Tapestry, as well as a 6% decrease in solar generation, primarily at CVSR in connection with lower insolation | $ | (10 | ) |
| Increase in the Conventional segment due to fewer outages at Walnut Creek in 2017, as well as increased start revenues at El Segundo and Marsh Landing | 6 | ||
Decrease in gross margin | $ | (4 | ) |
Gain on Sale of Business
On May 1, 2022, the Company completed the sale of 100% of its interests in the first halfThermal Business to KKR, resulting in a gain on sale of 2017.
Equity in Earnings of Unconsolidated Affiliates
Equity in earnings of unconsolidated affiliates increaseddecreased by $12$7 million during the three months ended SeptemberJune 30, 2017,2023, compared to the same period in 2016,2022, primarily due to an increasethe change in earnings from the Utah Solar Portfolio, which was acquired by NRG in November 2016,fair value of interest rate swaps, as well as an increase in earnings from Desert Sunlight, partially offset by a decrease in earnings from Avenallower wind production.
38
Interest Expense
Interest expense increased by $4$8 million during the three months ended SeptemberJune 30, 2017,2023, compared to the same period in 2016,2022, primarily due to:to the following:
| (In millions) | |||||
| Change in fair value of interest rate swaps | $ | 14 | |||
| Decrease in interest expense due to decreased principal balances of project-level debt | (4) | ||||
| Decrease in interest expense due to the sale of the Thermal Business on May 1, 2022 | (1) | ||||
| Decrease in interest expense due to decreased principal balances of Corporate debt, which includes repayment of the outstanding borrowings under the Bridge Loan Agreement and the revolving credit facility on May 3, 2022 | (1) | ||||
| $ | 8 | ||||
| (In millions) | |||
| Issuance of the new long-term debt, primarily including 2026 Senior Notes in August 2016, Energy Center Minneapolis Series D Notes due 2031 issued in October 2016, and Agua Caliente Borrower 2 due 2038 issued in February 2017 | $ | 6 | |
| Utah Solar Portfolio debt assumed in connection with the acquisition of the March 2017 Drop Down Assets | 4 | ||
| Lower principal balances on certain project level debt in 2017, as well as higher revolver borrowings in 2016 | (4 | ) | |
| Amortization of de-designated interest rate swaps, partially offset by the change in fair value of interest rate swaps | (2 | ) | |
| Increase in interest expense | $ | 4 | |
For the three months ended SeptemberJune 30, 2017,2023, net (loss) income attributable to noncontrolling interests and redeemable noncontrolling interests was comprised of the following:
| (In millions) | |||||
| Losses attributable to tax equity financing arrangements and the application of the HLBV method | $ | (11) | |||
| Income attributable to third-party partnerships | 11 | ||||
| $ | — | ||||
For the three months ended June 30, 2022, the Company had a net loss of $23$6 million attributable to noncontrolling interests and redeemable noncontrolling interests with respect to its tax equity financing arrangements and the application of the HLBV method. For the three months ended September 30, 2016, the Company had a loss of $38 million attributable to noncontrolling interests with respect to its tax equity financing arrangements and the application of the HLBV method, which generally allocates more loss to the noncontrolling interest in the first several years after fund formation, reflecting the allocation of tax items such as production tax credits and tax depreciation to the fund investors.
Management’s Discussion of the Results of Operations for the NineSix Months Ended SeptemberJune 30, 20172023 and 20162022
| (In millions) | ||||||||
| Renewables Segment | Decrease driven primarily by lower than average wind production during the second quarter of 2023, compared with higher than average wind production during the second quarter of 2022. | $ | (47) | |||||
| Decrease driven primarily by lower solar generation due to weather. | (14) | |||||||
| Increase driven primarily by the acquisition of the Capistrano Wind Portfolio in August 2022. | 36 | |||||||
| Increase for solar acquisitions driven by Mililani I and Waiawa, which reached commercial operations in July 2022 and January 2023, respectively, offset by the disposition of Kawailoa in August 2022. | 3 | |||||||
| Conventional Segment | Decrease at Walnut Creek and Marsh Landing facilities primarily driven by lower prices for capacity revenue due to the expiring PPAs during the second quarter of 2023 and commencement of RA capacity revenue. | (15) | ||||||
| Decrease driven by outages at the Walnut Creek and Marsh Landing facilities during the first quarter of 2023, resulting in lower capacity revenue. | (5) | |||||||
| Decrease primarily driven by longer planned maintenance outages at the El Segundo facility in 2023. | (2) | |||||||
| Increase driven by the sales-type lease revenue recognition of the Marsh Landing Black Start addition that commenced operations on May 31, 2023. | 21 | |||||||
| Thermal Segment | Decrease primarily driven by the sale of the Thermal Business on May 1, 2022. | (77) | ||||||
| Mark-to-market economic hedging activities | Increase primarily driven by decreases in forward power prices in the ERCOT and PJM markets. | 223 | ||||||
| Contract amortization | Increase primarily driven by amortization of the intangible assets of PPAs related to the acquisition of the Capistrano Wind Portfolio in August 2022. | (11) | ||||||
| $ | 112 | |||||||
| Conventional Generation | Renewables | Thermal | Total | ||||||||||||
| (In millions) | |||||||||||||||
| Nine months ended September 30, 2017 | |||||||||||||||
| Energy and capacity revenues | $ | 250 | $ | 437 | $ | 132 | $ | 819 | |||||||
| Cost of fuels | — | — | (45 | ) | (45 | ) | |||||||||
| Contract amortization | (4 | ) | (46 | ) | (2 | ) | (52 | ) | |||||||
| Gross margin | 246 | 391 | 85 | 722 | |||||||||||
| Contract amortization | 4 | 46 | 2 | 52 | |||||||||||
| Economic gross margin | $ | 250 | $ | 437 | $ | 87 | $ | 774 | |||||||
| Nine months ended September 30, 2016 | |||||||||||||||
| Energy and capacity revenues | $ | 250 | $ | 458 | $ | 132 | $ | 840 | |||||||
| Cost of fuels | (1 | ) | (1 | ) | (46 | ) | (48 | ) | |||||||
| Contract amortization | (4 | ) | (46 | ) | (1 | ) | (51 | ) | |||||||
| Emissions credit amortization | (6 | ) | — | — | (6 | ) | |||||||||
| Gross margin | 239 | 411 | 85 | 735 | |||||||||||
| Contract amortization | 4 | 46 | 1 | 51 | |||||||||||
| Emissions credit amortization | 6 | — | — | 6 | |||||||||||
| Economic gross margin | $ | 249 | $ | 457 | $ | 86 | $ | 792 | |||||||
Cost of fuels decreased by $13 million during the ninesix months ended SeptemberJune 30, 2017,2023, compared to the same period in 2016,2022, due to a combinationthe sale of the following:Thermal Business on May 1, 2022, which resulted in a decrease of $28 million, offset by a $15 million increase for the Conventional segment primarily due to the associated costs of the sales-type lease recognition of the Marsh Landing Black Start addition that commenced operations on May 31, 2023, as further described in Note 2, Summary of Significant Accounting Policies.
40
| (In millions) | |||
| Decrease in the Renewables segment due to a 4% decrease in volume generated by wind projects, primarily in connection with lower wind resource at the Alta Wind, and NRG Wind TE Holdco projects, as well as a 5% decrease in solar generation, primarily at CVSR in connection with lower insolation | $ | (20 | ) |
| Increase in the Conventional segment, primarily due to Emissions credit amortization of NOx allowances at Walnut Creek and El Segundo in compliance with amendments to the Regional Clean Air Incentives Market program in 2016 | 7 | ||
| Decrease in gross margin | $ | (13 | ) |
Operations and Maintenance Expense
Operations and maintenance expense increased by $9$7 million during the ninesix months ended SeptemberJune 30, 2017,2023, compared to the same period in 2016, primarily2022, due to forced outages at Walnut Creek and El Segundoa combination of the drivers summarized in 2017.the table below:
| (In millions) | ||||||||
| Renewables Segment | Increase primarily driven by the acquisition of the Capistrano Wind Portfolio in August 2022. | $ | 11 | |||||
| Increase primarily driven by maintenance activities at the wind facilities. | 6 | |||||||
| Increase for solar acquisitions driven by Daggett 3 in February 2023, Mililani I in March 2022 and Waiawa in November 2022, offset by the disposition of Kawailoa in August 2022. | 2 | |||||||
| Conventional Segment | Increase primarily driven by outages at the Walnut Creek and Marsh Landing facilities. | 4 | ||||||
| Increase primarily driven by higher costs related to additional planned maintenance outages at the El Segundo facility in 2023. | 2 | |||||||
| Thermal Segment | Decrease primarily driven by the sale of the Thermal Business on May 1, 2022. | (18) | ||||||
| $ | 7 | |||||||
Other Costs of Operations Expense
Gain on Sale of Business
| (In millions) | |||
| Increase in depreciation expense due to an update in estimated useful lives for certain components of fixed assets in the first half of 2017 in the Conventional and Renewables segments | $ | 23 | |
Decrease in depreciation expense at NRG Wind TE Holdco, primarily due to the effect of assets impairment at Elbow Creek, Goat and Forward that took place in December 2016, as further described in Note 9 - Asset Impairments to the Company's 2016 Form 10-K. | (6 | ) | |
| Increase in depreciation and amortization expense | $ | 17 | |
Equity in Earnings of Unconsolidated Affiliates
Equity in earnings of unconsolidated affiliates increaseddecreased by $29$14 million during the ninesix months ended SeptemberJune 30, 2017,2023, compared to the same period in 2016,2022, primarily due to the acquisitionchange in fair value of the Utah Solar Portfolio in November 2016, partially offset by a decrease in earnings from the Company's partnerships with NRG. interest swaps and higher depreciation expense, as well as lower wind production.
Interest Expense
Interest expense increased by $60 million during the six months ended June 30, 2023, compared to the same period in 2022, primarily due to the following:
| (In millions) | |||||
| Change in fair value of interest rate swaps | $ | 76 | |||
| Decrease in interest expense due to decreased principal balances of project-level debt | (7) | ||||
| Decrease in interest expense due to the sale of the Thermal Business on May 1, 2022 | (6) | ||||
| Decrease in interest expense due to decreased principal balances of Corporate debt, which includes repayment of the outstanding borrowings under the Bridge Loan Agreement and the revolving credit facility on May 3, 2022 | (3) | ||||
| $ | 60 | ||||
41
| (In millions) | |||
| Issuance of the new long-term debt in the second half of 2016, including primarily 2026 Senior Notes, CVSR Holdco Notes due 2037, and Energy Center Minneapolis Series D Notes due 2031 | $ | 20 | |
| Utah Solar Portfolio debt assumed in connection with the acquisition of the March 2017 Drop Down Assets | 12 | ||
| Amortization of de-designated interest rate swaps, as well as the change in fair value of interest rate swaps | 2 | ||
| Higher revolver borrowings in 2016 combined with the lower principal balances on project level debt in 2017 | (11 | ) | |
| Increase in interest expense | $ | 23 | |
For the ninesix months ended SeptemberJune 30, 2017,2023, the Company had a net loss of $56$30 million attributable to noncontrolling interests with respect to its tax equity financing arrangements and the applicationredeemable noncontrolling interests comprised of the HLBV method. following:
| (In millions) | |||||
| Losses attributable to tax equity financing arrangements and the application of the HLBV method | $ | (44) | |||
| Income attributable to third-party partnerships | 14 | ||||
| $ | (30) | ||||
For the ninesix months ended SeptemberJune 30, 2016,2022, the Company had a net loss of $67$46 million attributable to noncontrolling interests with respect to its tax equity financing arrangements and applicationredeemable noncontrolling interests comprised of the HLBV method, which generally allocates more loss to the noncontrolling interest in the first several years after fund formation, reflecting the allocation of tax items such as production tax credits and tax depreciation to the fund investors.
following:
| (In millions) | |||||
| Losses attributable to tax equity financing arrangements and the application of the HLBV method | $ | (24) | |||
| Losses attributable to third-party partnerships | (22) | ||||
| $ | (46) | ||||
42
Liquidity and Capital Resources
The Company'sCompany’s principal liquidity requirements are to meet its financial commitments, finance current operations, fund capital expenditures, including acquisitions from time to time, service debt and pay distributions. As a normal part of the Company'sCompany’s business, depending on market conditions, the Company will from time to time consider opportunities to repay, redeem, repurchase or refinance its indebtedness. Changes in the Company'sCompany’s operating plans, lower than anticipated sales, increased expenses, acquisitions or other events may cause the Company to seek additional debt or equity financing in future periods. There can be no guarantee that financing will be available on acceptable terms or at all. Debt financing, if available, could impose additional cash payment obligations and additional covenants and operating restrictions.
Current Liquidity Position
As of SeptemberJune 30, 20172023 and December 31, 20162022, the Company'sCompany’s liquidity was approximately $745 million$1.43 billion and $921 million,$1.37 billion, respectively, comprised of cash, restricted cash and availability under the Company'sCompany’s revolving credit facility.
| (In millions) | June 30, 2023 | December 31, 2022 | ||||||||||||
| Cash and cash equivalents: | ||||||||||||||
| Clearway Energy LLC, excluding subsidiaries | $ | 413 | $ | 536 | ||||||||||
| Subsidiaries | 134 | 121 | ||||||||||||
| Restricted cash: | ||||||||||||||
| Operating accounts | 104 | 109 | ||||||||||||
| Reserves, including debt service, distributions, performance obligations and other reserves | 267 | 230 | ||||||||||||
| Total cash, cash equivalents and restricted cash | 918 | 996 | ||||||||||||
| Revolving credit facility availability | 512 | 370 | ||||||||||||
| Total liquidity | $ | 1,430 | $ | 1,366 | ||||||||||
The Company'sCompany’s liquidity includes $140$371 million and $165$339 million of restricted cash balances as of SeptemberJune 30, 20172023 and December 31, 20162022, respectively. Restricted cash consists primarily of funds to satisfy the requirements of certain debt agreementsarrangements and funds held within the Company'sCompany’s projects that are restricted in their use. The Company's various financing arrangements are described in Note 7, Long-term Debt. As of SeptemberJune 30, 2017,2023, these restricted funds were comprised of $104 million designated to fund operating expenses, approximately $168 million designated for current debt service payments and $85 million restricted for reserves including debt service, performance obligations and other reserves, as well as capital expenditures. The remaining $14 million is held in distribution reserve accounts.
Clearway Energy LLC and Clearway Energy Operating LLC Revolving Credit Facility
On March 15, 2023, Clearway Energy Operating LLC refinanced the Amended and Restated Credit Agreement, which (i) replaced LIBOR with SOFR plus a credit spread adjustment of 0.10% as the applicable reference rate, (ii) increased the available revolving commitments to an aggregate principal amount of $700 million, (iii) extended the maturity date to March 15, 2028, (iv) increased the letter of credit sublimit to $594 million and (v) implemented certain other technical modifications.
As of June 30, 2023, the Company had $427 million of available borrowings under its revolving credit facility.
Management believes that the Company'sCompany’s liquidity position, cash flows from operations, and availability under its revolving credit facility will be adequate to meet the Company'sCompany’s financial commitments; debt service obligations; growth, operating and maintenance capital expenditures; and to fund distributions to Yield,Clearway, Inc. and NRG.CEG. Management continues to regularly monitor the Company'sCompany’s ability to finance the needs of its operating, financing and investing activity within the dictates of prudent balance sheet management.
Sources of Liquidity
The Company’s principal sources of liquidity include cash on hand, cash generated from operations, proceeds from sales of assets, borrowings under new and existing financing arrangements and the issuance of additional equity and debt securities by Clearway, Inc. or the Company as appropriate given market conditions. As described in Note 7, Long-term Debt, to this Form 10-Q and Item 15 — Note 10, Long-term Debt, to the consolidated financial statements included in the Company’s 2022 Form 10-K, the Company’s financing arrangements consist of corporate level debt, which includes Senior Notes, intercompany borrowings with Clearway, Inc. and the revolving credit facility, the ATM Program and project-level financings for its various assets.
43
Credit Ratings
Credit rating agencies rate a firm'sfirm’s public debt securities. These ratings are utilized by the debt markets in evaluating a firm'sfirm’s credit risk. Ratings influence the price paid to issue new debt securities by indicating to the market the Company'sCompany’s ability to pay principal, interest and preferred dividends. Rating agencies evaluate a firm'sfirm’s industry, cash flow, leverage, liquidity and hedge profile, among other factors, in their credit analysis of a firm'sfirm’s credit risk.
As of SeptemberJune 30, 2017,2023, the Company's 2024Company’s 2028 Senior Notes, 2031 Senior Notes and 20262032 Senior Notes arewere rated BB by S&P and Ba2 by Moody's, respectively. The ratings outlook is stable.Moody’s.
Uses of Liquidity
The Company'sCompany’s requirements for liquidity and capital resources, other than for operating its facilities, are categorized as: (i) debt service obligations, as described more fully in Item 1 — Note 7, Long-term Debt; (ii) capital expenditures; (iii) off-balance sheet arrangements; (iv) acquisitions and investments;investments, as described more fully in Note 3, Acquisitions and (iv)Dispositions and Note 4, Investments Accounted for by the Equity Method and Variable Interest Entities; and (v) distributions.
Capital Expenditures
The Company'sCompany’s capital spending program is mainly focused on maintenance capital expenditures, consisting of costs to maintain the assets currently operating, such as costs to replace or refurbish assets during routine maintenance, and growth capital expenditures consisting of costs to construct new assets and costs to complete the construction of assets where construction is in process, and capital expenditures related to acquiring additional thermal customers. process.
For the ninesix months ended SeptemberJune 30, 20172023, the Company used approximately $23$109 million to fund capital expenditures, including growthexpenditures of $2$96 million in the ThermalRenewables segment, funded through construction-related financing. Renewables segment capital expenditures included $86 million incurred in connection with expansion of its customer base. For the nine months ended September 30, 2016,Daggett 3 solar project, $7 million incurred in connection with the Waiawa solar project and $3 million incurred by other wind and solar projects. In addition, the Company used approximately $16incurred $13 million to fundin maintenance capital expenditures, of which $12 million related to maintenance expenditures. The Company develops annual capital spending plans based on projected requirements for maintenance and growth capital. The Company estimated an additional $5 million and $32estimates $35 million of maintenance expenditures for the remainder of 2017 and full 2018, respectively. 2023. These estimates are subject to continuing review and adjustment and actualadjustment. Actual capital expenditures may vary from these estimates.
| Third Quarter 2017 | Second Quarter 2017 | First Quarter 2017 | |||||||||
| Distributions per Class A, B, C and D unit | $ | 0.28 | $ | 0.27 | $ | 0.26 | |||||
| Nine months ended September 30, | |||||||||||
| 2017 | 2016 | Change | |||||||||
| (In millions) | |||||||||||
| Net cash provided by operating activities | $ | 375 | $ | 444 | $ | (69 | ) | ||||
| Net cash used in investing activities | (204 | ) | (135 | ) | (69 | ) | |||||
| Net cash used in financing activities | (339 | ) | (212 | ) | (127 | ) | |||||
| Changes to net cash provided by operating activities were driven by: | (In millions) | ||
| Decrease in operating income adjusted for non-cash items | $ | (52 | ) |
| Decrease in working capital driven primarily by timing of cash receipts from customers in the first nine months of 2017 compared to the same period in 2016 | (26 | ) | |
| Higher distributions from unconsolidated affiliates primarily due to the acquisition of the Utah Solar Portfolio, which was acquired by the Company in March 2017 and by NRG in November 2016 | 9 | ||
| $ | (69 | ) | |
| Changes to net cash used in investing activities were driven by: | (In millions) | ||
| Payments for the August 2017 Drop Down Assets and March 2017 Drop Down Assets compared to the payments made for the CVSR Drop Down in 2016 | $ | (99 | ) |
| Decrease in investments in unconsolidated affiliates in 2017 primarily due to the timing of funding of the projects | 37 | ||
| Higher capital expenditures in 2017 compared to the same period in 2016 due primarily to maintenance expenditures at Walnut Creek as a result of the forced outages | (7 | ) | |
| $ | (69 | ) | |
| Changes in net cash used in financing activities were driven by: | (In millions) | ||
| Proceeds from the issuance of Class C units | $ | 33 | |
| Net borrowings under the revolving credit facility in 2016 | 306 | ||
| Higher borrowings in 2016, primarily related to the proceeds from the issuance of 2026 Senior Notes and CVSR Holdco Notes due 2037 combined with higher repayments of long-term debt and increased financing fees in 2017 | (527 | ) | |
| Increase in net contributions from noncontrolling interests due to higher production-based payments in 2017 compared to 2016 | 6 | ||
| Increase in distributions paid to unit holders | (22 | ) | |
| Lower payments of distributions to NRG for the Drop Down Assets relating to the pre-acquisition period in 2017 compared to 2016 | 77 | ||
| $ | (127 | ) | |
Off-Balance Sheet Arrangements
Obligations under Certain Guarantee Contracts
The Company may enter into guarantee arrangements in the normal course of business to facilitate commercial transactions with third parties.
Retained or Contingent Interests
The Company does not have any material retained or contingent interests in assets transferred to an unconsolidated entity.
Obligations Arising Out of a Variable Interest in an Unconsolidated Entity
The Company'sCompany’s pro-rata share of non-recourse debt held by unconsolidated affiliates was approximately $643$317 million as of SeptemberJune 30, 2017.2023. This indebtedness may restrict the ability of these subsidiaries to issue dividends or distributions to the Company. For a complete description of debt held by unconsolidated affiliates seeNote 5, Investments Accounted for by the Equity Method and Variable Interest Entities to the consolidated financial statements for the year ended December 31, 2016 included in the Company's May 9, 2017 Form 8-K.
Contractual Obligations and Commercial Commitments
The Company has a variety of contractual obligations and other commercial commitments that represent prospective cash requirements in addition to the Company'sCompany’s capital expenditure programs, as disclosed in the Company's 2016Company’s 2022 Form 10-K. See also Note
Acquisitions and Investments
The Company intends to acquire generation assets developed and constructed by CEG, as well as generation assets from third parties where the Company believes its knowledge of the market and operating expertise provides a competitive advantage, and to utilize such acquisitions as a means to grow its business.
44
Rosie Central BESS — On June 30, 2023, the Company, through its indirect subsidiary, Rosie Class B LLC, the indirect owner of the Rosamond Central solar project, became the owner of the Class B membership interests of Rosie Central BESS in order to facilitate and fund the construction of a 147 MW BESS project that will be co-located at the Rosamond Central solar facility. Clearway Renew indirectly owns the Class A membership interests. The Company’s investment consists of $10 million contributed into Rosie Central BESS, funded through contributions from the Company and its cash equity investor in Rosie TargetCo LLC, which consolidates Rosie Class B LLC. On July 3, Business Acquisitions2023, Rosie Class B LLC contributed an additional $20 million into Rosie Central BESS. Additionally, on June 30, 2023, Rosamond Central entered into an asset purchase agreement with Rosie Central BESS to this Form 10-Qacquire the BESS project assets at mechanical completion for a discussionpurchase price of $360 million, of which $72 million is payable at mechanical completion with the remaining $288 million payable at substantial completion. The Company will fund $17 million of the purchase price at mechanical completion and $67 million of the purchase price at substantial completion. The BESS project is anticipated to reach mechanical completion in the second half of 2023 and to reach substantial completion in the first half of 2024.
On June 30, 2023, Rosie Class B LLC amended its financing agreement. On July 3, 2023, the Company received total loan proceeds of $138 million under the refinancing, which is net of $5 million in debt issuance costs. Also on July 3, 2023, Rosie Class B LLC issued a loan to a consolidated subsidiary of Clearway Renew in the aggregate principal amount of $117 million in order to finance the construction of the BESS project.
Waiawa Drop Down —In connection with the 2022 Drop Down of Waiawa, the Company assumed the project’s financing agreement, which includes a construction loan that converted to a term loan on March 30, 2023 upon the project reaching substantial completion and a tax equity bridge loan that was repaid on March 30, 2023.
Daggett 3 Drop Down — On February 17, 2023, the Company, through its indirect subsidiary, Daggett Solar Investment LLC, acquired the Class A membership interests in Daggett TargetCo LLC, the indirect owner of the Daggett 3 solar project, from Clearway Renew for cash consideration of $21 million and then contributed its Class A membership interests into Daggett Renewable Holdco LLC, a partnership between the Company and a cash equity investor, which consolidates Daggett TargetCo LLC. Daggett TargetCo LLC consolidates, as the indirect owner of the primary beneficiary, a tax equity fund, Daggett TE Holdco LLC, which owns the Daggett 3 solar project. Daggett 3 has PPAs with investment-grade counterparties that have a 15-year weighted average contract duration that commence when the underlying operating assets reach commercial operations, which is expected to occur in the second half of 2023. The acquisition was funded with existing sources of liquidity. As part of the acquisition, the Company assumed the project’s financing agreement, which included a construction loan that converts to a term loan upon the project reaching substantial completion, a tax equity bridge loan that will be repaid when the project reaches substantial completion and a sponsor equity bridge loan that was repaid at acquisition date. Subsequent to the acquisition, CEG funded an additional contingencies$43 million in project completion costs, which will be repaid with the proceeds received when the project reaches substantial completion, which is expected to occur in the second half of 2023.
Cash Distributions to Clearway, Inc. and CEG
The Company intends to distribute to its unit holders in the form of a quarterly distribution all of the CAFD it generates each quarter less reserves for the prudent conduct of the business, including among others, maintenance capital expenditures to maintain the operating capacity of the assets. Distributions on the Company’s units are subject to available capital, market conditions and compliance with associated laws, regulations and other contractual obligations. The Company expects that, occurredbased on current circumstances, comparable cash distributions will continue to be paid in the foreseeable future.
The following table lists the distributions paid on the Company’s Class A, B, C and D units during 2017.the six months ended June 30, 2023:
| Second Quarter 2023 | First Quarter 2023 | ||||||||||||||||||||||
| Distributions per Class A, B, C and D unit | $ | 0.3818 | $ | 0.3745 | |||||||||||||||||||
On August 7, 2023, the Company declared a distribution on its Class A, Class B, Class C and Class D units of $0.3891 per unit payable on September 15, 2023 to unit holders of record as of September 1, 2023.
45
Cash Flow Discussion
The following tables reflect the changes in cash flows for the comparative periods:
| Six months ended June 30, | |||||||||||||||||
| 2023 | 2022 | Change | |||||||||||||||
| (In millions) | |||||||||||||||||
| Net cash provided by operating activities | $ | 235 | $ | 280 | $ | (45) | |||||||||||
| Net cash (used in) provided by investing activities | (116) | 1,331 | (1,447) | ||||||||||||||
| Net cash used in financing activities | (197) | (977) | 780 | ||||||||||||||
Net Cash Provided by Operating Activities
| Changes to net cash provided by operating activities were driven by: | (In millions) | ||||
| Decrease in operating income adjusted for non-cash items | $ | (46) | |||
| Increase in working capital primarily driven by the timing of accounts receivable collections and payments of current liabilities | (11) | ||||
| Decrease in distributions from unconsolidated affiliates | (6) | ||||
| Transaction expenses paid on May 1, 2022 in connection with the sale of the Thermal Business | 18 | ||||
| $ | (45) | ||||
Net Cash (Used in) Provided by Investing Activities
| Changes to net cash (used in) provided by investing activities were driven by: | (In millions) | ||||
| Proceeds from the sale of the Thermal Business in 2022 | $ | (1,457) | |||
| Increase in capital expenditures | (28) | ||||
| Increase in investments in unconsolidated affiliates | (10) | ||||
| Decrease in cash paid for Drop Down Assets | 44 | ||||
| Increase in the return of investment from unconsolidated affiliates | 4 | ||||
| $ | (1,447) | ||||
Net Cash Used in Financing Activities
| Changes in net cash used in financing activities were driven by: | (In millions) | ||||
| Increase in contributions from noncontrolling interest members and CEG, net of distributions | $ | 282 | |||
| Decrease in payments for the revolving credit facility, net of proceeds | 245 | ||||
| Decrease in payments for long-term debt, net of proceeds | 245 | ||||
| Cash released from escrow distributed to CEG in 2022 | 64 | ||||
| Tax related distributions in 2023 | (45) | ||||
| Increase in distributions paid to unit holders | (12) | ||||
| Other | 1 | ||||
| $ | 780 | ||||
Fair Value of Derivative Instruments
The Company may enter into fuelcommodity purchase contracts and other energy-related derivativefinancial instruments to mitigate variability in earnings due to fluctuations in spot market prices and to hedge fuel requirements at certain generation facilities.prices. In addition, in order to mitigate interest rate risk associated with the issuance of variable rate debt, the Company enters into interest rate swap agreements.
46
The tables below disclose the activities of non-exchange traded contracts accounted for at fair value in accordance with ASC 820. Specifically, these tables disaggregate realized and unrealized changes in fair value; disaggregate estimated fair values at SeptemberJune 30, 20172023, based on their level within the fair value hierarchy defined in ASC 820; and indicate the maturities of contracts at SeptemberJune 30, 20172023. For a full discussion of the Company'sCompany’s valuation methodology of its contracts, see Derivative Fair Value Measurements in Item — 1 Note 5, Fair Value of Financial Instruments.
| Derivative Activity (Losses) Gains | (In millions) | ||||
| Fair value of contracts as of December 31, 2022 | $ | (264) | |||
| Contracts realized or otherwise settled during the period | 22 | ||||
| Contracts acquired during the period | 27 | ||||
| Changes in fair value | 29 | ||||
| Fair value of contracts as of June 30, 2023 | $ | (186) | |||
| Derivative Activity (Losses)/Gains | (In millions) | ||
| Fair value of contracts as of December 31, 2016 | $ | (73 | ) |
| Contracts realized or otherwise settled during the period | 21 | ||
| Changes in fair value | (14 | ) | |
| Fair value of contracts as of September 30, 2017 | $ | (66 | ) |
| Fair value of contracts as of June 30, 2023 | |||||||||||||||||||||||||||||
| Maturity | |||||||||||||||||||||||||||||
| Fair Value Hierarchy (Losses) Gains | 1 Year or Less | Greater Than 1 Year to 3 Years | Greater Than 3 Years to 5 Years | Greater Than 5 Years | Total Fair Value | ||||||||||||||||||||||||
| (In millions) | |||||||||||||||||||||||||||||
| Level 2 | $ | 34 | $ | 40 | $ | 24 | $ | 19 | $ | 117 | |||||||||||||||||||
| Level 3 | (44) | (85) | (75) | (99) | (303) | ||||||||||||||||||||||||
| Total | $ | (10) | $ | (45) | $ | (51) | $ | (80) | $ | (186) | |||||||||||||||||||
| Fair value of contracts as of September 30, 2017 | |||||||||||||||||||
| Maturity | |||||||||||||||||||
| Fair Value Hierarchy Losses | 1 Year or Less | Greater Than 1 Year to 3 Years | Greater Than 3 Years to 5 Years | Greater Than 5 Years | Total Fair Value | ||||||||||||||
| (In millions) | |||||||||||||||||||
| Level 2 | $ | 23 | $ | 25 | $ | 12 | $ | 6 | $ | 66 | |||||||||
The Company has elected to disclose derivative assets and liabilities on a trade-by-trade basis and does not offset amounts at the counterparty master agreement level. NRG, on behalf of the Company, measures the sensitivity of the portfolio to potential changes in market prices using VaR, a statistical model which attempts to predict risk of loss based on market price and volatility. NRG's risk management policy places a limit on one-day holding period VaR, which limits the net open position.
Critical Accounting Policies and Estimates
The Company'sCompany’s discussion and analysis of the financial condition and results of operations are based upon the consolidated financial statements, which have been prepared in accordance with GAAP. The preparation of these financial statements and related disclosures in compliance with GAAP requires the application of appropriate technical accounting rules and guidance, as well as the use of estimates and judgments that affect the reported amounts of assets, liabilities, revenues and expenses, and related disclosures of contingent assets and liabilities. The application of these policies necessarily involves judgments regarding future events, including the likelihood of success of particular projects, legal and regulatory challenges and the fair value of certain assets and liabilities. These judgments, in and of themselves, could materially affect the financial statements and disclosures based on varying assumptions, which may be appropriate to use. In addition, the financial and operating environment may also have a significant effect, not only on the operation of the business, but on the results reported through the application of accounting measures used in preparing the financial statements and related disclosures, even if the nature of the accounting policies has not changed.
On an ongoing basis, the Company evaluates these estimates, utilizing historic experience, consultation with experts and other methods the Company considers reasonable. In any event, actualActual results may differ substantially from the Company'sCompany’s estimates. Any effects on the Company'sCompany’s business, financial position or results of operations resulting from revisions to these estimates are recorded in the period in which the information that gives rise to the revision becomes known.
The Company identifies its most critical accounting policies as those that are the most pervasive and important to the portrayal of the Company'sCompany’s financial position and results of operations, and that require the most difficult, subjective and/or complex judgments by management regarding estimates about matters that are inherently uncertain. The Company'sCompany’s critical accounting policies include impairment of long livedincome taxes and valuation allowance for deferred tax assets, accounting utilizing Hypothetical Liquidation at Book Value, or HLBV, acquisition accounting and other intangible assets and acquisition accounting.
Recent Accounting Developments
See Item — 1 Note 2, Summary of Significant Accounting Policies, for a discussion of recent accounting developments.
ITEM 3 — Quantitative and Qualitative Disclosures About Market Risk
The Company is exposed to several market risks in its normal business activities. Market risk is the potential loss that may result from market changes associated with the Company’s power generation or with an existing or forecasted financial or commodity transaction. The types of market risks the Company is exposed to are commodity price risk, interest rate risk, liquidity risk and credit risk. The following disclosures about market risk provide an update to, and should be read in conjunction with, Item 37A —Quantitative and Qualitative Disclosures About Market Risk, of the Company’s 2022 Form 10-K.
Commodity Price Risk
Commodity price risks result from exposures to changes in spot prices, forward prices, volatilities and correlations between various commodities, such as electricity, natural gas and emissions credits. The Company manages the commodity price risk of certain of its merchant generation operations by entering into derivative or non-derivative instruments to hedge the variability in future cash flows from forecasted power sales. The portion of forecasted transactions hedged may vary based upon management's assessment of market, weather, operation and other factors.
Based on a sensitivity analysis using simplified assumptions, the impact of a $0.05 per MWh increase or decrease in power prices across the term of the derivatives contracts would cause a change of approximately $6 million to the net value of power derivatives as of June 30, 2023.
Interest Rate Risk
The Company is exposed to fluctuations in interest rates through its issuance of variable rate debt. Exposures to interest rate fluctuations may be mitigated by entering into derivative instruments known as interest rate swaps, caps, collars and put or call options. These contracts reduce exposure to interest rate volatility and result in primarily fixed rate debt obligations when taking into account the combination of the variable rate debt and the interest rate derivative instrument. See Note 6, Derivative Instruments and Hedging Activities, for more information.
Most of the Company’s project subsidiaries enter into interest rate swaps intended to hedge the risks associated with interest rates on non-recourse project-level debt. See Item 15 — Note 10, Long-term Debt, to the Company’s audited consolidated financial statements for the year ended December 31, 2022 included in the 2022 Form 10-K for more information about interest rate swaps of the Company’s project subsidiaries.
If all of the interest rate swaps had been discontinued on June 30, 2023, the counterparties would have owed the Company $121 million. Based on the credit ratings of the counterparties, the Company believes its exposure to credit risk due to nonperformance by counterparties to its hedge contracts to be insignificant.
The Company has been omittedlong-term debt instruments that subject it to the risk of loss associated with movements in market interest rates. As of June 30, 2023, a change of 1%, or 100 basis points, in interest rates would result in an approximately $2 million change in market interest expense on a rolling twelve-month basis.
As of June 30, 2023, the fair value of the Company’s debt was $6.52 billion and the carrying value was $7.10 billion. The Company estimates that a decrease of 1%, or 100 basis points, in market interest rates would have increased the fair value of its long-term debt by approximately $338 million.
Liquidity Risk
Liquidity risk arises from this reportthe general funding needs of the Company’s activities and in the management of the Company’s assets and liabilities.
Counterparty Credit Risk
Credit risk relates to the risk of loss resulting from non-performance or non-payment by counterparties pursuant to the reduced disclosure format permittedterms of their contractual obligations. The Company monitors and manages credit risk through credit policies that include: (i) an established credit approval process; and (ii) the use of credit mitigation measures such as prepayment arrangements or volumetric limits. Risks surrounding counterparty performance and credit could ultimately impact the amount and timing of expected cash flows. The Company seeks to mitigate counterparty risk by General Instruction H(2)having a diversified portfolio of counterparties. See Note 5, Fair Value of Financial Instruments, to Form 10-Q.the consolidated financial statements for more information about concentration of credit risk.
ITEM 4 — Controls and Procedures
Conclusion Regarding the Effectiveness of Disclosure ControlsandProcedures
Under the supervision and with the participation of the Company'sCompany’s management, including its principal executive officer, principal financial officer and principal accounting officer, the Company conducted an evaluation of the effectiveness of the design and operation of its disclosure controls and procedures, as such term is defined in Rules 13a-15(e) or 15d-15(e) of the Exchange Act. Based on this evaluation, the Company'sCompany’s principal executive officer, principal financial officer and principal accounting officer concluded that the disclosure controls and procedures were effective as of the end of the period covered by this Quarterly Report on Form 10-Q.
Changes in Internal Control over Financial Reporting
There were no changes in the Company’s internal control over financial reporting (as such term is defined in Rule 13a-15(f) under the Exchange Act) that occurred induring the third quarter of 2017ended June 30, 2023 that materially affected, or are reasonably likely to materially affect, the Company’s internal control over financial reporting.
49
PART II -— OTHER INFORMATION
ITEM 1 — LEGAL PROCEEDINGS
For a discussion of the material legal proceedings in which the Company was involved through SeptemberJune 30, 2017,2023, see Note 11, 10, Contingencies, to this Form 10-Q.
ITEM 1A — RISK FACTORS
Information regarding risk factors appears in Part I, Item 1A, Risk Factors, in the Company's 2016Company’s 2022 Form 10-K and Part II, Item 1A of the Company's Form 10-Q for the quarter ended June 30, 2017.10-K. There have been no material changes in the Company'sCompany’s risk factors since those reported in its 20162022 Form 10-K and its Form 10-Q for the quarter ended June 30, 2017.10-K.
ITEM 2 — UNREGISTERED SALES OF EQUITY SECURITIES AND USE OF PROCEEDS
ITEM 3 — DEFAULTS UPON SENIOR SECURITIES
ITEM 4 — MINE SAFETY DISCLOSURES
Not applicable.
ITEM 5 — OTHER INFORMATION
During the three months ended June 30, 2023, no director or officer of the Company adopted or terminated a “Rule 10b5-1 trading arrangement” or “non-Rule 10b5-1 trading arrangement,” as each term is defined in Item 408(a) of Regulation S-K.
50
ITEM 6 — EXHIBITS
| Number | Description | Method of Filing | ||||||||||||
| Incorporated herein by reference to Exhibit 10.1 to the Company’s Current Report on Form 8-K filed on May 24, 2023. | ||||||||||||||
| 31.1 | Filed herewith. | |||||||||||||
| 31.2 | Filed herewith. | |||||||||||||
| Furnished herewith. | ||||||||||||||
| 101 INS | Inline XBRL Instance Document. | Filed herewith. | ||||||||||||
| 101 SCH | Inline XBRL Taxonomy Extension Schema. | Filed herewith. | ||||||||||||
| 101 CAL | Inline XBRL Taxonomy Extension Calculation Linkbase. | Filed herewith. | ||||||||||||
| 101 DEF | Inline XBRL Taxonomy Extension Definition Linkbase. | Filed herewith. | ||||||||||||
| 101 LAB | Inline XBRL Taxonomy Extension Label Linkbase. | Filed herewith. | ||||||||||||
| 101 PRE | Inline XBRL Taxonomy Extension Presentation Linkbase. | Filed herewith. | ||||||||||||
| 104 | Cover Page Interactive Data File (the cover page interactive data file does not appear in Exhibit 104 because its Inline XBRL tags are embedded within the Inline XBRL document). | Filed herewith. | ||||||||||||
† Schedules and similar attachments to this Exhibit have been omitted pursuant to Item 601(a)(5) of Regulation S-K. The Company agrees to furnish supplementally a copy of any omitted schedule or exhibit to the U.S. Securities and Exchange Commission upon request.
* Certain portions of this Exhibit have been redacted pursuant to Item 601(b)(10)(iv) of Regulation S-K. The omitted information is (i) not material and (ii) would likely cause competitive harm to the Company if publicly disclosed. The Company agrees to furnish supplementally an unredacted copy of this Exhibit to the SEC upon request.
51
SIGNATURES
Pursuant to the requirements of Section 13 or 15(d) of the Securities Exchange Act of 1934, the registrant has duly caused this report to be signed on its behalf by the undersigned thereunto duly authorized.
(Registrant) | ||||||||||||||
| /s/ CHRISTOPHER S. SOTOS | ||||||||||||||
| Christopher S. Sotos | ||||||||||||||
President and Chief Executive Officer (Principal Executive Officer) | ||||||||||||||
| /s/ SARAH RUBENSTEIN | ||||||||||||||
| Sarah Rubenstein | ||||||||||||||
| Date: August 8, 2023 | Executive Vice President and Chief Financial Officer (Principal Financial | |||||||||||||