
UNITED STATES
SECURITIES AND EXCHANGE COMMISSION
Washington, D.C. 20549
FORM 10–Q10-Q
(Mark One)
x QUARTERLY REPORT PURSUANT TO SECTION 13 OR 15(d) OF THE SECURITIES EXCHANGE ACT OF 1934
☒ | QUARTERLY REPORT PURSUANT TO SECTION 13 OR 15(d) OF THE SECURITIES EXCHANGE ACT OF 1934 |
For the quarterly period ended DecemberMarch 31, 20172023
or
¨TRANSITION REPORT PURSUANT TO SECTION 13 OR 15(d) OF THE SECURITIES EXCHANGE ACT OF 1934
☐ | TRANSITION REPORT PURSUANT TO SECTION 13 OR 15(d) OF THE SECURITIES EXCHANGE ACT OF 1934 |
For the transition period from ____________ to ________________
Commission file number: 000-55276
Verde Resources, Inc. |
(Exact name of registrant as specified in its charter) |
Nevada |
| 32-0457838 |
(State or other jurisdiction of incorporation or organization) |
| (I.R.S. Employer Identification No.) |
|
(Address of principal executive offices) |
|
|
( |
Indicate by check mark whether the registrant (1) has filed all reports required to be filed by Section 13 or 15(d) of the Securities Exchange Act of 1934 during the preceding 12 months (or for such shorter period that the Registrant was required to file such reports), and (2) has been subject to such filing requirements for the past 90 days. Yes x ☒ No ¨☐
Indicate by check mark whether the registrant has submitted electronically and posted on its corporate Web site, if any, every Interactive Data File required to be submitted and posted pursuant to Rule 405 of Regulation S-T (§232.405 of this chapter) during the preceding 12 months (or for such shorter period that the registrant was required to submit and post such files). Yes x ☒ No ¨☐
Indicate by check mark whether the registrant is a large accelerated filer, an accelerated filer, a non-accelerated filer, or a smaller reporting company. See the definitions of "large“large accelerated filer," "accelerated filer"” “accelerated filer” and "smaller“smaller reporting company"company” in Rule 12b-2 of the Exchange Act (Check one).
Large accelerated filer |
| Accelerated filer |
|
Non-accelerated |
| Smaller reporting company |
|
(Do not check if a smaller reporting company) |
| ||
Indicate by check mark whether the registrant is a shell company (as defined in Rule 12b-2 of the Exchange Act). Yes ¨ ☐ No x☒
As of FebruaryMay 12, 20182023 there were 96,038,9091,176,200,278 shares of the issuer's common stock,issuer’s Common Stock, par value $0.001, outstanding.
FORM 10-Q
FOR THE QUARTERLY PERIOD ENDED DECEMBERMARCH 31, 20172023
TABLE OF CONTENTS
|
| PAGE |
| ||
|
| ||||
|
|
| |||
|
|
| |||
|
|
| |||
|
|
|
| ||
|
|
| |||
|
|
| |||
|
|
| |||
|
|
| |||
|
|
| |||
|
|
| |||
|
|
| |||
|
|
| |||
|
|
| |||
|
|
| |||
Unregistered Sales of Equity Securities and Use of Proceeds. |
|
|
| ||
|
|
| |||
|
|
| |||
|
|
| |||
|
|
| |||
|
|
| |||
|
|
| |||
|
|
| |||
|
|
| |||
|
|
| |||
|
|
|
| 2 |
| Table of Contents |
CAUTIONARY NOTE CONCERNING FORWARD-LOOKING STATEMENTS
This Quarterly Report on Form 10-Q includes “forward-looking statements” within the meaning of Section 27A of the Securities Act of 1933, as amended, and Section 21E of the Securities Exchange Act of 1934, as amended, or the Exchange Act, that are not historical facts, and involve risks and uncertainties that could cause actual results to differ materially from those expected and projected. All statements, other than statements of historical facts, included in this Form 10-Q including, without limitation, statements in the “Management’s Discussion and Analysis of Financial Condition and Results of Operations” regarding the Company’s financial position, business strategy and the plans and objectives of management for future operations, events or developments which the Company expects or anticipates will or may occur in the future, including such things as future capital expenditures (including the amount and nature thereof); expansion and growth of the Company’s business and operations; and other such matters are forward-looking statements. These statements are based on certain assumptions and analyses made by the Company in light of its experience and its perception of historical trends, current conditions and expected future developments, as well as other factors it believes are appropriate under the circumstances. However, whether actual results or developments will conform with the Company’s expectations and predictions is subject to a number of risks and uncertainties, including general economic, market and business conditions; the business opportunities (or lack thereof) that may be presented to and pursued by the Company; changes in laws or regulation; and other factors, most of which are beyond the control of the Company.
These forward-looking statements can be identified by the use of predictive, future-tense or forward-looking terminology, such as “believes,” “anticipates,” “expects,” “estimates,” “plans,” “may,” “will,” or similar terms. These statements appear in a number of places in this filing and include statements regarding the intent, belief or current expectations of the Company, and its directors or its officers with respect to, among other things: (i) trends affecting the Company’s financial condition or results of operations for its limited history; (ii) the Company’s business and growth strategies; and, (iii) the Company’s financing plans. Investors are cautioned that any such forward-looking statements are not guarantees of future performance and involve significant risks and uncertainties, and that actual results may differ materially from those projected in the forward-looking statements as a result of various factors. Such factors that could adversely affect actual results and performance include, but are not limited to, the Company’s limited operating history, potential fluctuations in quarterly operating results and expenses, government regulation, technological change and competition. For information identifying important factors that could cause actual results to differ materially from those anticipated in the forward-looking statements, please refer to our filings with the SEC under the Exchange Act and the Securities Act of 1933, as amended, including our Current Report on Form 10-K filed with the Securities and Exchange Commission on November 4, 2022.
Consequently, all of the forward-looking statements made in this Form 10-Q are qualified by these cautionary statements and there can be no assurance that the actual results or developments anticipated by the Company will be realized or, even if substantially realized, that they will have the expected consequence to or effects on the Company or its business or operations. The Company assumes no obligations to update any such forward-looking statements.
| 3 |
| Table of Contents |
PART I - FINANCIAL INFORMATION
The accompanying unaudited condensed consolidated financial statements have been prepared in accordance with the instructions to Form 10-Q and Item Regulation S-X, Rule 10-01(c) Interim Financial Statements, and, therefore, do not include all information and footnotes necessary for a complete presentation of financial position, results of operations, cash flows, and stockholders’ equity in conformity with generally accepted accounting principles. In the opinion of management, all adjustments considered necessary for a fair presentation of the results of operations and financial position have been included and all such adjustments are of a normal recurring nature. Operating results for the nine months ended March 31, 2023 are not necessarily indicative of the results that can be expected for the year ended June 30, 2023.
VERDE RESOURCES, INC.
INDEX TO INTERIMUNAUDITED CONDENSED CONSOLIDATED FINANCIAL STATEMENTS
FOR THE PERIOD OF ENDED DECEMBERMARCH 31, 20172023
|
| Page |
|
|
|
| |
Condensed Consolidated Balance Sheets as at March 31, 2023 (Unaudited) and June 30, 2022 |
|
|
|
|
|
| |
|
|
| |
|
|
| |
|
|
| |
F-4 | |||
|
|
| |
Notes to Condensed Consolidated Financial Statements (Unaudited) |
|
|
|
| Table of Contents |
VERDE RESOURCES, INC.
UNAUDITED CONDENSED CONSOLIDATED BALANCE SHEETS
(Currency expressed in United States Dollars (“US$”), except for number of shares)
Condensed Consolidated Balance Sheets
|
| As at December 31, |
|
| As at June 30, |
| ||
|
| 2017 |
|
| 2017 |
| ||
ASSETS |
| (Unaudited) |
|
| (Audited) |
| ||
Current Assets |
|
|
|
|
|
| ||
Cash and cash equivalents |
| $ | 11,225 |
|
| $ | 38,616 |
|
Amount due from related parties |
|
| 4,614 |
|
|
| 4,088 |
|
Inventories |
|
| 13,278 |
|
|
| 8,832 |
|
Deposit & prepayment |
|
| 2,945 |
|
|
| 2,352 |
|
Total Current Assets |
| $ | 32,062 |
|
| $ | 53,888 |
|
Long Term Assets |
|
|
|
|
|
|
|
|
Property, plant and equipment |
| $ | 11,900 |
|
| $ | 23,388 |
|
Total Long Term Assets |
| $ | 11,900 |
|
| $ | 23,388 |
|
|
|
|
|
|
|
|
|
|
TOTAL ASSETS |
| $ | 43,962 |
|
| $ | 77,276 |
|
|
|
|
|
|
|
|
|
|
LIABILITIES AND STOCKHOLDERS' DEFICIT |
|
|
|
|
|
|
|
|
Current Liabilities |
|
|
|
|
|
|
|
|
Accounts payable |
| $ | 1,644,145 |
|
| $ | 1,560,749 |
|
Advanced from related parties |
|
| 766,798 |
|
|
| 728,634 |
|
Accrual |
|
| 63,550 |
|
|
| 101,979 |
|
Taxation payable |
|
| (34 | ) |
|
| 3,758 |
|
Loans from banks |
|
| 2,397 |
|
|
| 4,645 |
|
Total Current Liabilities |
| $ | 2,476,856 |
|
| $ | 2,399,765 |
|
Long term Liabilities |
|
|
|
|
|
|
|
|
Loans from banks (non-current) |
| $ | 1,441 |
|
| $ | 2,466 |
|
Total Long Term Liabilities |
| $ | 1,441 |
|
| $ | 2,466 |
|
|
|
|
|
|
|
|
|
|
TOTAL LIABILITIES |
| $ | 2,478,297 |
|
| $ | 2,402,231 |
|
|
|
|
|
|
|
|
|
|
STOCKHOLDERS' DEFICIT |
|
|
|
|
|
|
|
|
Preferred stock, par value $0.001, 50,000,000 shares authorized, none issued and outstanding |
|
| - |
|
|
| - |
|
Common stock, par value $0.001, 250,000,000 shares authorized, 96,038,909 shares issued and outstanding as of December 31, 2017 & June 30, 2017 respectively |
| $ | 96,039 |
|
| $ | 96,039 |
|
Additional paid-in capital |
|
| 2,055,243 |
|
|
| 2,055,243 |
|
Accumulated deficit |
|
| (4,568,446 | ) |
|
| (4,628,182 | ) |
Accumulated other comprehensive income (loss) |
|
| 554,494 |
|
|
| 731,182 |
|
Non-controlled interest |
|
| (571,665 | ) |
|
| (579,237 | ) |
Total Stockholders' Deficit |
| $ | (2,434,335 | ) |
| $ | (2,324,955 | ) |
|
|
|
|
|
|
|
|
|
TOTAL LIABILITIES AND STOCKHOLDERS' DEFICIT |
| $ | 43,962 |
|
| $ | 77,276 |
|
|
| March 31, 2023 |
|
| June 30, 2022 |
| ||
ASSETS |
|
|
|
|
|
| ||
Current assets: |
|
|
|
|
|
| ||
Cash and cash equivalents |
| $ | 241,371 |
|
| $ | 418,917 |
|
Accounts receivable |
|
| 13,760 |
|
|
| 21,028 |
|
Inventories |
|
| 97,336 |
|
|
| 87,035 |
|
Amount due from related party |
|
| 100 |
|
|
| - |
|
Prepayments |
|
| 450,470 |
|
|
| 722 |
|
Other receivables and deposits |
|
| 192,127 |
|
|
| 118,516 |
|
|
|
|
|
|
|
|
|
|
Total current assets |
|
| 995,164 |
|
|
| 646,218 |
|
|
|
|
|
|
|
|
|
|
Non-current assets: |
|
|
|
|
|
|
|
|
Property, plant and equipment, net |
|
| 7,272,555 |
|
|
| 1,048,893 |
|
Right of use assets, net |
|
| 663,455 |
|
|
| 685,714 |
|
Mining rights |
|
| - |
|
|
| 27,088 |
|
Intangible asset |
|
| 30,192,771 |
|
|
| - |
|
Security deposit |
|
| 80,000 |
|
|
| 320,000 |
|
Deposit paid for acquisition of subsidiaries |
|
| 22,609 |
|
|
| 25,935,550 |
|
Deposit paid for acquisition of property, plant and equipment |
|
| - |
|
|
| 5,000,000 |
|
|
|
|
|
|
|
|
|
|
Total non-current assets |
|
| 38,231,390 |
|
|
| 33,017,245 |
|
|
|
|
|
|
|
|
|
|
Assets of disposal group held for sale |
|
| 19,570 |
|
|
| - |
|
|
|
|
|
|
|
|
|
|
TOTAL ASSETS |
| $ | 39,246,124 |
|
| $ | 33,663,463 |
|
|
|
|
|
|
|
|
|
|
LIABILTIES AND STOCKHOLDERS’ EQUITY |
|
|
|
|
|
|
|
|
Current liabilities: |
|
|
|
|
|
|
|
|
Accounts payable |
| $ | 29,360 |
|
| $ | 18,211 |
|
Accrued liabilities and other payables |
|
| 579,374 |
|
|
| 283,656 |
|
Finance lease liabilities |
|
| 171,538 |
|
|
| 75,224 |
|
Operating lease liability |
|
| 19,851 |
|
|
| - |
|
Bank loan |
|
| 100,000 |
|
|
| - |
|
Promissory notes |
|
| - |
|
|
| 18,484,028 |
|
Amount due to director |
|
| 16,776 |
|
|
| - |
|
Amounts due to related parties |
|
| 178,492 |
|
|
| 555,527 |
|
|
|
|
|
|
|
|
|
|
Total current liabilities |
|
| 1,095,391 |
|
|
| 19,416,646 |
|
|
|
|
|
|
|
|
|
|
Non-current liabilities: |
|
|
|
|
|
|
|
|
Finance lease liabilities |
|
| 654,979 |
|
|
| 97,900 |
|
Operating lease liability |
|
| 35,032 |
|
|
| - |
|
Promissory notes |
|
| 481,023 |
|
|
| - |
|
|
|
|
|
|
|
|
|
|
Total non-current liabilities |
|
| 1,171,034 |
|
|
| 97,900 |
|
|
|
|
| �� |
|
|
|
|
Liabilities of disposal group held for sale |
|
| 40,007 |
|
|
| - |
|
|
|
|
|
|
|
|
|
|
TOTAL LIABILITIES |
|
| 2,306,432 |
|
|
| 19,514,546 |
|
|
|
|
|
|
|
|
|
|
Commitments and contingencies |
|
| - |
|
|
| - |
|
|
|
|
|
|
|
|
|
|
STOCKHOLDERS’ EQUITY |
|
|
|
|
|
|
|
|
Preferred stock, $0.001 par value, 50,000,000 shares authorized, none issued and outstanding |
|
| - |
|
|
| - |
|
Common stock, $0.001 par value; 10,000,000,000 shares authorized; 1,174,290,939 and 819,188,055 shares issued and outstanding as of March 31, 2023 and June 30, 2022 |
|
| 1,174,291 |
|
|
| 819,188 |
|
Common stock, $0.001 par value; 1,717,032 and 0 shares to be issued as of March 31, 2023 and June 30, 2022 |
|
| 1,717 |
|
|
| - |
|
Additional paid-in capital |
|
| 45,396,150 |
|
|
| 22,945,190 |
|
Accumulated other comprehensive income |
|
| 886,003 |
|
|
| 742,459 |
|
Accumulated deficit |
|
| (10,518,469 | ) |
|
| (10,357,920 | ) |
Stockholders’ equity |
|
| 36,939,692 |
|
|
| 14,148,917 |
|
|
|
|
|
|
|
|
|
|
TOTAL LIABILITIES AND STOCKHOLDERS’ EQUITY |
| $ | 39,246,124 |
|
| $ | 33,663,463 |
|
TheSee accompanying notes are an integral part of theseto unaudited condensed consolidated financial statements.
| Table of Contents |
VERDE RESOURCES, INC.
UNAUDITED CONDENSED CONSOLIDATED STATEMENTS OF OPERATIONS AND COMPREHENSIVE (LOSS) INCOME
(Currency expressed in United States Dollars (“US$”), except for number of shares)
Condensed Consolidated Statements of Operations
|
| Three Months Ended December 31, |
|
| Six Months Ended December 31, |
| ||||||||||
|
| 2017 |
|
| 2016 |
|
| 2017 |
|
| 2016 |
| ||||
|
|
|
|
|
|
|
|
|
|
|
|
| ||||
REVENUES |
|
|
|
|
|
|
|
|
|
|
|
| ||||
Revenue |
|
| 22,802 |
|
|
| 186,767 |
|
| $ | 43,523 |
|
| $ | 557,003 |
|
Cost of revenue |
|
| (35,046 | ) |
|
| (131,028 | ) |
|
| (46,079 | ) |
|
| (636,050 | ) |
Gross profit (loss) |
|
| (12,244 | ) |
|
| 55,739 |
|
|
| (2,556 | ) |
|
| (79,047 | ) |
OPERATING EXPENSES: |
|
|
|
|
|
|
|
|
|
|
|
|
|
|
|
|
Selling, general & administrative expenses |
|
| 25,325 |
|
|
| (102,371 | ) |
|
| 11,300 |
|
|
| (196,039 | ) |
PROFIT (LOSS) FROM OPERATIONS |
|
| 13,081 |
|
|
| (46,632 | ) |
| $ | 8,744 |
|
| $ | (275,086 | ) |
|
|
|
|
|
|
|
|
|
|
|
|
|
|
|
|
|
OTHER INCOME(EXPENSES) |
|
| 16,557 |
|
|
| 35,450 |
|
|
| 58,564 |
|
|
| 47,744 |
|
|
|
|
|
|
|
|
|
|
|
|
|
|
|
|
|
|
NET PROFIT (LOSS) BEFORE INCOME TAX |
|
| 29,638 |
|
|
| (11,182 | ) |
| $ | 67,308 |
|
| $ | (227,342 | ) |
|
|
|
|
|
|
|
|
|
|
|
|
|
|
|
|
|
Provision of Income Tax |
|
| - |
|
|
| - |
|
|
| - |
|
|
| - |
|
NET PROFIT (LOSS) |
|
| 29,638 |
|
|
| (11,182 | ) |
| $ | 67,308 |
|
| $ | (227,342 | ) |
|
|
|
|
|
|
|
|
|
|
|
|
|
|
|
|
|
Non-controlled interest |
|
| (185 | ) |
|
| (10,045 | ) |
|
| (7,572 | ) |
|
| 11,625 |
|
Net profit (loss) contributed to the group |
|
| 29,453 |
|
|
| (21,227 | ) |
|
| 59,736 |
|
|
| (215,717 | ) |
|
|
|
|
|
|
|
|
|
|
|
|
|
|
|
|
|
Other comprehensive income(loss) |
|
|
|
|
|
|
|
|
|
|
|
|
|
|
|
|
Foreign currency translation income(loss) |
|
| (128,578 | ) |
|
| 72,179 |
|
| $ | (176,688 | ) |
| $ | 158,538 |
|
|
|
|
|
|
|
|
|
|
|
|
|
|
|
|
|
|
Comprehensive income(loss) |
| $ | (99,125 | ) |
| $ | 50,952 |
|
| $ | (116,952 | ) |
| $ | (57,179 | ) |
|
|
|
|
|
|
|
|
|
|
|
|
|
|
|
|
|
Basic and Diluted Profit (Loss) per Common Share |
| $ | 0.0003 |
|
| $ | (0.0001 | ) |
| $ | 0.0007 |
|
| $ | (0.0024 | ) |
|
|
|
|
|
|
|
|
|
|
|
|
|
|
|
|
|
Weighted Average Number of Common Shares Outstanding |
|
| 96,038,909 |
|
|
| 93,715,539 |
|
|
| 96,038,909 |
|
|
| 93,715,539 |
|
|
| Three Months ended March 31, |
|
| Nine Months ended March 31, |
| ||||||||||
|
| 2023 |
|
| 2022 |
|
| 2023 |
|
| 2022 |
| ||||
|
|
|
|
|
|
|
|
|
|
|
|
| ||||
Revenue, net |
| $ | 26,586 |
|
| $ | 16,712 |
|
| $ | 134,038 |
|
| $ | 16,712 |
|
|
|
|
|
|
|
|
|
|
|
|
|
|
|
|
|
|
Cost of revenue |
|
| (44,308 | ) |
|
| (86,701 | ) |
|
| (123,903 | ) |
|
| (86,701 | ) |
|
|
|
|
|
|
|
|
|
|
|
|
|
|
|
|
|
Gross (loss)/profit |
|
| (17,722 | ) |
|
| (69,989 | ) |
|
| 10,135 |
|
|
| (69,989 | ) |
|
|
|
|
|
|
|
|
|
|
|
|
|
|
|
|
|
Operating expenses: |
|
|
|
|
|
|
|
|
|
|
|
|
|
|
|
|
General and administrative |
|
| (816,089 | ) |
|
| (498,774 | ) |
|
| (2,381,155 | ) |
|
| (1,221,875 | ) |
Total operating expenses |
|
| (816,089 | ) |
|
| (498,774 | ) |
|
| (2,381,155 | ) |
|
| (1,221,875 | ) |
|
|
|
|
|
|
|
|
|
|
|
|
|
|
|
|
|
LOSS FROM OPERATION |
|
| (833,811 | ) |
|
| (568,763 | ) |
|
| (2,371,020 | ) |
|
| (1,291,864 | ) |
|
|
|
|
|
|
|
|
|
|
|
|
|
|
|
|
|
Other (expense) income: |
|
|
|
|
|
|
|
|
|
|
|
|
|
|
|
|
Interest expense |
|
| (13,549 | ) |
|
| (486,977 | ) |
|
| (1,893,209 | ) |
|
| (1,441,911 | ) |
Other income |
|
| 194,917 |
|
|
| 99 |
|
|
| 196,514 |
|
|
| 12,214 |
|
Total other income (expense), net |
|
| 181,368 |
|
|
| (486,878 | ) |
|
| (1,696,695 | ) |
|
| (1,429,697 | ) |
|
|
|
|
|
|
|
|
|
|
|
|
|
|
|
|
|
LOSS BEFORE INCOME TAXES |
|
| (652,443 | ) |
|
| (1,055,641 | ) |
|
| (4,067,715 | ) |
|
| (2,721,561 | ) |
|
|
|
|
|
|
|
|
|
|
|
|
|
|
|
|
|
Income tax expense |
|
| - |
|
|
| - |
|
|
| - |
|
|
| - |
|
|
|
|
|
|
|
|
|
|
|
|
|
|
|
|
|
|
Loss from continuing operation |
|
| (652,443 | ) |
|
| (1,055,641 | ) |
|
| (4,067,715 | ) |
|
| (2,721,561 | ) |
Loss from discontinued operation |
|
| (55,884 | ) |
|
| - |
|
|
| (157,284 | ) |
|
| - |
|
NET LOSS |
|
| (708,327 | ) |
|
| (1,055,641 | ) |
|
| (4,224,999 | ) |
|
| (2,721,561 | ) |
|
|
|
|
|
|
|
|
|
|
|
|
|
|
|
|
|
Comprising: |
|
|
|
|
|
|
|
|
|
|
|
|
|
|
|
|
Net profit attributable to noncontrolling interest |
|
| - |
|
|
| 23,914 |
|
|
| - |
|
|
| 6,979 |
|
Net loss attributable to Verde Resources Inc., shareholders |
|
| (708,327 | ) |
|
| (1,079,555 | ) |
|
| (4,224,999 | ) |
|
| (2,728,540 | ) |
|
|
|
|
|
|
|
|
|
|
|
|
|
|
|
|
|
|
| $ | (708,327 | ) |
| $ | (1,055,641 | ) |
| $ | (4,224,999 | ) |
| $ | (2,721,561 | ) |
|
|
|
|
|
|
|
|
|
|
|
|
|
|
|
|
|
Other comprehensive income (loss) : |
|
|
|
|
|
|
|
|
|
|
|
|
|
|
|
|
– Foreign currency adjustment income (loss) |
|
| 154,912 |
|
|
| 11,600 |
|
|
| 143,544 |
|
|
| 15,171 |
|
Less: other comprehensive (loss) attributable to non-controlling interest |
|
| - |
|
|
| (13,285 | ) |
|
| - |
|
|
| (12,750 | ) |
Add: other comprehensive income attributable to Verde Resources Inc., shareholders |
|
| 154,912 |
|
|
| 24,885 |
|
|
| 143,544 |
|
|
| 27,921 |
|
|
|
|
|
|
|
|
|
|
|
|
|
|
|
|
|
|
COMPREHENSIVE LOSS |
| $ | (553,415 | ) |
| $ | (1,044,041 | ) |
| $ | (4,081,455 | ) |
| $ | (2,706,390 | ) |
|
|
|
|
|
|
|
|
|
|
|
|
|
|
|
|
|
Net loss per share |
|
|
|
|
|
|
|
|
|
|
|
|
|
|
|
|
– Basic |
| $ | 0.00 |
|
| $ | 0.00 |
|
| $ | 0.00 |
|
| $ | 0.00 |
|
– Diluted |
| $ | 0.00 |
|
| $ | 0.00 |
|
| $ | 0.00 |
|
| $ | 0.00 |
|
|
|
|
|
|
|
|
|
|
|
|
|
|
|
|
|
|
Weighted average Common Shares outstanding |
|
|
|
|
|
|
|
|
|
|
|
|
|
|
|
|
– Basic |
|
| 967,932,561 |
|
|
| 810,742,109 |
|
|
| 967,932,561 |
|
|
| 810,742,109 |
|
– Diluted |
|
| 979,305,136 |
|
|
| 819,188,055 |
|
|
| 979,305,136 |
|
|
| 819,188,055 |
|
TheSee accompanying notes are an integral part of theseto unaudited condensed consolidated financial statements.
| Table of Contents |
VERDE RESOURCES, INC.
UNAUDITED CONDENSED CONSOLIDATED STATEMENTS OF CASH FLOWS
(Currency expressed in United States Dollars (“US$”))
|
| Nine Months ended March 31, |
| |||||
|
| 2023 |
|
| 2022 |
| ||
|
|
|
|
|
|
| ||
Cash flows from operating activities: |
|
|
|
|
|
| ||
Net loss |
| $ | (4,224,999 | ) |
| $ | (2,721,561 | ) |
|
|
|
|
|
|
|
|
|
Adjustments to reconcile net loss to net cash (used in) provided by operating activities |
|
|
|
|
|
|
|
|
Depreciation of property, plant and equipment |
|
| 177,074 |
|
|
| 9,831 |
|
Amortization |
|
| 98,954 |
|
|
| 29,434 |
|
Stock-based compensation |
|
| 448,123 |
|
|
| 284,249 |
|
Finance cost interest element of promissory notes (non-cash) |
|
| 1,870,972 |
|
|
| 1,441,911 |
|
Lease interest expense |
|
| 22,237 |
|
|
| - |
|
Fair value adjustment on convertible promissory note |
|
| (194,865 | ) |
|
|
|
|
Gain on disposal of property, plant and equipment |
|
| (600 | ) |
|
| - |
|
Changes in operating assets and liabilities: |
|
|
|
|
|
|
|
|
Accounts receivable |
|
| 7,196 |
|
|
| (14,818 | ) |
Other receivables, deposits and prepayments |
|
| (96,124 | ) |
|
| (85,132 | ) |
Inventories |
|
| (10,600 | ) |
|
| (81,492 | ) |
Accounts payables |
|
| 25,970 |
|
|
| (719 | ) |
Accrued liabilities and other payables |
|
| 183,312 |
|
|
| 24,774 |
|
Advanced from director |
|
| (5,761 | ) |
|
| - |
|
Mining rights |
|
| - |
|
|
| 16,142 |
|
Advanced from related parties |
|
| 165,792 |
|
|
| - |
|
Net cash used in operating activities |
|
| (1,533,319 | ) |
|
| (1,097,381 | ) |
|
|
|
|
|
|
|
|
|
Cash flows from investing activities: |
|
|
|
|
|
|
|
|
Proceeds from disposal of property, plant and equipment |
|
| 23,000 |
|
|
| - |
|
Payments of deposit for property, plant and equipment |
|
| - |
|
|
| (240,000 | ) |
Advanced to related parties |
|
| - |
|
|
| 690 |
|
Proceed from disposal of discontinued operation, net |
|
| 107,824 |
|
|
| - |
|
Payments of deposit for acquisition of subsidiary company |
|
| (22,609 | ) |
|
| - |
|
Net cash flows on acquisition of subsidiary company |
|
| 1,140 |
|
|
| - |
|
Purchase of property, plant and equipment |
|
| (473,895 | ) |
|
| (70,332 | ) |
Net cash used in investing activities |
|
| (364,540 | ) |
|
| (309,642 | ) |
|
|
|
|
|
|
|
|
|
Cash flows from financing activities: |
|
|
|
|
|
|
|
|
Repayments to lease liabilities |
|
| (56,356 | ) |
|
| (5,220 | ) |
Drawdown of bank loan |
|
| 150,000 |
|
|
| - |
|
Repayment of bank loan |
|
| (50,000 | ) |
|
| - |
|
Lease interest paid |
|
| (22,237 | ) |
|
| - |
|
Advanced from related parties |
|
| - |
|
|
| 9,417 |
|
Proceeds from issuance of Common Stock |
|
| 1,556,280 |
|
|
| 1,000,000 |
|
Net cash provided by financing activities |
|
| 1,577,687 |
|
|
| 1,004,197 |
|
|
|
|
|
|
|
|
|
|
Net change in cash and cash equivalent |
|
| (320,172 | ) |
|
| (402,826 | ) |
|
|
|
|
|
|
|
|
|
Foreign currency translation adjustment |
|
| 142,626 |
|
|
| 7,787 |
|
|
|
|
|
|
|
|
|
|
Net change in cash and cash equivalents |
|
| (177,546 | ) |
|
| (395,039 | ) |
|
|
|
|
|
|
|
|
|
BEGINNING OF PERIOD |
|
| 418,917 |
|
|
| 2,117,622 |
|
|
|
|
|
|
|
|
|
|
END OF PERIOD |
| $ | 241,371 |
|
| $ | 1,722,583 |
|
|
|
|
|
|
|
|
|
|
SUPPLEMENTAL DISCLOSURE OF CASH FLOW INFORMATION: |
|
|
|
|
|
|
|
|
Cash paid for income taxes |
| $ | - |
|
| $ | - |
|
Cash paid for interest |
| $ | - |
|
| $ | - |
|
See accompanying notes to unaudited condensed consolidated financial statements.
| F-3 |
| Table of Contents |
VERDE RESOURCES, INC.
UNAUDITED CONDENSED CONSOLIDATED STATEMENTS OF CHANGES IN STOCKHOLDERS’ EQUITY
FOR THE NINE MONTHS ENDED MARCH 31, 2023 AND 2022
(Currency expressed in United States Dollars (“US$”), except for number of shares)
|
| No. of shares |
|
| Common Shares Stock |
|
| Shares to be issued Amount |
|
| Additional paid-in capital |
|
| Accumulated other comprehensive income |
|
| Accumulated losses |
|
| Accumulated other comprehensive income of disposal group held for sale |
|
| Total stockholders’ equity |
| ||||||||
|
|
|
|
|
|
|
|
|
|
|
|
|
|
|
|
|
|
|
|
|
|
|
|
| ||||||||
Balance as of July 1, 2022 |
|
| 819,188,055 |
|
| $ | 819,188 |
|
| $ | - |
|
| $ | 22,945,190 |
|
| $ | 742,459 |
|
| $ | (10,357,920 | ) |
| $ | - |
|
| $ | 14,148,917 |
|
|
|
|
|
|
|
|
|
|
|
|
|
|
|
|
|
|
|
|
|
|
|
|
|
|
|
|
|
|
|
|
|
|
Share issued to service provider |
|
| 5,315,000 |
|
|
| 5,315 |
|
|
| - |
|
|
| 870,185 |
|
|
| - |
|
|
| - |
|
|
| - |
|
|
| 875,500 |
|
Shares issued for private placement |
|
| 15,931,210 |
|
|
| 15,931 |
|
|
| - |
|
|
| 1,381,349 |
|
|
| - |
|
|
| - |
|
|
| - |
|
|
| 1,397,280 |
|
Shares issued for conversion of promissory note (“PN”) |
|
| 333,142,389 |
|
|
| 333,142 |
|
|
| - |
|
|
| 20,021,858 |
|
|
| - |
|
|
| - |
|
|
| - |
|
|
| 20,355,000 |
|
Fair value adjustment on conversion of PN |
|
| - |
|
|
| - |
|
|
| - |
|
|
| - |
|
|
| - |
|
|
| 4,064,450 |
|
|
| - |
|
|
| 4,064,450 |
|
Net loss for the period |
|
| - |
|
|
| - |
|
|
| - |
|
|
| - |
|
|
| - |
|
|
| (3,516,672 | ) |
|
| - |
|
|
| (3,516,672 | ) |
Foreign currency translation adjustment |
|
| - |
|
|
| - |
|
|
| - |
|
|
| - |
|
|
| (11,368 | ) |
|
| - |
|
|
| - |
|
|
| (11,368 | ) |
|
|
|
|
|
|
|
|
|
|
|
|
|
|
|
|
|
|
|
|
|
|
|
|
|
|
|
|
|
|
|
|
|
Balance as of December 31,2022 |
|
| 1,173,576,654 |
|
| $ | 1,173,576 |
|
| $ | - |
|
| $ | 45,218,582 |
|
| $ | 731,091 |
|
| $ | (9,810,142 | ) |
| $ | - |
|
| $ | 37,313,107 |
|
|
|
|
|
|
|
|
|
|
|
|
|
|
|
|
|
|
|
|
|
|
|
|
|
|
|
|
|
|
|
|
|
|
Shares issued to service provider |
|
| 714,285 |
|
|
| 715 |
|
|
| - |
|
|
| 49,285 |
|
|
| - |
|
|
| - |
|
|
| - |
|
|
| 50,000 |
|
Shares to be issued for private placement |
|
| 1,717,032 |
|
|
| - |
|
| 1,717 |
|
|
| 128,283 |
|
|
| - |
|
|
| - |
|
|
| - |
|
|
| 130,000 |
| |
Net loss for the period |
|
| - |
|
|
| - |
|
|
| - |
|
|
| - |
|
|
| - |
|
|
| (708,327 | ) |
|
| - |
|
|
| (708,327 | ) |
Foreign currency translation adjustment |
|
| - |
|
|
| - |
|
|
| - |
|
|
| - |
|
|
| 154,912 |
|
|
| - |
|
|
| - |
|
|
| 154,912 |
|
Reclassification arising from disposal group held for sale |
|
| - |
|
|
| - |
|
|
| - |
|
|
| - |
|
|
| (811,346 | ) |
|
| - |
|
|
| 811,346 |
|
|
| - |
|
|
|
|
|
|
|
|
|
|
|
|
|
|
|
|
|
|
|
|
|
|
|
|
|
|
|
|
|
|
|
|
|
|
Balance as of March 31, 2023 |
|
| 1,176,007,971 |
|
| $ | 1,174,291 |
|
| $ | 1,717 |
|
| $ | 45,396,150 |
|
| $ | 74,657 |
|
| $ | (10,518,469 | ) |
| $ | 811,346 |
|
| $ | 36,939,692 |
|
| F-4 |
| Table of Contents |
Condensed Consolidated StatementsVERDE RESOURCES, INC.
UNAUDITED CONDENSED CONSOLIDATED STATEMENTS OF CHANGES IN STOCKHOLDERS’ EQUITY
FOR THE NINE MONTHS ENDED MARCH 31, 2023 AND 2022
(Currency expressed in United States Dollars (“US$”), except for number of Cash Flows
(Unaudited)shares)
|
| December 31, 2017 |
|
| December 31, 2016 |
| ||
Cash flows from operating activities: |
|
|
|
|
|
| ||
Net profit (loss) |
| $ | 67,308 |
|
| $ | (227,342 | ) |
Adjustments to reconcile loss to net cash used in operation |
|
|
|
|
|
|
|
|
Depreciation |
|
| 12,475 |
|
|
| 83,475 |
|
Waiver of consultancy service fee |
|
| (17,006 | ) |
|
| - |
|
Changes in operating assets and liabilities |
|
|
|
|
|
|
|
|
(Increase) decrease in: |
|
|
|
|
|
|
|
|
Accounts receivable from related parties |
|
| (267 | ) |
|
| (214 | ) |
Deposits and prepayment |
|
| - |
|
|
| (2,086 | ) |
Inventory |
|
| (3,773 | ) |
|
| 72,000 |
|
Increase (decrease) in: |
|
|
|
|
|
|
|
|
Accounts payable |
|
| 6,489 |
|
|
| 47,470 |
|
Accrued liabilities |
|
| (39,394 | ) |
|
| (52,385 | ) |
GST payable |
|
| (4,904 | ) |
|
| 687 |
|
Advanced from sub-contractor & related parties |
|
| (8,758 | ) |
|
| 11,382 |
|
Deposit received from customer |
|
| - |
|
|
| - |
|
Net cash (used in) operating activities |
|
| 12,170 |
|
|
| (67,013 | ) |
|
|
|
|
|
|
|
|
|
Cash flows from financing activities: |
|
|
|
|
|
|
|
|
Repayments of bank loans |
|
| (3,581 | ) |
|
| (5,217 | ) |
Proceeds from issuance of common stock |
|
| - |
|
|
| 190,000 |
|
Net cash provided by (used in) financing activities |
|
| (3,581 | ) |
|
| 184,783 |
|
|
|
|
|
|
|
|
|
|
Net increase (decrease) in cash and cash equivalent |
|
| 8,589 |
|
|
| 117,770 |
|
|
|
|
|
|
|
|
|
|
Effect of exchange rate changes on cash |
|
| (35,980 | ) |
|
| (43,275 | ) |
|
|
|
|
|
|
|
|
|
Net increase (decrease) in cash and cash equivalents |
|
| (27,391 | ) |
|
| 74,495 |
|
Cash and cash equivalents at beginning of year |
|
| 38,616 |
|
|
| 16,113 |
|
Cash and cash equivalents at end of year |
| $ | 11,225 |
|
| $ | 90,608 |
|
|
|
|
|
|
|
|
|
|
Supplementary cash flow information |
|
|
|
|
|
|
|
|
Income taxes paid |
| $ | - |
|
| $ | - |
|
Interest paid |
| $ | 119 |
|
| $ | 280 |
|
Supplementary non-cash information |
|
|
|
|
|
|
|
|
Reorganization |
|
| - |
|
|
| - |
|
Issuance of common stock |
|
| - |
|
|
| - |
|
|
| No. of shares |
|
| Common Shares Amount |
|
| Shares to be issued Amount |
|
| Additional paid-in capital |
|
| Accumulated other comprehensive income |
|
| Accumulated losses |
|
| Non- controlling interest |
|
| Total stockholders’ equity |
| ||||||||
|
|
|
|
|
|
|
|
|
|
|
|
|
|
|
|
|
|
|
|
|
|
|
|
| ||||||||
Balance as of July 1, 2021 |
|
| 779,742,109 |
|
| $ | 779,742 |
|
|
| - |
|
| $ | 20,699,067 |
|
| $ | 646,205 |
|
| $ | (5,913,255 | ) |
| $ | (441,834 | ) |
| $ | 15,769,925 |
|
|
|
|
|
|
|
|
|
|
|
|
|
|
|
|
|
|
|
|
|
|
|
|
|
|
|
|
|
|
|
|
|
|
Shares issued for acquisition |
|
| 31,000,000 |
|
|
| 31,000 |
|
|
| - |
|
|
| 899,000 |
|
|
| - |
|
|
| - |
|
|
| - |
|
|
| 930,000 |
|
Stock based compensation |
|
| - |
|
|
| - |
|
|
| - |
|
|
| 191,222 |
|
|
| - |
|
|
| - |
|
|
| - |
|
|
| 191,222 |
|
Net loss for the period |
|
| - |
|
|
| - |
|
|
| - |
|
|
| - |
|
|
| - |
|
|
| (1,648,985 | ) |
|
| (16,935 | ) |
|
| (1,665,920 | ) |
Foreign currency translation adjustment |
|
| - |
|
|
| - |
|
|
| - |
|
|
| - |
|
|
| 3,036 |
|
|
| - |
|
|
| 535 |
|
|
| 3,571 |
|
|
|
|
|
|
|
|
|
|
|
|
|
|
|
|
|
|
|
|
|
|
|
|
|
|
|
|
|
|
|
|
|
|
Balance as of December 31, 2021 |
|
| 810,742,109 |
|
| $ | 810,742 |
|
| $ | - |
|
| $ | 21,789,289 |
|
| $ | 649,241 |
|
| $ | (7,562,240 | ) |
| $ | (458,234 | ) |
| $ | 15,228,798 |
|
|
|
|
|
|
|
|
|
|
|
| - |
|
|
|
|
|
|
|
|
|
|
|
|
|
|
|
|
|
|
|
|
|
Shares to be issued for private placement |
|
| 8,445,946 |
|
|
| - |
|
|
| 8,446 |
|
|
| 991,554 |
|
|
| - |
|
|
| - |
|
|
| - |
|
|
| 1,000,000 |
|
Stock based compensation |
|
| - |
|
|
| - |
|
|
| - |
|
|
| 93,027 |
|
|
| - |
|
|
| - |
|
|
| - |
|
|
| 93,027 |
|
Net loss for the period |
|
| - |
|
|
| - |
|
|
| - |
|
|
| - |
|
|
| - |
|
|
| (1,079,555 | ) |
|
| 23,914 |
|
|
| (1,055,641 | ) |
Foreign currency translation adjustment |
|
| - |
|
|
| - |
|
|
| - |
|
|
| - |
|
|
| 24,885 |
|
|
| - |
|
|
| (13,285 | ) |
| 11,600 |
| |
Accretion of interest |
|
| - |
|
|
| - |
|
|
| - |
|
|
| - |
|
|
| 202,628 |
|
|
| (685,852 | ) |
|
| 447,605 |
|
|
| (35,619 | ) |
|
|
|
|
|
|
|
|
|
|
|
|
|
|
|
|
|
|
|
|
|
|
|
|
|
|
|
|
|
|
|
|
|
Balance as of March 31, 2022 |
|
| 819,188,055 |
|
| $ | 810,742 |
|
| $ | 8,446 |
|
| $ | 22,873,870 |
|
| $ | 876,754 |
|
| $ | (9,327,647 | ) |
| $ | - |
|
| $ | 15,242,165 |
|
TheSee accompanying notes are an integral part of theseto unaudited condensed consolidated financial statements.
| Table of Contents |
VERDE RESOURCES, INC.
NOTES TO UNAUDITED CONDENSED CONSOLIDATED FINANCIAL STATEMENTS
FOR THE THREE AND NINE MONTHS ENDED MARCH 31, 2023 AND 2022
(Currency expressed in United States Dollars (“US$”), except for number of shares)
Notes to Condensed Consolidated Financial Statements
December 31, 2017
(Unaudited)
NOTE 1 - ORGANIZATION AND DESCRIPTION OF BUSINESS BACKGROUND
Verde Resources, Inc. (the "Company"“We” or "VRDR"“Company” or “VRDR”) was incorporated on April 22, 2010, in the State of Nevada, U.S.A. U.S.A..
The accountingCompany currently is engaged in the distribution of THC-free cannabinoid (CBD) products, production and reporting policiesdistribution of renewable commodities and real property holding. However, the Company has been undergoing a restructuring exercise to shift its focus towards renewable energy and sustainability development with the world faced with challenges of climate change and environmental dehydration. The Company has initiated the disposition of the mining business via the sale of the entire issued and paid-up share capital of CSB to focus on renewable energy and sustainability.
As of March 31, 2023, the Company conformhas the following subsidiaries:-
Company name | Place of incorporation | Principal activities and place of operation | Effective interest held | |||
Verde Resources Asia Pacific Limited (“VRAP”) (fka Gold Billion Global Limited) | British Virgin Islands | Investment holding | 100% | |||
Verde Resources (Malaysia) Sdn Bhd (“VRSB”) | Malaysia | Provision of consultation service and distribution of renewable agricultural commodities | 100% | |||
Verde Renewables, Inc. (“VRI”) | State of Missouri, U.S.A. | Management of a processing and packaging facility | 100% | |||
Verde Life Inc. (“VLI”) | State of Oregon, U.S.A. | Distribution of THC-free cannabinoid (CBD) products | 100% | |||
Champmark Sdn Bhd (“Champmark”) | Malaysia | Mining of minerals | 100%* | |||
The Wision Project Sdn Bhd (“Wision”) | Malaysia | Digital innovation, marketing & consulting service, PR, branding, influencer marketing, event management and media relations services | 100% | |||
Verde Estates LLC (“VEL”) | State of Missouri, U.S.A. | Holding real property | 100% | |||
Bio Resources Limited (“BRL”) | Labuan, Malaysia | Provision of proprietary pyrolysis technology and investment holding | 100%** |
* The disposition of Champmark was initiated on March 13, 2023 and subsequently completed on April 20, 2023.
** The acquisition of BRL was completed on October 12, 2022.
The Company and its subsidiaries are hereinafter referred to as (the “Company”).
On March 23, 2023, the Company initiated the acquisition of 60% equity interest in Vata VM Synergy (M) Sdn Bhd (“VATA”), a company incorporated in Malaysia and engaged in the provision of green technology and creating high quality compost using agricultural waste and biomass products. The initial deposit has been paid and the transaction is yet to be completed as of today.
NOTE 2 - SUMMARY OF SIGNIFICANT ACCOUNTING POLICIES
The accompanying unaudited condensed consolidated financial statements reflect the application of certain significant accounting policies as described in this note and elsewhere in the accompanying unaudited condensed consolidated financial statements and notes.
· | Basis of Presentation |
The accompanying unaudited condensed consolidated financial statements have been prepared by management in accordance with both accounting principles generally accepted in the United States of America,(“GAAP”), and the Company's fiscal year end is June 30.
Gold Billion Global Limited ("Gold Billion" or "GBL") was incorporated in British Virgin Islands on February 7, 2013. GBL was setup by the Boardinstructions to Form 10-Q and Rule 10-01 of Directors of Federal Mining Resources Limited ("FMR"). The major operation of GBL is to manage and monitor the mineral exploration and mining projects of FMR.
On July 1, 2013, FMR has assigned its rights and obligation on Champmark Sdn Bhd ("CSB") to GBL. Four of the five members of CSB Board of Directors were appointed by FMR, with two of the GBL Board of Directors currently sitting on the CSB Board. According to ASC 810-05-08 A, CSB is a deemed subsidiary of GBL where it has controlled the CSB Board of Directors, has assigned rights to receive future benefits and residual value, and obligation to absorb loss and finance for CSB by GBL. GBL has the power to direct the activities of CSB that most significantly impact CSB's economic performance and the obligation to absorb losses of CSB that could potentially be significant to the CSB or the right to receive benefits from CSB that could potentially be significant to CSB. GBL is the primary beneficiary of CSB because it has been assigned with all relevant rights and obligation and can direct the activities of CSB through the common directors and the 85% shareholder, FMR. Under 810-23-42, 43, it is determined that CSB is de-facto agent of GBL and GBL is the de-facto principal of CSB. GBL started to consolidate CSB from July 1, 2013 and the Company consolidated GBL and CSB from October 25, 2013 onwards.
On February 17, 2014, the Company entered into a Supplementary Agreement to the Assignment Agreement and completed an acquisition of GBL pursuant to the Supplementary Agreement. The acquisition was a reverse acquisition in accordance with ASC 805-40 "Reverse Acquisitions". The legal parent was VRDR which was the accounting acquiree while GBL was the accounting acquirer. There was a 15% non-controlling interest of Champmark SDN BHD ("CSB") after the acquisition. This transaction was accounted for as a recapitalization effected by a share exchange, wherein GBL with its 85% deemed subsidiary CSB was considered the acquirer for accounting and financial reporting purposes. The assets and liabilities of the acquired entity have been brought forward at their book value and no goodwill has been recognized.
As a result of the acquisition, the Company holds 100% equity interest in GBL and 85% variable interest in CSB. Our consolidated subsidiaries include GBL being our wholly-owned subsidiary and 85% of CSB being a variable interest entity (VIE) and deemed subsidiary of GBL.
On March 17, 2014, the Company through GBL and its deemed subsidiary CSB entered into a Sub-Contract Agreement with Borneo Oil & Gas Corporation Sdn Bhd ("BOG") for the engagement of its sub-contractor services to carry out exploration and exploitation works on alluvial and lode gold resources at Site IV-1 of the Merapoh Mine. The Sub-Contract Agreement is for a period of 5 years with a renewal for another 5 years subject to review by both parties. BOG is a wholly-owned subsidiary of Borneo Oil Berhad (BOB) which is listed on the main market of Kuala Lumpur Stock Exchange. BOG being a local company in Malaysia provides the Company with the advantage of local knowledge and well-established connection in dealing with the relevant local authorities in our mining operations.
On April 1, 2014, GBL purchased 85% equity interest of CSB, and CSB became indirect subsidiary of the Company.
Effective August 27, 2014, the Company's Articles of Incorporation were amended to increase the authorized shares of the Company from 100,000,000 shares of common stock to 250,000,000 shares of common stock. A copy of the Certificate of Amendment was filed with the Nevada Secretary of State. The Form 8K announcing the increase of the authorized shares of the Company was filed with SEC on September 15, 2014.
Effective February 20, 2016, Mr. Wu Ming Ding resigned all of his positions as President and Director of the Company with Mr. Balakrishnan B S Muthu being appointed President to fill the vacancy created. Effective February 20, 2016, Mr. Chen Ching was appointed Director of the Company and the entire Board of Directors now consists of Mr. Balakrishnan B S Muthu and Mr. Chen Ching. The SC 14F1 and Form 8-K announcing the change in officers and directors were filed with SEC on February 10, 2016 and February 22, 2016 respectively.
Effective February 2, 2018, the Company's Articles of Incorporation were amended to increase the authorized shares of the Company from 250,000,000 shares of common stock to 10,000,000,000 shares of common stock. A copy of the Certificate of Amendment was filed with the Nevada Secretary of State. The Form 8K announcing the increase of the authorized shares of the Company was filed with SEC on February 6, 2018.
NOTE 2 - SUMMARY OF SIGNIFICANT ACCOUNTING POLICIES
Condensed Consolidated Financial Statements
Regulation S-X. Certain information and footnotenote disclosures normally included in audited financial statements prepared in accordance with accounting principles generally accepted in the United States of Americaaccounting principles have been condensed or omitted. Theomitted pursuant to those rules and regulations, although the Company believes that the disclosures made are adequate to make the information not misleading.
| F-6 |
| Table of Contents |
In the opinion of management, the condensed consolidated balance sheet as of June 30, 2022 which has been derived from audited financial statements and these unaudited condensed consolidated financial statements reflect all normal and recurring adjustments considered necessary to state fairly the results of operations for the periods presented. The results for the period ended DecemberMarch 31, 20172023 are not necessarily indicative of the operating results to be expected for the full years.entire fiscal year ending June 30, 2023 or for any future period.
Basis of Presentation
The accounting and reporting policies of the Company conform to accounting principles generally accepted in the United States of America (GAAP). These unaudited condensed consolidated financial statements are expressedand notes thereto should be read in United States dollars ($). Financial statements prepared in accordanceconjunction with GAAP contemplate the realization of assetsManagement’s Discussion and the satisfaction of liabilities in the normal course of business. These condensed consolidated audited financial statements include all adjustments that, in the opinion of management, are necessary in order to make the financial statements not misleading.
Basis of Consolidation
The condensed consolidated financial statements include the financial statements of Verde Resources, Inc., its wholly owned subsidiary Gold Billion Global Limited ("GBL") and the 85% of the deemed subsidiary variable interest of Champmark SDN BHD ("CSB"). All inter-company balances and transactions between the Company and its subsidiary and variable interest entity (VIE) have been eliminated upon consolidation.
The Company has adopted ASC Topic 810-10-5-8, "Variable Interest Entities", which requires a variable interest entity or VIE to be consolidated by a company if that company is subject to a majority of the risk of loss for the VIE or is entitled to receive a majority of the VIE's residual returns.
Variable Interest Entity
On July 1, 2013, the Company's subsidiary, GBL entered into a series of agreements ("VIE agreements") with FMR and details of the VIE agreements are as follows :
|
| |
|
| |
|
| |
|
| |
|
| |
|
| |
|
| |
|
| |
|
| |
|
| |
With the above agreements, GBL demonstrates its ability to control CSB as the primary beneficiary and the operating results of the VIE wasnotes thereto included in the condensed consolidated financial statementsAnnual Report on Form 10-K for the year ended June 30, 2014.2022, filed with the SEC on November 4, 2022.
On April 1, 2014, the Board of Director of GBL notified FMR upon the decision to exercise the right of option to purchase 85% equity interest of CSB under Management Agreement Section 3.2.4 dated July 1, 2013 between GBL and FMR. This acquisition was completed on April 1, 2014 with consideration of US$1. GBL then became 85% shareholder of CSB and is required to consolidate CSB as a subsidiary.
· | Use of Estimates and Assumptions |
Use of Estimates
The preparation of unaudited condensed consolidated financial statements in conformity with accounting principles generally accepted in the United States of AmericaGAAP requires management to make estimates and assumptions that affect the reported amounts of assets and liabilities and disclosure of contingent assets and liabilities at the date of the financial statements and the reported amount of revenues and expenses during the reporting period. Actual results could differ from those estimates. The Company'sCompany’s periodic filings with the Securities and Exchange Commission include, where applicable, disclosures of estimates, assumptions, uncertainties and markets that could affect the financial statements and future operations of the Company.
CashIn preparing these unaudited condensed consolidated financial statements, management makes estimates and Cash Equivalentsassumptions that affect the reported amounts of assets and liabilities in the balance sheet and revenues and expenses during the periods reported. Actual results may differ from these estimates.
Cash and cash equivalents include cash in banks, money market funds, and certificates of term deposits with maturities of less than three months, which are readily convertible to known amounts of cash and which, in the opinion of management, are subject to an insignificant risk of loss in value. The Company had $11,225 and $38,616 in cash and cash equivalents at December 31, 2017 and June 30, 2017, respectively.
Concentrations of Credit Risk
· | Basis of Consolidation |
The Company'sunaudited condensed consolidated financial statements include the financial statements of Verde Resources, Inc. and its subsidiaries. All significant inter-company balances and transactions within the Company and its subsidiaries have been eliminated upon consolidation. The Company accounts for acquisitions in accordance with guidance found in ASC 805, Business Combinations. The guidance requires consideration given, including contingent consideration, assets acquired, and liabilities assumed to be valued at their fair market values at the acquisition date.
· | Segment Reporting |
Accounting Standard Codification (“ASC”) Topic 280, Segment Reporting establishes standards for reporting information about operating segments on a basis consistent with the Company’s internal organization structure as well as information about geographical areas, business segments and major customers in consolidated financial statements. Currently, the Company operates in four reportable operating segments.
· | Concentrations of Credit Risk |
The Company’s financial instruments that are exposed to concentrations of credit risk primarily consist of its cash and cash equivalents and related party payables it will likely incur in the near future. The Company places its cash and cash equivalents with financial institutions of high credit worthiness. At times, its cash and cash equivalents with a particular financial institution may exceed any applicable government insurance limits. The Company'sCompany’s management plans to assess the financial strength and credit worthiness of any parties to which it extends funds, and as such, it believes that any associated credit risk exposures are limited.
· | Risks and Uncertainties |
The Company operates in the resource exploration industry and the production and distribution of renewable commodities that isare subject to significant risks and uncertainties, including financial, operational, technological, and other risks associated with operating a resource exploration business and a production operation for renewable commodities, including the potential risk of business failure.
· | Cash and Cash Equivalents |
Cash and cash equivalents are carried at cost and represent cash in banks, money market funds, and certificates of term deposits with maturities of less than three months, which are readily convertible to known amounts of cash and which, in the opinion of management, are subject to an insignificant risk of loss in value. The Company had $241,371 and $418,917 in cash and cash equivalents at March 31, 2023 and June 30, 2022.
At March 31, 2023 and June 30, 2022, cash and cash equivalents consisted of bank deposits and petty cash on hands.
· | Accounts Receivable |
Accounts receivable are recognized and carried at net realizable value. An allowance for doubtful accounts will be recorded in the period when a loss is probable based on an assessment of specific evidence indicating troubled collection, historical experience, accounts aging, ongoing business relation and other factors. Accounts are written off after exhaustive efforts at collection. If accounts receivable are to be provided for, or written off, they would be recognized in the consolidated statement of operations within operating expenses. At March 31, 2023 and June 30, 2022, the Company has no allowance for doubtful accounts, as per management'smanagement’s judgment based on their best knowledge. As of DecemberMarch 31, 20172023 and June 30, 2017,2022, the longest credit term for certain customers are 60 days.
| F-7 |
| Table of Contents |
Provision
· | Inventories |
Inventories are stated at the lower of cost or market value (net realizable value), cost being determined on a first-in-first-out method. Costs include material, labor and overhead costs. The Company provides inventory allowances based on excess and obsolete inventories determined principally by customer demand.
As of March 31, 2023 and June 30, 2022, the Company did not record an allowance for Doubtful Accountsobsolete inventories, nor have there been any write-offs.
· | Property, Plant and Equipment |
Property, plant and equipment are stated at cost less accumulated depreciation and accumulated impairment losses, if any. Depreciation is calculated on the straight-line basis over the following expected useful lives from the date on which they become fully operational and after taking into account their estimated residual values:
Expected useful life | |||
Land and buildings | 3-27.5 years | ||
Plant and machinery | 5-10 years | ||
Office equipment | 3 years | ||
Project equipment | 5 years | ||
Computer | 5 years | ||
Motor vehicle | 5 years | ||
Furniture & fittings | 5 years |
Expenditures for maintenance and repairs, which do not materially extend the useful lives of the assets, are charged to expense as incurred. Expenditures for major renewals and betterment which substantially extend the useful life of assets are capitalized. The cost and related accumulated depreciation of assets retired or sold are removed from the respective accounts, and any gain or loss is recognized in the unaudited condensed consolidated statements of income and other comprehensive income in other income or expenses.
· | Intangible assets |
Intangible assets acquired from third parties are measured initially at fair value, and have a finite lives of 10 years, which are reviewed for indicators of impairment at least annually. These intangible assets are to be amortized over these estimated useful lives on a straight-line basis, upon the success of its commercial operation.
· | Disposal group held for sale |
Disposal group comprising assets and liabilities, that are expected to be recovered primarily through sale rather than through continuing use, are classified as held for sale. Immediately before classification as held for sale, the assets or components of a disposal group, are remeasured at the lower of their carrying amount and fair value less costs of disposal. Mining rights and property, plant and equipment once classified as held for sale are not amortised or depreciated.
· | Impairment of Long-lived Assets |
In accordance with the provisions of ASC Topic 360, Impairment or Disposal of Long-Lived Assets, all long-lived assets such as property and equipment and intangible assets owned and held by the Company are reviewed for impairment whenever events or changes in circumstances indicate that the carrying amount of an asset may not be recoverable. Recoverability of assets to be held and used is evaluated by a comparison of the carrying amount of an asset to its estimated future undiscounted cash flows expected to be generated by the asset. If such assets are considered to be impaired, the impairment to be recognized is measured by the amount by which the carrying amounts of the assets exceed the fair value of the assets.
· | Revenue Recognition |
ASC Topic 606, Revenue from Contracts with Customers (“ASC Topic 606”), establishes principles for reporting information about the nature, amount, timing and uncertainty of revenue and cash flows arising from the entity’s contracts to provide goods or services to customers.
The Company maintains an allowanceapplies the following five steps in order to determine the appropriate amount of revenue to be recognized as it fulfills its obligations under each of its agreements:
· | identify the contract with a customer; |
· | identify the performance obligations in the contract; |
· | determine the transaction price; |
· | allocate the transaction price to performance obligations in the contract; and |
· | recognize revenue as the performance obligation is satisfied. |
| F-8 |
| Table of Contents |
Revenue is recognized when the Company satisfies its performance obligation under the contract by transferring the promised product to its customer that obtains control of the product and collection is reasonably assured. A performance obligation is a promise in a contract to transfer a distinct product or service to a customer. Most of the Company’s contracts have a single performance obligation, as the promise to transfer products or services is not separately identifiable from other promises in the contract and, therefore, not distinct.
Product sales
Revenues from product sales are recognized when the customer obtains control of the Company’s product, which occurs at a point in time, typically upon delivery to the customer. The Company expenses incremental costs of obtaining a contract as and when incurred if the expected amortization period of the asset that it would have recognized is one year or less or the amount is immaterial.
Revenues from product sales are recorded net of reserves established for doubtful accountsapplicable discounts and allowances that are offered within contracts with the Company’s customers.
Product revenue reserves, which are classified as a reduction in product revenues, are generally characterized in the following categories: discounts, returns and rebates. These reserves are based on estimates of the amounts earned or to reserve for potentially uncollectible receivablesbe claimed on the related sales and reviewsare classified as reductions of accounts receivable as the amount is payable to the Company’s customer.
Gold mining
Revenue from the sales of gold mineral or other minerals to registered gold trading companies or other customers in Malaysia is recognized as revenue in accordance with the following core principles: at the time of gold or minerals sales, the contract with customers and the performance obligations are identified. The transaction and selling price is determined by amounts duethe prevailing market value of gold bullion quoted by the leading registered gold trading company in Malaysia or at an agreed price. Sales invoice will be prepared to reflect the proper transaction price based on the performance obligation allocation. After delivery is completed and the performance obligation is satisfied, sales invoice will be presented to the customers whichand so revenue is then recognized accordingly.
· | Leases |
The Company determines if an arrangement is a lease or contains a lease at inception. Operating lease liabilities are past duerecognized based on the present value of the remaining lease payments, discounted using the discount rate for the lease at the commencement date. As the rate implicit in the lease is not readily determinable for the operating lease, the Company generally uses an incremental borrowing rate based on information available at the commencement date to identify specific customers with known disputes or collectability issues. In determiningdetermine the present value of future lease payments. Operating lease right-of-use (“ROU assets”) assets represent the Company’s right to control the use of an identified asset for the lease term and lease liabilities represent the Company’s obligation to make lease payments arising from the lease. ROU assets are generally recognized based on the amount of the reserve,initial measurement of the lease liability. Lease expense is recognized on a straight-line basis over the lease term.
ROU assets are reviewed for impairment when indicators of impairment are present. ROU assets from operating and finance leases are subject to the impairment guidance in ASC Topic 360, Property, Plant, and Equipment, as ROU assets are long-lived nonfinancial assets.
ROU assets are tested for impairment individually or as part of an asset group if the cash flows related to the ROU asset are not independent from the cash flows of other assets and liabilities. An asset group is the unit of accounting for long-lived assets to be held and used, which represents the lowest level for which identifiable cash flows are largely independent of the cash flows of other groups of assets and liabilities.
The Company makes judgments about the creditworthinessrecognized no impairment of customers based on past collection experience and ongoing credit risk evaluations. At DecemberROU assets as of March 31, 20172023 and June 30, 2017 there was no allowance for doubtful accounts.2022.
Fair ValueThe operating lease is included in operating lease right-of-use assets and operating lease liabilities as current and non-current liabilities in the unaudited condensed consolidated balance sheets at March 31, 2023 and June 30, 2022.
Leases that transfer substantially all the rewards and risks of ownership to the lessee, other than legal title, are accounted for as finance leases. Substantially all of the risks or benefits of ownership are deemed to have been transferred if any one of the four criteria is met: (i) transfer of ownership to the lessee at the end of the lease term, (ii) the lease containing a bargain purchase option, (iii) the lease term exceeding 75% of the estimated economic life of the leased asset, (iv) the present value of the minimum lease payments exceeding 90% of the fair value. At the inception of a finance lease, we as the lessee records an asset and an obligation at an amount equal to the present value of the minimum lease payments. The leased asset is amortized over the shorter of the lease term or its estimated useful life if title does not transfer to us, while the leased asset is depreciated in accordance with our depreciation policy if the title is to eventually transfer to us. The periodic rent payments made during the lease term are allocated between a reduction in the obligation and interest element using the effective interest method in accordance with the provisions of ASC Topic 820 "Fair Value Measurement and Disclosures" establishes842.
· | Income Taxes |
The Company adopted the ASC Topic 740, Income tax provisions of paragraph 740-10-25-13, which addresses the determination of whether tax benefits claimed or expected to be claimed on a three-tier fair value hierarchy, which prioritizestax return should be recorded in the inputs used in measuring fair value. The hierarchy prioritizesunaudited condensed consolidated financial statements. Under paragraph 740-10-25-13, the inputs into three levelsCompany may recognize the tax benefit from an uncertain tax position only if it is more likely than not that the tax position will be sustained on examination by the taxing authorities, based on the extent to which inputs used in measuring fair value are observabletechnical merits of the position. The tax benefits recognized in the market.unaudited condensed consolidated financial statements from such a position should be measured based on the largest benefit that has a greater than fifty percent (50%) likelihood of being realized upon ultimate settlement. Paragraph 740-10-25-13 also provides guidance on de-recognition, classification, interest and penalties on income taxes, accounting in interim periods and requires increased disclosures. The Company had no material adjustments to its liabilities for unrecognized income tax benefits according to the provisions of paragraph 740-10-25-13.
| Table of Contents |
These tiers include:
|
| |
|
| |
|
|
The Company's financial instruments consistestimated future tax effects of cash and cash equivalents, trade receivables, other receivables, payables, and short term and long term debt. The carrying valuestemporary differences between the tax basis of cash and cash equivalents, trade receivables, other receivables, and payables approximate their fair value due to their short maturities. The carrying value of long term debt approximates the fair value of debt of similar terms and remaining maturities available to the company.
The Company's non-financial assets are measured on a recurring basis. These non-financial assets are measured for impairment annually on the Company's measurement date at the reporting unit level using Level 3 inputs. For most assets, ASC 820 requires that the impact of changes resulting from its application be applied prospectively in the year in which the statement is initially applied.
The Company's non-financial assets measured on a non-recurring basis include the Company's property, plant and equipment and finite-use intangible assets which are measured for recoverability when indicators for impairment are present. ASC 820 requires companies to disclose assets and liabilities measured on a non-recurring basisare reported in the period in whichaccompanying balance sheets, as well as tax credit carry-backs and carry-forwards. The Company periodically reviews the re-measurement at fair value is performed.recoverability of deferred tax assets recorded on its balance sheets and provides valuation allowances as management deems necessary.
Uncertain Tax Positions
The Company did not havetake any convertible bonds asuncertain tax positions and had no adjustments to its income tax liabilities or benefits pursuant to the ASC Topic 740 provisions of DecemberSection 740-10-25 for the three and nine months ended March 31, 20172023 and June 30, 2017.2022.
Foreign Currency
· | Foreign Currencies Translation |
The Company'sCompany’s reporting currency is the United States dollar ("$"(“US$”) and the accompanying unaudited condensed consolidated financial statements have been expressed in United States dollars. The Company's functionalIn addition, some of the Company’s subsidiaries operating in Malaysia maintain their books and records in the local currency, is the Malaysian Ringgit ( "MYR"(“MYR”) which is atheir functional currency, as being the primary currency of the economic environment in which their operations are conducted.
In general, for consolidation purposes, assets and liabilities of its subsidiaries whose functional currency is not US$ are translated into US$, in accordance with ASC Topic 830 "830-30, “Translation of Financial Statements"Statement”, capital accounts ofusing the consolidated financial statements areexchange rate on the balance sheet date. Shareholders’ equity is translated into United States dollars from MYR at theirusing the historical exchange rates when the capital transactions occurred. Assetsrates. Revenues and liabilitiesexpenses are translated at average rates prevailing during the year. The gains and losses resulting from translation of financial statements of foreign subsidiary are recorded as a separate component of accumulated other comprehensive income within the statements of changes in stockholder’s equity.
Translation of MYR into U.S. dollars has been made at the following exchange rates as of balance sheet date. Income and expenditures are translated atfor the average exchange rate of the respective year. The resulting exchange differences are recorded in the consolidated statement of operations.following periods:-
|
| December 31, 2017 |
|
| June 30, 2017 |
| ||
Period-end MYR : $1 exchange rate |
|
| 0.2471 |
|
|
| 0.2329 |
|
Average MYR : $1 exchange rate |
|
| 0.2387 |
|
|
| 0.2338 |
|
|
| March 31, 2023 |
|
| March 31, 2022 |
| ||
Period-end MYR:US$ exchange rate |
|
| 0.22609 |
|
|
| 0.23784 |
|
Average period MYR:US$ exchange rate |
|
| 0.22328 |
|
|
| 0.23898 |
|
· | Comprehensive Income |
ASC Topic 220, Comprehensive Income
, establishes standards for reporting and display of comprehensive income, its components and accumulated balances. Comprehensive income isas defined to includeincludes all changes in equity except those resultingduring a period from investments by owners and distributions to owners. Amongnon-owner sources. Accumulated other disclosures, all items that are required to be recognized under current accounting standards as components of comprehensive income, as presented in the accompanying unaudited condensed consolidated statements of changes in stockholders’ equity, consists of changes in unrealized gains and losses on foreign currency translation. This comprehensive income is not included in the computation of income tax expense or benefit.
· | Net Loss per Share |
The Company calculates net loss per share in accordance with ASC Topic 260, Earnings per Share. Basic income per share is computed by dividing the net income by the weighted-average number of Common Shares outstanding during the period. Diluted income per share is computed similar to basic income per share except that the denominator is increased to include the number of additional Common Shares that would have been outstanding if the potential Common Stock equivalents had been issued and if the additional Common Shares were dilutive.
· | Stock Based Compensation |
The Company accounts for stock-based compensation in accordance with ASC Topic 718-10, Compensation-Stock Compensation, which requires the measurement and recognition of compensation expense for all share-based payment awards made to employees and directors including employee stock options, restricted stock units, and stock appreciation rights are required to be reported in a financial statementbased on estimated fair values. Stock-based compensation expense recognized during the period is based on the value of the portion of share-based payment awards that is presented withultimately expected to vest during the same prominence as other financial statements. Comprehensive income includes net income and the foreign currency translation changes.
Segment Reportingperiod.
The Company currently engagesaccounts for non-employee stock-based awards at fair value in one operation segment: Gold Mining. The expenses incurred were consisting principallyaccordance with the measurement and recognition criteria of management services. The Company's major operation is located in Malaysia.ASC Topic 505-50, “Equity-Based Payments to Non-Employees”.
Mineral Acquisition and Exploration Costs
The Company has been primarily engaged in the acquisition, exploration, and development of mining properties. The Company was no longer considered an exploration stage company after the reverse take-over with its subsidiary GBL.
· | Mineral Acquisition and Exploration Costs |
Mineral property acquisition and exploration costs are expensed as incurred. When it has been determined that a mineral property can be economically developed as a result of establishing proven and probable reserves, the costs incurred to develop such property are capitalized. Such costs will be amortized using the units-of-production method over the estimated life of the probable reserves.
| F-10 |
| Table of Contents |
· | Environmental Expenditures |
The operations of the Company have been, and may in the future be affected from time to time in varying degree by changes in environmental regulations, including those for future reclamation and site restoration costs. Both the likelihood of new regulations and their overall effect upon the Company vary greatly and are not predictable. The Company'sCompany’s policy is to meet or, if possible, surpass standards set by relevant legislation by application of technically proven and economically feasible measures.
Environmental expenditures that relate to ongoing environmental and reclamation programs are charged against earnings as incurred or capitalized and amortized depending on their future economic benefits. All of these types of expenditures incurred since inception have been charged against earnings due to the uncertainty of their future recoverability. Estimated future reclamation and site restoration costs, when the ultimate liability is reasonably determinable, are charged against earnings over the estimated remaining life of the related business operation, net of expected recoveries.
· | Related Parties |
Revenue Recognition
The Company follows the ASC 850-10, Related Party for the identification of related parties and disclosure of related party transactions.
In accordancePursuant to section 850-10-20 the related parties include a) affiliates of the Company; b) entities for which investments in their equity securities would be required, absent the election of the fair value option under the Fair Value Option Subsection of section 825–10–15, to be accounted for by the equity method by the investing entity; c) trusts for the benefit of employees, such as pension and Income-sharing trusts that are managed by or under the trusteeship of management; d) principal owners of the Company; e) management of the Company; f) other parties with which the Company may deal if one party controls or can significantly influence the management or operating policies of the other to an extent that one of the transacting parties might be prevented from fully pursuing its own separate interests; and g) other parties that can significantly influence the management or operating policies of the transacting parties or that have an ownership interest in one of the transacting parties and can significantly influence the other to an extent that one or more of the transacting parties might be prevented from fully pursuing its own separate interests.
The unaudited condensed consolidated financial statements shall include disclosures of material related party transactions, other than compensation arrangements, expense allowances, and other similar items in the ordinary course of business. However, disclosure of transactions that are eliminated in the preparation of consolidated or combined financial statements is not required in those statements. The disclosures shall include: a) the nature of the relationship(s) involved; b) a description of the transactions, including transactions to which no amounts or nominal amounts were ascribed, for each of the periods for which income statements are presented, and such other information deemed necessary to an understanding of the effects of the transactions on the financial statements; c) the dollar amounts of transactions for each of the periods for which income statements are presented and the effects of any change in the method of establishing the terms from that used in the preceding period; and d) amount due from or to related parties as of the date of each balance sheet presented and, if not otherwise apparent, the terms and manner of settlement.
· | Commitments and Contingencies |
The Company follows the ASC Topic 605, "Revenue Recognition",450-20, Commitments to report accounting for contingencies. Certain conditions may exist as of the date the financial statements are issued, which may result in a loss to the Company recognizes revenuebut which will only be resolved when persuasive evidenceone or more future events occur or fail to occur. The Company assesses such contingent liabilities, and such assessment inherently involves an exercise of judgment. In assessing loss contingencies related to legal proceedings that are pending against the Company or un-asserted claims that may result in such proceedings, the Company evaluates the perceived merits of any legal proceedings or un-asserted claims as well as the perceived merits of the amount of relief sought or expected to be sought therein.
If the assessment of a contingency indicates that it is probable that a material loss has been incurred and the amount of the liability can be estimated, then the estimated liability would be accrued in the Company’s unaudited condensed consolidated financial statements. If the assessment indicates that a potentially material loss contingency is not probable but is reasonably possible, or is probable but cannot be estimated, then the nature of the contingent liability, and an arrangement exists, transferestimate of titlethe range of possible losses, if determinable and material, would be disclosed.
Loss contingencies considered remote are generally not disclosed unless they involve guarantees, in which case the guarantees would be disclosed. Management does not believe, based upon information available at this time that these matters will have a material adverse effect on the Company’s financial position, results of operations or cash flows. However, there is no assurance that such matters will not materially and adversely affect the Company’s business, financial position, and results of operations or cash flows.
| F-11 |
| Table of Contents |
· | Fair Value of Financial Instruments |
The Company follows paragraph 825-10-50-10 of the FASB Accounting Standards Codification for disclosures about fair value of its financial instruments and has occurredadopted paragraph 820-10-35-37 of the FASB Accounting Standards Codification (“Paragraph 820-10-35-37”) to measure the fair value of its financial instruments. Paragraph 820-10-35-37 of the FASB Accounting Standards Codification establishes a framework for measuring fair value in generally accepted accounting principles (GAAP), and expands disclosures about fair value measurements. To increase consistency and comparability in fair value measurements and related disclosures, paragraph 820-10-35-37 of the FASB Accounting Standards Codification establishes a fair value hierarchy which prioritizes the inputs to valuation techniques used to measure fair value into three (3) broad levels. The fair value hierarchy gives the highest priority to quoted prices (unadjusted) in active markets for identical assets or servicesliabilities and the lowest priority to unobservable inputs. The three (3) levels of fair value hierarchy defined by paragraph 820-10-35-37 of the FASB Accounting Standards Codification are described below:
Level 1 | Quoted market prices available in active markets for identical assets or liabilities as of the reporting date. |
Level 2 | Pricing inputs other than quoted prices in active markets included in Level 1, which are either directly or indirectly observable as of the reporting date. |
Level 3 | Pricing inputs that are generally observable inputs and not corroborated by market data. |
Financial assets are considered Level 3 when their fair values are determined using pricing models, discounted cash flow methodologies or similar techniques and at least one significant model assumption or input is unobservable.
The fair value hierarchy gives the highest priority to quoted prices (unadjusted) in active markets for identical assets or liabilities and the lowest priority to unobservable inputs. If the inputs used to measure the financial assets and liabilities fall within more than one level described above, the categorization is based on the lowest level input that is significant to the fair value measurement of the instrument.
The carrying amounts of the Company’s financial assets and liabilities, such as cash and cash equivalents, accounts receivable, prepayments and other receivables, accounts payable, accrued liabilities and other payables, loans payable, and amounts due to related parties approximate their fair values because of the short maturity of these instruments.
· | Recent Accounting Pronouncements |
During the period ended March 31, 2023, there have been rendered,no new, or existing, recently issued accounting pronouncements that are of significance, or potential significance, that impact the selling price is fixed or determinableCompany’s unaudited condensed consolidated financial statements.
NOTE 3 -GOING CONCERN UNCERTAINTIES
The accompanying unaudited condensed consolidated financial statements have been prepared using the going concern basis of accounting, which contemplates the realization of assets and collectibility is reasonably assured.the satisfaction of liabilities in the normal course of business.
The Company derives revenues primarilyhas generated recurring losses and suffered from an accumulated deficit of $10,518,469 at March 31, 2023 and recorded a net current liability position of $100,227 as of that date. The continuation of the sales of gold mineral to registered gold trading companiesCompany as a going concern in Malaysia. Thethe next twelve months is dependent upon the Company generally recognizespursuing additional financing for its revenues atoperations. However, there is no assurance that the time of gold sales and its selling price is determined by the prevailing market value of gold bullion quoted by the leading registered gold trading company in Malaysia. Sales invoicesCompany will be duly presentedsuccessful in securing sufficient funds to sustain the trading companies when delivery is completed and revenue is then recognized.
Cost of Revenueoperations.
The costability of the Company to survive is dependent upon, among other things, obtaining additional financing to continue operations, and development of its business plan. In response to these problems, management intends to raise additional funds through public or private placement offerings, and related party loans.
No assurance can be given that any future financing, if needed, will be available or, if available, that it will be on terms that are satisfactory to the Company. Even if the Company is able to obtain additional financing, if needed, it may contain undue restrictions on its operations, in the case of debt financing, or cause substantial dilution for its stockholders, in the case of equity financing.
These and other factors raise substantial doubt about the Company’s ability to continue as a going concern. These unaudited condensed consolidated financial statements do not include any adjustments to reflect the possible future effects on the recoverability and classification of assets and liabilities that may result in the Company not being able to continue as a going concern.
NOTE 4 –BUSINESS SEGMENT INFORMATION
Currently, the Company has four reportable business segments:
(i) | Distribution of THC-free cannabinoid (CBD) products; |
(ii) | Production and distribution of renewable commodities; |
(iii) | Holding of real property; and |
(iv) | Licensor of proprietary pyrolysis technology |
| F-12 |
| Table of Contents |
In the following table, revenue is disaggregated by primary major product line, and timing of revenue consistsrecognition. The table also includes a reconciliation of exploration costs, mine equipment depreciation, production costs, mine site management costs, sub-contractor costs,the disaggregated revenue with the reportable segments for the three and royaltynine months ended March 31, 2023 and tribute payments which2022:
|
| Three Months ended March 31, 2023 |
| |||||||||||||||||||||||||
|
| Gold mineral mining |
|
| Distribution of THC-free cannabinoid (CBD) products |
|
| Production and distribution of renewable commodities |
|
| Holding property |
|
| Licensor of proprietary pyrolysis technology |
|
| Corporate unallocated |
|
| Consolidated |
| |||||||
|
|
|
|
|
|
|
|
|
|
|
|
|
|
|
|
|
|
|
|
|
| |||||||
Revenue |
| $ | - |
|
| $ | - |
|
| $ | 10,215 |
|
| $ | 15,896 |
|
| $ | - |
|
| $ | 475 |
|
| $ | 26,586 |
|
Cost of revenue |
|
| - |
|
|
| - |
|
|
| (44,129 | ) |
|
| - |
|
|
| - |
|
|
| (179 | ) |
|
| (44,308 | ) |
Gross profit/(loss) |
|
| - |
|
|
| - |
|
|
| (33,914 | ) |
|
| 15,896 |
|
|
| - |
|
|
| 296 |
|
|
| (17,722 | ) |
Selling, general & administrative expenses |
|
| - |
|
|
| (300 | ) |
|
| (371,146 | ) |
|
| (47,630 | ) |
|
| (8,282 | ) |
|
| (388,731 | ) |
|
| (816,089 | ) |
Loss from operations |
|
| - |
|
|
| (300 | ) |
|
| (405,060 | ) |
|
| (31,734 | ) |
|
| (8,282 | ) |
|
| (388,435 | ) |
|
| (833,811 | ) |
Interest expenses |
|
| - |
|
|
| - |
|
|
| (13,549 | ) |
|
| - |
|
|
| - |
|
|
| - |
|
|
| (13,549 | ) |
Other income |
|
| - |
|
|
| - |
|
|
| 42 |
|
|
| - |
|
|
| - |
|
|
| 194,875 |
|
|
| 194,917 |
|
Loss before income tax |
|
| - |
|
|
| (300 | ) |
|
| (418,567 | ) |
|
| (31,734 | ) |
|
| (8,282 | ) |
|
| (193,560 | ) |
|
| (652,443 | ) |
Income tax |
|
| - |
|
|
| - |
|
|
| - |
|
|
| - |
|
|
| - |
|
|
| - |
|
|
| - |
|
Loss from continuing operation |
|
| - |
|
|
| (300 | ) |
|
| (418,567 | ) |
|
| (31,734 | ) |
|
| (8,282 | ) |
|
| (193,560 | ) |
|
| (652,443 | ) |
Loss from discontinued operation |
|
| (55,884 | ) |
|
| - |
|
|
| - |
|
|
| - |
|
|
| - |
|
|
| - |
|
|
| (55,884 | ) |
Net loss |
| $ | (55,884 | ) |
| $ | (300 | ) |
| $ | (418,567 | ) |
| $ | (31,734 | ) |
| $ | (8,282 | ) |
| $ | (193,560 | ) |
| $ | (708,327 | ) |
|
|
|
|
|
|
|
|
|
|
|
|
|
|
|
|
|
|
|
|
|
|
|
|
|
|
|
|
|
Total assets at March 31, 2023 |
| $ | 19,570 |
|
| $ | 315,929 |
|
| $ | 1,519,462 |
|
| $ | 1,245,906 |
|
| $ | 30,195,135 |
|
| $ | 5,950,122 |
|
| $ | 39,246,124 |
|
|
| Three Months ended March 31, 2022 |
| |||||||||||||||||||||
|
| Gold mineral mining |
|
| Distribution of THC-free cannabinoid (CBD) products |
|
| Production and distribution of renewable commodities |
|
| Holding property |
|
| Corporate unallocated |
|
| Consolidated |
| ||||||
|
|
|
|
|
|
|
|
|
|
|
|
|
|
|
|
|
|
| ||||||
Revenue |
| $ | - |
|
| $ | - |
|
| $ | 16,712 |
|
| $ | - |
|
| $ | - |
|
| $ | 16,712 |
|
Cost of revenue |
|
| - |
|
|
| - |
|
|
| (86,701 | ) |
|
| - |
|
|
| - |
|
|
| (86,701 | ) |
Gross loss |
|
| - |
|
|
| - |
|
|
| (69,989 | ) |
|
| - |
|
|
| - |
|
|
| (69,989 | ) |
Selling, general & administrative expenses |
|
| (43,405 | ) |
|
| (1,378 | ) |
|
| (75,958 | ) |
|
| (180,497 | ) |
|
| (197,536 | ) |
|
| (498,774 | ) |
Loss from operations |
|
| (43,405 | ) |
|
| (1,378 | ) |
|
| (145,947 | ) |
|
| (180,497 | ) |
|
| (197,536 | ) |
|
| (568,763 | ) |
Interest expenses |
|
| - |
|
|
| - |
|
|
| - |
|
|
| - |
|
|
| (486,977 | ) |
|
| (486,977 | ) |
Other income |
|
| (17 | ) |
|
| - |
|
|
| - |
|
|
| 116 |
|
|
| - |
|
|
| 99 |
|
Loss before income tax |
|
| (43,422 | ) |
|
| (1,378 | ) |
|
| (145,947 | ) |
|
| (180,381 | ) |
|
| (684,513 | ) |
|
| (1,055,641 | ) |
Income tax |
|
| - |
|
|
| - |
|
|
| - |
|
|
| - |
|
|
| - |
|
|
| - |
|
Loss from continuing operation |
|
| (43,422 | ) |
|
| (1,378 | ) |
|
| (145,947 | ) |
|
| (180,381 | ) |
|
| (684,513 | ) |
|
| (1,055,641 | ) |
Loss from discontinued operation |
|
| - |
|
|
| - |
|
|
| - |
|
|
| - |
|
|
| - |
|
|
| - |
|
Net loss |
| $ | (43,422 | ) |
| $ | (1,378 | ) |
| $ | (145,947 | ) |
| $ | (180,381 | ) |
| $ | (684,513 | ) |
| $ | (1,055,641 | ) |
|
|
|
|
|
|
|
|
|
|
|
|
|
|
|
|
|
|
|
|
|
|
|
|
|
Total assets as March 31, 2022 |
| $ | 317,471 |
|
| $ | - |
|
| $ | 101,066 |
|
| $ | 505,432 |
|
|
| 33,118,811 |
|
| $ | 34,042,780 |
|
| F-13 |
| Table of Contents |
|
| Nine Months ended March 31, 2023 |
| |||||||||||||||||||||||||
|
| Gold mineral mining |
|
| Distribution of THC-free cannabinoid (CBD) products |
|
| Production and distribution of renewable commodities |
|
| Holding property |
|
| Licensor of proprietary pyrolysis technology |
|
| Corporate unallocated |
|
| Consolidated |
| |||||||
|
|
|
|
|
|
|
|
|
|
|
|
|
|
|
|
|
|
|
|
|
| |||||||
Revenue |
| $ | - |
|
| $ | - |
|
| $ | 89,480 |
|
| $ | 39,117 |
|
| $ | - |
|
| $ | 5,441 |
|
| $ | 134,038 |
|
Cost of revenue |
|
| - |
|
|
| - |
|
|
| (122,758 | ) |
|
| - |
|
|
| - |
|
|
| (1,145 | ) |
|
| (123,903 | ) |
Gross (loss)/profit |
|
| - |
|
|
| - |
|
|
| (33,278 | ) |
|
| 39,117 |
|
|
| - |
|
|
| 4,296 |
|
|
| 10,135 |
|
Selling, general & administrative expenses |
|
| - |
|
|
| (2,875 | ) |
|
| (1,373,555 | ) |
|
| (134,880 | ) |
|
| (8,935 | ) |
|
| (860,910 | ) |
|
| (2,381,155 | ) |
Loss from operations |
|
| - |
|
|
| (2,875 | ) |
|
| (1,406,833 | ) |
|
| (95,763 | ) |
|
| (8,935 | ) |
|
| (856,614 | ) |
|
| (2,371,020 | ) |
Interest expenses |
|
| - |
|
|
| - |
|
|
| (22,237 | ) |
|
| - |
|
|
| - |
|
|
| (1,870,972 | ) |
|
| (1,893,209 | ) |
Other income |
|
| - |
|
|
| - |
|
|
| 678 |
|
|
| - |
|
|
| - |
|
|
| 195,836 |
|
|
| 196,514 |
|
Loss before income tax |
|
| - |
|
|
| (2,875 | ) |
|
| (1,428,392 | ) |
|
| (95,763 | ) |
|
| (8,935 | ) |
|
| (2,531,750 | ) |
|
| (4,067,715 | ) |
Income tax |
|
| - |
|
|
| - |
|
|
| - |
|
|
| - |
|
|
| - |
|
|
| - |
|
|
| - |
|
Loss from continuing operation |
|
| - |
|
|
| (2,875 | ) |
|
| (1,428,392 | ) |
|
| (95,763 | ) |
|
| (8,935 | ) |
|
| (2,531,750 | ) |
|
| (4,067,715 | ) |
Loss from discontinued operation |
|
| (157,284 | ) |
|
| - |
|
|
| - |
|
|
| - |
|
|
| - |
|
|
| - |
|
|
| (157,284 | ) |
Net loss |
| $ | (157,284 | ) |
| $ | (2,875 | ) |
| $ | (1,428,392 | ) |
| $ | (95,763 | ) |
| $ | (8,935 | ) |
| $ | (2,531,750 | ) |
| $ | (4,224,999 | ) |
|
|
|
|
|
|
|
|
|
|
|
|
|
|
|
|
|
|
|
|
|
|
|
|
|
|
|
|
|
Total assets at March 31, 2023 |
| $ | 19,570 |
|
| $ | 315,929 |
|
| $ | 1,519,462 |
|
| $ | 1,245,906 |
|
| $ | 30,195,135 |
|
| $ | 5,950,122 |
|
| $ | 39,246,124 |
|
|
| Nine Months ended March 31, 2022 |
| |||||||||||||||||||||
|
| Gold mineral mining |
|
| Distribution of THC-free cannabinoid (CBD) products |
|
| Production and distribution of renewable commodities |
|
| Holding property |
|
| Corporate unallocated |
|
| Consolidated |
| ||||||
|
|
|
|
|
|
|
|
|
|
|
|
|
|
|
|
|
|
| ||||||
Revenue |
| $ | - |
|
| $ | - |
|
| $ | 16,712 |
|
| $ | - |
|
| $ | - |
|
| $ | 16,712 |
|
Cost of revenue |
|
| - |
|
|
| - |
|
|
| (86,701 | ) |
|
| - |
|
|
| - |
|
|
| (86,701 | ) |
Gross loss |
|
| - |
|
|
| - |
|
|
| (69,989 | ) |
|
| - |
|
|
| - |
|
|
| (69,989 | ) |
Selling, general & administrative expenses |
|
| (150,781 | ) |
|
| (3,134 | ) |
|
| (93,598 | ) |
|
| (283,239 | ) |
|
| (691,123 | ) |
|
| (1,221,875 | ) |
Loss from operations |
|
| (150,781 | ) |
|
| (3,134 | ) |
|
| (163,587 | ) |
|
| (283,239 | ) |
|
| (691,123 | ) |
|
| (1,291,864 | ) |
Interest expenses |
|
| - |
|
|
| - |
|
|
| - |
|
|
| - |
|
|
| (1,441,911 | ) |
|
| (1,441,911 | ) |
Other income |
|
| 12,098 |
|
|
| - |
|
|
| - |
|
|
| 116 |
|
|
| - |
|
|
| 12,214 |
|
Loss before income tax |
|
| (138,683 | ) |
|
| (3,134 | ) |
|
| (163,587 | ) |
|
| (283,123 | ) |
|
| (2,133,034 | ) |
|
| (2,721,561 | ) |
Income tax |
|
| - |
|
|
| - |
|
|
| - |
|
|
| - |
|
|
| - |
|
|
| - |
|
Loss from continuing operation |
|
| (138,683 | ) |
|
| (3,134 | ) |
|
| (163,587 | ) |
|
| (283,123 | ) |
|
| (2,133,034 | ) |
|
| (2,721,561 | ) |
Loss from discontinued operation |
|
| - |
|
|
| - |
|
|
| - |
|
|
| - |
|
|
| - |
|
|
| - |
|
Net loss |
| $ | (138,683 | ) |
| $ | (3,134 | ) |
| $ | (163,587 | ) |
| $ | (283,123 | ) |
| $ | (2,133,034 | ) |
| $ | (2,721,561 | ) |
|
|
|
|
|
|
|
|
|
|
|
|
|
|
|
|
|
|
|
|
|
|
|
|
|
Total assets as March 31, 2022 |
| $ | 317,471 |
|
| $ | - |
|
| $ | 101,066 |
|
| $ | 505,432 |
|
|
| 33,118,811 |
|
| $ | 34,042,780 |
|
| F-14 |
| Table of Contents |
The below revenues are leviedbased on the gross revenue atcountries in which the rate of 18% oncustomer is located. Summarized financial information concerning the invoiced value of gold sales.geographic segments is shown in the following tables:
|
| Three Months ended March 31, |
|
| Nine Months ended March 31, |
| ||||||||||
|
| 2023 |
|
| 2022 |
|
| 2023 |
|
| 2022 |
| ||||
|
|
|
|
|
|
|
|
|
|
|
|
| ||||
Malaysia |
| $ | 4,045 |
|
| $ | 16,712 |
|
| $ | 26,278 |
|
| $ | 16,712 |
|
United States |
|
| 22,541 |
|
|
| - |
|
|
| 107,760 |
|
|
| - |
|
|
| $ | 26,586 |
|
| $ | 16,712 |
|
| $ | 134,038 |
|
| $ | 16,712 |
|
NOTE 5 – OTHER RECEIVABLE AND DEPOSITS
Advertising Expenses
Advertising costs are expensedOther receivable, deposits and prepayments as incurred under ASC Topic 720, "Advertising Costs" . Advertising expenses incurred for the periods ended Decemberof March 31, 20172023 and June 30, 2017 were $0.2022 consisted of the following:
|
| March 31, 2023 |
|
| June 30, 2022 |
| ||
|
|
|
|
|
|
| ||
Deposits |
| $ | 191,011 |
|
| $ | 118,516 |
|
Other receivables |
|
| 1,116 |
|
|
| - |
|
|
| $ | 192,127 |
|
| $ | 118,516 |
|
NOTE 6 –INTANGIBLE ASSET
On May 13, 2021, the Company announced the Share Sale Agreement on May 12, 2021 for the acquisition of the entire issued and paid-up share capital of Bio Resources Limited from Taipan International Limited, an unrelated third party, The Wision Project Limited (formerly known as “Borneo Resources Limited”), an unrelated third party, and other unrelated third party individuals, The acquisition of BRL was consummated on October 12, 2022.
Bio Resources Limited (“BRL”) is the beneficial and/or registered proprietor of the intellectual property known as “Catalytic Biofraction Process”, which is a slow pyrolysis process using a proprietary catalyst to depolymerize palm biomass wastes (empty fruit bunches or palm kernel shells) in temperature range of 350 degrees Celsius to 500 degrees Celsius to yield commercially valuable bio products: bio-oil, wood vinegar (pyroligneous acid), biochar and bio-syngas. The intellectual property is a second-generation pyrolysis process where non-food feedstock like palm biomass wastes is used as feedstock. Upon fulfilling UN’s (United Nations) ACM 22 protocol as well as LCA (Life Cycle Assessment) requirements, it is anticipated that the by-products from this IP with fair value of $30,192,771 would lead to certification and issuance of Carbon Avoidance Credits as well as Carbon Removal Credits to generate carbon revenue for the Company.
During this quarter, the Company has not operated the use of its intellectual property rights to generate its revenue. Therefore, no amortization was provided.
| Table of Contents |
NOTE 7 – PROPERTY, PLANT AND EQUIPMENT
A summary of property and equipment at March 31, 2023 and June 30, 2022 is as follows:
|
| March 31, 2023 |
|
| June 30, 2022 |
| ||
|
|
|
|
|
|
| ||
Land and building |
| $ | 1,258,360 |
|
| $ | 1,642,102 |
|
Plant and machinery |
|
| 5,477,728 |
|
|
| 134,198 |
|
Office equipment |
|
| 6,206 |
|
|
| 23,353 |
|
Project equipment |
|
| - |
|
|
| 615,420 |
|
Computer |
|
| 5,382 |
|
|
| 14,846 |
|
Motor vehicle |
|
| 708,037 |
|
|
| 225,861 |
|
Furniture & fittings |
|
| 12,931 |
|
|
| 2,527 |
|
|
|
| 7,468,644 |
|
|
| 2,658,307 |
|
Less: accumulated depreciation |
|
| (195,979 | ) |
|
| (1,707,150 | ) |
Foreign exchange adjustment |
|
| (110 | ) |
|
| 97,736 |
|
|
| $ | 7,272,555 |
|
| $ | 1,048,893 |
|
Depreciation expense for the three months ended March 31, 2023 and 2022 totaled $97,167 and $4,611, respectively.
Depreciation expense for the nine months ended March 31, 2023 and 2022 totaled $177,074 and $9,831, respectively.
Land and building with the net carrying value of $729,522 at March 31, 2023 and $746,145 at June 30, 2022 were pledged to a financial institution for facilities granted.
A summary of property and equipment reclassified to assets of disposal group held for sale is as follows:
|
| March 31, 2023 |
|
| June 30, 2022 |
| ||
|
|
|
|
|
|
| ||
Land and building |
| $ | 889,180 |
|
| $ | - |
|
Plant and machinery |
|
| 15,393 |
|
|
| - |
|
Office equipment |
|
| 17,804 |
|
|
| - |
|
Project equipment |
|
| 613,294 |
|
|
| - |
|
Computer |
|
| 10,487 |
|
|
| - |
|
Motor vehicle |
|
| 33,520 |
|
|
| - |
|
|
|
| 1,579,678 |
|
|
| - |
|
Less: accumulated depreciation |
|
| (1,584,909 | ) |
|
| - |
|
Foreign exchange adjustment |
|
| 5,473 |
|
|
| - |
|
|
| $ | 242 |
|
| $ | - |
|
| F-16 |
| Table of Contents |
NOTE 8 – DEPOSITS PAID
Income TaxesAt March 31, 2023 and June 30, 2022, deposits consist of the following:
|
| March 31, 2023 |
|
| June 30, 2022 |
| ||
Deposits paid for acquisition of subsidiaries |
|
|
|
|
|
| ||
- Bio Resources Limited (#1) |
|
| - |
|
|
| 25,935,550 |
|
- Vata VM Synergy (M) Sdn Bhd (“VATA”) (#2) |
| $ | 22,609 |
|
| $ | - |
|
|
| $ | 22,609 |
|
| $ | 25,935,550 |
|
|
|
|
|
|
|
|
|
|
Deposits paid for acquisition of property, plant and equipment (#3) |
|
| - |
|
|
| 5,000,000 |
|
|
|
|
|
|
|
|
|
|
Security deposit |
|
|
|
|
|
|
|
|
- Factory site (#4) |
|
| 80,000 |
|
|
| 80,000 |
|
- Land and building (#5) |
| $ | - |
|
| $ | 240,000 |
|
|
| $ | 80,000 |
|
| $ | 320,000 |
|
(#1) The Company announced the Share Sale Agreement on May 12, 2021 for the acquisition of the entire issued and paid-up share capital of Bio Resources Limited from Taipan International Limited, an unrelated third party, The Wision Project Limited (formerly known as “Borneo Resources Limited”), an unrelated third party, and other unrelated third party individuals, in consideration of issuance of 321,500,000 shares of the Company’s restricted Common Stock at $0.03 per share, valued at $9,645,000, and the issuance of promissory notes with two-year term period with a principal amount of $20,355,000. 321,500,000 shares were issued on May 12, 2021 and the promissory notes were issued on May 12, 2021. The face value (principal) amount of $20,355,000 was convertible into Common Shares within 60 days from October 12, 2022, and bearing zero coupon interest. The promissory note was priced at $16,290,550 considering the market interest rate then. This transaction was subsequently closed on October 12, 2022.
(#2) On March 23, 2023, the Company, through its wholly-owned subsidiary Verde Resources (Malaysia) Sdn. Bhd. (“VRM”), entered into a Shares Sale Agreement (the “SSA Agreement”) with Murugesu A/L M. Narasimha and Deivamalar A/P Kandiah (“Vendors”), the legal and beneficial owners of Vata VM Synergy (M) Sdn. Bhd. (“VATA”), a company incorporated under the laws of Malaysia, to acquire 60% of the issued and paid-up share capital of VATA, a company engaged in the business of providing green technology to government and private sectors and in creating high quality compost using agricultural waste and biomass products in Malaysia. In relation to the SSA Agreement, the Company through VRM also entered into a Shareholders Agreement with Murugesu A/L M. Narasimha and VATA. Under the terms of the SSA Agreement, the consideration for the acquisition of 60% of the issued and paid-up share capital of VATA shall be satisfied by the total purchase consideration of MYR 2,250,000, which includes a first payment of MYR100,000 upon the execution of the SSA Agreement, a second payment of MYR 150,000 within thirty (30) days from the date of fulfillment or waiver of all the conditions set out in the SSA Agreement, and the issuance of shares of the Company’s restricted Common Stock for the balance consideration of MYR 2,000,000 at a price per share of not more than ten percent (10%) discount from the immediate preceding five trading days volume weighted average price (“VWAP”) from the issuance date pursuant to the terms of the SSA Agreement. As of March 31, 2023, the first payment has been made.
(#3) On May 10, 2021, the Company announced the Sale and Purchase Agreement to acquire the assets of biofraction plant and the right to use intellectual property license in Sabah, Malaysia from Borneo Energy Sdn Bhd, in consideration of issuance of 166,666,667 share of the Company’s stock at $0.03 per share, valued at $5,000,000. 135,666,667 shares and 31,000,000 shares were issued on May 10, 2021 and July 1, 2021, respectively. The acquisition from Borneo Energy the assets of its biofraction plant and the right to use its licensed intellectual property known as “Catalytic Biofraction Process” in the state of Sabah, Malaysia was completed on February 24,2023.
(#4) On March 2, 2022, the Company, through VRAP, entered into a Commercial Lease Agreement and Option to Purchase (“Lease Agreement”) the factory site from Segama Ventures for a lease term of seven (7) years (“Lease Term”) at a monthly rental of MYR 36,000 ($8,571). The rental for the entire Lease Term amounts to the sum of MYR 3,024,000 ($720,000) (the “Lease Payment”) which shall be paid in advance upon commencement of the Lease Agreement together with a payment of security deposit for the sum of MYR 336,000 ($80,000) (the “Security Payment”).
(#5) On February 10, 2022, the Company, through VEL, a limited liability company incorporated in the State of Missouri, which is an indirect wholly-owned subsidiary of the Company via Verde Renewables, Inc., entered into a Commercial Lease Agreement and Option to Purchase (the “Lease Agreement”) a 24-acre property in La Belle from Jon Neal Simmons and Betty Jo Simmon (the “Landlord”) in order to kickstart carbon farming with biochar in Missouri. Under the Lease Agreement, the term of the lease will be for a period of two (2) years and the Company will have the right to renew the lease with a total of three renewal periods with each term being two years. The monthly base rent is $10,000 for the term, was payable on the commencement of the Lease Agreement, together with a security deposit of $240,000. The Lease Agreement also grants the Company the exclusive right and option to purchase the premises together with all the right title and interest from the Landlord for a consideration of $490,000 at any time during the two-year term of the lease. If the Company exercises the option to purchase the premises from the Landlord, the upfront lease payment and security deposit may be utilized as part payment of the purchase consideration. The option to purchase was exercised on September 27, 2022.
| F-17 |
| Table of Contents |
NOTE 9 - MINING RIGHT
A lump sum payment of MYR260,500 ($62,260) was made for a mining right over a period of 2 years up to June 13, 2023. The mining right is amortized on a straight-line basis over the term of the right.
The provisiontable below presents the movement of the right as recorded on the balance sheets.
|
| Nine months ended March 31, 2023 |
|
| Year Ended June 30, 2022 |
| ||
Balance as at July 1, 2022 and July 1, 2021 |
| $ | 27,088 |
|
| $ | 60,131 |
|
Amortization charge for the period |
|
| (21,812 | ) |
|
| (30,779 | ) |
Foreign exchange adjustment |
|
| (368 | ) |
|
| (2,264 | ) |
Reclassified to assets held for sale |
|
| (4,908 | ) |
|
| - |
|
Balance as of March 31, 2023 and June 30, 2022 |
| $ | - |
|
| $ | 27,088 |
|
Amortization charge of mining right was $7,418 and $8,150 for income taxesthe three months ended March 31, 2023 and 2022, respectively.
Amortization charge of mining right was $21,812 and $23,345 for the nine months ended March 31, 2023 and 2022, respectively.
NOTE 10 – DISPOSAL GROUP HELD FOR SALE
On March 13, 2023, the Company through its wholly-owned subsidiary Verde Resources Asia Pacific Limited (“VRAP”) (fka Gold Billion Global Limited), a company incorporated under the laws of the British Virgin Islands, entered into a Share Sale Agreement (the “SSA Agreement”) with Jusra Mining Merapoh Sdn Bhd (“JMM”), a company incorporated under the laws of Malaysia, to sell the entire issued and paid-up share capital of Champmark Sdn Bhd (“CSB”), an indirect wholly-owned subsidiary of the Company engaged in the mining business. Under the terms of the SSA Agreement, the consideration for the sale of the entire issued and paid-up share capital of CSB shall be satisfied in full by the payment of Malaysia Ringgit MYR 500,000. The disposal is determined in accordance withpending completion as at Mar 31, 2023 and this the provisions of ASC Topic 740, "Accounting for Income Taxes" ("ASC 740"). Under this method, deferred tax assets and liabilities are recognizedhave been presented separately in the balance sheets as assets held for sale an liabilities held for sale respectively. The disposal was subsequently completed on April 20, 2023.
|
| March 31, 2023 |
|
| June 30, 2022 |
| ||
Assets classified as held for sale |
|
|
|
|
|
| ||
Cash and cash equivalents |
| $ | 5,376 |
|
| $ | - |
|
Property, plant and equipment, net |
|
| 242 |
|
|
| - |
|
Mining rights |
|
| 4,908 |
|
|
| - |
|
Other receivables and deposits |
|
| 9,044 |
|
|
| - |
|
|
|
| 19,570 |
|
|
| - |
|
Liabilities classified as held for sale |
|
|
|
|
|
| ||
Accounts payable |
| $ | 14,758 |
|
| $ | - |
|
Accrued liabilities and other payables |
|
| 25,249 |
|
|
| - |
|
|
|
| 40,007 |
|
|
| - |
|
The carrying value of property, plant and equipment of the future tax consequences attributabledisposal group is the same as its carrying value before it was reclassified to differences between the financial statement carrying amounts of existing assets held for sale and liabilities and their respective tax basis. Deferred tax assets and liabilities are measured using enacted income tax rates expected to apply to taxable income in the years in which those temporary differences are expected to be recovered or settled. Any effect on deferred tax assets and liabilities of a change in tax rates is recognized in income in the period that includes the enactment date.held for sale.
| F-18 |
| Table of Contents |
NOTE 11 – AMOUNTS DUE TO RELATED PARTIES
ASC 740 prescribes a comprehensive model for how companies should recognize, measure, present, and disclose in their financial statements uncertain tax positions taken or expected to be taken on a tax return. Under ASC 740, tax positions must initially be recognized in the financial statements when it is more likely than not the position will be sustained upon examination by the tax authorities. Such tax positions must initially and subsequently be measured as the largest amount of tax benefit that has a greater than 50% likelihood of being realized upon ultimate settlement with the tax authority assuming full knowledgeThe following breakdown of the positionbalances due to related parties, consisted of:-
|
| March 31, 2023 |
|
| June 30, 2022 |
| ||
|
|
|
|
|
|
| ||
Borneo Oil Corporation Sdn Bhd (formerly known as Borneo Oil and Gas Corporation Sdn Bhd) (“BOC”) |
| $ | 43,740 |
|
| $ | 555,527 |
|
Borneo Energy Sdn Bhd |
|
| 15,599 |
|
|
| - |
|
Taipan International Limited |
|
| 119,153 |
|
|
| - |
|
|
|
| 178,492 |
|
|
| 555,527 |
|
Borneo Oil Berhad (“BOB”) (holding 13.4% and relevant facts. As22.8% of Decemberthe Company’s issued and outstanding Common Stock as of March 31, 20172023 and June 30, 2017,2022, respectively) is the Company did not have any significant unrecognized uncertain tax positions.
Recent Accounting Pronouncements
The FASB has issued Accounting Standards Update No. 2017-01, Business Combinations (Topic 805): Clarifying the Definitionholding company of a Business , clarifying the definition of a business. The amendments affect all companiesBOC and other reporting organizations that must determine whether they have acquired or sold a business.
The definition of a business affects many areas of accounting including acquisitions, disposals, goodwill, and consolidation. The amendments are intended to help companies and other organizations evaluate whether transactions should be accounted for as acquisitions (or disposals) of assets or businesses. The amendments provide a more robust framework to use in determining when a set of assets and activities is a business. They also provide more consistency in applying the guidance, reduce the costs of application, and make the definition of a business more operable.
For public companies, the amendments are effective for annual periods beginning after December 15, 2017, including interim periods within those periods. For all other companies and organizations, the amendments are effective for annual periods beginning after December 15, 2018, and interim periods within annual periods beginning after December 15, 2019.
The FASB has issued Accounting Standards Update (ASU) No. 2017-04, Intangibles - Goodwill and Other (Topic 350): Simplifying the Test for Goodwill Impairment.
To simplify the subsequent measurement of goodwill, the amendments eliminate Step 2 from the goodwill impairment test. The annual, or interim, goodwill impairment test is performed by comparing the fair value of a reporting unit with its carrying amount. An impairment charge should be recognized for the amount by which the carrying amount exceeds the reporting unit’s fair value; however, the loss recognized should not exceed the total amount of goodwill allocated to that reporting unit. In addition, income tax effects from any tax deductible goodwill on the carrying amount of the reporting unit should be considered when measuring the goodwill impairment loss, if applicable.
The amendments also eliminate the requirements for any reporting unit with a zero or negative carrying amount to perform a qualitative assessment and, if it fails that qualitative test, to perform Step 2 of the goodwill impairment test. An entity still has the option to perform the qualitative assessment for a reporting unit to determine if the quantitative impairment test is necessary.
The amendments should be applied on a prospective basis. The nature of and reason for the change in accounting principle should be disclosed upon transition.
A public business entity that is a U.S. Securities and Exchange Commission (SEC) filer should adopt the amendments for its annual or any interim goodwill impairment tests in fiscal years beginning after December 15, 2019.
A public business entity that is not an SEC filer should adopt the amendments for its annual or any interim goodwill impairment tests in fiscal years beginning after December 15, 2020.
All other entities, including not-for-profit entities, which adopt the amendments should do so for their annual or any interim goodwill impairment tests in fiscal years beginning after December 15, 2021.
Early adoption is permitted for interim or annual goodwill impairment tests performed on testing dates after January 1, 2017.
The FASB has issued Accounting Standards Update No. 2017-05, Other Income – Gains and Losses from the Derecognition of Nonfinancial Assets (Subtopic 610-20): Clarifying the Scope of Asset Derecognition Guidance and Accounting for Partial Sales of Nonfinancial Assets.
A contract may involve the transfer of both nonfinancial assets and financial assets (e.g., cash and receivables). The amendments clarify that a financial asset is within the scope of Subtopic 610-20 if it meets the definition of an in substance nonfinancial asset. The amendments also define the term in substance nonfinancial asset.
The amendments clarify that nonfinancial assets within the scope of Subtopic 610-20 may include nonfinancial assets transferred within a legal entity to a counterparty. For example, a parent may transfer control of nonfinancial assets by transferring ownership interests in a consolidated subsidiary. A contract that includes the transfer of ownership interests in one or more consolidated subsidiaries is within the scope of Subtopic 610-20 if substantially all of the fair value of the assets that are promised to the counterparty in a contract is concentrated in nonfinancial assets.
The amendments clarify that an entity should identify each distinct nonfinancial asset or in substance nonfinancial asset promised to a counterparty and derecognize each asset when a counterparty obtains control of it.
The amendments are effective at the same time Topic 606, Revenue from Contracts with Customers is effective. For public entities, the amendments are effective for annual reporting periods beginning after December 15, 2017, including interim reporting periods within that reporting period. For all other entities, the amendments are effective for annual reporting periods beginning after December 15, 2018, and interim reporting periods within annual reporting periods beginning after December 15, 2019.
Other accounting standards that have been issued or proposed by the FASB or other standards-setting bodies that do not require adoption until a future date are not expected to have a material impact on our consolidated financial statements upon adoption.
NOTE 3 - CASH AND CASH EQUIVALENT
The Company considers all highly liquid investments purchased with original maturities of three months or less to be cash equivalents. At December 31, 2017 and June 30, 2017 cash and cash equivalents consisted of bank deposits in Malaysia bank and petty cash on hands.
NOTE 4 - AMOUNT DUE FROM RELATED PARTIES
Amount due from related parties at December 31, 2017 and June 30, 2017 consist of the following items:
December 31, 2017 June 30, 2017 Amount due from Stable Treasure Sdn. Bhd. (*) $ 4,614 $ 4,088
(*) One of the directors of Stable Treasure Sdn.Borneo Energy Sdn Bhd., Mr. Balakrishnan B S Muthu is also the director of the Company. The advances related to ordinary business transactions and bear no interest or collateral, repayable and renewable under normal business advancement terms.
NOTE 5 - INVENTORIES
Inventories are valued at cost, not in excess of market. Inventories are determined at first in first out basis and comprised of production cost, mine site management cost and sub-contractor cost. Inventories, at December 31, 2017 and June 30, 2017 are summarized as follows:
December 31, 2017 June 30, 2017 Inventories $ 13,278 $ 8,832
The inventories represent the gold minerals as at December 31, 2017 and June 30, 2017, which were comprised of 8% share by the Company and 92% share by the sub-contractor and the other parties such as original mine assigner.
NOTE 6 - ACCOUNTS PAYABLE AND ADVANCED FROM RELATED PARTIES
Accounts Payable
Accounts payable at December 31, 2017 and June 30, 2017 consist of the following items:
|
| December 31, 2017 |
|
| June 30, 2017 |
| ||
Due to Changxin Wanlin Technology Co Ltd(*) |
| $ | 1,593,122 |
|
| $ | 1,501,406 |
|
Other accounts payable |
|
| 51,023 |
|
|
| 59,343 |
|
|
| $ | 1,644,145 |
|
| $ | 1,560,749 |
|
(*) Due to Changxin Wanlin Technology Co Ltd are accounts payable derived from ordinary business transactions. One of the directors of Changxin Wanlin Technology Co. Ltd., Mr. Wu Ming Ding, has resigned as director of VRDR (as of February 20, 2016), GBL (as of February 11, 2016) and CSB (as of February 17, 2016). This accounts payable bears no interest or collateral, repayable and renewable under normal business accounts payable terms.
Advanced from related parties
Advanced from related parties at December 31, 2017 and June 30, 2017 consist of the following items:
|
| December 31, 2017 |
|
| June 30, 2017 |
| ||
Advanced from BOG (#1) |
| $ | 456,333 |
|
| $ | 430,169 |
|
Advanced from Federal Mining Resources Limited(#2) |
| $ | 173,465 |
|
| $ | 173,465 |
|
Advanced from Federal Capital Investment Limited (#3) |
| $ | 110,000 |
|
| $ | 98,000 |
|
Advanced from Yorkshire Capital Limited (#4) |
| $ | 27,000 |
|
| $ | 27,000 |
|
|
| $ | 766,798 |
|
| $ | 728,634 |
|
(#1) BOG is one of the shareholders of the Company. The advances are related to ordinary business transactions and bear no interest or collateral, repayable and renewable under normal business advancement terms.
(#2) OneTaipan International Limited is one of the directors of Federal Mining Resources Limited, Mr. Chen Ching, has been appointed as directorshareholders of the Company, effective February 20, 2016. Another director of Federal Mining Resources Limited, Mr. Wu Ming Ding, has resigned as directorand held 33.4% of the Company effective February 20, 2016.Company’s issued and outstanding Common Stock as of March 31, 2023. The advances are related to ordinary business transactions and bear no interest or collateral, repayable and renewable under normal business advancement terms.
(#3) OneNOTE 12 –PROMISSORY NOTES
|
| March 31, 2023 |
|
| June 30, 2022 |
| ||
|
|
|
|
|
|
| ||
Promissory Notes (#1) |
| $ | - |
|
| $ | 18,484,028 |
|
Promissory Notes (#2) |
|
| 481,023 |
|
|
| - |
|
|
| $ | 481,023 |
|
| $ | 18,484,028 |
|
(#1) On May 13, 2021, the Company announced the Share Sale Agreement dated May 12, 2021 for the acquisition of the directorsentire issued and paid-up share capital of Federal Capital InvestmentBio Resources Limited Mr. Wu Ming Ding, has resignedfrom Taipan International Limited, an unrelated third party, The Wision Project Limited (formerly known as director“Borneo Resources Limited”), an unrelated third party, and other unrelated third party individuals, in consideration of issuance of 321,500,000 shares of the Company’s restricted Common Stock at $0.03 per share, valued at $9,645,000, and the issuance of promissory notes with two-year term period with a principal amount of $20,355,000. 321,500,000 shares and the promissory notes were issued on May 12, 2021. The face value (principal) amount of $20,355,000 was repayable by May 12, 2023, and bearing zero coupon interest. On January 20, 2022, the Company effective February 20, 2016. The advances are relatedhad reached a mutual agreement with the Lenders of the Notes to ordinary business transactionsenter into a Supplement to Promissory Note with each Lender, to convert the total principal loan amount of $20,355,000 into shares of the Company’s restricted Common Stock priced at $0.0611 per share, which represents the last ninety (90) days’ volume weighted average price (VWAP) as of the market closing of January 19, 2022. With the consummation of the acquisition of BRL on October 12, 2022, on December 9, 2022 the conversion of Promissory Notes was completed pursuant to a Supplementary Agreement dated December 7, 2022, with the issuance of 333,142,389 shares of the Company’s restricted Common Stock, at the price of $0.0611 per share, to the 17 Lenders, including the Company’s President and bear no interest or collateral, repayable and renewable under normal business advancement terms.CEO, Jack Wong.
(#4) OneThe fair value of the directorsoutstanding promissory notes as of Yorkshire Capital Limited, Mr. Lai Kui Shing, Andy, has resigned as director of CSB effective February 17, 2016. The advances are related to ordinary business transactions and bear no interest or collateral, repayable and renewable under normal business advancement terms.June 30, 2022 was calculated with the following assumptions:
Risk free rate | 0.268 | % | ||
Credit spread | 6.513 | % | ||
Liquidity risk premium | 5.000 | % |
The following is a reconciliation of the beginning and ending balances of promissory notes payable using Level 3 inputs:
|
| March 31, |
|
| June 30, |
| ||
|
| 2023 |
|
| 2022 |
| ||
Balance at the beginning of period or year |
| $ | 18,484,028 |
|
| $ | 16,535,942 |
|
Interest expense |
|
| 1,870,972 |
|
|
| 1,948,086 |
|
Converted to Company’s restricted Common Stock |
|
| (20,355,000 | ) |
|
| - |
|
Balance at the end of period or year |
| $ | - |
|
| $ | 18,484,028 |
|
(#2) On March 13, 2023, the Company and its indirect wholly-owned subsidiary CSB entered into a Settlement of Debts Agreement (the “SDA Agreement”) and a two year term period Promissory Note with CSB’s creditor, Borneo Oil Corporation Sdn Bhd (formerly known as Borneo Oil and Gas Corporation Sdn Bhd) (“BOC”) to settle in full a total of $675,888 of CSB’s account payable to the BOC either in cash or by the issuance of new restricted shares of the Company’s Common Stock at a price of $0.07 per share. As set out in the SDA Agreement, the new restricted shares for settlement of the account payable to BOC shall be issued to BOC or its nominee. Promissory Notes with the face value (principal) amount of $675,888, bearing 2% coupon interest were issued on March 13, 2023 and repayable by May 12, 2025, either in cash or by the issuance of the Company’s restricted Common Stock priced at $0.07 per share. The fair value of the Promissory Notes of $481,023 was calculated using the net present value of estimated future cash flows with the assumptions of risk free rate at 4.03%, credit spread of 11.6% and liquidity risk premium of 5.6%.
| Table of Contents |
NOTE 7 - PROPERTY, PLANT AND EQUIPMENT
Property and equipment at December 31, 2017 and June 30, 2017 are summarized as follows:
|
| December 31, 2017 |
|
| June 30, 2017 |
| ||
Land and Building |
| $ | 971,915 |
|
| $ | 915,962 |
|
Plant and Machinery |
|
| 153,081 |
|
|
| 144,268 |
|
Office equipment |
|
| 19,461 |
|
|
| 18,340 |
|
Project equipment |
|
| 1,102,157 |
|
|
| 1,038,707 |
|
Computer |
|
| 10,585 |
|
|
| 9,976 |
|
Motor Vehicle |
|
| 113,940 |
|
|
| 107,381 |
|
Accumulated depreciation |
|
| (2,359,239 | ) |
|
| (2,211,246 | ) |
|
| $ | 11,900 |
|
| $ | 23,388 |
|
The depreciation expenses chargedCompany recorded $0 and $486,978 interest expense for the periodthree months ended DecemberMarch 31, 20172023 and 2016 was $12,475 and $83,475.
NOTE 8 - LOANS FROM BANKS (HIRE PURCHASE INSTALLMENT LOANS)
The loans from banks include long term and short term and are summarized as follow:
|
| December 31, 2017 |
|
| June 30, 2017 |
| ||
Loans from banks |
| $ | 2,397 |
|
| $ | 4,645 |
|
Loans from banks(non-current) |
|
| 1,441 |
|
|
| 2,466 |
|
Total |
| $ | 3,838 |
|
| $ | 7,111 |
|
Hire purchase installment loans with total amount $3,997 and $7,533 as at December 31, 2017and June 30, 2017 were $3,838 and $7,111 net of imprest charges equivalent to interest $159 and $422 are summarized as follows:
|
| Interest |
| Monthly |
|
| December 31, |
|
| June 30, |
| |||
|
| Rate |
| Due |
|
| 2017 |
|
| 2017 |
| |||
Financial institution in Malaysia |
| N/A* |
|
| 1,514 |
|
|
| - |
|
|
| 1,514 |
|
Financial institution in Malaysia |
| N/A* |
|
| 266 |
|
|
| - |
|
|
| 1,059 |
|
Financial institution in Malaysia |
| N/A* |
|
| 211 |
|
|
| 3,997 |
|
|
| 4,960 |
|
Hire purchase loans payable to banks |
|
|
|
|
|
|
| $ | 3,997 |
|
| $ | 7,533 |
|
(*) Hire purchase installment loans with Motor Vehicles as collateral. The financial institutions in Malaysia are Islamic banks and bear no interest in the installment agreement. However, there are certain imprest charges equivalent to interests which are being calculated at an average annual rate of approximate 4.14% for the entire loans life and periods.
The scheduled maturities of the CSL's hire purchase installment loans are as follows:
December 31, |
|
|
| |
2018 |
|
| 2,533 |
|
2019 |
|
| 1,464 |
|
2020 |
|
| - |
|
2021 |
|
| - |
|
Later years |
|
| - |
|
Total minimum hire purchase installment payment |
| $ | 3,997 |
|
Less: Amount representing imprest charges equivalent to interest (current portion: $135 and non-current portion: $24) |
|
| (159 | ) |
Present value of net minimum lease payments (#) |
| $ | 3,838 |
|
(#) Minimum payment reflected in the balance sheet as current and noncurrent obligations under hire purchases installment loans as at December 31, 2017
NOTE 9 - INCOME TAX2022, respectively.
The Company recorded $1,870,972 and $1,441,911 interest expense for the nine months ended March 31, 2023 and 2022, respectively.
NOTE 13 - LEASES
The Company adopted ASU No. 2016-02, Leases and determines whether an arrangement is a lease at inception. This determination generally depends on whether the arrangement conveys the right to control the use of an identified fixed asset explicitly or implicitly for a period of time in exchange for consideration. Control of an underlying asset is conveyed if we obtain the rights to direct the use of and to obtain substantially all of the economic benefit from the use of the underlying asset. Some of our leases include both lease and non-lease components which are accounted for as a single lease component as the Company has elected the practical expedient. Some of the operating lease agreements include variable lease costs, primarily taxes, insurance, common area maintenance or increases in rental costs related to inflation. Substantially all of our equipment leases and some of our real estate leases have terms of less than one year and, as such, are accounted for as short-term leases as we have elected the practical expedient.
Operating leases are included in the right-of-use lease assets, and current and non-current lease liabilities on the Unaudited Condensed Consolidated Balance Sheet. Right-of-use assets and lease liabilities are recognized at each lease’s commencement date based on the present values of its lease payments over its respective lease term. When a borrowing rate is not explicitly available for a lease, the incremental borrowing rate is used based on information available at the lease’s commencement date to determine the present value of its lease payments. Operating lease payments are recognized on a straight-line basis over the lease term.
The Company adopts a 5% as weighted average incremental borrowing rate to determine the present value of the lease payments. The weighted average remaining life of the lease was 3 years.
The table below presents the lease-related assets and liabilities recorded on the balance sheet.
|
| March 31, 2023 |
|
| June 30, 2022 |
| ||
|
|
|
|
|
|
| ||
Assets |
|
|
|
|
|
| ||
Right-of-use asset (#1) |
| $ | 608,572 |
|
| $ | 685,714 |
|
Right-of-use asset (#2) |
|
| 54,883 |
|
|
| - |
|
|
|
| 663,455 |
|
|
| 685,714 |
|
|
|
|
|
|
|
|
|
|
Liabilities |
|
|
|
|
|
|
|
|
Current: |
|
|
|
|
|
|
|
|
Operating lease liabilities |
| $ | 19,851 |
|
| $ | - |
|
Finance lease liabilities |
| $ | 171,538 |
|
| $ | 75,224 |
|
|
|
|
|
|
|
|
|
|
Non-current: |
|
|
|
|
|
|
|
|
Operating lease liabilities |
| $ | 35,032 |
|
| $ | - |
|
Finance lease liabilities |
|
| 654,979 |
|
|
| 97,900 |
|
|
|
|
|
|
|
|
|
|
Total lease liabilities |
| $ | 881,400 |
|
| $ | 173,124 |
|
As of March 31, 2023, right-of-use assets were $663,455 and lease liabilities were $881,400.
As of June 30, 2022, right-of-use assets were $685,714 and lease liabilities were $173,124.
For the three months ended March 31, 2023 and 2022, the amortization charge on right-of use assets was $30,141 and $0, respectively.
For the nine months ended March 31, 2023 and 2022, the amortization charge on right-of-use assets was $87,169 and $0, respectively.
(#1) This leasing arrangement for the lease of the Segama factory amounting to $720,000 is for a lease term of seven (7) years and includes an exclusive right and option to purchase the factory site, together with all its right title and interest, for a consideration to be mutually agreed between the parties at any time during the period of two years from the date of the Lease Agreement. The Lease Payment and Security Payment shall be applied toward the Purchase Price upon VRAP exercising the option to purchase. The Company’s lease agreements do not contain any material restrictive covenants.
There are no corresponding lease liabilities recorded as the lease payments for the entire lease period has been paid upfront upon inception of the agreement.
(#2)This leasing arrangement for the lease of the executive vehicle amounting to $84,718 is for a lease term of three (3) years and includes option to purchase the said vehicle at an agreed consideration as stated in the Lease Agreement. The purchase option fee shall be applied toward the Purchase Price upon VRI exercising the option to purchase. The Company’s lease agreements do not contain any material restrictive covenants.
| F-20 |
| Table of Contents |
The Company excludes short-term leases (those with lease terms of less than one year at inception) from the measurement of lease liabilities or right-of-use assets. The following tables summarize the lease expense for the periods.
|
| Nine Months ended March 31, |
| |||||
|
| 2023 |
|
| 2022 |
| ||
|
|
|
|
|
|
| ||
Finance lease cost: |
|
|
|
|
|
| ||
Interest on lease liabilities (per ASC 842) |
| $ | 22,237 |
|
| $ | - |
|
|
|
|
|
|
|
|
|
|
Operating lease cost: |
|
|
|
|
|
|
|
|
Operating lease expense (per ASC 842) |
|
| 93,614 |
|
|
| 28,571 |
|
|
|
|
|
|
|
|
|
|
Total lease expense |
| $ | 115,851 |
|
| $ | 28,571 |
|
Components of Lease Expense
The Company recognizes operating lease expense on a straight-line basis over the term of the operating leases, comprising interest expense determined using the effective interest method, and amortization of the right-of-use asset, as reported within “general and administrative” expense on the accompanying unaudited condensed consolidated statement of operations.
Finance lease expense comprise of interest expenses determined using the effective interest method.
Future Contractual Lease Payments as of March 31, 2023
The below table summarizes our (i) minimum lease payments over the next five years, (ii) lease arrangement implied interest, and (iii) present value of future lease payments for the next five years and thereafter ending March 31:
Years ending March 31, |
| Operating and finance lease amount |
| |
|
|
|
| |
2024 |
| $ | 191,389 |
|
2025 |
|
| 149,972 |
|
2026 |
|
| 145,996 |
|
2027 |
|
| 143,469 |
|
2028 |
|
| 108,637 |
|
Thereafter |
|
| 141,937 |
|
Total minimum finance lease liabilities installment payment |
| $ | 881,400 |
|
|
|
|
|
|
Representing:- |
|
|
|
|
Current liabilities |
| $ | 191,389 |
|
Non-current liabilities |
|
| 690,011 |
|
|
| $ | 881,400 |
|
NOTE 14 -STOCKHOLDERS’ EQUITY
Authorized Stock
The Company has authorized 10,000,000,000 Common Shares and 50,000,000 preferred shares, both with a par value of $0.001 per share. Each Common share entitles the holder to one vote, in person or proxy, on any matter on which action of the stockholders of the corporation is sought.
Preferred stock outstanding
There are no preferred shares outstanding as of March 31, 2023 and June 30, 2022.
| F-21 |
| Table of Contents |
Common Stock outstanding
On July 15, 2022, the Company issued a total of 1,500,000 restricted Common Shares at US$0.155 per share to two consultants pursuant to two consultant agreements; 1,000,000 restricted Common Shares were issued to Gary F. Zimmer and 500,000 restricted Common Shares were issued to Lisa Leilani Zimmer Durand, to serve as consultants to the Company. An aggregate of $232,500 was recognized as stock-based compensation under general and administrative expenses during the period ended September 30,2022.
During period ended September 30, 2022, 15,328,029 restricted Common Shares were committed to be issued pursuant to private placement and were subsequently issued on November 7, 2022, comprising of 291,667 restricted Common Shares for US$21,000 at US$0.072 per share to one non-US shareholder, 15,036,362 restricted Common Shares for US$1,323,200 at US$0.088 per share to five non-US Shareholders .
On November 7, 2022, the Company issued 603,181 restricted Common Shares for US$53,080 at US$0.088 per share to three US Shareholders.
On October 26, 2022, the Company entered into a corporate consulting services agreement (the “Consulting Agreement”) for investor communication and public relations services with Dutchess Group LLC (“DGL”). On December 9, 2022, pursuant to terms of the Consulting Agreement, the Company issued a total of 1,500,000 restricted Common Shares at US$0.12 per share to DGL.
On November 30, 2022, the Company, through its wholly-owned subsidiary Verde Renewables, Inc.(“VRI”), a company incorporated in the State of Missouri, U.S.A., entered into a Services Agreement (the “Agreement”) with YM Tengku Chanela Jamidah YAM Tengku Ibrahim to engage her as its Director of Strategic Initiatives to promote and make introductions for the benefit of advancing the Company’s business and interests amongst her networks as designated in the Agreement. Under the Agreement, the Company will pay YM Tengku Chanela Jamidah YAM Tengku Ibrahim by the issuance of 1,000,000 shares of the Company’s restricted Common Stock, par value $0.001 per share (the “Common Stock”) in two tranches of 500,000 shares each on or before December 31, 2022 and December 31, 2023 respectively. The term of the Agreement will be for a fixed period of twenty-four (24) months commencing on November 30, 2022 and both parties may renew the agreement or enter into a new agreement as may be mutually agreed on terms to be separately negotiated. On December 31, 2022, pursuant to terms of the Services Agreement, the Company issued a total of 500,000 restricted Common Shares at US$0.20 per share to YM Tengku Chanela Jamidah YAM Tengku Ibrahim.
On December 1, 2022, the Company through its wholly-owned subsidiary VRI, a company incorporated in the State of Missouri, U.S.A., entered into a Services Agreement (the “Agreement”) with Steven Sorhus to engage him as its Financial Controller to prepare monthly financial reports and financial projections, and oversee daily accounting practices of the Company and its subsidiaries as designated in the Agreement. Under the Agreement, the Company will pay Steven Sorhus by the issuance of 800,000 shares of the Company’s restricted Common Stock, par value $0.001 per share (the “Common Stock”) in two tranches of 300,000 shares on or before December 31, 2022 and 500,000 shares on or before December 31, 2023. The term of the Agreement will be for a fixed period of twenty-five (25) months commencing on December 1, 2022 and both parties may renew the agreement or enter into a new agreement as may be mutually agreed on terms to be separately negotiated. On December 31, 2022, pursuant to terms of the Agreement, the Company issued a total of 300,000 restricted Common Shares at US$0.20 per share to Steven Sorhus.
On December 1, 2022, the Company through its wholly-owned subsidiary VRI, a company incorporated in the State of Missouri, U.S.A., entered into a Services Agreement (the “Agreement”) with EMGTA LLC (“EMGTA”). Under the Agreement, EMGTA will provide services to develop business plan and marketing strategy to facilitate business growth, and identify new customers and markets for the Company. The Company will pay EMGTA by the issuance of 750,000 shares of the Company’s restricted Common Stock, par value $0.001 per share (the “Common Stock”) in two tranches of 375,000 shares each on or before December 31, 2022 and December 31, 2023 respectively. The term of the Agreement will be for a fixed period of twenty-five (25) months commencing on December 1, 2022 and both parties may renew the agreement or enter into a new agreement as may be mutually agreed on terms to be separately negotiated. On December 31, 2022, pursuant to terms of the Agreement, the Company issued a total of 375,000 restricted Common Shares at US$0.20 per share to EMGTA.
On December 15, 2022, the Company entered into a Services Agreement (the “Agreement”) with Looi Pei See to engage her as its consultant to develop the retail markets for the Company’s products and services in Malaysia and Singapore. On December 31, 2022, pursuant to terms of the Consulting Agreement, the Company issued a total of 1,140,000 restricted Common Shares at US$0.20 per share to Looi Pei See. The term of the Agreement will be for a fixed period of thirty-six (36) months.
On February 17, 2023, the Company issued 714,285 restricted Common Shares for $50,000 at $0.07 per share to one non-US shareholder.
On February 24, 2023, the acquisition of the assets of biofraction plant and the right to use intellectual property license in Sabah, Malaysia from Borneo Energy Sdn Bhd was completed. The Company had announced the Sale and Purchase Agreement to acquire the assets of biofraction plant and the right to use intellectual property license in Sabah, Malaysia from Borneo Energy Sdn Bhd on May 10, 2021, in consideration of issuance of 166,666,667 share of the Company’s stock at $0.03 per share, valued at $5,000,000. 135,666,667 shares and 31,000,000 shares were issued on May 10, 2021 and July 1, 2021, respectively.
On March 13, 2023, the Company and its indirect wholly-owned subsidiary CSB entered into a Settlement of Debts Agreement (the “SDA Agreement”) and a two year term period Promissory Note with CSB’s creditor Borneo Oil Corporation Sdn Bhd (the “Creditor”) to settle in full a total of USD 675,888 of CSB’s account payable to the Creditor either in cash or by the issuance of new restricted shares of the Company’s Common Stock at a price of $0.07 per share. As set out in the SDA Agreement, the new restricted shares for settlement of the account payable to the Creditor shall be issued to the Creditor or its nominee.
| F-22 |
| Table of Contents |
On March 23, 2023, the Company, through its wholly-owned subsidiary Verde Resources (Malaysia) Sdn. Bhd. (“VRM”), entered into a Shares Sale Agreement (the “SSA Agreement”) with Murugesu A/L M. Narasimha and Deivamalar A/P Kandiah (“Vendors”), the legal and beneficial owners of Vata VM Synergy (M) Sdn. Bhd. (“VATA”), a company incorporated under the laws of Malaysia, to acquire 60% of the issued and paid-up share capital of VATA, a company engaged in the business of providing green technology to government and private sectors and in creating high quality compost using agricultural waste and biomass products in Malaysia. In relation to the SSA Agreement, the Company through VRM also entered into a Shareholders Agreement with Murugesu A/L M. Narasimha and VATA. Under the terms of the SSA Agreement, the consideration for the acquisition of 60% of the issued and paid-up share capital of VATA shall be satisfied by the total purchase consideration of Malaysia Ringgit MYR 2,250,000, which includes a first payment of Malaysia Ringgit MYR 100,000 upon the execution of the SSA Agreement, a second payment of Malaysia Ringgit MYR 150,000 within thirty (30) days from the date of fulfillment or waiver of all the conditions set out in the SSA Agreement, and the issuance of shares of the Company’s restricted Common Stock for the balance consideration of Malaysia Ringgit MYR 2,000,000 at a price per share of not more than ten percent (10%) discount from the immediate preceding five trading days volume weighted average price (“VWAP”) from the issuance date pursuant to the terms of the SSA Agreement.
There were 1,174,290,939 and 819,188,055 shares of Common Stock issued and outstanding at March 31, 2023 and June 30, 2022, respectively.
The Company has no stock option plan, warrants, or other dilutive securities issued during the period.
NOTE 15 - INCOME TAX
For the nine months ended March 31, 2023 and 2022, the local (“United States of America”) and foreign components incurred loss before income taxes as follows:
|
| Nine Months ended March 31, |
| |||||
|
| 2023 |
|
| 2022 |
| ||
|
|
|
|
|
|
| ||
Tax jurisdiction from: |
|
|
|
|
|
| ||
- Local (US regime) |
| $ | (3,344,881 | ) |
| $ | (2,608,660 | ) |
- Foreign, including |
|
|
|
|
|
|
|
|
British Virgin Island |
|
| (338,002 | ) |
|
| - |
|
Malaysia |
|
| (375,897 | ) |
|
| (112,901 | ) |
Labuan, Malaysia |
|
| (8,935 | ) |
|
| - |
|
|
|
|
|
|
|
|
|
|
Loss before income taxes |
| $ | (4,067,715 | ) |
| $ | (2,721,561 | ) |
The provision for income taxes consisted of the following:
Nine Months ended March 31, | ||||||||
2023 | 2022 | |||||||
Current tax: | ||||||||
- Local | $ | - | $ | - | ||||
- Foreign | - | - | ||||||
Deferred tax | ||||||||
- Local | - | - | ||||||
- Foreign | - | - | ||||||
Income tax expense (benefit) | $ | - | $ | - | ||||
The effective tax rate in the periods presented is the result of the mix of income earned in various tax jurisdictions that apply a broad range of income tax rates. The Company mainly operates in U.S.A. and Malaysia and are subject to income taxes on an entity basis on income arising in or derived from, the tax jurisdictionjurisdictions in which they operate. The Company is a Nevada incorporated companyoperate, as follows:
United States of America
VRDR, VRI and VLI are subject to the tax laws of United State Federal Income Tax. GBL is a British Virgin Islands incorporated companyStates of America. The U.S. Tax Cuts and not required to pay income tax on corporate income. CSB is a Malaysia incorporated company and required to payJobs Act (the “Tax Reform Act”) was signed into law. The Tax Reform Act significantly revised the U.S. corporate income tax at 25%regime by, among other things, lowering the U.S. corporate tax rate from 35% to 21% effective January 1, 2018. The Company’s policy is to recognize accrued interest and penalties related to unrecognized tax benefits in its income tax provision. The Company has not accrued or paid interest or penalties which were not material to its results of operations for the periods presented.
The Company has provided for a full valuation allowance against the deferred tax assets of $962,630 on the expected future tax benefits from the net operating loss (“NOL”) carry forwards of $4,583,951 as the management believes it is more likely than not that these assets will not be realized in the future.
| F-23 |
| Table of Contents |
Net Operating Losses (NOLs) generated prior to January 1, 2018 are able to be carried forward up to twenty subsequent years. Any NOLs created for tax years subsequent to that may be carried forward indefinitely. However, any NOLs arising from tax years ending after December 31, 2020, can only be used to offset up to 80% of taxable income.
A reconciliation betweenFor the nine months ended March 31, 2023 and 2022, there were no operating income under US tax regime.
BVI
Under the current BVI law, VRAP is not subject to tax on income.
Labuan
Under the current laws of the Labuan applicable to BRL, income derived from an intellectual property right is subject to tax under the Malaysian Income Tax Act 1967 (ITA) at 24% of its chargeable income. However, BRL is not subject to income tax, computed atgiven that it was a net loss position during the relevant statutory ratecurrent period presented. The losses are presently not able to be carried forward to offset against its future operation income as income generating activities have not yet been undertaken.
Malaysia
VRSB, Champmark and Wision are registered in Malaysia and are subject to the Company's provision forMalaysian corporate income tax is as follows:at a standard income tax rate of 24% on chargeable income.
|
| Period ended |
| |||||
|
| December 31, |
|
| June 30, |
| ||
|
| 2017 |
|
| 2017 |
| ||
US Federal Income Tax Rate. |
|
| 34 | % |
|
| 34 | % |
Valuation allowance – US Rate |
|
| (34 | )% |
|
| (34 | )% |
BVI Income Tax Rate |
|
| 0 | % |
|
| 0 | % |
Valuation allowance – BVI Rate |
|
| (0 | )% |
|
| (0 | )% |
Malaysia Income Tax Rate |
|
| 25 | % |
|
| 25 | % |
Valuation allowance – Malaysia Rate |
|
| (25 | )% |
|
| (25 | )% |
Provision for income tax |
|
| - |
|
|
| - |
|
For the nine months ended March 31, 2023, the operation in Malaysia incurred $5,750,759 of cumulative net operating losses which can be carried forward to offset future taxable income. The net operating loss are allowed to be carried forward up to a maximum of ten (10) years of assessments under the current tax legislation in Malaysia. The Company has provided for a full valuation allowance against the deferred tax assets of $1,380,182 on the expected future tax benefits from the net operating loss (“NOL”) carryforwards as the management believes it is more likely than not that these assets will not be realized in the future.
|
| Nine Months ended March 31, |
| |||||
|
| 2023 |
|
| 2022 |
| ||
|
|
|
|
|
|
| ||
Loss before income taxes |
| $ | (375,897 | ) |
| $ | (112,901 | ) |
Statutory income tax rate |
|
| 24 | % |
|
| 24 | % |
Income tax expense at statutory rate |
|
| (90,215 | ) |
|
| (27,096 | ) |
Non-deductible items |
|
| 9,850 |
|
|
| 3,781 |
|
Operating losses unable to carried forward |
|
| 2,144 |
|
|
| - |
|
Net operating loss |
|
| 78,221 |
|
|
| 23,315 |
|
Income tax expense |
| $ | - |
|
| $ | - |
|
SummaryThe following table sets forth the significant components of the Company's net deferred tax liabilities and assets are as follows:of the Company:
|
| December 31, 2017 |
|
| June 30, 2017 |
| ||
Deferred tax assets: |
|
|
|
|
|
| ||
Tax attribute carryforwards |
| $ | 18,403 |
|
| $ | 114,774 |
|
Valuation allowances |
|
| (18,403 | ) |
|
| (114,774 | ) |
Total |
| $ | - |
|
| $ | - |
|
|
| March 31, 2023 |
|
| June 30, 2022 |
| ||
|
|
|
|
|
|
| ||
Deferred tax assets: |
|
|
|
|
|
| ||
Net operating loss carryforwards, from |
|
|
|
|
|
| ||
US tax regime |
| $ | 962,630 |
|
| $ | 169,688 |
|
Malaysia tax regime |
|
| 1,380,182 |
|
|
| 1,259,662 |
|
Less: valuation allowance |
|
| (2,342,812 | ) |
|
| (1,429,350 | ) |
Deferred tax assets, net |
| $ | - |
|
| $ | - |
|
The Company has recorded valuation allowances for certain tax attribute carry forwards and other deferred tax assets due to uncertainty that exists regarding future realizability. If in the future the Company believes that it is more likely than not that these deferred tax benefits will be realized, the majority of the valuation allowances will be recognizedreversed in the unaudited condensed consolidated statement of operations. The Company did not have any interest and penalty provided or recognized in the income statements for period Decemberthe nine months ended March 31, 2017and June 30, 2017or balance sheet as of December 31, 2017and June 30, 20172023 and 2022. The Company did not have uncertainty tax positions or events leading to uncertainty tax position within the next 12 months.
| Table of Contents |
NOTE 16 -RELATED PARTY TRANSACTIONS
|
| Nine Months ended |
| |||||
|
| March 31, |
| |||||
|
| 2023 |
|
| 2022 |
| ||
Related party transactions: |
|
|
|
|
|
| ||
Sales to: |
|
|
|
|
|
| ||
Borneo Eco Food Sdn Bhd (#2) |
| $ | 12,305 |
|
| $ | - |
|
Rental income: |
|
|
|
|
|
|
|
|
Mr. Jack Wong (#5) |
| $ | 32,967 |
|
| $ | - |
|
Other income – Sales of wash sand to: |
|
|
|
|
|
|
|
|
Jusra Mining Merapoh Sdn Bhd (#1) |
| $ | - |
|
| $ | 12,115 |
|
Site expenses: |
|
|
|
|
|
|
|
|
Warisan Khidmat Sdn Bhd (#3) |
| $ | 9,831 |
|
| $ | - |
|
Professional services provided by: |
|
|
|
|
|
|
|
|
Warisan Khidmat Sdn Bhd (#3) |
| $ | 14,067 |
|
| $ | - |
|
NOTE 10 - COMMITMENTS AND CONTINGENCIES
Related party balances: |
|
| ||||||
|
| As of |
| |||||
|
| March 31, 2023 |
|
| June 30, 2022 |
| ||
Trade receivables |
|
|
|
|
|
| ||
Borneo Eco Food Sdn Bhd (#2) |
| $ | 901 |
|
| $ | 5,933 |
|
|
|
|
|
|
|
|
|
|
Deposits paid for acquisition of property, plant and equipment |
|
|
|
|
|
|
|
|
Borneo Energy Sdn Bhd (#2) |
| $ | - |
|
| $ | 5,000,000 |
|
|
|
|
|
|
|
|
|
|
Trade Payables |
|
|
|
|
|
|
|
|
Warisan Khidmat Sdn Bhd (#3) |
| $ | - |
|
| $ | 7,253 |
|
|
|
|
|
|
|
|
|
|
Advanced from related parties |
|
|
|
|
|
|
|
|
Advanced from BOC (#4) |
| $ | 43,740 |
|
| $ | 555,527 |
|
Advanced from Borneo Energy Sdn Bhd (#2) |
| $ | 15,599 |
|
| $ | - |
|
Taipan International Limited (#6) |
| $ | 119,153 |
|
| $ | - |
|
|
|
|
|
|
|
|
|
|
Advanced to related party |
|
|
|
|
|
|
|
|
Vetrolysis Limited (#7) |
| $ | 100 |
|
| $ | - |
|
|
|
|
|
|
|
|
|
|
Advanced from Director |
|
|
|
|
|
|
|
|
Mr. Carl M. Craven |
| $ | - |
|
| $ | - |
|
Mr. Jack Wong (#5) |
| $ | 16,776 |
|
| $ | - |
|
As at December 31, 2017(#1) Lamax Gold Limited (“LGL”) held 15% equity interests of Champmark Sdn Bhd which was disposed on October 20, 2021 to Verde Resources Asia Pacific Limited (formerly known as Gold Billion Global Limited) and is also the Company's hire purchase installment agreements are disclosed in Note 8. See Note 8 for the commitments for minimum installment payments under these agreements.major shareholder of Jusra Mining Merapoh Sdn Bhd.
NOTE 11 - EARNINGS/(LOSS) PER SHARE
The Company has adopted ASC Topic No. 260, "Earnings Per Share," ("EPS"(#2) Borneo Oil Berhad (“BOB”) which requires presentationis ultimate holding company of basicBorneo Eco Food Sdn. Bhd. and diluted EPS on the faceBorneo Energy Sdn Bhd, and held 13.4% and 22.8% of the income statement for all entities with complex capital structures, and requires a reconciliation of the numerator and denominator of the basic EPS computation to the numerator and denominator of the diluted EPS computation. In the accompanying financial statements, basic earnings (loss) per share is computed by dividing net income (loss) by the weighted average number of shares of common stock outstanding during the period.
The following table sets forth the computation of basic and diluted earnings per share:
|
| Three Months Ended December 31, |
| |||||
|
| 2017 |
|
| 2016 |
| ||
Net income(loss) applicable to common shares |
| $ | 29,638 |
|
| $ | (11,182 | ) |
|
|
|
|
|
|
|
|
|
Weighted average common shares |
|
|
|
|
|
|
|
|
outstanding (Basic) |
|
| 96,038,909 |
|
|
| 93,715,539 |
|
Options |
|
| - |
|
|
| - |
|
Warrants |
|
| - |
|
|
| - |
|
Weighted average common shares outstanding (Diluted) |
|
| 96,038,909 |
|
|
| 93,715,539 |
|
|
|
|
|
|
|
|
|
|
Net income(loss) per share (Basic and Diluted) |
| $ | 0.0003 |
|
| $ | (0.0001 | ) |
|
| Six Months Ended December 31, |
| |||||
|
| 2017 |
|
| 2016 |
| ||
Net income(loss) applicable to common shares |
| $ | 67,308 |
|
| $ | (227,342 | ) |
|
|
|
|
|
|
|
|
|
Weighted average common shares |
|
|
|
|
|
|
|
|
outstanding (Basic) |
|
| 96,038,909 |
|
|
| 93,715,539 |
|
Options |
|
| - |
|
|
| - |
|
Warrants |
|
| - |
|
|
| - |
|
Weighted average common shares outstanding (Diluted) |
|
| 96,038,909 |
|
|
| 93,715,539 |
|
|
|
|
|
|
|
|
|
|
Net income(loss) per share (Basic and Diluted) |
| $ | 0.0007 |
|
| $ | (0.0024 | ) |
The Company has no potentially dilutive securities, such as options or warrants, currentlyCompany’s issued and outstanding.outstanding Common Stock as of March 31, 2023 and June 30, 2022, respectively.
(#3) Warisan Khidmat Sdn. Bhd. is a company whose shareholdings is entirely held by Director of VRSB.
NOTE 12 - CAPITAL STOCK
Authorized Stock
The Company has authorized 10,000,000,000 common shares and 50,000,000 preferred shares, both with a par value of $0.001 per share. Each common share entitles the holder to one vote, in person or proxy, on any matter on which action of the stockholders of the corporation is sought.
Effective February 2, 2018, the Company's Articles of Incorporation were amended to increase the authorized shares of the Company from 250,000,000 shares of common stock to 10,000,000,000 shares of common stock. A copy of the Certificate of Amendment was filed with the Nevada Secretary of State. The Form 8K announcing the increase of the authorized shares of the Company was filed with SEC on February 6, 2018.
Share Issuance
On January 29, 2014, the Company issued a total of 643,229 common shares for $665,238, of which 288,288 common shares at US$1.25 per share, 183,661 common shares at US$0.83 per share and 171,280 common shares at US$0.89 per share, to(#4) Borneo Oil &Corporation Sdn Bhd (formerly known as Borneo Oil and Gas Corporation Sdn Bhd ("BOG"Bhd) (“BOC”), is a Malaysia Limited Liability Company, under the termswholly owned subsidiary of Borneo Oil Berhad (“BOB”) (holding 13.4% and 22.8% of the Sub-Contractor Agreement for the engagement of its sub-contractor services.
On March 10, 2014, the Company issued a total of 693,180 common shares for $609,756, of which 179,340 common shares at US$0.85 per share and 513,840 common shares at US$0.89 per share, to Borneo Oil & Gas Corporation Sdn Bhd ("BOG"), a Malaysia Limited Liability Company, under the terms of the Sub-Contractor Agreement for the engagement of its sub-contractor services.
On January 21, 2015, the Company issued 5,900,000 common shares at US$0.05 per share to Borneo Oil & Gas Corporation Sdn Bhd ("BOG"), a Malaysia Limited Liability Company, under the terms of the Consultant Agreement for the additional services of its sub-contractor.
On September 29, 2016, the Company issued a total of 4,750,000 common shares at US$0.04 per share, of which 2,375,000 common shares to Vincent Lee Sen Min and 2,375,000 common shares to Reggie Abraham, both are Malaysian citizens.
There were 96,038,909 common sharesCompany’s issued and outstanding at DecemberCommon Stock as of March 31, 20172023 and June 30, 2017 respectively.
There2022, respectively). The advances are no preferred shares outstanding. The Company has issued no authorized preferred shares. The Company has no stock option plan, warrants, or other dilutive securities.
NOTE 13 - RELATED PARTY TRANSACTIONS
As of December 31, 2017, advances were made by five companies of $2,359,920 related to ordinary business transactions. All advances related to ordinary business transactions and bear no interest or collateral, repayable and renewable under normal business advancement terms. Details
(#5) Mr. Jack Wong is the President and Chief Executive of the Company effective October 1, 2022. Effective March 30, 2023, Carl Craven voluntarily resigned from his position as Director of the Company. By resolution of the Board of Directors, Jack Wong was appointed Director of the Company for a one (1) year term, effective March 30, 2023. Jack Wong will hold the Board position formerly held by Carl Craven.
(#6) Taipan International Limited is one of the shareholders of the Company, and held 33.4% of the Company’s issued and outstanding Common Stock as of March 31, 2023.
(#7) Encik Anuar bin Ismail, an indirect significant shareholder, is a director of Vetrolysis Limited.
Apart from the transactions and balances detailed above and elsewhere in these accompanying unaudited condensed consolidated financial statements, the Company has no other significant or material related party transactions during the periods presented.
| F-25 |
| Table of Contents |
NOTE 17 -CONCENTRATIONS OF RISK
The Company is exposed to the following concentrations of risk:
(a) Major customers
For the three and nine months ended March 31, 2023 and 2022, there was no single customer whose revenue exceeded 10% of the revenue.
(b) Economic and political risk
The Company’s major operations are disclosedconducted in Note 6.U.S.A. and Malaysia. Accordingly, the political, economic, and legal environments in U.S.A. and Malaysia, as well as the general state of U.S.A. and Malaysia’s economy may influence the Company’s business, financial condition, and results of operations.
(c) Exchange rate risk
The Company cannot guarantee that the current exchange rate will remain steady; therefore there is a possibility that the Company could post the same amount of profit for two comparable periods and because of the fluctuating exchange rate actually post higher or lower profit depending on exchange rate of HKD converted to US$ on that date. The exchange rate could fluctuate depending on changes in political and economic environments without notice.
NOTE 18 -COMMITMENTS AND CONTINGENCIES
As of March 31, 2023, the Company had the following capital commitment:
a) commitment to issue restricted Common Shares to the following service provideron or before December 31, 2017, amounts due from one company of $4,614 related2023 for services to ordinary business transactions. The receivable amounts relatedbe performed pursuant to ordinary business transactions bear no interest or collateral, repayable and renewable under normal advancement terms. Details arethe Service Agreements signed as disclosed in Note 4.14 on or before December 31, 2023:
Number of shares to be issued | ||||
EMGTA LLC | 375,000 | |||
YM Tengku Chanela Jamidah YAM Tengku Ibrahim | 500,000 | |||
Steven Sorhus | 500,000 | |||
| 1,375,000 | ||||
b) commitment to repay Promissory Notes with the face value (principal) amount of $675,888, bearing 2% coupon interest by May 12, 2025 in cash or by issuance of the Company’s restricted Common Shares priced at $0.07 per share as disclosed in Note 12.
Duringc) commitment to pay MYR 150,000 within thirty (30) days from the period ended December 31, 2017,date of fulfillment or waiver of all the Company received other incomeconditions set out in the Shares Sale Agreement (the “SSA Agreement”) for acquisition of $41,56160% of the issued and paid-up share capital of Vata VM Synergy (M) Sdn. Bhd. (“VATA”), and the issuance of shares of the Company’s restricted Common Stock for the balance consideration of MYR 2,000,000 at a price per share of not more than ten percent (10%) discount from BOG.the immediate preceding five trading days volume weighted average price (“VWAP”) from the issuance date pursuant to the terms of the SSA Agreement as disclosed in Note 8.
During the period ended December 31, 2017, the Company incurred cost of revenue worth of $32,208 to BOG.
NOTE 14 - GOING CONCERN AND LIQUIDITY CONSIDERATIONS
The accompanying financial statements have been prepared assuming that the Company will continue as a going concern, which contemplates the realization of assets and the liquidation of liabilities in the normal course of business. As of and for the period ended DecemberMarch 31, 2017,2023, the Company has a profit from operationsno material contingencies.
NOTE 19 -SUBSEQUENT EVENTS
On April 20, 2023, the disposition of $8,744 and working capital deficiency of $2,444,794.Champmark Sdn Bhd (“CSB”) was completed. The Company intendshad announced the Share Sale Agreement to fund operations through debtsell the entire issued and equity financing arrangements, which may be insufficientpaid-up share capital of CSB to fund its capital expenditures, working capital and other cash requirementsJusra Mining Merapoh Sdn Bhd (“JMM”) on March 13, 2023. The consideration for the period ending December 31, 2017sale of the entire issued and subsequently.paid-up share capital of CSB shall be satisfied in full by the payment of Malaysia Ringgit MYR 500,000.
The ability ofOn April 21, 2023, the Company issued 1,428,571 restricted Common Shares for $100,000 at $0.07 per share and 480,768 restricted Common Shares for $50,000 at $0.104 per share to survive is dependent upon, among other things, obtaining additional financing to continue operations, and development of its business plan.one non-US shareholder.
In response to these problems, management intends to raise additional funds through public or private placement offerings,accordance with ASC Topic 855, “Subsequent Events”, which establishes general standards of accounting for and related party loans.
These factors, among others, raise substantial doubt about the Company's ability to continue as a going concern. The accompanying financial statements do not include any adjustmentsdisclosure of events that might result from the outcome of this uncertainty.
NOTE 15 - CONCENTRATIONS
Suppliers
The Company's major suppliers for the period ended December 31, 2016 and 2015 are listed as following:
|
| Subcontractors |
|
| Accounts Payable |
| ||||||||||
|
| Six |
|
| Six |
|
|
|
|
|
|
| ||||
|
| Months |
|
| Months |
|
|
|
|
|
|
| ||||
|
| Ended |
|
| Ended |
|
|
|
|
|
|
| ||||
Major Suppliers |
| December 31, 2017 |
|
| December 31, 2016 |
|
| December 31, 2017 |
|
| December 31, 2016 |
| ||||
Company A |
|
| 100 | % |
|
| 100 | % |
|
| 0 | % |
|
| 0 | % |
Customers
The Company's major customers for the period ended December 31, 2017 and 2016 are listed as following:
|
| Sales |
|
| Accounts Receivable |
| ||||||||||
|
| Six |
|
| Six |
|
|
|
|
|
|
| ||||
|
| Months |
|
| Months |
|
|
|
|
|
|
| ||||
|
| Ended |
|
| Ended |
|
|
|
|
|
|
| ||||
Major Customers |
| December 31, 2017 |
|
| December 31, 2016 |
|
| December 31, 2017 |
|
| December 31, 2016 |
| ||||
Company N |
|
| 0 | % |
|
| 1 | % |
|
| 0 | % |
|
| 0 | % |
Company O |
|
| 100 | % |
|
| 99 | % |
|
| 0 | % |
|
| 0 | % |
NOTE 16 - SUBSEQUENT EVENTS
Effective February 2, 2018, the Company's Articles of Incorporation were amended to increase the authorized shares of the Company from 250,000,000 shares of common stock to 10,000,000,000 shares of common stock. A copy of the Certificate of Amendment was filed with the Nevada Secretary of State. The Form 8K announcing the increase of the authorized shares of the Company was filed with SEC on February 6, 2018.
The Company has evaluated subsequent events fromoccur after the balance sheet date but before unaudited condensed consolidated financial statements are issued, the Company has evaluated all events or transactions that occurred after March 31, 2023, up through the date the Company issued the audited unaudited condensed consolidated financial statements were issued and determined that there are no additionalfurther significant subsequent items which are required to disclose.be disclosed.
| Table of Contents |
Forward-Looking Statements
Except for historical information, this report contains forward-looking statements within the meaning of Section 27A of the Securities Act of 1933 and Section 21E of the Securities Exchange Act of 1934. Such forward-looking statements involve risks and uncertainties, including, among other things, statements regarding our business strategy, future revenues and anticipated costs and expenses. Such forward-looking statements include, among others, those statements including the words "expects," "anticipates," "intends," "believes"“expects,” “anticipates,” “intends,” “believes” and similar language. Our actual results may differ significantly from those projected in the forward-looking statements. Factors that might cause or contribute to such differences include, but are not limited to, those discussed herein as well as in the "Description“Description of Business – Risk Factors"Factors” section in our Annual Report on Form 10-K, as filed on September 30, 2013.November 4, 2022. You should carefully review the risks described in our Annual Report and in other documents we file from time to time with the Securities and Exchange Commission. You are cautioned not to place undue reliance on the forward-looking statements, which speak only as of the date of this report. We undertake no obligation to publicly release any revisions to the forward-looking statements or reflect events or circumstances after the date of this document.
Although we believe that the expectations reflected in these forward-looking statements are based on reasonable assumptions, there are a number of risks and uncertainties that could cause actual results to differ materially from such forward-looking statements.
All references in this Form 10-Q to the "Company," "Verde“Company,” “Verde Resources," "we," "us,"” “we,” “us,” or "our"“our” are to Verde Resources, Inc.
Business Overview
The Company is a Nevada corporation that conducts business operations in Pahang Malaysia through Champmark Sdn Bhd ("CSB"), a privately limited liability company incorporated in Malaysia which is a deemed subsidiary under the management control of our 100% subsidiary GBL.
On October 25, 2013, we entered into an Assignment Agreement For the Assignment of Management Right in Merapoh Gold Mines in Malaysia ("Assignment Agreement") with Federal Mining Resources Limited ("FMR"), a company incorporated under the laws of the British Virgin Islands.
FMR owns 85% equity interest in CSB, a privately limited liability company incorporated in Malaysia. CSB is the Mining Contractor of the Mining Lease for Site IV-1 at the Merapoh Gold Mine under the Contract for Work with MMC Corporation Berhad, the Permit Holder of the Mining Lease.
Under the terms of the Assignment Agreement, FMR assigned its management rights of CSB's mining operation in the Mining Lease to the Company, through its wholly-owned subsidiary Gold Billion Global Limited ("GBL"), in exchange for 80,000,000 shares of the Company's common stock, which constituted 95.26% of our issued and outstanding capital stock as of and immediately after the consummation of the acquisition.
GBL was established on February 7, 2013, by the Board of Directors of FMR to monitor the CSB operation. The acquisition of 100% of the issued and outstanding capital stock of GBL was agreed upon on October 18, 2013, and completed on October 25, 2013, subject to the approval of the Board of Directors and the audit of GBL.
On February 17, 2014, we entered into a Supplementary Agreement to the Assignment Agreement and completed a reverse acquisition of GBL pursuant to the Supplementary Agreement. As a result of the acquisition, the Company holds 100% equity interest in GBL and 85% variable interest in CSB. Our consolidated subsidiaries include GBL being our wholly-owned subsidiary and 85% of CSB being a variable interest entity (VIE) and deemed subsidiary of GBL. On April 1, 2014, GBL purchased 85% equity interest of CSB, and CSB became indirect subsidiary of the Company.
Corporate History and Structure
Verde Resources, Inc. (the “Company” or “VRDR”) was incorporated on April 22, 2010, in the State of Nevada U.S.A. On October 17, 2013, Stephen Spaldingon April 22, 2010.
The Company currently is engaged in the distribution of THC-free cannabinoid (CBD) products, production and Michael Stiege resigned from alldistribution of their positions as officersrenewable commodities and directorsreal property holding. However, the Company has been undergoing a restructuring exercise to shift its focus towards renewable energy and sustainability development with the world faced with challenges of climate change and environmental dehydration. The Company has initiated the disposition of the Company. In addition,mining business via the following persons were appointed to serve as directors and to assume the responsibilities of officers on October 17, 2013. Mr. Wu Ming Ding, as President and Director; Mr. Balakrishnan B S Muthu as Treasurer Chief Financial Officer, General Manager and Director; and Mr. Liang Wai Keen as Secretary. Mr. Wu and Mr. Muthu were added to the Board of Directors.
On April 1, 2014, the Board of Directors of Gold Billion Global Limited ("GBL") notified Federal Mining Resources Limited ("FMR") upon the decision to exercise the right of option to purchase 85% equity interest of Champmark Sdn Bhd ("CSB") under Management Agreement Section 3.2.4 dated July 1, 2013, between GBL and FMR. This acquisition was completed on April 1, 2014, with consideration of US$1, and GBL then became 85% shareholder of CSB.
Effective February 20, 2016, Mr. Wu Ming Ding resigned all of his positions as President and Directorsale of the Company with Mr. Balakrishnan B S Muthu being appointed Presidententire issued and paid-up share capital of CSB to fill the vacancy created. Effective February 20, 2016, Mr. Chen Ching was appointed Director of the Companyfocus on renewable energy and the entire Board of Directors now consists of Mr. Balakrishnan B S Muthu and Mr. Chen Ching.
Effective February 2, 2018, the Company's Articles of Incorporation were amended to increase the authorized shares of the Company from 250,000,000 shares of common stock to 10,000,000,000 shares of common stock. A copy of the Certificate of Amendment was filed with the Nevada Secretary of State. The Form 8K announcing the increase of the authorized shares of the Company was filed with SEC on February 6, 2018.sustainability.
The following diagram illustrates our current corporate structure:
According to ASC 810-05-08 A, CSB is a deemed subsidiary of GBL where GBL has control the Board of Directors of CSB, rights to receive future benefits and residual value, and obligation to absorb loss and finance for CSB. GBL has the power to direct the activities of CSB that most significantly impact CSB's economic performance and the obligation to absorb losses of CSB that could potentially be significant to the CSB or the right to receive benefits from CSB that could potentially be significant to CSB. GBL is the primary beneficiary of CSB because GBL can direct the activities of CSB through the common directors and 85% shareholder FMR. Under 810-23-42, 43, it is determined that CSB is de-facto agent of the principal GBL and so GBL will consolidate CSB from July 1, 2013.
Contractual Arrangements
Our exploration and mining business is currently provided through contractual arrangements with CSB through our wholly-owned subsidiary GBL.
CSB, the VIE of GBL, sells gold minerals directly to the registered gold trading company in Malaysia. We have been and are expected to continue to be dependent on our VIE to operate our exploration and mining business. GBL has entered into contractual arrangements with its VIE, which enable us to exercise effective control over the VIE, receive substantially all of the economic benefits from the VIE, and have the option to purchase equity interests in the VIE. 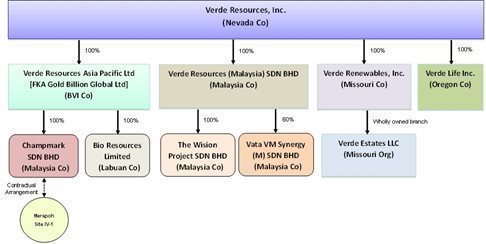
On July 1, 2013,15, 2022, the Company's subsidiary GBL entered intoCompany issued a seriestotal of agreements ("VIE agreements") with FMR1,500,000 restricted Common Shares at US$0.155 per share to two consultants pursuant to two consultant agreements; 1,000,000 restricted Common Shares were issued to Gary F. Zimmer and details500,000 restricted Common Shares were issued to Lisa Leilani Zimmer Durand, to serve as consultants to the Company. An aggregate of $232,500 was recognized as stock-based compensation under general and administrative expenses during the VIE agreements are as follows :
|
| ||
|
| ||
|
| ||
|
| ||
|
| ||
|
| ||
|
| ||
|
| ||
|
| ||
|
|
With the above agreements, GBL controls CSB as the primary beneficiary and the operating results of the VIE was included in the condensed consolidated financial statements for the nine monthsperiod ended March 31, 2014.
CSB holds the operating right to Merapoh Gold Mine (the "Mine") with all regulatory and government operating licenses in Malaysia.September 30, 2022.
On AprilOctober 1, 2014, GBL purchased 85% equity interest2022, Balakrishnan B S Muthu resigned from his position as President of CSB,the Company. Balakrishnan B S Muthu shall remain as Treasurer, Chief Financial Officer, General Manager and CSB became indirect subsidiaryDirector of Verde and Liang Wai Keen shall remain as Secretary of the Company.
Mr. Jack Wong has been appointed President and Chief Executive Officer of the Company effective October 1, 2022. Mr. Wong was the sole shareholder of The Wision Project Sdn Bhd (“Wision”), a subsidiary which was acquired by the Company through its wholly owned subsidiary Verde Resources (Malaysia) Sdn Bhd (“VRSB”) pursuant to Share Sale Agreement (“SSA”) signed on March 23, 2022 for the acquisition of one hundred percent 100% of the issued and paid-up ordinary shares in Wision from Mr. Wong.
On October 1, 2022, the Company’s Board of Directors adopted an employment and compensation agreement for Mr. Wong (the “Agreement”). The Agreement provides for an employment term of five (5) years. Mr. Wong will receive an annual salary of $287,650 inclusive of any tax payable as required by law. The Company will also provide Mr. Wong an executive vehicle, executive housing, health benefits, and equity incentives upon the Company adopting an equity incentive plan.
| 5 |
| Table of Contents |
On October 26, 2022, the Company entered into a corporate consulting services agreement (the “Consulting Agreement”) for investor communication and public relations services with Dutchess Group LLC (“DGL”). Pursuant to terms of the Consulting Agreement, the Company agreed to issue 1,500,000 shares of the Company’s restricted Common Stock to DGL within forty-five (45) days of signing the Consulting Agreement. These shares were subsequently issued in December 2022.
On November 8, 2022, Jack Wong has been appointed Chief Executive Officer of the Company’s wholly owned subsidiaries Verde Renewables, Inc and Verde Life Inc.
On November 22, 2022, the Company through its wholly-owned subsidiary Verde Life Inc. (“VLI”), a company incorporated in the State of Oregon, entered into a Product Distribution Agreement (the “Agreement”) with Country Farms Sdn Bhd (“CF”), a company incorporated in Malaysia and a wholly-owned subsidiary of Berjaya Corporation Berhad, to grant CF with the exclusive right to distribute white-label CBD products from VLI to its customers in Malaysia. Under the Agreement, CF shall pay VLI a deposit of $200,000 upon execution of this Agreement. Upon submission of the first purchase order, CF shall pay 50% of the purchase order value to VLI. Prior to any product shipment, CF shall pay VLI the balance 50% of the purchase order value less an initial deposit of $70,000. The remaining deposit of $130,000 shall be retained for the exclusivity and subsequent orders. The term of the Agreement will commence on November 22, 2022 for a period of three (3) years.
On November 30, 2022, the Company through its wholly-owned subsidiary Verde Renewables, Inc. (“VRI”), a company incorporated in the State of Missouri, U.S.A., entered into a Services Agreement (the “Agreement”) with Y M Tengku Chanela Jamidah Y A M Tengku Ibrahim to engage her as its Director of Strategic Initiatives to promote and make introductions for the benefit of advancing the Company’s business and interests amongst her networks as designated in the Agreement. Under the Agreement, the Company will pay Y M Tengku Chanela Jamidah Y A M Tengku Ibrahim by the issuance of 1,000,000 shares of the Company’s restricted Common Stock, par value $0.001 per share (the “Common Stock”) in two tranches of 500,000 shares each on or before December 31, 2022 and December 31, 2023 respectively. The term of the Agreement will be for a fixed period of twenty-four (24) months commencing on November 30, 2022.
On December 1, 2022, the Company, through its wholly-owned subsidiary VRI, entered into a Services Agreement (the “Agreement”) with Steven Sorhus to engage him as its Financial Controller to prepare monthly financial reports and financial projections, and oversee daily accounting practices of the Company and its subsidiaries as designated in the Agreement. Under the Agreement, the Company will pay Steven Sorhus by the issuance of 800,000 shares of the Company’s restricted Common Stock, par value $0.001 per share (the “Common Stock”) in two tranches of 300,000 shares on or before December 31, 2022 and 500,000 shares on or before December 31, 2023. The term of the Agreement will be for a fixed period of twenty-five (25) months commencing on December 1, 2022.
On December 1, 2022, the Company, through its wholly-owned subsidiary VRI, entered into a Services Agreement (the “Agreement”) with EMGTA LLC (“EMGTA”). Under the Agreement, EMGTA will provide services to develop business plan and marketing strategy to facilitate business growth, and identify new customers and markets for the Company. The Company will pay EMGTA by the issuance of 750,000 shares of the Company’s restricted Common Stock, par value $0.001 per share (the “Common Stock”) in two tranches of 375,000 shares each on or before December 31, 2022 and December 31, 2023 respectively. The term of the Agreement will be for a fixed period of twenty-five (25) months commencing on December 1, 2022.
On December 15, 2022, the Company entered into a Services Agreement (the “Agreement”) with Looi Pei See to engage her as a consultant to develop the retail markets for the Company’s products and services in Malaysia and Singapore. The Company will pay Looi Pei See by the issuance of 1,140,000 shares of the Company’s restricted Common Stock, par value $0.001 per share (the “Common Stock”) on or before December 31, 2022.
On February 17, 2023, the Company issued 714,285 restricted Common Shares for $50,000 at $0.07 per share to one non-US shareholder.
On February 24, 2023, the acquisition of the assets of biofraction plant and the right to use intellectual property license in Sabah, Malaysia from Borneo Energy Sdn Bhd was completed. The Company had announced the Sale and Purchase Agreement to acquire the assets of biofraction plant and the right to use intellectual property license in Sabah, Malaysia from Borneo Energy Sdn Bhd on May 10, 2021, in consideration of issuance of 166,666,667 share of the Company’s stock at $0.03 per share, valued at $5,000,000. 135,666,667 shares and 31,000,000 shares were issued on May 10, 2021 and July 1, 2021, respectively.
On March 13, 2023, the Company through its wholly-owned subsidiary Verde Resources Asia Pacific Limited (“VRAP”) (fka Gold Billion Global Limited), a company incorporated under the laws of the British Virgin Islands, entered into a Share Sale Agreement (the “SSA Agreement”) with Jusra Mining Merapoh Sdn Bhd (“JMM”), a company incorporated under the laws of Malaysia, to sell the entire issued and paid-up share capital of Champmark Sdn Bhd (“CSB”), an indirect wholly-owned subsidiary of the Company engaged in the mining business. Under the terms of the SSA Agreement, the consideration for the sale of the entire issued and paid-up share capital of CSB shall be satisfied in full by the payment of Malaysia Ringgit MYR 500,000.
On March 13, 2023, the Company and its indirect wholly-owned subsidiary CSB entered into a Settlement of Debts Agreement (the “SDA Agreement”) and a two year term period Promissory Note with CSB’s creditor Borneo Oil Corporation Sdn Bhd (the “Creditor”) to settle in full a total of USD 675,888 of CSB’s account payable to the Creditor either in cash or by the issuance of new restricted shares of the Company’s Common Stock at a price of $0.07 per share. As set out in the SDA Agreement, the new restricted shares for settlement of the account payable to the Creditor shall be issued to the Creditor or its nominee.
On March 23, 2023, the Company, through its wholly-owned subsidiary Verde Resources (Malaysia) Sdn. Bhd. (“VRM”), entered into a Shares Sale Agreement (the “SSA Agreement”) with Murugesu A/L M. Narasimha and Deivamalar A/P Kandiah (“Vendors”), the legal and beneficial owners of Vata VM Synergy (M) Sdn. Bhd. (“VATA”), a company incorporated under the laws of Malaysia, to acquire 60% of the issued and paid-up share capital of VATA, a company engaged in the business of providing green technology to government and private sectors and in creating high quality compost using agricultural waste and biomass products in Malaysia. In relation to the SSA Agreement, the Company through VRM also entered into a Shareholders Agreement with Murugesu A/L M. Narasimha and VATA. Under the terms of the SSA Agreement, the consideration for the acquisition of 60% of the issued and paid-up share capital of VATA shall be satisfied by the total purchase consideration of Malaysia Ringgit MYR 2,250,000, which includes a first payment of Malaysia Ringgit MYR 100,000 upon the execution of the SSA Agreement, a second payment of Malaysia Ringgit MYR 150,000 within thirty (30) days from the date of fulfillment or waiver of all the conditions set out in the SSA Agreement, and the issuance of shares of the Company’s restricted Common Stock for the balance consideration of Malaysia Ringgit MYR 2,000,000 at a price per share of not more than ten percent (10%) discount from the immediate preceding five trading days volume weighted average price (“VWAP”) from the issuance date pursuant to the terms of the SSA Agreement.
Effective March 30, 2023, Carl Craven voluntarily resigned from his position as Director of the Company. By resolution of the Board of Directors, Jack Wong was appointed Director of the Company for a one (1) year term, effective March 30, 2023. Jack Wong will hold the Board position formerly held by Carl Craven.
| 6 |
| Table of Contents |
Stage of Operation
On March 13, 2023, the Company initiated its divestment in its mining business.
The Company does not own any titleis diversifying into the green industry with its acquisition of Bio Resources Ltd (“BRL”), the beneficial and/or concession rightregistered proprietor of the intellectual property known as “Catalytic Biofraction Process”, which is a slow pyrolysis process using a proprietary catalyst to depolymerize palm biomass wastes (empty fruit bunches or palm kernel shells) in any mines.temperature range of 350 degree Celsius to 500 degree Celsius to yield commercially valuable bio products: bio-oil, wood vinegar (pyroligneous acid), biochar and bio-syngas. The Companyintellectual property is undertaking natural mineral resource extraction management services.a second-generation pyrolysis process where non-food feedstock like the palm biomass wastes is used as feedstock. The acquisition was completed on October 12, 2022.
AccordingThe Company has been undergoing a restructuring exercise to shift its focus towards renewable energy and sustainability development with the United States Industry Guide 7 (a) (4)world faced with challenges of climate change and environmental dehydration. To focus on renewable energy and sustainability, the Company has initiated the disposition of the mining operations,business via the Merapoh Gold Mine is currentlysale of the entire issued and paid-up share capital of CSB and the acquisition of 60% of the issued and paid-up share capital of VATA, a company engaged in the production stage becausebusiness of providing green technology and in creating high quality compost using agricultural waste and biomass products.
Apart from the mine has produced approximately 8 kilogram gold from January 2017 to December 2017. According to the ASC 930-330-20 Glossary, the production phase is defined as "when saleable minerals are extracted (produced) from an ore body, regardless of the level of production". However, the production is limited to a small part of the site, and extraction is alluvial gold only. The objective ofgreen industry, the Company is preparingalso working on a partnership with MRX Technologies, a market leader in commercial extraction systems for cannabis and hemp. The partnership includes an agreement for Verde Resources to improve the productivity of the mines to ensure that the operation will be carried out effectively and efficiently at minimum cost.white-label THC-free CBD products from MRX Technologies.
| Table of Contents |
Results of Operations
Current Mining Property and Location
Merapoh Gold Mine (the "Mine")
The Merapoh Gold Mine is located in northern Pahang, with convenient road access through Kelantan directly to mine site and is about 400 kilometers away from Kuala Lumpur. The Mine is located in the middle of Malaysia gold metallogenic belt. The central gold belt is the source of the majority of the gold deposits in the peninsula. It lies between the western and eastern tin belts and extends from Kelantan (Sungai Pergau, Sungai Galas) to Pahang (Merapoh, Kuala Lipis, Raub), Terengganu (Lubuk Mandi), Negri Sembilan and Johor (Gunung Ledang).
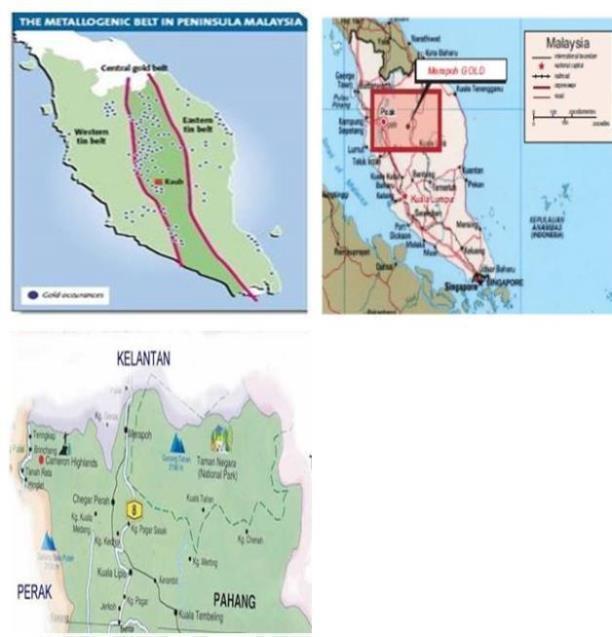
Description of the Mining Process
A planned sequence of events is involved in mining a pit:
|
| |
|
| |
|
| |
|
|
Our in-house exploration team identifies a target and undertakes exploration. Before any hole is drilled or rock mined, much planning goes into making sure the mining sequence runs smoothly and safely as possible. The process of creating access to the possible ore body includes possible ore excavation, possible ore assessment and possible ore segregation.

Process for removing ore concentrates from the ore body
|
| |
|
| |
|
| |
|
| |
|
| |
|
| |
|
| |
|
|
Refining of the concentrate
|
| |
|
| |
|
|
Results of Operations
For the three months ended DecemberMarch 31, 2017 2023and 2016:2022:
The following table sets forth selected financial information from our statements of comprehensive loss for the three months ended March 31, 2023 and 2022:
|
| March 31, 2023 |
|
| March 31, 2022 |
|
| Change |
| |||
|
| Amount |
|
| Amount |
|
| % |
| |||
|
| (Unaudited) |
|
| (Unaudited) |
|
|
| ||||
Revenue |
| $ | 26,586 |
|
| $ | 16,712 |
|
|
| 59.1 | % |
Cost of revenue |
| $ | (44,308 | ) |
| $ | (86,701 | ) |
|
| -48.9 | % |
Gross loss |
| $ | (17,722 | ) |
| $ | (69,989 | ) |
|
| -74.7 | % |
Operating expenses |
| $ | 816,089 |
|
| $ | 498,774 |
|
|
| 63.6 | % |
Interest expense |
| $ | 13,549 |
|
| $ | 486,977 |
|
|
| -97.2 | % |
Other income, net |
| $ | 194,917 |
|
| $ | 99 |
|
|
| 196,785.9 | % |
Loss from continuing operation |
| $ | (652,443 | ) |
| $ | (1,055,641 | ) |
|
| -38.2 | % |
Loss from discontinued operation |
| $ | (55,884 | ) |
| $ | - |
|
|
| - |
|
NET LOSS |
| $ | (708,327 | ) |
|
| (1,055,641 | ) |
|
| -32.9 | % |
The average rate of MYR : USD for three months ended March 31, 2023 and March 31, 2022 was 0.2278 and 0.2383 respectively.
Revenue
The revenue is mainly derived from the sales of products.
We have generated $22,802$26,586 and $186,767$16,712 revenues for the three months ended DecemberMarch 31, 20172023 and 2016,2022.
Cost of revenue
We have generated $44,308 and have recorded a gross income (loss)$86,701 cost of $(12,244) and $55,739revenues for the three months ended DecemberMarch 31, 20172023 and 2016. We have incurred $25,325 and $(102,371) in operating income (expenses) through December 31, 2017 and 2016. We have other income (expenses) $16,557 and $35,450 for the three months ended December 31, 2017 and 2016.2022.
The following table provides selected financial data about our company for the three months ended December 31, 2017 and December 31, 2016.
Statement of Operation |
| 12/31/2017 |
|
| 12/31/2016 |
|
| Change | |||
|
| Amount |
|
| Amount |
|
| % | |||
Revenue |
| $ | 22,802 |
|
| $ | 186,767 |
|
| (88%) | |
Cost of revenue |
| $ | 35,046 |
|
| $ | 131,028 |
|
| (73%) | |
Gross Income (Loss) |
| $ | (12,244 | ) |
| $ | 55,739 |
|
| (122%) | |
Operating Income (Expenses) |
| $ | 25,325 |
|
| $ | (102,371 | ) |
| (125%) | |
Other Income(Expenses) |
| $ | 16,557 |
|
| $ | 35,450 |
|
| (53%) | |
For the six months ended December 31, 2017 and 2016:Gross profit
We have generated $43,523 and $557,003 revenues for the six months ended December 31, 2017 and 2016, and have recorded a gross loss of $2,556$17,722 and $79,047$69,989 for the sixthree months ended DecemberMarch 31, 20172023 and 2016. We have incurred $11,300 and $(196,039) in operating income (expenses) through December 31, 2017 and 2016. We have other income $58,564 and $47,744 for the six months ended December 31, 2017 and 2016.2022.
The following table provides selected financial data about our company for the six months ended December 31, 2017 and December 31, 2016. Operating expense
Statement of Operation |
| 12/31/2017 |
|
| 12/31/2016 |
|
| Change |
| |||
|
| Amount |
|
| Amount |
|
| % |
| |||
Revenue |
| $ | 43,523 |
|
| $ | 557,003 |
|
| (92%) |
| |
Cost of revenue |
| $ | 46,079 |
|
| $ | 636,050 |
|
| (93%) |
| |
Gross Loss |
| $ | 2,556 |
|
| $ | 79,047 |
|
| (97%) |
| |
Operating Income (Expenses) |
| $ | 11,300 |
|
| $ | (196,039 | ) |
| (106%) |
| |
Other Income(Expenses) |
| $ | 58,564 |
|
| $ | 47,744 |
|
|
| 23 | % |
The revenue derived from the sales of gold mineral to customers in Malaysia. The decrease of revenue for the period ended December 31, 2017 was mainly due to a decrease in gold production because of depleting mineral reserves in the mine and gold sales during the period. The decrease of cost of revenue was mainly due to a decrease of gold production corresponding to the decrease in revenue during the period. Operating expenses comprised mainly of salaries, office costs, legal and professional fees and travelling expenses.fees. The decreaseincrease in operating expenses for the period was mainly due to the decreaseincrease of salariesconsultancy fee and an increase in foreign exchange gainlegal and professional fees during the period. Net other
We have incurred $816,089 and $498,774 in operating expenses through March 31, 2023 and 2022.
Interest expense and Other income, comprise mainlynet
We have interest expense of miscellaneous non-operating$13,549 and $486,977 for the three months ended March 31, 2023 and 2022. The decrease in interest expenses equipment rental income and waiver of consultancy service fee. The increase in net other income for the period was mainly due to settlement of promissory note in period ended December 31, 2022.
We have other net income of $194,917 and $99 for the three months ended March 31, 2023 and 2022. The increase in net income for the period was due to fair value adjustment on convertible promissory note issued to BOC as disclosed in Note 12.
Net loss
As a result of equipment rental incomethe above factors, the Company incurred a net loss of $708,327 and $1,055,641 for the waiverthree months ended March 31, 2023 and 2022, respectively.
| 8 |
| Table of Contents |
For the nine months ended March 31, 2023and 2022:
The following table sets forth selected financial information from our statements of consultancy service fee.comprehensive loss for the nine months ended March 31, 2023 and 2022:
|
| March 31, 2023 |
|
| March 31, 2022 |
|
| Change |
| |||
|
| Amount |
|
| Amount |
|
| % |
| |||
|
| (Unaudited) |
|
| (Unaudited) |
|
|
| ||||
Revenue |
| $ | 134,038 |
|
| $ | 16,712 |
|
|
| 702.0 | % |
Cost of revenue |
| $ | (123,903 | ) |
| $ | (86,701 | ) |
|
| 42.9 | % |
Gross profit/(loss) |
| $ | 10,135 |
|
| $ | (69,989 | ) |
|
| -114.5 | % |
Operating expenses |
| $ | 2,381,155 |
|
| $ | 1,221,875 |
|
|
| 94.9 | % |
Interest expense |
| $ | 1,893,209 |
|
| $ | 1,441,911 |
|
|
| 31.3 | % |
Other income, net |
| $ | 196,514 |
|
| $ | 12,214 |
|
|
| 1,508.9 | % |
Loss from continuing operation |
| $ | (4,067,715 | ) |
| $ | (2,721,561 | ) |
|
| 49.46 | % |
Loss from discontinued operation |
| $ | (157,284 | ) |
| $ | - |
|
|
| - |
|
NET LOSS |
| $ | (4,224,999 | ) |
|
| (2,721,561 | ) |
|
| 55.24 | % |
The average rate of MYR : USD for nine months ended March 31, 2023 and March 31, 2022 was 0.2233 and 0.2390 respectively.
Revenue
The revenue is mainly derived from the rental income and sales of gold mineral to customers in Malaysia. The decreaseproducts.
We have generated $134,038 and $16,712 revenues for the nine months ended March 31, 2023 and 2022.
Cost of revenue
We have generated $123,903 and $86,701 cost of revenuerevenues for the periodnine months ended DecemberMarch 31, 2017 was mainly due to2023 and 2022.
Gross profit
We have recorded a decrease in gold productiongross profit of $10,135 and gold sales duringa gross loss of $69,989 for the period. nine months ended March 31, 2023 and 2022.
Operating expense
Operating expenses comprised mainly of salaries, office costs, legal and professional fees and travelling expenses.fees. The increase in operating expenses werefor the period was mainly denominated in MYR and decrease compared with six months ended December 31, 2016 due to decreasethe increase of salariesconsultancy fee and an increase in foreign exchange gainlegal and professional fees during the period. Moreover, the average rate of MYR : USD for six months December 31, 2017 and December 31, 2016 was 0.2387 and 0.2387 respectively.
Plan of Operation
Our Industry and Principal Markets
As reported in the GFMS Annual Surveys 2017 released by Thomson Reuters, gold prices are likely to remain volatile in the near future, and the market is not expected to regain its composure as investors remain averse to risk. The forecast of a $1,259 average per ounce for 2017 is partly predicated on information contained in this report, but also on the expectation that the Indian market will start to find its feet again, helping to contain price weakness and providing a more stable backdrop for the returning investors. The longer term prognosis is for further price gains even against the headwind of the Federal Reserve raising rates.
In another forecast by Business Monitor International (BMI) in mid-2016, global gold mine output growth will continue to decelerate, as miners focus on cost cutting and divesting from unprofitable assets in a weak price environment. BMI made the forecast for global gold production to increase slightly, from 98.4 million ounces in 2016 to 106 million ounces by 2020, averaging 1.8% growth. BMI also reported that the Malaysia’s mining industry is anticipated to reach US$38.7bn by 2017, growing at an annual average rate of 2.5% from 2011 levels. The bulk of this growth will be led by the country’s nascent gold mining sector, which has attracted a number of foreign investors in recent years. The mineral exploration activities are subject to extensive national and local government regulations in Malaysia, which regulations may be revised or expanded at any time. Generally, compliance with these regulations requires the company to obtain the permits issued by government regulatory agencies. Certain permits require periodic renewal or review of their conditions. Malaysia provides an attractive mining legislative environment for foreign investors, but there is the risk that these laws will change once the country is able to attract enough foreign money.
Subcontractor
In an effort to enhance the efficiency of mine operations at the Merapoh Gold Mine, Champmark Sdn Bhd ("CSB") entered into an Operation Term Sheet ("OTS") agreement in July 2013 to outsource the exploitation works of alluvial gold resources at Site IV-1 of the Merapoh Gold Mine to a subcontractor Borneo Oil & Gas Corporation Sdn Bhd ("BOG").
BOG has the experience and local knowledge in managing the exploitation of alluvial gold at the Merapoh Gold Mine. The Company will provide necessary disclosure when any significant agreements have been made with sub-contractors in the future.
BOG became the Company's shareholder in January 29, 2014, and was no longer a third party subcontractor.
Expansion Plans
At present, we are well positioned working with our third party subcontractor, who has the experience and local knowledge to manage our exploitation of alluvial gold at the Merapoh Gold Mine. The Company believes that there are excellent growth opportunities for its business outside Malaysia. We are constantly exploring for potential acquisition of mining projects in other parts of the world.
The Company, through its wholly-owned subsidiary company Gold Billion Global Ltd ("GBL") entered into a letter of intent with Xinjiang Changhe Mining Co., Ltd ("XCM") on September 29, 2014. Under the letter of intent, GBL has offered to acquire ownership in XCM for the Ayigate Gold Project subject to due diligence. The Ayigate gold mine is located within the Tianshan region in Wuqia County, Xinjiang Uygur Autonomous Region of the People's Republic of China. After several discussions, the Company decided not to proceed with the offer to acquire ownership in XCM.
As our business is affected by the fluctuations of gold prices, the Company intends to diversify its product line by acquiring mining projects with potential for different mineral resources other than gold. We continue to hold discussions with other mining companies for potential collaboration to carry out exploration and exploitation works on other mineral resources in Southeast Asia regions.
Limited Operating History; Need for Additional Capital
There is no historical financial information about us upon which to base an evaluation of our performance. We cannot guarantee we will be successful in our business operations. Our business is subject to risks inherent in the establishment of a new business enterprise, including limited capital resources, possible delays in the exploration of our properties, and possible cost overruns due to price and cost increases in services.
We have no assurance that future financing will be available to us on acceptable terms. If financing is not available on satisfactory terms, we may be unable to continue, develop or expand our operations. Equity financing could resultincurred $2,381,155 and $1,221,875 in additional dilution to existing shareholders.operating expenses through March 31, 2023 and 2022.
Interest expense and Other income, net
We have interest expense of $1,893,209 and $1,441,911 for the nine months ended March 31, 2023 and 2022. The increase in interest expenses for the period was mainly due to early conversion of promissory notes in period ended December 31, 2022.
We have other net income of $196,514 and $12,214 for the nine months ended March 31, 2023 and 2022. The increase in net income for the period was due to fair value adjustment on convertible promissory note issued to BOC as disclosed in Note 12.
Net loss
As a result of the above factors, the Company incurred a net loss of $4,224,999 and $2,721,561 for the nine months ended March 31, 2023 and 2022, respectively.
| Table of Contents |
Liquidity and Capital Resources
The following table provides selectedsummarizes the key component of our cash flow data about our companyflows for the sixnine months ended DecemberMarch 31, 20172023 and December 31, 2016.2022.
Cash Flow Date |
| 12/31/2017 |
|
| 12/31/2016 |
| ||
Net Profit (Loss) from operation |
| $ | 67,308 |
|
| $ | (227,342 | ) |
Net Cash Generated/(Used) from operating activities |
| $ | 12,170 |
|
| $ | (67,013 | ) |
Net Cash Generated/(Used) from investing activities |
| $ | - |
|
| $ | - |
|
Net Cash Generated/(Used) from financing activities |
| $ | (3,581 | ) |
| $ | 184,783 |
|
Cash Flow Date |
| March 31, 2023 |
|
| March 31, 2022 |
| ||
|
|
|
|
|
|
| ||
Net Cash (Used in) operating activities |
| $ | (1,533,319 | ) |
| $ | (1,097,381 | ) |
Net Cash (Used in) investing activity |
|
| (364,540 | ) |
|
| (309,642 | ) |
Net Cash Provided by financing activities |
|
| 1,577,687 |
|
|
| 1,004,197 |
|
Effect of exchange rate fluctuation on cash and cash equivalents |
|
| 142,262 |
|
|
| 7,787 |
|
Net decrease in cash and cash equivalents |
|
| (320,172 | ) |
|
| (402,826 | ) |
Cash and cash equivalents, beginning of period |
|
| 418,917 |
|
|
| 2,117,622 |
|
Cash and cash equivalents, ending of period |
| $ | 241,371 |
|
| $ | 1,722,583 |
|
Net Cash (Used in) Operating Activities
For the sixnine months ended DecemberMarch 31, 2017,2023, the Company had incurred net profitloss from operation of $67,308$4,224,999 which posted a positivenegative impact to the company'sCompany’s cash flow. The reconciliation on non-cash items such as depreciationsinterest expenses, depreciation and amortization provide negativepositive impact on cash.
In the operation analysis, the net cash generatedused in operating activities increased from $(67,013)$1,097,381 to $12,170.$1,533,319. The $67,308 net profitoperation loss of $4,224,999 was partially offset by the noncash incomeexpenses such as $17,006$177,074 in waiverdepreciation, $98,954 in amortization, $448,123 in share-based compensation, $1,870,972 in interest expenses on promissory notes, $22,237 in lease interest expense, fair value adjustment on convertible promissory note of consultancy fee less $12,475 in depreciation.$194,865 and $600 from gain on disposal of property, plant and equipment. In the operating assets and liabilities, the net increase in current assets such asresulted from an increase of other receivables, deposits and prepayments of $96,124, an increase in inventories held of $10,600 and a decrease in accounts receivablereceivables of $7,196. The net increase in current liabilities resulted from $165,792 increase in advances from related parties, deposits$183,312 increase in accrued liabilities and prepayment was $4,040 whereas the netother payables and $25,970 increase in accounts payable, offset by a decrease in current liabilities, such as accounts payable, accrued liabilities, advancedadvances from related parties and deposit received from customer was $46,567, which provided negative cash flow effect to offset the $67,308 profit in operation.director of $5,761. The final result of the cash flow fromused in operating activities was positive cash flow effect.$1,533,319.
In theNet Cash (Used in) Investing Activity
The net cash used by investing activity of $364,540 resulted from purchase of property, plant and equipment of $473,895, deposit paid for acquisition of subsidiary company of $22,609, offset by proceeds on disposal of $23,000, net proceed from disposal of discontinued operation of $107,824 and net cash flow analysis, there was no changeon acquisition of a subsidiary company of $1,140 for the threenine months ended DecemberMarch 31, 2017.2023.
In theNet Cash Provided by) Financing Activities
The net cash provided by financing analysis, there was loan principal $3,581 repaidactivities of $1,577,687 resulted from proceeds from shares issued of $1,556,280 and net proceeds from drawdown of loans of $100,000, set off partially by repayments to the banklease liabilities and related interests for the sixnine months ended DecemberMarch 31, 2017, compared to $5,217 repaid to the bank for the six months ended December 31, 2016. There was also proceeds from the issuance2023 of common stock of $190,000 for six months ended December 31, 2016.
Besides, the net increase in exchange rate effect of $35,980 provided a negative cash flow effect. The cash$56,356 and cash equivalents at the end of December 31, 2017, was decreased by $27,391 with $11,225 as balance.$22,237 respectively.
The cash flow situation will not allow for operations in the coming next 12 months by self-generated cash provided from operating activities. The Company needs to increase cash flow supplies with a long term plan until the Company makes sustainable profits and has a positive cash flow. Otherwise, loans from related parties may be a temporary solution, although we have no written loan agreements. There is no guarantee that we will be able to secure adequate financing. If we fail to secure sufficient funds, our business activities may be curtailed, or we may cease to operate.
Working Capital
As of March 31, 2023 and June 30, 2022, we had cash and cash equivalent of $241,371 and $418,917, respectively. As of March 31, 2023 and June 30, 2022, we have incurred accumulated operating losses of $10,518,469 and $10,357,920, respectively.
Off-Balance Sheet Arrangements
We do not have any off-balance sheet arrangements that have or are reasonably likely to have a current or future effect on our financial condition, changes in financial condition, revenues or expenses, results of operations, liquidity, capital expenditures, or capital resources that is material to investors.
| Table of Contents |
Item 3. Quantitative and Qualitative Disclosures About Market Risk.
As a "smaller“smaller reporting company"company”, we are not required to provide the information required by this Item.
Item 4. Controls and Procedures.
Evaluation of Disclosure Controls and Procedures
Under the supervision and with the participation of our senior management, including our Chief Executive Officer and Chief Financial Officer, we conducted an evaluation of the effectiveness of the design and operation of our disclosure controls and procedures, as defined in Rules 13a-15(e) and 15d-15(e) under the Securities Exchange Act of 1934, as amended (the “Exchange Act”), as of the end of the period covered by this Quarterly Report on Form 10-Q (the “Evaluation Date”). During 2022, the Company has been undertaking tremendous changes and expansion which rendered the management to re-consider the availability of more management talents and professional staff to meet the enlargement in operation under the coming acquisition and expansion move. Based on this evaluation, our Chief Executive Officer and Chief Financial Officer concluded as of the Evaluation Date that our disclosure controls and procedures were not effective such that the information relating to us required to be disclosed in our Securities and Exchange Commission (“SEC”) reports (i) is recorded, processed, summarized and reported within the time periods specified in SEC rules and forms, and (ii) is accumulated and communicated to our management, including our chief executive officer and chief financial officer, as appropriate to allow timely decisions regarding required disclosure.
As of DecemberMarch 31, 2017,2023 management also assessed the effectiveness of our internal control over financial reporting based on the criteria for effective internal control over financial reporting established in Internal Control--Integrated Framework issued by the Committee of Sponsoring Organizations of the Treadway Commission ("COSO"(“COSO”) and SEC guidance on conducting such assessments.assessments Based on thatour consideration and evaluation, theythe current management concluded that, during the period covered by this report, such internal controls and procedures were not effective to detect the inappropriate application of US GAAP rules as more fully described below. This was due to deficiencies that existed in the design or operation of our internal controls over financial reporting that adversely affected our internal controls and that may be considered to be material weaknesses.
The matters involving internal controls and procedures that our management considered to be material weaknesses under the standards of the Public Company Accounting Oversight Board were: (1) lack of a functioning audit committee, (2) lack of a majority of outside directors on our board of directors, resulting in ineffective oversight in the establishment and monitoring of required internal controls and procedures; (3) inadequate segregation of duties consistent with control objectives; and (4) management is dominated by three individuals without adequate compensating controls. The aforementioned material weaknesses were identified by our Chief Executive and Financial Officers in connection with the review of our financial statements as of DecemberMarch 31, 2017.2023. In the meantime, management has appointed external consultants to minimise risk and ascertain compliance of the requirements.
Management believes that the material weaknesses set forth above did not have an immediate negative effect on our financial results because of our small size of operation. However, management believes that the lack of a functioning audit committee and the lack of a majority of outside directors on our board of directors results in ineffective oversight in the establishment and monitoring of required internal controls and procedures, which could result in a material misstatement in our financial statements if the Company were growing substantially inafter the future periods.expansion move was materialized.
Changes in Internal Controls
There have been no changes in our internal controls over financial reporting identified in connection with the evaluation required by paragraph (d) of Securities Exchange Act Rule 13a-15 or Rule 15d-15 that occurred in the threenine months ended DecemberMarch 31, 20172023 that have materially affected, or are reasonably likely to materially affect, our internal control over financial reporting.
| Table of Contents |
We know of no material, existing or pending legal proceedings against our Company, nor are we involved as a plaintiff in any material proceeding or pending litigation. There are no proceedings in which any of our directors, officers or affiliates, or any registered beneficial shareholder, is an adverse party or has a material interest adverse to our interest.
As a "smaller“smaller reporting company"company”, we are not required to provide the information required by this Item.
Item 2. Unregistered Sales of Equity Securities and Use of Proceeds.
N/A.
Item 3. Defaults Upon Senior Securities.
None.
Item 4. Mine Safety Disclosure.
Pursuant to Section 1503(a) of the Dodd-Frank Wall Street Reform and Consumer Protection Act of 2010 (" (“Dodd-Frank Act ")”), issuers that are operators, or that have a subsidiary that is an operator, of a coal or other mine in the United States are required to disclose in their periodic and annual reports filed with the SEC information regarding specified health and safety violations, orders and citations, related assessments and legal actions, and mining-related fatalities under the regulation of the Federal Mine Safety and Health Act of 1977. The Company did not have any mines in the United States during the period ended DecemberMarch 31, 2017.2023.
There were changes in Directors and Executive Officers effective on February 20, 2016. For details, please refer to SC 14F1 and Form 8-K filed by the registrant to SEC on February 10, 2016 and February 22, 2016 respectively, at SEC website: www.sec.gov.None.
| Table of Contents |
The following exhibits are included as part of this report:
______________
101*
* The following financial information from Verde Resources, Inc.'s’s Quarterly Report on Form 10-Q for the quarter ended DecemberMarch 31, 2017,2023, formatted in XBRL (eXtensible Business Reporting Language): (i) Condensed Balance Sheets as of DecemberMarch 31, 2017,2023, and June 30, 2017,2022, (ii) Condensed Statements of Operations for the three and sixnine months ended DecemberMarch 31, 20172023 and 2016,2022, (iii) Condensed Statements of Cash Flows for the sixnine months ended DecemberMarch 31, 20172023 and 2016,2022, and (iv) Notes to Condensed Financial Statements.
| Table of Contents |
Pursuant to the requirements of the Securities Exchange Act of 1934, the registrant has duly caused this report to be signed on its behalf by the undersigned thereunto duly authorized.
| VERDE RESOURCES, INC. | ||||
(Registrant) | |||||
|
|
| |||
| |||||
Dated: | By: | /s/ Jack Wong |
|
| |
|
|
| |||
|
| President and Chief Executive Officer | |||
|
| (Principal Executive Officer) | |||
| 14 |
|