UNITED STATES
SECURITIES AND EXCHANGE COMMISSION
Washington, D.C. 20549
FORM 10–Q10-Q
(Mark One)
x QUARTERLY REPORT PURSUANT TO SECTION 13 OR 15(d) OF THE SECURITIES EXCHANGE ACT OF 1934
For the quarterly period ended December 31, 2018September 30, 2019
or
¨ TRANSITION REPORT PURSUANT TO SECTION 13 OR 15(d) OF THE SECURITIES EXCHANGE ACT OF 1934
For the transition period from ____________ to ____________________________
Commission file number: 000-55276
Verde Resources, Inc. |
(Exact name of registrant as specified in its charter) |
Nevada |
| 32-0457838 |
(State or other jurisdiction of incorporation or organization) |
| (I.R.S. Employer Identification No.) |
Block B-5, 20/F, Great Smart Tower, 230 Wanchai Road, Wanchai, Hong Kong |
(Address of principal executive offices) |
|
(852) 21521223 |
(Registrant’s telephone number, including area code) |
Indicate by check mark whether the registrant (1) has filed all reports required to be filed by Section 13 or 15(d) of the Securities Exchange Act of 1934 during the preceding 12 months (or for such shorter period that the Registrant was required to file such reports), and (2) has been subject to such filing requirements for the past 90 days. Yes x No ¨
Indicate by check mark whether the registrant has submitted electronically and posted on its corporate Web site, if any, every Interactive Data File required to be submitted and posted pursuant to Rule 405 of Regulation S-T (§232.405 of this chapter) during the preceding 12 months (or for such shorter period that the registrant was required to submit and post such files). Yes x No ¨
Indicate by check mark whether the registrant is a large accelerated filer, an accelerated filer, a non-accelerated filer, or a smaller reporting company. See the definitions of “large accelerated filer,” “accelerated filer” and “smaller reporting company” in Rule 12b-2 of the Exchange Act (Check one).
Large accelerated filer | ¨ | Accelerated filer |
|
Non-accelerated filer |
| Smaller reporting company | x |
(Do not check if a smaller reporting company) | |||
Indicate by check mark whether the registrant is a shell company (as defined in Rule 12b-2 of the Exchange Act). Yes ¨ No x
As of February 14,November 19, 2019 there were 115,038,909 shares of the issuer’s common stock, par value $0.001, outstanding.
VERDE RESOURCES, INC.
FORM 10-Q
FOR THE QUARTERLY PERIOD ENDED DECEMBER 31, 2018SEPTEMBER 30, 2019
| PAGE | |||
| ||||
| ||||
| 3 | |||
| ||||
Management’s Discussion and Analysis of Financial Condition and Results of Operations. |
|
| ||
| ||||
|
| |||
| ||||
|
| |||
| ||||
| ||||
|
| |||
| ||||
|
| |||
| ||||
Unregistered Sales of Equity Securities and Use of Proceeds. |
|
| ||
| ||||
|
| |||
| ||||
|
| |||
| ||||
|
| |||
| ||||
|
| |||
|
|
| ||
| 2 |
PART I - FINANCIAL INFORMATION
VERDE RESOURCES, INC.
INDEX TO INTERIM CONDENSEDINTERIMCONDENSED CONSOLIDATED FINANCIAL STATEMENTS
FOR THE PERIOD OF ENDED DECEMBER 31, 2018SEPTEMBER 30, 2019
| Page | |||
| ||||
| 4 | |||
| ||||
| 5 | |||
| ||||
| 6 | |||
| ||||
7 | ||||
|
|
|
| |
| 8 |
|
| 3 |
| Table of Contents |
Condensed Consolidated Balance Sheets
|
| As at September 30, |
| As at June 30, |
| |||||||||||
|
| As at December 31, |
| As at June 30, |
|
| 2019 |
|
| 2019 |
| |||||
|
| 2018 |
|
| 2018 |
|
| (Unaudited) |
| (Audited) |
| |||||
ASSETS |
| (Unaudited) |
| (Audited) |
|
|
|
|
|
| ||||||
Current Assets |
|
|
|
|
|
|
|
|
|
| ||||||
Cash and cash equivalents |
| $ | 6,185 |
| $ | 10,032 |
|
| $ | 14,493 |
| $ | 10,662 |
| ||
Amount due from related parties |
| - |
| 4,621 |
| |||||||||||
Inventories |
| 4,293 |
| 9,038 |
| |||||||||||
Deposit & prepayment |
|
| 1,507 |
|
|
| 1,615 |
|
|
| 644 |
|
|
| 974 |
|
Total Current Assets |
| $ | 11,985 |
|
| $ | 25,306 |
|
| $ | 15,137 |
|
| $ | 11,636 |
|
Long Term Assets |
|
|
|
|
|
|
|
|
|
| ||||||
Property, plant and equipment |
| $ | 2,474 |
|
| $ | 6,142 |
|
| $ | 1 |
|
| $ | 1 |
|
Total Long Term Assets |
| $ | 2,474 |
|
| $ | 6,142 |
|
| $ | 1 |
|
| $ | 1 |
|
|
|
|
|
|
|
|
|
|
|
| ||||||
TOTAL ASSETS |
| $ | 14,459 |
|
| $ | 31,448 |
|
| $ | 15,138 |
|
| $ | 11,637 |
|
|
|
|
|
|
|
|
|
|
|
| ||||||
LIABILITIES AND STOCKHOLDERS’ DEFICIT |
|
|
|
|
|
|
|
|
|
| ||||||
Current Liabilities |
|
|
|
|
|
|
|
|
|
| ||||||
Accounts payable |
| $ | 1,561,316 |
| $ | 1,601,894 |
|
| $ | 1,542,043 |
| $ | 1,563,102 |
| ||
Advanced from related parties |
| 563,059 |
| 803,096 |
|
| 521,517 |
| 592,683 |
| ||||||
Accrual |
| 34,421 |
| 38,791 |
| |||||||||||
Accrual and other payables |
| 166,029 |
| 76,490 |
| |||||||||||
Taxation payable |
| - |
| 468 |
|
| - |
| - |
| ||||||
Loans from banks |
|
| 1,411 |
|
|
| 2,461 |
|
|
| - |
|
|
| 193 |
|
Total Current Liabilities |
| $ | 2,160,207 |
|
| $ | 2,446,710 |
|
| $ | 2,229,589 |
|
| $ | 2,232,468 |
|
Long term Liabilities |
|
|
|
|
|
|
|
|
|
| ||||||
Loans from banks (non-current) |
| $ | - |
|
| $ | 198 |
|
| $ | - |
|
| $ | - |
|
Total Long Term Liabilities |
| $ | - |
|
| $ | 198 |
|
| $ | - |
|
| $ | - |
|
|
|
|
|
|
|
|
|
|
|
| ||||||
TOTAL LIABILITIES |
| $ | 2,160,207 |
|
| $ | 2,446,908 |
|
| $ | 2,229,589 |
|
| $ | 2,232,468 |
|
|
|
|
|
|
|
|
|
|
|
| ||||||
STOCKHOLDERS’ DEFICIT |
|
|
|
|
|
|
|
|
|
| ||||||
Preferred stock, par value $0.001, 50,000,000 shares authorized, none issued and outstanding |
| - |
| - |
|
| - |
| - |
| ||||||
Common stock, par value $0.001, 10,000,000,000 shares authorized, 115,038,909 shares issued and outstanding as of December 31, 2018 & June 30, 2018 respectively |
| $ | 115,039 |
| $ | 115,039 |
| |||||||||
Common stock, par value $0.001, 10,000,000,000 shares authorized, 115,038,909 shares issued and outstanding as of September 30, 2019 and June 30, 2019 |
| $ | 115,039 |
| $ | 115,039 |
| |||||||||
Additional paid-in capital |
| 2,416,243 |
| 2,416,243 |
|
| 2,416,243 |
| 2,416,243 |
| ||||||
Accumulated deficit |
| (4,771,253 | ) |
| (4,934,011 | ) |
| (4,986,577 | ) |
| (4,839,749 | ) | ||||
Accumulated other comprehensive income (loss) |
| 615,581 |
| 548,707 |
|
| 770,360 |
| 614,603 |
| ||||||
Non-controlled interest |
|
| (521,358 | ) |
|
| (561,438 | ) |
|
| (529,516 | ) |
|
| (526,967 | ) |
Total Stockholders’ Deficit |
| $ | (2,145,748 | ) |
| $ | (2,415,460 | ) |
| $ | (2,214,451 | ) |
| $ | (2,220,831 | ) |
|
|
|
|
|
|
|
|
|
|
| ||||||
TOTAL LIABILITIES AND STOCKHOLDERS’ DEFICIT |
| $ | 14,459 |
|
| $ | 31,448 |
|
| $ | 15,138 |
|
| $ | 11,637 |
|
The accompanying notes are an integral part of these condensed consolidated financial statements.
| 4 |
| Table of Contents |
Condensed Consolidated Statements of Operations
|
| Three Months Ended December 31, |
| Six Months Ended December 31, |
|
| Three Months Ended September 30, |
| ||||||||||||||||
|
| 2018 |
|
| 2017 |
|
| 2018 |
|
| 2017 |
|
| 2019 |
|
| 2018 |
| ||||||
|
|
|
|
|
|
|
|
|
|
|
|
|
|
| ||||||||||
REVENUES |
|
|
|
|
|
|
|
|
|
|
|
|
|
| ||||||||||
Revenue |
| - |
| 22,802 |
| $ | 8,879 |
| $ | 43,523 |
|
| $ | - |
| $ | 8,879 |
| ||||||
Cost of revenue |
|
| (1,539 | ) |
|
| (35,046 | ) |
|
| (12,805 | ) |
|
| (46,079 | ) |
|
| - |
|
|
| (11,266 | ) |
Gross profit (loss) |
| (1,539 | ) |
| (12,244 | ) |
| (3,926 | ) |
| (2,556 | ) | ||||||||||||
Gross income(loss) |
| - |
| (2,387 | ) | |||||||||||||||||||
OPERATING EXPENSES: |
|
|
|
|
|
|
|
|
|
|
|
|
|
| ||||||||||
Selling, general & administrative expenses |
|
| (35,902 | ) |
|
| 25,325 |
|
|
| (93,255 | ) |
|
| 11,300 |
|
|
| (149,377 | ) |
|
| (57,353 | ) |
PROFIT (LOSS) FROM OPERATIONS |
|
| (37,441 | ) |
|
| 13,081 |
|
| $ | (97,181 | ) |
| $ | 8,744 |
| ||||||||
LOSS FROM OPERATIONS |
| $ | (149,377 | ) |
| $ | (59,740 | ) | ||||||||||||||||
|
|
|
|
|
|
|
|
|
|
|
|
|
|
| ||||||||||
OTHER INCOME(EXPENSES) |
|
| 26,652 |
|
|
| 16,557 |
|
|
| 300,019 |
|
|
| 58,564 |
| ||||||||
OTHER INCOME, NET |
|
| - |
|
|
| 273,367 |
| ||||||||||||||||
|
|
|
|
|
|
|
|
|
|
|
|
|
|
| ||||||||||
NET PROFIT (LOSS) BEFORE INCOME TAX |
|
| (10,789 | ) |
|
| 29,638 |
|
| $ | 202,838 |
|
| $ | 67,308 |
| ||||||||
NET INCOME( LOSS) BEFORE INCOME TAX |
| $ | (149,377 | ) |
| $ | 213,627 |
| ||||||||||||||||
|
|
|
|
|
|
|
|
|
|
|
|
|
|
| ||||||||||
Provision of Income Tax |
|
| - |
|
|
| - |
|
|
| - |
|
|
| - |
|
|
| - |
|
|
| - |
|
NET PROFIT (LOSS) |
|
| (10,789 | ) |
|
| 29,638 |
|
| $ | 202,838 |
|
| $ | 67,308 |
| ||||||||
NET INCOME(LOSS) |
| $ | (149,377 | ) |
| $ | 213,627 |
| ||||||||||||||||
|
|
|
|
|
|
|
|
|
|
|
|
|
|
| ||||||||||
Non-controlled interest |
|
| (308 | ) |
|
| (185 | ) |
|
| (40,080 | ) |
|
| (7,572 | ) |
|
| 2,549 |
|
|
| (39,772 | ) |
Net profit (loss) contributed to the group |
| (11,097 | ) |
| 29,453 |
| 162,758 |
| 59,736 |
| ||||||||||||||
Net income(loss) contributed to the group |
| (146,828 | ) |
| 173,855 |
| ||||||||||||||||||
|
|
|
|
|
|
|
|
|
|
|
|
|
|
| ||||||||||
Other comprehensive income(loss) |
|
|
|
|
|
|
|
|
|
|
|
|
|
| ||||||||||
Foreign currency translation income(loss) |
|
| (2,315 | ) |
|
| (128,578 | ) |
| $ | 66,874 |
|
| $ | (176,688 | ) |
| $ | 155,757 |
|
| $ | 69,189 |
|
|
|
|
|
|
|
|
|
|
|
|
|
|
|
| ||||||||||
Comprehensive income(loss) |
| $ | (13,412 | ) |
| $ | (99,125 | ) |
| $ | 229,632 |
|
| $ | (116,952 | ) |
| $ | 8,929 |
|
| $ | 243,044 |
|
|
|
|
|
|
|
|
|
|
|
|
|
|
|
| ||||||||||
Basic and Diluted Profit (Loss) per Common Share |
| $ | (0.0001 | ) |
| $ | 0.0003 |
|
| $ | 0.0014 |
|
| $ | 0.0007 |
| ||||||||
Basic and Diluted Earnings/(Loss) per Common Share |
| $ | (0.0013 | ) |
| $ | 0.0015 |
| ||||||||||||||||
|
|
|
|
|
|
|
|
|
|
|
|
|
|
| ||||||||||
Weighted Average Number of Common Shares Outstanding |
|
| 115,038,909 |
|
|
| 96,038,909 |
|
|
| 115,038,909 |
|
|
| 93,038,909 |
|
|
| 115,038,909 |
|
|
| 115,038,909 |
|
The accompanying notes are an integral part of these condensed consolidated financial statements.
| 5 |
| Table of Contents |
Condensed Consolidated Statements of Cash Flows
(Unaudited)
|
| December 31, 2018 |
|
| December 31, 2017 |
|
| September 30, 2019 |
|
| September 30, 2018 |
| ||||
Cash flows from operating activities: |
|
|
|
|
|
|
|
|
|
| ||||||
Net profit (loss) |
| $ | 202,838 |
| $ | 67,308 |
| |||||||||
Adjustments to reconcile loss to net cash used in operation |
|
|
|
|
| |||||||||||
Net (loss) profit |
| $ | (149,377 | ) |
| $ | 213,627 |
| ||||||||
Adjustments to reconcile loss to net cash used in operations |
|
|
|
|
| |||||||||||
Depreciation |
| 3,530 |
| 12,475 |
|
| - |
| 2,312 |
| ||||||
Waiver of consultancy service fee |
| - |
| (17,006 | ) |
| - |
| - |
| ||||||
Gain on disposal of property, plant and equipment |
| (245,581 | ) |
| - |
|
| - |
| (247,518 | ) | |||||
Changes in operating assets and liabilities |
|
|
|
|
|
|
|
|
|
| ||||||
(Increase) decrease in: |
|
|
|
|
|
|
|
|
|
| ||||||
Accounts receivable from related parties |
| 4,517 |
| (267 | ) |
| - |
| (706 | ) | ||||||
Deposits and prepayment |
| 73 |
| - |
|
| 329 |
| 73 |
| ||||||
Inventory |
| 4,542 |
| (3,773 | ) |
| - |
| 4,895 |
| ||||||
Increase (decrease) in: |
|
|
|
|
|
|
|
|
|
| ||||||
Accounts payable |
| (4,695 | ) |
| 6,489 |
|
| 49 |
| 877 |
| |||||
Accrued liabilities |
| (4,304 | ) |
| (39,394 | ) | ||||||||||
Accrued liabilities and other payables |
| 89,600 |
| 9,787 |
| |||||||||||
GST payable |
| (458 | ) |
| (4,904 | ) |
| - |
| (250 | ) | |||||
Advanced from sub-contractor & related parties |
| (21,392 | ) |
| (8,758 | ) |
| (97,165 | ) |
| (12,659 | ) | ||||
Deposit received from customer |
|
| - |
|
|
| - |
|
|
| - |
|
|
| - |
|
Net cash (used in) operating activities |
| (60,930 | ) |
| 12,170 |
| ||||||||||
Net cash used in by operating activities |
|
| (156,564 | ) |
|
| (29,562 | ) | ||||||||
|
|
|
|
|
|
|
|
|
|
| ||||||
Cash flows from financing activities: |
|
|
|
|
|
|
|
|
|
| ||||||
Repayments of bank loans |
| (1,188 | ) |
| (3,581 | ) |
| (191 | ) |
| (595 | ) | ||||
Proceeds from issuance of common stock |
|
| - |
|
|
| - |
|
|
| - |
|
|
| - |
|
Net cash provided by (used in) financing activities |
|
| (1,188 | ) |
|
| (3,581 | ) | ||||||||
Net cash (used in) provided by financing activities |
|
| (191 | ) |
|
| (595 | ) | ||||||||
|
|
|
|
|
|
|
|
|
|
| ||||||
Net increase (decrease) in cash and cash equivalent |
| (62,118 | ) |
| 8,589 |
| ||||||||||
Net (decrease)increased in cash and cash equivalent |
| (156,755 | ) |
| (30,157 | ) | ||||||||||
|
|
|
|
|
|
|
|
|
|
| ||||||
Effect of exchange rate changes on cash |
|
| 58,271 |
|
|
| (35,980 | ) |
|
| 160,586 |
|
|
| 47,549 |
|
|
|
|
|
|
|
|
|
|
|
| ||||||
Net increase (decrease) in cash and cash equivalents |
| (3,847 | ) |
| (27,391 | ) | ||||||||||
Net (decrease)increase in cash and cash equivalents |
| 3,831 |
| 17,392 |
| |||||||||||
Cash and cash equivalents at beginning of year |
|
| 10,032 |
|
|
| 38,616 |
|
|
| 10,662 |
|
|
| 10,032 |
|
Cash and cash equivalents at end of year |
| $ | 6,185 |
|
| $ | 11,225 |
|
| $ | 14,493 |
|
| $ | 27,424 |
|
|
|
|
|
|
|
|
|
|
|
| ||||||
Supplementary cash flow information |
|
|
|
|
|
|
|
|
|
| ||||||
Income taxes paid |
| $ | - |
|
| $ | - |
|
| $ | - |
|
| $ | - |
|
Interest paid |
| $ | 52 |
|
| $ | 119 |
|
| $ | 1 |
|
| $ | 30 |
|
|
| |||||||||||||||
Supplementary non-cash information |
|
|
|
|
|
|
|
|
|
| ||||||
Reorganization |
| - |
| - |
|
| - |
| - |
| ||||||
Issuance of common stock |
|
| - |
|
|
| - |
|
|
| - |
|
|
| - |
|
The accompanying notes are an integral part of these condensed financial statements.
| 6 |
| Table of Contents |
Condensed Consolidated Statements of Changes in Equity
|
|
|
|
|
|
|
|
|
|
|
|
|
| ACCUMULATED |
|
|
|
|
|
|
| |||||||
|
|
|
|
|
|
|
| ADDITIONAL |
|
|
|
|
| OTHER |
|
| NON- |
|
|
|
| |||||||
|
| COMMON STOCK |
|
| PAID-IN |
|
| ACCUMULATED |
|
| COMPREHENSIVE |
|
| CONTROLLING |
|
| TOTAL |
| ||||||||||
|
| SHARES |
|
| AMOUNT |
|
| CAPITAL |
|
| DEFICIT |
|
| INCOME/(LOSS) |
|
| INTEREST |
|
| EQUITY |
| |||||||
Balance at June 30, 2018 |
|
| 115,038,909 |
|
| $ | 115,039 |
|
| $ | 2,416,243 |
|
| $ | (4,934,011 | ) |
| $ | 548,707 |
|
| $ | (561,438 | ) |
| $ | (2,415,460 | ) |
Net income (loss) for the period |
|
| - |
|
|
| - |
|
|
| - |
|
|
| 173,855 |
|
|
| - |
|
|
| 39,772 |
|
|
| 213,627 |
|
Foreign currency translation gain (loss) |
|
| - |
|
|
| - |
|
|
| - |
|
|
| - |
|
|
| 69,189 |
|
|
| - |
|
|
| 69,189 |
|
Balance at September 30, 2018 |
|
| 115,038,909 |
|
| $ | 115,039 |
|
| $ | 2,416,243 |
|
| $ | (4,760,156 | ) |
| $ | 617,896 |
|
| $ | (521,666 | ) |
| $ | (2,132,644 | ) |
|
|
|
|
|
|
|
|
|
|
|
|
|
|
|
|
|
|
|
|
|
|
|
|
|
|
|
|
|
Balance at June 30, 2019 |
|
| 115,038,909 |
|
| $ | 115,039 |
|
| $ | 2,416,243 |
|
| $ | (4,839,749 | ) |
| $ | 614,603 |
|
| $ | (526,967 | ) |
| $ | (2,220,831 | ) |
Net income (loss) for the period |
|
| - |
|
|
| - |
|
|
| - |
|
|
| (146,828 | ) |
|
| - |
|
|
| (2,549 | ) |
|
| (149,377 | ) |
Foreign currency translation gain (loss) |
|
| - |
|
|
| - |
|
|
| - |
|
|
| - |
|
|
| 155,757 |
|
|
| - |
|
|
| 155,757 |
|
Balance at September 30, 2019 |
|
| 115,038,909 |
|
| $ | 115,039 |
|
| $ | 2,416,243 |
|
| $ | (4,986,577 | ) |
| $ | 770,360 |
|
| $ | (529,516 | ) |
| $ | (2,214,451 | ) |
The accompanying notes are an integral part of these unaudited condensed consolidated financial statements
| 7 |
| Table of Contents |
Notes to Condensed Consolidated Financial Statements
December 31, 2018September 30, 2019
(Unaudited)
NOTE 1 -– ORGANIZATION AND DESCRIPTION OF BUSINESS
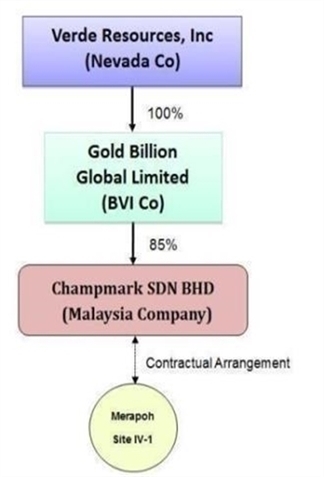
Verde Resources, Inc. (the “Company” or “VRDR”) was incorporated on April 22, 2010, in the State of Nevada, U.S.A. The accounting and reporting policies of the Company conform to accounting principles generally accepted in the United States of America, and the Company’s fiscal year end is June 30.
Gold Billion Global Limited (“Gold Billion” or “GBL”) was incorporated in British Virgin Islands on February 7, 2013. GBL was setup by the Board of Directors of Federal Mining Resources Limited (“FMR”). The major operation of GBL is to manage and monitor the mineral exploration and mining projects of FMR.
On July 1, 2013, FMR has assigned its rights and obligation on Champmark Sdn Bhd (“CSB”) to GBL. Four of the five members of CSB Board of Directors were appointed by FMR, with two of the GBL Board of Directors currently sitting on the CSB Board. According to ASC 810-05-08 A, CSB is a deemed subsidiary of GBL, where it has controlled the CSB Board of Directors, has assigned rights to receive future benefits and residual value and obligationobligations to absorb loss and finance for CSB by GBL. GBL has the power to direct the activities of CSB that most significantly impact CSB’s economic performance and the obligation to absorb losses of CSB that could potentially be significant to the CSB or the right to receive benefits from CSB that could potentially be significant to CSB. GBL is the primary beneficiary of CSB because it has been assigned with all relevant rights and obligation and can direct the activities of CSB through the common directors and the 85% shareholder, FMR. Under 810-23-42, 43, it is determined that CSB is de-facto agent of GBL and GBL is the de-facto principal of CSB. GBL started to consolidate CSB from July 1, 2013, and the Company consolidated GBL and CSB from October 25, 2013, onwards.
On February 17, 2014, the Company entered into a Supplementary Agreement to the Assignment Agreement and completed an acquisition of GBL pursuant to the Supplementary Agreement. The acquisition was a reverse acquisition in accordance with ASC 805-40 “Reverse Acquisitions”. The legal parent was VRDR which was the accounting acquiree while GBL was the accounting acquirer. There was a 15% non-controlling interest of Champmark SDN BHD (“CSB”) after the acquisition. This transaction was accounted for as a recapitalization effected by a share exchange, wherein GBL with its 85% deemed subsidiary CSB was considered the acquirer for accounting and financial reporting purposes. The assets and liabilities of the acquired entity have been brought forward at their book value and no goodwill has been recognized.
As a result of the acquisition, the Company holds 100% equity interest in GBL and 85% variable interest in CSB. Our consolidated subsidiaries include GBL being our wholly-owned subsidiary and 85% of CSB being a variable interest entity (VIE) and deemed subsidiary of GBL.
On March 17, 2014, the Company through GBL and its deemed subsidiary CSB entered into a Sub-Contract Agreement with Borneo Oil & Gas Corporation Sdn Bhd (“BOG”) for the engagement of its sub-contractor services to carry out exploration and exploitation works on alluvial and lode gold resources at Site IV-1 of the Merapoh Mine. The Sub-Contract Agreement is for a period of 5 years with a renewal for another 5 years subject to review by both parties. BOG is a wholly-owned subsidiary of Borneo Oil Berhad (BOB) which is listed on the main market of Kuala Lumpur Stock Exchange. BOG being a local company in Malaysia provides the Company with the advantage of local knowledge and well-established connection in dealing with the relevant local authorities in our mining operations.
On April 1, 2014, GBL purchased 85% equity interest of CSB, and CSB became indirect subsidiary of the Company.
Effective August 27, 2014, the Company’s Articles of Incorporation were amended to increase the authorized shares of the Company from 100,000,000 shares of common stock to 250,000,000 shares of common stock. A copy of the Certificate of Amendment was filed with the Nevada Secretary of State. The Form 8K announcing the increase of the authorized shares of the Company was filed with SEC on September 15, 2014.
Effective February 20, 2016, Mr. Wu Ming Ding resigned all of his positions as President and Director of the Company with Mr. Balakrishnan B S Muthu being appointed President to fill the vacancy created. Effective February 20, 2016, Mr. Chen Ching was appointed Director of the Company and the entire Board of Directors now consists of Mr. Balakrishnan B S Muthu and Mr. Chen Ching. The SC 14F1 and Form 8-K announcing the change in officers and directors were filed with SEC on February 10, 2016 and February 22, 2016 respectively.
Effective February 2, 2018, the Company’s Articles of Incorporation were amended to increase the authorized shares of the Company from 250,000,000 shares of common stock to 10,000,000,000 shares of common stock. A copy of the Certificate of Amendment was filed with the Nevada Secretary of State. The Form 8K announcing the increase of the authorized shares of the Company was filed with SEC on February 6, 2018.
| Table of Contents |
NOTE 2 -– SUMMARY OF SIGNIFICANT ACCOUNTING POLICIES
Condensed Consolidated Financial Statements
Certain information and footnote disclosures normally included in financial statements prepared in accordance with accounting principles generally accepted in the United States of America have been condensed or omitted. The results of operations for the periods ended December 31, 2018September 30, 2019 are not necessarily indicative of the operating results for the full years.
Basis of Presentation
The accounting and reporting policies of the Company conform to accounting principles generally accepted in the United States of America (GAAP). These condensed consolidated financial statements are expressed in United States dollars ($). Financial statements prepared in accordance with GAAP contemplate the realization of assets and the satisfaction of liabilities in the normal course of business. These condensed consolidated audited financial statements include all adjustments that, in the opinion of management, are necessary in order to make the financial statements not misleading.
Basis of Consolidation
The condensed consolidated financial statements include the financial statements of Verde Resources, Inc., its wholly owned subsidiary Gold Billion Global Limited (“GBL”) and the 85% of the deemed subsidiary variable interest of Champmark SDN BHD (“CSB”). All inter-company balances and transactions between the Company and its subsidiary and variable interest entity (VIE) have been eliminated upon consolidation.
The Company has adopted ASC Topic 810-10-5-8, “Variable Interest Entities”, which requires a variable interest entity or VIE to be consolidated by a company if that company is subject to a majority of the risk of loss for the VIE or is entitled to receive a majority of the VIE’s residual returns.
Variable Interest Entity
On July 1, 2013, the Company’s subsidiary, GBL entered into a series of agreements (“VIE agreements”) with FMR and details of the VIE agreements are as follows :
1. | Management Agreement, FMR entrusted the management rights of its subsidiary CSB to GBL that include: | |||
| i) | management and administrative rights over the day-to-day business affairs of CSB and the mining operation at Site IV-1 of the Merapoh Gold Mine; | ||
| ii) | final right for the appointment of members to the Board of Directors and the management team of CSB; | ||
| iii) | act as principal of CSB; | ||
| iv) | obligation to provide financial support to CSB; | ||
| v) | option to purchase an equity interest in CSB; | ||
| vi) | entitlement to future benefits and residual value of CSB; | ||
| vii) | right to impose no dividend policy; | ||
| viii) | human resources management. | ||
| ||||
2. | Debt Assignment, FMR assigned to GBL the sum of money in the amount of US Dollars One Hundred Nine Thousand Eight Hundred One And Cents Seventy-Two Only (US$ 109,801.72), now due to GBL from CSB under the financing obligation from the FMR to CSB. | |||
With the above agreements, GBL demonstrates its ability to control CSB as the primary beneficiary and the operating results of the VIE was included in the condensed consolidated financial statements for the year ended June 30, 2014.
On April 1, 2014, the Board of Director of GBL notified FMR upon the decision to exercise the right of option to purchase 85% equity interest of CSB under Management Agreement Section 3.2.4 dated July 1, 2013 between GBL and FMR. This acquisition was completed on April 1, 2014 with consideration of US$1. GBL then became 85% shareholder of CSB and is required to consolidate CSB as a subsidiary.
| Table of Contents |
Use of Estimates
The preparation of financial statements in conformity with accounting principles generally accepted in the United States of America requires management to make estimates and assumptions that affect the reported amounts of assets and liabilities and disclosure of contingent assets and liabilities at the date of the financial statements and the reported amount of revenues and expenses during the reporting period. Actual results could differ from those estimates. The Company’s periodic filings with the Securities and Exchange Commission include, where applicable, disclosures of estimates, assumptions, uncertainties and markets that could affect the financial statements and future operations of the Company.
Cash and Cash Equivalents
Cash and cash equivalents include cash in banks, money market funds, and certificates of term deposits with maturities of less than three months, which are readily convertible to known amounts of cash and which, in the opinion of management, are subject to an insignificant risk of loss in value. The Company had $6,185$14,493 and $10,032$10,662 in cash and cash equivalents at December 31, 2018September 30, 2019 and June 30, 2018,2019, respectively.
Concentrations of Credit Risk
The Company’s financial instruments that are exposed to concentrations of credit risk primarily consist of its cash and cash equivalents and related party payables it will likely incur in the near future. The Company places its cash and cash equivalents with financial institutions of high credit worthiness. At times, its cash and cash equivalents with a particular financial institution may exceed any applicable government insurance limits. The Company’s management plans to assess the financial strength and credit worthiness of any parties to which it extends funds, and as such, it believes that any associated credit risk exposures are limited.
Risks and Uncertainties
The Company operates in the resource exploration industry that is subject to significant risks and uncertainties, including financial, operational, technological, and other risks associated with operating a resource exploration business, including the potential risk of business failure.
Accounts Receivable
Accounts receivable are recognized and carried at net realizable value. An allowance for doubtful accounts will be recorded in the period when a loss is probable based on an assessment of specific evidence indicating troubled collection, historical experience, accounts aging, ongoing business relation and other factors. Accounts are written off after exhaustive efforts at collection. If accounts receivable are to be provided for, or written off, they would be recognized in the consolidated statement of operations within operating expenses. At and, the Company has no allowance for doubtful accounts, as per management’s judgment based on their best knowledge. As of December 31, 2018September 30, 2019 and June 30, 2018,2019, the longest credit term for certain customers are 60 days.
Provision for Doubtful Accounts
The Company maintains an allowance for doubtful accounts to reserve for potentially uncollectible receivables and reviews accounts receivable by amounts due by customers which are past due to identify specific customers with known disputes or collectability issues. In determining the amount of the reserve, the Company makes judgments about the creditworthiness of customers based on past collection experience and ongoing credit risk evaluations. At December 31, 2018September 30, 2019 and June 30, 20182019 there was no allowance for doubtful accounts.
Fair Value
ASC Topic 820 “Fair Value Measurement and Disclosures” establishes a three-tier fair value hierarchy, which prioritizes the inputs used in measuring fair value. The hierarchy prioritizes the inputs into three levels based on the extent to which inputs used in measuring fair value are observable in the market.
These tiers include:
| Level 1—defined as observable inputs such as quoted prices in active markets; | |
| Level 2—defined as inputs other than quoted prices in active markets that are either directly or indirectly observable; and | |
| Level 3—defined as unobservable inputs in which little or no market data exists, therefore requiring an entity to develop its own assumptions. |
The Company’s financial instruments consist of cash and cash equivalents, trade receivables, other receivables, payables, and short term and long termlong-term debt. The carrying values of cash and cash equivalents, trade receivables, other receivables, and payables approximate their fair value due to their short maturities. The carrying value of long termlong-term debt approximates the fair value of debt of similar terms and remaining maturities available to the company.
| 10 |
| Table of Contents |
The Company’s non-financial assets are measured on a recurring basis. These non-financial assets are measured for impairment annually on the Company’s measurement date at the reporting unit level using Level 3 inputs. For most assets, ASC 820 requires that the impact of changes resulting from its application be applied prospectively in the year in which the statement is initially applied.
The Company’s non-financial assets measured on a non-recurring basis include the Company’s property, plant and equipment and finite-use intangible assets which are measured for recoverability when indicators for impairment are present. ASC 820 requires companies to disclose assets and liabilities measured on a non-recurring basis in the period in which the re-measurement at fair value is performed.
The Company did not have any convertible bonds as of December 31, 2018September 30, 2019 and June 30, 2018.2019.
Foreign Currency Translation
The Company’s reporting currency is the United States dollar (“$”) and the accompanying consolidated financial statements have been expressed in United States dollars. The Company’s functional currency is the Malaysian Ringgit ( “MYR”) which is a functional currency as being the primary currency of the economic environment in which their operations are conducted.
In accordance with ASC Topic 830 “Translation of Financial Statements” , capital accounts of the consolidated financial statements are translated into United States dollars from MYR at their historical exchange rates when the capital transactions occurred. Assets and liabilities are translated at the exchange rates as of balance sheet date. Income and expenditures are translated at the average exchange rate of the respective year. The resulting exchange differences are recorded in the consolidated statement of operations.
|
| September 30, 2019 |
|
| June 30, 2019 |
| ||||||||||
|
| December 31, 2018 |
|
| June 30, 2018 |
|
|
|
|
|
| |||||
Period-end MYR : $1 exchange rate |
| 0.2420 |
| 0.2475 |
|
| 0.2387 |
| 0.2420 |
| ||||||
Average MYR : $1 exchange rate |
| 0.2420 |
| 0.2462 |
|
| 0.2397 |
| 0.2425 |
| ||||||
Comprehensive Income
Comprehensive income is defined to include all changes in equity except those resulting from investments by owners and distributions to owners. Among other disclosures, all items that are required to be recognized under current accounting standards as components of comprehensive income are required to be reported in a financial statement that is presented with the same prominence as other financial statements. Comprehensive income includes net income and the foreign currency translation changes.
Segment Reporting
The Company currently engages in one operation segment: Gold Mining. The expenses incurred were consisting principally of management services. The Company’s major operation is located in Malaysia.
Mineral Acquisition and Exploration Costs
The Company has been primarily engaged in the acquisition, exploration, and development of mining properties. The Company was no longer considered an exploration stage company after the reverse take-over with its subsidiary GBL.
Mineral property acquisition and exploration costs are expensed as incurred. When it has been determined that a mineral property can be economically developed as a result of establishing proven and probable reserves, the costs incurred to develop such property are capitalized. Such costs will be amortized using the units-of-production method over the estimated life of the probable reserves.
Environmental Expenditures
The operations of the Company have been, and may in the future be, affected from time to time in varying degree by changes in environmental regulations, including those for future reclamation and site restoration costs. Both the likelihood of new regulations and their overall effect upon the Company vary greatly and are not predictable. The Company’s policy is to meet or, if possible, surpass standards set by relevant legislation by application of technically proven and economically feasible measures.
| 11 |
| Table of Contents |
Environmental expenditures that relate to ongoing environmental and reclamation programs are charged against earnings as incurred or capitalized and amortized depending on their future economic benefits. All of these types of expenditures incurred since inception have been charged against earnings due to the uncertainty of their future recoverability. Estimated future reclamation and site restoration costs, when the ultimate liability is reasonably determinable, are charged against earnings over the estimated remaining life of the related business operation, net of expected recoveries.
Revenue Recognition
In accordance with the ASC Topic 605, “Revenue Recognition”, the Company recognizes revenue when persuasive evidence of an arrangement exists, transfer of title has occurred or services have been rendered, the selling price is fixed or determinable and collectibilitycollectability is reasonably assured.
The Company derives revenues primarily from the sales of gold mineral to registered gold trading companies in Malaysia. The Company generally recognizes its revenues at the time of gold sales and its selling price is determined by the prevailing market value of gold bullion quoted by the leading registered gold trading company in Malaysia. Sales invoicesinvoice will be duly presented to the trading companies when delivery is completed, and revenue is then recognized.
Cost of Revenue
The cost of revenue consists of exploration costs,cost, mine equipment depreciation, production costs,cost, mine site management costs,cost, sub-contractor costs,cost, and royalty and tribute paymentspayment which are levied on the gross revenue at the rate of 18% on the invoiced value of gold sales.
Advertising Expenses
Advertising costs are expensed as incurred under ASC Topic 720, “Advertising Costs” . Advertising expenses incurred for the periods ended December 31, 2018September 30, 2019 and June 30, 20182019 were $0.
Income Taxes
The provision for income taxes is determined in accordance with the provisions of ASC Topic 740, “Accounting for Income Taxes” (“ASC 740”). Under this method, deferred tax assets and liabilities are recognized for the future tax consequences attributable to differences between the financial statement carrying amounts of existing assets and liabilities and their respective tax basis. Deferred tax assets and liabilities are measured using enacted income tax rates expected to apply to taxable income in the years in which those temporary differences are expected to be recovered or settled. Any effect on deferred tax assets and liabilities of a change in tax rates is recognized in income in the period that includes the enactment date.
ASC 740 prescribes a comprehensive model for how companies should recognize, measure, present, and disclose in their financial statements uncertain tax positions taken or expected to be taken on a tax return. Under ASC 740, tax positions must initially be recognized in the financial statements when it is more likely than not the position will be sustained upon examination by the tax authorities. Such tax positions must initially and subsequently be measured as the largest amount of tax benefit that has a greater than 50% likelihood of being realized upon ultimate settlement with the tax authority assuming full knowledge of the position and relevant facts. As of December 31, 2018September 30, 2019 and June 30, 2018,2019, the Company did not have any significant unrecognized uncertain tax positions.
Recent Accounting Pronouncements
ASU 2018-01 is expected to reduce the cost of adopting the new leases standard for certain land easements. It is also an attempt to help ensure that companies can make a successful transition to the standard without compromising the quality of information provided to investors about these transactions. Land easements (also commonly referred to as rights of way) represent the right to use, access, or cross another entity’s land for a specified purpose. Land easements are used by utility and telecommunications companies, for example, when they need to take a small strip of land, or easement, to bury wires. Not all companies have historically accounted for them as leases. Stakeholders pointed out that the requirement to evaluate all old and existing land easements, sometimes numbering in the tens of thousands, to determine if they meet the definition of a lease under the new standard could be very costly. They also noted there would be limited benefit to applying this requirement, as many of their land easements would not meet the definition of a lease, or even if they met that definition, many of their easements are prepaid and, therefore, already are recognized on the balance sheet.
The amendments to paragraphs 820-10-35-18D through 35-18F and 820-10-35- 18H through 35-18L revise the current guidance to allow portfolios of financial instruments and nonfinancial instruments accounted for as derivatives in accordance with Topic 815 to use the portfolio exception to valuation. The amendments improve guidance by adding wording that explicitly states that a group of financial assets, financial liabilities, nonfinancial items accounted for as derivatives in accordance with Topic 815, or a combination of these items that otherwise meet the criteria to do so are permitted to apply the portfolio exception for measuring fair value of the group. This allows entities to measure fair value on a net basis for those portfolios in which financial assets and financial liabilities and nonfinancial instruments are managed and valued together.
| ||||||||||||||||||||||||||||||||||||||||||||||||||||||||||||||||||||||||||||||||||||||||||||||||||||||||||||||||||||||||||||||||||||||||||||||||||||||||||||||||||||||||||||||||||||||||||||||||||||||||||||||||||||||||||||||||||||||||||||||||||||||||||||||||||||||||||||||||||||||||||||||
| Transition and Effective Date. The transition and effective date guidance is based on the facts and circumstances of each amendment. Some of the amendments in ASU No. 2018-09 do not require transition guidance and will be effective upon issuance of ASU No. 2018-09. However, many of the amendments do have transition guidance with effective dates for annual periods beginning after December 15, 2018, for public business entities. | |||||||||||||||||||||||||||||||||||||||||||||||||||||||||||||||||||||||||||||||||||||||||||||||||||||||||||||||||||||||||||||||||||||||||||||||||||||||||||||||||||||||||||||||||||||||||||||||||||||||||||||||||||||||||||||||||||||||||||||||||||||||||||||||||||||||||||||||||||||||||||||
In addition, there are some conforming amendments in ASU No. 2018-09 that have been made to recently issued guidance that is not yet effective that may require application of the transition and effective date guidance in the original ASU. For example, there are conforming amendments to Topic 820 and Subtopic 944-310, Financial Services—Insurance—Receivables, that are related to the amendments in Accounting Standards Update No. 2016-01, Financial Instruments—Overall (Subtopic 825-10): Recognition and Measurement of Financial Assets and Financial Liabilities, which require application of the transition and effective date guidance in that ASU. | ||||||||||||||||||||||||||||||||||||||||||||||||||||||||||||||||||||||||||||||||||||||||||||||||||||||||||||||||||||||||||||||||||||||||||||||||||||||||||||||||||||||||||||||||||||||||||||||||||||||||||||||||||||||||||||||||||||||||||||||||||||||||||||||||||||||||||||||||||||||||||||||
The FASB has issued Accounting Standards Update (ASU) No. 2018-10, Codification Improvements to Topic 842, Leases. | ||||||||||||||||||||||||||||||||||||||||||||||||||||||||||||||||||||||||||||||||||||||||||||||||||||||||||||||||||||||||||||||||||||||||||||||||||||||||||||||||||||||||||||||||||||||||||||||||||||||||||||||||||||||||||||||||||||||||||||||||||||||||||||||||||||||||||||||||||||||||||||||
| 16 |
| Table of Contents |
ASU No. 2018-10, among other things, amends Topic 842 as follows:
ASU No. 2018-10, among other things, amends Topic 842 as follows: | ||
| ||
· | Issue 1: Residual Value Guarantees - Paragraph 460-10-60-32 in Topic 460, Guarantees - This paragraph incorrectly refers readers to the guidance in Topic 842 about sale-leaseback-sublease transactions, when, in fact, it should refer readers to the guidance about guarantees by a seller-lessee of the underlying asset’s residual value in a sale and leaseback transaction. The amendment corrects the cross-reference in paragraph 460-10-60-32. | |
· | Issue 2: Rate Implicit in the Lease - The amendment clarifies that a rate implicit in the lease of zero should be used when applying the definition of the term “rate implicit” in the lease results in a rate that is less than zero. | |
· | Issue 3: Lessee Reassessment of Lease Classification - The amendment consolidates the requirements about lease classification reassessments into one paragraph and better articulates that an entity should perform the lease classification reassessment on the basis of the facts and circumstances, and the modified terms and conditions, if applicable, as of the date the reassessment is required. | |
· | Issue 4: Lessor Reassessment of Lease Term and Purchase Option - The amendment clarifies that a lessor should account for the exercise by a lessee of an option to extend or terminate the lease or to purchase the underlying asset as a lease modification unless the exercise of that option by the lessee is consistent with the assumptions that the lessor made in accounting for the lease at the commencement date of the lease (or the most recent effective date of a modification that is not accounted for as a separate contract). | |
· | Issue 5: Variable Lease Payments That Depend on an Index or a Rate - The amendment clarifies that a change in a reference index or rate upon which some or all of the variable lease payments in the contract are based does not constitute the resolution of a contingency subject to the guidance in paragraph 842-10-35-4(b). Variable lease payments that depend on an index or a rate should be remeasured, using the index or rate at the remeasurement date, only when the lease payments are remeasured for another reason (that is, when one or more of the events described in paragraph 842-10-35- 4(a) or (c) occur or when a contingency unrelated to a change in a reference index or rate under paragraph 842-10-35-4(b) is resolved). | |
| ||
· | Issue 6: Investment Tax Credits - There is an inconsistency in terminology used about the effect that investment tax credits have on the fair value of the underlying asset between the definition of the term rate implicit in the lease and the lease classification guidance in paragraph 842-10-55-8. The amendment removes that inconsistency by clarifying that the period covered by a lessor-only option to terminate the lease is included in the lease term. | |
· | Issue 7: Lease Term and Purchase Option - The description in paragraph 842-10-55- 24 about lessor-only termination options is inconsistent with the description in paragraph 842-10-55- 23 about the noncancellable period of a lease. The amendment removes that inconsistency by clarifying that the period covered by a lessor-only option to terminate the lease is included in the lease term. | |
· | Issue 8: Transition Guidance for Amounts Previously Recognized in Business Combinations - The transition guidance for lessors in paragraph 842-10-65-1(h)(3) is unclear because it relates to leases classified as direct financing leases or sales-type leases under Topic 840, while the lead-in sentence to paragraph 842-10-65-1(h) provides transition guidance for leases classified as operating leases under Topic 840. The amendment clarifies that paragraph 842-10-65-1(h)(3) applies to lessors for leases classified as direct financing leases or sales-type leases under Topic 842, not Topic 840. In other words, paragraph 842- 10-65-1(h)(3) applies when an entity does not elect the package of practical expedients in paragraph 842-10-65-1(f), and, for a lessor, an operating lease acquired as part of a previous business combination is classified as a direct financing lease or a sales-type lease when applying the lease classification guidance in Topic 842. The amendment also cross-references to other transition guidance applicable to those changes in lease classification for lessors. | |
| ||
· | Issue 9: Certain Transition Adjustments - The amendments clarify whether to recognize a transition adjustment to earnings rather than through equity when an entity initially applies Topic 842 retrospectively to each prior reporting period. | |
|
| |
· | Issue 10: Transition Guidance for Leases Previously Classified as Capital Leases under Topic 840 - Paragraph 842-10-65-1(r) provides guidance to lessees for leases previously classified as capital leases under Topic 840 and classified as finance leases under Topic 842. Paragraph 842-10-65-1(r)(4) provides subsequent measurement guidance before the effective date when an entity initially applies Topic 842 retrospectively to each prior reporting period, but it refers readers to the subsequent measurement guidance in Topic 840 about operating leases. It should refer them to the subsequent measurement guidance applicable to capital leases. The amendment corrects that reference. | |
|
| |
· | Issue 11: Transition Guidance for Modifications to Leases Previously Classified as Direct Financing or Sales-Type Leases under Topic 840 - Paragraph 842-10-65-1(x) provides transition guidance applicable to lessors for leases previously classified as direct financing leases or sales-type leases under Topic 840 and classified as direct financing leases or sales-type leases under Topic 842. For modifications to those leases beginning after the effective date, paragraph 842-10-65-1(x)(4) refers readers to other applicable guidance in Topic 842 to account for the modification, specifically paragraphs 842-10-25-16 through 25- 17, depending on how the lease is classified after the modification. Stakeholders noted that it should refer to how the lease is classified before the modification to be consistent with the guidance provided in paragraphs 842-10-25-16 through 25-17. The amendment corrects that inconsistency. | |
| 17 |
| Table of Contents |
· | Issue 12: Transition Guidance for Sale and Leaseback Transactions - The amendments clarify that the transition guidance on sale and leaseback transactions in paragraph 842-10-65-1(aa) through (ee) applies to all sale and leaseback transactions that occur before the effective date and corrects the referencing issues noted. | |
· | Issue 13: Impairment of Net Investment in the Lease - Paragraph 842-30-35-3 provides guidance to lessors for determining the loss allowance of the net investment in the lease and describes the cash flows that should be considered when the lessor determines that loss allowance. Stakeholders questioned whether the guidance, as written, would accelerate and improperly measure the loss allowance because the cash flows associated with the unguaranteed residual asset appear to be excluded from the evaluation. The amendment clarifies the application of the guidance for determining the loss allowance of the net investment in the lease, including the cash flows to consider in that assessment. | |
· | Issue 14: Unguaranteed Residual Asset - The amendment clarifies that a lessor should not continue to accrete the unguaranteed residual asset to its estimated value over the remaining lease term to the extent that the lessor sells substantially all of the lease receivable associated with a direct financing lease or a sales-type lease, consistent with Topic 840. | |
· | Issue 15: Effect of Initial Direct Costs on Rate Implicit in the Lease - The ordering of the illustration in Case C of Example 1 in paragraphs 842-30-55- 31 through 55-39 raised questions about how initial direct costs factor into determining the rate implicit in the lease for lease classification purposes for lessors only. The amendment more clearly aligns the illustration to the guidance in paragraph 842-10-25-4. | |
· | Issue 16: Failed Sale and Leaseback Transaction - The amendment clarifies that a seller lessee in a failed sale and leaseback transaction should adjust the interest rate on its financial liability as necessary to ensure that the interest on the financial liability does not exceed the total payments (rather than the principal payments) on the financial liability. This clarification is also reflected in the relevant illustration on failed sale and leaseback transactions that is contained in Subtopic 842-40. | |
Effective Date | ||
The amendments in ASU No. 2018-10 affect the amendments in ASU No. 2016-02, which are not yet effective, but for which early adoption upon issuance is permitted. For entities that early adopted Topic 842, the amendments are effective upon issuance of ASU No. 2018-10, and the transition requirements are the same as those in Topic 842. For entities that have not adopted Topic 842, the effective date and transition requirements will be the same as the effective date and transition requirements in Topic 842. | ||
FASB Issues Targeted Improvements to Lease Standard . The FASB has issued Accounting Standards Update (ASU) No. 2018-11, Leases (Topic 842): Targeted Improvements. This ASU is intended to reduce costs and ease implementation of the leases standard for financial statement preparers. | ||
“The targeted improvements in the ASU address areas our stakeholders identified as sources of unnecessary cost or complexity in the leases standard,” stated FASB Chairman Russell G. Golden. “They represent the FASB’s commitment to proactively address implementation issues raised by our stakeholders to ensure a successful transition to the new standard without compromising the quality of information provided to investors.” | ||
ASU 2018-11 provides a new transition method and a practical expedient for separating components of a contract. | ||
Transition: Comparative Reporting at Adoption | ||
The amendments ASU 2018-11 provide entities with an additional (and optional) transition method to adopt the new leases standard. Under this new transition method, an entity initially applies the new leases standard at the adoption date and recognizes a cumulative-effect adjustment to the opening balance of retained earnings in the period of adoption consistent with preparers’ requests. Consequently, an entity’s reporting for the comparative periods presented in the financial statements in which it adopts the new leases standard will continue to be in accordance with current GAAP in Topic 840, Leases. | ||
An entity that elects this additional (and optional) transition method must provide the required Topic 840 disclosures for all periods that continue to be in accordance with Topic 840. The amendments do not change the existing disclosure requirements in Topic 840 (for example, they do not create interim disclosure requirements that entities previously were not required to provide). | ||
Separating Components of a Contract | ||
Effective Date
The amendments in ASU No. 2018-10 affect the amendments in ASU No. 2016-02, which are not yet effective, but for which early adoption upon issuance is permitted. For entities that early adopted Topic 842, the amendments are effective upon issuance of ASU No. 2018-10, and the transition requirements are the same as those in Topic 842. For entities that have not adopted Topic 842, the effective date and transition requirements will be the same as the effective date and transition requirements in Topic 842.
FASB Issues Targeted Improvements to Lease Standard . The FASB has issued Accounting Standards Update (ASU) No. 2018-11, Leases (Topic 842): Targeted Improvements. This ASU is intended to reduce costs and ease implementation of the leases standard for financial statement preparers.
“The targeted improvements in the ASU address areas our stakeholders identified as sources of unnecessary cost or complexity in the leases standard,” stated FASB Chairman Russell G. Golden. “They represent the FASB’s commitment to proactively address implementation issues raised by our stakeholders to ensure a successful transition to the new standard without compromising the quality of information provided to investors.”
ASU 2018-11 provides a new transition method and a practical expedient for separating components of a contract.
| 18 |
| Table of Contents |
Transition: Comparative Reporting at Adoption
The amendments ASU 2018-11 provide entities with an additional (and optional) transition method to adopt the new leases standard. Under this new transition method, an entity initially applies the new leases standard at the adoption date and recognizes a cumulative-effect adjustment to the opening balance of retained earnings in the period of adoption consistent with preparers’ requests. Consequently, an entity’s reporting for the comparative periods presented in the financial statements in which it adopts the new leases standard will continue to be in accordance with current GAAP in Topic 840, Leases.
An entity that elects this additional (and optional) transition method must provide the required Topic 840 disclosures for all periods that continue to be in accordance with Topic 840. The amendments do not change the existing disclosure requirements in Topic 840 (for example, they do not create interim disclosure requirements that entities previously were not required to provide).
Separating Components of a Contract
The amendments in ASU 2018-11 provide lessors with a practical expedient, by class of underlying asset, to not separate nonlease components from the associated lease component and, instead, to account for those components as a single component if the nonlease components otherwise would be accounted for under the new revenue guidance (Topic 606) and both of the following are met: | ||||||||||||||||||||||||||||||||||||||||||||||||||||||||||||||||||||||||||||||||||||||||||||||||||||||||||||||||||||||||||||||||||||||||||||||||||||||||||||||||||||||||||||||||||||||||||||||||||||||||||||||||||||||||||||||||||||||||||||||||||||||||||||||||||
| ||||||||||||||||||||||||||||||||||||||||||||||||||||||||||||||||||||||||||||||||||||||||||||||||||||||||||||||||||||||||||||||||||||||||||||||||||||||||||||||||||||||||||||||||||||||||||||||||||||||||||||||||||||||||||||||||||||||||||||||||||||||||||||||||||
| · | The amendments also clarify the disclosure requirements in paragraph 715-20-50-3, which state that the following information for defined benefit pension plans should be disclosed: |
| · |
|
| · | The accumulated benefit obligation (ABO) and fair value of plan assets for plans with ABOs in excess of plan assets. |
Effective Date
ASU No. 2018-14 is effective for fiscal years ending after December 15, 2020, for public business entities and for fiscal years ending after December 15, 2021, for all other entities. Early adoption is permitted for all entities.
The FASB has issued Accounting Standards Update (ASU) No. 2018-17, Consolidation (Topic 810): Targeted Improvements to Related Party Guidance for Variable Interest Entities, that reduces the cost and complexity of financial reporting associated with consolidation of variable interest entities (VIEs). A VIE is an organization in which consolidation is not based on a majority of voting rights.
The new guidance supersedes the private company alternative for common control leasing arrangements issued in 2014 and expands it to all qualifying common control arrangements.
Under the new standard, a private company could make an accounting policy election to not apply VIE guidance to legal entities under common control (including common control leasing arrangements) when certain criteria are met. This accounting policy election must be applied by a private company to all current and future legal entities under common control that meet the criteria for applying the alternative. A private company will be required to continue to apply other consolidation guidance, specifically the voting interest entity guidance.
Additionally, a private company electing the alternative is required to provide detailed disclosures about its involvement with, and exposure to, the legal entity under common control.
The ASU also amends the guidance for determining whether a decision-making fee is a variable interest. The amendments require organizations to consider indirect interests held through related parties under common control on a proportional basis rather than as the equivalent of a direct interest in its entirety (as currently required in GAAP). Therefore, these amendments likely will result in more decision makers not consolidating VIEs. |
For organizations other than private companies, the amendments in this ASU are effective for fiscal years beginning after December 15, 2019, and interim periods within those fiscal years. The amendments in this ASU are effective for a private company for fiscal years beginning after December 15, 2020, and interim periods within fiscal years beginning after December 15, 2021. Early adoption is permitted. |
The FASB has issued Accounting Standards Update (ASU) No. 2018-18, Collaborative Arrangements (Topic 808): Clarifying the Interaction Between Topic 808 and Topic 606, that clarifies the interaction between the guidance for certain collaborative arrangements and the Revenue Recognition financial accounting and reporting standard. |
A collaborative arrangement is a contractual arrangement under which two or more parties actively participate in a joint operating activity and are exposed to significant risks and rewards that depend on the activity’s commercial success. The ASU provides guidance on how to assess whether certain transactions between collaborative arrangement participants should be accounted for within the revenue recognition standard. |
The ASU also provides more comparability in the presentation of revenue for certain transactions between collaborative arrangement participants. It accomplishes this by allowing organizations to only present units of account in collaborative arrangements that are within the scope of the revenue recognition standard together with revenue accounted for under the revenue recognition standard. The parts of the collaborative arrangement that are not in the scope of the revenue recognition standard should be presented separately from revenue accounted for under the revenue recognition standard. |
For public companies, the amendments in ASU No. 2018-18 are effective for fiscal years beginning after December 15, 2019, and interim periods within those fiscal years. For all other organizations, the amendments are effective for fiscal years beginning after December 15, 2020, and interim periods within fiscal years beginning after December 15, 2021. Early adoption is permitted. |
Other accounting standards that have been issued or proposed by the FASB or other standards-setting bodies that do not require adoption until a future date are not expected to have a material impact on our consolidated financial statements upon adoption. |
| 21 |
| Table of Contents |
The ASU also amends the guidance for determining whether a decision-making fee is a variable interest. The amendments require organizations to consider indirect interests held through related parties under common control on a proportional basis rather than as the equivalent of a direct interest in its entirety (as currently required in GAAP). Therefore, these amendments likely will result in more decision makers not consolidating VIEs.
For organizations other than private companies, the amendments in this ASU are effective for fiscal years beginning after December 15, 2019, and interim periods within those fiscal years. The amendments in this ASU are effective for a private company for fiscal years beginning after December 15, 2020, and interim periods within fiscal years beginning after December 15, 2021. Early adoption is permitted.
The FASB has issued Accounting Standards Update (ASU) No. 2018-18, Collaborative Arrangements (Topic 808): Clarifying the Interaction Between Topic 808 and Topic 606, that clarifies the interaction between the guidance for certain collaborative arrangements and the Revenue Recognition financial accounting and reporting standard.
A collaborative arrangement is a contractual arrangement under which two or more parties actively participate in a joint operating activity and are exposed to significant risks and rewards that depend on the activity’s commercial success. The ASU provides guidance on how to assess whether certain transactions between collaborative arrangement participants should be accounted for within the revenue recognition standard.
The ASU also provides more comparability in the presentation of revenue for certain transactions between collaborative arrangement participants. It accomplishes this by allowing organizations to only present units of account in collaborative arrangements that are within the scope of the revenue recognition standard together with revenue accounted for under the revenue recognition standard. The parts of the collaborative arrangement that are not in the scope of the revenue recognition standard should be presented separately from revenue accounted for under the revenue recognition standard.
For public companies, the amendments in ASU No. 2018-18 are effective for fiscal years beginning after December 15, 2019, and interim periods within those fiscal years. For all other organizations, the amendments are effective for fiscal years beginning after December 15, 2020, and interim periods within fiscal years beginning after December 15, 2021. Early adoption is permitted.
Other accounting standards that have been issued or proposed by the FASB or other standards-setting bodies that do not require adoption until a future date are not expected to have a material impact on our consolidated financial statements upon adoption.
NOTE 3 -– CASH AND CASH EQUIVALENT
The Company considers all highly liquid investments purchased with original maturities of three months or less to be cash equivalents. At December 31, 2018September 30, 2019 and June 30, 20182019 cash and cash equivalents consisted of bank deposits in Malaysia bank and petty cash on hands.
NOTE 4 - AMOUNT DUE FROM RELATED PARTIES
Amount due from related parties at December 31, 2018 and June 30, 2018 consist of the following items:
|
| December 31, 2018 |
|
| June 30, 2018 |
| ||
Amount due from Stable Treasure Sdn. Bhd. (*) |
| $ | - |
|
| $ | 4,621 |
|
(*) One of the directors of Stable Treasure Sdn. Bhd., Mr. Balakrishnan B S Muthu is also the director of the Company. The advances related to ordinary business transactions and bear no interest or collateral, repayable and renewable under normal business advancement terms.
NOTE 5 - INVENTORIES
Inventories are valued at cost, not in excess of market. Inventories are determined at first in first out basis and comprised of production cost, mine site management cost and sub-contractor cost. Inventories, at December 31, 2018 and June 30, 2018 are summarized as follows:
|
| December 31, 2018 |
|
| June 30, 2018 |
| ||
Inventories |
| $ | 4,293 |
|
| $ | 9,038 |
|
The inventories represent the gold minerals as at December 31, 2018 and June 30, 2018, which were comprised of 8% share by the Company and 92% share by the sub-contractor and the other parties such as original mine assigner.
NOTE 6 -4 – ACCOUNTS PAYABLE AND ADVANCED FROM RELATED PARTIESPARITES
Accounts Payable
Accounts payable at December 31, 2018September 30, 2019 and June 30, 20182019 consist of the following items:
|
| September 30, 2019 |
|
| June 30, 2019 |
| ||||||||||
|
| December 31, 2018 |
|
| June 30, 2018 |
|
|
|
|
|
| |||||
Due to Changxin Wanlin Technology Co Ltd(*) |
| $ | 1,559,748 |
| $ | 1,595,488 |
|
| $ | 1,538,965 |
| $ | 1,560,032 |
| ||
Other accounts payable |
|
| 1,568 |
|
|
| 6,406 |
|
|
| 3,078 |
|
|
| 3,070 |
|
|
| $ | 1,561,316 |
|
| $ | 1,601,894 |
|
| $ | 1,542,043 |
|
| $ | 1,563,102 |
|
_____________
(*) Due to Changxin Wanlin Technology Co Ltd are accounts payable derived from ordinary business transactions. One of the directors of Changxin Wanlin Technology Co. Ltd., Mr. Wu Ming Ding, has resigned as director of VRDR (as of February 20, 2016), GBL (as of February 11, 2016) and CSB (as of February 17, 2016). This accounts payable bears no interest or collateral, repayable and renewable under normal business accounts payable terms.
| 22 |
| Table of Contents |
Advanced from related parties
Advanced from related parties at December 31, 2018September 30, 2019 and June 30, 20182019, consist of the following items:
|
| September 30, 2019 |
|
| June 30, 2019 |
| ||||||||||
|
| December 31, 2018 |
|
| June 30, 2018 |
|
|
|
|
|
| |||||
Advanced from BOG (#1) |
| $ | 240,594 |
| $ | 488,631 |
|
| $ | 191,052 |
| $ | 266,218 |
| ||
Advanced from Federal Mining Resources Limited(#2) |
| $ | 173,465 |
| $ | 173,465 |
|
| $ | 173,465 |
| $ | 173,465 |
| ||
Advanced from Federal Capital Investment Limited (#3) |
| $ | 122,000 |
| $ | 114,000 |
|
| $ | 130,000 |
| $ | 126,000 |
| ||
Advanced from Yorkshire Capital Limited (#4) |
| $ | 27,000 |
|
| $ | 27,000 |
|
| $ | 27,000 |
|
| $ | 27,000 |
|
|
| $ | 563,059 |
|
| $ | 803,096 |
|
| $ | 521,517 |
|
| $ | 592,683 |
|
(#1) BOG is one of the shareholders of the Company. The advances are related to ordinary business transactions and bear no interest or collateral, repayable and renewable under normal business advancement terms.
(#2) One of the directors of Federal Mining Resources Limited, Mr. Chen Ching, has been appointed as director of the Company effective February 20, 2016. Another director of Federal Mining Resources Limited, Mr. Wu Ming Ding, has resigned as director of the Company effective February 20, 2016. The advances are related to ordinary business transactions and bear no interest or collateral, repayable and renewable under normal business advancement terms.
(#3) One of the directors of Federal Capital Investment Limited, Mr. Wu Ming Ding, has resigned as director of the Company effective February 20, 2016. The advances are related to ordinary business transactions and bear no interest or collateral, repayable and renewable under normal business advancement terms.
(#4) One of the directors of Yorkshire Capital Limited, Mr. Lai Kui Shing, Andy, has resigned as director of CSB effective February 17, 2016. The advances are related to ordinary business transactions and bear no interest or collateral, repayable and renewable under normal business advancement terms.
| Table of Contents |
NOTE 7 -5 – PROPERTY, PLANT AND EQUIPMENT
Property and equipment at December 31, 2018September 30, 2019 and June 30, 20182019 are summarized as follows:
|
| September 30, 2019 |
|
| June 30, 2019 |
| ||||||||||
|
| December 31, 2018 |
|
| June 30, 2018 |
|
|
|
|
|
| |||||
Land and Building |
| $ | 951,555 |
| $ | 973,359 |
|
| $ | 938,875 |
| $ | 951,728 |
| ||
Plant and Machinery |
| 16,473 |
| 153,308 |
|
| 16,254 |
| 16,476 |
| ||||||
Office equipment |
| 19,053 |
| 19,490 |
|
| 18,799 |
| 19,057 |
| ||||||
Project equipment |
| 656,315 |
| 1,103,794 |
|
| 647,570 |
| 656,434 |
| ||||||
Computer |
| 10,364 |
| 10,601 |
|
| 10,226 |
| 10,365 |
| ||||||
Motor Vehicle |
| 35,870 |
| 114,109 |
|
| 35,392 |
| 35,877 |
| ||||||
Accumulated depreciation |
|
| (1,687,156 | ) |
|
| (2,368,519 | ) |
|
| (1,667,115 | ) |
|
| (1,689,936 | ) |
|
| $ | 2,474 |
|
| $ | 6,142 |
|
| $ | 1 |
|
| $ | 1 |
|
The depreciation expenses charged for the period ended December 31,September 30, 2019 and 2018 was $0 and 2017 was $3,530 and $12,475.$2,312.
NOTE 8 -6 – LOANS FROM BANKS (HIRE PURCHASE INSTALLMENT LOANS)
The loans from banks include long term and short term and are summarized as follow:
|
| September 30, 2019 |
|
| June 30, 2019 |
| ||||||||||
|
| December 31, 2018 |
|
| June 30, 2018 |
|
|
|
|
|
| |||||
Loans from banks |
| $ | 1,411 |
| $ | 2,461 |
|
| $ | - |
| $ | 193 |
| ||
Loans from banks(non-current) |
|
| - |
|
|
| 198 |
|
|
| - |
|
|
| - |
|
Total |
| $ | 1,411 |
|
| $ | 2,659 |
|
| $ | - |
|
| $ | 193 |
|
Hire purchase installment loans with total amount $1,434$0 and $2,735$2,050 as at December 31, 2018September 30, 2019 and June 30, 2018 were $1,4112019 are $0 and $2,659$2,005 net of imprest charges equivalent to interest $23$0 and $76$45 are summarized as follows:
|
| Interest |
| Monthly |
| December 31, |
| June 30, |
|
| Interest Rate |
| Monthly Due |
|
| September 30, 2019 |
|
| June 30, 2019 |
| ||||||||
|
| Rate |
| Due |
|
| 2018 |
|
| 2018 |
|
|
|
|
|
|
|
|
|
| ||||||||
Financial institution in Malaysia |
| N/A* |
| - |
| - |
| - |
|
| N/A* |
| - |
| - |
| - |
| ||||||||||
Financial institution in Malaysia |
| N/A* |
| - |
| - |
| - |
|
| N/A* |
| - |
| - |
| - |
| ||||||||||
Financial institution in Malaysia |
| N/A* |
| 207 |
| 1,434 |
| 2,735 |
|
| N/A* |
| - |
| - |
| 2,050 |
| ||||||||||
Hire purchase loans payable to banks |
|
|
|
|
| $ | 1,434 |
| $ | 2,735 |
|
|
|
|
|
| $ | - |
| $ | 2,050 |
| ||||||
_____________
(*) Hire purchase installment loans with Motor Vehicles as collateral. The financial institutions in Malaysia are Islamic banks and bear no interest in the installment agreement. However, there are certain imprest charges equivalent to interests which are being calculated at an average annual rate of approximate 1.63%0% for the entire loans life and periods.
The scheduled maturities of the CSL’s hire purchase installment loans are as follows:
December 31, |
|
|
| |
2019 |
|
| 1,434 |
|
2020 |
|
| - |
|
2021 |
|
| - |
|
2022 |
|
| - |
|
Later years |
|
| - |
|
Total minimum hire purchase installment payment |
| $ | 1,434 |
|
Less: Amount representing imprest charges equivalent to interest (current portion: $23 and non-current portion: -) |
|
| (23 | ) |
Present value of net minimum lease payments (#) |
| $ | 1,411 |
|
September 30, |
| |||
2020 | - | |||
2021 | - | |||
2022 | - | |||
2023 | - | |||
Later years | - | |||
Total minimum hire purchase installment payment | $ | - | ||
Less: Amount representing imprest charges equivalent to interest (current portion: - and non-current portion: -) | - | |||
Present value of net minimum lease payments (#) | $ | - | ||
_____________
(#) Minimum payment reflected in the balance sheet as current and noncurrent obligations under hire purchases installment loans as at December 31, 2018September 30, 2019.
| 24 |
| Table of Contents |
NOTE 9 -7 – INCOME TAX
The Company and its subsidiaries are subject to income taxes on an entity basis on income arising in, or derived from, the tax jurisdiction in which they operate. The Company is a Nevada incorporated company and subject to United State Federal Income Tax. The Tax Cuts and Jobs Act of (“TCJ Act”) was signed into law in December 2017, and among its many provisions, it imposed a mandatory one-time transition tax on undistributed international earnings and reduced the U.S. corporate income tax rate to 21%, effective January 1, 2018. No provision for income taxes in the United States has been made as the Company had no taxable income for the periods ended September 30, 20182019 and 2017.2018. GBL is a British Virgin Islands incorporated company and not required to pay income tax on corporate income. CSB is a Malaysia incorporated company and required to pay corporate income tax at 25% of taxable income.
A reconciliation between the income tax computed at the relevant statutory rate and the Company’s provision for income tax is as follows:
|
| Period ended |
|
| Period ended |
| ||||||||||
|
| December 31, |
| June 30, |
|
| September 30, 2019 |
|
| June 30, 2019 |
| |||||
|
| 2018 |
|
| 2018 |
|
|
|
|
|
| |||||
US Federal Income Tax Rate. |
| 21 | % |
| 21 | % |
| 21 | % |
| 21 | % | ||||
Valuation allowance – US Rate |
| (21 | )% |
| (21 | )% |
| (21 | )% |
| (21 | )% | ||||
BVI Income Tax Rate |
| 0 | % |
| 0 | % |
| 0 | % |
| 0 | % | ||||
Valuation allowance – BVI Rate |
| (0 | )% |
| (0 | )% |
| (0 | )% |
| (0 | )% | ||||
Malaysia Income Tax Rate |
| 25 | % |
| 25 | % |
| 25 | % |
| 25 | % | ||||
Valuation allowance – Malaysia Rate |
|
| (25 | )% |
|
| (25 | )% |
|
| (25 | )% |
|
| (25 | )% |
Provision for income tax |
|
| - |
|
|
| - |
|
|
| - |
|
|
| - |
|
Summary of the Company’s net deferred tax liabilities and assets are as follows:
December 31, 2018 June 30, 2018 Deferred tax assets: Tax attribute carryforwards Valuation allowances Total $ 65,688 $ 108,284 (65,688 ) (108,284 ) $ - $ -
September 30, 2019 | June 30, 2019 | |||||||
Deferred tax assets: | ||||||||
Tax attribute carryforwards | $ | - | $ | - | ||||
Valuation allowances | - | - | ||||||
Total | $ | - | $ | - | ||||
The Company has recorded valuation allowances for certain tax attribute carry forwards and other deferred tax assets due to uncertainty that exists regarding future realizability. If in the future the Company believes that it is more likely than not that these deferred tax benefits will be realized, the majority of the valuation allowances will be recognized in the consolidated statement of operations. The Company did not have any interest and penalty provided or recognized in the income statements for period December 31, 2018September 30, 2019 and June 30, 20182019 or balance sheet as of December 31, 2018September 30, 2019 and June 30, 2018.2019. The Company did not have uncertainty tax positions or events leading to uncertainty tax position within the next 12 months.
| Table of Contents |
NOTE 10 -8 – COMMITMENTS AND CONTINGENCIES
As at December 31, 2018September 30, 2019, the Company’s hire purchase installment agreements are disclosed in Note 8. See Note 8 for the commitments for minimum installment payments under these agreements.
NOTE 11 -9 – EARNINGS/(LOSS) PER SHARE
The Company has adopted ASC Topic No. 260, “Earnings Per Share,” (“EPS”) which requires presentation of basic and diluted EPS on the face of the income statement for all entities with complex capital structures, and requires a reconciliation of the numerator and denominator of the basic EPS computation to the numerator and denominator of the diluted EPS computation. In the accompanying financial statements, basic earnings (loss) per share is computed by dividing net income (loss) by the weighted average number of shares of common stock outstanding during the period.
The following table sets forth the computation of basic and diluted earnings per share:
|
| Three Months Ended December 31, |
| |||||
|
| 2018 |
|
| 2017 |
| ||
Net income(loss) applicable to common shares |
| $ | (10,789 | ) |
| $ | 29,638 |
|
|
|
|
|
|
|
|
|
|
Weighted average common shares |
|
|
|
|
|
|
|
|
outstanding (Basic) |
|
| 115,038,909 |
|
|
| 96,038,909 |
|
Options |
|
| - |
|
|
| - |
|
Warrants |
|
| - |
|
|
| - |
|
Weighted average common shares outstanding (Diluted) |
|
| 115,038,909 |
|
|
| 96,038,909 |
|
|
|
|
|
|
|
|
|
|
Net income(loss) per share (Basic and Diluted) |
| $ | (0.0001 | ) |
| $ | 0.0003 |
|
|
| Three Months Ended September 30, |
| |||||||||||||
|
| Six Months Ended December 31, |
|
| 2019 |
|
| 2018 |
| |||||||
|
| 2018 |
|
| 2017 |
|
|
|
|
|
| |||||
Net income(loss) applicable to common shares |
| $ | 202,838 |
|
| $ | 67,308 |
|
| $ | (146,828 | ) |
| $ | 173,855 |
|
|
|
|
|
|
|
|
|
|
|
| ||||||
Weighted average common shares |
|
|
|
|
| |||||||||||
outstanding (Basic) |
| 115,038,909 |
| 96,038,909 |
| |||||||||||
Weighted average common shares outstanding (Basic) |
| 115,038,909 |
| 115,038,909 |
| |||||||||||
Options |
| - |
| - |
|
| - |
| - |
| ||||||
Warrants |
| - |
| - |
|
| - |
| - |
| ||||||
Weighted average common shares outstanding (Diluted) |
|
| 115,038,909 |
|
|
| 96,038,909 |
|
|
| 115,038,909 |
|
|
| 115,038,909 |
|
|
|
|
|
|
|
|
|
|
|
| ||||||
Net income(loss) per share (Basic and Diluted) |
| $ | 0.0014 |
|
| $ | 0.0007 |
|
| $ | (0.0013 | ) |
| $ | 0.0015 |
|
The Company has no potentially dilutive securities, such as options or warrants, currently issued and outstanding.
NOTE 1210 - CAPITAL STOCK
Authorized Stock
The Company has authorized 10,000,000,000 common shares and 50,000,000 preferred shares, both with a par value of $0.001 per share. Each common share entitles the holder to one vote, in person or proxy, on any matter on which action of the stockholders of the corporation is sought.
Effective February 2, 2018, the Company’s Articles of Incorporation were amended to increase the authorized shares of the Company from 250,000,000 shares of common stock to 10,000,000,000 shares of common stock. A copy of the Certificate of Amendment was filed with the Nevada Secretary of State. The Form 8K announcing the increase of the authorized shares of the Company was filed with SEC on February 6, 2018.
Share Issuance
On September 29, 2016, the Company issued a total of 4,750,000 common shares at US$0.04 per share, of which 2,375,000 common shares to Vincent Lee Sen Min and 2,375,000 common shares to Reggie Abraham, both are Malaysian citizens.
On March 1, 2018, the Company issued a total of 10,000,000 common shares at US$0.02 per share to each of the two directors, of which 5,000,000 common shares to Balakrishnan B S Muthu and 5,000,000 common shares to Chen Ching. An aggregate of $200,000 for this transaction was recognized as stock-based compensation under selling, general and administrative expenses during the three and six months ended March 31, 2018.
On March 1, 2018, the Company issued a total of 9,000,000 common shares at US$0.02 per share to three consultants under the Consultant Agreements, of which 5,000,000 common shares to Vincent Yong Tuck Seng, 2,500,000 common shares to Georgia Suzanne Lingam and 1,500,000 common shares to Liu Jiew Shin, all are Malaysian citizens. An aggregate of $180,000 for this transaction was recognized as stock-based compensation under selling, general and administrative expenses during the three and six months ended March 31, 2018.
There were 115,038,909 common shares issued and outstanding at December 31, 2018September 30, 2019 and June 30, 20182019 respectively.
There are no preferred shares outstanding. The Company has issued no authorized preferred shares. The Company has no stock option plan, warrants, or other dilutive securities.
| Table of Contents |
NOTE 13 -11 – RELATED PARTY TRANSACTIONS
As of December 31, 2018,September 30, 2019, advances were made by five companies of $2,122,807$2,060,482 related to ordinary business transactions. All advances related to ordinary business transactions, bear no interest or collateral, repayable and renewable under normal advancement terms. Details are disclosed in Note 6.
As of December 31, 2018, amounts due from one company of nil related to ordinary business transactions. The receivable amounts related to ordinary business transactions bear no interest or collateral, repayable and renewable under normal advancement terms. Details are disclosed in Note 4.
During the period ended December 31, 2018, the Company sold the property, plant and equipment to BOG and incurred gain of $245,581. This amount was classified as other income.
During the period ended December 31, 2018, the Company received other income of $25,410 from BOG.
During the period ended December 31, 2018, the Company incurred cost of revenue worth of $6,519 to BOG.
NOTE 14 -12 – GOING CONCERN AND LIQUIDITY CONSIDERATIONS
The accompanying financial statements have been prepared assuming that the Company will continue as a going concern, which contemplates the realization of assets and the liquidation of liabilities in the normal course of business. As of and for the period ended December 31, 2018,September 30, 2019, the Company has a loss from operationshad an accumulated deficit of $97,181$4,986,577 and working capital deficiency of $2,148,222.$2,214,452. The Company intends to fund operations through debt and equity financing arrangements, which may be insufficient to fund its capital expenditures, working capital and other cash requirements for the period ending December 31, 2018September 30, 2019 and subsequently.
The ability of the Company to survive is dependent upon, among other things, obtaining additional financing to continue operations, and development of its business plan.
In response to these problems, management intends to raise additional funds through public or private placement offerings, and related party loans.
These factors, among others, raise substantial doubt about the Company’s ability to continue as a going concern. The accompanying financial statements do not include any adjustments that might result from the outcome of this uncertainty.
NOTE 15 -13 – CONCENTRATIONS
Suppliers
The Company’s major suppliers for the period ended December 31,September 30, 2019 and 2018 and 2017 are listed as following:
|
| Subcontractors |
| Accounts Payable |
|
| Subcontractors |
| Accounts Payable |
| ||||||||||||||||||||||
|
| Six |
| Six |
|
|
|
|
|
| Three |
| Three |
|
|
|
|
| ||||||||||||||
|
| Months |
| Months |
|
|
|
|
|
| Months |
| Months |
|
|
|
|
| ||||||||||||||
|
| Ended |
| Ended |
|
|
|
|
|
| Ended |
| Ended |
|
|
|
|
| ||||||||||||||
Major Suppliers |
| December 31, 2018 |
|
| December 31, 2017 |
|
| December 31, 2018 |
|
| December 31, 2017 |
|
| September 30, 2019 |
|
| September 30, 2018 |
|
| September 30, 2019 |
|
| September 30, 2018 |
| ||||||||
|
|
|
|
|
|
|
|
|
| |||||||||||||||||||||||
Company A |
| 100 | % |
| 100 | % |
| 0 | % |
| 0 | % |
| 0 | % |
| 100 | % |
| 0 | % |
| 0 | % | ||||||||
Customers
The Company’s major customers for the period ended December 31,September 30, 2019 and 2018 and 2017 are listed as following:
|
| Other income |
| Sales |
| Accounts Receivable |
|
| Sales |
| Accounts Receivable |
| ||||||||||||||||||||||||||||
|
| Six |
| Six |
| Six |
| Six |
|
|
|
|
|
| Three |
| Three |
|
|
|
|
| ||||||||||||||||||
|
| Months |
| Months |
| Months |
| Months |
|
|
|
|
|
| Months |
| Months |
|
|
|
|
| ||||||||||||||||||
|
| Ended |
| Ended |
| Ended |
| Ended |
|
|
|
|
|
| Ended |
| Ended |
|
|
|
|
| ||||||||||||||||||
Major Customers |
| December 31, 2018 |
| December 31, 2017 |
| December 31, 2018 |
|
| December 31, 2017 |
|
| December 31, 2018 |
|
| December 31, 2017 |
|
| September 30, 2019 |
|
| September 30, 2018 |
|
| September 30, 2019 |
|
| September 30, 2018 |
| ||||||||||||
|
|
|
|
|
|
|
|
|
| |||||||||||||||||||||||||||||||
Company O |
| 0 | % |
| 0 | % |
| 100 | % |
| 100 | % |
| 0 | % |
| 0 | % |
| 0 | % |
| 100 | % |
| 0 | % |
| 0 | % | ||||||||||
Company A |
| 90 | % |
| 71 | % |
|
|
|
|
|
|
|
|
| |||||||||||||||||||||||||
NOTE 16 -14 – SUBSEQUENT EVENTS
The Company has evaluated subsequent events from the balance sheet date through the date the financial statements were issued and determined that there are no additional items to disclose.
|
| Table of Contents |
Item 2. Management’s Discussion and Analysis of Financial Condition and Results of Operations.
Forward-Looking Statements
Except for historical information, this report contains forward-looking statements within the meaning of Section 27A of the Securities Act of 1933 and Section 21E of the Securities Exchange Act of 1934. Such forward-looking statements involve risks and uncertainties, including, among other things, statements regarding our business strategy, future revenues and anticipated costs and expenses. Such forward-looking statements include, among others, those statements including the words “expects,” “anticipates,” “intends,” “believes” and similar language. Our actual results may differ significantly from those projected in the forward-looking statements. Factors that might cause or contribute to such differences include, but are not limited to, those discussed herein as well as in the “Description of Business – Risk Factors” section in our Annual Report on Form 10-K, as filed on September 30, 2013.October 11, 2019. You should carefully review the risks described in our Annual Report and in other documents we file from time to time with the Securities and Exchange Commission. You are cautioned not to place undue reliance on the forward-looking statements, which speak only as of the date of this report. We undertake no obligation to publicly release any revisions to the forward-looking statements or reflect events or circumstances after the date of this document.
Although we believe that the expectations reflected in these forward-looking statements are based on reasonable assumptions, there are a number of risks and uncertainties that could cause actual results to differ materially from such forward-looking statements.
All references in this Form 10-Q to the “Company,” “Verde Resources,” “we,” “us,” or “our” are to Verde Resources, Inc.
Business Overview
The Company is a Nevada corporation that conducts business operations in Pahang Malaysia through Champmark Sdn Bhd (“CSB”), a privately limited liability company incorporated in Malaysia which is a deemed subsidiary under the management control of our 100% subsidiary GBL.
On October 25, 2013, we entered into an Assignment Agreement For the Assignment of Management Right in Merapoh Gold Mines in Malaysia (“Assignment Agreement”) with Federal Mining Resources Limited (“FMR”), a company incorporated under the laws of the British Virgin Islands.
FMR owns 85% equity interest in CSB, a privately limited liability company incorporated in Malaysia. CSB ishas been the Mining Contractor of the Mining Lease for Site IV-1 at the Merapoh Gold Mine under the Contract for Work with MMC Corporation Berhad, the Permit Holder of the Mining Lease. CSB is currently in discussion with Pahang State Development Corporation to accept their offer for CSB to act as the contractor and operator for Site IV-1 at the Merapoh Gold Mine.
Under the terms of the Assignment Agreement, FMR assigned its management rights of CSB’s mining operation in the Mining Lease to the Company, through its wholly-owned subsidiary Gold Billion Global Limited (“GBL”), in exchange for 80,000,000 shares of the Company’s common stock, which constituted 95.26% of our issued and outstanding capital stock as of and immediately after the consummation of the acquisition.
GBL was established on February 7, 2013, by the Board of Directors of FMR to monitor the CSB operation. The acquisition of 100% of the issued and outstanding capital stock of GBL was agreed upon on October 18, 2013, and completed on October 25, 2013, subject to the approval of the Board of Directors and the audit of GBL.
On February 17, 2014, we entered into a Supplementary Agreement to the Assignment Agreement and completed a reverse acquisition of GBL pursuant to the Supplementary Agreement. As a result of the acquisition, the Company holds 100% equity interest in GBL and 85% variable interest in CSB. Our consolidated subsidiaries include GBL being our wholly-owned subsidiary and 85% of CSB being a variable interest entity (VIE) and deemed subsidiary of GBL. On April 1, 2014, GBL purchased 85% equity interest of CSB, and CSB became indirect subsidiary of the Company.
| Table of Contents |
Corporate History and Structure
Verde Resources, Inc. was incorporated on April 22, 2010, in the State of Nevada, U.S.A. On October 17, 2013, Stephen Spalding and Michael Stiege resigned from all of their positions as officers and directors of the Company. In addition, the following persons were appointed to serve as directors and to assume the responsibilities of officers on October 17, 2013. Mr. Wu Ming Ding, as President and Director; Mr. Balakrishnan B S Muthu as Treasurer, Chief Financial Officer General Manager and Director; and Mr. Liang Wai Keen as Secretary. Mr. Wu and Mr. Muthu were added to the Board of Directors.
On April 1, 2014, the Board of Directors of Gold Billion Global Limited (“GBL”) notified Federal Mining Resources Limited (“FMR”) upon the decision to exercise the right of option to purchase 85% equity interest of Champmark Sdn Bhd (“CSB”) under Management Agreement Section 3.2.4 dated July 1, 2013, between GBL and FMR. This acquisition was completed on April 1, 2014, with consideration of US$1, and GBL then became 85% shareholder of CSB.
Effective February 20, 2016, Mr. Wu Ming Ding resigned all of his positions as President and Director of the Company with Mr. Balakrishnan B S Muthu being appointed President to fill the vacancy created. Effective February 20, 2016, Mr. Chen Ching was appointed Director of the Company, and the entire Board of Directors now consists of Mr. Balakrishnan B S Muthu and Mr. Chen Ching.
Effective February 2, 2018, the Company’s Articles of Incorporation were amended to increase the authorized shares of the Company from 250,000,000 shares of common stock to 10,000,000,000 shares of common stock. A copy of the Certificate of Amendment was filed with the Nevada Secretary of State. The Form 8K announcing the increase of the authorized shares of the Company was filed with SEC on February 6, 2018.
The following diagram illustrates our current corporate structure:

According to ASC 810-05-08 A, CSB is a deemed subsidiary of GBL where GBL has control the Board of Directors of CSB, rights to receive future benefits and residual value, and obligation to absorb loss and finance for CSB. GBL has the power to direct the activities of CSB that most significantly impact CSB’s economic performance and the obligation to absorb losses of CSB that could potentially be significant to the CSB or the right to receive benefits from CSB that could potentially be significant to CSB. GBL is the primary beneficiary of CSB because GBL can direct the activities of CSB through the common directors and 85% shareholder FMR. Under 810-23-42, 43, it is determined that CSB is de-facto agent of the principal GBL and so GBL will consolidate CSB from July 1, 2013.
| Table of Contents |
Contractual Arrangements
Our exploration and mining business is currently provided through contractual arrangements with CSB through our wholly-owned subsidiary GBL.
CSB, the VIE of GBL, sells gold minerals directly to the registered gold trading company in Malaysia. We have been and are expected to continue to be dependent on our VIE to operate our exploration and mining business. GBL has entered into contractual arrangements with its VIE, which enable us to exercise effective control over the VIE, receive substantially all of the economic benefits from the VIE, and have the option to purchase equity interests in the VIE.
On July 1, 2013, the Company’s subsidiary GBL entered into a series of agreements (“VIE agreements”) with FMR and details of the VIE agreements are as follows :follows:
| 1. | Management Agreement, FMR entrusted the management rights of its subsidiary CSB to GBL that include: | |
| i) | management and administrative rights over the day-to-day business affairs of CSB and the mining operation at Site IV-1 of the Merapoh Gold Mine; | |
| ii) | final right for the appointment of members to the Board of Directors and the management team of CSB; | |
| iii) | to act as principal of CSB; | |
| iv) | an obligation to provide financial support to CSB; | |
| v) | an option to purchase an equity interest in CSB; | |
| vi) | an entitlement to future benefits and residual value of CSB; | |
| vii) | a right to impose no dividend policy; | |
| viii) | human resources management. | |
| 2. | Debt Assignment, FMR assigned to GBL the sum of money in the amount of US Dollars Three Hundred Nine Thousand Three Hundred Thirty One And Ninety Two cents (US$ 309,331.92), now due to GBL from CSB under the financing obligation from the FMR to CSB. | |
With the above agreements, GBL controls CSB as the primary beneficiary and the operating results of the VIE was included in the condensed consolidated financial statements for the nine months ended March 31, 2014.
CSB holds the operating right to Merapoh Gold Mine (the “Mine”) with all regulatory and government operating licenses in Malaysia.
On April 1, 2014, GBL purchased 85% equity interest of CSB, and CSB became indirect subsidiary of the Company.
Stage of Operation
The Company does not own any title and/or concession right in any mines. The Company is undertaking natural mineral resource extraction management services.
According to the United States Industry Guide 7 (a) (4) on mining operations, the Merapoh Gold Mine is currently in the production stage because the mine has produced approximately 0.90.1 kilogram gold from JanuaryJuly 2018 to December 2018.June 2019. According to the ASC 930-330-20 Glossary, the production phase is defined as “when saleable minerals are extracted (produced) from an ore body, regardless of the level of production”. However, the production is limited to a small part of the site, and extraction is alluvial gold only. The objective of the Company is preparing to improve the productivity of the mines to ensure that the operation will be carried out effectively and efficiently at minimum cost.
| Table of Contents |
Current Mining Property and Location
Merapoh Gold Mine (the “Mine”)
The Merapoh Gold Mine is located in northern Pahang, with convenient road access through Kelantan directly to mine site and is about 400 kilometers away from Kuala Lumpur. The Mine is located in the middle of Malaysia gold metallogenic belt. The central gold belt is the source of the majority of the gold deposits in the peninsula. It lies between the western and eastern tin belts and extends from Kelantan (Sungai Pergau, Sungai Galas) to Pahang (Merapoh, Kuala Lipis, Raub), Terengganu (Lubuk Mandi), Negri Sembilan and Johor (Gunung Ledang).
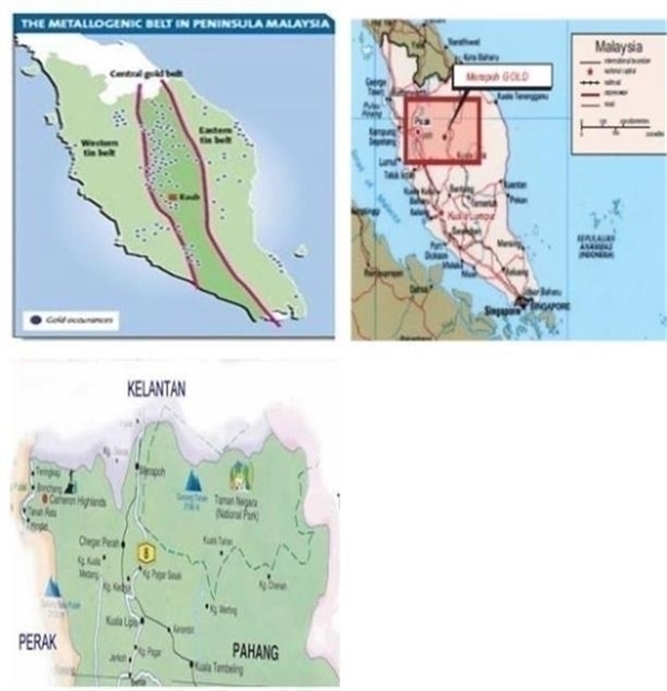

| Table of Contents |
Description of the Mining Process
A planned sequence of events is involved in mining a pit:
| · | Identifying the resource |
| · | Creating access to the ore body |
| · | Removing the ore from the ore body |
| · | Refining of the concentrate |
Our in-house exploration team identifies a target and undertakes exploration. Before any hole is drilled or rock mined, much planning goes into making sure the mining sequence runs smoothly and safely as possible. The process of creating access to the possible ore body includes possible ore excavation, possible ore assessment and possible ore segregation.
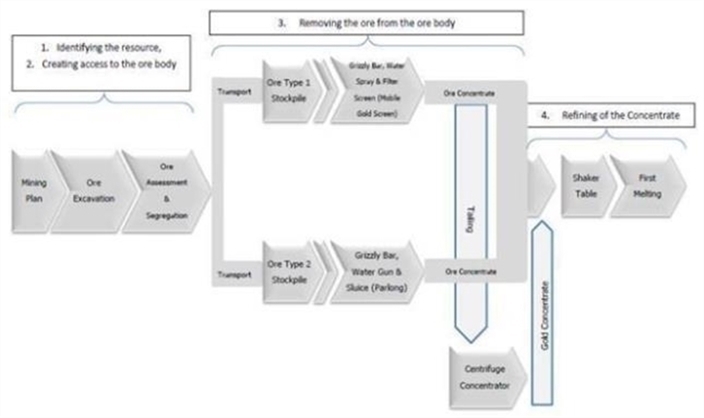

Process for removing ore concentrates from the ore body
| 1. | The ore body is transported to the treatment plants in vehicles capable of hauling huge, heavy loads. |
| 2. | The ore body is separated into Ore Type 1 Stockpile and Ore Type 2 Stockpile. |
| 3. | The monitor washes finer gold bearing material off larger rocks which is screened on an inclined coarse wire screen. |
| 4. | An excavator is used to turn over the rocks so wash is removed from all sides of the coarse material. |
| 5. | A monitor pushes the rock down the inclined coarse screen where the course is removed and stockpiled at the bottom. |
| 6. | Finer material passes through the mesh screen into the sluice system and runs over the sluice. |
| 7. | The carpets are removed and taken to refining facility for gold recovery. |
| 8. | A suction pipe recovers water of the fine tailings pond for use in the system. |
Refining of the concentrate
| 1. | The carpets holding concentrate from the sluice are brought to a shed in the camp site where the gold refined. |
| 2. | The first stage of the refining is to wash the gold containing concentrate into large bins. This is pumped to a jig and shaking table. |
| 3. | Nuggets are handpicked from the coarse fraction and the fine fraction is amalgamated to remove the gold. After distillation gold from the amalgam and the coarse are melted with flux and the gold is poured into small bars. |
| Table of Contents |
Results of Operations
For the three months ended December 31, 2018September 30, 2019 and 2017:2018:
We have generated nil$0 and $22,802$8,879 revenues for the three months ended December 31,September 30, 2019 and 2018, and 2017, and have recorded a gross income (loss)loss of $(1,539)$0 and $(12,244)$2,387 for the three months ended December 31, 2018September 30, 2019 and 2017.2018. We have incurred $(35,902)$149,377 and $25,325$57,353 in operating income (expenses)expenses through December 31, 2018September 30, 2019 and 2017.2018. We have other income, (expenses) $26,652net $0 and $16,557$273,367 for the three months ended December 31, 2018September 30, 2019 and 2017.2018.
The following table provides selected financial data about our company for the three months ended December 31, 2017September 30, 2019 and December 31, 2016.September 30, 2018.
Statement of Operation |
| 12/31/2018 |
|
| 12/31/2017 |
|
| Change |
| |||
|
| Amount |
|
| Amount |
|
| % |
| |||
Revenue |
| $ | - |
|
| $ | 22,802 |
|
| (100 | )% | |
Cost of revenue |
| $ | 1,539 |
|
| $ | 35,046 |
|
| (96 | )% | |
Gross Income (Loss) |
| $ | (1,539 | ) |
| $ | (12,244 | ) |
| (87 | )% | |
Operating Income (Expenses) |
| $ | (35,902 | ) |
| $ | 25,325 |
|
| (242 | )% | |
Other Income(Expenses) |
| $ | 26,652 |
|
| $ | 16,557 |
|
|
| 61 | % |
For the six months ended December 31, 2018 and 2017:
We have generated $8,879 and $43,523 revenues for the six months ended December 31, 2018 and 2017, and have recorded a gross loss of $3,926 and $2,556 for the six months ended December 31, 2018 and 2017. We have incurred $(93,255) and $11,300 in operating income (expenses) through December 31, 2018 and 2017. We have other income $300,019 and $58,564 for the six months ended December 31, 2018 and 2017.
The following table provides selected financial data about our company for the six months ended December 31, 2018 and December 31, 2017.
Statement of Operation |
| 12/31/2018 |
|
| 12/31/2017 |
|
| Change |
|
| 9/30/2019 |
|
| 9/30/2018 |
|
| Change |
| ||||||
|
| Amount |
| Amount |
| % |
|
| Amount |
| Amount |
| % |
| ||||||||||
Revenue |
| $ | 8,879 |
| $ | 43,523 |
| (80 | )% |
| $ | - |
| $ | 8,879 |
| (100 | )% | ||||||
Cost of revenue |
| $ | 12,805 |
| $ | 46,079 |
| (72 | )% |
| $ | - |
| $ | 11,266 |
| (100 | )% | ||||||
Gross Loss |
| $ | 3,926 |
| $ | 2,556 |
| 54 | % | |||||||||||||||
Operating Income (Expenses) |
| $ | (93,255 | ) |
| $ | 11,300 |
| (925 | )% | ||||||||||||||
Other Income(Expenses) |
| $ | 300,019 |
| $ | 58,564 |
| 412 | % | |||||||||||||||
Gross Profit(Loss) |
| $ | - |
| $ | (2,387 | ) |
| (100 | )% | ||||||||||||||
Operating Expenses |
| $ | 149,377 |
| $ | 57,353 |
| 160 | % | |||||||||||||||
Other Income, net |
| $ | - |
| $ | 273,367 |
| (100 | )% | |||||||||||||||
The revenue derived from the sales of gold mineral to customers in Malaysia. The decrease of revenue for the period ended December 31, 2018September 30, 2019 was mainly due to a decrease in gold production because of depleting mineral reserves in the mine and gold sales during the period. The decrease of cost of revenue was mainly due to a decrease of gold production corresponding to the decrease in revenue during the period.period and a substantial increase in closing inventories as during the period-end. Operating expenses comprised mainly of salaries, office costs, legal and professional fees and travelling expenses. The decrease in operating expenses for the period was mainly due to the decrease of salaries and an increase in foreign exchange gain during the period. Net other income comprisecomprises mainly of miscellaneous non-operating expenses, equipment rental income and waivergain on disposal of consultancy service fee.property, plant and equipment. The increase in net other income for the period was mainly due to the increasegain on disposal of equipment rental incomeproperty, plant and the waiver of consultancy service fee.equipment.
The revenue derived from the sales of gold mineral to customers in Malaysia. The decrease of revenue and cost of revenue for the period ended December 31, 2018September 30, 2019, was mainly due to a decrease in gold production and gold sales during the period. Operating expenses comprised mainly of salaries, office costs, legal and professional fees, consultancy service fee, stock-based compensation and travelling expenses. The operating expenses were mainly denominated in MYR and decrease compared with sixthree months ended December 31, 2018September 30, 2019, due to decrease of salaries and an increase in foreign exchange gain during the period.cost of revenue. Moreover, the average rate of MYR : USD:USD for sixthree months December 31,September 30, 2019 and September 30, 2018 was 0.2397 and December 31, 2017 was 0.2420 and 0.23870.2439 respectively.
Plan of Operation
Our Industry and Principal Markets
As reported in the GFMS Gold Surveys H1 2018 released by Thomson Reuters, after closing 2017 in fine fettle gold sentiment changed early in 2018, pressuring prices towards $1,240/oz. While professional sentiment has been gold-averse, there are shifts in some regional areas of demand and growing scope for a short-covering rally. In Malaysia, the report expects the Malaysian gold market to benefit from the removal of Goods and Services Tax (GST) as a new government takes over. The jewelry demand is expected to pick up as a result of the removal of the consumption tax but the rate of recovery will depend largely on the prevailing gold price.
Another report by BMI Research states that global gold mine output growth will pick up in the next few years, supported by higher gold prices and solid projects in key countries. BMI Research forecasts global gold production to increase from 105moz in 2018 to 125moz by 2026, averaging 2.3% annual growth. While a steady pace of growth, this represents a slight deceleration in growth rate compared with the previous eight-year average of 3.1%.
Subcontractor
In an effort to enhance the efficiency of mine operations at the Merapoh Gold Mine, Champmark Sdn Bhd (“CSB”) entered into an Operation Term Sheet (“OTS”) agreement in July 2013 to outsource the exploitation works of alluvial gold resources at Site IV-1 of the Merapoh Gold Mine to a subcontractor Borneo Oil & Gas Corporation Sdn Bhd (“BOG”).
BOG has the experience and local knowledge in managing the exploitation of alluvial gold at the Merapoh Gold Mine. The Company will provide necessary disclosure when any significant agreements have been made with sub-contractors in the future.
BOG became the Company’s shareholder in January 29, 2014, and was no longer a third party subcontractor.
| 33 |
| Table of Contents |
Expansion Plans
At present, we are well positioned working with our third party subcontractor, who has the experience and local knowledge to manage our exploitation of alluvial gold at the Merapoh Gold Mine. The Company believes that there are excellent growth opportunities for its business outside Malaysia. We are constantly exploring for potential acquisition of mining projects in other parts of the world.
The Company, through its wholly-owned subsidiary company Gold Billion Global Ltd (“GBL”) entered into a letter of intent with Xinjiang Changhe Mining Co., Ltd (“XCM”) on September 29, 2014. Under the letter of intent, GBL has offered to acquire ownership in XCM for the Ayigate Gold Project subject to due diligence. The Ayigate gold mine is located within the Tianshan region in Wuqia County, Xinjiang Uygur Autonomous Region of the People’s Republic of China. After several discussions, the Company decided not to proceed with the offer to acquire ownership in XCM.
As our business is affected by the fluctuations of gold prices, the Company intends to diversify its product line by acquiring mining projects with potential for different mineral resources other than gold. We continue to hold discussions with other mining companies for potential collaboration to carry out exploration and exploitation works on other mineral resources in Southeast Asia regions. Apart from the mining industry, the Company is taking steps to look into investment opportunities in the non-mining areas that include the bioenergy industry and the food & beverage sector.
Limited Operating History; Need for Additional Capital
There is no historical financial information about us upon which to base an evaluation of our performance. We cannot guarantee we will be successful in our business operations. Our business is subject to risks inherent in the establishment of a new business enterprise, including limited capital resources, possible delays in the exploration of our properties, and possible cost overruns due to price and cost increases in services.
We have no assurance that future financing will be available to us on acceptable terms. If financing is not available on satisfactory terms, we may be unable to continue, develop or expand our operations. Equity financing could result in additional dilution to existing shareholders.
| Table of Contents |
Liquidity and Capital Resources
The following table provides selected cash flow data about our company for the sixthree months ended December 31, 2018September 30, 2019 and December 31, 2017.2018.
Cash Flow Date |
| 12/31/2018 |
|
| 12/31/2017 |
|
| 9/30/2019 |
|
| 9/30/2018 |
| ||||
Net Profit (Loss) from operation |
| $ | 202,838 |
| $ | 67,308 |
| |||||||||
Net Profit(Loss) from operation |
| $ | (149,377 | ) |
| $ | 213,627 |
| ||||||||
Net Cash Generated/(Used) from operating activities |
| $ | (60,930 | ) |
| $ | 12,170 |
|
| $ | (156,564 | ) |
| $ | (29,562 | ) |
Net Cash Generated/(Used) from investing activities |
| $ | - |
| $ | - |
|
| $ | - |
| $ | - |
| ||
Net Cash Generated/(Used) from financing activities |
| $ | (1,188 | ) |
| $ | (3,581 | ) |
| $ | (191 | ) |
| $ | (595 | ) |
For the sixthree months ended December 31, 2018,September 30, 2019, the Company had incurred net profitloss from operation of $202,838$149,377 which posted a positivenegative impact to the company’s cash flow. The reconciliation on non-cash items such as depreciations and gain on disposal of property, plant and equipment provide negative impact on cash.
In the operation analysis, the net cash generatedused in operating activities decreased from $12,170$(29,562) to $(60,930)$(156,564). The $202,838 net profit was partially offset by the noncash income such as $245,581 in gain on disposal of property, plant and equipment less $3,530 in depreciation. In the operating assets and liabilities, the net decreaseincrease in current assets, such as accounts receivable from related parties, deposits and prepayment was $9,132$329 whereas the net decrease in current liabilities, such as accounts payable, accrued liabilities and other payables, advanced from sub-contractor & related parties and taxation payable was $30,849, which provided negative cash flow effect to offset the $202,838 profit in operation.$7,516. The final result of the cash flow from operating activities was $(60,930)$(156,564) negative cash flow effect.
In the investing cash flow analysis, there was no change for the three months ended December 31, 2018.September 30, 2019.
In the financing analysis, there was loan principal $1,188 repaid to the repayments of bank for the six months ended December 31, 2018, compared to $3,581 repaid to the bank for the six months ended December 31, 2017.loans of $191.
Besides, theThe net increasedecrease in exchange rate effect of $58,271$160,586 provided a positive cash flow effect. The cash and cash equivalents at the end of December 31, 2018,September 30, 2019, was decreasedincreased by $5,040$3,831 with $6,185$14,493 as a balance.
The cash flow situation will not allow for operations in the coming next 12 months by self-generated cash provided from operating activities. The Company needs to increase cash flow supplies with a long term plan until the Company makes sustainable profits and has a positive cash flow. Otherwise, loans from related parties may be a temporary solution, although we have no written loan agreements. There is no guarantee that we will be able to secure adequate financing. If we fail to secure sufficient funds, our business activities may be curtailed, or we may cease to operate.
Off-Balance Sheet Arrangements
We do not have any off-balance sheet arrangements that have or are reasonably likely to have a current or future effect on our financial condition, changes in financial condition, revenues or expenses, results of operations, liquidity, capital expenditures, or capital resources that is material to investors.
| Table of Contents |
Item 3. Quantitative and Qualitative Disclosures About Market Risk.
As a “smaller reporting company”, we are not required to provide the information required by this Item.
Item 4. Controls and Procedures.
Evaluation of Disclosure Controls and Procedures
As of December 31, 2018,September 30, 2019, management assessed the effectiveness of our internal control over financial reporting based on the criteria for effective internal control over financial reporting established in Internal Control--Integrated Framework issued by the Committee of Sponsoring Organizations of the Treadway Commission (“COSO”) and SEC guidance on conducting such assessments. Based on that evaluation, they concluded that, during the period covered by this report, such internal controls and procedures were not effective to detect the inappropriate application of US GAAP rules as more fully described below. This was due to deficiencies that existed in the design or operation of our internal controls over financial reporting that adversely affected our internal controls and that may be considered to be material weaknesses.
The matters involving internal controls and procedures that our management considered to be material weaknesses under the standards of the Public Company Accounting Oversight Board were: (1) lack of a functioning audit committee, (2) lack of a majority of outside directors on our board of directors, resulting in ineffective oversight in the establishment and monitoring of required internal controls and procedures; (3) inadequate segregation of duties consistent with control objectives; and (4) management is dominated by three individuals without adequate compensating controls. The aforementioned material weaknesses were identified by our Chief Executive and Financial Officers in connection with the review of our financial statements as of December 31, 2018.September 30, 2019.
Management believes that the material weaknesses set forth above did not have an immediate negative effect on our financial results because of our small size of operation. However, management believes that the lack of a functioning audit committee and the lack of a majority of outside directors on our board of directors results in ineffective oversight in the establishment and monitoring of required internal controls and procedures, which could result in a material misstatement in our financial statements if the Company were growing substantially in the future periods.
Changes in Internal Controls
There have been no changes in our internal controls over financial reporting identified in connection with the evaluation required by paragraph (d) of Securities Exchange Act Rule 13a-15 or Rule 15d-15 that occurred in the threenine months ended December 31, 2018September 30, 2019 that have materially affected, or are reasonably likely to materially affect, our internal control over financial reporting.
| Table of Contents |
We know of no material, existing or pending legal proceedings against our Company, nor are we involved as a plaintiff in any material proceeding or pending litigation. There are no proceedings in which any of our directors, officers or affiliates, or any registered beneficial shareholder, is an adverse party or has a material interest adverse to our interest.
As a “smaller reporting company”, we are not required to provide the information required by this Item.
Item 2. Unregistered Sales of Equity Securities and Use of Proceeds.
N/A.
Item 3. Defaults Upon Senior Securities.
None.
Item 4. Mine Safety Disclosure.
Pursuant to Section 1503(a) of the Dodd-Frank Wall Street Reform and Consumer Protection Act of 2010 (“ Dodd-Frank Act “), issuers that are operators, or that have a subsidiary that is an operator, of a coal or other mine in the United States are required to disclose in their periodic and annual reports filed with the SEC information regarding specified health and safety violations, orders and citations, related assessments and legal actions, and mining-related fatalities under the regulation of the Federal Mine Safety and Health Act of 1977. The Company did not have any mines in the United States during the period ended December 31, 2018.September 30, 2019.
There were changes in Directors and Executive Officers effective on February 20, 2016. For details, please refer to SC 14F1 and Form 8-K filed by the registrant to SEC on February 10, 2016 and February 22, 2016 respectively, at SEC website: www.sec.gov.
| Table of Contents |
The following exhibits are included as part of this report:
101*
___________
* The following financial information from Verde Resources, Inc.’s Quarterly Report on Form 10-Q for the quarter ended December 31, 2018,September 30, 2019, formatted in XBRL (eXtensible Business Reporting Language): (i) Condensed Balance Sheets as of December 31, 2018,September 30, 2019, and June 30, 2018,2019, (ii) Condensed Statements of Operations for the three and six months ended December 31,September 30, 2019 and 2018, and 2017, (iii) Condensed Statements of Cash Flows for the sixnine months ended December 31,September 30, 2019 and 2018, and 2017, and (iv) Notes to Condensed Financial Statements.
| Table of Contents |
Pursuant to the requirements of the Securities Exchange Act of 1934, the registrant has duly caused this report to be signed on its behalf by the undersigned thereunto duly authorized.
| VERDE RESOURCES, INC. | |||
| (Registrant) | |||
| ||||
Dated: | By: | /s/ Balakrishnan B S Muthu | ||
| Balakrishnan B S Muthu | |||
| President | |||
| (Principal Executive Officer) | |||
|