UNITED STATES
SECURITIES AND EXCHANGE COMMISSION
WASHINGTON, D.C. 20549
______________________
FORM 10-Q
| | | | | |
| ☑ | |
þ | QUARTERLY REPORT PURSUANT TO SECTION 13 OR 15(d) OF THE SECURITIES EXCHANGE ACT OF 1934 |
For the quarterly period ended DecemberMarch 31, 20172024
OR
| | | | | |
| ☐ | |
o | TRANSITION REPORT PURSUANT TO SECTION 13 OR 15(d) OF THE SECURITIES EXCHANGE ACT OF 1934 |
For the transition period from _________ to ___________
Commission file number 001-37884
VALVOLINE INC.
(Exact name of registrant as specified in its charter)
| | | | | |
| Kentucky | 30-0939371 |
| |
Kentucky
(State or other jurisdiction of incorporation or organization) | 30-0939371
(I.R.S. Employer Identification No.) |
100 Valvoline Way, Suite 100
Lexington, Kentucky 40509
(Address of principal executive offices) (Zip Code)
Telephone Number (859) 357-7777
(Registrant’s telephone number, including area code)
Securities registered pursuant to Section 12(b) of the Act:
| | | | | | | | | | | | | | |
| Title of each class | | Trading Symbol(s) | | Name of each exchange on which registered |
| Common stock, par value $0.01 per share | | VVV | | New York Stock Exchange |
Indicate by check mark whether the Registrantregistrant (1) has filed all reports required to be filed by Section 13 or 15(d) of the Securities Exchange Act of 1934 during the preceding 12 months (or for such shorter period that the Registrant was required to file such reports), and (2) has been subject to such filing requirements for the past 90 days. Yes þNoo
Indicate by check mark whether the Registrantregistrant has submitted electronically and posted on its corporate website, if any, every Interactive Data File required to be submitted and posted pursuant to Rule 405 of Regulation S-T (§232.405 of this chapter) during the preceding 12 months (or for such shorter period that the Registrantregistrant was required to submit and post such files).Yes þ Noo
Indicate by check mark whether the Registrantregistrant is a large accelerated filer, an accelerated filer, a non-accelerated filer, a smaller reporting company or an emerging growth company. See the definitions of “large accelerated filer,” “accelerated filer”,filer,” “smaller reporting company,” and “emerging growth company” in Rule 12b-2 of the Exchange Act. (Check one):
| | | | | | | | | | | |
| Large accelerated filer | ☑ | Accelerated filer | ☐ |
| Non-accelerated filer | ☐ | Smaller reporting company | ☐ |
| Large Accelerated Filer þ
| Emerging growth company | Accelerated Filer o
|
Non-Accelerated Filer o
| Smaller Reporting Company o
|
(Do not check if a smaller reporting company) | Emerging Growth Company o
☐ |
If an emerging growth company, indicate by check mark if the registrant has elected not to use the extended transition period for complying with any new or revised financial accounting standards provided pursuant to Section 13(a) of the Exchange Act. o☐
Indicate by check mark whether the Registrantregistrant is a shell company (as defined in Rule 12b-2 of the Act). Yes o☐ No þ
At February 1, 2018,May 7, 2024, there were 200,065,752128,854,818 shares of the Registrantregistrant’s common stock outstanding.
VALVOLINE INC. AND CONSOLIDATED SUBSIDIARIES
TABLE OF CONTENTS
| | | | | |
| Page |
| |
| Page |
| PART I – FINANCIAL INFORMATION |
| |
| |
| |
| |
For the three months ended December 31, 2017 and 2016 | |
| |
| |
As of December 31, 2017 and September 30, 2017 | |
| |
| |
For the three months ended December 31, 2017 and 2016 | |
| |
| |
| |
| |
| |
| |
| |
| |
| |
| |
| |
| |
| |
| PART II – OTHER INFORMATION |
| |
| |
| |
| |
| |
| |
| |
| |
| |
| |
PART I - FINANCIAL INFORMATION
ITEM 1. FINANCIAL STATEMENTS
Valvoline Inc. and Consolidated Subsidiaries
Condensed Consolidated Statements of Comprehensive Income |
| | | | | | | |
| | Three months ended December 31 |
| (In millions except per share data - unaudited) | 2017 | | 2016 |
| Sales | $ | 545 |
| | $ | 489 |
|
| Cost of sales | 350 |
| | 304 |
|
| Gross profit | 195 |
| | 185 |
|
| | | | |
| Selling, general and administrative expenses | 114 |
| | 95 |
|
| Separation costs | 2 |
| | 6 |
|
| Equity and other income | (9 | ) | | (10 | ) |
| Operating income | 88 |
| | 94 |
|
| Net pension and other postretirement plan non-service income and remeasurement adjustments | (10 | ) | | (26 | ) |
| Net interest and other financing expense | 14 |
| | 10 |
|
| Income before income taxes | 84 |
| | 110 |
|
| Income tax expense | 94 |
| | 38 |
|
| Net (loss) income | $ | (10 | ) | | $ | 72 |
|
| | | | |
| NET (LOSS) INCOME PER SHARE | | | |
| Basic | $ | (0.05 | ) | | $ | 0.35 |
|
| Diluted | $ | (0.05 | ) | | $ | 0.35 |
|
| | | | |
| WEIGHTED AVERAGE COMMON SHARES OUTSTANDING | | | |
| Basic | 202 |
| | 205 |
|
| Diluted | 202 |
| | 205 |
|
| | | | |
| DIVIDENDS PAID PER COMMON SHARE | $ | 0.07 |
| | $ | 0.05 |
|
| | | | |
| COMPREHENSIVE (LOSS) INCOME | | | |
| Net (loss) income | $ | (10 | ) | | $ | 72 |
|
| Other comprehensive income (loss), net of tax | | | |
| Unrealized translation gain (loss) | 1 |
| | (9 | ) |
| Pension and other postretirement obligation adjustment | (2 | ) | | (2 | ) |
| Other comprehensive loss | (1 | ) | | (11 | ) |
| Comprehensive (loss) income | $ | (11 | ) | | $ | 61 |
|
| | | | |
| | | | | | | | | | | | | | | | | | | | | | | | | | |
| | Three months ended
March 31 | | Six months ended
March 31 |
| (In millions, except per share amounts - unaudited) | | 2024 | | 2023 | | 2024 | | 2023 |
| Net revenues | | $ | 388.7 | | | $ | 344.5 | | | $ | 762.1 | | | $ | 677.3 | |
| Cost of sales | | 242.5 | | | 217.8 | | | 481.1 | | | 431.8 | |
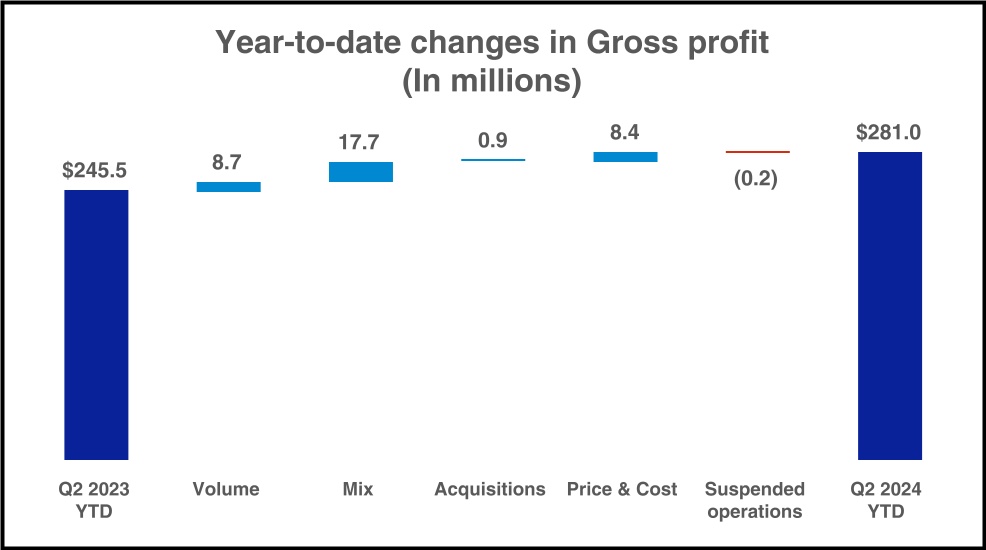
| Gross profit | 146.2 | | | 126.7 | | | 281.0 | | | 245.5 | |
| | | | | | | | |
| Selling, general and administrative expenses | | 72.3 | | | 62.6 | | | 146.8 | | | 128.6 | |
| Net legacy and separation-related expenses | | — | | | 3.8 | | | 0.1 | | | 29.2 | |
| Other income, net | | (2.5) | | | (0.9) | | | (5.1) | | | (2.8) | |
| Operating income | 76.4 | | | 61.2 | | | 139.2 | | | 90.5 | |
| Net pension and other postretirement plan expenses | | 3.6 | | | 3.6 | | | 7.0 | | | 7.3 | |
| Net interest and other financing expenses | | 15.5 | | | 13.3 | | | 29.1 | | | 32.0 | |
| Income before income taxes | 57.3 | | | 44.3 | | | 103.1 | | | 51.2 | |
| Income tax expense (benefit) | | 14.0 | | | 11.4 | | | 25.9 | | | (8.7) | |
| Income from continuing operations | | 43.3 | | | 32.9 | | | 77.2 | | | 59.9 | |
| (Loss) income from discontinued operations, net of tax | | (1.9) | | | 1,194.4 | | | (3.9) | | | 1,249.3 | |
| Net income | $ | 41.4 | | | $ | 1,227.3 | | | $ | 73.3 | | | $ | 1,309.2 | |
| | | | | | | | |
| Net earnings per share | | | | | | | | |
| Basic earnings (loss) per share | | | | | | | |
| Continuing operations | $ | 0.33 | | | $ | 0.19 | | | $ | 0.59 | | | $ | 0.35 | |
| Discontinued operations | (0.01) | | | 6.96 | | | (0.03) | | | 7.20 | |
| Basic earnings per share | $ | 0.32 | | | $ | 7.15 | | | $ | 0.56 | | | $ | 7.55 | |
| | | | | | | | |
| Diluted earnings (loss) per share | | | | | | | |
| Continuing operations | $ | 0.33 | | | $ | 0.19 | | | $ | 0.59 | | | $ | 0.34 | |
| Discontinued operations | (0.01) | | | 6.92 | | | (0.03) | | | 7.16 | |
| Diluted earnings per share | $ | 0.32 | | | $ | 7.11 | | | $ | 0.56 | | | $ | 7.50 | |
| | | | | | | | |
| Weighted average common shares outstanding | | | | | | | | |
| Basic | | 129.8 | | | 171.7 | | | 130.8 | | | 173.5 | |
| Diluted | | 130.7 | | | 172.7 | | | 131.7 | | | 174.5 | |
| | | | | | | | |
| Comprehensive income | | | | | | | | |
| Net income | | $ | 41.4 | | | $ | 1,227.3 | | | $ | 73.3 | | | $ | 1,309.2 | |
| Other comprehensive (loss) income, net of tax | | | | | | | | |
| Currency translation adjustments | | (2.5) | | | 29.3 | | | 4.1 | | | 44.5 | |
| Amortization of pension and other postretirement plan prior service credits | | (0.4) | | | (0.5) | | | (0.9) | | | (0.9) | |
| Unrealized loss on cash flow hedges | | (1.4) | | | (3.1) | | | (3.3) | | | (4.4) | |
| Other comprehensive (loss) income | | (4.3) | | | 25.7 | | | (0.1) | | | 39.2 | |
| Comprehensive income | | $ | 37.1 | | | $ | 1,253.0 | | | $ | 73.2 | | | $ | 1,348.4 | |
| | | | | | | | |
SeeThe accompanying Notes to Condensed Consolidated Financial Statements are an integral part of these Condensed Consolidated Financial Statements.
Valvoline Inc. and Consolidated Subsidiaries
Condensed Consolidated Balance Sheets | | | | | | | | | | | | | | |
| (In millions, except per share amounts - unaudited) | | March 31
2024 | | September 30 2023 |
| Assets |
| Current assets | | | | |
| Cash and cash equivalents | | $ | 494.5 | | | $ | 409.1 | |
| Receivables, net | | 109.6 | | | 81.3 | |
| Inventories, net | | 37.5 | | | 33.3 | |
| Prepaid expenses and other current assets | | 59.8 | | | 65.5 | |
| Short-term investments | | — | | | 347.5 | |
| | | | |
| Total current assets | | 701.4 | | | 936.7 | |
| Noncurrent assets | | | | |
| Property, plant and equipment, net | | 877.9 | | | 818.3 | |
| Operating lease assets | | 288.1 | | | 266.5 | |
| Goodwill and intangibles, net | | 692.3 | | | 680.6 | |
| | | | |
| Other noncurrent assets | | 203.3 | | | 187.8 | |
| | | | |
| Total noncurrent assets | | 2,061.6 | | | 1,953.2 | |
| Total assets | | $ | 2,763.0 | | | $ | 2,889.9 | |
| | | | |
| Liabilities and Stockholders’ Equity | | | | |
| Current liabilities | | | | |
| | | | |
| Current portion of long-term debt | | $ | 623.8 | | | $ | 23.8 | |
| Trade and other payables | | 118.8 | | | 118.7 | |
| Accrued expenses and other liabilities | | 221.1 | | | 215.9 | |
| Current liabilities held for sale | | — | | | 3.9 | |
| Total current liabilities | | 963.7 | | | 362.3 | |
| Noncurrent liabilities | | | | |
| Long-term debt | | 951.3 | | | 1,562.3 | |
| Employee benefit obligations | | 170.2 | | | 168.0 | |
| Operating lease liabilities | | 269.0 | | | 247.3 | |
| | | | |
| Other noncurrent liabilities | | 348.7 | | | 346.8 | |
| | | | |
| Total noncurrent liabilities | | 1,739.2 | | | 2,324.4 | |
| Commitments and contingencies | | | | |
| Stockholders' equity | | | | |
| Preferred stock, no par value, 40.0 shares authorized; no shares issued and outstanding | | — | | | — | |
| Common stock, par value $0.01 per share, 400.0 shares authorized; 128.8 and 134.8 shares issued and outstanding at March 31, 2024 and September 30, 2023, respectively | | 1.3 | | | 1.3 | |
| Paid-in capital | | 45.3 | | | 48.0 | |
| Retained earnings | | 0.4 | | | 140.7 | |
| | | | |
| | | | |
| Accumulated other comprehensive income | | 13.1 | | | 13.2 | |
| Stockholders' equity | | 60.1 | | | 203.2 | |
| Total liabilities and stockholders’ equity | | $ | 2,763.0 | | | $ | 2,889.9 | |
| | | | |
|
| | | | | | | |
| (In millions except per share amounts - unaudited) | December 31
2017 | | September 30
2017 |
| Assets | | | |
| Current assets | | | |
| Cash and cash equivalents | $ | 115 |
| | $ | 201 |
|
| Accounts receivable, net | 418 |
| | 385 |
|
| Inventories, net | 170 |
| | 175 |
|
| Other current assets | 32 |
| | 29 |
|
| Total current assets | 735 |
| | 790 |
|
| Noncurrent assets | | | |
| Property, plant and equipment, net | 384 |
| | 391 |
|
| Goodwill and intangibles, net | 393 |
| | 335 |
|
| Equity method investments | 33 |
| | 30 |
|
| Deferred income taxes | 196 |
| | 281 |
|
| Other noncurrent assets | 86 |
| | 88 |
|
| Total noncurrent assets | 1,092 |
| | 1,125 |
|
| Total assets | $ | 1,827 |
| | $ | 1,915 |
|
| | | | |
| Liabilities and Stockholders’ Deficit | | | |
| Current liabilities | | | |
| Short-term debt | $ | — |
| | $ | 75 |
|
| Current portion of long-term debt | 19 |
| | 15 |
|
| Trade and other payables | 141 |
| | 192 |
|
| Accrued expenses and other liabilities | 208 |
| | 196 |
|
| Total current liabilities | 368 |
| | 478 |
|
| Noncurrent liabilities | | | |
| Long-term debt | 1,147 |
| | 1,034 |
|
| Employee benefit obligations | 331 |
| | 342 |
|
| Other noncurrent liabilities | 175 |
| | 178 |
|
| Total noncurrent liabilities | 1,653 |
| | 1,554 |
|
| Commitments and contingencies |
| |
|
Stockholders’ deficit | | | |
| Preferred stock, no par value, 40 shares authorized; no shares issued and outstanding | — |
| | — |
|
| Common stock, par value $0.01 per share, 400 shares authorized; 201 and 203 shares issued and outstanding at December 31, 2017 and September 30, 2017 | 2 |
| | 2 |
|
| Paid-in capital | — |
| | 5 |
|
| Retained deficit | (238 | ) | | (167 | ) |
| Accumulated other comprehensive income | 42 |
| | 43 |
|
| Total stockholders’ deficit | (194 | ) | | (117 | ) |
Total liabilities and stockholders’ deficit | $ | 1,827 |
| | $ | 1,915 |
|
| | | | |
SeeThe accompanying Notes to Condensed Consolidated Financial Statements are an integral part of these Condensed Consolidated Financial Statements.
Valvoline Inc. and Consolidated Subsidiaries
Condensed Consolidated Statements of Cash Flows | | | | | | | | | | | | | | |
| | Six months ended
March 31 |
| (In millions - unaudited) | | 2024 | | 2023 |
| Cash flows from operating activities | | | | |
| Net income | | $ | 73.3 | | | $ | 1,309.2 | |
| Adjustments to reconcile net income to cash flows from operating activities: | | | | |
| Loss (income) from discontinued operations | | 3.9 | | | (1,249.3) | |
| | | | |
| Depreciation and amortization | | 50.2 | | | 39.1 | |
| | | | |
| Deferred income taxes | | — | | | (26.6) | |
| | | | |
| | | | |
| | | | |
| | | | |
| | | | |
| Stock-based compensation expense | | 4.9 | | | 5.4 | |
| Other, net | | 1.4 | | | 2.3 | |
| Change in operating assets and liabilities | | | | |
| Receivables | | (23.1) | | | 4.8 | |
| Inventories | | (4.7) | | | (3.7) | |
| Payables and accrued liabilities | | 4.2 | | | 68.5 | |
| Other assets and liabilities | | (18.0) | | | 23.8 | |
| Operating cash flows from continuing operations | | 92.1 | | | 173.5 | |
| Operating cash flows from discontinued operations | | (3.9) | | | (63.4) | |
| Total cash provided by operating activities | | 88.2 | | | 110.1 | |
| Cash flows from investing activities | | | | |
| Additions to property, plant and equipment | | (87.2) | | | (79.4) | |
| | | | |
| Acquisitions of businesses | | (21.3) | | | (18.9) | |
| | | | |
| | | | |
| | | | |
| Proceeds from maturities of short-term investments | | 350.0 | | | — | |
| Other investing activities, net | | (10.9) | | | 2.0 | |
| Investing cash flows from continuing operations | | 230.6 | | | (96.3) | |
| Investing cash flows from discontinued operations | | — | | | 2,623.2 | |
| Total cash provided by investing activities | | 230.6 | | | 2,526.9 | |
| Cash flows from financing activities | | | | |
| Proceeds from borrowings | | — | | | 920.9 | |
| | | | |
| Repayments on borrowings | | (11.8) | | | (909.0) | |
| | | | |
| Repurchases of common stock | | (212.2) | | | (257.4) | |
| | | | |
| Cash dividends paid | | — | | | (21.8) | |
| Other financing activities | | (13.6) | | | (12.1) | |
| Financing cash flows from continuing operations | | (237.6) | | | (279.4) | |
| Financing cash flows from discontinued operations | | — | | | (108.1) | |
| Total cash used in financing activities | | (237.6) | | | (387.5) | |
| Effect of currency exchange rate changes on cash, cash equivalents and restricted cash | | 0.2 | | | 1.1 | |
| Increase in cash, cash equivalents and restricted cash | | 81.4 | | | 2,250.6 | |
| Cash, cash equivalents and restricted cash - beginning of period | | 413.1 | | | 83.9 | |
| Cash, cash equivalents and restricted cash - end of period | | $ | 494.5 | | | $ | 2,334.5 | |
| | | | |
|
| | | | | | | |
| | Three months ended
December 31 |
| (In millions - unaudited) | 2017 | | 2016 |
| Cash flows from operating activities | | | |
| Net (loss) income | $ | (10 | ) | | $ | 72 |
|
| Adjustments to reconcile net income (loss) to cash flows from operating activities | | | |
| Depreciation and amortization | 11 |
| | 9 |
|
| Debt issuance cost and discount amortization | 1 |
| | 1 |
|
| Deferred income taxes | 85 |
| | — |
|
| Equity income from affiliates | (5 | ) | | (4 | ) |
| Distributions from equity affiliates | 3 |
| | — |
|
| Pension contributions | (3 | ) | | (3 | ) |
| Gain on pension and other postretirement plan remeasurements | — |
| | (8 | ) |
| Stock-based compensation expense | 4 |
| | 1 |
|
Change in assets and liabilities (a) | | | |
| Accounts receivable | (34 | ) | | 10 |
|
| Inventories | 7 |
| | (2 | ) |
| Payables and accrued liabilities | (40 | ) | | 23 |
|
| Other assets and liabilities | 1 |
| | (11 | ) |
| Total cash provided by operating activities | 20 |
| | 88 |
|
| Cash flows from investing activities | | | |
| Additions to property, plant and equipment | (14 | ) | | (9 | ) |
| Acquisitions, net of cash acquired | (60 | ) | | — |
|
| Other investing activities, net | — |
| | (1 | ) |
| Total cash used in investing activities | (74 | ) | | (10 | ) |
| Cash flows from financing activities | | | |
| Net transfers to Ashland | — |
| | (2 | ) |
| Proceeds from borrowings, net of issuance costs | 44 |
| | 75 |
|
| Repayments on borrowings | (4 | ) | | (79 | ) |
| Repurchase of common stock | (37 | ) | | — |
|
| Purchase of additional ownership in subsidiary | (15 | ) | | — |
|
| Cash dividends paid | (15 | ) | | (10 | ) |
| Other financing activities | (4 | ) | | — |
|
| Total cash used in financing activities | (31 | ) | | (16 | ) |
| Effect of currency exchange rate changes on cash and cash equivalents | (1 | ) | | 2 |
|
| (Decrease) increase in cash and cash equivalents | (86 | ) | | 64 |
|
| Cash and cash equivalents - beginning of period | 201 |
| | 172 |
|
| Cash and cash equivalents - end of period | $ | 115 |
| | $ | 236 |
|
| | | | |
(a) Excludes changes resulting from operations acquired or sold.
SeeThe accompanying Notes to Condensed Consolidated Financial Statements are an integral part of these Condensed Consolidated Financial Statements.
Valvoline Inc. and Consolidated Subsidiaries
Condensed Consolidated Statements of Stockholders' Equity
| | | | | | | | | | | | | | | | | | | | | | | | | | | | | | | | | | | | | | |
| | Six months ended March 31, 2024 |
| (In millions, except per share amounts - unaudited) | | Common stock | | Paid-in capital | | Retained earnings (deficit) | | Accumulated other comprehensive income | | Totals |
| Shares | | Amount |
| Balance at September 30, 2023 | | 134.8 | | | $ | 1.3 | | | $ | 48.0 | | | $ | 140.7 | | | $ | 13.2 | | | $ | 203.2 | |
| Net income | | — | | | — | | | — | | | 31.9 | | | — | | | 31.9 | |
| | | | | | | | | | | | |
| Stock-based compensation, net of issuances | | 0.2 | | | — | | | (1.7) | | | — | | | — | | | (1.7) | |
| Repurchases of common stock | | (5.4) | | | — | | | — | | | (172.8) | | | — | | | (172.8) | |
| Other comprehensive income, net of tax | | — | | | — | | | — | | | — | | | 4.2 | | | 4.2 | |
| Balance at December 31, 2023 | | 129.6 | | | $ | 1.3 | | | $ | 46.3 | | | $ | (0.2) | | | $ | 17.4 | | | $ | 64.8 | |
| Net income | | — | | | — | | | — | | | 41.4 | | | — | | | 41.4 | |
| | | | | | | | | | | | |
| Stock-based compensation, net of issuances | | 0.2 | | | — | | | (1.0) | | | — | | | — | | | (1.0) | |
| Repurchases of common stock | | (1.0) | | | — | | | — | | | (40.8) | | | — | | | (40.8) | |
| Other comprehensive loss, net of tax | | — | | | — | | | — | | | — | | | (4.3) | | | (4.3) | |
| Balance at March 31, 2024 | | 128.8 | | | $ | 1.3 | | | $ | 45.3 | | | $ | 0.4 | | | $ | 13.1 | | | $ | 60.1 | |
| | | | | | | | | | | | |
| | | | | | | | | | | | |
| | | | | | | | | | | | |
| | | | | | | | | | | | |
| | | | | | | | | | | | |
| | | | | | | | | | | | |
| | | | | | | | | | | | |
| | | | | | | | | | | | |
| | | | | | | | | | | | |
| | | | | | | | | | | | |
| | | | | | | | | | | | |
| | | | | | | | | | | | |
| | | | | | | | | | | | |
| | | | | | | | | | | | |
| | | | | | | | | | | | |
| | | | | | | | | | | | |
| | | | | | | | | | | | |
| | | | | | | | | | | | |
| | | | | | | | | | | | |
| | | | | | | | | | | | |
| | | | | | | | | | | | |
| | | | | | | | | | | | |
| | | | | | | | | | | | |
| | | | | | | | | | | | |
| | | | | | | | | | | | |
| | | | | | | | | | | | |
| | | | | | | | | | | | |
| | | | | | | | | | | | |
| | | | | | | | | | | | |
| | | | | | | | | | | | |
| | | | | | | | | | | | |
| | Six months ended March 31, 2023 |
| (In millions, except per share amounts - unaudited) | | Common stock | | Paid-in capital | | Retained earnings | | Accumulated other comprehensive (loss) income | | Totals |
| Shares | | Amount |
| Balance at September 30, 2022 | | 176.1 | | | $ | 1.8 | | | $ | 44.1 | | | $ | 282.0 | | | $ | (21.3) | | | $ | 306.6 | |
| Net income | | — | | | — | | | — | | | 81.9 | | | — | | | 81.9 | |
| Dividends paid, $0.125 per common share | | — | | | — | | | 0.1 | | | (21.9) | | | — | | | (21.8) | |
| Stock-based compensation, net of issuances | | 0.3 | | | — | | | (3.4) | | | — | | | — | | | (3.4) | |
| Repurchases of common stock | | (2.9) | | | (0.1) | | | — | | | (87.4) | | | — | | | (87.5) | |
| | | | | | | | | | | | |
| Other comprehensive income, net of tax | | — | | | — | | | — | | | — | | | 13.5 | | | 13.5 | |
| Balance at December 31, 2022 | | 173.5 | | | $ | 1.7 | | | $ | 40.8 | | | $ | 254.6 | | | $ | (7.8) | | | $ | 289.3 | |
| Net income | | — | | | — | | | — | | | 1,227.3 | | | — | | | 1,227.3 | |
| | | | | | | | | | | | |
| Stock-based compensation, net of issuances | | 0.1 | | | — | | | 1.8 | | | — | | | — | | | 1.8 | |
| Repurchases of common stock | | (4.9) | | | — | | | — | | | (171.7) | | | — | | | (171.7) | |
| Other comprehensive income, net of tax | | — | | | — | | | — | | | — | | | 25.7 | | | 25.7 | |
| Balance at March 31, 2023 | | 168.7 | | | $ | 1.7 | | | $ | 42.6 | | | $ | 1,310.2 | | | $ | 17.9 | | | $ | 1,372.4 | |
| | | | | | | | | | | | |
| | | | | | | | | | | | |
| | | | | | | | | | | | |
| | | | | | | | | | | | |
| | | | | | | | | | | | |
| | | | | | | | | | | | |
| | | | | | | | | | | | |
The accompanying Notes to Condensed Consolidated Financial Statements are an integral part of these Condensed Consolidated Financial Statements.
| | | | | |
Index to Notes to Condensed Consolidated Financial Statements | Page |
| |
| |
| |
| |
| |
| |
| |
| |
| |
| |
| |
| |
Valvoline Inc. and Consolidated Subsidiaries
Notes to Condensed Consolidated Financial Statements (Unaudited)
NOTE 1 – BASIS OF PRESENTATION AND SIGNIFICANT ACCOUNTING POLICIES
The accompanying unaudited condensed consolidated financial statements have been prepared by Valvoline Inc. (“Valvoline” or the “Company”) in accordance with accounting principles generally accepted in the United States of America (“U.S. GAAP”) and Securities and Exchange Commission (“SEC”) regulations for interim financial reporting, which do not include all information and footnote disclosures normally included in annual financial statements. Therefore, these condensed consolidated financial statements should be read in conjunction with Valvoline’s Annual Report on Form 10-K for the fiscal year ended September 30, 2017. 2023.
Use of estimates, risks and uncertainties
The preparation of the condensed consolidated financial statements in conformity with U.S. GAAP requires management to make use of estimates and assumptionsjudgments that affect the reported amounts of assets, liabilities, revenues and disclosures. Actual results may vary from these estimates. In the opinion of management, all adjustments considered necessary for a fair presentation have been included herein,expenses, and the disclosures of contingent matters. Although management bases its estimates on historical experience and various other assumptions underlyingthat are believed to be reasonable under the circumstances, actual results could differ significantly from the estimates under different assumptions or conditions.
Sale of Global Products business
On March 1, 2023, Valvoline completed the sale of its former Global Products reportable segment (“Global Products”) to Aramco Overseas Company B.V. (the “Transaction”). The operating results and cash flows associated with and directly attributed to the Global Products disposal group are reflected as discontinued operations within these condensed consolidated financial statementsstatements.Refer to Note 2 for additional information regarding the Global Products business, including income from discontinued operations. Unless otherwise noted, disclosures within these interim periods are reasonable. The results forremaining Notes to Condensed Consolidated Financial Statements relate solely to the interim periods are not necessarily indicative of results to be expected for the entire year.Company's continuing operations.
Recent accounting pronouncements
A description of new U.S. GAAPThe following accounting standards issued and adopted during the current year is required in interim financial reporting. A detailed listing of recent accounting standardsguidance relevant to Valvoline is included in the Annual Report on Form 10-K for the fiscal year ended September 30, 2017. The following standards relevant to Valvoline werewas either issued or adopted in the current period,fiscal year or areis expected to have a meaningful impact on Valvoline in future periods.periods upon adoption.
RecentlyIssued but not yet adopted
In the first fiscal quarter of 2018, Valvoline adopted the following:
In July 2015,November 2023, the Financial Accounting Standards Board (“FASB”) issued accounting guidance that enhances reportable segment disclosures by requiring disclosure of significant reportable segment expenses and other items regularly provided to simplify the subsequent measurement of certain inventories by replacing the current lower of cost or market test with a lower of cost or net realizable value test. The guidance applies only to inventories for which cost is determined by methods other than last-in, first outChief Operating Decision Maker (“LIFO”CODM”) and retail inventory methods.included within measures of a segment’s profit or loss, inclusive of entities that operate in a single reportable segment. This guidance must be applied retrospectively to all prior periods presented and will become effective for Valvoline adoptedbeginning with its fiscal 2025 annual financial statements and interim periods starting in fiscal 2026, with early adoption permitted. Valvoline is currently evaluating the impact this guidance prospectivelywill have on October 1, 2017. Valvoline utilizes LIFO to value approximately 70% ofthe Company and expects adoption will require enhanced disclosures regarding its gross inventoryCODM and there were no material differencesthe information used in the Company's previous valuation methodology for its remaining inventory using lower of cost or market to lower of cost or net realizable value.assessing performance and allocating resources, including significant expenses.
In March 2017,December 2023, the FASB issued accounting guidance which enhances income tax disclosure requirements to include additional disaggregation within the effective tax rate reconciliation and income taxes paid. This guidance will be effective for Valvoline beginning with its fiscal 2026 annual financial statements, with early adoption permitted. The guidance must be applied prospectively, while retrospective application is permitted. The Company is currently assessing the impact of adoption, which is expected to result in enhanced income tax disclosures.
NOTE 2 - DISCONTINUED OPERATIONS
Sale of Global Products
Financial results
On March 1, 2023, Valvoline completed the sale of Global Products for a cash purchase price of $2.650 billion and recognized a pre-tax gain on the sale within Income from discontinued operations, net of tax, during the second quarter of fiscal 2023, coinciding with the completion of the sale. The Transaction was subject to customary closing settlements that changed how employers who sponsor defined benefit pension and/or postretirement benefit plans present the net periodic benefit costwere finalized in the Condensed Consolidated Statementsthird quarter of Comprehensive Income. This guidance requires employers to present the service cost component of net periodic benefit cost fiscal 2023 and resulted in the same caption as other employee compensation costs from services renderedrecognition of a pre-tax gain on sale of $1.572 billion during the period. All other components of the net periodic benefit cost are presented separately outside of the operating income caption. Valvoline retrospectively adopted this guidance on October 1, 2017. Accordingly, Net pension and other postretirement plan non-service income and remeasurement adjustments has been reclassified to non-operating income for all periods presentedfiscal year ended September 30, 2023.
The following table summarizes Income from discontinued operations within the Condensed ConsolidatedStatements of Comprehensive Income:
| | | | | | | | | | | | | | | | | | | | | | | | | | |
| | Three months ended
March 31 | | Six months ended
March 31 |
| (In millions) | | 2024 | | 2023 | | 2024 | | 2023 |
| Net revenues | | $ | — | | | $ | 468.6 | | | $ | — | | | $ | 1,174.4 | |
| Cost of sales | | — | | | 367.6 | | | — | | | 924.2 | |
| Gross profit | — | | | 101.0 | | | — | | | 250.2 | |
| | | | | | | | |
| Selling, general and administrative expenses | | — | | | 52.7 | | | — | | | 125.0 | |
| Net legacy and separation-related expenses | | 2.6 | | | 14.4 | | | 4.9 | | | 20.6 | |
| Equity and other income, net | | — | | | (5.0) | | | — | | | (14.2) | |
| Operating (loss) income from discontinued operations | (2.6) | | | 38.9 | | | (4.9) | | | 118.8 | |
| Net pension and other postretirement plan expense | | — | | | — | | | — | | | 0.1 | |
| Net interest and other financing expenses | | — | | | 2.7 | | | — | | | 5.0 | |
Gain on sale of discontinued operations (a) | | — | | | (1,570.8) | | | — | | | (1,570.8) | |
| (Loss) income before income taxes - discontinued operations | (2.6) | | | 1,607.0 | | | (4.9) | | | 1,684.5 | |
Income tax (benefit) expense (b) | | (0.7) | | | 412.6 | | | (1.0) | | | 435.2 | |
| (Loss) income from discontinued operations, net of tax | $ | (1.9) | | | $ | 1,194.4 | | | $ | (3.9) | | | $ | 1,249.3 | |
| | | | | | | | |
(a)The gain on sale recorded in the three months ended March 31, 2023 includes the release of Accumulated other comprehensive income of $30.7 million associated with the realization of cumulative translation losses attributed to the Global Products business.
(b)Income tax expense in the three and six months ended March 31, 2023 includes the tax effects of the gain on sale of $420.2 million comprised of current and deferred expense of $327.6 million and $92.6 million, respectively.
Post-closing arrangements
Valvoline sources substantially all lubricant and certain ancillary products for its stores through a long-term supply agreement with Global Products. Net revenues within the results of Global Products above include product sales to the Company's continuing operations prior to the closing of the Transaction, which reduced previously reported operating income by $26were considered to be effectively settled and were not eliminated. These transactions totaled $34.6 million and $89.7 million for the three and six months ended DecemberMarch 31, 2016.
2023, respectively.
Issued but not yet adopted
In May 2014,Valvoline also entered into a Transition Services Agreement with Global Products, effective March 1, 2023, to provide and receive services including information technology (“IT”), legal, finance, and human resources support. Transition services have lapsed periodically as business process transitions have occurred since the FASB issued accounting guidance outlining a single comprehensive model for entities to use in accounting for revenue arising from contracts with customers, which supersedes most current revenue recognition guidance. This guidance introduces a five-step model for revenue recognition that focuses on transfer of control, as opposed to transfer of risksale, and rewards under current guidance. The Company is evaluating the effect of adopting the new revenue guidance on its
financial statements and does not currently expect it to have a material effect to net earnings. Based on an evaluation of current contracts and revenue streams to-date, Valvoline believes that most revenue transactions recorded under the new guidance will be substantially consistent with treatment under existing guidance, with certain reclassifications expected within the Condensed Consolidated Statements of Comprehensive Earnings and certain minimal changes to the timing of the recognition of revenues. The Company's revenue transactionsremaining services are generally consist of a single performance obligation to transfer promised goods and are not accounted for under industry-specific guidance. The Company anticipates expanded footnote disclosures under the new guidance.
Management will continue to complete its assessment of revenue streams and implementation plans, including monitoring developments, and plans to substantially complete the Company's implementation assessment in early 2018 and finalize conclusions by the fourth quarter of fiscal 2018. Valvoline will adopt this standard in the first quarter of fiscal 2019 and will provide updated disclosures of the anticipated impacts of adoption in future filings.
In February 2016, the FASB issued new accounting guidance related to lease transactions. The primary objective of this guidance is to increase transparency and comparability among organizations by requiring lessees to recognize assets and liabilities on the balance sheet for the rights and obligations created by leases and to disclose key information about leasing arrangements. The Company expects to adopt the new guidance in the first quarter of fiscal 2020 using the modified retrospective method. While adoption is expected to lead to aconclude within 18 months post-closing with limited IT transition services that may extend through early calendar year 2025. The income and costs associated with these services were not material increase induring the assetsthree and liabilities recorded on the Condensed Consolidated Balance Sheet and an increase in footnote disclosures related to leases, the Company is in the process of developing assessment and implementation plans to determine the specific impacts, including those on the Condensed Consolidated Statements of Comprehensive Earnings.six months ended March 31, 2024.
NOTE 23 - FAIR VALUE MEASUREMENTS
Recurring fair value measurements
The following table setstables set forth the Company’s financial assets and liabilities by level within the fair value hierarchy the Company's financial assets and liabilities that were accounted for those measured at fair value on a recurring basis:
|
| | | | | | | | | | | | | | | |
| | December 31, 2017 | | September 30, 2017 |
| | | | Quoted prices in active markets for identical assets | | | | Quoted prices in active markets for identical assets |
| (In millions) | Fair Value | | Level 1 | | Fair Value | | Level 1 |
| Assets | | | | | | | |
Cash equivalents (a) | $ | 24 |
| | $ | 24 |
| | $ | 46 |
| | $ | 46 |
|
Foreign currency derivatives (b) | 1 |
| | 1 |
| | 1 |
| | 1 |
|
Non-qualified trust funds (c) | 30 |
| | 30 |
| | 30 |
| | 30 |
|
| Total assets at fair value | $ | 55 |
| | $ | 55 |
| | $ | 77 |
| | $ | 77 |
|
| | | | | | | | |
| Liabilities | | | | | | | |
Foreign currency derivatives (d) | $ | 1 |
| | $ | 1 |
| | $ | 1 |
| | $ | 1 |
|
| Total liabilities at fair value | $ | 1 |
| | $ | 1 |
| | $ | 1 |
| | $ | 1 |
|
| | | | | | | | |
(a) Included in Cash and cash equivalents in the Condensed Consolidated Balance Sheets. | |
(b) | Included in Other current assets in the Condensed Consolidated Balance Sheets.
|
| |
(c) | As of December 31, 2017, $2 million of this balance is included in Other current assets, with the remainder included in Other noncurrent assets in the Condensed Consolidated Balance Sheets. As of September 30, 2017, this balance is included in Other noncurrent assets in the Condensed Consolidated Balance Sheets.
|
| |
(d) | Included in Accrued expense and other liabilities in the Condensed Consolidated Balance Sheets.
|
| | | | | | | | | | | | | | | | | | | | | | | | | | | | | | | | |
| | As of March 31, 2024 |
| (In millions) | | Total | | Level 1 | | Level 2 | | Level 3 | | NAV (a) |
| Cash and cash equivalents | | | | | | | | | | |
| Money market funds | | $ | 360.0 | | | $ | 360.0 | | | $ | — | | | $ | — | | | $ | — | |
| Time deposits | | 2.3 | | | — | | | 2.3 | | | — | | | — | |
| | | | | | | | | | |
| Prepaid expenses and other current assets | | | | | | | | | | |
| | | | | | | | | | |
| Interest rate swap agreements | | 3.3 | | | — | | | 3.3 | | | — | | | — | |
| Other noncurrent assets | | | | | | | | | | |
| Non-qualified trust funds | | 1.8 | | | — | | | — | | | — | | | 1.8 | |
| | | | | | | | | | |
| Deferred compensation investments | | 21.6 | | | 21.6 | | | — | | | — | | | — | |
| Total assets at fair value | | $ | 389.0 | | | $ | 381.6 | | | $ | 5.6 | | | $ | — | | | $ | 1.8 | |
| | | | | | | | | | |
| | | | | | | | | | |
| | | | | | | | | | |
| | | | | | | | | | |
| Other noncurrent liabilities | | | | | | | | | | |
| Deferred compensation obligations | | $ | 21.8 | | | $ | — | | | $ | — | | | $ | — | | | $ | 21.8 | |
| Total liabilities at fair value | | $ | 21.8 | | | $ | — | | | $ | — | | | $ | — | | | $ | 21.8 | |
There were no Level 2 or 3 financial assets or liabilities that were accounted for at fair value on a recurring basis as of December 31, 2017 or September 30, 2017. Additionally, there were no transfers between levels of the fair value hierarchy during the three months ending December 31, 2017 or 2016. | | | | | | | | | | | | | | | | | | | | | | | | | | | | | | | | |
| | As of September 30, 2023 |
| (In millions) | | Total | | Level 1 | | Level 2 | | Level 3 | | NAV (a) |
| Cash and cash equivalents | | | | | | | | | | |
| Money market funds | | $ | 0.6 | | | $ | 0.6 | | | $ | — | | | $ | — | | | $ | — | |
| Time deposits | | 277.3 | | | — | | | 277.3 | | | — | | | — | |
| Prepaid expenses and other current assets | | | | | | | | | | |
Currency derivatives (b) | | 0.1 | | | — | | | 0.1 | | | — | | | — | |
| Interest rate swap agreements | | 7.8 | | | — | | | 7.8 | | | — | | | — | |
| Other noncurrent assets | | | | | | | | | | |
| Non-qualified trust funds | | 2.1 | | | — | | | — | | | — | | | 2.1 | |
| | | | | | | | | | |
| Deferred compensation investments | | 19.0 | | | 19.0 | | | — | | | — | | | — | |
| Total assets at fair value | | $ | 306.9 | | | $ | 19.6 | | | $ | 285.2 | | | $ | — | | | $ | 2.1 | |
| | | | | | | | | | |
| Accrued expenses and other liabilities | | | | | | | | | | |
Currency derivatives (b) | | $ | 0.1 | | | $ | — | | | $ | 0.1 | | | $ | — | | | $ | — | |
| | | | | | | | | | |
| Other noncurrent liabilities | | | | | | | | | | |
| Deferred compensation obligations | | 20.8 | | | — | | | — | | | — | | | 20.8 | |
| Total liabilities at fair value | | $ | 20.9 | | | $ | — | | | $ | 0.1 | | | $ | — | | | $ | 20.8 | |
| | | | | | | | | | |
Cash equivalents
A portion of the Company's excess cash is held in highly liquid investments with maturities of three months or less. Cash equivalents generate interest income and are(a)Funds measured at fair value using prevailing market rates.
Derivatives
The Company uses derivativesthe net asset value ("NAV") per share practical expedient have not designated as hedging instruments consisting primarily of forward contracts to hedge foreign currency denominated balance sheet exposures and exchange one foreign currency for another for a fixed rate at a future date of twelve months or less. Gains and losses recognized for changesbeen classified in the fair value of these instruments were not material during the three months ended December 31, 2017 and 2016 and are included in Selling, general and administrative expense in the Condensed Consolidated Statements of Comprehensive Income to offset the gain or loss on the hedged item in the same period as the remeasurement losses and gains of the related foreign currency-denominated exposures. hierarchy.
(b)The Company had outstanding contracts with highly-rated financial institutions with notional values of $43 million and $47$29.7 million as of December 31, 2017 and September 30, 2017, respectively.2023.
Non-qualified trust funds
The Company maintains a non-qualified trust to fund benefit payments for certain of its U.S. non-qualified pension plans, which primarily consists of highly liquid fixed income U.S. government bonds. Gains and losses related to these investments are immediately recognized within Selling, general and administrative expense in the Condensed Consolidated Statements of Comprehensive Income.Fair value disclosures
Long-term debt
The Company's outstanding fixed rate senior notes consist of 5.500% senior unsecured notes due 2024 with an aggregate principal amount of $375 million issued in July 2016 (the “2024 Notes”)Company’s held-to-maturity U.S. treasury securities and 4.375% senior unsecured notes due 2025 with an aggregate principal amount of $400 million issued in August 2017 (the “2025 Notes” and together with the 2024 Notes, “Senior Notes”).
The fair values shown in the table belowlong-term debt are based on the prices at which the bonds have recently traded in the market as well as the overall market conditions on the date of valuation, stated coupon rates, the number of coupon payments each year and the maturity dates. Long-term debt is includedreported in the Condensed Consolidated Balance Sheets at carrying value, rather than fair value, and isare therefore excluded from the disclosure above of financial assets and liabilities measured at fair value table above. within the condensed consolidated financial statements on a recurring basis. The following disclosures summarize the fair value of these assets and liabilities at each relevant balance sheet date.
U.S. treasury securities
The fair values of the Company’s U.S. treasury securities summarized below were determined utilizing quoted prices for identical securities from less active markets, which are considered Level 2 inputs within the fair value hierarchy. The U.S. treasury securities were fully matured as of March 31, 2024.
| | | | | | | | | | | | | | | | | | | | | | | | |
| | | | September 30, 2023 |
| (In millions) | | | | | | | | Amortized cost | | Gross unrealized losses | | Fair value |
| Cash and cash equivalents | | | | | | | | | | | | |
U.S. treasury securities (a) | | | | | | | | $ | 2.2 | | | $ | — | | | $ | 2.2 | |
| Short-term investments | | | | | | | | | | | | |
U.S. treasury securities (b) | | | | | | | | $ | 347.5 | | | $ | (0.5) | | | $ | 347.0 | |
| | | | | | | | | | | | |
(a)U.S. treasury securities with original maturity dates of three months or less.
(b)U.S. treasury securities with original maturities greater than three months and less than 12 months.
Debt
The fair values of the Company's outstanding fixed rate senior notes shown below are based on recent trading values, which are considered Level 2 inputs within the fair value hierarchy.
| | | | | | | | | | | | | | | | | | | | | | | | | | | | | | | | | | | | | | |
| | March 31, 2024 | | September 30, 2023 |
| (In millions) | | Fair value | | Carrying value (a) | | Unamortized
discounts and
issuance costs | | Fair value | | Carrying value (a) | | Unamortized
discounts and
issuance costs |
2030 Notes (b) | | $ | 599.5 | | | $ | 594.9 | | | $ | (5.1) | | | $ | 589.8 | | | $ | 594.5 | | | $ | (5.5) | |
| 2031 Notes | | 461.2 | | | 530.1 | | | (4.9) | | | 416.6 | | | 529.9 | | | (5.2) | |
| Total | | $ | 1,060.7 | | | $ | 1,125.0 | | | $ | (10.0) | | | $ | 1,006.4 | | | $ | 1,124.4 | | | $ | (10.7) | |
| | | | | | | | | | | | |
(a)Carrying values shown in the following table are net of unamortized discounts and debt issuance costs.
(b)The 2030 Notes were reported in Current portion of long-term debt within the Condensed Consolidated Balance Sheet as of March 31, 2024 due to the execution of the Tender Offer in April 2024 as further described in Note 5. |
| | | | | | | | | | | | | | | | | | | | | | | |
| | December 31, 2017 | | September 30, 2017 |
| (In millions) | Fair value | | Carrying value | | Unamortized discount and issuance costs | | Fair value | | Carrying value | | Unamortized discount and issuance costs |
| 2024 Notes | $ | 399 |
| | $ | 370 |
| | $ | 5 |
| | $ | 401 |
| | $ | 370 |
| | $ | 5 |
|
| 2025 Notes | 404 |
| | 395 |
| | 5 |
| | 408 |
| | 394 |
| | 6 |
|
| Total | $ | 803 |
| | $ | 765 |
| | $ | 10 |
| | $ | 809 |
| | $ | 764 |
| | $ | 11 |
|
Refer to Note 75 for more information on the Senior Notes anddetails of these senior notes as well as Valvoline's other debt instruments that have variable interest rates and accordingly, theirwith carrying amounts that approximate fair value.
NOTE 4 - BUSINESS COMBINATIONS
The Company acquired fifteen service center stores in single and multi-store transactions for an aggregate purchase price of $21.3 million during the six months ended March 31, 2024. These acquisitions expand Valvoline's retail presence in key North American markets, increase the number of company-operated service center stores, and contribute to growing the retail footprint to 1,928 system-wide service center stores.
During the six months ended March 31, 2023, the Company acquired 13 service center stores in single and multi-store transactions for an aggregate purchase price of $18.9 million.
NOTE 3 - ACQUISITIONS
Henley Bluewater acquisition
On October 2, 2017, the Company completed the acquisition of 56 Quick Lubes franchise service centers from Henley Bluewater LLCThe Company’s acquisitions are accounted for $60 million. These stores build on the infrastructure and talent baseas business combinations. A summary follows of the existing Company-owned operationsaggregate cash consideration paid and the total assets acquired and liabilities assumed for the six months ended March 31:
| | | | | | | | | | | | | | |
| (In millions) | | 2024 | | 2023 |
| | | | |
| | | | |
| Inventories | | $ | — | | | $ | 0.3 | |
| | | | |
Property, plant and equipment (a) | | 4.0 | | | 3.5 | |
| Operating lease assets | | 6.5 | | | 4.0 | |
Goodwill (b) | | 20.3 | | | 15.1 | |
Intangible assets (c) | | | | |
Reacquired franchise rights (d) | | — | | | 2.3 | |
| | | | |
| | | | |
| Other | | 0.1 | | | 0.1 | |
| | | | |
| | | | |
Other current liabilities (a) | | (0.4) | | | (0.4) | |
| Operating lease liabilities | | — | | | (3.7) | |
Other noncurrent liabilities (a) | | (9.2) | | | (2.3) | |
| Total net assets acquired | | $ | 21.3 | | | $ | 18.9 | |
| | | | |
| | | | |
| | | | |
| | | | |
| | | | |
| | | | |
(a)Includes finance lease assets in northern Ohioproperty, plant and adds Company-owned locationsequipment and finance lease liabilities in Michigan.other current and noncurrent liabilities. During the six months ended March 31, 2024, finance lease assets acquired were $3.1 million and finance lease liabilities of $0.1 million and $3.0 million in other current and noncurrent liabilities, respectively. During the six months ended March 31, 2023, finance lease assets acquired were $2.4 million and finance lease liabilities of $0.1 million and $2.3 million in other current and noncurrent liabilities.
(b)Goodwill is generally expected to be deductible for income tax purposes and is primarily attributed to the operational synergies and potential growth expected to result in economic benefits in the respective markets of the acquisitions.
(c)Intangible assets acquired during the six months ended March 31, 2024 and 2023 have weighted average amortization periods of five and nine years, respectively.
(d)Prior to the acquisition Valvolineof former franchise service center stores, the Company licensed the right to operate quick lubefranchised service centers, including the use of the Company'sValvoline's trademarks and trade name, to the franchisee whose assets were acquired.name. In connection with the acquisition,these acquisitions, Valvoline reacquired those rights and recognized a separate definite-lived reacquired franchise rights intangible assetassets, which was assigned a preliminary fair value of $22 million that will beare being amortized on a straight-line basis over the weighted average remaining term of approximately eight years.ten years for the rights reacquired in fiscal 2023. The effective settlement of these arrangements resulted in no settlement gain or loss as the contractual terms were at market. There have been no franchise rights reacquired during fiscal 2024.
The fair values above are preliminary for up to one year from the date of acquisition resulted in $36 million of goodwillas they may be subject to measurement period adjustments if new information is obtained about facts and the remaindercircumstances that existed as of the acquisition date. The Company does not currently expect any material changes to the preliminary purchase price was allocated to working capital and property, plant and equipment. Goodwill is primarily attributed toallocations for acquisitions completed during the potential growth of the business in the northern Ohio and Michigan markets, has been allocated to the Company's Quick Lubes reportable segment, and is expected to be deductible for income tax purposes.last twelve months.
Remaining ownership interest in subsidiary
Valvoline historically owned a 70% controlling interest and consolidated the financial results of its subsidiary in Thailand. In December 2017, Valvoline purchased the remaining 30% interest for total consideration of approximately $16 million, making it a wholly-owned subsidiary of the Company. This interest was not material to the current or prior period financial statements for presentation and disclosure as a noncontrolling interest, which was eliminated as a result of this purchase through a net charge to Paid-in capital and Retained deficit.
NOTE 4 - ACCOUNTS RECEIVABLE
The following summarizes Valvoline’s accounts receivable:
|
| | | | | | | |
| (In millions) | December 31
2017 | | September 30
2017 |
| Trade and other accounts receivable | $ | 424 |
| | $ | 390 |
|
| Less: Allowance for doubtful accounts | (6 | ) | | (5 | ) |
| | $ | 418 |
| | $ | 385 |
|
Prior to May 2017 when Valvoline's former parent company, Ashland Global Holdings Inc. (which together with its predecessors and consolidated subsidiaries is referred to as “Ashland”), distributed its net investment in Valvoline (the “Distribution”), Ashland was party to an agreement to sell certain Valvoline customer accounts receivable in the form of drafts or bills of exchange to a financial institution. Each draft constituted an order to pay for obligations of the customer to Ashland arising from the sale of goods to the customer. The intention of the arrangement was to decrease the time accounts receivable was outstanding and increase cash flows as Ashland in turn remitted payment to Valvoline. During the three months ended December 31, 2016, $11 million of accounts receivable were sold to the financial institution under this agreement.
Following the Distribution, Valvoline became party to the arrangement to sell certain customer accounts receivable in the form of draft or bills of exchange to the financial institution. During the three months ended December 31, 2017, Valvoline did not sell accounts receivable to the financial institution.
NOTE 5 - INVENTORIESDEBT
Certain lubricants are valued at the lower of cost or market using the last-in, first-out (“LIFO”) method. Remaining inventories are carried at the lower of cost or net realizable value using the weighted average cost method.
The following summarizes Valvoline’s inventories:
|
| | | | | | | |
| (In millions) | December 31
2017 | | September 30
2017 |
| Finished products | $ | 178 |
| | $ | 180 |
|
| Raw materials, supplies and work in process | 28 |
| | 31 |
|
| LIFO reserves | (33 | ) | | (33 | ) |
| Obsolete inventory reserves | (3 | ) | | (3 | ) |
| | $ | 170 |
| | $ | 175 |
|
NOTE 6 - GOODWILL AND OTHER INTANGIBLES
Goodwill
The following table summarizes the changes in the carrying amount of goodwill by reportable segment and in total during the three months ended December 31, 2017.
|
| | | | | | | | | | | | | | | |
| (In millions) | Core North America | | Quick Lubes | | International | | Total |
| September 30, 2017 | $ | 89 |
| | $ | 201 |
| | $ | 40 |
| | $ | 330 |
|
Acquisitions (a) | — |
| | 30 |
| | — |
| | 30 |
|
| December 31, 2017 | $ | 89 |
| | $ | 231 |
| | $ | 40 |
| | $ | 360 |
|
| | | | | | | | |
(a) Relates to the acquisition of Henley Bluewater LLC during the three months ended December 31, 2017 and adjustments related to prior year acquisitions.
Other Intangible Assets
Valvoline's purchased intangible assets were specifically identified when acquired and have finite lives. Intangible assets were $37 million in gross carrying amount, net of $4 million in accumulated amortization as of December 31, 2017 and were reported in Goodwill and intangibles, net on the Condensed Consolidated Balance Sheet. Amortization expense recognized on intangible assets during the three months ended December 31, 2017 and 2016 was not material. Amortization expense expected in the next five fiscal years is as follows:
|
| | | | |
| (In millions) | | |
| Years ending September 30 (estimated) | | |
| 2018 | | $ | 5 |
|
| 2019 | | $ | 5 |
|
| 2020 | | $ | 5 |
|
| 2021 | | $ | 4 |
|
| 2022 | | $ | 4 |
|
| | | |
NOTE 7 - DEBT OBLIGATIONS
The following table summarizes Valvoline’s short-term borrowings and long-term debt:total debt as of:
| | | | | | | | | | | | | | |
| (In millions) | | March 31
2024 | | September 30 2023 |
| 2031 Notes | | $ | 535.0 | | | $ | 535.0 | |
| 2030 Notes | | 600.0 | | | 600.0 | |
| Term Loan | | 451.3 | | | 463.1 | |
Revolver (a) | | — | | | — | |
| | | | |
| | | | |
| | | | |
| Debt issuance costs and discounts | | (11.2) | | | (12.0) | |
| Total debt | | 1,575.1 | | | 1,586.1 | |
| | | | |
| Current portion of long-term debt | | 623.8 | | | 23.8 | |
| Long-term debt | | $ | 951.3 | | | $ | 1,562.3 | |
| | | | | |
(a)As of March 31, 2024, the total borrowing capacity remaining under the $475.0 million revolving credit facility was $471.8 million due to a reduction of $3.2 million for letters of credit outstanding.
|
| | | | | | | | |
| (In millions) | December 31 2017 | | September 30 2017 |
| 2025 Notes | $ | 400 |
| | $ | 400 |
|
| 2024 Notes | 375 |
| | 375 |
|
| Term Loans | 281 |
| | 285 |
|
| Trade Receivables Facility | 120 |
| | 75 |
|
| Revolver | — |
| | — |
|
Other (a) | (10 | ) | | (11 | ) |
| Total debt | $ | 1,166 |
| | $ | 1,124 |
|
| Short-term debt | — |
| | 75 |
|
| Current portion of long-term debt | 19 |
| | 15 |
|
| Long-term debt | $ | 1,147 |
| | $ | 1,034 |
|
| | | | |
(a) At December 31, 2017, Other includes $12 million of debt issuance cost discounts and $2 million of debt acquired through acquisitions. At September 30, 2017, Other included $13 million of debt issuance cost discounts and $2 million of debt acquired through acquisitions.
Senior Notes
During August 2017, Valvoline completedOn March 14, 2024, the issuance of 4.375%Company commenced a tender offer (the “Tender Offer”) to purchase its outstanding 4.250% senior unsecured notes due 20252030 with an aggregate principal amount of $400 million.$600.0 million (the “2030 Notes”). The net proceeds fromTender Offer was made to comply with the offeringrequirements of the 2025asset sale covenant under the indenture governing the 2030 Notes was $394 million (after deducting initial purchasers' discounts and debt issuance costs), which were used to make a voluntary contribution toin connection with the Company's qualified U.S. pension plan.sale of Global Products.
During July 2016,On April 16, 2024, Valvoline completed the issuanceTender Offer with 99.7% of 5.500% senior unsecured notes due 2024 with an aggregatethe outstanding principal amount of $375 million. The net proceeds fromtendered by the offeringholders of the 2030 Notes. The Company used cash and cash equivalents on hand, in addition to borrowing $175.0 million on the Revolver to facilitate the $598.3 million purchase of the 2030 Notes at par, plus accrued and unpaid interest, and cancelled the 2030 Notes accepted for purchase. The Company elected to redeem the remaining balance outstanding of $1.7 million on April 29, 2024 pursuant to the terms and conditions of the indenture governing the 2030 Notes. Valvoline expects to recognize a loss on extinguishment of the 2030 Notes was $370of $5.1 million (after deducting initial purchasers’ discounts andduring the third quarter of fiscal 2024 due to the write-off of unamortized debt issuance costs), which were transferred to Valvoline's former parent, Ashland.
costs and discounts. The Senior2030 Notes are subject to customary eventsreported in Current portion of default for similarlong-term debt securities, which if triggered may accelerate paymentwithin the Condensed Consolidated Balance Sheet as of principal, premium, if any, and accrued but unpaid interest on the notes. Such events of default include non-payment of principal and interest, non-performance of covenants and obligations, default on other material debt, and bankruptcy or insolvency. If a change of control repurchase event occurs, Valvoline may be required to offer to purchase the Senior Notes from the holders thereof. The Senior Notes are not otherwise required to be repaid prior to maturity, although they may be redeemed at the option of Valvoline at any time prior to their maturity in the manner specified in the indentures governing the notes. The notes are guaranteed by each of Valvoline's subsidiaries that guarantee obligations under the existing senior secured credit facility described below.March 31, 2024.
In December 2017, Valvoline completed registered exchange offers for the Senior Notes.
Senior Credit Agreement
The 2016 Senior Credit Agreement provides for an aggregate principal amount of $1,325 million in senior secured credit facilities (“2016 Credit Facilities”), composed of (i) a five-year $875 million term loan facility (“Term Loans”), and (ii) a five-year $450 million revolving credit facility (including a $100 million letter of credit sublimit) (“Revolver”). At December 31, 2017 and September 30, 2017, the Term Loans had outstanding principal balances of $281 million and $285 million, respectively. At December 31, 2017 and September 30, 2017, there were no amounts outstanding under the Revolver. As of DecemberMarch 31, 2017, total borrowing capacity remaining under the Revolver was $439 million due to a reduction of $11 million for letters of credit outstanding.
The outstanding principal balance of the Term Loans is required to be repaid in quarterly installments of approximately $4 million for fiscal 2018, $8 million for fiscal 2019 and 2020, and $15 million for fiscal 2021 with the balance due at maturity. At Valvoline’s option, amounts outstanding under the 2016 Senior Credit Agreement bear interest at either LIBOR or an alternate base rate, in each case plus the applicable interest rate margin. The interest rate fluctuates between LIBOR plus 1.500% per annum and LIBOR plus 2.500% per annum (or between the alternate base rate plus 0.500% per annum and the alternate base rate plus 1.500% annum), based upon Valvoline’s corporate credit ratings or the consolidated first lien net leverage ratio (as defined in the 2016 Senior Credit Agreement).
The 2016 Credit Facilities are guaranteed by Valvoline’s existing and future subsidiaries (other than certain immaterial subsidiaries, joint ventures, special purpose financing subsidiaries, regulated subsidiaries, foreign subsidiaries and certain other subsidiaries), and are secured by a first-priority security interest in substantially all the personal property assets, and certain real property assets, of Valvoline and the guarantors, including all or a portion of the equity interests of certain of Valvoline’s domestic subsidiaries and first-tier foreign subsidiaries. The 2016 Credit Facilities may be prepaid at any time without premium.
The 2016 Senior Credit Agreement contains usual and customary representations and warranties, and usual and customary affirmative and negative covenants, including limitations on liens, additional indebtedness, investments, restricted payments, asset sales, mergers, affiliate transactions and other customary limitations, as well as financial covenants (including maintenance of a maximum consolidated net leverage ratio and a minimum consolidated interest coverage ratio). As of the end of any fiscal quarter, the maximum consolidated net leverage ratio and minimum consolidated interest coverage ratio permitted under the 2016 Senior Credit Agreement are 4.5 and 3.0, respectively. As of December 31, 2017,2024, Valvoline was in compliance with all covenants under the 2016 Senior Credit Agreement.its long-term borrowings.
Trade Receivables Facility
On November 29, 2016, Valvoline entered into a $125 million, one-year revolving trade receivables securitization facility (“Trade Receivables Facility”) with certain financial institutions. On November 20, 2017, the Company amended the Trade Receivables Facility to extend the maturity date to November 19, 2020 and increase the maximum funding under the facility to $175 million based on the availability of eligible receivables and other customary factors and conditions.
Under the Trade Receivables Facility, Valvoline sells and/or transfers a majority of its U.S. trade receivables to a wholly-owned, bankruptcy-remote subsidiary as they are originated, and advances by the lenders to that subsidiary (in the form of cash or letters of credit) are secured by those trade receivables. The assets of this financing subsidiary are restricted as collateral for the payment of its obligations under the Trade Receivables Facility, and its assets and credit are not available to satisfy the debts and obligations owed to the creditors of the Company. The Company includes the assets, liabilities and results of operations of this financing subsidiary in its condensed consolidated financial statements.
During the first fiscal quarter of 2017, Valvoline borrowed $75 million under the Trade Receivables Facility and used the net proceeds to repay an equal amount of the Term Loans. During the first fiscal quarter of 2018, Valvoline borrowed $45 million under the Trade Receivables Facility and used the proceeds to supplement the daily cash needs of the Company's operations. The Company accounts for the Trade Receivables Facility as secured borrowings. Based upon the maturity dates in place in each respective period, as of December 31, 2017, the $120 million balance outstanding was classified as Long-term debt and the $75 million balance outstanding as of September 30, 2017 was classified as Short-term debt in the Condensed Consolidated Balance Sheets. Based on the availability of eligible receivables, the total borrowing capacity remaining under the Trade Receivables Facility at December 31, 2017 was $39 million. The financing subsidiary owned $253 million and $247 million of outstanding accounts receivable as of December 31, 2017 and September 30, 2017, respectively, and these amounts are included in Accounts receivable, net in the Company’s Condensed Consolidated Balance Sheets.
The financing subsidiary pays customary fees to the lenders, and advances by a lender under the Trade Receivables Facility accrue interest for which the weighted average interest rates were 2.2% and 1.5% for the three months ended December 31, 2017 and 2016, respectively. The Trade Receivables Facility contains various customary affirmative and negative covenants and default and termination provisions, which provide for acceleration of amounts owed under the Trade Receivables Facility in circumstances including, but not limited to, the failure to pay interest or other amounts when due, defaults on certain other indebtedness, certain insolvency events, and breach of representation.
NOTE 86 – INCOME TAXES
Income tax provisions for interim quarterly periods are based on an estimated annual effective income tax rate calculated separately from the effect of significant, infrequent or unusual discrete items related specifically to interim periods. IncomeThe following summarizes income tax expense and the effective tax rate in each interim period:
| | | | | | | | | | | | | | | | | | | | | | | | | | |
| | Three months ended
March 31 | | Six months ended
March 31 |
| | |
| (In millions) | | 2024 | | 2023 | | 2024 | | 2023 |
| Income tax expense (benefit) | | $ | 14.0 | | | $ | 11.4 | | | $ | 25.9 | | | $ | (8.7) | |
| Effective tax rate percentage | | 24.4 | % | | 25.7 | % | | 25.1 | % | | (17.0) | % |
The increase in income tax expense for the three months ended DecemberMarch 31, 20172024 was $94 million, anprincipally driven by higher pre-tax earnings, while the reduction in the effective tax rate was primarily attributed to the favorable impact of 111.9% compared to expense of $38 million and an effectivediscrete tax rate of 34.5% for the three months ended December 31, 2016.benefits. The increaseincreases in income tax expense and the effective tax rate was principallyfor the six months ended March 31, 2024 were driven by the enactment of tax reform legislationmore normalized activity in the U.S. in December 2017,current year period as compared to the prior year period which resulted inincluded the recognition of a net increase in$26.5 million income tax expensebenefit for the release of approximately $68 million that more than offset benefits relateda valuation allowance due to the reductionchange in expectations regarding the estimated annual effective tax rate for fiscal 2018.
U.S. tax reform legislation
On December 22, 2017, the President of the United States signed into law tax reform legislation (the “Act”), which is generally effective January 1, 2018. The Act includes a number of provisions, including lowering the U.S. corporate federal income tax rate from a maximum of 35% to 21% and changing or limiting certain tax deductions. While the Company expects this rate reduction will ultimately benefit Valvoline, the Act also includes provisions that are expected to offset some of the benefit of the rate reduction, including the repeal of the deduction for domestic production activities and the expansion of the limitation on the deductionutilization of certain executive compensation. In addition, the Act alters the landscape of taxation of non-U.S. operations and provides immediate deductions for certain new investments, among other provisions. Based on the Company's provisional estimates of the impacts of the Act, the Company expects the Act will result in a lower estimated annual effectivelegacy tax rate for Valvoline in fiscal 2018 and beyond and decrease the Company's cash taxes, particularly in years beyond fiscal 2018.
During the three months ended December 31, 2017, enactment of the Act resulted in the following provisional impacts on income tax expense, which are described further below:
The remeasurement of net deferred tax assets at the lower enacted corporate tax rate resulted in a net $67 million increase in income tax expense;
The deemed repatriation tax on unremitted non-U.S. earnings and profits resulted in a $4 million increase in income tax expense; and
The remeasurement of net indemnity liabilities associated with the Tax Matters Agreement increased pre-tax expense by $7 million and generated a $3 million tax benefit primarily related to the higher expected utilization of tax attributes payable to Ashland.
The estimated impacts of the Act recorded during the three months ended December 31, 2017 are provisional in nature, and the Company will continue to assess the impact of the Act and will record adjustments through the income tax provision in the relevant period as amounts are known and reasonably estimable during the measurement period. Accordingly, the impact of the Act may differ from the Company's provisional estimates due to and among other factors, information currently not available, changes in interpretations and the issuance of additional guidance, as well as changes in assumptions the Company has currently made, including actions the Company may take in future periods as a result of the Act.
In particular, there is currently a lack of clarity regarding the applicationterms of the executive compensation deduction limitations and state tax implications as a result of the Act. The Company currently estimates that the effect of the Act on executive compensation deduction limitations will primarily be effective in future periods. With regard to state tax implications, the Company generally expects taxable state income will increase as a result of deduction limitations associated with the Act, though the impact is not currently reasonably estimable as most U.S. state tax jurisdictions have not responded to the specific effects of the Act. The Company will make relevant updates to management's estimates and assumptions as additional information becomes available.
Given the effective date of the rate reduction in the Act, the Company's statutory federal corporate tax rate for fiscal 2018 will be a blended rate of 24.5% and will decline to 21% for fiscal 2019 and beyond.
Deferred tax remeasurement
The Company's net deferred income taxes represent benefits that will be used to reduce corporate taxes expected to be paid as well as differences between the tax bases and carrying amounts of assets and liabilities that will result in taxable or deductible amounts in future years. Deferred tax assets and liabilities are measured using enacted tax rates expected to apply to taxable income in years in which those temporary differences are expected to be recovered or settled. As changes in tax laws or rates occur, deferred tax assets and liabilities are adjusted in the period changes are enacted through income tax expense.
The Company’s net deferred tax assets of $281 million were determined at September 30, 2017 based on the then-current enacted income tax rates prior to the passage of the Act. As a result of the reduction in the federal corporate income tax rate from 35% to 21% under the Act, the Company revalued its net deferred tax assets as of December 31, 2017, which resulted in a reduction in the value of net deferred tax assets of approximately $67 million that was recorded as additional income tax expense in the Company’s Condensed Consolidated Statements of Comprehensive Income for the three months ended December 31, 2017.
Deemed repatriation
The Act implements a new territorial tax system that imposes a one-time transition tax, or deemed repatriation, on unremitted earnings of certain non-U.S. subsidiaries that is based in part on the amount of these earnings held in cash and other specified assets. The mandatory deemed repatriation resulted in a $22 million gross liability, but allows for the realization of $18 million of previously unrecognized foreign tax credits related to taxes previously paid in relevant local jurisdictions. The net result was $4 million of income tax expense which was recognized during the three months ended December 31, 2017.
The Company has historically intended to indefinitely reinvest undistributed earnings of its non-U.S. subsidiaries. As undistributed earnings of the Company's non-U.S. subsidiaries were subject to the one-time deemed repatriation tax, the Company began to reevaluate its intentions to indefinitely reinvest its non-U.S. undistributed earnings. The Company now plans to repatriate up to $45 million of previously undistributed earnings of certain non-U.S. subsidiaries where the withholding tax implications are expected to be minimal. The Company is presently not aware of any significant restrictions on the repatriation of these funds and additional taxes and other costs that may arise between the deemed and actual distribution dates are not estimated to be material.
The Company's intent is to continue to indefinitely reinvest the remainder of its undistributed earnings of non-U.S. subsidiaries. Upon any future determination to distribute these earnings, the Company would be subject to certain income and withholding taxes, the amount of which is not practicable to determine given the complexities associated with such a hypothetical calculation, including dependencies on income tax laws and other circumstances in place at the time amounts are distributed.
Tax Matters Agreement
Total liabilities related to obligations owed to Ashland under the Tax Matters Agreement were $67 million and $62 million at December 31, 2017 and September 30, 2017, respectively. At December 31, 2017 and September 30, 2017, $1 million was recorded in Accrued expenses and other liabilities, and $66 million and $61 million was recorded in Other noncurrent liabilities in the Condensed Consolidated Balance Sheets as of December 31, 2017 and September 30, 2017, respectively.
Under the Tax Matters Agreement, Valvoline has net indemnification obligations for a number ofamended tax matters including certain taxes that arise upon audit or examination related to the periods prior to Distribution and Valvoline's utilization of legacy tax attributes contributed as part of the separation from Ashland. During the three months ended December 31, 2017, Valvoline recognized $7 million of expense in Selling, general and administrative expenses for the estimated increase in net amounts due. The estimated increase in net amounts due was a result of the reduction in the federal tax rate primarily related to the reduced federal benefit of state tax deductions, which drove increases in estimated taxes payable upon audit or examination as well as the expected utilization of legacy tax attributes, whichagreement with Valvoline’s former parent company. This amendment also resulted in an income tax benefithigher Net legacy and separation-related expenses of $3$24.4 million duringfor the period.
Uncertainties in income taxes
The Company records reserves related to its uncertain tax positions when it is more likely than not thatincreased indemnity obligation for the tax position may not be sustained on examination by the taxing authorities. As of December 31, 2017, the Condensed Consolidated Balance Sheet includes a $10 million liability for uncertain income tax positions, and during the threesix months ended DecemberMarch 31, 2017, there were no significant changes in Valvoline's uncertain tax positions or related reserves. As tax examinations are completed or settled, statutes of limitations expire, or other new information becomes available, the Company will adjust its liabilities for uncertain tax positions in the respective period through payment or through the income tax provision. The Company has provided adequate reserves for its income tax uncertainties in all open tax years based on the recognition and measurement considerations in the relevant accounting principles and any adjustments are not expected to have a material effect on its condensed consolidated financial statements at this time; however, it is reasonably possible that there could be changes to the Company's reserves related to its uncertain tax positions due to activities of the taxing authorities, resolution of examination issues, or reassessment of existing uncertain tax positions.2023.
Although the timing and nature of the resolution and/or closure of examinations cannot be predicted with certainty, management estimates that it is reasonably possible that reserves related to uncertain tax positions may decrease by as much as $3 million from the resolution of tax examinations in U.S. jurisdictions during the next twelve months.
NOTE 97 – EMPLOYEE BENEFIT PLANS
The total pension and other postretirement benefit income was $10 million and $25 million during the three months ended December 31, 2017 and 2016, respectively.
Contributions to the U.S. non-qualified and non-U.S. pension plans during the three months ended December 31, 2017 were $3 million. For the remainder of fiscal 2018, Valvoline expects to contribute approximately $11 million to these plans, for a total of $14 million in fiscal 2018.
Components of net periodic benefit income
For segment reporting purposes, service cost is proportionately allocated to each reportable segment, while all other components of net periodic benefit income are recognized below operating income within Net pension and other postretirement plan non-service income and remeasurement adjustments in the Condensed Consolidated Statements of Comprehensive Income.
Effective January 1, 2017, Valvoline discontinued certain other postretirement health and life insurance benefits. The effect of these plan amendments resulted in a remeasurement gain of $8 million during the three months ended December 31, 2016 as shown in the table below. The following table summarizes the components of pension and other postretirement benefit income for the three months ended December 31:plan expense:
| | | | | | | | | | | | | | | | | | | | | | | | | | |
| | Pension benefits | | Other postretirement benefits |
| | |
| (In millions) | | 2024 | | 2023 | | 2024 | | 2023 |
| Three months ended March 31 | | | | | | | | |
| | | | | | | | |
| Interest cost | | $ | 20.9 | | | $ | 20.6 | | | $ | 0.3 | | | $ | 0.4 | |
| Expected return on plan assets | | (17.1) | | | (16.8) | | | — | | | — | |
| Amortization of prior service credits | | — | | | — | | | (0.5) | | | (0.6) | |
| | | | | | | | |
| Net periodic benefit costs (income) | | $ | 3.8 | | | $ | 3.8 | | | $ | (0.2) | | | $ | (0.2) | |
| | | | | | | | |
| Six months ended March 31 | | | | | | | | |
| | | | | | | | |
| Interest cost | | $ | 41.8 | | | $ | 41.2 | | | $ | 0.6 | | | $ | 0.8 | |
| Expected return on plan assets | | (34.3) | | | (33.6) | | | — | | | — | |
| Amortization of prior service credit | | — | | | — | | | (1.1) | | | (1.1) | |
| Actuarial gain | | — | | | — | | | — | | | — | |
| Net periodic benefit costs (income) | | $ | 7.5 | | | $ | 7.6 | | | $ | (0.5) | | | $ | (0.3) | |
|
| | | | | | | | | | | | | | | | |
| | | | | | | Other postretirement benefits |
| | | Pension benefits | |
| (In millions) | | 2017 | | 2016 | | 2017 | | 2016 |
| Service cost | | $ | — |
| | $ | 1 |
| | $ | — |
| | $ | — |
|
| Interest cost | | 19 |
| | 21 |
| | — |
| | — |
|
| Expected return on plan assets | | (26 | ) | | (36 | ) | | — |
| | — |
|
| Amortization of prior service credit | | — |
| | — |
| | (3 | ) | | (3 | ) |
| Actuarial gain | | — |
| | — |
| | — |
| | (8 | ) |
| Net periodic benefit income | | $ | (7 | ) | | $ | (14 | ) |
| $ | (3 | ) | | $ | (11 | ) |
NOTE 108 – COMMITMENTSLITIGATION, CLAIMS AND CONTINGENCIES
From time to time, Valvoline is involved inparty to lawsuits, claims and other legal actionsproceedings that arise in the ordinary course of business. While Valvoline cannot predict with certaintyThe Company establishes liabilities for the outcome costs recognizedof such matters where losses are determined to be probable and reasonably estimable. Where appropriate, the Company has recorded liabilities with respect to such actionsthese matters, which were immaterial duringnot material for the three months ended December 31, 2017.periods presented as reflected in the condensed consolidated financial statements herein. There are certain claims and legal proceedings pending where loss is not determined to be probable or reasonably estimable, and therefore, accruals have not been made. In addition, Valvoline doesdiscloses matters when management believes a material loss is at least reasonably possible.
In all instances, management has assessed each matter based on current information available and made a judgment concerning its potential outcome, giving due consideration to the amount and nature of the claim and the probability of success. The Company believes it has established adequate accruals for liabilities that are probable and reasonably estimable.
Although the ultimate resolution of these matters cannot be predicted with certainty and there can be no assurances that the actual amounts required to satisfy liabilities from these matters will not have any currentlyexceed the amounts reflected in the condensed consolidated financial statements, based on information available at this time, it is the opinion of management that such pending claims or litigation which Valvoline believes, individually or in the aggregate,proceedings will not have a material adverse effect on its condensed consolidated financial position, results of operations, liquidity or capital resources. While Valvoline cannot predict with certainty the outcome of such matters, where appropriate, adequate reserves have been recorded, which were not material as of December 31, 2017 and September 30, 2017. There is a reasonable possibility that a loss exceeding amounts already recognized may be incurred related to these matters; however, Valvoline currently believes that such potential losses will not be material.statements.
NOTE 119 - EARNINGS PER SHARE
The following istable summarizes basic and diluted earnings per share:
| | | | | | | | | | | | | | | | | | | | | | | | | | |
| | Three months ended
March 31 | | Six months ended
March 31 |
| | |
| (In millions, except per share amounts) | | 2024 | | 2023 | | 2024 | | 2023 |
| Numerator | | | | | | | | |
| Income from continuing operations | | $ | 43.3 | | | $ | 32.9 | | | $ | 77.2 | | | $ | 59.9 | |
| (Loss) income from discontinued operations, net of tax | | (1.9) | | | 1,194.4 | | | (3.9) | | | 1,249.3 | |
| Net income | | $ | 41.4 | | | $ | 1,227.3 | | | $ | 73.3 | | | $ | 1,309.2 | |
| | | | | | | | |
| Denominator | | | | | | | | |
| Weighted average common shares outstanding | | 129.8 | | | 171.7 | | | 130.8 | | | 173.5 | |
Effect of potentially dilutive securities (a) | | 0.9 | | | 1.0 | | | 0.9 | | | 1.0 | |
| Weighted average diluted shares outstanding | | 130.7 | | | 172.7 | | | 131.7 | | | 174.5 | |
| | | | | | | | | |
| Basic earnings (loss) per share | | | | | | | | |
| Continuing operations | | $ | 0.33 | | | $ | 0.19 | | | $ | 0.59 | | | $ | 0.35 | |
| Discontinued operations | | (0.01) | | | 6.96 | | | (0.03) | | | 7.20 | |
| Basic earnings per share | | $ | 0.32 | | | $ | 7.15 | | | $ | 0.56 | | | $ | 7.55 | |
| | | | | | | | |
| Diluted earnings (loss) per share | | | | | | | | |
| Continuing operations | | $ | 0.33 | | | $ | 0.19 | | | $ | 0.59 | | | $ | 0.34 | |
| Discontinued operations | | (0.01) | | | 6.92 | | | (0.03) | | | 7.16 | |
| Diluted earnings per share | | $ | 0.32 | | | $ | 7.11 | | | $ | 0.56 | | | $ | 7.50 | |
|
(a)There were 0.1 million and 0.3 million outstanding stock appreciation rights not included in the computation of basic and diluted EPS for the three months ended December 31, 2017 and 2016. EPS is reported under the treasury stock method.
|
| | | | | | | | |
| | | Three months ended |
| | | December 31 |
| (In millions except per share data) | | 2017 | | 2016 |
| Numerator | | | | |
| Net (loss) income | | $ | (10 | ) | | $ | 72 |
|
| Denominator | | | | |
| Weighted average shares used to compute basic EPS | | 202 |
| | 205 |
|
Effect of dilutive securities (a) | | — |
| | — |
|
| Weighted average shares used to compute diluted EPS | | 202 |
| | 205 |
|
| | | | | |
| (Loss) earnings per share | | | | |
| Basic | | $ | (0.05 | ) | | $ | 0.35 |
|
| Diluted | | $ | (0.05 | ) | | $ | 0.35 |
|
| | | | | |
(a) For the three months ended December 31, 2017, due to the net loss attributable to Valvoline common stockholders, potential common shares primarily related to stock-based compensation plans of approximately 1 million were excluded from the dilutedearnings per share count because their effect would have been anti-dilutive. During the three months ended December 31, 2016, there was not a significant dilutive impact from potential common shares.
NOTE 12 - STOCKHOLDERS’ DEFICIT
Changes in stockholders' deficit in the three months ended DecemberMarch 31, 20172024 and 2023, respectively, and 0.2 million in the six months ended March 31, 2024 and 2023 because the effect would have been antidilutive.
NOTE 10 - SUPPLEMENTAL FINANCIAL INFORMATION
Cash, cash equivalents and restricted cash
The following provides a reconciliation of cash, cash equivalents and restricted cash reported within the Condensed Consolidated Statements of Cash Flows to the Condensed Consolidated Balance Sheets:
| | | | | | | | | | | | | | | | | | | | |
| (In millions) | | March 31
2024 | | September 30
2023 | | March 31
2023 |
| Cash and cash equivalents - continuing operations | | $ | 494.5 | | | $ | 409.1 | | | $ | 2,334.5 | |
Cash and cash equivalents - held for sale (a) | | — | | | 4.0 | | | — | |
| | | | | | |
| | | | | | |
| | | | | | |
| Total cash, cash equivalents and restricted cash | | $ | 494.5 | | | $ | 413.1 | | | $ | 2,334.5 | |
| | | | | | |
(a)Former Global Products business whose operations were suspended during fiscal 2022, classified as follows:held for sale and impaired as of September 30, 2023, and subsequently sold during the first quarter of fiscal 2024.
|
| | | | |
| (In millions) | |
| Balance as of September 30, 2017 | $ | (117 | ) |
| | | |
| | Net loss | (10 | ) |
| | Repurchases of common stock (a) | (39 | ) |
| | Stock-based compensation plans | 2 |
|
| | Dividends paid, $0.0745 per common share | (15 | ) |
| | Purchase of remaining ownership interest in subsidiary (b) | (14 | ) |
| | Accumulated other comprehensive income, net of tax: | |
| | Unrealized currency translation gain | 1 |
|
| | Amortization of pension and other postretirement prior service credits in income (c) | (2 | ) |
| | | |
| Balance as of December 31, 2017 | $ | (194 | ) |
| | | |
| |
(a) | During the three months ended December 31, 2017, the Company repurchased approximately 2 million shares of its common stock for $39 million. Upon repurchase, shares are retired. |
| |
(b) | Refer to Note 3 for details regarding the Company's purchase of the remaining ownership interest in a controlled and consolidated subsidiary during the three months ended December 31, 2017. |
| |
(c) | Amortization of unrecognized prior service credits is included in net periodic benefit income within Net pension and other postretirement plan non-service income and remeasurement adjustments in the Condensed Consolidated Statements of Comprehensive Income.
|
NOTE 13 – RELATED PARTY TRANSACTIONS
At December 31, 2017, Valvoline had total net obligations due to Ashland of $81 million, of which $3 million was recorded in Accrued expensesAccounts and other liabilitiesreceivables
The following summarizes Valvoline’s accounts and the remainder was primarily recorded and Other noncurrent liabilitiesother receivables in the Condensed Consolidated Balance Sheets.Sheets as of:
At September 30, 2017, Valvoline had total net obligations due to Ashland of $74 million, of which $2 million was recorded | | | | | | | | | | | | | | |
| (In millions) | | March 31
2024 | | September 30 2023 |
| Current | | | | |
| Trade | | $ | 94.3 | | | $ | 64.0 | |
| Notes receivable from franchisees | | 6.6 | | | 1.6 | |
| Other | | 9.1 | | | 16.3 | |
| Receivables, gross | | 110.0 | | | 81.9 | |
| Allowance for credit losses | | (0.4) | | | (0.6) | |
| Receivables, net | | $ | 109.6 | | | $ | 81.3 | |
| | | | |
Non-current (a) | | | | |
| | | | |
| Notes receivable | | $ | 2.4 | | | $ | 2.3 | |
| Other | | 7.8 | | | 7.5 | |
| Noncurrent notes receivable, gross | | 10.2 | | | 9.8 | |
| Allowance for losses | | (2.5) | | | (2.4) | |
| Noncurrent notes receivable, net | | $ | 7.7 | | | $ | 7.4 | |
| | | | |
(a)Included in Accrued expenses and other liabilities and the remainder was primarily recorded and Other noncurrent liabilities inassets within the Condensed Consolidated Balance Sheets.
These liabilities generally relate toRevenue recognition
The following disaggregates the Company’s net obligations due to Ashland under the Tax Matters Agreement as well as reimbursements payable to Ashland for certain other contractual obligations, including those related to transition services and other obligations that are intended to transfer to Valvoline as partrevenues by timing of the Distribution of Ashland's remaining interest in Valvoline. The increase in total net obligations due to Ashland from September 30, 2017 is primarily related to the change in obligations estimated as due under the Tax Matters Agreement related to the enactment of U.S. tax reform legislation in December 2017. Refer to Note 8 for additional details regarding the Tax Matters Agreement and related obligations.revenue recognized:
17 | | | | | | | | | | | | | | | | | | | | | | | | | | |
| | Three months ended
March 31 | | Six months ended
March 31 |
| | |
| (In millions) | | 2024 | | 2023 | | 2024 | | 2023 |
| Net revenues transferred at a point in time | | $ | 370.1 | | | $ | 327.9 | | | $ | 726.0 | | | $ | 645.1 | |
| Franchised revenues transferred over time | | 18.6 | | | 16.6 | | | 36.1 | | | 32.2 | |
| Net revenues | | $ | 388.7 | | | $ | 344.5 | | | $ | 762.1 | | | $ | 677.3 | |
NOTE 14 - REPORTABLE SEGMENT INFORMATION
Valvoline manages and reports within the following three segments:
Core North America - sells Valvoline and other branded products and solutions in the United States and Canada to heavy-duty customers and retailers for consumers to perform their own automotive and engine maintenance, as well as to installer customers who use Valvoline products to service vehicles.
Quick Lubes - services the passenger car and light truck quick lube market through: Company-owned and franchised Valvoline Instant Oil Change (“VIOC”) retail quick lube service stores; and its Express Care stores for independent operators to purchase Valvoline motor oil and other products and display Valvoline branded signage.
International - sells Valvoline and other branded products in approximately 140 countries outside of the United States and Canada for the maintenance of consumer and commercial vehicles and equipment.
These segments represent components of the Company for which separate financial information is available that is utilized on a regular basis by the chief operating decision maker in assessing segment performance and in allocating the Company's resources. Sales and operating income are the primary measures evaluated in assessing each reportable segment’s financial performance. Intersegment sales are not material, and assets are not regularly included in the assessment of segment performance; consequently, these items are not disclosed by segment herein.
To maintain operating focus on business performance, certain corporate and non-operational items, including adjustments related to legacy businesses that no longer are attributed to Valvoline, are excluded from the segment operating results utilized by the chief operating decision maker in evaluating segment performance and are separately delineated within Unallocated and other to reconcile to total reported Operating income as shown in the table below.
The following table presents sales and operating income for each reportable segment:summarizes net revenues by category:
| | | | | | | | | | | | | | | | | | | | | | | | | | |
| | Three months ended
March 31 | | Six months ended
March 31 |
| | |
| (In millions) | | 2024 | | 2023 | | 2024 | | 2023 |
| | | | | | | | |
| Oil changes and related fees | | $ | 283.2 | | | $ | 254.9 | | | $ | 560.7 | | | $ | 502.1 | |
| Non-oil changes and related fees | | 86.8 | | | 72.9 | | | 165.0 | | | 142.7 | |
Franchise fees and other (a) | | 18.7 | | | 16.7 | | | 36.4 | | | 32.5 | |
| Total | | $ | 388.7 | | | $ | 344.5 | | | $ | 762.1 | | | $ | 677.3 | |
| | | | | | | | |
| | | | | | | | |
| | | | | | | | |
| | | | | | | | |
| | | | | | | | |
| | | | | | | | |
| | | | | | | | |
| | | | | | | | |
|
| | | | | | | |
(In millions) | Three months ended December 31 |
| 2017 | | 2016 |
| Sales | | | |
| Core North America | $ | 251 |
| | $ | 237 |
|
| Quick Lubes | 154 |
| | 127 |
|
| International | 140 |
| | 125 |
|
| Consolidated sales | $ | 545 |
| | $ | 489 |
|
| | | | |
| Operating income (loss) | | | |
| Core North America | $ | 43 |
| | $ | 51 |
|
| Quick Lubes | 35 |
| | 29 |
|
| International | 19 |
| | 20 |
|
| Total operating segments | $ | 97 |
| | $ | 100 |
|
Unallocated and other (a) | (9 | ) | | (6 | ) |
| Consolidated operating income | $ | 88 |
| | $ | 94 |
|
| | | | |
| |
(a) | Unallocated and other includes $7(a)Includes $0.2 million of expense in the three months ended December 31, 2017 related to adjustments associated with Ashland tax indemnities driven by tax reform legislation, as well as separation costs of $2 million and $6 million for the three months ending December 31, 2017 and 2016, respectively. |
NOTE 15 - GUARANTOR FINANCIAL INFORMATION
The Senior Notes are general unsecured senior obligations of Valvoline Inc. and are fully and unconditionally guaranteed on a senior unsecured basis, jointly and severally, by the combined “Guarantor Subsidiaries.” Other subsidiaries (the “Non-Guarantor Subsidiaries”) largely represent the internationalnet revenues associated with suspended operations of the Company, which do not guarantee the Senior Notes. Under the terms of the indentures, Valvoline Inc. and the Guarantor Subsidiaries each fully and unconditionally, jointly and severally, guarantee the payment of interest, principal and premium, if any, on each of the notes included in the Senior Notes. Refer to Note 7 for additional information.
The Guarantor Subsidiaries are subject to release in certain circumstances, including (i) the sale of all of the capital stock of the subsidiary, (ii) the designation of the subsidiary as an “Unrestricted Subsidiary” under the indentures governing the Senior Notes; or (iii) the release of the subsidiary as a guarantor from the Company's 2016 Senior Credit Agreement described further in Note 7.
In connection with the registered exchange offers for the Senior Notes completed in December 2017, the Company is required to comply with Rule 3-10 of SEC Regulation S-X (“Rule 3-10”), and has therefore included the accompanying condensed consolidating financial statements in accordance with Rule 3-10(f) of SEC Regulation S-X.six months ended March 31, 2023.
The following tables present, on a consolidating basis, the condensed statements of comprehensive income; condensed balance sheets; and condensed statements of cash flows for the parent issuer of these Senior Notes, the Guarantor Subsidiaries on a combined basis, the Non-Guarantor Subsidiaries on a combined basis and the eliminations necessary to arrive at the Company's consolidated results.
|
| | | | | | | | | | | | | | | | | | | |
| Condensed Consolidating Statements of Comprehensive Income | | | | | | |
| For the three months ended December 31, 2017 | | | | | | | | |
| (In millions) | Valvoline Inc.
(Parent Issuer) | | Guarantor Subsidiaries | | Non-Guarantor Subsidiaries | | Eliminations | | Consolidated |
| Sales | $ | — |
| | $ | 422 |
| | $ | 134 |
| | $ | (11 | ) | | $ | 545 |
|
| Cost of sales | — |
| | 263 |
| | 98 |
| | (11 | ) | | 350 |
|
| Gross profit | — |
| | 159 |
| | 36 |
| | — |
| | 195 |
|
| | | | | | | | | | |
| Selling, general and administrative expense | 9 |
| | 83 |
| | 22 |
| | — |
| | 114 |
|
| Separation costs | 1 |
| | 1 |
| | — |
| | — |
| | 2 |
|
| Equity and other (income) expenses | — |
| | (12 | ) | | 3 |
| | — |
| | (9 | ) |
| Operating (loss) income | (10 | ) | | 87 |
| | 11 |
| | — |
| | 88 |
|
| Net pension and other postretirement plan non-service income and remeasurement adjustments | — |
| | (10 | ) | | — |
| | — |
| | (10 | ) |
| Net interest and other financing expense | 12 |
| | 1 |
| | 1 |
| | — |
| | 14 |
|
| (Loss) income before income taxes | (22 | ) | | 96 |
| | 10 |
| | — |
| | 84 |
|
| Income tax expense | 21 |
| | 70 |
| | 3 |
| | — |
| | 94 |
|
| Equity in net income of subsidiaries | 33 |
| | 7 |
| | — |
| | (40 | ) | | — |
|
| Net (loss) income | $ | (10 | ) | | $ | 33 |
| | $ | 7 |
| | $ | (40 | ) | | $ | (10 | ) |
| | | | | | | | | | |
| Total comprehensive (loss) income | $ | (11 | ) | | $ | 32 |
| | $ | 8 |
| | $ | (40 | ) | | $ | (11 | ) |
|
| | | | | | | | | | | | | | | | | | | |
| Condensed Consolidating Statements of Comprehensive Income | | | | | | |
| For the three months ended December 31, 2016 | | | | | | | | |
| (In millions) | Valvoline Inc.
(Parent Issuer) | | Guarantor Subsidiaries | | Non-Guarantor Subsidiaries | | Eliminations | | Consolidated |
| Sales | $ | — |
| | $ | 377 |
| | $ | 124 |
| | $ | (12 | ) | | $ | 489 |
|
| Cost of sales | — |
| | 224 |
| | 92 |
| | (12 | ) | | 304 |
|
| Gross profit | — |
| | 153 |
| | 32 |
| | — |
| | 185 |
|
| | | | | | | | | | |
| Selling, general and administrative expense | 2 |
| | 69 |
| | 24 |
| | — |
| | 95 |
|
| Separation costs | — |
| | 6 |
| | — |
| | — |
| | 6 |
|
| Equity and other (income) expenses | — |
| | (13 | ) | | 3 |
| | — |
| | (10 | ) |
| Operating (loss) income | (2 | ) | | 91 |
| | 5 |
| | — |
| | 94 |
|
| Net pension and other postretirement plan non-service income and remeasurement adjustments | — |
| | (26 | ) | | — |
| | — |
| | (26 | ) |
| Net interest and other financing expense | 9 |
| | 1 |
| | — |
| | — |
| | 10 |
|
| (Loss) income before income taxes | (11 | ) | | 116 |
| | 5 |
| | — |
| | 110 |
|
| Income tax (benefit) expense | (4 | ) | | 38 |
| | 4 |
| | — |
| | 38 |
|
| Equity in net income of subsidiaries | 79 |
| | 1 |
| | — |
| | (80 | ) | | — |
|
| Net income (loss) | $ | 72 |
| | $ | 79 |
| | $ | 1 |
| | $ | (80 | ) | | $ | 72 |
|
| | | | | | | | | | |
| Total comprehensive income (loss) | $ | 61 |
| | $ | 68 |
| | $ | (7 | ) | | $ | (61 | ) | | $ | 61 |
|
|
| | | | | | | | | | | | | | | | | | | | |
| Condensed Consolidating Balance Sheets | | | | | | | | |
| As of December 31, 2017 | | | | | | | | |
| (In millions) | | Valvoline Inc.
(Parent Issuer) | | Guarantor Subsidiaries | | Non-Guarantor Subsidiaries | | Eliminations | | Consolidated |
| Assets | | | | | | | | | | |
| Current assets | | | | | | | | | | |
| Cash and cash equivalents | | $ | — |
| | $ | 18 |
| | $ | 97 |
| | $ | — |
| | $ | 115 |
|
| Accounts receivable, net | | — |
| | 84 |
| | 435 |
| | (101 | ) | | 418 |
|
| Inventories, net | | — |
| | 94 |
| | 76 |
| | — |
| | 170 |
|
| Other current assets | | — |
| | 29 |
| | 3 |
| | — |
| | 32 |
|
| Total current assets | | — |
| | 225 |
| | 611 |
| | (101 | ) | | 735 |
|
| Noncurrent assets | | | | | | | | | | |
| Property, plant and equipment, net | | — |
| | 346 |
| | 38 |
| | — |
| | 384 |
|
| Goodwill and intangibles, net | | — |
| | 391 |
| | 2 |
| | — |
| | 393 |
|
| Equity method investments | | — |
| | 33 |
| | — |
| | — |
| | 33 |
|
| Investment in subsidiaries | | 622 |
| | 444 |
| | — |
| | (1,066 | ) | | — |
|
| Deferred income taxes | | 127 |
| | 55 |
| | 14 |
| | — |
| | 196 |
|
| Other noncurrent assets | | 254 |
| | 78 |
| | 6 |
| | (252 | ) | | 86 |
|
| Total noncurrent assets | | 1,003 |
| | 1,347 |
| | 60 |
| | (1,318 | ) | | 1,092 |
|
| Total assets | | $ | 1,003 |
| | $ | 1,572 |
| | $ | 671 |
| | $ | (1,419 | ) | | $ | 1,827 |
|
| | | | | | | | | | | |
| Liabilities and Stockholders' Deficit | | | | | | | | | | |
| Current Liabilities | | | | | | | | | | |
| Current portion of long-term debt | | $ | 19 |
| | $ | — |
| | $ | — |
| | $ | — |
| | $ | 19 |
|
| Trade and other payables | | — |
| | 192 |
| | 50 |
| | (101 | ) | | 141 |
|
| Accrued expenses and other liabilities | | 119 |
| | 55 |
| | 34 |
| | — |
| | 208 |
|
| Total current liabilities | | 138 |
| | 247 |
| | 84 |
| | (101 | ) | | 368 |
|
| Noncurrent liabilities | | | | | | | | | | |
| Long-term debt | | 1,025 |
| | 2 |
| | 120 |
| | — |
| | 1,147 |
|
| Employee benefit obligations | | — |
| | 309 |
| | 22 |
| | — |
| | 331 |
|
| Other noncurrent liabilities | | 34 |
| | 392 |
| | 1 |
| | (252 | ) | | 175 |
|
| Total noncurrent liabilities | | 1,059 |
| | 703 |
| | 143 |
| | (252 | ) | | 1,653 |
|
| Commitments and contingencies | |
| |
| |
| |
| |
|
| Stockholders' (deficit) equity | | (194 | ) | | 622 |
| | 444 |
| | (1,066 | ) | | (194 | ) |
| Total liabilities and stockholders' deficit/equity | | $ | 1,003 |
| | $ | 1,572 |
| | $ | 671 |
| | $ | (1,419 | ) | | $ | 1,827 |
|
|
| | | | | | | | | | | | | | | | | | | | |
| Condensed Consolidating Balance Sheets | | | | | | | | |
| As of September 30, 2017 | | | | | | | | |
| (In millions) | | Valvoline Inc.
(Parent Issuer) | | Guarantor Subsidiaries | | Non-Guarantor Subsidiaries | | Eliminations | | Consolidated |
| Assets | | | | | | | | | | |
| Current assets | | | | | | | | | | |
| Cash and cash equivalents | | $ | — |
| | $ | 99 |
| | $ | 102 |
| | $ | — |
| | $ | 201 |
|
| Accounts receivable, net | | — |
| | 57 |
| | 389 |
| | (61 | ) | | 385 |
|
| Inventories, net | | — |
| | 94 |
| | 81 |
| | — |
| | 175 |
|
| Other current assets | | — |
| | 25 |
| | 4 |
| | — |
| | 29 |
|
| Total current assets | | — |
| | 275 |
| | 576 |
| | (61 | ) | | 790 |
|
| Noncurrent assets | | | | | | | | | | |
| Property, plant and equipment, net | | — |
| | 353 |
| | 38 |
| | — |
| | 391 |
|
| Goodwill and intangibles, net | | — |
| | 333 |
| | 2 |
| | — |
| | 335 |
|
| Equity method investments | | — |
| | 30 |
| | — |
| | — |
| | 30 |
|
| Investment in subsidiaries | | 606 |
| | 447 |
| | — |
| | (1,053 | ) | | — |
|
| Deferred income taxes | | 145 |
| | 122 |
| | 14 |
| | — |
| | 281 |
|
| Other noncurrent assets | | 314 |
| | 80 |
| | 6 |
| | (312 | ) | | 88 |
|
| Total noncurrent assets | | 1,065 |
| | 1,365 |
| | 60 |
| | (1,365 | ) | | 1,125 |
|
| Total assets | | $ | 1,065 |
| | $ | 1,640 |
| | $ | 636 |
| | $ | (1,426 | ) | | $ | 1,915 |
|
| | | | | | | | | | | |
| Liabilities and Stockholders' Deficit | | | | | | | | | | |
| Current Liabilities | | | | | | | | | | |
| Short-term debt | | $ | — |
| | $ | — |
| | $ | 75 |
| | $ | — |
| | $ | 75 |
|
| Current portion of long-term debt | | 15 |
| | — |
| | — |
| | — |
| | 15 |
|
| Trade and other payables | | 2 |
| | 198 |
| | 53 |
| | (61 | ) | | 192 |
|
| Accrued expenses and other liabilities | | 103 |
| | 60 |
| | 33 |
| | — |
| | 196 |
|
| Total current liabilities | | 120 |
| | 258 |
| | 161 |
| | (61 | ) | | 478 |
|
| Noncurrent liabilities | | | | | | | | | | |
| Long-term debt | | 1,032 |
| | 2 |
| | — |
| | — |
| | 1,034 |
|
| Employee benefit obligations | | — |
| | 321 |
| | 21 |
| | — |
| | 342 |
|
| Other noncurrent liabilities | | 30 |
| | 453 |
| | 7 |
| | (312 | ) | | 178 |
|
| Total noncurrent liabilities | | 1,062 |
| | 776 |
| | 28 |
| | (312 | ) | | 1,554 |
|
| Commitments and contingencies | |
| |
| |
| |
| |
|
| Stockholders' (deficit) equity | | (117 | ) | | 606 |
| | 447 |
| | (1,053 | ) | | (117 | ) |
| Total liabilities and stockholders' deficit/equity | | $ | 1,065 |
| | $ | 1,640 |
| | $ | 636 |
| | $ | (1,426 | ) | | $ | 1,915 |
|
|
| | | | | | | | | | | | | | | | | | | |
| Condensed Consolidating Statements of Cash Flows | | | | | | |
| For the three months ended December 31, 2017 | | | | | | | | |
| (In millions) | Valvoline Inc.
(Parent Issuer) | | Guarantor Subsidiaries | | Non-Guarantor Subsidiaries | | Eliminations | | Consolidated |
| Cash flow provided by (used in) operating activities | $ | (2 | ) | | $ | 52 |
| | $ | (30 | ) | | $ | — |
| | $ | 20 |
|
| Cash flows from investing activities | | | | | | | | | |
| Additions to property, plant and equipment | — |
| | (13 | ) | | (1 | ) | | — |
| | (14 | ) |
| Acquisitions, net of cash required | — |
| | (60 | ) | | — |
| | — |
| | (60 | ) |
| Return of advance from subsidiary | 60 |
| | — |
| | — |
| | (60 | ) | | — |
|
| Total cash provided by (used in) investing activities | 60 |
| | (73 | ) | | (1 | ) | | (60 | ) | | (74 | ) |
| Cash flows from financing activities | | | | | | | | | |
| Proceeds from borrowings, net of issuance costs of $1 | — |
| | — |
| | 44 |
| | — |
| | 44 |
|
| Repayments on borrowings | (4 | ) | | — |
| | — |
| | — |
| | (4 | ) |
| Repurchase of common stock | (37 | ) | | — |
| | — |
| | — |
| | (37 | ) |
| Purchase of additional ownership in subsidiary | — |
| | — |
| | (15 | ) | | — |
| | (15 | ) |
| Cash dividends paid | (15 | ) | | — |
| | — |
| | — |
| | (15 | ) |
| Other financing activities | (2 | ) | | — |
| | (2 | ) | | — |
| | (4 | ) |
| Other intercompany activity, net | — |
| | (60 | ) | | — |
| | 60 |
| | — |
|
| Total cash (used in) provided by financing activities | (58 | ) | | (60 | ) | | 27 |
| | 60 |
| | (31 | ) |
| Effect of currency exchange rate changes on cash and cash equivalents | — |
| | — |
| | (1 | ) | | — |
| | (1 | ) |
| Decrease in cash and cash equivalents | — |
| | (81 | ) | | (5 | ) | | — |
| | (86 | ) |
| Cash and cash equivalents - beginning of year | — |
| | 99 |
| | 102 |
| | — |
| | 201 |
|
| Cash and cash equivalents - end of period | $ | — |
| | $ | 18 |
| | $ | 97 |
| | $ | — |
| | $ | 115 |
|
| | | | | | | | | | |
|
| | | | | | | | | | | | | | | | | | | |
| Condensed Consolidating Statements of Cash Flows | | | | | | |
| For the three months ended December 31, 2016 | | | | | | | | |
| (In millions) | Valvoline Inc.
(Parent Issuer) | | Guarantor Subsidiaries | | Non-Guarantor Subsidiaries | | Eliminations | | Consolidated |
| Cash flows provided by (used in) operating activities | $ | 89 |
| | $ | 75 |
| | $ | (76 | ) | | $ | — |
| | $ | 88 |
|
| Cash flows from investing activities | | | | | | | | | |
| Additions to property, plant and equipment | — |
| | (9 | ) | | — |
| | — |
| | (9 | ) |
| Other investing activities, net | — |
| | (1 | ) | | — |
| | — |
| | (1 | ) |
| Total cash used in investing activities | — |
| | (10 | ) | | — |
| | — |
| | (10 | ) |
| Cash flows from financing activities | | | | | | | | | |
| Net transfers to Ashland | (2 | ) | | — |
| | — |
| | — |
| | (2 | ) |
| Proceeds from borrowings | — |
| | — |
| | 75 |
| | — |
| | 75 |
|
| Repayments on borrowings | (79 | ) | | — |
| | — |
| | — |
| | (79 | ) |
| Cash dividends paid | (10 | ) | | — |
| | — |
| | — |
| | (10 | ) |
| Other intercompany activity, net | 2 |
| | (2 | ) | | — |
| | — |
| | — |
|
| Total cash (used in) provided by financing activities | (89 | ) | | (2 | ) | | 75 |
| | — |
| | (16 | ) |
| Effect of currency exchange rate changes on cash and cash equivalents | — |
| | — |
| | 2 |
| | — |
| | 2 |
|
| Increase in cash and cash equivalents | — |
| | 63 |
| | 1 |
| | — |
| | 64 |
|
| Cash and cash equivalents - beginning of year | — |
| | 94 |
| | 78 |
| | — |
| | 172 |
|
| Cash and cash equivalents - end of period | $ | — |
| | $ | 157 |
| | $ | 79 |
| | $ | — |
| | $ | 236 |
|
NOTE 16 – SUBSEQUENT EVENTS
Dividend declared
On January 31, 2018, the Board of Directors of Valvoline declared a quarterly cash dividend of $0.0745 per share on Valvoline common stock. The dividend is payable on March 15, 2018 to shareholders of record on March 1, 2018.
Share repurchases
The Company repurchased over 1 million shares for an aggregate amount of $29 million in the period from January 1, 2018 through February 6, 2018. The Company has $32 million in aggregate share repurchase authorization remaining under the $150 million share repurchase authorization approved by the Board of Directors on April 24, 2017 (the “2017 Share Repurchase Authorization”).
In addition, on January 31, 2018, the Board of Directors of Valvoline authorized the Company to repurchase up to $300 million of its common stock through September 30, 2020, which amount is in addition to the amount remaining under the 2017 Share Repurchase Authorization. The timing and amount of any purchases of shares of common stock will be based on available liquidity, general business and market conditions and other factors, including alternative investment opportunities.
CAUTIONARY STATEMENT REGARDING FORWARD-LOOKING STATEMENTS
Certain statements in this Quarterly Report on Form 10-Q, other than statements of historical facts, including estimates, projections, statements related to the Company's business plans and operating resultsfact, are forward-looking statements within the meaning of the Private Securities Litigation Reform Act of 1995. Such forward-looking statements may include, without limitation, executing on its growth strategy to create shareholder value by driving the full potential in the Company’s core business, accelerating network growth and innovating to meet the needs of customers and the evolving car parc; realizing the benefits from the sale of Global Products; and future opportunities for the remaining stand-alone retail business; and any other statements regarding Valvoline's future operations, financial or operating results, capital allocation, debt leverage ratio, anticipated business levels, dividend policy, anticipated growth, market opportunities, strategies, competition, and other expectations and targets for future periods. Valvoline has identified some of these forward-looking statements with words such as “anticipates,” “believes,” “expects,” “estimates,” “is likely,” “predicts,” “projects,” “forecasts,” “may,” “will,” “should”“should,” and “intends”“intends,” and the negative of these words or other comparable terminology. These forward-looking statements are based on Valvoline’s current expectations, estimates, projections, and assumptions as of the date such statements are made and are subject to risks and uncertainties that may cause results to differ materially from those expressed or implied in the forward-looking statements. Additional information regarding these risks and uncertaintiesFactors that might cause such differences include, but are described in Valvoline’s filings withnot limited to, those discussed under the Securities and Exchange Commission, including in theheadings “Risk Factors” and Management’sFactors,” “Management’s Discussion and Analysis of Financial Condition and Results of Operations” sections ofOperations,” and “Quantitative and Qualitative Disclosures about Market Risk” in this Quarterly Report on Form 10-Q and Valvoline’s most recently filed periodic reportsAnnual Report on Forms 10-K and Form 10-Q, which are available on Valvoline’s website at http://investors.valvoline.com/sec-filings or on the SEC’s website at http://www.sec.gov.10-K. Valvoline assumes no obligation to update or revise these forward-looking statements for any reason, even if new information becomes available in the future.future, unless required by law.
| | | | | |
| Index to Management’s Discussion and Analysis of Financial Condition and Results of Operations | Page |
| |
| |
| |
| |
| |
| |
| |
ITEM 2. MANAGEMENT’S DISCUSSION AND ANALYSIS OF FINANCIAL CONDITION AND RESULTS OF OPERATIONS
The following discussion and analysis should be read in conjunction with the Annual Report on Form 10-K for the fiscal year ended September 30, 2017,2023, as well as the Condensed Consolidated Financial Statementscondensed consolidated financial statements and the accompanying Notes to Condensed Consolidated Financial Statements included in Item 1 of Part I in this Quarterly Report on Form 10-Q. Unless otherwise noted, disclosures within Item 2. Management’s Discussion and Analysis of Financial Condition and Results of Operations relate solely to the Company's continuing operations.
BUSINESS OVERVIEW AND PURPOSE
As the quick, easy, trusted leader in automotive preventive maintenance, Valvoline Inc. (“Valvoline” oris creating shareholder value by driving the “Company”) is a worldwide producer, marketerfull potential in its core business, accelerating network growth and supplierinnovating to meet the needs of enginecustomers and automotive maintenance productsthe evolving car parc. With average customer ratings that indicate high levels of service satisfaction, Valvoline and services. Established in 1866, Valvoline’s heritage spans over 150 years, during which it has developed powerful name recognition across multiple productthe Company’s franchise partners keep customers moving with 15-minute stay-in-your-car oil changes; battery, bulb and service channels. In addition to the iconic Valvoline-branded passenger car motor oilswiper replacements; tire rotations; and other automotive lubricant products, Valvoline provides a wide array of lubricants used in heavy duty equipment, as well as automotive chemicalsmanufacturer recommended maintenance services. The Company operates and fluids designed to improve engine performance and lifespan. Valvoline’s premium branded product offerings enhancefranchises more than 1,900 service center locations through its high quality reputation and provide customers with solutions that address a wide variety of needs.
In the United States and Canada, Valvoline's products and services are sold to retailers with over 30,000 retail outlets, to installer customers with over 12,000 locations, and through 1,139 Valvoline branded franchised and company-owned stores. Valvoline also has a strong international presence with products sold in approximately 140 countries.
Valvoline has three reportable segments: Core North America, Quick Lubes, and International, with certain corporate and non-operational items included in Unallocated and Other to reconcile to consolidated results.
BUSINESS STRATEGY
To deliver on Valvoline's key business and growth strategies in 2018, the Company is focused on:
growing and strengthening Valvoline’s quick lube network through organic store expansion, opportunistic, high-quality acquisitions in both core and new markets within the Valvoline Instant Oil Change (“VIOC”) systemSM and strong sales efforts to partner with newGreat Canadian Oil Change retail locations and supports nearly 300 locations through its Express Care operators, in addition to continued same-store sales growth and profitability within Valvoline’s existing VIOC system stores by attracting new customers and increasing customer satisfaction, customer loyalty and average transaction size;TM platform.
accelerating international growth across key markets where demand for premium lubricants is growing, such as China, India and select countries in Latin America, by building strong distribution channels in under-served
geographies, replacing less successful distributors and improving brand awareness among installer customers in those regions; and
BUSINESS STRATEGY
leveraging innovation, both in terms of product development, packaging, marketing
As a pure play automotive retail services provider and the implementationtrusted leader in preventive automotive maintenance, Valvoline is well positioned to create long-term shareholder value through executing the Company’s strategic initiatives, which include:
•Driving the full potential of Valvoline’s new digital infrastructure, to strengthenthe core business through increasing market share and profitability.non-oil change revenue growth in existing stores by building on Valvoline’s strong foundation in marketing, technology, and data;
FIRST•Aggressively growing the retail footprint with company-operated store growth and an increased emphasis on franchisee store growth; and
•Developing capabilities to capture new customers through services expansion focused on fleet manager needs and needs of the evolving car parc.
SECOND FISCAL QUARTER 20182024 OVERVIEW
The following were the significant events for the firstsecond fiscal quarter of 2018,2024, each of which is discussed more fully in this Quarterly Report on Form 10-Q as referenced below:10-Q:
First quarter results were•Valvoline’s net revenues grew 13% over the prior year period driven by strong sales led bysystem-wide same-store sales ("SSS") growth of 7.7% and the addition of 147 net new stores to the system from the prior year.
•Income from continuing operations grew 32% to $43.3 million for the three months ended March 31, 2024 compared to the prior year. This growth is attributable to strong gross profit expansion which was partially offset by increased investments in VIOC,selling, general and administrative expenses. Diluted earnings per share from the continuing operations increased 74% to $0.33 in the three months ended March 31, 2024 compared to the prior year period driven by earnings expansion from operating results and share count reductions from repurchases, including benefits from the prior year execution of the share repurchase tender offer.
•Adjusted EBITDA increased 21% over the prior year period due to strong top-line growth driven by higher average ticket price from pricing actions, non-oil change service penetration and premiumization. Additionally, benefits from improved labor cost efficiency were partially offset by growth investments in premium product mix across all reportable segmentsselling, general and continued volume gains in international markets. administrative expenses.
•The Company also continuesreturned $40.4 million to be focused on margin expansionits shareholders during the quarter through repurchases of 1.0 million shares of Valvoline common stock completing the 2022 Share Repurchase Authorization for $1.6 billion and cost management to drive profitability improvements. Valvoline's gross profit assuccessfully returning a percentagesubstantial portion of sales (i.e., gross margin) was 35.8% and declined due to increased raw material, new packaging and supply chain costs in the current quarter.
Tax reform legislation was enacted in the first fiscal quarter of 2018 and although Valvoline expects to ultimately benefitnet proceeds from the legislation, expenses were recorded during the first quarter, including pre-tax expensesale of $7 million and income tax expense of $68 million primarily relatedGlobal Products to the reduction in the federal statutory tax rate. Refer to the “Tax-Related Commitments” section in this Management's Discussion and Analysis of Financial Condition and Results of Operations below as well as Note 8 of the Notes to Condensed Consolidated Financial Statements in Item 1 of Part I in this Quarterly Report on Form 10-Q for additional information.shareholders.
Valvoline acquired 56 company-owned stores within the Quick Lubes reportable segment in connection with the acquisition of business assets from Henley Bluewater LLC. Refer to Note 3 of the Notes to Condensed Consolidated Financial Statements in Item 1 of Part I in this Quarterly Report on Form 10-Q for additional information.
Valvoline extended the maturity date by three years and increased the maximum funding capacity of the trade receivables securitization facility to $175 million and borrowed an additional $45 million during the quarter. Refer to Note 7 and the Financial Position, Liquidity and Capital Resources section below for more details.
Use of Non-GAAP Measures
To aid in the understanding of Valvoline'sValvoline’s ongoing business performance, certain items within this document are presented on an adjusted, non-GAAP basis. These non-GAAP measures have limitations as analytical tools and should not be considered in isolation from, or as an alternative to, or more meaningful than, the financial statements presented on both a consolidated and reportable segment basis are not defined withinin accordance with U.S. GAAP. The financial results presented in accordance with U.S. GAAP and do not purport toreconciliations of non-GAAP measures included within this Quarterly Report on Form 10-Q should be alternatives to net income/loss or cash flows from operating activities as measures of operating performance or cash flows. carefully evaluated.
The following are the non-GAAP measures management has included and how management defines them:
Earnings before interest, taxes, depreciation and amortization (“EBITDA”), which management defines as •EBITDA - net income/loss, plus income tax expense/benefit, net interest and other financing expenses, and depreciation and amortization;
•Adjusted EBITDA which management defines as - EBITDA adjusted for the impacts of certain unusual, infrequent or non-operational activity not directly attributable to the underlying business, which management believes impacts the comparability of operational results between periods ("key items," as further described below, andbelow);
•Adjusted EBITDA margin - adjusted EBITDA divided by adjusted net pension and other postretirement plan non-service income and remeasurement adjustments; andrevenues;
•Adjusted net revenues - reported net revenues adjusted for key items;
•Free cash flow which management defines as-cash flows from operating cash flowsactivities less capital expenditures and certain other adjustments as applicable.applicable; and
These•Discretionary free cash flow - cash flows from operating activities less maintenance capital expenditures and certain other adjustments as applicable.
Non-GAAP measures are not prepared in accordance withinclude adjustments from results based on U.S. GAAP that management believes enables comparison of certain financial trends and contain management’s best estimatesresults between periods and provides a useful supplemental presentation of cost allocations and shared resource costs. Management believes the use of non-GAAP measures on a consolidated and reportable segment basis assists investors in understanding the ongoingValvoline's operating performance of Valvoline’sthat allows for transparency with respect to key metrics used by management in operating the business by presenting comparable financial results between periods.and measuring performance. The manner used to compute non-GAAP information provided is used by Valvoline’s management and may not be comparable to similar measures disclosed by other companies, because of differingdiffer from the methods used by other companies, in calculating EBITDA, Adjusted EBITDA and free cash flow. EBITDA, Adjusted EBITDA, and free cash flow provide a supplemental presentation of Valvoline’s operating performance.may not be comparable. For a reconciliation of the most comparable U.S. GAAP measures to the non-GAAP measures, refer to the “Results of Operations” and “Financial Position, Liquidity and Capital Resources” sections below.
DueManagement believes EBITDA measures provide a meaningful supplemental presentation of Valvoline’s operating performance between periods on a comparable basis due to the depreciable assets associated with the nature of the Company’s operations as well as income tax and interest costs related to Valvoline’s tax and capital structures, respectively. Adjusted EBITDA measures enable comparison of financial trends and results between periods where certain items may not be reflective of the Company’s underlying and ongoing operations performance or vary independent of business performance.
Management uses free cash flow and discretionary free cash flow as additional non-GAAP metrics of cash flow generation. By including capital expenditures and certain other adjustments, as applicable, management is able to provide an indication of the ongoing cash being generated that is ultimately available for both debt and equity holders as well as other investment opportunities. Free cash flow includes the impact of capital expenditures, providing a supplemental view of cash generation. Discretionary free cash flow includes maintenance capital expenditures, which are routine uses of cash that are necessary to maintain the Company's operations and interest costs associated with Valvoline's capital structure,provides a supplemental view of cash flow generation to maintain operations before discretionary investments in growth. Free cash flow and discretionary free cash flow have certain limitations, including that they do not reflect adjustments for certain non-discretionary cash flows, such as mandatory debt repayments.
The non-GAAP measures used by management believes EBITDA is an important supplemental measureexclude key items. Key items are often related to evaluate the Company's consolidated and reportable segment operating results between periods on a comparable basis.
Management believes Adjusted EBITDA provides investors with a meaningful supplemental presentation of Valvoline’s operating performance. Adjusted EBITDA excludes the impactlegacy matters or market-driven events considered by management to not be reflective of the following:
Key items - Key items consist of income or expenses associated with certain unusual, infrequent or non-operational income or expenses not directly attributable to the underlying business, which management believes impacts the comparability of operational results between periods.ongoing operating performance. Key items may consist of adjustments related to: the impairment of an equity investment; legacy businesses, including the separation from AshlandValvoline's former parent company, the former Global Products reportable segment, and associated impacts of related activity and indemnities; non-service pension and other postretirement plan activity; restructuring-related matters, including organizational restructuring plans, the separation of Valvoline’s businesses, significant acquisitions or dispositions, restructuring-related matters,divestitures, debt extinguishment and modification, and tax reform legislation; in addition to other matters that aremanagement considers non-operational, infrequent or unusual in nature. Key items are considered by management to be outside the comparable operational performance of the business and are also often related to legacy matters or market-driven events that are not directly related to the underlying business and do not have an immediate, corresponding impact on the Company's ongoing performance.
Details with respect to the description and composition of key items recognized during the respective periods presented herein are set forth below in the “EBITDA and Adjusted EBITDA” section of “Results of Operations” that follows.
Net pension
Key Business Measures
Valvoline tracks its operating performance and other postretirement plan non-service incomemanages its business using certain key measures, including system-wide, company-operated and remeasurement adjustments - Net pensionfranchised store counts and other postretirement plan non-service incomeSSS; and remeasurement adjustments include several elements impacted by changes in plan assetssystem-wide store sales. Management believes these measures are useful to evaluating and obligations that are primarily driven by changes in the debt and equity markets, as well as those that are predominantly legacy in nature and related to prior service to the Company from employees (e.g., retirees, former employees, current employees with frozen benefits). These elements include (i) interest cost, (ii) expected return on plan assets, (iii) actuarial gains/losses, and (iv) amortization of prior service cost. Significant factors that can contribute to changes in these elements include changes in discount rates used to remeasure pension and other postretirement obligations on an annual basis or upon a qualifying remeasurement, differences between actual and expected returns on plan assets, and other changes in actuarial assumptions, such as the life expectancy of plan participants. Accordingly, management considers that these elements are more reflective of changes in current conditions in global financial markets (in particular, interest rates) and are outside the operationalunderstanding Valvoline's operating performance of the business and are also primarily legacy amounts that are not directly related to the underlying business and do not have an immediate, corresponding impact on the compensation and benefits provided to eligible employees for current service. Adjusted EBITDA will continue to include pension and other postretirement service costs related to current employee service as well as the costs of other benefits provided to employees for current service.
Management uses free cash flow as an additional non-GAAP metric of cash flow generation. By including capital expenditures and certain other adjustments as applicable, management is able to provide a better indication of the ongoing cash being generated that is ultimately available for both debt and equity holders as well as other investment opportunities. Unlike cash flow from operating activities, free cash flow includes the impact of capital expenditures, providing a more complete picture of cash generation. Free cash flow has certain limitations, including that it does not reflect adjustments for certain non-discretionary cash flows, such as mandatory debt repayments. The amount of mandatory versus discretionary expenditures can vary significantly between periods.
Valvoline’s results of operations are presented based on Valvoline’s management structure and internal accounting practices. The structure and practices are specific to Valvoline; therefore, Valvoline’s financial results, EBITDA, Adjusted EBITDA and free cash flow are not necessarily comparable with similar information for other comparable companies. EBITDA, Adjusted EBITDA and free cash flow each have limitations as analytical tools and should not be considered in isolation from, or as an alternativesupplements to, or more meaningful than,not substitutes for, Valvoline's net incomerevenues and cash flows from operating activitiesincome, as determined in accordance with U.S. GAAP. Because of these limitations, you should rely primarily on net income and cash flows from operating activities as determined in accordance with U.S. GAAP and use EBITDA, Adjusted EBITDA, and free cash flow only as supplements. In evaluating EBITDA, Adjusted EBITDA, and free cash flow, you should be aware that in the future Valvoline may incur expenses/income similar to those for which adjustments are made in calculating EBITDA, Adjusted EBITDA, and free cash flow. Valvoline’s presentation of EBITDA, Adjusted EBITDA, and free cash flow should not be construed as a basis to infer that Valvoline’s future results will be unaffected by unusual or nonrecurring items.
RESULTS OF OPERATIONS
Consolidated Review
The following table summarizes the results of the Company's operations for the three months ended December 31, 2017 and 2016:
|
| | | | | | | | | | | | |
| | | Three months ended |
| | | December 31 |
| | | 2017 | | 2016 |
| (In millions) | | | | % of Sales | | | | % of Sales |
| Sales | | $ | 545 |
| | 100.0% | | $ | 489 |
| | 100.0% |
| Gross profit | | $ | 195 |
| | 35.8% | | $ | 185 |
| | 37.8% |
| Net operating expenses | | $ | 107 |
| | 19.6% | | $ | 91 |
| | 18.6% |
| Operating income | | $ | 88 |
| | 16.1% | | $ | 94 |
| | 19.2% |
| Net (loss) income | | $ | (10 | ) | | (1.8)% | | $ | 72 |
| | 14.7% |
Sales
Sales for the three months ended December 31, 2017 increased $56 million, or 11%, compared to the three months ended December 31, 2016. The following table provides a reconciliation of the change in sales:
|
| | | | |
| (In millions) | | Year over year change - Quarter |
| Pricing | | $ | 20 |
|
| Volume | | 10 |
|
| Product mix | | 6 |
|
| Currency exchange | | 7 |
|
| Acquisitions | | 13 |
|
| Change in sales | | $ | 56 |
|
The primary drivers of this increase were higher product pricing and higher volume levels, which increased sales by $20 million, or 4%, and $10 million, or 2%, respectively. During the current quarter, lubricant gallons sold increased 2% to 43.8 million. Favorable changes in product mix with increases in the percentage of sales of premium lubricants across all reportable segments and favorable foreign currency exchange increased sales by $6 million and $7 million, respectively. Acquisitions within the Quick Lubes reportable segment increased sales by $13 million, or 3%, in the current quarter.
The changes to reportable segment sales and the drivers thereof are discussed in further detail in “Reportable Segment Review” below.
Gross profit
Gross profit margin was 35.8% for the three months ended December 31, 2017 compared to 37.8% in the prior year quarter. Gross profit increased $10 million and the table below provides a reconciliation of the change:
|
| | | | |
| (In millions) | | Year over year change - Quarter |
| Volume and product mix | | $ | 7 |
|
| Acquisitions | | 3 |
|
| Currency exchange | | 2 |
|
| Price and cost | | (2 | ) |
| Change in gross profit | | $ | 10 |
|
The increase in gross profit was primarily driven by higher volume levels and favorable changes in product mix of $7 million, or 4%. Additional profits generated by acquisitions of Quick Lubes locations and favorable foreign currency exchange increased gross profit by $3 million and $2 million, respectively. Lower product margins of $2 million were attributed to higher product costs primarily driven by new product packaging as well as increased raw material costs associated with the hurricanes in the late summer of 2017.
The changes to reportable segment gross profit and the drivers thereof are discussed in further detail in “Reportable Segment Review” below.
Net operating expenses
Net operating expenses were $107 million or 19.6% of sales for the three months ended December 31, 2017 compared to $91 million or 18.6% for the three months ended December 31, 2016. The table below provides further details of the components of net operating expenses during each period:
|
| | | | | | | | | | | | | | |
| | | Three months ended |
| | | December 31 |
| | | 2017 | | 2016 |
| (In millions) | | | | % of Sales | | | | % of Sales |
| Selling, general and administrative expenses | | $ | 114 |
| | 20.9 | % | | $ | 95 |
| | 19.4 | % |
| Separation costs | | 2 |
| | 0.4 | % | | 6 |
| | 1.2 | % |
| Equity and other income | | (9 | ) | | (1.7 | )% | | (10 | ) | | (2.0 | )% |
| Net operating expenses | | $ | 107 |
| | 19.6 | % | | $ | 91 |
| | 18.6 | % |
Selling, general and administrative expenses were $114 million, or 20.9% of sales, in the three months ended December 31, 2017 as compared to $95 million, or 19.4% of sales, in the three months ended December 31, 2016. Adjustments in the estimates of the amounts payable to Ashland related to indemnities under the Tax Matters Agreement as a result of tax reform legislation increased selling, general and administrative expense by $7 million in the current quarter. Acquisitions, depreciation and foreign currency exchange also contributed $4 million to the year-over-year increase in selling, general and administrative expenses. The remaining increase was primarily the result of planned increased spend related to the Company's investments in its teams and shared infrastructure expenses necessary to operate independently subsequent to the separation from Ashland, which phased in during fiscal 2017, including investments in sales and marketing to drive growth and profitability.
The Company incurred $2 million of costs during the current period related to the separation from Ashland. The decline from the prior year quarter is due to the substantial completion of separation-related activities as Ashland distributed all of its remaining interest in Valvoline in May 2017, marking the completion of Valvoline's separation from Ashland.
Equity and other income decreased $1 million during the current year period compared to the prior year period driven by a decrease of $2 million in income generated by research and development testing, partially offset by an increase of $1 million in equity income.
Net pension and other postretirement plan non-service income and remeasurement adjustments
Net pension and other postretirement plan non-service income and remeasurement adjustments decreased by $16 million from the prior year period due to a decrease of $8 million in pension and other postretirement plan non-service income primarily attributed to the pension de-risking actions taken by the Company in late fiscal 2017 to shift the U.S. qualified plan's target asset allocation toward more fixed income securities and better match the asset duration to that of the pension plan obligations, which resulted in a decrease in related recurring income. In addition, during the prior year quarter, a gain on other postretirement plan remeasurement of $8 million was recorded due to the discontinuation of certain postretirement health and life insurance benefits, compared to none during the current year period as there were no changes requiring remeasurement.
Net interest and other financing expense
Net interest and other financing expense increased by $4 million during the three months ended December 31, 2017 compared to the three months ended December 31, 2016. There was an increase in interest associated with higher outstanding debt at December 31, 2017 compared to December 31, 2016 primarily related to the borrowing to fund the U.S. qualified pension plan in the aggregate principal amount of $400 million during the fourth fiscal quarter of 2017 and $45 million in new borrowings on the trade receivables securitization facility entered into during the three months ended December 31, 2017.
Income tax expense
Income tax expense for the three months ended December 31, 2017 was $94 million or an effective tax rate of 111.9% compared to an expense of $38 million or an effective tax rate of 34.5% for the three months ended December 31, 2016. The increase in income tax expense and the effective tax rate in the current year was primarily attributed to the enactment of U.S. tax reform legislation during the period, which resulted in a net increase in income tax expense of approximately $68 million that more than offset benefits related to the reduction in the estimated annual effective tax rate for fiscal 2018. Specifically, the Company recorded provisional one-time adjustments to income tax expense of $67 million related to the remeasurement of net deferred tax assets due to the income tax rate reduction and $4 million for the deemed repatriation tax on unremitted non-U.S. earnings and profits, net of benefits related to the rate reduction, including $3 million as a result of adjustments to the estimates of the net amounts payable related to indemnities under the Tax Matters Agreement, as well as a reduction in the estimated annual blended effective tax rate for fiscal 2018 . Refer to the “Tax-Related Commitments” section in this Management's Discussion and Analysis of Financial Condition and Results of Operations below for additional details regarding tax reform legislation and its estimated impacts to Valvoline.
EBITDA and Adjusted EBITDA
The following table reconciles EBITDA and Adjusted EBITDA to net income for the interim periods presented:
|
| | | | | | | | |
| | | | | |
| | | Three months ended December 31 |
| (In millions) | | 2017 | | 2016 |
| Net (loss) income | | $ | (10 | ) | | $ | 72 |
|
| Income tax expense | | 94 |
| | 38 |
|
| Net interest and other financing expense | | 14 |
| | 10 |
|
| Depreciation and amortization | | 11 |
| | 9 |
|
| EBITDA | | 109 |
| | 129 |
|
| Separation costs | | 2 |
| | 6 |
|
| Adjustment associated with Ashland tax indemnity | | 7 |
| | — |
|
Non-service pension and other postretirement plan net periodic income (a) | | (10 | ) | | (18 | ) |
| Gain on pension and other postretirement plan remeasurements | | — |
| | (8 | ) |
| Adjusted EBITDA | | $ | 108 |
| | $ | 109 |
|
| | | | | |
(a) Recurring non-service pension and other postretirement net periodic income, which consists of interest cost, expected return on plan assets and amortization of prior service credit. Refer to Note 9 in Item 1 of Part I in this Quarterly Report on Form 10-Q for further details.
The decrease in Adjusted EBITDA of $1 million was primarily due to the performance of the Company's operating segments, notably higher planned investments in selling, general and administrative expenses and higher raw material costs related to new product packaging and the hurricanes partially offset by higher volume levels and favorable changes in product mix.
The changes to reportable segment EBITDA and Adjusted EBITDA and the drivers thereof are discussed in further detail in “Reportable Segment Review” below.
Reportable Segment Review
Valvoline’s business is managed within the following three reportable segments:
Core North America - sells Valvoline and other branded products and solutions in the United States and Canada to heavy-duty customers and retailers for consumers to perform their own automotive and engine maintenance, as well as to installer customers who use Valvoline products to service vehicles.
Quick Lubes - services the passenger car and light truck quick lube market through: Company-owned and franchised VIOC retail quick lube service stores; and its Express Care stores for independent operators to purchase Valvoline motor oil and other products and display Valvoline branded signage.
International - sells Valvoline and other branded products in approximately 140 countries outside of the United States and Canada for the maintenance of consumer and commercial vehicles and equipment.
Results of Valvoline’s reportable segments are presented based on how operations are managed internally, including how the results are reviewed by the chief operating decision maker. The structure and practices are specific to Valvoline; therefore, the financial results of its reportable segments are not necessarily comparable with similar information for other comparable companies. Valvoline's reportable segments are measured for profitability based on operating income; therefore, Valvoline does not generally allocate items to each reportable segment below operating income, such as non-service pension and other postretirement income and remeasurement adjustments, interest expense or income tax expense. Valvoline allocates all items above operating income to its reportable segments except for certain significant corporate and non-operational matters, including, but not limited to, company-wide restructuring activities and costs or adjustments that relate to former businesses
that Valvoline no longer operates. The service cost component of pension and other postretirement benefit plans is allocated to each reportable segment on a ratable basis, while the remaining non-service and remeasurement components of pension and other postretirement benefits costs are recorded below operating income and attributed to Unallocated and other.
The EBITDA and Adjusted EBITDA amounts presented within this section are provided as a means to enhance the understanding of financial measurements that Valvoline has internally determined to be relevant measures of comparison for each reportable segment. Each of these non-GAAP measures is defined as follows: EBITDA (operating income plus depreciation and amortization) and Adjusted EBITDA (EBITDA adjusted for key items, which may include adjustments for significant acquisitions or divestitures, as applicable). As Valvoline does not allocate items to each reportable segment below operating income, reportable segment EBITDA and Adjusted EBITDA are reconciled directly to operating income since it is the most directly comparable Condensed Consolidated Statements of Comprehensive Income caption.
The following table presents sales, operating income and statistical operating information by reportable segment for the three months ended December 31, 2017 and 2016:
|
| | | | | | | | |
| | | Three months ended December 31 |
| (In millions) | | 2017 | | 2016 |
| Sales | | | | |
| Core North America | | $ | 251 |
| | $ | 237 |
|
| Quick Lubes | | 154 |
| | 127 |
|
| International | | 140 |
| | 125 |
|
| | | $ | 545 |
| | $ | 489 |
|
| Operating income (loss) | | | | |
| Core North America | | $ | 43 |
| | $ | 51 |
|
| Quick Lubes | | 35 |
| | 29 |
|
| International | | 19 |
| | 20 |
|
| Total operating segments | | 97 |
| | 100 |
|
| Unallocated and other | | (9 | ) | | (6 | ) |
| | | $ | 88 |
| | $ | 94 |
|
| Depreciation and amortization | | | | |
| Core North America | | $ | 4 |
| | $ | 3 |
|
| Quick Lubes | | 6 |
| | 5 |
|
| International | | 1 |
| | 1 |
|
| | | $ | 11 |
| | $ | 9 |
|
| Operating information | | | | |
| Core North America | | | | |
| Lubricant sales gallons | | 23.8 |
| | 24.1 |
|
| Premium lubricants (percent of U.S. branded volumes) | | 47.8 | % | | 43.8 | % |
Gross profit as a percent of sales (a) | | 37.7 | % | | 40.9 | % |
| Quick Lubes | | | | |
| Lubricant sales gallons | | 5.7 |
| | 5.3 |
|
| Premium lubricants (percent of U.S. branded volumes) | | 61.5 | % | | 58.6 | % |
Gross profit as a percent of sales (a) | | 40.4 | % | | 40.1 | % |
| International | | | | |
Lubricant sales gallons (b) | | 14.3 |
| | 13.7 |
|
| Lubricant sales gallons, including unconsolidated joint ventures | | 25.1 |
| | 23.0 |
|
| Premium lubricants (percent of lubricant volumes) | | 27.7 | % | | 27.4 | % |
Gross profit as a percent of sales (a) | | 28.2 | % | | 30.7 | % |
| | | | | |
(a) Gross profit as a percent of sales is defined as sales, less cost of sales, divided by sales.
(b) Excludes volumes from unconsolidated joint ventures.
Core North America
Core North America sales increased $14 million, or 6%, to $251 million during the current quarter compared to the prior year quarter. This increase was primarily driven by higher product pricing and favorable changes in product mix of $13 million, or 5%, and $4 million, or 2%, respectively. These increases were partially offset by volume declines of approximately $4 million.
Gross profit decreased $2 million compared to the prior year quarter. Higher raw material costs decreased gross profit by $3 million and overall decreases in volume related to the timing of promotions drove declines in non-branded product sales which decreased gross profit by $2 million. These decreases were partially offset by gains in premium product mix which increased gross profit by $3 million. Gross profit margin decreased 3.2 percentage points to 37.7% for the quarter ended December 31, 2017 driven largely by incremental costs associated with the launch of new packaging and higher raw material costs attributed to the hurricanes in late 2017.
Selling, general and administrative expenses, which include corporate expense allocations of costs, increased $3 million, or 6%, during the current quarter compared to the prior year quarter due to planned increases related to the Company's investments in its teams and shared infrastructure expenses.
Operating income totaled $43 million in the current quarter compared to $51 million in the prior year quarter. EBITDA decreased $7 million to $47 million in the current quarter. EBITDA margin decreased 4.1 percentage points to 18.7%.
Core North America - EBITDA and Adjusted EBITDA reconciliation
The following EBITDA presentation is provided as a means to enhance the understanding of financial measurements that the Company has internally determined to be relevant measures of comparison for the results of Core North America. There were no unusual or key items that affected comparability for Adjusted EBITDA during the three months ended December 31, 2017 and 2016.
|
| | | | | | | | |
| | | Three months ended December 31 |
| (In millions) | | 2017 | | 2016 |
| Operating income | | $ | 43 |
| | $ | 51 |
|
| Depreciation and amortization | | 4 |
| | 3 |
|
| EBITDA | | $ | 47 |
| | $ | 54 |
|
Quick Lubes
Quick Lubes sales increased $27 million, or 21%, to $154 million during the current quarter compared to the prior year quarter. Volume increased sales by $8 million as lubricant sales gallons increased to 5.7 million gallons during the quarter. Increased pricing and favorable changes in product mix increased sales $5 million and $1 million, respectively. Acquisitions increased sales by $13 million.
Gross profit increased $11 million during the current quarter compared to the prior year quarter. Increases in volumes and higher premium product mix combined to increase gross profit by approximately $4 million. Favorable pricing increased gross profit by $4 million, while acquisitions increased gross profit by $3 million. Gross profit margin during the current quarter increased 0.3 percentage points to 40.4% as a percentage of sales for the quarter, driven primarily by favorable margins due to increased ticket as a result of pricing improvements coupled with effective store execution, including increased transactions.
Selling, general and administrative expenses, which include corporate expense allocations of costs, increased $6 million, or 27%, during the current quarter compared to the prior year quarter. The increase was primarily a result of planned increases related to the Company's investments in its teams and shared infrastructure expenses of $3 million, an increase of $1 million in operating costs as a result of acquisitions and an increase of $1 million in advertising costs.
Operating income totaled $35 million in the current quarter as compared to $29 million in the prior year quarter. EBITDA increased $7 million to $41 million in the current quarter. EBITDA margin decreased 0.2 percentage points to 26.6% in the current quarter.
Quick Lubes - Additional growth and sales information
Quick Lubes salesrevenues are influenced by the number of company-ownedservice center stores and the business performance of those stores. Through Quick Lubes,Stores are considered open upon acquisition or opening for business. Temporary store closings remain in the respective store counts with only permanent store closures reflected in the activity and end of period store counts. SSS is defined as net revenues by U.S. Valvoline sells products to and receives royalty fees from VIOC franchisees. As a result, Quick Lubes sales are influenced by the number of units owned by franchiseesInstant Oil Change (“VIOC”) stores (company-operated, franchised and the business performancecombination of franchisees. The following tables provide supplemental information regarding company-owned stores and franchisees that Valvoline believes is relevant to an understanding of the Quick Lubes business.
|
| | | | | | | | | | | | | | | | |
| | | | Company-owned |
| | | | First Quarter 2018 | | Fourth Quarter 2017 | | Third Quarter 2017 | | Second Quarter 2017 | | First Quarter 2017 |
| | | | | | | | | | | | |
| | Beginning of period | 384 |
| | 383 |
| | 374 |
| | 347 |
| | 342 |
|
| | | Opened | 2 |
| | 2 |
| | 1 |
| | — |
| | — |
|
| | | Acquired | — |
| | 1 |
| | — |
| | 28 |
| | — |
|
| | | Conversions between company-owned and franchise | 56 |
| | — |
| | 9 |
| | — |
| | 5 |
|
| | | Closed | — |
| | (2 | ) | | (1 | ) | | (1 | ) | | — |
|
| | End of period | 442 |
| | 384 |
| | 383 |
| | 374 |
| | 347 |
|
| | | | | | | | | | | | |
| | | Franchise |
| | | | First Quarter 2018 | | Fourth Quarter 2017 | | Third Quarter 2017 | | Second Quarter 2017 | | First Quarter 2017 |
| | | | | | | | | | | | |
| | Beginning of period | 743 |
| | 730 |
| | 734 |
| | 729 |
| | 726 |
|
| | | Opened | 11 |
| | 15 |
| | 6 |
| | 7 |
| | 10 |
|
| | | Acquired | — |
| | — |
| | — |
| | — |
| | — |
|
| | | Conversions between company-owned and franchise | (56 | ) | | — |
| | (9 | ) | | — |
| | (5 | ) |
| | | Closed | (1 | ) | | (2 | ) | | (1 | ) | | (2 | ) | | (2 | ) |
| | End of period | 697 |
| | 743 |
| | 730 |
| | 734 |
| | 729 |
|
| | | | | | | | | | | | |
| | Total VIOC Stores | 1,139 |
| | 1,127 |
| | 1,113 |
| | 1,108 |
| | 1,076 |
|
The year over year change from December 31, 2017 to December 31, 2016 is primarily driven by opening new company-owned stores and franchise locations, including the acquisition of Time-It Lube in the second quarter of 2017, which added 28 company-owned locations. In addition, the acquisition of 56 Henley Bluewater stores converted from franchises in the first quarter of 2018.
|
| | | | | | |
| | | Three months ended December 31 |
| | | 2017 | | 2016 |
| Same-Store Sales Growth** - Company-owned | | 8.2 | % | | 9.5 | % |
| Same-Store Sales Growth** - Franchisee* | | 7.7 | % | | 8.9 | % |
| Same-Store Sales Growth** - Combined* | | 7.9 | % | | 9.0 | % |
| | | | | |
* Valvoline’s franchisees are distinct legal entities and Valvoline does not consolidate the results of operations of its franchisees.
** Valvoline has historically determined same-store sales growth on a fiscal year basis,these for system-wide SSS), with new stores, including franchised conversions, excluded from the metric until the completion of their first full fiscal year in operation.operation as this period is generally required for new store sales levels to begin to normalize.
Quick Lubes -Net revenues are limited to sales at company-operated stores, in addition to royalties and other fees from independent franchised and Express Care stores. Although Valvoline does not recognize store-level sales from franchised stores as net revenues in its Statements of Condensed Consolidated Income, management believes system-wide and franchised SSS comparisons, store counts, and total system-wide store sales are useful to assess market position relative to competitors and overall store and operating performance.
RESULTS OF OPERATIONS
The following summarizes the results of the Company’s continuing operations for the periods ended March 31:
| | | | | | | | | | | | | | | | | | | | | | | | | | | | | | | | | | | | | | | | | | | | | | | | | | | | | | |
| | Three months ended March 31 | | | | | | Six months ended March 31 |
| | 2024 | | 2023 | | | | | | 2024 | | 2023 |
| (In millions) | | Amount | | % of Net revenues | | Amount | | % of Net revenues | | | | Amount | | % of Net revenues | | Amount | | % of Net revenues |
| Net revenues | | $ | 388.7 | | | 100.0% | | $ | 344.5 | | | 100.0% | | | | | | $ | 762.1 | | | 100.0% | | $ | 677.3 | | | 100.0% |
| Gross profit | | $ | 146.2 | | | 37.6% | | $ | 126.7 | | | 36.8% | | | | | | $ | 281.0 | | | 36.9% | | $ | 245.5 | | | 36.2% |
| Net operating expenses | | $ | 69.8 | | | 18.0% | | $ | 65.5 | | | 19.0% | | | | | | $ | 141.8 | | | 18.6% | | $ | 155.0 | | | 22.9% |
| Operating income | | $ | 76.4 | | | 19.7% | | $ | 61.2 | | | 17.8% | | | | | | $ | 139.2 | | | 18.3% | | $ | 90.5 | | | 13.4% |
| Income from continuing operations | | $ | 43.3 | | | 11.1% | | $ | 32.9 | | | 9.6% | | | | | | $ | 77.2 | | | 10.1% | | $ | 59.9 | | | 8.8% |
| | | | | | | | | | | | | | | | | | | | |
EBITDA (a) | | $ | 98.4 | | | 25.3% | | $ | 78.2 | | | 22.7% | | | | | | $ | 182.4 | | | 23.9% | | $ | 122.3 | | | 18.1% |
Adjusted EBITDA (a) | | $ | 105.1 | | | 27.0% | | $ | 87.1 | | | 25.3% | | | | | | $ | 195.3 | | | 25.6% | | $ | 160.4 | | | 23.7% |
|
(a)Refer to the “Use of Non-GAAP Measures” and Continuing operations EBITDA and Adjusted EBITDA for management’s definitions of the metrics presented above and reconciliation to the corresponding GAAP measures, where applicable.
The following EBITDA presentation is provided as a means to enhance the understanding of financial measurements that the Company has internally determined to be relevant measures of comparison
| | | | | | | | | | | | | | | | | | | | | | | | | | | | | | |
| | Three months ended
March 31 | | | | Six months ended
March 31 | | |
| | | |
| 2024 | | 2023 | | | 2023 | | 2023 | | |
System-wide store sales - in millions (a) | | $ | 746.1 | | | $ | 659.9 | | | | | $ | 1,469.0 | | | $ | 1,303.9 | | | |
Year-over-year growth (a) | | 13.1 | % | | 18.5 | % | | | | 12.7 | % | | 17.7 | % | | |
| | | | | | | | | | | | |
Same-store sales growth (b) | | | | | | | | | | | | |
| Company-operated | | 7.4 | % | | 14.2 | % | | | | 6.8 | % | | 13.5 | % | | |
Franchised (a) | | 8.0 | % | | 12.9 | % | | | | 8.0 | % | | 12.0 | % | | |
System-wide (a) | | 7.7 | % | | 13.5 | % | | | | 7.4 | % | | 12.7 | % | | |
| | | | | | | | | | | | | | | | | | | | | | | | | | | | | | | | | | | |
| | | | | |
| | | | | | | | | | | |
| | | | | | | | | | | |
| | | | | | | | | | |
| | | | | | | | | | | |
| | | | | | | | | | | |
| | | | | | | | | | | |
| | | | | | | | | | |
| | | | | | | | | | | |
| | | Number of stores at end of period |
| | | Second Quarter
2024 | | First Quarter
2024 | | Fourth Quarter
2023 | | Third Quarter
2023 | | Second Quarter
2023 |
| | | | | | | | | | | |
| Company-operated | | 919 | | | 895 | | | 876 | | | 854 | | | 832 | |
Franchised (a) | | 1,009 | | | 995 | | | 976 | | | 950 | | | 949 | |
Total system-wide stores (a) | | 1,928 | | | 1,890 | | | 1,852 | | | 1,804 | | | 1,781 | |
| |
| | |
| | | | | | | | | | |
| | | | | | | | | | |
| | | | | | | | | | | |
| (a) | Measures include Valvoline franchisees, which are independent legal entities. Valvoline does not consolidate the results of operations of its franchisees. |
| (b) | Valvoline determines SSS growth as sales by U.S. VIOC stores (company-operated, franchised, and the combination of these for system-wide SSS), with new stores, including franchised conversions, excluded from the metric until the completion of their first full fiscal year in operation. |
Net revenues
Net revenues increased $44.2 million, or 12.8% for the results of Quick Lubes. There were no unusual or key items that affected comparability for Adjusted EBITDA during the three months ended DecemberMarch 31, 2017 and 2016.
|
| | | | | | | | |
| | | Three months ended December 31 |
| (In millions) | | 2017 | | 2016 |
| Operating income | | $ | 35 |
| | $ | 29 |
|
| Depreciation and amortization | | 6 |
| | 5 |
|
| EBITDA | | $ | 41 |
| | $ | 34 |
|
International
International sales increased $15 million, or 12%, to $140 million during the current quarter2024 compared to the prior year quarter. Higher volume levelsperiod. Store operations fueled top-line expansion with system-wide SSS increasing by 7.7% largely due to increased ticket from non-oil change service penetration with the balance from net pricing and changespremiumization. Transaction growth contributed modestly to system-wide SSS growth driven primarily by benefits from day mix. Additionally, revenue growth was bolstered by the addition of 147 net new stores through openings and acquisitions. The following reconciles the year-over-year change in product mix combined to increase sales by $6net revenues:
Net revenues increased $84.8 million, or 5%. Favorable foreign currency exchange increased sales by $6 million and favorable product pricing increased sales $3 million.
Gross profit increased $1 million, or 3%, during12.5% for the current quartersix months ended March 31, 2024 compared to the prior year quarter. Increases in volumesperiod due to volume, mix and favorable changes in product mix combined to increase gross profits by $2 million. Favorable foreign currency exchange increased gross profit by $1 million, while higher productprice improvements, as well as store expansion through net new openings and supply chain costs resulted in a $2 million decrease in gross profit. Gross profit margin decreased by 2.5 percentage points to 28.2%acquisitions. System-wide SSS grew 7.4% compared to the prior year quarter largelywith ticket contributing the majority of the
benefits from non-oil change service penetration, premiumization, and pricing actions, in addition to increased transactions. The following reconciles the year-over-year change in year-to-date net revenues:
Gross profit
Gross profit increased $19.5 million, or 15.4%, for the three months ended March 31, 2024 compared to the prior year period. Profitability increased primarily due to mix improvements from non-oil change service penetration and premiumization. Additionally, strategic pricing actions coupled with cost efficiencies, particularly in labor and modest benefits from materials increased profitability and were partially offset by increased store operating expenses, including higher depreciation. The following reconciles the year-over-year change in gross profit:
Gross profit margin improved in the three months ended March 31, 2024 compared to the prior year primarily due to labor efficiency resulting from strong schedule management.
Gross profit improved $35.5 million, or 14.5%, for the six months ended March 31, 2024 compared to the prior year period driven by increased average ticket from non-oil change service penetration and premiumization as well as pricing actions. Additionally, increased transactions and unit growth also provided benefits along with improved labor management. The following reconciles the year-over-year change in year-to-date gross profit:
The improvement in gross profit margin in the six months ended March 31, 2024 compared to the prior year was primarily due to pricing actions and labor efficiency which resulted in staff providing best-in-class customer experiences improving overall service mix. These benefits were partially offset by increased store operating expenses, including higher raw material and supply chain costs in some markets anddepreciation.
Net operating expenses
Details of the lower contribution from higher-margin geographies.components of Net operating expenses are summarized below for the periods ended March 31:
| | | | | | | | | | | | | | | | | | | | | | | | | | | | | | | | | | | | | | | | | | | | | | | | | | |
| | Three months ended March 31 | | Six months ended March 31 |
| | 2024 | | 2023 | | 2024 | | 2023 |
| (In millions) | | Amount | | % of Net revenues | | Amount | | % of Net revenues | | Amount | | % of Net revenues | | Amount | | % of Net revenues |
| Selling, general and administrative expenses | | $ | 72.3 | | | 18.6 | % | | $ | 62.6 | | | 18.2 | % | | $ | 146.8 | | | 19.3 | % | | $ | 128.6 | | | 19.0 | % |
| Net legacy and separation-related expenses | | — | | | — | % | | 3.8 | | | 1.1 | % | | 0.1 | | | — | % | | 29.2 | | | 4.3 | % |
| Other income, net | | (2.5) | | | (0.6) | % | | (0.9) | | | (0.3) | % | | (5.1) | | | (0.7) | % | | (2.8) | | | (0.4) | % |
| Net operating expenses | | $ | 69.8 | | | 18.0 | % | | $ | 65.5 | | | 19.0 | % | | $ | 141.8 | | | 18.6 | % | | $ | 155.0 | | | 22.9 | % |
Selling, general and administrative expenses which include corporate expense allocations of costs,(“SG&A”) increased $3$9.7 million or 12%, duringand $18.2 millionfor the current quarterthree and six months ended March 31, 2024, respectively, compared to the prior year quarter. The increase was primarily relatedperiods. These increases were principally driven by costs from implementing stand-alone information technology platforms, and increased investments in advertising to $2 million of planned increasesattract and retain customers and talent to support future growth. Additionally, higher travel expenses related to the Company's investments in its teamsCompany’s annual meeting and shared infrastructure expenses, and a $1 millionstore growth contributed to the increase in employee costs. Equitythe six months ended March 31, 2024.
Net legacy and other income increased $1separation-related expenses decreased $3.8 million and $29.1 million for the three and six months ended March 31, 2024, respectively, compared to the prior year quarterperiods attributable to activities that did not recur. In the three and six months ended March 31, 2023, the expense was primarily associated with the modification of certain performance-based unvested stock awards as a result of increased equitythe sale of Global Products as well as expense of $24.4 million to increase the indemnity obligation and royalty income fromreflect the Company's investments in joint ventures, which had increased volumesutilization of certain legacy tax attributes associated with the amendment of the tax matters agreement with its former parent company during the quarter.six months ended March 31, 2023.
Other income, totaled $19net increased $1.6 million and $2.3 million in the current quarter asthree and six months ended March 31, 2024, respectively, compared to $20the prior year periods, primarily due to higher rental income from subleasing properties in connection with the sale of Global Products partially offset by expense associated with an investment impairment of $1.0 million in the prior year quarter. EBITDA decreased $1 million to $20 millionperiod which did not recur.
Net pension and other postretirement plan expenses
Net pension and other postretirement plan expenses were flat in the current quarter. EBITDA margin decreased 2.5 percentage points to 14.3% in the current quarter.
International - EBITDA and Adjusted EBITDA reconciliation
The following EBITDA presentation is provided as a means to enhance the understanding of financial measurements that Valvoline has internally determined to be relevant measures of comparison for the results of International. There were no unusual or key items that affected comparability for Adjusted EBITDA during the three months ended DecemberMarch 31, 20172024 and 2016.decreased $0.3 million in the six months ended March 31, 2024 compared to the prior year periods. The decrease was generally attributable to higher recurring expected returns on plan assets partially offset by higher interest costs of the rate environment as a result of the most recent annual remeasurement of the plans.
|
| | | | | | | | |
| | | Three months ended December 31 |
| (In millions) | | 2017 | | 2016 |
| Operating income | | $ | 19 |
| | $ | 20 |
|
| Depreciation and amortization | | 1 |
| | 1 |
|
| EBITDA | | $ | 20 |
| | $ | 21 |
|
| | | | | |
Unallocated and Other
UnallocatedNet interest and other operating income/loss generally includes items suchfinancing expenses
Net interest and other financing expenses increased $2.2 million and decreased $2.9 million during the three and six months ended March 31, 2024, respectively, compared to the prior year periods. While higher rates on outstanding borrowings increased expense during the periods, interest income on invested remaining net proceeds from the sale of Global Products drove benefits. These benefits more than offset the increased expense in the year-to-date period and were lower to partially offset increased expense in the quarter as certain other corporate and non-operational matters, such as company-wide restructuring activities and legacy costs, including those associated with the separation from Ashland. investments matured prior to executing the Tender Offer in April 2024.
Income tax provision
The following table summarizes income tax provision and the components of Unallocatedeffective tax rate for the current and other operating income/lossprior year periods:
| | | | | | | | | | | | | | | | | | | | | | | | | | |
| | Three months ended
March 31 | | Six months ended
March 31 |
| | |
| (In millions) | | 2024 | | 2023 | | 2024 | | 2023 |
| Income tax expense (benefit) | | $ | 14.0 | | | $ | 11.4 | | | $ | 25.9 | | | $ | (8.7) | |
| Effective tax rate percentage | | 24.4 | % | | 25.7 | % | | 25.1 | % | | (17.0) | % |
The increase in income tax expense for the three months ended DecemberMarch 31, 20172024 was principally driven by higher pre-tax earnings, while the reduction in the effective tax rate was primarily attributed to the favorable impact of discrete tax benefits. The increases in income tax expense and 2016:the effective tax rate for the six months ended March 31, 2024 were driven by more normalized activity in the current year period as compared to the prior year period which included the recognition of a $26.5 million income tax benefit for the release of a valuation allowance due to the change in expectations regarding the utilization of certain legacy tax attributes as a result of the terms of the amended tax matters agreement with Valvoline’s former parent company. This amendment also resulted in higher Net legacy and separation-related expenses of $24.4 million for the related increased indemnity obligation for the six months ended March 31, 2023.
(Loss) income from discontinued operations, net of tax
The following summarizes (Loss) income from discontinued operations, net of tax for the current and prior year periods:
| | | | | | | | | | | | | | | | | | | | | | | | | | |
| | Three months ended
March 31 | | Six months ended
March 31 |
| | |
| (In millions) | | 2024 | | 2023 | | 2024 | | 2023 |
| (Loss) income from discontinued operations, net of tax | | $ | (1.9) | | | $ | 1,194.4 | | | $ | (3.9) | | | $ | 1,249.3 | |
| | | | | | | | |
Earnings from discontinued operations declined $1.196 billion and $1.253 billion in the three and six months ended March 31, 2024, respectively, compared to the prior year periods primarily due to the recognition of a gain on the sale of the Global Products business in March 2023 resulting in costs associated with the separation of processes
|
| | | | | | | | |
| | | Three months ended December 31 |
| (In millions) | | 2017 | | 2016 |
| Separation costs | | $ | (2 | ) | | $ | (6 | ) |
| Adjustments associated with Ashland tax indemnity | | (7 | ) | | — |
|
| Operating loss | | $ | (9 | ) | | $ | (6 | ) |
| | | | | |
23
and systems and no longer reflecting operational results from the underlying business for the three and six months ended March 31, 2024.
Unallocated
Continuing operations adjusted net revenues
The following table reconciles Net revenues to Adjusted net revenues for the current and other had operating lossprior year periods:
| | | | | | | | | | | | | | | | | | | | | | | | | | |
| | Three months ended
March 31 | | Six months ended
March 31 |
| (In millions) | | 2024 | | 2023 | | 2024 | | 2023 |
| Reported net revenues | | $ | 388.7 | | | $ | 344.5 | | | $ | 762.1 | | | $ | 677.3 | |
| Key items: | | | | | | | | |
Suspended operations (a) | | — | | | — | | | — | | | (0.2) | |
Adjusted net revenues (b) (c) | | $ | 388.7 | | | $ | 344.5 | | | $ | 762.1 | | | $ | 677.1 | |
| | | | | | | | |
(a)Represents the results of $9a former Global Products business where operations were suspended during fiscal 2022 that were not included in the sale.
(b)Adjusted net revenues are reported net revenues adjusted for key items.
(c)Represents a non-GAAP measure. Refer to “Use of Non-GAAP Measures” for management’s definitions of the metrics presented above.
Continuing operations EBITDA and Adjusted EBITDA
The following table reconciles Income from continuing operations to EBITDA and Adjusted EBITDA for the current and prior year periods:
| | | | | | | | | | | | | | | | | | | | | | | | | | |
| | Three months ended
March 31 | | Six months ended
March 31 |
| (In millions) | | 2024 | | 2023 | | 2024 | | 2023 |
| Income from continuing operations | | $ | 43.3 | | | $ | 32.9 | | | $ | 77.2 | | | $ | 59.9 | |
| Income tax expense (benefit) | | 14.0 | | | 11.4 | | | 25.9 | | | (8.7) | |
| Net interest and other financing expenses | | 15.5 | | | 13.3 | | | 29.1 | | | 32.0 | |
| Depreciation and amortization | | 25.6 | | | 20.6 | | | 50.2 | | | 39.1 | |
EBITDA from continuing operations (a) | | 98.4 | | | 78.2 | | | 182.4 | | | 122.3 | |
Net pension and other postretirement plan expenses (b) | | 3.6 | | | 3.6 | | | 7.0 | | | 7.3 | |
Net legacy and separation-related expenses (c) | | — | | | 3.8 | | | 0.1 | | | 29.2 | |
Information technology transition costs (d) | | 3.1 | | | 0.4 | | | 5.8 | | | 0.7 | |
Investment and divestiture-related costs (e) | | — | | | 1.0 | | | — | | | 1.0 | |
Suspended operations (f) | | — | | | 0.1 | | | — | | | (0.1) | |
Adjusted EBITDA from continuing operations (a) | | $ | 105.1 | | | $ | 87.1 | | | $ | 195.3 | | | $ | 160.4 | |
| | | | | | | | | |
| | | | | |
| (a) | EBITDA from continuing operations is defined as income from continuing operations, plus income tax expense (benefit), net interest and other financing expenses, and depreciation and amortization attributable to continuing operations. Adjusted EBITDA from continuing operations is EBITDA adjusted for key items attributable to continuing operations. |
| (b) | Includes several elements impacted by changes in plan assets and obligations that are primarily driven by the debt and equity markets, including remeasurement gains and losses, when applicable; and recurring non-service pension and other postretirement net periodic activity, which consists of interest cost, expected return on plan assets and amortization of prior service credits. Management considers these elements are more reflective of changes in current conditions in global markets (in particular, interest rates), outside the operational performance of the business, and are also legacy amounts that are not directly related to the underlying business and do not have an impact on the compensation and benefits provided to eligible employees for current service. Refer to Note 7 in the Notes to Condensed Consolidated Financial Statements in Item 1 of Part I in this Quarterly Report on Form 10-Q for further details. |
| | | | | |
| (c) | Activity associated with legacy businesses, including the separation from Valvoline’s former parent company and its former Global Products reportable segment. This activity includes the recognition of and adjustments to indemnity obligations to its former parent company; certain legal, financial, professional advisory and consulting fees; and other expenses incurred by the continuing operations in connection with and directly related to these separation transactions and legacy matters. This incremental activity directly attributable to legacy matters and separation transactions is not considered reflective of the underlying operating performance of the Company’s continuing operations. During the six months ended March 31, 2023, the Company recognized $24.4 million of pre-tax expense to reflect its increased estimated indemnity obligation which also resulted in an income tax benefit of $26.5 million to reflect the release of valuations allowances in connection with the amendment of the Tax Matters Agreement with Valvoline’s former parent company. |
| (d) | Consists of expenses incurred related to the Company’s transition to a stand-alone enterprise resource planning software system during fiscal years 2023 and 2024, including data conversion, temporary support, training, and redundant expenses incurred from duplicative technology platforms during implementation. These expenses are reflective of incremental costs directly associated with technology transitions and data migration that are not considered to be reflective of the ongoing expenses of operating the Company’s technology platforms. |
| (e) | Expense recognized to reduce the carrying value of an investment interest determined to be impaired. This cost is not considered to be reflective of the underlying performance of the Company’s ongoing continuing operations. |
| (f) | Represents the results of a former Global Products business where operations were suspended during fiscal 2022. This business was not included in the sale of the Global Products business in March 2023. It was classified as held for sale and impaired as of September 30, 2023, and subsequently sold during the first fiscal quarter of 2024. These results are not indicative of the operating performance of the Company’s ongoing continuing operations. |
Adjusted EBITDA from continuing operations increased $18.0 million and loss of $6 million duringfor the three months ended DecemberMarch 31, 20172024 and 2016, respectively. The increased operating loss is$34.9 million in thesix months ended March 31, 2024compared to the prior year periods driven by strong revenue growth primarily the result of increased expense relateddue to adjustments recorded for indemnities associated with the Tax Matters Agreement primarily as a result of tax reform legislation,higher average ticket from pricing actions, non-oil change service penetration, and premiumization. In addition, improved labor cost efficiency was partially offset by decreased separation costs from the prior year as the separation from Ashland was completed in May 2017.SG&A investments to support future growth.
FINANCIAL POSITION, LIQUIDITY AND CAPITAL RESOURCES
Overview
The Company closely manages its liquidity and capital resources. Valvoline'sValvoline’s liquidity requirements depend on key variables, including the level of investment needed to support business strategies, the performance of the business, capital expenditures, borrowing arrangements, and working capital management. Capital expenditures, acquisitions, share repurchases, and dividend payments are components of the Company'sCompany’s cash flow and capital management strategy, which to a large extent, can be adjusted in response to economic and other changes in the business environment. The Company has a disciplined approach to capital allocation, which focuses on investing in key priorities that support Valvoline'sValvoline’s business and growth strategies and returning capital to shareholders, while funding ongoing operations.
As of December 31, 2017, the Company had $115 million in Cash andContinuing operations cash equivalents, of which approximately $96 million was held by Valvoline's non-U.S. subsidiaries. The Company utilizes a variety of strategies to deploy available cash in locations where it is needed, and the Company has historically intended to indefinitely reinvest undistributed earnings offlows
its non-U.S. subsidiaries. As a result of the enactment of tax reform legislation in December 2017, undistributed earnings of the Company's non-U.S. subsidiaries were subject to the one-time deemed repatriation tax, which provides certain expected opportunities to repatriate with lower tax consequences. Consequently, the Company began to reevaluate its intentions to indefinitely reinvest its non-U.S. undistributed earnings. The Company now plans to repatriate up to approximately $45 million of previously undistributed earnings of certain non-U.S. subsidiaries where the withholding tax implications are expected to be minimal. The Company is presently not aware of any significant restrictions on the repatriation of these funds and additional taxes and other costs that may arise between the deemed and actual distribution dates are not estimated to be material.
The Company's intent is to continue to indefinitely reinvest the remainder of its undistributed earnings of non-U.S. subsidiaries. Upon any future determination to distribute these earnings, the Company would be subject to certain income and withholding taxes, the amount of which is not practicable to determine given the complexities associated with such a hypothetical calculation, including dependencies on income tax laws and other circumstances in place at the time amounts are distributed.
Cash Flow
Valvoline’s continuing operations cash flows as reflected in the Condensed Consolidated Statements of Cash Flows are summarized as follows for the threesix months ended December 31, 2017 and 2016:March 31:
| | | | | | | | | | | | | | |
| (In millions) | | 2024 | | 2023 |
| | | | |
| | | | |
| Cash provided (used by): | | | | |
| Operating activities | | $ | 92.1 | | | $ | 173.5 | |
| Investing activities | | $ | 230.6 | | | $ | (96.3) | |
| Financing activities | | $ | (237.6) | | | $ | (279.4) | |
| | | | |
| | | | |
| | | | |
| | | | |
|
| | | | | | | |
| | Three months ended December 31 |
| |
| (In millions) | 2017 | | 2016 |
| Cash provided by (used in): | | | |
| Operating activities | $ | 20 |
| | $ | 88 |
|
| Investing activities | (74 | ) | | (10 | ) |
| Financing activities | (31 | ) | | (16 | ) |
| Effect of currency exchange rate changes on cash and cash equivalents | (1 | ) | | 2 |
|
| (Decrease) increase in cash and cash equivalents | $ | (86 | ) | | $ | 64 |
|
Operating activities
The decrease in cash flows provided by operating activities for the three months ended December 31, 2017 compared toof $81.4 million from the prior year period was primarily relateddriven by changes in net working capital. Unfavorable changes in payables and accruals of approximately $60 million were due to the timingestablishment of cash settlements of both assetthe supply agreement and liability working capital accounts, including those related to Valvoline's separation from Ashland that drove higher operating cash flowsother separation-related matters with Global Products in the prior year period . Specifically, in the three months ended December 31, 2016, Valvoline received $23 million from Ashland in customer payments on certain Valvoline receivables that were collected by Ashland and remitted to Valvolineyear. Additionally, a lengthened collection cycle during the period. In addition, Valvoline's accrued liabilities increased bycurrent year due to billing delays in connection with the implementation of a new enterprise resource planning (“ERP”) system contributed approximately $40$25 million duringto the three months ended December 31, 2016 related primarily to transition services, tax sharing and other miscellaneous billings from Ashland. Also, as described furthergrowth in Note 4 of the Notes to Condensed Consolidated Financial Statements included in Item 1 of Part I of this Quarterly Report on Form 10-Q, during the three months ended December 31, 2016, the Company sold $11 million of accounts receivables to a financial institution and did not sell accounts receivable during the three months ended December 31, 2017.working capital.
Investing activities
The increasedecrease in cash flows used in investing activities for the three months ended December 31, 2017 compared toof $326.9 million from the prior year period was primarily relatedsubstantially driven by proceeds from the maturities of short-term investments of $350.0 million. This cash inflow was partially offset by a net outflow of $3.7 million for cash transferred in connection with selling a former Global Products business during the current year, in addition to the acquisitionloans extended to franchisees, net of 56 franchise service centers from Henley Bluewater LLC for $60repayments of $5.2 million, combined with a moderatean increase in acquisition activity of $2.4 million, and increased capital expenditures due to planned investments. Valvoline is currently forecasting approximately$80of $7.8 million to $90 million of capital expenditures for full year fiscal 2018, funded primarily from operating cash flows.support investments in store growth.
Financing activities
The increasedecrease in cash flows used in financing activities for the three months ended December 31, 2017 compared toof $41.8 million from the prior year period was relatedprimarily due to transactions that occurredreturning $45.2 million less in the current year, including payments relatedcash to the repurchase of common stock of $37 million, the purchase ofshareholders through share repurchases from utilizing the remaining ownership interestauthorization under the 2022 Share Repurchase Authorization during the second quarter of fiscal 2024 in addition to a consolidated subsidiary for $15$23.7 million lower borrowings in the period related to the trade receivables securitization facility, and the increase in dividends that resulted in an incremental $5 million payment. These increasesdecrease in cash usage wereinflows from net borrowing activity. This decreased use of cash from the prior year was partially offset by reduced repaymentslower dividends paid of borrowings in$21.8 million as the current year period.Company discontinued its dividend during the second quarter of fiscal 2023 following the sale of Global Products.
FreeContinuing operations free cash flow and other liquidity information
The following table sets forth free cash flow for the disclosed periodsand discretionary free cash flow and reconciles cash flows provided byfrom operating activities to free cash flow. As previously noted,both measures. These free cash flow hasmeasures have certain limitations, including that it doesthey do not reflect adjustments for certain non-discretionary cash flows, such as mandatory debt repayments, and includes pension and other postretirement plan remeasurement gains/losses.repayments. Refer to the “Use of Non-GAAP Measures” section previously included above in this Item 2 for additional information.information regarding these non-GAAP measures.
| | | | | | | | | | | | | | |
| | Six months ended
March 31 |
| (In millions) | | 2024 | | 2023 |
| Cash flows provided by operating activities | | $ | 92.1 | | | $ | 173.5 | |
| Less: Maintenance capital expenditures | | (13.6) | | | (9.7) | |
| Discretionary free cash flow | | 78.5 | | | 163.8 | |
| Less: Growth capital expenditures | | (73.6) | | | (69.7) | |
| Free cash flow | | $ | 4.9 | | | $ | 94.1 | |
|
| | | | | | | | |
| | | Three months ended December 31 |
| (In millions) | | 2017 | | 2016 |
| Cash flows provided by operating activities | | $ | 20 |
| | $ | 88 |
|
| Additions to property, plant and equipment | | (14 | ) | | (9 | ) |
| Free cash flow | | $ | 6 |
| | $ | 79 |
|
FreeThe decrease in free cash flow from continuing operations over the prior year was driven by lower cash flow provided by operating activities in addition to increased capital expenditures during the current period. The increase in maintenance capital expenditures over the prior year period was driven by facility and equipment expenditures due to the growing store count. In addition, the higher growth capital expenditures over the prior year period primarily relate to new store construction. The Company continues to focus the majority of its capital spend toward growth, which is expected to drive a high return on invested capital.
Discontinued operations cash flows
The cash flows of the discontinued operation are reflected in the Condensed Consolidated Statements of Cash Flows and are summarized below for the threesix months ended December 31, 2017 as comparedMarch 31:
| | | | | | | | | | | | | | |
| (In millions) | | 2024 | | 2023 |
| | | | |
| | | | |
| Cash (used in) provided by: | | | | |
| Operating activities | | $ | (3.9) | | | $ | (63.4) | |
| Investing activities | | $ | — | | | $ | 2,623.2 | |
| Financing activities | | $ | — | | | $ | (108.1) | |
The declines in cash flows used in operating and financing activities and those provided from investing activities of the discontinued operation were due to the completion of the sale of Global Products in March 2023, where prior year cash flows were from conducting business within the former Global Products segment and the current year cash flows generally relate to the completion of the separation of the business processes and systems. During the prior year period, cash flows used in operating activities of the discontinued operation were largely driven by trade and other payables activity operating in an unfavorable working capital environment, in addition to transaction costs to support the sale of the Global Products business. Prior year discontinued operations cash flows provided by investing activities were due to the cash consideration received, net of cash transferred to Global Products entities, at the close of the sale of Global Products of $2.6 billion. The decrease in cash flows used in financing activities of discontinued operations was due to net repayments on borrowings during the prior year period, driven by lower cash flows from operating activities as described above, coupledthe extinguishment of the $175 million Trade Receivables Facility.
Debt
Inclusive of the interest rate swap agreements, approximately 83% of Valvoline's outstanding borrowings at March 31, 2024 had fixed interest rates, with higher capital expenditures due to planned investments.
the remainder bearing variable rates. As of DecemberMarch 31, 2017, working capital (current assets minus current liabilities, excluding long-term debt due within one year) amounted to $386 million, compared to $327 million at September 30, 2017. Liquid assets, (cash, cash equivalents, and accounts receivable) was145% of current liabilities as of December 31, 2017 and 123% at September 30, 2017.
Debt
The following summary reflects Valvoline’s debt as of:
|
| | | | | | | |
| | December 31 | | September 30 |
| (In millions) | 2017 | | 2017 |
| Short-term debt | $ | — |
| | $ | 75 |
|
Long-term debt (including current portion and debt issuance cost discounts) (a) | 1,166 |
| | 1,049 |
|
| Total debt | $ | 1,166 |
| | $ | 1,124 |
|
| | | | |
| |
(a) | Amount includes $2 million of debt acquired through acquisitions and is net of $12 million and $13 million of debt issuance cost discounts as of December 31 and September 30, 2017, respectively, which are direct reductions from the carrying amount of debt. |
As of December 31, 2017, the senior secured credit facility consisted of a term loan facility with an aggregate principal outstanding balance of $281 million and a $450 million revolving credit facility with no outstanding balance. The revolving credit facility also allows a portion of the availability to be used for outstanding letters of credit, and as of December 31, 2017, there were $11 million in letters of credit outstanding. As of September 30, 2017, the outstanding principal balance of the term loan facility was $285 million and there was no outstanding balance on the revolving facility.
As of December 31 and September 30, 2017, the Company had outstanding $400 million in aggregate principal balance of 4.375% senior unsecured notes due in 2025 and $375 million in aggregate principal balance of 5.500% senior unsecured notes due in 2024. In December 2017, the Company completed registered exchange offers for the senior notes.
During the first fiscal quarter of 2018, the Company amended the trade receivables securitization facility to extend the maturity date to November 19, 2020 and increase the maximum funding under the facility to $175 million. Valvoline borrowed an additional $45 million under this facility during the three months ended December 31, 2017 and used the proceeds to supplement the daily cash needs of the Company's operations. As of December 31, 2017, $120 million remains outstanding under this facility. As of September 30, 2017, the Company had $75 million outstanding under this facility.
Debt covenant restrictions
Valvoline’s debt contains usual and customary representations and warranties, and usual and customary affirmative and negative covenants, including limitations on liens, additional indebtedness, investments, restricted payments, asset sales, mergers, affiliate transactions and other customary limitations, as well as financial covenants (including maintenance of a maximum consolidated leverage ratio and a minimum consolidated interest coverage ratio). As of the end of any fiscal quarter, the maximum consolidated net leverage ratio and minimum consolidated interest coverage ratio permitted under the 2016 Senior Credit Agreement are 4.5 and 3.0, respectively. As of December 31, 2017,2024, Valvoline was in compliance with all covenants of its debt obligations.obligations and had borrowing capacity remaining of $471.8 million under its Revolver, which was reduced to $296.8 million from borrowing $175.0 million to facilitate the purchase of the 2030 Notes in April 2024.
Pension and Other Postretirement Plan Obligations
During fiscal 2018,On March 14, 2024, the Company commenced the Tender Offer to purchase its outstanding 2030 Notes. The Tender Offer was made to comply with the requirements of the asset sale covenant under the indenture governing the 2030 Notes in connection with the sale of Global Products.
On April 16, 2024, Valvoline completed the Tender Offer with 99.7% of the outstanding principal amount tendered by the holders of the 2030 Notes. The Company used cash and cash equivalents on hand, in addition to borrowing $175.0 million on the Revolver to facilitate the $598.3 million purchase of the 2030 Notes at par, plus accrued and unpaid interest, and cancelled the 2030 Notes accepted for purchase. The Company elected to redeem the remaining balance outstanding of $1.7 million on April 29, 2024 pursuant to the terms and conditions of the indenture governing the 2030 Notes. Valvoline expects to make contributionsrecognize a loss on extinguishment of approximately $14the 2030 Notes of $5.1 million to its pension plans related to its U.S. non-qualified and non-U.S. pension plans, of which contributions of $3 million were made during the three months ended Decemberthird quarter of fiscal 2024 due to the write-off of unamortized debt issuance costs and discounts. The 2030 Notes are reported in Current portion of long-term debt within the Condensed Consolidated Balance Sheet as of March 31, 2017. 2024.
Refer to Note 95 of the Notes to Condensed Consolidated Financial Statements for additional information.details regarding the Company’s debt instruments.
Tax-related CommitmentsShare repurchases
On December 22, 2017, the President of the United States signed into law tax reform legislation (the “Act”), which is generally effective January 1, 2018. The Act includes a number of provisions, including lowering the U.S. corporate federal income tax rate from a maximum of 35% to 21% and changing or limiting certain tax deductions. While the Company expects the Act will ultimately benefit Valvoline, it also includes provisions that are expected to offset some of the benefit of the rate reduction, including the repeal of the deduction for domestic production activities and the expansion of the limitation on the deduction of certain executive compensation. In addition, the Act alters the landscape of taxation of non-U.S. operations and provides immediate deductions for certain new investments, among other provisions.
During the threesix months ended DecemberMarch 31, 2017, enactment of the Act resulted in pre-tax expense of $7 million and income tax expense of $68 million due to the following:
The remeasurement of net deferred tax assets at the lower enacted corporate tax rate resulted in a net $67 million increase in income tax expense;
The deemed repatriation tax on unremitted non-U.S. earnings and profits resulted in a $4 million increase in income tax expense; and
The remeasurement of net indemnity liabilities associated with the Tax Matters Agreement increased pre-tax expense by $7 million and generated a $3 million tax benefit related to the higher expected utilization of tax attributes payable to Ashland.
Based on the Company's provisional estimates of the impacts of the Act, management expects there will be a net favorable impact on Valvoline and its U.S. operations primarily due to the reduction in the federal statutory income tax rate. Set forth below is a discussion of certain provisions of the Act and the Company's preliminary assessment of the impact of such provisions on Valvoline's consolidated financial statements:
Given the effective date of the rate reduction in the Act, the Company's statutory federal corporate tax rate for fiscal 2018 will be a blended rate of 24.5%, with the federal statutory rate of 21% beginning in fiscal 2019. Inclusive of the reduction of the annual estimated effective tax rate and combined with income tax expense recorded in the three months ended December 31, 2017 related to the enactment of the Act,2024, the Company currently anticipates an estimated consolidated effective tax rate between 44% and 45%repurchased 6.3 million shares of its common stock for fiscal 2018. The reduced federal tax rate is expected to result in overall lower income tax expense in fiscal 2019, and$211.5 million utilizing the Company currently expects that its consolidated effective tax rate for fiscal 2019 will be between 25% and 26%. Such estimates are based on management’s current assumptions with respect to, among other things, the Company’s earnings, state income tax levels and tax deductions.
The Act implements a new territorial tax system and imposes a one-time U.S. tax on the deemed repatriation of certain accumulated non-U.S. earnings and profits. The Company currently expects to settle the related gross liability of approximately $22 million through utilization of foreign tax credits of $18 million, resulting in a net impact of $4 million which was recorded as income tax expense in the three months ended December 31, 2017. As a result of certain opportunities to repatriate with estimated lower tax consequences, the Company now intends to repatriate up to approximately $45 million of previously undistributed non-U.S. earnings in the foreseeable future.
The Act expands the limitation on the deduction of certain executive compensation. This expansion is subject to transition rules that provide grandfather relief. The Company has currently estimated that these deduction limitations will primarily be effective in future periods.
The Act repeals the deduction for domestic manufacturing production activities. With Valvoline’s domestic manufacturing footprint, the repeal will have an unfavorable impact beginning in fiscal 2019.
The Act includes a new incentive for U.S. companies to produce goods and services domestically and sell them abroad, which the Company expects will have a favorable impact on Valvoline beginning in fiscal 2019.
The Act provides for an election of 100 percent tax depreciation on certain property expenditures through 2022. The depreciation percentage will be phased down beginning in 2023 through 2026, when the prior depreciation rules will return. The Company expects to benefitremaining authorization available from this provision related to the timing of deductions for investments.
Given the Company's present financial profile, management expects to fully deduct interest expense under the present and future limitation rules under the Act.
The Company generally expects taxable state income will increase as a result of deduction limitations associated with the Act. However, the impact is not currently reasonably estimable as most U.S. state tax jurisdictions have not responded to the specific effects of the Act.
As summarized above, based on the Company's provisional estimates of the impacts of the Act, management expects there will be a net favorable impact on Valvoline, taking into account the impact on profitability and improved capital generation, which will provide the Company the opportunity to evaluate the potential utilization of the expected savings to increase or accelerate investments in its business and growth.
The estimated impacts of the Act recorded during the three months ended December 31, 2017 as well as the forward-looking estimates are provisional in nature, and the Company will continue to assess the impact of the Act and provide additional information and record adjustments through the income tax provision in the relevant period as amounts are known and reasonably estimable during the measurement period. Accordingly, the impact of the Act may differ from the Company's provisional estimates due to and among other factors, information currently not available, changes in interpretations and the issuance of additional guidance, as well as changes in assumptions the Company has currently made, including actions the Company may take in future periods as a result of the Act.
Dividend Payments and Share Repurchases
For the three months ended December 31, 2017, the Company paid cash dividends of $0.0745 per common share for $15 million. On January 31, 2018, the Valvoline Board of Directors declared a quarterly cash dividend of $0.0745 per share on Valvoline common stock. The dividend is payable on March 15, 2018 to shareholders of record on March 1, 2018.
Future declarations of quarterly dividends are subject to approval by the Board of Directors and may be adjusted as business needs or market conditions change. For the three months ended December 31, 2016,for the Company paid cash dividendsto repurchase up to $1.6 billion of $0.049 perits common share for $10 million.
For the three months ended December 31, 2017, the Company repurchased approximately 2 million shares for $39 million under the $150 million share repurchase authorization approved by the Board of Directorsstock announced on April 24, 2017November 15, 2022 (the “2017“2022 Share Repurchase Authorization”). As of DecemberMarch 31, 2017, there was $61 million of share repurchase authority remaining under the 2017 Share Repurchase Authorization. This repurchase authority allows2024, the Company to repurchase its stock from time to time inrepurchased the open market or in privately negotiated transactions depending upon market price and other factors. Repurchases were and will continue to be in accordance with all applicable securities laws and regulations and funded from available liquidity. The Company did not repurchase shares during the three months ended December 31, 2016.
On January 31, 2018, the Board of Directors of Valvoline:
Declared a quarterly cash dividend of $0.0745 per share on Valvoline common stock that is payable on March 15, 2018 to shareholders of record on March 1, 2018; and
Authorized the Company to repurchase up to $300 millionfull amount of its common stock through September 30, 2020, which amount is in addition tounder the 20172022 Share Repurchase Authorization.Authorization and no other share repurchase authorizations have been approved.
Off-Balance Sheet Arrangements and Contractual Obligations
Other than the matters disclosed in this Quarterly Report on Form 10-Q andThe share repurchase authorization is part of a broader capital allocation framework to deliver value to shareholders by first driving growth in the ordinary course of business, since the end of fiscal 2017, there have been no material changes in the Company's contractual obligations. See the Annual Report on Form 10-K for the fiscal year ended September 30, 2017 for additional information regarding the Company's off-balance-sheet arrangementsorganically and contractual obligations.through acquisitions and franchise development, and then returning excess cash to shareholders through share repurchases.
Summary
As of DecemberMarch 31, 2017,2024, Valvoline had cash and cash equivalents totaled $115of $494.5 million, total debt of $1,575.1 million, and total debt was $1.2 billion. Valvoline'sremaining borrowing capacity of $471.8 million, which decreased to $296.8 million subsequent to borrowing $175.0 million on the Revolver to facilitate the purchase of the 2030 Notes in April 2024. Valvoline’s ability to continue to generate positive cash flows from operations is dependent on general economic conditions, and the competitive environment in the industry, and is subject to the business and other risk factors described in Item 1A of Part II of this Quarterly Report on Form 10-Q and Item 1A of Part I of the Annual Report on Form 10-K for the fiscal year ended September 30, 2017. If the Company is unable to generate sufficient cash flows from operations, or otherwise comply with the terms of its credit facilities, Valvoline may be required to seek additional financing alternatives. Valvoline's financial position has enabled it to achieve a Moody's rating of Ba2 and a Standard & Poor’s rating of BB+, which was upgraded in the fourth fiscal quarter of 2017. Subsequent changes to ratings may have an effect on Valvoline's borrowing rate or ability to access capital markets in the future. Borrowing capacity under the 2016 Senior Credit Agreement was $439 million (due to a $11 million reduction for letters of credit) and based on the availability of eligible receivables, $39 million under the trade receivables securitization facility as of December 31, 2017.2023.
Management believes that the Company has sufficient liquidity based on its current cash, position,cash equivalents, cash generated from business operations, and existing financing to meet its required pension and other postretirement plan contributions,contributions; debt servicing obligations, including the purchase of the 2030 Notes in connection with the Tender Offer; tax-related and other contractual commitments, as well asmaterial cash and operating requirements for the next twelve months.
RECENT
NEW ACCOUNTING PRONOUNCEMENTS
For a discussion and analysis of recently issued accounting pronouncements and the impactimpacts on Valvoline, refer to Note 1 in the Notes to Condensed Consolidated Financial Statements in Item 1 of Part I inof this Quarterly Report on Form 10-Q.
CRITICAL ACCOUNTING POLICIES AND ESTIMATES
The Company'sCompany’s critical accounting policies and estimates are discussed in detaildescribed in Item 7 of Part II in Valvoline’s Annual Report on Form 10-K for the fiscal year ended September 30, 2017. As described in Note 1 of the Notes to Condensed Consolidated Financial Statements included in Item 1 of Part I in this Quarterly Report on Form 10-Q, the Company adopted accounting policy changes related to the classification of non-service pension and other postretirement net periodic income effective October 1, 2017. Accordingly, Net pension and other postretirement plan non-service income and remeasurement adjustments for all periods presented has been reclassified from within operating income to non-operating income within the Condensed Consolidated Statements of Comprehensive Income.
2023. Management reassessed the critical accounting policiesestimates as disclosed in the Annual Report on Form 10-K, and determined there were no other changes to critical accounting policies in the threesix months ended DecemberMarch 31, 2017. There were also no significant changes in estimates associated with those policies.2024.
ITEM 3. QUANTITATIVE AND QUALITATIVE DISCLOSURES ABOUT MARKET RISK
The Company'sCompany’s market risks are discussed in detail in Item 7A of Part II in Valvoline’sValvoline's Annual Report on Form 10-K for the fiscal year ended September 30, 2017.2023. Management reassessed the quantitative and qualitative market risk disclosures as described in the Annual Report on Form 10-K and determined there were no material changes to market risks in the threesix months ended DecemberMarch 31, 2017.2024.
ITEM 4. CONTROLS AND PROCEDURES
Evaluation of Disclosure Controls and Procedures
Valvoline's Chief Executive Officer (“CEO”) and Chief Financial Officer (“CFO”), with the assistance of management, have evaluated the effectiveness of the Company's disclosureDisclosure controls and procedures (as defined in Rules 13a-15(e) and 15d-15(e) under the Securities Exchange Act of 1934, as amended (“Exchange Act”)), as of the end of the period covered by this Quarterly Report on Form 10-Q (the “Evaluation Date”), and based upon such evaluation, have concluded that as of the Evaluation Date, the Company's disclosure controls and procedures were effective. These controls are designed to ensure that information required to be disclosed in the reports that are filed or submitted under the Exchange Act is recorded, processed, summarized, and reported within the time periods specified in the rules and forms of the Securities and Exchange Commission, (“SEC”), and that such information is accumulated and communicated to Valvoline'sValvoline’s management, including the CEOChief Executive Officer (“CEO”) and CFO,Chief Financial Officer (“CFO”), to allow timely decisions regarding required disclosure. Management recognizes that any controls and procedures, no matter how well designed and operated, can provide only reasonable assurance of achieving their objectives.
Valvoline’s CEO and CFO, with the assistance of management, have evaluated the effectiveness of the Company’s disclosure controls and procedures, as of the end of the period covered by this Quarterly Report on Form 10-Q (the “Evaluation Date”), and based upon such evaluation, have concluded that as of the Evaluation Date, the Company’s disclosure controls and procedures were not effective at the reasonable assurance level due to a material weakness in internal control over financial reporting as described below.
Notwithstanding the conclusion that disclosure controls and procedures were not effective as of March 31, 2024 due to the material weakness, management implemented and enhanced certain manual controls intended to ensure the condensed consolidated financial statements included in this Quarterly Report on Form 10-Q are fairly presented in all material respects. Accordingly, the Company believes there are no material inaccuracies or omissions of material fact in its condensed consolidated financial statements included in this Quarterly Report on Form 10-Q and that such financial statements present fairly, in all material respects, the financial position, results of operations and cash flows as of and for each of the periods presented herein in accordance with U.S. GAAP.
Changes in Internal Control
ThereDuring the three months ended March 31, 2024, Valvoline implemented a new ERP system to facilitate the separation from its former Global Products reportable segment that was sold in March 2023. This new ERP system will better accommodate the Company’s retail business model and support its continued growth. As a result of the ERP system implementation, Valvoline implemented new or modified certain pre-existing internal controls, processes and procedures. These modifications also concluded certain transition services between the Company and its former Global Products reportable segment, whereby certain stand-alone processes were implemented commensurate with the system go-live. Other than these changes and the ongoing remedial efforts described further below, there have been no significant changes in Valvoline’sthe Company’s internal control over financial reporting that occurred during the three monthsfiscal quarter ended DecemberMarch 31, 20172024 that have materially affected, or are reasonably likely to materially affect, Valvoline’s internal control over financial reporting.
Material Weakness in Internal Control over Financial Reporting
In connection with the implementation of the new ERP system on January 1, 2024, a material weakness in internal control over financial reporting arose. A material weakness is a deficiency, or a combination of deficiencies, in internal control over financial reporting, such that there is a reasonable possibility that a material misstatement of a company’s annual or interim financial statements will not be prevented or detected on a timely basis. The material weakness relates to the Company’s January 2024 implementation of a new ERP system and its related impact on IT general controls. Specifically, the Company did not ensure adequate (a) system design for certain business processes, (b) segregation of duties reviews for a portion of time during the three-month period ended March 31, 2024, and (c) evidence to support the rigor of change management activities, sensitive access reviews, and design of user roles and application controls, including certain reports, automated jobs and interfaces.
The material weakness did not result in any identified misstatements to the condensed consolidated interim financial statements. However, if not timely remediated, the material weakness could impact maintaining effective systematic access, as well as the effectiveness of IT-dependent controls (such as automated controls and underlying information that supports the effectiveness of IT system-generated data and reports to address the risk of material misstatement).
Remedial Measures
Management has been actively developing and executing remedial plans following the ERP implementation. The remedial efforts are planned to be completed during the course of management’s annual assessment of the effectiveness of its internal control over financial reporting and include the following:
•Establishment of a plan to stabilize the ERP system for the classes of transactions with inadequate initial system design, including the continued execution of manual control activities to address the periods of time with systematic deficiencies;
•Enhancement of the design of provisioning and review of user access to confirm that such access, including privileged access and segregation of duties, was appropriate during the period following implementation, as validating user access and segregation of duties for appropriateness at quarter-end is substantially complete;
•Improvement of the consistency of manually reviewing the appropriateness of changes to the ERP environment for proper authorization, testing, and implementation until a change management tool can be implemented to centrally retain this evidence; and
•Completion of end-to-end business process walkthroughs to identify the points in the process for each significant class of transactions where risk of material misstatement exists to validate the design and operational effectiveness of responsive controls, including application controls, such as system configuration, reports, automated jobs and interfaces.
Management believes the foregoing efforts will effectively remediate the material weakness; however, remediation will not be considered complete until the relevant controls operate effectively for a sufficient period of time and this conclusion is reached through testing to validate effectiveness. As the Company continues to evaluate and work to improve its internal control over financial reporting, management may take additional measures to address control deficiencies or modify the remedial efforts and timeline described above.
The Company started the remediation process outlined above prior to March 31, 2024.
ITEM 5. OTHER INFORMATION
Rule 10b5-1 Trading Plans
From time to time, the Company’s officers and directors enter into equity trading plans with their brokers, which are intended to satisfy the affirmative defense conditions of Rule 10b5-1(c) under the Securities and Exchange Act of 1934 (a “Rule 10b5-1 Trading Plan”). A Rule 10b5-1 Trading Plan is a written agreement between the officer or director and such person’s broker that pre-establishes the formula for determining the amounts, prices, and dates of Valvoline common stock and does not permit the officer or director to exercise any subsequent influence over how, when or whether to effect purchases or sales. In addition, the officer or director must represent that he or she is not aware of any material nonpublic information concerning Valvoline or its common stock upon execution of the Rule 10b5-1 Trading Plan. The Company’s insider trading policy requires a 90-day cooling-off period before transactions may be executed pursuant an officer’s or director’s Rule 10b5-1 Trading Plan.
During the three months ended March 31, 2024, no director or officer, as defined in Rule 16a-1(f), of Valvoline adopted or terminated any contract, instruction or written plan for the purchase or sale of the Company’s securities that was intended to satisfy the affirmative defense conditions of Rule 10b5-1(c) or any “non Rule 10b5-1 trading arrangement” as defined in Item 408 of Regulation S-K.
PART II - OTHER INFORMATION
ITEM 1. LEGAL PROCEEDINGS
From time to time, Valvoline is involved inparty to lawsuits, claims and other legal actionsproceedings that arise in the ordinary course of business. While Valvoline cannot predict with certaintyFor a description of Valvoline's legal proceedings, refer to Note 8 of the outcome, costs recognized with respectNotes to such actions were immaterial during the three months ended December 31, 2017. Valvoline does not have any currently pending claims or litigation which Valvoline believes, individually orCondensed Consolidated Financial Statements included in the aggregate, will have a material adverse effectItem 1 of Part I of this Quarterly Report on its financial position, results of operations, liquidity or capital resources. While Valvoline cannot predict with certainty the outcome of such matters, where appropriate, adequate reserves have been recorded, which were not material as of December 31, 2017. There is a reasonable possibility that a loss exceeding amounts already recognized may be incurred related to these matters; however, Valvoline currently believes that such potential losses will not be material.Form 10-Q.
ITEM 1A. RISK FACTORS
DuringInformation about the period covered by this report, there were no material changes from theCompany’s risk factors previously disclosedis contained in Valvoline'sItem 1A of Part I in Valvoline’s Annual Report on Form 10-K for the fiscal year ended September 30, 2017.2023. Except for the addition of the risk factor set forth below, there have been no material changes to the Company’s risk factors previously disclosed.
The Company’s recently implemented ERP system has adversely impacted Valvoline’s internal controls and working capital and could continue to negatively impact the business if remedial efforts are not timely and effective.
Valvoline relies upon its ERP application to assist in managing certain business processes and summarizing operational and financial results. Following the sale of the former Global Products reportable segment in fiscal 2023, and as part of Valvoline’s continued evolution to a standalone retail business, the Company has been in the process of separating certain business processes, information systems and applications that were previously shared to support both businesses. On January 1, 2024, Valvoline implemented a new ERP application intended to better accommodate the retail business model and support the Company’s continued growth.
A material weakness in internal control over financial reporting arose in connection with the Company’s implementation of the new ERP system and its related impact on IT general controls, which included deficiencies related to certain business processes that were not adequately designed at the time of system implementation. While the ERP system is intended to ultimately improve and enhance business processes, its implementation resulted in disruptions to maintaining an effective internal control environment and the timely processing of invoices and billings to franchisee, independent operator and fleet customers. Although the new ERP application is not currently utilized in the day-to-day operations of Valvoline’s retail stores and there have been no material impacts on its ability to serve customers to-date, the conversion to any new IT system exposes the Company to additional risks and possible continued disruptions, including the loss of information, unauthorized access and systematic changes, disruption to normal operations, and risks associated with integrations with other applications and processes.
Implementing the new ERP system has required, and the efforts associated with mitigation, remediation, and enhancements will continue to require, the investment of significant personnel and financial resources. Failure to adequately and timely address any known or potential issues to ensure the new ERP system operates as intended could result in unexpected incremental costs and diversion of management’s attention and resources, further interruptions or delays in processes and challenges with vendor and customer relationships, difficulty in achieving and maintaining effective internal controls and issuing timely and accurate financial results. Valvoline management has implemented a remedial plan, as described in Item 4, Evaluation of Disclosure Controls and Procedures, which is expected to be completed by the end of fiscal 2024. However, management cannot provide any assurance that such remedial measures, or any other remedial measures taken, will be effective and identify or address all inherent risks from implementing an ERP application. If this remediation fails or other material weaknesses arise, it may adversely affect operating results, the trading price of Valvoline’s common stock, internal control over financial reporting, or the ability to effectively manage the business.
ITEM 2. UNREGISTERED SALES OF EQUITY SECURITIES AND USE OF PROCEEDS
During the three months ended December 31, 2017, theThe Company repurchased 1.6approximately 1 million shares of its common stock for $39during the three months ended March 31, 2024, utilizing the $40.4 million underremaining on the 20172022 Share Repurchase Authorization. Under the authorization, shares may be repurchased on the open market, through Rule 10b5-1 trading plans, Rule 10b-18 repurchase programs and accelerated share acquisition programs. As of December 31, 2017, $61 million remains available for repurchase under this authorization, and on January 31, 2018, the Board of Directors of Valvoline authorized the Company to repurchase up to $300 million of its common stock through September 30, 2020, which amount is in addition to the 2017 Share Repurchase Authorization.
Share repurchase activity during the three months ended DecemberMarch 31, 2017 was as2024 follows:
| | | | | | | | | | | | | | |
| Monthly period | Total number of shares purchased | Average price paid per share | Total number of shares purchased as part of publicly announced plans or programs | Dollar value of shares that may yet be purchased
under the plans or programs
(in millions) |
| January 1, 2024 - January 31, 2024 | — | | | — | | $ | 40.4 | |
| February 1, 2024 - February 29, 2024 | 849,511 | | $ | 40.55 | | 849,511 | | $ | 5.9 | |
| March 1, 2024 - March 31, 2024 | 136,557 | | $ | 43.51 | | 136,557 | | $ | — | |
| Total | 986,068 | | $ | 40.96 | | 986,068 | | |
|
| | | | | | | | | | | | | | |
| Fiscal Period | | Total Number of Shares Purchased (1) | | Average Price Paid per Share, including Commission | | Total Number of Shares Purchased as Part of Publicly Announced Plans or Programs (2) | | Dollar Value of Shares That May Yet Be Purchased Under the Plans or Programs (in millions) (2) |
October 1, 2017 to October 31, 2017 | | — |
| | $ | — |
| | — |
| | $ | 100 |
|
| November 1, 2017 to November 30, 2017 | | 747,265 |
| | $ | 24.04 |
| | 737,629 |
| | $ | 82 |
|
December 1, 2017 to December 31, 2017 | | 875,728 |
| | $ | 24.58 |
| | 875,728 |
| | $ | 61 |
|
| Total | | 1,622,993 |
| | | | | 1,613,357 |
| | | |
(1) Total number of shares purchased includes both shares repurchased under the Board of Directors authorization described above, as well as vested restricted stock awards purchased to cover withholding taxes.
(2)Further information regarding the Company's share repurchases can be found in Note 12 of the Notes to Condensed Consolidated Financial Statements in Item 1 of Part I of this Quarterly Report on Form 10-Q.
ITEM 6. EXHIBITS
| | | | | |
| |
| 10.1* |
| |
| |
| |
| |
| |
| |
| |
| |
| |
| |
| |
| |
| 31.1* | First Amendment to the Transfer and Administration Agreement, dated as of November 20, 2017, among Valvoline LLC, Lex Capital LLC, the Originators, the Investors, Letter of Credit Issuers, Managing Agents and Administrators party thereto, and PNC Bank National Association, as agent for the Investors. |
| |
31.1* | |
| |
| 31.2* | |
| |
| 32** | |
| |
| 101.INS | XBRL Instance Document - the instance document does not appear in the Interactive Data File because its XBRL tags are embedded within the Inline XBRL document. |
101101.SCH | XBRL Taxonomy Extension Schema Document. |
| 101.CAL | XBRL Taxonomy Extension Calculation Linkbase Document. |
| 101.DEF | XBRL Taxonomy Extension Definition Linkbase Document. |
| 101.LAB | XBRL Taxonomy Extension Label Linkbase Document. |
| 101.PRE | XBRL Taxonomy Extension Presentation Linkbase Document. |
| 104 | Cover Page Interactive data files pursuant to Rule 405 of Regulation S-T: (i) the Condensed Consolidated Statements of Comprehensive Income for the three months ended December 31, 2017Data File (formatted as inline XBRL and 2016, (ii) the Condensed Consolidated Balance Sheets at December 31, 2017 and September 30, 2017, (iii) the Condensed Consolidated Statements of Cash Flows for the three months ended December 31, 2017 and 2016, and (iv) the Notes to Condensed Consolidated Financial Statements.contained in Exhibit 101). |
* Filed herewith.
SM Service mark, Valvoline or its subsidiaries, registered in various countries.** Furnished herewith.
™ Trademark, Valvoline or its subsidiaries, registered in various countries.
† Trademark owned by a third party.SM Service mark, Valvoline or its subsidiaries, registered in various countries.
SIGNATURE
Pursuant to the requirements of the Securities Exchange Act of 1934, the Registrant has duly caused this report to be signed on its behalf by the undersigned thereunto duly authorized.
| | | | | | | | |
| VALVOLINE INC. |
| | (Registrant) |
| | VALVOLINE INC. |
| May 10, 2024 | (Registrant) |
| By: | | |
February 8, 2018 | By: | /s/ Mary E. Meixelsperger |
| | Mary E. Meixelsperger |
| | Chief Financial Officer |
| | |
| | |