U.S. UNITED STATES
SECURITIES AND EXCHANGE COMMISSION
WASHINGTON, D.C. 20549
FormFORM 10-Q
Quarterly Report Under[X] QUARTERLY REPORT PURSUANT TO SECTION 13 OR 15(d) OF THE SECURITIES EXCHANGE ACT OF 1934
For the Securities Exchange Act ofquarterly period ended March 31, 2021
[ ] TRANSITION REPORT PURSUANT TO SECTION 13 OR 15(d) OF THE SECURITIES EXCHANGE ACT OF 1934
For Quarter Ended: June 30, 2018the transition period from _________ to _________.
Commission File Number: 000-52898
urban-gro, Inc.Inc.
(Exact name of small business issuerregistrant as specified in its charter)
| 46-5158469 | ||
(State incorporation or organization) | (I.R.S. Employer Identification No.) |
1751 Panorama Point, Unit G Lafayette, CO | 80026 | |
| (Address of principal executive offices) | ( |
(720) 390-3880 (Registrant’s telephone number, including area code) |
1751 Panorama Point
Unit G
Lafayette, CO 80026
(AddressSecurities registered pursuant to Section 12(b) of principal executive offices)the Act: None
(720) 390-3880
(Issuer’s Telephone Number)
| Title of each class | Trading Symbol(s) | Name of each exchange on which registered | ||
Common Stock, $0.001 par value | UGRO | NASDAQ |
Indicate by check mark whether the registrant (1) has filed all reports required to be filed by Section 13 or 15(d) of the Securities Exchange Act of 1934 during the preceding 12 months (or for such shorter period that the registrant was required to file such reports), and (2) has been subject to such filing requirements for the past 90 days:days. Yes ☐[X] No ☒[ ]
Indicate by check mark whether the registrant has submitted electronically and posted on its corporate Web site, if any, every Interactive Data File required to be submitted and posted pursuant to Rule 405 of Regulation S-T (§232.405 of this chapter) during the preceding 12 months (or for such shorter period that the registrant was required to submit and post such files). Yes ☑[X] No ☐[ ]
Indicate by check mark whether the registrant is a large accelerated filer, an accelerated filer, a non-accelerated filer, a smaller reporting company, or an emerging growth company. See the definitions of “large accelerated filer,” “accelerated filer”,filer,” “smaller reporting company”,company,” and “emerging growth company” in Rule 12b-2 of the Exchange Act. (Check one)
| Large accelerated filer | Accelerated filer | |
| Non-accelerated filer [X] | Smaller reporting company [X] | |
| Emerging growth company | [X] |
If an emerging growth company, indicate by check mark if the registrant has elected not to use the extended transition period for complying with any new or revised financial accounting standards provided pursuant to Section 13(a) of the Exchange Act.☐ [ ]
Indicate by check mark whether the registrant is a shell company (as defined in Rule 12b-2 of the Exchange Act). Yes☐ [ ] No ☑[X]
The number of shares of the registrant’s only class of common stock issued and outstanding as of August 16, 2018,May 11, 2021 was 24,808,00010,868,137 shares.
urban gro, Inc.
FORM 10-Q
For the Three Months Period Ended March 31, 2021
| 2 |
FORWARD LOOKING STATEMENTS
This Report on Form 10-Q (the “Report”) contains forward-looking statements within the meaning of Section 27A of the Securities Act of 1933, as amended (the “Securities Act”), and Section 21E of the Securities Exchange Act of 1934, as amended (the “Exchange Act”). Forward looking statements are statements not based on historical information and which relate to future operations, strategies, financial results or other developments. The statements regarding urban-gro, Inc. contained in this Report that are not historical in nature, particularly those that utilize terminology such as “may,” “will,” “should,” “likely,” “expects,” “anticipates,” “estimates,” “believes” or “plans,” or comparable terminology, are forward-looking statements based on current expectations and assumptions that are inherently subject to significant business, economic and competitive uncertainties and contingencies, many of which are beyond our control and many of which, with respect to future business decisions, are subject to change. These uncertainties and contingencies can affect actual results and could cause actual results to differ materially from those expressed in any forward-looking statements made by, or on our behalf. We caution readers regarding certain forward-looking statements in this Report and in any other statement made by, or on our behalf, whether or not in future filings with the Securities and Exchange Commission (the “SEC”).
Important factors known to us that could cause such material differences are identified in this Report, including the factors described in Part I, Item 1A, Risk Factors, of our Annual Report on Form 10-K for the year ended December 31, 2020. Except as required by applicable law, we undertake no obligation to correct or update any forward-looking statements, whether as a result of new information, future events or otherwise. You are advised, however, to consult any future disclosures we make on related subjects in future reports to the SEC.
| 3 |
urban-gro, Inc.
CONDENSED CONSOLIDATED BALANCE SHEETS
(unaudited)
| June 30, | December 31, | ||||||||
| 2018 | 2017 | ||||||||
| (Unaudited) | (Audited) | ||||||||
| Assets | |||||||||
| Current Assets | |||||||||
| Cash | $ | 1,023,284 | $ | 1,656,791 | |||||
| Accounts receivable, net | 896,797 | 642,553 | |||||||
| Inventory | 1,183,032 | 1,124,714 | |||||||
| Related party receivable | 31,804 | 13,540 | |||||||
| Prepayments and advances | 1,165,347 | 859,277 | |||||||
| Total current assets | 4,300,264 | 4,296,875 | |||||||
| Non current assets | |||||||||
| Property, plant, and equipment, net | 284,770 | 224,824 | |||||||
| Investments | 539,771 | 400,000 | |||||||
| Other assets | 65,028 | 44,693 | |||||||
| Total non current assets | 889,569 | 669,517 | |||||||
| Total assets | $ | 5,189,833 | $ | 4,966,392 | |||||
| Liabilities | |||||||||
| Current liabilities | |||||||||
| Accounts payable | $ | 1,207,931 | $ | 1,338,661 | |||||
| Accrued expenses | 1,177,051 | 1,256,115 | |||||||
| Related party payable | 63,597 | 93,394 | |||||||
| Customer deposits | 4,508,894 | 3,151,250 | |||||||
| Short term notes payable | 476,606 | 188,000 | |||||||
| Total current liabilities | 7,434,079 | 6,027,420 | |||||||
| Non-current liabilities | |||||||||
| Long term notes payable | – | 300,000 | |||||||
| Total long-term liabilities | – | 300,000 | |||||||
| Total liabilities | 7,434,079 | 6,327,420 | |||||||
| Commitments and contingencies, note 10 | |||||||||
| Equity | |||||||||
| Preferred stock, $0.1 par value; 10,000,000 shares authorized; 0 shares issued and outstanding as of June 30, 2018 and December 31, 2017 | – | – | |||||||
| Common stock, $0.001 par value; 100,000,000 shares authorized; 24,808,000 and 25,046,000 shares issued and outstanding as of June 30, 2018, and December 31, 2017 respectively | 24,808 | 25,036 | |||||||
| Additional Paid in Capital | 3,656,823 | 3,258,116 | |||||||
| Retained earnings / (deficit) | (5,925,877 | ) | (4,644,180 | ) | |||||
| Total equity (deficit) | (2,244,246 | ) | (1,361,028 | ) | |||||
| Total liabilities and equity | $ | 5,189,833 | $ | 4,966,392 | |||||
| March 31, | December 31, | |||||||
| 2021 | 2020 | |||||||
| Assets | ||||||||
| Current assets: | ||||||||
| Cash and cash equivalents | $ | 49,922,802 | $ | 184,469 | ||||
| Accounts receivable, net | 753,225 | 915,052 | ||||||
| Inventories | 634,335 | 537,104 | ||||||
| Related party receivable | 4,263 | 61,678 | ||||||
| Prepayments and other assets | 3,853,950 | 3,547,068 | ||||||
| Total current assets | 55,168,575 | 5,245,371 | ||||||
| Non-current assets: | ||||||||
| Property and equipment, net | 107,260 | 129,444 | ||||||
| Operating lease right of use assets, net | 55,556 | 88,889 | ||||||
| Investments | 1,710,358 | 1,710,358 | ||||||
| Goodwill | 902,067 | 902,067 | ||||||
| Other assets | 84,347 | 84,514 | ||||||
| Total non-current assets | 2,859,588 | 2,915,272 | ||||||
| Total assets | $ | 58,028,163 | $ | 8,160,643 | ||||
| Liabilities | ||||||||
| Current liabilities: | ||||||||
| Accounts payable | $ | 2,230,765 | $ | 653,998 | ||||
| Accrued expenses | 1,417,119 | 1,798,494 | ||||||
| Deposits | 4,729,451 | 4,878,863 | ||||||
| Notes payable | 1,020,600 | 1,854,500 | ||||||
| Revolving Facility | - | 3,403,143 | ||||||
| Term Loan, net | - | 1,868,320 | ||||||
| Operating lease liabilities | 55,556 | 88,889 | ||||||
| Total current liabilities | 9,453,491 | 14,546,207 | ||||||
| Non-current liabilities: | ||||||||
| Notes payable | - | 1,020,600 | ||||||
| Total non-current liabilities | - | 1,020,600 | ||||||
| Total liabilities | 9,453,491 | 15,566,807 | ||||||
| Shareholders’ equity (deficit): | ||||||||
| Preferred stock, $0.10 par value; 10,000,000 shares authorized; 0 shares issued and outstanding | - | – | ||||||
| Common stock, $0.001 par value; 100,000,000 shares authorized; 11,218,137 issued and 10,868,137 outstanding as of March 31, 2021, and 4,718,714 shares issued and outstanding as of December 31, 2020 | 11,218 | 4,719 | ||||||
| Additional paid in capital | 75,091,357 | 14,553,438 | ||||||
| Treasury shares, cost basis: 350,000 shares as of March 31, 2021 | (2,975,000 | ) | - | |||||
| Accumulated deficit | (23,552,903 | ) | (21,964,321 | ) | ||||
| Total shareholders’ equity (deficit) | 48,574,672 | (7,406,164 | ) | |||||
| Total liabilities and shareholders’ equity (deficit) | $ | 58,028,163 | $ | 8,160,643 | ||||
See accompanying notes to unaudited condensed consolidated financial statements
| 4 |
urban-gro, Inc.
CONDENSED CONSOLIDATED STATEMENTS OF OPERATIONS AND COMPREHENSIVE INCOME (LOSS)
(unaudited)
| For The Three Months Ended | For The Six Months Ended | |||||||||||||||||||||||
| (unaudited) | (unaudited) | |||||||||||||||||||||||
| June 30, | June 30, | June 30, | June 30, | Three Months Ended March 31, | ||||||||||||||||||||
| 2018 | 2017 | 2018 | 2017 | 2021 | 2020 | |||||||||||||||||||
| Revenue | $ | 5,897,300 | $ | 3,368,570 | $ | 9,343,664 | $ | 4,795,114 | ||||||||||||||||
| Cost of sales | 4,030,852 | 2,530,055 | 6,473,345 | 3,637,794 | ||||||||||||||||||||
| Equipment systems | $ | 11,344,752 | $ | 3,306,911 | ||||||||||||||||||||
| Consumable products | 429,093 | 539,426 | ||||||||||||||||||||||
| Services | 260,513 | 414,666 | ||||||||||||||||||||||
| Total Revenue | 12,034,358 | 4,261,003 | ||||||||||||||||||||||
| Cost of Revenue | 9,393,713 | 3,147,515 | ||||||||||||||||||||||
| Gross profit | 1,866,448 | 838,515 | 2,870,319 | 1,157,320 | 2,640,642 | 1,113,488 | ||||||||||||||||||
| Operating expenses | ||||||||||||||||||||||||
| Marketing | 310,756 | 123,169 | 433,193 | 183,423 | ||||||||||||||||||||
| Operating expenses: | ||||||||||||||||||||||||
| General and administrative | 2,030,100 | 1,087,992 | 3,679,557 | 1,831,104 | 2,197,009 | 2,095,408 | ||||||||||||||||||
| Stock-based compensation | 290,805 | 432,645 | ||||||||||||||||||||||
| Total operating expenses | 2,340,856 | 1,211,161 | 4,112,750 | 2,014,527 | 2,487,814 | 2,528,053 | ||||||||||||||||||
| Loss from operations | (474,408 | ) | (372,646 | ) | (1,242,431 | ) | (857,207 | ) | ||||||||||||||||
| Income (loss) from operations | 152,831 | (1,414,565 | ) | |||||||||||||||||||||
| Other Income (Expenses) | ||||||||||||||||||||||||
| Non-operating income (expenses): | ||||||||||||||||||||||||
| Interest expense | (317,443 | ) | (298,634 | ) | ||||||||||||||||||||
| Interest expense – beneficial conversion of notes payable | (636,075 | ) | - | |||||||||||||||||||||
| Loss on extinguishment of debt | (790,723 | ) | - | |||||||||||||||||||||
| Other income | (80 | ) | 540 | 4,007 | 540 | 2,828 | 17,568 | |||||||||||||||||
| Interest expense | (24,561 | ) | (75,269 | ) | (43,274 | ) | (162,421 | ) | ||||||||||||||||
| Total other expenses | (24,641 | ) | (74,729 | ) | (39,267 | ) | (161,881 | ) | ||||||||||||||||
| Total non-operating income (expenses) | (1,741,413 | ) | (281,066 | ) | ||||||||||||||||||||
| Income (loss) before income taxes | (1,588,582 | ) | (1,695,631 | ) | ||||||||||||||||||||
| Income tax expense (benefit) | - | – | ||||||||||||||||||||||
| Net income (loss) | $ | (499,049 | ) | $ | (447,375 | ) | $ | (1,281,698 | ) | $ | (1,019,088 | ) | $ | (1,588,582 | ) | $ | (1,695,631 | ) | ||||||
| Comprehensive income (loss) | $ | (499,049 | ) | $ | (447,375 | ) | $ | (1,281,698 | ) | $ | (1,019,088 | ) | $ | (1,588,582 | ) | $ | (1,695,631 | ) | ||||||
| Earnings per share Net loss per share - basic and diluted | $ | (0.02 | ) | $ | (0.02 | ) | $ | (0.05 | ) | $ | (0.04 | ) | ||||||||||||
| Earnings (loss) per share: | ||||||||||||||||||||||||
| Net loss per share - basic and diluted | $ | (0.20 | ) | $ | (0.36 | ) | ||||||||||||||||||
| Weighted average outstanding shares for the periods ended June 30, 2018 and June 30, 2017* | 24,672,505 | 22,826,154 | 24,856,149 | 22,663,978 | ||||||||||||||||||||
| Weighted average shares used in computation | 7,831,959 | 4,739,830 | ||||||||||||||||||||||
*Weighted shares outstanding for the period ended June 30, 2017 were recalculated from partnership units to common stock shares with a conversion rate of 193.3936722 shares for each LLC unit.
See accompanying notes to unaudited condensed consolidated financial statements
| 5 |
urban-gro, Inc.
CONDENSED CONSOLIDATED STATEMENTS OF CASH FLOWSSHAREHOLDERS’ EQUITY (DEFICIT)
(unaudited)
| For the six months ending (unaudited) | ||||||||
| June 30, | June 30, | |||||||
| 2018 | 2017 | |||||||
| Cash Flows from Operating Activities | ||||||||
| Net Loss | $ | (1,281,697 | ) | $ | (1,019,088 | ) | ||
| Adjustment to reconcile net loss from operations: | ||||||||
| Depreciation and amortization | 77,112 | 34,446 | ||||||
| Warrant expense | 1,131 | – | ||||||
| Inventory write-offs | 58,310 | 12,552 | ||||||
| Bad debt expense | 39,963 | 112,783 | ||||||
| Stock compensation expense | 213,955 | 8,690 | ||||||
| Changes in Operating Assets and Liabilities | ||||||||
| Accounts receivable | (312,471 | ) | (250,630 | ) | ||||
| Inventory | (116,627 | ) | (345,811 | ) | ||||
| Prepayments and advances | (306,072 | ) | (486,981 | ) | ||||
| Other assets | – | (3,645 | ) | |||||
| Accounts payable | (160,527 | ) | 15,867 | |||||
| Accrued expenses | 20,934 | 224,239 | ||||||
| Customer deposits | 1,357,645 | 1,963,614 | ||||||
| Net Cash Provided by (Used in) Operating Activities | (408,344 | ) | 266,036 | |||||
| Cash Flows from Investing Activities | ||||||||
| Purchase of investment | (139,771 | ) | – | |||||
| Purchases of property and equipment | (136,721 | ) | (30,670 | ) | ||||
| Purchases of intangible assets | (20,671 | ) | – | |||||
| Net Cash Used Provided By (Used In) Investing Activities | (297,163 | ) | (30,670 | ) | ||||
| Cash Flows from Financing Activities | ||||||||
| Issuance of capital stock | 80,000 | 185,000 | ||||||
| Proceeds from issuance of notes payable | – | 294,546 | ||||||
| Repayment of related party loan | – | (132,792 | ) | |||||
| Repayment of notes payable | (8,000 | ) | (42,000 | ) | ||||
| Net Cash Provided by (Used In) Financing Activities | 72,000 | 304,754 | ||||||
| Net Increase (Decrease) in Cash | (633,507 | ) | 540,120 | |||||
| Cash at Beginning of Period | 1,656,791 | 17,463 | ||||||
| Cash at End of Period | $ | 1,023,284 | $ | 557,583 | ||||
| Supplemental Cash Flow Information: | ||||||||
| Interest Paid | $ | 43,274 | $ | 162,421 | ||||
| Income Tax Paid | $ | – | $ | – | ||||
| Supplemental disclosure of non-cash investing and financing activities: | ||||||||
| Common stock issued to convert membership units | $ | – | $ | 742,313 | ||||
| Common stock issued to reduce convertible and promissory notes payable | $ | – | $ | 500,000 | ||||
| Common stock retired | $ | 375 | $ | – | ||||
| Common Stock | Additional Paid in | Accumulated | Treasury | Total Shareholders’ Equity | ||||||||||||||||||||
| Shares | Amount | Capital | Deficit | Stock | (Deficit) | |||||||||||||||||||
| Balance, December 31, 2020 | 4,718,714 | $ | 4,719 | $ | 14,553,483 | $ | (21,964,321 | ) | – | $ | (7,406,164 | ) | ||||||||||||
| Stock-based compensation | – | – | 290,805 | – | – | 290,805 | ||||||||||||||||||
Beneficial conversion feature | – | – | 636,075 | – | – | 636,075 | ||||||||||||||||||
| Conversion of Bridge Financing | 254,425 | 254 | 1,907,971 | – | – | 1,908,225 | ||||||||||||||||||
| Stock grant program vesting | 16,586 | 17 | (17 | ) | – | – | – | |||||||||||||||||
| Stock issuance related to offering, net of offering costs of $4,400,683 | 6,210,000 | 6,210 | 57,693,107 | – | – | 57,699,317 | ||||||||||||||||||
| Common stock repurchased | – | – | - | – | (2,975,000 | ) | (2,975,000 | ) | ||||||||||||||||
| Stock issued with exercise of warrants | 18,412 | 18 | 9,978 | – | – | 9,996 | ||||||||||||||||||
| Net income (loss) for period ended March 31, 2021 | – | – | – | (1,588,582 | ) | – | (1,588,582 | ) | ||||||||||||||||
| Balance, March 31, 2021 | 11,218,137 | 11,218 | 72,116,357 | (23,552,903 | ) | (2,975,000 | ) | 48,574,672 | ||||||||||||||||
| Common Stock | Additional Paid in | Accumulated | Total Shareholders’ Equity | |||||||||||||||||
| Shares | Amount | Capital | Deficit | (Deficit) | ||||||||||||||||
| Balance, December 31, 2019 | 4,701,552 | $ | 4,702 | $ | 11,877,590 | $ | (16,890,626 | ) | $ | (5,008,334 | ) | |||||||||
| Stock-based compensation | – | – | 432,645 | – | 432,645 | |||||||||||||||
| Clawback of stock granted | (16,667 | ) | (17 | ) | 17 | – | – | |||||||||||||
| Stock issuance related to loan term revisions | 16,667 | 16 | 99,984 | – | 100,000 | |||||||||||||||
| Stock issuance related to debt | 83,333 | 83 | 499,917 | – | 500,000 | |||||||||||||||
| Warrant issuance related to debt | – | – | 76,822 | – | 76,822 | |||||||||||||||
| Net income (loss) for period ended March 31, 2020 | – | – | – | (1,695,631 | ) | (1,695,631 | ) | |||||||||||||
| Balance, March 31, 2020 | 4,784,885 | $ | 4,785 | $ | 12,986,974 | $ | (18,586,257 | ) | $ | (5,594,498 | ) | |||||||||
See accompanying notes to unaudited condensed consolidated financial statements
| 6 |
urban-gro, Inc.
NotesCONDENSED CONSOLIDATED STATEMENTS OF CASH FLOWS
(unaudited)
Three Months Ended March 31, | ||||||||
| 2021 | 2020 | |||||||
| Cash Flows from Operating Activities | ||||||||
| Net loss | $ | (1,588,582 | ) | $ | (1,695,631 | ) | ||
| Adjustments to reconcile net loss from operations: | ||||||||
| Depreciation and amortization | 55,685 | 61,014 | ||||||
| Amortization of deferred financing costs | 103,632 | 50,930 | ||||||
| Loss on extinguishment of debt | 790,723 | - | ||||||
| Interest on convertible notes | 53,725 | – | ||||||
| Stock-based compensation expense | 290,805 | 432,645 | ||||||
| Beneficial conversion of Bridge notes | 636,075 | - | ||||||
| Gain on disposal of assets | - | 13,815 | ||||||
| Inventory write-offs | 14,539 | 10,528 | ||||||
| Bad debt expense | 15,000 | 15,239 | ||||||
| Changes in operating assets and liabilities: | ||||||||
| Accounts receivable | 204,242 | 391,569 | ||||||
| Inventories | (111,770 | ) | (221,537 | ) | ||||
| Prepayments and other assets | (1,178,239 | ) | (404,412 | ) | ||||
| Accounts payable and accrued expenses | 1,162,059 | (1,172,081 | ) | |||||
| Deposits | (149,412 | ) | 651,336 | |||||
| Net Cash Provided By (Used In) Operating Activities | 298,482 | (1,866,585 | ) | |||||
| Cash Flows from Investing Activities | ||||||||
| Purchases of property and equipment | – | (46,797 | ) | |||||
| Net Cash Used In Investing Activities | – | (46,797 | ) | |||||
| Cash Flows from Financing Activities | ||||||||
| Proceeds from issuance of Revolving Facility | - | 2,207,432 | ||||||
| Proceeds from issuance of Term Loan | – | 2,000,000 | ||||||
| Proceeds from Revolving Facility advances | – | 1,001,893 | ||||||
| Repurchase of Common Stock | (2,975,000 | ) | – | |||||
| Proceeds from issuance of Common Stock, net of offering costs | 58,170,696 | – | ||||||
| Debt financing costs | – | (545,501 | ) | |||||
| Repayment of notes payable | (5,755,845 | ) | (2,629,616 | ) | ||||
| Net Cash Provided by Financing Activities | 49,439,851 | 2,034,208 | ||||||
| Net Increase in Cash | 49,738,333 | 120,826 | ||||||
| Cash at Beginning of Period | 184,469 | 448,703 | ||||||
| Cash at End of Period | $ | 49,922,802 | $ | 569,529 | ||||
| Supplemental Cash Flow Information: | ||||||||
| Interest Paid | $ | 317,443 | $ | 298,634 | ||||
| Supplemental disclosure of non-cash investing and financing activities: | ||||||||
| Debt financing costs booked in equity | $ | – | $ | 676,822 | ||||
See accompanying notes to Financial Statementsunaudited condensed consolidated financial statements
For the six months ended June 30, 2018
| 7 |
urban-gro, Inc.
NOTES TO UNAUDITED CONDENSED CONSOLIDATED FINANCIAL STATEMENTS
NOTE 1 – ORGANIZATION BASIS OF PRESENTATIONAND ACQUISITIONS, BUSINESS PLAN, AND LIQUIDITY
Organization and Acquisitions
Urban-gro
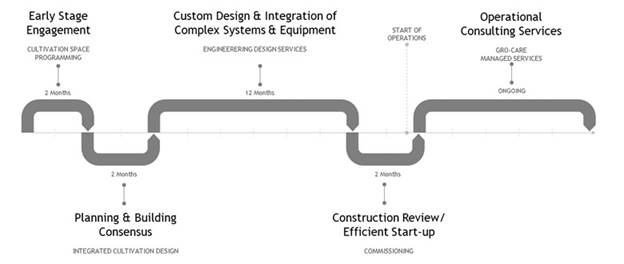
urban-gro, Inc., (“we,” “us,” “our,” the “Company,” or “urban-gro”) is a Colorado corporation (the “Company”leading engineering and design services company focused on the sustainable commercial indoor horticulture market. We engineer and design indoor controlled environment agriculture (“CEA”), was founded facilities and then integrate complex environmental equipment systems into those facilities. Through this work, we create high-performance indoor cultivation facilities for our clients to grow specialty crops, including leafy greens, vegetables, herbs, and plant-based medicines. Our custom-tailored approach to design, procurement, and equipment integration provides a single point of accountability across all aspects of indoor growing operations. We also help our clients achieve operational efficiency and economic advantages through a full spectrum of professional services and programs focused on facility optimization and environmental health which establish facilities that allow clients to manage, operate and perform at the highest level throughout their entire cultivation lifecycle once they are up and running.
We aim to work with our clients from inception of their project in 2014 as a limited liability company. On March 10, 2017,way that provides value throughout the Company was converted intolife of their facility. We are a corporation. The Company provides product solutionstrusted partner and advisor to the commercial Cannabis cultivation industry, including commercial grade LEDour clients and HPS grow light systems, integrated pest management, automated fertilization / irrigation solutions, andoffer a complete lineset of water treatment solutions in the Stateengineering and managed services complemented by a vetted suite of Colorado and throughout the US and Canada. The Company’s products are integrated to ensure a cohesive approach toselect cultivation that is economical and legal.equipment systems.
Basis of Presentation
These consolidated financial statements are presented in United States dollars and have been prepared in accordance with United States generally accepted accounting principles.principles (“GAAP”). On December 31, 2020, we effected a 1-for-6 reverse stock split with respect to our common stock. All share and per share information in these consolidated financial statements gives effect to this reverse stock split, including restating prior period reported amounts.
Business PlanLiquidity and Going Concern
The Company’s diversification plansaccompanying consolidated financial statements have led to the strategic decision to focus on brand as an ancillary national market leader delivering the best in class value added product solutions to cannabis cultivators. Management has implemented the following actions to increase profit margins and generate positive operating cash flow; 1) Establish strategic partnerships with our vendors to increase our margins for benches and control systems. 2) Implement fees to the customer for the design of their grow systems 3) Create a commissioning team and charge commissioning fees 4) Create and implement integrated pest management plans for our customers and increase sales of the biological controls and pesticides. Management believes these objectives will increase the Company’s gross profit and increase cash provided by operations.
Liquidity
Since inception,been prepared assuming that the Company has incurred operating losseswill continue as a going concern, which contemplates realization of assets and has funded its operations primarily through issuancethe satisfaction of equity securities, unsecured debt, and operating revenue. Asliabilities in the normal course of June 30, 2018,business within one year after the Company had an accumulated deficit of $(5,925,877) working capital of $(3,113,815) and stockholders’ equity of $(2,244,246). The Company has evaluated its projected cash flows and believes that its cash and cash equivalents of $1,023,284 as of June 30, 2018, will be sufficient to funddate the Company’s operations through at least twelve months from the issuance date of theseconsolidated financial statements or at least through June 30, 2019. Future financings, if necessary, may not beare available to the Company at acceptable terms, or at all. Sales of additional equity securities would result in the dilution of interests of current shareholders.be issued.
NOTE 2 – SUMMARY OF SIGNIFICANT ACCOUNTING POLICIES
Unaudited Condensed Consolidated Financial Statements
The Company has prepared the accompanying condensed consolidated financial statements pursuant to the rules and regulations of the SEC for condensed financial reporting. The condensed consolidated financial statements are unaudited and, in the Company’s opinion, include all adjustments, consisting of normal recurring adjustments and accruals necessary for a fair presentation of the Company’s condensed consolidated balance sheets, condensed consolidated statements of operations and comprehensive income (loss), condensed consolidated statements of shareholders’ deficit and condensed consolidated statements of cash flows for the periods presented. The results reported in these condensed consolidated financial statements should not be regarded as necessarily indicative of results that may be expected for the entire year. Certain information and footnote disclosures normally included in financial statements prepared in accordance with GAAP have been omitted in accordance with regulations of the SEC. These condensed consolidated financial statements should be read in conjunction with the financial statements and notes thereto included in the Company’s consolidated financial statements in the Company’s Annual Report on Form 10-K for the year ended December 31, 2020.
Significant Accounting Policies
For a detailed discussion about the Company’s significant accounting policies, refer to Note 2 — “Summary of Significant Accounting Policies,” in the Company’s consolidated financial statements included in the Company’s 2020 Form 10-K. During the three months ended March 31, 2021, there were no material changes made to the Company’s significant accounting policies.
| 8 |
Use of Estimates
In preparing condensed consolidated financial statements in conformity with generally accepted accounting principles,GAAP, management is required to make estimates and assumptions that affect the reported amounts of assets and liabilities and the disclosure of assets and liabilities at the date of the condensed consolidated financial statements and revenues and expenses during the reported period. Actual results could differ from those estimates. Significant estimates include estimated useful lives and potential impairment of propertylong-lived assets and equipment,goodwill, inventory write offs, allowance for deferred tax assets, and allowance for bad debt.
Reclassification
Going Concern AssessmentCertain prior year amounts have been reclassified for consistency with the current year presentation. These reclassifications had no effect on the reported results of operations.
With the implementation of FASB’s new standard on going concern, ASC No. 205-40, beginning with the year ended December 31, 2016 and all annual and interim periods thereafter, we will assess going concern uncertainty for our financial statements to determine if we have sufficient cash and cash equivalents on hand and working capital to operate for a period of at least one year from the date the financial statements are issued or are available to be issued, which is referred to as the “look - forward period” as defined by ASC No. 205-40. As part of this assessment, based on conditions that are known and reasonably knowable to us, we will consider various scenarios, forecasts, projections, and estimates, and we will make certain key assumptions, including the timing and nature of projected cash expenditures or programs, and our ability to delay or curtail those expenditures or programs, among other factors, if necessary, within the look-forward period in accordance with ASC No 205-40.
Fair Value of Financial Instruments
The Company’s financial instruments consist principally of cash and cash equivalents, accounts receivable, accounts payable, notes payable and other current assets and liabilities. We value our financial assets and liabilities using fair value measurements. Fair value is based on the price that would be received to sell an asset or paid to transfer a liability in an orderly transaction between market participants at the measurement date. Assets and liabilities measured at fair value are categorized based on whether the inputs are observable in the market and the degree that the inputs are observable. The categorization of financial instruments within the valuation hierarchy is based on the lowest level of input that is significant to the fair value measurement. The hierarchy is prioritized into three levels (with Level 3 being the lowest) defined as follows:
Level 1: Quoted prices in active markets for identical assets or liabilities that the entity has the ability to access.
Level 2: Observable inputs other than prices included in Level 1, such as quoted prices for similar assets and liabilities in active markets; quoted prices for identical or similar assets and liabilities in markets that are not active; or other inputs that are observable or can be corroborated with observable market data.
Level 3: Unobservable inputs that are supported by little or no market activity and that are significant to the fair value of the assets and liabilities. This includes certain pricing models, discounted cash flow methodologies, and similar techniques that use significant unobservable inputs.
The carrying amount of our cash and cash equivalents, accounts receivable, accounts payable, and other current assets and liabilities in our financial statements approximates fair value because of the short-term nature of the instruments. Investments in non-marketable equity securities are carried at cost less other-than-temporary impairments. The carrying amount of our notes payable and convertible debt at June 30, 2018 and December 31, 2017 approximates their fair values based on our incremental borrowing rates.
There have been no changes in Level 1, Level 2, and Level 3 categorizations and no changes in valuation techniques for these assets or liabilities for the period ended June 30, 2018 and year ended December 31, 2017.
Cash and Cash Equivalents
The Company considers all highly liquid short term cash investments with an original maturity of three months or less to be cash equivalents. As of June 30, 2018 and December 31, 2017, the Company did not maintain any cash equivalents. The Company maintains cash with financial institutions that may from time to time exceed federally-insured limits. The Company has not experienced any losses related to these balances and believes the risk to be minimal.
Accounts Receivable, Net
Trade accounts receivables are carried at the original invoiced amounts less an allowance for doubtful accounts. As of June 30, 2018 and December 31, 2017, the balance of allowance for doubtful accounts was $91,737 and $63,455, respectively. The allowances for doubtful accounts are calculated based on a detailed review of certain individual customer accounts and an estimation of the overall economic conditions affecting the Company's customer base. The Company reviews a customer's credit history before extending credit to the customer. If the financial condition of its customers were to deteriorate, resulting in an impairment of their ability to make payments, additions to the allowance would be required. A provision is made against accounts receivable to the extent they are considered unlikely to be collected. Bad debt expense for the three months ended June 30, 2018 and 2017 was $23,099 and $94,145 respectively. Bad debt expense for the six months ended June 30, 2018 and 2017 was $39,963 and $112,783 respectively.
Inventory
Inventories are stated at the lower of cost or net realizable value. The Company periodically reviews the value of items in inventory and provides write-downs or write-offs of inventory based on its assessment of market conditions. All inventory is finished goods and no raw products or work in progress is recorded on the balance sheet. Write-downs and write-offs are charged to cost of goods sold at the realization of change in value. Once written down, inventories are carried at this lower cost basis until sold or scrapped.
Property, Plant and Equipment, Net
Property and equipment is stated at cost less accumulated depreciation and impairment. Expenditures for major additions and improvements are capitalized and minor replacements, maintenance, and repairs are charged to expense as incurred. When property and equipment is retired or otherwise disposed of, the cost and accumulated depreciation are removed from the accounts and any resulting gain or loss is included in the results of operations for the respective period. Depreciation is provided over the estimated useful lives of the related assets using the straight-line method for financial statement purposes. The Company uses other depreciation methods (generally accelerated) for tax purposes where appropriate. No impairment charges were recorded for period ended June 30, 2018 and 2017.
The estimated useful lives for significant property and equipment categories are as follows:
Intangible Assets
The Company’ intangible assets, consisting of legal fees for application of patents and trademarks are recorded at cost, and once approved will be amortized using the straight-line method over an estimated life, generally 5 years for patents and 10 to 20 years for trademarks. Intangible assets are included in “other assets” on the balance sheet. The net balance of intangible assets for June 30, 2018 and December 31, 2017 was $51,389 and $31,054 respectively. Amortization expense totaled $270 and $0 for the three months ended June 30, 2018 and 2017, respectively and $337 and $0 for the six months ended June 30, 2018 and 2017, respectively.
Equity Investments
In the first quarter of 2018, the Company adopted the ASU 2016-01, Financial Instruments — Overall (Subtopic 825-10). Under the new ASC, entities no longer use the cost method of accounting as it was applied before, but it can elect a measurement alternative for equity investments that do not have readily determinable fair values and do not qualify for the practical expedient in ASC 820 to estimate fair value using the NAV per share. After management’s assessment of each of these two equity investments, management concluded that these two investments should be accounted for using measurement alternative. Under the alternative, the Company measures these investments at cost, less any impairment, plus or minus changes resulting from observable price changes in orderly transactions for an identical or similar investment of the same issuer, and the Company has to make a separate election to use the alternative for each eligible investment and has to apply the alternative consistently from period to period until the investment’s fair value becomes readily determinable. ASU further requires that the Company should use prospective method for all equity investments without readily determinable fair values.
Revenue Recognition
The Company recognizes revenue in accordance with the Financial Accounting Standards Board (“FASB”) Accounting Standards Codification (“ASC”) 606,Revenue from Contracts with Customers, which requires that five basic steps be followed to recognize revenue: (1) a legally enforceable contract that meets criterial standards as to composition and substance is identified; (2) performance obligations relating to provision of goods or services to the customer are identified; (3) the transaction price, with consideration given to any variable, noncash, or other relevant consideration, is determined; (4) the transaction price is allocated to the performance obligations; and (5) revenue is recognized when control of goods or services is transferred to the customer with consideration given to whether that control happens over time or not. Determination of criteria (3) and (4) are based on our management's judgments regarding the fixed nature of the selling prices of the products and services delivered and the collectability of those amounts. There was no material impact to our revenue recognition process because of the implementation of FASB ASC 606 as of June 30, 2018.
Customer Deposit
The Company’s policy is to collect deposits from customers at the beginning of the project prior to the design phase. The customer payments received are recorded as a customer deposit liability on the balance sheet. When the project is complete and meets all the criteria for revenue recognition, the deposit is recorded against the customer’s Accounts Receivable Balance. In certain situations when the customer has paid the deposit and design work has been completed but the customer chooses not to proceed with the project, the Company may keep the deposit and book it to revenue.
Cost of Goods Sold
The Company’s policy is to recognize cost of revenues in the same manner as, and in conjunction with, revenue recognition. The Company’s cost of revenues includes the costs directly attributable to revenue recognized and includes expenses related to the purchasing of our products, fees for third-party commissions and shipping costs. Total shipping costs included in the cost of goods sold was $81,568 for the three months ended June 30, 2018 and $59,227 for the three months ended June 30, 2017 and $157,768 for the six months ended June 30, 2018 and $101,725 for the six months ended June 30, 2017.
Income Taxes
The Company accounts for income taxes in accordance with the asset and liability method. Deferred taxes are recognized for the future tax consequences attributable to temporary differences between the carrying amounts of assets and liabilities for financial statement purposes and income tax purposes using enacted rates expected to be in effect when such amounts are realized or settled. The effect on deferred taxes of a change in tax rates is recognized in income in the period that includes the enactment date. A valuation allowance is established, as needed to reduce the amount of deferred tax assets if it is considered more likely than not that some portion or all of the deferred tax assets will not be realized.
The Company recognizes the effect of income tax positions only if those positions are more likely than not of being sustained. Recognized income tax positions are measured at the largest amount that is greater than 50% likely of being realized. Changes in recognition or measurement are reflected in the period in which the change in judgment occurs. There were no such interest or penalty for the periods ended June 30, 2018 and 2017.
On December 22, 2017 the U.S. Tax Reform, which among other effects, reduces the U.S. federal corporate income tax rate to 21% from 34% (or 35% in certain cases) beginning in 2018, requires companies to pay a one-time transition tax on certain unrepatriated earnings from non-U.S. subsidiaries that is payable over eight years, makes the receipt of future non-U.S. sourced income of non-U.S. subsidiaries tax-free to U.S. companies and creates a new minimum tax on the earnings of non-U.S. subsidiaries relating to the parent’s deductions for payments to the subsidiaries. The Company’s provisional estimate is that no tax will be due under this provision. The Company continues to gather information relating to this estimate.
Deferred tax is provided in full on timing differences that exist at the balance sheet date and that result in an obligation to pay more tax, or a right to pay less tax in the future. The deferred tax is measured at the rate expected to apply in the periods in which the timing differences are expected to reverse, based on the tax rates and laws that are enacted or substantively enacted at the balance sheet date. Timing differences arise from the inclusion of items of income and expenditure in taxation computations in periods different from those in which they are included in the Company’s financial statements. Deferred tax assets are recognized to the extent that it is regarded as more likely than not that they will be recovered. Deferred tax assets and liabilities are not discounted. We recognize deferred tax assets to the extent that we believe that these assets are more likely than not to be realized. In making such a determination, we consider all available positive and negative evidence, including future reversals of existing taxable temporary differences, projected future taxable income, tax-planning strategies, and results of recent operations. If we determine that we would be able to realize our deferred tax assets in the future in excess of their net recorded amount, we would make an adjustment to the deferred tax asset valuation allowance, which would reduce the provision for income taxes. There was no deferred tax asset as of June 30, 2018 and December 31, 2017.
Advertising Costs
The Company expenses advertisings costs in the periods the costs are incurred. Prepayments made under contracts are included in prepaid expenses and expensed when the advertisement is run. Total advertising expense incurred was $73,086 for the three months ended June 30, 2018 and $9,267 for the three months ended June 30, 2017 and $95,356 for the six months ended June 30, 2018 and $15,274 for the six months ended June 30, 2017.
Share Based Compensation
The Company periodically issue shares of its common stock to employees and consultants in non-capital raising transactions for fees and services. The Company accounts for stock issued to non-employees in accordance with ASC 505, Equity, whereas the value of the stock compensation is based upon the measurement date as determined at either (a) the date at which a performance commitment is reached, or (b) at the date at which the necessary performance to earn the equity instruments is complete.
The Company accounts for stock grants issued and vesting to employees based on ASC 718, Compensation – Stock Compensation, whereas the award is measured at its fair value at the date of grant and is amortized ratably over the vesting period. Accounting for stock-based compensation to employees requires the measurement and recognition of compensation expense for all share-based payment awards made to employees based on estimated fair values. The Company also estimate forfeitures at the time of grant and revise those estimates in subsequent periods if actual forfeitures differ from our estimates.
Earnings (Loss) Per Share
The Company computes net earnings (loss) per share under Accounting Standards Codification subtopic 260-10, “Earnings Per Share” (“ASC 260-10”). Basic earnings or loss per share (“EPS”) is computed by dividing net income (loss) available to common stockholders by the weighted average number of common shares outstanding for the period. Diluted EPS is computed by dividing net income (loss) by the weighted-average of all potentially dilutive shares of common stock that were outstanding during the periods presented.
The treasury stock method is used in calculating diluted EPS for potentially dilutive stock options and share purchase warrants, which assumes that any proceeds received from the exercise of in-the-money stock options and share purchase warrants, would be used to purchase common shares at the average market price for the period.
Recently Issued Accounting Pronouncements
From time to time, the FASBFinancial Accounting Standards Board (the “FASB”) or other standards setting bodies issue new accounting pronouncements. UpdatesThe FASB issues updates to new accounting pronouncements through the FASB ASCs are communicated through issuance of an Accounting Standards Update ("ASU"(“ASU”). Unless otherwise discussed, we believethe Company believes that the impact of recently issued guidance, whether adopted or to be adopted in the future, is not expected to have a material impact on ourthe Company’s financial statements upon adoption.
FASB ASU No. 2016-02, (Topic 842) “Leases”Issues in February 2016, ASU 2016-02, Leases (Topic 842), which requires lessees to recognize assets and liabilities for leases with lease terms greater than twelve months in the statement of financial position. Leases will be classified as either financing or operating, with classification affecting the pattern of expense recognition in the statements of operations. ASU 2016-02 also requires improved disclosures to help users of financial statements better understand the amount, timing and uncertainty of cash flows arising from leases. The update is effective for fiscal years beginning after December 15, 2018, including interim reporting periods within that reporting period. Early adoption is permitted. Although the Company has not completed its evaluation of the impact of the adoption of ASU 2016-02, the Company believes the adoption of ASU 2016-02 is expected to have no material impact to the Company’s financial statements.
There are other various updates recently issued, most of which represented technical corrections to the accounting literature or application to specific industries and are not expected to have a material impact on the Company's financial position, results of operations or cash flows.
NOTE 3 – RELATED PARTY TRANSACTIONS
TheCloud 9 Support, LLC (“Cloud 9”), a company owned by James Lowe, a director and shareholder, purchases materials from the Company. Total sales to Cloud 9 from the Company purchases lighting products from Bravo Lighting (“Bravo”)were $14,006 and Enviro-Glo, distributors of customized lighting solutions with common control by the Company’s CEO, Bradley Nattrass and CDO Octavio Gutierrez. Purchases from Bravo and Enviro-Glo were $72,432 and $222,339 for$132,872 during the three months ended June 30, 2018March 31, 2021 and 2017, respectively and $142,410 and $332,525 for the six months ended June 30, 2018 and 20172020, respectively. Outstanding receivables from BravoCloud 9 as of March 31, 2021 and Enviro-GloDecember 31, 2020 totaled $31,804$4,263 and $61,678, respectively.
In October 2018, we issued a $1,000,000 unsecured note payable to Cloud 9, an entity owned by James Lowe, a director of the Company, which originally became due April 30, 2019 (the “James Lowe Note”). The James Lowe Note was personally guaranteed by Bradley Nattrass, our Chief Executive Officer, and Octavio Gutierrez. The loan had a one-time origination fee of $12,500. Interest accrued at the rate of 12% per annum and was paid monthly. As additional consideration for the James Lowe Note, we granted Mr. Lowe (as designee of Cloud9 Support) an option to purchase 5,000 shares of our common stock at an exercise price of $7.20 per share, which option is exercisable for a period of five years. The due date for the James Lowe Note was extended in May 2019 to December 31, 2019 and the interest rate was decreased to 9% per year. In consideration for Cloud9 Support extending the maturity date of the note and reducing the interest rate, we issued 1,667 shares of our common stock to Mr. Lowe (as designee of Cloud9 Support).
On February 21, 2020, we entered into an agreement to amend the James Lowe Note to extend the maturity date therein from December 31, 2019 to the date which is the earlier of 60 days following the date: (a) on June 30, 2018which demand for repayment is made by the lenders under the Credit Agreement, as described in Note 9, (which is now only applicable in the case of an event of default under the Credit Agreement because of the removal of the demand feature pursuant to the First Amendment to the Credit Agreement); or (b) which is the maturity date under the Credit Agreement.
In addition, on February 25, 2020, the Company entered into a subordination, postponement and $13,540standstill agreement with Cloud9 Support (the “Subordination Agreement”) pursuant to which Cloud 9 Support agreed to postpone and subordinate all payments due under the promissory note until the facilities under the Credit Agreement have been fully and finally repaid. The term for the Subordination Agreement will continue in force as long as the Company is indebted to the agent or lenders under the Credit Agreement. In consideration for Cloud9 Support’s agreement to extend the maturity date of the promissory note and to enter into the Subordination Agreement, we issued 16,667 shares of common stock to Mr. Lowe (as designee of Cloud 9 Support).
On December 15, 2020, James Lowe agreed to convert the $1,000,000 James Lowe Note plus $4,500 of accrued interest (the “New James Lowe Note”) into a convertible note bridge financing (see “Bridge Financing” in Note 8 – Notes Payable). The New James Lowe Note carries interest at the rate of 12% and matures on December 31, 2017. Net outstanding payables incurred for purchases2021. The New James Lowe Note plus accrued interest was mandatorily converted into 137,940 shares of inventory andour common stock on February 17, 2021 in connection with the other services to Bravo and Enviro-Glo totaled $63,597 at June 30, 2018 and $93,394 at December 31, 2017.Bridge Financing notes.
The Company also entered into a lease agreement with Bravo Lighting a related party, to sublease office space for 12 months commencing in September 2017. Minimum lease payments are $9,000 for the remainder of 2018.
NOTE 4 – PREPAYMENTS & ADVANCESAND OTHER ASSETS
Prepayments and Advances isother assets are comprised of advances paid to employees, prepaid services and fees and prepayments paid to vendors to initiate orders.orders and prepaid services and fees. The prepaid balances are summarized as follows:
| June 30, | December 31, | |||||||
| 2018 | 2017 | |||||||
| Advances to Employees | $ | – | $ | 4,960 | ||||
| Prepaid Services and Fees | 123,379 | 8,875 | ||||||
| Vendor Prepayments | 1,041,968 | 845,442 | ||||||
| $ | 1,165,347 | $ | 859,277 | |||||
| March 31, | December 31, | |||||||
| 2021 | 2020 | |||||||
| Vendor prepayments | $ | 3,428,331 | $ | 2,676,493 | ||||
| Prepaid services and fees | 425,619 | 365,931 | ||||||
| Deferred financing asset (See Note 9 - Debt) | - | 504,644 | ||||||
| Prepayments and other assets | $ | 3,853,950 | $ | 3,547,068 | ||||
| 9 |
NOTE 5 - PROPERTY PLANT & EQUIPMENT, NET
Property Plant and Equipment balances are summarized as follows:NOTE 5 – INVESTMENTS
| June 30, | December 31, | |||||||
| 2018 | 2017 | |||||||
| Computers & Technology Equip | $ | 53,714 | $ | 37,366 | ||||
| Furniture and Fixtures | 28,690 | 24,825 | ||||||
| Leasehold Improvements | 143,215 | 143,215 | ||||||
| Molds & Tooling | 14,144 | 11,421 | ||||||
| Marketing | 15,386 | – | ||||||
| Vehicles | 154,028 | 149,028 | ||||||
| Warehouse Equipment | 7,733 | 9,232 | ||||||
| Software | 18,950 | 6,550 | ||||||
| R&D Assets | 82,499 | – | ||||||
| Accumulated depreciation | (233,589 | ) | (156,813 | ) | ||||
| Property plant and equipment, net | $ | 284,770 | $ | 224,824 | ||||
The Company has a strategic investment in Edyza, Inc. (“Edyza”), a hardware and software technology company that enables dense sensor networks in agriculture, healthcare, and other environments that require precise micro-climate monitoring. The Company measures this investment at cost, less any impairment changes resulting from observable price changes in orderly transactions for an identical or similar investment of the same issuer. The balance as of March 31, 2021 and December 31, 2020 was $1,710,358.
Depreciation expense totaled $41,961 and $17,499 for the three months ending June 30, 2018 and 2017, respectively and $76,775 and $34,446 for the six months ended June 30, 2018 and 2017, respectively.
NOTE 6 – INVESTMENTGOODWILL
In August 2017, theThe Company entered into an agreement with Edyza Sensors, Inc., (”Edyza”), wherein the Company became Edyza’s exclusive agricultural partnerrecorded goodwill in the attempt to provide wireless sensors to the cultivation solutions offered by the Company to the cannabis industry. As part of the terms of this agreement, Edyza has assigned the Company all of their global rights to two patent pending applications for sensor rods and moisture and salinity measurements, along with any additional patent rights that may arise as a result of this collaboration. In addition, Edyza issued the Company a Simple Agreement for Future Equity, to provide the Company with an ownership interest in Edyza in the principal amount of $400,000, to be issued when Edyza engages in a priced round of investment or liquidation occurs. As of June 30, 2018, the Company determined that no impairment is necessary given the recent valuations and no change in qualitative factors.
In February 2018, the Company entered into an agreement with Total Grow Controls to purchase 5% on a fully diluted basis of Total Growth Holdings for $125,000. This agreement provides the Companyconjunction with the right to purchase an additional 5%initial acquisition of Impact Engineering, Inc. (“Impact”) on a fully diluted basis at the same valuation on or before AugustMarch 7, 2019. The goodwill balance as of March 31, 2018. As of June 30, 2018, the Company determined that no impairment is necessary given the recent valuations and no change in qualitative factors. As of June 30, 2018 the Company’s current ownership percentage of Total Grow Controls was 5%.
NOTE 7 –COST OF PATENTS
Costs of patents, which consist of legal costs paid to third parties to establish a patent, are capitalized until such time that the patents are approved and issued or rejected. If approved, capitalized costs are amortized using the straight-line method over the estimated lives of the patents, generally five years. There are no issued patents for the six months ended June 30, 20182021 and December 31, 2017.2020 is $902,067. Goodwill is not amortized. There is no goodwill for income tax purposes. The Company did not record any impairment charges related to goodwill for the periods ended March 31, 2021 and 2020.
NOTE 87 – ACCRUED EXPENSES
Accrued expenses are summarized as follows:
| June 30, | December 31, | |||||||
| 2018 | 2017 | |||||||
| Accrued operating expenses | 219,336 | 153,946 | ||||||
| Accrued stock compensation expense | – | 100,000 | ||||||
| Accrued wages and related expenses | 360,427 | 377,305 | ||||||
| Accrued sales tax payable | 597,288 | 624,864 | ||||||
| $ | 1,177,051 | $ | 1,256,115 | |||||
| March 31, | December 31, | |||||||
| 2021 | 2020 | |||||||
| Accrued operating expenses | $ | 538,835 | $ | 717,503 | ||||
| Accrued wages and related expenses | 335,225 | 408,907 | ||||||
| Accrued interest expense | 9,759 | 99,258 | ||||||
| Accrued sales tax payable | 533,300 | 572,826 | ||||||
| $ | 1,417,119 | $ | 1,798,494 | |||||
Accrued sales tax payable is comprised of prior period sales tax payableamounts due to various states and Canadian provinces for the years ended December 2015 2016, and 2017. The Company has set up payment plans with the various taxing agencies to relieve the obligation. The payment plans require monthly payments in various amounts for a period of 12 months or less. Additionally, as of June 30, 2018, the Company has a $166,224 receivable from customers for sales tax obligations. The Company believes it is more likely than not that the majority of the balance can be relieved by the customers providing the Company with resellers permits. This will also reduce the amount of the liability the Company owes to the taxing agencies. Additionally, the company has increased its allowance for doubtful accounts for customers that do not pay their outstanding tax liability.through 2020.
NOTE 98 – NOTES PAYABLE AND CURRENT PORTION OF NOTES PAYABLE
Unsecured notes payable balances totaled $476,606 and $488,000 at June 30, 2018 and December 31, 2017, respectively. In March 2018, the Company extended the loan with Michael S. Bank for 1 year As of December 31, 2017, the Company deemed the loan long term due to the lender agreeing to extend the loan and not call the loan before the new expiration of March 23, 2019. As of June 30, 2018, the loan was classified as short term. Interest expense incurred on the unsecured notes payable is $24,561 and $75,269 for the three months ended June 30, 2018 and 2017, respectively. Interest expense incurred on the unsecured notes payable is $43,274 and $162,421 for the six months ended June 30, 2018 and 2017, respectively.
The following is a summary of notes payable excluding related party notes payable:
| June 30, | December 31, | |||||||
| 2018 | 2017 | |||||||
| Unsecured, interest-free, note payable with JW Properties, LLC. Principal is re-paid monthly with a maturity date of May 31, 2018. | $ | – | $ | 8,000 | ||||
| Unsecured note payable with Chris Parkes. Interest payments due monthly at an annual rate of 20.4%. Note payable revised in May 2017 amending principal due and extending maturity date to December 31, 2018. On May 9, 2017, as part of the private placement offering of the Company's common stock, the individual has converted part of this note into 300,000 common shares of the Company at $1.00 per share. | 80,000 | 80,000 | ||||||
| Unsecured note payable with David Parkes. Interest payments due monthly at an annual rate of 18%. Note payable revised in May 2017 amending principal due and extending maturity date to December 31, 2018. On May 9, 2017, as part of the private offering of the Company's common stock, the individual has converted part of this note into 200,000 common shares of the Company at $1.00 per share. | 100,000 | 100,000 | ||||||
Unsecured note payable with Michael S. Bank. Interest at 19.8% per year is paid twice per month. The note contains a demand re-payment provision that can be executed by individual at any time by providing a one-time notice. The Company may re-pay any part or the entire principal sum at any time with penalty and abatement of interest expense from date of early payment.The note includes six thousand warrants, each exercisable to purchase shares of the Company's common stock at a price of $1 per share. The loan matures on March 23, 2019. | 296,606 | 300,000 | ||||||
| Total | $ | 476,606 | $ | 488,000 | ||||
| Less current maturities | (476,606 | ) | (188,000 | ) | ||||
| Long Term | $ | – | $ | 300,000 | ||||
| March 31, | December 31, | |||||||
| 2021 | 2020 | |||||||
| Paycheck Protection Program (“PPP”) loan entered into on April 16, 2020. Interest rate of 1.0% per annum. Payments of principal and interest are deferred until August 1, 2021 (the “Deferral Period”). The PPP loan may be forgiven in part or fully depending on the Company meeting certain PPP loan forgiveness guidelines. The Company has not yet determined if any of the PPP loan is subject to forgiveness and has therefore continued to present the entire PPP loan as an obligation on its financial statements. Any unforgiven portion of the PPP loan is payable over a two-year term, with payments deferred during the Deferral Period. The Company may prepay the unforgiven loan balance at any time without payment of any premium. | 1,020,600 | 1,020,600 | ||||||
| Convertible notes related to bridge financing. See Bridge Financing Notes below. | – | 1,854,500 | ||||||
| Total | 1,020,600 | 2,875,100 | ||||||
| Less current maturities | (1,020,600 | ) | (1,854,500 | ) | ||||
| Long Term | $ | – | $ | 1,020,600 | ||||
During the fourth quarter of 2020 the Company entered into bridge financing notes (the “Bridge Financing Notes”) totaling $1,854,500. The Bridge Financing Notes are a combination of $1,004,500 in the New James Lowe Note (See Note 3 – Related Party Transactions), $350,000 received in November 2020, and an additional $500,000 received in December 2020. The Bridge Financing Notes carry interest at the rate of 12% and mature on December 31, 2021. The Bridge Financing Notes will be mandatorily converted upon the closing of a sale of the securities of the Company, whether in a private placement or pursuant to an effective registration statement under the Securities Act, resulting in at least $2,500,000 of gross proceeds to the Company (a “Qualified Offering”). In the event of a Qualified Offering, the outstanding principal and interest of the Bridge Financing Notes will be converted into the identical security issued at such Qualified Offering at 75% of the per security price paid by investors in connection with the Qualified Offering. The Offering described in Note 12 – Shareholders Equity, was a Qualified Offering and the Bridge Financing Notes were converted into equity in connection with the Offering on February 17, 2021.
| 10 |
NOTE 109 – COMMITMENTS AND CONTINGENCIESDEBT
The Company’s borrowings as of March 31, 2021 and December 31, 2020 consisted of the following:
| March 31, | December 31, | |||||||
| 2021 | 2020 | |||||||
| Revolving Facility | $ | – | $ | 3,403,143 | ||||
| Term Loan, net of $0 and $252,322 unamortized debt issuance costs | – | 1,868,320 | ||||||
| Total | – | 5,271,463 | ||||||
| Less current debt due within one year | – | (5,271,463 | ) | |||||
| Total long-term debt | $ | – | $ | - | ||||
On February 21, 2020, we entered into a letter agreement (the “Credit Agreement”) by and among the Company, as borrower, urban-gro Canada Technologies Inc. and Impact., as guarantors, the lenders party thereto (the “Lenders”), and Bridging Finance Inc., as administrative agent for the Lenders (the “Agent”). The Credit Agreement, which was denominated in Canadian dollars (C$), was comprised of (i) a 12-month senior secured demand term loan facility in the amount of C$2.7 million ($2.0 million), which was funded in its entirety on the closing date (the “Term Loan”); and (ii) a 12-month demand revolving credit facility of up to C$5.4 million ($4.0 million), which could be drawn from time to time, subject to the terms and conditions set forth in the Credit Agreement and described further below (the “Revolving Facility,” and together with the Term Loan, the “Facilities”). The Credit Agreement was personally guaranteed by the Company’s CEO and Chairman, Brad Nattrass, and was to be in place for the original term of the Credit Agreement (1 year) plus a 1-year extension period at the discretion of the Lender as provided in the Credit Agreement.
The final maturity date of the Facilities was initially stipulated in the Credit Agreement as the earlier of (i) demand, and (ii) the date that is 12 months after the closing date, with a potential extension to the date that is 24 months after the closing date (the “Initial Maturity Date”). The Facilities bore interest at the annual rate established and designated by the Bank of Nova Scotia as the prime rate, plus 11% per annum. Accrued interest on the outstanding principal amount of the Facilities was due and payable monthly in arrears, on the last business day of each month, and on the Initial Maturity Date.
The Revolving Facility could initially be borrowed and re-borrowed on a revolving basis by the Company during the term of the Facilities, provided that borrowings under the Revolving Facility were limited by a loan availability formula equal to the sum of (i) 90% of insured accounts receivable, (ii) 85% of investment grade receivables, (iii) 75% of other accounts receivable, (iv) 50% of eligible inventory, and (v) the lesser of C$4.05 million ($3.0 million) and (A) 75% of uncollected amounts on eligible signed equipment orders for equipment systems contracts and (B) 85% of uncollected amounts on eligible signed professional services order forms for design contracts. The Revolving Facility could be prepaid in part or in full without a penalty at any time during the term of the Facilities, and the Term Loan could be prepaid in full or in part without penalty subject to 60 days prior notice in each case subject to certain customary conditions.
On September 4, 2020, the Company executed an amendment to the Credit Agreement (the “First Amendment”) whereas the Facilities described above were due on December 31, 2021 (the “Revised Maturity Date”). The First Amendment also increased the rate at which the Facilities will bear interest to the annual rate established and designated by the Bank of Nova Scotia as the prime rate, plus 12% per annum.
As a result of the First Amendment, the Company was required to prepay, on or before January 31, 2021, $1,000,000 of the balance of the Term Loan and begin making monthly payments of $100,000 on the balance on the Term Loan starting on March 1, 2021. Additionally, the Company was required to make monthly payments of $50,000 on the balance under the Revolving Facility beginning October 1, 2020 and could make no more draws under the Revolving Facility.
The Company leases an officeincurred $1,314,868 of debt issuance costs in connection with these Facilities, of which $676,822 was non-cash in the form of Common Stock and warehouse in Lafayette, Colorado. The lease ends on August 31, 2020. Future minimum lease payments are $46,000 in 2018.warrant issuances. The Company entered into a lease agreement with Bravo Lighting a related party, to sublease office space for 12 months commencing in September 2017. Minimum lease payments are $9,000 forestimated the remainderfair value of 2018.these warrants at the respective balance sheet dates using the Black-Scholes option pricing based on the market value of the underlying Common Stock at the valuation measurement date of $6.00, the remaining contractual terms of the warrants of 5 years, risk free interest rate of 1.14% an expected volatility of the price of the underlying Common Stock of 100%. The Company leased two cars forrecorded the usedebt issuance costs as either a deferred financing asset or a direct reduction of its employees in December 2017.the loan obligation based on the pro-rata value of the Revolving Facility and Term Loan, respectively, on the closing date. The leases end December 2020. The future minimum payments fordebt issuance costs were being amortized as interest expense over the car leases are $5,775 forlife of the remainder of 2018. The following is a schedule showing future minimum lease payments:
| Year ending | Total Minimum | |||||
| December 31, | Lease Payments | |||||
| 2018 | $ | 60,775 | ||||
| 2019 | 98,775 | |||||
| 2020 | 67,775 | |||||
| 2021 | – | |||||
| 2022 | – | |||||
From time to time,Facilities, until the Revised Maturity Date. On February 17, 2021, the Company is involved in routine litigation that arises inrepaid all amounts outstanding under the ordinary courseCredit Agreement and expensed the remaining unamortized debt issuance costs as loss on extinguishment of business. There are no legal proceedings for which management believesdebt. As of December 31, 2020, there were $504,644 and $252,322 of unamortized debt issuance costs remaining related to the ultimate outcome would have a material adverse effect on the Company’s results of operationsRevolving Facility and cash flows.Term Loan, respectively.
NOTE 1110 – RISKS AND UNCERTAINTIES
Concentration Risk
During the three months ended June 30, 2018,March 31, 2021 and 2020, one vendor composed 15%client represented 31% and another client represented 26% of total purchasesrevenue, respectively. At March 31, 2021 one client represented 18% and two unrelated vendors composed 11% each. During three months ended June 30, 2017, one vendor composed 44% of total purchases. During the six months ended June 30, 2018 one vendor composed 10% of total purchases. During the six months ended June 30, 2017, one vendor composed 37% of total purchases. See note 3 for discussion of related party transactions that represent the 2% of purchases from Bravo Lighting during the three months ending June 30, 2018 and 7% during the three months ending June 30, 2017. For the six months ending June 30, 2018 and 2017 the purchases from bravoanother represented 8% and 2% of total purchases, respectively.
The Company’s primary suppliers of automated fertigation controls represented 30% and 16% of total outstanding accounts payable outstanding as of June 30, 2018 andreceivable. At December 31, 2017, respectively. The Company’s primary suppliers of benching2020, one client represented 2%23% and 0%another represented 17% of total outstanding accounts payable outstanding as of June 30, 2018 and December 31, 2017, respectively.receivable.
| 11 |
During the three months ended June 30, 2018 and 2017,March 31, 2021, 18% of the Company’s total purchases were from one customer represented 27% and one customer 12% of total revenue respectively.vendor. During the sixthree months ended June 30, 2018,March 31, 2020, one customer represented 17%vendor composed 21% and another vendor composed 15% of the Company’s total revenue respectively. During the 6 months ended June 30, 2017, no customer represented more than 10% of total revenue.purchases.
NOTE 12 - STOCK COMPENSATIONCoronavirus Pandemic
The outbreak of COVID-19, a novel strain of coronavirus first identified in China, which has spread across the globe including the U.S., has had an adverse impact on our operations and financial condition. The response to this coronavirus by federal, state and local governments in the U.S. has resulted in significant market and business disruptions across many industries and affecting businesses of all sizes. This pandemic has also caused significant stock market volatility and further tightened capital access for most businesses. Given that the COVID-19 pandemic and its disruptions are of an unknown duration, they could have an adverse effect on our liquidity and profitability.
In June 2017,
The ultimate magnitude of COVID-19, including the Company implemented a stock grant programextent of its impact on our financial and operational results, which could be material, will depend on the length of time that the pandemic continues, its effect on the demand for our products and our supply chain, the effect of governmental regulations imposed in response to reward and attract employees with Common Stock. Stock grants are offeredthe pandemic, as partwell as uncertainty regarding all of the employment offer package or as a reward for performance.
The Company measuresforegoing. We cannot at this time predict the cost of services received in exchange for an award of equity instruments based on the fair valuefull impact of the award. For employeesCOVID-19 pandemic, but it could have a larger material adverse effect on our business, financial condition, results of operations and directors, the fair value of the awardcash flows beyond what is measured on the grant date and for non-employees, the fair value of the award is generally re-measured on vesting dates and interim financial reporting dates until the service period is complete. The fair value amount is then recognized over the period during which services are required to be provided in exchange for the award, usually the vesting period. The amortized expense is reported on the income statement as stock compensation expense for employees’ stock grants. Stockdiscussed within this Report.
NOTE 11 – STOCK-BASED COMPENSATION
Stock-based compensation expense for the three months ended June 30, 2018March 31, 2021 and 20172020 was $114,105$290,805 and $8,690 respectively. Stock compensation expense for the six months ended June 30, 2018 and 2017 was $213,955 and $8,690$432,645, respectively, based on the vesting schedule of the stock grants. As of June 30, 2018, 137,000 shares vestedgrants and were issued to employees. Stock granted to non-employees is presented on the income statement in the expense account that related to the service performed.options. No cash flow affectseffects are anticipated for stock grants.
Stock Grants:
During the six months ended June 30, 2018, the Company reserved 446,500 shares of Common Stock to employees which will vest after a period of 1, 2 or 3 years of employment. The fair value of the stock is $446,500 based on the average share price of $1. The following scheduletable shows stock grant activity for the periodthree months ended June 30, 2018.March 31, 2021:
| Grants awarded | ||||
As of March 31, 2021, the Company has $329,448 in unrecognized share-based compensation expense related to these stock grants.
Stock Options:
The following table summarizesshows stock grant vesting periods.option activity for the three months ended March 31, 2021:
| Year Ending | ||||||
| Amount of Shares | December 31, | |||||
| 295,167 | 2018 | |||||
| 207,667 | 2019 | |||||
| 116,666 | 2020 | |||||
| 619,500 | ||||||
| Number of Shares | Weighted Average Remaining Life (Years) | Weighted Average Exercise Price | ||||||||||
| Stock options outstanding as of December 31, 2020 | 638,278 | 7.72 | $ | 6.48 | ||||||||
| Issued | 55,833 | 4.76 | $ | 6.00 | ||||||||
| Expired | 18,444 | 5.07 | $ | 7.89 | ||||||||
| Stock options outstanding at March 31, 2021 | 675,667 | 7.55 | $ | 6.40 | ||||||||
| Stock options exercisable at March 31, 2021 | 369,305 | 7.69 | $ | 6.46 | ||||||||
In January 2018, the Company implemented a stock options plan to reward and attract employees and compensate vendors for services. Stock options are offered as part of the employment offer package or as a reward for performance.The stock option plan authorizes 3,000,000 shares of Common Stock. 100,000 options have been awarded under the Plan as of June 30, 2018 and no options were awarded as of December 31, 2017. The fair value of the options is $90,103calculated using the Black-Scholes option pricing model based on the estimated market value of the underlying common stock at the valuation measurement date of $1.00,$6.00, the remaining contractual term of the options of 105 years, risk-free interest rate of 2.75%0.36% and expected volatility of the price of the underlying common stock of 100%. There is a moderate degree
As of subjectivity involved when using option pricing modelsMarch 31, 2021, the Company has $673,086 in unrecognized share-based compensation expense related to estimatethese stock options. The aggregate intrinsic value of the options outstanding and the assumptions used in the Black Scholes option-pricing model are moderately judgmental. No options have vested as of June 30, 2018. The following schedule shows stock option activity for the period ended June 30, 2018.exercisable at March 31, 2021 is $0.
| Number of Shares | Weighted Average Remaining Life (Years) | Weighted Average Exercise Price | ||||||||||
| Stock options outstanding as of December 31, 2017 | – | – | – | |||||||||
| Issued | 100,000 | |||||||||||
| Exercised | – | |||||||||||
| Expired | – | |||||||||||
| Stock options outstanding at June 30, 2018 | 100,000 | 9.9 | $ | 1.00 | ||||||||
| Stock options exercisable at June 30, 2018 | 0 | |||||||||||
The following table summarizes stock option vesting periods.
| Year Ending | ||||||
| Amount of Shares | December 31, | |||||
| 50,000 | 2018 | |||||
| 25,000 | 2019 | |||||
| 25,000 | 2020 | |||||
| 100,000 | ||||||
NOTE 1312 – SHAREHOLDER’SSHAREHOLDERS’ EQUITY AND MEMBER’S DEFICIT
The Company was formed by Bradley Nattrass and Octavio Gutierrez on March 20, 2014, as a Colorado limited liability company with equity contributions totaling $100 from each member. In August 2016, when still an LLC, the Company undertook a private offering of member interests wherein the Company received subscriptions of $575,107 in the form of 6,392 member interests to three (3) accredited investors (approximately $90 per member interest).
On December 31, 2016, the Company issued 8,008 membership units to key employees. On December 31, 2016 the Company issued 1,943 membership units to vendors for services provided. Total outstanding membership units at December 31, 2016 were 116,343.
In February 2017 under a 351 Exchange Agreement, the members converted an aggregate of 116,343 membership interests into 22,500,000 shares of Common Stock (193.3936722 to 1). The effective date for the exchange was February 23, 2017.
In March 2017, the Company’s authorized capital consisted of 100,000,000 shares of Common Stock, $0.001 par value per share, and 10,000,000 shares of Preferred Stock, par value $0.10 per share.
In June 2017, the Company implemented a stock grant program to reward and attract employees with Common Stock. Stock grants are offered as part of the employment offer package or as a reward for performance.During the six months ended June 30, 2018, the Company reserved 446,000 shares of Common Stock to employees which vests after one, two or three years of employment. Fair value of the stock is $109,000 based on the average share price of $1. As of June 30, 2018 the Company granted a total of 756,500 shares of Common Stock to employees. As of June 30, 2018, 137,000 grants vested.
As of December 31, 2017 there were 25,046,000 shares of Common Stock issued and outstanding.
In March 2018,2020, an executive left the Company and returned 375,000 Common Shares16,667 common shares as part of the related separation agreement. The Company retired the shares and reduced its issued and outstanding stock by 375,00016,667 shares.
In June 2018, 137,000 shares of Common Stock previously reserved for issuance to employees, vested and were issued.
As of June 30, 2018 there were no shares of Preferred Stock issued or outstanding and 24,808,000 shares of Common Stock issued and outstanding.
NOTE 14 - INCOME TAXES
The Tax Cuts and Jobs Acts (the “Act”) was enacted on December 22, 2017. The Act reduces the U.S. federal corporate income tax rate from 35% to 21%. ASC 740, “Income Taxes”, requires that effects of changes in tax rates to be recognized in the period enacted. Recognizing the late enactment of the Act and complexity of accurately accounting for its impact, the Securities and Exchange Commission in SAB 118 provides guidance that allows registrants to provide a reasonable estimate of the Act in their financial statements and adjust the reported impact in a measurement period not to exceed one year. The Company has not completed its accounting for the tax effects of the Act; however, a reasonable estimate was made to measure tax liabilities based on the rates at which they are expected to reverse in the future as a result of the reduction on the federal tax rate, and the Company has estimated no tax liability as of December 31, 2017 due to operating losses. The Company has adopted the provisions of ASC 740-10-25, which provides recognition criteria and a related measurement model for uncertain tax positions taken or expected to be taken in income tax returns. ASC 740-10-25 requires that a position taken or expected to be taken in a tax return be recognized in the financial statements when it is more likely than not that the position would be sustained upon examination by tax authorities. Tax position that meet the more likely than not threshold are then measured using a probability weighted approach recognizing the largest amount of tax benefit that is greater than 50% likely of being realized upon ultimate settlement. Management has filed an extension with the IRS and has not determined if it is more likely or not to recognize a loss carryforward. The Company had no tax positions relating to open income tax returns that were considered to be uncertain. The company utilizes FASB ASC 740, “Income Taxes” which requires the recognition of deferred tax assets and liabilities for the expected future tax consequences of events that have been included in the financial statements or tax returns. Under this method, deferred tax assets and liabilities are determined based on the difference between the tax basis of assets and liabilities and their financial reporting amounts based on enacted tax laws and statutory tax rates applicable to the periods in which the differences are expected to affect taxable income. Valuation allowances are established if it is more likely than not that some portion or all of the deferred tax asset will not be realized. The Company had no tax provisions as of June 30, 2018 and December 31, 2017. The Company had a net loss during the quarter ended June 30, 2018, resulting in no tax liability incurred in the current quarter.
NOTE 15 – WARRANTSOn February 17, 2021, we completed an offering of 6,210,000 shares of our common stock, inclusive of the underwrites full overallotment, at $10.00 per share for total gross offering proceeds of $62,100,000. In connection with this offering, we received approval to list our common stock on the Nasdaq Capital Market under the symbol “UGRO”.
NOTE 13 – WARRANTS
Warrants are immediately exercisable upon issuance. The following table shows warrant activity for the three months ended March 31, 2021.
| Number of shares | Weighted Average Exercise Price | |||||||
| Warrants outstanding as of December 31, 2020 | 202,752 | $ | 13.64 | |||||
| Exercised | (21,747 | ) | 24.00 | |||||
| Issued in connection with equity offering | 310,500 | $ | 12.50 | |||||
| Warrants outstanding as of March 31, 2021 | 491,505 | $ | 12.75 | |||||
| Warrants exercisable as of March 31, 2021 | 491,505 | $ | 12.75 | |||||
The Company issued one round of warrants related to a debt transaction that were issued on April 19, 2018. These were valued on this date per the signed agreements and issuance on April 19, 2018. The Company accounts for its warrants issued in accordance with the US GAAP accounting guidance under ASC 480. We estimated the fair value of thesethe warrants at the respective balance sheet datesis calculated using the Black-Scholes option pricing model based on the estimated market value of the underlying common stock at the valuation measurement date of $1.00,$10.00, the remaining contractual term of the warrantoptions of 5 years, risk-free interest rate of 2.75%0.57% and expected volatility of the price of the underlying common stock of 100%. There is a moderate degree of subjectivity involved when using option pricing models to estimate the warrants and the assumptions used in the Black Scholes option-pricing model are moderately judgmental.
The following table summarizes our share warrants as of June 30, 2018 and December 31, 2017:
| June 30, | December 31, | |||||||||||||||
| 2018 | 2017 | |||||||||||||||
| Number of shares | Weighted Average Exercise Price | Number of shares | Weighted Average Exercise Price | |||||||||||||
| Warrants outstanding, beginning of period | – | – | – | – | ||||||||||||
| Warrants issued | 6,000 | $ | 1.00 | – | – | |||||||||||
| Warrants exercised | – | – | – | – | ||||||||||||
| Warrants outstanding, end of period | 6,000 | $ | 1.00 | – | – | |||||||||||
| Warrants exercisable, end of period | 6,000 | $ | 1.00 | – | – | |||||||||||
The weighted-average remaining contractual life forof the warrants outstanding and exercisable at June 30, 2018 is 4.8 years, and the2.4 years. The aggregate intrinsic value of the warrants outstanding and exercisable at June 30, 2018March 31, 2021 is $0.
NOTE 1614 – SUBSEQUENT EVENTS
Management has evaluatedassessed and determined that no significant subsequent events through August 17, 2018, which is the date the financial statements were availableare to be issued. There were no subsequent events that required adjustmentdisclosed according to or disclosure in the consolidated financial statements.ASC 855.
| 13 |
ITEM 2. MANAGEMENT’S DISCUSSION AND ANALYSIS OF FINANCIAL CONDITION AND RESULTS OF OPERATIONS
The following discussion should be read in conjunction with our condensed consolidated financial statements and notes thereto included herein. In connection with, and because we desire to take advantageSee also “Forward Looking Statements” on page 3 of the “safe harbor” provisions of the Private Securities Litigation Reform Act of 1995, we caution readers regarding certain forward looking statements in the following discussion and elsewhere in this report and in any other statement made by, or on our behalf, whether or not in future filings with the Securities and Exchange Commission. Forward looking statements are statements not based on historical information and which relate to future operations, strategies, financial results or other developments. Forward looking statements are necessarily based upon estimates and assumptions that are inherently subject to significant business, economic and competitive uncertainties and contingencies, many of which are beyond our control and many of which, with respect to future business decisions, are subject to change. These uncertainties and contingencies can affect actual results and could cause actual results to differ materially from those expressed in any forward looking statements made by, or on our behalf. We disclaim any obligation to update forward looking statements.Report.
Overview and History
We were originally formed on March 20, 2014, asurban-gro, Inc. (“we,” “us,” “our,” the “Company,” or “urban-gro”) is a Colorado limited liability company. In March 2017, we converted to a corporationleading engineering design and issued 193.3936722 shares of our Common Stock for every Member Interest issued and outstandingservices company focused on the datecommercial indoor horticulture market. We engineer and design indoor controlled environment agriculture (“CEA”) facilities and then integrate complex environmental equipment systems into those facilities. Through this work, we create high-performance indoor cultivation facilities for our clients to grow specialty crops, including leafy greens, vegetables, herbs, and plant-based medicines like cannabis and hemp. Our custom-tailored approach to design, procurement, and equipment integration provides a single point of conversion.accountability across all aspects of indoor growing operations. We also help our clients achieve operational efficiency and economic advantages through a full spectrum of professional services and programs focused on facility optimization and environmental health which allows clients to manage their entire cultivation lifecycle, establishing facilities that operate and perform at the highest level.
We are an agricultural technology systems integrator that provides full design and expertise on climate and automated control of fertigation/irrigation systems, lighting systems, environmental, substrate and inventory monitoring, water treatment systems, integrated pest management solutions, and a complete line of cultivation equipment targeting growers of the world’s highest value crops including cannabis, tomatoes, strawberries, chilies and peppers, and leaf lettuce. While it is our intention to expand our operations to additional applications, to date, all of our revenues have been generated in the cannabis industry.
We engage directly in the business of manufacturing, distributing and selling lighting, pest management, fertigation, water and other products to the medical and recreational cannabis industry in states where operation of a cannabis production facility has been legalized. We have and will continueaim to work with grow operationsour clients for the life of their facility – providing value to them from inception through ongoing facility operation. We are a trusted partner and production facilitiesadvisor to pursue strategiesour clients and offer a complete set of engineering and managed services complemented by a vetted suite of select cultivation equipment systems. Outlined below is an example of a complete project with estimated time frames for each phase that demonstrate how we provide value to provide services, products, and other potential revenue-producing opportunities with respect to our clients for the cannabis industry in those states where the same is lawful. We engage directly with the ownership groups and growers at large indoor and outdoor greenhouse cultivation facilities and strategically work with them to provide value-added services and industry best products that assist them in lowering production costs and increasing crop yields. While earmarking the emerging cannabis market as our principal target market, we are also marketing to customers outsidelife of the cannabis industry to diversify our operations.their facility.
| 14 |
Our executive officeindoor commercial cultivation solution offers an integrated suite of services and equipment systems that generally fall within the following categories:
| ● | Service Solutions: |
| ● | Engineering Design Services – A comprehensive triad of services including: |
| i. | Cultivation Space Programming (“CSP”) |
| ii. | Integrated Cultivation Design (“ICD”) |
| iii. | Full-Facility Mechanical, Electrical, and Plumbing (“MEP”) |
| ● | gro-care® - A recurring revenue subscription-based managed service offering including: |
| i. | Remote Monitoring, Reporting, Support, and Training Services |
| ii. | Facility and Equipment Commissioning & Audit Services |
| iii. | Environmental Sciences Groups’ (“ESG”) Compliance and Program Services |
| ● | Integrated Equipment Solutions: |
| ● | Design, Source, and Integration of Complex Environmental Equipment Systems Including Purpose-Built Heating, Ventilation, and Air Conditioning (“HVAC”) solutions, Environmental Controls, Fertigation, and Irrigation Distribution. |
| ● | Value-Added Reselling (“VAR”) of Cultivation Equipment including a Complete line of Lighting and Rolling Benching Systems |
| ● | Strategic Vendor Relationships with Premier Manufacturers |
The majority of our clients are commercial CEA cultivators. We believe one of the key points of our differentiation that our clients value is located at 1751 Panorama Point, Unit G, Lafayette, CO 80026,the depth of experience of our employees and our phone number is (720) 390-3880. Our Company website iswww.urban-gro.com, which contain a descriptionCompany. We currently employ 49 individuals. Approximately two-thirds of our employees are considered experts in their areas of focus, and our team includes Engineers (Mechanical, Electrical, Plumbing, Controls, and Agricultural), Professional Engineers, horticulturalists and individuals with Masters Degrees in Plant Science and Business Administration. As a company, we have worked on more than 300 indoor CEA facilities, and believe that the experience of our team and Company provide clients with the confidence that we will proactively keep them from making common costly mistakes during the build out and products, but such websitesoperational stages. Our expertise translates into clients saving time, money, and resources, and provides them ongoing access to expertise that they can leverage without having to add headcount to their own operations. We provide this experience in addition to offering a platform of the information contained onhighest quality equipment systems that can be integrated holistically into our websites are not part of this Prospectus. In addition, we also maintain branded product websites of www.soleiltech.ag and www.opti-dura.com.
We have not been subject to any bankruptcy, receivership or similar proceeding.clients’ facilities.
Results Of Operations
Comparison of Results of Operations forDuring the sixthree months ended June 30, 2018 and 2017
During the six month period ended June 30, 2018,March 31, 2021, we generated revenues of $9,343,664,$12.0 million compared to revenues of $4,795,114$4.2 million during the similar period in 2017,three months ended March 31, 2020, an increase of $4,548,550.$7.8 million, or 182%. Equipment systems revenue increased $8.0 million primarily due to an increase in cultivation equipment sales, services revenue decreased $0.1 million and consumable product sales decreased $0.1 million.
During the three months ended March 31, 2021, cost of revenues was $9.4 million compared to $3.1 million during the three months ended March 31, 2020, an increase of $6.3 million, or 198%. This increase arose primarily as a result of increased revenues attributable to sales of cultivation technology, which increased by $4,908,008. While this increase may beis directly attributable to the general growth of the cannabis industry in North America which has provided us with additional sales opportunities, we also believe that this increase in revenue occurred primarily as a result of our increased emphasis on our cultivation technologies segment. This segment included $2,638,038 in revenues derived from cultivation equipment, compared to revenues of $693,534 in this segment during the six months ended June 30, 2017, which occurred as a result of our increased focus on the sale of cultivation equipment in 2018, as well as an increase of $2,238,807 in fertigation, which we attribute to increased marketing efforts and industry demand for large control systems. In addition, cultivation technology revenues increased in other segments, including integrated pest management, which increased by $197,930, which we believe was directly attributable to new employees hired to market this segment, inputs, which increased by $35,348, which we believe was due to increased sales of substrates due to more focus on consumables in the cannabis industry and other cultivation revenue, which increased by $491,420, which was primarily due to project management fees and forfeited deposits by clients who cancelled projects after the design work had commenced.indicated above.
We also generated additional revenues in salesGross profit was $2.6 million (22% of our lighting systems, which decreased fromrevenues) during the relevant period in 2017 by $381,221three months ended March 31, 2021 compared to $1.1million (26% of revenues) during the three months ended March 31, 2020. Gross profit as a resultpercentage of revenues decreased due to a large decreaserevenue mix shift in P.L. light sales, which we have discontinued. However,the current period favoring equipment systems revenues from the sale of our soleil grow light systems increased by $1,225,487.
As we have previously disclosed, in 2016 we began diversifying our business, moving from a lighting distribution company to emphasizing cultivation technologies. In 2015, we were considered a value added reseller of P.L. grow light systems, with 97% of our revenues generated from lighting related product sales. In order to grow our business we made a strategic decision to:
· focus on building/positioning our brand as an ancillary national market leader delivering best in class value-added product solutions to Cannabis cultivators;
· expand our sales reach to extend across the US;versus services and
· expand our product offering to include a full line of other cultivation equipment and products used by cannabis cultivators.
We now consider ourselves a one-stop, turnkey provider of agricultural technology systems.
Cost of goods sold increased to $6,473,345 during the six months ended June 30, 2018, compared to $3,637,794 during the similar period in 2017, an increase of $2,835,551. These increases are directly related to our increased consumables revenues.
Operating expenses also increased duringremained constant at $2.5 million for the sixthree months ended June 30, 2018March 31, 2021 compared to the same period in 2017 by $2,098,223, from $2,014,527 in the sixthree months ended June 30, 2017, to $4,112,750 in the same period in 2018. Marketing expense increased by $249,770March 31, 2020. This was due to increasesthe offsetting effects of a $0.1 million reduction in advertisingstock-based compensation expense and a $0.1 million increase in general operating expenses, business development and costs of attendance at trade shows. Office costs and personnel expense increased by $149,696 and $1,333,989, respectively,mainly due to our expanding work force. Many of our new employees are members of management, whichan increase in salary and travel expenses.
Non-operating expenses increased compensation expense. Professional fees also increased by $152,602, from $231,229 during$1.4 million to $1.7 million for the sixthree months ended June 30, 2017,March 31, 2021, compared to $383,831 in 2018. Travel expense increased by $156,304 due to our expanding sales and marketing to additional jurisdictions. Stock compensation expense$0.3 million for the sixthree months ended June 30, 2018 and 2017 was $213,955 and $8,690, respectively, basedMarch 31, 2020. The Company incurred a $0.8 million loss on the vesting schedule of the stock grants. As of June 30, 2018, 137,000 shares vested and were issued to employees.
Through repaymentextinguishment of debt and a $0.6 million expense related to the conversion of previously existing debt to equity interest expense inat a discount to the sixoffering price for the three months ended June 30, 2018 was $43,274, compared to $162,421 incurred during the six months ended June 30, 2017.March 31, 2021.
As a result of the above, we incurred a net loss of ($1,281,698) during$1.6 million for the sixthree months ended June 30, 2018 ($0.05March 31, 2021, or a loss per share),share of $0.20, compared to a net loss of ($1,019,088) during the six months ended June 30, 2017 ($0.04 per share).
Comparison of Results of Operations$1.7 million for the three months ended June 30, 2018 and 2017March 31, 2020 or a loss per share of $0.36.
During the three month period ended June 30, 2018, we generated revenues of $5,897,300, compared to revenues of $3,368,570 during the similar period in 2017, an increase of $2,528,730. This increase arose primarily as a result of increased revenues attributable to sales of cultivation technology, which increased by $3,038,335. While this increase may be attributable to the general growth of the cannabis industry in North America which has provided us with additional sales opportunities, we also believe that this increase in revenue occurred primarily as a result of our increased emphasis on our cultivation technologies segment. This segment included $1,837,971 in revenues derived from cultivation equipment, compared to revenues of $534,033 in this segment during the three months ended June 30, 2017, which occurred as a result of our increased focus on the sale of cultivation equipment in 2018, as well as an increase of $2,595,928 in fertigation, which we attribute to increased marketing efforts and industry demand for large control systems. In addition, cultivation technology revenues increased in other segments, including integrated pest management, which increased by $31,126, which we believe was directly attributable to new employees hired to market this segment and other cultivation revenue, which increased by $407,901, which was primarily due to project management fees and forfeited deposits by clients who cancelled projects after the design work had commenced.
We also generated additional revenues in sales of our lighting systems, which decreased from the relevant period in 2017 by $452,874 as a result of a large decrease in P.L. light sales, which we have discontinued. However, in this segment, revenues from the sale of our soleil grow light systems increased by $570,360. See the discussion included in the comparative section for the 6 months for an additional explanation as to why our revenues increased.
Cost of goods sold increased to $4,030,852 during the three months ended June 30, 2018, compares to $2,530,055 during the comparable period in 2017, an increase of $1,500,797. These increases are directly related to increased revenues.
| 15 |
OperatingNON-GAAP FINANCIAL MEASURES
The Company uses the supplemental financial measure of Adjusted Earnings before Interest, Taxes, Depreciation and Amortization (“Adjusted EBITDA”) as a measure of our operating performance. Adjusted EBITDA is not calculated in accordance with accounting principles generally accepted in the United States of America (“GAAP”) and it is not a substitute for other measures prescribed by GAAP such as net income (loss), income (loss) from operations, and cash flows from operating activities. We define Adjusted EBITDA as net income (loss) attributable to urban-gro, Inc., determined in accordance with GAAP, excluding the effects of certain operating and non-operating expenses also increased duringincluding, but not limited to, interest expense, depreciation of tangible assets, amortization of intangible assets, impairment of investments, unrealized exchange losses, and stock-based compensation expense that we do not believe reflect our core operating performance.
Our board of directors and management team focus on Adjusted EBITDA as a key performance and compensation measure. We believe that Adjusted EBITDA assists us in comparing our operating performance over various reporting periods because it removes from our operating results the three months ended June 30, 2018 comparedimpact of items that our management believes do not reflect our core operating performance.
The following table reconciles net loss attributable to the same period in 2017 by $1,129,695, from $1,211,161 in the three months ended June 30, 2017,Company to $2,340,856 in the same period in 2018. Marketing expense increased by $187,587 due to increases in advertising expenses, business development and costs of attendance at trade shows. Office costs and personnel expense increased by $26,196 and $684,853, respectively, due to our expanding work force. Many of our new employees are members of management, which increased the compensation expense. Professional fees also increased by $97,356 and travel expense increased by $187,751 due to our expanding sales and marketing to additional jurisdictions. Stock compensation expenseAdjusted EBITDA for the three months ended June 30, 2018 and 2017 was $114,105 and $8,690 respectively. As of June 30, 2018, 137,000 shares vested and were issued to employees.periods presented:
Through repayment of debt, as well as conversion of previously existing debt to equity, interest expense in the three months ended June 30, 2018 was $24,561, compared to $75,269 incurred during the three months ended June 30, 2017
As a result, we incurred a net loss of ($499,049) during the three months ended June 30, 2018 ($0.02 per share), compared to a net loss of ($447,375) during the three months ended June 30, 2017 ($0.02 per share).
| Three months Ended March 31, | ||||||||
| 2021 | 2020 | |||||||
| Net Loss | $ | (1,588,582 | ) | $ | (1,695,631 | ) | ||
| Interest expense | 317,443 | 298,634 | ||||||
| Interest expense – BCF | 636,075 | – | ||||||
| Loss on extinguishment of debt | 790,723 | – | ||||||
| Stock-based compensation | 290,805 | 432,645 | ||||||
| Depreciation and amortization | 55,684 | 60,553 | ||||||
| Adjusted EBITDA | $ | 502,148 | $ | (903,799 | ) | |||
Liquidity and Capital Resources
As of June 30, 2018,March 31, 2021, we had cash orand cash equivalents of $1,023,284.$49.9 million, which represented an increase of $49.7 million from December 31, 2020. This increase in cash and cash equivalents is primarily due to the net proceeds received from our equity offering in February of 2021 of $58.2 million offset by $5.8 million of debt repayment and $3.0 million of treasury stock purchases during the quarter ended March 31, 2021.
Net cash provided by operating activities was $0.3 million during the three months ended March 31, 2021, compared to net cash used in operating activities was $(408,344)of $1.9 million during the six month periodthree months ended June 30, 2018,March 31, 2020, an improvement of $2.2 million. This increase in cash provided by operating activities is primarily the result of the $1.6 million improvement in income from operations for the comparable periods with the remaining fluctuation being primarily comprised of fluctuations in operating assets and liabilities. At March 31, 2021, we had $4.7 million in client deposits related to client orders, compared to $266,036 for the six month period ended June 30, 2017.client deposits of $4.9 million as of December 31, 2020. We anticipate that overhead costs and other expenses will increase in the future as we continue to expand our operations.
Cash flows used in investing activities were $297,163 for the six month period ended June 30, 2018 compared to $30,670 during the same six months period in 2017. Cash flows provided by financing activities were $72,000 in the six month period ended June 30, 2018, compared to $304,754 provided by financing activities during the six months ended June 30, 2017.
During the three month period ended June 30, 2018, 137,000 shares of Common Stock previously reserved for issuance to employees, vested and were issued.
The significant increase in customer deposits was due to an increase in customer orders. Customer orders require prepayments from clients before theany design work is commenced and before any material is ordered from the vendor. PrepaymentsThese prepayments are booked to the customerclient deposits liability account when received. When the product ships to the customer, the customer is invoiced and an accounts receivable balance is created for the customer. The deposit is then moved from the customer deposit account to the customer accounts receivable account to clear the receivable. Our standard policy is to collect the following before action is taken: a 10% design deposit, 40% order deposit, and a 50% shipping deposit. We expect customerclient deposits to be relieved from the deposits account no longer than 12 months for each project. The netAt March 31, 2021, we had $3.4 million of vendor prepayments compared to $2.7 million at December 31, 2020. At March 31, 2021, we had $2.2 million in accounts payable, compared to $0.7 million at December 31, 2020.
Net cash used in operationsinvesting activities was $0.0 million for prepaymentsthe three months ended March 31, 2021, compared to $0.1 million during the three months ended March 31, 2020. Historically, cash has been used to increase our investments in strategic partnerships and advances areto acquire property and equipment. We will continue to have ongoing needs to purchase property and equipment to maintain our operations. We have no material commitments for payments made to vendors for prepayments on orders. Due to the increase in projects, we increased our prepayments to order materials from our vendors.capital expenditures as of March 31, 2021.
In August 2016, when still an LLC, we undertook a private offeringNet cash provided by financing activities was $49.4 million for the three months ended March 31, 2021, compared to $2.0 million during the three months ended March 31, 2020. Cash provided from financing activities during the three months ended March 31, 2021 primarily relates to $58.2 million in net proceeds received from the issuance of member interests wherein we received subscriptions of $575,107stock, offset by $5.8 million used in the formrepayment of 6,392 member interests to three (3) accredited investors (approximately $90 per member interest) or approximately $0.46 per share based upon the conversion rate of 193.3636722notes payable and $3.0 million in treasury shares per member interest issued when we converted into a corporation in 2017). These funds were used to (i) add two systems designers to expand our Cultivation Technologies team to support market demand; (ii) expandacquired.
Inflation
Although our operations intoare influenced by general economic conditions, we do not believe that inflation had a material effect on our results of operations during the expanding fertigation marketplace as States approving legalized cannabis increased, (iii) hire a mechanical engineer to begin vetting opportunities to add IP and technology to our future business offering, (iv) hired a strategic financial consultant to aid in compiling a business forecast model; and (v) fund working capital to support brand building marketing initiatives focused on trade show participation and an Increased on-hand inventory position.three months ended March 31, 2021.
In May 2017, we commenced a private offering of our Common Stock wherein we received aggregate subscriptions of $2,546,000 from the sale of 2,546,000 shares, at $1 per share, to 76 investors, including 58 “accredited” investors, as that term is defined under the Securities Act of 1933, as amended. These funds were used to repay debt, expansion of our existing business operations, new investment opportunities and working capital.
| 16 |
We currently have three other notes outstanding, all of which are unsecured. Two of the note holders agreed to convert $300,000Critical Accounting Policies and $200,000 of their respective notes into shares of our Common Stock as part of our private placement of common stock in 2017, leaving a balance of $80,000 and $100,000, respectively. Interest accrues at 1.7% and 1.5% per month on these notes. Both are unsecured and due December 31, 2018. The third note has a principal balance of $300,000, accrues interest at the rate of 1.65% per month and was due to mature March 23, 2018. In March 2018 this note was extended for one year. In consideration for the lender’s agreement to extend this note we issued 6,000 warrants, each exercisable to purchase one shares of our Common Stock at a price of $1 per share for a term of five years. Interest is paid twice monthly.
While no assurances can be provided we anticipate that we will generate sufficient revenues during the remainder of 2018 and into 2019 to satisfy our needs. However, if we do not generate profits, or if such profits are insufficient, or if additional acquisitions are identified and we cannot use our securities as compensation, we will need additional capital to continue to implement our business plan. If such capital is required, we estimate that we will need approximately $500,000. While we believe we will be able to raise these funds in either debt or equity, we have no agreement with any third party to provide us the same and there can be no assurances that we will be able to raise any capital on commercially reasonable terms, or at all. If we require additional capital and are unable to raise the same, it could have a material negative impact on our results of operations.Estimates
Off BalanceCritical Accounting Policies and Estimates
The discussion and analysis of our financial condition and results of operations are based upon our financial statements, which have been prepared in accordance with accounting principles generally accepted in the United States. The preparation of these financial statements requires us to make estimates and judgments that affect the amounts of assets, liabilities, revenues and expenses, and related disclosure of contingent assets and liabilities. On an on-going basis, we evaluate our estimates based on historical experience and on various other assumptions that are believed to be reasonable under the circumstances, the results of which form the basis for making judgments about the carrying values of assets and liabilities that are not readily apparent from other sources. Actual results may differ from these estimates under different assumptions or conditions For a detailed discussion about the Company’s significant accounting policies, refer to Note 2 — “Summary of Significant Accounting Policies,” in the Company’s consolidated financial statements included in the Company’s 2020 Form 10-K. During the three months ended March 31, 2021, there were no material changes made to the Company’s significant accounting policies.
Off-Balance Sheet Arrangements
NoneWe have not entered into any off-balance sheet arrangements that have or are reasonably likely to have a current or future effect on our financial condition, changes in financial condition, revenues or expenses, results of operations, liquidity, capital expenditures or capital resources and would be considered material to investors.
ITEM 3. QUANTITATIVE AND QUALITATIVE DISCLOSURES ABOUT MARKET RISK.
We are a smaller reporting company and are not required to provide the information under this itemItem pursuant to Regulation S-K.
ITEM 4. CONTROLS AND PROCEDURES.
This reportDisclosure Controls and Procedures
Disclosure Controls and Procedures – Our management, with the participation of our Chief Executive Officer (“CEO”) and Chief Financial Officer (“CFO”), has evaluated the effectiveness of our disclosure controls and procedures (as such term is defined in Rules 13a-15(e) and 15d-15(e) under the Exchange Act) as of the end of the period covered by this Report.
These controls are designed to ensure that information required to be disclosed in the reports we file or submit pursuant to the Exchange Act is recorded, processed, summarized and reported within the time periods specified in the rules and forms of the SEC, and that such information is accumulated and communicated to our management, including our CEO and CFO to allow timely decisions regarding required disclosure.
Based on this evaluation, our CEO and CFO have concluded that our disclosure controls and procedures were effective as of March 31, 2021, at reasonable assurance levels.
We believe that our financial statements presented in this Form 10-Q fairly present, in all material respects, our financial position, results of operations, and cash flows for all periods presented herein.
Inherent Limitations – Our management team, including our CEO and CFO, does not expect that our disclosure controls and procedures will prevent all error and all fraud. A control system, no matter how well conceived and operated, can provide only reasonable, not absolute, assurance that the objectives of the control system are met. The design of any system of controls is based in part upon certain assumptions about the likelihood of future events, and there can be no assurance that any design will succeed in achieving its stated goals under all potential future conditions. Further, the design of a control system must reflect the fact that there are resource constraints, and the benefits of controls must be considered relative to their costs. Because of the inherent limitations in all control systems, no evaluation of controls can provide absolute assurance that all control issues and instances of fraud, if any, within our company have been detected. These inherent limitations include a reportthe realities that judgments in decision-making can be faulty, and that breakdown can occur because of management's assessment regardingsimple error or mistake. In particular, many of our current processes rely upon manual reviews and processes to ensure that neither human error nor system weakness has resulted in erroneous reporting of financial data.
Changes in Internal Control over Financial Reporting – There were no changes in our internal control over financial reporting during our three months ended March 31, 2021, which were identified in conjunction with management’s evaluation required by paragraph (d) of Rules 13a-15 and 15d-15 under the Exchange Act, that have materially affected, or an attestation report of the Company's registered public accounting firm dueare reasonably likely to a transition period established by rules of the Securities and Exchange Commission for newly public companies.materially affect, our internal control over financial reporting.
| 17 |
To the best of our management’s knowledge and belief, there are no material claims that have been brought against us nor have there been any claims threatened.
We are a smaller reporting company as defined by Rule 12b-2 of the Exchange Act and are not required to provide the information under this item pursuant to Regulation S-K.item.
ITEM 2. UNREGISTERED SALES OF EQUITY SECURITIES AND USE OF PROCEEDS
In June 2018, 137,000 shares of Common Stock previously reserved for issuance to employees, vested and were issued. We did not issue any other shares of our Common Stock in the six month period ended June 30, 2018. We did not receive any proceeds from the issuance of these shares. We relied upon the exemption from registration provided by Section 4(2) of the Securities Act to issue these shares.None.
ITEM 3. DEFAULTS UPON SENIOR SECURITIES
None.
ITEM 4. MINE SAFETY DISCLOSURE
Not Applicable.
None.
| 101.INS | XBRL Instance | |
| 101.SCH | XBRL Schema | |
| 101.CAL | XBRL Calculation Linkbase | |
| 101.DEF | XBRL Definition Linkbase | |
| 101.LAB | XBRL Label Linkbase | |
| 101.PRE | XBRL Presentation Linkbase | |
| Document |
______________________
* Pursuant to Rule 406T of Regulation S-T, these interactive data files are not deemed filed or part of a registration statement or prospectus for purposes of Section 11 or 12 of the Securities Act or Section 18 of the Securities Exchange Act and otherwise not subject to liability.
| 18 |
Pursuant to the requirements of Section 12 of the Securities and Exchange Act of 1934, the Registrant has duly caused this Report to be signed on its behalf by the undersigned, thereunto duly authorized, on August 16, 2018.May 11, 2021.
| URBAN-GRO, INC. | |||
| By: | /s/ Bradley Nattrass | ||
| Bradley Nattrass, | |||
| Principal Executive Officer, | a duly authorized officer | ||
| By: | /s/ | Richard Akright | |
| Principal Accounting Officer | |||
| 19 |