UNITED STATES
SECURITIES AND EXCHANGE COMMISSION
Washington, D.C. 20549
FORM 10-Q
x☒QUARTERLY REPORT PURSUANT TO SECTION 13 OR 15(d) OF THE SECURITIES EXCHANGE ACT OF 1934
For the quarterly period ended SeptemberJune 30, 20182019
or
¨ ☐TRANSITION REPORT PURSUANT TO SECTION 13 OR 15(d) OF THE SECURITIES EXCHANGE ACT OF 1934
For the transition period fromto
Commission file number 333-215435
Cheniere Corpus Christi Holdings, LLC
(Exact name of registrant as specified in its charter)
|
| | | |
| Delaware | 333-215435 | 47-1929160 |
| (State or other jurisdiction of incorporation or organization) | (Commission File Number) | (I.R.S. Employer Identification No.) |
| | | | |
700 Milam Street | , | Suite 1900 Houston, Texas
| |
| Houston | , | Texas | 77002 |
| (Address of principal executive offices) | | (Zip code) |
(713) (713) 375-5000
(Registrant’s telephone number, including area code)
Securities registered pursuant to Section 12(b) of the Act:
|
| | |
| Title of each class | Trading Symbol | Name of each exchange on which registered |
| None | None | None |
Indicate by check mark whether the registrant (1) has filed all reports required to be filed by Section 13 or 15(d) of the Securities Exchange Act of 1934 during the preceding 12 months (or for such shorter period that the registrant was required to file such reports), and (2) has been subject to such filing requirements for the past 90 days. Yesx☐ No ¨☒
Note: As of January 1, 2018, theThe registrant is a voluntary filer not subject to the filing requirements of Sections 13 or 15(d) of the Securities Exchange Act of 1934. However, the registrant has filed all reports required pursuant to Sections 13 or 15(d) during the preceding 12 months as if the registrant was subject to such filing requirements.
Indicate by check mark whether the registrant has submitted electronically every Interactive Data File required to be submitted pursuant to Rule 405 of Regulation S-T (§232.405 of this chapter) during the preceding 12 months (or for such shorter period that the registrant was required to submit and post such files). Yesx ☒No ¨☐
Indicate by check mark whether the registrant is a large accelerated filer, an accelerated filer, a non-accelerated filer, a smaller reporting company, or an emerging growth company. See the definitions of “large accelerated filer,” “accelerated filer,” “smaller reporting company” and “emerging growth company” in Rule 12b-2 of the Exchange Act.
|
| |
Large accelerated filer ¨
| Accelerated filer ¨
|
Non-accelerated filer x
| Smaller reporting company ¨
| |
| | Large accelerated filer | ☐ | | Accelerated filer | ☐ |
| Non-accelerated filer | ☒ | | Smaller reporting company | ☐ |
| | | | Emerging growth company¨ | ☐ |
If an emerging growth company, indicate by check mark if the registrant has elected not to use the extended transition period for complying with any new or revised financial accounting standards provided pursuant to Section 13(a) of the Exchange Act. ¨☐
Indicate by check mark whether the registrant is a shell company (as defined in Rule 12b-2 of the Exchange Act). Yes ¨☐ No x☒
Indicate the number of shares outstanding of the issuer��sissuer’s classes of common stock, as of the latest practicable date: Not applicable
CHENIERE CORPUS CHRISTI HOLDINGS, LLC
TABLE OF CONTENTS
DEFINITIONS
As used in this quarterly report, the terms listed below have the following meanings:
Common Industry and Other Terms
|
| | |
| Bcf | | billion cubic feet |
| Bcf/d | | billion cubic feet per day |
| Bcf/yr | | billion cubic feet per year |
| Bcfe | | billion cubic feet equivalent |
| DOE | | U.S. Department of Energy |
| EPC | | engineering, procurement and construction |
| FERC | | Federal Energy Regulatory Commission |
| FTA countries | | countries with which the United States has a free trade agreement providing for national treatment for trade in natural gas |
| GAAP | | generally accepted accounting principles in the United States |
| Henry Hub | | the final settlement price (in USD per MMBtu) for the New York Mercantile Exchange’s Henry Hub natural gas futures contract for the month in which a relevant cargo’s delivery window is scheduled to begin |
| LIBOR | | London Interbank Offered Rate |
| LNG | | liquefied natural gas, a product of natural gas that, through a refrigeration process, has been cooled to a liquid state, which occupies a volume that is approximately 1/600th of its gaseous state |
| MMBtu | | million British thermal units, an energy unit |
| mtpa | | million tonnes per annum |
| non-FTA countries | | countries with which the United States does not have a free trade agreement providing for national treatment for trade in natural gas and with which trade is permitted |
| SEC | | U.S. Securities and Exchange Commission |
| SPA | | LNG sale and purchase agreement |
| TBtu | | trillion British thermal units, an energy unit |
| Train | | an industrial facility comprised of a series of refrigerant compressor loops used to cool natural gas into LNG |
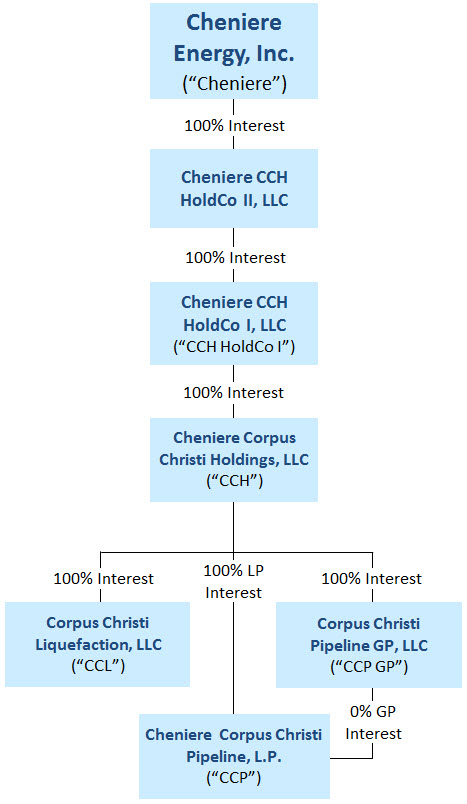
Abbreviated Legal Entity Structure
The following diagram depicts our abbreviated legal entity structure as of SeptemberJune 30, 2018,2019, including our ownership of certain subsidiaries, and the references to these entities used in this quarterly report:
Unless the context requires otherwise, references to “CCH,” “the Company,” “we,” “us,” and “our” refer to Cheniere Corpus Christi Holdings, LLC and its consolidated subsidiaries.
| |
| PART I. | FINANCIAL INFORMATION |
| |
| ITEM 1. | CONSOLIDATED FINANCIAL STATEMENTS |
CHENIERE CORPUS CHRISTI HOLDINGS, LLC AND SUBSIDIARIES
CONSOLIDATED BALANCE SHEETS
(in thousands)
| | | | | September 30, | | December 31, | | June 30, | | December 31, |
| | | 2018 | | 2017 | | 2019 | | 2018 |
| ASSETS | | (unaudited) | | | | (unaudited) | | |
| Current assets | | | | | | | | |
| Cash and cash equivalents | | $ | — |
| | $ | — |
| | $ | — |
| | $ | — |
|
| Restricted cash | | 219,950 |
| | 226,559 |
| | 279,170 |
| | 289,141 |
|
| Accounts and other receivables | | | 38,576 |
| | 24,989 |
|
| Accounts receivable—affiliate | | | 30,613 |
| | 21,060 |
|
| Advances to affiliate | | 53,845 |
| | 31,486 |
| | 69,140 |
| | 94,397 |
|
| Inventory | | 8,638 |
| | — |
| | 63,274 |
| | 26,198 |
|
| Derivative assets | | 16,008 |
| | — |
| | 5,498 |
| | 15,627 |
|
| Derivative assets—related party | | | 1,807 |
| | 2,132 |
|
| Other current assets | | 4,392 |
| | 1,494 |
| | 20,606 |
| | 15,217 |
|
| Other current assets—affiliate | | 498 |
| | 190 |
| | 31 |
| | 633 |
|
| Total current assets | | 303,331 |
| | 259,729 |
| | 508,715 |
| | 489,394 |
|
| | | | | | | | | |
| Property, plant and equipment, net | | 10,556,309 |
| | 8,261,383 |
| | 12,077,658 |
| | 11,138,825 |
|
| Debt issuance and deferred financing costs, net | | 53,465 |
| | 98,175 |
| | 17,788 |
| | 38,012 |
|
| Non-current derivative assets | | 91,091 |
| | 2,469 |
| | 7,678 |
| | 19,032 |
|
| Non-current derivative assets—related party | | | 614 |
| | 3,381 |
|
| Other non-current assets, net | | 29,841 |
| | 38,124 |
| | 51,546 |
| | 31,709 |
|
| Total assets | | $ | 11,034,037 |
| | $ | 8,659,880 |
| | $ | 12,663,999 |
| | $ | 11,720,353 |
|
| | | | | | | | | |
| LIABILITIES AND MEMBER’S EQUITY | | | | | | | | |
| Current liabilities | | | | | | | | |
| Accounts payable | | $ | 25,304 |
| | $ | 6,461 |
| | $ | 29,196 |
| | $ | 16,202 |
|
| Accrued liabilities | | 256,527 |
| | 258,060 |
| | 385,208 |
| | 162,205 |
|
| Accrued liabilities—related party | | | 4,174 |
| | — |
|
| Current debt | | | — |
| | 168,000 |
|
| Due to affiliates | | 19,846 |
| | 23,789 |
| | 19,451 |
| | 25,086 |
|
| Derivative liabilities | | 213 |
| | 19,609 |
| | 25,348 |
| | 13,576 |
|
| Other current liabilities | | | 1,106 |
| | — |
|
| Other current liabilities—affiliate | | | 506 |
| | — |
|
| Total current liabilities | | 301,890 |
| | 307,919 |
| | 464,989 |
| | 385,069 |
|
| | | | | | | | | |
| Long-term debt, net | | 8,589,201 |
| | 6,669,476 |
| | 10,221,597 |
| | 9,245,552 |
|
| Non-current derivative liabilities | | 3,441 |
| | 15,209 |
| | 77,218 |
| | 8,595 |
|
| Other non-current liabilities | | | 6,775 |
| | — |
|
| Other non-current liabilities—affiliate | | | 846 |
| | — |
|
| | | | | | | | | |
| Member’s equity | | 2,139,505 |
| | 1,667,276 |
| | 1,892,574 |
| | 2,081,137 |
|
| Total liabilities and member’s equity | | $ | 11,034,037 |
| | $ | 8,659,880 |
| | $ | 12,663,999 |
| | $ | 11,720,353 |
|
The accompanying notes are an integral part of these consolidated financial statements.
3
CHENIERE CORPUS CHRISTI HOLDINGS, LLC AND SUBSIDIARIES
CONSOLIDATED STATEMENTS OF OPERATIONS
(in thousands)
(unaudited)
| | | | Three Months Ended September 30, | | Nine Months Ended September 30, | Three Months Ended June 30, | | Six Months Ended June 30, |
| | 2018 | | 2017 | | 2018 | | 2017 | 2019 | | 2018 | | 2019 | | 2018 |
| Revenues | $ | — |
| | $ | — |
| | $ | — |
| | $ | — |
| | | | | | | |
| LNG revenues | | $ | 118,525 |
| | $ | — |
| | $ | 131,581 |
| | $ | — |
|
| LNG revenues—affiliate | | 181,548 |
| | — |
| | 274,573 |
| | — |
|
| Total revenues | | 300,073 |
| | — |
| | 406,154 |
| | — |
|
| | | | | | | | | | | | | | | |
| Expenses | | | | | | | | |
| Operating and maintenance expense (recovery) | (9,477 | ) | | 533 |
| | (6,377 | ) | | 2,097 |
| |
| Operating costs and expenses | | | | | | | | |
| Cost of sales (excluding depreciation and amortization expense shown separately below) | | 181,136 |
| | 1,031 |
| | 238,665 |
| | 1,147 |
|
| Cost of sales—related party | | 24,230 |
| | — |
| | 35,753 |
| | — |
|
| Operating and maintenance expense | | 60,817 |
| | 1,103 |
| | 92,672 |
| | 1,953 |
|
| Operating and maintenance expense—affiliate | 1,522 |
| | 1,504 |
| | 2,539 |
| | 1,653 |
| 15,459 |
| | 551 |
| | 20,706 |
| | 1,017 |
|
| Development expense | 49 |
| | 82 |
| | 172 |
| | 497 |
| 532 |
| | 89 |
| | 532 |
| | 123 |
|
| Development expense—affiliate | — |
| | — |
| | — |
| | 8 |
| 38 |
| | — |
| | 38 |
| | — |
|
| General and administrative expense | 1,479 |
| | 861 |
| | 3,514 |
| | 3,824 |
| 1,542 |
| | 1,185 |
| | 3,079 |
| | 2,035 |
|
| General and administrative expense—affiliate | 607 |
| | 289 |
| | 1,605 |
| | 753 |
| 2,407 |
| | 595 |
| | 3,562 |
| | 998 |
|
| Depreciation and amortization expense | 3,488 |
| | 248 |
| | 5,246 |
| | 537 |
| 57,300 |
| | 1,387 |
| | 79,624 |
| | 1,758 |
|
| Impairment expense and loss (gain) on disposal of assets | (13 | ) | | 2,059 |
| | (13 | ) | | 2,064 |
| |
| Total expenses (recoveries) | (2,345 | ) | | 5,576 |
| | 6,686 |
| | 11,433 |
| |
| Impairment expense and loss on disposal of assets | | — |
| | — |
| | 313 |
| | — |
|
| Total operating costs and expenses | | 343,461 |
| | 5,941 |
| | 474,944 |
| | 9,031 |
|
| | | | | | | | | | | | | | | |
| Income (loss) from operations | 2,345 |
| | (5,576 | ) | | (6,686 | ) | | (11,433 | ) | |
| Loss from operations | | (43,388 | ) | | (5,941 | ) | | (68,790 | ) | | (9,031 | ) |
| | | | | | | | | | | | | | | |
| Other income (expense) | | | | | | | | | | | | | | |
| Interest expense, net of capitalized interest | | (73,052 | ) | | — |
| | (84,810 | ) | | — |
|
| Loss on modification or extinguishment of debt | — |
| | — |
| | (15,332 | ) | | (32,480 | ) | — |
| | (15,332 | ) | | — |
| | (15,332 | ) |
| Derivative gain (loss), net | 21,818 |
| | (2,906 | ) | | 119,233 |
| | (35,002 | ) | (73,821 | ) | | 28,566 |
| | (108,908 | ) | | 97,415 |
|
| Other income (expense) | 225 |
| | (95 | ) | | 184 |
| | (177 | ) | 1,354 |
| | 26 |
| | 2,324 |
| | (41 | ) |
| Total other income (expense) | 22,043 |
| | (3,001 | ) | | 104,085 |
| | (67,659 | ) | (145,519 | ) | | 13,260 |
| | (191,394 | ) | | 82,042 |
|
| | | | | | | | | | | | | | |
| Net income (loss) | $ | 24,388 |
| | $ | (8,577 | ) | | $ | 97,399 |
| | $ | (79,092 | ) | $ | (188,907 | ) | | $ | 7,319 |
| | $ | (260,184 | ) | | $ | 73,011 |
|
The accompanying notes are an integral part of these consolidated financial statements.
4
CHENIERE CORPUS CHRISTI HOLDINGS, LLC AND SUBSIDIARIES
CONSOLIDATED STATEMENTSTATEMENTS OF MEMBER’S EQUITY
(in thousands)
(unaudited)
|
| | | | | | | |
| | Cheniere CCH HoldCo I, LLC | | Total Member’s Equity |
| Balance at December 31, 2017 | $ | 1,667,276 |
| | $ | 1,667,276 |
|
| Capital contributions | 374,830 |
| | 374,830 |
|
| Net income | 97,399 |
| | 97,399 |
|
| Balance at September 30, 2018 | $ | 2,139,505 |
| | $ | 2,139,505 |
|
|
| | | | | | | |
| Three and Six Months Ended June 30, 2019 | | | |
| | Cheniere CCH HoldCo I, LLC | | Total Member’s Equity |
| Balance at December 31, 2018 | $ | 2,081,137 |
| | $ | 2,081,137 |
|
| Capital contributions | 10 |
| | 10 |
|
| Net loss | (71,277 | ) | | (71,277 | ) |
| Balance at March 31, 2019 | 2,009,870 |
| | 2,009,870 |
|
| Capital contributions | 71,611 |
| | 71,611 |
|
| Net loss | (188,907 | ) | | (188,907 | ) |
| Balance at June 30, 2019 | $ | 1,892,574 |
| | $ | 1,892,574 |
|
|
| | | | | | | |
| Three and Six Months Ended June 30, 2018 | | | |
| | Cheniere CCH HoldCo I, LLC | | Total Member’s Equity |
| Balance at December 31, 2017 | $ | 1,667,276 |
| | $ | 1,667,276 |
|
| Capital contributions | 189,000 |
| | 189,000 |
|
| Net income | 65,692 |
| | 65,692 |
|
| Balance at March 31, 2018 | 1,921,968 |
| | 1,921,968 |
|
| Capital contributions | 185,797 |
| | 185,797 |
|
| Net income | 7,319 |
| | 7,319 |
|
| Balance at June 30, 2018 | $ | 2,115,084 |
| | $ | 2,115,084 |
|
The accompanying notes are an integral part of these consolidated financial statements.
5
CHENIERE CORPUS CHRISTI HOLDINGS, LLC AND SUBSIDIARIES
CONSOLIDATED STATEMENTS OF CASH FLOWS
(in thousands)
(unaudited)
| | | | Nine Months Ended September 30, | Six Months Ended June 30, |
| | 2018 | | 2017 | 2019 | | 2018 |
| Cash flows from operating activities | | | | | | |
| Net income (loss) | $ | 97,399 |
| | $ | (79,092 | ) | $ | (260,184 | ) | | $ | 73,011 |
|
| Adjustments to reconcile net income (loss) to net cash used in operating activities: | | | | | | |
| Depreciation and amortization expense | 5,246 |
| | 537 |
| 79,624 |
| | 1,758 |
|
| Amortization of debt issuance costs | | 4,959 |
| | — |
|
| Loss on modification or extinguishment of debt | 15,332 |
| | 32,480 |
| — |
| | 15,332 |
|
| Total losses (gains) on derivatives, net | (128,590 | ) | | 34,707 |
| 101,456 |
| | (96,265 | ) |
| Net cash used for settlement of derivative instruments | (7,204 | ) | | (42,160 | ) | |
| Impairment expense and loss (gain) on disposal of assets | (13 | ) | | 2,064 |
| |
| Net cash provided by (used for) settlement of derivative instruments | | 3,514 |
| | (5,145 | ) |
| Impairment expense and loss on disposal of assets | | 313 |
| | — |
|
| Other | | 839 |
| | — |
|
| Changes in operating assets and liabilities: | | | | | | |
| Accounts receivable | | (38,519 | ) | | (58 | ) |
| Accounts receivable—affiliate | | (22,339 | ) | | — |
|
| Inventory | (8,638 | ) | | — |
| (30,843 | ) | | (6,935 | ) |
| Accounts payable and accrued liabilities | 1,710 |
| | 495 |
| 133,641 |
| | 6,785 |
|
| Accrued liabilities—related party | | 4,174 |
| | — |
|
| Due to affiliates | 152 |
| | 1,176 |
| 5,598 |
| | (376 | ) |
| Advances to affiliate | (1,704 | ) | | — |
| (30,907 | ) | | — |
|
| Other, net | (5,244 | ) | | (1,032 | ) | (3,931 | ) | | (1,938 | ) |
| Other, net—affiliate | (307 | ) | | (756 | ) | (381 | ) | | (295 | ) |
| Net cash used in operating activities | (31,861 | ) | | (51,581 | ) | (52,986 | ) | | (14,126 | ) |
| | | | | | | |
| Cash flows from investing activities | |
| | | |
| | |
| Property, plant and equipment, net | (2,228,365 | ) | | (1,629,173 | ) | (839,498 | ) | | (1,202,502 | ) |
| Other | 3,705 |
| | 25,995 |
| (2,143 | ) | | 3,789 |
|
| Net cash used in investing activities | (2,224,660 | ) | | (1,603,178 | ) | (841,641 | ) | | (1,198,713 | ) |
| | | | | | | |
| Cash flows from financing activities | |
| | | |
| | |
| Proceeds from issuances of debt | 2,276,800 |
| | 2,706,000 |
| 1,371,674 |
| | 1,675,800 |
|
| Repayments of debt | (295,455 | ) | | (1,436,050 | ) | (558,000 | ) | | (281,455 | ) |
| Debt issuance and deferred financing costs | (45,743 | ) | | (23,309 | ) | (639 | ) | | (45,402 | ) |
| Debt extinguishment cost | (9,108 | ) | | (29 | ) | — |
| | (7,956 | ) |
| Capital contributions | 323,418 |
| | 254,120 |
| 71,621 |
| | 323,415 |
|
| Net cash provided by financing activities | 2,249,912 |
| | 1,500,732 |
| 884,656 |
| | 1,664,402 |
|
| | | | | | | |
| Net decrease in cash, cash equivalents and restricted cash | (6,609 | ) | | (154,027 | ) | |
| Net increase (decrease) in cash, cash equivalents and restricted cash | | (9,971 | ) | | 451,563 |
|
| Cash, cash equivalents and restricted cash—beginning of period | 226,559 |
| | 270,540 |
| 289,141 |
| | 226,559 |
|
| Cash, cash equivalents and restricted cash—end of period | $ | 219,950 |
| | $ | 116,513 |
| $ | 279,170 |
| | $ | 678,122 |
|
Balances per Consolidated Balance Sheet:
| | | | September 30, 2018 | June 30, 2019 |
| Cash and cash equivalents | $ | — |
| $ | — |
|
| Restricted cash | 219,950 |
| 279,170 |
|
| Total cash, cash equivalents and restricted cash | $ | 219,950 |
| $ | 279,170 |
|
The accompanying notes are an integral part of these consolidated financial statements.
6
CHENIERE CORPUS CHRISTI HOLDINGS, LLC AND SUBSIDIARIES
NOTES TO CONSOLIDATED FINANCIAL STATEMENTS
(unaudited)
NOTE 1—NATURE OF OPERATIONS AND BASIS OF PRESENTATION
We are in various stages of developing and constructing natural gas liquefaction and export facilities at the Corpus Christi LNG terminal (the “Liquefaction Facilities”) near Corpus Christi, Texas and a 23-mile natural gas supply pipeline that interconnects the Corpus Christi LNG terminal with several interstate and intrastate natural gas pipelines (the “Corpus Christi Pipeline” and together with the Liquefaction Facilities, the “Liquefaction Project”) through our wholly owned subsidiaries CCL and CCP, respectively. The Liquefaction Project is being developed in stages.stages with the first phase being three Trains (“Phase 1”). The first stage includes Trains 1 and 2, two LNG storage tanks, one complete marine berth and a second partial berth and all of the Liquefaction Project’s necessary infrastructure facilities (“Stage 1”). The second stage includes Train 3, one LNG storage tank and the completion of the second partial berth (“Stage 2”). Stages 1 and 2 are currently under construction, and construction of the Corpus Christi Pipeline was completed in the second quarter of 2018. Train 1 has commencedis operational, Train 2 is undergoing commissioning activities.and Train 3 is under construction.
Basis of Presentation
The accompanying unaudited Consolidated Financial Statements of CCH have been prepared in accordance with GAAP for interim financial information and with Rule 10-01 of Regulation S-X. Accordingly, they do not include all of the information and footnotes required by GAAP for complete financial statements and should be read in conjunction with the Consolidated Financial Statements and accompanying notes included in our annual report on Form 10-K for the year ended December 31, 20172018. In our opinion, all adjustments, consisting only of normal recurring adjustments necessary for a fair presentation, have been included. Certain reclassifications have been made to conform prior period information to the current presentation. The reclassifications did not have a material effect on our consolidated financial position, results of operations or cash flows.
On January 1, 2018, we adopted ASU 2014-09, Revenue from Contracts with Customers (Topic 606), and subsequent amendments thereto (“ASC 606”) using the full retrospective method. The adoption of ASC 606 represents a change in accounting principle that will provide financial statement readers with enhanced disclosures regarding the nature, amount, timing and uncertainty of revenue and cash flows arising from contracts with customers. The adoption of ASC 606 did not impact our previously reported consolidated financial statements in any prior period nor did it result in a cumulative effect adjustment to retained earnings.
Results of operations for the three and ninesix months ended SeptemberJune 30, 20182019 are not necessarily indicative of the results of operations that will be realized for the year ending December 31, 2018.2019.
We are a disregarded entity for federal and state income tax purposes. Our taxable income or loss, which may vary substantially from the net income or loss reported on our Consolidated Statements of Operations, is included in the consolidated federal income tax return of Cheniere. The provision for income taxes, taxes payable and deferred income tax balances have been recorded as if we had filed all tax returns on a separate return basis from Cheniere. Tax elections under a separate return basis may differ from tax elections taken on the consolidated federal income tax return of Cheniere.
Recent Accounting Standards
We adopted ASU 2016-02, Leases (Topic 842), and subsequent amendments thereto on January 1, 2019 using the optional transition approach to apply the standard at the beginning of the first quarter of 2019 with no retrospective adjustments to prior periods. This standard requires a lessee to recognize leases on its balance sheet by recording a lease liability representing the obligation to make future lease payments and a right-of-use asset representing the right to use the underlying asset for the lease term. The adoption of the standard did not materially impact our Consolidated Financial Statements. Upon adoption of the standard, we recorded right-of-use assets of $8.1 million in other non-current assets, net, and lease liabilities of $0.5 million in other current liabilities—affiliate, $5.2 million other non-current liabilities and $1.2 million in other non-current liabilities—affiliate.
NOTE 2—RESTRICTED CASH
Restricted cash consists of funds that are contractually and legally restricted as to usage or withdrawal and have been presented separately from cash and cash equivalents on our Consolidated Balance Sheets. As of SeptemberJune 30, 20182019 and December 31, 2017,2018, restricted cash consisted of the following (in thousands):
|
| | | | | | | | |
| | | June 30, | | December 31, |
| | | 2019 | | 2018 |
| Current restricted cash | | | | |
| Liquefaction Project | | $ | 279,170 |
| | $ | 289,141 |
|
|
| | | | | | | | |
| | | September 30, | | December 31, |
| | | 2018 | | 2017 |
| Current restricted cash | | | | |
| Liquefaction Project | | $ | 219,950 |
| | $ | 226,559 |
|
Pursuant to the accounts agreement entered into with the collateral trustee for the benefit of our debt holders, we are required to deposit all cash received into reserve accounts controlled by the collateral trustee. The usage or withdrawal of such cash is restricted to the payment of liabilities related to the Liquefaction Project and other restricted payments.
CHENIERE CORPUS CHRISTI HOLDINGS, LLC AND SUBSIDIARIES
NOTES TO CONSOLIDATED FINANCIAL STATEMENTS—CONTINUED
(unaudited)
NOTE 3—ACCOUNTS AND OTHER RECEIVABLES
As of June 30, 2019 and December 31, 2018, accounts and other receivables consisted of the following (in thousands):
|
| | | | | | | | |
| | | June 30, | | December 31, |
| | | 2019 | | 2018 |
| Trade receivable | | $ | 22,641 |
| | $ | 51 |
|
| Other accounts receivable | | 15,935 |
| | 24,938 |
|
| Total accounts and other receivables | | $ | 38,576 |
| | $ | 24,989 |
|
NOTE 4—INVENTORY
As of June 30, 2019 and December 31, 2018, inventory consisted of the following (in thousands):
|
| | | | | | | | |
| | | June 30, | | December 31, |
| | | 2019 | | 2018 |
| Natural gas | | $ | 3,625 |
| | $ | 1,326 |
|
| LNG | | 9,496 |
| | — |
|
| Materials and other | | 50,153 |
| | 24,872 |
|
| Total inventory | | $ | 63,274 |
| | $ | 26,198 |
|
NOTE 5—PROPERTY, PLANT AND EQUIPMENT
As of SeptemberJune 30, 20182019 and December 31, 2017,2018, property, plant and equipment, net consisted of the following (in thousands):
| | | | | September 30, | | December 31, | | June 30, | | December 31, |
| | | 2018 | | 2017 | | 2019 | | 2018 |
| LNG terminal costs | | | | | | | | |
| LNG terminal and interconnecting pipeline facilities | | $ | 454,710 |
| | $ | — |
| | $ | 6,641,022 |
| | $ | 618,547 |
|
| LNG site and related costs | | 40,911 |
| | 13,844 |
| | 275,820 |
| | 44,725 |
|
| LNG terminal construction-in-process | | 10,057,318 |
| | 8,242,520 |
| | 5,232,298 |
| | 10,470,577 |
|
| Accumulated depreciation | | (3,696 | ) | | — |
| | (84,565 | ) | | (7,416 | ) |
| Total LNG terminal costs, net | | 10,549,243 |
| | 8,256,364 |
| | 12,064,575 |
| | 11,126,433 |
|
| Fixed assets | | | | | | | | |
| Fixed assets | | 9,433 |
| | 6,042 |
| | 18,321 |
| | 15,534 |
|
| Accumulated depreciation | | (2,367 | ) | | (1,023 | ) | | (5,238 | ) | | (3,142 | ) |
| Total fixed assets, net | | 7,066 |
| | 5,019 |
| | 13,083 |
| | 12,392 |
|
| Property, plant and equipment, net | | $ | 10,556,309 |
| | $ | 8,261,383 |
| | $ | 12,077,658 |
| | $ | 11,138,825 |
|
Depreciation expense was $3.4$57.1 million and $0.3$1.4 million during the three months ended SeptemberJune 30, 20182019 and 2017,2018, respectively, and $5.1$79.4 million and $0.5$1.7 million during the ninesix months ended SeptemberJune 30, 20182019 and 2017,2018, respectively.
We realized offsets to LNG terminal costs of $8.3 million and $82.5 million during the three and six months ended June 30, 2019, respectively, that were related to the sale of commissioning cargoes because these amounts were earned or loaded prior to the start of commercial operations of the Liquefaction Project, during the testing phase for its construction. We did not realize any offsets to LNG terminal costs during the three and six months ended June 30, 2018.
CHENIERE CORPUS CHRISTI HOLDINGS, LLC AND SUBSIDIARIES
NOTES TO CONSOLIDATED FINANCIAL STATEMENTS—CONTINUED
(unaudited)
NOTE 4—6—DERIVATIVE INSTRUMENTS
We have entered into the following derivative instruments that are reported at fair value:
interest rate swaps (“Interest Rate Derivatives”) to hedge the exposure to volatility in a portion of the variable-ratefloating-rate interest payments on our credit facility (the “CCH Credit Facility”) and to hedge against changes in interest rates that could impact our anticipated future issuance of debt (“Interest Rate Forward Start Derivatives” and, collectively with the Interest Rate Derivatives, CCH Interest Rate Derivatives”) and
commodity derivatives consisting of natural gas supply contracts for the commissioning and operation of the Liquefaction Project (“Physical Liquefaction Supply Derivatives”) and associated economic hedges (collectively, the “Liquefaction Supply Derivatives”).
We recognize our derivative instruments as either assets or liabilities and measure those instruments at fair value. None of our derivative instruments are designated as cash flow hedging instruments, and changes in fair value are recorded within our Consolidated Statements of Operations to the extent not utilized for the commissioning process.
The following table shows the fair value of our derivative instruments that are required to be measured at fair value on a recurring basis as of SeptemberJune 30, 20182019 and December 31, 2017,2018, which are classified as derivative assets, derivative assets—related party, non-current derivative assets, non-current derivative assets—related party, derivative liabilities or non-current derivative liabilities in our Consolidated Balance Sheets (in thousands).:
|
| | | | | | | | | | | | | | | | | | | | | | | | | | | | | | | |
| | Fair Value Measurements as of |
| | June 30, 2019 | | December 31, 2018 |
| | Quoted Prices in Active Markets (Level 1) | | Significant Other Observable Inputs (Level 2) | | Significant Unobservable Inputs (Level 3) | | Total | | Quoted Prices in Active Markets (Level 1) | | Significant Other Observable Inputs (Level 2) | | Significant Unobservable Inputs (Level 3) | | Total |
| Interest Rate Derivatives asset (liability) | $ | — |
| | $ | (88,187 | ) | | $ | — |
| | $ | (88,187 | ) | | $ | — |
| | $ | 18,069 |
| | $ | — |
| | $ | 18,069 |
|
| Interest Rate Forward Start Derivatives liability | — |
| | (6,640 | ) | | — |
| | (6,640 | ) | | — |
| | — |
| | — |
| | — |
|
| Liquefaction Supply Derivatives asset (liability) | (1,219 | ) | | 2,992 |
| | 6,085 |
| | 7,858 |
| | 1,299 |
| | 2,990 |
| | (4,357 | ) | | (68 | ) |
|
| | | | | | | | | | | | | | | | | | | | | | | | | | | | | | | |
| | Fair Value Measurements as of |
| | September 30, 2018 | | December 31, 2017 |
| | Quoted Prices in Active Markets (Level 1) | | Significant Other Observable Inputs (Level 2) | | Significant Unobservable Inputs (Level 3) | | Total | | Quoted Prices in Active Markets (Level 1) | | Significant Other Observable Inputs (Level 2) | | Significant Unobservable Inputs (Level 3) | | Total |
| Interest Rate Derivatives asset (liability) | $ | — |
| | $ | 94,180 |
| | $ | — |
| | $ | 94,180 |
| | $ | — |
| | $ | (32,258 | ) | | $ | — |
| | $ | (32,258 | ) |
| Liquefaction Supply Derivatives asset (liability) | (183 | ) | | 3,217 |
| | 6,231 |
| | 9,265 |
| | — |
| | — |
| | (91 | ) | | (91 | ) |
There have been no changes to our evaluation of and accounting for our derivative positions during the nine months ended September 30, 2018. See Note 5—Derivative Instruments of our Notes to Consolidated Financial Statements in our annual report on Form 10-K for the year ended December 31, 2017 for additional information.
We value our Interest Rate Derivatives using an income-based approach, utilizing observable inputs to the valuation model including interest rate curves, risk adjusted discount rates, credit spreads and other relevant data. We value our Liquefaction Supply
CHENIERE CORPUS CHRISTI HOLDINGS, LLC AND SUBSIDIARIES
NOTES TO CONSOLIDATED FINANCIAL STATEMENTS—CONTINUED
(unaudited)
Derivatives using a market basedmarket-based approach incorporating present value techniques, as needed, using observable commodity price curves, when available, and other relevant data.
The fair value of our Physical Liquefaction Supply Derivatives is predominantly driven by observable and unobservable market commodity basis prices and, as applicable to our natural gas supply contracts, our assessment of the associated conditions precedent, including evaluating whether the respective market is available as pipeline infrastructure is developed. UponThe fair value of our Physical Liquefaction Supply Derivatives incorporates risk premiums related to the satisfaction of conditions precedent, includingsuch as completion and placement into service of relevant pipeline infrastructure to accommodate marketable physical gas flow, we recognize a gain or loss based onflow. As of June 30, 2019 and December 31, 2018, some of our Physical Liquefaction Supply Derivatives existed within markets for which the fair value of the respective naturalpipeline infrastructure was under development to accommodate marketable physical gas supply contracts.flow.
We include a portion of our Physical Liquefaction Supply Derivatives as Level 3 within the valuation hierarchy as the fair value is developed through the use of internal models which may be impacted by inputs that are unobservable in the marketplace. The curves used to generate the fair value of our Physical Liquefaction Supply Derivatives are based on basis adjustments applied to forward curves for a liquid trading point. In addition, there may be observable liquid market basis information in the near term, but terms of a Physical Liquefaction Supply Derivatives contract may exceed the period for which such information is available, resulting in a Level 3 classification. In these instances, the fair value of the contract incorporates extrapolation assumptions made in the determination of the market basis price for future delivery periods in which applicable commodity basis prices were either not observable or lacked corroborative market data. As of SeptemberJune 30, 20182019 and December 31, 2017,2018, some of our Physical Liquefaction
CHENIERE CORPUS CHRISTI HOLDINGS, LLC AND SUBSIDIARIES
NOTES TO CONSOLIDATED FINANCIAL STATEMENTS—CONTINUED
(unaudited)
Supply Derivatives existed within markets for which the pipeline infrastructure is under development to accommodate marketable physical gas flow.
The Level 3 fair value measurements of natural gas positions within our Physical Liquefaction Supply Derivatives could be materially impacted by a significant change in certain natural gas market basis spreads due to the contractual notional amount represented by our Level 3 positions, which is a substantial portion of our overall Physical Liquefaction Supply Derivatives portfolio. The following table includes quantitative information for the unobservable inputs for our Level 3 Physical Liquefaction Supply Derivatives as of SeptemberJune 30, 2018:2019:
|
| | | | | | | | |
| | | Net Fair Value Asset (in thousands) | | Valuation Approach | | Significant Unobservable Input | | Significant Unobservable Inputs Range |
| Physical Liquefaction Supply Derivatives | | $6,2316,085 | | Market approach incorporating present value techniques | | Henry Hub Basis Spread | | $(0.748)(0.700) - $0.050 |
The following table shows the changes in the fair value of our Level 3 Physical Liquefaction Supply Derivatives, including those with related parties, during the three and ninesix months ended SeptemberJune 30, 20182019 and 20172018 (in thousands):
|
| | | | | | | | | | | | | | | | |
| | | Three Months Ended June 30, | | Six Months Ended June 30, |
| | | 2019 | | 2018 | | 2019 | | 2018 |
| Balance, beginning of period | | $ | 1,610 |
| | $ | (207 | ) | | $ | (4,357 | ) | | $ | (91 | ) |
| Realized and mark-to-market gains: | | | | | | | | |
| Included in cost of sales | | 4,369 |
| | 324 |
| | 7,733 |
| | 675 |
|
| Purchases and settlements: | | | | | | | | |
| Purchases | | 181 |
| | (111 | ) | | 918 |
| | (111 | ) |
| Settlements | | 50 |
| | — |
| | 2,113 |
| | — |
|
| Transfers out of Level 3 (1) | | (125 | ) | | 467 |
| | (322 | ) | | — |
|
| Balance, end of period | | $ | 6,085 |
| | $ | 473 |
| | $ | 6,085 |
| | $ | 473 |
|
| Change in unrealized gains (losses) relating to instruments still held at end of period | | $ | 4,369 |
| | $ | 324 |
| | $ | 7,733 |
| | $ | 675 |
|
|
| | | | | | | | | | | | | | | | |
| | | Three Months Ended September 30, | | Nine Months Ended September 30, |
| | | 2018 | | 2017 | | 2018 | | 2017 |
| Balance, beginning of period | | $ | 473 |
| | $ | (383 | ) | | $ | (91 | ) | | $ | — |
|
| Realized and mark-to-market gains: | | | | | | | | |
| Included in operating and maintenance expense | | 640 |
| | 678 |
| | 614 |
| | — |
|
| Purchases | | 5,118 |
| | — |
| | 5,708 |
| | 295 |
|
| Balance, end of period | | $ | 6,231 |
| | $ | 295 |
| | $ | 6,231 |
| | $ | 295 |
|
| Change in unrealized gains (losses) relating to instruments still held at end of period | | $ | 640 |
| | $ | 678 |
| | $ | 614 |
| | $ | — |
|
| |
| (1) | Transferred to Level 2 as a result of observable market for the underlying natural gas purchase agreements. |
Derivative assets and liabilities arising from our derivative contracts with the same counterparty are reported on a net basis, as all counterparty derivative contracts provide for net settlement.the unconditional right of set-off in the event of default. The use of derivative instruments exposes us to counterparty credit risk, or the risk that a counterparty will be unable to meet its commitments in instances when our derivative instruments are in an asset position. Additionally, counterparties are at risk that we evaluate our own abilitywill be unable to meet our commitments in instances where our derivative instruments are in a liability position. OurWe incorporate both our own nonperformance risk and the respective counterparty’s nonperformance risk in fair value measurements. In adjusting the fair value of our derivative instruments are subject to contractual provisions which providecontracts for the unconditional righteffect of nonperformance risk, we have considered the impact of netting and any applicable credit enhancements, such as collateral postings, set-off for all derivative assetsrights and liabilities with a given counterparty in the event of default.guarantees.
CCH Interest Rate Derivatives
InDuring the six months ended June 2018,30, 2019, there were no changes to the terms of our Interest Rate Derivatives, which we settledentered into to protect against volatility of future cash flows and hedge a portion of the Interest Rate Derivatives and recognized a derivative gain of $4.8 million upon the termination ofvariable interest rate swaps associated with the amendment ofpayments on the CCH Credit Facility, as discussedFacility.
In June 2019, we entered into the Interest Rate Forward Start Derivatives to hedge against changes in
Note 6—Debt.interest rates that could impact anticipated future issuance of debt by CCH, which is anticipated by the end of 2020.
CHENIERE CORPUS CHRISTI HOLDINGS, LLC AND SUBSIDIARIES
NOTES TO CONSOLIDATED FINANCIAL STATEMENTS—CONTINUED
(unaudited)
In May 2017, we settled a portion of the Interest Rate Derivatives and recognized a derivative loss of $13.0 million in conjunction with the termination of approximately $1.4 billion of commitments under the CCH Credit Facility.
As of SeptemberJune 30, 2018,2019, we had the following CCH Interest Rate Derivatives outstanding:
|
| | | | | | | | | | | | |
| | | Initial Notional Amount | | Maximum Notional Amount | | Effective Date | | Maturity Date | | Weighted Average Fixed Interest Rate Paid | | Variable Interest Rate Received |
| Interest Rate Derivatives | | $28.8 million | | $4.7 billion | | May 20, 2015 | | May 31, 2022 | | 2.30% | | One-month LIBOR |
| Interest Rate Forward Start Derivatives | | $1.0 billion | | $1.0 billion | | June 30, 2020 | | September 30, 2030 | | 2.11% | | Three-month LIBOR |
The following table shows the fair value and location of our CCH Interest Rate Derivatives on our Consolidated Balance Sheets (in thousands):
|
| | | | | | | | | | | | | | | | | | | | | | | |
| | June 30, 2019 | | December 31, 2018 |
| | Interest Rate Derivatives | | Interest Rate Forward Start Derivatives | | Total | | Interest Rate Derivatives | | Interest Rate Forward Start Derivatives | | Total |
| Consolidated Balance Sheet Location | | | | | | | | | | | |
| Derivative assets | $ | — |
| | $ | — |
| | $ | — |
| | $ | 10,556 |
| | $ | — |
| | $ | 10,556 |
|
| Non-current derivative assets | — |
| | — |
| | — |
| | 7,918 |
| | — |
| | 7,918 |
|
| Total derivative assets | — |
|
| — |
|
| — |
|
| 18,474 |
|
| — |
|
| 18,474 |
|
| | | | | |
|
| | | | | |
|
|
| Derivative liabilities | (20,626 | ) | | — |
| | (20,626 | ) | | (7 | ) | | — |
| | (7 | ) |
| Non-current derivative liabilities | (67,561 | ) | | (6,640 | ) | | (74,201 | ) | | (398 | ) | | — |
| | (398 | ) |
| Total derivative liabilities | (88,187 | ) |
| (6,640 | ) |
| (94,827 | ) |
| (405 | ) |
| — |
|
| (405 | ) |
| | | | | | | | | | | | |
| Derivative asset (liability), net | $ | (88,187 | ) |
| $ | (6,640 | ) |
| $ | (94,827 | ) |
| $ | 18,069 |
|
| $ | — |
|
| $ | 18,069 |
|
|
| | | | | | | | |
| | | September 30, | | December 31, |
| Consolidated Balance Sheet Location | | 2018 | | 2017 |
| Derivative assets | | $ | 13,505 |
| | $ | — |
|
| Non-current derivative assets | | 80,675 |
| | 2,469 |
|
| Total derivative assets | | 94,180 |
| | 2,469 |
|
| | | | | |
| Derivative liabilities | | — |
| | (19,609 | ) |
| Non-current derivative liabilities | | — |
| | (15,118 | ) |
| Total derivative liabilities | | — |
| | (34,727 | ) |
| | | | | |
| Derivative asset (liability), net | | $ | 94,180 |
| | $ | (32,258 | ) |
The following table shows the changes in the fair value and settlements of our CCH Interest Rate Derivatives recorded in derivative gain (loss), net on our Consolidated Statements of Operations during the three and ninesix months ended SeptemberJune 30, 20182019 and 20172018 (in thousands):
|
| | | | | | | | | | | | | | | | |
| | | Three Months Ended September 30, | | Nine Months Ended September 30, |
| | | 2018 | | 2017 | | 2018 | | 2017 |
| Interest Rate Derivatives gain (loss) | | $ | 21,818 |
| | $ | (2,906 | ) | | $ | 119,233 |
| | $ | (35,002 | ) |
|
| | | | | | | | | | | | | | | | |
| | | Three Months Ended June 30, | | Six Months Ended June 30, |
| | | 2019 | | 2018 | | 2019 | | 2018 |
| Interest Rate Derivatives gain (loss) | | $ | (67,181 | ) | | $ | 28,566 |
| | $ | (102,268 | ) | | $ | 97,415 |
|
| Interest Rate Forward Start Derivatives loss | | (6,640 | ) | | — |
| | (6,640 | ) | | — |
|
Liquefaction Supply Derivatives
CCL has entered into primarily index-based physical natural gas supply contracts and associated economic hedges to purchase natural gas for the commissioning and operation of the Liquefaction Project. The terms of the physical natural gas supply contracts range up to eight years, some of which commence upon the satisfaction of certain conditions precedent, such as the date of first commercial delivery of specified Trains of the Liquefaction Project.precedent.
As of SeptemberJune 30, 20182019 and December 31, 2017,2018, CCL had secured up to approximately 2,6402,787 TBtu and 2,0242,801 TBtu, respectively, of natural gas feedstock through natural gas supply contracts, of which 57 TBtu and 55 TBtu, respectively, were for a natural gas supply contract CCL has with a related party. The forward notional for our Liquefaction Supply Derivatives was approximately 2,5632,905 TBtu and 1,0192,854 TBtu as of SeptemberJune 30, 20182019 and December 31, 2017,2018, respectively.
CHENIERE CORPUS CHRISTI HOLDINGS, LLC AND SUBSIDIARIES
NOTES TO CONSOLIDATED FINANCIAL STATEMENTS—CONTINUED
(unaudited)
The following table shows the fair value and location of our Liquefaction Supply Derivatives on our Consolidated Balance Sheets (in thousands):
|
| | | | | | | | |
| | | Fair Value Measurements as of (1) |
| Consolidated Balance Sheet Location | | June 30, 2019 | | December 31, 2018 |
| Derivative assets | | $ | 5,498 |
| | $ | 5,071 |
|
| Derivative assets—related party | | 1,807 |
| | 2,132 |
|
| Non-current derivative assets | | 7,678 |
| | 11,114 |
|
| Non-current derivative assets—related party | | 614 |
| | 3,381 |
|
| Total derivative assets | | 15,597 |
|
| 21,698 |
|
| | | | | |
| Derivative liabilities | | (4,722 | ) | | (13,569 | ) |
| Non-current derivative liabilities | | (3,017 | ) | | (8,197 | ) |
| Total derivative liabilities | | (7,739 | ) | | (21,766 | ) |
| | | | | |
| Derivative asset (liability), net | | $ | 7,858 |
| | $ | (68 | ) |
|
| | | | | | | | |
| | | Fair Value Measurements as of (1) |
| Consolidated Balance Sheet Location | | September 30, 2018 | | December 31, 2017 |
| Derivative assets | | $ | 2,503 |
| | $ | — |
|
| Non-current derivative assets | | 10,416 |
| | — |
|
| Total derivative assets | | 12,919 |
|
| — |
|
| | | | | |
| Derivative liabilities | | (213 | ) | | — |
|
| Non-current derivative liabilities | | (3,441 | ) | | (91 | ) |
| Total derivative liabilities | | (3,654 | ) | | (91 | ) |
| | | | | |
| Derivative asset (liability), net | | $ | 9,265 |
| | $ | (91 | ) |
| |
| (1) | Does not include collateral callcalls of $1.0$4.3 million and $4.5 million for such contracts, which are included in other current assets in our Consolidated Balance SheetSheets as SeptemberJune 30, 2018.2019 and December 31, 2018, respectively. |
The following table shows the changes in the fair value, settlements and location of our Liquefaction Supply Derivatives recorded in operating and maintenance expense on our Consolidated Statements of Operations during the three and ninesix months ended SeptemberJune 30, 20182019 and 20172018 (in thousands):
|
| | | | | | | | | | | | | | | |
| | Three Months Ended September 30, | | Nine Months Ended September 30, |
| | 2018 | | 2017 | | 2018 | | 2017 |
| Liquefaction Supply Derivatives gain | $ | 10,507 |
| | $ | 678 |
| | $ | 9,357 |
| | $ | 295 |
|
|
| | | | | | | | | | | | | | | | |
| | | Three Months Ended June 30, | | Six Months Ended June 30, |
| | Consolidated Statements of Operations Location (1) | 2019 | | 2018 | | 2019 | | 2018 |
| Liquefaction Supply Derivatives loss | LNG revenues | $ | (885 | ) | | $ | — |
| | $ | (74 | ) | | $ | — |
|
| Liquefaction Supply Derivatives gain (loss) | Cost of sales | 2,752 |
| | (1,034 | ) | | 10,617 |
| | (1,150 | ) |
| Liquefaction Supply Derivatives loss | Cost of sales—related party | (1,279 | ) | | — |
| | (3,091 | ) | | — |
|
| |
| (1) | Does not include the realized value associated with derivative instruments that settle through physical delivery. Fair value fluctuations associated with commodity derivative activities are classified and presented consistently with the item economically hedged and the nature and intent of the derivative instrument. |
Consolidated Balance Sheet Presentation
Our derivative instruments are presented on a net basis on our Consolidated Balance Sheets as described above. The following table shows the fair value of our derivatives outstanding on a gross and net basis (in thousands):
|
| | | | | | | | | | | | |
| | | Gross Amounts Recognized | | Gross Amounts Offset in the Consolidated Balance Sheets | | Net Amounts Presented in the Consolidated Balance Sheets |
| Offsetting Derivative Assets (Liabilities) | | | |
| As of June 30, 2019 | | | | | | |
| Interest Rate Derivatives | | $ | (88,659 | ) | | $ | 472 |
| | $ | (88,187 | ) |
| Interest Rate Forward Start Derivatives | | (6,640 | ) | | — |
| | (6,640 | ) |
| Liquefaction Supply Derivatives | | 16,432 |
| | (835 | ) | | 15,597 |
|
| Liquefaction Supply Derivatives | | (14,300 | ) | | 6,561 |
| | (7,739 | ) |
| As of December 31, 2018 | | | | | | |
| Interest Rate Derivatives | | $ | 19,520 |
| | $ | (1,046 | ) | | $ | 18,474 |
|
| Interest Rate Derivatives | | (413 | ) | | 8 |
| | (405 | ) |
| Liquefaction Supply Derivatives | | 31,770 |
| | (10,072 | ) | | 21,698 |
|
| Liquefaction Supply Derivatives | | (29,996 | ) | | 8,230 |
| | (21,766 | ) |
|
| | | | | | | | | | | | |
| | | Gross Amounts Recognized | | Gross Amounts Offset in the Consolidated Balance Sheets | | Net Amounts Presented in the Consolidated Balance Sheets |
| Offsetting Derivative Assets (Liabilities) | | | |
| As of September 30, 2018 | | | | | | |
| Interest Rate Derivatives | | $ | 94,496 |
| | $ | (316 | ) | | $ | 94,180 |
|
| Liquefaction Supply Derivatives | | 14,946 |
| | (2,027 | ) | | 12,919 |
|
| Liquefaction Supply Derivatives | | (9,283 | ) | | 5,629 |
| | (3,654 | ) |
| As of December 31, 2017 | | | | | | |
| Interest Rate Derivatives | | $ | 2,808 |
| | $ | (339 | ) | | $ | 2,469 |
|
| Interest Rate Derivatives | | (34,747 | ) | | 20 |
| | (34,727 | ) |
| Liquefaction Supply Derivatives | | (130 | ) | | 39 |
| | (91 | ) |
NOTE 5—ACCRUED LIABILITIES
As of September 30, 2018 and December 31, 2017, accrued liabilities consisted of the following (in thousands):
|
| | | | | | | | |
| | | September 30, | | December 31, |
| | | 2018 | | 2017 |
| Interest costs and related debt fees | | $ | 64,933 |
| | $ | 136,283 |
|
| Liquefaction Project costs | | 170,741 |
| | 107,055 |
|
| Other | | 20,853 |
| | 14,722 |
|
| Total accrued liabilities | | $ | 256,527 |
| | $ | 258,060 |
|
CHENIERE CORPUS CHRISTI HOLDINGS, LLC AND SUBSIDIARIES
NOTES TO CONSOLIDATED FINANCIAL STATEMENTS—CONTINUED
(unaudited)
NOTE 6—DEBT7—OTHER NON-CURRENT ASSETS
As of SeptemberJune 30, 20182019 and December 31, 2017,2018, other non-current assets, net consisted of the following (in thousands):
|
| | | | | | | | |
| | | June 30, | | December 31, |
| | | 2019 | | 2018 |
| Advances and other asset conveyances to third parties to support LNG terminals | | $ | 17,912 |
| | $ | 18,209 |
|
| Operating lease assets | | 7,364 |
| | — |
|
| Tax-related payments and receivables | | 3,450 |
| | 3,783 |
|
| Information technology service assets | | 2,420 |
| | 2,435 |
|
| Advances made under EPC and non-EPC contracts | | 10,905 |
| | — |
|
| Other | | 9,495 |
| | 7,282 |
|
| Total other non-current assets, net | | $ | 51,546 |
| | $ | 31,709 |
|
NOTE 8—ACCRUED LIABILITIES
As of June 30, 2019 and December 31, 2018, accrued liabilities consisted of the following (in thousands):
|
| | | | | | | | |
| | | June 30, | | December 31, |
| | | 2019 | | 2018 |
| Interest costs and related debt fees | | $ | 128,619 |
| | $ | 994 |
|
| Accrued natural gas purchases | | 87,990 |
| | 91,910 |
|
| Liquefaction Project costs | | 146,304 |
| | 46,964 |
|
| Other | | 22,295 |
| | 22,337 |
|
| Total accrued liabilities | | $ | 385,208 |
| | $ | 162,205 |
|
NOTE 9—DEBT
As of June 30, 2019 and December 31, 2018, our debt consisted of the following (in thousands):
|
| | | | | | | | |
| | | June 30, | | December 31, |
| | | 2019 | | 2018 |
| Long-term debt | | | | |
| 7.000% Senior Secured Notes due 2024 (“2024 CCH Senior Notes”) | | $ | 1,250,000 |
| | $ | 1,250,000 |
|
| 5.875% Senior Secured Notes due 2025 (“2025 CCH Senior Notes”) | | 1,500,000 |
| | 1,500,000 |
|
| 5.125% Senior Secured Notes due 2027 (“2027 CCH Senior Notes”) | | 1,500,000 |
| | 1,500,000 |
|
| CCH Credit Facility | | 6,137,412 |
| | 5,155,737 |
|
| Unamortized premium, discount and debt issuance costs, net | | (165,815 | ) | | (160,185 | ) |
| Total long-term debt, net | | 10,221,597 |
| | 9,245,552 |
|
| | | | | |
| Current debt | | | | |
| $1.2 billion CCH Working Capital Facility (“CCH Working Capital Facility”) | | — |
| | 168,000 |
|
| Total debt, net | | $ | 10,221,597 |
| | $ | 9,413,552 |
|
|
| | | | | | | | |
| | | September 30, | | December 31, |
| | | 2018 | | 2017 |
| Long-term debt | | | | |
| 7.000% Senior Secured Notes due 2024 (“2024 CCH Senior Notes”) | | $ | 1,250,000 |
| | $ | 1,250,000 |
|
| 5.875% Senior Secured Notes due 2025 (“2025 CCH Senior Notes”) | | 1,500,000 |
| | 1,500,000 |
|
| 5.125% Senior Secured Notes due 2027 (“2027 CCH Senior Notes”) | | 1,500,000 |
| | 1,500,000 |
|
| CCH Credit Facility | | 4,491,737 |
| | 2,484,737 |
|
| Unamortized premium, discount and debt issuance costs, net | | (152,536 | ) | | (65,261 | ) |
| Total long-term debt, net | | 8,589,201 |
| | 6,669,476 |
|
| | | | | |
| Current debt | | | | |
| $1.2 billion CCH Working Capital Facility (“CCH Working Capital Facility”) | | — |
| | — |
|
| Total debt, net | | $ | 8,589,201 |
| | $ | 6,669,476 |
|
2018 Debt Issuances
CCH Credit Facility
In May 2018, we amended and restated the CCH Credit Facility to increase total commitments under the credit facility to $6.1 billion. Borrowings are used to fund a portion of the costs of developing, constructing and placing into service the three Trains and the related facilities of the Liquefaction Project and for related business purposes.
The CCH Credit Facility matures on June 30, 2024, with principal payments due quarterly commencing on the earlier of (1) the first quarterly payment date occurring more than three calendar months following the completion of the Liquefaction Project as defined in the common terms agreement and (2) a set date determined by reference to the date under which a certain LNG buyer linked to the last Train of the Liquefaction Project to become operational is entitled to terminate its SPA for failure to achieve the date of first commercial delivery for that agreement. Scheduled repayments will be based upon a 19-year tailored amortization, commencing the first full quarter after the completion of Trains 1 through 3 and designed to achieve a minimum projected fixed debt service coverage ratio of 1.50:1.
Loans under the CCH Credit Facility accrue interest at a variable rate per annum equal to, at our election, LIBOR or the base rate, plus the applicable margin. The applicable margin for LIBOR loans is 1.75% and for base rate loans is 0.75%. Interest on LIBOR loans is due and payable at the end of each applicable interest period and interest on base rate loans is due and payable at the end of each quarter. We were required to pay certain upfront fees to the agents and lenders under the CCH Credit Facility together with additional transaction fees and expenses in the aggregate amount of $53.3 million.
All other terms of the CCH Credit Facility substantially remained the same to those described in Note 7—Debt of our Notes to Consolidated Financial Statements in our annual report on Form 10-K for the year ended December 31, 2017. The amendment and restatement of the CCH Credit Facility resulted in the recognition of $15.3 million of debt modification and extinguishment costs during the nine months ended September 30, 2018 relating to the incurrence of third party fees and write off of unamortized debt issuance costs.
CCH Working Capital Facility
In June 2018, we amended and restated the CCH Working Capital Facility to increase total commitments under the CCH Working Capital Facility to $1.2 billion. Borrowings will be used for certain working capital requirements related to developing and placing into operations the Liquefaction Project and for related business purposes.
Loans under the CCH Working Capital Facility accrue interest at a variable rate per annum equal to LIBOR or the base rate plus the applicable margin. The applicable margin for LIBOR loans ranges from 1.25% to 1.75% per annum, and the applicable margin for base rate loans ranges from 0.25% to 0.75% per annum. We were required to pay certain upfront fees to the agents
CHENIERE CORPUS CHRISTI HOLDINGS, LLC AND SUBSIDIARIES
NOTES TO CONSOLIDATED FINANCIAL STATEMENTS—CONTINUED
(unaudited)
and lenders under the CCH Working Capital Facility together with additional transaction fees and expenses in the aggregate amount of $13.8 million.
The CCH Working Capital Facility matures on June 29, 2023. All other terms of the CCH Working Capital Facility substantially remained the same to those described in Note 7—Debt of our Notes to Consolidated Financial Statements in our annual report on Form 10-K for the year ended December 31, 2017.
Credit Facilities
Below is a summary of our credit facilities outstanding as of SeptemberJune 30, 20182019 (in thousands):
|
| | | | | | | | |
| | | CCH Credit Facility | | CCH Working Capital Facility |
| Original facility size | | $ | 8,403,714 |
| | $ | 350,000 |
|
| Incremental commitments | | 1,565,961 |
| | 850,000 |
|
| Less: | | | | |
| Outstanding balance | | 6,137,412 |
| | — |
|
| Commitments terminated | | 3,832,263 |
| | — |
|
| Letters of credit issued | | — |
| | 338,037 |
|
| Available commitment | | $ | — |
|
| $ | 861,963 |
|
| | | | | |
| Interest rate on outstanding balance | | LIBOR plus 1.75% or base rate plus 0.75% | | LIBOR plus 1.25% - 1.75% or base rate plus 0.25% - 0.75% |
| Weighted average interest rate of outstanding balance | | 4.15% | | n/a |
| Maturity date | | June 30, 2024 | | June 29, 2023 |
|
| | | | | | | | |
| | | CCH Credit Facility | | CCH Working Capital Facility |
| Original facility size | | $ | 8,403,714 |
| | $ | 350,000 |
|
| Incremental commitments | | 1,565,961 |
| | 850,000 |
|
| Less: | | | | |
| Outstanding balance | | 4,491,737 |
| | — |
|
| Commitments terminated | | 3,832,263 |
| | — |
|
| Letters of credit issued | | — |
| | 315,525 |
|
| Available commitment | | $ | 1,645,675 |
|
| $ | 884,475 |
|
| | | | | |
| Interest rate | | LIBOR plus 1.75% or base rate plus 0.75% | | LIBOR plus 1.25% - 1.75% or base rate plus 0.25% - 0.75% |
| Maturity date | | June 30, 2024 | | June 29, 2023 |
Restrictive Debt Covenants
As of SeptemberJune 30, 2018,2019, we were in compliance with all covenants related to our debt agreements.
Interest Expense
Total interest expense consisted of the following (in thousands):
|
| | | | | | | | | | | | | | | |
| | Three Months Ended June 30, | | Six Months Ended June 30, |
| | 2019 | | 2018 | | 2019 | | 2018 |
| Total interest cost | $ | 137,970 |
| | $ | 106,619 |
| | $ | 270,633 |
| | $ | 207,814 |
|
| Capitalized interest, including amounts capitalized as an Allowance for Funds Used During Construction | (64,918 | ) | | (106,619 | ) | | (185,823 | ) | | (207,814 | ) |
| Total interest expense, net | $ | 73,052 |
| | $ | — |
| | $ | 84,810 |
| | $ | — |
|
|
| | | | | | | | | | | | | | | |
| | Three Months Ended September 30, | | Nine Months Ended September 30, |
| | 2018 | | 2017 | | 2018 | | 2017 |
| Total interest cost | $ | 117,834 |
| | $ | 95,204 |
| | $ | 325,648 |
| | $ | 263,560 |
|
| Capitalized interest, including amounts capitalized as an Allowance for Funds Used During Construction | (117,834 | ) | | (95,204 | ) | | (325,648 | ) | | (263,560 | ) |
| Total interest expense, net | $ | — |
| | $ | — |
| | $ | — |
| | $ | — |
|
Fair Value Disclosures
The following table shows the carrying amount, which is net of unamortized premium, discount and debt issuance costs, and estimated fair value of our debt (in thousands):
| | | | | September 30, 2018 | | December 31, 2017 | | June 30, 2019 | | December 31, 2018 |
| | | Carrying
Amount | | Estimated
Fair Value | | Carrying
Amount | | Estimated
Fair Value | | Carrying
Amount | | Estimated
Fair Value | | Carrying
Amount | | Estimated
Fair Value |
| Senior notes (1) | | $ | 4,189,958 |
| | $ | 4,453,750 |
| | $ | 4,184,739 |
| | $ | 4,590,625 |
| | $ | 4,195,434 |
| | $ | 4,744,100 |
| | $ | 4,191,754 |
| | $ | 4,228,750 |
|
| Credit facilities (2) | | 4,399,243 |
| | 4,399,243 |
| | 2,484,737 |
| | 2,484,737 |
| | 6,026,163 |
| | 6,026,163 |
| | 5,221,798 |
| | 5,221,798 |
|
| |
| (1) | Includes 2024 CCH Senior Notes, 2025 CCH Senior Notes and 2027 CCH Senior Notes (collectively, the “CCH Senior Notes”). The Level 2 estimated fair value was based on quotes obtained from broker-dealers or market makers of the CCH Senior Notes and other similar instruments. |
| |
| (2) | Includes CCH Credit Facility and CCH Working Capital Facility. The Level 3 estimated fair value approximates the principal amount because the interest rates are variable and reflective of market rates and the debt may be repaid, in full or in part, at any time without penalty. |
CHENIERE CORPUS CHRISTI HOLDINGS, LLC AND SUBSIDIARIES
NOTES TO CONSOLIDATED FINANCIAL STATEMENTS—CONTINUED
(unaudited)
NOTE 7—10—REVENUES FROM CONTRACTS WITH CUSTOMERS
We have entered into numerous SPAsThe following table represents a disaggregation of revenue earned from contracts with third party customers for the sale of LNG on a free on board (“FOB”) (delivered to the customer at the Corpus Christi LNG terminal) basis. Our customers generally purchase LNG for a price consisting of a fixed fee per MMBtu of LNG (a portion of which is subject to annual adjustment for inflation) plus a variable fee per MMBtu of LNG equal to approximately 115% of Henry Hub. The fixed fee component is the amount payable to us regardless of a cancellation or suspension of LNG cargo deliveries by the customers. The variable fee component is the amount generally payable to us only upon delivery of LNG plus all future adjustments to the fixed fee for inflation. The SPAs and contracted volumes to be made available under the SPAs are not tied to a specific Train; however, the term of each SPA generally commences upon the date of first commercial delivery of a specified Train.
Revenues from the sale of LNG are recognized at a point in time when the LNG is delivered to the customer, at the Corpus Christi LNG terminal, which is the point legal title, physical possession and the risks and rewards of ownership transfer to the customer. Each individual molecule of LNG is viewed as a separate performance obligation. The stated contract price (including both fixed and variable fees) per MMBtu in each LNG sales arrangement is representative of the stand-alone selling price for LNG at the time the sale was negotiated. We have concluded that the variable fees meet the exception for allocating variable consideration to specific parts of the contract. As such, the variable consideration for these contracts is allocated to each distinct molecule of LNG and recognized when that distinct molecule of LNG is delivered to the customer. Because of the use of the exception, variable consideration related to the sale of LNG is also not included in the transaction price.
Fees received pursuant to SPAs are recognized as LNG revenues only after substantial completion of the respective Train. Prior to substantial completion, sales generated during the commissioning phase are offset against the cost of constructionthree and six months ended June 30, 2019 and 2018 (in thousands):
|
| | | | | | | | | | | | | | | | |
| | | Three Months Ended June 30, | | Six Months Ended June 30, |
| | | 2019 | | 2018 | | 2019 | | 2018 |
| LNG revenues | | $ | 119,410 |
| | $ | — |
| | $ | 131,655 |
| | $ | — |
|
| LNG revenues—affiliate | | 181,548 |
| | — |
| | 274,573 |
| | — |
|
| Total revenues from customers | | 300,958 |
| | — |
| | 406,228 |
| | — |
|
| Net derivative losses (1) | | (885 | ) | | — |
| | (74 | ) | | — |
|
| Total revenues | | $ | 300,073 |
| | $ | — |
| | $ | 406,154 |
| | $ | — |
|
(1) See Note 6—Derivative Instruments for the respective Train, as the production and removal of LNG from storage is necessary to test the facility and bring the asset to the condition necessary for its intended use.additional information about our derivatives.
Transaction Price Allocated to Future Performance Obligations
Because many of our sales contracts have long-term durations, we are contractually entitled to significant future consideration which we have not yet recognized as revenue. The following table discloses the aggregate amount of the transaction price that is allocated to performance obligations that have not yet been satisfied as of SeptemberJune 30, 2019 and December 31, 2018:
|
| | | | | | |
| | | Unsatisfied Transaction Price (in billions) | | Weighted Average Recognition Timing (years) (1) |
| LNG revenues | | $ | 34.8 |
| | 11.9 |
|
| | | | | | | | | | | | |
| | | June 30, 2019 | | December 31, 2018 |
| | | Unsatisfied
Transaction Price
(in billions) | | Weighted Average Recognition Timing (years) (1) | | Unsatisfied
Transaction Price
(in billions) | | Weighted Average Recognition Timing (years) (1) |
| LNG revenues | | $ | 33.8 |
| | 11 | | $ | 33.9 |
| | 12 |
| LNG revenues—affiliate | | 1.0 |
| | 14 | | 1.0 |
| | 14 |
| Total revenues | | $ | 34.8 |
| | | | $ | 34.9 |
| | |
| |
| (1) | The weighted average recognition timing represents an estimate of the number of years during which we shall have recognized half of the unsatisfied transaction price. |
We have elected the following exemptions which omit certain potential future sources of revenue from the table above:
| |
| (1) | We omit from the table above all performance obligations that are part of a contract that has an original expected duration of one year or less. |
| |
| (2) | We omit from the table above all variable consideration that is allocated entirely to a wholly unsatisfied performance obligation or to a wholly unsatisfied promise to transfer a distinct good or service that forms part of a single performance obligation when that performance obligation qualifies as a series. The table above excludes substantially all variable consideration under our SPAs. The amount of revenue from variable fees that is not included in the transaction price will vary based on the future prices of Henry Hub throughout the contract terms, to the extent customers elect to take delivery of their LNG, and adjustments to the consumer price index. Certain of our contracts contain additional variable consideration based on the outcome of contingent events and the movement of various indexes. The receipt ofWe have not included such variable consideration in the transaction price to the extent the consideration is considered constrained due to the uncertainty of ultimate pricing and receiptreceipt. Approximately 46% of our LNG revenues during each of the three and we have not included suchsix months ended June 30, 2019 were related to variable consideration inreceived from customers. All of our LNG revenues—affiliate were related to variable consideration received from customers during the transaction price.three and six months ended June 30, 2019. |
CHENIERE CORPUS CHRISTI HOLDINGS, LLC AND SUBSIDIARIES
NOTES TO CONSOLIDATED FINANCIAL STATEMENTS—CONTINUED
(unaudited)
We have entered into contracts to sell LNG that are conditioned upon one or both of the parties achieving certain milestones such as reaching a final investment decision on a certain liquefaction Train, obtaining financing or achieving substantial completion of a Train and any related facilities. These contracts are considered completed contracts for revenue recognition purposes and are included in the transaction price above when the conditions are considered probable of being met.
We have elected the practical expedient to omit the disclosure of the transaction price allocated to future performance obligations and an explanation of when the entity expects to recognize the amount as revenue as of December 31, 2017.
CHENIERE CORPUS CHRISTI HOLDINGS, LLC AND SUBSIDIARIES
NOTES TO CONSOLIDATED FINANCIAL STATEMENTS—CONTINUED
(unaudited)
NOTE 8—11—RELATED PARTY TRANSACTIONS
Below is a summary of our related party transactions as reported on our Consolidated Statements of Operations for the three and ninesix months ended SeptemberJune 30, 20182019 and 20172018 (in thousands):
|
| | | | | | | | | | | | | | | | |
| | Three Months Ended June 30, | | Six Months Ended June 30, |
| | 2019 | | 2018 | | 2019 | | 2018 |
| Revenues—affiliate |
| Cheniere Marketing Agreements | $ | 181,548 |
| | $ | — |
| | $ | 274,573 |
| | $ | — |
|
| |
| Cost of sales—related party | | | | | | | |
| Natural Gas Supply Agreement | 24,230 |
| | — |
| | 35,753 |
| | — |
|
| |
| Operating and maintenance expense—affiliate |
| Services Agreements | 15,270 |
| | 355 |
| | 20,341 |
| | 588 |
|
| Land Agreements | 189 |
| | 196 |
| | 365 |
| | 429 |
|
| Total operating and maintenance expense—affiliate | 15,459 |
| | 551 |
| | 20,706 |
| | 1,017 |
|
| |
| Development expense—affiliate |
| Services Agreements | 38 |
| | — |
| | 38 |
| | — |
|
| |
| General and administrative expense—affiliate |
| Services Agreements | 2,407 |
| | 595 |
| | 3,562 |
| | 998 |
|
|
| | | | | | | | | | | | | | | | |
| | Three Months Ended September 30, | | Nine Months Ended September 30, |
| | 2018 | | 2017 | | 2018 | | 2017 |
| Operating and maintenance expense—affiliate |
| Services Agreements | $ | 1,302 |
| | $ | 1,415 |
| | $ | 1,890 |
| | $ | 1,434 |
|
| Lease Agreements | 223 |
| | 89 |
| | 652 |
| | 219 |
|
| Other Agreements | (3 | ) | | — |
| | (3 | ) | | — |
|
| Total operating and maintenance expense—affiliate | 1,522 |
| | 1,504 |
| | 2,539 |
| | 1,653 |
|
| |
| Development expense—affiliate |
| Services Agreements | — |
| | — |
| | — |
| | 8 |
|
| |
| General and administrative expense—affiliate |
| Services Agreements | 607 |
| | 289 |
| | 1,605 |
| | 753 |
|
We had $19.8$19.5 million and $23.8$25.1 million due to affiliates as of SeptemberJune 30, 20182019 and December 31, 2017,2018, respectively, under agreements with affiliates, as described below.
LNG Sale and Purchase Agreements
CCL has a fixed price 20-year SPA with Cheniere Marketing International LLP (“Cheniere Marketing”) (the “Cheniere Marketing Base SPA”) with a term of 20 years which allows Cheniere Marketing to purchase, at its option, (1) up to a cumulative total of 150 TBtu of LNG within the commissioning periods for Trains 1 through 3, (2) any LNG produced from the end of the commissioning period for Train 1 until the date of first commercial delivery of LNG from Train 1 and (3) any excess LNG produced by the Liquefaction Facilities that is not committed to customers under third-party SPAs. Under the Cheniere Marketing Base SPA, Cheniere Marketing may, without charge, elect to suspend deliveries of cargoes (other than commissioning cargoes) scheduled for any month under the applicable annual delivery program by providing specified notice in advance. Additionally, CCL has a fixed price 25-year SPA with an approximate term of 23 years with Cheniere Marketing which allows them to purchase volumes of approximately 15 TBtu per annum of LNG. As of June 30, 2019 and December 31, 2018, CCL had $30.6 million and $21.1 million of accounts receivable—affiliate, respectively, under these agreements.
Services Agreements
Gas and Power Supply Services Agreement (“G&P Agreement”)
CCL has a G&P Agreement with Cheniere Energy Shared Services, Inc. (“Shared Services”), a wholly owned subsidiary of Cheniere, pursuant to which Shared Services will manage the gas and power procurement requirements of CCL. The services include, among other services, exercising the day-to-day management of CCL’s natural gas and power supply requirements, negotiating agreements on CCL’s behalf and providing other administrative services. Prior to the substantial completion of each Train of the Liquefaction Facilities, no monthly fee payment is required except for reimbursement of operating expenses. After substantial completion of each Train of the Liquefaction Facilities, for services performed while the Liquefaction Facilities is operational, CCL will pay, in addition to the reimbursement of operating expenses, a fixed monthly fee of $125,000 (indexed for inflation) for services with respect to such Train.
CHENIERE CORPUS CHRISTI HOLDINGS, LLC AND SUBSIDIARIES
NOTES TO CONSOLIDATED FINANCIAL STATEMENTS—CONTINUED
(unaudited)
Operation and Maintenance Agreements (“O&M Agreements”)
CCL has an O&M Agreement (“CCL O&M Agreement”) with Cheniere LNG O&M Services, LLC (“O&M Services”), a wholly owned subsidiary of Cheniere, pursuant to which CCL receives all of the necessary services required to construct, operate and maintain the Liquefaction Facilities. The services to be provided include, among other services, preparing and maintaining staffing plans, identifying and arranging for procurement of equipment and materials, overseeing contractors, administering various agreements, information technology services and other services required to operate and maintain the Liquefaction Facilities. Prior to the substantial completion of each Train of the Liquefaction Facilities, no monthly fee payment is required except for reimbursement of operating expenses. After substantial completion of each Train of the Liquefaction Facilities, for services performed while the Liquefaction Facilities is operational, CCL will pay, in addition to the reimbursement of operating expenses, a fixed monthly fee of $125,000 (indexed for inflation) for services with respect to such Train.
CCP has an O&M Agreement (“CCP O&M Agreement”) with O&M Services pursuant to which CCP receives all of the necessary services required to construct, operate and maintain the Corpus Christi Pipeline. The services to be provided include, among other services, preparing and maintaining staffing plans, identifying and arranging for procurement of equipment and materials, overseeing contractors, information technology services and other services required to operate and maintain the Corpus Christi Pipeline. CCP is required to reimburse O&M Services for all operating expenses incurred on behalf of CCP.
Management Services Agreements (“MSAs”)
CCL has an MSA with Shared Services pursuant to which Shared Services manages the construction and operation of the Liquefaction Facilities, excluding those matters provided for under the G&P Agreement and the CCL O&M Agreement. The services include, among other services, exercising the day-to-day management of CCL’s affairs and business, managing CCL’s regulatory matters, preparing status reports, providing contract administration services for all contracts associated with the Liquefaction Facilities and obtaining insurance. Prior to the substantial completion of each Train of the Liquefaction Facilities, no monthly fee payment is required except for reimbursement of expenses. After substantial completion of each Train, CCL will pay, in addition to the reimbursement of related expenses, a monthly fee equal to 3% of the capital expenditures incurred in the previous month and a fixed monthly fee of $375,000 for services with respect to such Train.
CCP has an MSA with Shared Services pursuant to which Shared Services manages CCP’s operations and business, excluding those matters provided for under the CCP O&M Agreement. The services include, among other services, exercising the day-to-day management of CCP’s affairs and business, managing CCP’s regulatory matters, preparing status reports, providing contract administration services for all contracts associated with the Corpus Christi Pipeline and obtaining insurance. CCP is required to reimburse Shared Services for the aggregate of all costs and expenses incurred in the course of performing the services under the MSA.
Natural Gas Supply Agreement
CCL has entered into a natural gas supply contract to obtain feed gas for the operation of the Liquefaction Project through September 2020 with a related party in the ordinary course of business. CCL recorded $24.2 million and $35.8 million in cost of sales—related party under this contract during the three and six months ended June 30, 2019, respectively. Of this amount, $4.2 million and zero was included in accrued liabilities—related party as of June 30, 2019 and December 31, 2018, respectively. CCL did not have any transactions during the three and six months ended June 30, 2018 under this contract. CCL also has recorded derivative assets—related party of $1.8 million and $2.1 million and non-current derivative assets—related party of $0.6 million and $3.4 million as of June 30, 2019 and December 31, 2018, respectively, related to this contract.
Agreements with Midship Pipeline
CCL has entered into a transportation precedent agreement and a negotiated rate agreement with Midship Pipeline Company, LLC (“Midship Pipeline”) to secure firm pipeline transportation capacity for a period of 10 years following commencement of the approximately 200-mile natural gas pipeline project which Midship Pipeline is constructing. In May 2018, CCL issued a letter of credit to Midship Pipeline for drawings up to an aggregate maximum amount of $16.2 million. Midship Pipeline had not made any drawings on this letter of credit as of June 30, 2019.
CHENIERE CORPUS CHRISTI HOLDINGS, LLC AND SUBSIDIARIES
NOTES TO CONSOLIDATED FINANCIAL STATEMENTS—CONTINUED
(unaudited)
Land Agreements
Lease Agreements
CCL has agreements with Cheniere Land Holdings, LLC (“Cheniere Land Holdings”), a wholly owned subsidiary of Cheniere, to lease the land owned by Cheniere Land Holdings for the Liquefaction Facilities. The total annual lease payment is $0.7$0.6 million, and the terms of the agreements range from three years to five years.
In February 2018, Easement Agreements
CCL entered intohas agreements with Cheniere Land Holdings which grantsgrant CCL a limited license to use certain roadseasements on land owned by Cheniere Land Holdings for the Liquefaction Facilities. The total annual lease payment for easement agreements is $0.1 million, excluding any previously paid one-time payments, and the termterms of each agreement isthe agreements range from three years to five years.
In August 2018, CCL entered into an agreement with Cheniere Land Holdings which grants CCL a limited license to use certain land owned by Cheniere Land Holdings for the Liquefaction Facilities. CCL made a one-time payment of $0.5 million under this agreement, and the term of the agreement is three years.
We had $0.5 million and $0.2 million as of September 30, 2018 and December 31, 2017, respectively, of prepaid expenses related to these agreements in other current assets—affiliate.
CHENIERE CORPUS CHRISTI HOLDINGS, LLC AND SUBSIDIARIES
NOTES TO CONSOLIDATED FINANCIAL STATEMENTS—CONTINUED
(unaudited)
Easement Agreements
In May 2018, CCL entered into agreements with Cheniere Land Holdings which grants CCL the right to construct, install and operate waterlines on land owned by Cheniere Land Holdings for the Liquefaction Facilities. During the nine months ended September 30, 2018, CCL paid $0.4 million as equity contributions to Cheniere Land Holdings for the value of these agreements.
Special Warranty Deed
In May 2018, CCL entered into a special warranty deed agreement with Cheniere Land Holdings whereby land owned by Cheniere Land Holdings was transferred to CCL as a non-cash equity contribution of $20.8 million.
Dredge Material Disposal Agreement
CCL has a dredge material disposal agreement with Cheniere Land Holdings that terminates in 2042 which grants CCL permission to use land owned by Cheniere Land Holdings for the deposit of dredge material from the construction and maintenance of the Liquefaction Facilities. Under the terms of the agreement, CCL will pay Cheniere Land Holdings $0.50 per cubic yard of dredge material deposits up to 5.0 million cubic yards and $4.62 per cubic yard for any quantities above that.
Tug Hosting Agreement
In February 2017, CCL entered into a tug hosting agreement with Corpus Christi Tug Services, LLC (“Tug Services”), a wholly owned subsidiary of Cheniere, to provide certain marine structures, support services and access necessary at the Liquefaction Facilities for Tug Services to provide its customers with tug boat and marine services. Tug Services is required to reimburse CCL for any third partythird-party costs incurred by CCL in connection with providing the goods and services.
State Tax Sharing Agreements
CCL has a state tax sharing agreement with Cheniere. Under this agreement, Cheniere has agreed to prepare and file all state and local tax returns which CCL and Cheniere are required to file on a combined basis and to timely pay the combined state and local tax liability. If Cheniere, in its sole discretion, demands payment, CCL will pay to Cheniere an amount equal to the state and local tax that CCL would be required to pay if CCL’s state and local tax liability were calculated on a separate company basis. There have been no state and local taxes paid by Cheniere for which Cheniere could have demanded payment from CCL under this agreement; therefore, Cheniere has not demanded any such payments from CCL. The agreement is effective for tax returns due on or after May 2015.
CCP has a state tax sharing agreement with Cheniere. Under this agreement, Cheniere has agreed to prepare and file all state and local tax returns which CCP and Cheniere are required to file on a combined basis and to timely pay the combined state and local tax liability. If Cheniere, in its sole discretion, demands payment, CCP will pay to Cheniere an amount equal to the state and local tax that CCP would be required to pay if CCP’s state and local tax liability were calculated on a separate company basis. There have been no state and local taxes paid by Cheniere for which Cheniere could have demanded payment from CCP under this agreement; therefore, Cheniere has not demanded any such payments from CCP. The agreement is effective for tax returns due on or after May 2015.
Equity Contribution Agreements
Equity Contribution Agreement
In May 2018, we amended and restated the existing equity contribution agreement with Cheniere (the “Equity Contribution Agreement”) pursuant to which Cheniere agreed to provide cash contributions up to approximately $1.1 billion, not including $2.0 billion previously contributed under the original equity contribution agreement. As of SeptemberJune 30, 2018,2019, we have received $2.0 billion$71.6 million in contributions under the Equity Contribution Agreement. Cheniere willis only be required to make additional contributions
CHENIERE CORPUS CHRISTI HOLDINGS, LLC AND SUBSIDIARIES
NOTES TO CONSOLIDATED FINANCIAL STATEMENTS—CONTINUED
(unaudited)
under the Equity Contribution Agreement after the commitments under the CCH Credit Facility have been reduced to zero and to the extent cash flows from operations of the Liquefaction Project are unavailable for Liquefaction Project costs.
CHENIERE CORPUS CHRISTI HOLDINGS, LLC AND SUBSIDIARIES
NOTES TO CONSOLIDATED FINANCIAL STATEMENTS—CONTINUED
(unaudited)
Early Works Equity Contribution Agreement
In conjunction with the amendment and restatement of the Equity Contribution Agreement, we terminated the early works equity contribution agreement with Cheniere entered into in December 2017. Prior to termination in May 2018, we had received $250.0 million in contributions from Cheniere under the early works equity contribution agreement.
NOTE 9—12—CUSTOMER CONCENTRATION
The following table shows customers with revenues of 10% or greater of total revenues from external customers and customers with accounts receivable balances of 10% or greater of total accounts receivable from external customers:
|
| | | | | | | | | | | | |
| | | Percentage of Total Revenues from External Customers | | Percentage of Accounts Receivable from External Customers |
| | | Three Months Ended June 30, | | Six Months Ended June 30, | | June 30, | | December 31, |
| | | 2019 | | 2018 | | 2019 | | 2018 | | 2019 | | 2018 |
| Customer A | | 38% | | —% | | 34% | | —% | | —% | | —% |
| Customer B | | 19% | | —% | | 17% | | —% | | 58% | | —% |
NOTE 13—SUPPLEMENTAL CASH FLOW INFORMATION
The following table provides supplemental disclosure of cash flow information (in thousands):
|
| | | | | | | |
| | Six Months Ended June 30, |
| | 2019 | | 2018 |
| Noncash capital contribution for conveyance of property, plant and equipment from affiliate | $ | — |
| | $ | 51,381 |
|
|
| | | | | | | |
| | Nine Months Ended September 30, |
| | 2018 | | 2017 |
| Cash paid during the period for interest, net of amounts capitalized | $ | 48,742 |
| | $ | — |
|
| Noncash capital contribution for conveyance of property, plant and equipment from affiliate | 51,412 |
| | — |
|
The balance in property, plant and equipment, net funded with accounts payable and accrued liabilities (including affiliate) was $285.8$269.0 million and $194.2$698.7 million as of SeptemberJune 30, 20182019 and 2017,2018, respectively.
CHENIERE CORPUS CHRISTI HOLDINGS, LLC AND SUBSIDIARIES
NOTES TO CONSOLIDATED FINANCIAL STATEMENTS—CONTINUED
(unaudited)
NOTE 10—RECENT ACCOUNTING STANDARDS
The following table provides a brief description of a recent accounting standard that had not been adopted by us as of September 30, 2018:
|
| | | | | | |
Standard | | Description | | Expected Date of Adoption | | Effect on our Consolidated Financial Statements or Other Significant Matters |
ASU 2016-02, Leases (Topic 842), and subsequent amendments thereto
| | This standard requires a lessee to recognize leases on its balance sheet by recording a lease liability representing the obligation to make future lease payments and a right-of-use asset representing the right to use the underlying asset for the lease term. A lessee is permitted to make an election not to recognize lease assets and liabilities for leases with a term of 12 months or less. The standard also modifies the definition of a lease and requires expanded disclosures. This guidance may be early adopted, and may be adopted using either a modified retrospective approach to apply the standard at the beginning of the earliest period presented in the financial statements or an optional transition approach to apply the standard at the date of adoption with no retrospective adjustments to prior periods. Certain additional practical expedients are also available.
| | January 1, 2019
| | We continue to evaluate the effect of this standard on our Consolidated Financial Statements. This evaluation process includes reviewing all forms of leases, performing a completeness assessment over the lease population, analyzing the practical expedients and assessing opportunities to make certain changes to our lease accounting information technology system in order to determine the best implementation strategy. Preliminarily, we expect that the requirement to recognize all leases on our Consolidated Balance Sheets will be a significant change from current practice but will not have a material impact on our Consolidated Balance Sheets. Because this assessment is preliminary and the accounting for leases is subject to significant judgment, this conclusion could change as we finalize our assessment. We have not yet determined the impact of the adoption of this standard upon our results of operations or cash flows. We anticipate electing the optional transition method to initially apply the standard at the January 1, 2019 adoption date. We expect to elect the package of practical expedients permitted under the transition guidance which, among other things, allows the carryforward of prior conclusions related to lease identification and classification. We also expect to elect the practical expedient to retain our existing accounting for land easements which were not previously accounted for as leases. We have not yet determined whether we will elect any other practical expedients upon transition. |
CHENIERE CORPUS CHRISTI HOLDINGS, LLC AND SUBSIDIARIES
NOTES TO CONSOLIDATED FINANCIAL STATEMENTS—CONTINUED
(unaudited)
Additionally, the following table provides a brief description of recent accounting standards that were adopted by us during the reporting period:
|
| | | | | | |
Standard | | Description | | Date of Adoption | | Effect on our Consolidated Financial Statements or Other Significant Matters |
ASU 2014-09, Revenue from Contracts with Customers (Topic 606), and subsequent amendments thereto
| | This standard provides a single, comprehensive revenue recognition model which replaces and supersedes most existing revenue recognition guidance and requires an entity to recognize revenue to depict the transfer of promised goods or services to customers in an amount that reflects the consideration to which the entity expects to be entitled in exchange for those goods or services. The standard requires that the costs to obtain and fulfill contracts with customers should be recognized as assets and amortized to match the pattern of transfer of goods or services to the customer if expected to be recoverable. The standard also requires enhanced disclosures. This guidance may be adopted either retrospectively to each prior reporting period presented subject to allowable practical expedients (“full retrospective approach”) or as a cumulative-effect adjustment as of the date of adoption (“modified retrospective approach”). | | January 1, 2018 | | We adopted this guidance on January 1, 2018, using the full retrospective method. The adoption of this guidance represents a change in accounting principle that will provide financial statement readers with enhanced disclosures regarding the nature, amount, timing and uncertainty of revenue and cash flows arising from contracts with customers. The adoption of this guidance did not impact our previously reported consolidated financial statements in any prior period nor did it result in a cumulative effect adjustment to retained earnings. See Note 7—Revenues from Contracts with Customers for additional disclosures.
|
ASU 2016-16, Income Taxes (Topic 740): Intra-Entity Transfers of Assets Other Than Inventory
| | This standard requires the immediate recognition of the tax consequences of intercompany asset transfers other than inventory. This guidance may be early adopted, but only at the beginning of an annual period, and must be adopted using a modified retrospective approach. | | January 1, 2018
| | The adoption of this guidance did not have an impact on our Consolidated Financial Statements or related disclosures. |
CHENIERE CORPUS CHRISTI HOLDINGS, LLC AND SUBSIDIARIES
NOTES TO CONSOLIDATED FINANCIAL STATEMENTS—CONTINUED
(unaudited)
NOTE 11—14—SUPPLEMENTAL GUARANTOR INFORMATION
Our CCH Senior Notes are jointly and severally guaranteed by our subsidiaries, CCL, CCP and CCP GP (each a “Guarantor” and collectively, the “Guarantors”). These guarantees are full and unconditional, subject to certain customary release provisions including (1) the sale, exchange, disposition or transfer (by merger, consolidation or otherwise) of the capital stock or all or substantially all of the assets of the Guarantors, (2) the designation of the Guarantor as an “unrestricted subsidiary” in accordance with the indenture governing the CCH Senior Notes (the “CCH Indenture”),Indenture, (3) upon the legal defeasance or covenant defeasance or discharge of obligations under the CCH Indenture and (4) the release and discharge of the Guarantors pursuant to the Common Security and Account Agreement. See Note 6—9—Debt of our Notes to Consolidated Financial Statements in our annual report on Form 10-K for the year ended December 31, 2018 for additional information regarding the CCH Senior Notes.
The following is condensed consolidating financial information for CCH (“Parent Issuer”) and the Guarantors. We did not have any non-guarantor subsidiaries as of SeptemberJune 30, 2018.2019.
|
| | | | | | | | | | | | | | | |
| Condensed Consolidating Balance Sheet |
| September 30, 2018 |
| (in thousands) |
| | | | | | | | |
| | Parent Issuer | | Guarantors | | Eliminations | | Consolidated |
| ASSETS | | | | | | | |
| Current assets | | | | | | | |
| Cash and cash equivalents | $ | — |
| | $ | — |
| | $ | — |
| | $ | — |
|
| Restricted cash | 217,993 |
| | 1,957 |
| | — |
| | 219,950 |
|
| Advances to affiliate | — |
| | 53,845 |
| | — |
| | 53,845 |
|
| Inventory | — |
| | 8,638 |
| | — |
| | 8,638 |
|
| Derivative assets | 13,505 |
| | 2,503 |
| | — |
| | 16,008 |
|
| Other current assets | 320 |
| | 4,072 |
| | — |
| | 4,392 |
|
| Other current assets—affiliate | — |
| | 498 |
| | — |
| | 498 |
|
| Total current assets | 231,818 |
| | 71,513 |
| | — |
| | 303,331 |
|
| | | | | | | | |
| Property, plant and equipment, net | 969,395 |
| | 9,586,914 |
| | — |
| | 10,556,309 |
|
| Debt issuance and deferred financing costs, net | 53,465 |
| | — |
| | — |
| | 53,465 |
|
| Non-current derivative assets | 80,675 |
| | 10,416 |
| | — |
| | 91,091 |
|
| Investments in subsidiaries | 9,575,538 |
| | — |
| | (9,575,538 | ) | | — |
|
| Other non-current assets, net | — |
| | 29,841 |
| | — |
| | 29,841 |
|
| Total assets | $ | 10,910,891 |
| | $ | 9,698,684 |
| | $ | (9,575,538 | ) | | $ | 11,034,037 |
|
| | | | | | | | |
| LIABILITIES AND MEMBER’S EQUITY | | | | | | | |
| Current liabilities | | | | | | | |
| Accounts payable | $ | 73 |
| | $ | 25,231 |
| | $ | — |
| | $ | 25,304 |
|
| Accrued liabilities | 65,075 |
| | 191,452 |
| | — |
| | 256,527 |
|
| Due to affiliates | — |
| | 19,846 |
| | — |
| | 19,846 |
|
| Derivative liabilities | — |
| | 213 |
| | — |
| | 213 |
|
| Total current liabilities | 65,148 |
| | 236,742 |
| | — |
| | 301,890 |
|
| | | | | | | | |
| Long-term debt, net | 8,589,201 |
| | — |
| | — |
| | 8,589,201 |
|
| Non-current derivative liabilities | — |
| | 3,441 |
| | — |
| | 3,441 |
|
| Deferred tax liability | — |
| | 4,209 |
| | (4,209 | ) | | — |
|
| | | | | | | | |
| Member’s equity | 2,256,542 |
| | 9,454,292 |
| | (9,571,329 | ) | | 2,139,505 |
|
| Total liabilities and member’s equity | $ | 10,910,891 |
| | $ | 9,698,684 |
| | $ | (9,575,538 | ) | | $ | 11,034,037 |
|
CHENIERE CORPUS CHRISTI HOLDINGS, LLC AND SUBSIDIARIES
NOTES TO CONSOLIDATED FINANCIAL STATEMENTS—CONTINUED
(unaudited)
| | Condensed Consolidating Balance Sheet | | December 31, 2017 | |
| June 30, 2019 | | June 30, 2019 |
(in thousands) | | | | | | | | | | | | | | | | |
| | Parent Issuer | | Guarantors | | Eliminations | | Consolidated | Parent Issuer | | Guarantors | | Eliminations | | Consolidated |
| ASSETS | | | | | | | | | | | | | | |
| Current assets | | | | | | | | | | | | | | |
| Cash and cash equivalents | $ | — |
| | $ | — |
| | $ | — |
| | $ | — |
| $ | — |
| | $ | — |
| | $ | — |
| | $ | — |
|
| Restricted cash | 226,559 |
| | — |
| | — |
| | 226,559 |
| 271,057 |
| | 8,113 |
| | — |
| | 279,170 |
|
| Accounts and other receivables | | — |
| | 38,576 |
| | — |
| | 38,576 |
|
| Accounts receivable—affiliate | | — |
| | 30,613 |
| | — |
| | 30,613 |
|
| Advances to affiliate | — |
| | 31,486 |
| | — |
| | 31,486 |
| — |
| | 69,140 |
| | — |
| | 69,140 |
|
| Inventory | | — |
| | 63,274 |
| | — |
| | 63,274 |
|
| Derivative assets | | — |
| | 5,498 |
| | — |
| | 5,498 |
|
| Derivative assets—related party | | — |
| | 1,807 |
| | — |
| | 1,807 |
|
| Other current assets | 246 |
| | 1,248 |
| | — |
| | 1,494 |
| 352 |
| | 20,254 |
| | — |
| | 20,606 |
|
| Other current assets—affiliate | — |
| | 191 |
| | (1 | ) | | 190 |
| — |
| | 33 |
| | (2 | ) | | 31 |
|
| Total current assets | 226,805 |
| | 32,925 |
| | (1 | ) | | 259,729 |
| 271,409 |
| | 237,308 |
| | (2 | ) | | 508,715 |
|
| | | | | | | | | | | | | | | |
| Property, plant and equipment, net | 651,687 |
| | 7,609,696 |
| | — |
| | 8,261,383 |
| 1,272,273 |
| | 10,805,385 |
| | — |
| | 12,077,658 |
|
| Debt issuance and deferred financing costs, net | 98,175 |
| | — |
| | — |
| | 98,175 |
| 17,788 |
| | — |
| | — |
| | 17,788 |
|
| Non-current derivative assets | 2,469 |
| | — |
| | — |
| | 2,469 |
| — |
| | 7,678 |
| | — |
| | 7,678 |
|
| Non-current derivative assets—related party | | — |
| | 614 |
| | — |
| | 614 |
|
| Investments in subsidiaries | 7,648,111 |
| | — |
| | (7,648,111 | ) | | — |
| 10,968,324 |
| | — |
| | (10,968,324 | ) | | — |
|
| Other non-current assets, net | — |
| | 38,124 |
| | — |
| | 38,124 |
| — |
| | 51,546 |
| | — |
| | 51,546 |
|
| Total assets | $ | 8,627,247 |
| | $ | 7,680,745 |
| | $ | (7,648,112 | ) | | $ | 8,659,880 |
| $ | 12,529,794 |
| | $ | 11,102,531 |
| | $ | (10,968,326 | ) | | $ | 12,663,999 |
|
| | | | | | | | | | | | | | | |
| LIABILITIES AND MEMBER’S EQUITY | | | | | | | | | | | | | | |
| Current liabilities | | | | | | | | | | | | | | |
| Accounts payable | $ | 82 |
| | $ | 6,379 |
| | $ | — |
| | $ | 6,461 |
| $ | 365 |
| | $ | 28,831 |
| | $ | — |
| | $ | 29,196 |
|
| Accrued liabilities | 136,389 |
| | 121,671 |
| | — |
| | 258,060 |
| 129,154 |
| | 256,054 |
| | — |
| | 385,208 |
|
| Accrued liabilities—related party | | — |
| | 4,174 |
| | — |
| | 4,174 |
|
| Due to affiliates | — |
| | 23,789 |
| | — |
| | 23,789 |
| 140 |
| | 19,311 |
| | — |
| | 19,451 |
|
| Derivative liabilities | 19,609 |
| | — |
| | — |
| | 19,609 |
| 20,626 |
| | 4,722 |
| | — |
| | 25,348 |
|
| Other current liabilities | | — |
| | 1,106 |
| | — |
| | 1,106 |
|
| Other current liabilities—affiliate | | — |
| | 506 |
| | — |
| | 506 |
|
| Total current liabilities | 156,080 |
| | 151,839 |
| | — |
| | 307,919 |
| 150,285 |
| | 314,704 |
| | — |
| | 464,989 |
|
| | | | | | | | | | | | | | | |
| Long-term debt, net | 6,669,476 |
| | — |
| | — |
| | 6,669,476 |
| 10,221,597 |
| | — |
| | — |
| | 10,221,597 |
|
| Non-current derivative liabilities | 15,118 |
| | 91 |
| | — |
| | 15,209 |
| 74,201 |
| | 3,017 |
| | — |
| | 77,218 |
|
| Deferred tax liability | — |
| | 2,983 |
| | (2,983 | ) | | — |
| |
| Deferred tax liabilities | | — |
| | 3,645 |
| | (3,645 | ) | | — |
|
| Other non-current liabilities | | — |
| | 6,775 |
| | — |
| | 6,775 |
|
| Other non-current liabilities—affiliate | | — |
| | 846 |
| | — |
| | 846 |
|
| | | | | | | | | | | | | | | |
| Member’s equity | 1,786,573 |
| | 7,525,832 |
| | (7,645,129 | ) | | 1,667,276 |
| 2,083,711 |
| | 10,773,544 |
| | (10,964,681 | ) | | 1,892,574 |
|
| Total liabilities and member’s equity | $ | 8,627,247 |
| | $ | 7,680,745 |
| | $ | (7,648,112 | ) | | $ | 8,659,880 |
| $ | 12,529,794 |
| | $ | 11,102,531 |
| | $ | (10,968,326 | ) | | $ | 12,663,999 |
|
CHENIERE CORPUS CHRISTI HOLDINGS, LLC AND SUBSIDIARIES
NOTES TO CONSOLIDATED FINANCIAL STATEMENTS—CONTINUED
(unaudited)
|
| | | | | | | | | | | | | | | |
| Condensed Consolidating Balance Sheet |
| December 31, 2018 |
| (in thousands) |
| | | | | | | | |
| | Parent Issuer | | Guarantors | | Eliminations | | Consolidated |
| ASSETS | | | | | | | |
| Current assets | | | | | | | |
| Cash and cash equivalents | $ | — |
| | $ | — |
| | $ | — |
| | $ | — |
|
| Restricted cash | 282,248 |
| | 6,893 |
| | — |
| | 289,141 |
|
| Accounts and other receivables | — |
| | 24,989 |
| | — |
| | 24,989 |
|
| Accounts receivable—affiliate | — |
| | 21,060 |
| | — |
| | 21,060 |
|
| Advances to affiliate | — |
| | 94,397 |
| | — |
| | 94,397 |
|
| Inventory | — |
| | 26,198 |
| | — |
| | 26,198 |
|
| Derivative assets | 10,556 |
| | 5,071 |
| | — |
| | 15,627 |
|
| Derivative assets—related party | — |
| | 2,132 |
| | — |
| | 2,132 |
|
| Other current assets | 178 |
| | 15,039 |
| | — |
| | 15,217 |
|
| Other current assets—affiliate | — |
| | 634 |
| | (1 | ) | | 633 |
|
| Total current assets | 292,982 |
| | 196,413 |
| | (1 | ) | | 489,394 |
|
| | | | | | | | |
| Property, plant and equipment, net | 1,094,671 |
| | 10,044,154 |
| | — |
| | 11,138,825 |
|
| Debt issuance and deferred financing costs, net | 38,012 |
| | — |
| | — |
| | 38,012 |
|
| Non-current derivative assets | 7,917 |
| | 11,115 |
| | — |
| | 19,032 |
|
| Non-current derivative assets—related party | — |
| | 3,381 |
| | — |
| | 3,381 |
|
| Investments in subsidiaries | 10,194,296 |
| | — |
| | (10,194,296 | ) | | — |
|
| Other non-current assets, net | 1 |
| | 31,708 |
| | — |
| | 31,709 |
|
| Total assets | $ | 11,627,879 |
| | $ | 10,286,771 |
| | $ | (10,194,297 | ) | | $ | 11,720,353 |
|
| | | | | | | | |
| LIABILITIES AND MEMBER’S EQUITY | | | | | | | |
| Current liabilities | | | | | | | |
| Accounts payable | $ | 71 |
| | $ | 16,131 |
| | $ | — |
| | $ | 16,202 |
|
| Accrued liabilities | 1,242 |
| | 160,963 |
| | — |
| | 162,205 |
|
| Current debt | 168,000 |
| | — |
| | — |
| | 168,000 |
|
| Due to affiliates | — |
| | 25,086 |
| | — |
| | 25,086 |
|
| Derivative liabilities | 6 |
| | 13,570 |
| | — |
| | 13,576 |
|
| Total current liabilities | 169,319 |
| | 215,750 |
| | — |
| | 385,069 |
|
| | | | | | | | |
| Long-term debt, net | 9,245,552 |
| | — |
| | — |
| | 9,245,552 |
|
| Non-current derivative liabilities | 398 |
| | 8,197 |
| | — |
| | 8,595 |
|
| Deferred tax liability | — |
| | 2,008 |
| | (2,008 | ) | | — |
|
| | | | | | | | |
| Member’s equity | 2,212,610 |
| | 10,060,816 |
| | (10,192,289 | ) | | 2,081,137 |
|
| Total liabilities and member’s equity | $ | 11,627,879 |
| | $ | 10,286,771 |
| | $ | (10,194,297 | ) | | $ | 11,720,353 |
|
|
| | | | | | | | | | | | | | | |
| Condensed Consolidating Statement of Operations |
| Three Months Ended September 30, 2018 |
| (in thousands) |
| | | | | | | | |
| | Parent Issuer | | Guarantors | | Eliminations | | Consolidated |
| | | | | | | | |
| Revenues | $ | — |
| | $ | — |
| | $ | — |
| | $ | — |
|
| | | | | | | | |
| Expenses | | | | | | | |
| Operating and maintenance expense (recovery) | — |
| | (9,477 | ) | | — |
| | (9,477 | ) |
| Operating and maintenance expense—affiliate | — |
| | 1,522 |
| | — |
| | 1,522 |
|
| Development expense | — |
| | 49 |
| | — |
| | 49 |
|
| General and administrative expense | 450 |
| | 1,029 |
| | — |
| | 1,479 |
|
| General and administrative expense—affiliate | — |
| | 607 |
| | — |
| | 607 |
|
| Depreciation and amortization expense | 89 |
| | 3,399 |
| | — |
| | 3,488 |
|
| Impairment expense and gain on disposal of assets | — |
| | (13 | ) | | — |
| | (13 | ) |
| Total expenses (recoveries) | 539 |
| | (2,884 | ) | | — |
| | (2,345 | ) |
| | | | | | | | |
| Income (loss) from operations | (539 | ) | | 2,884 |
| | — |
| | 2,345 |
|
| | | | | | | | |
| Other income (expense) | | | | | | | |
| Derivative gain, net | 21,818 |
| | — |
| | — |
| | 21,818 |
|
| Other income | 220 |
| | 80 |
| | (75 | ) | | 225 |
|
| Total other income | 22,038 |
| | 80 |
| | (75 | ) | | 22,043 |
|
| | | | | | | | |
| Net income | $ | 21,499 |
| | $ | 2,964 |
| | $ | (75 | ) | | $ | 24,388 |
|
CHENIERE CORPUS CHRISTI HOLDINGS, LLC AND SUBSIDIARIES
NOTES TO CONSOLIDATED FINANCIAL STATEMENTS—CONTINUED
(unaudited)
| | Condensed Consolidating Statement of Operations | | Three Months Ended September 30, 2017 | |
| Three Months Ended June 30, 2019 | | Three Months Ended June 30, 2019 |
(in thousands) | | | | | | | | | | | | | | | | |
| | Parent Issuer | | Guarantors | | Eliminations | | Consolidated | Parent Issuer | | Guarantors | | Eliminations | | Consolidated |
| | | | | | | | | | | | | | | |
| Revenues | $ | — |
| | $ | — |
| | $ | — |
| | $ | — |
| | | | | | | |
| LNG revenues | | $ | — |
| | $ | 118,525 |
| | $ | — |
| | $ | 118,525 |
|
| LNG revenues—affiliate | | — |
| | 181,548 |
| | — |
| | 181,548 |
|
| Total revenues | | — |
| | 300,073 |
| | — |
| | 300,073 |
|
| | | | | | | | | | | | | | | |
| Expenses | | | | | | | | |
| Operating costs and expenses | | | | | | | | |
| Cost of sales (excluding depreciation and amortization expense shown separately below) | | — |
| | 181,136 |
| | — |
| | 181,136 |
|
| Cost of sales—related party | | — |
| | 24,230 |
| | — |
| | 24,230 |
|
| Operating and maintenance expense | — |
| | 533 |
| | — |
| | 533 |
| — |
| | 60,817 |
| | — |
| | 60,817 |
|
| Operating and maintenance expense—affiliate | — |
| | 1,516 |
| | (12 | ) | | 1,504 |
| — |
| | 15,459 |
| | — |
| | 15,459 |
|
| Development expense | — |
| | 82 |
| | — |
| | 82 |
| — |
| | 532 |
| | — |
| | 532 |
|
| Development expense—affiliate | | — |
| | 38 |
| | — |
| | 38 |
|
| General and administrative expense | 192 |
| | 669 |
| | — |
| | 861 |
| 486 |
| | 1,056 |
| | — |
| | 1,542 |
|
| General and administrative expense—affiliate | — |
| | 289 |
| | — |
| | 289 |
| — |
| | 2,407 |
| | — |
| | 2,407 |
|
| Depreciation and amortization expense | — |
| | 248 |
| | — |
| | 248 |
| 6,079 |
| | 51,221 |
| | — |
| | 57,300 |
|
| Impairment expense and loss on disposal of assets | — |
| | 2,059 |
| | — |
| | 2,059 |
| |
| Total expenses | 192 |
| | 5,396 |
| | (12 | ) | | 5,576 |
| |
| Total operating costs and expenses | | 6,565 |
| | 336,896 |
| | — |
| | 343,461 |
|
| | | | | | | | | | | | | | | |
| Loss from operations | (192 | ) | | (5,396 | ) | | 12 |
| | (5,576 | ) | (6,565 | ) | | (36,823 | ) | | — |
| | (43,388 | ) |
| | | | | | | | | | | | | | | |
| Other income (expense) | | | | | | | | | | | | | | |
| Interest expense, net of capitalized interest | | (73,052 | ) | | — |
| | — |
| | (73,052 | ) |
| Derivative loss, net | (2,906 | ) | | — |
| | — |
| | (2,906 | ) | (73,821 | ) | | — |
| | — |
| | (73,821 | ) |
| Other income (expense) | (97 | ) | | 3,722 |
| | (3,720 | ) | | (95 | ) | |
| Other income—affiliate | — |
| | 12 |
| | (12 | ) | | — |
| |
| Other expense | | 1,285 |
| | 81 |
| | (12 | ) | | 1,354 |
|
| Total other income (expense) | (3,003 | ) | | 3,734 |
| | (3,732 | ) | | (3,001 | ) | (145,588 | ) | | 81 |
| | (12 | ) | | (145,519 | ) |
| | | | | | | | | | | | | | | |
| Loss before income taxes | (3,195 | ) | | (1,662 | ) | | (3,720 | ) | | (8,577 | ) | (152,153 | ) | | (36,742 | ) | | (12 | ) | | (188,907 | ) |
| Income tax provision | — |
| | (3,677 | ) | | 3,677 |
| | — |
| — |
| | (2,541 | ) | | 2,541 |
| | — |
|
| Net loss | $ | (3,195 | ) | | $ | (5,339 | ) | | $ | (43 | ) | | $ | (8,577 | ) | $ | (152,153 | ) | | $ | (39,283 | ) | | $ | 2,529 |
| | $ | (188,907 | ) |
CHENIERE CORPUS CHRISTI HOLDINGS, LLC AND SUBSIDIARIES
NOTES TO CONSOLIDATED FINANCIAL STATEMENTS—CONTINUED
(unaudited)
| | Condensed Consolidating Statement of Operations | | Nine Months Ended September 30, 2018 | |
| Three Months Ended June 30, 2018 | | Three Months Ended June 30, 2018 |
(in thousands) | | | | | | | | | | | | | | | | |
| | Parent Issuer | | Guarantors | | Eliminations | | Consolidated | Parent Issuer | | Guarantors | | Eliminations | | Consolidated |
| | | | | | | | | | | | | | | |
| Revenues | $ | — |
| | $ | — |
| | $ | — |
| | $ | — |
| $ | — |
| | $ | — |
| | $ | — |
| | $ | — |
|
| | | | | | | | | | | | | | | |
| Expenses | | | | | | | | |
| Operating and maintenance expense recovery | — |
| | (6,377 | ) | | — |
| | (6,377 | ) | |
| Operating costs and expenses | | | | | | | | |
| Cost of sales (excluding depreciation and amortization expense shown separately below) | | — |
| | 1,031 |
| | — |
| | 1,031 |
|
| Operating and maintenance expense | | — |
| | 1,103 |
| | — |
| | 1,103 |
|
| Operating and maintenance expense—affiliate | — |
| | 2,539 |
| | — |
| | 2,539 |
| — |
| | 551 |
| | — |
| | 551 |
|
| Development expense | — |
| | 172 |
| | — |
| | 172 |
| — |
| | 89 |
| | — |
| | 89 |
|
| General and administrative expense | 999 |
| | 2,515 |
| | — |
| | 3,514 |
| 450 |
| | 735 |
| | — |
| | 1,185 |
|
| General and administrative expense—affiliate | — |
| | 1,605 |
| | — |
| | 1,605 |
| — |
| | 595 |
| | — |
| | 595 |
|
| Depreciation and amortization expense | 114 |
| | 5,132 |
| | — |
| | 5,246 |
| 12 |
| | 1,375 |
| | — |
| | 1,387 |
|
| Impairment expense and gain on disposal of assets | — |
| | (13 | ) | | — |
| | (13 | ) | |
| Total expenses | 1,113 |
| | 5,573 |
| | — |
| | 6,686 |
| 462 |
| | 5,479 |
| | — |
| | 5,941 |
|
| | | | | | | | | | | | | | | |
| Loss from operations | (1,113 | ) | | (5,573 | ) | | — |
| | (6,686 | ) | (462 | ) | | (5,479 | ) | | — |
| | (5,941 | ) |
| | | | | | | | | | | | | | | |
| Other income (expense) | | | | | | | | | | | | | | |
| Loss on modification or extinguishment of debt | (15,332 | ) | | — |
| | — |
| | (15,332 | ) | (15,332 | ) | | — |
| | — |
| | (15,332 | ) |
| Derivative gain, net | 119,233 |
| | — |
| | — |
| | 119,233 |
| 28,566 |
| | — |
| | — |
| | 28,566 |
|
| Other income | 177 |
| | 7,833 |
| | (7,826 | ) | | 184 |
| 25 |
| | 3,277 |
| | (3,276 | ) | | 26 |
|
| Total other income | 104,078 |
| | 7,833 |
| | (7,826 | ) | | 104,085 |
| 13,259 |
| | 3,277 |
| | (3,276 | ) | | 13,260 |
|
| | | | | | | | | | | | | | | |
| Income before income taxes | 102,965 |
| | 2,260 |
| | (7,826 | ) | | 97,399 |
| |
| Income (loss) before income taxes | | 12,797 |
| | (2,202 | ) | | (3,276 | ) | | 7,319 |
|
| Income tax provision | — |
| | (1,225 | ) | | 1,225 |
| | — |
| — |
| | (328 | ) | | 328 |
| | — |
|
| Net income | $ | 102,965 |
| | $ | 1,035 |
| | $ | (6,601 | ) | | $ | 97,399 |
| |
| Net income (loss) | | $ | 12,797 |
| | $ | (2,530 | ) | | $ | (2,948 | ) | | $ | 7,319 |
|
CHENIERE CORPUS CHRISTI HOLDINGS, LLC AND SUBSIDIARIES
NOTES TO CONSOLIDATED FINANCIAL STATEMENTS—CONTINUED
(unaudited)
| | Condensed Consolidating Statement of Operations | | Nine Months Ended September 30, 2017 | |
| Six Months Ended June 30, 2019 | | Six Months Ended June 30, 2019 |
(in thousands) | | | | | | | | | | | | | | | | |
| | Parent Issuer | | Guarantors | | Eliminations | | Consolidated | Parent Issuer | | Guarantors | | Eliminations | | Consolidated |
| | | | | | | | | | | | | | | |
| Revenues | $ | — |
| | $ | — |
| | $ | — |
| | $ | — |
| | | | | | | |
| LNG revenues | | $ | — |
| | $ | 131,581 |
| | $ | — |
| | $ | 131,581 |
|
| LNG revenues—affiliate | | — |
| | 274,573 |
| | — |
| | 274,573 |
|
| Total revenues | | — |
|
| 406,154 |
|
| — |
|
| 406,154 |
|
| | | | | | | | | | | | | | | |
| Expenses | | | | | | | | |
| Operating costs and expenses | | | | | | | | |
| Cost of sales (excluding depreciation and amortization expense shown separately below) | | — |
| | 238,665 |
| | — |
| | 238,665 |
|
| Cost of sales—related party | | — |
| | 35,753 |
| | — |
| | 35,753 |
|
| Operating and maintenance expense | — |
| | 2,097 |
| | — |
| | 2,097 |
| — |
| | 92,672 |
| | — |
| | 92,672 |
|
| Operating and maintenance expense—affiliate | — |
| | 1,653 |
| | — |
| | 1,653 |
| — |
| | 20,706 |
| | — |
| | 20,706 |
|
| Development expense | — |
| | 497 |
| | — |
| | 497 |
| — |
| | 532 |
| | — |
| | 532 |
|
| Development expense—affiliate | — |
| | 8 |
| | — |
| | 8 |
| — |
| | 38 |
| | — |
| | 38 |
|
| General and administrative expense | 832 |
| | 2,992 |
| | — |
| | 3,824 |
| 897 |
| | 2,182 |
| | — |
| | 3,079 |
|
| General and administrative expense—affiliate | — |
| | 753 |
| | — |
| | 753 |
| — |
| | 3,562 |
| | — |
| | 3,562 |
|
| Depreciation and amortization expense | — |
| | 537 |
| | — |
| | 537 |
| 8,144 |
| | 71,480 |
| | — |
| | 79,624 |
|
| Impairment expense and loss on disposal of assets | — |
| | 2,064 |
| | — |
| | 2,064 |
| |
| Total expenses | 832 |
| | 10,601 |
| | — |
| | 11,433 |
| |
| Impairment expense and gain on disposal of assets | | — |
| | 313 |
| | — |
| | 313 |
|
| Total operating costs and expenses | | 9,041 |
| | 465,903 |
| | — |
| | 474,944 |
|
| | | | | | | | | | | | | | | |
| Loss from operations | (832 | ) | | (10,601 | ) | | — |
| | (11,433 | ) | (9,041 | ) |
| (59,749 | ) |
| — |
|
| (68,790 | ) |
| | | | | | | | | | | | | | | |
| Other income (expense) | | | | | | | | | | | | | | |
| Loss on modification or extinguishment of debt | (32,480 | ) | | — |
| | — |
| | (32,480 | ) | |
| Interest expense, net of capitalized interest | | (84,810 | ) | | — |
| | — |
| | (84,810 | ) |
| Derivative loss, net | (35,002 | ) | | — |
| | — |
| | (35,002 | ) | (108,908 | ) | | — |
| | — |
| | (108,908 | ) |
| Other income (expense) | (182 | ) | | 11,540 |
| | (11,535 | ) | | (177 | ) | |
| Other income | | 2,178 |
| | 230 |
| | (84 | ) | | 2,324 |
|
| Total other income (expense) | (67,664 | ) | | 11,540 |
| | (11,535 | ) | | (67,659 | ) | (191,540 | ) | | 230 |
| | (84 | ) | | (191,394 | ) |
| | | | | | | | | | | | | | | |
| Income (loss) before income taxes | (68,496 | ) | | 939 |
| | (11,535 | ) | | (79,092 | ) | |
| Loss before income taxes | | (200,581 | ) | | (59,519 | ) | | (84 | ) | | (260,184 | ) |
| Income tax provision | — |
| | (3,677 | ) | | 3,677 |
| | — |
| — |
| | (1,637 | ) | | 1,637 |
| | — |
|
| Net loss | $ | (68,496 | ) | | $ | (2,738 | ) | | $ | (7,858 | ) | | $ | (79,092 | ) | $ | (200,581 | ) | | $ | (61,156 | ) | | $ | 1,553 |
| | $ | (260,184 | ) |
CHENIERE CORPUS CHRISTI HOLDINGS, LLC AND SUBSIDIARIES
NOTES TO CONSOLIDATED FINANCIAL STATEMENTS—CONTINUED
(unaudited)
|
| | | | | | | | | | | | | | | |
| Condensed Consolidating Statement of Operations |
| Six Months Ended June 30, 2018 |
| (in thousands) |
| | | | | | | | |
| | Parent Issuer | | Guarantors | | Eliminations | | Consolidated |
| | | | | | | | |
| Revenues | $ | — |
| | $ | — |
| | $ | — |
| | $ | — |
|
| | | | | | | | |
| Operating costs and expenses | | | | | | | |
| Cost of sales (excluding depreciation and amortization expense shown separately below) | — |
| | 1,147 |
| | — |
| | 1,147 |
|
| Operating and maintenance expense | — |
| | 1,953 |
| | — |
| | 1,953 |
|
| Operating and maintenance expense—affiliate | — |
| | 1,017 |
| | — |
| | 1,017 |
|
| Development expense | — |
| | 123 |
| | — |
| | 123 |
|
| General and administrative expense | 549 |
| | 1,486 |
| | — |
| | 2,035 |
|
| General and administrative expense—affiliate | — |
| | 998 |
| | — |
| | 998 |
|
| Depreciation and amortization expense | 25 |
| | 1,733 |
| | — |
| | 1,758 |
|
| Total operating costs and expenses | 574 |
| | 8,457 |
| | — |
| | 9,031 |
|
| | | | | | | | |
| Loss from operations | (574 | ) | | (8,457 | ) | | — |
| | (9,031 | ) |
| | | | | | | | |
| Other income (expense) | | | | | | | |
| Loss on modification or extinguishment of debt | (15,332 | ) | | — |
| | — |
| | (15,332 | ) |
| Derivative gain, net | 97,415 |
| | — |
| | — |
| | 97,415 |
|
| Other income (expense) | (43 | ) | | 7,753 |
| | (7,751 | ) | | (41 | ) |
| Total other income | 82,040 |
| | 7,753 |
| | (7,751 | ) | | 82,042 |
|
| | | | | | | | |
| Income (loss) before income taxes | 81,466 |
| | (704 | ) | | (7,751 | ) | | 73,011 |
|
| Income tax provision | — |
| | (1,225 | ) | | 1,225 |
| | — |
|
| Net income (loss) | $ | 81,466 |
| | $ | (1,929 | ) | | $ | (6,526 | ) | | $ | 73,011 |
|
|
| | | | | | | | | | | | | | | |
| Condensed Consolidating Statement of Cash Flows |
| Nine Months Ended September 30, 2018 |
| (in thousands) |
| | | | | | | | |
| | Parent Issuer | | Guarantors | | Eliminations | | Consolidated |
| Cash flows used in operating activities | $ | (8,075 | ) | | $ | (23,786 | ) | | $ | — |
| | $ | (31,861 | ) |
| | | | | | | | |
| Cash flows from investing activities | | | | | | | |
| Property, plant and equipment, net | (374,390 | ) | | (1,853,975 | ) | | — |
| | (2,228,365 | ) |
| Investments in subsidiaries | (1,876,013 | ) | | — |
| | 1,876,013 |
| | — |
|
| Other | — |
| | 3,705 |
| | — |
| | 3,705 |
|
| Net cash used in investing activities | (2,250,403 | ) | | (1,850,270 | ) | | 1,876,013 |
| | (2,224,660 | ) |
| | | | | | | | |
| Cash flows from financing activities | | | | | | | |
| Proceeds from issuances of debt | 2,276,800 |
| | — |
| | — |
| | 2,276,800 |
|
| Repayments of debt | (295,455 | ) | | — |
| | — |
| | (295,455 | ) |
| Debt issuance and deferred financing costs | (45,743 | ) | | — |
| | — |
| | (45,743 | ) |
| Debt extinguishment cost | (9,108 | ) | | — |
| | — |
| | (9,108 | ) |
| Capital contributions | 323,418 |
| | 1,876,013 |
| | (1,876,013 | ) | | 323,418 |
|
| Net cash provided by financing activities | 2,249,912 |
| | 1,876,013 |
| | (1,876,013 | ) | | 2,249,912 |
|
| | | | | | | | |
| Net increase (decrease) in cash, cash equivalents and restricted cash | (8,566 | ) | | 1,957 |
| | — |
| | (6,609 | ) |
| Cash, cash equivalents and restricted cash—beginning of period | 226,559 |
| | — |
| | — |
| | 226,559 |
|
| Cash, cash equivalents and restricted cash—end of period | $ | 217,993 |
| | $ | 1,957 |
| | $ | — |
| | $ | 219,950 |
|
Balances per Condensed Consolidating Balance Sheet:
|
| | | | | | | | | | | | | | | |
| | September 30, 2018 |
| | Parent Issuer | | Guarantors | | Eliminations | | Consolidated |
| Cash and cash equivalents | $ | — |
| | $ | — |
| | $ | — |
| | $ | — |
|
| Restricted cash | 217,993 |
| | 1,957 |
| | — |
| | 219,950 |
|
| Total cash, cash equivalents and restricted cash | $ | 217,993 |
| | $ | 1,957 |
| | $ | — |
| | $ | 219,950 |
|
CHENIERE CORPUS CHRISTI HOLDINGS, LLC AND SUBSIDIARIES
NOTES TO CONSOLIDATED FINANCIAL STATEMENTS—CONTINUED
(unaudited)
|
| | | | | | | | | | | | | | | |
| Condensed Consolidating Statement of Cash Flows |
| Six Months Ended June 30, 2019 |
| (in thousands) |
| | | | | | | | |
| | Parent Issuer | | Guarantors | | Eliminations | | Consolidated |
| Cash flows used in operating activities | $ | (16,351 | ) | | $ | (18,351 | ) | | $ | (18,284 | ) | | $ | (52,986 | ) |
| | | | | | | | |
| Cash flows from investing activities | | | | | | | |
| Property, plant and equipment, net | (87,327 | ) | | (752,171 | ) | | — |
| | (839,498 | ) |
| Investments in subsidiaries | (1,313,687 | ) | | — |
| | 1,313,687 |
| | — |
|
| Distributions received from affiliates | 521,518 |
| | — |
| | (521,518 | ) | | — |
|
| Other | — |
| | (2,143 | ) | | — |
| | (2,143 | ) |
| Net cash used in investing activities | (879,496 | ) | | (754,314 | ) | | 792,169 |
| | (841,641 | ) |
| | | | | | | | |
| Cash flows from financing activities | | | | | | | |
| Proceeds from issuances of debt | 1,371,674 |
| | — |
| | — |
| | 1,371,674 |
|
| Repayments of debt | (558,000 | ) | | — |
| | — |
| | (558,000 | ) |
| Debt issuance and deferred financing costs | (639 | ) | | — |
| | — |
| | (639 | ) |
| Capital contributions | 71,621 |
| | 1,313,687 |
| | (1,313,687 | ) | | 71,621 |
|
| Distributions | — |
| | (539,802 | ) | | 539,802 |
| | — |
|
| Net cash provided by financing activities | 884,656 |
| | 773,885 |
| | (773,885 | ) | | 884,656 |
|
| | | | | | | | |
| Net increase (decrease) in cash, cash equivalents and restricted cash | (11,191 | ) | | 1,220 |
| | — |
| | (9,971 | ) |
| Cash, cash equivalents and restricted cash—beginning of period | 282,248 |
| | 6,893 |
| | — |
| | 289,141 |
|
| Cash, cash equivalents and restricted cash—end of period | $ | 271,057 |
| | $ | 8,113 |
| | $ | — |
| | $ | 279,170 |
|
Balances per Condensed Consolidating Balance Sheet:
|
| | | | | | | | | | | | | | | |
| Condensed Consolidating Statement of Cash Flows |
| Nine Months Ended September 30, 2017 |
| (in thousands) |
| | | | | | | | |
| | Parent Issuer | | Guarantors | | Eliminations | | Consolidated |
| Cash flows used in operating activities | $ | (43,315 | ) | | $ | (8,266 | ) | | $ | — |
| | $ | (51,581 | ) |
| | | | | | | | |
| Cash flows from investing activities | | | | | | | |
| Property, plant and equipment, net | (227,143 | ) | | (1,402,030 | ) | | — |
| | (1,629,173 | ) |
| Investments in subsidiaries | (1,384,301 | ) | | — |
| | 1,384,301 |
| | — |
|
| Other | — |
| | 25,995 |
| | — |
| | 25,995 |
|
| Net cash used in investing activities | (1,611,444 | ) | | (1,376,035 | ) | | 1,384,301 |
| | (1,603,178 | ) |
| | | | | | | | |
| Cash flows from financing activities | | | | | | | |
| Proceeds from issuances of debt | 2,706,000 |
| | — |
| | — |
| | 2,706,000 |
|
| Repayments of debt | (1,436,050 | ) | | — |
| | — |
| | (1,436,050 | ) |
| Debt issuance and deferred financing costs | (23,309 | ) | | — |
| | — |
| | (23,309 | ) |
| Debt extinguishment cost | (29 | ) | | — |
| | — |
| | (29 | ) |
| Capital contributions | 254,120 |
| | 1,384,458 |
| | (1,384,458 | ) | | 254,120 |
|
| Distributions | — |
| | (157 | ) | | 157 |
| | — |
|
| Net cash provided by financing activities | 1,500,732 |
| | 1,384,301 |
| | (1,384,301 | ) | | 1,500,732 |
|
| | | | | | | | |
| Net decrease in cash, cash equivalents and restricted cash | (154,027 | ) | | — |
| | — |
| | (154,027 | ) |
| Cash, cash equivalents and restricted cash—beginning of period | 270,540 |
| | — |
| | — |
| | 270,540 |
|
| Cash, cash equivalents and restricted cash—end of period | $ | 116,513 |
| | $ | — |
| | $ | — |
| | $ | 116,513 |
|
|
| | | | | | | | | | | | | | | |
| | June 30, 2019 |
| | Parent Issuer | | Guarantors | | Eliminations | | Consolidated |
| Cash and cash equivalents | $ | — |
| | $ | — |
| | $ | — |
| | $ | — |
|
| Restricted cash | 271,057 |
| | 8,113 |
| | — |
| | 279,170 |
|
| Total cash, cash equivalents and restricted cash | $ | 271,057 |
| | $ | 8,113 |
| | $ | — |
| | $ | 279,170 |
|
CHENIERE CORPUS CHRISTI HOLDINGS, LLC AND SUBSIDIARIES
NOTES TO CONSOLIDATED FINANCIAL STATEMENTS—CONTINUED
(unaudited)
|
| | | | | | | | | | | | | | | |
| Condensed Consolidating Statement of Cash Flows |
| Six Months Ended June 30, 2018 |
| (in thousands) |
| | | | | | | | |
| | Parent Issuer | | Guarantors | | Eliminations | | Consolidated |
| Cash flows used in operating activities | $ | (5,975 | ) | | $ | (8,151 | ) | | $ | — |
| | $ | (14,126 | ) |
| | | | | | | | |
| Cash flows from investing activities | | | | | | | |
| Property, plant and equipment, net | (201,944 | ) | | (1,000,558 | ) | | — |
| | (1,202,502 | ) |
| Investments in subsidiaries | (1,005,925 | ) | | — |
| | 1,005,925 |
| | — |
|
| Other | — |
| | 3,789 |
| | — |
| | 3,789 |
|
| Net cash used in investing activities | (1,207,869 | ) | | (996,769 | ) | | 1,005,925 |
| | (1,198,713 | ) |
| | | | | | | | |
| Cash flows from financing activities | | | | | | | |
| Proceeds from issuances of debt | 1,675,800 |
| | — |
| | — |
| | 1,675,800 |
|
| Repayments of debt | (281,455 | ) | | — |
| | — |
| | (281,455 | ) |
| Debt issuance and deferred financing costs | (45,402 | ) | | — |
| | — |
| | (45,402 | ) |
| Debt extinguishment cost | (7,956 | ) | | — |
| | — |
| | (7,956 | ) |
| Capital contributions | 323,415 |
| | 1,005,925 |
| | (1,005,925 | ) | | 323,415 |
|
| Net cash provided by financing activities | 1,664,402 |
| | 1,005,925 |
| | (1,005,925 | ) | | 1,664,402 |
|
| | | | | | | | |
| Net increase in cash, cash equivalents and restricted cash | 450,558 |
| | 1,005 |
| | — |
| | 451,563 |
|
| Cash, cash equivalents and restricted cash—beginning of period | 226,559 |
| | — |
| | — |
| | 226,559 |
|
| Cash, cash equivalents and restricted cash—end of period | $ | 677,117 |
| | $ | 1,005 |
| | $ | — |
| | $ | 678,122 |
|
| |
| ITEM 2. | MANAGEMENT’S DISCUSSION AND ANALYSIS OF FINANCIAL CONDITION AND RESULTS OF OPERATIONS |
Information Regarding Forward-Looking Statements
This quarterly report contains certain statements that are, or may be deemed to be, “forward-looking statements.”statements” within the meaning of Section 27A of the Securities Act of 1933, as amended, and Section 21E of the Securities Exchange Act of 1934, as amended (the “Exchange Act”). All statements, other than statements of historical or present facts or conditions, included herein or incorporated herein by reference are “forward-looking statements.” Included among “forward-looking statements” are, among other things:
statements that we expect to commence or complete construction of our proposed LNG terminal, liquefaction facilities, pipeline facilities or other projects, or any expansions or portions thereof, by certain dates, or at all;
statements regarding future levels of domestic and international natural gas production, supply or consumption or future levels of LNG imports into or exports from North America and other countries worldwide or purchases of natural gas, regardless of the source of such information, or the transportation or other infrastructure or demand for and prices related to natural gas, LNG or other hydrocarbon products;
statements regarding any financing transactions or arrangements, or our ability to enter into such transactions;
statements relating to the construction of our Trains and pipeline, including statements concerning the engagement of any EPC contractor or other contractor and the anticipated terms and provisions of any agreement with any such EPC or other contractor, and anticipated costs related thereto;
statements regarding any SPA or other agreement to be entered into or performed substantially in the future, including any revenues anticipated to be received and the anticipated timing thereof, and statements regarding the amounts of total natural gas liquefaction or storage capacities that are, or may become, subject to contracts;
statements regarding counterparties to our commercial contracts, construction contracts, and other contracts;
statements regarding our planned development and construction of additional Trains and pipeline,pipelines, including the financing of such Trains;Trains and pipelines;
statements that our Trains, when completed, will have certain characteristics, including amounts of liquefaction capacities;
statements regarding our business strategy, our strengths, our business and operation plans or any other plans, forecasts, projections, or objectives, including anticipated revenues, capital expenditures, maintenance and operating costs and cash flows, any or all of which are subject to change;
statements regarding legislative, governmental, regulatory, administrative or other public body actions, approvals, requirements, permits, applications, filings, investigations, proceedings or decisions; and
any other statements that relate to non-historical or future information.
All of these types of statements, other than statements of historical or present facts or conditions, are forward-looking statements. In some cases, forward-looking statements can be identified by terminology such as “may,” “will,” “could,” “should,” “expect,” “plan,” “project,” “intend,“achieve,” “anticipate,” “believe,” “contemplate,” “continue,” “estimate,” “expect,” “intend,” “plan,” “potential,” “predict,” “potential,“project,” “pursue,” “target,” “continue,” the negative of such terms or other comparable terminology. The forward-looking statements contained in this quarterly report are largely based on our expectations, which reflect estimates and assumptions made by our management. These estimates and assumptions reflect our best judgment based on currently known market conditions and other factors. Although we believe that such estimates are reasonable, they are inherently uncertain and involve a number of risks and uncertainties beyond our control. In addition, assumptions may prove to be inaccurate. We caution that the forward-looking statements contained in this quarterly report are not guarantees of future performance and that such statements may not be realized or the forward-looking statements or events may not occur. Actual results may differ materially from those anticipated or implied in forward-looking statements as a result of a variety of factors described in this quarterly report and in the other reports and other information that we file with the SEC, including those discussed under “Risk Factors” in our annual report on Form 10-K for the year ended December 31, 20172018. All forward-looking statements attributable to us or persons acting on our behalf are expressly qualified in their entirety by these risk factors. These forward-looking statements speak only as of the date made, and other than as required by law, we undertake no obligation to update or revise any forward-looking statement or provide reasons why actual results may differ, whether as a result of new information, future events or otherwise.
Introduction
The following discussion and analysis presents management’s view of our business, financial condition and overall performance and should be read in conjunction with our Consolidated Financial Statements and the accompanying notes. This information is intended to provide investors with an understanding of our past performance, current financial condition and outlook for the future. Our discussion and analysis includes the following subjects:
Overview of Business
Overview of Significant Events
Liquidity and Capital Resources
Results of Operations
Off-Balance Sheet Arrangements
Summary of Critical Accounting Estimates
Recent Accounting Standards
Overview of Business
We were formed in September 2014 to develop, construct, operate, maintain and own natural gas liquefaction and export facilities (the “Liquefaction Facilities”) and a 23-mile natural gas supply pipeline that interconnects the Corpus Christi LNG terminal with several interstate and intrastate natural gas pipelines (the “Corpus Christi Pipeline” and together with the Liquefaction Facilities, the “Liquefaction Project”) near Corpus Christi, Texas, through our wholly-owned subsidiaries CCL and CCP, respectively. The liquefaction of natural gas into LNG allows it to be shipped economically from the United States where natural gas is abundant and inexpensive to produce to our international customers in areas where natural gas demand and infrastructure exist.
The Liquefaction Project is being developed in stages forwith the first phase being three Trains with expected aggregate nominal production capacity, which is prior to adjusting for planned maintenance, production reliability, potential overdesign and debottlenecking opportunities, of approximately 13.5 mtpa of LNG,(“Phase 1”), three LNG storage tanks with aggregate capacity of approximately 10.1 Bcfe and two marine berths that can each accommodate vessels with nominal capacity of up to 266,000 cubic meters. The first stage (“Stage 1”) includes Trains 1 and 2, two LNG storage tanks, one complete marine berth and a second partial berth and all of the Liquefaction Project’s necessary infrastructure facilities. The second stage (“Stage 2”) includes Train 3, one LNG storage tank and the completion of the second partial berth. The Liquefaction Project also includes the Corpus Christi Pipeline that will interconnect the Corpus Christi LNG terminal with several interstate and intrastate natural gas pipelines. Stages 1 and 2 are currently under construction, and construction of the Corpus Christi Pipeline was completed in the second quarter of 2018. Train 1 has commencedis operational, Train 2 is undergoing commissioning activities.and Train 3 is under construction. Each Train is expected to have a nominal production capacity, which is prior to adjusting for planned maintenance, production reliability, potential overdesign and debottlenecking opportunities, of approximately 4.5 mtpa of LNG per Train.
Overview of Significant Events
Our significant accomplishments since January 1, 20182019 and through the filing date of this Form 10-Q include the following:
StrategicOperational
As of July 31, 2019, over 40 cumulative LNG cargoes have been produced, loaded and exported from the Liquefaction Project.
In May 2018, Cheniere’s board of directors made a positive final investment decision with respect to StageJune 2019, first LNG production from Train 2 of the Liquefaction Project occurred, and issued a full notice to proceed to Bechtel Oil, Gas and Chemicals, Inc. (“Bechtel”) under the EPC contract for Stage 2.first commissioning cargo from Train 2 was exported.
In February 2018,2019, CCL entered into a 20-year SPA with PetroChina International Company Limited, a subsidiaryachieved substantial completion of China National Petroleum Corporation, forTrain 1 of the sale of LNG beginning in 2023.Liquefaction Project and commenced operating activities.
OperationalFinancial
In August 2018, feed gasJune 2019, the date of first commercial delivery was introducedreached under the 20-year SPAs with Endesa S.A. and PT Pertamina (Persero) relating to Train 1 of the Liquefaction Project as part of the commissioning process.
Financial
We completed the following debt transactions:Project.
| |
◦• | In May 2018,June 2019, we amended and restated our existing credit facilitiessubsidiaries, as guarantors, entered into a note purchase agreement (“CCH Note Purchase Agreement”) with Allianz Global Investors GmbH to issue an aggregate principal amount of $727 million of 4.80% Senior Secured Notes due 2039 (the “CCH Credit Facility”) to increase total commitments under the“2039 CCH Credit Facility to $6.1 billion. Borrowings will be used to fund a portionSenior Notes”), with closing and funding of the 2039 CCH Senior Notes |
costs of developing, constructing and placing into serviceconditional in part on the three Trains and the related facilities2039 CCH Senior Notes receiving at least two investment grade ratings within 18 months of the Liquefaction Project and for related business purposes.
In June 2018, we amended and restated our working capital facility (“CCH Working Capital Facility”) to increase total commitments underdate of the CCH Working Capital Facility to $1.2 billion. Borrowings will be used for certain working capital requirements related to developing and placing into operations the Liquefaction Project and for related business purposes.Note Purchase Agreement.
Liquidity and Capital Resources
The following table provides a summary of our liquidity position at SeptemberJune 30, 20182019 and December 31, 20172018 (in thousands):
| | | | September 30, | | December 31, | June 30, | | December 31, |
| | 2018 | | 2017 | 2019 | | 2018 |
| Cash and cash equivalents | $ | — |
| | $ | — |
| $ | — |
| | $ | — |
|
| Restricted cash designated for the Liquefaction Project | 219,950 |
| | 226,559 |
| 279,170 |
| | 289,141 |
|
| Available commitments under the following credit facilities: | | | | | | |
| CCH Credit Facility | 1,645,675 |
| | 2,086,714 |
| |
| CCH Working Capital Facility | 884,475 |
| | 186,422 |
| |
| Amended and restated CCH Credit Facility (“CCH Credit Facility”) | | — |
| | 981,675 |
|
| $1.2 billion CCH Working Capital Facility (“CCH Working Capital Facility”) | | 861,963 |
| | 716,475 |
|
For additional information regarding our debt agreements, see Note 6—9—Debt of our Notes to Consolidated Financial Statements in this quarterly report and Note 7—9—Debt of our Notes to Consolidated Financial Statements in our annual report on Form 10-K for the year ended December 31, 2017.2018.
Corpus Christi LNG Terminal
Liquefaction Facilities
TheWe are in various stages of constructing and operating the Liquefaction Project is being developed and constructed at the Corpus Christi LNG terminal. We have received authorization from the FERC to site, construct and operate Stages 1 and 2 of the Liquefaction Project. We achieved substantial completion of Train 1 of the Liquefaction Project and commenced operating activities in February 2019. The following table summarizes the overall project status of the Liquefaction Project as of SeptemberJune 30, 2018:2019:
| | | | Stage 1 | | Stage 2 | Stage 1 | | Stage 2 |
| Overall project completion percentage | 93.9% | | 36.3% | 99.5% | | 62.4% |
| Completion percentage of: | | | | |
| Engineering | 100% | | 79.2% | 100% | | 94.3% |
| Procurement | 100% | | 57.3% | 100% | | 92.5% |
| Subcontract work | 83.6% | | 5.8% | 96.4% | | 12.2% |
| Construction | 86.9% | | 5.9% | 99.2% | | 29.2% |
| Expected date of substantial completion | Train 1 | 1Q 2019 | | Train 3 | 2H 2021 | Train 2 | 3Q 2019 | | Train 3 | 2H 2021 |
| | Train 2 | 2H 2019 | | |
The DOE has authorized the export of domestically produced LNG by vessel from the Corpus Christi LNG terminal to FTA countries for a 25-year term and to non-FTA countries for a 20-year term up to a combined total of the equivalent of 767 Bcf/yr (approximately 15 mtpa) of natural gas. The terms of each of these authorizations begin on the earlier of the date of first export thereunder or the date specified in the particular order, which ranges from seven to 10 years from the date the order was issued.
Customers
CCL has entered into ten fixed-pricefixed price SPAs generally with terms of 20 years (plus extension rights) with nine third parties for Trains 1 through 3 of the Liquefaction Project to make available an aggregate amount of LNG that is between approximately 75% to 85% of the expected aggregate adjusted nominal production capacity of Trains 1 through 3.from these Trains. Under these ten SPAs, the customers will purchase LNG from CCL for a price consisting of a fixed fee per MMBtu of LNG (a portion of which is subject to annual adjustment for inflation) plus a variable fee per MMBtu of LNG equal to approximately 115% of Henry Hub. In certain circumstances, the customers may elect to cancel or suspend deliveries of LNG cargoes, in which case the customers would still be required to pay the fixed fee with respect to the contracted volumes that are not delivered as a result of such cancellation or suspension. We refer to the fee component that is applicable regardless of a cancellation or suspension of LNG cargo deliveries under the SPAs as the fixed fee component of the price under our SPAs. We refer to the fee component that is applicable only in connection with LNG cargo deliveries as the variable fee
component of the price under our SPAs. The variable fee under CCL’s SPAs entered into in connection with the development of the Liquefaction Project was sized at the time of entry into each SPA with the intent to cover the costs of gas purchases and transportation related to, and operating and maintenance costs to produce, the LNG to be sold under each such SPA. The SPAs and contracted volumes to be made available under the SPAs are not tied to a specific Train; however,
the term of each SPA generally commences upon the date of first commercial delivery for the applicable Train, as specified in each SPA.
In aggregate, the minimum fixed fee portion to be paid by the third-party SPA customers is approximately $550 million for Train 1, and increasing to approximately $1.4 billion for Train 2, in each case upon the date of first commercial delivery for the respective Train 2 and further increasing to approximately $1.8 billion following the substantial completion of Train 3 of the Liquefaction Project.
CCL expects to sell LNG that it produces that is in excess of the contract quantities committed under CCL’s third-party SPAs toIn addition, Cheniere Marketing International LLP (“Cheniere Marketing”), an indirect wholly-owned subsidiary of Cheniere.Cheniere, has entered into SPAs with CCL to purchase 15 TBtu per annum of LNG and any LNG produced by CCL in excess of that required for other customers at Cheniere Marketing’s option.
Natural Gas Transportation, Storage and Supply
To ensure CCL is able to transport adequate natural gas feedstock to the Corpus Christi LNG terminal, it has entered into transportation precedent agreements to secure firm pipeline transportation capacity with CCP and certain third-party pipeline companies. CCL has entered into a firm storage services agreement with a third party to assist in managing volatilityvariability in natural gas needs for the Liquefaction Project. CCL has also entered into enabling agreements and long-term natural gas supply contracts with third parties, and will continue to enter into such agreements, in order to secure natural gas feedstock for the Liquefaction Project. As of SeptemberJune 30, 2018,2019, CCL had secured up to approximately 2,6402,787 TBtu of natural gas feedstock through long-term natural gas supply contracts, a portion of which is subject to the achievement of certain project milestones and other conditions precedent.
Construction
CCL entered into separate lump sum turnkey contracts with Bechtel Oil, Gas and Chemicals, Inc. (“Bechtel”) for the engineering, procurement and construction of Stages 1 and 2 of the Liquefaction Project under which Bechtel charges a lump sum for all work performed and generally bears project cost risk unless certain specified events occur, in which case Bechtel may cause CCL to enter into a change order, or CCL agrees with Bechtel to a change order.
The total contract prices of the EPC contract for Stage 1 and the EPC contract for Stage 2, which do not include the Corpus Christi Pipeline, are approximately $7.8 billion and $2.4 billion, respectively, reflecting amounts incurred under change orders through SeptemberJune 30, 2018.2019. Total expected capital costs for Trains 1 through 3 are estimated to be between $11.0 billion and $12.0 billion before financing costs and between $15.0 billion and $16.0 billion after financing costs including, in each case, estimated owner’s costs and contingencies.
Pipeline Facilities
In December 2014, the FERC issued a certificate of public convenience and necessity under Section 7(c) of the Natural Gas Act of 1938, as amended, authorizing CCP to construct and operate the Corpus Christi Pipeline. The Corpus Christi Pipeline is designed to transport 2.25 Bcf/d of natural gas feedstock required by the Liquefaction Project from the existing regional natural gas pipeline grid. The construction of the Corpus Christi Pipeline commenced in January 2017 and was completed in the second quarter of 2018.
Capital Resources
We expect to finance the construction costs of the Liquefaction Project from one or more of the following: project financing, operating cash flows from CCL and CCP and equity contributions from Cheniere. We realized offsets to LNG terminal costs of $82.5 million in the six months ended June 30, 2019 that were related to the sale of commissioning cargoes because these amounts were earned or loaded prior to the start of commercial operations of Train 1 during the testing phase for its construction. The following table provides a summary of our capital resources from borrowings and available commitments for the Liquefaction Project, excluding any equity contributions, at SeptemberJune 30, 20182019 and December 31, 20172018 (in thousands):
| | | | | September 30, | | December 31, | | June 30, | | December 31, |
| | | 2018 | | 2017 | | 2019 | | 2018 |
| Senior notes (1) | | $ | 4,250,000 |
| | $ | 4,250,000 |
| | $ | 4,250,000 |
| | $ | 4,250,000 |
|
| Credit facilities outstanding balance (2) | | 4,491,737 |
| | 2,484,737 |
| | 6,137,412 |
| | 5,323,737 |
|
| Letters of credit issued (2) | | 315,525 |
| | 163,578 |
| | 338,037 |
| | 315,525 |
|
| Available commitments under credit facilities (2) | | 2,530,150 |
| | 2,273,136 |
| | 861,963 |
| | 1,698,150 |
|
Total capital resources from borrowings and available commitments | | $ | 11,587,412 |
| | $ | 9,171,451 |
| | $ | 11,587,412 |
| | $ | 11,587,412 |
|
| |
| (1) | Includes 7.000% Senior Secured Notes due 2024 (the “2024 CCH Senior Notes”), 5.875% Senior Secured Notes due 2025 (the “2025 CCH Senior Notes”) and 5.125% Senior Secured Notes due 2027 (the “2027 CCH Senior Notes”) (collectively, the “CCH Senior Notes”). |
| |
| (2) | Includes CCH Credit Facility and CCH Working Capital Facility. |
| |
| (3) | Does not include additional borrowings by our indirect parents which may be used for the Liquefaction Project. |
For additional information regarding our debt agreements related to the Liquefaction Project, see Note 6—9—Debt of our Notes to Consolidated Financial Statements in this quarterly report and Note 7—9—Debt of our Notes to the Consolidated Financial Statements in our annual report on Form 10-K for the year ended December 31, 2017.2018.
CCH Senior Notes
The CCH Senior Notes are jointly and severally guaranteed by our subsidiaries, CCL, CCP and CCP GP (each a “Guarantor” and collectively, the “Guarantors”).
The indenture governing the CCH Senior Notes (the “CCH Indenture”) contains customary terms and events of default and certain covenants that, among other things, limit our ability and the ability of our restricted subsidiaries to: incur additional indebtedness or issue preferred stock; make certain investments or pay dividends or distributions on membership interests or subordinated indebtedness or purchase, redeem or retire membership interests; sell or transfer assets, including membership or partnership interests of our restricted subsidiaries; restrict dividends or other payments by restricted subsidiaries to us or any of our restricted subsidiaries; incur liens; enter into transactions with affiliates; dissolve, liquidate, consolidate, merge, sell or lease all or substantially all of the properties or assets of us and our restricted subsidiaries taken as a whole; or permit any Guarantor to dissolve, liquidate, consolidate, merge, sell or lease all or substantially all of its properties and assets.
At any time prior to six months before the respective dates of maturity for each series of the CCH Senior Notes, we may redeem all or part of such series of the CCH Senior Notes at a redemption price equal to the “make-whole” price set forth in the CCH Indenture, plus accrued and unpaid interest, if any, to the date of redemption. We also may at any time within six months of the respective dates of maturity for each series of the CCH Senior Notes, redeem all or part of such series of the CCH Senior Notes, in whole or in part, at a redemption price equal to 100% of the principal amount of the CCH Senior Notes to be redeemed, plus accrued and unpaid interest, if any, to the date of redemption.
CCH Credit Facility
In May 2018, we amended and restated the CCH Credit Facility to increase total commitments under the CCH Credit Facility from $4.6 billion to $6.1 billion. Our obligations under the CCH Credit Facility are secured by a first priority lien on substantially all of our assets and the assets of our subsidiaries and by a pledge by CCH HoldCo I of its limited liability company interests in us. As of SeptemberJune 30, 20182019 and December 31, 2017,2018, we had $1.6 billionzero and $2.1$1.0 billion of available commitments and $4.5$6.1 billion and $2.5$5.2 billion of loans outstanding under the CCH Credit Facility, respectively.
The CCH Credit Facility matures on June 30, 2024, with principal payments due quarterly commencing on the earlier of (1) the first quarterly payment date occurring more than three calendar months following the completion of the Liquefaction Project as defined in the common terms agreement and (2) a set date determined by reference to the date under which a certain LNG buyer linked to the last Train of the Liquefaction Project to become operational is entitled to terminate its SPA for failure to achieve the
date of first commercial delivery for that agreement. Scheduled repayments will be based upon a 19-year tailored amortization, commencing the first full quarter after the completion of Trains 1 through 3 and designed to achieve a minimum projected fixed debt service coverage ratio of 1.50:1.
Under the CCH Credit Facility, we are required to hedge not less than 65% of the variable interest rate exposure of our senior secured debt. We are restricted from making certain distributions under agreements governing our indebtedness generally until, among other requirements, the completion of the construction of Trains 1 and 2through 3 of the Liquefaction Project, funding of a debt service reserve account equal to six months of debt service and achieving a historical debt service coverage ratio and fixed projected debt service coverage ratio of at least 1.25:1.00.
CCH Working Capital Facility
In June 2018, we amended and restated the CCH Working Capital Facility to increase total commitments under the CCH Working Capital Facility from $350 million to $1.2 billion. The CCH Working Capital Facility is intended to be used for loans (“CCH Working Capital Loans”), and the issuance of letters of credit as well as for swing line loans (“CCH Swing Line Loans”) for certain working capital requirements related to developing and placing into operations the Liquefaction Project and for related business purposes. Loans under the CCH Working Capital Facility are guaranteed by the Guarantors. We may, from time to time, request increases in the commitments under the CCH Working Capital Facility of up to the maximum allowed for working capital under the Common Terms Agreement that was entered into concurrently with the CCH Credit Facility. As of SeptemberJune 30, 20182019 and December 31, 2017,2018, we had $884.5$862.0 million and $186.4$716.5 million of available commitments, and $315.5$338.0 million and $163.6$315.5 million aggregate amount of issued letters of credit under the CCH Working Capital Facility, respectively. We did not have any amountsand zero and $168.0 million of loans outstanding under the CCH Working Capital Facility, as of both September 30, 2018 and December 31, 2017.respectively.
The CCH Working Capital Facility matures on June 29, 2023, and we may prepay the CCH Working Capital Loans, CCH Swing Line Loans and loans made in connection with a draw upon any letter of credit (“CCH LC Loans”) at any time without premium or penalty upon three business days’ notice and may re-borrow at any time. CCH LC Loans have a term of up to one year. CCH Swing Line Loans terminate upon the earliest of (1) the maturity date or earlier termination of the CCH Working Capital Facility, (2) the date that is 15 days after such CCH Swing Line Loan is made and (3) the first borrowing date for a CCH Working Capital Loan or CCH Swing Line Loan occurring at least four business days following the date the CCH Swing Line Loan is made. We are required to reduce the aggregate outstanding principal amount of all CCH Working Capital Loans to zero for a period of five consecutive business days at least once each year.
The CCH Working Capital Facility contains conditions precedent for extensions of credit, as well as customary affirmative and negative covenants. Our obligations under the CCH Working Capital Facility are secured by substantially all of our assets and the assets of the Guarantors as well as all of our membership interests and the membership interest in each of the Guarantors on a pari passu basis with the CCH Senior Notes and the CCH Credit Facility.
CCH Note Purchase Agreement
In June 2019, we entered into the CCH Note Purchase Agreement with Allianz Global Investors GmbH to issue an aggregate principal amount of $727 million of 4.80% Senior Secured Notes due 2039 (the “2039 CCH Senior Notes”), which will be jointly and severally guaranteed by the Guarantors. The conditions to closing and issuance of the 2039 CCH Senior Notes include the receipt of at least two investment grade ratings for the 2039 CCH Senior Notes, in addition to other customary conditions to closing. Pursuant to the CCH Note Purchase Agreement, we have up to 12 months, subject to a six-month extension at our option, to satisfy the conditions to closing and issuance. The net proceeds from the 2039 CCH Senior Notes will be used to repay a portion of our outstanding term loans and pay fees, costs and expenses incurred in connection with the repayment of such outstanding term loans and/or the transactions contemplated in the CCH Note Purchase Agreement.
Equity Contribution Agreement
In May 2018, we amended and restated the existing equity contribution agreement with Cheniere (the “Equity Contribution Agreement”) pursuant to which Cheniere agreed to provide cash contributions up to approximately $1.1 billion, not including $2.0 billion previously contributed under the original equity contribution agreement. As of SeptemberJune 30, 2018,2019, we have received $2.0 billion$71.6 million in contributions under the Equity Contribution Agreement. Cheniere willis only be required to make additional contributions under the Equity Contribution Agreement after the commitments under the CCH Credit Facility have been reduced to zero and to the extent cash flows from operations of the Liquefaction Project are unavailable for Liquefaction Project costs. In March 2017,
Cheniere entered into a $750 million senior secured revolving credit facility (the “CEI Revolving Credit Facility”). The proceeds of the CEI Revolving Credit Facility are available to Cheniere to back-stop its obligations under the Equity Contribution Agreement and for general corporate purposes.
Early Works Equity Contribution Agreement
In conjunction with the amendment and restatement of the Equity Contribution Agreement, we terminated the early works equity contribution agreement with Cheniere entered into in December 2017. Prior to termination in May 2018, we had received $250.0 million in contributions from Cheniere under the early works equity contribution agreement.
Restrictive Debt Covenants
As of SeptemberJune 30, 2018,2019, we were in compliance with all covenants related to our debt agreements.
Sources and Uses of Cash
The following table summarizes the sources and uses of our cash, cash equivalents and restricted cash for the ninesix months ended SeptemberJune 30, 20182019 and 20172018 (in thousands). The table presents capital expenditures on a cash basis; therefore, these amounts differ from the amounts of capital expenditures, including accruals, which are referred to elsewhere in this report. Additional discussion of these items follows the table.
| | | | Nine Months Ended September 30, | Six Months Ended June 30, |
| | 2018 | | 2017 | 2019 | | 2018 |
| Operating cash flows | $ | (31,861 | ) | | $ | (51,581 | ) | $ | (52,986 | ) | | $ | (14,126 | ) |
| Investing cash flows | (2,224,660 | ) | | (1,603,178 | ) | (841,641 | ) | | (1,198,713 | ) |
| Financing cash flows | 2,249,912 |
| | 1,500,732 |
| 884,656 |
| | 1,664,402 |
|
| | | | | | | |
| Net decrease in cash, cash equivalents and restricted cash | (6,609 | ) | | (154,027 | ) | |
| Net increase (decrease) in cash, cash equivalents and restricted cash | | (9,971 | ) | | 451,563 |
|
| Cash, cash equivalents and restricted cash—beginning of period | 226,559 |
| | 270,540 |
| 289,141 |
| | 226,559 |
|
| Cash, cash equivalents and restricted cash—end of period | $ | 219,950 |
| | $ | 116,513 |
| $ | 279,170 |
| | $ | 678,122 |
|
Operating Cash Flows
Operating cash net outflows during the ninesix months ended SeptemberJune 30, 2019 and 2018 and 2017 were $31.9$53.0 million and $51.6$14.1 million, respectively. The decreaseincrease in operating cash net outflows in 20182019 compared to 20172018 was primarily relateddue to decreasedincreased operating costs and expenses, partially offset by increased cash used for settlementreceipts from the sale of derivative instruments.LNG cargoes, as a result of the commencement of operations of Train 1 of the Liquefaction Project in March 2019.
Investing Cash Flows
Investing cash net outflows during the ninesix months ended SeptemberJune 30, 2019 and 2018 were $841.6 million and 2017 were $2.2 billion and $1.6 billion,$1,198.7 million, respectively, and were primarily used to fund the construction costs for the Liquefaction Project. These costs are capitalized as construction-in-process until achievement of substantial completion. In addition to cash outflows for construction costs for the Liquefaction Project, we received $3.7 million and $36.3 million during the nine months ended September 30, 2018 and 2017, respectively, from the return of collateral payments previously paid for the Liquefaction Project, which was offset by $10.3 million paid for infrastructure to support the Liquefaction Project in the nine months ended September 30, 2017.
Financing Cash Flows
Financing cash net inflows during the ninesix months ended SeptemberJune 30, 2019 were $884.7 million, primarily as a result of:
$981.7 million of borrowings under the CCH Credit Facility;
$390.0 million of borrowings and $558.0 million of repayments under the CCH Working Capital Facility; and
$71.6 million of equity contributions from Cheniere.
Financing cash net inflows during the six months ended June 30, 2018 were $2.2$1.7 billion, primarily as a result of:
•$2.31.7 billion of borrowings and $281.5 million of repayments under the CCH Credit Facility;
•$14.0 million of borrowings and $14.0 million of repayments under the CCH Working Capital Facility;
•
| |
| • | $45.4 million of costs related to up-front fees paid for the amendment and restatement of the CCH Credit Facility and the CCH Working Capital Facility; |
$45.7 million of debt issuance costs related to up-front fees paid upon the closing of these transactions;
•$9.18.0 million of debt extinguishment costs related to the repayment of the CCH Credit Facility;costs; and
•$323.4 million of equity contributions from Cheniere.
Financing cash inflows during the nine months ended September 30, 2017 were $1.5 billion, primarily as a result of:
•$1.2 billion of borrowings under the CCH Credit Facility;
issuance of aggregate principal amount of $1.5 billion of the 2027 CCH Senior Notes, which was used to prepay $1.4 billion of outstanding borrowings under the CCH Credit Facility;
$24.0 million of borrowings and $24.0 million of repayments made under the CCH Working Capital Facility;
•$23.3 million of debt issuance costs related to up-front fees paid upon the closing of these transactions; and
•$254.1 million of equity contributions from Cheniere.
Results of Operations
Our consolidated net incomeloss was $24.4$188.9 million in the three months ended SeptemberJune 30, 2018,2019, compared to a net lossincome of $8.6$7.3 million in the three months ended SeptemberJune 30, 2017.2018. This $33.0$196.2 million increasedecrease in net income in 20182019 was primarily athe result of increased derivative gain,loss, net, interest expense, net of capitalized interest, and decreased loss from operations.
Our consolidated net incomeloss was $97.4$260.2 million in the ninesix months ended SeptemberJune 30, 2018,2019, compared to a net lossincome of $79.1$73.0 million in the ninesix months ended SeptemberJune 30, 2017.2018. This $176.5$333.2 million increasedecrease in net income in 20182019 was primarily athe result of increased derivative gain,loss, net, decreased loss on modification or extinguishmentinterest expense, net of debtcapitalized interest, and decreased loss from operations.
Income (loss) fromWe enter into derivative instruments to manage our exposure to changing interest rates and commodity-related marketing and price risk. Derivative instruments are reported at fair value on our Consolidated Financial Statements. In some cases, the underlying transactions economically hedged receive accrual accounting treatment, whereby revenues and expenses are recognized only upon delivery, receipt or realization of the underlying transaction. Because the recognition of derivative instruments at fair value has the effect of recognizing gains or losses relating to future period exposure, use of derivative instruments may increase the volatility of our results of operations based on changes in market pricing, counterparty credit risk and other relevant factors.
Revenues
|
| | | | | | | | | | | | | | | | | | | | | | | |
| | Three Months Ended September 30, | | Nine Months Ended September 30, |
| (in thousands) | 2018 | | 2017 | | Change | | 2018 | | 2017 | | Change |
| Revenues | $ | — |
| | $ | — |
| | $ | ��� |
| | $ | — |
| | $ | — |
| | $ | — |
|
| | | | | | | | | | | |
|
|
| Operating and maintenance expense (recovery) | (9,477 | ) | | 533 |
| | (10,010 | ) | | (6,377 | ) | | 2,097 |
| | (8,474 | ) |
| Operating and maintenance expense—affiliate | 1,522 |
| | 1,504 |
| | 18 |
| | 2,539 |
| | 1,653 |
| | 886 |
|
| Development expense | 49 |
| | 82 |
| | (33 | ) | | 172 |
| | 497 |
| | (325 | ) |
| Development expense—affiliate | — |
| | — |
| | — |
| | — |
| | 8 |
| | (8 | ) |
| General and administrative expense | 1,479 |
| | 861 |
| | 618 |
| | 3,514 |
| | 3,824 |
| | (310 | ) |
| General and administrative expense—affiliate | 607 |
| | 289 |
| | 318 |
| | 1,605 |
| | 753 |
| | 852 |
|
| Depreciation and amortization expense | 3,488 |
| | 248 |
| | 3,240 |
| | 5,246 |
| | 537 |
| | 4,709 |
|
| Impairment expense and loss (gain) on disposal of assets | (13 | ) | | 2,059 |
| | (2,072 | ) | | (13 | ) | | 2,064 |
| | (2,077 | ) |
| Total expenses (recoveries) | (2,345 | ) |
| 5,576 |
|
| (7,921 | ) | | 6,686 |
|
| 11,433 |
|
| (4,747 | ) |
| | | | | | | | | | | |
|
|
| Income (loss) from operations | $ | 2,345 |
| | $ | (5,576 | ) | | $ | 7,921 |
| | $ | (6,686 | ) | | $ | (11,433 | ) | | $ | 4,747 |
|
|
| | | | | | | | | | | | | | | | | | | | | | | |
| | Three Months Ended June 30, | | Six Months Ended June 30, |
| (in thousands, except volumes) | 2019 | | 2018 | | Change | | 2019 | | 2018 | | Change |
| LNG revenues | $ | 118,525 |
| | $ | — |
| | $ | 118,525 |
| | $ | 131,581 |
| | $ | — |
| | $ | 131,581 |
|
| LNG revenues—affiliate | 181,548 |
| | — |
| | 181,548 |
| | 274,573 |
| | — |
| | 274,573 |
|
| Total revenues | $ | 300,073 |
| | $ | — |
| | $ | 300,073 |
| | $ | 406,154 |
| | $ | — |
| | $ | 406,154 |
|
| | | | | | | | | | | | |
| LNG volumes recognized as revenues (in TBtu) | 56 |
| | — |
| | 56 |
| | 77 |
| | — |
| | 77 |
|
During the three and six months ended June 30, 2019, we began recognizing LNG revenues from the Liquefaction Project following the substantial completion and the commencement of operating activities of Train 1 of the Liquefaction Project in February 2019. We expect our LNG revenues to increase in the future upon Trains 2 and 3 of the Liquefaction Project becoming operational. Also included in LNG revenues are gains and losses from derivative instruments, which include the realized value associated with a portion of derivative instruments that settle through physical delivery and the sale of natural gas procured for the liquefaction process.
Prior to substantial completion of a Train, amounts received from the sale of commissioning cargoes from that Train are offset against LNG terminal construction-in-process, because these amounts are earned or loaded during the testing phase for the construction of that Train. During the three months ended June 30, 2019, we realized offsets to LNG terminal costs of $8.3 million corresponding to 3 TBtu of LNG that were related to the sale of commissioning cargoes. During the six months ended June 30, 2019, we realized offsets to LNG terminal costs of $82.5 million corresponding to 18 TBtu of LNG that were related to the sale of commissioning cargoes. We did not realize any offsets to LNG terminal costs in the three and six months ended June 30, 2018.
Operating costs and expenses
|
| | | | | | | | | | | | | | | | | | | | | | | |
| | Three Months Ended June 30, | | Six Months Ended June 30, |
| (in thousands) | 2019 | | 2018 | | Change | | 2019 | | 2018 | | Change |
| Cost of sales | $ | 181,136 |
| | $ | 1,031 |
| | $ | 180,105 |
| | $ | 238,665 |
| | $ | 1,147 |
| | $ | 237,518 |
|
| Cost of sales—related party | 24,230 |
| | — |
| | 24,230 |
| | 35,753 |
| | — |
| | 35,753 |
|
| Operating and maintenance expense | 60,817 |
| | 1,103 |
| | 59,714 |
| | 92,672 |
| | 1,953 |
| | 90,719 |
|
| Operating and maintenance expense—affiliate | 15,459 |
| | 551 |
| | 14,908 |
| | 20,706 |
| | 1,017 |
| | 19,689 |
|
| Development expense | 532 |
| | 89 |
| | 443 |
| | 532 |
| | 123 |
| | 409 |
|
| Development expense—affiliate | 38 |
| | — |
| | 38 |
| | 38 |
| | — |
| | 38 |
|
| General and administrative expense | 1,542 |
| | 1,185 |
| | 357 |
| | 3,079 |
| | 2,035 |
| | 1,044 |
|
| General and administrative expense—affiliate | 2,407 |
| | 595 |
| | 1,812 |
| | 3,562 |
| | 998 |
| | 2,564 |
|
| Depreciation and amortization expense | 57,300 |
| | 1,387 |
| | 55,913 |
| | 79,624 |
| | 1,758 |
| | 77,866 |
|
| Impairment expense and loss on disposal of assets | — |
| | — |
| | — |
| | 313 |
| | — |
| | 313 |
|
| Total operating costs and expenses | $ | 343,461 |
|
| $ | 5,941 |
|
| $ | 337,520 |
| | $ | 474,944 |
|
| $ | 9,031 |
|
| $ | 465,913 |
|
Our loss from operations decreased $7.9 milliontotal operating costs and $4.7 millionexpenses increased during the three and ninesix months ended SeptemberJune 30, 2019 from the three and six months ended June 30, 2018, respectively,primarily as a result of the commencement of operations of Train 1 of the Liquefaction Project in February 2019.
Cost of sales increased during the three and six months ended June 30, 2019 from the comparable periodsthree and six months ended June 30, 2018, primarily related to the increase in 2017 primarilythe volume of natural gas feedstock related to our LNG sales due to the decreasecommencement of operations at the Liquefaction Project. Cost of sales includes costs incurred directly for the production and delivery of LNG from the Liquefaction Project, to the extent those costs are not utilized for the commissioning process. Cost of sales also includes gains and losses from derivatives associated with economic hedges to secure natural gas feedstock for the Liquefaction Project and costs associated with a portion of derivative instruments that settle through physical delivery and the sale of natural gas procured for the liquefaction process.
Operating and maintenance expense primarily includes costs associated with operating and maintaining the Liquefaction Project. The increase in operating and maintenance expense which resulted(including affiliates) during the three and six months ended June 30, 2019 from an increase in fair value of ourthe three and six months ended June 30, 2018 was primarily related to increased natural gas supply agreements due to favorable market shifts between the periods. This decrease in operatingtransportation and storage capacity demand charges, increased third-party service and maintenance expense was partially offset bycontract costs and increased depreciationpayroll and benefit costs of operations personnel, generally as a result of the commencement of operations at the Liquefaction Project. Operating and maintenance (including affiliates) also includes insurance and regulatory costs and other operating costs.
Depreciation and amortization expenses,expense increased during the three and six months ended June 30, 2019 from the three and six months ended June 30, 2018 as a result of commencing operations of Train 1 of the assets related toLiquefaction Project in February 2019 and completing construction of the Corpus Christi Pipeline in the second quarter of 2018, as the related assets began depreciating upon completion of the construction.reaching substantial completion.
Other expense (income)
| | | | Three Months Ended September 30, | | Nine Months Ended September 30, | Three Months Ended June 30, | | Six Months Ended June 30, |
| (in thousands) | 2018 | | 2017 | | Change | | 2018 | | 2017 | | Change | 2019 | | 2018 | | Change | | 2019 | | 2018 | | Change |
| Interest expense, net of capitalized interest | | $ | 73,052 |
| | $ | — |
| | $ | 73,052 |
| | $ | 84,810 |
| | $ | — |
| | $ | 84,810 |
|
| Loss on modification or extinguishment of debt | $ | — |
| | $ | — |
| | $ | — |
| | $ | 15,332 |
| | $ | 32,480 |
| | $ | (17,148 | ) | — |
| | 15,332 |
| | (15,332 | ) | | — |
| | 15,332 |
| | (15,332 | ) |
| Derivative loss (gain), net | (21,818 | ) | | 2,906 |
| | (24,724 | ) | | (119,233 | ) | | 35,002 |
| | (154,235 | ) | 73,821 |
| | (28,566 | ) | | 102,387 |
| | 108,908 |
| | (97,415 | ) | | 206,323 |
|
| Other expense (income) | (225 | ) | | 95 |
| | (320 | ) | | (184 | ) | | 177 |
| | (361 | ) | (1,354 | ) | | (26 | ) | | (1,328 | ) | | (2,324 | ) | | 41 |
| | (2,365 | ) |
| Total other expense (income) | $ | (22,043 | ) | | $ | 3,001 |
| | $ | (25,044 | ) | | $ | (104,085 | ) | | $ | 67,659 |
| | $ | (171,744 | ) | $ | 145,519 |
| | $ | (13,260 | ) | | $ | 158,779 |
| | $ | 191,394 |
| | $ | (82,042 | ) | | $ | 273,436 |
|
Interest expense, net of capitalized interest, increased during the three and six months ended June 30, 2019 compared to the three and six months ended June 30, 2018, primarily as a result of a decrease in the portion of total interest costs that could be capitalized due to the commencement of operations at the Liquefaction Project. For the three months ended June 30, 2019 and 2018, we incurred $138.0 million and $106.6 million of total interest cost, respectively, of which we capitalized $64.9 million and $106.6 million, respectively, primarily for the construction of the Liquefaction Project. For the six months ended June 30, 2019
and 2018, we incurred $270.6 million and $207.8 million of total interest cost, respectively, of which we capitalized $185.8 million and $207.8 million, respectively, primarily for the construction of the Liquefaction Project.
Loss on modification or extinguishment of debt decreased during the ninethree and six months ended SeptemberJune 30, 2018,2019, as compared to the ninethree and six months ended SeptemberJune 30, 2017.2018. Loss on modification or extinguishment of debt recognized in 2018 was attributable to $15.3 million of debt modification and extinguishment costs relatingrelated to the incurrence of third partythird-party fees and write offwrite-off of unamortized debt issuance costs as a result of the amendment and restatement of the CCH Credit Facility. Loss on modification or extinguishment of debt recognized in 2017 was attributable to the write-off of debt issuance costs of $32.5 million in May 2017 upon the prepayment of approximately $1.4 billion of outstanding borrowings under the CCH Credit Facility in connection with the issuance of the 2027 CCH Senior Notes.
Derivative gain,loss, net increased from a net loss during the three and ninesix months ended SeptemberJune 30, 20172019 compared to a net gain during the three and ninesix months ended SeptemberJune 30, 2018. The increase in derivative gain, net in 2018, as compared to derivative
loss, net in 2017 was primarily due to a favorablean unfavorable shift in the long-term forward LIBOR curve between the periods. During
Other income increased during the ninethree and six months ended SeptemberJune 30, 2019 as compared to the three and six months ended June 30, 2018, we also recognized a $4.8 million gainprimarily due to an increase in June 2018 upon the termination of interest rate swaps associated with the amendmentincome earned on our cash and restatement of the CCH Credit Facility. During the nine months ended September 30, 2017, we recognized a $13.0 million loss in May 2017 in conjunction with the termination of approximately $1.4 billion of commitments under the CCH Credit Facility.cash equivalents.
Off-Balance Sheet Arrangements
As of SeptemberJune 30, 2018,2019, we had no transactions that met the definition of off-balance sheet arrangements that may have a current or future material effect on our consolidated financial position or operating results.
Summary of Critical Accounting Estimates
The preparation of our Consolidated Financial Statements in conformity with GAAP requires management to make certain estimates and assumptions that affect the amounts reported in the Consolidated Financial Statements and the accompanying notes. There have been no significant changes to our critical accounting estimates from those disclosed in our annual report on Form 10-K for the year ended December 31, 20172018.
Recent Accounting Standards
ITEM 3. QUANTITATIVE AND QUALITATIVE DISCLOSURES ABOUT MARKET RISK
Marketing and Trading Commodity Price Risk
We have entered into commodity derivatives consisting of natural gas supply contracts for the commissioning and operation of the Liquefaction Project (“Liquefaction Supply Derivatives”). In order to test the sensitivity of the fair value of the Liquefaction Supply Derivatives to changes in underlying commodity prices, management modeled a 10% change in the commodity price for natural gas for each delivery location as follows (in thousands):
|
| | | | | | | | | | | | | | | |
| | September 30, 2018 | | December 31, 2017 |
| | Fair Value | | Change in Fair Value | | Fair Value | | Change in Fair Value |
| Liquefaction Supply Derivatives | $ | 9,265 |
| | $ | 4,496 |
| | $ | (91 | ) | | $ | 10 |
|
|
| | | | | | | | | | | | | | | |
| | June 30, 2019 | | December 31, 2018 |
| | Fair Value | | Change in Fair Value | | Fair Value | | Change in Fair Value |
| Liquefaction Supply Derivatives | $ | 7,858 |
| | $ | 4,265 |
| | $ | (68 | ) | | $ | 1,165 |
|
Interest Rate Risk
We are exposed to interest rate risk primarily when we incur debt related to project financing. Interest rate risk is managed in part by replacing outstanding floating-rate debt with fixed-rate debt with varying maturities. We have entered into interest rate swaps to hedge the exposure to volatility in a portion of the floating-rate interest payments under the CCH Credit Facility (“Interest Rate Derivatives”) and to hedge against changes in interest rates that could impact our anticipated future issuance of debt (“Interest Rate Forward Start Derivatives” and, collectively with the Interest Rate Derivatives, CCH Interest Rate Derivatives”). In order to test the sensitivity of the fair value of the Interest Rate Derivatives to changes in interest rates, management modeled a 10% change in the forward 1-monthone-month LIBOR curve across the remaining terms of the CCH Interest Rate Derivatives as follows (in thousands):
|
| | | | | | | | | | | | | | | |
| | September 30, 2018 | | December 31, 2017 |
| | Fair Value | | Change in Fair Value | | Fair Value | | Change in Fair Value |
| Interest Rate Derivatives | $ | 94,180 |
| | $ | 42,254 |
| | $ | (32,258 | ) | | $ | 43,994 |
|
|
| | | | | | | | | | | | | | | |
| | June 30, 2019 | | December 31, 2018 |
| | Fair Value | | Change in Fair Value | | Fair Value | | Change in Fair Value |
| Interest Rate Derivatives | $ | (88,187 | ) | | $ | 24,536 |
| | $ | 18,069 |
| | $ | 37,145 |
|
| Interest Rate Forward Start Derivatives | (6,640 | ) | | 19,772 |
| | — |
| | — |
|
| |
ITEM 4. | CONTROLS AND PROCEDURES |
We maintain a set of disclosure controls and procedures that are designed to ensure that information required to be disclosed by us in the reports voluntarily filed by us under the Securities Exchange Act, of 1934, as amended (the “Exchange Act”), is recorded, processed, summarized and reported within the time periods specified in the SEC’s rules and forms. As of the end of the period covered by this report, we evaluated, under the supervision and with the participation of our management, including our President and Chief Financial Officer, the effectiveness of our disclosure controls and procedures pursuant to Rule 13a-15 of the Exchange
Act. Based on that evaluation, our President and Chief Financial Officer concluded that our disclosure controls and procedures are effective.
During the most recent fiscal quarter, there have been no changes in our internal control over financial reporting that have materially affected, or are reasonably likely to materially affect, our internal control over financial reporting.
PART II. OTHER INFORMATION
We may in the future be involved as a party to various legal proceedings, which are incidental to the ordinary course of business. We regularly analyze current information and, as necessary, provide accruals for probable liabilities on the eventual disposition of these matters. There have been no material changes to the legal proceedings disclosed in our annual report on Form 10-K for the year ended December 31, 20172018.
|
| | |
| Exhibit No. | | Description |
| 10.1* | | Change orders to the Fixed Price Separated Turnkey Agreement for the Engineering, Procurement and Construction of the Corpus Christi Stage 1 Liquefaction Facility, dated as of December 6, 2013, between CCL and Bechtel Oil, Gas and Chemicals, Inc.: (i) the Change Order CO-00051 Fencing Scope Modifications, dated April 19, 2019 and (ii) Change Order CO-00052 West Jetty Manual Gas Sampler, dated April 19, 2019 (Portions of this exhibit have been omitted.) |
| 10.2* | | Change orders to the Amended and Restated Fixed Price Separated Turnkey Agreement for the Engineering, Procurement and Construction of the Corpus Christi Stage 2 Liquefaction Facility, dated as of December 12, 2017, between CCL and Bechtel Oil, Gas and Chemicals, Inc.: (i) the Change Order CO-00001 Stage 2 EPC Agreement Revised Table A-2,CO-000013 Section 232 Steel and Aluminum Tariffs & Anti-dumping (ADA) and Countervailing Duties (CVD), dated May 18, 2018,2, 2019, (ii) the Change Order CO-00002 Stage 2 EPC Agreement Amended and Restated Attachment C,CO-00014 Tank B Jump-over Tie-In Interface - Long Lead Items, dated May 18, 2018,2, 2019 and (iii) the Change Order CO-00003 Fuel Provisional Sum Adjustment,CO-00015 Section 232 Steel and Aluminum Tariffs & Anti-dumping (ADA) and Countervailing (CVD) Q1_2019, dated May 24, 2018, (iv) the Change Order CO-00004 Currency Provisional Sum Adjustment, dated May 29, 2018, (v) the Change Order CO-00005 JT Valve Modifications, dated July 10, 2018 and (vi) the Change Order CO-00006 Tank B Soil Conditions, International Building Code, and East Jetty Marine Facility Schedule Acceleration, dated September 5, 2018June 4, 2019 (Portions of this exhibit have been omitted and filed separately with the SEC pursuant to a request for confidential treatment.omitted.) |
| 31.1* | | |
| 32.1** | | |
| 101.INS* | | XBRL Instance Document - the instance document does not appear in the Interactive Data File because its XBRL tags are embedded within the Inline XBRL document. |
| 101.SCH* | | Inline XBRL Taxonomy Extension Schema Document |
| 101.CAL* | | Inline XBRL Taxonomy Extension Calculation Linkbase Document |
| 101.DEF* | | Inline XBRL Taxonomy Extension Definition Linkbase Document |
| 101.LAB* | | Inline XBRL Taxonomy Extension Labels Linkbase Document |
| 101.PRE* | | Inline XBRL Taxonomy Extension Presentation Linkbase Document |
|
| |
| * | Filed herewith. |
| ** | Furnished herewith. |
Pursuant to the requirements of the Securities Exchange Act of 1934, the registrant has duly caused this report to be signed on its behalf by the undersigned, thereunto duly authorized.
|
| | | |
| | | CHENIERE CORPUS CHRISTI HOLDINGS, LLC |
| | | | |
| Date: | NovemberAugust 7, 20182019 | By: | /s/ Michael J. Wortley |
| | | | Michael J. Wortley |
| | | | President and Chief Financial Officer |
| | | | (on behalf of the registrant and
as principal financial officer) |
| | | | |
| Date: | NovemberAugust 7, 20182019 | By: | /s/ Leonard E. Travis |
| | | | Leonard E. Travis |
| | | | Chief Accounting Officer |
| | | | (on behalf of the registrant and
as principal accounting officer) |