UNITED STATES
SECURITIES AND EXCHANGE COMMISSION
☒QUARTERLY REPORT PURSUANT TO SECTION 13 OR 15(d) OF THE SECURITIES EXCHANGE ACT OF 1934
For the quarterly period ended June 30, 2020March 31, 2021
or
☐TRANSITION REPORT PURSUANT TO SECTION 13 OR 15(d) OF THE SECURITIES EXCHANGE ACT OF 1934
For the transition period from to
Commission file number 333-215435
Cheniere Corpus Christi Holdings, LLC
(Exact name of registrant as specified in its charter) |
| | | | |
| Delaware | 47-1929160 |
| (State or other jurisdiction of incorporation or organization) | (I.R.S. Employer Identification No.) |
700 Milam Street,, Suite 1900
Houston,, Texas77002
(Address of principal executive offices) (Zip Code)
(713) (713) 375-5000
(Registrant’s telephone number, including area code) Securities registered pursuant to Section 12(b) of the Act:
|
| | | | | | | |
| Title of each class | Trading Symbol | Name of each exchange on which registered |
| None | None | None |
Indicate by check mark whether the registrant (1) has filed all reports required to be filed by Section 13 or 15(d) of the Securities Exchange Act of 1934 during the preceding 12 months (or for such shorter period that the registrant was required to file such reports), and (2) has been subject to such filing requirements for the past 90 days. Yes ☐ No ☒
Note: The registrant is a voluntary filer not subject to the filing requirementsrequirement of Sections 13 or 15(d) of the Securities Exchange Act of 1934. However, the registrant has filed all reports required pursuant to Sections 13 or 15(d) during the preceding 12 months as if the registrant was subject to such filing requirements.
Indicate by check mark whether the registrant has submitted electronically every Interactive Data File required to be submitted pursuant to Rule 405 of Regulation S-T (§232.405 of this chapter) during the preceding 12 months (or for such shorter period that the registrant was required to submit such files). Yes ☒ No ☐
Indicate by check mark whether the registrant is a large accelerated filer, an accelerated filer, a non-accelerated filer, a smaller reporting company, or an emerging growth company. See the definitions of “large accelerated filer,” “accelerated filer,” “smaller reporting company” and “emerging growth company” in Rule 12b-2 of the Exchange Act.
|
| | | | | | | | | | | | | | | | |
| Large accelerated filer | ☐ | | Accelerated filer | ☐ |
| Non-accelerated filer | ☒ | | Smaller reporting company | ☐ |
| | | | Emerging growth company | ☐ |
If an emerging growth company, indicate by check mark if the registrant has elected not to use the extended transition period for complying with any new or revised financial accounting standards provided pursuant to Section 13(a) of the Exchange Act. ☐
Indicate by check mark whether the registrant is a shell company (as defined in Rule 12b-2 of the Exchange Act). Yes ☐ No ☒
Indicate the number of shares outstanding of the issuer’s classes of common stock, as of the latest practicable date: Not applicable
CHENIERE CORPUS CHRISTI HOLDINGS, LLC
TABLE OF CONTENTS
DEFINITIONS
As used in this quarterly report, the terms listed below have the following meanings:
Common Industry and Other Terms
|
| | | | | | | |
| Bcf | | billion cubic feet |
| Bcf/d | | billion cubic feet per day |
| Bcf/yr | | billion cubic feet per year |
| Bcfe | | billion cubic feet equivalent |
| DOE | | U.S. Department of Energy |
| EPC | | engineering, procurement and construction |
| FERC | | Federal Energy Regulatory Commission |
| FTA countries | | countries with which the United States has a free trade agreement providing for national treatment for trade in natural gas |
| GAAP | | generally accepted accounting principles in the United States |
| Henry Hub | | the final settlement price (in USD per MMBtu) for the New York Mercantile Exchange’s Henry Hub natural gas futures contract for the month in which a relevant cargo’s delivery window is scheduled to begin |
| LIBOR | | London Interbank Offered Rate |
| LNG | | liquefied natural gas, a product of natural gas that, through a refrigeration process, has been cooled to a liquid state, which occupies a volume that is approximately 1/600th of its gaseous state |
| MMBtu | | million British thermal units, an energy unit |
| mtpa | | million tonnes per annum |
| | |
| non-FTA countries | | countries with which the United States does not have a free trade agreement providing for national treatment for trade in natural gas and with which trade is permitted |
| SEC | | U.S. Securities and Exchange Commission |
| SPA | | LNG sale and purchase agreement |
| TBtu | | trillion British thermal units, an energy unit |
| Train | | an industrial facility comprised of a series of refrigerant compressor loops used to cool natural gas into LNG |
Abbreviated Legal Entity Structure
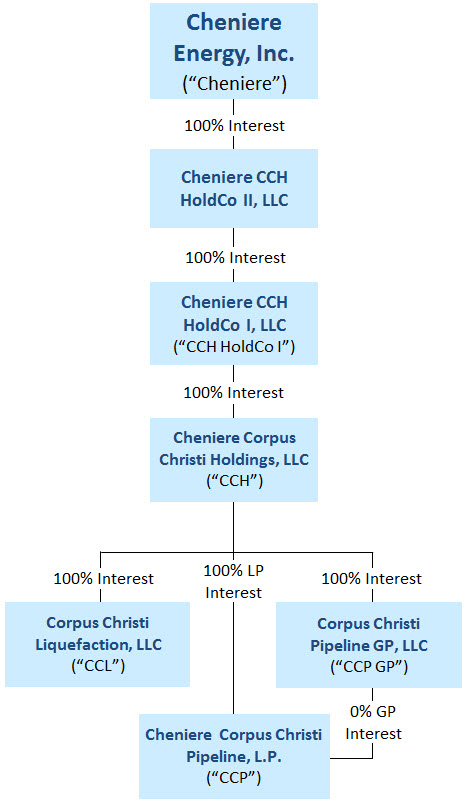
The following diagram depicts our abbreviated legal entity structure as of June 30, 2020,March 31, 2021, including our ownership of certain subsidiaries, and the references to these entities used in this quarterly report:
Unless the context requires otherwise, references to “CCH,” the “Company,” “we,” “us,” and “our” refer to Cheniere Corpus Christi Holdings, LLC and its consolidated subsidiaries.
| |
PART I. | FINANCIAL INFORMATION |
PART I. FINANCIAL INFORMATION
| |
ITEM 1. | ITEM 1. CONSOLIDATED FINANCIAL STATEMENTS |
CHENIERE CORPUS CHRISTI HOLDINGS, LLC AND SUBSIDIARIES
CONSOLIDATED BALANCE SHEETS
(in millions)
|
| | | | | | | | |
| | | June 30, | | December 31, |
| | | 2020 | | 2019 |
| ASSETS | | (unaudited) | | |
| Current assets | | | | |
| Cash and cash equivalents | | $ | — |
| | $ | — |
|
| Restricted cash | | 101 |
| | 80 |
|
| Accounts and other receivables | | 283 |
| | 58 |
|
| Accounts receivable—affiliate | | — |
| | 57 |
|
| Advances to affiliate | | 106 |
| | 115 |
|
| Inventory | | 75 |
| | 69 |
|
| Derivative assets | | 108 |
| | 74 |
|
| Derivative assets—related party | | 5 |
| | 3 |
|
| Other current assets | | 24 |
| | 15 |
|
| Total current assets | | 702 |
| | 471 |
|
| | | | | |
| Property, plant and equipment, net | | 12,546 |
| | 12,507 |
|
| Debt issuance and deferred financing costs, net | | 13 |
| | 15 |
|
| Non-current derivative assets | | 159 |
| | 61 |
|
| Non-current derivative assets—related party | | 2 |
| | 2 |
|
| Other non-current assets, net | | 73 |
| | 56 |
|
| Total assets | | $ | 13,495 |
| | $ | 13,112 |
|
| | | | | |
| LIABILITIES AND MEMBER’S EQUITY | | | | |
| Current liabilities | | | | |
| Accounts payable | | $ | 8 |
| | $ | 7 |
|
| Accrued liabilities | | 148 |
| | 370 |
|
| Accrued liabilities—related party | | 9 |
| | 3 |
|
| Current debt | | 141 |
| | — |
|
| Due to affiliates | | 20 |
| | 27 |
|
| Derivative liabilities | | 223 |
| | 46 |
|
| Other current liabilities | | 2 |
| | — |
|
| Other current liabilities—affiliate | | 1 |
| | 1 |
|
| Total current liabilities | | 552 |
| | 454 |
|
| | | | | |
| Long-term debt, net | | 10,106 |
| | 10,093 |
|
| Non-current derivative liabilities | | 160 |
| | 135 |
|
| Other non-current liabilities | | 9 |
| | 11 |
|
| Other non-current liabilities—affiliate | | — |
| | 1 |
|
| | | | | |
| Member’s equity | | 2,668 |
| | 2,418 |
|
| Total liabilities and member’s equity | | $ | 13,495 |
| | $ | 13,112 |
|
The accompanying notes are an integral part of these consolidated financial statements.
3
CHENIERE CORPUS CHRISTI HOLDINGS, LLC AND SUBSIDIARIES
CONSOLIDATED STATEMENTS OF OPERATIONS
(in millions)
(unaudited)
| | | | | | | | | | | | | | | | | |
| | | Three Months Ended March 31, |
| | | | | 2021 | | 2020 | | |
| Revenues | | | | | | | | | |
| LNG revenues | | | | | $ | 615 | | | $ | 343 | | | |
| LNG revenues—affiliate | | | | | 268 | | | 190 | | | |
| | | | | | | | | |
| Total revenues | | | | | 883 | | | 533 | | | |
| | | | | | | | | |
| Operating costs and expenses | | | | | | | | | |
| Cost of sales (excluding items shown separately below) | | | | | 186 | | | 49 | | | |
| Cost of sales—affiliate | | | | | 35 | | | 6 | | | |
| Cost of sales—related party | | | | | 35 | | | 23 | | | |
| Operating and maintenance expense | | | | | 83 | | | 89 | | | |
| Operating and maintenance expense—affiliate | | | | | 24 | | | 20 | | | |
| Operating and maintenance expense—related party | | | | | 2 | | | 0 | | | |
| | | | | | | | | |
| | | | | | | | | |
| General and administrative expense | | | | | 1 | | | 2 | | | |
| General and administrative expense—affiliate | | | | | 5 | | | 5 | | | |
| Depreciation and amortization expense | | | | | 89 | | | 84 | | | |
| | | | | | | | | |
| Total operating costs and expenses | | | | | 460 | | | 278 | | | |
| | | | | | | | | |
| Income from operations | | | | | 423 | | | 255 | | | |
| | | | | | | | | |
| Other income (expense) | | | | | | | | | |
| Interest expense, net of capitalized interest | | | | | (93) | | | (99) | | | |
| | | | | | | | | |
| Interest rate derivative gain (loss), net | | | | | 1 | | | (208) | | | |
| Other income, net | | | | | 0 | | | 1 | | | |
| Total other expense | | | | | (92) | | | (306) | | | |
| | | | | | | | | |
| | | | | | | | | |
| | | | | | | | | |
| | | | | | | | | |
| Net income (loss) | | | | | $ | 331 | | | $ | (51) | | | |
|
| | | | | | | | | | | | | | | |
| | Three Months Ended June 30, | | Six Months Ended June 30, |
| | 2020 | | 2019 | | 2020 | | 2019 |
| Revenues | | | | | | | |
| LNG revenues | $ | 610 |
| | $ | 118 |
| | $ | 953 |
| | $ | 131 |
|
| LNG revenues—affiliate | 44 |
| | 182 |
| | 234 |
| | 275 |
|
| Total revenues | 654 |
| | 300 |
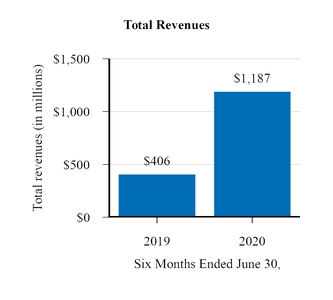
| | 1,187 |
| | 406 |
|
| | | | | | | | |
| Operating costs and expenses | | | | | | | |
| Cost of sales (excluding items shown separately below) | 140 |
| | 180 |
| | 189 |
| | 239 |
|
| Cost of sales—affiliate | 2 |
| | — |
| | 8 |
| | — |
|
| Cost of sales—related party | 25 |
| | 26 |
| | 48 |
| | 36 |
|
| Operating and maintenance expense | 95 |
| | 61 |
| | 184 |
| | 93 |
|
| Operating and maintenance expense—affiliate | 25 |
| | 16 |
| | 45 |
| | 21 |
|
| Operating and maintenance expense—related party | 2 |
| | — |
| | 2 |
| | — |
|
| Development expense | — |
| | 1 |
| | — |
| | 1 |
|
| General and administrative expense | 2 |
| | 1 |
| | 4 |
| | 3 |
|
| General and administrative expense—affiliate | 5 |
| | 2 |
| | 10 |
| | 3 |
|
| Depreciation and amortization expense | 86 |
| | 57 |
| | 170 |
| | 79 |
|
| Total operating costs and expenses | 382 |
| | 344 |
| | 660 |
| | 475 |
|
| | | | | | | | |
| Income (loss) from operations | 272 |
| | (44 | ) | | 527 |
| | (69 | ) |
| | | | | | | | |
| Other income (expense) | | | | | | | |
| Interest expense, net of capitalized interest | (90 | ) | | (73 | ) | | (189 | ) | | (85 | ) |
| Interest rate derivative loss, net | (25 | ) | | (74 | ) | | (233 | ) | | (109 | ) |
| Other income (expense), net | (1 | ) | | 2 |
| | — |
| | 3 |
|
| Total other expense | (116 | ) | | (145 | ) | | (422 | ) | | (191 | ) |
| | | | | | | | |
| Net income (loss) | $ | 156 |
| | $ | (189 | ) | | $ | 105 |
| | $ | (260 | ) |
The accompanying notes are an integral part of these consolidated financial statements.
3
CHENIERE CORPUS CHRISTI HOLDINGS, LLC AND SUBSIDIARIES
CONSOLIDATED BALANCE SHEETS
(in millions)
| | | | | | | | | | | | | | |
| | |
| | March 31, | | December 31, |
| | 2021 | | 2020 |
| ASSETS | | (unaudited) | | |
| Current assets | | | | |
| | | | |
| Restricted cash | | $ | 382 | | | $ | 70 | |
| Accounts and other receivables, net | | 169 | | | 198 | |
| Accounts receivable—affiliate | | 112 | | | 42 | |
| Advances to affiliate | | 101 | | | 144 | |
| Inventory | | 95 | | | 89 | |
| Derivative assets | | 26 | | | 10 | |
| Derivative assets—related party | | 5 | | | 3 | |
| Other current assets | | 12 | | | 17 | |
| Other current assets—affiliate | | 0 | | | 1 | |
| Total current assets | | 902 | | | 574 | |
| | | | |
| | | | |
| Property, plant and equipment, net | | 12,862 | | | 12,853 | |
| Debt issuance and deferred financing costs, net | | 10 | | | 11 | |
| Non-current derivative assets | | 98 | | | 114 | |
| Non-current derivative assets—related party | | 0 | | | 1 | |
| | | | |
| Other non-current assets, net | | 98 | | | 87 | |
| | | | |
| Total assets | | $ | 13,970 | | | $ | 13,640 | |
| | | | |
| LIABILITIES AND MEMBER’S EQUITY | | | | |
| Current liabilities | | | | |
| Accounts payable | | $ | 69 | | | $ | 19 | |
| | | | |
| Accrued liabilities | | 396 | | | 318 | |
| Accrued liabilities—related party | | 18 | | | 16 | |
| Current debt | | 151 | | | 269 | |
| Due to affiliates | | 44 | | | 32 | |
| Derivative liabilities | | 124 | | | 143 | |
| Other current liabilities | | 1 | | | 0 | |
| Other current liabilities—affiliate | | 1 | | | 0 | |
| Total current liabilities | | 804 | | | 797 | |
| | | | |
| Long-term debt, net | | 10,085 | | | 10,101 | |
| Non-current derivative liabilities | | 124 | | | 114 | |
| | | | |
| Other non-current liabilities | | 2 | | | 4 | |
| | | | |
| | | | |
| | | | |
| | | | |
| Member’s equity | | 2,955 | | | 2,624 | |
| Total liabilities and member’s equity | | $ | 13,970 | | | $ | 13,640 | |
The accompanying notes are an integral part of these consolidated financial statements.
4
CHENIERE CORPUS CHRISTI HOLDINGS, LLC AND SUBSIDIARIES
CONSOLIDATED STATEMENTS OF MEMBER’S EQUITY
(in millions)
(unaudited)
| | | | | | | | | | | |
| Three Months Ended March 31, 2021 | | | |
| Cheniere CCH HoldCo I, LLC | | Total Member’s Equity |
| | | |
| | | |
| | | |
| | | |
| | | |
| | | |
| | | |
| | | |
| Balance at December 31, 2020 | $ | 2,624 | | | $ | 2,624 | |
| | | |
| | | |
| | | |
| | | |
| | | |
| | | |
| | | |
| | | |
| | | |
| Net income | 331 | | | 331 | |
| Balance at March 31, 2021 | $ | 2,955 | | | $ | 2,955 | |
|
| | | | | | | |
| Three and Six Months Ended June 30, 2020 | | | |
| | Cheniere CCH HoldCo I, LLC | | Total Member’s Equity |
| Balance at December 31, 2019 | $ | 2,418 |
| | $ | 2,418 |
|
| Net loss | (51 | ) | | (51 | ) |
| Balance at March 31, 2020 | 2,367 |
| | 2,367 |
|
| Capital contributions | 145 |
| | 145 |
|
| Net income | 156 |
| | 156 |
|
| Balance at June 30, 2020 | $ | 2,668 |
| | $ | 2,668 |
|
| | | | | | | | | | | |
| Three Months Ended March 31, 2020 | | | |
| Cheniere CCH HoldCo I, LLC | | Total Member’s Equity |
| Balance at December 31, 2019 | $ | 2,418 | | | $ | 2,418 | |
| | | |
| Net loss | (51) | | | (51) | |
| Balance at March 31, 2020 | $ | 2,367 | | | $ | 2,367 | |
| | | |
| | | |
| | | |
| | | |
| | | |
| | | |
|
| | | | | | | |
| Three and Six Months Ended June 30, 2019 | | | |
| | Cheniere CCH HoldCo I, LLC | | Total Member’s Equity |
| Balance at December 31, 2018 | $ | 2,081 |
| | $ | 2,081 |
|
| Net loss | (71 | ) | | (71 | ) |
| Balance at March 31, 2019 | 2,010 |
| | 2,010 |
|
| Capital contributions | 72 |
| | 72 |
|
| Net loss | (189 | ) | | (189 | ) |
| Balance at June 30, 2019 | $ | 1,893 |
| | $ | 1,893 |
|
The accompanying notes are an integral part of these consolidated financial statements.
5
CHENIERE CORPUS CHRISTI HOLDINGS, LLC AND SUBSIDIARIES
CONSOLIDATED STATEMENTS OF CASH FLOWS
(in millions)
(unaudited)
| | | | | | | | | | | | | |
| Three Months Ended March 31, |
| 2021 | | 2020 | | |
| Cash flows from operating activities | | | | | |
| Net income (loss) | $ | 331 | | | $ | (51) | | | |
| Adjustments to reconcile net loss to net cash used in operating activities: | | | | | |
| Depreciation and amortization expense | 89 | | | 84 | | | |
| Amortization of discount and debt issuance costs | 5 | | | 5 | | | |
| | | | | |
| Total losses on derivatives, net | 9 | | | 37 | | | |
| Total gains on derivatives, net—related party | (1) | | | (1) | | | |
| Net cash used for settlement of derivative instruments | (18) | | | (3) | | | |
| | | | | |
| | | | | |
| Changes in operating assets and liabilities: | | | | | |
| Accounts receivable | 41 | | | (16) | | | |
| Accounts receivable—affiliate | (35) | | | 7 | | | |
| Advances to affiliate | 51 | | | 22 | | | |
| Inventory | (2) | | | 2 | | | |
| Accounts payable and accrued liabilities | 66 | | | 16 | | | |
| Accrued liabilities—related party | 1 | | | 5 | | | |
| Due to affiliates | (12) | | | (3) | | | |
| Other, net | (1) | | | (9) | | | |
| Other, net—affiliate | 0 | | | (1) | | | |
| Net cash provided by operating activities | 524 | | | 94 | | | |
| | | | | |
| Cash flows from investing activities | | | | | |
| Property, plant and equipment, net | (71) | | | (220) | | | |
| Other | (1) | | | (1) | | | |
| Net cash used in investing activities | (72) | | | (221) | | | |
| | | | | |
| Cash flows from financing activities | | | | | |
| Proceeds from issuances of debt | 0 | | | 141 | | | |
| Repayments of debt | (140) | | | 0 | | | |
| | | | | |
| | | | | |
| | | | | |
| | | | | |
| Net cash provided by (used in) financing activities | (140) | | | 141 | | | |
| | | | | |
| Net increase in restricted cash | 312 | | | 14 | | | |
| Restricted cash—beginning of period | 70 | | | 80 | | | |
| Restricted cash—end of period | $ | 382 | | | $ | 94 | | | |
|
| | | | | | | |
| | Six Months Ended June 30, |
| | 2020 | | 2019 |
| Cash flows from operating activities | | | |
| Net income (loss) | $ | 105 |
| | $ | (260 | ) |
| Adjustments to reconcile net loss to net cash used in operating activities: | | | |
| Depreciation and amortization expense | 170 |
| | 79 |
|
| Amortization of discount and debt issuance costs | 10 |
| | 5 |
|
| Total losses on derivatives, net | 90 |
| | 98 |
|
| Total losses (gains) on derivatives, net—related party | (2 | ) | | 3 |
|
| Net cash provided by (used for) settlement of derivative instruments | (20 | ) | | 4 |
|
| Other | — |
| | 1 |
|
| Changes in operating assets and liabilities: | | | |
| Accounts receivable | (225 | ) | | (39 | ) |
| Accounts receivable—affiliate | 57 |
| | (22 | ) |
| Advances to affiliate | 10 |
| | (31 | ) |
| Inventory | (6 | ) | | (31 | ) |
| Accounts payable and accrued liabilities | (67 | ) | | 134 |
|
| Accrued liabilities—related party | 6 |
| | 4 |
|
| Due to affiliates | (2 | ) | | 6 |
|
| Other, net | (39 | ) | | (4 | ) |
| Net cash provided by (used in) operating activities | 87 |
| | (53 | ) |
| | | | |
| Cash flows from investing activities | |
| | |
| Property, plant and equipment, net | (350 | ) | | (840 | ) |
| Other | (2 | ) | | (2 | ) |
| Net cash used in investing activities | (352 | ) | | (842 | ) |
| | | | |
| Cash flows from financing activities | |
| | |
| Proceeds from issuances of debt | 141 |
| | 1,372 |
|
| Repayments of debt | — |
| | (558 | ) |
| Debt issuance and deferred financing costs | — |
| | (1 | ) |
| Capital contributions | 145 |
| | 72 |
|
| Net cash provided by financing activities | 286 |
| | 885 |
|
| | | | |
| Net increase (decrease) in cash, cash equivalents and restricted cash | 21 |
| | (10 | ) |
| Cash, cash equivalents and restricted cash—beginning of period | 80 |
| | 289 |
|
| Cash, cash equivalents and restricted cash—end of period | $ | 101 |
| | $ | 279 |
|
Balances per Consolidated Balance Sheet:
|
| | | |
| | June 30, |
| | 2020 |
| Cash and cash equivalents | $ | — |
|
| Restricted cash | 101 |
|
| Total cash, cash equivalents and restricted cash | $ | 101 |
|
The accompanying notes are an integral part of these consolidated financial statements.
6
CHENIERE CORPUS CHRISTI HOLDINGS, LLC AND SUBSIDIARIES
NOTES TO CONSOLIDATED FINANCIAL STATEMENTS
(unaudited)
NOTE 1—NATURE OF OPERATIONS AND BASIS OF PRESENTATION
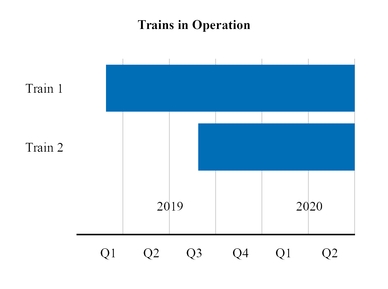
We are operating and constructing a natural gas liquefaction and export facility (the “Liquefaction Facilities”) and operating a 23-mile natural gas supply pipeline that interconnects the Corpus Christi LNG terminal with several interstate and intrastate natural gas pipelines (the “Corpus Christi Pipeline” and together with the Liquefaction Facilities, the “Liquefaction Project”) near Corpus Christi, Texas, through our subsidiaries CCL and CCP, respectively. We are currently operating 23 Trains, and 1 additionalincluding the third Train is undergoing commissioning which achieved substantial completion on March 26, 2021,for a total production capacity of approximately 15 mtpa of LNG. The Liquefaction Project once fully constructed, will containalso contains 3 LNG storage tanks and 2 marine berths.
Basis of Presentation
The accompanying unaudited Consolidated Financial Statements of CCH have been prepared in accordance with GAAP for interim financial information and with Rule 10-01 of Regulation S-X. Accordingly, they do not include all of the information and footnotes required by GAAP for complete financial statements and should be read in conjunction with the Consolidated Financial Statements and accompanying notes included in our annual report on Form 10-K for the fiscal year ended December 31, 2019.2020. In our opinion, all adjustments, consisting only of normal recurring adjustments necessary for a fair presentation, have been included. Certain reclassifications have been made to conform prior period information to the current presentation. The reclassifications did not have a material effect on our consolidated financial position, results of operations or cash flows.
Results of operations for the three and six months ended June 30, 2020March 31, 2021 are not necessarily indicative of the results of operations that will be realized for the year ending December 31, 2020.2021.
We are a disregarded entity for federal and state income tax purposes. Our taxable income or loss, which may vary substantially from the net income or loss reported on our Consolidated Statements of Operations, is included in the consolidated federal income tax return of Cheniere. Accordingly, no0 provision or liability for federal or state income taxes is included in the accompanying Consolidated Financial Statements.
Recent Accounting Standards
In March 2020, the Financial Accounting Standards Board (“FASB”) issued Accounting Standards Update (“ASU”) 2020-04, Reference Rate Reform (Topic 848): Facilitation of the Effects of Reference Rate Reform on Financial Reporting. This guidance primarily provides temporary optional expedients which simplify the accounting for contract modifications to existing debt agreements expected to arise from the market transition from LIBOR to alternative reference rates. The optional expedients were available to be used upon issuance of this guidance but we have not yet applied the guidance because we have not yet modified any of our existing contracts for reference rate reform. Once we apply an optional expedient to a modified contract and adopt this standard, the guidance will be applied to all subsequent applicable contract modifications until December 31, 2022, at which time the optional expedients are no longer available.
NOTE 2—RESTRICTED CASH
Restricted cash consists of funds that are contractually or legally restricted as to usage or withdrawal and have been presented separately from cash and cash equivalents on our Consolidated Balance Sheets. As of June 30, 2020March 31, 2021 and December 31, 2019,2020, we had $101$382 million and $80$70 million of current restricted cash, respectively.
Pursuant to the accounts agreement entered into with the collateral trustee for the benefit of our debt holders, we are required to deposit all cash received into reserve accounts controlled by the collateral trustee. The usage or withdrawal of such cash is restricted to the payment of liabilities related to the Liquefaction Project and other restricted payments.
CHENIERE CORPUS CHRISTI HOLDINGS, LLC AND SUBSIDIARIES
NOTES TO CONSOLIDATED FINANCIAL STATEMENTS—CONTINUED
(unaudited)
NOTE 3—ACCOUNTS AND OTHER RECEIVABLES
As of June 30, 2020March 31, 2021 and December 31, 2019,2020, accounts and other receivables, net consisted of the following (in millions):
| | | | | | | | | | | | | | |
| | |
| | March 31, | | December 31, |
| | 2021 | | 2020 |
| Trade receivable | | $ | 126 | | | $ | 182 | |
| Other accounts receivable | | 43 | | | 16 | |
| Total accounts and other receivables, net | | $ | 169 | | | $ | 198 | |
|
| | | | | | | | |
| | | June 30, | | December 31, |
| | | 2020 | | 2019 |
| Trade receivable | | $ | 222 |
| | $ | 44 |
|
| Other accounts receivable | | 61 |
| | 14 |
|
| Total accounts and other receivables | | $ | 283 |
| | $ | 58 |
|
NOTE 4—INVENTORY
As of June 30, 2020March 31, 2021 and December 31, 2019,2020, inventory consisted of the following (in millions):
| | | | | | | | | | | | | | |
| | |
| | March 31, | | December 31, |
| | 2021 | | 2020 |
| Materials | | $ | 76 | | | $ | 69 | |
| LNG | | 10 | | | 11 | |
| Natural gas | | 9 | | | 9 | |
| | | | |
| Total inventory | | $ | 95 | | | $ | 89 | |
|
| | | | | | | | |
| | | June 30, | | December 31, |
| | | 2020 | | 2019 |
| Natural gas | | $ | 6 |
| | $ | 7 |
|
| LNG | | 8 |
| | 6 |
|
| Materials and other | | 61 |
| | 56 |
|
| Total inventory | | $ | 75 |
| | $ | 69 |
|
NOTE 5—PROPERTY, PLANT AND EQUIPMENT
As of June 30, 2020March 31, 2021 and December 31, 2019,2020, property, plant and equipment, net consisted of the following (in millions):
| | | | | | | | | | | | | | |
| | |
| | March 31, | | December 31, |
| | 2021 | | 2020 |
| LNG terminal costs | | | | |
| LNG terminal and interconnecting pipeline facilities | | $ | 13,196 | | | $ | 10,176 | |
| LNG site and related costs | | 276 | | | 276 | |
| LNG terminal construction-in-process | | 35 | | | 2,960 | |
| Accumulated depreciation | | (654) | | | (568) | |
| Total LNG terminal costs, net | | 12,853 | | | 12,844 | |
| Fixed assets | | | | |
| Fixed assets | | 23 | | | 22 | |
| Accumulated depreciation | | (14) | | | (13) | |
| Total fixed assets, net | | 9 | | | 9 | |
| Property, plant and equipment, net | | $ | 12,862 | | | $ | 12,853 | |
|
| | | | | | | | |
| | | June 30, | | December 31, |
| | | 2020 | | 2019 |
| LNG terminal costs | | | | |
| LNG terminal and interconnecting pipeline facilities | | $ | 10,164 |
| | $ | 10,027 |
|
| LNG site and related costs | | 276 |
| | 276 |
|
| LNG terminal construction-in-process | | 2,495 |
| | 2,425 |
|
| Accumulated depreciation | | (399 | ) | | (232 | ) |
| Total LNG terminal costs, net | | 12,536 |
| | 12,496 |
|
| Fixed assets | | | | |
| Fixed assets | | 21 |
| | 19 |
|
| Accumulated depreciation | | (11 | ) | | (8 | ) |
| Total fixed assets, net | | 10 |
| | 11 |
|
| Property, plant and equipment, net | | $ | 12,546 |
| | $ | 12,507 |
|
DepreciationThe following table shows depreciation expense was $86 million and $57 millionoffsets to LNG terminal costs during the three months ended June 30,March 31, 2021 and 2020 and 2019, respectively, and $170 million and $79 million during the six months ended June 30, 2020 and 2019, respectively.(in millions):
| | | | | | | | | | | | | | | | | | | | |
| | | | Three Months Ended March 31, |
| | | | | | 2021 | | 2020 | | |
| Depreciation expense | | | | | | $ | 88 | | | $ | 84 | | | |
| Offsets to LNG terminal costs (1) | | | | | | 143 | | | 0 | | | |
(1) We realizedrecognize offsets to LNG terminal costs of $8 million and $82 million during the three and six months ended June 30, 2019, respectively, that were related to the sale of commissioning cargoes because these amounts were earned or loaded prior to the start of commercial operations of the Liquefaction Project during the testing phase for its construction. We did 0t realize any offsets to LNG terminal costs during the three and six months ended June 30, 2020.
CHENIERE CORPUS CHRISTI HOLDINGS, LLC AND SUBSIDIARIES
NOTES TO CONSOLIDATED FINANCIAL STATEMENTS—CONTINUED
(unaudited)
NOTE 6—DERIVATIVE INSTRUMENTS
We have entered into the following derivative instruments that are reported at fair value:
•interest rate swaps (“CCH Interest Rate Derivatives”) to hedge the exposure to volatility in a portion of the floating-rate interest payments on our amended and restated credit facility (the “CCH Credit Facility”) and to hedge against changes in interest rates that could impact anticipated future issuance of debt (“CCH Interest Rate Forward Start Derivatives” and, collectively with the CCH Interest Rate Derivatives, the “Interest Rate Derivatives”) and
CHENIERE CORPUS CHRISTI HOLDINGS, LLC AND SUBSIDIARIES
NOTES TO CONSOLIDATED FINANCIAL STATEMENTS—CONTINUED
(unaudited)
•commodity derivatives consisting of natural gas supply contracts for the commissioning and operation of the Liquefaction Project (“Physical Liquefaction Supply Derivatives”) and associated economic hedges (collectively,(“Financial Liquefaction Supply Derivatives,” and collectively with the Physical Liquefaction Supply Derivatives, the “Liquefaction Supply Derivatives”).
We recognize our derivative instruments as either assets or liabilities and measure those instruments at fair value. None of our derivative instruments are designated as cash flow or fair value hedging instruments, and changes in fair value are recorded within our Consolidated Statements of Operations to the extent not utilized for the commissioning process.
The following table shows the fair value of our derivative instruments that are required to be measured at fair value on a recurring basis as of June 30, 2020March 31, 2021 and December 31, 2019,2020, which are classified as derivative assets, derivative assets—related party, non-current derivative assets, non-current derivative assets—related party, derivative liabilities or non-current derivative liabilities in our Consolidated Balance Sheets (in millions):
| | | | | | | | | | | | | | | | | | | | | | | | | | | | | | | | | | | | | | | | | | | | | | | |
| Fair Value Measurements as of |
| March 31, 2021 | | December 31, 2020 |
| Quoted Prices in Active Markets
(Level 1) | | Significant Other Observable Inputs
(Level 2) | | Significant Unobservable Inputs
(Level 3) | | Total | | Quoted Prices in Active Markets
(Level 1) | | Significant Other Observable Inputs
(Level 2) | | Significant Unobservable Inputs
(Level 3) | | Total |
| CCH Interest Rate Derivatives liability | $ | 0 | | | $ | (114) | | | $ | 0 | | | $ | (114) | | | $ | 0 | | | $ | (140) | | | $ | 0 | | | $ | (140) | |
| | | | | | | | | | | | | | | |
| Liquefaction Supply Derivatives asset (liability) | 11 | | | (2) | | | (14) | | | (5) | | | 4 | | | (5) | | | 12 | | | 11 | |
| | | | | | | | | | | | | | | |
| | | | | | | | | | | | | | | |
|
| | | | | | | | | | | | | | | | | | | | | | | | | | | | | | | |
| | Fair Value Measurements as of |
| | June 30, 2020 | | December 31, 2019 |
| | Quoted Prices in Active Markets (Level 1) | | Significant Other Observable Inputs (Level 2) | | Significant Unobservable Inputs (Level 3) | | Total | | Quoted Prices in Active Markets (Level 1) | | Significant Other Observable Inputs (Level 2) | | Significant Unobservable Inputs (Level 3) | | Total |
| CCH Interest Rate Derivatives liability | $ | — |
| | $ | (191 | ) | | $ | — |
| | $ | (191 | ) | | $ | — |
| | $ | (81 | ) | | $ | — |
| | $ | (81 | ) |
| CCH Interest Rate Forward Start Derivatives liability | — |
| | (102 | ) | | — |
| | (102 | ) | | — |
| | (8 | ) | | — |
| | (8 | ) |
| Liquefaction Supply Derivatives asset | 9 |
| | 2 |
| | 173 |
| | 184 |
| | 3 |
| | 10 |
| | 35 |
| | 48 |
|
We value our Interest Rate Derivatives using an income-based approach utilizing observable inputs to the valuation model including interest rate curves, risk adjusted discount rates, credit spreads and other relevant data. We value our Liquefaction Supply Derivatives using a market-based approach incorporating present value techniques, as needed, using observable commodity price curves, when available, and other relevant data.
The fair value of our Physical Liquefaction Supply Derivatives is predominantly driven by observable and unobservable market commodity prices and, as applicable to our natural gas supply contracts, our assessment of the associated events deriving fair value, including evaluating whether the respective market is available as pipeline infrastructure is developed. The fair value of our Physical Liquefaction Supply Derivatives incorporates risk premiums related to the satisfaction of conditions precedent, such as completion and placement into service of relevant pipeline infrastructure to accommodate marketable physical gas flow. As of June 30, 2020March 31, 2021 and December 31, 2019,2020, some of our Physical Liquefaction Supply Derivatives existed within markets for which the pipeline infrastructure was under development to accommodate marketable physical gas flow.
We include a portion of our Physical Liquefaction Supply Derivatives as Level 3 within the valuation hierarchy as the fair value is developed through the use of internal models which incorporate significant unobservable inputs. In instances where observable data is unavailable, consideration is given to the assumptions that market participants would use in valuing the asset or liability. This includes assumptions about market risks, such as future prices of energy units for unobservable periods, liquidity, volatility and contract duration.
CHENIERE CORPUS CHRISTI HOLDINGS, LLC AND SUBSIDIARIES
NOTES TO CONSOLIDATED FINANCIAL STATEMENTS—CONTINUED
(unaudited)
The Level 3 fair value measurements of natural gas positions within our Physical Liquefaction Supply Derivatives could be materially impacted by a significant change in certain natural gas and international LNG prices. The following table includes quantitative information for the unobservable inputs for our Level 3 Physical Liquefaction Supply Derivatives as of June 30, 2020:March 31, 2021:
|
| | | | | | | | | | | | | | | | | | | | | | | | | |
| | Net Fair Value Asset Liability
(in millions) | | Valuation Approach | | Significant Unobservable Input | | Range of Significant Unobservable Inputs / Weighted Average (1) |
| Physical Liquefaction Supply Derivatives | | $173(14) | | Market approach incorporating present value techniques | | Henry Hub basis spread | | $(0.546)(0.577) - $0.172$0.265 / $(0.057)$(0.022) |
| | | | Option pricing model | | International LNG pricing spread, relative to Henry Hub (2) | | 46%130% - 158%205% / 105%160% |
(1) Unobservable inputs were weighted by the relative fair value of the instruments.
(2) Spread contemplates U.S. dollar-denominated pricing.
Increases or decreases in basis or pricing spreads, in isolation, would decrease or increase, respectively, the fair value of our Physical Liquefaction Supply Derivatives.
The following table shows the changes in the fair value of our Level 3 Physical Liquefaction Supply Derivatives, including those with related parties, during the three and six months ended June 30,March 31, 2021 and 2020 and 2019 (in millions):
| | | | | Three Months Ended June 30, | | Six Months Ended June 30, | | | Three Months Ended March 31, |
| | | 2020 | | 2019 | | 2020 | | 2019 | | | 2021 | | 2020 | |
| Balance, beginning of period | | $ | 202 |
| | $ | 2 |
| | $ | 35 |
| | $ | (4 | ) | Balance, beginning of period | | | $ | 12 | | | $ | 35 | | |
| Realized and mark-to-market gains: | | | | | | | | | |
| Realized and mark-to-market gains (losses): | | Realized and mark-to-market gains (losses): | | | | |
| Included in cost of sales | | (31 | ) | | 4 |
| | 134 |
| | 7 |
| Included in cost of sales | | | (66) | | | 164 | | |
| Purchases and settlements: | | | | | | | | | Purchases and settlements: | | | | |
| Purchases | | (3 | ) | | — |
| | (3 | ) | | 1 |
| Purchases | | | 3 | | | 1 | | |
| Settlements | | 2 |
| | (1 | ) | | 5 |
| | 2 |
| Settlements | | | 37 | | | 3 | | |
| Transfers into Level 3, net (1) | | 3 |
| | 1 |
| | 2 |
| | — |
| Transfers into Level 3, net (1) | | | 0 | | | (1) | | |
| Balance, end of period | | $ | 173 |
| | $ | 6 |
| | $ | 173 |
| | $ | 6 |
| Balance, end of period | | | $ | (14) | | | $ | 202 | | |
| Change in unrealized gains (losses) relating to instruments still held at end of period | | $ | (31 | ) | | $ | 4 |
| | $ | 134 |
| | $ | 7 |
| |
| Change in unrealized gain (loss) relating to instruments still held at end of period | | Change in unrealized gain (loss) relating to instruments still held at end of period | | | $ | (66) | | | $ | 164 | | |
(1) Transferred into Level 3 as a result of unobservable market, or out of Level 3 as a result of observable market for the underlying natural gas purchase agreements.
| |
(1) | Transferred into Level 3 as a result of unobservable market, or out of Level 3 as a result of observable market, for the underlying natural gas purchase agreements. |
Derivative assets and liabilities arising from our derivative contracts with the same counterparty are reported on a net basis, as allAll counterparty derivative contracts provide for the unconditional right of set-off in the event of default. We have elected to report derivative assets and liabilities arising from our derivative contracts with the same counterparty on a net basis. The use of derivative instruments exposes us to counterparty credit risk, or the risk that a counterparty will be unable to meet its commitments in instances when our derivative instruments are in an asset position. Additionally, counterparties are at risk that we will be unable to meet our commitments in instances where our derivative instruments are in a liability position. We incorporate both our own nonperformance risk and the respective counterparty’s nonperformance risk in fair value measurements. In adjusting the fair value of our derivative contracts for the effect of nonperformance risk, we have considered the impact of any applicable credit enhancements, such as collateral postings, set-off rights and guarantees.
Interest Rate Derivatives
We have entered into interest rate swaps to protect against volatility of future cash flows and hedge a portion of the variable interest payments on the CCH Credit Facility. We previously also had interest rate swaps to hedge against changes in interest rates that could impact anticipated future issuance of debt. In August 2020, we settled the outstanding CCH Interest Rate Forward Start Derivatives.
CHENIERE CORPUS CHRISTI HOLDINGS, LLC AND SUBSIDIARIES
NOTES TO CONSOLIDATED FINANCIAL STATEMENTS—CONTINUED
(unaudited)
Interest Rate Derivatives
As of June 30, 2020,March 31, 2021, we had the following Interest Rate Derivatives outstanding:
| | | | | | | | | | | | | | | | | | | | | | | | | | | | | | | | |
| | Notional Amounts | | | | | | |
| | March 31, 2021 | | December 31, 2020 | | Latest Maturity Date | | Weighted Average Fixed Interest Rate Paid | | Variable Interest Rate Received |
| CCH Interest Rate Derivatives | | $4.6 billion | | $4.6 billion | | May 31, 2022 | | 2.30% | | One-month LIBOR |
| | | | | | | | | | |
| | Notional Amounts | | | | | | |
| | June 30, 2020 | | December 31, 2019 | | Term | | Weighted Average Fixed Interest Rate Paid | | Variable Interest Rate Received |
CCH Interest Rate Derivatives | | $4.7 billion | | $4.5 billion | | May 31, 2022 (1) | | 2.30% | | One-month LIBOR |
CCH Interest Rate Forward Start Derivatives | | $250 million | | $250 million | | September 30, 2020 (2) | | 2.05% | | Three-month LIBOR |
CCH Interest Rate Forward Start Derivatives | | $500 million | | $500 million | | December 31, 2020 (2) | | 2.06% | | Three-month LIBOR |
(1) Represents the maturity date.
| |
(2) | Represents the effective date. These forward start derivatives have terms of 10 years with a mandatory termination date consistent with the effective date. |
The following table shows the fair value and location of our Interest Rate Derivatives on our Consolidated Balance Sheets (in millions):
|
| | | | | | | | | | | | | | | | | | | | | | | |
| | June 30, 2020 | | December 31, 2019 |
| | CCH Interest Rate Derivatives | | CCH Interest Rate Forward Start Derivatives | | Total | | CCH Interest Rate Derivatives | | CCH Interest Rate Forward Start Derivatives | | Total |
| Consolidated Balance Sheets Location | | | | | | | | | | | |
| Derivative liabilities | $ | (100 | ) | | $ | (102 | ) | | $ | (202 | ) | | $ | (32 | ) | | $ | (8 | ) | | $ | (40 | ) |
| Non-current derivative liabilities | (91 | ) | | — |
| | (91 | ) | | (49 | ) | | — |
| | (49 | ) |
| Total derivative liabilities | $ | (191 | ) |
| $ | (102 | ) |
| $ | (293 | ) |
| $ | (81 | ) |
| $ | (8 | ) |
| $ | (89 | ) |
The following table shows thegain (loss) from changes in the fair value and settlements of our Interest Rate Derivatives recorded in interest rate derivative loss,gain (loss), net on our Consolidated Statements of Operations during the three and six months ended June 30,March 31, 2021 and 2020 and 2019 (in millions):
|
| | | | | | | | | | | | | | | | |
| | | Three Months Ended June 30, | | Six Months Ended June 30, |
| | | 2020 | | 2019 | | 2020 | | 2019 |
| CCH Interest Rate Derivatives loss | | $ | (15 | ) | | $ | (67 | ) | | $ | (138 | ) | | $ | (102 | ) |
| CCH Interest Rate Forward Start Derivatives loss | | (10 | ) | | (7 | ) | | (95 | ) | | (7 | ) |
| | | | | | | | | | | | | | | | | | | | |
| | | | Three Months Ended March 31, |
| | | | | | 2021 | | 2020 | | |
| CCH Interest Rate Derivatives | | | | | | $ | 1 | | | $ | (123) | | | |
| CCH Interest Rate Forward Start Derivatives | | | | | | 0 | | | (85) | | | |
Liquefaction Supply Derivatives
CCL has entered into primarily index-based physical natural gas supply contracts and associated economic hedges to purchase natural gas for the commissioning and operation of the Liquefaction Project. The remaining terms of the physical natural gas supply contracts range up to 10 years, some of which commence upon the satisfaction of certain conditions precedent. The terms of the Financial Liquefaction Supply Derivatives range up to approximately three years.
The forward notional amount for our Liquefaction Supply Derivatives was approximately 3,0943,126 TBtu and 3,1533,152 TBtu as of June 30, 2020March 31, 2021 and December 31, 2019,2020, respectively, of which 9155 TBtu and 12060 TBtu, respectively, were for a natural gas supply contract CCL has with a related party.
CHENIERE CORPUS CHRISTI HOLDINGS, LLC AND SUBSIDIARIES
NOTES TO CONSOLIDATED FINANCIAL STATEMENTS—CONTINUED
(unaudited)
The following table shows the fair value and location of our Liquefaction Supply Derivatives on our Consolidated Balance Sheets (in millions):
|
| | | | | | | | |
| | | Fair Value Measurements as of (1) |
| Consolidated Balance Sheets Location | | June 30, 2020 | | December 31, 2019 |
| Derivative assets | | $ | 108 |
| | $ | 74 |
|
| Derivative assets—related party | | 5 |
| | 3 |
|
| Non-current derivative assets | | 159 |
| | 61 |
|
| Non-current derivative assets—related party | | 2 |
| | 2 |
|
| Total derivative assets | | 274 |
|
| 140 |
|
| | | | | |
| Derivative liabilities | | (21 | ) | | (6 | ) |
| Non-current derivative liabilities | | (69 | ) | | (86 | ) |
| Total derivative liabilities | | (90 | ) | | (92 | ) |
| | | | | |
| Derivative asset, net | | $ | 184 |
| | $ | 48 |
|
| |
(1) | Does not include collateral posted with counterparties by us of 0 and $5 million for such contracts, which are included in other current assets in our Consolidated Balance Sheets as of June 30, 2020 and December 31, 2019, respectively. |
The following table shows thegain (loss) from changes in the fair value, settlements and location of our Liquefaction Supply Derivatives recorded on our Consolidated Statements of Operations during the three and six months ended June 30,March 31, 2021 and 2020 and 2019 (in millions):
|
| | | | | | | | | | | | | | | | |
| | Consolidated Statements of Operations Location (1) | Three Months Ended June 30, | | Six Months Ended June 30, |
| | 2020 | | 2019 | | 2020 | | 2019 |
| Liquefaction Supply Derivatives loss | LNG revenues | $ | (10 | ) | | $ | (1 | ) | | $ | (10 | ) | | $ | — |
|
| Liquefaction Supply Derivatives gain (loss) | Cost of sales | (18 | ) | | 3 |
| | 153 |
| | 11 |
|
| Liquefaction Supply Derivatives gain (loss) | Cost of sales—related party | 1 |
| | (1 | ) | | 2 |
| | (3 | ) |
| | | | | | | | | | | | | | | | | | | | |
| Consolidated Statements of Operations Location (1) | | | Three Months Ended March 31, |
| | | | | 2021 | | 2020 | | |
| Liquefaction Supply Derivatives | LNG revenues | | | | | $ | 1 | | | $ | 0 | | | |
| Liquefaction Supply Derivatives | Cost of sales | | | | | (11) | | | 171 | | | |
| Liquefaction Supply Derivatives | Cost of sales—related party | | | | | 1 | | | 1 | | | |
(1) Does not include the realized value associated with derivative instruments that settle through physical delivery. Fair value fluctuations associated with commodity derivative activities are classified and presented consistently with the item economically hedged and the nature and intent of the derivative instrument.
CHENIERE CORPUS CHRISTI HOLDINGS, LLC AND SUBSIDIARIES
NOTES TO CONSOLIDATED FINANCIAL STATEMENTS—CONTINUED
(unaudited)
Fair Value and Location of Derivative Assets and Liabilities on the Consolidated Balance Sheets
The following table shows the fair value and location of our derivative instruments on our Consolidated Balance Sheets (in millions):
| | | | | | | | | | | | | | | | | | | |
| March 31, 2021 |
| CCH Interest Rate Derivatives | | | | Liquefaction Supply Derivatives (1) | | Total |
| Consolidated Balance Sheets Location | | | | | | | |
| Derivative assets | $ | 0 | | | | | $ | 26 | | | $ | 26 | |
| Derivative assets—related party | 0 | | | | | 5 | | | 5 | |
| Non-current derivative assets | 0 | | | | | 98 | | | 98 | |
| | | | | | | |
| Total derivative assets | 0 | | | | | 129 | | | 129 | |
| | | | | | | |
| Derivative liabilities | (98) | | | | | (26) | | | (124) | |
| Non-current derivative liabilities | (16) | | | | | (108) | | | (124) | |
| Total derivative liabilities | (114) | | | | | (134) | | | (248) | |
| | | | | | | |
| Derivative liability, net | $ | (114) | | | | | $ | (5) | | | $ | (119) | |
| | | | | | | |
| December 31, 2020 |
| CCH Interest Rate Derivatives | | | | Liquefaction Supply Derivatives (1) | | Total |
| Consolidated Balance Sheets Location | | | | | | | |
| Derivative assets | $ | 0 | | | | | $ | 10 | | | $ | 10 | |
| Derivative assets—related party | 0 | | | | | 3 | | | 3 | |
| Non-current derivative assets | 0 | | | | | 114 | | | 114 | |
| Non-current derivative assets—related party | 0 | | | | | 1 | | | 1 | |
| Total derivative assets | 0 | | | | | 128 | | | 128 | |
| | | | | | | |
| Derivative liabilities | (100) | | | | | (43) | | | (143) | |
| Non-current derivative liabilities | (40) | | | | | (74) | | | (114) | |
| Total derivative liabilities | (140) | | | | | (117) | | | (257) | |
| | | | | | | |
| Derivative asset (liability), net | $ | (140) | | | | | $ | 11 | | | $ | (129) | |
| |
(1) | Does not include the realized value associated with derivative instruments that settle through physical delivery. Fair value fluctuations associated with commodity derivative activities are classified and presented consistently with the item economically hedged and the nature and intent of the derivative instrument. |
(1) Does not include collateral posted with counterparties by us of 0 and $5 million, which are included in other current assets in our Consolidated Balance Sheets as of March 31, 2021 and December 31, 2020, respectively.
CHENIERE CORPUS CHRISTI HOLDINGS, LLC AND SUBSIDIARIES
NOTES TO CONSOLIDATED FINANCIAL STATEMENTS—CONTINUED
(unaudited)
Consolidated Balance Sheets Presentation
Our derivative instruments are presented on a net basis on our Consolidated Balance Sheets as described above. The following table shows the fair value of our derivatives outstanding on a gross and net basis (in millions):
| | | | | | | | | | | | | | | | |
| | CCH Interest Rate Derivatives | | | | Liquefaction Supply Derivatives |
| | | |
| As of March 31, 2021 | | | | | | |
| Gross assets | | $ | 0 | | | | | $ | 158 | |
| Offsetting amounts | | 0 | | | | | (29) | |
| Net assets | | $ | 0 | | | | | $ | 129 | |
| | | | | | |
| Gross liabilities | | $ | (114) | | | | | $ | (148) | |
| Offsetting amounts | | 0 | | | | | 14 | |
| Net liabilities | | $ | (114) | | | | | $ | (134) | |
| | | | | | |
| As of December 31, 2020 | | | | | | |
| Gross assets | | $ | 0 | | | | | $ | 132 | |
| Offsetting amounts | | 0 | | | | | (4) | |
| Net assets | | $ | 0 | | | | | $ | 128 | |
| | | | | | |
| Gross liabilities | | $ | (140) | | | | | $ | (136) | |
| Offsetting amounts | | 0 | | | | | 19 | |
| Net liabilities | | $ | (140) | | | | | $ | (117) | |
|
| | | | | | | | | | | | |
| | | Gross Amounts Recognized | | Gross Amounts Offset in the Consolidated Balance Sheets | | Net Amounts Presented in the Consolidated Balance Sheets |
| Offsetting Derivative Assets (Liabilities) | | | |
| As of June 30, 2020 | | | | | | |
| CCH Interest Rate Derivatives | | $ | (191 | ) | | $ | — |
| | $ | (191 | ) |
| CCH Interest Rate Forward Start Derivatives | | (102 | ) | | — |
| | (102 | ) |
| Liquefaction Supply Derivatives | | 283 |
| | (9 | ) | | 274 |
|
| Liquefaction Supply Derivatives | | (92 | ) | | 2 |
| | (90 | ) |
| As of December 31, 2019 | | | | | | |
| CCH Interest Rate Derivatives | | $ | (81 | ) | | $ | — |
| | $ | (81 | ) |
| CCH Interest Rate Forward Start Derivatives | | (8 | ) | | — |
| | (8 | ) |
| Liquefaction Supply Derivatives | | 145 |
| | (5 | ) | | 140 |
|
| Liquefaction Supply Derivatives | | (98 | ) | | 6 |
| | (92 | ) |
NOTE 7—OTHER NON-CURRENT ASSETS
As of March 31, 2021 and December 31, 2020, other non-current assets, net consisted of the following (in millions):
| | | | | | | | | | | | | | |
| | |
| | March 31, | | December 31, |
| | 2021 | | 2020 |
| Contract assets, net | | $ | 55 | | | $ | 48 | |
| Advances and other asset conveyances to third parties to support LNG terminal | | 20 | | | 22 | |
| Operating lease assets | | 5 | | | 5 | |
| Information technology service prepayments | | 3 | | | 3 | |
| Tax-related payments and receivables | | 2 | | | 3 | |
| Advances made under EPC and non-EPC contracts | | 4 | | | 0 | |
| Other | | 9 | | | 6 | |
| Total other non-current assets, net | | $ | 98 | | | $ | 87 | |
NOTE 8—ACCRUED LIABILITIES
As of March 31, 2021 and December 31, 2020, accrued liabilities consisted of the following (in millions):
| | | | | | | | | | | | | | |
| | |
| | March 31, | | December 31, |
| | 2021 | | 2020 |
| Interest costs and related debt fees | | $ | 105 | | | $ | 7 | |
| Accrued natural gas purchases | | 194 | | | 186 | |
| Liquefaction Project costs | | 82 | | | 76 | |
| Other | | 15 | | | 49 | |
| Total accrued liabilities | | $ | 396 | | | $ | 318 | |
CHENIERE CORPUS CHRISTI HOLDINGS, LLC AND SUBSIDIARIES
NOTES TO CONSOLIDATED FINANCIAL STATEMENTS—CONTINUED
(unaudited)
NOTE 7—OTHER NON-CURRENT ASSETS
As of June 30, 2020March 31, 2021 and December 31, 2019, other non-current assets, net consisted of the following (in millions):
|
| | | | | | | | |
| | | June 30, | | December 31, |
| | | 2020 | | 2019 |
| Advances and other asset conveyances to third parties to support LNG terminal | | $ | 20 |
| | $ | 19 |
|
| Operating lease assets | | 7 |
| | 7 |
|
| Tax-related payments and receivables | | 3 |
| | 3 |
|
| Information technology service prepayments | | 3 |
| | 3 |
|
| Advances made under EPC and non-EPC contracts | | — |
| | 14 |
|
| Contract assets, net | | 32 |
| | — |
|
| Other | | 8 |
| | 10 |
|
| Total other non-current assets, net | | $ | 73 |
| | $ | 56 |
|
NOTE 8—ACCRUED LIABILITIES
As of June 30, 2020, and December 31, 2019, accrued liabilities consisted of the following (in millions):
|
| | | | | | | | |
| | | June 30, | | December 31, |
| | | 2020 | | 2019 |
| Interest costs and related debt fees | | $ | 8 |
| | $ | 8 |
|
| Accrued natural gas purchases | | 71 |
| | 132 |
|
| Liquefaction Project costs | | 42 |
| | 192 |
|
| Other | | 27 |
| | 38 |
|
| Total accrued liabilities | | $ | 148 |
| | $ | 370 |
|
NOTE 9—DEBT
As of June 30, 2020 and December 31, 2019, our debt consisted of the following (in millions):
| | | | | | | | | | | | | | |
| | |
| | March 31, | | December 31, |
| | 2021 | | 2020 |
| Long-term debt: | | | | |
| | | | |
| | | | |
| | | | |
| | | | |
| | | | |
| | | | |
| | | | |
| | | | |
| 3.520% to 7.000% senior secured notes due between June 2024 and December 2039 and CCH Credit Facility | | $ | 10,195 | | | $ | 10,217 | |
| Unamortized debt issuance costs | | (110) | | | (116) | |
| Total long-term debt, net | | 10,085 | | | 10,101 | |
| | | | |
| Current debt: | | | | |
| $1.2 billion CCH Working Capital Facility (“CCH Working Capital Facility”) and current portion of CCH Credit Facility | | 153 | | | 271 | |
| Unamortized premium, discount and debt issuance costs, net | | (2) | | | (2) | |
| Total current debt | | 151 | | | 269 | |
| | | | |
| Total debt, net | | $ | 10,236 | | | $ | 10,370 | |
|
| | | | | | | | |
| | | June 30, | | December 31, |
| | | 2020 | | 2019 |
| Long-term debt | | | | |
| 7.000% Senior Secured Notes due 2024 (“2024 CCH Senior Notes”) | | $ | 1,250 |
| | $ | 1,250 |
|
| 5.875% Senior Secured Notes due 2025 (“2025 CCH Senior Notes”) | | 1,500 |
| | 1,500 |
|
| 5.125% Senior Secured Notes due 2027 (“2027 CCH Senior Notes”) | | 1,500 |
| | 1,500 |
|
| 3.700% Senior Secured Notes due 2029 (“2029 CCH Senior Notes”) | | 1,500 |
| | 1,500 |
|
| 4.80% Senior Secured Notes due 2039 (“4.80% CCH Senior Notes”) | | 727 |
| | 727 |
|
| 3.925% Senior Secured Notes due 2039 (“3.925% CCH Senior Notes”) | | 475 |
| | 475 |
|
| CCH Credit Facility | | 3,283 |
| | 3,283 |
|
| Unamortized debt issuance costs | | (129 | ) | | (142 | ) |
| Total long-term debt, net | | 10,106 |
|
| 10,093 |
|
| | | | | |
| Current debt | | | | |
| $1.2 billion CCH Working Capital Facility (“CCH Working Capital Facility”) | | 141 |
| | — |
|
| Total debt, net | | $ | 10,247 |
| | $ | 10,093 |
|
Credit Facilities
Below is a summary of our credit facilities outstanding as of March 31, 2021 (in millions):
| | | | | | | | | | | | | | |
| | CCH Credit Facility (1) | | CCH Working Capital Facility |
| Original facility size | | $ | 8,404 | | | $ | 350 | |
| Incremental commitments | | 1,566 | | | 850 | |
| Less: | | | | |
| Outstanding balance | | 2,627 | | | 0 | |
| Commitments terminated | | 7,343 | | | 0 | |
| Letters of credit issued | | 0 | | | 293 | |
| Available commitment | | $ | 0 | | | $ | 907 | |
| | | | |
| Priority ranking | | Senior secured | | Senior secured |
| Interest rate on available balance | | LIBOR plus 1.75% or base rate plus 0.75% | | LIBOR plus 1.25% - 1.75% or base rate plus 0.25% - 0.75% |
| Weighted average interest rate of outstanding balance | | 1.86% | | n/a |
| Maturity date | | June 30, 2024 | | June 29, 2023 |
Restrictive Debt Covenants
The indentures governing our senior notes and other agreements underlying our debt contain customary terms and events of default and certain covenants that, among other things, may limit us and our restricted subsidiaries’ ability to make certain investments or pay dividends or distributions.
As of March 31, 2021, we were in compliance with all covenants related to our debt agreements.
Interest Expense
Total interest expense, net of capitalized interest consisted of the following (in millions):
| | | | | | | | | | | | | | | | | |
| | | | Three Months Ended March 31, |
| | | | | 2021 | | 2020 | | |
| Total interest cost | | | | | $ | 119 | | | $ | 129 | | | |
| Capitalized interest, including amounts capitalized as an Allowance for Funds Used During Construction | | | | | (26) | | | (30) | | | |
| Total interest expense, net of capitalized interest | | | | | $ | 93 | | | $ | 99 | | | |
CHENIERE CORPUS CHRISTI HOLDINGS, LLC AND SUBSIDIARIES
NOTES TO CONSOLIDATED FINANCIAL STATEMENTS—CONTINUED
(unaudited)
Credit Facilities
Below is a summary of our credit facilities outstanding as of June 30, 2020 (in millions):
|
| | | | | | | | |
| | | CCH Credit Facility | | CCH Working Capital Facility |
| Original facility size | | $ | 8,404 |
| | $ | 350 |
|
| Incremental commitments | | 1,566 |
| | 850 |
|
| Less: | | | | |
| Outstanding balance | | 3,283 |
| | 141 |
|
| Commitments terminated | | 6,687 |
| | — |
|
| Letters of credit issued | | — |
| | 392 |
|
| Available commitment | | $ | — |
| | $ | 667 |
|
| | | | | |
| Interest rate on available balance | | LIBOR plus 1.75% or base rate plus 0.75% | | LIBOR plus 1.25% - 1.75% or base rate plus 0.25% - 0.75% |
| Weighted average interest rate of outstanding balance | | 1.93% | | 1.43% |
| Maturity date | | June 30, 2024 | | June 29, 2023 |
Restrictive Debt Covenants
As of June 30, 2020, we were in compliance with all covenants related to our debt agreements.
Interest Expense
Total interest expense, net of capitalized interest consisted of the following (in millions):
|
| | | | | | | | | | | | | | | |
| | Three Months Ended June 30, | | Six Months Ended June 30, |
| | 2020 | | 2019 | | 2020 | | 2019 |
| Total interest cost | $ | 119 |
| | $ | 138 |
| | $ | 248 |
| | $ | 271 |
|
| Capitalized interest, including amounts capitalized as an Allowance for Funds Used During Construction | (29 | ) | | (65 | ) | | (59 | ) | | (186 | ) |
| Total interest expense, net of capitalized interest | $ | 90 |
| | $ | 73 |
| | $ | 189 |
|
| $ | 85 |
|
Fair Value Disclosures
The following table shows the carrying amount and estimated fair value of our debt (in millions):
|
| | | | | | | | | | | | | | | | |
| | | June 30, 2020 | | December 31, 2019 |
| | | Carrying
Amount | | Estimated
Fair Value | | Carrying
Amount | | Estimated
Fair Value |
| Senior notes (1) | | $ | 5,750 |
| | $ | 6,282 |
| | $ | 5,750 |
| | $ | 6,329 |
|
| 4.80% CCH Senior Notes (2) | | 727 |
| | 841 |
| | 727 |
| | 830 |
|
| 3.925% CCH Senior Notes (2) | | 475 |
| | 502 |
| | 475 |
| | 495 |
|
| Credit facilities (3) | | 3,424 |
| | 3,424 |
| | 3,283 |
| | 3,283 |
|
| | | | | | | | | | | | | | | | | | | | | | | | | | |
| | | March 31, 2021 | | December 31, 2020 |
| | | Carrying
Amount | | Estimated
Fair Value | | Carrying
Amount | | Estimated
Fair Value |
| Senior notes — Level 2 (1) | | $ | 5,750 | | | $ | 6,466 | | | $ | 5,750 | | | $ | 6,669 | |
| Senior notes — Level 3 (2) | | 1,971 | | | 2,176 | | | 1,971 | | | 2,387 | |
| | | | | | | | |
| Credit facilities (3) | | 2,627 | | | 2,627 | | | 2,767 | | | 2,767 | |
| |
(1) | Includes 2024 CCH Senior Notes, 2025 CCH Senior Notes, 2027 CCH Senior Notes and 2029 CCH Senior Notes. The Level 2 estimated fair value was based on quotes obtained from broker-dealers or market makers of these senior notes and other similar instruments. |
| |
(2) | The Level 3 estimated fair value was calculated based on inputs that are observable in the market or that could be derived from, or corroborated with, observable market data, including interest rates based on debt issued by parties with comparable credit ratings to us and inputs that are not observable in the market. |
| |
(3) | Includes CCH Credit Facility and CCH Working Capital Facility. The Level 3 estimated fair value approximates the principal amount because the interest rates are variable and reflective of market rates and the debt may be repaid, in full or in part, at any time without penalty. |
(2)The Level 3 estimated fair value was calculated based on inputs that are observable in the market or that could be derived from, or corroborated with, observable market data, including interest rates based on debt issued by parties with comparable credit ratings to us and inputs that are not observable in the market.
CHENIERE CORPUS CHRISTI HOLDINGS, LLC AND SUBSIDIARIES
NOTES TO CONSOLIDATED FINANCIAL STATEMENTS—CONTINUED
(unaudited)
NOTE 10—REVENUES FROM CONTRACTS WITH CUSTOMERS
The following table represents a disaggregation of revenue earned from contracts with customers during the three and six months ended June 30,March 31, 2021 and 2020 and 2019 (in millions):
|
| | | | | | | | | | | | | | | | |
| | | Three Months Ended June 30, | | Six Months Ended June 30, |
| | | 2020 | | 2019 | | 2020 | | 2019 |
| LNG revenues (1) | | $ | 620 |
| | $ | 119 |
| | $ | 963 |
| | $ | 131 |
|
| LNG revenues—affiliate | | 44 |
| | 182 |
| | 234 |
| | 275 |
|
| Total revenues from customers | | 664 |
| | 301 |
| | 1,197 |
| | 406 |
|
| Net derivative losses (2) | | (10 | ) | | (1 | ) | | (10 | ) | | — |
|
| Total revenues | | $ | 654 |
| | $ | 300 |
| | $ | 1,187 |
| | $ | 406 |
|
| | | | | | | | | | | | | | | | | | | | |
| | | | Three Months Ended March 31, |
| | | | | | 2021 | | 2020 | | |
| LNG revenues (1) | | | | | | $ | 614 | | | $ | 343 | | | |
| LNG revenues—affiliate | | | | | | 268 | | | 190 | | | |
| Total revenues from customers | | | | | | 882 | | | 533 | | | |
| Net derivative losses (2) | | | | | | 1 | | | 0 | | | |
| Total revenues | | | | | | $ | 883 | | | $ | 533 | | | |
| |
(1) | (1)LNG revenues include revenues for LNG cargoes in which our customers exercised their contractual right to not take delivery but remained obligated to pay fixed fees irrespective of such election. During the three months ended March 31, 2020, we recognized $37 million in LNG revenues associated with LNG cargoes for which customers notified us that they would not take delivery, which would have been recognized subsequent to March 31, 2020 had the cargoes in which our customers exercised their contractual right to not take delivery but remained obligated to pay fixed fees irrespective of such election. LNG revenues during the three and six months ended June 30, 2020 included $299 million and $336 million, respectively, in revenues associated with LNG cargoes for which customers have notified us that they will not take delivery, of which $200 million would have otherwise been recognized subsequent to June 30, 2020, if the cargoes were lifted pursuant to the delivery schedules with the customers. LNG revenues during the three months ended June 30, 2020 excluded $37 million that would have otherwise been recognized during the quarter if the cargoes were lifted pursuant to the delivery schedules with the customers. We did 0t have such revenues during the three months ended March 31, 2021. Revenue is generally recognized upon receipt of irrevocable notice that a customer will not take delivery because our customers have no contractual right to take delivery of such LNG cargo in future periods and our performance obligations with respect to such LNG cargo have been satisfied.
|
Contract Assets
The following table shows our contract assets, net, which are classified as other non-current assets, net on our Consolidated Balance Sheets (in millions):
| | | | | | | | | | | | | | |
| | |
| | March 31, | | December 31, |
| | 2021 | | 2020 |
| Contract assets, net | | $ | 55 | | | $ | 48 | |
|
| | | | | | | | |
| | | June 30, | | December 31, |
| | | 2020 | | 2019 |
| Contract assets, net | | $ | 32 |
| | $ | — |
|
Contract assets represent our right to consideration for transferring goods or services to the customer under the terms of a sales contract when the associated consideration is not yet due. Changes in contract assets during the three months ended March 31, 2021 were primarily attributable to revenue recognized due to the delivery of LNG under certain SPAs for which the associated consideration was not yet due.
CHENIERE CORPUS CHRISTI HOLDINGS, LLC AND SUBSIDIARIES
NOTES TO CONSOLIDATED FINANCIAL STATEMENTS—CONTINUED
(unaudited)
Transaction Price Allocated to Future Performance Obligations
Because many of our sales contracts have long-term durations, we are contractually entitled to significant future consideration which we have not yet recognized as revenue. The following table discloses the aggregate amount of the transaction price that is allocated to performance obligations that have not yet been satisfied as of June 30, 2020March 31, 2021 and December 31, 2019:2020:
| | | | | | | | | | | | | | | | | | | | | | | | | | |
| | March 31, 2021 | | December 31, 2020 |
| | Unsatisfied
Transaction Price
(in billions) | | Weighted Average Recognition Timing (years) (1) | | Unsatisfied
Transaction Price
(in billions) | | Weighted Average Recognition Timing (years) (1) |
| LNG revenues | | $ | 32.0 | | | 10 | | $ | 32.3 | | | 10 |
| LNG revenues—affiliate | | 1.0 | | | 12 | | 1.0 | | | 12 |
| Total revenues | | $ | 33.0 | | | | | $ | 33.3 | | | |
|
| | | | | | | | | | | | |
| | | June 30, 2020 | | December 31, 2019 |
| | | Unsatisfied
Transaction Price
(in billions) | | Weighted Average Recognition Timing (years) (1) | | Unsatisfied
Transaction Price
(in billions) | | Weighted Average Recognition Timing (years) (1) |
| LNG revenues | | $ | 32.9 |
| | 10 | | $ | 33.6 |
| | 11 |
| LNG revenues—affiliate | | 1.0 |
| | 13 | | 1.0 |
| | 13 |
| Total revenues | | $ | 33.9 |
| | | | $ | 34.6 |
| | |
| |
(1) | (1) The weighted average recognition timing represents an estimate of the number of years during which we shall have recognized half of the unsatisfied transaction price. |
CHENIERE CORPUS CHRISTI HOLDINGS, LLC AND SUBSIDIARIES
NOTES TO CONSOLIDATED FINANCIAL STATEMENTS—CONTINUED
(unaudited)
We have elected the following exemptions which omit certain potential future sources of revenue from the table above:
| |
(1) | We omit from the table above all performance obligations that are part of a contract that has an original expected delivery duration of one year or less. |
| |
(2) | The table above excludes substantially all variable consideration under our SPAs. We omit from the table above all variable consideration that is allocated entirely to a wholly unsatisfied performance obligation or to a wholly unsatisfied promise to transfer a distinct good or service that forms part of a single performance obligation when that performance obligation qualifies as a series. The amount of revenue from variable fees that is not included in the transaction price will vary based on the future prices of Henry Hub throughout the contract terms, to the extent customers elect to take delivery of their LNG, and adjustments to the consumer price index. Certain of our contracts contain additional variable consideration based on the outcome of contingent events and the movement of various indexes. We have not included such variable consideration in the transaction price to the extent the consideration is considered constrained due to the uncertainty of ultimate pricing and receipt. Approximately 18% and 46% of our LNG revenues from contracts included in the table above during the three months ended June 30, 2020 and 2019, respectively, and approximately 24% and 46% of our LNG revenues from contracts included in the table above during the six months ended June 30, 2020 and 2019 were related to variable consideration received from customers. |
(1)We omit from the table above all performance obligations that are part of a contract that has an original expected duration of one year or less.
(2)The table above excludes substantially all variable consideration under our SPAs. We omit from the table above all variable consideration that is allocated entirely to a wholly unsatisfied performance obligation or to a wholly unsatisfied promise to transfer a distinct good or service that forms part of a single performance obligation when that performance obligation qualifies as a series. The amount of revenue from variable fees that is not included in the transaction price will vary based on the future prices of Henry Hub throughout the contract terms, to the extent customers elect to take delivery of their LNG, and adjustments to the consumer price index. Certain of our contracts contain additional variable consideration based on the outcome of contingent events and the movement of various indexes. We have not included such variable consideration in the transaction price to the extent the consideration is considered constrained due to the uncertainty of ultimate pricing and receipt. Approximately 47% and 36% of our LNG revenues from contracts included in the table above during the three months ended March 31, 2021 and 2020, respectively, were related to variable consideration received from customers.
We may enter into contracts to sell LNG that are conditioned upon one or both of the parties achieving certain milestones such as reaching a final investment decision on a certain liquefaction Train, obtaining financing or achieving substantial completion of a Train and any related facilities. These contracts are considered completed contracts for revenue recognition purposes and will beare included in the transaction price above when the conditions are considered probable of being met.
CHENIERE CORPUS CHRISTI HOLDINGS, LLC AND SUBSIDIARIES
NOTES TO CONSOLIDATED FINANCIAL STATEMENTS—CONTINUED
(unaudited)
NOTE 11—RELATED PARTY TRANSACTIONS
Below is a summary of our related party transactions as reported on our Consolidated Statements of Operations for the three and six months ended June 30,March 31, 2021 and 2020 and 2019 (in millions):
| | | | | | | | | | | | | | | | | | | | |
| | | Three Months Ended March 31, |
| | | | | 2021 | | 2020 | | |
| LNG revenues—affiliate | | | | | | | | | |
| Cheniere Marketing Agreements | | | | | $ | 260 | | | $ | 190 | | | |
| Contracts for Sale and Purchase of Natural Gas and LNG | | | | | 8 | | | 0 | | | |
| Total LNG revenues—affiliate | | | | | 268 | | | 190 | | | |
| | | | | | | | | | |
| | | | | | | | | | |
| | | | | | | | | |
| | | | | | | | | |
| Cost of sales—affiliate | | | | | | | | | |
| Contracts for Sale and Purchase of Natural Gas and LNG | | | | | 4 | | | 6 | | | |
| Cheniere Marketing Agreements | | | | | 31 | | | 0 | | | |
| Total cost of sales—affiliate | | | | | 35 | | | 6 | | | |
| | | | | | | | | |
| Cost of sales—related party | | | | | | | | | |
| Natural Gas Supply Agreement | | | | | 35 | | | 23 | | | |
| | | | | | | | | |
| | | | | | | | | |
| | | | | | | | | |
| Operating and maintenance expense—affiliate | | | | | | | | | |
| Services Agreements | | | | | 24 | | | 20 | | | |
| | | | | | | | | |
| | | | | | | | | |
| | | | | | | | | |
| | | | | | | | | |
| Operating and maintenance expense—related party | | | | | | | | | |
| Natural Gas Transportation Agreements | | | | | 2 | | | 0 | | | |
| | | | | | | | | |
| | | | | | | | | |
| | | | | | | | | |
| | | | | | | | | |
| General and administrative expense—affiliate | | | | | | | | | |
| Services Agreements | | | | | 5 | | | 5 | | | |
|
| | | | | | | | | | | | | | | | |
| | Three Months Ended June 30, | | Six Months Ended June 30, |
| | 2020 | | 2019 | | 2020 | | 2019 |
| LNG revenues—affiliate | | | | | | | |
| Cheniere Marketing Agreements | $ | 38 |
| | $ | 182 |
| | $ | 228 |
| | $ | 275 |
|
| Contracts for Sale and Purchase of Natural Gas and LNG | 6 |
| | — |
| | 6 |
| | — |
|
| Total LNG revenues—affiliate | 44 |
| | 182 |
| | 234 |
| | 275 |
|
| | | | | | | | |
| Cost of sales—affiliate | | | | | | | |
| Contracts for Sale and Purchase of Natural Gas and LNG | 2 |
| | — |
| | 8 |
| | — |
|
| | | | | | | | |
| Cost of sales—related party | | | | | | | |
| Natural Gas Supply Agreement | 25 |
| | 26 |
| | 48 |
| | 36 |
|
| | | | | | | | |
| Operating and maintenance expense—affiliate | | | | | | | |
| Services Agreements | 25 |
| | 16 |
| | 45 |
| | 21 |
|
| | | | | | | | |
| Operating and maintenance expense—related party | | | | | | | |
| Agreements with Midship Pipeline | 2 |
| | — |
| | 2 |
| | — |
|
| | | | | | | | |
| General and administrative expense—affiliate | | | | | | | |
| Services Agreements | 5 |
| | 2 |
| | 10 |
| | 3 |
|
We had $20$44 million and $27$32 million due to affiliates as of June 30, 2020March 31, 2021 and December 31, 2019,2020, respectively, under agreements with affiliates, as described below.
CHENIERE CORPUS CHRISTI HOLDINGS, LLC AND SUBSIDIARIES
NOTES TO CONSOLIDATED FINANCIAL STATEMENTS—CONTINUED
(unaudited)
Cheniere Marketing Agreements
Cheniere Marketing SPA
CCL has a fixed price SPA with Cheniere Marketing (the “Cheniere Marketing Base SPA”) with a term of 20 years which allows Cheniere Marketing to purchase, at its option, (1) up to a cumulative total of 150 TBtu of LNG within the commissioning periods for Trains 1 through 3 and (2) any excess LNG produced by the Liquefaction Facilities that is not committed to customers under third-party SPAs. Under the Cheniere Marketing Base SPA, Cheniere Marketing may, without charge, elect to suspend deliveries of cargoes (other than commissioning cargoes) scheduled for any month under the applicable annual delivery program by providing specified notice in advance. Additionally, CCL has: (1) a fixed price SPA with an approximate term of 23 years with Cheniere Marketing which allows them to purchase volumes of approximately 15 TBtu per annum of LNG and (2) an SPA for approximately 44 TBtu of LNG with a term of up to seven years associated with the integrated production marketing gas supply agreement between CCL and EOG Resources, Inc. As of June 30, 2020March 31, 2021 and December 31, 2019,2020, CCL had 0$109 million and $57$39 million of accounts receivable—affiliate, respectively, under these agreements with Cheniere Marketing.
Train 3 Commissioning Letter Agreement
Under the Cheniere Marketing Base SPA, CCL entered into a letter agreement with Cheniere Marketing for the sale of commissioning cargoes from Train 3 of the Liquefaction Project. Under the agreement, CCL paid a one-time shipping fee to Cheniere Marketing of $1 million after the commencement of the commissioning of Train 3 in December 2020.
CHENIERE CORPUS CHRISTI HOLDINGS, LLC AND SUBSIDIARIES
NOTES TO CONSOLIDATED FINANCIAL STATEMENTS—CONTINUED
(unaudited)
Facility Swap Agreement
We have entered into an arrangement with subsidiaries of Cheniere to provide the ability, in limited circumstances, to potentially fulfill commitments to LNG buyers in the event operational conditions impact operations at either the Sabine Pass or Corpus Christi liquefaction facilities. The purchase price for such cargoes would be (i) 115% of the applicable natural gas feedstock purchase price or (ii) a free-on-board U.S. Gulf Coast LNG market price, whichever is greater.
Services Agreements
Gas and Power Supply Services Agreement (“G&P Agreement”)
CCL has a G&P Agreement with Cheniere Energy Shared Services, Inc. (“Shared Services”), a wholly owned subsidiary of Cheniere, pursuant to which Shared Services will manage the gas and power procurement requirements of CCL. The services include, among other services, exercising the day-to-day management of CCL’s natural gas and power supply requirements, negotiating agreements on CCL’s behalf and providing other administrative services. Prior to the substantial completion of each Train of the Liquefaction Facilities, no monthly fee payment is required except for reimbursement of operating expenses. After substantial completion of each Train of the Liquefaction Facilities, for services performed while the Liquefaction Facilities is operational, CCL will pay, in addition to the reimbursement of operating expenses, a fixed monthly fee of $125,000 (indexed for inflation) for services with respect to such Train.
Operation and Maintenance Agreements (“O&M Agreements”)
CCL has an O&M Agreement (“CCL O&M Agreement”) with Cheniere LNG O&M Services, LLC (“O&M Services”), a wholly owned subsidiary of Cheniere, pursuant to which CCL receives all of the necessary services required to construct, operate and maintain the Liquefaction Facilities. The services to be provided include, among other services, preparing and maintaining staffing plans, identifying and arranging for procurement of equipment and materials, overseeing contractors, administering various agreements, information technology services and other services required to operate and maintain the Liquefaction Facilities. Prior to the substantial completion of each Train of the Liquefaction Facilities, no monthly fee payment is required except for reimbursement of operating expenses. After substantial completion of each Train of the Liquefaction Facilities, for services performed while the Liquefaction Facilities is operational, CCL will pay, in addition to the reimbursement of operating expenses, a fixed monthly fee of $125,000 (indexed for inflation) for services with respect to such Train.
CCP has an O&M Agreement (“CCP O&M Agreement”) with O&M Services pursuant to which CCP receives all of the necessary services required to construct, operate and maintain the Corpus Christi Pipeline. The services to be provided include, among other services, preparing and maintaining staffing plans, identifying and arranging for procurement of equipment and materials, overseeing contractors, information technology services and other services required to operate and maintain the Corpus Christi Pipeline. CCP is required to reimburse O&M Services for all operating expenses incurred on behalf of CCP.
Management Services Agreements (“MSAs”)
CCL has a MSA with Shared Services pursuant to which Shared Services manages the construction and operation of the Liquefaction Facilities, excluding those matters provided for under the G&P Agreement and the CCL O&M Agreement. The services include, among other services, exercising the day-to-day management of CCL’s affairs and business, managing CCL’s regulatory matters, preparing status reports, providing contract administration services for all contracts associated with the Liquefaction Facilities and obtaining insurance. Prior to the substantial completion of each Train of the Liquefaction Facilities, no monthly fee payment is required except for reimbursement of expenses. After substantial completion of each Train, CCL will pay, in addition to the reimbursement of related expenses, a monthly fee equal to 3% of the capital expenditures incurred in the previous month and a fixed monthly fee of $375,000 for services with respect to such Train.
CHENIERE CORPUS CHRISTI HOLDINGS, LLC AND SUBSIDIARIES
NOTES TO CONSOLIDATED FINANCIAL STATEMENTS—CONTINUED
(unaudited)
CCP has a MSA with Shared Services pursuant to which Shared Services manages CCP’s operations and business, excluding those matters provided for under the CCP O&M Agreement. The services include, among other services, exercising the day-to-day management of CCP’s affairs and business, managing CCP’s regulatory matters, preparing status reports, providing contract administration services for all contracts associated with the Corpus Christi Pipeline and obtaining insurance.
CHENIERE CORPUS CHRISTI HOLDINGS, LLC AND SUBSIDIARIES
NOTES TO CONSOLIDATED FINANCIAL STATEMENTS—CONTINUED
(unaudited)
CCP is required to reimburse Shared Services for the aggregate of all costs and expenses incurred in the course of performing the services under the MSA.
Natural Gas Supply Agreement
CCL has entered intois party to a natural gas supply contractagreement with a related party in the ordinary course of business, to obtain a fixed minimum daily volume of feed gas for the operation of the Liquefaction Project through March 20222022. This related party is partially owned by the investment management company that also partially owns our affiliated entity. In addition to the amounts recorded on our Consolidated Statements of Operations in the table above, CCL recorded accrued liabilities—related party of $13 million and $13 million, derivative assets—related party of $5 million and $3 million and non-current derivative assets—related party of 0 and $1 million as of March 31, 2021 and December 31, 2020, respectively, related to this agreement.
Natural Gas Transportation Agreements
Agreements with Related Party
CCL is party to natural gas transportation agreements with a related party in the ordinary course of business. CCL recorded $25 million and $26 million in costbusiness for the operation of sales—related party during the three months ended June 30, 2020 and 2019, respectively and $48 million and $36 million in cost of sales—related party during the six months ended June 30, 2020 and 2019, respectively, under this contract. Of this amount, $8 million and $3 million was included in accrued liabilities—related party as of June 30, 2020 and December 31, 2019, respectively. CCL also has recorded derivative assets—related party of $5 million and $3 million as of June 30, 2020 and December 31, 2019, respectively, and non-current derivative assets—related party of $2 million as of both June 30, 2020 and December 31, 2019, related to this contract.
Agreements with Midship Pipeline
CCL has entered into a transportation precedent agreement and a negotiated rate agreement with Midship Pipeline Company, LLC (“Midship Pipeline”) to secure firm pipeline transportation capacityLiquefaction Project, for a period of 10 years beginningwhich began in May 2020. Cheniere accounts for its investment in this related party as an equity method investment. In March 2020, we along with CCL, entered into a guaranty agreement whereby we will absolutely and irrevocably guarantee CCL’s obligation underaddition to the transportation precedent agreement with Midship Pipeline.amounts recorded on our Consolidated Statements of Operations in the table above, CCL recorded $2 million in operating and maintenance expense—related party during both the three and six months ended June 30, 2020 and $1 million of accrued liabilities—related party of $1 million as of June 30,both March 31, 2021 and December 31, 2020 underrelated to this agreement.
Natural Gas Transportation AgreementAgreements with Cheniere Corpus Christi Liquefaction Stage III, LLC
Cheniere Corpus Christi Liquefaction Stage III, LLC, a wholly owned subsidiary of Cheniere, has a transportation precedent agreement with CCP to secure firm pipeline transportation capacity for the transportation of natural gas feedstock to the expansion of the Corpus Christi LNG terminal it is constructing adjacent to the Liquefaction Project. The agreement will have a primary term of 20 years from the service commencement date with right to extend the term for 2 successive five-yearfive-year terms.
Contracts for Sale and Purchase of Natural Gas and LNG
CCL has an agreement with Sabine Pass Liquefaction, LLC that allows them to sell and purchase natural gas with each other. Natural gas purchased under this agreement is initially recorded as inventory and then to cost of sales—affiliate upon its sale, except for purchases related to commissioning activities which are capitalized as LNG terminal construction-in-process. Natural gas sold under this agreement is recorded as LNG revenues—affiliate.
CCL also has an agreement with Midship Pipeline Company, LLC that allows them to sell and purchase natural gas with each other.
Land Agreements
Lease Agreements
CCL has agreements with Cheniere Land Holdings, LLC (“Cheniere Land Holdings”), a wholly owned subsidiary of Cheniere, to lease the land owned by Cheniere Land Holdings for the Liquefaction Facilities. The total annual lease payment is $0.6 million, and the terms of the agreements range from three to seven years.
CHENIERE CORPUS CHRISTI HOLDINGS, LLC AND SUBSIDIARIES
NOTES TO CONSOLIDATED FINANCIAL STATEMENTS—CONTINUED
(unaudited)
Easement Agreements
CCL has agreements with Cheniere Land Holdings which grant CCL easements on land owned by Cheniere Land Holdings for the Liquefaction Facilities. The total annual payment for easement agreements is $0.1 million, excluding any previously paid one-time payments, and the terms of the agreements range from three to five years.
CHENIERE CORPUS CHRISTI HOLDINGS, LLC AND SUBSIDIARIES
NOTES TO CONSOLIDATED FINANCIAL STATEMENTS—CONTINUED
(unaudited)
Dredge Material Disposal Agreement
CCL has a dredge material disposal agreement with Cheniere Land Holdings that terminates in 2042 which grants CCL permission to use land owned by Cheniere Land Holdings for the deposit of dredge material from the construction and maintenance of the Liquefaction Facilities. Under the terms of the agreement, CCL will pay Cheniere Land Holdings $0.50 per cubic yard of dredge material deposits up to 5.0 million cubic yards and $4.62 per cubic yard for any quantities above that.
Tug Hosting Agreement
In February 2017, CCL entered into a tug hosting agreement with Corpus Christi Tug Services, LLC (“Tug Services”), a wholly owned subsidiary of Cheniere, to provide certain marine structures, support services and access necessary at the Liquefaction Facilities for Tug Services to provide its customers with tug boat and marine services. Tug Services is required to reimburse CCL for any third party costs incurred by CCL in connection with providing the goods and services.
State Tax Sharing Agreements
CCL has a state tax sharing agreement with Cheniere. Under this agreement, Cheniere has agreed to prepare and file all state and local tax returns which CCL and Cheniere are required to file on a combined basis and to timely pay the combined state and local tax liability. If Cheniere, in its sole discretion, demands payment, CCL will pay to Cheniere an amount equal to the state and local tax that CCL would be required to pay if CCL’s state and local tax liability were calculated on a separate company basis. There have been 0 state and local taxes paid by Cheniere for which Cheniere could have demanded payment from CCL under this agreement; therefore, Cheniere has not demanded any such payments from CCL. The agreement is effective for tax returns due on or after May 2015.
CCP has a state tax sharing agreement with Cheniere. Under this agreement, Cheniere has agreed to prepare and file all state and local tax returns which CCP and Cheniere are required to file on a combined basis and to timely pay the combined state and local tax liability. If Cheniere, in its sole discretion, demands payment, CCP will pay to Cheniere an amount equal to the state and local tax that CCP would be required to pay if CCP’s state and local tax liability were calculated on a separate company basis. There have been 0 state and local taxes paid by Cheniere for which Cheniere could have demanded payment from CCP under this agreement; therefore, Cheniere has not demanded any such payments from CCP. The agreement is effective for tax returns due on or after May 2015.
Equity Contribution Agreements
Equity Contribution Agreement
In May 2018, we amended and restated the existing equity contribution agreement with Cheniere (the “Equity Contribution Agreement”) pursuant to which Cheniere agreed to provide cash contributions up to approximately $1.1 billion, not including $2.0 billion previously contributed under the original equity contribution agreement. As of June 30, 2020,March 31, 2021, we have received $703 million in contributions under the Equity Contribution Agreement and Cheniere has posted $313 million of0 outstanding letters of credit on our behalf. Cheniere is only required to make additional contributions under the Equity Contribution Agreement after the commitments under the CCH Credit Facility have been reduced to 0 and to the extent cash flows from operations of the Liquefaction Project are unavailable for Liquefaction Project costs.
CHENIERE CORPUS CHRISTI HOLDINGS, LLC AND SUBSIDIARIES
NOTES TO CONSOLIDATED FINANCIAL STATEMENTS—CONTINUED
(unaudited)
NOTE 12—CUSTOMER CONCENTRATION
The following table shows external customers with revenues of 10% or greater of total revenues from external customers and external customers with accounts receivable, net and contract assets, net balances of 10% or greater of total accounts receivable, net and contract assets, net from external customers:
|
| | | | | | | | | | | | |
| | | Percentage of Total Revenues from External Customers | | Percentage of Accounts Receivable, Net and Contract Assets, Net from External Customers |
| | | Three Months Ended June 30, | | Six Months Ended June 30, | | June 30, | | December 31, |
| | | 2020 | | 2019 | | 2020 | | 2019 | | 2020 | | 2019 |
| Customer A | | 32% | | 38% | | 39% |
| 34% | | 22% | | 38% |
| Customer B | | 10% | | —% | | 12% |
| —% | | 14% | | —% |
| Customer C | | 19% | | —% | | 17% | | —% | | 12% | | 39% |
| Customer D | | 10% | | 19% | | 11% | | 17% | | * | | —% |
| Customer E | | 14% | | —% | | * | | —% | | 13% | | —% |
| | | | | | | | | | | | | | | | | | | | | | | | | | | | | | | | |
| | | | | | Percentage of Total Revenues from External Customers | | Percentage of Accounts Receivable, Net and Contract Assets, Net from External Customers |
| | | | | | |
| | | | Three Months Ended March 31, | | | | March 31, | | December 31, |
| | | | | | 2021 | | 2020 | | | | 2021 | | 2020 |
| Customer A | | | | | | 22% | | 52% | | | | 23% | | 15% |
| Customer B | | | | | | 21% | | 12% | | | | 10% | | * |
| Customer C | | | | | | 18% | | 0% | | | | 11% | | 10% |
| Customer D | | | | | | * | | 12% | | | | 11% | | 16% |
| Customer E | | | | | | * | | 0% | | | | 0% | | 11% |
| Customer F | | | | | | * | | 15% | | | | 25% | | 27% |
| Customer G | | | | | | 0% | | 0% | | | | 13% | | * |
* Less than 10%
NOTE 13—SUPPLEMENTAL CASH FLOW INFORMATION
The following table provides supplemental disclosure of cash flow information (in millions):
| | | | | | | | | | | | | |
| Three Months Ended March 31, |
| 2021 | | 2020 | | |
| Cash paid during the period for interest, net of amounts capitalized | $ | 12 | | | $ | 24 | | | |
| | | | | |
|
| | | | | | | |
| | Six Months Ended June 30, |
| | 2020 | | 2019 |
| Cash paid during the period for interest, net of amounts capitalized | $ | 179 |
| | $ | — |
|
The balance in property, plant and equipment, net funded with accounts payable and accrued liabilities (including affiliate) was $29$174 million and $269$41 million as of June 30,March 31, 2021 and 2020, and 2019, respectively.
| |
ITEM 2. | MANAGEMENT’S DISCUSSION AND ANALYSIS OF FINANCIAL CONDITION AND RESULTS OF OPERATIONS
|
ITEM 2. MANAGEMENT’S DISCUSSION AND ANALYSIS OF FINANCIAL CONDITION AND RESULTS OF OPERATIONS
Information Regarding Forward-Looking Statements
This quarterly report contains certain statements that are, or may be deemed to be, “forward-looking statements” within the meaning of Section 27A of the Securities Act of 1933, as amended (the “Securities Act”), and Section 21E of the Securities Exchange Act of 1934, as amended (the “Exchange Act”). All statements, other than statements of historical or present facts or conditions, included herein or incorporated herein by reference are “forward-looking statements.” Included among “forward-looking statements” are, among other things:
•statements that we expect to commence or complete construction of ourany proposed LNG terminal, liquefaction facilities,facility, pipeline facilitiesfacility or other projects, or any expansions or portions thereof, by certain dates, or at all;
•statements regarding future levels of domestic and international natural gas production, supply or consumption or future levels of LNG imports into or exports from North America and other countries worldwide or purchases of natural gas, regardless of the source of such information, or the transportation or other infrastructure or demand for and prices related to natural gas, LNG or other hydrocarbon products;
•statements regarding any financing transactions or arrangements, or our ability to enter into such transactions;
•statements relating to the construction of our Trains and pipeline,or pipelines, including statements concerning the engagement of any EPC contractor or other contractor and the anticipated terms and provisions of any agreement with any EPC or other contractor, and anticipated costs related thereto;
•statements regarding any SPA or other agreement to be entered into or performed substantially in the future, including any revenues anticipated to be received and the anticipated timing thereof, and statements regarding the amounts of total natural gas liquefaction or storage capacities that are, or may become, subject to contracts;
•statements regarding counterparties to our commercial contracts, construction contracts and other contracts;
•statements regarding our planned development and construction of additional Trains andor pipelines, including the financing of such Trains andor pipelines;
•statements that our Trains, when completed, will have certain characteristics, including amounts of liquefaction capacities;
•statements regarding our business strategy, our strengths, our business and operation plans or any other plans, forecasts, projections, or objectives, including anticipated revenues, capital expenditures, maintenance and operating costs and cash flows, any or all of which are subject to change;
•statements regarding legislative, governmental, regulatory, administrative or other public body actions, approvals, requirements, permits, applications, filings, investigations, proceedings or decisions;
•statements regarding the outbreak of COVID-19 and its impact on our business and operating results, including any customers not taking delivery of LNG cargoes, the ongoing credit worthiness of our contractual counterparties, any disruptions in our operations or construction of our Trains and the health and safety of Cheniere’s employees, and on our customers, the global economy and the demand for LNG; and
•any other statements that relate to non-historical or future information.
All of these types of statements, other than statements of historical or present facts or conditions, are forward-looking statements. In some cases, forward-looking statements can be identified by terminology such as “may,” “will,” “could,” “should,” “achieve,” “anticipate,” “believe,” “contemplate,” “continue,” “estimate,” “expect,” “intend,” “plan,” “potential,” “predict,” “project,” “pursue,” “target,” the negative of such terms or other comparable terminology. The forward-looking statements contained in this quarterly report are largely based on our expectations, which reflect estimates and assumptions made by our management. These estimates and assumptions reflect our best judgment based on currently known market conditions and other factors. Although we believe that such estimates are reasonable, they are inherently uncertain and involve a number of risks and uncertainties beyond our control. In addition, assumptions may prove to be inaccurate. We caution that the forward-looking statements contained in this quarterly report are not guarantees of future performance and that such statements may not be realized or the forward-looking statements or events may not occur. Actual results may differ materially from those anticipated or implied in forward-looking statements as a result of a variety of factors described in this quarterly
forward-looking statements attributable to us or persons acting on our behalf are expressly qualified in their entirety by these risk factors. These forward-looking statements speak only as of the date made, and other than as required by law, we undertake no obligation to update or revise any forward-looking statement or provide reasons why actual results may differ, whether as a result of new information, future events or otherwise.
Introduction
The following discussion and analysis presents management’s view of our business, financial condition and overall performance and should be read in conjunction with our Consolidated Financial Statements and the accompanying notes. This information is intended to provide investors with an understanding of our past performance, current financial condition and outlook for the future. Our discussion and analysis includes the following subjects:
Results of Operations
Overview of Business
We are operating and constructing a natural gas liquefaction and export facility (the “Liquefaction Facilities”) and operating a 23-mile natural gas supply pipeline that interconnects the Corpus Christi LNG terminal with several interstate and intrastate natural gas pipelines (the “Corpus Christi Pipeline” and together with the Liquefaction Facilities, the “Liquefaction Project”) near Corpus Christi, Texas, through our subsidiaries CCL and CCP, respectively.
We are currently operating twothree Trains, and one additionalincluding the third Train is undergoing commissioning forwhich achieved substantial completion on March 26, 2021,with a total production capacity of approximately 15 mtpa of LNG. The Liquefaction Project once fully constructed, will containalso contains three LNG storage tanks with aggregate capacity of approximately 10 Bcfe and two marine berths that can each accommodate vessels with nominal capacity of up to 266,000 cubic meters.
Overview of Significant Events
Our significant events since January 1, 20202021 and through the filing date of this Form 10-Q include the following:
Operational
•As of July 31, 2020,April 30, 2021, more than 150270 cumulative LNG cargoes totaling over 1018 million tonnes of LNG have been produced, loaded and exported from the Liquefaction Project.
Financial
In May 2020, the date•On March 26, 2021, substantial completion of first commercial delivery was reached under the 20-year SPAs with PT Pertamina (Persero), Naturgy LNG GOM, Limited, Woodside Energy Trading Singapore Pte Ltd, Iberdrola, S.A. and Électricité de France, S.A. relating to Train 23 of the Liquefaction Project.Project was achieved.
In August 2020, Moody’s Investors Service upgraded its rating
Results of our senior secured debt from Ba1 (Positive Outlook) to Baa3.Operations
Impact of COVID-19 and Market Environment
The business environment in which we operate has been impacted byfollowing charts summarize the recent downturn in the energy market as well as the outbreak of COVID-19total revenues and its progression into a pandemic in March 2020. As a result of these developments, our growth
estimates fortotal LNG in 2020 have moderated from previous expectations. Annual LNG demand grew by approximately 13% in 2019 to approximately 360 mtpa. In a report published in the month of April 2020, IHS Markit projected LNG demand in 2020 to reach 363 mtpa, down from a pre-COVID-19 estimate of approximately 377 mtpa. This implies a year-over-year rate of growth of below 1% in 2020 compared to an implied pre-COVID-19 year-over-year growth estimate of approximately 5%. While worldwide demand increased by approximately 5% during the six months ended June 30, 2020 compared to the comparable period of 2019, we expect to potentially see year-over-year declines in some future months as reduced economic activity affects LNG demandvolumes loaded (including both operational and high storage inventory levels reduce the need for imports. The robust LNG supply additions over the past several years, along with warmer winters and now strict virus containment measures, have exerted downward pressure on global gas prices. As an example, the Dutch Title Transfer Facility (“TTF”), a virtual trading point for natural gas in the Netherlands, averaged $1.76commissioning volumes) during the three months ended June 30, 2020, 60% lowerMarch 31, 2021 and 2020:
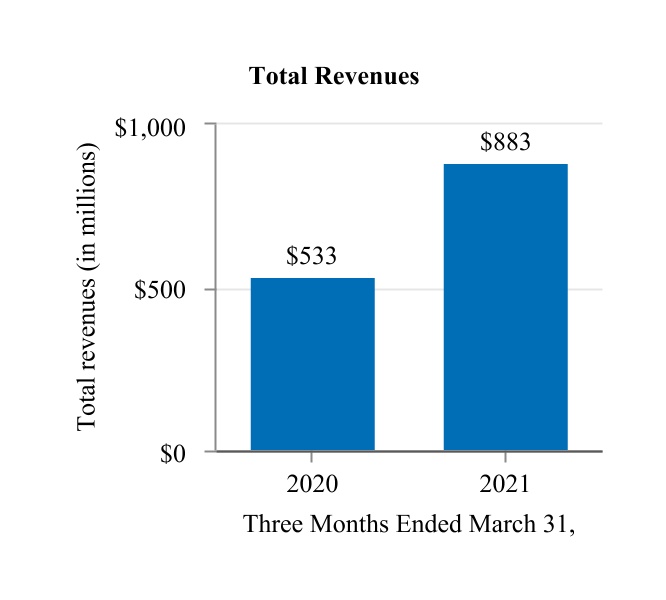
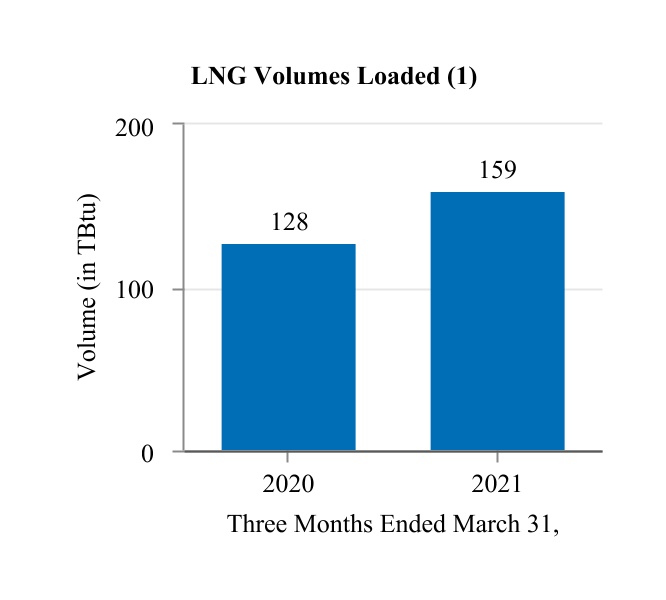
| | | | | | | | | | | | | | | | | | | | |
| | | | | | |
| (1) | The three months ended March 31, 2021 excludes four TBtu that were loaded at our affiliate’s facility. |
Our consolidated net income was $331 million for the three months ended March 31, 2021, compared to net loss of $51 million in the three months ended March 31, 2020. This $382 million increase in net income in 2021 was primarily due to (1) decreased interest rate derivative loss, net, (2) higher than the comparable period of 2019, while the Japan Korean Marker (“JKM”), annormal contributions from LNG benchmark price assessment for spot physical cargoes delivered ex-ship into certain keyand natural gas portfolio optimization activities due to significant volatility in LNG and natural gas markets in Asia, averaged $2.68 during the three months ended June 30,March 31, 2021 and (3) increased revenues per MMBtu, which were partially offset by the non-recurrence of commodity-related derivative gains from the three months ended March 31, 2020.
We enter into derivative instruments to manage our exposure to changing interest rates and commodity-related marketing and price risk. Derivative instruments are reported at fair value on our Consolidated Financial Statements. In some cases, the underlying transactions being economically hedged are accounted for under the accrual method of accounting, whereby revenues and expenses are recognized only upon delivery, receipt or realization of the underlying transaction. Because the recognition of derivative instruments at fair value has the effect of recognizing gains or losses relating to future period exposure, use of derivative instruments may increase the volatility of our results of operations based on changes in market pricing, counterparty credit risk and other relevant factors.
Revenues
| | | | | | | | | | | | | | | | | | | | | | | | | | | |
| | | Three Months Ended March 31, |
| (in millions, except volumes) | | | | | | | 2021 | | 2020 | | Change | | | | |
| LNG revenues | | | | | | | $ | 615 | | | $ | 343 | | | $ | 272 | | | | | |
| LNG revenues—affiliate | | | | | | | 268 | | | 190 | | | 78 | | | | | |
| | | | | | | | | | | | | | | |
| Total revenues | | | | | | | $ | 883 | | | $ | 533 | | | $ | 350 | | | | | |
| | | | | | | | | | | | | | | |
| LNG volumes recognized as revenues (in TBtu) (1) | | | | | | | 135 | | | 128 | | | 7 | | | | | |
(1) Excludes volume associated with cargoes for which customers notified us that they would not take delivery and includes four TBtu that were loaded at our affiliate’s facility.
Total revenues increased by $350 million during the three months ended March 31, 2021 from the three months ended March 31, 2020, 50% lower than the comparable period of 2019. Asprimarily as a result of the weakerhigher revenues per MMBtu. LNG market environment, as well as customer-specific variables, we have recently experienced an increase in the number of LNG cargoes for which our customers have notified us they will not take delivery. While this may impact our expected LNG production, we do not expect it to have a material adverse impact on our forecasted financial results for 2020, due to the highly contracted nature of our business and the fact that customers continue to be obligated to pay fixed fees for cargoes in relation to which they have exercised their contractual right to cancel. As such,revenues during the three and six months ended June 30, March 31,
2020 we recognized $299also included $37 million and $336 million, respectively, in LNG revenues associated with LNG cargoes for which customers have notified us that they would not take delivery, of which $200 million would have otherwise been recognized subsequent to June 30,March 31, 2020 ifhad the cargoes werebeen lifted pursuant to the delivery schedules with the customers. We did not have such revenues during the three months ended March 31, 2021.
In addition,Also included in responseLNG revenues are the sale of certain unutilized natural gas procured for the liquefaction process and gains and losses from derivative instruments, which include the realized value associated with a portion of derivative instruments that settle through physical delivery. We recognized revenues of $59 million and $44 million during the three months ended March 31, 2021 and 2020, respectively, related to these transactions.
Prior to substantial completion of a Train, amounts received from the sale of commissioning cargoes from that Train are offset against LNG terminal construction-in-process, because these amounts are earned or loaded during the testing phase for the construction of that Train. During the three months ended March 31, 2021, we realized offsets to LNG terminal costs of $143 million corresponding to 28 TBtu of LNG that were related to the COVID-19 pandemic, Cheniere has modified certain businesssale of commissioning cargoes. We did not realize any offsets to LNG terminal costs during the three months ended March 31, 2020.
Operating costs and workforce practicesexpenses
| | | | | | | | | | | | | | | | | | | | | | | | | | | |
| | | Three Months Ended March 31, |
| (in millions) | | | | | | | 2021 | | 2020 | | Change | | | | |
| Cost of sales | | | | | | | $ | 186 | | | $ | 49 | | | $ | 137 | | | | | |
| Cost of sales—affiliate | | | | | | | 35 | | | 6 | | | 29 | | | | | |
| Cost of sales—related party | | | | | | | 35 | | | 23 | | | 12 | | | | | |
| Operating and maintenance expense | | | | | | | 83 | | | 89 | | | (6) | | | | | |
| Operating and maintenance expense—affiliate | | | | | | | 24 | | | 20 | | | 4 | | | | | |
| Operating and maintenance expense—related party | | | | | | | 2 | | | — | | | 2 | | | | | |
| | | | | | | | | | | | | | | |
| | | | | | | | | | | | | | | |
| General and administrative expense | | | | | | | 1 | | | 2 | | | (1) | | | | | |
| General and administrative expense—affiliate | | | | | | | 5 | | | 5 | | | — | | | | | |
| Depreciation and amortization expense | | | | | | | 89 | | | 84 | | | 5 | | | | | |
| | | | | | | | | | | | | | | |
| Total operating costs and expenses | | | | | | | $ | 460 | | | $ | 278 | | | $ | 182 | | | | | |
Total operating costs and expenses increased between the three months ended March 31, 2021 and 2020, primarily as a result of increased cost of sales. Cost of sales includes costs incurred directly for the production and delivery of LNG from the Liquefaction Project, to protect the safetyextent those costs are not utilized for the commissioning process. Cost of sales (including related party) increased between the three months ended March 31, 2021 and welfare2020, primarily as a result of its employees who continue to work at its facilitiesthe non-recurrence of commodity-related derivatives gains from the three months ended March 31, 2020 and offices worldwide,increased cost of natural gas feedstock as well as implemented certain mitigation efforts to ensure business continuity. In March 2020, Cheniere began consulting with a medical advisor, and implemented social distancing through revised shift schedules, work from home policies and designated remote work locations where appropriate, restricted non-essential business travel and began requiring self-screening for employees and contractors. In April 2020, Cheniere began providing temporary housing for its workforce for our facilities, implemented temperature testing, incorporated medical and social workers to support employees, enforced prior self-isolation and screening for temporary housing and implemented marine operations with zero contact during loading activities. These measures have resultedresult of higher pricing. Partially offsetting these increases were decreases in increased costs. While response measures continue to evolve and in certain cases moderate, we expect Cheniere to incur incremental operatingnet costs associated with business continuitythe sale of certain unutilized natural gas procured for the liquefaction process and protectiona portion of its workforce untilderivative instruments that settle through physical delivery.
Cost of sales—affiliate increased during the risks associated withthree months ended March 31, 2021 as a result of the pandemic diminish. Ascost of June 30,cargoes procured from our affiliate to fulfill our commitments to our long-term customers during operational constraints.
Other (income) expense
| | | | | | | | | | | | | | | | | | | | | | | | | | | |
| | | Three Months Ended March 31, |
| (in millions) | | | | | | | 2021 | | 2020 | | Change | | | | |
| Interest expense, net of capitalized interest | | | | | | | $ | 93 | | | $ | 99 | | | $ | (6) | | | | | |
| | | | | | | | | | | | | | | |
| Interest rate derivative loss (gain), net | | | | | | | (1) | | | 208 | | | (209) | | | | | |
| Other income, net | | | | | | | — | | | (1) | | | 1 | | | | | |
| Total other expense | | | | | | | $ | 92 | | | $ | 306 | | | $ | (214) | | | | | |
Interest expense, net of capitalized interest decreased during the three months ended March 31, 2021 compared to the three months ended March 31, 2020, we haveprimarily as a result of the prepayment of a portion of our outstanding borrowings under our amended and restated credit facility (the “CCH Credit Facility”) and lower interest rates. We incurred approximately$119 million and $129 million of total interest cost during the three months ended March 31, 2021 and 2020, respectively, of which we
capitalized $26 million and $30 million, respectively. Capitalized interest primarily related to interest costs incurred to construct the remaining assets of such costs.the Liquefaction Project.
Interest rate derivative loss, net decreased during the three months ended March 31, 2021 compared to the three months ended March 31, 2020, primarily due to the settlement of our outstanding derivatives, primarily due to the settlement of our outstanding derivatives used to hedge against changes in interest rates that could impact anticipated future issuance of debt (the “CCH Interest Rate Forward Start Derivatives”) in August 2020 and a favorable shift in the long-term forward LIBOR curve relative to our economically hedged position.
Liquidity and Capital Resources
The following table provides a summary of our liquidity position at June 30, 2020March 31, 2021 and December 31, 20192020 (in millions):
| | | | | | | | | | | |
| |
| March 31, | | December 31, |
| 2021 | | 2020 |
| Cash and cash equivalents | $ | — | | | $ | — | |
| Restricted cash designated for the Liquefaction Project | 382 | | | 70 | |
| Available commitments under the following credit facilities: | | | |
| CCH Credit Facility | — | | | — | |
| $1.2 billion CCH Working Capital Facility (“CCH Working Capital Facility”) | 907 | | | 767 | |
|
| | | | | | | |
| | June 30, | | December 31, |
| | 2020 | | 2019 |
| Cash and cash equivalents | $ | — |
| | $ | — |
|
| Restricted cash designated for the Liquefaction Project | 101 |
| | 80 |
|
| Available commitments under the following credit facilities: | | | |
| CCH Credit Facility | — |
| | — |
|
| $1.2 billion CCH Working Capital Facility (“CCH Working Capital Facility”) | 667 |
| | 729 |
|
Corpus Christi LNG Terminal
Liquefaction Facilities
We are currently operating twothree Trains and onetwo marine berthberths at the Liquefaction Project, commissioning one additional Train and constructing an additional marine berth. We have received authorization from the FERC to site, construct and operate Trains 1 through 3 of the Liquefaction Project. We completed construction of Trains 1, 2 and 23 of the Liquefaction Project and commenced commercial operating activities in February 2019, and August 2019 respectively. The following table summarizes the project completion and construction status of Train 3 of the Liquefaction Project, including the related infrastructure, as of June 30, 2020:March 2021, respectively.
|
| | | |
| | Train 3 |
Overall project completion percentage | | 90.5% |
Completion percentage of: | | |
Engineering | | 100.0% |
Procurement | | 100.0% |
Subcontract work | | 83.2% |
Construction | | 77.5% |
Expected date of substantial completion | | 1H 2021 |
The DOE has authorized the export of domestically produced LNG by vessel from the Corpus Christi LNG terminal to FTA countries for a 25-year term and to non-FTA countries for a 20-year term, both of which commenced in June 2019,through December 31, 2050, up to a combined total of the equivalent of 767 Bcf/yr (approximately 15 mtpa) of natural gas. The terms of
In December 2020, the DOE announced a new policy in which it would no longer issue short-term export authorizations separately from long-term authorizations. Accordingly, the DOE amended each of theseCCL’s long-term authorizations begin onto include short-term export authority, and vacated the earlier of the date of first export thereunder or the date specified in the particular order, which ranges from seven to 10 years from the date the order was issued.short-term orders.
An application was filed in September 2019 to authorize additional exports from the Liquefaction Project to FTA countries for a 25-year term and to non-FTA countries for a 20-year term in an amount up to the equivalent of approximately 108 Bcf/yr of natural gas, for a total Liquefaction Project export of 875.16 Bcf/yr. The terms of the authorizations are requested to commence on the date of first commercial export from the Liquefaction Project of the volumes contemplated in the application. DOE’s authorization forIn April 2020, the DOE issued an order authorizing CCL to export to FTA countries has been granted. The DOErelated to this application, for which the term was subsequently extended through December 31, 2050, but has not yet issued an order authorizing CCL to export to non-FTA countries for the corresponding LNG volume. A corresponding application for authorization to increase the total LNG production capacity of the Liquefaction Project from the currently authorized level to approximately 875.16 Bcf/yr was also submitted to the FERC and is currently pending before the DOE.pending.
Customers
CCL has entered into fixed price long-term SPAs generally with terms of 20 years (plus extension rights) and with nine third partiesa weighted average remaining contract length of approximately 19 years (plus extension rights) for Trains 1 through 3 of the Liquefaction Project.Project to make available an aggregate amount of LNG that is approximately 70% of the total production capacity from these Trains. Under these SPAs, the customers will purchase LNG from CCL on a FOB basis for a price consisting of a fixed fee per MMBtu of LNG (a portion of which is subject to annual adjustment for inflation) plus a variable fee per MMBtu of LNG equal to approximately 115% of Henry Hub. The customers may elect to cancel or suspend deliveries of LNG cargoes, with advance notice as governed by each respective SPA, in which case the customers would still be required to pay the fixed
fee with respect to the contracted volumes that are not delivered as a result of such cancellation or suspension. We refer to the fee component that is applicable regardless of a cancellation or suspension of LNG cargo deliveries under the SPAs as the fixed fee component of the price under our SPAs. We refer to the fee component that is applicable only in connection with LNG cargo deliveries as the variable fee component of the price under our SPAs. The variable fee under CCL’s SPAs entered into in connection with the development of the Liquefaction Project was sized at the time of entry into each SPA with the intent to cover the costs of gas purchases and transportation and liquefaction fuel to produce the LNG to be sold under each such SPA. The SPAs and contracted volumes to be made available under the SPAs are not tied to a specific Train; however, the term of each SPA generally commences upon the date of first commercial delivery for the applicable Train, as specified in each SPA.
In aggregate, the minimum annual fixed fee portion to be paid by the third-party SPA customers iswas approximately $1.4 billion for Trains 1 and 2 and further increasingincreased to approximately $1.8 billion following the substantial completion of Train 3 of the Liquefaction Project.Project on March 26, 2021.
In addition, Cheniere Marketing International LLP (“Cheniere Marketing”) has agreements with CCL to purchase: (1) approximately 15 TBtu per annum of LNG with an approximate term of 23 years, (2) any LNG produced by CCL in excess of
that required for other customers at Cheniere Marketing’s option and (3) approximately 44 TBtu of LNG with a term of up to seven years associated with the integrated production marketing (“IPM”) gas supply agreement between CCL and EOG.
Natural Gas Transportation, Storage and Supply
To ensure CCL is able to transport adequate natural gas feedstock to the Corpus Christi LNG terminal, it has entered into transportation precedent agreements to secure firm pipeline transportation capacity with CCP and certain third-party pipeline companies. CCL has entered into a firm storage services agreement with a third party to assist in managing variability in natural gas needs for the Liquefaction Project. CCL has also entered into enabling agreements and long-term natural gas supply contracts with third parties, and will continue to enter into such agreements, in order to secure natural gas feedstock for the Liquefaction Project. As of June 30, 2020,March 31, 2021, CCL had secured up to approximately 2,9352,923 TBtu of natural gas feedstock through long-term natural gas supply contracts with remaining terms that range up to 10 years, a portion of which is subject to the achievement of certain project milestones and other conditions precedent.
A portion of the natural gas feedstock transactions for CCL are IPM transactions, in which the natural gas producers are paid based on a global gas market price less a fixed liquefaction fee and certain costs incurred by us.
Construction
CCL entered into separate lump sum turnkey contracts with Bechtel Oil, Gas and Chemicals, Inc. (“Bechtel”) for the engineering, procurement and construction of Trains 1 through 3 of the Liquefaction Project under which Bechtel chargescharged a lump sum for all work performed and generally bearsbore project cost, schedule and performance risks unless certain specified events occur,occurred, in which case Bechtel may causehave caused CCL to enter into a change order, or CCL agreesagreed with Bechtel to a change order.
The total contract price of the EPC contract for Train 3, which is currently under construction, is approximately $2.4 billion, reflecting amounts incurred under change orders through June 30, 2020. As of June 30, 2020, we have incurred $2.2 billion under this contract.
Capital Resources
We expect to finance the construction costs of the Liquefaction Project from one or more of the following: operating cash flows from CCL and CCP, project debt and equity contributions from Cheniere. The following table provides a summary of our capital resources from borrowings and available commitments for the Liquefaction Project, excluding any equity contributions, at June 30, 2020March 31, 2021 and December 31, 20192020 (in millions):
|
| | | | | | | | |
| | | June 30, | | December 31, |
| | | 2020 | | 2019 |
| Senior notes (1) | | $ | 6,952 |
| | $ | 6,952 |
|
| Credit facilities outstanding balance (2) | | 3,424 |
| | 3,283 |
|
| Letters of credit issued (2) | | 392 |
| | 471 |
|
| Available commitments under credit facilities (2) | | 667 |
| | 729 |
|
| Total capital resources from borrowings and available commitments (3) | | $ | 11,435 |
| | $ | 11,435 |
|
| | | | | | | | | | | | | | |
| | |
| | March 31, | | December 31, |
| | | 2021 | | 2020 |
| Senior notes (1) | | $ | 7,721 | | | $ | 7,721 | |
| Credit facilities outstanding balance (2) | | 2,627 | | | 2,767 | |
| Letters of credit issued (2) | | 293 | | | 293 | |
| Available commitments under credit facilities (2) | | 907 | | | 767 | |
| Total capital resources from borrowings and available commitments (3) | | $ | 11,548 | | | $ | 11,548 | |
| |
(1) | Includes 7.000% Senior Secured Notes due 2024, 5.875% Senior Secured Notes due 2025, 5.125% Senior Secured Notes due 2027, 3.700% Senior Secured Notes due 2029, 4.80% Senior Secured Notes due 2039 and 3.925% Senior Secured Notes due 2039 (collectively, the “CCH Senior Notes”). |
| |
(2) | Includes CCH Credit Facility and CCH Working Capital Facility. |
| |
(3) | Does not include additional borrowings or contributions by our indirect parents which may be used for the Liquefaction Project. |
(1)Includes the 7.000% Senior Secured Notes due 2024, 5.875% Senior Secured Notes due 2025, 5.125% Senior Secured Notes due 2027, 3.700% Senior Secured Notes due 2029, 4.80% Senior Secured Notes due 2039, 3.925% Senior Secured Notes due 2039 and the 3.52% CCH Senior Secured Notes (collectively, the “CCH Senior Notes”).
(2)Includes the CCH Credit Facility and the CCH Working Capital Facility.
(3)Does not include additional borrowings or contributions by our indirect parents which may be used for the Liquefaction Project.
CCH Senior Notes
The CCH Senior Notes are jointly and severally guaranteed by each of our consolidated subsidiaries, CCL, CCP and CCP GP (each a “Guarantor” and collectively, the “Guarantors”). The indentures governing the CCH Senior Notes contain customary terms and events of default and certain covenants that, among other things, limit our ability and the ability of our restricted
subsidiaries to: incur additional indebtedness or issue preferred stock; make certain investments or pay dividends or distributions on membership interests or subordinated indebtedness or purchase, redeem or retire membership interests; sell or transfer assets, including membership or partnership interests of our restricted subsidiaries; restrict dividends or other payments by restricted subsidiaries to us or any of our restricted subsidiaries; incur liens; enter into transactions with affiliates; dissolve, liquidate, consolidate, merge, sell or lease all or substantially all of the properties or assets of us and our restricted subsidiaries taken as a whole; or permit any Guarantor to dissolve, liquidate, consolidate, merge, sell or lease all or substantially all of its properties and assets. The covenants included in the respective indentures that govern the CCH Senior Notes are subject to a number of important limitations and exceptions.
The CCH Senior Notes are our senior secured obligations, ranking senior in right of payment to any and all of our future indebtedness that is subordinated to the CCH Senior Notes and equal in right of payment with our other existing and future indebtedness that is senior and secured by the same collateral securing the CCH Senior Notes. The CCH Senior Notes are secured by a first-priority security interest in substantially all of our assets and the assets of the CCH Guarantors.
At any time prior to six months before the respective dates of maturity for each of the CCH Senior Notes, we may redeem all or part of such series of the CCH Senior Notes at a redemption price equal to the “make-whole” price set forth in the appropriate indenture, plus accrued and unpaid interest, if any, to the date of redemption. At any time within six months of the respective dates of maturity for each of the CCH Senior Notes, we may redeem all or part of such series of the CCH Senior Notes, in whole or in part, at a redemption price equal to 100% of the principal amount of the CCH Senior Notes to be redeemed, plus accrued and unpaid interest, if any, to the date of redemption.
The Guarantors’ guarantees are full and unconditional, subject to certain release provisions including (1) the sale, exchange, disposition or transfer (by merger, consolidation or otherwise) of all or substantially all of the capital stock or the assets of the Guarantors, (2) the designation of the Guarantor as an “unrestricted subsidiary” in accordance with the indentures governing the CCH Senior Notes (the “CCH Indentures”), (3) upon the legal defeasance or covenant defeasance or discharge of obligations under the CCH Indentures and (4) the release and discharge of the Guarantors pursuant to the Common Security and Account Agreement. In the event of a default in payment of the principal or interest by us, whether at maturity of the CCH Senior Notes or by declaration of acceleration, call for redemption or otherwise, legal proceedings may be instituted against the Guarantors to enforce the guarantee.
The rights of holders of the CCH Senior Notes against the Guarantors may be limited under the U.S. Bankruptcy Code or federal or state fraudulent transfer or conveyance law. Each guarantee contains a provision intended to limit the Guarantor’s liability to the maximum amount that it could incur without causing the incurrence of obligations under its guarantee to be a fraudulent conveyance or transfer under U.S. federal or state law. However, there can be no assurance as to what standard a court will apply in making a determination of the maximum liability of the Guarantors. Moreover, this provision may not be effective to protect the guarantee from being voided under fraudulent conveyance laws. There is a possibility that the entire guarantee may be set aside, in which case the entire liability may be extinguished.
Summarized financial information about us and the Guarantors as a group (the “Obligor Group”) is omitted herein because such information would not be materially different from our Consolidated Financial Statements.
The CCH Senior Notes are our senior secured obligations, ranking senior in right of payment to any and all of our future indebtedness that is subordinated to the CCH Senior Notes and equal in right of payment with our other existing and future indebtedness that is senior and secured by the same collateral securing the CCH Senior Notes. The CCH Senior Notes are secured by a first-priority security interest in substantially all of our assets and the assets of the CCH Guarantors.
The security interests in our assets and the assets of the CCH Guarantors are subject to release provisions including (1) upon satisfaction and discharge of the CCH Indentures, (2) upon the legal defeasance or covenant defeasance with respect to the applicable CCH Senior Notes or (3) upon payment in full in cash of the applicable CCH Senior Notes and all other related obligations that are outstanding, due and payable at the time the CCH Senior Notes are paid full in cash; and in accordance with the Common Security and Account Agreement governing the parties to the CCH Senior Notes.
CCH Credit Facility
In May 2018, we amended and restated the CCH Credit Facility to increaseWe have total commitments under the CCH Credit Facility from $4.6 billion toof $6.1 billion. Our obligations under the CCH Credit Facility are secured by a first priority lien on substantially all of our assets and the assets of our subsidiaries and by a pledge by CCH HoldCo I of its limited liability company interests in us. As of both June 30, 2020March 31, 2021 and December 31, 2019,2020, we had no available commitments and $3.3$2.6 billionof loans outstanding under the CCH Credit Facility.
The CCH Credit Facility matures on June 30, 2024, with principal payments due quarterly commencing on the earlier of (1) the first quarterly payment date occurring more than three calendar months following the completion of the Liquefaction Project as defined in the common terms agreement and (2) a set date determined by reference to the date under which a certain LNG buyer linked to the last Train of the Liquefaction Project to become operational is entitled to terminate its SPA for failure to achieve the date of first commercial delivery for that agreement. Scheduled repayments will be based upon a 19-year tailored amortization, commencing the first full quarter after the completion of Trains 1 through 3 and designed to achieve a minimum projected fixed debt service coverage ratio of 1.50:1.
Under the CCH Credit Facility, we are required to hedge not less than 65% of the variable interest rate exposure of our senior secured debt. We are restricted from making certain distributions under agreements governing our indebtedness generally until, among other requirements, the completion of the construction of Trains 1 through 3 of the Liquefaction Project, funding of a debt service reserve account equal to six months of debt service and achieving a historical debt service coverage ratio and fixed projected debt service coverage ratio of at least 1.25:1.00.
CCH Working Capital Facility
In June 2018, we amended and restated the CCH Working Capital Facility to increaseWe have total commitments under the CCH Working Capital Facility from $350 million toof $1.2 billion. The CCH Working Capital Facility is intended to be used for loans (“CCH Working Capital Loans”) and the issuance of letters of credit for certain working capital requirements related to developing and operating the Liquefaction Project and for related business purposes. Loans under the CCH Working Capital Facility are guaranteed by the Guarantors. We may, from time to time, request increases in the commitments under the CCH Working Capital Facility of up to the maximum allowed for working capital under the Common Terms Agreement that was entered into concurrently with the CCH Credit Facility. As of June 30, 2020March 31, 2021 and December 31, 2019,2020, we had $667$907 million and $729$767 million of available commitments $392 million and $471 million aggregate amount of issued letters of credit and $141 million and zero and $140 million of loans outstanding under the CCH Working Capital Facility, respectively. We had $293 million aggregate amount of issued letters of credit under the CCH Working Capital Facility as of both March 31, 2021 and December 31, 2020.
The CCH Working Capital Facility matures on June 29, 2023, and we may prepay the CCH Working Capital Loans and loans made in connection with a draw upon any letter of credit (“CCH LC Loans”) at any time without premium or penalty upon three business days’ notice and may re-borrow at any time. CCH LC Loans have a term of up to one year. We are required to reduce the aggregate outstanding principal amount of all CCH Working Capital Loans to zero for a period of five consecutive business days at least once each year.
The CCH Working Capital Facility contains conditions precedent for extensions of credit, as well as customary affirmative and negative covenants. Our obligations under the CCH Working Capital Facility are secured by substantially all of our assets and the assets of the Guarantors as well as all of our membership interests and the membership interest in each of the Guarantors on a pari passu basis with the CCH Senior Notes and the CCH Credit Facility.
Equity Contribution Agreement
In May 2018, we amended and restated the existing equity contribution agreement with Cheniere (the “Equity Contribution Agreement”) pursuant to which Cheniere agreed to provide cash contributions up to approximately $1.1 billion, not including $2.0 billion previously contributed under the original equity contribution agreement. As of June 30, 2020,March 31, 2021, we have received $703 million in contributions under the Equity Contribution Agreement and Cheniere has posted $313 millionzero of letters of
credit on our behalf under its revolving credit facility. Cheniere is only required to make additional contributions under the Equity Contribution Agreement after the commitments under the CCH Credit Facility have been reduced to zero and to the extent cash flows from operations of the Liquefaction Project are unavailable for Liquefaction Project costs.
Restrictive Debt Covenants
As of June 30, 2020,March 31, 2021, we were in compliance with all covenants related to our debt agreements.
LIBOR
The use of LIBOR is expected to be phased out by the end of 2021.June 2023. It is currently unclear whether LIBOR will be utilized beyond that date or whether it will be replaced by a particular rate. We intend to continue to workworking with our lenders and counterparties to pursue any amendments to our debt and derivative agreements that are currently subject to LIBOR following LIBOR cessation and will continue to monitor, assess and plan for the phase out of LIBOR.
Sources and Uses of Cash
The following table summarizes the sources and uses of our cash, cash equivalents and restricted cash for the sixthree months ended June 30,March 31, 2021 and 2020 and 2019 (in millions). The table presents capital expenditures on a cash basis; therefore, these amounts differ from the amounts of capital expenditures, including accruals, which are referred to elsewhere in this report. Additional discussion of these items follows the table.
|
| | | | | | | |
| | Six Months Ended June 30, |
| | 2020 | | 2019 |
| Operating cash flows | $ | 87 |
| | $ | (53 | ) |
| Investing cash flows | (352 | ) | | (842 | ) |
| Financing cash flows | 286 |
| | 885 |
|
| | | | |
| Net increase (decrease) in cash, cash equivalents and restricted cash | 21 |
| | (10 | ) |
| Cash, cash equivalents and restricted cash—beginning of period | 80 |
| | 289 |
|
| Cash, cash equivalents and restricted cash—end of period | $ | 101 |
| | $ | 279 |
|
| | | | | | | | | | | | | | | | |
| | Three Months Ended March 31, |
| | 2021 | | 2020 | | |
| Sources of cash, cash equivalents and restricted cash: | | | | | | |
| Net cash provided by operating activities | | $ | 524 | | | $ | 94 | | | |
| Proceeds from issuances of debt | | — | | | 141 | | | |
| | | | | | |
| | | | | | |
| | $ | 524 | | | $ | 235 | | | |
| | | | | | |
| Uses of cash, cash equivalents and restricted cash: | | | | | | |
| Property, plant and equipment, net | | $ | (71) | | | $ | (220) | | | |
| Repayments of debt | | (140) | | | — | | | |
| | | | | | |
| | | | | | |
| Other | | (1) | | | (1) | | | |
| | (212) | | | (221) | | | |
| Net increase in restricted cash | | $ | 312 | | | $ | 14 | | | |
Operating Cash Flows
Operating cash flows during the sixthree months ended June 30,March 31, 2021 and 2020 and 2019 were net inflows of $87$524 million and net outflows of $53$94 million, respectively. The $430 million increase in operating cash net inflows in 2021 compared to 2020 was primarily duerelated to increased cash receipts from the sale of LNG cargoes as a resultdue to higher revenue per MMBtu and from higher than normal contributions from LNG and natural gas portfolio optimization activities due to significant volatility in LNG and natural gas markets during the three months ended March 31, 2021.
Proceeds from Issuance of Debt, Repayments of Debt, Debt Issuance and Other Financing Costs and Debt Modification or Extinguishment Costs
During the three months ended March 31, 2021, we repaid all of the commencement of operations of Trains 1 and 2 ofoutstanding borrowings under the Liquefaction Project in February 2019 and August 2019, respectively, and from increased revenues related to LNG cargoes for which customers have notified us that they will not take delivery.
Investing Cash Flows
Investing cash net outflows duringCCH Working Capital Facility. During the sixthree months ended June 30,March 31, 2020, we borrowed $141 million under the CCH Working Capital Facility.
Property, Plant and 2019 were $352 millionEquipment, net
Cash outflows for property, plant and $842 million, respectively, andequipment were primarily used to fundfor the construction costs for the Liquefaction Project. These costsProject, which are capitalized as construction-in-process until achievement of substantial completion.
Financing Cash Flows
Financing cash net inflows during the six months ended June 30, 2020 were $286 million, primarily as a result of:
$141 million of borrowings under the CCH Working Capital Facility; and
$145 million of equity contributions from Cheniere.
Financing cash net inflows during the six months ended June 30, 2019 were $885 million, primarily as a result of:
$982 million of borrowings under the CCH Credit Facility;
| |
• | $390 million of borrowings and $558 million of repayments under the CCH Working Capital Facility; and
|
| |
• | $72 million of equity contributions from Cheniere.
|
Results of Operations
The following charts summarize the number of Trains that were in operation during the year ended December 31, 2019 and the six months ended June 30, 2020 and total revenues and total LNG volumes loaded (including both operational and commissioning volumes) during the six months ended June 30, 2020 and 2019:
Our consolidated net income was $156 million in the three months ended June 30, 2020, compared to net loss of $189 million in the three months ended June 30, 2019. This $345 million increase in net income in 2020 was primarily the result of accelerated revenues recognized from LNG cargoes for which customers have notified us that they will not take delivery and increased income from operations due to an additional Train in operation.
Our consolidated net income was $105 million in the six months ended June 30, 2020, compared to net loss of $260 million in the six months ended June 30, 2019. This $365 million increase in net income in 2020 was primarily the result of increased income from operations due to an additional Train in operation and accelerated revenues recognized from LNG cargoes for which the customers have notified us that they will not take delivery, which were partially offset by increased interest rate derivative loss, net and interest expense, net of capitalized interest.
We enter into derivative instruments to manage our exposure to changing interest rates and commodity-related marketing and price risk. Derivative instruments are reported at fair value on our Consolidated Financial Statements. In some cases, the underlying transactions economically hedged receive accrual accounting treatment, whereby revenues and expenses are recognized only upon delivery, receipt or realization of the underlying transaction. Because the recognition of derivative instruments at fair value has the effect of recognizing gains or losses relating to future period exposure, use of derivative instruments may increase the volatility of our results of operations based on changes in market pricing, counterparty credit risk and other relevant factors.
Revenues
|
| | | | | | | | | | | | | | | | | | | | | | | |
| | Three Months Ended June 30, | | Six Months Ended June 30, |
| (in millions, except volumes) | 2020 | | 2019 | | Change | | 2020 | | 2019 | | Change |
| LNG revenues | $ | 610 |
| | $ | 118 |
| | $ | 492 |
| | $ | 953 |
| | $ | 131 |
| | $ | 822 |
|
| LNG revenues—affiliate | 44 |
| | 182 |
| | (138 | ) | | 234 |
| | 275 |
| | (41 | ) |
| Total revenues | $ | 654 |
| | $ | 300 |
| | $ | 354 |
| | $ | 1,187 |
| | $ | 406 |
| | $ | 781 |
|
| | | | | | | | | | | | |
| LNG volumes recognized as revenues (in TBtu) | 71 |
| | 56 |
| | 15 |
| | 199 |
| | 77 |
| | 122 |
|
We began recognizing LNG revenues from the Liquefaction Project following the On March 26, 2021, substantial completion and the commencement of operating activities of Trains 1 and 2 in February 2019 and August 2019, respectively. The additional Train in operation between the periods resulted in additional revenue from the increased volume of LNG sold. LNG revenues during the three and six months ended June 30, 2020 also included $299 million and $336 million, respectively, in revenues associated with LNG cargoes for which customers have notified us that they will not take delivery, of which $200 million would have otherwise been recognized subsequent to June 30, 2020, if the cargoes were lifted pursuant to the delivery schedules with the customers. LNG revenues during the three months ended June 30, 2020 excluded $37 million that would have otherwise been recognized during the quarter if the cargoes were lifted pursuant to the delivery schedules with the customers. As we have recognized accelerated revenues associated with LNG cargoes for which customers have notified us that they will not take delivery, we may expect decreased revenues in future periods for which the deliveries would have occurred.We expect our LNG revenues to increase in the future upon Train 3 of the Liquefaction Project becoming operational.was achieved.
Also included in LNG revenues are gains and losses from derivative instruments, which include the realized value associated with a portion of derivative instruments that settle through physical delivery and the sale of unutilized natural gas procured for the liquefaction process. We recognized revenues of $44 million and $51 million during the three months ended June 30, 2020 and 2019, respectively, and $51 million and $64 million during the six months ended June 30, 2020 and 2019, respectively, related to derivative instruments and other revenues from these transactions.
Prior to substantial completion of a Train, amounts received from the sale of commissioning cargoes from that Train are offset against LNG terminal construction-in-process, because these amounts are earned or loaded during the testing phase for the construction of that Train. During the three months ended June 30, 2019, we realized offsets to LNG terminal costs of $8 million corresponding to 3 TBtu of LNG that were related to the sale of commissioning cargoes. During the six months ended June 30, 2019, we realized offsets to LNG terminal costs of $82 million corresponding to 18 TBtu of LNG that were related to the sale of commissioning cargoes. We did not realize any offsets to LNG terminal costs during the three and six months ended June 30, 2020.
Operating costs and expenses
|
| | | | | | | | | | | | | | | | | | | | | | | |
| | Three Months Ended June 30, | | Six Months Ended June 30, |
| (in millions) | 2020 | | 2019 | | Change | | 2020 | | 2019 | | Change |
| Cost of sales | $ | 140 |
| | $ | 180 |
| | $ | (40 | ) | | $ | 189 |
| | $ | 239 |
| | $ | (50 | ) |
| Cost of sales—affiliate | 2 |
| | — |
| | 2 |
| | 8 |
| | — |
| | 8 |
|
| Cost of sales—related party | 25 |
| | 26 |
| | (1 | ) | | 48 |
| | 36 |
| | 12 |
|
| Operating and maintenance expense | 95 |
| | 61 |
| | 34 |
| | 184 |
| | 93 |
| | 91 |
|
| Operating and maintenance expense—affiliate | 25 |
| | 16 |
| | 9 |
| | 45 |
| | 21 |
| | 24 |
|
| Operating and maintenance expense—related party | 2 |
| | — |
| | 2 |
| | 2 |
| | — |
| | 2 |
|
| Development expense | — |
| | 1 |
| | (1 | ) | | — |
| | 1 |
| | (1 | ) |
| General and administrative expense | 2 |
| | 1 |
| | 1 |
| | 4 |
| | 3 |
| | 1 |
|
| General and administrative expense—affiliate | 5 |
| | 2 |
| | 3 |
| | 10 |
| | 3 |
| | 7 |
|
| Depreciation and amortization expense | 86 |
| | 57 |
| | 29 |
| | 170 |
| | 79 |
| | 91 |
|
| Total operating costs and expenses | $ | 382 |
|
| $ | 344 |
|
| $ | 38 |
| | $ | 660 |
|
| $ | 475 |
|
| $ | 185 |
|
Our total operating costs and expenses increased between the three and six months ended June 30, 2020 and 2019, primarily as a result of higher depreciation and amortization expense as a result of an additional Train in operation between the periods and costs incurred in response to the COVID-19 pandemic, as further described earlier in Impact of COVID-19 and Market Environment, partially offset by decreased costs of sales.
Cost of sales (including affiliate and related party) decreased between the three months ended June 30, 2020 and 2019, primarily due to decreased pricing of natural gas feedstock, which was partially offset by increased volume related to our LNG sales and a decrease in the fair value of commodity derivatives to secure natural gas feedstock for the Liquefaction Project due to an unfavorable shift in long-term forward prices relative to our hedge position between the periods. Cost of sales (including affiliate and related party) decreased between the six months ended June 30, 2020 and 2019, primarily related to an increase in fair value of commodity derivatives to secure natural gas feedstock for the Liquefaction Project due to relative shifts in long-term forward prices relative to our hedged position and decreased pricing of natural gas feedstock, partially offset by the increase in the volume of natural gas feedstock related to our LNG sales due to an additional Train in operation between the periods. Cost of sales includes costs incurred directly for the production and delivery of LNG from the Liquefaction Project, to the extent those costs are not utilized for the commissioning process.
Operating and maintenance expense primarily includes costs associated with operating and maintaining the Liquefaction Project. Additionally, operating and maintenance expense (including affiliate) includes costs incurred in response to the COVID-19 pandemic, as further described earlier in Impact of COVID-19 and Market Environment, which was the primary reason for the increase between the three months ended June 30, 2020 and 2019 and also contributed to the increase between the six months ended June 30, 2020 and 2019. Operating and maintenance expense (including affiliate) also increased between the three and six months ended June 30, 2020 and 2019 due to increased third-party service and maintenance contract costs, increased natural gas transportation and storage capacity demand charges and increased payroll and benefit costs of operations personnel, generally as a result of an additional Train in operation between the periods. Operating and maintenance (including affiliates) also includes insurance and regulatory costs and other operating costs.Depreciation and amortization expense increased during the three and six months ended June 30, 2020 from the comparable period in 2019 as a result of commencing operations of Trains 1 and 2 of the Liquefaction Project in February 2019 and August 2019, respectively.
Other expense (income)
|
| | | | | | | | | | | | | | | | | | | | | | | |
| | Three Months Ended June 30, | | Six Months Ended June 30, |
| (in millions) | 2020 | | 2019 | | Change | | 2020 | | 2019 | | Change |
| Interest expense, net of capitalized interest | $ | 90 |
| | $ | 73 |
| | $ | 17 |
| | $ | 189 |
| | $ | 85 |
| | $ | 104 |
|
| Interest rate derivative loss, net | 25 |
| | 74 |
| | (49 | ) | | 233 |
| | 109 |
| | 124 |
|
| Other expense (income), net | 1 |
| | (2 | ) | | 3 |
| | — |
| | (3 | ) | | 3 |
|
| Total other expense | $ | 116 |
| | $ | 145 |
| | $ | (29 | ) | | $ | 422 |
| | $ | 191 |
| | $ | 231 |
|
Interest expense, net of capitalized interest, increased between the three and six months ended June 30, 2020 and 2019, primarily as a result of a decrease in the portion of total interest costs that is eligible for capitalization due to the commencement of operations at the Liquefaction Project, partially offset by lower interest costs as a result of refinancing a portion of the outstanding balance under the CCH Credit Facility and lower interest rates. We incurred $119 million and $138 million of total interest cost, of which we capitalized $29 million and $65 million, which was primarily related to interest costs incurred to construct the remaining assets of the Liquefaction Project during the three months ended June 30, 2020 and 2019, respectively. We incurred $248 million and $271 million of total interest cost, of which we capitalized $59 million and $186 million, which was primarily related to interest costs incurred to construct the remaining assets of the Liquefaction Project during the six months ended June 30, 2020 and 2019, respectively.
Interest rate derivative loss, net decreased during the three months ended June 30, 2020 compared to the three months ended June 30, 2019, primarily due to a favorable shift in the long-term forward LIBOR curve between the periods. Interest rate derivative loss, net increased during the six months ended June 30, 2020 compared to the six months ended June 30, 2019, primarily due to an unfavorable shift in the long-term forward LIBOR curve between the periods.
Off-Balance Sheet Arrangements
As of June 30, 2020,March 31, 2021, we had no transactions that met the definition of off-balance sheet arrangements that may have a current or future material effect on our consolidated financial position or operating results.
Summary of Critical Accounting Estimates
The preparation of our Consolidated Financial Statements in conformity with GAAP requires management to make certain estimates and assumptions that affect the amounts reported in the Consolidated Financial Statements and the accompanying notes. There have been no significant changes to our critical accounting estimates from those disclosed in our annual report on Form 10-K for the fiscal year ended December 31, 2019.2020.
Recent Accounting Standards
ITEM 3. QUANTITATIVE AND QUALITATIVE DISCLOSURES ABOUT MARKET RISK
Marketing and Trading Commodity Price Risk
We have entered into commodity derivatives consisting of natural gas supply contracts for the commissioning and operation of the Liquefaction Project (“Liquefaction Supply Derivatives”). In order to test the sensitivity of the fair value of the Liquefaction Supply Derivatives to changes in underlying commodity prices, management modeled a 10% change in the commodity price for natural gas for each delivery location as follows (in millions):
| | | | | | | | | | | | | | | | | | | | | | | |
| March 31, 2021 | | December 31, 2020 |
| Fair Value | | Change in Fair Value | | Fair Value | | Change in Fair Value |
| Liquefaction Supply Derivatives | $ | (5) | | | $ | 77 | | | $ | 11 | | | $ | 77 | |
|
| | | | | | | | | | | | | | | |
| | June 30, 2020 | | December 31, 2019 |
| | Fair Value | | Change in Fair Value | | Fair Value | | Change in Fair Value |
| Liquefaction Supply Derivatives | $ | 184 |
| | $ | 40 |
| | $ | 48 |
| | $ | 63 |
|
Interest Rate Risk
We are exposed to interest rate risk primarily when we incur debt related to project financing. Interest rate risk is managed in part by replacing outstanding floating-rate debt with fixed-rate debt with varying maturities. We have entered into interest rate swaps to hedge the exposure to volatility in a portion of the floating-rate interest payments under the CCH Credit Facility (“CCH Interest Rate Derivatives”) and to hedge against changes in interest rates that could impact our anticipated future issuance of debt (“CCH Interest Rate Forward Start Derivatives” and, collectively with the CCH Interest Rate Derivatives, the “Interest Rate Derivatives”). In order to test the sensitivity of the fair value of the CCH Interest Rate Derivatives to changes in interest rates, management modeled a 10% change in the forward one-month LIBOR curve across the remaining terms of the CCH Interest Rate Derivatives and CCH Interest Rate Forward Start Derivatives as follows (in millions):
| | | | | | | | | | | | | | | | | | | | | | | |
| March 31, 2021 | | December 31, 2020 |
| Fair Value | | Change in Fair Value | | Fair Value | | Change in Fair Value |
| CCH Interest Rate Derivatives | $ | (114) | | | $ | 1 | | | $ | (140) | | | $ | 1 | |
| | | | | | | |
|
| | | | | | | | | | | | | | | |
| | June 30, 2020 | | December 31, 2019 |
| | Fair Value | | Change in Fair Value | | Fair Value | | Change in Fair Value |
| CCH Interest Rate Derivatives | $ | (191 | ) | | $ | 2 |
| | $ | (81 | ) | | $ | 19 |
|
| CCH Interest Rate Forward Start Derivatives | (102 | ) | | 7 |
| | (8 | ) | | 15 |
|
| |
ITEM 4.CONTROLS AND PROCEDURES
| CONTROLS AND PROCEDURES |
We maintain a set of disclosure controls and procedures that are designed to ensure that information required to be disclosed by us in the reports voluntarily filed by us under the Exchange Act, is recorded, processed, summarized and reported within the time periods specified in the SEC’s rules and forms. As of the end of the period covered by this report, we evaluated, under the supervision and with the participation of our management, including our President and Chief Financial Officer, the effectiveness of our disclosure controls and procedures pursuant to Rule 13a-15 of the Exchange Act. Based on that evaluation, our President and Chief Financial Officer concluded that our disclosure controls and procedures are effective.
During the most recent fiscal quarter, there have been no changes in our internal control over financial reporting that have materially affected, or are reasonably likely to materially affect, our internal control over financial reporting.
PART II. OTHER INFORMATION
| |
ITEM 1.LEGAL PROCEEDINGS | LEGAL PROCEEDINGS |
We may in the future be involved as a party to various legal proceedings, which are incidental to the ordinary course of business. We regularly analyze current information and, as necessary, provide accruals for probable liabilities on the eventual disposition of these matters. There have been no material changes to the legal proceedings disclosed in our annual report on Form 10-K for the fiscal year ended December 31, 2019.2020.
ITEM 1A. RISK FACTORS
ITEM 6. EXHIBITS
| | | | | | | | | |
| | |
Exhibit No. | | Description |
10.1*Exhibit No. | | Description | | | | | |
| 10.1* | | Change orders to the Amended and Restated Fixed Price Separated Turnkey Agreement for the Engineering, Procurement and Construction of the Corpus Christi Stage 2 Liquefaction Facility, dated as of December 12, 2017, between CCL and Bechtel Oil, Gas and Chemicals, Inc.: (i) the Change Order CO-00031CO-00043 Early Turnover of Tank B, Isolation of Proposed 4th In-Tank LNG Pump (Post Start-Up of Tank B) - EPC, dated April 1, 2020, (ii) the Change Order CO-00032 Train 3 Thermowell Upgrades, dated April 3, 2020, (iii) the Change Order CO-00033 Tank B Rundown Line (Part 2) Development Costs, dated April 29, 2020 and (iv) the Change Order CO-00034 Train 3 UPS Modification of MV Motors, dated May 21, 2020January 13, 2021 (Portions of this exhibit have been omitted) | | | | | |
| 22.1 | | | | | | | |
| 31.1* | | | | | | | |
| 32.1** | | | | | | | |
| 101.INS* | | XBRL Instance Document | | | | | |
| 101.SCH* | | XBRL Taxonomy Extension Schema Document | | | | | |
| 101.CAL* | | XBRL Taxonomy Extension Calculation Linkbase Document | | | | | |
| 101.DEF* | | XBRL Taxonomy Extension Definition Linkbase Document | | | | | |
| 101.LAB* | | XBRL Taxonomy Extension Labels Linkbase Document | | | | | |
| 101.PRE* | | XBRL Taxonomy Extension Presentation Linkbase Document | | | | | |
| 104* | | Cover Page Interactive Data File (formatted as Inline XBRL and contained in Exhibit 101) | | | | | |
| | | | | |
| |
| * | Filed herewith. |
| ** | Furnished herewith. |
| |
Pursuant to the requirements of the Securities Exchange Act of 1934, the registrant has duly caused this report to be signed on its behalf by the undersigned, thereunto duly authorized.
| | | | | | | | | | | |
| | CHENIERE CORPUS CHRISTI HOLDINGS, LLC |
| | | |
| Date: | May 3, 2021 | By: | /s/ Zach Davis |
| | | Zach Davis |
| | | President and Chief Financial Officer |
| | | (Principal Executive and Financial Officer) |
| | | |
| | | |
| Date: | May 3, 2021 | CHENIERE CORPUS CHRISTI HOLDINGS, LLC |
| By: | | | |
Date: | August 5, 2020 | By: | /s/ Michael J. Wortley |
| | | Michael J. Wortley |
| | | President and Chief Financial Officer |
| | | (Principal Executive and Financial Officer) |
| | | |
Date: | August 5, 2020 | By: | /s/ Leonard E. Travis |
| | | Leonard E. Travis |
| | | Chief Accounting Officer |
| | | (on behalf of the registrant and
as principal accounting officer) |