UNITED STATES
SECURITIES AND EXCHANGE COMMISSION
Washington, D.C. 20549
FORM 10-Q
☒ QUARTERLY REPORT PURSUANT TO SECTION 13 OR 15(d) OF THE SECURITIES EXCHANGE ACT OF 1934
For the quarterly period ended June 30, 2022March 31, 2023
or
☐ TRANSITION REPORT PURSUANT TO SECTION 13 OR 15(d) OF THE SECURITIES EXCHANGE ACT OF 1934
For the transition period from to
Commission file number 333-215435
Cheniere Corpus Christi Holdings, LLC
(Exact name of registrant as specified in its charter)
| | | | | |
| Delaware | 47-1929160 |
| (State or other jurisdiction of incorporation or organization) | (I.R.S. Employer Identification No.) |
700 Milam Street, Suite 1900
Houston, Texas 77002
(Address of principal executive offices) (Zip Code)
(713) 375-5000
(Registrant’s telephone number, including area code)
Securities registered pursuant to Section 12(b) of the Act:
| | | | | | | | |
| Title of each class | Trading Symbol | Name of each exchange on which registered |
| None | None | None |
Indicate by check mark whether the registrant (1) has filed all reports required to be filed by Section 13 or 15(d) of the Securities Exchange Act of 1934 during the preceding 12 months (or for such shorter period that the registrant was required to file such reports), and (2) has been subject to such filing requirements for the past 90 days. Yes ☐ No ☒
Note: The registrant wasis a voluntary filer until March 25, 2022. Thenot subject to the filing requirements of Section 13 or 15(d) of the Securities Exchange Act of 1934. However, the registrant has filed all reports required pursuant to Sections 13 or 15(d) during the preceding 12 months as if the registrant was subject to such filing requirements.
Indicate by check mark whether the registrant has submitted electronically every Interactive Data File required to be submitted pursuant to Rule 405 of Regulation S-T (§232.405 of this chapter) during the preceding 12 months (or for such shorter period that the registrant was required to submit such files). Yes ☒ No ☐
Indicate by check mark whether the registrant is a large accelerated filer, an accelerated filer, a non-accelerated filer, a smaller reporting company, or an emerging growth company. See the definitions of “large accelerated filer,” “accelerated filer,” “smaller reporting company” and “emerging growth company” in Rule 12b-2 of the Exchange Act.
| | | | | | | | | | | | | | | | | |
| Large accelerated filer | ☐ | | Accelerated filer | ☐ |
| Non-accelerated filer | ☒ | | Smaller reporting company | ☐ |
| | | | Emerging growth company | ☐ |
If an emerging growth company, indicate by check mark if the registrant has elected not to use the extended transition period for complying with any new or revised financial accounting standards provided pursuant to Section 13(a) of the Exchange Act. ☐
Indicate by check mark whether the registrant is a shell company (as defined in Rule 12b-2 of the Exchange Act). Yes ☐ No ☒
Indicate the number of shares outstanding of the issuer’s classes of common stock, as of the latest practicable date: Not applicable
CHENIERE CORPUS CHRISTI HOLDINGS, LLC
TABLE OF CONTENTS
DEFINITIONS
As used in this quarterly report, the terms listed below have the following meanings:
Common Industry and Other Terms
| | | | | | | | |
| ASU | | Accounting Standards Update |
| Bcf | | billion cubic feet |
| Bcf/d | | billion cubic feet per day |
| Bcf/yr | | billion cubic feet per year |
| Bcfe | | billion cubic feet equivalent |
| DAT | | delivered at terminal |
| DOE | | U.S. Department of Energy |
| EPC | | engineering, procurement and construction |
| FASB | | Financial Accounting Standards Board |
| FERC | | Federal Energy Regulatory Commission |
| FID | | final investment decision |
| FOB | | free-on-board |
| FTA countries | | countries with which the United States has a free trade agreement providing for national treatment for trade in natural gas |
| GAAP | | generally accepted accounting principles in the United States |
| Henry Hub | | the final settlement price (in USD per MMBtu) for the New York Mercantile Exchange’s Henry Hub natural gas futures contract for the month in which a relevant cargo’s delivery window is scheduled to begin |
| IPM agreements | | integrated production marketing agreements in which the gas producer sells to us gas on a global LNG index price, less a fixed liquefaction fee, shipping and other costs |
| LIBOR | | London Interbank Offered Rate |
| LNG | | liquefied natural gas, a product of natural gas that, through a refrigeration process, has been cooled to a liquid state, which occupies a volume that is approximately 1/600th of its gaseous state |
| MMBtu | | million British thermal units; one British thermal unit measures the amount of energy required to raise the temperature of one pound of water by one degree Fahrenheit |
| mtpa | | million tonnes per annum |
| | |
| non-FTA countries | | countries with which the United States does not have a free trade agreement providing for national treatment for trade in natural gas and with which trade is permitted |
| SEC | | U.S. Securities and Exchange Commission |
| SOFR | | Secured Overnight Financing Rate |
| SPA | | LNG sale and purchase agreement |
| TBtu | | trillion British thermal units; one British thermal unit measures the amount of energy required to raise the temperature of one pound of water by one degree Fahrenheit |
| Train | | an industrial facility comprised of a series of refrigerant compressor loops used to cool natural gas into LNG |
Abbreviated Legal Entity Structure
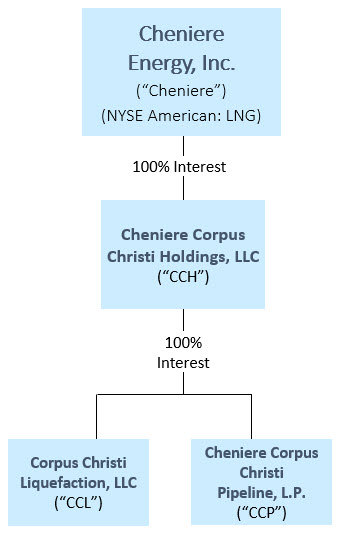
The following diagram depicts our abbreviated legal entity structure as of June 30, 2022,March 31, 2023, including our ownership of certain subsidiaries, and the references to these entities used in this quarterly report:
Unless the context requires otherwise, references to “CCH,” the “Company,” “we,” “us,” and “our” refer to Cheniere Corpus Christi Holdings, LLC and its consolidated subsidiaries.
In June 2022, as part of the internal restructuring of Cheniere’s subsidiaries, Cheniere contributed its equity interest in Corpus Christi Liquefaction Stage III, LLC (“CCL Stage III”), formerly a wholly owned direct subsidiary of Cheniere, to us, and CCL Stage III was subsequently merged with and into CCL, the surviving entity of the merger and our wholly owned subsidiary.
PART I. FINANCIAL INFORMATION
ITEM 1. CONSOLIDATED FINANCIAL STATEMENTS
CHENIERE CORPUS CHRISTI HOLDINGS, LLC
CONSOLIDATED STATEMENTS OF OPERATIONS
(in millions)
(unaudited)
| | | Three Months Ended June 30, | | Six Months Ended June 30, | | | | Three Months Ended March 31, |
| | 2022 | | 2021 | | 2022 | | 2021 | | | | | 2023 | | 2022 | |
| Revenues | Revenues | | | | | | | | | Revenues | | | | | | |
| LNG revenues | LNG revenues | $ | 1,607 | | | $ | 826 | | | $ | 2,931 | | | $ | 1,441 | | | LNG revenues | | | $ | 1,093 | | | $ | 1,324 | | |
| LNG revenues—affiliate | LNG revenues—affiliate | 763 | | | 331 | | | 1,434 | | | 599 | | | LNG revenues—affiliate | | | 555 | | | 671 | | |
| | Total revenues | Total revenues | 2,370 | | | 1,157 | | | 4,365 | | | 2,040 | | | Total revenues | | | 1,648 | | | 1,995 | | |
| | Operating costs and expenses | | | |
| Cost of sales (excluding items shown separately below) | 2,442 | | | 799 | | | 4,783 | | | 985 | | | |
| Operating costs and expenses (recovery) | | Operating costs and expenses (recovery) | | | |
| Cost (recovery) of sales (excluding items shown separately below) | | Cost (recovery) of sales (excluding items shown separately below) | | | (2,540) | | | 2,341 | | |
| Cost of sales—affiliate | Cost of sales—affiliate | 36 | | | 2 | | | 48 | | | 37 | | | Cost of sales—affiliate | | | 15 | | | 12 | | |
| Cost of sales—related party | — | | | 36 | | | — | | | 71 | | | |
| | Operating and maintenance expense | Operating and maintenance expense | 118 | | | 120 | | | 231 | | | 203 | | | Operating and maintenance expense | | | 116 | | | 113 | | |
| Operating and maintenance expense—affiliate | Operating and maintenance expense—affiliate | 28 | | | 28 | | | 58 | | | 52 | | | Operating and maintenance expense—affiliate | | | 30 | | | 30 | | |
| Operating and maintenance expense—related party | Operating and maintenance expense—related party | 3 | | | 3 | | | 5 | | | 5 | | | Operating and maintenance expense—related party | | | 2 | | | 2 | | |
| Development expense | 1 | | | — | | | 1 | | | — | | | |
| | | General and administrative expense | General and administrative expense | 2 | | | 2 | | | 4 | | | 3 | | | General and administrative expense | | | 2 | | | 2 | | |
| General and administrative expense—affiliate | General and administrative expense—affiliate | 8 | | | 7 | | | 16 | | | 12 | | | General and administrative expense—affiliate | | | 12 | | | 8 | | |
| Depreciation and amortization expense | Depreciation and amortization expense | 112 | | | 110 | | | 222 | | | 199 | | | Depreciation and amortization expense | | | 112 | | | 110 | | |
| Other | 3 | | | 1 | | | 3 | | | 1 | | | |
| Total operating costs and expenses | 2,753 | | | 1,108 | | | 5,371 | | | 1,568 | | | |
| | Total operating costs and expenses (recovery) | | Total operating costs and expenses (recovery) | | | (2,251) | | | 2,618 | | |
| | Income (loss) from operations | Income (loss) from operations | (383) | | | 49 | | | (1,006) | | | 472 | | | Income (loss) from operations | | | 3,899 | | | (623) | | |
| | Other income (expense) | Other income (expense) | | | Other income (expense) | | | |
| Interest expense, net of capitalized interest | Interest expense, net of capitalized interest | (116) | | | (118) | | | (234) | | | (211) | | | Interest expense, net of capitalized interest | | | (63) | | | (118) | | |
| Loss on modification or extinguishment of debt | Loss on modification or extinguishment of debt | (28) | | | — | | | (30) | | | — | | | Loss on modification or extinguishment of debt | | | (10) | | | (2) | | |
| Interest rate derivative gain (loss), net | (1) | | | (2) | | | 2 | | | (1) | | | |
| Interest rate derivative gain, net | | Interest rate derivative gain, net | | | — | | | 3 | | |
| Other income, net | Other income, net | 1 | | | — | | | 1 | | | — | | | Other income, net | | | 3 | | | — | | |
| Total other expense | Total other expense | (144) | | | (120) | | | (261) | | | (212) | | | Total other expense | | | (70) | | | (117) | | |
| | | Net income (loss) | Net income (loss) | $ | (527) | | | $ | (71) | | | $ | (1,267) | | | $ | 260 | | | Net income (loss) | | | $ | 3,829 | | | $ | (740) | | |
The accompanying notes are an integral part of these consolidated financial statements.
3
CHENIERE CORPUS CHRISTI HOLDINGS, LLC AND SUBSIDIARIES
CONSOLIDATED BALANCE SHEETS
(in millions)
| | | | June 30, | | December 31, | | March 31, | | December 31, |
| | 2022 | | 2021 | | 2023 | | 2022 |
| ASSETS | ASSETS | | (unaudited) | | | ASSETS | | (unaudited) | | |
| Current assets | Current assets | | Current assets | |
| | Restricted cash and cash equivalents | Restricted cash and cash equivalents | | $ | 51 | | | $ | 44 | | Restricted cash and cash equivalents | | $ | 93 | | | $ | 738 | |
| Trade and other receivables, net of current expected credit losses | Trade and other receivables, net of current expected credit losses | | 441 | | | 280 | | Trade and other receivables, net of current expected credit losses | | 140 | | | 348 | |
| Accounts receivable—affiliate | | 307 | | | 315 | | |
| Trade receivables—affiliate | | Trade receivables—affiliate | | 157 | | | 240 | |
| Advances to affiliate | Advances to affiliate | | 76 | | | 128 | | Advances to affiliate | | 93 | | | 132 | |
| Inventory | Inventory | | 152 | | | 156 | | Inventory | | 120 | | | 178 | |
| Current derivative assets | Current derivative assets | | 30 | | | 17 | | Current derivative assets | | 20 | | | 12 | |
| | Margin deposits | Margin deposits | | 25 | | | 13 | | Margin deposits | | 14 | | | 76 | |
| Other current assets | Other current assets | | 30 | | | 15 | | Other current assets | | 10 | | | 18 | |
| | Total current assets | Total current assets | | 1,112 | | | 968 | | Total current assets | | 647 | | | 1,742 | |
| | | Property, plant and equipment, net of accumulated depreciation | Property, plant and equipment, net of accumulated depreciation | | 13,117 | | | 12,607 | | Property, plant and equipment, net of accumulated depreciation | | 14,030 | | | 13,673 | |
| Debt issuance and deferred financing costs, net of accumulated amortization | | 43 | | | 7 | | |
| Debt issuance, net of accumulated amortization | | Debt issuance, net of accumulated amortization | | 39 | | | 40 | |
| Derivative assets | Derivative assets | | 108 | | | 37 | | Derivative assets | | 168 | | | 7 | |
| | Other non-current assets, net | Other non-current assets, net | | 351 | | | 145 | | Other non-current assets, net | | 307 | | | 225 | |
| | Total assets | Total assets | | $ | 14,731 | | | $ | 13,764 | | Total assets | | $ | 15,191 | | | $ | 15,687 | |
| | LIABILITIES AND MEMBER’S EQUITY (DEFICIT) | | | | |
| LIABILITIES AND MEMBER’S EQUITY | | LIABILITIES AND MEMBER’S EQUITY | | | |
| Current liabilities | Current liabilities | | | | Current liabilities | | | |
| Accounts payable | Accounts payable | | $ | 87 | | | $ | 119 | | Accounts payable | | $ | 14 | | | $ | 85 | |
| | Accrued liabilities | Accrued liabilities | | 796 | | | 631 | | Accrued liabilities | | 398 | | | 901 | |
| Accrued liabilities—related party | Accrued liabilities—related party | | 1 | | | 1 | | Accrued liabilities—related party | | 1 | | | 1 | |
| Current debt, net of discount and debt issuance costs | Current debt, net of discount and debt issuance costs | | — | | | 366 | | Current debt, net of discount and debt issuance costs | | — | | | 495 | |
| Due to affiliates | Due to affiliates | | 28 | | | 35 | | Due to affiliates | | 26 | | | 43 | |
| Current derivative liabilities | Current derivative liabilities | | 1,162 | | | 668 | | Current derivative liabilities | | 818 | | | 1,374 | |
| Other current liabilities | Other current liabilities | | 1 | | | 1 | | Other current liabilities | | 2 | | | 1 | |
| Other current liabilities—affiliate | | 1 | | | — | | |
| | Total current liabilities | Total current liabilities | | 2,076 | | | 1,821 | | Total current liabilities | | 1,259 | | | 2,900 | |
| | Long-term debt, net of discount and debt issuance costs | Long-term debt, net of discount and debt issuance costs | | 9,168 | | | 9,986 | | Long-term debt, net of discount and debt issuance costs | | 6,307 | | | 6,698 | |
| Derivative liabilities | Derivative liabilities | | 3,955 | | | 638 | | Derivative liabilities | | 2,250 | | | 4,923 | |
| | Other non-current liabilities | Other non-current liabilities | | 58 | | | 38 | | Other non-current liabilities | | 77 | | | 78 | |
| Other non-current liabilities—affiliate | Other non-current liabilities—affiliate | | 3 | | | — | | Other non-current liabilities—affiliate | | 4 | | | 4 | |
| | | Member’s equity (deficit) | | (529) | | | 1,281 | | |
| Total liabilities and member’s equity (deficit) | | $ | 14,731 | | | $ | 13,764 | | |
| Member’s equity | | Member’s equity | | 5,294 | | | 1,084 | |
| Total liabilities and member’s equity | | Total liabilities and member’s equity | | $ | 15,191 | | | $ | 15,687 | |
The accompanying notes are an integral part of these consolidated financial statements.
4
CHENIERE CORPUS CHRISTI HOLDINGS, LLC AND SUBSIDIARIES
CONSOLIDATED STATEMENTS OF MEMBER’S EQUITY (DEFICIT)
(in millions)
(unaudited)
| | | | | | | | | | | |
| Three and Six Months Ended June 30, 2022 | | | |
| Cheniere CCH HoldCo I, LLC | | Total Member’s Deficit |
| | | |
| | | |
| | | |
| | | |
| | | |
| | | |
| | | |
| | | |
| Balance at December 31, 2021 | $ | 1,281 | | | $ | 1,281 | |
| Capital contributions | 138 | | | 138 | |
| Net loss | (740) | | | (740) | |
| Balance at March 31, 2022 | 679 | | | 679 | |
| | | |
| | | |
| | | |
| Contributions | 801 | | | 801 | |
| | | |
| | | |
Contribution of CCL Stage III entity (see Note 2) | (1,482) | | | (1,482) | |
| Net loss | (527) | | | (527) | |
| Balance at June 30, 2022 | $ | (529) | | | $ | (529) | |
| | | | | | | | | | | |
| Three Months Ended March 31, 2023 | | | |
| Cheniere CCH HoldCo I, LLC | | Total Member’s Equity |
| | | |
| | | |
| | | |
| | | |
| | | |
| | | |
| | | |
| | | |
| Balance at December 31, 2022 | $ | 1,084 | | | $ | 1,084 | |
| | | |
| | | |
| | | |
| | | |
| | | |
| | | |
| | | |
| Contributions (excluding items shown separately below) | 45 | | | 45 | |
| | | |
Contributions of cancelled senior secured notes (see Note 8) | 396 | | | 396 | |
| Distributions | (60) | | | (60) | |
| Net income | 3,829 | | | 3,829 | |
| Balance at March 31, 2023 | $ | 5,294 | | | $ | 5,294 | |
| | | | | | | | | | | |
| Three and Six Months Ended June 30, 2021 | | | |
| Cheniere CCH HoldCo I, LLC | | Total Member’s Equity |
| Balance at December 31, 2020 | $ | 2,624 | | | $ | 2,624 | |
| Net income | 331 | | | 331 | |
| Balance at March 31, 2021 | 2,955 | | | 2,955 | |
| Capital distributions | (337) | | | (337) | |
| Net loss | (71) | | | (71) | |
| Balance at June 30, 2021 | $ | 2,547 | | | $ | 2,547 | |
| | | |
| | | |
| | | |
| | | |
| | | |
| | | | | | | | | | | |
| Three Months Ended March 31, 2022 | | | |
| Cheniere CCH HoldCo I, LLC | | Total Member’s Equity |
| Balance at December 31, 2021 | $ | 1,281 | | | $ | 1,281 | |
| Contributions | 138 | | | 138 | |
| Net loss | (740) | | | (740) | |
| Balance at March 31, 2022 | $ | 679 | | | $ | 679 | |
| | | |
| | | |
| | | |
| | | |
| | | |
| | | |
| | | |
| | | |
The accompanying notes are an integral part of these consolidated financial statements.
5
CHENIERE CORPUS CHRISTI HOLDINGS, LLC AND SUBSIDIARIES
CONSOLIDATED STATEMENTS OF CASH FLOWS
(in millions)
(unaudited)
| | | Six Months Ended June 30, | | Three Months Ended March 31, |
| | 2022 | | 2021 | | | 2023 | | 2022 | |
| Cash flows from operating activities | Cash flows from operating activities | | | | | Cash flows from operating activities | | | | |
| Net income (loss) | Net income (loss) | $ | (1,267) | | | $ | 260 | | | Net income (loss) | $ | 3,829 | | | $ | (740) | | |
| Adjustments to reconcile net income (loss) to net cash provided by operating activities: | Adjustments to reconcile net income (loss) to net cash provided by operating activities: | | | Adjustments to reconcile net income (loss) to net cash provided by operating activities: | | |
| Depreciation and amortization expense | Depreciation and amortization expense | 222 | | | 199 | | | Depreciation and amortization expense | 112 | | | 110 | | |
| Amortization of discount and debt issuance costs | Amortization of discount and debt issuance costs | 11 | | | 12 | | | Amortization of discount and debt issuance costs | 3 | | | 6 | | |
| Loss on modification or extinguishment of debt | Loss on modification or extinguishment of debt | 30 | | | — | | | Loss on modification or extinguishment of debt | 10 | | | 2 | | |
| Total losses on derivatives instruments, net | 1,871 | | | 249 | | | |
| Total gains on derivatives, net—related party | — | | | (7) | | | |
| Net cash used for settlement of derivative instruments | (82) | | | (35) | | | |
| Total losses (gains) on derivative instruments, net | | Total losses (gains) on derivative instruments, net | (3,406) | | | 1,052 | | |
| | Net cash provided by (used for) settlement of derivative instruments | | Net cash provided by (used for) settlement of derivative instruments | 8 | | | (30) | | |
| | Other | Other | 4 | | | 2 | | | Other | 4 | | | — | | |
| Changes in operating assets and liabilities: | Changes in operating assets and liabilities: | | | Changes in operating assets and liabilities: | | |
| Trade and other receivables, net of current expected credit losses | Trade and other receivables, net of current expected credit losses | (161) | | | 34 | | | Trade and other receivables, net of current expected credit losses | 208 | | | 83 | | |
| Accounts receivable—affiliate | 9 | | | (48) | | | |
| Trade receivables—affiliate | | Trade receivables—affiliate | 82 | | | (2) | | |
| Advances to affiliate | Advances to affiliate | (6) | | | 56 | | | Advances to affiliate | 37 | | | 37 | | |
| Inventory | Inventory | 2 | | | (9) | | | Inventory | 58 | | | 22 | | |
| Margin deposits | Margin deposits | (12) | | | (1) | | | Margin deposits | 61 | | | 51 | | |
| Accounts payable and accrued liabilities | Accounts payable and accrued liabilities | 145 | | | 65 | | | Accounts payable and accrued liabilities | (506) | | | (28) | | |
| Accrued liabilities—related party | — | | | 1 | | | |
| | Due to affiliates | Due to affiliates | (9) | | | (4) | | | Due to affiliates | (17) | | | (15) | | |
| | Other, net | Other, net | (15) | | | (41) | | | Other, net | (1) | | | (95) | | |
| | Net cash provided by operating activities | Net cash provided by operating activities | 742 | | | 733 | | | Net cash provided by operating activities | 482 | | | 453 | | |
| | Cash flows from investing activities | Cash flows from investing activities | | | | Cash flows from investing activities | | | |
| Property, plant and equipment | Property, plant and equipment | (406) | | | (203) | | | Property, plant and equipment | (606) | | | (45) | | |
| Other | — | | | (1) | | | |
| | Net cash used in investing activities | Net cash used in investing activities | (406) | | | (204) | | | Net cash used in investing activities | (606) | | | (45) | | |
| | Cash flows from financing activities | Cash flows from financing activities | | | | Cash flows from financing activities | | | |
| Proceeds from issuances of debt | 440 | | | — | | | |
| | Repayments of debt | Repayments of debt | (1,640) | | | (140) | | | Repayments of debt | (498) | | | (540) | | |
| Debt issuance and deferred financing costs | (18) | | | — | | | |
| | Debt extinguishment costs | Debt extinguishment costs | (43) | | | — | | | Debt extinguishment costs | (8) | | | — | | |
| Capital contributions | 932 | | | — | | | |
| Contributions | | Contributions | 45 | | | 138 | | |
| Distributions | Distributions | — | | | (337) | | | Distributions | (60) | | | — | | |
| Net cash used in financing activities | Net cash used in financing activities | (329) | | | (477) | | | Net cash used in financing activities | (521) | | | (402) | | |
| | Net increase in restricted cash and cash equivalents | 7 | | | 52 | | | |
| Net increase (decrease) in restricted cash and cash equivalents | | Net increase (decrease) in restricted cash and cash equivalents | (645) | | | 6 | | |
| Restricted cash and cash equivalents—beginning of period | Restricted cash and cash equivalents—beginning of period | 44 | | | 70 | | | Restricted cash and cash equivalents—beginning of period | 738 | | | 44 | | |
| Restricted cash and cash equivalents—end of period | Restricted cash and cash equivalents—end of period | $ | 51 | | | $ | 122 | | | Restricted cash and cash equivalents—end of period | $ | 93 | | | $ | 50 | | |
The accompanying notes are an integral part of these consolidated financial statements.
6
CHENIERE CORPUS CHRISTI HOLDINGS, LLC AND SUBSIDIARIES
NOTES TO CONSOLIDATED FINANCIAL STATEMENTS
(unaudited)
NOTE 1—NATURE OF OPERATIONS AND BASIS OF PRESENTATION
We operate a natural gas liquefaction and export facility located near Corpus Christi, Texas (the “Corpus Christi LNG Terminal”) through CCL, which has 3three operational Trains for a total production capacity of approximately 15 mtpa of LNG, 3three LNG storage tanks and 2two marine berths. Additionally, we are constructing an expansion of the Corpus Christi LNG Terminal (the “Corpus Christi Stage 3 Project”) for up to 7seven midscale Trains with an expected total production capacity of over 10 mtpa of LNG.
CCL Stage III, CCL and CCP received approval from FERC in November 2019 to site, construct and operate the Corpus Christi Stage 3 Project. In March 2022, CCL Stage III issued limited notice to proceed to Bechtel Energy Inc. (“Bechtel”) to commence early engineering, procurement and site works. In June 2022, Cheniere’s board of directors made a positive FID with respect to the investment in the construction and operation of the Corpus Christi Stage 3 Project and issued a full notice to proceed with construction to Bechtel effective June 16, 2022. In connection with the positive FID, CCL Stage III, through which Cheniere was developing and constructing the Corpus Christi Stage 3 Project, was contributed to us from Cheniere (the “Contribution”) on June 15, 2022. Immediately following the Contribution, CCL Stage III was merged with and into CCL (the “Merger”), the surviving entity of the merger and our wholly owned subsidiary. Refer to Note 2—CCL Stage III Contribution and Merger for additional information on the Contribution and Merger of CCL Stage III.
Through our subsidiary CCP, we also own a 21.5-mile natural gas supply pipeline that interconnects the Corpus Christi LNG Terminal with several interstate and intrastate natural gas pipelines (the “Corpus Christi Pipeline” and together with the existing operational Trains, midscale trains, storage tanksCorpus Christi LNG Terminal and marine berths,the Corpus Christi Stage 3 Project, the “Liquefaction Project”).
We have increased available liquefaction capacity at our Liquefaction Project as a result of debottlenecking and other optimization projects. We hold a significant land position at the Corpus Christi LNG Terminal which provides opportunity for further liquefaction capacity expansion. In March 2023, CCL and another subsidiary of Cheniere submitted an application with the FERC under the Natural Gas Act for an expansion adjacent to the Liquefaction Project consisting of two midscale Trains with an expected total production capacity of approximately 3 mtpa of LNG. The development of this site or other projects, including infrastructure projects in support of natural gas supply and LNG demand, will require, among other things, acceptable commercial and financing arrangements before we make a positive FID.
Basis of Presentation
The accompanying unaudited Consolidated Financial Statements of CCH have been prepared in accordance with GAAP for interim financial information and in accordance with Rule 10-01 of Regulation S-X.S-X and reflect all normal recurring adjustments which are, in the opinion of management, necessary for a fair statement of the financial results for the interim periods presented. Accordingly, they do not include all of the information and footnotes required by GAAP for complete financial statements and should be read in conjunction with the Consolidated Financial Statements and accompanying notes included in our annual report on Form 10-K for the fiscal year ended December 31, 20212022.
Results of operations for the three and six months ended June 30, 2022March 31, 2023 are not necessarily indicative of the results of operations that will be realized for the year ending December 31, 2022.2023.
We are a disregarded entity for federal and state income tax purposes. Our taxable income or loss, which may vary substantially from the net income or loss reported on our Consolidated Statements of Operations, is included in the consolidated federal income tax return of Cheniere. Accordingly, no provision or liability for federal or state income taxes is included in the accompanying Consolidated Financial Statements.
Recent Accounting Standards
ASU 2020-04
In March 2020, the FASB issued ASU 2020-04, Reference Rate Reform (Topic 848): Facilitation of the Effects of Reference Rate Reform on Financial Reporting. This guidance primarily provides temporary optional expedients which simplify the accounting for contract modifications to existing contracts expected to arise from the market transition from LIBOR to alternative reference rates. The transition periodtemporary optional expedients under thisthe standard isbecame effective March 12, 2020 and will apply throughbe available until December 31, 2022.
CHENIERE CORPUS CHRISTI HOLDINGS, LLC AND SUBSIDIARIES
NOTES TO CONSOLIDATED FINANCIAL STATEMENTS
(unaudited)
We had interest rate swaps andhave various credit facilities indexed to LIBOR, as further described in Note 7—Derivative Instruments and Note 9—8—Debt, respectively.. In June 2022, we amended our credit facilities to bear interest at a variable rate per annum based on SOFR as a result of the expected LIBOR transition. Since adoption of the standard, we elected to apply the optional expedients as applicable to certain modified facilities,facilities; however, the impact of applying the optional expedients was not material, and the transition to SOFR or other replacement rate indexes doesdid not have a material impact on our cash flows.
NOTE 2—CCL STAGE III CONTRIBUTION AND MERGER
As described in Note 1—Nature of Operations and Basis of Presentation, the Contribution of the CCL Stage III legal entity to us from Cheniere occurred on the June 15, 2022, which was immediately followed by the Merger, in which CCL Stage III was merged with and into CCL, with CCL continuing as the surviving company.
The Contribution was accounted for as a common control transaction as the assets and liabilities were transferred between entities under Cheniere’s control. As a result, the net liability transfer was recognized as a distribution in our Statement of Member’s Equity (Deficit) and at the historical basis of Cheniere on June 15, 2022 in our Consolidated Balance Sheets. The Contribution has been presented prospectively as we have concluded that the Contribution did not represent a change in our reporting entity, primarily as we concluded that CCL Stage III did not constitute a business under FASB topic Accounting Standards Codification 805, Business Combinations. The Merger had no impact on our Consolidated Financial Statements as it occurred between our consolidated subsidiaries.
The net liabilities of CCL Stage III contributed to us and recognized on our Consolidated Balance Sheets on June 15, 2022 consisted of the following (in millions):
| | | | | | | | |
| | June 15, |
| | 2022 |
ASSETS | | |
| | |
Property, plant and equipment, net of accumulated depreciation | | $ | 441 | |
Derivatives assets | | 112 | |
Other non-current assets, net | | 19 | |
Total assets | | $ | 572 | |
| | |
LIABILITIES AND MEMBER’S DEFICIT | | |
Current liabilities | | |
Accounts payable | | $ | 3 | |
Due to affiliates | | 1 | |
Total current liabilities | | 4 | |
| | |
Derivative liabilities | | 2,050 | |
| | |
Total net liabilities contributed | | $ | (1,482) | |
Amended and Restated Debt Agreements
In June 2022, in connection with the FID with respect to the Corpus Christi Stage 3 Project referenced above, CCH amended and restated its term loan credit facility (the “CCH Credit Facility”) and its working capital facility (“CCH Working Capital Facility”) to, among other things, (1) increase the commitments to approximately $4.0 billion and $1.5 billion for the CCH Credit Facility and the CCH Working Capital Facility, respectively, (2) extend the maturity of the CCH Credit Facility to the earlier of June 15, 2029 or two years after the substantial completion of the last Train of the Corpus Christi Stage 3 Project and of the CCH Working Capital Facility through June 15, 2027, (3) update the indexed interest rate to SOFR and (4) make certain other changes to the terms and conditions of the existing facility. See Note 9—Debt for additional information on our credit facilities.
CHENIERE CORPUS CHRISTI HOLDINGS, LLC AND SUBSIDIARIES
NOTES TO CONSOLIDATED FINANCIAL STATEMENTS—CONTINUED
(unaudited)
NOTE 3—2—RESTRICTED CASH AND CASH EQUIVALENTS
Restricted cash and cash equivalents consist of funds that are contractually or legally restricted as to usage or withdrawal. As of June 30, 2022 and December 31, 2021, we had $51 million and $44 million of restricted cash and cash equivalents, respectively.
Pursuant to the accounts agreement entered into with the collateral trustee for the benefit of our debt holders, we are required to deposit all cash received into reserve accounts controlled by the collateral trustee. The usage or withdrawal of such cash is restricted to the payment of liabilities related to the Liquefaction Project and other restricted payments.
As of March 31, 2023 and December 31, 2022, we had $93 million and $738 million of restricted cash and cash equivalents, respectively, as required by the above agreement, of which $498 million as of December 31, 2022 related to the cash contributed from Cheniere for the redemption of the remaining outstanding principal balance of the 7.000% Senior Notes due 2024 (the “2024 CCH Senior Notes”) in January 2023.
NOTE 4—3—TRADE AND OTHER RECEIVABLES, NET OF CURRENT EXPECTED CREDIT LOSSES
Trade and other receivables, net of current expected credit losses consisted of the following (in millions):
| | | | June 30, | | December 31, | | March 31, | | December 31, |
| | 2022 | | 2021 | | 2023 | | 2022 |
| Trade receivables | Trade receivables | | $ | 394 | | | $ | 256 | | Trade receivables | | $ | 132 | | | $ | 319 | |
| Other receivables | Other receivables | | 47 | | | 24 | | Other receivables | | 8 | | | 29 | |
| Total trade and other receivables, net of current expected credit losses | Total trade and other receivables, net of current expected credit losses | | $ | 441 | | | $ | 280 | | Total trade and other receivables, net of current expected credit losses | | $ | 140 | | | $ | 348 | |
NOTE 5—4—INVENTORY
Inventory consisted of the following (in millions):
| | | | June 30, | | December 31, | | March 31, | | December 31, |
| | 2022 | | 2021 | | 2023 | | 2022 |
| Materials | Materials | | $ | 88 | | | $ | 88 | | Materials | | $ | 92 | | | $ | 92 | |
| LNG | LNG | | 40 | | | 45 | | LNG | | 7 | | | 53 | |
| | Natural gas | Natural gas | | 24 | | | 21 | | Natural gas | | 19 | | | 31 | |
| Other | Other | | — | | | 2 | | Other | | 2 | | | 2 | |
| Total inventory | Total inventory | | $ | 152 | | | $ | 156 | | Total inventory | | $ | 120 | | | $ | 178 | |
NOTE 6—5—PROPERTY, PLANT AND EQUIPMENT, NET OF ACCUMULATED DEPRECIATION
Property, plant and equipment, net of accumulated depreciation consisted of the following (in millions):
| | | | June 30, | | December 31, | | March 31, | | December 31, |
| | 2022 | | 2021 | | 2023 | | 2022 |
| LNG terminal | LNG terminal | | | | | LNG terminal | | | | |
| Terminal and interconnecting pipeline facilities | Terminal and interconnecting pipeline facilities | | $ | 13,281 | | | $ | 13,222 | | Terminal and interconnecting pipeline facilities | | $ | 13,324 | | | $ | 13,299 | |
| Site and related costs | Site and related costs | | 302 | | | 294 | | Site and related costs | | 302 | | | 302 | |
| Construction-in-process | Construction-in-process | | 729 | | | 66 | | Construction-in-process | | 1,928 | | | 1,486 | |
| Accumulated depreciation | Accumulated depreciation | | (1,200) | | | (981) | | Accumulated depreciation | | (1,532) | | | (1,421) | |
| Total LNG terminal, net of accumulated depreciation | Total LNG terminal, net of accumulated depreciation | | 13,112 | | | 12,601 | | Total LNG terminal, net of accumulated depreciation | | 14,022 | | | 13,666 | |
| Fixed assets | Fixed assets | | Fixed assets | |
| Fixed assets | Fixed assets | | 23 | | | 23 | | Fixed assets | | 28 | | | 26 | |
| Accumulated depreciation | Accumulated depreciation | | (18) | | | (17) | | Accumulated depreciation | | (20) | | | (19) | |
| Total fixed assets, net of accumulated depreciation | Total fixed assets, net of accumulated depreciation | | 5 | | | 6 | | Total fixed assets, net of accumulated depreciation | | 8 | | | 7 | |
| Property, plant and equipment, net of accumulated depreciation | Property, plant and equipment, net of accumulated depreciation | | $ | 13,117 | | | $ | 12,607 | | Property, plant and equipment, net of accumulated depreciation | | $ | 14,030 | | | $ | 13,673 | |
9Depreciation expense was $112 million and $110 million during three months ended March 31, 2023 and 2022, respectively.
CHENIERE CORPUS CHRISTI HOLDINGS, LLC AND SUBSIDIARIES
NOTES TO CONSOLIDATED FINANCIAL STATEMENTS—CONTINUED
(unaudited)
The following table shows depreciation expense and offsets to LNG terminal costs (in millions):
| | | | | | | | | | | | | | | | | | | | | | | | | | | | |
| | Three Months Ended June 30, | | Six Months Ended June 30, |
| | 2022 | | 2021 | | 2022 | | 2021 | | |
| Depreciation expense | | $ | 111 | | | $ | 110 | | | $ | 221 | | | $ | 198 | | | |
| Offsets to LNG terminal costs (1) | | — | | | — | | | — | | | 143 | | | |
(1)We recognize offsets to LNG terminal costs related to the sale of commissioning cargoes because these amounts were earned or loaded prior to the start of commercial operations of the respective Trains of the Liquefaction Project during the testing phase for its construction. We did not record any offsets to LNG terminal costs during the three months ended March 31, 2023 and 2022.
CHENIERE CORPUS CHRISTI HOLDINGS, LLC AND SUBSIDIARIES
NOTES TO CONSOLIDATED FINANCIAL STATEMENTS—CONTINUED
(unaudited)
NOTE 7—6—DERIVATIVE INSTRUMENTS
We haveCCL has entered into the following derivative instruments:
•interest rate swaps (“Interest Rate Derivatives”) to hedge the exposure to volatility in a portion of the floating-rate interest payments on our CCH Credit Facility, with the last of our Interest Rate Derivatives expiring in May 2022; and
•commodity derivatives consisting of natural gas and power supply contracts, including those under ourthe IPM agreements, for the development, commissioning and operation of the Liquefaction Project (“Physical Liquefaction Supply Derivatives”) and associated economic hedges (“Financial Liquefaction Supply Derivatives,” and collectively with the Physical Liquefaction Supply Derivatives, the(collectively, “Liquefaction Supply Derivatives”).
We recognize ourCCL’s derivative instruments as either assets or liabilities and measure those instruments at fair value. None of ourCCL’s derivative instruments are designated as cash flow or fair value hedging instruments, and changes in fair value are recorded within our Consolidated Statements of Operations to the extent not utilized for the commissioning process, in which case such changes are capitalized.
The following table shows the fair value of ourthe derivative instruments that are required to be measured at fair value on a recurring basis (in millions):
| | | | | | | | | | | | | | | | | | | | | | | | | | | | | | | | | | | | | | | | | | | | | | | |
| Fair Value Measurements as of |
| June 30, 2022 | | December 31, 2021 |
| Quoted Prices in Active Markets
(Level 1) | | Significant Other Observable Inputs
(Level 2) | | Significant Unobservable Inputs
(Level 3) | | Total | | Quoted Prices in Active Markets
(Level 1) | | Significant Other Observable Inputs
(Level 2) | | Significant Unobservable Inputs
(Level 3) | | Total |
| Interest Rate Derivatives liability | $ | — | | | $ | — | | | $ | — | | | $ | — | | | $ | — | | | $ | (40) | | | $ | — | | | $ | (40) | |
| | | | | | | | | | | | | | | |
| Liquefaction Supply Derivatives asset (liability) | (6) | | | 33 | | | (5,006) | | | (4,979) | | | 5 | | | 4 | | | (1,221) | | | (1,212) | |
| | | | | | | | | | | | | | | |
| | | | | | | | | | | | | | | |
| | | | | | | | | | | | | | | | | | | | | | | | | | | | | | | | | | | | | | | | | | | | | | | |
| Fair Value Measurements as of |
| March 31, 2023 | | December 31, 2022 |
| Quoted Prices in Active Markets
(Level 1) | | Significant Other Observable Inputs
(Level 2) | | Significant Unobservable Inputs
(Level 3) | | Total | | Quoted Prices in Active Markets
(Level 1) | | Significant Other Observable Inputs
(Level 2) | | Significant Unobservable Inputs
(Level 3) | | Total |
| | | | | | | | | | | | | | | |
| | | | | | | | | | | | | | | |
| Liquefaction Supply Derivatives asset (liability) | $ | 6 | | | $ | 38 | | | $ | (2,924) | | | $ | (2,880) | | | $ | (54) | | | $ | (19) | | | $ | (6,205) | | | $ | (6,278) | |
| | | | | | | | | | | | | | | |
| | | | | | | | | | | | | | | |
We value our Interest Rate Derivatives using an income-based approach utilizing observable inputs to the valuation model including interest rate curves, risk adjusted discount rates, credit spreads and other relevant data. We value our Liquefaction Supply Derivatives using a market or option-based approach incorporating present value techniques, as needed, using observable commodity price curves, when available, and other relevant data.
The fair value of our Physicalthe Liquefaction Supply Derivatives is predominantly driven by observable and unobservable market commodity prices and, as applicable to our natural gas supply contracts, our assessment of the associated events deriving fair value, including, but not limited to, evaluation of whether the respective market exists from the perspective of market participants as infrastructure is developed.
We include a significant portion of our Physicalthe Liquefaction Supply Derivatives as Level 3 within the valuation hierarchy as the fair value is developed through the use of internal models which incorporate significant unobservable inputs. In instances where observable data is unavailable, consideration is given to the assumptions that market participants would use in valuing the asset or liability. This includes assumptions about market risks, such as future prices of energy units for unobservable periods, liquidity and volatility.
CHENIERE CORPUS CHRISTI HOLDINGS, LLC AND SUBSIDIARIES
NOTES TO CONSOLIDATED FINANCIAL STATEMENTS—CONTINUED
(unaudited)
The Level 3 fair value measurements of the natural gas positions within our Physicalthe Liquefaction Supply Derivatives could be materially impacted by a significant change in certain natural gas and international LNG prices. The following table includes quantitative information for the unobservable inputs for ourthe Level 3 Physical Liquefaction Supply Derivatives as of June 30, 2022 and DecemberMarch 31, 2021:2023:
| | | | | | | | | | | | | | | | | | | | | | | | | | |
| | Net Fair Value Liability
(in millions) | | Valuation Approach | | Significant Unobservable Input | | Range of Significant Unobservable Inputs / Weighted Average (1) |
Physical Liquefaction Supply Derivatives | | $(5,006)(2,924) | | Market approach incorporating present value techniques | | Henry Hub basis spread | | $(1.802)(0.828) - $0.695$0.370 / $(0.100)$(0.159) |
| | | | Option pricing model | | International LNG pricing spread, relative to Henry Hub (2) | | 94%86% - 671%574% / 184%173% |
(1)Unobservable inputs were weighted by the relative fair value of the instruments.
(2)Spread contemplates U.S. dollar-denominated pricing.
Increases or decreases in basis or pricing spreads, in isolation, would decrease or increase, respectively, the fair value of our Physicalthe Liquefaction Supply Derivatives.
CHENIERE CORPUS CHRISTI HOLDINGS, LLC AND SUBSIDIARIES
NOTES TO CONSOLIDATED FINANCIAL STATEMENTS—CONTINUED
(unaudited)
The following table shows the changes in the fair value of ourthe Level 3 Physical Liquefaction Supply Derivatives including those with related parties (in millions):
| | | | | | | | | | | | | | | | | | | | | | | | | | | | |
| | Three Months Ended June 30, | | Six Months Ended June 30, |
| | 2022 | | 2021 (1) | | 2022 | | 2021 (1) | | |
| Balance, beginning of period | | $ | (2,235) | | | $ | (14) | | | $ | (1,221) | | | $ | 12 | | | |
| Realized and mark-to-market losses: | | | | | | | | | | |
| Included in cost of sales | | (634) | | | (255) | | | (1,678) | | | (314) | | | |
| Purchases and settlements: | | | | | | | | | | |
| Purchases | | (2,407) | | | 8 | | | (2,414) | | | 10 | | | |
| Settlements | | 270 | | | 1 | | | 307 | | | 32 | | | |
| | | | | | | | | | |
| Balance, end of period | | $ | (5,006) | | | $ | (260) | | | $ | (5,006) | | | $ | (260) | | | |
| Change in unrealized losses relating to instruments still held at end of period | | $ | (634) | | | $ | (255) | | | $ | (1,678) | | | $ | (314) | | | |
| | | | | | | | | | | | | | | | | | | | |
| | | | Three Months Ended March 31, |
| | | | | | 2023 | | 2022 | | |
| Balance, beginning of period | | | | | | $ | (6,205) | | | $ | (1,221) | | | |
| Realized and change in fair value gains (losses) included in net income (1): | | | | | | | | | | |
| Included in cost of sales, existing deals (2) | | | | | | 3,048 | | | (1,170) | | | |
| Included in cost of sales, new deals (3) | | | | | | — | | | — | | | |
| Purchases and settlements: | | | | | | | | | | |
| Purchases (4) | | | | | | — | | | (5) | | | |
| Settlements (5) | | | | | | 233 | | | 161 | | | |
| | | | | | | | | | |
| | | | | | | | | | |
| | | | | | | | | | |
| Balance, end of period | | | | | | $ | (2,924) | | | $ | (2,235) | | | |
| Favorable (unfavorable) changes in fair value relating to instruments still held at the end of the period | | | | | | $ | 3,048 | | | $ | (1,170) | | | |
(1)Does not include the realized value associated with derivative instruments that settle through physical delivery, as settlement is equal to contractually fixed price from trade date multiplied by contractual volume. See settlements line item in this table.
(2)Impact to earnings on deals that existed at the beginning of the period and continue to exist at the end of the period.
(3)Impact to earnings on deals that were entered into during the reporting period and continue to exist at the end of the period.
(4)Includes any day one gain (loss) recognized during the reporting period on deals that were entered into during the reporting period which continue to exist at the end of the period, in addition to any derivative contracts acquired from entities at a value other than zero on acquisition date, such as derivatives assigned or novated during the reporting period and continuing to exist at the end of the period.
(5)Roll-off in the current period of amounts recorded relatedrecognized in our Consolidated Balance Sheets at the end of the previous period due to natural gas supply contracts that CCL had with a related party. The agreement ceased to be considered a related party agreement during 2021, as discussedsettlement of the underlying instruments in Note 11—Related Party Transactions.the current period.
Except for Interest Rate Derivatives, allAll counterparty derivative contracts provide for the unconditional right of set-off in the event of default. We have elected to report derivative assets and liabilities arising from those derivative contracts with the same counterparty and the unconditional contractual right of set-off on a net basis. The use of derivative instruments exposes usCCL to counterparty credit risk, or the risk that a counterparty will be unable to meet its commitments, in instances when ourthe derivative instruments are in an asset position. Additionally, counterparties are at risk that weCCL will be unable to meet ourits commitments in instances where ourthe derivative instruments are in a liability position. We incorporate both our ownCCL’s nonperformance risk and the respective counterparty’s nonperformance risk in fair value measurements depending on the position of the derivative. In adjusting the fair value of ourthe derivative contracts for the effect of nonperformance risk, we have considered the impact of any applicable credit enhancements, such as collateral postings, set-off rights and guarantees.
Interest RateLiquefaction Supply Derivatives
We previously entered intoCCL holds Liquefaction Supply Derivatives which are primarily indexed to the following interest rate swaps to protect against volatility of future cash flowsnatural gas market and hedge a portioninternational LNG indices. The terms of the variable interest payments onLiquefaction Supply Derivatives range up to approximately 15 years, some of which commence upon the CCH Credit Facility, which expired in May 2022:satisfaction of certain events or states of affairs.
| | | | | | | | | | | | | | | | | | | | | | | | | | | | |
| | Notional Amounts | | | | | | |
| | June 30, 2022 | | December 31, 2021 | | | | Weighted Average Fixed Interest Rate Paid | | Variable Interest Rate Received |
Interest Rate Derivatives | | $— | | $4.5 billion | | | | 2.30% | | One-month LIBOR |
| | | | | | | | | | |
| | | | | | | | | | |
The forward notional amount for the Liquefaction Supply Derivatives was approximately 8,332 TBtu and 8,532 TBtu as of March 31, 2023 and December 31, 2022, respectively.
CHENIERE CORPUS CHRISTI HOLDINGS, LLC AND SUBSIDIARIES
NOTES TO CONSOLIDATED FINANCIAL STATEMENTS—CONTINUED
(unaudited)
The following table shows the effect and location of our Interest Rate Derivatives on our Consolidated Statements of Operations (in millions):
| | | | | | | | | | | | | | | | | | | | | | | | | | | | | | | | | | |
| | | | Gain (Loss) Recognized in Consolidated Statements of Operations |
| | Consolidated Statements of Operations Location | | Three Months Ended June 30, | | Six Months Ended June 30, |
| | | 2022 | | 2021 | | 2022 | | 2021 | | |
| Interest Rate Derivatives | | Interest rate derivative gain (loss), net | | $ | (1) | | | $ | (2) | | | $ | 2 | | | $ | (1) | | | |
| | | | | | | | | | | | |
Liquefaction Supply Derivatives
CCL holds Liquefaction Supply Derivatives which are primarily indexed to the natural gas market and international LNG indices. The remaining terms of the Physical Liquefaction Supply Derivatives range up to 15 years, some of which commence upon the satisfaction of certain conditions precedent. The terms of the Financial Liquefaction Supply Derivatives range up to approximately three years.
The forward notional amount for our Liquefaction Supply Derivatives was approximately 8,256 TBtu and 2,915 TBtu as of June 30, 2022 and December 31, 2021, respectively.
The following table shows the effect and location of our Liquefaction Supply Derivatives recorded on our Consolidated Statements of Operations (in millions):
| | | Gain (Loss) Recognized in Consolidated Statements of Operations | | | Gain (Loss) Recognized in Consolidated Statements of Operations |
| Consolidated Statements of Operations Location (1) | Consolidated Statements of Operations Location (1) | | Three Months Ended June 30, | | Six Months Ended June 30, | Consolidated Statements of Operations Location (1) | | | Three Months Ended March 31, |
| 2022 | | 2021 | | 2022 | | 2021 | | Consolidated Statements of Operations Location (1) | | | 2023 | | 2022 | |
| LNG revenues | LNG revenues | | $ | 12 | | | $ | (1) | | | $ | 7 | | | $ | — | | | | | $ | (5) | | | $ | (5) | | |
| Cost of sales | | (830) | | | (237) | | | (1,880) | | | (248) | | | |
| Cost of sales—related party (2) | | — | | | 6 | | | — | | | 7 | | | |
| Recovery (cost) of sales | | Recovery (cost) of sales | | | 3,411 | | | (1,050) | | |
|
(1)Does not include the realized value associated with derivative instruments that settle through physical delivery. Fair value fluctuations associated with commodity derivative activities are classified and presented consistently with the item economically hedged and the nature and intent of the derivative instrument.
(2)Includes amounts recorded related to natural gas supply contracts that we had with a related party. This agreement ceased to be considered a related party agreement as of November 1, 2021 as discussed in Note 11—Related Party Transactions.
CHENIERE CORPUS CHRISTI HOLDINGS, LLC AND SUBSIDIARIES
NOTES TO CONSOLIDATED FINANCIAL STATEMENTS—CONTINUED
(unaudited)
Fair Value and Location of Derivative Assets and Liabilities on the Consolidated Balance Sheets
The following table shows the fair value and location of our derivative instrumentsthe Liquefaction Supply Derivatives on our Consolidated Balance Sheets (in millions):
| | | June 30, 2022 | | | | Fair Value Measurements as of (1) |
| | Interest Rate Derivatives | | | Liquefaction Supply Derivatives (1) | | Total | | | | March 31, 2023 | | December 31, 2022 |
| Consolidated Balance Sheets Location | Consolidated Balance Sheets Location | | | | | | | Consolidated Balance Sheets Location | | | | |
| Current derivative assets | Current derivative assets | $ | — | | | | $ | 30 | | | $ | 30 | | Current derivative assets | | | $ | 20 | | | $ | 12 | |
| | Derivative assets | Derivative assets | — | | | | 108 | | | 108 | | Derivative assets | | | 168 | | | 7 | |
| | Total derivative assets | Total derivative assets | — | | | | 138 | | | 138 | | Total derivative assets | | | 188 | | | 19 | |
| | Current derivative liabilities | Current derivative liabilities | — | | | | (1,162) | | | (1,162) | | Current derivative liabilities | | | (818) | | | (1,374) | |
| Derivative liabilities | Derivative liabilities | — | | | | (3,955) | | | (3,955) | | Derivative liabilities | | | (2,250) | | | (4,923) | |
| Total derivative liabilities | Total derivative liabilities | — | | | | (5,117) | | | (5,117) | | Total derivative liabilities | | | (3,068) | | | (6,297) | |
| | Derivative liability, net | Derivative liability, net | $ | — | | | | $ | (4,979) | | | $ | (4,979) | | Derivative liability, net | | | $ | (2,880) | | | $ | (6,278) | |
| | December 31, 2021 | |
| Interest Rate Derivatives | | | Liquefaction Supply Derivatives (1) | | Total | |
| Consolidated Balance Sheets Location | | | | | | | |
| Current derivative assets | $ | — | | | | $ | 17 | | | $ | 17 | | |
| | Derivative assets | — | | | | 37 | | | 37 | | |
| | Total derivative assets | — | | | | 54 | | | 54 | | |
| | Current derivative liabilities | (40) | | | | (628) | | | (668) | | |
| Derivative liabilities | — | | | | (638) | | | (638) | | |
| Total derivative liabilities | (40) | | | | (1,266) | | | (1,306) | | |
| | Derivative liability, net | $ | (40) | | | | $ | (1,212) | | | $ | (1,252) | | |
(1)Does not include collateral posted with counterparties by usCCL of $25$14 million and $13$76 million as of June 30, 2022March 31, 2023 and December 31, 2021,2022, respectively, which are included in other current assetsmargin deposits in our Consolidated Balance Sheets.
CHENIERE CORPUS CHRISTI HOLDINGS, LLC AND SUBSIDIARIES
NOTES TO CONSOLIDATED FINANCIAL STATEMENTS—CONTINUED
(unaudited)
Consolidated Balance Sheets Presentation
The following table shows the fair value of ourthe derivatives outstanding on a gross and net basis (in millions) for ourthe derivative instruments that are presented on a net basis on our Consolidated Balance Sheets:
| | | | | | | | | | | | |
| | | | | | Liquefaction Supply Derivatives |
| | | |
As of June 30, 2022 | | | | | | |
Gross assets | | | | | | $ | 151 | |
Offsetting amounts | | | | | | (13) | |
Net assets | | | | | | $ | 138 | |
| | | | | | |
Gross liabilities | | | | | | $ | (5,485) | |
Offsetting amounts | | | | | | 368 | |
Net liabilities | | | | | | $ | (5,117) | |
| | | | | | |
As of December 31, 2021 | | | | | | |
Gross assets | | | | | | $ | 76 | |
Offsetting amounts | | | | | | (22) | |
Net assets | | | | | | $ | 54 | |
| | | | | | |
Gross liabilities | | | | | | $ | (1,295) | |
Offsetting amounts | | | | | | 29 | |
Net liabilities | | | | | | $ | (1,266) | |
NOTE 8—ACCRUED LIABILITIES
Accrued liabilities consisted of the following (in millions):
| | | | | | | | | | | | | | |
| | |
| | June 30, | | December 31, |
| | 2022 | | 2021 |
| Natural gas purchases | | $ | 716 | | | $ | 531 | |
| Interest costs and related debt fees | | 8 | | | 7 | |
| Liquefaction Project costs | | 41 | | | 43 | |
| Other accrued liabilities | | 31 | | | 50 | |
| Total accrued liabilities | | $ | 796 | | | $ | 631 | |
| | | | | | | | | | | | | | | | | | |
| | | | | | Liquefaction Supply Derivatives |
| | | | | | March 31, 2023 | | December 31, 2022 |
| Gross assets | | | | | | $ | 281 | | | $ | 19 | |
| Offsetting amounts | | | | | | (93) | | | — | |
| Net assets | | | | | | $ | 188 | | | $ | 19 | |
| | | | | | | | |
| Gross liabilities | | | | | | $ | (3,268) | | | $ | (6,622) | |
| Offsetting amounts | | | | | | 200 | | | 325 | |
| Net liabilities | | | | | | $ | (3,068) | | | $ | (6,297) | |
CHENIERE CORPUS CHRISTI HOLDINGS, LLC AND SUBSIDIARIES
NOTES TO CONSOLIDATED FINANCIAL STATEMENTS—CONTINUED
(unaudited)
NOTE 9—7—ACCRUED LIABILITIES
Accrued liabilities consisted of the following (in millions):
| | | | | | | | | | | | | | |
| | |
| | March 31, | | December 31, |
| | 2023 | | 2022 |
| Natural gas purchases | | $ | 262 | | | $ | 597 | |
| Interest costs and related debt fees | | 77 | | | 150 | |
| Liquefaction Project costs | | 41 | | | 103 | |
| Other accrued liabilities | | 18 | | | 51 | |
| Total accrued liabilities | | $ | 398 | | | $ | 901 | |
NOTE 8—DEBT
Debt consisted of the following (in millions):
| | | | June 30, | | December 31, | | March 31, | | December 31, |
| | 2022 | | 2021 | | 2023 | | 2022 |
| Senior Secured Notes: | Senior Secured Notes: | | | | | Senior Secured Notes: | | | | |
| 7.000% due 2024 | | $ | 1,250 | | | $ | 1,250 | | |
| 2024 CCH Senior Notes | | 2024 CCH Senior Notes | | $ | — | | | $ | 498 | |
| 5.875% due 2025 | 5.875% due 2025 | | 1,500 | | | 1,500 | | 5.875% due 2025 | | 1,491 | | | 1,491 | |
| 5.125% due 2027 | 5.125% due 2027 | | 1,500 | | | 1,500 | | 5.125% due 2027 | | 1,201 | | | 1,271 | |
| 3.700% due 2029 | 3.700% due 2029 | | 1,500 | | | 1,500 | | 3.700% due 2029 | | 1,125 | | | 1,361 | |
| 3.72% weighted average rate due 2039 | | 2,721 | | | 2,721 | | |
| 3.788% weighted average rate due 2039 | | 3.788% weighted average rate due 2039 | | 2,541 | | | 2,633 | |
| Total Senior Secured Notes | Total Senior Secured Notes | | 8,471 | | | 8,471 | | Total Senior Secured Notes | | 6,358 | | | 7,254 | |
| CCH Credit Facility | CCH Credit Facility | | 779 | | | 1,728 | | CCH Credit Facility | | — | | | — | |
| CCH Working Capital Facility) (1) | | — | | | 250 | | |
| CCH Working Capital Facility (1) | | CCH Working Capital Facility (1) | | — | | | — | |
| Total debt | Total debt | | 9,250 | | | 10,449 | | Total debt | | 6,358 | | | 7,254 | |
| | Current portion of long-term debt | Current portion of long-term debt | | — | | | (117) | | Current portion of long-term debt | | — | | | (495) | |
| Short-term debt | | — | | | (250) | | |
| Unamortized discount and debt issuance costs, net | | (82) | | | (96) | | |
| | Long-term portion of unamortized discount and debt issuance costs, net | | Long-term portion of unamortized discount and debt issuance costs, net | | (51) | | | (61) | |
| Total long-term debt, net of discount and debt issuance costs | Total long-term debt, net of discount and debt issuance costs | | $ | 9,168 | | | $ | 9,986 | | Total long-term debt, net of discount and debt issuance costs | | $ | 6,307 | | | $ | 6,698 | |
(1)The CCH Working Capital Facility is classified as short-term debt.debt as we are required to reduce the aggregate outstanding principal amount of the CCH Working Capital Facility to zero for a period of five consecutive business days at least once each year.
Credit Facilities
Below is a summary of our credit facilities outstanding as of June 30, 2022March 31, 2023 (in millions):
| | | CCH Credit Facility (1) | | CCH Working Capital Facility (1) | | CCH Credit Facility | | CCH Working Capital Facility |
| Total facility size | Total facility size | | $ | 4,039 | | | $ | 1,500 | | Total facility size | | $ | 3,260 | | | $ | 1,500 | |
| | Less: | Less: | | Less: | |
| Outstanding balance | Outstanding balance | | 779 | | | — | | Outstanding balance | | — | | | — | |
| | Letters of credit issued | Letters of credit issued | | — | | | 276 | | Letters of credit issued | | — | | | 162 | |
| Available commitment | Available commitment | | $ | 3,260 | | | $ | 1,224 | | Available commitment | | $ | 3,260 | | | $ | 1,338 | |
| | Priority ranking | Priority ranking | | Senior secured | | Senior secured | Priority ranking | | Senior secured | | Senior secured |
Interest rate on available balance | Interest rate on available balance | | SOFR plus credit spread adjustment of 0.1% , plus margin of 1.5% or base rate plus 0.5% | | SOFR plus credit spread adjustment of 0.1%, plus margin of 1.0% - 1.5% or base rate plus applicable margin | Interest rate on available balance | | SOFR plus credit spread adjustment of 0.1%, plus margin of 1.5% or base rate plus 0.5% | | SOFR plus credit spread adjustment of 0.1%, plus margin of 1.0% - 1.5% or base rate plus 0.0% - 0.5% |
| Weighted average interest rate of outstanding balance | | 3.13% | | n/a | |
| Commitment fees on undrawn balance | Commitment fees on undrawn balance | | 0.53% | | 0.18% | Commitment fees on undrawn balance | | 0.525% | | 0.10% - 0.20% |
| Maturity date | Maturity date | | (2) | | June 15, 2027 | Maturity date | | (2) | | June 15, 2027 |
(1)In June 2022, we amended and restatedThe margin on the CCH Credit Facility and CCH Working Capital Facility resulting in $20 million of debt extinguishment and modification costs to, among other things, (1) provide incremental commitments of $3.7 billion and $300 million for the CCH Credit Facilityinterest rate and the CCH Working Capital Facility, respectively, in connection withcommitment fees is subject to change based on the FID with respect to the Corpus Christi Stage 3 Project, (2) extend the maturity, (3) update the indexed interest rate to SOFR and (4) make certain other changes to the terms and conditions of each existing facility.applicable entity’s credit rating.
(2)The CCH Credit Facility matures the earlier of June 15, 2029 or two years after the substantial completion of the last Train of the Corpus Christi Stage 3 Project.
CHENIERE CORPUS CHRISTI HOLDINGS, LLC AND SUBSIDIARIES
NOTES TO CONSOLIDATED FINANCIAL STATEMENTS—CONTINUED
(unaudited)
Cancellation of CCH Senior Secured Notes Contributed from Cheniere
During the three months ended March 31, 2023, Cheniere repurchased $398 million of our Senior Secured Notes due 2027, 2029 and 2039 on the open market, with all of such repurchases immediately contributed to us from Cheniere for no consideration, and cancelled by us. It was determined that for accounting purposes, Cheniere repurchased the bonds on our behalf as a principal as opposed to as an agent, and thus the debt extinguishment was accounted for as an extinguishment directly with Cheniere.
Additionally, we recorded a net distribution from Cheniere totaling $2 million from associated operating activities, inclusive of $2 million of interest due to the extinguishment of debt at the time of repayment offset by our write off of associated debt issuance costs and discount of $4 million.
Restrictive Debt Covenants
The indentures governing our senior notes and other agreements underlying our debt contain customary terms and events of default and certain covenants that, among other things, may limit us and our restricted subsidiaries’ ability to make certain investments or pay dividends or distributions. We are restricted from making distributions under agreements governing our indebtedness generally until, among other requirements, appropriate reserves have been established for debt service using cash or letters of credit and a historical debt service coverage ratio and projected debt service coverage ratio of at least 1.25:1.00 is satisfied.
As of June 30, 2022,March 31, 2023, we were in compliance with all covenants related to our debt agreements.
Interest Expense
Total interest expense, net of capitalized interest, consisted of the following (in millions):
| | | | | | | | | | | | | | | | | | | | | | | | | |
| | Three Months Ended June 30, | | Six Months Ended June 30, |
| 2022 | | 2021 | | 2022 | | 2021 | | |
| Total interest cost | $ | 118 | | | $ | 118 | | | $ | 237 | | | $ | 237 | | | |
| Capitalized interest, including amounts capitalized as an allowance for funds used during construction | (2) | | | — | | | (3) | | | (26) | | | |
| Total interest expense, net of capitalized interest | $ | 116 | | | $ | 118 | | | $ | 234 | | | $ | 211 | | | |
| | | | | | | | | | | | | | | | | |
| | | | Three Months Ended March 31, |
| | | | | 2023 | | 2022 | | |
| Total interest cost | | | | | $ | 83 | | | $ | 119 | | | |
| Capitalized interest | | | | | (20) | | | (1) | | | |
| Total interest expense, net of capitalized interest | | | | | $ | 63 | | | $ | 118 | | | |
Fair Value Disclosures
The following table shows the carrying amount and estimated fair value of our debt (in millions):
| | | | | June 30, 2022 | | December 31, 2021 | | | March 31, 2023 | | December 31, 2022 |
| | | | Carrying
Amount | | Estimated
Fair Value | | Carrying
Amount | | Estimated
Fair Value | | | Carrying
Amount | | Estimated
Fair Value | | Carrying
Amount | | Estimated
Fair Value |
| Senior notes — Level 2 (1) | Senior notes — Level 2 (1) | | $ | 6,500 | | | $ | 6,291 | | | $ | 6,500 | | | $ | 7,095 | | Senior notes — Level 2 (1) | | $ | 4,387 | | | $ | 4,210 | | | $ | 5,283 | | | $ | 5,014 | |
| Senior notes — Level 3 (2) | Senior notes — Level 3 (2) | | 1,971 | | | 1,865 | | | 1,971 | | | 2,227 | | Senior notes — Level 3 (2) | | 1,971 | | | 1,853 | | | 1,971 | | | 1,738 | |
|
(1)The Level 2 estimated fair value was based on quotes obtained from broker-dealers or market makers of these senior notes and other similar instruments.
(2)The Level 3 estimated fair value was calculated based on inputs that are observable in the market or that could be derived from, or corroborated with, observable market data, including interest rates based on debt issued by parties with comparable credit ratings to us and inputs that are not observable in the market.
The estimated fair value of our credit facilities approximates the principal amount outstanding because the interest rates are variable and reflective of market rates and the debt may be repaid, in full or in part, at any time without penalty.
NOTE 10—REVENUES FROM CONTRACTS WITH CUSTOMERS
The following table represents a disaggregation of revenue earned from contracts with customers (in millions):
| | | | | | | | | | | | | | | | | | | | | | | | | | | | |
| | Three Months Ended June 30, | | Six Months Ended June 30, |
| | 2022 | | 2021 | | 2022 | | 2021 | | |
| LNG revenues | | $ | 1,595 | | | $ | 827 | | | $ | 2,924 | | | $ | 1,441 | | | |
| LNG revenues—affiliate | | 763 | | | 331 | | | 1,434 | | | 599 | | | |
| Total revenues from customers | | 2,358 | | | 1,158 | | | 4,358 | | | 2,040 | | | |
| Net derivative gain (loss) (1) | | 12 | | | (1) | | | 7 | | | — | | | |
| Total revenues | | $ | 2,370 | | | $ | 1,157 | | | $ | 4,365 | | | $ | 2,040 | | | |
CHENIERE CORPUS CHRISTI HOLDINGS, LLC AND SUBSIDIARIES
NOTES TO CONSOLIDATED FINANCIAL STATEMENTS—CONTINUED
(unaudited)
NOTE 9—REVENUES
The following table represents a disaggregation of revenue earned (in millions):
| | | | | | | | | | | | | | | | | | | | |
| | | | Three Months Ended March 31, |
| | | | | | 2023 | | 2022 | | |
| Revenues from contracts with customers | | | | | | | | | | |
| LNG revenues | | | | | | $ | 1,098 | | | $ | 1,329 | | | |
| LNG revenues—affiliate | | | | | | 555 | | | 671 | | | |
| Total revenues from contracts with customers | | | | | | 1,653 | | | 2,000 | | | |
| Net derivative loss (1) | | | | | | (5) | | | (5) | | | |
| Total revenues | | | | | | $ | 1,648 | | | $ | 1,995 | | | |
Contract Assets and Liabilities
The following table shows our contract assets, net of current expected credit losses, which are classified as other current assets and other non-current assets, net on our Consolidated Balance Sheets (in millions):
| | | | | | | | | | | | | | |
| | |
| | June 30, | | December 31, |
| | 2022 | | 2021 |
| Contract assets, net of current expected credit losses | | $ | 125 | | | $ | 104 | |
| | | | | | | | | | | | | | |
| | |
| | March 31, | | December 31, |
| | 2023 | | 2022 |
| Contract assets, net of current expected credit losses | | $ | 154 | | | $ | 144 | |
The following table reflects the changes in our contract liabilities, which we classify as other non-current liabilities on our Consolidated Balance Sheets (in millions):
| | | | | | | | | | |
| | |
| | SixThree Months Ended June 30, 2022March 31, 2023 | | |
| Deferred revenue, beginning of period | | $ | 3576 | | | |
| Cash received but not yet recognized in revenue | | 5676 | | | |
| Revenue recognized from prior period deferral | | (35)(76) | | | |
| Deferred revenue, end of period | | $ | 5676 | | | |
Transaction Price Allocated to Future Performance Obligations
Because many of our sales contracts have long-term durations, we are contractually entitled to significant future consideration which we have not yet recognized as revenue. The following table discloses the aggregate amount of the transaction price that is allocated to performance obligations that have not yet been satisfied:
| | | June 30, 2022 | | December 31, 2021 | | March 31, 2023 | | December 31, 2022 |
| | Unsatisfied Transaction Price (in billions) | | Weighted Average Recognition Timing (years) (1) | | Unsatisfied Transaction Price (in billions) | | Weighted Average Recognition Timing (years) (1) | | Unsatisfied Transaction Price (in billions) | | Weighted Average Recognition Timing (years) (1) | | Unsatisfied Transaction Price (in billions) | | Weighted Average Recognition Timing (years) (1) |
| LNG revenues | LNG revenues | | $ | 49.2 | | | 11 | | $ | 31.7 | | | 9 | LNG revenues | | $ | 50.5 | | | 10 | | $ | 50.9 | | | 10 |
| LNG revenues—affiliate | LNG revenues—affiliate | | 1.3 | | | 8 | | 1.1 | | | 10 | LNG revenues—affiliate | | 1.2 | | | 9 | | 1.2 | | | 8 |
| Total revenues | Total revenues | | $ | 50.5 | | | $ | 32.8 | | | Total revenues | | $ | 51.7 | | | $ | 52.1 | | |
(1)The weighted average recognition timing represents an estimate of the number of years during which we shall have recognized half of the unsatisfied transaction price.
We have elected the following exemptions which omit certain potential future sources of revenue from the table above:
(1)We omit from the table above all performance obligations that are part of a contract that has an original expected duration of one year or less.
(2)The table above excludes substantially all variable consideration under our SPAs. We omit from the table above all variable consideration that is allocated entirely to a wholly unsatisfied performance obligation or to a wholly unsatisfied promise to transfer a distinct good or service that forms part of a single performance obligation when that performance obligation qualifies as a series. The amount of revenue from variable fees that is not included in the transaction price will vary based on the future prices of Henry Hub throughout the contract terms, to the extent customers elect to take delivery of their LNG, and adjustments to the consumer price index. Certain of our
CHENIERE CORPUS CHRISTI HOLDINGS, LLC AND SUBSIDIARIES
NOTES TO CONSOLIDATED FINANCIAL STATEMENTS—CONTINUED
(unaudited)
contracts contain additional variable consideration based on the outcome of contingent events and the movement of various indexes. We have not included such variable consideration in the transaction price to the extent the consideration is considered constrained due to the uncertainty of ultimate pricing and receipt. Additionally, we have excluded variable consideration related to contracts where there is uncertainty that one or both of the parties will achieve certain milestones. Approximately 72%55% and 49%64% of our LNG revenues from contracts included in the table above during the three months ended June 30,March 31, 2023 and 2022, and 2021, respectively, and approximately 68% and 48%were related to variable consideration received from customers. Approximately 83% of our LNG revenuesrevenues—affiliate from contracts included in the table above during the sixthree months ended June 30, 2022 and 2021, respectively,March 31, 2023 were related to variable consideration received from customers. Noneof our LNG revenues—affiliates from the contract included in the table above were related to variable consideration received from customers during the three and six months ended June 30, 2022 and 2021.March 31, 2022.
We may enter into contracts to sell LNG that are conditioned upon one or both of the parties achieving certain milestones such as reaching FID on a certain liquefaction Train, obtaining financing or achieving substantial completion of a Train and any related facilities. These contracts are considered completed contracts for revenue recognition purposes and are included in the transaction price above when the conditions are considered probable of being met.
CHENIERE CORPUS CHRISTI HOLDINGS, LLC AND SUBSIDIARIES
NOTES TO CONSOLIDATED FINANCIAL STATEMENTS—CONTINUED
(unaudited)
NOTE 11—10—RELATED PARTY TRANSACTIONS
Below is a summary of our related party transactions as reported on our Consolidated Statements of Operations (in millions):
| | | | | | | | | | | | | | | | | | | | | | | | | | | | |
| Three Months Ended June 30, | | Six Months Ended June 30, |
| 2022 | | 2021 | | 2022 | | 2021 | | |
| LNG revenues—affiliate | | | | | | | | | |
| Cheniere Marketing Agreements | $ | 707 | | | $ | 319 | | | $ | 1,372 | | | $ | 579 | | | |
| Contracts for Sale and Purchase of Natural Gas and LNG | 56 | | | 12 | | | 62 | | | 20 | | | |
| Total LNG revenues—affiliate | 763 | | | 331 | | | 1,434 | | | 599 | | | |
| | | | | | | | | | |
| | | | | | | | | | |
| | | | | | | | | |
| | | | | | | | | |
| Cost of sales—affiliate | | | | | | | | | |
| Contracts for Sale and Purchase of Natural Gas and LNG | 36 | | | 2 | | | 48 | | | 6 | | | |
| Cheniere Marketing Agreements | — | | | — | | | — | | | 31 | | | |
| Total cost of sales—affiliate | 36 | | | 2 | | | 48 | | | 37 | | | |
| | | | | | | | | |
| Cost of sales—related party | | | | | | | | | |
| Natural Gas Supply Agreement (1) | — | | | 36 | | | — | | | 71 | | | |
| | | | | | | | | |
| | | | | | | | | |
| | | | | | | | | |
| Operating and maintenance expense—affiliate | | | | | | | | | |
| Services Agreements | 28 | | | 28 | | | 58 | | | 52 | | | |
| | | | | | | | | |
| | | | | | | | | |
| | | | | | | | | |
| | | | | | | | | |
| Operating and maintenance expense—related party | | | | | | | | | |
| Natural Gas Transportation Agreements | 3 | | | 3 | | | 5 | | | 5 | | | |
| | | | | | | | | |
| | | | | | | | | |
| | | | | | | | | |
| | | | | | | | | |
| General and administrative expense—affiliate | | | | | | | | | |
| Services Agreements | 8 | | | 7 | | | 16 | | | 12 | | | |
| | | | | | | | | | | | | | | | | | | | |
| | | Three Months Ended March 31, |
| | | | | 2023 | | 2022 | | |
| LNG revenues—affiliate | | | | | | | | | |
| Cheniere Marketing Agreements (1) | | | | | $ | 555 | | | $ | 665 | | | |
| Contracts for Sale and Purchase of Natural Gas and LNG (2) | | | | | — | | | 6 | | | |
| Total LNG revenues—affiliate | | | | | 555 | | | 671 | | | |
| | | | | | | | | | |
| | | | | | | | | | |
| | | | | | | | | |
| | | | | | | | | |
| Cost of sales—affiliate | | | | | | | | | |
| Contracts for Sale and Purchase of Natural Gas and LNG (2) | | | | | 15 | | | 12 | | | |
| | | | | | | | | |
| | | | | | | | | |
| | | | | | | | | |
| | | | | | | | | |
| | | | | | | | | |
| | | | | | | | | |
| | | | | | | | | |
| | | | | | | | | |
| Operating and maintenance expense—affiliate | | | | | | | | | |
| Services Agreements (3) | | | | | 30 | | | 30 | | | |
| | | | | | | | | |
| | | | | | | | | |
| | | | | | | | | |
| | | | | | | | | |
| Operating and maintenance expense—related party | | | | | | | | | |
| Natural Gas Transportation Agreements (4) | | | | | 2 | | | 2 | | | |
| | | | | | | | | |
| | | | | | | | | |
| | | | | | | | | |
| | | | | | | | | |
| General and administrative expense—affiliate | | | | | | | | | |
| Services Agreements (3) | | | | | 12 | | | 8 | | | |
(1)Includes amounts recorded relatedCCL primarily sells LNG to natural gas supply contracts that we had with a related party. This agreement ceased to be considered a related party agreement during 2021, as discussed below.
We had $28 million and $35 million due to affiliates as of June 30, 2022 and December 31, 2021, respectively, under agreements with affiliates, as described below.
Cheniere Marketing Agreements
Cheniere Marketing SPA
CCL has an amended and restated fixed price SPA with Cheniere Marketing International LLP (“Cheniere Marketing”), a wholly owned subsidiary of Cheniere, (the “Cheniere Marketing Base SPA”) with a term of 20 years which allows Cheniere Marketing to purchase, at its option, (1) up to a cumulative total of 150 TBtu of LNG within the commissioning periods for Trains 1 through 3under SPAs and (2) any excess LNG produced by the Liquefaction Project that is not committed to customers under third party SPAs. Under the Cheniere Marketing Base SPA, Cheniere Marketing may, without charge, elect to suspend deliveries of cargoes (other than commissioning cargoes) scheduled for any month under the applicable annual delivery program by providing specified notice in advance. Additionally, CCL has: (1) a fixed price SPA with a term through 2043 with Cheniere Marketing which allows them to purchase volumes of approximately 15 TBtu per annum of LNG and (2) an SPA with Cheniere Marketing for approximately 44 TBtu of LNG with a maximum term up to 2026 associated with the integrated production marketing gas supply agreement between CCL and EOG Resources, Inc. As of June 30, 2022 and December 31, 2021, CCL had $294 million and $314 million of accounts receivable—affiliate, respectively, under these agreements with Cheniere Marketing.
In association with an IPM agreement between CCL and ARC Resources U.S. Corp, CCL entered into an SPA in June 2022 with Cheniere Marketing to sell Cheniere Marketing approximately 44 TBtu per annum of LNG at a price linked to the Platts Japan Korea Marker (“JKM”), for a term of 15 years commencing with commercial operations of Train 7 of the Corpus Christi Stage 3 Project.
CHENIERE CORPUS CHRISTI HOLDINGS, LLC AND SUBSIDIARIES
NOTES TO CONSOLIDATED FINANCIAL STATEMENTS—CONTINUED
(unaudited)
Cheniere Marketing Letter Agreement
CCL has a letter agreement with Cheniere Marketing for the sale of up to 48 cargoes scheduled to be delivered between 2023 and 2025 at a price equal to 115% of Henry Hub plus $1.97 per MMBtu.
Facility Swap Agreement
We have entered intoa fixed fee, except for SPAs associated with IPM agreements for which pricing is linked to international natural gas prices. In addition, CCL has an arrangement with subsidiaries of Cheniere to provide the ability, in limited circumstances, to potentially fulfill commitments to LNG buyers in the event operational conditions impact operations at either the Sabine Pass or Corpus Christi liquefaction facilities. The purchase price for such cargoes would be (i)the greater of: (a) 115% of the applicable natural gas feedstock purchase price or (ii) a free-on-board(b) an FOB U.S. Gulf Coast LNG market price, whichever is greater.
Services Agreements
Gas and Power Supply Services Agreement (“G&P Agreement”)
CCL has a G&P Agreement with Cheniere Energy Shared Services, Inc. (“Shared Services”), a wholly owned subsidiaryprice. As of Cheniere, pursuant to which Shared Services will manage the gas and power procurement requirements of CCL. The services include, among other services, exercising the day-to-day management of CCL’s natural gas and power supply requirements, negotiating agreements on CCL’s behalf and providing other administrative services. Prior to the substantial completion of each Train of the Liquefaction Project, no monthly fee payment is required except for reimbursement of operating expenses. After substantial completion of each Train of the Liquefaction Project, CCL will pay, in addition to the reimbursement of related expenses, a fixed monthly fee of $30,000 (indexed for inflation) per mtpa for services performed with respect to such Train.
Operation and Maintenance Agreements (“O&M Agreements”)
CCL has an O&M Agreement (“CCL O&M Agreement”) with Cheniere LNG O&M Services, LLC (“O&M Services”), a wholly owned subsidiary of Cheniere, pursuant to which CCL receives all of the necessary services required to construct, operate and maintain the Liquefaction Project. The services to be provided include, among other services, preparing and maintaining staffing plans, identifying and arranging for procurement of equipment and materials, overseeing contractors, administering various agreements, information technology services and other services required to operate and maintain the Liquefaction Project. Prior to the substantial completion of each Train of the Liquefaction Project, no monthly fee payment is required except for reimbursement of operating expenses. After substantial completion of each Train of the Liquefaction Project, CCL will pay, in addition to the reimbursement of related expenses, a fixed monthly fee of $53,000 (indexed for inflation) per mtpa for services performed with respect to such Train.
CCP has an O&M Agreement (“CCP O&M Agreement”) with O&M Services pursuant to which CCP receives all of the necessary services required to construct, operate and maintain the Corpus Christi Pipeline. The services to be provided include, among other services, preparing and maintaining staffing plans, identifying and arranging for procurement of equipment and materials, overseeing contractors, information technology services and other services required to operate and maintain the Corpus Christi Pipeline. CCP is required to reimburse O&M Services for all operating expenses incurred on behalf of CCP.
Management Services Agreements (“MSAs”)
CCL has an MSA with Shared Services pursuant to which Shared Services manages the construction and operation of the Liquefaction Project, excluding those matters provided for under the G&P Agreement and the CCL O&M Agreement. The services include, among other services, exercising the day-to-day management of CCL’s affairs and business, managing CCL’s regulatory matters, preparing status reports, providing contract administration services for all contracts associated with the Liquefaction Project and obtaining insurance. Prior to the substantial completion of each Train of the Liquefaction Project, no monthly fee payment is required except for reimbursement of expenses. After substantial completion of each Train, CCL will pay, in addition to the reimbursement of related expenses, a monthly fee of $157,000 (adjusted for inflation) per mtpa for services performed with respect to such Train.
CHENIERE CORPUS CHRISTI HOLDINGS, LLC AND SUBSIDIARIES
NOTES TO CONSOLIDATED FINANCIAL STATEMENTS—CONTINUED
(unaudited)
CCP has a MSA with Shared Services pursuant to which Shared Services manages CCP’s operations and business, excluding those matters provided for under the CCP O&M Agreement. The services include, among other services, exercising the day-to-day management of CCP’s affairs and business, managing CCP’s regulatory matters, preparing status reports, providing contract administration services for all contracts associated with the Corpus Christi Pipeline and obtaining insurance. CCP is required to reimburse Shared Services for the aggregate of all costs and expenses incurred in the course of performing the services under the MSA.
Shipping Services Agreement (“SSA”)
In June 2022, CCL executed an SSA with Cheniere Marketing pursuant to which Cheniere Marketing will provide certain shipping and transportation-related services associated with CCL’s LNG sale and purchase agreement with a third party under delivery ex-ship terms, which commences upon substantial completion of the third Train of the Corpus Christi Stage 3 Project.
Natural Gas Supply Agreement
CCL was party to a natural gas supply agreement with a related party in the ordinary course of business, to obtain a fixed minimum daily volume of feed gas for the operation of the Liquefaction Project. The related party entity was acquired by a non-related party on November 1, 2021, therefore, as of such date, this agreement ceased to be considered a related party agreement.
Natural Gas Transportation Agreements
Agreements with Related Party
CCL is party to natural gas transportation agreements with a related party in the ordinary course of business for the operation of the Liquefaction Project, for a period of 10 years which began in May 2020. Cheniere accounts for its investment in this related party as an equity method investment. CCL recorded accrued liabilities—related party of $1 million as of both June 30, 2022March 31, 2023 and December 31, 20212022, CCL had $157 million and $223 million of trade receivables—affiliate, respectively, under these agreements with this related party.Cheniere Marketing.
Contracts for Sale and Purchase of Natural Gas and LNG
CCL has an agreement with Sabine Pass Liquefaction, LLC (“SPL”) that allows the parties to sell and purchase natural gas with each other. Natural gas purchased under this agreement is initially recorded as inventory and then to cost of sales—affiliate upon its sale, except for purchases related to commissioning activities which are capitalized as LNG terminal construction-in-process. Natural gas soldAs of March 31, 2023 and December 31, 2022, CCL had zero and $16 million of accounts receivable—affiliate, respectively, under this agreement is recorded as LNG revenues—affiliate.
CCL also has an agreement with Midship Pipeline Company, LLC that allows them to sell and purchase natural gas with each other.
Land Agreements
Rental Agreements
CCL hasthese agreements with Cheniere Land Holdings, LLC (“Cheniere Land Holdings”), a wholly owned subsidiary of Cheniere, to rent the land owned by Cheniere Land Holdings for the Liquefaction Project. The total annual rental payment is $0.6 million with terms through 2031.
Easement Agreements
CCL has agreements with Cheniere Land Holdings which grant CCL easements on land owned by Cheniere Land Holdings for the Liquefaction Project. The total annual payment for easement agreements is $0.1 million, excluding any previously paid one-time payments, and the terms of the agreements range from three to five years.
CHENIERE CORPUS CHRISTI HOLDINGS, LLC AND SUBSIDIARIES
NOTES TO CONSOLIDATED FINANCIAL STATEMENTS—CONTINUED
(unaudited)
Master License Agreements
CCL hasWe do not have employees and thus our subsidiaries have various services agreements with affiliates of Cheniere Land Holdings which grant CCL licensesin the ordinary course of business, including services required to enter certain land owned by Cheniere Land Holdings for the Liquefaction Project. The aggregate annual payment for these agreements is $1 million, commencing January 2022 through completion of construction atconstruct, operate and maintain the Liquefaction Project, subjectand administrative services. Prior to early termination.
Dredge Material Disposal Agreementthe substantial completion of each Train of the Liquefaction Project, our payments under the services agreements are primarily based on a cost reimbursement structure, and following the completion of each Train, our payments include a fixed monthly fee (indexed for inflation) per mtpa in addition to the reimbursement of costs. As of March 31, 2023 and December 31, 2022, we had $93 million and $132 million of advances to affiliates, respectively, under the services agreements. The non-reimbursement amounts incurred under these agreements are recorded in general and administrative expense—affiliate.
CCL hasis party to natural gas transportation agreements with a dredge material disposal agreement with Cheniere Land Holdings that terminatesrelated party in 2042 which grants CCL permission to use land owned by Cheniere Land Holdingsthe ordinary course of business for the deposit of dredge material from the construction and maintenanceoperation of the Liquefaction Project. Under the termsCCL had accrued liabilities—related party of the agreement, CCL will pay Cheniere Land Holdings $0.50 per cubic yard$1 million as of dredge material deposits up to 5.0 million cubic yardsboth March 31, 2023 and $4.62 per cubic yard for any quantities above that.December 31, 2022 with this related party.
Tug Hosting AgreementWe had $26 million and $43 million due to affiliates as of March 31, 2023 and December 31, 2022, respectively, under agreements with affiliates as described above.
Disclosure of future consideration under revenue contracts with affiliates is included in Note 9—Revenues. Other Agreements
CCL has a tug hosting agreement with Corpus Christi Tug Services, LLC (“Tug Services”), a wholly owned subsidiary of Cheniere, to provide certain marine structures, support services and access necessary at the Liquefaction Project for Tug Services to provide its customers with tug boat and marine services. Tug Services is required to reimburse CCL for any third party costs incurred by CCL in connection with providing the goods and services.
State Tax Sharing Agreements
CCL and CCP each have a state tax sharing agreement with Cheniere. Under these agreements, Cheniere has agreed to prepare and file all state and local tax returns which each of the entities and Cheniere are required to file on a combined basis and to timely pay the combined state and local tax liability. If Cheniere, in its sole discretion, demands payment, each of the respective entities will pay to Cheniere an amount equal to the state and local tax that each of the entities would be required to pay if its state and local tax liability were calculated on a separate company basis. To date, there have been no state and local tax payments demanded by Cheniere under the tax sharing agreements. The agreements for both CCL and CCP were effective for tax returns due on or after May 2015.
NOTE 12—CUSTOMER CONCENTRATION
The following table shows external customers with revenues of 10% or greater of total revenues from external customers and external customers with trade and other receivables, net of current expected credit losses and contract assets, net of current expected credit losses balances of 10% or greater of total trade and other receivables, net of current expected credit losses from external customers and contract assets, net of current expected credit losses from external customers, respectively:
| | | | | | | | | | | | | | | | | | | | | | | | | | | | | | | | | | | | | | | | |
| | Percentage of Total Revenues from External Customers | | Percentage of Trade and Other Receivables, Net and Contract Assets, Net from External Customers |
| | | | | | |
| | Three Months Ended June 30, | | Six Months Ended June 30, | | | | June 30, | | December 31, |
| | 2022 | | 2021 | | 2022 | | 2021 | | | | 2022 | | 2021 |
| Customer A | | 20% | | 23% | | 22% | | 23% | | | | * | | * |
| Customer B | | 15% | | 17% | | 14% | | 19% | | | | * | | * |
| Customer C | | 14% | | 14% | | 13% | | 16% | | | | * | | * |
| Customer D | | * | | * | | * | | * | | | | 28% | | 31% |
| Customer E | | * | | * | | * | | * | | | | * | | 11% |
| | | | | | | | | | | | | | |
* Less than 10%Equity Contribution Agreements
We have equity contribution agreements with Cheniere and certain of its subsidiaries (the “Equity Contribution Agreements”) pursuant to which Cheniere agreed to contribute any of CCH’s Senior Secured Notes that Cheniere has repurchased to CCH. During the three months ended March 31, 2023, Cheniere repurchased a total of $398 million of the outstanding principal amount of CCH’s Senior Secured Notes due 2027, 2029 and 2039 on the open market, which were immediately contributed under the Equity Contribution Agreements to us from Cheniere and cancelled by us.
Arrangement with ADCC Pipeline, LLC
In June 2022, Cheniere acquired a 30% equity interest in ADCC Pipeline, LLC and its wholly owned subsidiary (collectively, “ADCC Pipeline”) through its wholly owned subsidiary Cheniere ADCC Investments, LLC. ADCC Pipeline will develop, construct and operate an approximately 42-mile natural gas pipeline project (the “ADCC Pipeline Project”) connecting the Agua Dulce natural gas hub to the CCL Project. CCL is party to a natural gas transportation agreement with ADCC Pipeline for the operation of the CCL Project, with an initial term of 20 years with extension rights, which will commence upon the completion of the ADCC Pipeline Project.
CHENIERE CORPUS CHRISTI HOLDINGS, LLC AND SUBSIDIARIES
NOTES TO CONSOLIDATED FINANCIAL STATEMENTS—CONTINUED
(unaudited)
NOTE 13—11—CUSTOMER CONCENTRATION
The concentration of our customer credit risk in excess of 10% or greater of total revenues and/or trade and other receivables was as follows:
| | | | | | | | | | | | | | | | | | | | | | | | | | | | | | | | |
| | | | | | Percentage of Total Revenues from External Customers | | Percentage of Trade and Other Receivables, Net and Contract Assets, Net from External Customers |
| | | | | | |
| | | | Three Months Ended March 31, | | | | March 31, | | December 31, |
| | | | | | 2023 | | 2022 | | | | 2023 | | 2022 |
| Customer A | | | | | | 23% | | 26% | | | | * | | 17% |
| Customer B | | | | | | 14% | | 14% | | | | * | | * |
| Customer C | | | | | | 15% | | 12% | | | | * | | * |
| Customer D | | | | | | * | | * | | | | 48% | | 33% |
| Customer E | | | | | | * | | * | | | | 11% | | * |
| | | | | | | | | | | | | | |
| | | | | | | | | | | | | | |
* Less than 10%
NOTE 12—SUPPLEMENTAL CASH FLOW INFORMATION
The following table provides supplemental disclosure of cash flow information (in millions):
| | | | | | | | | | | | | |
| Six Months Ended June 30, |
| 2022 | | 2021 | | |
| Cash paid during the period for interest on debt, net of amounts capitalized | $ | 222 | | | $ | 199 | | | |
| Non-cash contributions from affiliates for conveyance of assets | 7 | | | — | | | |
| Right-of-use assets obtained in exchange for new operating lease liabilities | 3 | | | — | | | |
| Non-cash investing activity: | | | | | |
| Contributions of property, plant and equipment in exchange for other non-current assets | 17 | | | — | | | |
| | | | | |
The balance in property, plant and equipment, net of accumulated depreciation funded with accounts payable and accrued liabilities (including affiliate) was $6 million and $28 million as of June 30, 2022 and 2021, respectively.
We recorded $1.5 billion of contribution in our Statement of Member’s Equity (Deficit) during the quarter ended June 30, 2022 related to the contribution of the CCL Stage III entity to us from Cheniere on June 15, 2022, with such contribution representing a non-cash financing activity. See Note 2—CCL Stage III Contribution and Merger for further discussion. | | | | | | | | | | | | | |
| Three Months Ended March 31, |
| 2023 | | 2022 | | |
| Cash paid during the period for interest on debt, net of amounts capitalized | $ | 115 | | | $ | 11 | | | |
| | | | | |
| | | | | |
| Non-cash investing activity: | | | | | |
| Unpaid purchases of property, plant and equipment | 38 | | | 18 | | | |
| | | | | |
| | | | | |
| Non-cash financing activity: | | | | | |
Cancellation of CCH Senior Secured Notes contributed to us from Cheniere (see Note 8) | 398 | | | — | | | |
| | | | | |
CHENIERE CORPUS CHRISTI HOLDINGS, LLC AND SUBSIDIARIES
NOTES TO CONSOLIDATED FINANCIAL STATEMENTS—CONTINUED
(unaudited)
ITEM 2. MANAGEMENT’S DISCUSSION AND ANALYSIS OF FINANCIAL CONDITION AND RESULTS OF OPERATIONS
Information Regarding Forward-Looking Statements
This quarterly report contains certain statements that are, or may be deemed to be, “forward-looking statements” within the meaning of Section 27A of the Securities Act of 1933, as amended (the “Securities Act”), and Section 21E of the Securities Exchange Act of 1934, as amended (the “Exchange Act”). All statements, other than statements of historical or present facts or conditions, included herein or incorporated herein by reference are “forward-looking statements.” Included among “forward-looking statements” are, among other things:
•statements regarding our expected receipt of cash distributions from our subsidiaries;
•statements that we expect to commence or complete construction of our proposed LNG terminal, liquefaction facility, pipeline facility or other projects, or any expansions or portions thereof, by certain dates, or at all;
•statements regarding future levels of domestic and international natural gas production, supply or consumption or future levels of LNG imports into or exports from North America and other countries worldwide or purchases of natural gas, regardless of the source of such information, or the transportation or other infrastructure or demand for and prices related to natural gas, LNG or other hydrocarbon products;
•statements regarding any financing transactions or arrangements, or our ability to enter into such transactions;
•statements regarding our future sources of liquidity and cash requirements;
•statements relating to the construction of our Trains and pipeline, including statements concerning the engagement of any EPC contractor or other contractor and the anticipated terms and provisions of any agreement with any EPC or other contractor, and anticipated costs related thereto;
•statements regarding any SPA or other agreement to be entered into or performed substantially in the future, including any revenues anticipated to be received and the anticipated timing thereof, and statements regarding the amounts of total natural gas liquefaction or storage capacities that are, or may become, subject to contracts;
•statements regarding counterparties to our commercial contracts, construction contracts and other contracts;
•statements regarding our planned development and construction of additional Trains and pipelines, including the financing of such Trains and pipelines;
•statements that our Trains, when completed, will have certain characteristics, including amounts of liquefaction capacities;
•statements regarding our business strategy, our strengths, our business and operation plans or any other plans, forecasts, projections, or objectives, including anticipated revenues, capital expenditures, maintenance and operating costs and cash flows, any or all of which are subject to change;
•statements regarding legislative, governmental, regulatory, administrative or other public body actions, approvals, requirements, permits, applications, filings, investigations, proceedings or decisions;
•statements regarding the COVID-19 pandemic and its impact on our business and operating results, including any customers not taking delivery of LNG cargoes, the ongoing creditworthiness of our contractual counterparties, any disruptions in our operations or construction of our Trains and the health and safety of Cheniere’s employees, and on our customers, the global economy and the demand for LNG; and
•any other statements that relate to non-historical or future information.
All of these types of statements, other than statements of historical or present facts or conditions, are forward-looking statements. In some cases, forward-looking statements can be identified by terminology such as “may,” “will,” “could,” “should,” “achieve,” “anticipate,” “believe,” “contemplate,” “continue,” “estimate,” “expect,” “intend,” “plan,” “potential,” “predict,” “project,” “pursue,” “target,” the negative of such terms or other comparable terminology. The forward-looking statements contained in this quarterly report are largely based on our expectations, which reflect estimates and assumptions made by our management. These estimates and assumptions reflect our best judgment based on currently known market conditions and other factors. Although we believe that such estimates are reasonable, they are inherently uncertain and involve a number of risks and uncertainties beyond our control. In addition, assumptions may prove to be inaccurate. We caution that the forward-looking statements contained in this quarterly report are not guarantees of future performance and that such statements may not be realized or the forward-looking statements or events may not occur. Actual results may differ materially
from those anticipated or implied in forward-looking statements as a result of a variety of factors described in this quarterly report and in the other reports and other information that we file with the SEC, including those discussed under “Risk Factors” in our annual report on Form 10-K for the fiscal year ended December 31, 20212022. All forward-looking statements attributable to
us or persons acting on our behalf are expressly qualified in their entirety by these risk factors. These forward-looking statements speak only as of the date made, and other than as required by law, we undertake no obligation to update or revise any forward-looking statement or provide reasons why actual results may differ, whether as a result of new information, future events or otherwise.
Introduction
The following discussion and analysis presents management’s view of our business, financial condition and overall performance and should be read in conjunction with our Consolidated Financial Statements and the accompanying notes. This information is intended to provide investors with an understanding of our past performance, current financial condition and outlook for the future.
Our discussion and analysis includes the following subjects:
Overview
We are a Delaware limited liability company formed in 2014 by Cheniere. We provide clean, secure and affordable LNG to integrated energy companies, utilities and energy trading companies around the world. We aspire to conduct our business in a safe and responsible manner, delivering a reliable, competitive and integrated source of LNG to our customers.
LNG is natural gas (methane) in liquid form. The LNG we produce is shipped all over the world, turned back into natural gas (called “regasification”) and then transported via pipeline to homes and businesses and used as an energy source that is essential for heating, cooking and other industrial uses. Natural gas is a cleaner-burning, abundant and affordable source of energy. When LNG is converted back to natural gas, it can be used instead of coal, which reduces the amount of pollution traditionally produced from burning fossil fuels, like sulfur dioxide and particulate matter that enters the air we breathe. Additionally, compared to coal, it produces significantly fewer carbon emissions. By liquefying natural gas, we are able to reduce its volume by 600 times so that we can load it onto special LNG carriers designed to keep the LNG cold and in liquid form for efficient transport overseas.
We own and operate a natural gas liquefaction and export facility located near Corpus Christi, Texas (the “Corpus Christi LNG Terminal”) through CCL, which has natural gas liquefaction facilities consisting of three operational Trains for a total production capacity of approximately 15 mtpa of LNG, three LNG storage tanks with aggregate capacity of approximately 10 Bcfe and two marine berths.berths that can each accommodate vessels with nominal capacity of up to 266,000 cubic meters. Additionally, we are constructing an expansion of the Corpus Christi LNG Terminal (the “Corpus Christi Stage 3 Project”) for up to seven midscale Trains with an expected total production capacity of over 10 mtpa of LNG. Refer to Note 2—CCL Stage III Contribution and Merger for additional information on the Corpus Christi Stage 3 Project.
CCL Stage III, CCL and CCP received approval from FERC in November 2019 to site, construct and operate the Corpus Christi Stage 3 Project. In March 2022, CCL Stage III issued limited notice to proceed to Bechtel Energy Inc. (“Bechtel”) to commence early engineering, procurement and site works. In June 2022, Cheniere’s board of directors (the “Board”) made a positive FID with respect to the Corpus Christi Stage 3 Project and issued a full notice to proceed with construction to Bechtel Energy Inc. (“Bechtel”) effective June 16, 2022. In connection with the positive FID, CCL Stage III, through which Cheniere was developing and constructing the Corpus Christi Stage 3 Project, was contributed to us from Cheniere (the “Contribution”) on June 15, 2022. Immediately following the Contribution, CCL Stage III was merged with and into CCL (the “Merger”), the surviving entity of
We also own and operate through CCP a 21.5-mile natural gas supply pipeline that interconnects the Corpus Christi LNG Terminal with several interstate and intrastate natural gas pipelines (the “Corpus Christi Pipeline” and together with the existing operational Trains, midscale trains, storage tanksCorpus Christi LNG Terminal and marine berths,the Corpus Christi Stage 3 Project, the “Liquefaction Project”).
Our long-term customer arrangements form the foundation of our business and provide us with significant, stable, and long-term cash flows. We contracthave contracted most of our anticipated production capacity under SPAs, in which our customers are generally required to pay a fixed fee with respect to the contracted volumes irrespective of their election to cancel or suspend deliveries of LNG cargoes, and under IPM agreements, in which the gas producer sells natural gas to us gas on a global LNG index price, less a fixed liquefaction fee, shipping and other costs. Our long-term customer arrangements form the foundationThrough our SPAs and IPM agreements, we have contracted
approximately
85%88% of the total anticipated production capacity from the Liquefaction Project with approximately 18 years of weighted average remaining life as of
June 30, 2022. In March
2022, the DOE authorized the export of an additional 108.16 Bcf/yr of domestically produced LNG by vessel from the Corpus Christi LNG Terminal through December 31,
2050 to non-FTA countries, that were previously authorized for FTA countries only. For further discussion of the contracted future cash flows under our revenue arrangements, see the liquidity and capital resources disclosures in our annual report on Form 10-K for the fiscal year ended December 31, 2021.2023.
We remain focused on safety, operational excellence and customer satisfaction. Increasing demand for LNG has allowed us to expand our liquefaction infrastructure in a financially disciplined manner. We have increased available liquefaction capacity at our Liquefaction Project as a result of debottlenecking and other optimization projects. We hold a significant land position at the Corpus Christi LNG Terminal, which provides opportunity for further liquefaction capacity expansion. In March 2023, CCL and another subsidiary of Cheniere submitted an application with the FERC under the Natural Gas Act (“NGA”) for an expansion adjacent to the Liquefaction Project consisting of two midscale Trains with an expected total production capacity of approximately 3 mtpa of LNG (the “Midscale Trains 8 & 9 Project”). The development of these sitesthe Midscale Trains 8 & 9 Project or other projects, including infrastructure projects in support of natural gas supply and LNG demand, will require, among other things, acceptable commercial and financing arrangements before we make a positive FID.FID is made.
Additionally, we are committed to the responsible and proactive management of our most important environmental, social and governance (“ESG”) impacts, risks and opportunities. In June 2022, Cheniere published Acting Today, Securing Tomorrow, its 2021third Corporate Responsibility (“CR”) report, which details ourCheniere’s approach and progress on ESG issues, including Cheniere’s recently announcedits collaboration with natural gas midstream companies, methane detection technology providers and leading academic institutions to implementon life-cycle assessment (“LCA”) models, quantification, monitoring, reporting and verification (“QMRV”) of greenhouse gas emissions and other research and development projects. Cheniere also co-founded and sponsored the Energy Emissions Modeling and Data Lab (“EEMDL”), a multidisciplinary research and education initiative led by the University of Texas at natural gas gathering, processing, transmissionAustin in collaboration with Colorado State University and storage systems specific to our supply chain, as well as our contributions to energy security during a critical time in history. Additionally,the Colorado School of Mines. In addition, Cheniere commenced providing Cargo Emissions Tags (“CE Tags”) to itsour long-term customers in June 2022. The CE Tags provide customers with estimated greenhouse2022 and joined the Oil and Gas Methane Partnership (“OGMP”) 2.0, the United Nations Environment Programme’s (“UNEP”) flagship oil and gas (“GHG”)methane emissions data associated with each LNG cargo produced at the Liquefaction Projectreporting and are provided for both free-on-board (“FOB”) and delivered ex-ship (“DES”) LNG cargoes.mitigation initiative, in October 2022. Cheniere’s CR report is available at cheniere.com/our-responsibility/reporting-center. Information on ourCheniere’s website, including the CR report, is not incorporated by reference into this Quarterly Report on Form 10-Q.
Overview of Significant Events
Our significant events since January 1, 20222023 and through the filing date of this Form 10-Q include the following:
Strategic
•In July 2022, CCL entered into a long-term LNG SPA with PTT Global LNG Company Limited (“PTTGL”), under which PTTGL has agreed to purchase 1.0 mtpa of LNG from CCL for twenty years beginning in 2026. The SPA calls for a combination of FOB and DES deliveries. The purchase price for LNG under the SPA is indexed to the Henry Hub price, plus a fixed liquefaction fee.
•In March 2022, CCL amended its existing long-term SPA with Engie SA (“Engie”), increasing the volume Engie has agreed to purchase from CCL to approximately 0.9 mtpa of LNG on a FOB basis, and extending the term to approximately 20 years, which began in September 2021.
•On June 15, 2022, Cheniere’s Board made a positive FID with respect to the Corpus Christi Stage 3 Project and issued a full notice to proceed with construction to Bechtel under the EPC contract to commence construction of the Corpus Christi Stage 3 Project effective June 16, 2022. In connection with the positive FID, CCL Stage III was contributed to us as and subsequently merged with and into CCL, with CCL the surviving company of the merger and our wholly owned subsidiary. Notable contracts received by CCL in connection with the merger included the following:
◦IPM agreements held by CCL Stage III with ARC Resources U.S. Corp, EOG Resources, Inc. and Apache Corporation, with terms of approximately 15 years, aggregating approximately 65 million tonnes, approximately 40 million tonnes of which commences with commercial operations of certain Trains of the Corpus Christi Stage 3 Project (the “Transferred IPM Agreements”);
◦SPAs held by Cheniere Marketing International LLP (“Cheniere Marketing”) or its subsidiaries with Foran Energy Group, Ltd, CPC Corporation, Sinochem Group Co. Ltd. and Polskie Gornictwo Naftowe I Gazownictwo S.A. (“PGNiG”), for which CCL entered into a newly executed agreement between2023, CCL and PGNiG taking the place of a portion of the term of the existing agreement between PGNiG and Cheniere Marketing, aggregating approximately 105 million tonnes of LNG to be delivered through 2046; and
◦the aforementioned EPC contract with Bechtel for the Corpus Christi Stage 3 Project for a contract price of approximately $5.5 billion, subject to adjustment only by change order.
•In June 2022, CCL and Cheniere Marketing, a wholly ownedanother subsidiary of Cheniere entered intosubmitted an SPA for approximately 44 TBtu per annum of LNG associatedapplication with the IPM agreement between CCL and ARC Resources U.S. Corp referenced aboveFERC under the NGA for a term of 15 years.the Midscale Trains 8 & 9 Project.
Operational
•As of July 30, 2022, approximately 550April 26, 2023, over 700 cumulative LNG cargoes totaling over 3548 million tonnes of LNG have been produced, loaded and exported from the Liquefaction Project.
Financial
•In June 2022,January 2023, we redeemed with cash on hand the remaining $498 million outstanding principal amount of our 7.000% Senior Secured Notes due 2024 (the “2024 CCH amended and restated its term loan credit facility (the “CCH Credit Facility”Senior Notes”) and its working capital facility (the “CCH Working Capital Facility”) to, among other things, (1) increase the commitments to approximately $4.0 billion and $1.5 billion for the CCH Credit Facility and the CCH Working Capital Facility, respectively, which are intended to fund a portion of the cost of developing, constructing and operating the Corpus Christi Stage 3 Project, (2) extend the maturity of the CCH Credit Facility to the earlier of June 15, 2029 or two years after the substantial completion of the last Train of the Corpus Christi Stage 3 Project and extend the maturity of the CCH Working Capital Facility to June 15, 2027, (3) update the indexed interest rate to SOFR and (4) make certain other changes to the terms and conditions of each existing facility..
Results of Operations
The following charts summarize the total revenues and total LNG | | | | | | | | | | | | | | | | | | | | | |
| | | Three Months Ended March 31, |
| (in millions) | | | | | 2023 | | 2022 | | Variance |
| Revenues | | | | | | | | | |
| LNG revenues | | | | | $ | 1,093 | | | $ | 1,324 | | | $ | (231) | |
| LNG revenues—affiliate | | | | | 555 | | | 671 | | | (116) | |
| | | | | | | | | |
| Total revenues | | | | | 1,648 | | | 1,995 | | | (347) | |
| | | | | | | | | |
| Operating costs and expenses (recovery) | | | | | | | | | |
| Cost (recovery) of sales (excluding items shown separately below) | | | | | (2,540) | | | 2,341 | | | (4,881) | |
| Cost of sales—affiliate | | | | | 15 | | | 12 | | | 3 | |
| | | | | | | | | |
| Operating and maintenance expense | | | | | 116 | | | 113 | | | 3 | |
| Operating and maintenance expense—affiliate | | | | | 30 | | | 30 | | | — | |
| Operating and maintenance expense—related party | | | | | 2 | | | 2 | | | — | |
| | | | | | | | | |
| | | | | | | | | |
| General and administrative expense | | | | | 2 | | | 2 | | | — | |
| General and administrative expense—affiliate | | | | | 12 | | | 8 | | | 4 | |
| Depreciation and amortization expense | | | | | 112 | | | 110 | | | 2 | |
| | | | | | | | | |
| Total operating costs and expenses (recovery) | | | | | (2,251) | | | 2,618 | | | (4,869) | |
| | | | | | | | | |
| Income (loss) from operations | | | | | 3,899 | | | (623) | | | 4,522 | |
| | | | | | | | | |
| Other income (expense) | | | | | | | | | |
| Interest expense, net of capitalized interest | | | | | (63) | | | (118) | | | 55 | |
| Loss on modification or extinguishment of debt | | | | | (10) | | | (2) | | | (8) | |
| Interest rate derivative gain, net | | | | | — | | | 3 | | | (3) | |
| Other income, net | | | | | 3 | | | — | | | 3 | |
| Total other expense | | | | | (70) | | | (117) | | | 47 | |
| | | | | | | | | |
| | | | | | | | | |
| | | | | | | | | |
| | | | | | | | | |
| Net income (loss) | | | | | $ | 3,829 | | | $ | (740) | | | $ | 4,569 | |
Operational volumes loaded (including both operational and commissioning volumes) duringrecognized from the six months ended June 30, 2022 and 2021:Liquefaction Project
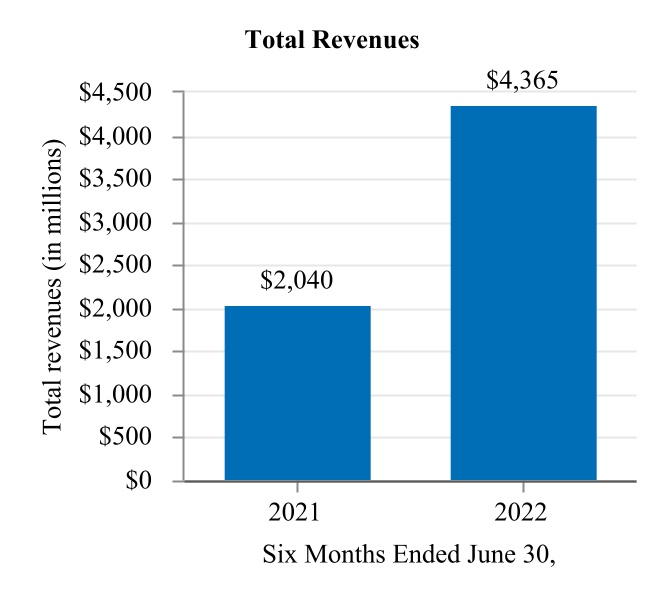
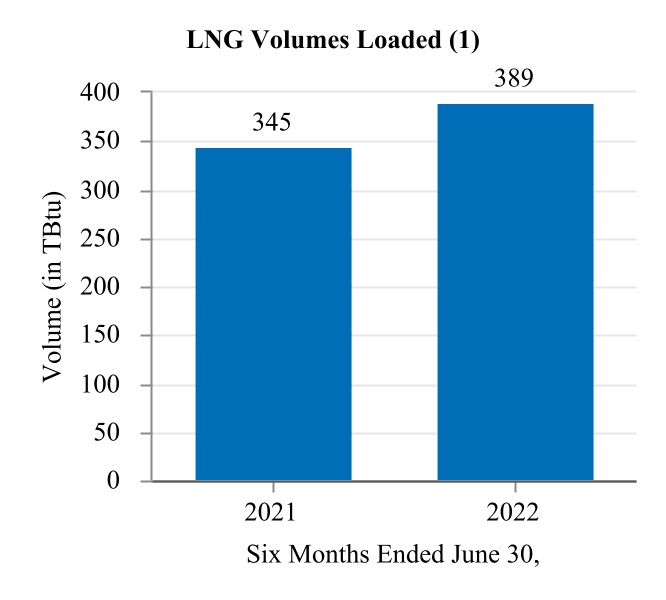
| | | | | | | | | | | | | | | | | |
| | | Three Months Ended March 31, | | |
| (in TBtu) | | | | | 2023 | | 2022 | | |
| Volumes loaded during the current period | | | | | 200 | | | 200 | | | |
| Volumes loaded during the prior period but recognized during the current period | | | | | 3 | | | — | | | |
| | | | | | | | | |
| Total volumes recognized in the current period | | | | | 203 | | | 200 | | | |
| | | | | | | | | | | | | | | | | | | | |
| | | | | | |
| (1)
| The six months ended June 30, 2021 excludes four TBtu that were loaded at our affiliate’s facility. |
Net income (loss)
Our consolidated net loss was $527 million and $1.3Substantially all of the favorable variance of $4.6 billion for the three and six months ended June 30, 2022, respectively,March 31, 2023 as compared to net lossthe same period of $71 million and net income of $260 million for the three and six months ended June 30, 2021, respectively. Substantially all of the decrease of $456 million and $1.5 billion during the three and six months ended June 30, 2022 respectively, was dueattributable to an increase in commodity derivatives losses from unfavorablefavorable changes in fair value and settlements of $586 million and $1.6derivatives of $4.5 billion between the periods, respectively, as further described below. Includedyears, of which $3.7 billion related to non-cash favorable changes in the derivative loss incurred during both the three and six months ended June 30, 2022 wasfair value of our IPM agreements where we procure natural gas at a loss incurred of $474 million associated with, and following the Contribution of, the Transferred IPM Agreements on June 15, 2022, primarily attributedprice indexed to CCL’s lower credit risk profile relative to that of CCL Stage III, resulting in a higher derivative liability given reduced risk of CCL’s own nonperformance.international gas prices.
Substantially all derivativeThe following is an additional discussion of the significant variance drivers of the change in net income (loss) by line item:
Revenues. $347 million decrease between comparable periods primarily attributable to:
•$366 million decrease due to lower pricing per MMBtu from decreased Henry Hub pricing; which was offset by
•$28 million increase due to slightly higher volumes of LNG delivered between the periods, which increased 6 TBtu or 3%.
Operating costs and expenses. $4.9 billion favorable variance between comparable periods primarily attributable to:
•$4.4 billion favorable variance from changes in fair value of derivatives included in cost of sales, from $1.0 billion of losses relatein the three months ended March 31, 2022 to $3.4 billionof gains in the usethree months ended March 31, 2023, primarily due to decreased international gas prices resulting in non-cash favorable changes in fair value of our commodity derivative instrumentsderivatives indexed to international LNGsuch prices primarily relatedand, to our IPM agreements. While operationally we utilize commoditya lesser extent, an increase in forward notional amount of derivatives due to mitigate price volatility for commodities procured or sold over a periodagreements contributed to us upon the merger of time,Corpus Christ Liquefaction Stage III, LLC with and into CCL in June 2022; and
•$416 million decrease in cost of sales excluding the effect of derivative changes described above, primarily as a result of significant appreciation$409 million in forward internationaldecreased cost of natural gas feedstock largely due to lower U.S. natural gas prices and partially offset by increased volume of LNG commodity curvesdelivered, as discussed above under the caption Revenues.
Other income (expense). $47 million decrease in total other income (expense) between comparable periods primarily attributable to:
•$55 million decrease in interest expense, net of capitalized interest, as a result of lower debt balances due to repayment of debt and lower interest costs due to refinancing higher cost debt, as further described under Financing Cash Flows in Sources and Uses of Cash within Liquidity and Capital Resources. Additionally, the decrease in interest expense, net of capitalized interest is due to a higher portion of total interest costs eligible for capitalization following the issuance of full notice to proceed to Bechtel on the Corpus Christi Stage 3 Project in 2022; partially offset by •$8 million increase in loss on modification or extinguishment of debt primarily due to premiums paid for the early redemption of the 2024 CCH Senior Notes during the three and six months ended June 30, 2022, we recognized approximately $948 millionMarch 31, 2023.
Significant factors affecting our results of operations
Below are significant factors that affect our results of operations.
Gains and $1.7 billion, respectively, of non-cash unfavorable changes in fair value attributed to positions indexed to such prices, including the $474 million losslosses on the Transferred IPM Agreements in connection with the Contribution as described above.derivative instruments
Derivative instruments, which in addition to managing exposure to commodity-related marketing and price risks are utilized to manage exposure to changing interest rates volatility, are reported at fair value on our Consolidated Financial Statements. In some cases,For commodity derivative instruments related to our IPM agreements, the underlying LNG sales being economically hedged are accounted for under the accrual method of accounting, whereby revenues expected to be derived from the future LNG sales are recognized only upon delivery or realization of the underlying transaction. Because the recognition of derivative instruments at fair value has the effect of recognizing gains or losses relating to future period exposure, and given the significant volumes, long-term duration and volatility in price basis for certain of our derivative contracts, use of derivative instruments may result in continued volatility of our results of operations based on changes in market pricing, counterparty credit risk and other relevant factors that may be outside of our control, notwithstanding the operational intent to mitigate risk exposure over time.
As described in Overview of Significant Events, during the six months ended June 30, 2022, we entered into IPM agreements with various counterparties for approximately 105 million tonnes of LNG. We expect our net income or loss in the future to be impacted by the revenues and associated expenses related to the commencement of these agreements.
We expect our net income or loss in the future will be subject to a greater degree of volatility as a result of the Transferred IPM Agreements, which as described in Overview of Significant Events, totaled approximately 65 mtpa, with terms of approximately 15 years commencing with commercial operations of certain Trains of the Corpus Christi Stage 3 Project.
Revenues
| | | | | | | | | | | | | | | | | | | | | | | | | | | | | | | | | | | | | | | | | |
| Three Months Ended June 30, | | Six Months Ended June 30, | | | | |
| (in millions, except volumes) | 2022 | | 2021 | | Variance | | 2022 | | 2021 | | | | Variance |
| LNG revenues | $ | 1,607 | | | $ | 826 | | | $ | 781 | | | $ | 2,931 | | | $ | 1,441 | | | | | $ | 1,490 | | | | | |
| LNG revenues—affiliate | 763 | | | 331 | | | 432 | | | 1,434 | | | 599 | | | | | 835 | | | | | |
| | | | | | | | | | | | | | | | | |
| Total revenues | $ | 2,370 | | | $ | 1,157 | | | $ | 1,213 | | | $ | 4,365 | | | $ | 2,040 | | | | | $ | 2,325 | | | | | |
| | | | | | | | | | | | | | | | | |
| LNG volumes recognized as revenues (in TBtu) (1) | 189 | | | 186 | | | 3 | | | 389 | | | 348 | | | | | 41 | | | | | |
(1)During the six months ended June 30, 2021, includes four TBtu that were loaded at our affiliate’s facility.
Total revenues increased by approximately $1.2 billion and $2.3 billion during the three and six months ended June 30, 2022 from the comparable periods in 2021, respectively, primarily as a result of increased revenues per MMBtu due to appreciation in the Henry Hub index. Additionally, there were higher volumes of LNG delivered six months ended June 30, 2022 from the six months ended June 30, 2021 as a result of the additional production capacity of approximately 5 mtpa from Train 3 of the Liquefaction Project, which achieved substantial completion on March 26, 2021 (the “Train 3 Completion”).
Prior to substantial completion of a Train, amounts received from the sale of commissioning cargoes from that Train are offset against LNG terminal construction-in-process, because these amounts are earned or loaded during the testing phase for the construction of that Train. During the six months ended June 30, 2021, we realized offsets to LNG terminal costs of $143 million corresponding to 28 TBtu of LNG that were related to the sale of commissioning cargoes. We did not record any offsets to LNG terminal costs during the three and six months ended June 30, 2022March 31, 2023 and the three months ended June 30, 2021.2022.
Also included in LNG revenues are sales of certain unutilized natural gas procured for the liquefaction process and gains and losses from certain commodity derivative instruments, which include the realized value associated with a portion of derivative instruments that settle through physical delivery. We recognized revenues of $89 million and $31 million during the three months ended June 30, 2022 and 2021, respectively, and $105 million and $90 million during the six months ended June 30, 2022 and 2021, respectively, related to these transactions.
Operating costs and expenses
| | | | | | | | | | | | | | | | | | | | | | | | | | | | | | | | | | | | | | | | | |
| Three Months Ended June 30, | | Six Months Ended June 30, | | | | |
| (in millions) | 2022 | | 2021 | | Variance | | 2022 | | 2021 | | | | Variance |
| Cost of sales | $ | 2,442 | | | $ | 799 | | | $ | 1,643 | | | $ | 4,783 | | | $ | 985 | | | | | $ | 3,798 | | | | | |
| Cost of sales—affiliate | 36 | | | 2 | | | 34 | | | 48 | | | 37 | | | | | 11 | | | | | |
| Cost of sales—related party | — | | | 36 | | | (36) | | | — | | | 71 | | | | | (71) | | | | | |
| Operating and maintenance expense | 118 | | | 120 | | | (2) | | | 231 | | | 203 | | | | | 28 | | | | | |
| Operating and maintenance expense—affiliate | 28 | | | 28 | | | — | | | 58 | | | 52 | | | | | 6 | | | | | |
| Operating and maintenance expense—related party | 3 | | | 3 | | | — | | | 5 | | | 5 | | | | | — | | | | | |
| Development expense | 1 | | | — | | | 1 | | | 1 | | | — | | | | | 1 | | | | | |
| | | | | | | | | | | | | | | | | |
| General and administrative expense | 2 | | | 2 | | | — | | | 4 | | | 3 | | | | | 1 | | | | | |
| General and administrative expense—affiliate | 8 | | | 7 | | | 1 | | | 16 | | | 12 | | | | | 4 | | | | | |
| Depreciation and amortization expense | 112 | | | 110 | | | 2 | | | 222 | | | 199 | | | | | 23 | | | | | |
| Other | 3 | | | 1 | | | 2 | | | 3 | | | 1 | | | | | 2 | | | | | |
| Total operating costs and expenses | $ | 2,753 | | | $ | 1,108 | | | $ | 1,645 | | | $ | 5,371 | | | $ | 1,568 | | | | | $ | 3,803 | | | | | |
Total operating costs and expenses increased $1.6 billion and $3.8 billion during the three and six months ended June 30, 2022, respectively, primarily as a result of increased cost of sales. Cost of sales includes costs incurred directly for the production and delivery of LNG from the Liquefaction Project, to the extent those costs are not utilized for the commissioning process. Substantially all of the increase in both comparable periods was attributed to third party cost of sales, which increased by $1.6 billion and $3.8 billion during the three and six months ended June 30, 2022 from the comparable 2021 periods, respectively, primarily as a result of increased pricing of natural gas feedstock as a result of higher U.S. natural gas prices and increased volume of LNG delivered and unfavorable changes in our commodity derivatives to secure natural gas feedstock for the Liquefaction Project, as discussed in Net income (loss) above.
Operating and maintenance expense (including affiliate and related party) primarily includes costs associated with operating and maintaining the Liquefaction Project. Operating and maintenance expense (including affiliates) also includes third party service and maintenance, insurance, regulatory costs and other operating costs. During the six months ended June 30, 2022, operating and maintenance expense increased from the comparable period in 2021, primarily due to increased natural gas transportation and storage capacity demand charges following Train 3 Completion, as Train 3 was in operation for the full six months ended June 30, 2022 as compared to a limited number of days during the six months ended June 30, 2021.
Depreciation and amortization expense increased during the six months ended June 30, 2022 from the comparable period in 2021 primarily as a result of Train 3 Completion.
Other expense (income)
| | | | | | | | | | | | | | | | | | | | | | | | | | | | | | | | | | | | | | | | | |
| Three Months Ended June 30, | | Six Months Ended June 30, | | | | |
| (in millions) | 2022 | | 2021 | | Variance | | 2022 | | 2021 | | | | Variance |
| Interest expense, net of capitalized interest | $ | 116 | | | $ | 118 | | | $ | (2) | | | $ | 234 | | | $ | 211 | | | | | $ | 23 | | | | | |
| Loss on modification or extinguishment of debt | 28 | | | — | | | 28 | | | 30 | | | — | | | | | 30 | | | | | |
| Interest rate derivative loss (gain), net | 1 | | | 2 | | | (1) | | | (2) | | | 1 | | | | | (3) | | | | | |
| Other income, net | (1) | | | — | | | (1) | | | (1) | | | — | | | | | (1) | | | | | |
| Total other expense | $ | 144 | | | $ | 120 | | | $ | 24 | | | $ | 261 | | | $ | 212 | | | | | $ | 49 | | | | | |
The changes in interest expense, net of capitalized interest increased during the three and six months ended June 30, 2022 compared to the comparable periods in 2021, were primarily as a result of a lower portion of total interest costs eligible for capitalization following the Train 3 Completion.
Total interest expense, net of capitalized interest consisted of the following (in millions):
| | | | | | | | | | | | | | | | | | | | | | | | | |
| | Three Months Ended June 30, | | Six Months Ended June 30, |
| 2022 | | 2021 | | 2022 | | 2021 | | |
| Total interest cost | $ | 118 | | | $ | 118 | | | $ | 237 | | | $ | 237 | | | |
| Capitalized interest, including amounts capitalized as an allowance for funds used during construction | (2) | | | — | | | (3) | | | (26) | | | |
| Total interest expense, net of capitalized interest | $ | 116 | | | $ | 118 | | | $ | 234 | | | $ | 211 | | | |
Liquidity and Capital Resources
The following information describes our ability to generate and obtain adequate amounts of cash to meet our requirements in the short term and the long term. In the short term, we expect to meet our cash requirements using operating cash flows and available liquidity, consisting of restricted cash and cash equivalents and available commitments under our credit facilities. In the long term,Additionally, we expect to meet our long term cash requirements by using operating cash flows and other future potential sources of liquidity, which may include debt offerings. The table below provides a summary of our available liquidity (in millions). Future material sources of liquidity are discussed below.
| | | | | | | |
| June 30, 2022March 31, 2023 | | |
| |
| | | |
| | | |
| | | |
| Restricted cash and cash equivalents designated for the Liquefaction Project | $ | 5193 | | | |
| Available commitments under our credit facilities (1): | | | |
| CCH Credit Facility | 3,260 | | | |
| CCH Working Capital Facility | 1,2241,338 | | | |
| Total available commitments under our credit facilities | 4,598 | | | |
| | | |
| Total available liquidity | $ | 4,5354,691 | | | |
(1)Available commitments represent total commitments less loans outstanding and letters of credit issued under each of our credit facilities as of June 30, 2022.March 31, 2023. See Note 98—Debt of our Notes to Consolidated Financial Statements for additional information on our credit facilities and other debt instruments.
Our liquidity position subsequent to June 30, 2022March 31, 2023 will be driven by future sources of liquidity and future cash requirements. Future sources of liquidity are expected to be composed of (1) cash receipts from executed contracts, under which we are contractually entitled to future consideration, and (2) additional sources of liquidity, from which we expect to receive cash although the cash is not underpinned by executed contracts. Future cash requirements are expected to be composed of (1) cash payments under executed contracts, under which we are contractually obligated to make payments, and (2) additional cash requirements, under which we expect to make payments although we are not contractually obligated to make the payments under executed contracts. For further discussion of our future sources and uses of liquidity, see the liquidity and capital resources disclosures in our annual report on Form 10-K for the fiscal year ended December 31, 2022.
Supplemental Guarantor Information
The 7.000% Senior Secured Notes due 2024, 5.875% Senior Secured Notes due 2025, 5.125% Senior Secured Notes due 2027, 3.700% Senior Secured Notes due 2029 and the series of Senior Secured Notes due 2039 with weighted average rate of 3.72%3.788% (collectively, the “CCH Senior Notes”) are jointly and severally guaranteed by each of our consolidated subsidiaries, CCL, CCP and Corpus Christi Pipeline GP, LLC (each a “Guarantor” and collectively, the “Guarantors”).
The Guarantors’ guarantees are full and unconditional, subject to certain release provisions including (1) the sale, exchange, disposition or transfer (by merger, consolidation or otherwise) of all or substantially all of the capital stock or the assets of the Guarantors, (2) the designation of the Guarantor as an “unrestricted subsidiary” in accordance with the indentures governing the CCH Senior Notes (the “CCH Indentures”), (3) upon the legal defeasance or covenant defeasance or discharge of obligations under the CCH Indentures and (4) the release and discharge of the Guarantors pursuant to the Common Security and Account Agreement. In the event of a default in payment of the principal or interest by us, whether at maturity of the CCH Senior Notes or by declaration of acceleration, call for redemption or otherwise, legal proceedings may be instituted against the Guarantors to enforce the guarantee.
The rights of holders of the CCH Senior Notes against the Guarantors may be limited under the U.S. Bankruptcy Code or federal or state fraudulent transfer or conveyance law. Each guarantee contains a provision intended to limit the Guarantor’s liability to the maximum amount that it could incur without causing the incurrence of obligations under its guarantee to be a fraudulent conveyance or transfer under U.S. federal or state law. However, there can be no assurance as to what standard a court will apply in making a determination of the maximum liability of the Guarantors. Moreover, this provision may not be effective to protect the guarantee from being voided under fraudulent conveyance laws. There is a possibility that the entire guarantee may be set aside, in which case the entire liability may be extinguished.
Summarized financial information about us and the Guarantors as a group is omitted herein because such information would not be materially different from our Consolidated Financial Statements.
Corpus Christi Stage 3 Project
The following table summarizes the project completion and construction status of the Corpus Christi Stage 3 Project as of March 31, 2023:
| | | | | | | | | | | |
| | |
| Overall project completion percentage | | 28.7% |
| Completion percentage of: | | |
| Engineering | | 49.5% |
| Procurement | | 41.8% |
| Subcontract work | | 37.1% |
| Construction | | 3.4% |
| Date of expected substantial completion | | 2H 2025 - 1H 2027 |
Sources and Uses of Cash
The following table summarizes the sources and uses of our restricted cash and cash equivalents (in millions). The table presents capital expenditures on a cash basis; therefore, these amounts differ from the amounts of capital expenditures, including accruals, which are referred to elsewhere in this report. Additional discussion of these items follows the table.
| | | Six Months Ended June 30, | | Three Months Ended March 31, |
| | 2022 | | 2021 | | | 2023 | | 2022 | |
| | Net cash provided by operating activities | Net cash provided by operating activities | | $ | 742 | | | $ | 733 | | | Net cash provided by operating activities | | $ | 482 | | | $ | 453 | | |
| Net cash used in investing activities | Net cash used in investing activities | | (406) | | | (204) | | | Net cash used in investing activities | | (606) | | | (45) | | |
| Net cash used in financing activities | Net cash used in financing activities | | (329) | | | (477) | | | Net cash used in financing activities | | (521) | | | (402) | | |
| | Net increase in restricted cash and cash equivalents | | $ | 7 | | | $ | 52 | | | |
| Net increase (decrease) in restricted cash and cash equivalents | | Net increase (decrease) in restricted cash and cash equivalents | | $ | (645) | | | $ | 6 | | |
|
Operating Cash Flows
OperatingOur operating cash flowsnet inflows during the sixthree months ended June 30,March 31, 2023 and 2022 and 2021 were $742$482 million and $733$453 million, respectively. The $29 million $9 million increasefavorable variance between the periods was primarily related to lower cash used as working capital as a result of payment timing differences and timing ofoutflows for natural gas feedstock, partially offset by an unfavorable variance due to lower cash receipts from the sale of LNG cargoes. The increasecargoes, both primarily due to lower U.S. natural gas prices. This favorable variance was partially offset by a decrease in operating cash inflowsan unfavorable variance due to higher costs associated with the saletiming of certain unutilized natural gas procured for the liquefaction process during the six months ended June 30, 2022.cash receipts and payments.
Investing Cash Flows
CashOur investing cash net outflows for property, plant and equipmentin both years primarily were primarily for the construction costs for the Liquefaction Project, which are capitalized as construction-in-process until achievement of substantial completion. InProject. The $561 million increase in 2023 compared to 2022 was primarily due to spend during the three months ended March 2021, substantial completion was achieved on Train 3, and in June 2022, Cheniere’s Board issued a full notice31, 2023 related to proceed with construction work performed by Bechtel for the Corpus Christi Stage 3 Project following the issuance of full notice to Bechtel.
Financing Cash Flows
OurThe following table summarizes our financing cash net outflows during the six months ended June 30, 2022 and 2021 were $329 million and $477 million, respectively. The $148 million decrease between the periods was due to an increase in cash inflows from receipts of capital contributions, net of capital distributions, of $1.3 billion, offset by an increase in net cash outflows from debt activity of $1.2 billion, each described further below.activities (in millions):
| | | | | | | | | | | | | | |
| | Three Months Ended March 31, |
| | 2023 | | 2022 |
| | | | |
| Repayments of debt | | $ | (498) | | | $ | (540) | |
| | | | |
| Debt extinguishment costs | | (8) | | | — | |
| Contributions | | 45 | | | 138 | |
| Distributions | | (60) | | | — | |
| Net cash used in financing activities | | $ | (521) | | | $ | (402) | |
Debt Activity
During the six months ended June 30, 2022 and 2021, total debt paid, net of issuances, was $1.2 billion and $140 million, respectively, all of which was paid prior to contractual maturity of the underlying debt. Additionally, total cash paid for debt related costs was $61 million and zero, respectively, during the six months ended June 30, 2022 and 2021. See tables below for additional details.
Debt Issuances and Related Financing Costs
The following table shows the issuances of debt, including intra-quarter borrowings (in millions):
| | | | | | | | | | | | | | | | |
| | Six Months Ended June 30, |
| | 2022 | | 2021 | | |
| | | | | | |
| | | | | | |
| CCH Credit Facility | | $ | 440 | | | $ | — | | | |
| | | | | | |
| | | | | | |
During the six months ended June 30, 2022 and 2021, we incurred debt issuance costs and other financing costs of $18 millionandzero, respectively, related to the debt issuances above and amendment of credit facilities during the respective periods.
Debt Repayments and Related Extinguishment Costs
The following table shows the repayments of debt, including intra-quarter repayments (in millions):
| | | Six Months Ended June 30, | | Three Months Ended March 31, |
| | 2022 | | 2021 | | | 2023 | | 2022 | |
| CCH Credit Facility | CCH Credit Facility | | $ | (1,390) | | | $ | — | | | CCH Credit Facility | | $ | — | | | $ | (290) | | |
| CCH Working Capital Facility | CCH Working Capital Facility | | (250) | | | (140) | | | CCH Working Capital Facility | | — | | | (250) | | |
| Total repayments | | $ | (1,640) | | | $ | (140) | | | |
| 2024 CCH Senior Notes | | 2024 CCH Senior Notes | | (498) | | | — | | |
| Total repayments of debt | | Total repayments of debt | | $ | (498) | | | $ | (540) | | |
During the sixthree months ended June 30,March 31, 2023 and 2022, and 2021, we incurredpaid debt modification or extinguishment costs of $43$8 million and zero, respectively, related to the these repayments.
Capital Contributions and Distributions
During the sixthree months ended June 30,March 31, 2023 and 2022, we received cash capital contributions of $932$45 million and $138 million, respectively, from Cheniere, primarily used to redeem our outstanding debt, and during the sixthree months ended June 30, 2021March 31, 2023 and 2022, we made cash distributions of $337$60 million and zero, respectively, to Cheniere.
Summary of Critical Accounting Estimates
The preparation of Consolidated Financial Statements in conformity with GAAP requires management to make certain estimates and assumptions that affect the amounts reported in the Consolidated Financial Statements and the accompanying notes. There have been no significant changes to our critical accounting estimates from those disclosed in our annual report on Form 10-K for the fiscal year ended December 31, 20212022.
Recent Accounting Standards
ITEM 3. QUANTITATIVE AND QUALITATIVE DISCLOSURES ABOUT MARKET RISK
Marketing and Trading Commodity Price Risk
We have entered intoCCL has commodity derivatives consisting of natural gas supply contracts for the commissioning and operation of the Liquefaction Project (“Liquefaction Supply Derivatives”). In order to test the sensitivity of the fair value of the Liquefaction Supply Derivatives to changes in underlying commodity prices, management modeled a 10% change in the commodity price for natural gas for each delivery location as follows (in millions):
| | | | | | | | | | | | | | | | | | | | | | | |
| June 30, 2022 | | December 31, 2021 |
| Fair Value | | Change in Fair Value | | Fair Value | | Change in Fair Value |
| Liquefaction Supply Derivatives | $ | (4,979) | | | $ | 1,605 | | | $ | (1,212) | | | $ | 186 | |
| | | | | | | | | | | | | | | | | | | | | | | |
| March 31, 2023 | | December 31, 2022 |
| Fair Value | | Change in Fair Value | | Fair Value | | Change in Fair Value |
| Liquefaction Supply Derivatives | $ | (2,880) | | | $ | 1,368 | | | $ | (6,278) | | | $ | 1,684 | |
ITEM 4. CONTROLS AND PROCEDURES
We maintain a set of disclosure controls and procedures that are designed to ensure that information required to be disclosed by us in the reports voluntarily filed by us under the Exchange Act, is recorded, processed, summarized and reported within the time periods specified in the SEC’s rules and forms. As of the end of the period covered by this report, we evaluated, under the supervision and with the participation of our management, including our President and Chief Financial Officer, the effectiveness of our disclosure controls and procedures pursuant to Rule 13a-15 of the Exchange Act. Based on that evaluation, our President and Chief Financial Officer concluded that our disclosure controls and procedures are effective.
During the most recent fiscal quarter, there have been no changes in our internal control over financial reporting that have materially affected, or are reasonably likely to materially affect, our internal control over financial reporting.
PART II. OTHER INFORMATION
ITEM 1. LEGAL PROCEEDINGS
We may in the future be involved as a party to various legal proceedings, which are incidental to the ordinary course of business. We regularly analyze current information and, as necessary, provide accruals for probable liabilities on the eventual disposition of these matters. There have been no material changes to the legal proceedings disclosed in our annual report on Form 10-K for the fiscal year ended December 31, 2021.2022.
ITEM 1A. RISK FACTORS
ITEM 6. EXHIBITS
| | | | | | | | | | | | | |
| | | | |
| Exhibit No. | | Description | | | | | |
10.1 | | Second Amended and Restated Term Loan Facility Agreement, dated June 15, 2022, among the Company, CCP, Corpus Christi Pipeline GP, LLC, CCL, the lenders party thereto from time to time and Société Générale as the Term Loan Facility Agent (Incorporated by reference to Exhibit 10.1 to the Company’s Current Report on Form 8-K (SEC File No. 333-215435), filed on June 22, 2022) | | | | | |
10.2 | | Second Amended and Restated Working Capital Facility Agreement, dated June 15, 2022, among the Company, CCP, Corpus Christi Pipeline GP, LLC, CCL, the lenders party thereto from time to time, the issuing banks party thereto from time to time, the swing line lenders party thereto from time to time, The Bank of Nova Scotia as Working Capital Facility Agent and Société Générale as Security Trustee (Incorporated by reference to Exhibit 10.2 to the Company’s Current Report on Form 8-K (SEC File No. 333-215435), filed on June 22, 2022) | | | | | |
10.3 | | Second Amended and Restated Common Terms Agreement, dated June 15, 2022, among the Company, CCP, Corpus Christi Pipeline GP, LLC, CCL, Société Générale, as Term Loan Facility Agent, The Bank of Nova Scotia as Working Capital Facility Agent, and Société Générale as Intercreditor Agent, and any other facility lenders party thereto from time to time(Incorporated by reference to Exhibit 10.3 to the Company’s Current Report on Form 8-K (SEC File No. 333-215435), filed on June 22, 2022) | | | | | |
10.4 | | Second Amended and Restated Common Security and Account Agreement, dated June 15, 2022, among the Company, CCP, Corpus Christi Pipeline GP, LLC, CCL, the Senior Creditor Group Representatives, Société Générale as the Intercreditor Agent, Société Générale as Security Trustee and Mizuho Bank, Ltd as the Account Bank(Incorporated by reference to Exhibit 10.4 to the Company’s Current Report on Form 8-K (SEC File No. 333-215435), filed on June 22, 2022) | | | | | |
10.5 | | | | | | | |
10.6*10.1* | | Change orders to the Lump Sum Turnkey Agreement for the Engineering, Procurement and Construction of the Corpus Christi Liquefaction Stage 3 Project, dated March 1, 2022, by and between CCLCorpus Christi Liquefaction Stage III, LLC and Bechtel Oil Gas and Chemicals, Inc.: (i) the Change Order CO-00001 Maintaining Elevated Ground Flare Option,CO-00012Chart License Fee Provisional Sum Closure, dated March 28,September 16, 2022, (ii) the Change Order CO-00002 Package 7 Pre-Investment of Trains 8CO-00013HRU Nozzles and 9 (Without Site Work)Block Headers, dated April 29,September 21, 2022, and (iii) the Change Order CO-00003 Modifications to Insurance Language,CO-00014Addition of Nitrogen Receiver, dated June December 13, 2022, (iv) the Change Order CO-00015Package 6 Feed Gas Pipeline Interfaces, dated December 14, 2022, (v) the Change Order CO-00016Old Sherwin Building Security, dated November 23, 2022, (vi) the Change Order CO-00017Remote Monitoring Diagnostic for Mixed Refrigerant (MR) Compressors, dated December 14, 2022, (vii) the Change Order CO-00018 EFG Package #1, dated January 9, 2023, (viii) the Change Order CO-00019 Q3 2022 Commodity Price Rise and Fall (ATT MM), dated January 17, 2023, (ix) the Change Order CO-00020 ICSS Vendor Selection and EPC Warranty (Yokogawa), dated September 21, 2022 and (x) the Change Order CO-00021 Laydown Development Package, dated February 6, 2023 (Portions of this exhibit have been omitted.) | | | | | |
10.7 | | | | | | | |
10.8 | | | | | | | |
| | | | | | | | | | | | | |
| | | | |
Exhibit No. | | Description |
| | | | | | | |
10.9 | | | | | | | |
| | | | | | | |
| 22.1 | | | | | | | |
| 31.1* | | | | | | | |
| 32.1** | | | | | | | |
| 101.INS* | | XBRL Instance Document | | | | | |
| 101.SCH* | | XBRL Taxonomy Extension Schema Document | | | | | |
| 101.CAL* | | XBRL Taxonomy Extension Calculation Linkbase Document | | | | | |
| 101.DEF* | | XBRL Taxonomy Extension Definition Linkbase Document | | | | | |
| 101.LAB* | | XBRL Taxonomy Extension Labels Linkbase Document | | | | | |
| 101.PRE* | | XBRL Taxonomy Extension Presentation Linkbase Document | | | | | |
| 104* | | Cover Page Interactive Data File (formatted as Inline XBRL and contained in Exhibit 101) | | | | | |
| | | | | |
| |
| * | Filed herewith. |
| ** | Furnished herewith. |
| |
Pursuant to the requirements of the Securities Exchange Act of 1934, the registrant has duly caused this report to be signed on its behalf by the undersigned, thereunto duly authorized.
| | | | | | | | | | | |
| | CHENIERE CORPUS CHRISTI HOLDINGS, LLC |
| | | |
| Date: | August 3, 2022May 1, 2023 | By: | /s/ Zach Davis |
| | | Zach Davis |
| | | President and Chief Financial Officer |
| | | (Principal Executive and Financial Officer) |
| | | |
| | | |
| Date: | August 3, 2022May 1, 2023 | By: | /s/ David Slack |
| | | David Slack |
| | | Chief Accounting Officer |
| | | (on behalf of the registrant and
as principal accounting officer) |