Washington, D.C. 20549
(Former name, former address and former fiscal year, if changed since last report)
Indicate by check mark whether the registrant is a large accelerated filer, an accelerated filer, a non-accelerated filer, a smaller reporting company or an emerging growth company. See the definitions of "large accelerated filer," "accelerated filer," "smaller reporting company" and "emerging growth company" in Rule 12b-2 of the Exchange Act.
Delek US Holdings, Inc.
Delek US Holdings, Inc.
Delek US Holdings, Inc.
Delek US Holdings, Inc.
Delek US Holdings, Inc.
Delek US Holdings, Inc. is the sole shareholder or owner of membership interests,operates through its wholly-owned subsidiaryconsolidated subsidiaries, which include Delek US Energy, Inc., of Delek Refining, Inc. ("Refining"), Delek Finance, Inc., Delek Marketing & Supply, LLC, Lion Oil Company ("Lion Oil"), Delek Renewables, LLC, Delek Rail Logistics, Inc., Delek Logistics Services Company, Delek Helena, LLC, Delek Land Holdings, LLC, (and its subsidiaries) and is also the sole shareholder of Alon USA Energy, Inc. ("Alon") (and in Alon's wholly-owned subsidiaries by virtue of Delek's ownership of Alon)its subsidiaries).
Effective July 1, 2017 (the "Effective Time"), we acquired the outstanding common stock of Alon (previously listed under NYSE: ALJ) (the "Delek/Alon Merger", as further discussed in Note 2), resulting in a new post-combination consolidated registrant renamed as Delek US Holdings, Inc. (“New Delek”), with Alon and the previous Delek US Holdings, Inc. (“Old Delek”) surviving as wholly-owned subsidiaries. New Delek is the successor issuer to Old Delek and Alon pursuant to Rule 12g-3(c) under the Securities Exchange Act of 1934, as amended (the "Exchange Act"). In addition, as a result of the Delek/Alon Merger, the shares of common stock of Old Delek and Alon were delisted from the New York Stock Exchange ("NYSE") in July 2017, and their respective reporting obligations under the Exchange Act were terminated.
Our condensed consolidated financial statements include the accounts of Delek and its consolidated subsidiaries. Certain information and footnote disclosures normally included in annual financial statements prepared in accordance with U.S. Generally Accepted Accounting Principles ("GAAP") have been condensed or omitted, although management believes that the disclosures herein are adequate to make the financial information presented not misleading. Our unaudited condensed consolidated financial statements have been prepared in conformity with GAAP applied on a consistent basis with those of the annual audited consolidated financial statements included in our Annual Report on Form 10-K filed with the Securities and Exchange Commission ("SEC") on February 28, 2017March 1, 2019 (the "Annual Report on Form 10-K") and in accordance with the rules and regulations of the SEC. These unaudited condensed consolidated financial statements should be read in conjunction with the audited consolidated financial statements and the notes thereto for the year ended December 31, 20162018 included in our Annual Report on Form 10-K.
Our condensed consolidated financial statements include Delek Logistics Partners, LP ("Delek Logistics"), Alon USA Partners, LP (the "Alon Partnership") and AltAir Paramount LLC ("AltAir"), allwhich is a variable interest entities.entity. As the indirect owner of the general partnerspartner of Delek Logistics, and the Alon Partnership and the managing member of AltAir, we have the ability to direct the activities of these entitiesthis entity that most significantly impact theirits economic performance. We are also considered to be the primary beneficiary for accounting purposes for all of these
In the opinion of management, all adjustments necessary for a fair presentation of the financial condition and the results of operations for the interim periods have been included. All significant intercompany transactions and account balances have been eliminated in consolidation. All adjustments are of a normal, recurring nature. Operating results for the interim period should not be viewed as representative of results that may be expected for any future interim period or for the full year.
Certain prior period amounts have been reclassified in order to conform to the current yearperiod presentation.
In June 2016, the FASB issued guidance requiring the measurement of all expected credit losses for financial assets held at the reporting date based on historical experience, current conditions, and reasonable and supportable forecasts. Financial institutions and other organizations will now use forward-looking information to better inform their credit loss estimates. This guidance is effective for interim and annual periods beginning after December 15, 2019. We expect to adopt this guidance on or before the effective date and are currently evaluating the impact that adopting this new guidance will have on our business, financial condition and results of operations.
In January 2017, we announced that Old Delek (and various related entities) entered into the Merger Agreementa merger agreement with Alon, as subsequently amended on February 27 and April 21, 2017.(the "Merger Agreement"). The related Merger (the "Merger" or(as previously defined, the "Delek/Alon Merger") was effective July 1, 2017 (as previously defined, the “Effective Time”), resulting in a new post-combination consolidated registrant renamed as Delek US Holdings, Inc. (as previously defined, “New Delek”), with Alon and Old Delek surviving as wholly-owned subsidiaries of New Delek. New Delek is the successor issuer to Old Delek and Alon pursuant to Rule 12g-3(c) under the Exchange Act, as amended. In addition, as a result of the Delek/Alon Merger, the shares of common stock of Old Delek and Alon were delisted from the New York Stock ExchangeNYSE in July 2017, and their respective reporting obligations under the Exchange Act were terminated. Prior to the Merger, Old Delek owned a non-controlling equity interest of approximately 47% of the outstanding shares of Alon , which was accounted for under the equity method of accounting (See Note 4).
Delek Logistics is a publicly traded limited partnership that was formed by Delek in 2012 to own, operate, acquire and construct crude oil and refined products logistics and marketing assets. A substantial majority of Delek Logistics' assets are integral to Delek’s refining and marketing operations. As of September 30, 2017,March 31, 2019, we owned a 61.5%61.4% limited partner interest in Delek Logistics, consisting of 15,294,046 common units, and a 94.6% interest in Delek Logistics GP, LLC, which owns the entire 2.0% general partner interest, consisting of 497,172498,110 general partner units, in Delek Logistics and all of the incentive distribution rights.
The limited partner interests in Delek Logistics not owned by us are reflected in net income attributable to non-controlling interest in the accompanying condensed consolidated statements of income and in non-controlling interest in subsidiaries in the accompanying condensed consolidated balance sheets.
We have agreements with Delek Logistics that, among other things, establish fees for certain administrative and operational services provided by us and our subsidiaries to Delek Logistics, provide certain indemnification obligations and establish terms for fee-based commercial logistics and marketing services provided by Delek Logistics and its subsidiaries to us.us, including new agreements related to the Big Spring Logistic Assets Acquisition. The revenues and expenses associated with these agreements are eliminated in consolidation.
Delek Logistics is a variable interest entity, as defined under GAAP, and is consolidated into our condensed consolidated financial statements.statements, representing our logistics segment. With the exception of intercompany balances and the marketing agreement intangible asset and Delek's related deferred revenue which are eliminated in consolidation, the Delek Logistics condensed consolidated balance sheets as of September 30, 2017March 31, 2019 and December 31, 2016,2018, as presented below, are included in the consolidated balance sheets of Delek (unaudited, in millions).
|
| | | | | | | | |
| | | September 30,
2017 | | December 31,
2016 |
| | | |
| ASSETS | | | | |
| Cash and cash equivalents | | $ | 5.3 |
| | $ | 0.1 |
|
| Accounts receivable | | 20.3 |
| | 19.2 |
|
| Accounts receivable from related parties | | 0.7 |
| | 2.8 |
|
| Inventory | | 7.9 |
| | 8.9 |
|
| Other current assets | | — |
| | 1.1 |
|
| Property, plant and equipment, net | | 250.7 |
| | 251.0 |
|
| Equity method investments | | 106.1 |
| | 101.1 |
|
| Goodwill | | 12.2 |
| | 12.2 |
|
| Intangible assets, net | | 16.2 |
| | 14.4 |
|
| Other non-current assets | | 3.5 |
| | 4.7 |
|
| Total assets | | $ | 422.9 |
| | $ | 415.5 |
|
| LIABILITIES AND DEFICIT | | | | |
| Accounts payable | | $ | 14.5 |
| | $ | 10.9 |
|
| Accrued expenses and other current liabilities | | 14.2 |
| | 9.8 |
|
| Long-term debt | | 401.3 |
| | 392.6 |
|
| Asset retirement obligations | | 4.0 |
| | 3.8 |
|
| Other non-current liabilities | | 14.7 |
| | 11.7 |
|
| Deficit | | (25.8 | ) | | (13.3 | ) |
| Total liabilities and equity | | $ | 422.9 |
| | $ | 415.5 |
|
Notes to Condensed Consolidated Financial Statements (Unaudited)
Alon Partnership
TheAs part of the Delek/Alon Merger, we acquired a majority interest in the Alon Partnership, is a publicly-traded limited partnership thatwhich owns the assets and conducts the operations of the Big Spring refinery and the associated integrated wholesale marketing operations. TheOn February 7, 2018 (the "Merger Date"), Delek acquired from the Alon Partnership all of the outstanding limited partner interestsunits that Delek did not already own in an all-equity transaction (the "Alon Partnership Merger"). Delek owned approximately 51.0 million limited partner units of the Alon Partnership, are represented as common units outstanding. As of September 30, 2017, the 11,492,800 common units held by the public represent 18.4% of the Alon Partnership’s common units outstanding. We own the remainingor approximately 81.6% of the Alon Partnership’s commonoutstanding units, and Alon USA Partners GP, LLC (the “Alon General Partner”), our wholly-owned subsidiary, owns 100%immediately prior to the Merger Date. Under terms of the general partner interestmerger agreement, the owners of the remaining outstanding units in the Alon Partnership which isthat Delek did not own immediately prior to the Merger Date received a non-economic interest.
Thefixed exchange ratio of 0.49 shares of New Delek common stock for each limited partner interests inunit of the Alon Partnership, notresulting in the issuance of approximately 5.6 million shares of New Delek common stock to the public unitholders of the Alon Partnership. Because the transaction represented a combination of ownership interests under common control, the transfer of equity from non-controlling interest to owned interest (additional paid-in capital) was recorded at carrying value and no gain or loss was recognized in connection with the transaction. Additionally, book-tax basis difference was created as a result of the transaction that resulted in a deferred tax asset of approximately $13.5 million, net of a valuation allowance on certain state income tax components, that also increased additional paid-in capital. Transaction costs incurred by us are reflectedthe Company in net income attributable to non-controlling interestconnection with the Alon Partnership Merger totaled approximately $3.3 million for the three months ended March 31, 2018. Such costs were included in general and administrative expenses in the accompanying condensed consolidated statements of income and in non-controlling interest in subsidiaries inincome.
Prior to the accompanying condensed consolidated balance sheets.
We have agreements withMerger Date, the Alon Partnership under which the Alon Partnership has agreed to reimburse us for certain administrative and operational services provided by us and our subsidiaries to the Alon Partnership, indemnify us with respect to certain matters and establish terms for the supply of products by the Alon Partnership to us.
The Alon Partnership iswas a variable interest entity as defined under GAAPfor which Delek was the primary beneficiary. As of March 31, 2019 and is consolidated into our condensed consolidated financial statements as part of the refining segment. We have elected to push down purchase accounting toDecember 31, 2018, the Alon Partnership which resultedis included in the push-down of the preliminary fair value of equity as purchase price consideration, and the preliminary fair valuing of assets and liabilities as of the Merger date. Such push-down purchase accounting also resulted in a preliminary determination of the fair value of our non-controlling interest in the Alon Partnership, which is estimated to be $120.6 million. With the exception of intercompany balances which are eliminated in consolidation, the Alon PartnershipDelek's condensed consolidated balance sheet as of September 30, 2017, as presented below, is included in the consolidated balance sheets of Delek (unaudited, in millions).a wholly-owned subsidiary.
|
| | | | |
| | | September 30,
2017 |
| | |
| ASSETS | | |
| Cash and cash equivalents | | $ | 268.6 |
|
| Accounts receivable | | 83.8 |
|
| Accounts receivable from related parties | | — |
|
| Inventories | | 99.8 |
|
| Prepaid expenses and other current assets | | 4.9 |
|
| Property, plant and equipment, net | | 418.1 |
|
| Goodwill | | 568.5 |
|
| Other non-current assets | | 54.0 |
|
| Total assets | | $ | 1,497.7 |
|
| LIABILITIES AND EQUITY | | |
| Accounts payable | | $ | 101.6 |
|
| Accounts payable to related parties, net of related receivables | | 84.6 |
|
| Accrued expenses and other current liabilities | | 181.8 |
|
| Current portion of long-term debt | | 2.5 |
|
Obligation under Supply and Offtake Agreement
| | 99.1 |
|
| Long-term debt, net of current portion | | 335.6 |
|
| Deferred income tax liability | | 2.4 |
|
| Other non-current liabilities | | 27.4 |
|
| Equity | | 662.7 |
|
| Total liabilities and equity | | $ | 1,497.7 |
|
4.Note 6 - Equity Method Investments
On May 14, 2015, Delek acquired from Alon Israel Oil Company, Ltd. ("Alon Israel") approximately 33.7 million shares of common stock (the "ALJ Shares") of Alon pursuant to the terms of a stock purchase agreement with Alon Israel dated April 14, 2015 (the "Alon Acquisition"). The ALJ Shares represented an equity interest in Alon of approximately 48% at the time of acquisition. We acquired the ALJ Shares with a combination of cash, Delek stock and seller-financed debt. Effective July 1, 2017, Alon became a wholly-owned subsidiary of New Delek in connection with the Delek/Alon Merger. See Note 2 for further discussion.
Below is summarized financial information of the financial condition and results of operations of Alon (in millions) for the previous periods when Alon was considered an equity method investment:
|
| | | |
| Balance Sheet Information | December 31, 2016 |
| Current assets | $ | 471.3 |
|
| Non-current assets | 1,624.0 |
|
| Current liabilities | 445.5 |
|
| Non-current liabilities | 1,067.4 |
|
| Non-controlling interests | 61.3 |
|
|
| | | | | | | |
| Income Statement Information | Three Months Ended September 30, 2016 | | Nine Months Ended September 30, 2016 |
| Revenue | $ | 1,043.7 |
| | $ | 2,902.1 |
|
| Gross profit | 147.8 |
| | 399.6 |
|
| Pre-tax loss | (13.0 | ) | | (99.4 | ) |
| Net loss | (7.3 | ) | | (64.0 | ) |
| Net loss attributable to Alon | (8.8 | ) | | (64.7 | ) |
In March 2015, Delek Logistics entered intohas two joint ventures that have constructedown and operate logistics assets, and which serve third parties and subsidiaries of Delek. As of March 31, 2019 and December 31, 2018, Delek Logistics' investment balances in these joint ventures was financed through a combination of cash from operations and borrowings under the DKL Revolver (as defined in Note 8). As of September 30, 2017, Delek Logistics' investment balance in these joint ventures was $106.1totaled $107.8 million and was$104.8 million, respectively, and were accounted for using the equity method. One of the joint venture projects was completed and began operations in September 2016. The other was completed and began operations in January 2017.
In July 2017, Delek Renewables, LLC, invested ina wholly-owned subsidiary of Delek, has a joint venture with an unrelated third party, that was formed to plan, develop, construct, own, operateowns, operates and maintainmaintains a terminal consisting of an ethanol unit train facility with an ethanol tank in North Little Rock, Arkansas. This investment was financed through cash from operations. As of September 30, 2017,March 31, 2019 and December 31, 2018, Delek Renewables, LLC's investment balance in this joint venture was $1.3$3.9 million and $2.4 million respectively, and was accounted for using the equity method. The investment in this joint venture is reflected in the refining segment.
Effective with the Delek/Alon Merger, we ownacquired a 50% interest in two joint ventures that own asphalt terminals located in Fernley, Nevada, and Brownwood, Texas. On May 21, 2018, Delek sold its 50% interest in the asphalt terminal located in Fernley, Nevada. See Note 7 for further discussion. As of September 30, 2017,March 31, 2019 and December 31, 2018, Delek's investment balance in thesethe Brownwood, Texas joint venturesventure was $34.0$23.3 million and $23.1 million, respectively. This investment is accounted for using the equity method. These investments aremethod and is included as part of total assets in the corporate, other and eliminations segment.
5.
Note 7 - Discontinued Operations and Assets Held for Sale
Retail EntitiesAsphalt Terminals Held for Sale
In August 2016,On February 12, 2018, Delek entered intoannounced it had reached a Purchase Agreementdefinitive agreement to sell certain assets and operations of four asphalt terminals (included in Delek's corporate, other and eliminations segment), as well as an equity method investment in an additional asphalt terminal located in Femley, Nevada, to an affiliate of Andeavor. On May 21, 2018, Delek completed the Retail Entities to COPEC. As a resulttransaction and received net proceeds of approximately $110.8 million, inclusive of the Purchase Agreement, we$75.0 million base proceeds as well as certain working capital adjustments. The assets associated with the owned terminals met the requirementsdefinition of ASC 205-20andheld for sale pursuant to ASC 360 to reportas of February 1, 2018, but did not meet the resultsdefinition of the Retail Entities as discontinued operations pursuant to ASC 205-20, Presentation of Financial Statements - Discontinued Operations ("ASC 205-20"), as the sale of these asphalt assets did not represent a strategic shift that would have a major effect on the entity's operations and financial results. Accordingly, depreciation ceased as of February 1, 2018, and the assets to classify the Retail Entities as a group ofbe sold were reclassified to assets held for sale. Thesale as of that date and were written down to the estimated fair value assessmentless costs to sell, resulting in an impairment loss on assets held for sale of $27.5 million for the three months ended March 31, 2018. All goodwill associated with the asphalt operations sold was written off in connection with the impairment charge discussed above. In connection with the completion of the Retail Entitiessale transaction in the second quarter of 2018, we recognized a gain of approximately $13.3 million, resulting primarily from the recognition of certain additional proceeds at closing associated with the asphalt terminals which were not previously determinable/probable and the recognition of the gain on the sale of the joint venture which was not previously recognized as of August 27, 2016held for sale (as it did not resultmeet the criteria).
Notes to Condensed Consolidated Financial Statements (Unaudited)
California Discontinued Entities
During the third quarter 2017, we committed to a plan to sell certain assets associated with our Paramount and Long Beach, California refineries and our California renewable fuels facility (as previously defined, the "California Discontinued Entities"). Such operations were designated and reported as discontinued operations. On March 16, 2018, Delek sold to World Energy, LLC (i) all of Delek’s membership interests in an impairment. We ceased depreciationthe California renewable fuels facility ("AltAir") (ii) certain refining assets and other related assets located in Paramount, California and (iii) certain associated tank farm and pipeline assets and other related assets located in California. Upon final settlement (excluding contingent components), Delek expects to receive net cash proceeds of theseapproximately $85.2 million, which includes a post-closing working capital settlement, Delek’s portion of the expected biodiesel tax credit for 2017 and certain customary adjustments. The sale resulted in a loss on sale of discontinued operations totaling approximately $41.4 million of which $41.2 million was recorded during the three months ended March 31, 2018. Of the total expected proceeds, $54.6 million was received during the three months ended March 31, 2018 ($14.9 million of which were included in net cash flows from investing activities in discontinued operations). As of March 31, 2019, we have received a total of $70.4 million of the total expected proceeds. Additionally, Delek will be entitled to its pro rata portion of any tax credits relating to AltAir activities in 2018 earned through the sale date if the 2018 biodiesel tax credit is re-enacted. A receivable for such additional contingent proceeds will be recorded when the criteria for recognition are met, which is predicated upon reenactment of the tax credit and determination of the amounts earned by AltAir.
The transaction to dispose of certain assets asand liabilities associated with our Long Beach, California refinery to Bridge Point Long Beach, LLC closed July 17, 2018 resulting in initial cash proceeds of August 27, 2016. The Retail Transaction closed in November 2016 and we received cash consideration of $378.9approximately $14.5 million, net of debt repaymentsexpenses, and transaction costs, and retained approximately $62.8 million of net liabilities from the Retail Entities. The Retail Transaction resultedresulting in a gain on sale of discontinued operations of approximately $1.4 million during the Retail Entities, before income tax,third quarter of $134.1 million in the three months ended December 31, 2016.2018.
Under the terms of the Purchase Agreement, Lion Oil and MAPCO Express entered into a supply agreement at the closing of the Retail Transaction pursuant to which Lion Oil will supply fuel to retail locations owned by MAPCO Express for a period of 18 months following the closing of the Retail Transaction (the "Fuel Supply Agreement"). We recorded net revenues of $97.7 million and $306.3 million and net cash inflows of $101.4 million and $337.5 million for the three and nine months ended September 30, 2017, respectively, associated with the Fuel Supply Agreement.
Once the Retail Entities were identified as assets held for sale, the operations associated with these properties qualified for reporting as discontinued operations. Accordingly, theThe operating results, net of tax, from discontinued operations associated with the California Discontinued Entities are presented separately in Delek’s condensed consolidated statements of income and the notes to the condensed consolidated financial statements have been adjusted to exclude the discontinued operations. Components of amounts reflected in income from discontinued operations are as follows (in millions):
|
| | | | |
| | Three Months Ended |
| | | March 31, 2018 |
| Net revenues | | 32.5 |
|
| Cost of sales: | | |
| Cost of materials and other | | 3.8 |
|
| Operating expenses (excluding depreciation and amortization) | | (7.8 | ) |
| Total cost of sales | | (4.0 | ) |
| General and administrative expenses | | (1.1 | ) |
| Interest income | | 0.3 |
|
| Other income, net | | 3.0 |
|
| Loss on sale of California Discontinued Entities | | (41.2 | ) |
| Loss from discontinued operations before taxes | | (10.5 | ) |
| Income tax benefit | | (2.3 | ) |
| Loss from discontinued operations, net of tax | | $ | (8.2 | ) |
|
| | | | | | | | |
| | | Three Months Ended | | Nine Months Ended |
| | | September 30, 2016 | | September 30, 2016 |
| Revenue | | $ | 361.7 |
| | $ | 1,034.7 |
|
| Cost of goods sold | | (306.6 | ) | | (884.5 | ) |
| Operating expenses | | (34.2 | ) | | (99.7 | ) |
| General and administrative expenses | | (5.4 | ) | | (16.7 | ) |
| Depreciation and amortization | | (4.5 | ) | | (20.3 | ) |
| Interest expense | | (1.8 | ) | | (5.4 | ) |
| Income from discontinued operations before taxes | | 9.2 |
| | 8.1 |
|
| Income tax expense | | 3.2 |
| | 2.6 |
|
| Income from discontinued operations, net of tax | | $ | 6.0 |
| | $ | 5.5 |
|
California Discontinued Entities
During the third quarter 2017, we committed to a plan to sell 100% of our equity interestsIncluded in (or substantially all of the assets of) our subsidiaries associated with our Paramount and Long Beach, California refineries and our California renewable fuels facility (AltAir Paramount, LLC), which were acquired as part of the Delek/Alon Merger. As a result of this decision and commitment to a plan, and because it was made within three months of the Delek/Alon Merger, we met the requirements under ASC 205-20 and ASC 360 to report the results of the California Discontinued Entities as discontinued operations and to classify the California Discontinued Entities as a group of assets held for sale as of July 1, 2017. The sale of the California Discontinued Entities is currently anticipated to occur within the next 12 months. The property, plant and equipment of the California Discontinued Entities were recorded at fair value as part of the Delek/Alon Merger, and we did not record any depreciation of these assets since the Delek/Alon Merger.
The carrying amount of the major classes of assets and liabilities of the California Discontinued Entities included in assets held for sale and liabilities associated with assets held for sale are as follows (in millions):
|
| | | | |
| | | September 30, 2017 |
| Assets held for sale: | | |
| Cash and cash equivalents | | $ | 6.4 |
|
| Accounts receivable | | 7.4 |
|
| Inventory | | 1.2 |
|
| Other current assets | | 1.7 |
|
| Property, plant & equipment, net | | 147.3 |
|
| Other intangibles, net | | 1.0 |
|
| Other non-current assets | | 2.2 |
|
| Assets held for sale | | $ | 167.2 |
|
| Liabilities associated with assets held for sale: | | |
| Accounts payable | | $ | 12.7 |
|
| Accrued expenses and other current liabilities | | 25.7 |
|
| Deferred tax liabilities | | 3.7 |
|
| Other non-current liabilities | | 61.0 |
|
| Liabilities associated with assets held for sale | | $ | 103.1 |
|
Once the operating assets of the California Discontinued Entities met the criteria to be classified as assets held for sale, the operations associated with these properties qualified for reporting as discontinued operations. Accordingly, the operating results, net of tax,loss from discontinued operations are presented separately in Delek’s condensed consolidated statements ofis net income and the notesattributable to the condensed consolidated financial statements have been adjusted to exclude the discontinued operations. Classification as discontinued operations requires retrospective reclassification of the associated assets, liabilities and results of operations for all periods presented, beginning (in this case) as of the date of acquisition, which was July 1, 2017. Components of amounts reflected in income from discontinued operations are as follows (in millions):
|
| | | | |
| | | Three and Nine Months Ended |
| | | September 30, 2017 |
| Revenue | | $ | 38.3 |
|
| Cost of goods sold | | (32.4 | ) |
| Operating expenses | | (8.4 | ) |
| General and administrative expenses | | (2.9 | ) |
| Interest expense | | (1.0 | ) |
| Loss from discontinued operations before taxes | | (6.4 | ) |
| Income tax benefit | | (2.3 | ) |
| Loss from discontinued operations, net of tax | | $ | (4.1 | ) |
The net assets of the California Discontinued Entities include a non-controlling interest totaling $2.6$8.1 million as of September 30, 2017, and the net loss attributablerelated to the California Discontinued Entities includes a net loss attributable to the non-controlling interest totaling $0.2 millionAltAir for the three months ended September 30, 2017.March 31, 2018.
6.
Note 8 - Inventory
Crude oil, work-in-process,work in process, refined products, blendstocks and asphalt inventory for all of our operations, excluding the Tyler refinery and merchandisefuel inventory in our Retailretail segment, are stated at the lower of cost determined using the FIFOfirst-in, first-out (“FIFO”) basis or net realizable value. Cost of all inventory at the Tyler refinery is determined using the LIFOlast-in, first-out ("LIFO") inventory valuation method and inventory is stated at the lower of cost or market. Retail merchandise inventory consists of cigarettes, beer, convenience merchandise and food service merchandise and is stated at estimated cost as determined by the retail inventory method.
Notes to Condensed Consolidated Financial Statements (Unaudited)
Carrying value of inventories consisted of the following (in millions):
|
| | | | | | | | |
| | | March 31,
2019 | | December 31,
2018 |
| Refinery raw materials and supplies | | $ | 436.6 |
| | $ | 289.0 |
|
| Refinery work in process | | 69.7 |
| | 58.9 |
|
| Refinery finished goods | | 358.0 |
| | 304.1 |
|
| Retail fuel | | 10.2 |
| | 8.0 |
|
| Retail merchandise | | 24.6 |
| | 25.4 |
|
| Logistics refined products | | 6.7 |
| | 5.5 |
|
| Total inventories | | $ | 905.8 |
| | $ | 690.9 |
|
|
| | | | | | | | |
| | | September 30,
2017 | | December 31,
2016 |
| Refinery raw materials and supplies | | $ | 314.5 |
| | $ | 145.6 |
|
| Refinery work in process | | 64.5 |
| | 37.6 |
|
| Refinery finished goods | | 270.7 |
| | 200.3 |
|
| Retail fuel | | 9.3 |
| | — |
|
| Retail merchandise | | 26.6 |
| | — |
|
| Logistics refined products | | 7.9 |
| | 8.9 |
|
| Total inventories | | $ | 693.5 |
| | $ | 392.4 |
|
Due to a lower crude oil and refined product pricing environment experienced since the end of 2014, market prices have declined to a level below the average cost of our inventories. At September 30, 2017,March 31, 2019, we recorded a pre-tax inventory valuation reserve of $17.5$1.9 million, $16.4$1.3 million of which related to LIFO inventory which is subjectdue to reversal in subsequent periods, not to exceed LIFOa market price decline below our cost should market prices recover.of certain inventory products. At December 31, 2016,2018, we recorded a pre-tax inventory valuation reserve of $16.0$54.0 million, all$39.4 million of which related to LIFO inventory, which reversed in the first quarter of 2017, as2019 due to the inventories associated withsale of inventory quantities that gave rise to the valuation adjustment at the end of 2016 were sold or used.December 31, 2018 reserve. We recognized a net reduction in cost of materials and other in the accompanying condensed consolidated statements of income related to the change in pre-tax inventory valuation gains (losses) of $11.6$52.1 million and $(1.5)$0.9 million for the three and nine months ended September 30, 2017, respectively,March 31, 2019 and $7.8 million and $26.0 million for the three and nine months ended September 30, 2016,2018, respectively. These gains (losses) were recorded as a component of cost of goods sold in the consolidated statements of income.
At September 30, 2017 and December 31, 2016, the excess of replacement cost (FIFO) over the carrying value (LIFO) of the Tyler refinery inventories was $5.6 million and $3.5 million, respectively.
Permanent Liquidations
We incurred a permanent reduction in a LIFO layer resulting in liquidation gain (loss) in our refinery inventory of $0.4 million and $0.2 million during the three and nine months ended September 30, 2017, respectively, and $(2.4) million during the nine months ended September 30, 2016. These liquidation gains (losses) were recognized as a component of cost of goods sold.
7.
Note 9 - Crude Oil Supply and Inventory Purchase Agreements
Delek has Master Supply and Offtake Agreements (the "Supply and Offtake Agreements") with J. Aron & Company ("J. Aron").
El Dorado refinery operationsSupply and Offtake Agreement
Throughout the term of theThe El Dorado refinery's Supply and Offtake Agreement that supports the operations of our El Dorado refineryas amended and restated on February 27, 2017 and in effect through December 2018 (the "El Dorado Supply and Offtake Agreement"), which was amended on February 27, 2017 to change, among other things, certain terms related to pricing and an extension provided for Lion Oil Company ("Lion Oil") (as the primary legal entity associated with the El Dorado refinery for purposes of the maturity date to April 30, 2020, Lion Oilthis Agreement) and J. Aron willto identify mutually acceptable contracts for the purchase of crude oil from third parties and J. Aron willto supply up to 100,000 barrels per day ("bpd")bpd of crude oil to the El Dorado refinery. Crude oil supplied to the El Dorado refinery by J. Aron will beis purchased daily at an estimated average monthly market price by Lion Oil. J. Aron will also purchase all refined products from the El Dorado refinery at an estimated daily market price, as they are produced. These daily purchases and sales are trued-up on a monthly basis in order to reflect actual average monthly prices. We have recorded a (payable) receivable related to this monthly settlement of $1.5$15.8 million and $6.9$7.8 million as of September 30, 2017March 31, 2019 and December 31, 2016,2018, respectively. Also pursuant to the El Dorado Supply and Offtake Agreement and other related agreements, Lion Oil will endeavor to arrangearranges potential sales by either Lion Oil or J. Aron to third parties of the products produced at the El Dorado refinery or purchased from third parties. In instances where Lion Oil is the seller to such third parties, J. Aron will first transfer title to the applicable products to Lion Oil. The El Dorado Supply and Offtake Agreement has a maturity date of April 30, 2020. Based upon terms in effect as of December 31, 2018, upon the expiration or upon any earlier termination, Delek would be required to repurchase the consigned crude oil and refined products from J. Aron at then prevailing market prices.
Effective January 3, 2019, we amended the El Dorado Supply and Offtake Agreement with J. Aron that supports the operations of our El Dorado refinery so that the repurchase of baseline volumes at the end of the El Dorado Supply and Offtake Agreement term (representing the El Dorado "Baseline Step-Out Liability") will be based upon a fixed price instead of a market-indexed price. The modified arrangement results in a Baseline Step-Out Liability that is no longer subject to commodity volatility, but for which its fair value is now subject to interest rate risk. As a result, we recorded a gain on the change in fair value resulting from the modification of the instruments from commodities-based risk to interest rate risk in cost of materials and other totaling approximately $4.1 million in the first quarter of 2019, and we incurred $3.2 million in fees paid to J. Aron which were charged to interest expense. Such Baseline Step-Out Liability will continue to be recorded at fair value, where the fair value will reflect changes in interest rate risk rather than commodity price risk under the fair value election provided by ASC 815 Derivatives and Hedging ("ASC 815") and ASC 825, Financial Instruments ("ASC 825"). The change in fair value recorded during the three months ended March 31, 2019 related to the new instrument totaled $(2.5) million and is reflected as a reduction in interest expense.
At March 31, 2019 and December 31, 2018, Delek had 3.5 million barrels and 2.8 million barrels, respectively, of inventory consigned from J. Aron under the El Dorado Supply and Offtake Agreement, and we have recorded total liabilities associated with this consigned inventory of $190.9 million and $152.6 million, respectively, on the condensed consolidated balance sheets. As a result of the amendment to the El Dorado Supply and Offtake Agreement, as of March 31, 2019, the fair value of the Baseline Step-Out Liability totaling $103.6 million is reflected as a non-current obligation on our condensed consolidated balance sheet, and represents 2.0 million barrels of baseline consigned inventory.
We maintained letters of credit with respect to the El Dorado Supply and Offtake Agreement totaling $150.0 million and $120.0 million at March 31, 2019 and December 31, 2018, respectively.
This arrangement is accounted for as a product financing arrangement.financing. Delek incurred recurring fees payable to J. Aron under the El Dorado Supply and Offtake Agreement of $2.5$2.4 million and $7.3$2.7 million during the three and nine months ended September 30, 2017, respectively,March 31, 2019 and $2.6 million and $7.4 million during the three and nine months ended September 30, 2016,March 31, 2018, respectively. These amounts are included as a component of interest expense in the condensed consolidated statements of income. Upon any termination of the El Dorado Supply and Offtake Agreement, including in connection with a force majeure event, the parties are required to negotiate with third parties for the assignment to us of certain contracts, commitments and arrangements, including procurement contracts, commitments for the sale of product, and pipeline, terminalling, storage and shipping arrangements.
Upon the expiration of the El DoradoAlon Supply and Offtake Agreement on April 30, 2020, or upon any earlier termination, Delek will be required to repurchase the consigned crude oil and refined products from J. Aron at then prevailing market prices. At September 30, 2017, Delek had 2.9 million barrels of inventory consigned from J. Aron, and we have recorded liabilities associated with this consigned inventory of $157.3 million in the condensed consolidated balance sheet.
Alon refinery operationsAgreements
Effective with the Delek/Alon Merger, we assumed Alon's existing Supply and Offtake Agreements and other associated agreements with J. Aron to support the operations of our Big Spring and Krotz Springs and California refineries (as further defined in Note 14) and certain of our asphalt terminals (together, the “Alon Supply and Offtake Agreements”). Pursuant to the Alon Supply and Offtake Agreements, (i) J. Aron agreed to sell to us, and we agreed to buy from J. Aron, at market prices, crude oil for processing at these refineries and (ii) we agreed to sell, and J. Aron agreed to buy, at market prices, certain refined products produced at these refineries. The Alon Supply and Offtake Agreements also provide for the sale, at market prices, of our crude oil and certain refined product inventories to J. Aron, the lease to J. Aron of crude oil and refined product storage facilities and the identification of prospective purchasers of refined products on J. Aron’s behalf. The Alon Supply and Offtake Agreements for the Big Spring and Krotz Springs refineries have initial terms that expire in May 2021, and the Supply and Offtake Agreement for the California refineries has initial terms that expire in May 2019.2021. J. Aron or Delek may elect to terminate the Supply and Offtake Agreements for the Big Spring and Krotz Springs refineries prior to the expiration of the initial term beginning in May 2018 and upon each anniversary thereof, on six months' prior notice. We may elect to terminateagreements at the Big Spring and Krotz Springs refineries in May 2020 on six months' prior notice. J. Aron may elect to terminate the Supply and Offtake Agreement for the California refineries prior to the expiration of the initial term beginning in May 2017 and upon each anniversary thereof, on six months prior notice. We may elect to terminate at the California refineries in May 2018 on six months' prior notice.
TheseThe daily purchases and sales are trued-up on a monthly basis in order to reflect actual average monthly prices. We have recorded a net receivable (payable) related to this monthly settlement of $6.6$17.2 million and $(1.0) million as of September 30, 2017.March 31, 2019 and December 31, 2018, respectively. Based upon terms in effect prior to the December 2018 and January 2019 amendments discussed below, upon the expiration or upon any earlier termination, Delek would be required to repurchase the consigned crude oil and refined products from J. Aron at then prevailing market prices.
These arrangementsEffective December 21, 2018, we amended our Supply and Offtake Agreement related to the Big Spring refinery (the "Big Spring Supply and Offtake Agreement") so that the repurchase of baseline volumes at the end of the Supply and Offtake Agreement term (representing the Big Spring "Baseline Step-Out Liability") will be based upon a fixed price instead of a market-indexed price. The modified arrangement results in a Baseline Step-Out Liability that is no longer subject to commodity volatility, but for which its fair value is now subject to interest rate risk. As a result for the Big Spring Supply and Offtake Agreement, we recorded a gain on the change in fair value resulting from the modification of the instruments from commodities-based risk to interest rate risk in cost of materials and other in the fourth quarter of 2018. Such Baseline Step-Out Liability will continue to be recorded at fair value, where the fair value will reflect changes in interest rate risk rather than commodity price risk under the fair value election provided by ASC 815 and ASC 825. Fees paid to J Aron as a result of this transaction were recorded as interest expense. As of March 31, 2019 and December 31, 2018 , the fair value of the Baseline Step-Out Liability for the Big Spring refinery was $48.1 million and $49.6 million, respectively, each based on 0.8 million barrels of baseline consigned inventory. As a result of the amendment, as of both March 31, 2019 and December 31, 2018, this baseline consigned inventory for the Big Spring refinery is reflected as a non-current obligation on our condensed consolidated balance sheet. The change in fair value recorded during the three months ended March 31, 2019 related to the new instrument totaled $(1.5) million and is reflected as a reduction in interest expense. There were no changes in our credit spread during the period that would require recognition in accumulated other comprehensive income pursuant to ASC 825.
At March 31, 2019 and December 31, 2018, Delek had 1.5 million barrels and 1.7 million barrels, respectively, of inventory consigned from J. Aron under the Big Spring Supply and Offtake Agreement, and we have recorded total liabilities associated with this consigned inventory of $91.5 million and $96.5 million, respectively, on the condensed consolidated balance sheets.
Effective January 2, 2019, we amended our Supply and Offtake Agreement related to the Krotz Springs refinery (the "Krotz Springs Supply and Offtake Agreement") so that the repurchase of baseline volumes at the end of the Supply and Offtake Agreement term (representing the Krotz Springs "Baseline Step-Out Liability") will also be based upon a fixed price instead of a market-indexed price. Like the Big Spring amendment, this modified arrangement results in a Baseline Step-Out Liability that is no longer subject to commodity volatility, but for which its fair value is now subject to interest rate risk. As a result for the Krotz Springs Supply and Offtake Agreement, we recorded a gain on the change in fair value resulting from the modification of the instruments from commodities-based risk to interest rate risk in cost of materials and other of $3.5 million in the first quarter of 2019, and we incurred $1.8 million in fees paid to J Aron which were charged to interest expense. Such Baseline Step-Out Liability will continue to be recorded at fair value, where the fair value will reflect changes in interest rate risk rather than commodity price risk under the fair value election provided by ASC 815 and ASC 825.
At March 31, 2019, Delek had 1.4 million barrels of inventory consigned from J. Aron under the Krotz Springs Supply and Offtake Agreement, inclusive of both the baseline volumes and over, short and excess target quantities, and we have total recorded liabilities associated with this consigned inventory of $102.4 million in the condensed consolidated balance sheets. As a result of the amendment, as of March 31, 2019, the fair value of the Baseline Step-Out Liability totaling $74.2 million for the Krotz Springs refinery is reflected as a non-current obligation on our condensed consolidated balance sheet, and represents 1.3 million barrels of baseline consigned inventory. The change in fair value
recorded during the three months ended March 31, 2019 related to the new instrument totaled $(1.1) million and is reflected as a reduction in interest expense. There were no changes in our credit spread during the period that would require recognition in accumulated other comprehensive income pursuant to ASC 825.
Based upon terms in effect as of December 31, 2018 for the Krotz Springs Supply and Offtake Agreement, as of December 31, 2018, we had 1.8 million barrels of inventory consigned from J. Aron under the Krotz Springs Supply and Offtake Agreement, inclusive of both the baseline volumes and over, short and excess target quantities, and recorded a current liability associated with this consigned inventory of $113.1 million in the consolidated balance sheets, measured using the fair value election pursuant to ASC 825 (based on prevailing market-indexed pricing).
Both the Big Spring Supply and Offtake Agreement and the Krotz Springs Supply and Offtake Agreement are accounted for as product financing arrangements. Delek incurred recurring fees payable to J. Aron of $2.3$3.7 million and $3.4 million during the three months ended September 30, 2017.March 31, 2019 and 2018, respectively. These amounts are included as a component of interest expense in the condensed consolidated statements of income. Upon any termination of the Alon Supply and Offtake Agreement,Agreements, including in connection with a force majeure event, the parties are required to negotiate with third parties for the assignment to us of certain contracts, commitments and arrangements, including procurement contracts, commitments for the sale of product, and pipeline, terminalling, storage and shipping arrangements.
Upon the expirationWe maintain letters of credit totaling $44.0 million and $24.0 million, as of March 31, 2019 and December 31, 2018, respectively with respect to the Alon Supply and Offtake Agreements, or upon any earlier termination, Delek will be required to repurchase the consigned crude oil and refined products from J. Aron at then prevailing market prices. At September 30, 2017, Delek had 3.4 million barrels of inventory consigned from J. Aron, and we have recorded liabilities associated with this consigned inventory of $229.4 million in the condensed consolidated balance sheet.
Agreements. In connection with the AlonKrotz Springs Supply and Offtake Agreement, for our Krotz Springs refinery, we have granted a security interest to J. Aron in certain assets (including all of its accounts receivable and inventoryinventory) to secure its obligations to J. Aron. In addition, we have granted a security interest in all of the Krotz Springs refinery's real property and equipment to J. Aron to secure our obligations under a commodity hedge and sale agreement in lieu of posting cash collateral and being subject to cash margin calls.
8.Note 10 - Long-Term Obligations and Notes Payable
Outstanding borrowings, net of unamortized debt discounts and certain deferred financing costs, under Delek’s existing debt instruments are as follows (in millions):
|
| | | | | | | | |
| | | September 30,
2017 | | December 31,
2016 |
| DKL Revolver | | $ | 158.8 |
| | $ | 392.6 |
|
DKL Notes (1) | | 242.5 |
| | — |
|
Wells Term Loan(2) | | 46.3 |
| | 63.6 |
|
| Wells Revolving Loan | | 45.0 |
| | — |
|
| Reliant Bank Revolver | | 17.0 |
| | 17.0 |
|
| Promissory Notes | | 95.2 |
| | 130.0 |
|
Lion Term Loan Facility(3) | | 210.0 |
| | 229.7 |
|
| Alon Partnership Credit Facility | | 100.0 |
| | — |
|
| Alon Partnership Term Loan | | 238.1 |
| | — |
|
Alon Convertible Senior Notes (4) | | 144.7 |
| | — |
|
Alon Term Loan Credit Facilities (5) | | 42.0 |
| | ��� |
|
Alon Retail Credit Facilities (6) | | 88.2 |
| | — |
|
| | | 1,427.8 |
| | 832.9 |
|
| Less: Current portion of long-term debt and notes payable | | 351.0 |
| | 84.4 |
|
| | | $ | 1,076.8 |
| | $ | 748.5 |
|
|
| | | | | | | | |
| | | March 31,
2019 | | December 31,
2018 |
| Revolving Credit Facility | | $ | 300.0 |
| | $ | 300.0 |
|
Term Loan Credit Facility (1) | | 680.9 |
| | 682.9 |
|
| Delek Logistics Credit Facility | | 461.2 |
| | 456.7 |
|
Delek Logistics Notes (2) | | 244.0 |
| | 243.7 |
|
| Reliant Bank Revolver | | 30.0 |
| | 30.0 |
|
| Promissory Notes | | 45.0 |
| | 70.0 |
|
| | | 1,761.1 |
| | 1,783.3 |
|
| Less: Current portion of long-term debt and notes payable | | 32.0 |
| | 32.0 |
|
| | | $ | 1,729.1 |
| | $ | 1,751.3 |
|
| |
(1) | The DKLTerm Loan Credit Facility is net of deferred financing costs of $4.2 million and $3.5 million, respectively, and debt discount of $7.9 million and $8.4 million at March 31, 2019 and December 31, 2018. |
| |
(2) | The Delek Logistics Notes are net of deferred financing costs of $5.7$4.6 million and debt discount of $1.8 million at September 30, 2017. |
| |
(2)
| The Wells Term Loan is net of deferred financing costs of a nominal amount and $0.1$4.8 million, respectively, and debt discount of $0.4$1.4 million and $0.5$1.5 million, respectively, at September 30, 2017March 31, 2019 and December 31, 2016.2018. |
Outstanding Obligations/Facilities as of the Balance Sheet Dates
Delek Revolver and Term Loan
On March 30, 2018, (the "Closing Date"), Delek entered into (i) a new term loan credit agreement with Wells Fargo Bank, National Association, as administrative agent (the "Term Administrative Agent"), Delek, as borrower, certain subsidiaries of Delek, as guarantors, and the lenders from time to time party thereto, providing for a senior secured term loan facility in an amount of $700.0 million (the "Term Loan Credit Facility") and (ii) a second amended and restated credit agreement with Wells Fargo Bank, National Association, as administrative agent (the "Revolver Administrative Agent"), Delek, as borrower, certain subsidiaries of Delek, as guarantors, and the other lenders party thereto, providing for a senior secured asset-based revolving credit facility with commitments of $1.0 billion (the "Revolving Credit Facility" and, together with the Term Loan Credit Facility, the "New Credit Facilities").
|
| |
(3)
21 | | The Lion Term Loan Facility is net of deferred financing costs of $2.3 million and $3.0 million, respectively, and debt discount of $0.8 million and $1.1 million, respectively, at September 30, 2017 and December 31, 2016. |
(4)
Notes to Condensed Consolidated Financial Statements (Unaudited)
The Alon Convertible Senior Notes are netRevolving Credit Facility permits borrowings in Canadian dollars of debt discountup to $50.0 million. The Revolving Credit Facility also permits the issuance of $5.3letters of credit of up to $300.0 million, at September 30, 2017.including letters of credit denominated in Canadian dollars of up to $10.0 million. Delek may designate restricted subsidiaries as additional borrowers under the Revolving Credit Facility.
(5) The Alon Term Loan Credit Facility was drawn in full for $700.0 million on the Closing Date at an original issue discount of 0.50%. Proceeds under the Term Loan Credit Facility, as well as proceeds of approximately $300.0 million in borrowings under the Revolving Credit Facility on the Closing Date, were used to repay certain indebtedness of Delek and its subsidiaries (the “Refinancing”), as well as certain fees, costs and expenses in connection with the closing of the New Credit Facilities, are netwith any remaining proceeds held in cash. Proceeds of future borrowings under the Revolving Credit Facility will be used for working capital and general corporate purposes of Delek and its subsidiaries.
We recorded a loss on extinguishment of debt discounttotaling approximately $9.0 million during the three months ended March 31, 2018 in connection with the Refinancing.
Interest and Unused Line Fees
The interest rates applicable to borrowings under the Term Loan Credit Facility and the Revolving Credit Facility are based on a fluctuating rate of $0.7 millioninterest measured by reference to either, at Delek’s option, (i) a base rate, plus an applicable margin, or (ii) a reserve-adjusted London Interbank Offered Rate ("LIBOR"), plus an applicable margin (or, in the case of Revolving Credit Facility borrowings denominated in Canadian dollars, the Canadian dollar bankers' acceptances rate ("CDOR")). The initial applicable margin for all Term Loan Credit Facility borrowings was 1.50% per annum with respect to base rate borrowings and 2.50% per annum with respect to LIBOR borrowings.
On October 26, 2018, Delek entered into an amendment to the Term Loan Credit Facility (the “First Amendment”) to reduce the margin on certain borrowings under the Term Loan Credit Facility and incorporate certain other changes. The First Amendment prospectively decreases the applicable margins for borrowings under (i) Base Rate Loans from 1.50% to 1.25% and (ii) LIBOR Rate Loans from 2.50% to 2.25%, as such terms are defined in the Term Loan Credit Facility. The decreases to the applicable margins became effective upon execution of the First Amendment.
The initial applicable margin for Revolving Credit Facility borrowings was 0.25% per annum with respect to base rate borrowings and 1.25% per annum with respect to LIBOR and CDOR borrowings, and the applicable margin for such borrowings after September 30, 2017.2018 is based on Delek’s excess availability as determined by reference to a borrowing base, ranging from 0.25% to 0.75% per annum with respect to base rate borrowings and from 1.25% to 1.75% per annum with respect to LIBOR and CDOR borrowings.
In addition, the Revolving Credit Facility requires Delek to pay an unused line fee on the average amount of unused commitments thereunder in each quarter, which fee will be at a rate of 0.25% or 0.375% per annum, depending on average commitment usage for such quarter. As of March 31, 2019, the unused line fee was 0.375% per annum.
(6) Maturity and Repayments
The Alon RetailRevolving Credit Facility will mature and the commitments thereunder will terminate on March 30, 2023. The Term Loan Credit Facility requires scheduled quarterly principal payments of $1.75 million, with the balance of the principal due on March 30, 2025. Additionally, the Term Loan Credit Facility requires prepayments by Delek with the net cash proceeds from certain debt incurrences, asset dispositions and insurance or condemnation events with respect to Delek’s assets, subject to certain exceptions, thresholds and reinvestment rights. The Term Loan Credit Facility also requires prepayments with a variable percentage of Delek’s excess cash flow, ranging from 50.0% to 0% depending on Delek’s consolidated secured net leverage ratio from time to time. Delek may also make voluntarily prepayments under the Term Loan Credit Facility at any time, subject to a prepayment premium of 1.0% in connection with certain customary repricing events that may occur within six months after the Closing Date, with no premium applied after six months.
Guarantee and Security
The obligations of the borrowers under the New Credit Facilities are netguaranteed by Delek and each of debt discountits direct and indirect, existing and future, wholly-owned domestic subsidiaries, subject to customary exceptions and limitations, and excluding Delek Logistics Partners, LP, Delek Logistics GP, LLC, and each subsidiary of $2.8the foregoing (collectively, the "MLP Subsidiaries"). Borrowings under the New Credit Facilities are also guaranteed by DK Canada Energy ULC, a British Columbia unlimited liability company and a wholly-owned restricted subsidiary of Delek.
The Revolving Credit Facility is secured by a first priority lien over substantially all of Delek’s and each guarantor's receivables, inventory, renewable identification numbers, instruments, intercompany loan receivables, deposit and securities accounts and related books and records and certain other personal property, subject to certain customary exceptions (the "Revolving Priority Collateral"), and a second priority lien over substantially all of Delek's and each guarantor's other assets, including all of the equity interests of any subsidiary held by Delek or any guarantor (other than equity interests in certain MLP Subsidiaries) subject to certain customary exceptions, but excluding real property (such real property and equity interests, the "Term Priority Collateral").
Notes to Condensed Consolidated Financial Statements (Unaudited)
The Term Loan Credit Facility is secured by a first priority lien on the Term Priority Collateral and a second priority lien on the Revolving Priority Collateral, all in accordance with an intercreditor agreement between the Term Administrative Agent and the Revolver Administrative Agent and acknowledged by Delek and the subsidiary guarantors. Certain excluded assets are not included in the Term Priority Collateral and the Revolving Priority Collateral.
Additional Information
At March 31, 2019, the weighted average borrowing rate under the Revolving Credit Facility was 5.75% and was comprised entirely of a base rate borrowing, and the principal amount outstanding thereunder was $300.0 million. Additionally, there were letters of credit issued of approximately $226.4 million at September 30, 2017.as of March 31, 2019 under the Revolving Credit Facility. Unused credit commitments under the Revolving Credit Facility, as of March 31, 2019, were approximately $473.6 million
DKL RevolverAt March 31, 2019, the weighted average borrowing rate under the Term Loan Credit Facility was approximately 4.75% comprised entirely of a LIBOR borrowing and the principal amount outstanding thereunder was $693.0 million.
Delek Logistics hasCredit Facility
Prior to its amendment and restatement on September 28, 2018, Delek Logistics had a $700.0 million senior secured revolving credit agreement with Fifth Third Bank ("Fifth Third"), as administrative agent, and a syndicate of lenders (the "DKL Revolver""2014 Facility") with a $100.0 million accordion feature, bearing interest at (i) either a U.S. prime dollar rate or a LIBOR Rate for borrowings denominated in U.S. Dollars, or (ii) either a Canadian dollar prime rate, or a Canadian Dealer Offered Rate, for borrowing denominated in Canadian dollars (in each case plus applicable margins, at the election of the borrowers and as a function of draw down currency). On September 28, 2018, Delek Logistics and all of its existing wholly-owned subsidiaries are borrowers underentered into a third amended and restated senior secured revolving credit agreement, with Fifth Third, as administrative agent, and a syndicate of lenders (hereafter, the DKL Revolver, except"Delek Logistics Credit Facility"). Under the terms of the Delek Logistics Finance Corp., a Delaware corporation and a wholly-owned subsidiary ofCredit Facility, among other things, the lender commitments were increased from $700.0 million to $850.0 million. The Delek Logistics ("Finance Corp."). The DKL RevolverCredit Facility also contains a dual currency borrowing tranche that permits draw downs in U.S. or Canadian dollars and an accordion feature whereby Delek Logistics can increase the size of the credit facility to an aggregate of $800.0 million,$1.0 billion, subject to receiving increased or new commitments from lenders and the satisfaction of certain other conditions precedent.
The obligations under the DKL Revolver areDelek Logistics Credit Facility remain secured by a first priority lienliens on substantially all of Delek Logistics' tangible and intangible assets. Additionally, a subsidiary of Delek providescontinues to provide a limited guaranty of Delek Logistics' obligations under the DKL Revolver.Delek Logistics Credit Facility. The guaranty is (i) limited to an amount equal to the principal amount, plus unpaid and accrued interest, of a promissory note made by Delek in favor of the subsidiary guarantor (the "Holdings Note") and (ii) secured by the subsidiary guarantor's pledge of the Holdings Note to the DKL RevolverDelek Logistics Credit Facility lenders. As of September 30, 2017,both March 31, 2019 and December 31, 2018, the principal amount of the Holdings Note was $102.0 million.
The DKL Revolver will mature on December 30, 2019.Delek Logistics Credit Facility has a maturity date of September 28, 2023. Borrowings under the DKL RevolverDelek Logistics Credit Facility bear interest at either a U.S. basedollar prime rate, Canadian prime rate, LIBOR, or a Canadian Dealer Offered Rate,CDOR rate, in each case plus applicable margins, at the election of the borrowers and as a function of draw down currency. The applicable margin in each case variesand the fee payable for the unused revolving commitments vary based upon Delek Logistics' most recent total leverage ratio which iscalculation delivered to the lenders, as called for and defined asunder the ratioterms of total funded debt to EBITDA for the most recently ended four fiscal quarters.Delek Logistics Credit Facility. At September 30, 2017,March 31, 2019, the weighted average borrowing rate
was approximately 4.0%5.1%. Additionally, the DKL RevolverDelek Logistics Credit Facility requires Delek Logistics to pay a leverage ratio dependent quarterly fee on the average unused revolving commitment. As of September 30, 2017,March 31, 2019, this fee was 0.50%0.40% per year.
As of September 30, 2017,March 31, 2019, Delek Logistics had $158.8$461.2 million of outstanding borrowings under the credit facility, as well asDelek Logistics Credit Facility, with no letters of credit issued of $8.5 million.in place. Unused credit commitments under the DKL Revolver,Delek Logistics Credit Facility, as of September 30, 2017,March 31, 2019, were $532.7$388.8 million.
DKLDelek Logistics Notes
On May 23, 2017, Delek Logistics and Delek Logistics Finance Corp. (collectively, the “Issuers”), issued $250.0 million in aggregate principal amount of 6.750%6.75% senior notes due 2025 (the “DKL“Delek Logistics Notes”) at a discount. The DKLDelek Logistics Notes are general unsecured senior obligations of the Issuers. The DKLDelek Logistics Notes are unconditionally guaranteed jointly and severally on a senior unsecured basis by Delek Logistic'sLogistics' existing subsidiaries (other than Delek Logistics Finance Corp., the "Guarantors") and will be unconditionally guaranteed on the same basis by certain of Delek Logistic’sLogistics' future subsidiaries. The DKLDelek Logistics Notes rank equal in right of payment with all existing and future senior indebtedness of the Issuers, and senior in right of payment to any future subordinated indebtedness of the Issuers. Interest on the DKL Delek Logistics Notes is payable semi-annually in arrears on each May 15 and November 15, commencing November 15, 2017.
At any time prior to May 15, 2020, the Issuers may redeem up to 35% of the aggregate principal amount of the DKLDelek Logistics Notes with the net cash proceeds of one or more equity offerings by Delek Logistics at a redemption price of 106.750% of the redeemed principal amount, plus accrued and unpaid interest, if any, subject to certain conditions and limitations. Prior to May 15, 2020, the Issuers may redeem all or part of the DKLDelek Logistics Notes at a redemption price of the principal amount plus accrued and unpaid interest, if any, plus a "make whole" premium, subject to certain conditions and limitations. In addition, beginning on May 15, 2020, the Issuers may, subject to certain conditions and limitations, redeem all or part of the DKLDelek Logistics Notes, at a redemption price of 105.063% of the redeemed principal for
Notes to Condensed Consolidated Financial Statements (Unaudited)
the twelve-month period beginning on May 15, 2020, 103.375% for the twelve-month period beginning on May 15, 2021, 101.688% for the twelve-month period beginning on May 15, 2022 and 100.00% beginning on May 15, 2023 and thereafter, plus accrued and unpaid interest, if any. There are also certain redemption provisions in
In the event of a change of control, accompanied or followed by a ratings downgrade within a certain period of time, subject to certain conditions and limitations.
limitations, the Issuers will be obligated to make an offer for the purchase of the Delek Logistics Notes from holders at a price equal to 101.00% of the principal amount thereof, plus accrued and unpaid interest.
In connection withMay 2018, the issuance of the 2025Delek Logistics Notes the Issuers and the Guarantors entered into a registration rights agreement, whereby the Issuers and the Guarantors are required to exchange the 2025 Noteswere exchanged for new notes with terms substantially identical in all material respects with the 2025 Notes (exceptexcept the new notes willdo not contain terms with respect to transfer restrictions). The Issuers and the Guarantors will use their commercially reasonable efforts to cause the exchange offer to be consummated not later than 365 days after May 23, 2017.restrictions.
As of September 30, 2017,March 31, 2019, we had $250.0 million in outstanding principal amount under the 2025Delek Logistics Notes.
Wells ABL
Our subsidiary, Delek Refining, Ltd., has an asset-based loan credit facility with Wells Fargo Bank, National Association, as administrative agent, and a syndicate of lenders, which was amended and restated on September 29, 2016 (the "Wells ABL") and was most recently amended on May 17, 2017 to incorporate technical modifications related to the Delek/Alon Merger. The Wells ABL consists of (i) a $450.0 million revolving loan (the "Wells Revolving Loan"), which includes a $45.0 million swing line loan sub-limit and a $200.0 million letter of credit sub-limit, (ii) a $70.0 million term loan (the "Wells Term Loan"), and (iii) an accordion feature that permits an increase in the size of the revolving credit facility to an aggregate of $725.0 million, subject to additional lender commitments and the satisfaction of certain other conditions precedent. The Wells Revolving Loan matures on September 29, 2021 and the Wells Term Loan matures on September 29, 2019. The Wells Term Loan is subject to repayment in level principal installments of approximately $5.8 million per quarter, with the final installment due on September 29, 2019. As of September 30, 2017, under the Wells ABL, we had letters of credit issued totaling approximately $96.5 million, $45.0 million in borrowings outstanding under the Wells Revolving Loan and $46.7 million outstanding under the Wells Term Loan. The obligations under the Wells ABL are secured by (i) substantially all the assets of Refining and its subsidiaries, with certain limitations, (ii) guaranties provided by the general partner of Delek Refining, Ltd., as well as by the parent of Delek Refining, Ltd., Delek Refining, Inc. (iii) a limited guarantee provided jointly and severally by Old and New Delek in an amount up to $15.0 million in the aggregate and (iv) a limited guarantee provided by Lion Oil in an amount equal to the sum of the face amount of all letters of credit issued on behalf of Lion Oil under the Wells ABL and any loans made by Refining or its subsidiaries to Lion Oil. Under the facility, revolving loans and letters of credit are provided subject to availability requirements which are determined pursuant to a borrowing base calculation as defined in the credit agreement. The borrowing base as calculated is primarily supported by cash, certain accounts receivable and certain inventory. Borrowings under the Wells Revolving Loan and Wells Term Loan bear interest based on separate predetermined pricing grids that allow us to choose between base rate loans or LIBOR loans. At September 30, 2017, the weighted average borrowing rate was approximately 5.0% under the Wells Term Loan and 4.8% under the Wells Revolving Loan. Additionally, the Wells ABL requires us to pay a quarterly unused credit commitment fee. As of September 30, 2017, this fee was approximately 0.38% per year. Unused borrowing base availability, as calculated and reported under the terms of the Wells ABL credit facility, as of September 30, 2017, was approximately $229.9 million.
Reliant Bank Revolver
We have aDelek has an unsecured revolving credit agreement with Reliant Bank which was amended on May 26, 2016 (the "Reliant Bank Revolver") and was most recently amended on May 23, 2017 to incorporate technical modifications related to the Delek/Alon Merger. The Reliant Bank Revolverthat provides for unsecured loans of up to $17.0$30.0 million. As of September 30, 2017, we had $17.0 million outstanding under this facility. The Reliant Bank Revolver matures on June 28, 2018, and2020, bears interest at a fixed rate of 5.25%4.75% per annum. The Reliant Bank Revolverannum and requires us to pay a quarterly fee of 0.50% per year on the average available revolving commitment. As of September 30, 2017,March 31, 2019, we had $30.0 million outstanding and had no unused credit commitments under the Reliant Bank Revolver.Revolver
Promissory Notes
On April 29, 2011, Delek entered into a $50.0 million promissory note (the "Ergon Note") with Ergon, Inc. ("Ergon") in connection with the closing of our acquisition of Lion Oil. The Ergon Note required Delek to make annual amortization payments of $10.0 million each, commencing April 29, 2013. The Ergon Note matured on April 29, 2017 and was paid in full. Interest under the Ergon Note was computed at a fixed rate equal to 4.0% per annum.
On May 14, 2015, in connection with the the Company’s closing of the acquisition of an equity method investment in Alon Acquisition,(the "Alon Acquisition"), the Company issued the Alona promissory note (the "Alon Israel NoteNote") in the amount of $145.0 million, which was payable to Alon Israel.Israel Oil Company, Ltd. ("Alon Israel"). The Alon Israel Note bears interest at a fixed rate of 5.5%5.50% per annum and requires five annual principal amortization payments of $25.0 million beginning in January 2016 followed by a final principal amortization payment of $20.0 million at maturity on January 4, 2021. In October 2015, we prepaid the first annual principal amortization payment in the amount of $25.0 million, along with all interest due on the prepaid amount. On December 22, 2015, Alon Israel assigned the remaining $120.0 million of principal and all accrued interest due under the Alon Israel Note to assignees under four new notes in substantially the same form and on the same terms as the Alon Israel Note (collectively, the "Alon Successor Notes"). The $120.0 million in total principal of the four Alon Successor Notes collectively require the same principal amortization payments and schedule as under the Alon Israel Note, with payments due under each Alon Successor Note commensurate to such note's pro rata share of $120.0 million in assigned principal. As of September 30, 2017,March 31, 2019, a total principal amount of $95.0$45.0 million was outstanding under the Alon Successor Notes.
At September 30, 2017, one of our retail companies had a loan that matures in 2019 with an outstanding balance of $0.2 million and the weighted average borrowing rate was approximately 9.7%.
Lion Term Loan
Our subsidiary, Lion Oil, has a term loan credit facility with Fifth Third Bank, as administrative agent, and a syndicate of lenders, which was amended and restated on May 14, 2015 in connection with the Company’s closing of the Alon Acquisition to, among other things, increase the total loan size from $99.0 million to $275.0 million (the "Lion Term Loan"), and was most recently amended on April 13, 2017 to incorporate technical modifications related to the Delek/Alon Merger. The Lion Term Loan requires Lion Oil to make quarterly principal amortization payments of approximately $6.9 million each, commencing on September 30, 2015, with a final balloon payment due at maturity on May 14, 2020. The Lion Term Loan is secured by, among other things, (i) substantially all the assets of Lion Oil and its subsidiaries (excluding inventory and accounts receivable), (ii) all shares in Lion Oil, (iii) any subordinated and common units of Delek Logistics held by Lion Oil, and (iv) the ALJ Shares. Additionally, the Lion Term Loan is guaranteed by Old and New Delek and the subsidiaries of Lion Oil. Interest on the unpaid balance of the Lion Term Loan is computed at a rate per annum equal to LIBOR or a base rate, at our election, plus the applicable margins, subject in each case to an all-in interest rate floor of 5.50% per annum. As of September 30, 2017, approximately $213.1 million was outstanding under the Lion Term Loan and the weighted average borrowing rate was 5.8%.
Alon Partnership
Revolving Credit Facility
The Alon Partnership has a $240.0 million revolving credit facility (the “Alon Partnership Credit Facility”) that will mature on May 26, 2018. The Alon Partnership Credit Facility can be used both for borrowings and the issuance of letters of credit subject to a limit of the lesser of the facility amount or the borrowing base amount under the facility. Borrowings under the Alon Partnership Credit Facility bear interest at LIBOR or base rate, at our election, plus the applicable margins.
The Alon Partnership Credit Facility is secured by a first priority lien on the Alon Partnership’s cash, accounts receivables, inventories and related assets and a second priority lien on the Alon Partnership’s fixed assets and other specified property.
At September 30, 2017, the weighted average borrowing rate was approximately 5.3%. Additionally, the Alon Partnership Credit Facility requires the payment of a quarterly fee on the average unused revolving commitment. As of September 30, 2017, this fee was 0.65% per year. As of September 30, 2017, the Alon Partnership had $100.0 million of outstanding borrowings under the credit facility, as well as letters of credit issued of $14.4 million. Unused credit commitments under the Alon Partnership Credit Facility, as of September 30, 2017, were $125.6 million.
Partnership Term Loan Credit Facility
The Alon Partnership has a $250.0 million term loan (the “Alon Partnership Term Loan”). The Alon Partnership Term Loan requires principal payments of $2.5 million per annum paid in equal quarterly installments until maturity in November 2018. The Alon Partnership Term Loan bears interest at a rate equal to the sum of (i) the Eurodollar rate (with a floor of 1.25% per annum) plus (ii) a margin of 8.0% per annum. At September 30, 2017, the weighted average borrowing rate was approximately 9.3% under the Alon Partnership Term Loan. As of September 30, 2017, the Alon Partnership Term Loan had an outstanding principal balance of $238.1 million,
The Alon Partnership Term Loan is secured by a first priority lien on all of the Alon Partnership’s fixed assets and other specified property, as well as on the general partner interest in the Alon Partnership held by the Alon General Partner, and a second priority lien on the Alon Partnership’s cash, accounts receivables, inventories and related assets.
Alon Convertible Senior Notes(share values in dollars)
In connection with the Delek/Alon Merger, Alon, New Delek and U.S. Bank National Association, as trustee (the “Trustee”) entered into a First Supplemental Indenture (the “Supplemental Indenture”), effective as of July 1, 2017, supplementing the Indenture, dated as of September 16, 2013 (the “Indenture”), pursuant to which Alon issued its 3.00% Convertible Senior Notes due 2018 (the “ Convertible Notes”) in the aggregate principal amount of $150.0 million, which were convertible into shares of Alon’s Common Stock, par value $0.01 per share or cash or a combination of cash and Alon Common Stock, at Alon's election, all as provided in the Indenture. The Supplemental Indenture provides that, as of the Effective Time, the right to convert each $1,000 principal amount of the Notes based on a number of shares of Alon Common Stock equal to the Conversion Rate (as defined in the Indenture) in effect immediately prior to the Mergers was changed into a right to convert each $1,000 principal amount of Notes into or based on a number of shares of New Delek Common Stock (at the exchange rate of 0.504), par value $0.01 per share, equal to the Conversion Rate in effect immediately prior to the Mergers. In addition, the Supplemental Indenture provides that, as of the Effective Time, New Delek fully and unconditionally guarantees, on a senior basis, Alon’s obligations under the Notes.
Interest on the Convertible Notes is payable in arrears in March and September of each year. Discount of $1.4 million was amortized to interest expense for the three months ended September 30, 2017, and the remaining discount of $5.3 million will be amortized through the September, 2018 maturity date. The Convertible Notes are not redeemable at our option prior to maturity. Under the terms of the Convertible Notes, the holders of the Convertible Notes cannot require us to repurchase all or part of the notes except for instances of a fundamental change, as defined in the indenture. The Convertible Notes do not contain any maintenance financial covenants.
The holders of the Convertible Notes may convert at any time after June 15, 2018 if our common stock is above the conversion price. The Convertible Notes may be converted into shares of New Delek Common Stock, into cash, or into a combination of cash and shares of New Delek Common Stock, at our election.
The conversion rate of the Convertible Notes is subject to adjustment upon the occurrence of certain events, including cash dividend adjustments, but will not be adjusted for any accrued and unpaid interest. As of September 30, 2017, the adjusted conversion rate was 74.3823 shares of Alon Common Stock per each $1,000 principal amount of Convertible Notes, equivalent to a per share conversion price for New Delek Common Stock of approximately $27, to reflect cash dividend adjustments and the merger stock exchange rate of 0.504 (for a post-Merger conversion ratio of 37.4887). As of September 30, 2017, there have been no conversions of the Convertible Notes.
The fair value of the conversion feature met the definition for recognition as a bifurcated equity instrument. As of September 30, 2017, the conversion feature equity instrument totaling $26.6 million is included in additional paid-in capital on the accompanying consolidated balance sheets.
Convertible Note Hedge Transactions
In connection with the Convertible Notes, we also have convertible note hedge transactions with respect to New Delek Common Stock (the “Purchased Options”) with the initial purchasers of the Convertible Notes (the “Hedge Counterparties”). The Purchased Options allow us to purchase up to approximately 5.6 million shares of New Delek Common Stock, subject to customary anti-dilution adjustments, that underlie the Convertible Notes sold in the offering. As of September 30, 2017, the Purchased Options had an adjusted strike price of approximately $27 per share of New Delek Common Stock. The Purchased Options will expire in September 2018.
The Purchased Options are intended to reduce the potential dilution with respect to our common stock upon conversion of the Convertible Notes, as well as offset any potential cash payments we are required to make in excess of the principal amount upon any conversion of the notes. The Purchased Options balance of $23.3 million has been included as a reduction of additional paid-in capital on the consolidated balance sheets.
The Purchased Options are separate transactions and are not part of the terms of the Convertible Notes and are excluded from classification as a derivative as the amount could be settled in our stock. Holders of the Convertible Notes do not have any rights with respect to the Purchased Options.
Warrant Transactions
In connection with the Convertible Notes offering, we also have warrant transactions (the “Warrants”), with the Hedge Counterparties. The Warrants allow the Hedge Counterparties to purchase up to approximately 5.6 million shares of New Delek Common Stock, subject to customary anti-dilution adjustments. As of September 30, 2017, the Warrants had an adjusted strike price of approximately $35 per share of New Delek Common Stock. The Warrants will be settled on a net-share basis and will expire in April 2019. As of September 30, 2017, Warrants totaling $14.3 million have been included in additional paid-in capital on the consolidated balance sheets.
The Warrants are separate transactions and are not part of the terms of the Convertible Notes and are excluded from classification as a derivative as the amount could be settled in our stock. Holders of the Convertible Notes do not have any rights with respect to the Warrants.
Alon Term Loan Credit Facilities
Alon Energy Term Loan
Alon has a Term Loan Agreement (“Alon Energy Term Loan”) in an original principal amount of $25.0 million, maturing in March 2019. The Alon Energy Term Loan requires monthly principal amortization payments of approximately $0.4 million each, commencing on June 1, 2014. Borrowings under this agreement incur interest at an annual rate equal to LIBOR plus a margin of 3.75%. We have pledged a portion of the Alon Partnership’s common units as collateral for the Alon Energy Term Loan. Additionally, Alon Assets, Inc. guarantees all obligations under the Alon Energy Term Loan.
At September 30, 2017, the weighted average borrowing rate was approximately 5.0% under the Alon Energy Term Loan, and this loan had an outstanding balance of approximately $7.7 million.
Alon Asphalt Term Loan
Alon has a term loan secured by a lien on certain of our asphalt terminals (“Alon Asphalt Term Loan”) in an original principal amount of $35.0 million. The Alon Asphalt Term Loan requires quarterly principal amortization payments of $3.9 million, commencing December 2018 until maturity in December 2020. The Alon Asphalt Term Loan bears interest at a rate equal to LIBOR plus a margin of 3.75% per annum. At September 30, 2017, the weighted average borrowing rate under this loan was approximately 5.0%, and the loan had an outstanding balance of $35.0 million.
Alon Energy Letter of Credit Facility
Alon has a Letter of Credit Facility (the “Alon Energy Letter of Credit Facility”) that is used for the issuance of standby letters of credit in an amount not to exceed $60.0 million. As collateral for the Alon Energy Letter of Credit Facility, we are required to pledge sufficient Alon Partnership common units with a collateral value of at least $100.0 million. Additionally, Alon Assets, Inc. (“Alon Assets”) is a guarantor under the Alon Energy Letter of Credit Facility. The Alon Energy Letter of Credit Facility matures November 2017.
At September 30, 2017, we had outstanding letters of credit under this facility of $24.8 million. Additionally, the Alon Energy Letter of Credit Facility requires the payment of a quarterly fee on the average unused commitment. As of September 30, 2017, this fee was 0.85% per year.
Retail Credit Facility
Alon Retail Credit Agreement
Alon wholly-owned subsidiaries Southwest Convenience Stores, LLC and Skinny’s LLC, (collectively, “Alon Retail”), have a credit agreement (“Alon Retail Credit Agreement”), maturing in March 2019. The Alon Retail Credit Agreement includes a term loan in an original principal amount of $110.0 million and a $10.0 million revolving credit facility. The Alon Retail Credit Agreement also includes an accordion feature that provides for incremental term loans up to $30.0 million. In August 2015, Alon borrowed $11.0 million using the accordion feature and amended the Alon Retail Credit Agreement to restore the undrawn amount of the accordion feature back to $30.0 million. The $11.0 million incremental term loan was used to fund Alon's acquisition of 14 convenience retail stores in New Mexico.
Borrowings under the Alon Retail Credit Agreement bear interest at LIBOR or base rate, at our election, plus an applicable margin, determined quarterly based upon Alon Retail’s leverage ratio. Principal payments on the term loan borrowings are made in quarterly installments based on a 15-year amortization schedule.
Obligations under the Alon Retail Credit Agreement are secured by a first priority lien on substantially all of the assets of Alon Retail.
The Alon Retail Credit Agreement requires us to pay a leverage ratio dependent quarterly fee on the average unused revolving commitment. As of September 30, 2017, this fee was 0.45% per year. As of and during the period from the Delek/Alon Merger through September 30, 2017, Alon had no outstanding borrowings under the revolving portion of the credit facility. Unused credit commitments under the revolving credit line, as of September 30, 2017, were $10.0 million.
At September 30, 2017, the weighted average borrowing rate was approximately 3.7% under the term loan, and this loan had an outstanding balance of approximately $91.0 million.
Restrictive Covenants
Under the terms of our Wells ABL, DKL Revolver, DKLRevolving Credit Facility, Term Loan Credit Facility, Delek Logistics Credit Facility, Delek Logistics Notes and Reliant Bank Revolver, Lion Term Loan, Alon Partnership Credit Facility, Alon Partnership Term Loan, Alon Energy Term Loan, Alon Asphalt Term Loan, Alon Energy Letter of Credit Facility and Alon Retail Credit Agreement, we are required to comply with certain usual and customary financial and non-financial covenants. Further, although we were not required to complyThe terms and conditions of the Revolving Credit Facility include periodic compliance with separatea springing minimum fixed charge coverage ratio financial covenantscovenant if excess availability under the Wells ABL and the Lion Term Loan during the three and nine months ended September 30, 2017, we may be required to comply with these covenants at times whenrevolver borrowing base is below certain trigger thresholds, are met, as defined in each of the Wells ABL and Lioncredit agreement. The Term Loan agreements.Credit Facility does not have any financial maintenance covenants. We believe we were in compliance with all covenant requirements under each of our credit facilities as of September 30, 2017.March 31, 2019.
Certain of our debt facilities contain limitations on the incurrence of additional indebtedness, making of investments, creation of liens, dispositions and acquisitions of property,assets, and making of restricted payments and transactions with affiliates. Specifically, these covenants may limit the payment, in the form of cash or other assets, of dividends or other distributions, or the repurchase of shares with respect to the equity of certain of our subsidiaries. Additionally, certain of our debt facilities limit our ability to make investments, including extensions of loans or advances to, or acquisitions of equity interests in, or guarantees of obligations of, any other entities.
Instruments Outstanding as of March 31, 2018
Alon Convertible Senior Notes
In connection with the Delek/Alon Merger, Alon, New Delek and U.S. Bank National Association, as trustee (the “Trustee”) entered into a First Supplemental Indenture (the “Supplemental Indenture”), effective as of July 1, 2017, which provided that Alon's 3.00% Convertible Senior Notes due September 2018, which were previously convertible into Alon Common Stock, to thereafter be convertible into New Delek Common Stock based on the exchange rate applied in the Delek/Alon Merger (as previously defined, the “Convertible Notes”). Additionally, In connection with the Convertible Notes, Alon also entered into equity instruments, including call options (as previously defined, the "Call Options") and warrants (as previously defined, the "Warrants"), designed, in combination, to hedge a portion of the risk associated with the potential exercise of the conversion feature of the Convertible Notes and to mitigate the dilutive effect of such potential conversion. The aggregate principal amount of the Convertible Notes was $150.0 million, and the effective interest rate as of March 31, 2018 was 5.92%, resulting in recognition of total interest expense during the three months then ended of approximately $2.2 million.
Notes to Condensed Consolidated Financial Statements (Unaudited)
The Convertible Notes could be converted into shares of Delek Common Stock, into cash, or into a combination of cash and shares of New Delek Common Stock, at our election. In May 2018, we made the election and notified holders of our intention to satisfy the principal amount outstanding with cash and the incremental value of the conversion options with shares at maturity. The conversion rate of the Convertible Notes was subject to adjustment upon the occurrence of certain events, including cash dividend adjustments. On September 17, 2018, Delek settled the Convertible Notes for a combination of cash and shares of New Delek Common Stock. The maturity settlement in respect of the Convertible Notes consisted of (i) cash payments totaling approximately $152.5 million which included a cash payment for outstanding principal of $150.0 million, a cash payment for accrued interest of approximately $2.2 million, a cash payment for dividends of approximately $0.3 million and a nominal cash payment in lieu of fractional shares, and (ii) the issuance of approximately 2.7 million shares of New Delek Common Stock to holders of the Convertible Notes (the “Conversion Shares”). The issuance of the Conversion Shares was made in exchange for the Convertible Notes pursuant to an exemption from the registration requirements provided by Section 3(a)(9) of the Securities Act of 1933, as amended.
Prior to the conversion, the conversion feature met the definition for recognition as a bifurcated equity instrument. At March 31, 2018, the conversion feature equity instrument totaled $26.6 million and was included in additional paid-in capital on the accompanying condensed consolidated balance sheets.
Convertible Note Hedge Transactions
In connection with the Convertible Notes offering, Alon entered into convertible note hedge transactions with respect to Alon Common Stock (as previously defined, the “Call Options”) with the initial purchasers of the Convertible Notes (the “Hedge Counterparties”). In connection with the Delek/Alon Merger, Alon, Delek and the Hedge Counterparties entered into amended and restated Call Options permitting us to purchase up to approximately 5.7 million shares of New Delek Common Stock, subject to customary anti-dilution adjustments, that underlie the Convertible Notes sold in the offering.
On September 17, 2018, we exercised the Call Options in connection with the settlement of the Convertible Notes and received approximately 2.7 million shares of our common stock from the Call Option counterparties, a cash payment for dividends of approximately $0.3 million and a nominal cash payment in lieu of fractional shares. On a net basis, the settlement of the Convertible Notes and the exercise of the Call Options resulted in no net dilution to our common stock. Prior to their exercise, the Call Options totaling $23.3 million were included as a reduction of additional paid-in capital on the condensed consolidated balance sheets.
Warrant Transactions
In connection with the Convertible Notes offering, Alon also entered into warrant transactions (as previously defined, the “Warrants”) whereby warrants to acquire Alon common stock were sold to the Hedge Counterparties. In connection with the Delek/Alon Merger, Alon, Delek and the Hedge Counterparties entered into amended and restated Warrants which allow the Hedge Counterparties to purchase up to approximately 5.7 million shares of New Delek Common Stock, subject to customary anti-dilution adjustments. In November 2018, Delek entered into Warrant Unwind Agreements (as previously defined, the "Unwind Agreements") with the holders of our outstanding common stock Warrants. Pursuant to the terms of the Unwind Agreements, we settled for cash all outstanding Warrants with the holders at various prices per Warrant as provided in the Unwind Agreements. The settlement amount was based on the volume-weighted average market price of our common stock taking into account an adjustment for the exercise price of the Warrants over a period of sixteen trading days beginning November 9, 2018 (the “Unwind Period”). Following the Unwind Period and upon the satisfaction of the payment obligation, the Warrants were canceled and the associated rights and obligations terminated. Based on the provisions of the Unwind Agreements, the amount paid to warrant holders in satisfaction of the payment obligation totaled approximately $36.0 million.
Obligations Extinguished in Connection with the March 2018 Refinancing
Prior to the Refinancing, Delek had outstanding various credit facilities/debt instruments as follows:
Wells ABL
Our subsidiary, Delek Refining, Ltd., had an asset-based loan credit facility with Wells Fargo Bank, National Association, as administrative agent, and a syndicate of lenders, which was previously amended and restated on September 29, 2016 and on May 17, 2017 (the "Wells ABL"). This facility was amended and restated on March 30, 2018 in connection with the Refinancing. The Wells ABL consisted of (i) a $450.0 million revolving loan (the "Wells Revolving Loan") and (ii) a $70 million term loan ("Wells Term Loan"). Borrowings under the Wells Revolving Loan and Wells Term Loan bore interest based on separate predetermined pricing grids that allowed us to choose between base rate loans or LIBOR rate loans. Additionally, the Wells ABL required us to pay a quarterly unused credit commitment fee.
Notes to Condensed Consolidated Financial Statements (Unaudited)
Lion Term Loan
Our subsidiary, Lion Oil, had a term loan credit facility with Fifth Third Bank, as administrative agent, and a syndicate of lenders, which, as amended and restated, had a total loan size of $275.0 million (the "Lion Term Loan"). This facility was extinguished in connection with the Refinancing on March 30, 2018. Interest on the unpaid balance of the Lion Term Loan was computed at a rate per annum equal to LIBOR or a base rate, at our election, plus the applicable margins, subject in each case to an all-in interest rate floor of 5.50% per annum.
Alon Partnership
Revolving Credit Facility
Alon USA, LP, a wholly-owned subsidiary of the Alon Partnership had a $240.0 million asset-based revolving credit facility with Israel Discount Bank of New York, as administrative agent (the “Alon Partnership Credit Facility”) that was to mature on May 26, 2018. This facility was extinguished in connection with the Refinancing on March 30, 2018. Borrowings under the Alon Partnership Credit Facility bore interest at LIBOR or base rate, at our election, plus the applicable margins.
Partnership Term Loan Credit Facility
The Alon Partnership had a $250.0 million term loan with Credit Suisse AG, as administrative agent (the “Alon Partnership Term Loan”). This term loan was extinguished in connection with the Refinancing on March 30, 2018. The Alon Partnership Term Loan bore interest at a rate per annum equal to LIBOR (subject to a floor of 1.25%) or a base rate plus the applicable margins.
Alon Term Loan Credit Facilities
Alon Energy Term Loan
On March 27, 2014, Alon issued a promissory note to Bank Hapoalim B.M. in an original principal amount of $25.0 million (“Alon Energy Term Loan”), that was to mature in March 2019, but was refinanced on December 29, 2017 with the proceeds of a new promissory note to Bank Hapoalim in an original principal amount of $38.0 million ("New Alon Energy Term Loan"), maturing on December 29, 2022. The New Alon Energy Term Loan was extinguished in connection with the Refinancing on March 30, 2018. The New Alon Energy Term Loan incurred interest at an annual rate equal to LIBOR plus an applicable margin.
Alon Asphalt Term Loan
Alon had a term loan owed to Export Development Canada secured by liens on certain of our asphalt terminals (“Alon Asphalt Term Loan”) in an original principal amount of $35.0 million. This loan was prepaid on March 29, 2018 in connection with the Refinancing on March 30, 2018. The Alon Asphalt Term Loan bore interest at a rate equal to LIBOR plus an applicable margin.
Alon Retail Credit Agreement
Alon wholly-owned subsidiaries Southwest Convenience Stores, LLC and Skinny’s LLC, (collectively, “Alon Retail”), had a credit agreement (“Alon Retail Credit Agreement”), that was to mature in March 2019, with Wells Fargo Bank, National Association, as administrative agent. This credit agreement was extinguished in connection with the Refinancing on March 30, 2018. The Alon Retail Credit Agreement included a term loan in an original principal amount of $110.0 million and a $10.0 million revolving credit facility. Borrowings under the Alon Retail Credit Agreement bore interest at LIBOR or base rate, at our election, plus an applicable margin, determined quarterly based upon Alon Retail’s leverage ratio.
Interest-Rate Derivative Instruments
Effective with the Delek/Alon Merger, we have assumed Alon's interest rate swap agreements maturingthat were to mature in March 2019, thatwhich effectively fixfixed the variable LIBOR interest component of the term loans within the Alon Retail Credit Agreement. These interest rate swap agreements were terminated in connection with the Refinancing on March 30, 2018. These interest rate swaps arewere accounted for as cash flow hedges. See Note 11 for further information regarding the interest rate swap agreements.
Note 11 - Derivative Instruments
We use the majority of our derivatives to reduce normal operating and market risks with the primary objective of reducing the impact of market price volatility on our results of operations. As such, our use of September 30, 2017,derivative contracts is aimed at:
limiting the exposure to price fluctuations of commodity inventory above or below target levels at each of our segments;
managing our exposure to commodity price risk associated with the purchase or sale of crude oil, feedstocks and finished grade fuel products at each of our segments;
managing the cost of our credits for commitments required by the U.S. Environmental Protection Agency ("EPA") to blend biofuels into fuel products ("RINs Obligation") using future commitments to purchase or sell RINs at fixed prices and quantities; and
Notes to Condensed Consolidated Financial Statements (Unaudited)
limiting the exposure to interest rate fluctuations on our floating rate borrowings.
We primarily utilize commodity swaps, futures, forward contracts and options contracts, generally with maturity dates of three years or less, and from time to time interest rate swap agreements, to achieve these objectives. Futures contracts are standardized agreements, traded on a futures exchange, to buy or sell the commodity at a predetermined price at a specified future date. Options provide the right, but not the obligation to buy or sell the commodity at a specified price in the future. Commodity swap and futures contracts require cash settlement for the commodity based on the difference between a fixed or floating price and the market price on the settlement date, and options require payment of an upfront premium. Because these derivatives are entered into to achieve objectives specifically related to our inventory and production risks, such gains and losses (to the extent not designated as accounting hedges and recognized on an unrealized basis in other comprehensive income) are recognized in cost of materials and other.
During the three months ended March 31, 2018, we utilized interest rate swap agreements to hedge floating rate debt by exchanging interest rate cash flows, based on a notional amount from a floating rate to a fixed rate. Effective with the Delek/Alon Merger, we had four interest rate swap agreements (that had maturities in March 2019) which effectively fixed the variable LIBOR interest component of the term loans within the Alon Retail Credit Agreement. The aggregate notional amount under these agreements of $69.8 million coverswere to cover approximately 77% of the outstanding principal of these term loans throughout the duration of the interest rate swaps. As of September 30, 2017, the outstanding principal of these term loans was approximately $91.0 million. See Note 16 for further information regarding theThese interest rate swap agreements.
9. Other Assets and Liabilities
The detailagreements were terminated due to the extinguishment of other current assets is as follows (in millions):
|
| | | | | | | |
| Other Current Assets | September 30,
2017 | | December 31,
2016 |
| Prepaid expenses | $ | 16.9 |
| | $ | 14.0 |
|
| Short-term derivative assets (see Note 16) | 17.6 |
| | 6.8 |
|
| Income and other tax receivables | 19.9 |
| | 19.2 |
|
| RINs Obligation surplus (see Note 15) | 7.7 |
| | 4.9 |
|
| Other | 20.3 |
| | 4.4 |
|
| Total | $ | 82.4 |
| | $ | 49.3 |
|
The detailthe Alon Retail Credit Agreement in connection with the Refinancing on March 30, 2018, resulting in a reclassification of other non-current assets is as follows (in millions):
|
| | | | | | | |
| Other Non-Current Assets | September 30,
2017 | | December 31,
2016 |
| Prepaid tax asset | $ | 57.0 |
| | $ | 59.5 |
|
| Deferred financing costs | 6.5 |
| | 8.2 |
|
| Long-term income tax receivables | 2.1 |
| | 7.5 |
|
| Supply and Offtake receivable | 46.3 |
| | — |
|
| Long-term derivative assets (see Note 15) | 0.1 |
| | — |
|
| Other | 8.8 |
| | 5.5 |
|
| Total | $ | 120.8 |
| | $ | 80.7 |
|
The detailunrealized loss of accrued expenses and other current liabilities is as follows (in millions):
|
| | | | | | | |
| Accrued Expenses and Other Current Liabilities | September 30,
2017 | | December 31,
2016 |
| Income and other taxes payable | $ | 81.5 |
| | $ | 115.7 |
|
| Short-term derivative liabilities (see Note 16) | 40.8 |
| | 26.1 |
|
| Interest payable | 14.1 |
| | 9.6 |
|
| Employee costs | 36.6 |
| | 7.3 |
|
| Environmental liabilities (see Note 17) | 7.3 |
| | 1.0 |
|
| Product financing agreements | 130.3 |
| | 6.0 |
|
| RINs Obligation deficit (see Note 15) | 39.7 |
| | 25.6 |
|
| Other | 89.4 |
| | 38.5 |
|
| Total | $ | 439.7 |
| | $ | 229.8 |
|
The detail of other non-current liabilities is as follows (in millions):
|
| | | | | | | |
| Other Non-Current Liabilities | September 30,
2017 | | December 31,
2016 |
Pension and other postemployment benefit liabilities, net
(see Note 18) | $ | 36.0 |
| | $ | — |
|
| Long-term derivative liabilities (see Note 16) | 1.5 |
| | 17.3 |
|
| Other | 0.6 |
| | 8.7 |
|
| Total | $ | 38.1 |
| | $ | 26.0 |
|
10. Stockholders' Equity
Changes to equity during the nine months ended September 30, 2017 are presented below (in millions, except per share amounts):
|
| | | | | | | | | | | | |
| | | Delek Stockholders' Equity | | Non-Controlling Interest in Subsidiaries | | Total Stockholders' Equity |
| Balance at December 31, 2016 | | $ | 991.9 |
| | $ | 190.6 |
| | $ | 1,182.5 |
|
| Net income | | 77.7 |
| | 19.8 |
| | 97.5 |
|
| Net unrealized gain on cash flow hedges, net of income tax expense of $11.2 million and ineffectiveness gain of $0.5 million | | 20.9 |
| | — |
| | 20.9 |
|
Other comprehensive income from equity method investments, net of income tax effect of $2.2 million (1) | | 4.1 |
| | — |
| | 4.1 |
|
| Other comprehensive income related to postretirement benefit plans | | 0.8 |
| | — |
| | 0.8 |
|
| Other comprehensive income related to interest rate contracts | | 0.1 |
| | — |
| | 0.1 |
|
| Common stock dividends ($0.45 per share) | | (31.3 | ) | | — |
| | (31.3 | ) |
| Issuance of equity in connection with Delek/Alon Merger | | 407.4 |
| | 123.3 |
| | 530.7 |
|
| Distributions to non-controlling interests | | — |
| | (23.8 | ) | | (23.8 | ) |
| Equity-based compensation expense | | 12.0 |
| | 0.6 |
| | 12.6 |
|
| Repurchase of common stock | | — |
| | (7.3 | ) | | (7.3 | ) |
| Taxes due to the net settlement of equity-based compensation | | (2.7 | ) | | — |
| | (2.7 | ) |
| Other | | (0.5 | ) | | — |
| | (0.5 | ) |
| Balance at September 30, 2017 | | $ | 1,480.4 |
| | $ | 303.2 |
| | $ | 1,783.6 |
|
(1) Includes reversal of $4.1$0.6 million offrom accumulated other comprehensive lossincome to interest expense on the condensed consolidated income statement during the three months ended March 31, 2018.
Forward contracts are agreements to buy or sell a commodity at a predetermined price at a specified future date, and for our transactions, generally require physical delivery. Forward contracts where the underlying commodity will be used or sold in the normal course of business qualify as normal purchases and normal sales pursuant to ASC 815 and are not accounted for as derivative instruments. Rather, such forward contracts are accounted for under other applicable GAAP. Forward contracts entered into for trading purposes that do not meet the normal purchases, normal sales exception are accounted for as derivative instruments at fair value with changes in fair value recognized in earnings in the period of change. As of and for the three months ended March 31, 2019 and the year ended December 31, 2018, all of our forward contracts that were accounted for as derivative instruments consisted of contracts related to our Canadian crude trading operations. Since Canadian crude trading activity is not related to managing supply or pricing risk of inventory that will be used in production, such unrealized and realized gains and losses are recognized in other operating (income) expense, net rather than cost of materials and other on the pre-Merger equity methodaccompanying condensed consolidated income statement.
Futures, swaps or other commodity related derivative instruments that are utilized to specifically provide economic hedges on our Canadian forward contract or investment positions are recognized in Alon.other operating (income) expense, net because that is where the related underlying transactions are reflected.
From time to time, we also enter into future commitments to purchase or sell RINs at fixed prices and quantities, which are used to manage the costs associated with our RINs Obligation. These future RIN commitment contracts meet the definition of derivative instruments under ASC 815, and are recorded at estimated fair value in accordance with the provisions of ASC 815. Changes in the fair value of these future RIN commitment contracts are recorded in cost of materials and other on the condensed consolidated statements of income.
DividendsAt this time, we do not believe there is any material credit risk with respect to the counterparties to any of our derivative contracts.
DuringIn accordance with ASC 815, certain of our commodity swap contracts and our interest rate agreements have been designated as cash flow hedges and the nine months ended September 30, 2017, our Boardchange in fair value between the execution date and the end of Directors declaredperiod (or early termination date in regards to the following dividends:four Alon retail interest rate swaps discussed above) has been recorded in other comprehensive income. The fair value of these contracts is recognized in income at the time the positions are closed and the hedged transactions are recognized in income.
|
| | | | | | |
Date Declared27 | | | Dividend Amount Per Share | | Record Date | | Payment Date |
February 27, 2017 | | $0.15 | | March 15, 2017 | | March 29, 2017 |
May 8, 2017 | | $0.15 | | May 23, 2017 | | June 2, 2017 |
August 1, 2017 | | $0.15 | | August 23, 2017 | | September 13, 2017 |
Notes to Condensed Consolidated Financial Statements (Unaudited)
Stock Repurchase Program
InThe following table presents the fair value of our derivative instruments as of March 31, 2019 and December 2016, our Board of Directors authorized a share repurchase program for up to $150.0 million of Delek common stock. Any share repurchases under the repurchase program may be implemented through open market transactions or in privately negotiated transactions, in accordance with applicable securities laws.31, 2018. The timing, price, and size of repurchases will be made at the discretion of management and will depend on prevailing market prices, general economic and market conditions and other considerations. The repurchase program does not obligate us to acquire any particular amount of stock and does not expire. There were no shares repurchased during the three and nine months ended September 30, 2017.
11. Income Taxes
Under ASC 740, Income Taxes (“ASC 740”), companiesfair value amounts below are required to apply an estimated annual tax rate to interim period resultspresented on a year-to-date basis; however,gross basis and do not reflect the estimated annual tax rate should not be appliednetting of asset and liability positions permitted under our master netting arrangements, including cash collateral on deposit with our counterparties. We have elected to interim financial results if a reliable estimate cannot be made. In this situation,offset the interim tax rate should be based on actual year-to-date results. Based on our current projections, which have fluctuated as a result of changes in crude oil prices andrecognized fair value amounts for multiple derivative instruments executed with the related crack spreads, we believe that using actual year-to-date results to compute
our effective tax rate will produce a more reliable estimate of our tax expense or benefit. As such, we recorded a tax provision for the three and nine months ended September 30, 2017 and 2016 based on actual year-to-date results, in accordance with ASC 740.
Our effective tax rate was 53.0% and 52.3% for the three and nine months ended September 30, 2017, respectively, compared to 38.7% and 42.2% for the three and nine months ended September 30, 2016, respectively. The changesame counterparty in our effective tax rate in the three and nine months ended September 30, 2017 was primarily due to the reversal of the deferred tax asset for the equity method investment in Alon.
12. Equity-Based Compensation
Delek US Holdings, Inc. 2006 and 2016 Long-Term Incentive Plans
Compensation expense for the 2006 and 2016 Long-Term Incentive Plans' equity-based awards amounted to $3.5 million ($2.3 million, net of taxes) and $10.5 million ($6.8 million, net of taxes) for the three and nine months ended September 30, 2017, respectively, and $3.8 million ($2.5 million, net of taxes) and $11.2 million ($7.3 million, net of taxes) for the three and nine months ended September 30, 2016, respectively. These amounts, excluding amounts related to discontinued operations of $0.4 million and $1.2 million for the three and nine months ended September 30, 2016, are included in general and administrative expenses in the accompanying condensed consolidated statements of income.
As of September 30, 2017, there was $23.8 million of total unrecognized compensation cost related to non-vested share-based compensation arrangements, which is expected to be recognized over a weighted-average period of 1.8 years.
We issued 57,149 and 257,602 shares of common stock as a result of exercised stock options, stock appreciation rights, and vested restricted stock units during the three and nine months ended September 30, 2017, respectively, and 49,718 and 122,350 shares during the three and nine months ended September 30, 2016, respectively. These amounts do not include shares withheld to satisfy employee tax obligations related to the exercises and vestings. Such withheld shares totaled 48,286 and 200,026 shares during the three and nine months ended September 30, 2017, respectively, and 29,621 and 57,200 shares during the three and nine months ended September 30, 2016, respectively.
Alon USA Energy, Inc. 2005 Long-Term Incentive Plan
In connection with the Delek/Alon Merger, Delek assumed the Alon USA Energy, Inc. Second Amended and Restated 2005 Incentive Compensation Plan (“the Alon Incentive Plan”) as a component of its overall executive incentive compensation program. The Alon Incentive Plan permits the granting of awards to Alon's officers and key employees in the form of options to purchase common stock, stock appreciation rights, restricted shares of common stock, restricted common stock units, performance shares, performance units and senior executive plan bonuses. Effective with the Delek/Alon Merger, all contractually unvested share-based awards were converted into share-based awards denominated in New Delek Common Stock. Committed but unissued share-based awards were exchanged and converted into rights to receive share-based awards indexed to New Delek Common Stock.
Compensation expense for the Alon Incentive Plan equity-based awards amounted to $0.6 million ($0.4 million, net of taxes) for the three months ended September 30, 2017. These amounts are included in general and administrative expenses in the accompanying condensed consolidated statements of income.
As of September 30, 2017, there was $10.0 million of total unrecognized compensation cost related to non-vested share-based compensation arrangements, which is expected to be recognized over a weighted-average period of 3.9 years.
Delek Logistics GP, LLC 2012 Long-Term Incentive Plan
Compensation expense for Delek Logistics GP equity-based awards was $0.4 million ($0.3 million, net of taxes) and $1.3 million ($0.8 million, net of taxes) for the three and nine months ended September 30, 2017, respectively, and $0.4 million ($0.3 million, net of taxes) and $1.3 million ($0.8 million, net of taxes) for the three and nine months ended September 30, 2016, respectively. These amounts are included in general and administrative expenses in the accompanying condensed consolidated statements of income.
As of September 30, 2017, there was $0.7 million of total unrecognized compensation cost related to non-vested share-based compensation arrangements, which is expected to be recognized over a weighted-average period of 1.2 years.
Alon USA Partners, LP 2012 Long-Term Incentive Plan
Non-employee directors of the Alon Partnership, who are designated by Alon’s directors, are awarded an annual grant of $25,000 in restricted common units, which vest over a period of three years, assuming continued service at vesting.
Compensation expense for the Alon Partnership restricted units amounted to a nominal amount for the three months ended September 30, 2017. These amounts are included in general and administrative expenses in the accompanying condensed consolidated statements of income.
As of September 30, 2017, there was $0.1 million of total unrecognized compensation cost related to non-vested share-based compensation arrangements, which is expected to be recognized over a weighted-average period of 1.3 years.
13. Earnings (Loss) Per Share
Basic and diluted earnings per share are computed by dividing net income (loss) by the weighted average common shares outstanding. The common shares used to compute Delek’s basic and diluted earnings (loss) per share are as follows:
|
| | | | | | | | | | | | |
| | | Three Months Ended | | Nine Months Ended |
| | | September 30, | | September 30, |
| | | 2017 |
| 2016 | | 2017 | | 2016 |
| Weighted average common shares outstanding | | 80,581,762 |
| | 61,834,968 |
| | 68,272,918 |
| | 61,931,040 |
|
| Dilutive effect of equity instruments | | 663,643 |
| | — |
| | 703,056 |
| | — |
|
| Weighted average common shares outstanding, assuming dilution | | 81,245,405 |
| | 61,834,968 |
| | 68,975,974 |
| | 61,931,040 |
|
Outstanding common share equivalents totaling 3,996,185 and 4,006,310 were excluded from the diluted earnings per share calculation for the three and nine months ended September 30, 2017, respectively, and 2,984,667 and 2,953,971 for the three and nine months ended September 30, 2016, respectively, as these common share equivalents did not have a dilutive effect under the treasury stock method. These amounts include outstanding common share equivalents totaling 324,574 and 241,958 for the three and nine months ended September 30, 2016 that were excluded from the diluted earnings per share calculation due to the net loss.
14. Segment Data
Prior to August 2016, we aggregated our operating units into three reportable segments: refining, logistics and retail. However, in August 2016, Delek entered into a Purchase Agreement to sell the Retail Entities, which consisted of all of the retail segment at that time and a portion of the corporate, other and eliminations segment, to COPEC.financial statements. As a result, of the Purchase Agreement, we met the requirements of ASC 205-20asset and ASC 360 to report the results of the Retail Entities as discontinued operations and to classify the Retail Entities as a group of assets held for sale. The Retail Entities were sold in November 2016. The operating results for the Retail Entities, in all periods up until and including the date of the sale, were reclassified to discontinued operations and are no longer reported as part of Delek's retail segment.
Effective with the Delek/Alon Merger July 1, 2017 (see Note 2), Delek's retail segment now includes the operations of Alon's approximately 300 owned and leased convenience store sites located primarily in Central and West Texas and New Mexico. These convenience stores typically offer various grades of gasoline and diesel under the Alon brand name and food products, food service, tobacco products, non-alcoholic and alcoholic beverages, general merchandise as well as money orders to the public, primarily under the 7-Eleven and Alon brand names. Substantially all of the motor fuel sold through our retail segment is supplied by our Big Spring refinery (which is owned by the Alon Partnership), which is transferred to the retail segment at prices substantially determined by reference to published commodity pricing information.
Our corporate activities, results of certain immaterial operating segments, including Alon's asphalt terminal operations effective with the Delek/Alon Merger, our equity method investment in Alon prior to the Delek/Alon Merger, as well as any discontinued operations, and intercompany eliminations are reported in the corporate, other and eliminations segment. Decisions concerning the allocation of resources and assessment of operating performance are made based on this segmentation. Management measures the operating performance of each of the reportable segments based on the segment contribution margin. Segment contribution margin is defined as net sales less cost of sales and operating expenses, excluding depreciation and amortization. Operations which are not specifically included in the reportable segments are included in the corporate and other category, which primarily consists of operating expenses, depreciation and amortization expense and interest income and expense associated with our discontinued operations and with our corporate headquarters.
The refining segment processes crude oil and other purchased feedstocks for the manufacture of transportation motor fuels, including various grades of gasoline, diesel fuel, aviation fuel, asphalt and other petroleum-based products that are distributed through owned and third-party product terminals. Prior to the Delek/Alon Merger, the refining segment had a combined nameplate capacity of 155,000 bpd, including the 75,000 bpd Tyler refinery and the 80,000 bpd El Dorado refinery. The refining segment also owns and operates two biodiesel facilities involved in the production of biodiesel fuels and related activities. Effective with the Delek/Alon Merger, our refining segment now also includes the operations of a sour crude oil refinery located in Big Spring, Texas with a nameplate capacity of 73,000 bpd, a light sweet crude oil refinery located in Krotz Springs, Louisiana with a nameplate capacity of 74,000 bpd, and a heavy crude oil refinery located in Bakersfield, California. The Bakersfield, California refinery has not processed crude oil since 2012 due to the high cost of crude oil relative to product yield and low asphalt demand. Alon's petroleum-based products are marketed primarily in the South Central, Southwestern and Western regions of the United States and also ships and sells gasoline into wholesale markets in the Southern and Eastern United States. Motor fuels are sold under the Alon
brand through various terminals to supply Alon branded retail sites, including our retail segment convenience stores. In addition, Alon sells motor fuels through its wholesale distribution network on an unbranded basis.
Our refining segment has a services agreement with our logistics segment, which, among other things, requires the refining segment to pay service fees based on the number of gallons sold at the Tyler refinery and a sharing of a portion of the margin achieved in return for providing marketing, sales and customer services. This intercompany transaction fee was $5.2 million and $14.8 million during the three and nine months ended September 30, 2017, respectively, and $4.1 million and $12.2 million during the three and nine months ended September 30, 2016, respectively. Additionally, the refining segment pays crude transportation, terminalling and storage fees to the logistics segment for the utilization of pipeline, terminal and storage assets. These fees were $33.3 million and $97.5 million during the three and nine months ended September 30, 2017, respectively, and $30.4 million and $92.1 million during the three and nine months ended September 30, 2016, respectively. The logistics segment also sold $1.4 million and $3.9 million of Renewable Identification Numbers ("RINs") to the refining segment during the three and nine months ended September 30, 2017, respectively, and $1.8 million and $4.7 million during the three and nine months ended September 30, 2016, respectively. The refining segment recorded sales and fee revenuesliability amounts below differ from the logistics segmentamounts presented in our condensed consolidated balance sheets. See Note 12 for further information regarding the fair value of $10.0 million and $27.1 million during the three and nine months ended September 30, 2017, and recorded sales and fee revenues from the logistics segment and the Retail Entities, the operations of which are included in discontinued operations, in the amount of $78.1 million and $266.6 million during the three and nine months ended September 30, 2016. Refined products purchased from Alon by the logistics segment subsequent to the Delek/Alon Merger totaled $0.8 million during the three months ended September 30, 2017. Also subsequent to the Delek/Alon Merger, the logistics segment sold refined products of $0.2 million during the three months ended September 30, 2017 to Alon. Intercompany fees and sales for the refining segment include the revenues from the sale of products to the retail segment of $90.6 million and sales of asphalt to Delek's other category of $7.7 million during the three months ended September 30, 2017. All inter-segment transactions have been eliminated in consolidation.
Our logistics segment owns and operates crude oil and refined products logistics and marketing assets. The logistics segment generates revenue and contribution margin by charging fees for gathering, transporting and storing crude oil and for marketing, distributing, transporting and storing intermediate and refined products.
Delek's other category in the following tables, subsequent to the Delek/Alon Merger, includes the operations of the Paramount, California and Long Beach, California heavy crude oil refineries, which have not processed crude oil since 2012, and a majority ownership interest in a renewable fuels facility in California, which has a throughput capacity of 3,000 bpd and converts tallow and vegetable oils into renewable fuels. The produced renewable fuels are drop-in replacements for petroleum-based fuels. The renewable fuels facility generates both state and federal environmental credits as well as the federal blender’s tax credit, when effective. The renewable fuels facility is inside the Paramount refinery and utilizes the refinery’s infrastructure, including electrical and other utility systems, tanks, and product blending and loading facilities. As a result of Delek management's committing to a plan to sell 100% of its equity interests in the California Discontinued Entities, we met the requirements under ASC 205-20 and ASC 360 to report the results of those operations as discontinued operations and to classify the applicable assets as a group of assets held for sale.
The following is a summary of business segment operating performance as measured by contribution margin for the period indicatedderivative instruments (in millions):
|
| | | | | | | | | | | | | | | | | | | | |
| | | Three Months Ended September 30, 2017 |
| (In millions) | | Refining | | Logistics | | Retail | | Corporate,
Other and Eliminations | | Consolidated |
| Net sales (excluding intercompany fees and sales) | | $ | 2,005.5 |
| | $ | 90.6 |
| | $ | 213.9 |
| | $ | (59.1 | ) | | $ | 2,250.9 |
|
Intercompany fees and sales | | 108.3 |
| | 40.1 |
| | — |
| | (57.8 | ) | | 90.6 |
|
| Operating costs and expenses: | | | | | | | | | | |
| Cost of goods sold | | 1,823.2 |
| | 89.1 |
| | 174.6 |
| | (98.8 | ) | | 1,988.1 |
|
| Operating expenses | | 110.5 |
| | 10.7 |
| | 25.8 |
| | 6.2 |
| | 153.2 |
|
| Segment contribution margin | | $ | 180.1 |
| | $ | 30.9 |
| | $ | 13.5 |
| | $ | (24.3 | ) | | 200.2 |
|
| General and administrative expenses | | | | | | | | | | 61.8 |
|
| Depreciation and amortization | | | | | | | | | | 46.9 |
|
| Other operating expense, net | | | | | | | | | | 0.7 |
|
| Operating income | | | | | | | | | | $ | 90.8 |
|
Total assets (2) | | $ | 4,269.0 |
| | $ | 422.9 |
| | $ | 371.8 |
| | $ | 505.4 |
| | $ | 5,569.1 |
|
Capital spending (excluding business combinations) (3) | | $ | 47.6 |
| | $ | 3.8 |
| | $ | 10.6 |
| | $ | 6.5 |
| | $ | 68.5 |
|
|
| | | | | | | | | | | | | | | | | | | | |
| | | Nine Months Ended September 30, 2017 |
| | | Refining | | Logistics | | Retail | | Corporate,
Other and Eliminations | | Consolidated |
| Net sales (excluding intercompany fees and sales) | | $ | 4,240.9 |
| | $ | 270.5 |
| | $ | 213.9 |
| | $ | (61.6 | ) | | $ | 4,663.7 |
|
| Intercompany fees and sales | | 125.4 |
| | 116.4 |
| | — |
| | (151.2 | ) | | 90.6 |
|
| Operating costs and expenses: | | | | | | | | | | |
| Cost of goods sold | | 3,888.5 |
| | 266.7 |
| | 174.6 |
| | (148.2 | ) | | 4,181.6 |
|
| Operating expenses | | 212.9 |
| | 31.0 |
| | 25.8 |
| | 6.8 |
| | 276.5 |
|
| Segment contribution margin | | $ | 264.9 |
| | $ | 89.2 |
| | $ | 13.5 |
| | $ | (71.4 | ) | | 296.2 |
|
| General and administrative expenses | | | | | | | | | | 115.8 |
|
| Depreciation and amortization | | | | | | | | | | 105.4 |
|
| Other operating expense, net | | | | | | | | | | 1.0 |
|
| Operating income | | | | | | | | | | $ | 74.0 |
|
Capital spending (excluding business combinations) (3) | | $ | 69.6 |
| | $ | 8.7 |
| | $ | 10.6 |
| | $ | 9.8 |
| | $ | 98.7 |
|
|
| | | | | | | | | | | | | | | | | | | | |
| | | Three Months Ended September 30, 2016 |
| | | Refining | | Logistics | | Retail | | Corporate,
Other and Eliminations | | Consolidated |
| Net sales (excluding intercompany fees and sales) | | $ | 935.1 |
| | $ | 71.2 |
| | $ | — |
| | $ | — |
| | $ | 1,006.3 |
|
Intercompany fees and sales(1) | | 78.1 |
| | 36.3 |
| | — |
| | (40.8 | ) | | 73.6 |
|
| Operating costs and expenses: | | | | | | | | | | |
| Cost of goods sold | | 923.7 |
| | 73.5 |
| | — |
| | (31.6 | ) | | 965.6 |
|
| Operating expenses | | 51.7 |
| | 9.2 |
| | — |
| | 0.1 |
| | 61.0 |
|
| Segment contribution margin | | $ | 37.8 |
| | $ | 24.8 |
| | $ | — |
| | $ | (9.3 | ) | | 53.3 |
|
| General and administrative expenses | | | | | | | | | | 24.9 |
|
| Depreciation and amortization | | | | | | | | | | 29.0 |
|
| Other operating expense | | | | | | | | | | 2.2 |
|
| Operating loss | | | | | | | | | | $ | (2.8 | ) |
Total assets(2) | | $ | 1,854.3 |
| | $ | 393.2 |
| | $ | — |
| | $ | 772.0 |
| | $ | 3,019.5 |
|
Capital spending (excluding business combinations)(3) | | $ | 7.5 |
| | $ | 3.2 |
| | $ | — |
| | $ | 0.1 |
| | $ | 10.8 |
|
|
| | | | | | | | | | | | | | | | | | | | |
| | | Nine Months Ended September 30, 2016 |
| | | Refining | | Logistics | | Retail | | Corporate,
Other and Eliminations | | Consolidated |
| Net sales (excluding intercompany fees and sales) | | $ | 2,651.6 |
| | $ | 214.4 |
| | $ | — |
| | $ | 0.5 |
| | $ | 2,866.5 |
|
Intercompany fees and sales(1) | | 266.6 |
| | 109.0 |
| | — |
| | (128.8 | ) | | 246.8 |
|
| Operating costs and expenses: | | | | | | | | | | |
| Cost of goods sold | | 2,675.1 |
| | 213.4 |
| | — |
| | (81.8 | ) | | 2,806.7 |
|
| Operating expenses | | 159.6 |
| | 28.4 |
| | — |
| | (0.2 | ) | | 187.8 |
|
| Insurance proceeds - business interruption | | (42.4 | ) | | — |
| | | | — |
| | (42.4 | ) |
| Segment contribution margin | | $ | 125.9 |
| | $ | 81.6 |
| | $ | — |
| | $ | (46.3 | ) | | 161.2 |
|
| General and administrative expenses | | | | | | | | | | 77.5 |
|
| Depreciation and amortization | | | | | | | | | | 86.6 |
|
| Other operating expense | | | | | | | | | | 2.2 |
|
| Operating loss | | | | | | | | | | $ | (5.1 | ) |
Capital spending (excluding business combinations)(3) | | $ | 14.4 |
| | $ | 5.1 |
| | $ | — |
| | $ | 4.7 |
| | $ | 24.2 |
|
|
| | | | | | | | | | | | | | | | | |
| | | | March 31, 2019 | | December 31, 2018 |
| Derivative Type | Balance Sheet Location | | Assets | | Liabilities | | Assets | | Liabilities |
| Derivatives not designated as hedging instruments: | | | | | | | | |
Commodity derivatives(1) | Other current assets | | $ | 100.7 |
| | $ | (101.9 | ) | | $ | 158.3 |
| | $ | (142.4 | ) |
Commodity derivatives(1) | Other current liabilities | | 7.4 |
| | (12.5 | ) | | — |
| | (8.4 | ) |
Commodity derivatives(1) | Other long-term assets | | 0.6 |
| | (0.4 | ) | | 2.1 |
| | (2.4 | ) |
Commodity derivatives(1) | Other long-term liabilities | | 25.3 |
| | (30.3 | ) | | 93.0 |
| | (94.0 | ) |
RIN commitment contracts(2) | Other current assets | | 4.0 |
| | — |
| | 2.0 |
| | — |
|
RIN commitment contracts(2) | Other current liabilities | | — |
| | (6.4 | ) | | — |
| | (6.7 | ) |
| | | | | | | | | | |
| Derivatives designated as hedging instruments: | | | | | | | | |
Commodity derivatives (1) | Other current assets | | 76.4 |
| | (27.2 | ) | | 200.3 |
| | (157.0 | ) |
Commodity derivatives (1) | Other current liabilities | | 0.5 |
| | (0.3 | ) | | — |
| | — |
|
Commodity derivatives (1) | Other long-term assets | | 2.5 |
| | (1.8 | ) | | 6.1 |
| | (4.8 | ) |
| Total gross fair value of derivatives | | $ | 217.4 |
| | $ | (180.8 | ) | | $ | 461.8 |
| | $ | (415.7 | ) |
Less: Counterparty netting and cash collateral(3) | | 183.0 |
| | (161.6 | ) | | 399.9 |
| | (399.5 | ) |
| Total net fair value of derivatives | | $ | 34.4 |
| | $ | (19.2 | ) | | $ | 61.9 |
| | $ | (16.2 | ) |
| |
(1) | Intercompany feesAs of March 31, 2019 and sales for the refining segment include revenues from the Retail EntitiesDecember 31, 2018, we had open derivative positions representing 67,840,734 and 39,277,822 barrels, respectively, of $73.6 millioncrude oil and $246.8 million during the threerefined petroleum products. Of these open positions, contracts representing 9,093,000 and nine months ended September 30, 2016, respectively, the operations of which are reported in discontinued operations.
|
| |
(2)
| Assets held for sale of $167.2 million and $471.5 million are included in the corporate, other and eliminations segment16,461,000 barrels were designated as cash flow hedging instruments as of September 30, 2017March 31, 2019 and September 30, 2016,December 31, 2018, respectively. |
| |
(2) | As of March 31, 2019 and December 31, 2018, we had open RIN commitment contracts representing 256,025,000 and 137,750,000 RINs, respectively. |
| |
(3) | Capital spending excludes capital spending associatedAs of March 31, 2019 and December 31, 2018, $21.4 million and $0.4 million, respectively, of cash obligation held by counterparties has been netted with the California Discontinued Entitiesderivatives with each counterparty.
|
Total gains (losses) on our hedging derivatives and RIN commitment contracts recorded in cost of materials and other on the condensed consolidated statements of income are as follows (in millions):
|
| | | | | | | | |
| | | Three Months Ended March 31, |
| | | 2019 | | 2018 |
Gains (losses) on commodity derivatives not designated as hedging instruments recognized in cost of materials and other (1) | | $ | 38.9 |
| | $ | (9.3 | ) |
Losses on commodity derivatives not designated as hedging instruments recognized in other operating income (expense), net (1) (2) | | (2.3 | ) | | — |
|
| Realized losses reclassified out of OCI on commodity derivatives designated as cash flow hedging instruments | | (19.1 | ) | | — |
|
| Total gains (losses) | | $ | 17.5 |
| | $ | (9.3 | ) |
| |
(1) | Gains (losses) on commodity derivatives that are economic hedges but not designated as hedging instruments include unrealized gains (losses) of $0.4$(27.1) million and the asset acquisition of pipeline assets totaling $12.1$(14.8) million for the three and nine months ended September 30, 2017. Capital spending excludes capital spending associated with the Retail Entities of $6.0March 31, 2019 and 2018, respectively. Of these amounts, approximately $(5.6) million and $12.2$(2.4) million duringfor the three and nine months ended September 30, 2016, respectively.March 31, 2019 and 2018, respectively, represent unrealized gains (losses) where the instrument has matured but where it has not cash settled as of period end, excluding the reversal of prior period settlement timing differences. Derivative instruments that have matured but not cash settled at the balance sheet date continue to be reflected in derivative assets or liabilities on our balance sheet. |
| |
(2) | See separate table below for disclosures about "trading derivatives." |
Property, plant and equipment and accumulated depreciation
Notes to Condensed Consolidated Financial Statements (Unaudited)
The effect of cash flow hedge accounting on the consolidated statement of income is as of September 30, 2017 and depreciation expense by reporting segmentfollows (in millions) for the three and nine months ended September 30, 2017March 31, 2019:
|
| | | | |
| Gain (loss) on cash flow hedging relationships recognized in cost of materials and other: | | |
| Commodity contracts: | | |
| Hedged items | | $ | 19.1 |
|
| Derivative designated as hedging instruments | | (19.1 | ) |
| Total | | $ | — |
|
For cash flow hedges, no component of the derivative instruments’ gains or losses was excluded from the assessment of hedge effectiveness for the three months ended March 31, 2019 or 2018. As of March 31, 2019 and December 31, 2018, cumulative gains of $45.7 million and $35.4 million related to Midland to Cushing crude price differentials at our refineries, respectively, on cash flow hedges, net of tax, remained in accumulated other comprehensive income. We estimate that $57.4 million of deferred gains related to commodity cash flow hedges will be reclassified into cost of materials and other over the next 12 months as a result of hedged transactions that are forecasted to occur.
Total gains on our trading forward contract derivatives (none of which were designated as hedging instruments) recorded in other operating income (expense), net on the condensed consolidated statements of income are as follows (in millions):
|
| | | | | | | | | | | | | | | | | | | | |
| | | Refining | | Logistics | | Retail | | Corporate,
Other and Eliminations | | Consolidated |
| Property, plant and equipment | | $ | 2,079.9 |
| | $ | 357.5 |
| | $ | 155.2 |
| | $ | 140.3 |
| | $ | 2,732.9 |
|
| Less: Accumulated depreciation | | (437.8 | ) | | (106.9 | ) | | (3.4 | ) | | (37.1 | ) | | (585.2 | ) |
| Property, plant and equipment, net | | $ | 1,642.1 |
| | $ | 250.6 |
| | $ | 151.8 |
| | $ | 103.2 |
| | $ | 2,147.7 |
|
| Depreciation expense for the three months ended September 30, 2017 | | $ | 31.6 |
| | $ | 5.2 |
| | $ | 3.3 |
| | $ | 4.5 |
| | $ | 44.6 |
|
| Depreciation expense for the nine months ended September 30, 2017 | | $ | 75.1 |
| | $ | 15.6 |
| | $ | 3.3 |
| | $ | 8.4 |
| | $ | 102.4 |
|
|
| | | | |
| | | Three Months Ended March 31, |
| | | 2019 |
| Realized gains | | $ | 3.9 |
|
| Unrealized gains | | 2.1 |
|
| Total | | $ | 6.0 |
|
In accordance with ASC 360, Delek evaluates the realizability of property, plant and equipment as events occur that might indicate potential impairment. There were no indicators of impairment of our property, plant and equipment as of September 30, 2017.
15.
Note 12 - Fair Value Measurements
The fair values of financial instruments are estimated based upon current market conditions and quoted market prices for the same or similar instruments. Management estimates that the carrying value approximates fair value for all of Delek’s assets and liabilities that fall under the scope of ASC 825, Financial Instruments ("ASC 825").
Delek applies the provisions of ASC 820, Fair Value Measurements ("ASC 820"), which defines fair value, establishes a framework for its measurement and expands disclosures about fair value measurements. ASC 820 applies to our commodity and interest rate derivatives that are measured at fair value on a recurring basis. The standard also requires that we assess the impact of nonperformance risk on our derivatives. Nonperformance risk is not considered material to our financial statements at this time.
ASC 820 requires disclosures that categorize assets and liabilities measured at fair value into one of three different levels depending on the observability of the inputs employed in the measurement. Level 1 inputs are quoted prices in active markets for identical assets or liabilities. Level 2 inputs are observable inputs other than quoted prices included within Level 1 for the asset or liability, either directly or indirectly through market-corroborated inputs. Level 3 inputs are unobservable inputs for the asset or liability reflecting our assumptions about pricing by market participants.
Over the counter ("OTC") commodityCommodity swaps, exchange-traded futures, options, physical commodity forward purchase and sale contracts (that do qualify as normal purchases or normal sales), and interest rate swaps and caps are generally valued using industry-standard models that consider various assumptions, including quoted forward prices, spot prices, interest rates, time value, volatility factors and contractual prices for the underlying instruments, as well as other relevant economic measures. The degree to which these inputs are observable in the forward markets determines the classification as Level 2 or 3. Our contracts are valued based on exchange pricing and/or price index developers such as Platts or Argus and are, therefore, classified as Level 2. Commodity investments are valued using published market prices of the commodity on the applicable exchange and are, therefore, classified as Level 1.
The U.S. Environmental Protection Agency ("EPA") requires certain refiners to blend biofuels into the fuel products they produce pursuant to the EPA’s Renewable Fuel Standard - 2. Alternatively, credits called RINs, which may be generated and/or purchased, can be used to satisfy this obligation instead of physically blending biofuels ("RINs Obligation"). Our RINs Obligation surplus or deficit is based on the amount of RINs we must purchase, net of amounts internally generated and purchased and the price of those RINs as of the balance sheet date. The RINs Obligation surplus or deficit is categorized as Level 2, and is measured at fair value based on quoted prices from an independent pricing service.
OnIn March 1, 2017,2018, the El Dorado refinery received approval from the EPA for a small refinery exemption from the requirements of the renewable fuel standard for the 20162017 calendar year. This waiveryear, which resulted in a reduction of our RINs Obligation and related cost of goods soldmaterials and other of approximately $47.5$59.3 million for the ninethree months ended September 30, 2017.March 31, 2018. In March 2018, the Krotz Springs refinery received such approval for 2017 as well, which resulted in a reduction of our RINs Obligation and related cost of materials and other of approximately $31.6 million for the three months ended March 31, 2018.
From time
Notes to time, Delek enters intoCondensed Consolidated Financial Statements (Unaudited)
Our RIN commitment contracts are future commitments to purchase or sell RINs at fixed prices and quantities, which are used to manage the costs associated with our RINs Obligation. These future RIN commitment contracts meet the definition of derivative instruments under ASC 815, Derivatives and Hedging ("ASC 815"). They are categorized as Level 2, and are measured at fair value based on quoted prices from an independent pricing service. Changes in the fair value of these future RIN commitment contracts are recorded in cost of goods soldmaterials and other on the condensed consolidated statements of income.
We haveThe fair values of financial instruments are estimated based upon current market conditions and quoted market prices for the same or similar instruments. Management estimates that the carrying value approximates fair value for all of Delek's assets and liabilities that fall under the scope of ASC 825. As of and for the three months ended March 31, 2019 and 2018, we elected to account for our J. Aron step-out liability at fair value in accordance with ASC 825, as it pertains to the fair value option. This standard permits the election to carry financial instruments and certain other items similar to financial instruments at fair value on the balance sheet, with all changes in fair value reported in earnings. By electing the fair value option, we can achieve an accounting result similar to a fair value hedge without having to follow the complex hedge accounting rules. Our J. Aron step-out liability iswas categorized as Level 2, and is measured at fair value using market prices for the consigned crude oil and refined products we arewere required to repurchase from J. Aron at the end of the term of the Supply and Offtake Agreement.Agreement prior to the December 2018/January 2019 amendments to each of the Supply and Offtake Agreements. The J. Aron step-out liability iswas presented in the Obligation under Supply and Offtake Agreement line item of the our condensed consolidated balance sheet as of September 30, 2017. The December 31, 2016 balance in Obligation under Supply and Offtake Agreement includes the J. Aron step-out liability, net of a $20.2 million holdback deposit, which is not eligible for the fair value option. Such deposit was classified as current and presented as an offset to the current liability because the contract had not been renewed as of that date.sheets. Gains (losses) related to the change in fair value werewas recorded as a component of cost of goods soldmaterials and other in the condensed consolidated statements of income. With respect to the amended Supply and Offtake Agreements, December 2018 for our Big Spring Agreement and January 2019 for our El Dorado and Krotz Springs Agreements, we apply fair value measurement as follows: (1) we determine fair value for our amended fixed-price step-out liability based on changes in fair value related to interest rate risk where such obligation is categorized as Level 2 and is presented in the long-term portion of the Obligation under Supply and Offtake Agreements on our condensed consolidated balance sheets, and where gains (losses) related to changes in fair value are recorded as a component of interest expense in the condensed consolidated statements of income; and (2) we determine fair value of the short-term commodity-indexed financing facility based on the market prices for the consigned crude oil and refined products collateralizing the financing/funding where such obligation is categorized as Level 2 and is presented in the current portion of the Obligation under Supply and Offtake Agreements on our condensed consolidated balance sheets, and where gains (losses) related to the change in fair value are recorded as a component of cost of materials and other in the condensed consolidated statements of income.
Commodity investments represent those commodities (generally crude oil) physically on hand as a result of trading activities with physical forward contracts. Such investment stores are maintained on a weighted average cost basis for determining realized gains and losses on physical sales under forward contracts, and ending balances are adjusted to fair value at each reporting date. The unrealized loss on commodity investments for the three months ended March 31, 2019 totaled $1.0 million.
Notes to Condensed Consolidated Financial Statements (Unaudited)
The fair value hierarchy for our financial assets and liabilities accounted for at fair value on a recurring basis at September 30, 2017March 31, 2019 and December 31, 2016,2018, was as follows (in millions):
| | | | | As of September 30, 2017 | | As of March 31, 2019 |
| | | Level 1 | | Level 2 | | Level 3 | | Total | | Level 1 | | Level 2 | | Level 3 | | Total |
| Assets | | | | | | | | | | | | | | | | |
| OTC commodity swaps | | $ | — |
| | $ | 104.6 |
| | $ | — |
| | $ | 104.6 |
| |
| Commodity derivatives | | | $ | — |
| | $ | 213.4 |
| | $ | — |
| | $ | 213.4 |
|
| Commodity investments | | | 5.4 |
| | — |
| | — |
| | 5.4 |
|
| RIN commitment contracts | | — |
| | 0.5 |
| | — |
| | 0.5 |
| | — |
| | 4.0 |
| | — |
| | 4.0 |
|
| RINs Obligation surplus | | — |
| | 7.7 |
| | — |
| | 7.7 |
| |
| Total assets | | — |
| | 112.8 |
| | — |
| | 112.8 |
| | 5.4 |
| | 217.4 |
| | — |
| | 222.8 |
|
| Liabilities | | | | | | | | | | | | | | | | |
| OTC commodity swaps | | — |
| | (133.0 | ) | | — |
| | (133.0 | ) | |
| Interest rate derivatives | | — |
| | (1.3 | ) | | — |
| | (1.3 | ) | |
| Commodity derivatives | | | — |
| | (174.4 | ) | | — |
| | (174.4 | ) |
| RIN commitment contracts | | — |
| | (11.7 | ) | | — |
| | (11.7 | ) | | — |
| | (6.4 | ) | | — |
| | (6.4 | ) |
| RINs Obligation deficit | | — |
| | (39.7 | ) | | — |
| | (39.7 | ) | | — |
| | (11.5 | ) | | — |
| | (11.5 | ) |
| J. Aron step-out liability | | — |
| | (386.7 | ) | | — |
| | (386.7 | ) | | — |
| | (384.8 | ) | | — |
| | (384.8 | ) |
| Total liabilities | | — |
| | (572.4 | ) | | — |
| | (572.4 | ) | | — |
| | (577.1 | ) | | — |
| | (577.1 | ) |
| Net liabilities | | $ | — |
| | $ | (459.6 | ) | | $ | — |
| | $ | (459.6 | ) | | $ | 5.4 |
| | $ | (359.7 | ) | | $ | — |
| | $ | (354.3 | ) |
|
| | | | | | | | | | | | | | | | |
| | | December 31, 2018 |
| | | Level 1 | | Level 2 | | Level 3 | | Total |
| Assets | | | | | | | | |
| Commodity derivatives | | $ | — |
| | $ | 459.8 |
| | $ | — |
| | $ | 459.8 |
|
| Commodity investments | | 15.8 |
| | — |
| | — |
| | 15.8 |
|
| RIN commitment contracts | | — |
| | 2.0 |
| | — |
| | 2.0 |
|
| RINs Obligation surplus | | — |
| | — |
| | — |
| | — |
|
| Total assets | | 15.8 |
| | 461.8 |
| | — |
| | 477.6 |
|
| Liabilities | | | | | | | | |
| Commodity derivatives |
| — |
|
| (409.0 | ) |
| — |
|
| (409.0 | ) |
| RIN commitment contracts | | — |
| | (6.7 | ) | | — |
| | (6.7 | ) |
| RINs Obligation deficit | | — |
| | (11.8 | ) | | — |
| | (11.8 | ) |
| J. Aron step-out liability | | — |
| | (362.2 | ) | | — |
| | (362.2 | ) |
| Total liabilities | | — |
| | (789.7 | ) | | — |
| | (789.7 | ) |
| Net liabilities | | $ | 15.8 |
| | $ | (327.9 | ) | | $ | — |
| | $ | (312.1 | ) |
|
| | | | | | | | | | | | | | | | |
| | | As of December 31, 2016 |
| | | Level 1 | | Level 2 | | Level 3 | | Total |
| Assets | | | | | | | | |
| OTC commodity swaps | | $ | — |
| | $ | 53.1 |
| | $ | — |
| | $ | 53.1 |
|
| RINs Obligation surplus | | — |
| | 4.9 |
| | — |
| | 4.9 |
|
| Total assets | | — |
| | 58.0 |
| | — |
| | 58.0 |
|
| Liabilities | | | | | | | | |
| OTC commodity swaps |
| — |
|
| (103.6 | ) |
| — |
|
| (103.6 | ) |
| RIN commitment contracts | | — |
| | (0.8 | ) | | — |
| | (0.8 | ) |
| RINs Obligation deficit | | — |
| | (25.6 | ) | | — |
| | (25.6 | ) |
| J. Aron step-out liability | | — |
| | (144.8 | ) | | — |
| | (144.8 | ) |
| Total liabilities | | — |
| | (274.8 | ) | | — |
| | (274.8 | ) |
| Net liabilities | | $ | — |
| | $ | (216.8 | ) | | $ | — |
| | $ | (216.8 | ) |
The derivative values above are based on analysis of each contract as the fundamental unit of account as required by ASC 820. In the table above, derivative assets and liabilities with the same counterparty are not netted where the legal right of offset exists. This differs from the presentation in the financial statements which reflects our policy, wherein we have elected to offset the fair value amounts recognized for multiple derivative instruments executed with the same counterparty and where the legal right of offset exists. As of September 30, 2017March 31, 2019 and December 31, 2016, $16.32018, $21.4 million and $14.7$0.4 million, respectively, of cash collateralobligation was held by counterparty brokerage firms and has been netted with the net derivative positions with each counterparty. See Note 1611 for further information regarding derivative instruments.
16. Derivative Instruments
We use derivatives to reduce normal operating and market risks with the primary objective of reducing the impact of market price volatility on our results of operations. As such, our use of derivative contracts is aimed at:
limiting the exposure to price fluctuations of commodity inventory above or below target levels at each of our segments;
managing our exposure to commodity price risk associated with the purchase or sale of crude oil, feedstocks and finished grade fuel products at each of our segments; and
limiting the exposure to interest rate fluctuations on our floating rate borrowings.
We primarily utilize OTC commodity swaps, generally with maturity dates of three years or less, and interest rate swap and cap agreements to achieve these objectives. OTC commodity swap contracts require cash settlement for the commodity based on the difference between a fixed or floating price and the market price on the settlement date. Interest rate swap and cap agreements economically hedge floating rate debt by exchanging interest rate cash flows, based on a notional amount from a floating rate to a fixed rate. Effective with the Delek/Alon Merger, we have interest rate swap agreements, maturing March 2019, that effectively fix the variable LIBOR interest component of the term loans within the Alon Retail Credit Agreement. The aggregate notional amount under these agreements covers approximately 77% of the outstanding principal of these term loans throughout the duration of the interest rate swaps. See Note 8 for further information. At this time, we do not believe there is any material credit risk with respect to the counterparties to these contracts.
From time to time, we also enter into future commitments to purchase or sell RINs at fixed prices and quantities, which are used to manage the costs associated with our RINs Obligation. These future RIN commitment contracts meet the definition of derivative instruments under ASC 815, and are recorded at estimated fair value in accordance with the provisions of ASC 815. Changes in the fair value of these future RIN commitment contracts are recorded in cost of goods sold on the consolidated statements of income.
In accordance with ASC 815, certain of our OTC commodity swap contracts and our interest rate agreements have been designated as cash flow hedges and the effective portion of the change in fair value between the execution date and the end of period has been recorded in other comprehensive income. The effective portion of the fair value of these contracts is recognized in income at the time the positions are closed and the hedged transactions are recognized in income.
From time to time, we also enter into futures contracts with supply vendors that secure supply of product to be purchased for use in the normal course of business at our refining segment. These contracts are priced based on an index that is clearly and closely related to the product being purchased, contain no net settlement provisions and typically qualify under the normal purchase exemption from derivative accounting treatment under ASC 815.
The following table presents the fair value of our derivative instruments as of September 30, 2017 and December 31, 2016. The fair value amounts below are presented on a gross basis and do not reflect the netting of asset and liability positions permitted under our master netting arrangements, including cash collateral on deposit with our counterparties. We have elected to offset the recognized fair value amounts for multiple derivative instruments executed with the same counterparty in our financial statements. As a result, the asset and liability amounts below differ from the amounts presented in our condensed consolidated balance sheets. See Note 15 for further information regarding the fair value of derivative instruments (in millions):
|
| | | | | | | | | | | | | | | | | |
| | | | September 30, 2017 | | December 31, 2016 |
| Derivative Type | Balance Sheet Location | | Assets | | Liabilities | | Assets | | Liabilities |
| Derivatives not designated as hedging instruments: | | | | | | | | |
OTC commodity swaps(1) | Other current assets | | $ | 85.2 |
| | $ | (82.0 | ) | | $ | 37.4 |
| | $ | (30.6 | ) |
OTC commodity swaps(1) | Other current liabilities | | 14.6 |
| | (23.4 | ) | | 14.4 |
| | (35.2 | ) |
OTC commodity swaps(1) | Other long term assets | | 1.1 |
| | (1.1 | ) | | — |
| | — |
|
OTC commodity swaps(1) | Other long term liabilities | | 3.7 |
| | (3.9 | ) | | — |
| | — |
|
RIN commitment contracts(2) | Other current assets | | 0.5 |
| | — |
| | — |
| | — |
|
RIN commitment contracts(2) | Other current liabilities | | — |
| | (11.7 | ) | | — |
| | (0.8 | ) |
| | | | | | | | | | |
| Derivatives designated as hedging instruments: | | | | | | | | |
OTC commodity swaps(1) | Other current assets | | — |
| | — |
| | 0.1 |
| | (2.5 | ) |
OTC commodity swaps(1) | Other current liabilities | | — |
| | (22.6 | ) | | 1.2 |
| | (18.0 | ) |
OTC commodity swaps(1) | Other long term assets | | — |
| | — |
| | — |
| | — |
|
OTC commodity swaps(1) | Other long term liabilities | | — |
| | — |
| | — |
| | (17.3 | ) |
| Interest rate derivatives | Other long term liabilities | | — |
| | (1.3 | ) | | — |
| | — |
|
| Total gross fair value of derivatives | | $ | 105.1 |
| | $ | (146.0 | ) | | $ | 53.1 |
| | $ | (104.4 | ) |
Less: Counterparty netting and cash collateral(3) | | 86.8 |
| | (103.1 | ) | | 46.3 |
| | (61.0 | ) |
| Less: Amounts subject to master netting arrangements that are not netted on the balance sheet | | 0.1 |
| | (0.1 | ) | | — |
| | — |
|
| Total net fair value of derivatives | | $ | 18.2 |
| | $ | (42.8 | ) | | $ | 6.8 |
| | $ | (43.4 | ) |
| |
(1)
| As of September 30, 2017 and December 31, 2016, we had open derivative positions representing 44,728,393 barrels and 9,348,000 barrels, respectively, of crude oil and refined petroleum products. Of these open positions, contracts representing 575,000 barrels and 3,392,000 barrels were designated as cash flow hedging instruments as of September 30, 2017 and December 31, 2016, respectively. |
| |
(2)
| As of September 30, 2017 and December 31, 2016, we had open RIN contracts representing 443,756,545 and 36,750,000 RINs, respectively. |
| |
(3)
| As of September 30, 2017 and December 31, 2016, $16.3 million and $14.7 million, respectively, of cash collateral held by counterparties has been netted with the derivatives with each counterparty. |
Total losses on our commodity derivatives and RIN commitment contracts recorded in cost of goods sold on the condensed consolidated statements of income for the three and nine months ended September 30, 2017 and 2016 are as follows (in millions):
|
| | | | | | | | | | | | | | | | |
| | | Three Months Ended September 30, | | Nine Months Ended September 30, |
| | | 2017 | | 2016 | | 2017 | | 2016 |
| Gains (losses) on commodity derivatives not designated as hedging instruments | | $ | (15.5 | ) | | $ | 3.2 |
| | $ | (5.6 | ) | | $ | (9.5 | ) |
| Realized losses reclassified out of OCI on commodity derivatives designated as cash flow hedging instruments | | 1.0 |
| | (7.0 | ) | | (38.5 | ) | | (21.3 | ) |
| Gains recognized on commodity derivatives due to cash flow hedging ineffectiveness | | 0.1 |
| | 2.2 |
| | 0.5 |
| | 2.7 |
|
| Total | | $ | (14.4 | ) | | $ | (1.6 | ) | | $ | (43.6 | ) | | $ | (28.1 | ) |
For cash flow hedges, no component of the derivative instruments’ gains or losses was excluded from the assessment of hedge effectiveness for the three and nine months ended September 30, 2017 or 2016. As of September 30, 2017 and December 31, 2016, losses of $4.7 million and $16.2 million, respectively, on cash flow hedges, net of tax, primarily related to future purchases of crude oil and the associated sale of finished grade fuel, remained in accumulated other comprehensive income. Losses of $0.7 million and $25.0 million, net of tax, on settled commodity contracts were reclassified into cost of goods sold in the condensed consolidated statements of income during the three and nine months ended September 30, 2017, respectively. Losses of $4.5 million and $13.9 million, net of tax, on settled commodity contracts were reclassified into cost of goods sold in the condensed consolidated statements of income during the three and nine months ended September 30, 2016, respectively. We estimate that $7.2 million of deferred losses related to commodity cash flow hedges will be reclassified into cost of goods sold over the next 12 months as a result of hedged transactions that are forecasted to occur. As of September 30, 2017, gains of $0.1 million, net of tax, related to the interest rate cash flow hedges, remained in accumulated other comprehensive income. We estimate that a nominal amount of deferred gains related to interest rate cash flow hedges will be reclassified into interest expense over the next 12 months as a result of hedged transactions that are forecasted to occur. Related to Alon's interest rate swap cash flow hedges, we recognized $0.1 million in interest expense on the condensed consolidated statements of income, and there was no cash flow hedge ineffectiveness for the three months ended September 30, 2017. There are no interest rate derivatives that are not designated as hedging instruments.
For the nine months ended September 30, 2017 and September 30, 2016, there were no amounts reclassified from accumulated other comprehensive income into income as a result of the discontinuation of cash flow hedge accounting.
17.13 - Commitments and Contingencies
Litigation
In the ordinary conduct of our business, we are from time to time subject to lawsuits, investigations and claims, including environmental claims and employee-related matters.
Although we cannot predict with certainty the ultimate resolution of lawsuits, investigations and claims asserted against us, including civil penalties or other enforcement actions, we do not believe that any currently pending legal proceeding or proceedings to which we are a party will have a material adverse effect on our business, financial conditionstatements. Certain environmental matters that have or results of operations.
One of our Alon subsidiaries was party to a lawsuit alleging breach of contract pertaining to an asphalt supply agreement. During the three months ended September 30, 2017, we reached a settlement on this matter which was includedmay result in accrued liabilities in purchase accounting as part of the fair value of the liabilities assumedpenalties or assessments are discussed below in the Delek/Alon Merger."Environmental, Health and Safety" section of this Note.
Notes to Condensed Consolidated Financial Statements (Unaudited)
Self-insurance
Delek is self-insuredrecords a self-insurance accrual for workers’ compensation claims up to a $1.0 million deductible on a per-accident basis. We self-insure forper accident basis, general liability claims up to $4.0 million on a per-occurrence basis.per occurrence basis and medical claims for eligible full-time employees up to $0.3 million per covered individual per calendar year. We self-insurealso record a self-insurance accrual for auto liability up to a $1.0 million deductible on a per-accidentper accident basis for claims incurred in recent periods, and up to a $4.0 million deductible for remaining claims from certain prior periods.
We have umbrella liability insurance available to each of our segments in an amount determined reasonable by management.
Environmental, Health and Safety
We are subject to extensive federal, state and local environmental and safety laws and regulations enforced by various agencies, including the EPA, the United States Department of Transportation, the Occupational Safety and Health Administration, as well as numerous state, regional and local environmental, safety and pipeline agencies.
These laws and regulations govern the discharge of materials into the environment, waste management practices, pollution prevention measures and the composition of the fuels we produce, as well as the safe operation of our plants and pipelines and the safety of our workers and the public. Numerous permits or other authorizations are required under these laws and regulations for the operation of our refineries, biodieselrenewable fuels facilities, terminals, pipelines, underground storage tanks, ("USTs"), trucks, rail cars and related operations, and may be subject to revocation, modification and renewal.
These laws and permits raise potential exposure to future claims and lawsuits involving environmental and safety matters which could include soil and water contamination, air pollution, personal injury and property damage allegedly caused by substances which we manufactured, handled, used, released or disposed of, transported, or that relate to pre-existing conditions for which we have assumed responsibility. We believe that our current operations are in substantial compliance with existing environmental and safety requirements. However, there have been and will continue to be ongoing discussions about environmental and safety matters between us and federal and state authorities, including notices of violations, citations and other enforcement actions, some of which have resulted or may result in changes to operating procedures and in capital expenditures. While it is often difficult to quantify future environmental or safety related expenditures, we anticipate that continuing capital investments and changes in operating procedures will be required for the foreseeable future to comply with existing and new requirements, as well as evolving interpretations and more strict enforcement of existing laws and regulations.
Our recently acquiredThe Big Spring refinery has been negotiating an agreement with the EPA for over 10 years under the EPA’s National Petroleum Refinery Initiative regarding alleged historical violations of the federal Clean Air Act.Act related to emissions and emissions control equipment. A Consent Decree resolving these alleged historical violations for the Big Spring refinery was lodged with the United States District Court for the Northern District of Texas on June 6, 2017,2017. An amendment to the Consent Decree was agreed upon by Delek and the EPA/ United States Department of Justice (the "DOJ"), in late 2018 and was executed by Delek. The amended Consent Decree was lodged during the first quarter of 2019, and we expect that Consent Decree to become final later this year. If finalized,upon entry by the court in the second quarter 2019. Once final, the amended Consent Decreewill require payment of a $0.5 million civil penalty and capital expenditures for pollution control equipment that may be significant over the next 510 years.
As of September 30, 2017,March 31, 2019, we have recorded an environmental liability of approximately $77.1$143.2 million, primarily related to the estimated probable costs of remediating or otherwise addressing certain environmental issues of a non-capital nature at the Tyler, El Dorado, Big Spring, Krotz Springs and Californiaour refineries, as well as terminals, some of which we no longer own. This liability includes estimated costs for ongoing investigation and remediation efforts, which were already being performed by the former operators of the refineries and terminals prior to our acquisition of those facilities, for known contamination of soil and groundwater, as well as estimated costs for additional issues which have been identified subsequent to the acquisitions. We expect approximately $0.1 million of this amount to be reimbursable by a prior owner of the El Dorado refinery, which we have recorded in other current assets in our condensed consolidated balance sheet as of September 30, 2017. We expect approximately $2.9 million of this amount to be reimbursable by a prior owner of certain assets associated with the Paramount refinery, and have recorded $0.6 million in other current assets and $2.3 million in other non-current assets in our condensed consolidated balance sheet as of September 30, 2017.
Approximately $7.3$3.7 million of the total liability is expected to be expended over the next 12 months, with most of the balance expended by 2046.2032, although some costs may extend up to 30 years. In the future, we could be required to extend the expected remediation period or undertake additional investigations of our refineries, pipelines and terminal facilities, which could result in the recognition of additional remediation liabilities.
Crude Oil Releases
We have experienced several crude oil releases from pipelines owned byinvolving our logistics segment,assets, including butfour releases that occurred in the first quarter of 2019, three releases that occurred in the first quarter of 2018, and three releases that occurred in the fourth quarter of 2018. Cleanup operations and site maintenance and remediation efforts on these and other releases are at various stages of completion. Many of the releases have occurred on the SALA Gathering System. Currently, we are in the process of decommissioning certain sections of the SALA Gathering System in an effort to improve the safety and integrity of the system. We do not limitedexpect for the decommissioning of certain gathering lines on the system to have a release at Magnolia Station in March 2013, a release near Fouke, Arkansas in April 2015 and a release near Woodville, Texas in January 2016. In June 2015,material effect on the United States Departmentoperational capabilities of Justice notified Delek Logistics that they were evaluating an enforcement actionthe system.
The DOJ, on behalf of the EPA, and the State of Arkansas, on behalf of the Arkansas Department of Environmental Quality, have been pursuing an enforcement action against Delek Logistics with regard to potential violations of the Clean Water Act violationsand certain state laws arising from the March 2013 Magnolia Station release. We are currently attempting to negotiate a resolution to this matter withRelease since June 2015. On July 13, 2018, the EPADOJ and the ADEQ, which may includeState of Arkansas filed a civil action against two of Delek Logistics’ wholly-owned subsidiaries, Delek Logistics Operating LLC and SALA Gathering Systems LLC, in the United States District Court
Notes to Condensed Consolidated Financial Statements (Unaudited)
for the Western District of Arkansas. On or around December 12, 2018, the claims against Delek Logistics were resolved and an additional demand for a compliance audit at the Magnolia terminal was abandoned pursuant to payment of monetary penalties and/orand other relief. Based onAs of March 31, 2019, we have accrued $2.2 million, which we recorded in accrued expenses and other current information available to us, we do not believeliabilities in our condensed consolidated balance sheet, for the total costs associatedMagnolia Release in connection with these events, whether alone or in the aggregate, including any fines or penalties,proceedings. We believe this amount is adequate to cover our expected obligations related to these proceedings and that these proceedings will not have a material adverse effect upon ourDelek's business, financial condition or resultsresult of operations. We expect to settle this accrual in the second half of 2019.
Letters of Credit
As of September 30, 2017,March 31, 2019, we had in place letters of credit totaling approximately $146.0$226.4 million with various financial institutions securing obligations primarily with respect to our commodity purchases for the refining segment and certain of our gasoline and diesel purchases for the logistics segment and our workers’ compensation and auto liability self-insuranceinsurance programs. NoThere were no amounts were drawn by beneficiaries of these letters of credit at September 30, 2017.March 31, 2019.
Note 14 - Income Taxes
Operating LeasesUnder ASC 740, Income Taxes (“ASC 740”), companies are required to apply an estimated annual tax rate to interim period results on a year-to-date basis; however, the estimated annual tax rate should not be applied to interim financial results if a reliable estimate cannot be made. In this situation, the interim tax rate should be based on actual year-to-date results. We used an estimated annual tax rate to record income taxes for the three months ended March 31, 2019 and March 31, 2018.
Delek leases buildings, equipmentFor the three months ended March 31, 2018, we recorded additional income tax benefit of $7.4 million as a component of income tax expense from continuing operations related to the continued assessment of the tax effects of the 2017 Tax Cuts and corporate office space under agreements expiring at various dates through 2035 after considering available renewal options. ManyJobs Act ("Tax Reform Act"). This adjustment to the previously recorded provisional amounts include the tax effects on the remeasurement of these leases contain renewal optionsthe existing net deferred tax liabilities. We also had a reclassification of $1.6 million from accumulated other comprehensive income to retained earnings for stranded tax effects resulting from the Tax Reform Act, which was recorded during the first quarter of 2018.
Our effective tax rate was 22.9% for the three months ended March 31, 2019, compared to 39.9% for the three months ended March 31, 2018. The change in our effective tax rate was primarily due to the impact of pre-tax income in the three months ended March 31, 2019 compared to a pre-tax loss in the three months ended March 31, 2018, and require Delekthe following discrete adjustments that were reported in the first quarter of 2018: further remeasurement of deferred tax assets and liabilities to pay executory costs (such as property taxes, maintenance and insurance).
Updatedproperly account for the effects of the Tax Reform Act under Staff Accounting Bulletin 118; tax benefit for federal tax credits attributable to the Company's biodiesel blending operations for 2017 that have not been extended by Congress; tax expense associated with the impairment of assets held for sale; and changes in valuation allowance attributable to the book-tax basis differences from the Big Spring Logistic Asset Acquisition (See Note 5).
Note 15 - Related Party Transactions
Transaction with Caddo Pipeline, LLC ("CP LLC")
For the three months ended March 31, 2019 and 2018, our refining segment paid pipeline throughput fees of $0.1 million to CP LLC. Delek Logistics owns 50% of CP LLC, and Plains All American Pipeline, LLC, a third-party, owns the other 50%.
Transactions with Rangeland RIO Pipeline, LLC ("Andeavor Logistics")
During 2018, Rangeland RIO Pipeline, LLC was acquired by Andeavor and became Andeavor Logistics RIO Pipeline LLC ("Andeavor Logistics"). For the three months ended March 31, 2019 and 2018, respectively, our refining segment paid pipeline throughput fees of $4.4 million and $4.2 million to Andeavor Logistics. As of March 31, 2019 and December 31, 2018, respectively, we carried a $1.3 million and $1.5 million payable balance to Andeavor Logistics, which is reflected in accounts payable to related party on our condensed consolidated balance sheets. Delek Logistics owns 33% of Andeavor Logistics, and Rangeland Energy II, LLC, a third-party, owns 67%.
Transactions with Wright Asphalt Products Company, LLC ("Wright Asphalt")
For the three months ended March 31, 2019 and 2018, respectively, our corporate, other and eliminations segment had related party revenues of $7.1 million and $4.0 million from Wright Asphalt related to asphalt sales. Purchases from Wright Asphalt for the three months ended March 31, 2019 were $0.2 million. There were no purchases from Wright Asphalt during the three months ended March 31, 2018. As of March 31, 2019, we carried a $0.4 million receivable balance from Wright Asphalt, which is reflected in accounts receivable from related party on our condensed consolidated balance sheet. Alon owns 50% of Wright Asphalt, and TTRD, Ltd., a third-party, owns the other 50%.
Notes to Condensed Consolidated Financial Statements (Unaudited)
Transactions with Paramount Nevada Asphalt Company, LLC ("PNAC")
For the period from the Delek/Alon Merger date of July 1, 2017 through May 21, 2018 we had related party transactions with PNAC. Alon owned 50% of PNAC, and Granite Construction Inc., a third-party, owned the other 50%. On May 21, 2018, Delek sold its 50% interest in PNAC - see note Note 8 for further information. For the three months ended March 31, 2018 our other segment had related party revenues of $1.2 million from PNAC related to asphalt sales.
Transactions with North Little Rock Energy Logistics, LLC ("NLR")
For the three months ended March 31, 2019, our refining segment paid pipeline throughput fees of $0.5 million to NLR. There was no activity related to pipeline throughput fees during the three months ended March 31, 2018. As of March 31, 2019, there was no payable balance to NLR. At December 31, 2018, we carried a $0.3 million payable balance to NLR, which is reflected in accounts payable to related party on our condensed consolidated balance sheets. Delek Logistics own 50% of NLR, and Green Plains Partners, LP, a third-party, owns the other 50%.
Note 16 - Other Assets and Liabilities
The detail of other current assets is as follows (in millions):
|
| | | | | | | |
| Other Current Assets | March 31,
2019 | | December 31,
2018 |
| Prepaid expenses | $ | 15.2 |
| | $ | 15.8 |
|
| Short-term derivative assets (see Note 11) | 33.6 |
| | 61.9 |
|
| Income and other tax receivables | 14.1 |
| | 24.3 |
|
| Commodity investments | 5.4 |
| | 15.6 |
|
| Other | 16.7 |
| | 18.1 |
|
| Total | $ | 85.0 |
| | $ | 135.7 |
|
The detail of other non-current assets is as follows (in millions):
|
| | | | | | | |
| Other Non-Current Assets | March 31,
2019 | | December 31,
2018 |
| Long-term deferred tax asset | $ | 2.5 |
| | $ | — |
|
| Deferred financing costs | 9.6 |
| | 10.6 |
|
| Supply and Offtake receivable | 32.7 |
| | 32.7 |
|
| Long-term derivative assets (see Note 11) | 0.9 |
| | 1.0 |
|
| Other | 7.1 |
| | 8.6 |
|
| Total | $ | 52.8 |
| | $ | 52.9 |
|
Notes to Condensed Consolidated Financial Statements (Unaudited)
The detail of accrued expenses and other current liabilities is as follows (in millions):
|
| | | | | | | |
| Accrued Expenses and Other Current Liabilities | March 31,
2019 | | December 31,
2018 |
| Income and other taxes payable | $ | 159.8 |
| | $ | 126.0 |
|
| Short-term derivative liabilities (see Note 11) | 14.2 |
| | 16.2 |
|
| Interest payable | 11.9 |
| | 10.2 |
|
| Employee costs | 30.8 |
| | 46.5 |
|
| Environmental liabilities (see Note 13) | 3.7 |
| | 3.8 |
|
| Product financing agreements | 6.6 |
| | — |
|
| RINs Obligation deficit (see Note 12) | 11.5 |
| | 11.8 |
|
| Accrued utilities | 7.1 |
| | 10.6 |
|
| Tank inspection liabilities | 7.0 |
| | 7.0 |
|
| Crude liabilities | 107.3 |
| | 42.3 |
|
| Other | 32.7 |
| | 33.3 |
|
| Total | $ | 392.6 |
| | $ | 307.7 |
|
The detail of other non-current liabilities is as follows (in millions):
|
| | | | | | | |
| Other Non-Current Liabilities | March 31,
2019 | | December 31,
2018 |
| Pension and other postemployment benefit liabilities, net (see Note 19) | $ | 17.1 |
| | $ | 17.6 |
|
| Long-term derivative liabilities (see Note 11) | 5.0 |
| | 1.0 |
|
| Liability for unrecognized tax benefits | 24.1 |
| | 19.2 |
|
| Above-market leases | — |
| | 9.2 |
|
| Tank inspection liabilities | 9.9 |
| | 9.9 |
|
| Other | 2.9 |
| | 6.0 |
|
| Total | $ | 59.0 |
| | $ | 62.9 |
|
Note 17 - Equity-Based Compensation
Delek US Holdings, Inc. 2006 and 2016 and Alon USA Energy, Inc. 2005 Long-Term Incentive Plans (the "Incentive Plans")
Compensation expense related to equity-based awards granted under the Incentive Plans amounted to $4.8 million ($3.8 million, net of taxes) and $4.6 million ($3.6 million, net of taxes) for the three months ended March 31, 2019 and 2018, respectively. These amounts are included in general and administrative expenses in the accompanying condensed consolidated statements of income.
As of March 31, 2019, there was $54.2 million of total unrecognized compensation cost related to non-vested share-based compensation arrangements, which is expected to be recognized over a weighted-average period of 2.5 years.
We issued 244,566 and 120,403 shares of common stock as a result of exercised or vested equity-based awards during the three months ended March 31, 2019 and 2018, respectively. These amounts are net of 169,991 and 254,724 shares, respectively, withheld to satisfy employee tax obligations related to the exercises and vestings during the three months ended March 31, 2019 and 2018.
Delek Logistics GP, LLC 2012 Long-Term Incentive Plan
Compensation expense for Delek Logistics GP equity-based awards was $0.1 million ($0.1 million, net of taxes) and $0.1 million ($0.1 million, net of taxes) for the three months ended March 31, 2019 and 2018, respectively. These amounts are included in general and administrative expenses in the accompanying condensed consolidated statements of income.
As of March 31, 2019, there was $0.1 million of total unrecognized compensation cost related to non-vested share-based compensation arrangements, which is expected to be recognized over a weighted-average period of 0.2 years.
Notes to Condensed Consolidated Financial Statements (Unaudited)
Note 18 - Stockholders' Equity
Dividends
During the three months ended March 31, 2019, our Board of Directors declared the following dividends:
|
| | | | | | |
| Date Declared | | Dividend Amount Per Share | | Record Date | | Payment Date |
| February 19, 2019 | | $0.27 | | March 5, 2019 | | March 19, 2019 |
Stock Repurchase Program
On November 6, 2018, our Board of Directors authorized a share repurchase program for up to $500.0 million of Delek common stock. Any share repurchases under the repurchase program may be implemented through open market transactions or in privately negotiated transactions, in accordance with applicable securities laws. The timing, price and size of repurchases will be made at the discretion of management and will depend on prevailing market prices, general economic and market conditions and other considerations. The repurchase program does not obligate us to acquire any particular amount of stock and does not expire. During the three months ended March 31, 2019, approximately 1.3 million shares of our common stock were repurchased for a total of approximately $46.2 million compared to repurchases of approximately 2.6 million shares during the three months ended March 31, 2018 for a total of approximately $95.3 million. As of March 31, 2019, there was approximately $363.6 million of authorization remaining under Delek's aggregate stock repurchase program.
Note 19 - Employees
Postretirement Benefits
The components of net periodic benefit cost related to our benefit plans consisted of the following:
|
| | | | | | | |
| | Three Months Ended March 31, |
| Components of net periodic (benefit) cost: | 2019 | | 2018 |
| Service cost | $ | — |
| | $ | 0.2 |
|
| Interest cost | 1.3 |
| | 1.2 |
|
| Expected return on plan assets | (1.9 | ) | | (1.8 | ) |
| Recognition due to settlement | — |
| | (0.2 | ) |
| Net periodic benefit | $ | (0.6 | ) | | $ | (0.6 | ) |
The service cost component of net periodic benefit is included as part of general and administrative expenses in the accompanying condensed consolidated statements of income. The other components of net periodic benefit are included as part of other non-operating expense (income), net in the accompanying condensed consolidated statements of income. During the year ended December 31, 2018, we completely settled the supplemental retirement income plan of the retail segment, and we had a partial settlement of Alon's executive non-qualified restoration plan. In addition, we entered into an agreement with the International Union of Operating Engineers (the "Union") to extend the Union agreement to March 31, 2022, and to freeze Alon's qualified pension plan for union employees effective July 31, 2018. As part of the extended Union agreement, the Company agreed to compensate each pension-eligible employee in the Union for the loss of the pension benefit over the remaining union contract period in four annual installments, where payments are contingent upon continued employment at each annual payment date. The payments, the first of which was made in July 2018, are expected to total approximately $6.9 million in the aggregate without considering forfeitures (which cannot yet be estimated). The related expense has been or will be recognized over the remaining union contract period as follows (estimated without considering forfeitures): approximately $0.5 million during the three months ended March 31, 2019 and approximately $1.5 million for the remainder of 2019; approximately $2.0 million during each of the years 2020 and 2021, and approximately $0.1 million in 2022. In addition during the fourth quarter of 2018, we spun off a portion of the Alon's qualified pension plan into a new plan for Union employees - The Alon USA Pension Plan for Collective Bargained Employees. The assets were allocated as required under IRC Section 414. The remaining accumulated other comprehensive income at that date was split between the two plans based on their respective portions of the projected benefit obligation (the "Projected Benefit Obligation") which is the present value of benefits earned to date by plan participants, including the effect of assumed future salary increases.
Our estimated contributions to our pension plans during 2019 have not changed significantly from amounts previously disclosed in the notes to the consolidated financial statements for the year ended December 31, 2018. For the three months ended March 31, 2019, we made no contributions to our funded qualified pension plan and made contributions of $0.1 million related to payments to participants in our unfunded pension plans.
Notes to Condensed Consolidated Financial Statements (Unaudited)
Note 20. Leases
We lease certain retail stores, land, building and various equipment. Leases with an initial term of 12 months or less are not recorded on the balance sheet; we recognize lease expense for these leases on a straight-line basis over the lease term.
Most leases include one or more options to renew, with renewal terms that can extend the lease term from one to 15 years or more. The exercise of existing lease renewal options is at our sole discretion. Certain leases also include options to purchase the leased property. The depreciable life of assets and leasehold improvements are limited by the expected lease term, unless there is a transfer of title or purchase option reasonably certain of exercise.
Some of our lease agreements include a rate based on equipment usage and others include a rate with fixed increases or inflationary indices based increase. Our lease agreements do not contain any material residual value guarantees or material restrictive covenants.
We rent or sublease certain real estate and equipment to third parties. Our sublease portfolio consists primarily of operating leases within our stores and crude storage equipment.
|
| | | | |
| (in millions) | | Three Months Ended March 31, 2019 |
| Lease Cost | | |
| Operating lease costs | | $ | 13.5 |
|
Short-term lease costs (1) | | 3.6 |
|
| Sublease income | | (1.7 | ) |
| Net lease costs | | $ | 15.4 |
|
| | | |
| Other Information | | |
| Cash paid for amounts included in the measurement of lease liabilities | | |
| Operating cash flows from operating leases | | $ | (13.5 | ) |
| | | |
| Weighted-average remaining lease term (years) operating leases | | 7.2 |
|
| | | |
Weighted-average discount rate operating leases (2) | | 6.3 | % |
(1)Includes an immaterial amount of variable lease cost.
(2) Our discount rate is primarily based on our incremental borrowing rate in accordance with ASC 842.
The following is an estimate of the maturity of our lease liabilities for operating leases having remaining noncancelable terms in excess of one year as of March 31, 2019 (in millions) under the new lease guidance ("ASC 842"):
|
| | | | |
| Maturity of Lease Liabilities | | Total |
| April 1 to December 31, 2019 | | 36.3 |
|
| 2020 | | 43.6 |
|
| 2021 | | 41.1 |
|
| 2022 | | 30.1 |
|
| 2023 | | 24.9 |
|
| Thereafter | | 85.6 |
|
| Total future lease payments | | 261.6 |
|
| Less: Interest | | 60.8 |
|
| Present Value of Lease Liabilities | | $ | 200.8 |
|
Notes to Condensed Consolidated Financial Statements (Unaudited)
The following is an estimate of our future minimum lease payments for operating leases having remaining noncancelable terms in excess of one year as of September 30, 2017December 31, 2018 (in millions) under the legacy lease guidance("ASC 840"):
|
| | | | | | | | |
| Minimum Lease Payments | | | | | | |
| 2019 | | | | | | $ | 48.1 |
|
| 2020 | | | | | | 42.1 |
|
| 2021 | | | | | | 39.5 |
|
| 2022 | | | | | | 28.5 |
|
| 2023 | | | | | | 23.4 |
|
| Thereafter | | | | | | 77.9 |
|
| Total future minimum lease payments | |
| |
| | $ | 259.5 |
|
|
| | | | |
| 4th Quarter 2017 | | $ | 11.6 |
|
| 2018 | | 38.9 |
|
| 2019 | | 22.2 |
|
| 2020 | | 13.7 |
|
| 2021 | | 9.9 |
|
| Thereafter | | 34.6 |
|
| Total future minimum lease payments | | $ | 130.9 |
|
18. Employees
Workforce Update
Approximately 134 employees who work at our Big Spring refinery are covered by a collective bargaining agreement that expires April 1, 2019. None of the other employees of Alon are represented by a union.
Retirement Plans Update
Effective with the Delek/Alon Merger (see Note 2), we now have four defined benefit pension plans covering substantially all of Alon's employees, excluding employees of the retail segment. The benefits are based on years of service and the employee’s final average monthly compensation. Our funding policy is to contribute annually no less than the minimum required nor more than the maximum amount that can be deducted for federal income tax purposes. Contributions are intended to provide not only for benefits attributed to service to date but also for those benefits expected to be earned in the future. The plans were frozen for non-union employees effective September 30, 2017.
The components of net periodic benefit cost related to our benefit plans for the three months ended September 30, 2017 consisted of the following:
|
| | | | |
| Components of net periodic benefit cost: | | |
| Service cost | | $ | 1.0 |
|
| Interest cost | | 1.3 |
|
| Expected return on plan assets | | (1.4 | ) |
| Recognition due to curtailment | | (6.1 | ) |
| Net periodic benefit cost | | $ | (5.2 | ) |
Net periodic benefit costs are included as part of general and administrative expenses in the accompanying condensed consolidated statements of income.
Our contributions to these pension plans during the three months ended September 30, 2017 were $5.3 million, and we expect to contribute $0.7 million to these pension plans during the remainder of 2017.
Our overall expected long-term rate of return on assets, effective with the Delek/Alon merger, is 7.45%.
Also, effective with the Delek/Alon Merger, our 401(k) savings plans are available to eligible Alon employees, for which contributions are matched up at varying levels ranging from 4.5% to 8% of eligible compensation.
Postretirement Medical Plan
In addition to providing pension benefits, Alon has an unfunded postretirement medical plan covering certain health care and life insurance benefits for certain employees of Alon, that retired prior to January 2, 2017, who met eligibility requirements in the plan documents. This plan is closed to new participants. The health care benefits in excess of certain limits are insured.
19.21 - Subsequent Events
Planned Acquisition of Non-controlling Interest in Alon Partnership
On November 8, 2017, Delek and the Alon Partnership entered into a definitive merger agreement under which Delek will acquire all of the outstanding limited partner units which Delek does not already own in an all-equity transaction. Delek currently owns approximately 51.0 million limited partner units of the Alon Partnership, or approximately 81.6% of the outstanding units. Under terms of the merger agreement, the owners of the remaining outstanding units in the Alon Partnership that Delek does not currently own will receive a fixed exchange ratio of 0.49 Delek shares for each limited partner unit of the Alon Partnership. This transaction was approved by all voting members of the board of directors of the general partner of the Alon Partnership upon the recommendation from its conflicts committee and by the board of directors of Delek. This transaction is expected to close in the first quarter of 2018.
Dividend Declaration
On November 7, 2017,April 30, 2019, our Board of Directors voted to declare a quarterly cash dividend of $0.15$0.28 per share of our common stock, payable on December 15, 2017June 3, 2019 to shareholders of record on November 22, 2017.May 20, 2019.
Management's Discussion and Analysis
ITEM 2.MANAGEMENT’S DISCUSSION AND ANALYSIS OF FINANCIAL CONDITION AND RESULTS OF OPERATIONS
Management’s Discussion and Analysis of Financial Condition and Results of Operations ("MD&A") is management’s analysis of our financial performance and of significant trends that may affect our future performance. The MD&A should be read in conjunction with our condensed consolidated financial statements and related notes included elsewhere in this Quarterly Report on Form 10-Q and in the Annual Report on Form 10-K filed with the Securities and Exchange Commission ("SEC") on February 28, 2017March 1, 2019 (the "Annual Report on Form 10-K"). Those statements in the MD&A that are not historical in nature should be deemed forward-looking statements that are inherently uncertain.
In January 2017, we announced that Delek US Holdings, Inc. ("Old Delek") (and various related entities) had entered into an Agreement and Plan of Merger with Alon USA Energy, Inc. (NYSE: ALJ) ("Alon"), as subsequently amended on February 27 and April 21, 2017 (as so amended, the "Merger Agreement"). The related Mergermerger (the "Merger" or the "Delek/Alon Merger") was effective July 1, 2017 (the “Effective Time”), resulting in a new post-combination consolidated registrant renamed as Delek US Holdings, Inc. (“New Delek”), with Alon and the previousOld Delek US Holdings, Inc. (“Old Delek”) surviving as wholly-owned subsidiaries. New Delek is the successor issuer to Old Delek and Alon USA pursuant to Rule 12g-3(c) under the Securities Exchange Act of 1934, as amended (the "Exchange Act"), as amended. In addition, as a result of the Delek/Alon Merger, the shares of common stock of Old Delek and Alon were delisted from the New York Stock Exchange in July 2017, and their respective reporting obligations under the Exchange Act were terminated. Concurrently, the shares of common stock of New Delek began trading under Old Delek's former ticker symbol, "DK." Prior to July 1, 2017, Old Delek owned a non-controlling equity interest of approximately 47% of the outstanding shares (the "ALJ Shares") in Alon. Alon is a refiner and marketer of petroleum products, operating primarily in the south central, southwestern and western regions of the United States. Alon owns 100% of the general partner and 81.6% of the limited partner interests in Alon USA Partners, LP (NYSE: ALDW), which owns a crude oil refinery in Big Spring, Texas with a crude oil throughput capacity of 73,000 bpd and an integrated wholesale marketing business. In addition, Alon directly owns a crude oil refinery in Krotz Springs, Louisiana with a crude oil throughput capacity of 74,000 bpd. Alon also owns crude oil refineries in California, which have not processed crude oil since 2012. Alon is a marketer of asphalt, which it distributes through asphalt terminals located predominantly in the southwestern and western United States. Alon is the largest 7-Eleven licensee in the United States and operates approximately 300 convenience stores which market motor fuels primarily in central and west Texas and New Mexico..
Unless otherwise noted or the context requires otherwise, the terms "we," "our," "us," "Delek" and the "Company" are used in this report to refer to Old Delek and its consolidated subsidiaries for the periods prior to July 1,2017,1, 2017, and New Delek and its consolidated subsidiaries for the periods on or after July 1, 2017.2017 - see Note 1 of the condensed consolidated financial statements in Item 1, Financial Statements, for additional information.
You should read the following discussion of our financial condition and results of operations in conjunction with our historical condensed consolidated financial statements and notes thereto.
Forward-Looking Statements
This Quarterly Report on Form 10-Q contains "forward-looking statements" within the meaning of Section 27A of the Securities Act of 1933, as amended, and Section 21E of the Securities Exchange Act of 1934, as amended (the "Exchange Act"). These forward-looking statements reflect our current estimates, expectations and projections about our future results, performance, prospects and opportunities. Forward-looking statements include, among other things, the information concerning our possible future results of operations, business and growth strategies, financing plans, expectations that regulatory developments or other matters will or will not have a material adverse effect on our business or financial condition, our competitive position and the effects of competition, the projected growth of the industry in which we operate, and the benefits and synergies to be obtained from our completed and any future acquisitions, statements of management’s goals and objectives, and other similar expressions concerning matters that are not historical facts. Words such as "may," "will," "should," "could," "would," "predicts," "potential," "continue," "expects," "anticipates," "future," "intends," "plans," "believes," "estimates," "appears," "projects" and similar expressions, as well as statements in future tense, identify forward-looking statements.
Forward-looking statements should not be read as a guarantee of future performance or results, and will not necessarily be accurate indications of the times at, or by, which such performance or results will be achieved. Forward-looking information is based on information available at the time and/or management’s good faith belief with respect to future events, and is subject to risks and uncertainties that could cause actual performance or results to differ materially from those expressed in the statements. Important factors that, individually or in the aggregate, could cause such differences include, but are not limited to:
volatility in our refining margins or fuel gross profit as a result of changes in the prices of crude oil, other feedstocks and refined petroleum products;
risk factors relating to the Delek/Alon Merger, including but not limited to risks surrounding the combining of operations, financial position and cash flows as well as systems, processes and controls going forward, as further discussed in Part II, Item 1A, "Risk Factors";
our ability to execute our strategy of growth through acquisitions and the transactional risks inherent in such acquisitions;
acquired assets may suffer a diminishment in fair value, which may require us to record a write-down or impairment;
liabilities related to, and the effects of, the sale of the Retail Entities (as defined below);
reliability of our operating assets;
competition;actions of our competitors and customers;
changes in, or the failure to comply with, the extensive government regulations applicable to our industry segments;
diminutionour ability to execute our strategy of growth through acquisitions and capital projects and changes in the expected value of and benefits derived therefrom, including any ability to successfully integrate acquisitions, realize expected synergies or achieve operational efficiency and effectiveness;
diminishment in value of long-lived assets may result in an impairment in the carrying value of the assets on our balance sheet and a resultant loss recognized in the statement of operations;
general economic and business conditions affecting the southern, southwestern and western United States;States, particularly levels of spending related to travel and tourism;
volatility under our derivative instruments;
deterioration of creditworthiness or overall financial condition of a material counterparty (or counterparties);
Management's Discussion and Analysis
unanticipated increases in cost or scope of, or significant delays in the completion of, our capital improvement and periodic turnaround projects;
risks and uncertainties with respect to the quantities and costs of refined petroleum products supplied to our pipelines and/or held in our terminals;
operating hazards, natural disasters, casualty losses and other matters beyond our control;
increases in our debt levels or costs;
changes in our ability to continue to access the credit markets;
compliance, or failure to comply, with restrictive and financial covenants in our various debt agreements;
the inability of our subsidiaries to freely make dividends, loans or other cash distributions to us;
seasonality;
acts of terrorism (including cyber-terrorism) aimed at either our facilities or other facilities that could impair our ability to produce or transport refined products or receive feedstocks;
disruption, failure, or cybersecurity breaches affecting or targeting our IT systems and controls, our infrastructure, or the infrastructure of our cloud-based IT service providers;
changes in the cost or availability of transportation for feedstocks and refined products; and
other factors discussed under the headings "Management’s Discussion and Analysis of Financial Condition and Results of Operations" and "Risk Factors" and in our other filings with the SEC.
In light of these risks, uncertainties and assumptions, our actual results of operations and execution of our business strategy could differ materially from those expressed in, or implied by, the forward-looking statements, and you should not place undue reliance upon them. In addition, past financial and/or operating performance is not necessarily a reliable indicator of future performance, and you should not use our historical performance to anticipate future results or period trends. We can give no assurances that any of the events anticipated by any forward-looking statements will occur or, if any of them do, what impact they will have on our results of operations and financial condition.
Forward-lookingAll forward-looking statements speak only as ofincluded in this report are based on information available to us on the date the statements are made.of this report. We assumeundertake no obligation to revise or update any forward-looking statements to reflect actual results, changes in assumptionsas a result of new information, future events or changes in other factors affecting forward-looking information except to the extent required by applicable securities laws. If we do update one or more forward-looking statements, no inference should be drawn that we will make additional updates with respect thereto or with respect to other forward-looking statements.otherwise.
Management's Discussion and Analysis
Executive Summary and Strategic Overview
Business Overview
We are an integrated downstream energy business focused on petroleum refining, the transportation, storage and wholesale distribution of crude oil, intermediate and refined products and convenience store retailing. Prior to August 2016, we aggregated our operating units into three reportable segments: refining, logistics and retail. However, in August 2016, we entered into a definitive equity purchase agreement to sell 100% of the equity interests in Delek's wholly-owned subsidiaries MAPCO Express, Inc., MAPCO Fleet, Inc., Delek Transportation, LLC, NTI Investments, LLC and GDK Bearpaw, LLC (collectively, the “Retail Entities”), the assets of which comprised our retail segment at that time (the “Retail Transaction”). The Retail Transaction closed in November 2016.
Effective with the Delek/Alon Merger July 1, 2017, Delek's retail segment now includes the operations of Alon's approximately 300 owned and leased convenience store sites located primarily in Central and West Texas and New Mexico. These convenience stores typically offer various grades of gasoline and diesel under the Alon brand name and food products, food service, tobacco products, non-alcoholic and alcoholic beverages, general merchandise as well as money orders to the public, primarily under the 7-Eleven and Alon brand names. Substantially all of the motor fuel soldwe acquired through our retail segment is supplied by our Big Spring refinery, which is transferred to the retail segment at prices substantially determined by reference to published commodity pricing information.
Our corporate activities, results of certain immaterial operating segments (including our asphalt terminal operations effective with the Delek/Alon Merger), our non-controlling equity interest of approximately 47% of the outstanding shares in Alon (which was accounted for as an equity method investment) prior to the Delek/Alon Merger and intercompany eliminations are reported in the corporate, other and eliminations segment. Decisions concerning the allocation of resources and assessment of operating performance are made based on this segmentation. Management measures the operating performance of each of the reportable segments based on the segment contribution margin.
In regards to the aforementioned asphalt operations, we own or operate 10 asphalt terminals located in Texas (Big Spring), Washington (Richmond Beach), California (Paramount, Long Beach, Elk Grove, Bakersfield and Mojave), Arizona (Phoenix) as well as asphalt terminals in which we own a 50% interest located in Fernley, Nevada, and Brownwood, Texas. The operations in which we have a 50% interest are recorded under the equity method of accounting. We purchase non-blended asphalt from third parties in addition to non-blended asphalt produced at the Big Spring refinery. We market asphalt through our terminals as blended and non-blended asphalt. Sales of asphalt are seasonal with the majority of sales occurring between May and October.
Prior to the Delek/Alon Merger the operations and net assets of Alon. The Delek/Alon Merger continues to have a significant impact on our revenue and profitability as well as earnings per share, our net asset position, our purchasing position in the marketplace, our footprint in the refining industry, especially in the Gulf Coast Region/Permian Basin, and our ability to go to market and secure financing, and we continue to realize synergies from our combined operations.
The refining segment operated refineries in Tyler, Texas (the "Tyler refinery")processes crude oil and El Dorado, Arkansas (the "El Dorado refinery") withother feedstocks for the manufacture of transportation motor fuels, including various grades of gasoline, diesel fuel and aviation fuel, asphalt and other petroleum-based products that are distributed through owned and third-party product terminals. The refining segment has a combined design crude throughput (nameplate)nameplate capacity of 155,000 barrels per day ("bpd"),302,000 bpd, including the 75,000 bpd Tyler, Texas refinery and(the "Tyler refinery"), the 80,000 bpd El Dorado, refinery. OurArkansas refinery (the "El Dorado refinery"), the 73,000 bpd Big Spring, Texas refinery (the "Big Spring refinery"), and the 74,000 bpd Krotz Springs, Louisiana refinery (the "Krotz Springs refinery"), as well as a non-operating refinery located in Bakersfield, California. The refining segment also includedowns and operates two biodiesel facilities we own and operate that are engagedinvolved in the production of biodiesel fuels and related activities, located in Crossett, Arkansas and Cleburn, Texas. Effective with the Delek/Alon Merger, ourThe refining segment now also includes a crude oil refinery located in Big Spring, Texas with a nameplate capacity of 73,000 bpd, a crude oil refinery located in Krotz Springs, Louisiana with a nameplate capacity of 74,000 bpd, and a heavy crude oil refinery located in Bakersfield, California. The Bakersfield, California refinery has not processed crude oil since 2012 due to the high cost of crude oil relative to product yield and low asphalt demand.
Our corporate, other and eliminations categorysegment's petroleum-based products are marketed primarily in the segment footnote tables in Note 14 of the consolidated financial statements in Item 1, Financial Statements, subsequent to the Delek/Alon Merger, includes the operations of the Paramount, Californiasouth central, southwestern and Long Beach, California heavy crude oil refineries, which have not processed crude oil since 2012, and a renewable fuels facility located at the Paramount, California refinery (in which we own a majority ownership interest), which has a throughput capacity of 3,000 bpd and converts tallow and vegetable oils into renewable fuels. The produced renewable fuels are drop-in replacements for petroleum-based fuels. The renewable fuels facility generates both state and federal environmental credits as well as the federal blender’s tax credit, when effective. As a result of Delek management's committing to a plan to sell 100% of our equity interests in (or substantially all of the assets of) our subsidiaries associated with the operations of our Paramount and Long Beach, California refineries and our California renewable fuels facility, which were acquired as part of the Delek/Alon Merger (collectively, the "California Discontinued Entities"), we met the requirements under Accounting Standards Codification ("ASC") 205-20, Presentation of Financial Statements - Discontinued Operations ("ASC 205-20") and ASC 360, Property, Plant and Equipment ("ASC 360") to report the results of those operations as discontinued operations and to classify the applicable assets of the California Discontinued Entities as a group of assets held for sale.
We own the Big Spring refinery and its integrated wholesale marketing operations through Alon USA Partners, LP (the "Alon Partnership"). Our marketing of transportation fuels produced at the Big Spring refinery is focused on Central and West Texas, Oklahoma, New Mexico and Arizona. We provide substantially all of our branded customers motor fuels, brand support and payment processing services in addition to the license of the Alon brand name and associated trade dress. We market transportation fuel production from our Krotz Springs refinery substantially through bulk sales and exchange channels. These bulk sales and exchange arrangements are entered into with various oil companies and trading companies and are transported to markets on the Mississippi River and the Atchafalaya River, as well as to the Colonial Pipeline.
Our logistics segment gathers, transports and stores crude oil and markets, distributes, transports and stores refined products in selectwestern regions of the southeastern United States, and west Texas for ourthe refining segment also ships and third parties.
At September 30, 2017, we own a 61.5% limited partner interest in Delek Logistics Partners, LP ("Delek Logistics") and a 94.6% interestsells gasoline into wholesale markets in the entity that ownssouthern and eastern United States. Motor fuels are sold under the entire 2.0% general partner interest inAlon or Delek Logistics and all of the incentivebrand through various terminals to supply Alon or Delek branded retail sites. In addition, we sell motor fuels through our wholesale distribution rights. Delek Logistics was formed by Delek in 2012 to own, operate, acquire and construct crude oil and refined products logistics and marketing assets. Delek Logistics' initial assets were contributed by us and included certain assets formerly owned or used by certain of our subsidiaries. A substantial majority of Delek Logistics' assets are currently integral to our refining and marketing operations.network on an unbranded basis.
Our profitability in the refining segment is substantially determined by the difference between the cost of the crude oil feedstocks we purchase and the price of the refined products we sell, referred to as the "crack spread", "refining margin" or "refined product margin."margin". Refining margin is used as a metric to assess a refinery's product margins against market crack spread trends, where "crack spread" is a measure of the difference between market prices for crude oil and refined products and is a commonly used proxy within the industry to estimate or identify trends in refining margins. The cost
to acquire feedstocks and the price of the refined petroleum products we ultimately sell from our refineries depend on numerous factors beyond our control, including the supply of, and demand for, crude oil, gasoline and other refined petroleum products which, in turn, depend on, among other factors, changes in domestic and foreign economies, weather conditions such as hurricanes or tornadoes, local, domestic and foreign political affairs, global conflict, production levels, the availability of imports, the marketing of competitive fuels and government regulation. Other significant factors that influence our results in the refining segment include operating costs (particularly the cost of natural gas used for fuel and the cost of electricity), seasonal factors, refinery utilization rates and planned or unplanned maintenance activities or turnarounds. Demand for gasoline and asphalt products is generally higher during the summer months than during the winter months due to seasonal increases in motor vehicle traffic and road and home construction. Varying vapor pressure requirements between the summer and winter months also tighten summer gasoline supply. As a result, our operating results are generally lower for the first and fourth quarters of the calendar year. Moreover, while the fluctuations in the cost of crude oil are typically reflected in the prices of light refined products, such as gasoline and diesel fuel, the price of other residual products, such as asphalt, coke, carbon black oil and liquefied petroleum gas ("LPG"), are less likely to move in parallel with crude cost. This could cause additional pressure on our realized margin during periods of rising or falling crude oil prices. Additionally, our margins are impacted by the pricing differentials of the various types and sources of crude oil we use at our refineries and their relation to product pricing, such as the differentials between Midland West Texas Intermediate crude oil ("WTI") Midland and WTI Cushing or WTI CushingMidland and Brent crude oil.
With respect to measuring our refining margins at our refineries, we consider the following:
For our Tyler refinery, we compare our per barrel refined product margin to a well established industry metric: the U.S. GulfU.S.Gulf Coast ("Gulf Coast") 5-3-2 crack spread. The Gulf Coast 5-3-2 crack spread is used as a benchmark for measuring a refinery's product margins by measuring the difference between the market price of light products and crude oil. Itoil, and represents the approximate grossrefining margin resulting from processing one barrel of crude oil into three-fifths of a barrel of gasoline and two-fifths of a barrel of high-sulfur diesel. We calculate the Gulf Coast 5-3-2 crack spread using the market value of U.S. Gulf Coast Pipeline CBOB and U.S. Gulf Coast Pipeline No. 2 Heating Oil (high sulfur diesel) and the first month futures price of WTI on the New York Mercantile Exchange ("NYMEX"). U.S. Gulf Coast CBOB is a grade of gasoline commonly blended with biofuels and marketed as Regular Unleaded at retail locations. U.S. Gulf Coast Pipeline No. 2 Heating Oil is a petroleum distillate that can be used as either a diesel fuel or a fuel oil. This is the standard by which other distillate products (such as ultra low sulfur diesel) are priced. The NYMEX is a commodities trading exchange where contracts for the future delivery of petroleum products are bought and sold.
The crude oil and product slate flexibility of the El Dorado refinery allows us to take advantage of changes in the crude oil and product markets; therefore, we anticipate that the quantities and varieties of crude oil processed and products manufactured at the El Dorado refinery will continue to vary. Thus, we do not believe that it is possible to develop a reasonable refined product margin benchmark that would accurately portray our refined product margins at the El Dorado refinery.
For our Big Spring refinery, we compare our per barrel refined product margin to the Gulf Coast 3-2-1 crack spread. The Gulf Coast 3-2-1 crack spread is calculated assuming that three barrelsone barrel of WTI Cushing crude oil are converted or cracked, into two barrelstwo-thirds barrel of Gulf Coast conventional gasoline and oneone-third barrel of Gulf Coast ultra-low sulfur diesel. Our Big Spring refinery is capable of processing substantial volumes of sour crude oil, which has historically cost less than intermediate, and/or substantial volumes of sweet crude oils, based on price differentials. We measure the cost advantage of refining sour crude oil by calculating the difference between the price of WTI Cushing crude oil and the price of West Texas Sour ("WTS"), a medium, sour crude oil. We refer to this differential astherefore the WTI Cushing/WTS or sweet/sour, spread. A widening of the sweet/sour spread can favorably influence the operating marginprice differential, taking into account differences in production yield, is an important measure for our Big Spring refinery. The Big Spring refinery’s crude oil input is primarily comprised of WTI and WTS Midland. In addition, the location of the Big Spring refinery near Midland, the largest origination terminal for West Texas crude oil, provides reliable crude sourcing with a relatively low transportation cost. Additionally, we have the ability to source locally produced crude at Big Spring by pipeline and truck, which enableshelping us to better control quality and eliminate the cost of transporting our crude supply from Midland. The WTI Cushing less WTI Midland spread represents the differential between the average per barrel price of WTI Cushing crude oil and the average per barrel price of WTI Midland crude oil.make strategic, market-respondent production decisions.
For our Krotz Springs refinery, we compare our per barrel refined product margin to the Gulf Coast 2-1-1 high sulfur diesel crack spread. A Gulf Coast 2-1-1 high sulfur diesel crack spread which is calculated assuming that two barrelsone barrel of Light Louisiana Sweet (“LLS”) crude oil areis converted into oneone-half barrel of Gulf Coast conventional gasoline and oneone-half barrel of Gulf Coast high sulfur diesel. The Krotz Springs refinery has the capability to process substantial volumes of low-sulfur, orlight sweet, crude oils to produce a high percentage of refined light products. Sweet crude oil typically comprises 100% of the Krotz Springs refinery’s crude oil input. The Krotz Springs refinery’s crude oil input is primarily comprised of LLS
Management's Discussion and WTI Midland.Analysis
| |
| • | The crude oil and product slate flexibility of the El Dorado refinery allows us to take advantage of changes in the crude oil and product markets; therefore, we anticipate that the quantities and varieties of crude oil processed and products manufactured at the El Dorado refinery by processing a variety of feedstocks into a number of refined product types will continue to vary. While there is variability in the crude slate and the product output at the El Dorado refinery, we compare our per barrel refined product margin to the Gulf Coast 5-3-2 crack spread because we believe it to be the most closely aligned benchmark. |
A widening of the WTI Cushing less WTI Midland spread will favorably influence the operating margin for our refineries. Alternatively, a narrowing of this differential will have an adverse effect on our operating margins. Global product prices are influenced by the price of Brent crude which is a global benchmark crude. Global product prices influence product prices in the U.S. As a result, our refineries are influenced by the spread between Brent crude and WTI Cushing.Midland. The Brent less WTI CushingMidland spread represents the differential between the average per barrel price of Brent crude oil and the average per barrel price of WTI CushingMidland crude oil. A widening of the spread between Brent and WTI CushingMidland will favorably influence our refineries' operating margins. Also, the Krotz Springs refinery is influenced by the spread between Brent crude and LLS. The Brent less LLS spread represents the differential between the average per barrel price of Brent crude oil and the average per barrel price of LLS crude oil. A discount in LLS relative to Brent will favorably influence the Krotz Springs refinery operating margin.
Our logistics segment gathers, transports and stores crude oil and markets, distributes, transports and stores refined products in select regions of the southeastern United States and west Texas for our refining segment and third parties. It is comprised of the consolidated balance sheet and results of operations of Delek Logistics Partners, LP ("Delek Logistics", NYSE:DKL), where we owned a 61.4% limited partner interest (at March 31, 2019) in Delek Logistics and a 94.6% interest in the entity that owns the entire 2.0% general partner interest in Delek Logistics and all of the incentive distribution rights. Delek Logistics was formed by Delek in 2012 to own, operate, acquire and construct crude oil and refined products logistics and marketing assets. A substantial majority of Delek Logistics' assets are currently integral to our refining and marketing operations. The logistics segment's pipelines and transportation business owns or leases capacity on approximately 400 miles of crude oil transportation pipelines, approximately 450 miles of refined product pipelines, an approximately 600-mile crude oil gathering system and associated crude oil storage tanks with an aggregate of approximately 9.6 million barrels of active shell capacity. Our logistics segment owns and operates nine light product terminals and markets light products using third-party terminals.
Our retail segment at March 31, 2019 includes the operations of 281 owned and leased convenience store sites located primarily in central and west Texas and New Mexico which were acquired in connection with the Delek/Alon Merger. Our convenience stores typically offer various grades of gasoline and diesel under the Delek or Alon brand name and food products, food service, tobacco products, non-alcoholic and alcoholic beverages, general merchandise as well as money orders to the public, primarily under the 7-Eleven and Delek or Alon brand names pursuant to a license agreement with 7-Eleven, Inc. which gives us a perpetual license to use the 7-Eleven trademark, service name and trade name in west Texas and a majority of the counties in New Mexico in connection with our retail store operations. In November 2018, we terminated the license agreement with 7-Eleven, Inc. and the terms of such termination require the removal of all 7-Eleven branding on a store-by-store basis by the earlier of December 31, 2021 or the date upon which our last 7-Eleven store is de-identified or closed. Merchandise sales at our convenience store sites will continue to be sold under the 7-Eleven brand name until 7-Eleven branding is removed pursuant to the termination. Substantially all of the motor fuel sold through our retail segment is supplied by our Big Spring refinery, which is transferred to the retail segment at prices substantially determined by reference to published commodity pricing information.
The cost to acquire the refined fuel products we sell to our wholesale customers in our logistics segment and at our convenience stores in our retail segment depends on numerous factors beyond our control, including the supply of, and demand for, crude oil, gasoline and other refined petroleum products which, in turn, depend on, among other factors, changes in domestic and foreign economies, weather conditions,
domestic and foreign political affairs, production levels, the availability of imports, the marketing of competitive fuels and government regulation. Our retail merchandise sales are driven by convenience, customer service, competitive pricing and branding. Motor fuel margin is sales less the delivered cost of fuel and motor fuel taxes, measured on a cents per gallon basis. Our motor fuel margins are impacted by local supply, demand, weather, competitor pricing and product brand.
Our corporate activities, results of certain immaterial operating segments (including Alon's asphalt terminal operations effective with the Delek/Alon Merger), results and assets of discontinued operations and intercompany eliminations are reported in the corporate, other and eliminations segment.
As part of our overall business strategy, we regularly evaluate opportunities to expand our portfolio of businesses and may at any time be discussing or negotiating a transaction that, if consummated, could have a material effect on our business, financial condition, liquidity or results of operations.
Recent
Management's Discussion and Analysis
2019 Developments
Delek/Alon MergerTransactions designed to maximize shareholder return
In January 2017, we announced that Old Delek (and various related entities) entered into a Merger Agreement with Alon, as subsequently amended on February 27 and April 21, 2017. The related mergers (the "Mergers" or the "Delek/Alon Merger") were effective July 1, 2017 (as previously defined, the “Effective Time”), resulting in a new post-combination consolidated registrant renamed as Delek US Holdings, Inc. (as previously defined, “New Delek”), with Alon and Old Delek surviving as wholly-owned subsidiaries of New Delek. New Delek is the successor issuer to Old Delek and Alon pursuant to Rule 12g-3(c) under the Exchange Act, as amended. In addition, as a result of the Delek/Alon Merger, the shares of common stock of Old Delek and Alon were delisted from the New York Stock Exchange in July 2017, and their respective reporting obligations under the Exchange Act were terminated. The Mergers resulted in total stock consideration paid of approximately $509.0 million consisting of approximately 19.3 million incremental shares of New Delek Common Stock.
Subject to the terms and conditions of the Merger Agreement, at the Effective Time, each issued and outstanding share of Alon Common Stock, other than shares owned by Old Delek and its subsidiaries or held in the treasury of Alon, was converted into the right to receive 0.504 of a share of New Delek Common Stock, or, in the case of fractional shares of New Delek Common Stock, cash (without interest) in an amount equal to the product of (i) such fractional part of a share of New Delek Common Stock multiplied by (ii) $25.96 per share, which was the volume weighted average price of the Old Delek Common Stock, par value $0.01 per share as reported on the NYSE Composite Transactions Reporting System for the twenty consecutive NYSE full trading days ending on June 30, 2017. Each outstanding share of restricted Alon Common Stock was assumed by New Delek and converted into restricted stock denominated in shares of New Delek Common Stock. Committed but unissued share-based awards were exchanged and converted into rights to receive share-based awards indexed to New Delek Common Stock. Conversions of restricted shares and unissued share-based awards were also subject to the exchange ratio.
In addition, subject to the terms and conditions of the Merger Agreement, each share of Old Delek Common Stock or fraction thereof issued and outstanding immediately prior to the Effective Time (other than Old Delek Common Stock held in the treasury of Old Delek) was converted at the Effective Time into the right to receive one validly issued, fully paid and non‑assessable share of New Delek Common Stock or such fraction thereof equal to the fractional share of New Delek Common Stock. All existing Old Delek stock options, restricted stock awards and stock appreciation rights were converted into equivalent rights with respect to New Delek Common Stock.
In connection with the Mergers, Alon, New Delek and U.S. Bank National Association, as trustee (the “Trustee”) entered into a First Supplemental Indenture (the “Supplemental Indenture”), effective as of July 1, 2017, supplementing the Indenture, dated as of September 16, 2013 (the “Indenture”), pursuant to which Alon issued its 3.00% Convertible Senior Notes due 2018 (the “Notes”), which were convertible into shares of Alon’s Common Stock, par value $0.01 per share or cash or a combination of cash and Alon Common Stock, all as provided in the Indenture. The Supplemental Indenture provides that, as of the Effective Time, the right to convert each $1,000 principal amount of the Notes based on a number of shares of Alon Common Stock equal to the Conversion Rate (as defined in the Indenture) in effect immediately prior to the Mergers was changed into a right to convert each $1,000 principal amount of Notes into or based on a number of shares of New Delek Common Stock (at the exchange ratio of 0.504), par value $0.01 per share, equal to the Conversion Rate in effect immediately prior to the Mergers. In addition, the Supplemental Indenture provides that, as of the Effective Time, New Delek fully and unconditionally guaranteed, on a senior basis, Alon’s obligations under the Notes.
The primary purpose of the Mergers was to enter into a strategic combination that has resulted in a larger, more diverse company that we believe is well positioned to take advantage of opportunities in the market and better navigate the cyclical nature of the business. The combination is also expected to provide opportunities for synergies across the organization as well as create a refining system that enhances its position as a significant buyer of crude from the Permian Basin among the independent refiners.
California Discontinued Entities
During the third quarter 2017, we committed to a plan to sell 100% of our equity interests in (or substantially all of the assets of) Delek's subsidiaries associated with our Paramount and Long Beach, California refineries and our California renewable fuels facility, which were acquired as part of the Delek/Alon Merger (collectively, the "California Discontinued Entities"). As a result of this decision and commitment to a plan, and because it was made within three months of the Delek/Alon Merger, we met the requirements under ASC 205-20 and ASC 360 to report
the results of the California Discontinued Entities as discontinued operations and to classify the California Discontinued Entities as a group of assets held for sale. The sale of the California Discontinued Entities is currently anticipated to occur within the next 12 months. The property, plant and equipment of the California Discontinued Entities were recorded at fair value as part of the Delek/Alon Merger, and we did not record any depreciation of these assets since the Delek/Alon Merger.
Planned Acquisition of Non-controlling Interest in Alon PartnershipDividend Declaration
On November 8, 2017, Delek and the Alon Partnership entered into a definitive merger agreement under which Delek will acquire all of the outstanding limited partner units which Delek does not already own in an all-equity transaction. Delek currently owns approximately 51.0 million limited partner units of the Alon Partnership, or approximately 81.6% of the outstanding units. Under terms of the merger agreement, the owners of the remaining outstanding units in the Alon Partnership that Delek does not currently own will receive a fixed exchange ratio of 0.49 Delek shares for each limited partner unit of the Alon Partnership. This transaction was approved by all voting members of the board of directors of the general partner of the Alon Partnership upon the recommendation from its conflicts committee and by the board of directors of Delek. This transaction is expected to close in the first quarter of 2018.
El Dorado Refinery RIN Waiver
In March 2017, the El Dorado refinery received approval from the Environmental Protection Agency for a small refinery exemption from the requirements of the renewable fuel standard for the 2016 calendar year. This waiver resulted in approximately $47.5 million of Renewable Identification Number ("RIN") expense reduction during the nine months ended SeptemberApril 30, 2017, based on an aggregated average price of $0.45 per RIN.
Return to Shareholders
Dividends
On September 13, 2017, we paid a regular quarterly dividend of $0.15 per share of our common stock, declared on August 1, 2017 to shareholders of record on August 23, 2017. On November 7, 2017, our2019, Delek's Board of Directors voted to declare a quarterly cash dividend of $0.15$0.28 per share, of our common stock, payable on December 15, 2017June 3, 2019, to shareholdersstockholders of record on November 22, 2017.May 20, 2019. Our previous quarterly cash dividend amounts ranged between $0.20 to $0.26 per share throughout 2018, and was $0.27 for the first quarter of 2019.
Share Repurchase ProgramRepurchases
In December 2016, our BoardDuring the quarter ended March 31, 2019, Delek repurchased 1,291,644 shares for an aggregate purchase price of Directors authorized a$46.2 million under the most recent share repurchase programplan which provided for repurchases up to $150.0$500.0 million and was approved by the board on November 6, 2018. As of Delek common stock. Any shareMarch 31, 2019, there remained $363.6 million available for repurchases under the most recent repurchase program mayplan.
Transactions designed to maximize return on assets
Alkylation Project Completed
The alkylation unit at the Krotz Springs refinery was completed in early April providing additional flexibility to the refinery. The total cost was approximately $138.0 million. This unit should improve the ability to convert low value products into gasoline, enable the refinery to produce multiple summer gasoline grades and increase octane, allowing the refinery to produce premium gasoline. Because of the conversion improvement at the refinery from this project, its returns are expected to be implemented through open market transactions orless dependent on the crack spread environment over time.
Investment in privately negotiated transactions,Pipeline Joint Venture
In September 2018, Delek announced plans for a joint venture with Energy Transfer, Magellan, and MPLX to construct a 600-mile common carrier pipeline to transport crude oil from the Permian Basin to the Texas Gulf Coast region (the "Proposed PGC Partnership"). During the first quarter, we elected not to move forward with the Proposed PGC Partnership which allows us to explore other options to participate in accordancea long haul crude oil pipeline.
Transactions designed to minimize the cost of capital/manage financial risk exposures
2019 Amendments to Supply and Offtake Agreements
During January 2019, we amended the El Dorado refinery and the Krotz Springs refinery Supply and Offtake Agreements with applicable securities laws. The timing,J. Aron & Company ("J. Aron") so that the repurchase of baseline volumes at the end of the Supply and Offtake Agreement term (representing the "Baseline Step-Out Liabilities") will be based upon a fixed price instead of a market-indexed price and sizetherefore subject to changes in fair value that reflect changes in interest rate risk rather than commodity price risk. The modified arrangement results in a Baseline Step-Out Liability that is no longer subject to commodity volatility, but for which its fair value is subject to interest rate risk. As a result, we recorded a gain on the change in fair value resulting from the modification of repurchases will be made at the discretioninstruments from commodities-based risk to interest rate risk in cost of management and will depend on prevailing market prices, general economic and market conditionsmaterials and other considerations. The repurchase program does not obligate usin the first quarter of 2019. Such Baseline Step-Out Liabilities will continue to acquire any particular amountbe recorded at fair value, where the fair value will reflect changes in interest rate risk rather than commodity price risk. See further discussion in Note 9 of stockour condensed consolidated financial statements included in Item 1, Financial Statements, of this Quarterly Report on Form 10-Q.
Management's Discussion and does not expire. There were no shares repurchased during the three and six months ended September 30, 2017.Analysis
Market Trends
Our results of operations are significantly affected by fluctuations in the prices of certain commodities, including, but not limited to, crude oil, gasoline, distillate fuel, biofuels, and natural gas and electricity, among others.electricity. Historically, our profitability has been affected by commodity price volatility, specifically as it relates to the price of crude oil and refined products.
The table below reflects the quarterly high, low and average prices of WTI Midland crude oil for each of the quarterly periods in 2018 and the three months ended March 31, 2019.
Management's Discussion and Analysis
The table below reflects the quarterly high, low and average prices of WTI Cushing crude oil for each of the quarterly periods in 20162018 and the ninethree months ended September 30, 2017.March 31, 2019.
The table below reflects the quarterly high, low and average Gulf Coast 5-3-2 crack spread (Tyler benchmark) for each of the quarterly periods in 20162018 and the ninethree months ended September 30, 2017. The average Gulf Coast 5-3-2 crack spread increased to $12.46 during the first nine months of 2017 from $9.15 during the first nine months of 2016.March 31, 2019.
Management's Discussion and Analysis
The table below reflects the quarterly high, low and average Gulf Coast 3-2-1 crack spread (Big Spring benchmark) for each of the quarterly periods in 2018 and the three months ended September 30, 2017, the period since the Delek/Alon Merger.March 31, 2019.
The table below reflects the quarterly high, low and average Gulf Coast 2-1-1 crack spread (Krotz Springs benchmark) for each of the quarterly periods in 2018 and the three months ended September 30, 2017, the period since the Delek/Alon Merger.March 31, 2019.
Management's Discussion and Analysis
The market price of refined products contributed to the increase in the average Gulf Coast 5-3-2 crack spread into $13.02 during the ninefirst three months ended September 30, 2017,of 2019 from $11.53 during the first three months of 2018, with the U.S. Gulf Coast price of gasoline increasing 20.6%(CBOB) decreasing 14.3%, from an average of $1.26$1.77 per gallon in the first ninethree months of 20162018 to $1.52 per gallon in the first ninethree months of 20172019 and the U.S. Gulf Coast price of High Sulfur Diesel increased 25.0%decreased 1.1%, from an average of $1.12$1.77 per gallon in the first ninethree months of 20162018 to $1.40$1.75 per gallon in the first ninethree months of 2017.2019. The charts below illustrate the quarterly high, low and average priceprices of Gulf Coast Gasoline, U.S. Gulf Coast Gasoline and U.S. High Sulfur Diesel and Ultra Low Sulfur Diesel ("ULSD") for each of the quarterly periods in 20162018 and the ninethree months ended September 30, 2017.March 31, 2019.
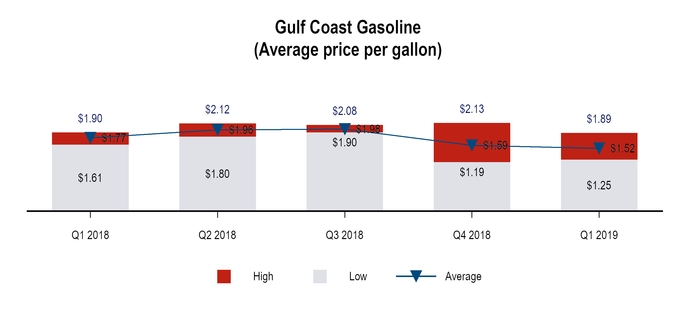
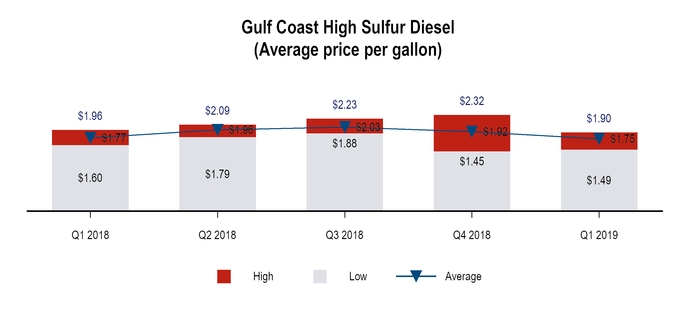
Management's Discussion and Analysis
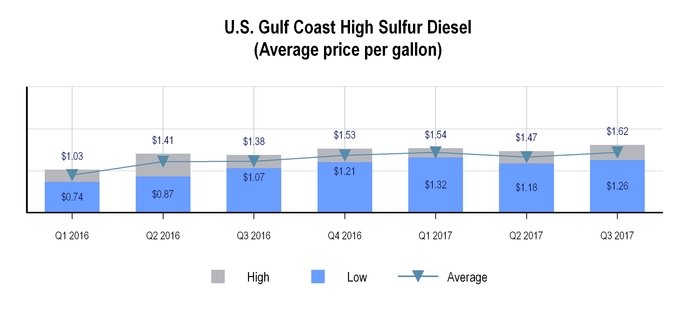
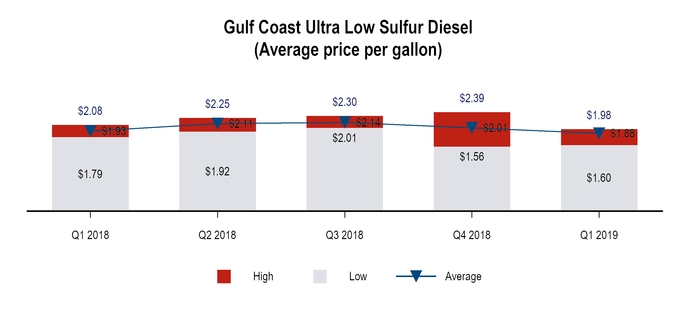
As USU.S. crude oil production has increased, we have seen the discount for WTI Cushing widen compared to Brent.Brent widen. This generally leads to higher margins in our refineries, as refined product prices are influenced by Brent crude prices.prices and the majority of our crude supply is WTI-linked. The average discount for WTI Cushing compared to Brent increased to $3.18$8.96 during the first ninethree months of 20172019 from $1.81$4.32 during the first ninethree months of 2016.2018. We note similar historical trends when reviewing the discount for WTI Cushing compared to LLS, where the average discount increased to $7.49 during the first three months of 2019 from $2.93 during the first three months of 2018. Additionally, our refineries continue to have relatively greater access to WTI Midland and WTI Midland-linked crude feedstocks compared to certain of our competitors. The average discount for WTI Midland compared to WTI Cushing increased to $0.53$1.17 during the first ninethree months of 20172019 from $0.18a discount of $0.38 during the first ninethree months of 2016.2018. As these price discounts increase, so does our competitive advantage, created by our access to WTI-linkedWTI Midland-linked crude oil.oil pricing. The chart below illustrates the differentials of both Brent crude oil and WTI Midland crude oil as compared to WTI Cushing crude oil for each of the quarterly periods in 20162018 and the ninethree months ended September 30, 2017.March 31, 2019.
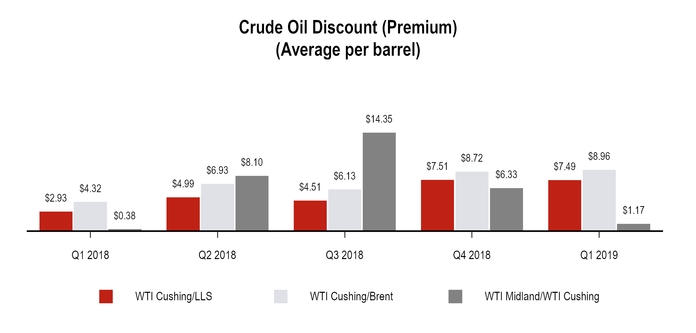
Management's Discussion and Analysis
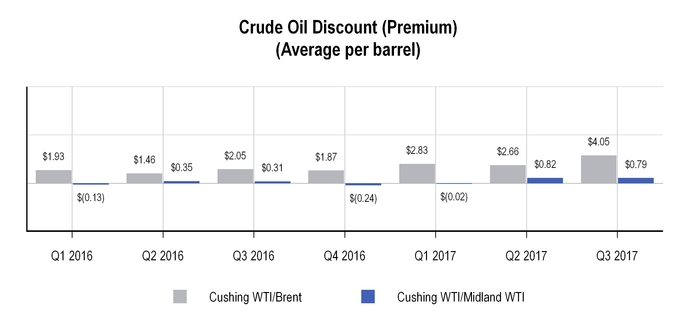
Environmental regulations continue to affect our margins in the form of volatility in the increasing cost of RINsrenewable identification number ("RINs"). On a consolidated basis, we work to balance the cost of our credits for commitments required by the EPA to blend biofuels into fuel products ("RINs obligationsObligation") in order to minimize the effect of RINs on our results. While we generate RINs in both our refining and logistics segments through our ethanol blending and biodiesel production, our refining segment needs to purchase additional RINs to satisfy its obligations. As a result, increases in the price of RINs generally adversely affect our results of operations. It is not possible at this time to predict with certainty what future volumes or costs may be, but given the increase in required volumes and the volatile price of RINs, the cost of purchasing sufficient RINs could have an adverse impact on our results of operations if we are unable to recover those costs in the price of our refined products. The chart below illustrates the volatile nature of the price for RINs for each of the quarterly periods in 20162018 and the ninethree months ended September 30, 2017.March 31, 2019.
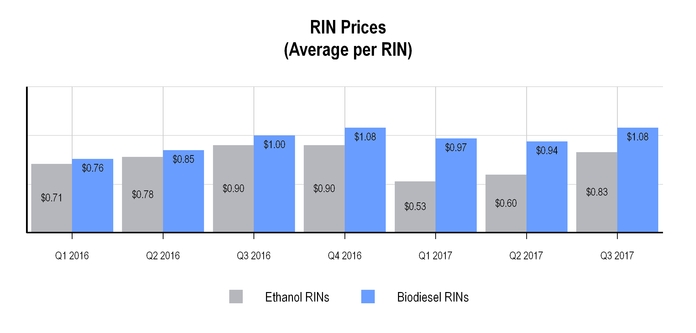
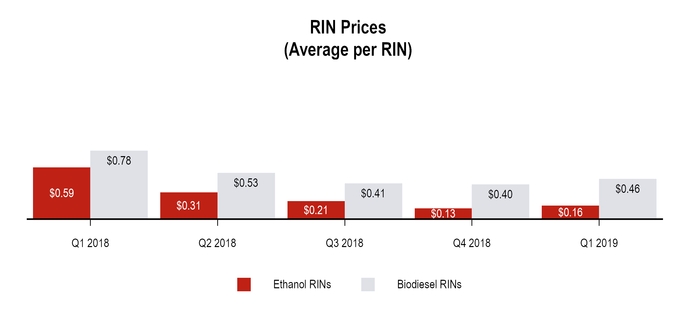
Seasonality
Demand for gasoline
Management's Discussion and asphalt products is generally lowerAnalysis
Contractual Obligations
There have been no material changes to our contractual obligations and commercial commitments during the winterthree months due to seasonal decreasesended March 31, 2019, from those disclosed in motor vehicle traffic and road and home construction. Additionally, varying vapor pressure requirements between the summer and winter months tighten summer gasoline supply. As a result, our operating results are generally lower during the first and fourth quarters of the year for all out segments. The effects of seasonal demand for gasoline are partially offset by seasonality in demand for diesel, which is generally higher in winter months as east-west trucking traffic moves south to avoid winter conditionsAnnual Report on northern routes.Form 10-K.
Critical Accounting Policies
The preparation of our consolidated financial statements requires us to make estimates and judgments that affect the reported amounts of assets, liabilities, revenues and expenses and related disclosure of contingent assets and liabilities. The SEC has defined critical accounting policies as those that are both most important to the portrayal of our financial condition and results of operations, and require our most difficult, complexsubjective or subjectivecomplex judgments or estimates. Based on this definition and as further described in our 2018 Annual Report on Form 10-K, we believe our critical accounting policies include the following: (i) determining our inventory using the last-in, first-out valuation method for the Tyler refinery, (ii) evaluating impairment for property, plant and equipment and definite life intangibles, (iii) valuing goodwill and evaluating potential impairment andof goodwill, (iv) estimating environmental expenditures.expenditures, and (v) estimating asset retirement obligations. For all financial statement periods presented, there have been no material modifications to the application of these critical accounting policies or estimates since our most recently filed Annual Report on Form 10-K. See Note 1 of the condensed consolidated financial statements in Item 1.1, Financial Statements for discussion of updates to our accounting policies.
Non-GAAP Measures
Our management uses certain “non-GAAP” operational measures to evaluate our operating segment performance and non-GAAP financial measures to evaluate past performance and prospects for the future to supplement our GAAP financial information presented in accordance with U.S. GAAP. These financial and operational non-GAAP measures are important factors in assessing our operating results and profitability and include:
Refining margin - calculated as the difference between net refining revenues and total cost of materials and other;
Refined product margin - calculated as the difference between net revenues attributable to refined products and related cost of materials and other (which is applicable to both the refining segment and the west Texas wholesale marketing activities within our logistics segment); and
Refining margin per barrels sold - calculated as refining margin divided by our average refining sales in barrels per day (excluding purchased barrels) multiplied by 1,000 and multiplied by the number of days in the period.
We believe these non-GAAP operational and financial measures are useful to investors, lenders, ratings agencies and analysts to assess our ongoing performance because, when reconciled to their most comparable GAAP financial measure, they provide improved comparability between periods through the exclusion of certain items that we believe are not indicative of our core operating performance and they may obscure our underlying results and trends.
Non-GAAP measures have important limitations as analytical tools, because they exclude some, but not all, items that affect net earnings and operating income. These measures should not be considered substitutes for their most directly comparable U.S. GAAP financial measures.
The following table provides a reconciliation of refining margin to the most directly comparable U.S.GAAP measure, gross margin:
|
| | | | | | | | |
| Refining Segment | | Three Months Ended March 31, 2019 |
| | | 2019 | | 2018 |
| Net revenues | | $ | 2,092.0 |
| | $ | 2,125.9 |
|
| Cost of sales | | 1,828.8 |
| | 2,024.9 |
|
| Gross margin | | 263.2 |
| | 101.0 |
|
| Add back (items included in cost of sales): | | | | |
| Operating expenses (excluding depreciation and amortization) | | 121.0 |
| | 114.7 |
|
| Depreciation and amortization | | 31.1 |
| | 32.2 |
|
| Refining margin | | $ | 415.3 |
| | $ | 247.9 |
|
Management's Discussion and Analysis
Summary Financial and Other Information
The following table provides summary financial data for Delek (in millions, except share and per share data)millions):
|
| | | | | | | | | | | | | | | | |
| | | Three Months Ended | | Nine Months Ended |
| Statement of Operations Data | | September 30, | | September 30, |
| | | 2017 | | 2016 | | 2017 | | 2016 |
| Net sales: | | | | | | | | |
| Refining | | $ | 2,113.8 |
| | $ | 1,013.2 |
| | $ | 4,366.3 |
| | $ | 2,918.2 |
|
| Logistics | | 130.7 |
| | 107.5 |
| | 386.9 |
| | 323.4 |
|
| Retail | | 213.9 |
| | — |
| | 213.9 |
| | — |
|
| Other | | (116.9 | ) | | (40.8 | ) | | (212.8 | ) | | (128.3 | ) |
| Net sales | | $ | 2,341.5 |
| | $ | 1,079.9 |
| | $ | 4,754.3 |
| | $ | 3,113.3 |
|
| Operating costs and expenses: | | | | | | | | |
| Cost of goods sold | | 1,988.1 |
| | 965.6 |
| | 4,181.6 |
| | 2,806.7 |
|
| Operating expenses | | 153.2 |
| | 61.0 |
| | 276.5 |
| | 187.8 |
|
| Insurance proceeds — business interruption | | — |
| | — |
| | — |
| | (42.4 | ) |
| General and administrative expenses | | 61.8 |
| | 24.9 |
| | 115.8 |
| | 77.5 |
|
| Depreciation and amortization | | 46.9 |
| | 29.0 |
| | 105.4 |
| | 86.6 |
|
| Other operating expense | | 0.7 |
| | 2.2 |
| | 1.0 |
| | 2.2 |
|
| Total operating costs and expenses | | 2,250.7 |
| | 1,082.7 |
| | 4,680.3 |
| | 3,118.4 |
|
| Operating (loss) income | | 90.8 |
| | (2.8 | ) | | 74.0 |
| | (5.1 | ) |
| Interest expense | | 34.1 |
| | 13.9 |
| | 62.5 |
| | 40.7 |
|
| Interest income | | (0.9 | ) | | (0.2 | ) | | (2.7 | ) | | (0.9 | ) |
| (Income) loss from equity method investments | | (5.1 | ) | | 5.1 |
| | (9.7 | ) | | 33.7 |
|
| Loss on impairment of equity method investment | | — |
| | 245.3 |
| | — |
| | — |
|
| Gain on investment in Alon | | (190.1 | ) | | — |
| | (190.1 | ) | | 245.3 |
|
| Other expense (income), net | | 0.8 |
| | 0.1 |
| | 0.9 |
| | 0.6 |
|
| Total non-operating expenses, net | | (161.2 | ) | | 264.2 |
| | (139.1 | ) | | 319.4 |
|
| Income (loss) from continuing operations before income tax expense (benefit) | | 252.0 |
| | (267.0 | ) | | 213.1 |
| | (324.5 | ) |
| Income tax expense (benefit) | | 133.5 |
| | (103.3 | ) | | 111.5 |
| | (136.8 | ) |
| Income (loss) from continuing operations | | 118.5 |
| | (163.7 | ) | | 101.6 |
| | (187.7 | ) |
| (Loss) income from discontinued operations, net of tax | | (4.1 | ) | | 6.0 |
| | (4.1 | ) | | 5.5 |
|
| Net income (loss) | | 114.4 |
| | (157.7 | ) | | 97.5 |
| | (182.2 | ) |
| Net income attributed to non-controlling interest | | 10.0 |
| | 4.0 |
| | 19.8 |
| | 15.7 |
|
| Net income (loss) attributable to Delek | | $ | 104.4 |
| | $ | (161.7 | ) | | $ | 77.7 |
| | $ | (197.9 | ) |
| Basic earnings per share: | | | | | | | | |
| Income (loss) from continuing operations | | $ | 1.35 |
| | $ | (2.71 | ) | | $ | 1.20 |
| | $ | (3.28 | ) |
| (Loss) income from discontinued operations | | (0.05 | ) | | 0.10 |
| | (0.06 | ) | | 0.09 |
|
| Total basic income (loss) per share | | $ | 1.30 |
| | $ | (2.61 | ) | | $ | 1.14 |
| | $ | (3.19 | ) |
| Diluted earnings per share: | |
|
| | | | | | |
| Income (loss) from continuing operations | | $ | 1.34 |
| | $ | (2.71 | ) | | $ | 1.19 |
| | $ | (3.28 | ) |
| (Loss) income from discontinued operations | | (0.05 | ) | | 0.10 |
| | (0.06 | ) | | 0.09 |
|
| Total diluted income (loss) per share | | $ | 1.29 |
| | $ | (2.61 | ) | | $ | 1.13 |
| | $ | (3.19 | ) |
|
| | | | | | | | |
| | | Three Months Ended |
| Statement of Operations Data | | March 31, |
| | | 2019 | | 2018 (1) |
| Net revenues | | $ | 2,199.9 |
| | $ | 2,353.2 |
|
| Total operating costs and expenses | | 1,977.5 |
| | 2,314.4 |
|
| Operating income (loss) | | 222.4 |
| | 38.8 |
|
| Total non-operating expenses, net | | 22.2 |
| | 67.6 |
|
| Income (loss) from continuing operations before income tax expense (benefit) | | 200.2 |
| | (28.8 | ) |
| Income tax expense (benefit) | | 45.8 |
| | (11.5 | ) |
| Income (loss) from continuing operations, net of tax | | 154.4 |
| | (17.3 | ) |
| Loss from discontinued operations, net of tax | | — |
| | (8.2 | ) |
| Net income (loss) | | 154.4 |
| | (25.5 | ) |
| Net income attributed to non-controlling interests | | 5.1 |
| | 14.9 |
|
| Net income (loss) attributable to Delek | | $ | 149.3 |
| | $ | (40.4 | ) |
| |
(1) | Income tax benefit for the quarter ended March 31, 2018 reflects a correction made in our 2018 Annual Report on Form 10-K (filed on March 1, 2019) to record additional deferred tax expense totaling $5.5 million related to the recognition of a valuation allowance on deferred tax assets recognized in connection with the Big Spring Logistic Assets Acquisition (see Note 5) not previously reported in our March 31, 2018 Quarterly Report on Form 10-Q filed on May 10, 2018. Such amount is not considered material to the financial statements or the trend of earnings for that period. See Note 23 to our annual audited consolidated financial statements included in Part II, Item 8 of our 2018 Annual Report on Form 10-K filed on March 1, 2019 for further discussion. |
Management's Discussion and Analysis
Results of Operations
Consolidated Results of Operations — Comparison of the Three Months Ended September 30, 2017March 31, 2019 versus the Three Months Ended September 30, 2016March 31, 2018
Net Income (Loss)
Consolidated net income for the thirdfirst quarter of 20172019 was $104.4$154.4 million compared to a net loss of $25.5 million for the first quarter of 2018. Consolidated net income attributable to Delek for the first quarter of March 31, 2019 was $149.3 million, or $1.30$1.92 per basic share, compared to a net loss of $161.7$40.4 million, or $2.61$(0.49) per basic share, for the thirdfirst quarter 2018. Explanations for significant drivers impacting net income as compared to the comparable period of 2016.the prior year are discussed in the sections below.
Net SalesRevenues
In the thirdfirst quarters of 20172019 and 2016,2018, we generated net salesrevenues of $2,341.5$2,199.9 million and $1,079.9$2,353.2 million, respectively, an increasea decrease of $1,261.6$153.3 million, or 116.8%6.5%. The increasedecrease in net salesrevenues was primarily duedriven by the following factors:
in our refining segment, decreases in the average price of U.S. Gulf Coast gasoline of 14.3%, ULSD of 2.5%, and High-Sulfur diesel ("HSD") of 1.1%;
in our logistics segment, decreases in the average volume sold and sales prices per gallon of gasoline and diesel sold in our west Texas marketing operations. The average sales prices per gallon of gasoline and diesel sold decreased $0.17 per gallon and $0.11 per gallon, respectively;
change in business strategy related to our Canadian trading activity, where what was previously refining margin was included in other income in the addition of Alon financial results as a result of Delek/Alon Merger (effective July 1, 2017), which contributed net sales of $970.5 million during the thirdfirst quarter of 2017, and the effects of increases2019, whereas in the pricefirst quarter of finished petroleum products at our refineries2018, such activity was more aligned with the normal operations of the Company and included in revenue; and
a decrease in sales volumes to third parties in the logistics segment, combined with increaseswholesale business.
Such decreases were partially offset by:
increase in sales volume atof purchased refined product in our refineries.refining segment.
Cost of Goods SoldMaterials and Other
Cost of goods soldmaterials and other was $1,988.1$1,699.4 million for the thirdfirst quarter of 20172019 compared to $965.6$2,042.8 million for the thirdfirst quarter of 2016, an increase2018, a decrease of $1,022.5$343.4 million, or 105.9%16.8%. The increasenet decrease in cost of goods soldmaterials and other was primarily due todriven by the addition of Alon financial results as a result of the Delek/Alon Merger, which contributed cost of goods sold of $789.9 million during the third quarter of 2017, the increasefollowing:
decreases in the cost of both crude oil feedstocks at the refineries including a decrease in the cost of WTI Cushing crude oil from an average of $62.89 per barrel to an average of $54.87, and a decrease in the cost of WTI Midland crude oil from an average of $62.51 per barrel to an average of $53.70 during the comparable periods;
a decrease in RIN expense from approximately $20.2 million to $1.2 million, where ethanol RIN prices averaged $0.16 per RIN in first quarter 2019 compared to $0.59 per RIN in the prior year period;
change in business strategy related to our Canadian trading activity, where what was previously refining margin is included in other income in the first quarter of 2019, whereas in the first quarter of 2018, such activity was more aligned with the normal operations of the Company and included in cost of materials and other;
a decrease in sales volumes to third parties in the logistics wholesale business;
decreases in the cost of refined products in the logistics segment as well as increasedwhere the average cost per gallon of gasoline and diesel purchased decreased $0.20 per gallon and $0.12 per gallon, respectively;
the net reversal benefit of $52.1 million related to inventory valuation reserves recognized during the first quarter of 2019 compared to the net reversal benefit of $0.9 million recognized during the first quarter of 2018; and
a decrease in retail fuel cost of materials and other attributable to an decrease in in average cost per gallon of $0.15.
Such decreases were partially offset by:
an increase in sales volumes atin our refining segment; and
Management's Discussion and Analysis
a prior period benefit of approximately $115.5 million related to a combination of the our refineries.2017 RINs waivers and a biodiesel tax credit recognized during the first quarter of 2018 that was not recurring in the first quarter of 2019.
Operating Expenses
Operating expenses were $153.2$166.7 million for the thirdfirst quarter of 20172019 compared to $61.0$158.1 million for the thirdfirst quarter of 2016,2018, an increase of $92.2$8.6 million, or 151.1%5.4%. The increase in operating expenses was primarily due todriven by the addition of Alon financial results asfollowing:
an increase in employee expense and outside services expense primarily in the refining segment;
offset by a result ofdecrease in repairs and maintenance costs primarily in the Delek/Alon Merger, which contributed operating expenses of $87.9 million during the third quarter of 2017.refining segment.
General and Administrative ExpensesGeneral and administrative expenses were $61.8 million and $24.9$62.2 million for the thirdfirst quarter of 20172019 compared to $65.2 million for the first quarter of 2018, a decrease of $3.0 million, or 4.6%. The decrease in general and 2016, respectively,administrative expense was primarily driven by the following:
a total decrease in employee costs across the company primarily driven by lower annual incentive plan costs offset by higher labor costs; and
a decrease in insurance expense in our refining and corporate, other and eliminations segments.
Depreciation and Amortization
Depreciation and amortization (included in both cost of sales and other operating expenses) was $46.8 million for the first quarter of 2019 compared to $48.0 million for the first quarter of 2018, a decrease of $1.2 million, or 2.5%.
Other Operating (Income) Expense, Net
Other operating income increased by $2.1 million in the first quarter of 2019 to $2.4 million compared to expense of $0.3 million in the first quarter of 2018.
Interest ExpenseInterest expense decreased by $3.8 million, or 11.7%, to $28.7 million in the first quarter of 2019 compared to $32.5 million in the first quarter of 2018, primarily driven by the following:
a decrease in net average borrowings outstanding (including the obligations under the supply and offtake agreements which have an associated interest charge) of approximately $44.2 million in the first quarter of 2019 (calculated as a simple average of beginning borrowings/obligations and ending borrowings/obligations for the period) compared to the first quarter of 2018, and a decrease in the average effective interest rate of 0.59% in the first quarter of 2019 compared to the first quarter of 2018 (where effective interest rate is calculated as interest expense divided by the net average borrowings/obligations outstanding).
Results from Equity Method Investments
We recognized income of $2.6 million from equity method investments during the first quarter of 2019, compared to none for the first quarter of 2018, an increase of $36.9 million, or 148.2%. The$2.6 million. This increase was primarily due duedriven by the following:
increase in income from our logistics joint ventures from $0.8 million in the first quarter of 2018 to $2.0 million in the additionfirst quarter of Alon financial results as2019; and
increase in income from our asphalt joint venture from a resultloss of $0.6 million in the Delek/Alon Merger, which contributed generalfirst quarter of 2018 to income of $0.5 million in the first quarter of 2019.
Management's Discussion and administrative expenses of $20.7 millionAnalysis
Other Non-operating Expenses, Net
During the three months ended March 31, 2018, we incurred certain infrequently occurring expenses/charges that were not incurred during the third quarterthree months ended March 31, 2019. These included a $9.0 million loss on extinguishment of 2017, as well integration costsdebt related to the Merger inRefinancing and an impairment loss on assets held for sale totaling approximately $27.5 million related to the third quarter of 2017 totaling $18.4 million.
In connection with the Merger, we assumed Alon's existing post-retirement benefit plansasphalt assets held for sale. See Notes 7 and recorded the net unfunded pension obligations as part of the purchase price allocation. During the third quarter of 2017, we elected to freeze certain of the plans, resulting in the recognition of a gain due to curtailment of $6.1 million in the
third quarter of 2017. Net periodic benefit costs are included as part of general and administrative expenses in the accompanying condensed consolidated statements of income. See Note 1810 of the condensed consolidated financial statements in Item 1, Financial Statements, for additional information about our defined benefit pension plans.information.
Depreciation and Amortization
Depreciation and amortization was $46.9 million for the third quarter of 2017 compared to $29.0 million for the third quarter of 2016, an increase of $17.9 million, or 61.7%. The increase in depreciation expense was primarily attributable due to the addition of Alon property, plant and equipment of $1,183.1 million (at preliminary fair value) and amortizable intangibles of $51.0 million (at preliminary fair value) as a result of the Delek/Alon Merger and other capital expenditures and acquisitions completed to date in 2017 as compared to 2016. The acquisition of Alon contributed $15.7 million in additional depreciation and amortization during the third quarter of 2017.
Interest Expense
Interest expense was $34.1 million for the third quarter of 2017 compared to $13.9 million for the third quarter of 2016, an increase of $20.2 million, or 145.3%. The increase was primarily attributable to the addition of assumed debt totaling $568.0 million (at fair value) in connection with the Delek/Alon Merger and increases in the weighted average interest rate under our credit facilities.
Results from Equity Method Investments
During the third quarter of 2017, we recognized income from equity method investments of $5.1 million, compared to a loss of $5.1 million for the third quarter of 2016. Changes in the results from equity method investments for the third quarter of 2016 were primarily attributable to our the fact that we no longer have an equity method investment in Alon in the third quarter of 2017, whereas we recorded our proportionate share of the net loss from our investment in Alon of $4.2 million and amortization of the excess of our investment over our equity in the underlying net assets of Alon of $0.6 million in the third quarter of 2016, combined with the effect of adding equity method investments owned by Alon in connection with the Merger, all of which had income in 2017.
Loss on Impairment of Equity Method Investment
We recorded an impairment charge of $245.3 million on our equity method investment in the third quarter of 2016, due to our determination that the decline in the market value of our ALJ Shares was other than temporary. There was no impairment recognized in the third quarter of 2017.
Gain on Remeasurement of Equity Method Investment
We recorded a gain of $190.1 million on our equity method investment in Alon in the third quarter of 2017, due to the remeasurement of the investment in connection with the Merger, where the remeasured pre-existing non-controlling interest is included as part of the purchase price consideration in recording
We report operating results in three reportable segments: refining, logistics and retail. Decisions concerning the allocation of resources and assessment of operating performance are made based on this segmentation. Management measures the operating performance of each of its reportable segments based on the segment contribution margin.
The tables and charts below set forth certain information concerning our refining segment operations ($ in millions, except per barrel amounts):
Off-Balance Sheet Arrangements
We have no off-balance sheet arrangements through the date of the filing of this Quarterly Report on Form 10-Q.
Management's Discussion and Analysis
Contractual Obligations and Commitments
Information regarding our known contractual obligations of the types described below have materially changed during the quarter ended September 30, 2017 due to the Delek/Alon Merger. The amounts as of September 30, 2017 are set forth in the following table (in millions):
|
| | | | | | | | | | | | | | | | | | | | |
| | | Payments Due by Period |
| | | <1 Year | | 1-3 Years | | 3-5 Years | | >5 Years | | Total |
| Long-term debt and notes payable obligations | | $ | 358.6 |
| | $ | 770.0 |
| | $ | 68.9 |
| | $ | 250.0 |
| | $ | 1,447.5 |
|
Interest(1) | | 79.9 |
| | 72.1 |
| | 36.7 |
| | 44.9 |
| | 233.6 |
|
Operating lease commitments(2) | | 42.6 |
| | 40.8 |
| | 18.8 |
| | 28.7 |
| | 130.9 |
|
Purchase commitments(3) | | 450.4 |
| | 1.3 |
| | — |
| | — |
| | 451.7 |
|
Transportation agreements(4) | | 115.1 |
| | 217.7 |
| | 131.9 |
| | 173.2 |
| | 637.9 |
|
| Total | | $ | 1,046.6 |
| | $ | 1,101.9 |
| | $ | 256.3 |
| | $ | 496.8 |
| | $ | 2,901.6 |
|
| |
(1)
| Expected interest payments on debt outstanding under credit facilities in place at September 30, 2017. Floating interest rate debt is calculated using September 30, 2017 rates. |
| |
(2)
| Amounts reflect future estimated lease payments under operating leases having remaining non-cancelable terms in excess of one year as of September 30, 2017. |
| |
(3)
| We have supply agreements to secure certain quantities of crude oil, finished product and other resources used in production at both fixed and market prices. We have estimated future payments under the market based agreements using current market rates. |
| |
(4)
| Balances consist of contractual obligations under agreements with third parties (not including Delek Logistics) for the transportation of crude oil to our refineries. |
ITEM 3. QUANTITATIVE AND QUALITATIVE DISCLOSURES ABOUT MARKET RISK
These disclosures should be read in conjunction with the condensed consolidated financial statements, "Management's Discussion and Analysis of Financial Condition and Results of Operations," and other information presented herein, as well as in the "Quantitative and Qualitative Disclosures About Market Risk" section contained in our Annual Report on Form 10-K.
Price Risk Management Activities.Activities
At times, we enter into the following instruments/transactions in order to manage our market-indexed pricing risk: commodity derivative contracts which we use to manage our price exposure to our inventory positions, future purchases of crude oil and ethanol, future sales of refined products or to fix margins on future production. We also enter intoproduction; and future commitments to purchase or sell RINs at fixed prices and quantities, which are used to manage the costs associated with our RINs obligations. These future RIN commitmentsobligations and meet the definition of derivative instruments under ASC 815, Derivatives and Hedging ("ASC 815"). In accordance with ASC 815, all of these commodity contracts and future purchase commitments are recorded at fair value, and any change in fair value between periods has historically been recorded in the profit and loss section of our condensed consolidated financial statements. Occasionally, at inception, the companyCompany will elect to designate the commodity derivative contracts as cash flow hedges under ASC 815. Gains or losses on commodity derivative contracts accounted for as cash flow hedges are recognized in other comprehensive income on the condensed consolidated balance sheets and, ultimately, when the forecasted transactions are completed, in net salesrevenues or cost of goods soldmaterials and other in the condensed consolidated statements of income.
The following table sets forth information relating to our open commodity derivative contracts as of September 30, 2017March 31, 2019 ($ in millions).
:
| | | | | Total Outstanding | | Notional Contract Volume by Year of Maturity | | Total Outstanding | | Notional Contract Volume by Year of Maturity |
| Contract Description | | Fair Value | | Notional Contract Volume | | 2017 | | 2018 | | 2019 | | Fair Value | | Notional Contract Volume | | 2019 | | 2020 | | 2021 |
| Contracts not designated as hedging instruments: | | | | | | | | | | | | | | | | | | | | |
Crude oil price swaps - long(1) | | $ | 2.6 |
| | 3,090,000 |
| | 180,000 |
| | 2,910,000 |
| | — |
| | $ | 29.6 |
| | 16,350,000 |
| | 13,470,000 |
| | 2,880,000 |
| | — |
|
Crude oil price swaps - short(1) | | (5.4 | ) | | 3,590,000 |
| | 180,000 |
| | 3,410,000 |
| | — |
| | (27.2 | ) | | 16,467,000 |
| | 12,287,000 |
| | 4,180,000 |
| | — |
|
Inventory, refined product and crack spread swaps - long(1) | | 30.0 |
| | 20,701,197 |
| | 13,181,197 |
| | 7,520,000 |
| | — |
| | 13.0 |
| | 9,578,000 |
| | 7,671,000 |
| | 1,667,000 |
| | 240,000 |
|
Inventory, refined product and crack spread swaps - short(1) | | (33.0 | ) | | 16,772,197 |
| | 11,747,197 |
| | 5,025,000 |
| | — |
| | (25.6 | ) | | 14,637,000 |
| | 13,110,000 |
| | 1,187,000 |
| | 340,000 |
|
RIN commitment contracts - long(2) | | (34.6 | ) | | 249,616,545 |
| | 249,616,545 |
| | — |
| | — |
| | 1.0 |
| | 117,025,000 |
| | — |
| | — |
| | — |
|
RIN commitment contracts - short(2) | | 23.4 |
| | 194,140,000 |
| | 194,140,000 |
| | — |
| | — |
| | (0.3 | ) | | 139,000,000 |
| | — |
| | — |
| | — |
|
| Total | | $ | (17.0 | ) | | 487,909,939 |
| | 469,044,939 |
| | 18,865,000 |
| | — |
| | $ | (9.5 | ) | | 313,057,000 |
| | 46,538,000 |
| | 9,914,000 |
| | 580,000 |
|
| Contracts designated as cash flow hedging instruments: | | | | | | | | | | | | | | | | | | | | |
Crude oil price swaps - long(1) | | $ | (22.6 | ) | | 575,000 |
| | — |
| | 575,000 |
| | — |
| | $ | 49.2 |
| | 8,793,000 |
| | 8,793,000 |
| | — |
| | — |
|
Crude oil price swaps - short(1) | | | — |
| | — |
| | — |
| | — |
| | — |
|
Inventory, refined product and crack spread swaps - long(1) | | | — |
| | — |
| | — |
| | — |
| | — |
|
Inventory, refined product and crack spread swaps - short(1) | | | 0.9 |
| | 300,000 |
| | — |
| | 300,000 |
| | — |
|
| Total | | $ | (22.6 | ) | | 575,000 |
| | — |
| | 575,000 |
| | — |
| | $ | 50.1 |
| | 9,093,000 |
| | 8,793,000 |
| | 300,000 |
| | — |
|
(1)Volume in barrels
(2)Volume in RINs
Management's Discussion and Analysis
Interest Risk Management Activities.Activities
We have market exposure to changes in interest rates relating to our outstanding floating rate borrowings, which totaled approximately $935.4$1,454.2 million as of September 30, 2017.
We help manage this risk through interest rate swap and cap agreements that we may periodically enter into in order to modify the interest rate characteristics of our outstanding long-term debt. In accordance with ASC 815, all interest rate hedging instruments are recorded at fair value and any changes in the fair value between periods are recognized in earnings. The fair values of our interest rate swaps and cap agreements are obtained from dealer quotes. These values represent the estimated amount that we would receive or pay to terminate the agreements taking into account the difference between the contract rate of interest and rates currently quoted for agreements, of similar terms and maturities. We expect that any interest rate derivatives held would reduce our exposure to short-term interest rate movements. As of September 30, 2017, we had four floating-to-fixed interest rate derivative agreements in place for a notional amount of $69.8 million, which all mature in March 31, 2019. The estimated fair value of our interest rate derivative liability was $1.3 million as of September 30, 2017.
The annualized impact of a hypothetical one percent change in interest rates on our floating rate debt after considering the interest rate swaps, outstanding as of September 30, 2017March 31, 2019 would be to change interest expense by approximately $8.7$14.5 million.
Commodity Derivatives Trading Activities
In the first half of 2018, we began entering into active trading positions in a variety of commodity derivatives, which include forward physical contracts, swap contracts, and futures contracts. These contracts are classified as held for trading and are recognized at fair value with changes in fair value recognized in the income statement. Trading activities are undertaken by using a range of contract types in combination to create incremental gains by capitalizing on crude oil supply and pricing seasonality. These contracts had remaining durations of less than one year as of March 31, 2019.
The following table sets forth information relating to commodity derivative contracts held for trading purposes as of March 31, 2019:
|
| | | | |
| Contract Description | | Less than 1 year |
| Over the counter forward sales contracts | | |
Notional contract volume (1) | | 1,030,899 |
|
| Weighted-average market price (per barrel) | | $ | 49.80 |
|
| Contractual volume at fair value (in millions) | | $ | 51.3 |
|
| Over the counter forward purchase contracts | | |
Notional contract volume (1) | | 684,834 |
|
| Weighted-average market price (per barrel) | | $ | 49.67 |
|
| Contractual volume at fair value (in millions) | | $ | 34.0 |
|
Management's Discussion and Analysis
ITEM 4.CONTROLS AND PROCEDURES [NEEDS TO BE UPDATED]
(a) Evaluation of Disclosure Controls and Procedures
Our management has evaluated,disclosure controls and procedures are designed to provide reasonable assurance that the information that we are required to disclose in reports we file under the Securities Exchange Act of 1934, as amended ("the Exchange Act"), is accumulated and appropriately communicated to management. We carried out an evaluation required by Rule 13a-15(b) of the Exchange Act, under the supervision and with the participation of our principal executivemanagement, including the Chief Executive Officer and principal financial officers,Chief Financial Officer, of the effectiveness of the design and operation of our disclosure controls and procedures (as defined in Rule 13a-15(e) or Rule 15d-15(e) under the Exchange Act) as ofat the end of the period covered by this report,reporting period. Based on that evaluation, the Chief Executive Officer and has, based on this evaluation,Chief Financial Officer concluded that our disclosure controls and procedures arewere effective to provide reasonable assurance that information required to be disclosed by us in the reports that we file or submit under the Exchange Act is recorded, processed, summarized and reported within the time periods specified in the SEC's rules and forms including, without limitation, controls and procedures designed to ensure that information required to be disclosed by us in the reports that we file or submit under the Exchange Act is accumulated and communicated to our management, including our principal executive and principal financial officers, as appropriate to allow timely decisions regarding required disclosures.
(b) Changes in Internal Control over Financial Reporting
We acquired Alon USA Energy, Inc. ("Alon")on July 1, 2017, and its total assets and revenues constituted 53% and 41%, respectively, of Delek's consolidated total assets and revenues as shown on our consolidated financial statements as of and for the nine months ended September 30, 2017. We will exclude Alon's internal control over financial reporting from the scope of management's 2017 annual assessmentend of the effectiveness of Delek's disclosure controls and procedures. This exclusion is in accordance with the general guidance issued by the Staff of the SEC that an assessment of a recent business combination may be omitted from management's report on internal control over financial reporting in the first year of consolidation.period.
In connection with the Delek/Alon Merger, we are integrating Alon's internal controls over financial reporting into our financial reporting framework. Such changesThere have resulted and may continue to result inbeen no changes in our internal control over financial reporting (as describedidentified in Rule 13a-15(f) and 15d-15(f) underconnection with the evaluation required by paragraph (d) of Exchange Act)Act Rules 13a-15 or 15d-15 that materially affect our internal control over financial reporting. Other than the changes that have and may continue to result from such integration, there has been no change in our internal control over financial reporting (as described in Rule 13a-15(f) and 15d-15(f) under the Exchange Act)occurred during the first quarter ended September 30, 2017of 2019 that hashave materially affected, or isare reasonably likely to materially affect, our internal control over financial reporting.reporting
Legal Proceedings, Risk Factors, Unregistered Sales of Equity Securities and Other Information
PART II.
Part II - OTHER INFORMATION
ITEM 1.LEGAL PROCEEDINGS
OneIn the ordinary conduct of our Alon subsidiaries wasbusiness, we are from time to time subject to lawsuits, investigations and claims, including, environmental claims and employee-related matters. Although we cannot predict with certainty the ultimate resolution of lawsuits, investigations and claims asserted against us, including civil penalties or other enforcement actions, we do not believe that any currently pending legal proceeding or proceedings to which we are a party will have a material adverse effect on our business, financial condition or results of operations. See Note 13 to a lawsuit alleging breach of contract pertaining to an asphalt supply agreement. Duringour accompanying condensed consolidated financial statements, which is incorporated by reference in this Item1, for additional information. Aside from the three months ended September 30, 2017, we reached a settlement on this matter.
Our recently acquired Big Spring refinery hasdisclosure in Note 13, there have been negotiating an agreement with EPA for over 10 years under EPA’s National Petroleum Refinery Initiative regarding alleged historical violations of the Clean Air Act ("CAA"). Accordingno material developments to the EPA, approximately 95% of the nation’s refining capacity has entered into “global” settlements under this EPA enforcement initiative. Our El Dorado and Tyler refineries entered into similar global settlementsproceedings previously reported in 2002 and 2009. A similar Consent Decree covering the Krotz Springs refinery, entered into in 2005 by a previous owner, was terminated by the court in October 2017. A Consent Decree resolving these alleged historical violations for the Big Spring refinery was lodged with the United States District Court for the Northern District of Texasour Annual Report on June 6, 2017, and we expect that Consent Decree to become final later this year. If finalized, the Consent Decree will require payment of a $456,250 civil penalty and capital expenditures for pollution control equipment that may be significant over the next 5 years.
Form 10-K.
ITEM 1A.RISK FACTORS
In January 2017, we announced that Delek (and various related entities) had entered into an Agreement and Plan of Merger with Alon USA Energy, Inc. (NYSE: ALJ) ("Alon"), as subsequently amended on February 27 and April 21, 2017 (as so amended, the "Merger Agreement"). The related Merger (the "Delek/Alon Merger" or the "Merger") was effective July 1, 2017 (the “Effective Time”), resulting in a new post-combination consolidated registrant renamed as Delek US Holdings, Inc. (“New Delek”), with Alon and the previous Delek US Holdings, Inc. (“Old Delek”) surviving as wholly-owned subsidiaries. New Delek is the successor issuer to Old Delek and Alon pursuant to Rule 12g-3(c) under the Securities Exchange Act of 1934, as amended (the "Exchange Act"). In addition, as a result of the Delek/Alon Merger, the shares of common stock of Old Delek and Alon were delisted from the New York Stock Exchange in July 2017, and their respective reporting obligations under the Exchange Act were terminated. The Risk Factors considered for presentation herein are based on identified and anticipated risks to New Delek unless specifically attributed to one of its subsidiaries in the discussion below.
There have been no material changes in the risk factors previously disclosed in "Item 1A. Risk Factors" of Old Delek'sour Annual Report on Form 10-K, except as disclosed below, which updates10-K.
ITEM 2. UNREGISTERED SALES OF EQUITY SECURITIES AND USE OF PROCEEDS
On November 6, 2018, our Board of Directors authorized a share repurchase program for up to $500.0 million of Delek common stock. Any share repurchases under the risk factors previously disclosed in Part I, Item 1A of Old Delek's Annual Report on Form 10-K for the year ended December 31, 2016.
Werepurchase program may be unable to integrate successfully the businessesimplemented through open market transactions or in privately negotiated transactions, in accordance with applicable securities laws. The timing, price, and size of Old Delek and Alon and realize the anticipated benefits of the Delek/Alon Merger.
The Delek/Alon Merger involve the combination of two companies which, prior to July 1, 2017, operated as independent public companies. We must devote significant management attention and resources to integrating the business practices and operations of Old Delek and Alon. We may fail to realize some or all of the anticipated benefits of the Delek/Alon Merger if the integration process takes longer than expected or is more costly than expected. Potential difficulties we may encounter in the integration process include the following:
the inability to successfully combine the businesses of Old Delek and Alon in a manner that permits us to achieve the synergies anticipated to result from the Delek/Alon Merger, which would result in the anticipated benefits of the Delek/Alon Merger not being realized partly or wholly in the time frame currently anticipated or at all;
lost sales and customers as a result of certain customers of either of the two companies deciding not to do business with us;
complexities associated with managing the combined businesses;
integrating personnel from the two companies;
challenges in the creation of uniform standards, controls, procedures, policies and information systems;
potential unknown liabilities and unforeseen increased expenses, delays or regulatory conditions associated with the Delek/Alon Merger; and
performance shortfalls as a result of the diversion of management’s attention caused by completing the Delek/Alon Merger and integrating the companies’ operations.
We are expected to incur substantial expenses related to the integration of Old Delek and Alon.
We are expected to incur substantial expenses in connection with the integration of the business, policies, procedures, operations, technologies and systems of Alon with those of Old Delek. There are a large number of systems that must be integrated, including management information, purchasing, administrative, accounting and finance, sales, marketing, billing, payroll and benefits, installation, engineering, infrastructure and regulatory compliance, among others. While we have assumed that a certain level of expenses would be incurred, there are a number of factors beyond our control that could affect the total amount or the timing of all of the expected integration expenses. Moreover, many of the expenses thatrepurchases will be incurred are, by their nature, difficult to estimate. These integration expenses likely will result in us taking significant charges against earnings, butmade at the amountdiscretion of management and timing of such charges is uncertain, and if such charges are greater than expected, they could offset the cost synergies that New Delek expects to achieve from the Delek/Alon Merger.
We may refinance a significant amount of indebtedness and otherwise require additional financing; we cannot guarantee that we will be able to obtain the necessary funds on favorable terms or at all.
We may elect to refinance certain of Old Delek's or Alon’s indebtedness even if not required to do so by the terms of such indebtedness. In addition, we may need or want to raise additional funds for our operations. We have been and may continue to be engaged in discussions with certain potential financing sources, which could provide a source of additional funds and liquidity for our operations. However, our ability to obtain such financing will depend on among other factors, prevailing market prices, general economic and market conditions at the time of the proposed financing and other factors beyond our control. There is no assurance that we will be ableconsiderations. The repurchase program does not obligate us to obtain additional financing on terms acceptable to us, or at all.
As a resultacquire any particular amount of the Delek/Alon Merger, we are subject to significant additional indebtedness as compared to the indebtedness of Old Delek, which could adversely affect us, including by decreasing our business flexibilitystock and increasing our interest expense.
As of September 30, 2017, our consolidated indebtedness was approximately $1,427.8 million, as compared to Old Delek's consolidated indebtedness of approximately $822.5 million as of June 30, 2017. As a result, we are subject to substantially increased indebtedness in comparison to Old Delek’s indebtedness on a recent historical basis. We may have to incur additional indebtedness in connection with any extinguishment of our debt, as well as for our ongoing business needs. Increased indebtedness could have the effect, among other things, of reducing our flexibility to respond to changing business and economic conditions and increasing our interest expense.does not expire. The increased levels of indebtedness could reduce funds available for working capital, capital expenditures, acquisitions, share repurchases, dividends and other general corporate purposes.
Our future results will suffer if we do not effectively manage our expanded operations following the Delek/Alon Merger.
The size and scope of operations of our business have increased beyond the current size and scope of operations of either Old Delek’s or Alon’s businesses prior to the Delek/Alon Merger. In addition, we may continue to expand our size and operations through additional acquisitions or other strategic transactions. Our future success depends, in part, upon our ability to manage our expanded business, which may pose substantial challenges for management, including challenges related to the management and monitoring of new operations and associated increased costs and complexity. There can be no assurance that we will be successful or that we will realize the expected economies of scale, synergies and other benefits currently anticipated from the Delek/Alon Merger or anticipated from any additional acquisitions or strategic transactions.
The Delek/Alon Merger could adversely affect our relationships with employees, customers, commercial partners, financing parties and other third parties.
Uncertainty about the effect of the Delek/Alon Merger on employees, customers, commercial partners and other third parties may have an adverse effect on us. These uncertainties may cause customers, suppliers, commercial partners, financing parties and others that dealt with Alon or Old Delek to seek to change, delay or defer decisionstable sets forth information with respect to existing or future business relationships. These uncertainties may impair our ability to retain, hire and motivate certain current and prospective employees. If key employees, customers, suppliers, commercial partners, financing parties and other third parties terminate or change, or seek to terminate or change, their existing relationships with us, our business could be harmed.
The trading price of our common stock is likely to be volatile.
The trading price of Old Delek common stock and Alon common stock prior to the Delek/Alon Merger were highly volatile. The trading price of our common stock could also be subject to wide fluctuations in response to various factors, some of which are beyond our control. The stock market in general, and the market for energy companies in particular, has experienced extreme price and volume fluctuations that have often been unrelated or disproportionate to the operating performance of those companies. Broad market and industry factors may seriously affect the market price of companies’ stock, including ours, regardless of actual operating performance. In addition, in the past, following periods of
volatility in the overall market and the market price of a particular company’s securities, securities class action litigation has often been instituted against these companies. Any such stockholder litigation could result in substantial costs and a diversion of the attention and resources of our management.
The Delek/Alon Merger may not be as accretive to our earnings per share as anticipated, which may negatively affect the market price of our common stock.
We currently anticipate that the Delek/Alon Merger will be accretive to earnings per share in 2018, assuming certain pre-tax synergies are realized. This expectation, however, is based on preliminary estimates which may materially change. We could encounter additional transaction-related costs or other factors such as the failure to realize all of the benefits anticipated in the Delek/Alon Merger. All of these factors could decrease or delay the expected accretive effect of the Delek/Alon Merger and cause a decrease in the market price of our common stock.
We will record goodwill and other intangible assets that could become impaired and result in material non-cash charges to our results of operations in the future.
The Delek/Alon Merger has been accounted for as an acquisition by us of Alon in accordance with accounting principles generally accepted in the United States. Under the acquisition method of accounting, the assets and liabilities of Alon and its subsidiaries have been recorded, as of the completion of the Delek/Alon Merger, at their respective fair values. Under the acquisition method of accounting, the total purchase price has been preliminarily allocated to Alon’s tangible assets and liabilities and identifiable intangible assets based on their estimated fair values as of the date of completion of the Delek/Alon Merger. The excess of the purchase price over those estimated fair values has been recorded as goodwill. To the extent the value of goodwill or intangibles becomes impaired, we may be required to incur material non-cash charges relating to such impairment. Our operating results may be significantly impacted from both the impairment and the underlying trends in the business that triggered the impairment.
We operate in a highly regulated industry and increased costs of compliance with, or liability for violation of, existing or future laws, regulations and other requirements could significantly increase our costs of doing business, thereby adversely affecting our profitability.
Our industry is subject to extensive laws, regulations, permits and other requirements including, but not limited to, those relating to the environment, fuel composition, safety, transportation, pipeline tariffs, employment, labor, immigration, minimum wages, overtime pay, health care benefits, working conditions, public accessibility, retail fuel pricing,the sale of alcohol and tobacco and other requirements. These permits, laws and regulations are enforced by federal agencies including the United States ("U.S.") Environmental Protection Agency ("EPA"), U.S. Department of Transportation, Pipeline and Hazardous Materials Safety Administration, Federal Motor Carrier Safety Administration, Federal Railroad Administration, the Occupational Safety and Health Administration ("OSHA"), National Labor Relations Board, Equal Employment Opportunity Commission, Federal Trade Commission and the Federal Energy Regulatory Commission ("FERC"), and numerous other state and federal agencies. We anticipate that compliance with environmental, health and safety regulations could require us to spend significant amounts in capital costs during the next five years. These estimates do not include amounts related to capital investments that management has deemed to be strategic investments. These amounts could materially change as a result of governmental and regulatory actions.
Various permits, licenses, registrations and other authorizations are required under these laws for the operation of our refineries, terminals, pipelines, retail locations and related operations, and these permits are subject to renewal and modification that may require operational changes involving significant costs. If key permits cannot be renewed or are revoked, the ability to continue operation of the affected facilities could be threatened.
Ongoing compliance with or violation of laws, regulations and other requirements could also have a material adverse effect on our business, financial condition and results of operations. We face potential exposure to future claims and lawsuits involving environmental matters including but not limited to, soil, groundwater and waterway contamination, air pollution, personal injury and property damage allegedly caused by substances we manufactured, handled, used, released or disposed. We are and have been the subject of various state, federal and private proceedings relating to environmental regulations, conditions and inquiries.
In addition, new legal requirements, new interpretations of existing legal requirements, increased legislative activity and governmental enforcement and other developments could require us to make additional unforeseen expenditures. Companies in the petroleum industry, such as us, are often the target of activist and regulatory activity regarding pricing, safety, environmental compliance, derivatives trading and other business practices which could result in price controls, fines, increased taxes or other actions affecting the conduct of our business. For example, consumer activists are lobbying various authorities to enact laws and regulations mandating the removal of tetra-ethyl lead from aviation gasoline. Other activists seek to require reductions in greenhouse gas emissions from our refineries and fuel products and are increasingly protesting new energy infrastructure projects such as pipelines and crude by rail facilities. The specific impact of laws and regulations or other actions may vary depending on a number of factors, including the age and location of operating facilities, marketing areas, crude oil and feedstock
sources and production processes.
We generate wastes that may be subject to the Resource Conservation and Recovery Act ("RCRA") and comparable state and local requirements. The EPA and various state agencies have limited the approved methods of managing, transporting, recycling and disposal of hazardous and certain non-hazardous wastes. Our refineries are large quantity generators of hazardous waste and require hazardous waste permits issued by the EPA or state agencies. Additionally, certain of our other facilities such as terminals and biodiesel plants generate lesser quantities of hazardous wastes.
Under RCRA and the Comprehensive Environmental Response, Compensation and Liability Act ("CERCLA") and other federal, state and local environmental requirements, as the owner or operator of refineries, biodiesel plants, bulk terminals, pipelines, tank farms, rail cars, trucks and retail locations, we may be liable for the costs of removal or remediation of contamination at our existing or former locations, whether we knew of, or were responsible for, the presence of such contamination. We have incurred such liability in the past and several of our current and former locations are the subject of ongoing remediation projects. The failure to timely report and properly remediate contamination may subject us to liability to third parties and may adversely affect our ability to sell or rent our property or to borrow money using our property as collateral. Additionally, persons who arrange for the disposal or treatment of hazardous substances also may be liable for the costs of removal or remediation of these substances at sites where they are located, regardless of whether the site is owned or operated by that person. We typically arrange for the treatment or disposal of hazardous substances in our refining and other operations. Therefore, we may be liable for removal or remediation costs, as well as other related costs, including fines, penalties and damages resulting from injuries to persons, property and natural resources. Our El Dorado refinery is a minor potentially responsible party at a Superfund site for which we expect our costs to be non-material. In the future, we may incur substantial expenditures for investigation or remediation of contamination that has not been discovered at our current or former locations or locations that we may acquire.
Our operations are subject to certain requirements of the federal Clean Air Act (“CAA”) as well as related state and local laws and regulations governing air emissions. Certain CAA regulatory programs applicable to our refineries, terminals and other operations require capital expenditures for the installation of air pollution control devices, operational procedures to minimize emissions and monitoring and reporting of emissions. In 2012, the EPA announced an industry-wide enforcement initiative directed at flaring operations and performance at refineries and petrochemical plants and finalized revisions to New Source Performance Standard ("NSPS") Subpart Ja that primarily affects flares and process heaters. We completed capital and other projects at our refineries related to flare compliance with NSPS Ja in 2015 and 2016.
Our recently acquired Big Spring refinery has been negotiating an agreement with EPA for over 10 years under EPA’s National Petroleum Refinery Initiative regarding alleged historical violations of the CAA. According to the EPA, approximately 95% of the nation’s refining capacity has entered into “global” settlements under this EPA enforcement initiative. Our El Dorado and Tyler refineries entered into similar global settlements in 2002 and 2009. A similar Consent Decree covering the Krotz Springs refinery, entered into in 2005 by a previous owner, was terminated by the court in October 2017. A Consent Decree resolving these alleged historical violations for the Big Spring refinery was lodged with the United States District Court for the Northern District of Texas on June 6, 2017, and we expect that Consent Decree to become final later this year. If finalized, the Consent Decree will require payment of a $456,250 civil penalty and capital expenditures for pollution control equipment that may be significant over the next 5 years.
In 2015, EPA finalized reductions in the National Ambient Air Quality Standard (NAAQS) for ozone, from 75 ppb to 70 ppb. Our Tyler refinery is likely to be located in an area reclassified as non-attainment with the new standard. While we do not yet know what specific actions we will be required to take or when, it is possible we will have to install additional air pollution control equipment for ozone forming emissions or change the formulation of gasoline we make for use in some areas. We do not believe such capital expenditures or the changes in our operation will result in a material adverse effect on our business.
In late 2015, the EPA finalized additional rules regulating refinery air emissions from a variety of sources (such as cokers, flares, tanks, and other process units) through additional NSPS and National Emission Standards for Hazardous Air Pollutants and changing the way emissions from startup, shutdown and malfunction operations are regulated (the "Refinery Risk and Technology Review Rules" or “RTR”). The RTR rule also requires that starting in January 2018 we monitor property line benzene concentrations at our refineries and starting in 2019 report those concentrations quarterly to EPA, which will make the results available to the public. Even though the concentrations are not expected to exceed regulatory or health based standards, the availability of such data may increase the likelihood of lawsuits against our refineries by the local public or organized public interest groups. Compliance with the rules will require additional capital projects and changes in the way we operate some equipment over the next three years but is not expected to have a material adverse effect on our business, financial condition or results of operations.
In addition to our operations, many of the fuel products we manufacture are subject to requirements of the CAA as well as related state and local laws and regulations. The EPA has the authority under the CAA to modify the formulation of the refined transportation fuel products we manufacture in order to limit the emissions associated with their final use. In 2007, the EPA issued final Mobile Source Air Toxic II rules for gasoline formulation that required the reduction of average benzene content beginning January 1, 2011 and the reduction of maximum annual average benzene content by July 1, 2012. We have purchased credits in the past to comply with these content requirements for two of our
refineries. Although credits have been readily available, there can be no assurance that such credits will continue to be available for purchase at reasonable prices or at all and we could have to implement capital projects in the future to reduce benzene levels.
In March 2014, the EPA issued final Tier 3 gasoline rules that require a reduction in annual average gasoline sulfur content from 30 ppm to 10 ppm by January 1, 2017 for "large refineries" and retains the current maximum per-gallon sulfur content limit of 80 ppm. Under the final rules, all of our refineries are considered “small refineries” and are exempt from complying with the rules' requirements until January 1, 2020. We anticipate that our refineries will meet these new limits when they become effective and that capital spending at our refineries over the next two to three years may be significant. In April 2016, EPA finalized a change to the Tier 3 standard requiring small volume refineries that increase their annual average crude processing rate above 75,000 bpd to meet the Tier 3 sulfur limits 30 months from that “disqualifying” date. We do not anticipate that this rule change will affect our refineries.
Our operations are also subject to the Federal Clean Water Act (“CWA”), the Oil Pollution Act of 1990 (“OPA-90”) and comparable state and local requirements. The CWA and similar laws prohibit any discharge into surface waters, ground waters, injection wells and publicly-owned treatment works except as allowed by pre-treatment permits and National Pollutant Discharge Elimination System (“NPDES”) permits, issued by federal, state and local governmental agencies. The OPA-90 prohibits the discharge of oil into Waters of the U.S. and requires that affected facilities have plans in place to respond to spills and other discharges. The CWA also regulates filling or discharges to wetlands and other Waters of the U.S. In 2015, the EPA, in conjunction with the Army Corps of Engineers, issued a final rule regarding the definition of “Waters of the U.S.,” which expanded the regulatory reach of the existing clean water regulations. Although the final rule is currently stayed pending litigation, if the rule becomes enforceable, it could increase costs for expanding our facilities or constructing new facilities, including pipelines.
We are subject to regulation by the United States Department of Transportation and various state agencies in connection with our pipeline, trucking and rail transportation operations. These regulatory authorities exercise broad powers, governing activities such as the authorization to operate hazardous materials pipelines and engage in motor carrier operations. There are additional regulations specifically relating to the transportation industry, including integrity management of pipelines, testing and specification of equipment, product handling and labeling requirements and personnel qualifications. The transportation industry is subject to possible regulatory and legislative changes that may affect the economics of our business by requiring changes in operating practices or pipeline construction or by changing the demand for common or contract carrier services or the cost of providing truckload services. Possible changes include, among other things, increasingly stringent environmental regulations, increased frequency and stringency for testing and repairing pipelines, replacement of older pipelines, changes in the hours of service regulations that govern the amount of time a driver may drive in any specific period, onboard black box recorder devices or limits on vehicle weight and size and properties of the materials that can be shipped. Required changes to the specifications governing rail cars carrying crude oil will eliminate the most commonly used tank car or require that such cars be upgraded. In January 2017, PHMSA announced they were considering limits on the volatility of crude oil that could be shipped by rail and other modes of transportation. These rules could limit the availability of tank cars to transport crude to our refineries and increase the cost of crude oil transported by rail or truck. In addition to the substantial remediation costs that could be caused by leaks or spills from our pipelines, regulators could prohibit our use of affected portions of the pipeline for extended periods thereby interrupting the delivery of crude oil to, or the distribution of refined products from, our refineries.
Our operations are subject to various laws and regulations relating to occupational health and safety and process safety administered by OSHA, EPA and various state equivalent agencies. We maintain safety, training, design standards, mechanical integrity and maintenance programs as part of our ongoing efforts to ensure compliance with applicable laws and regulations and protect the safety of our workers and the public. More stringent laws or regulations or adverse changes in the interpretation of existing laws or regulations by government agencies could have an adverse effect on our financial position and the results of our operations and could require substantial expenditures for the installation and operation of systems and equipment.
Health and safety legislation and regulations change frequently. We cannot predict what additional health and safety legislation or regulations will be enacted or become effective in the future or how existing or future laws or regulations will be administered or interpreted with respect to our operations. Compliance with applicable health and safety laws and regulations has required and continues to require substantial expenditures. Future process safety rules could also mandate changes to the way we operate, the processes and chemicals we use and the materials from which our process units are constructed. Such regulations could have a significant negative effect on our operations and profitability. For example, in response to Executive Order 13650, Improving Chemical Facility Safety and Security, OSHA announced it intends to propose comprehensive changes to process safety requirements. In January 2017, the EPA finalized changes to process safety requirements in its Risk Management Program rules that require evaluation of safer alternatives and technologies, expanded routine audits, independent third party audits following certain process safety events and increased sharing of information with the public and emergency response organizations. Pending reconsideration of this rule, EPA has subsequently delayed the effective date until 2019.
Environmental regulations are becoming more stringent and new environmental laws and regulations are continuously being enacted or proposed. Compliance with any future legislation or regulation of our produced fuels, including renewable fuel or carbon content; greenhouse gas ("GHG") emissions; sulfur, benzene or other toxic content; vapor pressure; octane; or other fuel characteristics, may result in increased capital and operating costs and may have a material adverse effect on our results of operations and financial condition. While it is impractical
to predict the impact that potential regulatory and activist activity may have, such future activity may result in increased costs to operate and maintain our facilities, as well as increased capital outlays to improve our facilities. Such future activity could also adversely affect our ability to expand production, result in damaging publicity about us, or reduce demand for our products. Our need to incur costs associated with complying with any resulting new legal or regulatory requirements that are substantial and not adequately provided for, could have a material adverse effect on our business, financial condition and results of operations.
The Dodd-Frank Wall Street Reform and Consumer Protection Act (the "Dodd-Frank Act") is comprehensive financial reform legislation that, among other things, establishes comprehensive federal oversight and regulation of over-the-counter derivatives and many of the entities that participate in that market. Although the Dodd-Frank Act was enacted on July 21, 2010, the Commodity Futures Trading Commission, or CFTC, and the SEC, along with certain other regulators, must promulgate final rules and regulations to implement many of the Dodd-Frank Act's provisions relating to over-the-counter derivatives. While some of these rules have been finalized, others have not; and, as a result, the final form and timing of the implementation of the new regulatory regime affecting commodity derivatives remains uncertain.
Finally, the Patient Protection and Affordable Care Act (the “ACA”) as well as other healthcare reform legislation being considered by Congress and state legislatures may have an impact on our business. Although many of the rules, reforms and regulations required to implement the ACA have not yet been adopted, and consequently the precise costs of complying with the ACA remain unknown, an increase in our employee healthcare-related costs appears likely and that increase could be extensive and changes to our healthcare cost structure could have a significant, negative impact on our business.
We may incur significant costs and liabilities with respect to investigation and remediation of environmental conditions at our refineries.
Prior to our purchase of our refineries and terminals, the previous owners had been engaged for many years in the investigation and remediation of hydrocarbons and other materials which contaminated soil and groundwater at the purchased facilities. Upon purchase of the facilities, we became responsible and liable for certain costs associated with the continued investigation and remediation of known and unknown impacted areas at the refineries. In the future, it may be necessary to conduct further assessments and remediation efforts at impacted areas at our refinery, pipeline, tank, terminal and store locations and elsewhere. In addition, we have identified and self-reported certain other environmental matters subsequent to our purchase of the refineries.
Based upon environmental evaluations performed internally and by third parties we recorded and periodically update environmental liabilities and accrued amounts we believe are sufficient to complete remediation. We expect remediation of soil, sediment and groundwater at some properties to continue for the foreseeable future. The need to make future expenditures for these purposes that exceed the amounts we estimated and accrued for could have a material adverse effect on our business, financial condition and results of operations.
Alon indemnified certain parties to which they sold assets for costs and liabilities that may be incurred as a result of environmental conditions existing at the time of the sale. As a result of our purchase of Alon, if we are forced to incur costs or pay liabilities in connection with these indemnifications, such costs and payments could be significant and adversely affect our business, results of operations and cash flows.
In the future, we may incur substantial expenditures for investigation or remediation of contamination that has not been discovered at our current or former locations or locations that we may acquire. Our handling and storage of petroleum and hazardous substances may lead to additional contamination at our facilities or along our pipelines and at facilities to which we send or have sent wastes or by-products for treatment of disposal. In addition, new legal requirements, new interpretations of existing legal requirements, increased legislative activity and governmental enforcement and other developments could require us to make additional unforeseen expenditures. As a result, we may be subject to additional investigation and cleanup costs, governmental penalties and third party suits alleging personal injury and property damage. Joint and several strict liability may be incurred in connection with releases of petroleum hydrocarbons, hazardous substances and/or wastes. Liabilities for future remediation costs are recorded when environmental assessments and/or remedial efforts are probable and the costs can be reasonably estimated as material. Other than for assessments, the timing and magnitude of these accruals generally are based on the completion of investigations or other studies or a commitment to a formal plan of action.
Adverse weather conditions or other unforeseen developments could damage our facilities, reduce customer traffic and impair our ability to produce and deliver refined petroleum products or receive supplies for our retail fuel and convenience stores.
The regions in which we operate are susceptible to severe storms, including hurricanes, thunderstorms, tornadoes, floods, extended periods of rain, ice storms and snow, all of which we have experienced in the past few years. Our refineries located in California and the related pipeline and asphalt terminals are located in areas with a history of earthquakes, some of which have been quite severe. In addition, for a variety of reasons, many members of the scientific community believe that climate changes are occurring that could have significant physical effects, such as increased frequency and severity of storms, droughts and floods and other climatic events. If any such effects were to occur, they could have an adverse effect on our assets and operations.
Inclement weather conditions, earthquakes or other unforeseen developments could damage our facilities, interrupt production, adversely impact consumer behavior, travel and retail fuel and convenience store traffic patterns or interrupt or impede our ability to operate our locations. If such conditions prevail near our refineries, they could interrupt or undermine our ability to produce and transport products from our refineries and receive and distribute products at our terminals. Regional occurrences, such as energy shortages or increases in energy prices, fires and other natural disasters, could also hurt our business. The occurrence of any of these developments could have a material adverse effect on our business, financial condition and results of operations.
Shareholder litigation against us and certain of our current or Our former directors could divert management time and result in the payment of damages if the plaintiffs are successful.
As more fully described in a Form 8-K filed by Old Delek on June 19, 2017, in June 2017, three purported stockholders of Alon and one purported stockholder of Old Delek filed four lawsuits in connection with the Delek/Alon Merger. Three of the lawsuits, Stephen Page v. Alon USA Energy Inc., et al., Case No. 1:17-cv-00671-RGA (D. Del.), David Phelps v. Delek US Holdings, Inc., et al., Case No. 3:17-cv-00910 (M.D. Tenn.) and Joseph Adler v. Alon USA Energy, Inc., et al., Case No. 1:17-cv-00742-UNA (D. Del.), alleged that the defendants violated Section 14(a) of the Exchange Act, and Rule 14a-9 promulgated thereunder, by filing the joint proxy statement/prospectus relating to the proposed Delek/Alon Merger which allegedly failed to disclose and/or misrepresented material information about the proposed Alon/Delek Merger. Each of Old Delek and Alon determined to voluntarily supplement the joint proxy statement/prospectus by filing Current Reports on Form 8-K in order to moot certain of the plaintiffs’ disclosure claims, alleviate the costs, risks and uncertainties inherent in litigation and provide additional information to their respective stockholders. To date, the Page and Phelps lawsuits have been dismissed with prejudice, subject to the plaintiffs’ right to seek a “mootness” fee.
The fourth lawsuit, Arkansas Teacher Retirement System v. Alon USA Energy, Inc., et al., Case No. 2017-0453, filed in the Delaware Court of Chancery, alleges breach of fiduciary duty claims. Specifically, it alleges that Old Delek used its position as a purportedly controlling stockholder of Alon’s to obtain buyout terms from Alon at an unfairly discounted price, and that the defendant Alon directors breached their fiduciary duties allegedly owed to the plaintiff stockholder and purported class by engaging in conduct that led to the sale of Alon’s shares at an unfairly discounted price. The plaintiff has asked the Delaware Chancery Court to, among other things, award damages to the plaintiff and purported class in an amount to be determined at trial, award additional shares of our common stock tomade during the plaintiff and purported class and award the plaintiff attorneys’ and experts’ fees. Although we believe the plaintiff’s claims are without merit, we cannot predict the outcomethree months ended March 31, 2019 by or on behalf of us or estimate the possible loss or range of loss from this litigation.
The defense or settlementany “affiliated purchaser,” as defined by Rule 10b-18 of the shareholder actions disclosed above could be time-consuming and expensive, and divert the attentionExchange Act (inclusive of our management away from operating the business. If any one or moreall purchases that have settled as of these legal proceedings is adversely resolved against us, it could have an adverse effect on our financial condition, results of operations or liquidity.
The termination or expiration of our supply and offtake agreements could have a material adverse effect on our liquidity.
Our supply and offtake agreements with J. Aron, have expiration dates ranging from May 2019 to May 2021. Pursuant to the agreements, J. Aron purchases a substantial portion of the crude oil and refined products in our refineries’ inventory at market prices. Upon any termination of the agreements, including at expiration or in connection with a force majeure or default, the parties are required to negotiate with third parties for the assignment to us of certain contracts, commitments and arrangements, including procurement contracts, commitments for the sale of product and pipeline, terminalling, storage and shipping arrangements. Additionally, upon any termination, we will be required to repurchase or refinance the consigned crude oil and refined products from J. Aron at then market prices, which may have a material impact on our working capital needs.
We conduct our convenience store business under a license agreement with 7-Eleven, and the loss of this license could adversely affect the results of operations of our retail segment.
Our convenience store operations are primarily conducted under the 7-Eleven name pursuant to a license agreement between 7-Eleven, Inc. and Alon. 7-Eleven may terminate the agreement if Alon defaults on its obligations under the agreement. This termination would result in our convenience stores losing the use of the 7-Eleven brand name, the accompanying 7-Eleven advertising and certain other brand names and products used exclusively by 7-Eleven. Termination of the license agreement could have a material adverse effect on our retail operations.
March 31, 2019):
|
| | | | | | | | | | | | | | |
| Period | | Total Number of Shares Purchased | | Average Price Paid per Share | | Total Number of Shares Purchased as Part of Publicly Announced Plans or Programs | | Approximate Dollar Value of Shares that May Yet Be Purchased Under the Plans or Programs |
| January 1 - January 31, 2019 | | — |
| | $ | — |
| | — |
| | $ | 409,722,408 |
|
| February 1 - February 28, 2019 | | 155,457 |
| | 37.11 |
| | 155,457 |
| | 403,953,220 |
|
| March 1 - March 31, 2019 | | 1,136,187 |
| | 35.54 |
| | 1,136,187 |
| | $ | 363,568,989 |
|
| Total | | 1,291,644 |
| | 35.73 |
| | 1,291,644 |
| | N/A |
We rely on information technology in our operations, and any material failure, inadequacy, interruption or security failure of that technology could harm our business.
We rely on information technology systems across our operations, including management of our supply chain, point of sale processing at our retail sites and various other processes and transactions. We rely on commercially available systems, software, tools and monitoring to provide security for processing, transmission and storage of confidential customer information, such as payment card and personal credit information.
In addition, the systems currently used for certain transmission and approval of payment card transactions, and the technology utilized in payment cards themselves, may put certain payment card data at risk. These standards for determining the required controls applicable to these systems are mandated by credit card issuers and administered by the Payment Card Industry Security Standards Counsel and not by us. The regulatory environment surrounding information security and privacy is increasingly demanding, with the frequent imposition of new and constantly changing requirements. We have taken the necessary steps to comply with the Payment Card Industry Data Security Standards (PCI-DSS) at all of our locations. However, compliance with these requirements may result in cost increases due to necessary systems changes and the development of new administrative processes.
In recent years, several retailers have experienced data breaches resulting in the exposure of sensitive customer data, including payment card information. Any compromise or breach of our information and payment technology systems could cause interruptions in our operations, damage our reputation, reduce our customers' willingness to visit our sites and conduct business with them, or expose us to litigation from customers or sanctions for violations of the PCI-DSS. In addition, a compromise of our internal data network at any of our refining or terminal locations may have disruptive impacts similar to that of our retail operations. These disruptions could range from inconvenience in accessing business information to a disruption in our refining operations. Cost increases may be incurred in this area to combat the continued escalation of cyber-attacks and/or disruptive criminal activity.
Also, we utilize information technology systems and controls that monitor the movement of petroleum products through our pipelines and terminals. An undetected failure of these systems could result in environmental damage, operational disruptions, regulatory enforcement or private litigation. Further, the failure of any of our systems to operate effectively, or problems we may experience with transitioning to upgraded or replacement systems, could significantly harm our business and operations and cause us to incur significant costs to remediate such problems.
A substantial portion of the workforce at our refineries is unionized, and we may face labor disruptions that would interfere with our operations.
As of September 30, 2017, we employed 315 and 455 people in our Tyler and El Dorado operations, respectively. From among these employees, 172 operations, maintenance and warehouse hourly employees and 43 truck drivers at the Tyler refinery were represented by the United Steel, Paper and Forestry, Rubber, Manufacturing, Energy, Allied Industrial and Service Workers International Union and its Local 202. The Tyler operations, maintenance and warehouse hourly employees are currently covered by a collective bargaining agreement that expires January 31, 2019. The Tyler truck drivers are currently covered by a collective bargaining agreement that expires March 1, 2018. As of September 30, 2017, 177 operations and maintenance hourly employees at the El Dorado refinery were represented by the International Union of Operating Engineers and its Local 381. These employees are covered by a collective bargaining agreement which expires on August 1, 2021. Although these collective bargaining agreements contain provisions to discourage strikes or work stoppages, we cannot assure you that strikes or work stoppages will not occur. As of September 30, 2017, 39 of our El Dorado based drivers for Lion Oil Company were represented by the United Steel, Paper and Forestry, Rubber, Manufacturing, Energy, Allied Industrial and Service Workers International, AFL-CIO and four of our El Dorado refinery warehouse hourly employees were represented by the International Union of Operating Engineers and its Local 381. Negotiations toward collective bargaining agreements with the new bargaining units is underway. A strike or work stoppage could have a material adverse effect on our business, financial condition and results of operations.
As of September 30, 2017, Alon employed approximately 195 people at its Big Spring refinery, approximately 134 of whom were covered by a collective bargaining agreement that expires April 1, 2019. Our current labor agreement may not prevent a strike or work stoppage in the future, and any such work stoppage could have a material adverse effect on our results of operations and financial condition.
Our retail segment is subject to loss of market share or pressure to reduce prices in order to compete effectively with a changing group of competitors in a fragmented retail industry.
The markets in which we operate our retail fuel and convenience stores are highly competitive and characterized by ease of entry and constant change in the number and type of retailers offering the products and services found in our stores. We compete with other convenience store chains, gas stations, supermarkets, drug stores, discount stores, dollar stores, club stores, mass merchants, fast food operations, independent owner-operators and other retail outlets. In some of our markets, our competitors have been in existence longer and have greater financial, marketing and other resources than us. In addition, independent owner-operators can generally operate stores with lower overhead costs than ours. As a result, our competitors may be able to respond better to changes in the economy and new opportunities within the industry.
Several non-traditional retailers, such as supermarkets, club stores and mass merchants, have affected the convenience store industry by entering the retail fuel business and/or selling merchandise traditionally found in convenience stores. Many of these competitors are substantially larger than we are. Because of their diversity, integration of operations and greater resources, these companies may be better able to withstand volatile market conditions or levels of low or no profitability. In addition, these retailers may use promotional pricing or discounts, both at the pump and in the store, to encourage in-store merchandise sales. These activities by our competitors could adversely affect our profit margins. Additionally, our convenience stores could lose market share, relating to both gasoline and merchandise, to these and other retailers, which could adversely affect our business, results of operations and cash flows. Our convenience stores compete in large part based on their ability to offer convenience to customers. Consequently, changes in traffic patterns and the type, number and location of competing stores could result in the loss of customers and reduced sales and profitability at affected stores. These non-traditional gasoline and/or convenience merchandise retailers may obtain a significant share of the retail fuels market, may obtain a significant share of the convenience store merchandise market and their market share in each market is expected to grow.
We may not be able to successfully execute our strategy of growth through acquisitions.
A significant part of our growth strategy is to acquire assets such as refineries, pipelines, terminals, and retail fuel and convenience stores that complement our existing assets and/or broaden our geographic presence. If attractive opportunities arise, we may also acquire assets in new lines of business that are complementary to our existing businesses. From our inception in 2001 through September 2017, we acquired the Tyler and El Dorado refineries, developed our logistics segment through the acquisition of transportation and marketing assets and acquired Alon USA. We expect to continue to acquire assets that complement our existing assets and/or broaden our geographic presence as a major element of our growth strategy. However, the occurrence of any of the following factors could adversely affect our growth strategy:
•We may not be able to identify suitable acquisition candidates or acquire additional assets on favorable terms;
•We usually compete with others to acquire assets, which competition may increase, and any level of competition could result in decreased availability or increased prices for acquisition candidates;
•We may experience difficulty in anticipating the timing and availability of acquisition candidates;
•We may not be able to obtain the necessary financing, on favorable terms or at all, to finance any of our potential acquisitions; and
•As a public company, we are subject to reporting obligations, internal controls and other accounting requirements with respect to any business we acquire, which may prevent or negatively affect the valuation of some acquisitions we might otherwise deem favorable or increase our acquisition costs.
Our operating results are seasonal and generally lower in the first and fourth quarters of the year for our refining and logistics segments and in the first quarter of the year for our retail segment. We depend on favorable weather conditions in the spring and summer months.
Demand for gasoline, convenience merchandise and asphalt products is generally higher during the summer months than during the winter months due to seasonal increases in motor vehicle traffic and road and home construction. Varying vapor pressure requirements between the summer and winter months also tighten summer gasoline supply. As a result, the operating results of our refining segment and logistics segment are generally lower for the first and fourth quarters of each year. Seasonal fluctuations in traffic also affect sales of motor fuels and merchandise in our retail fuel and convenience stores. As a result, the operating results of our retail segment are generally lower for the first quarter of the year.
Weather conditions in our operating area also have a significant effect on our operating results in our retail segment. Customers are more likely to purchase more gasoline and higher profit margin items such as fast foods, fountain drinks and other beverages during the spring and summer months. Unfavorable weather conditions during these months and a resulting lack of the expected seasonal upswings in traffic and sales could have a material adverse effect on our business, financial condition and results of operations.
We may seek to diversify our retail fuel and convenience store operations by entering new geographic areas, which may present operational and competitive challenges.
In the future, we may seek to grow by selectively operating stores in geographic areas other than those in which we currently operate, or in which we currently have a relatively small number of stores. This growth strategy would present numerous operational and competitive challenges to our senior management and employees and would place significant pressure on our operating systems. In addition, we cannot assure you that consumers located in the regions in which we may expand our operations would be as receptive to our stores as consumers in our existing markets. The success of any such growth plans will depend in part upon our ability to:
•select, and compete successfully in, new markets;
•obtain suitable sites at acceptable costs;
•identify and contract with financially stable developers;
•realize an acceptable return on the capital invested in new facilities;
•hire, train, and retain qualified personnel;
•integrate new retail fuel and convenience stores into our existing distribution, inventory control, and information systems;
•expand relationships with our suppliers or develop relationships with new suppliers; and
•secure adequate financing, to the extent required.
We cannot assure you that we will achieve our development goals, manage our growth effectively, or operate our existing and new retail fuel and convenience stores profitability. The failure to achieve any of the foregoing could have a material adverse effect on our business, financial condition and results of operations.
Our retail segment is dependent on fuel sales which makes us susceptible to increases in the cost of gasoline and interruptions in fuel supply.
Our dependence on fuel sales makes us susceptible to increases in the cost of gasoline and diesel fuel and fuel profit margins have a significant impact on our earnings. The volume of fuel sold by us and our fuel profit margins are affected by numerous factors beyond our control, including the supply and demand for fuel, volatility in the wholesale fuel market and the pricing policies of competitors in local markets. Although we can rapidly adjust our pump prices to reflect higher fuel costs, a material increase in the price of fuel could adversely affect demand. A material, sudden increase in the cost of fuel that causes our fuel sales to decline could have a material adverse effect on our business, financial condition and results of operations.
In addition, credit card interchange fees are typically calculated as a percentage of the transaction amount rather than a percentage of gallons sold, higher refined product prices often result in negative consequences for our retail operations such as higher credit card expenses, lower retail fuel gross margin per gallon and reduced demand for gasoline and diesel. These conditions could result in fewer retail gallons sold and fewer retail merchandise transactions, which could have a material adverse effect on our business, financial condition and results of operations.
Our dependence on fuel sales also makes us susceptible to interruptions in fuel supply. Gasoline sales generate customer traffic to our retail fuel and convenience stores and any decrease in gasoline sales, whether due to shortage or otherwise, could adversely affect our merchandise sales. A serious interruption in the supply of gasoline to our retail fuel and convenience stores could have a material adverse effect on our business, financial condition and results of operations.
If there is negative publicity concerning our brand names or the brand names of our suppliers, fuel and merchandise sales in our retail segment may suffer.
Negative publicity, regardless of whether the concerns are valid, concerning food, beverage, fuel or other product quality, food, beverage or other product safety or other health concerns, facilities, employee relations or other matters may materially and adversely affect demand for products offered at our stores and could result in a decrease in customer traffic to our stores. We offer food products in our stores that are marketed under our brand names and certain nationally recognized brands. These nationally recognized brands have significant operations at facilities owned and operated by third parties and negative publicity concerning these brands as a result of events that occur at facilities that we do not control could also adversely affect customer traffic to our stores. Additionally, we may be the subject of complaints or litigation arising from food or beverage-related illness or injury in general which could have a negative impact on our business. Health concerns, poor food, beverage, fuel or other product quality or operating issues stemming from one store or a limited number of stores can materially and adversely affect the operating results of some or all of our stores and harm our proprietary brands.
Wholesale cost increases, vendor pricing programs and tax increases applicable to tobacco products, as well as campaigns to discourage their use, could adversely impact our results of operations in our retail segment.
Increases in the retail price of tobacco products as a result of increased taxes or wholesale costs could materially impact our cigarette sales volume and/or revenues, merchandise gross profit and overall customer traffic. Cigarettes are subject to substantial and increasing excise taxes at both a state and federal level. In addition, national and local campaigns to discourage the use of tobacco products may have an adverse effect on demand for these products. A reduction in cigarette sales volume and/or revenues, merchandise gross profit from tobacco products or overall customer demand for tobacco products could have a material adverse effect on the business, financial condition and results of operations of our retail segment.
Major cigarette manufacturers currently offer substantial rebates to us; however, there can be no assurance that such rebate programs will continue. We include these rebates as a component of our gross margin from sales of cigarettes. In the event these rebates are decreased or eliminated, our wholesale cigarette costs will increase. For example, certain major cigarette manufacturers have offered rebate programs that provide rebates only if we follow the manufacturer's retail pricing guidelines. If we do not receive the rebates because we do not participate in the program or if the rebates we receive by participating in the program do not offset or surpass the revenue lost as a result of complying with the manufacturer's pricing guidelines, our cigarette gross margin will be adversely impacted. In general, we attempt to pass wholesale price increases on to our customers. However, competitive pressures in our markets may adversely impact our ability to do so. In addition, reduced retail display allowances on cigarettes offered by cigarette manufacturers negatively impact gross margins. These factors could materially impact our retail price of cigarettes, cigarette sales volume and/or revenues, merchandise gross profit and overall customer traffic, which could in turn have a material adverse effect on our business, financial condition and results of operations.
ITEM 5.OTHER INFORMATION
Dividend Declaration
On November 7, 2017, Delek'sApril 30, 2019, our Board of Directors voted to declare a quarterly cash dividend of $0.15$0.28 per share of our common stock, payable on December 15, 2017June 3, 2019 to shareholders of record on November 22, 2017.May 20, 2019.
ITEM 6.EXHIBITS
|
| | | | |
| Exhibit No. | | Description |
2.1 |
| ^# | | |
|
| ~# | | Amendment to Second Amended and Restated Supply and Offtake Agreement dated February 1, 2015 by and Plan of Merger dated as of January 2, 2017, among Delek US Holdings, Inc., Delek Holdco, Inc., Dione Mergeco, Inc., Astro Mergeco,between Alon Refining Krotz Springs, Inc. and Alon USA Energy, Inc. (incorporated by reference to Exhibit 2.1 to Old Delek’s Form 8-K filed on January 3, 2017).
J. Aron & Company.
|
2.2 |
| ~# | | | First Amendment to Second Amended and Restated Master Supply and Offtake Agreement and Plan of Merger dated as of February 27, 2017 among Delek US Holdings, Inc. Delek Holdco, Inc., Dion Mergco, Inc, Astro Mergco, Inc.J. Aron & Company, Lion Oil Company, and Alon USA Energy, Inc. (incorporated by reference to Exhibit 2.6 to Old Delek’s Form 10-K filed on February 28, 2017). |
2.3 |
| | | Second Amendment to Agreement and Plan of Merger dated as of April 21, 2017, among Delek US Holdings, Inc. Delek Holdco, Inc., Dion Mergco, Inc, Astro Mergco, Inc. and Alon USA Energy, Inc. (incorporated by reference to Annex B-2 to the Company’s Proxy Statement/Prospectus filed pursuant to Rule 424(b)(3) on May 30, 2017).
|
10.1 |
| | | First Supplemental Indenture, effective as of July 1, 2017, by and among Alon USA Energy, Inc., Delek US Holdings Inc. (f/k/a Delek Holdco, Inc.) and U.S. Bank National Association, as Trustee (incorporated by reference to Exhibit 10.1 to the Company’s Form 8-K12B filed on July 3, 2017). |
10.2 |
| § | | Alon USA Energy, Inc. Second Amended and Restated 2005 Incentive Compensation Plan, as amended (incorporated by reference to Exhibit 4.6 to the Company’s Form S-8 filed on July 10, 2017).
Lion Oil Trading & Transportation, LLC.
|
|
| § * | | Executive Employment Agreement, effective November 1, 2017, by and between Delek US Holdings, Inc. and Ezra Uzi Yemin. |
|
| *# | | Certification of the Company’s Chief Executive Officer pursuant to Rule 13a-14(a)/15(d)-14(a) under the Securities Exchange Act of 1934, as amended. |
|
| *# | | Certification of the Company’s Chief Financial Officer pursuant to Rule 13a-14(a)/15(d)-14(a) under the Securities Exchange Act of 1934, as amended. |
|
| **## | | Certification of the Company’s Chief Executive Officer pursuant to 18 U.S.C. Section 1350, as adopted pursuant to Section 906 of the Sarbanes-Oxley Act of 2002. |
|
| **## | | Certification of the Company’s Chief Financial Officer pursuant to 18 U.S.C. Section 1350, as adopted pursuant to Section 906 of the Sarbanes-Oxley Act of 2002. |
| 101 |
| | | The following materials from Delek US Holdings, Inc.’s Quarterly Report on Form 10-Q for the quarterly period ended September 30, 2017,March 31, 2019, formatted in XBRL (eXtensible Business Reporting Language): (i) Condensed Consolidated Balance Sheets as of September 30, 2017March 31, 2019 and December 31, 20162018 (Unaudited), (ii) Condensed Consolidated Statements of Income for the three and nine months ended September 30, 2017March 31, 2019 and 20162018 (Unaudited), (iii) Condensed Consolidated Statements of Comprehensive Income for the three ended March 31, 2019 and nine months ended September 30, 2017 and 20162018 (Unaudited), (iv) Condensed Consolidated Statements of Cash Flows for the ninethree months ended September 30, 2017March 31, 2019 and 20162018 (Unaudited), and (v) Notes to Condensed Consolidated Financial Statements (Unaudited). |
|
| | |
| # | | Filed herewith |
| ## | | Furnished herewith |
| ~ | | Certain confidential information contained in these exhibits has been omitted because it (i) is not material and (ii) would be competitively harmful if publicly disclosed. |
|
| |
§75 | | Management contract or compensatory plan or arrangement. |
| |
^ | Certain schedules and exhibits have been omitted pursuant to Item 601(b)(2) of Regulation S-K. The Company agrees to furnish supplementally a copy of any of the omitted schedules or exhibits upon request by the United States Securities and Exchange Commission, provided, however, that Delek may request confidential treatment pursuant to Rule 24b-2 of the Exchange Act, as amended, for any schedules or exhibits so furnished. |
SIGNATURES
Pursuant to the requirements of the Securities Exchange Act of 1934, the registrant has duly caused this report to be signed on its behalf by the undersigned, thereunto duly authorized.
|
| |
| Delek US Holdings, Inc. |
| | |
| By: | /s/ Ezra Uzi Yemin |
| | Ezra Uzi Yemin |
| | Director (Chairman), President and Chief Executive Officer (Principal Executive Officer) |
| | |
| By: | /s/ Kevin KremkeAssaf Ginzburg |
| | Kevin KremkeAssaf Ginzburg |
| | Executive Vice President and Chief Financial Officer (Principal Financial and Accounting Officer) |
Dated: November 9, 2017May 8, 2019