Washington, D.C. 20549
DELEK US HOLDINGS, INC.
(Former name, former address and former fiscal year, if changed since last report)
Indicate by check mark whether the registrant is a large accelerated filer, an accelerated filer, a non-accelerated filer, a smaller reporting company or an emerging growth company. See the definitions of "large accelerated filer," "accelerated filer," "smaller reporting company" and "emerging growth company" in Rule 12b-2 of the Exchange Act.
Financial Statements
Delek US Holdings, Inc.
Condensed Consolidated Statements of Income (Unaudited)
(In millions, except share and per share data)
| | | | | | | | | | | | | | | | | | | | | | | | | | |
| | Three Months Ended | | Nine Months Ended |
| | September 30, | | September 30, |
| | | 2021 | | 2020 | | 2021 | | 2020 |
| Net revenues | | $ | 2,956.5 | | | $ | 2,062.9 | | | $ | 7,540.2 | | | $ | 5,419.6 | |
| Cost of sales: | | | | | | | | |
| Cost of materials and other | | 2,670.1 | | | 1,875.9 | | | 6,871.4 | | | 5,064.3 | |
| Operating expenses (excluding depreciation and amortization presented below) | | 100.7 | | | 115.7 | | | 358.3 | | | 348.3 | |
| Depreciation and amortization | | 55.6 | | | 59.4 | | | 178.4 | | | 160.0 | |
| Total cost of sales | | 2,826.4 | | | 2,051.0 | | | 7,408.1 | | | 5,572.6 | |
| | | | | | | | |
| | | | | | | | |
| Operating expenses related to retail and wholesale business (excluding depreciation and amortization presented below) | | 22.1 | | | 24.0 | | | 74.9 | | | 73.7 | |
| General and administrative expenses | | 58.7 | | | 57.0 | | | 164.4 | | | 184.4 | |
| Depreciation and amortization | | 5.2 | | | 5.8 | | | 17.2 | | | 17.4 | |
| | | | | | | | |
| | | | | | | | |
| Other operating (income) expense, net | | (1.7) | | | 0.3 | | | (4.7) | | | (14.6) | |
| Total operating costs and expenses | | 2,910.7 | | | 2,138.1 | | | 7,659.9 | | | 5,833.5 | |
| Operating income (loss) | | 45.8 | | | (75.2) | | | (119.7) | | | (413.9) | |
| Interest expense | | 37.7 | | | 31.9 | | | 100.5 | | | 98.0 | |
| Interest income | | (0.2) | | | (0.9) | | | (0.5) | | | (3.1) | |
| Income from equity method investments | | (2.9) | | | (12.8) | | | (14.5) | | | (28.6) | |
| | | | | | | | |
| | | | | | | | |
| | | | | | | | |
| Loss (gain) on sale of non-operating refinery | | — | | | 0.1 | | | — | | | (56.8) | |
| | | | | | | | |
| | | | | | | | |
| Other income, net | | (21.8) | | | (1.0) | | | (16.0) | | | (3.4) | |
| Total non-operating expense, net | | 12.8 | | | 17.3 | | | 69.5 | | | 6.1 | |
| Income (loss) before income tax expense (benefit) | | 33.0 | | | (92.5) | | | (189.2) | | | (420.0) | |
| Income tax expense (benefit) | | 6.1 | | | (15.6) | | | (52.3) | | | (134.6) | |
| | | | | | | | |
| | | | | | | | |
| | | | | | | | |
| | | | | | | | |
| | | | | | | | |
| Net income (loss) | | 26.9 | | | (76.9) | | | (136.9) | | | (285.4) | |
| Net income attributed to non-controlling interests | | 8.8 | | | 11.2 | | | 24.7 | | | 29.4 | |
| Net income (loss) attributable to Delek | | $ | 18.1 | | | $ | (88.1) | | | $ | (161.6) | | | $ | (314.8) | |
| | | | | | | | |
| | | | | | | | |
| | | | | | | | |
| Basic income (loss) per share | | $ | 0.24 | | | $ | (1.20) | | | $ | (2.19) | | | $ | (4.28) | |
| | | | | | | | |
| | | | | | | | |
| | | | | | | | |
| Diluted income (loss) per share | | $ | 0.24 | | | $ | (1.20) | | | $ | (2.19) | | | $ | (4.28) | |
| | | | | | | | |
| | | | | | | | |
| | | | | | | | |
| Dividends declared per common share outstanding | | $ | — | | | $ | 0.31 | | | $ | — | | | $ | 0.93 | |
|
| | | | | | | | | | | | | | | | |
| | | Three Months Ended | | Nine Months Ended |
| | | September 30, | | September 30, |
| | | 2017 | | 2016 | | 2017 | | 2016 |
| Net sales | | $ | 2,341.5 |
| | $ | 1,079.9 |
| | $ | 4,754.3 |
| | $ | 3,113.3 |
|
| Operating costs and expenses: | | | | | | | | |
| Cost of goods sold | | 1,988.1 |
| | 965.6 |
| | 4,181.6 |
| | 2,806.7 |
|
| Operating expenses | | 153.2 |
| | 61.0 |
| | 276.5 |
| | 187.8 |
|
| Insurance proceeds — business interruption | | — |
| | — |
| | — |
| | (42.4 | ) |
| General and administrative expenses | | 61.8 |
| | 24.9 |
| | 115.8 |
| | 77.5 |
|
| Depreciation and amortization | | 46.9 |
| | 29.0 |
| | 105.4 |
| | 86.6 |
|
| Other operating expense, net | | 0.7 |
| | 2.2 |
| | 1.0 |
| | 2.2 |
|
| Total operating costs and expenses | | 2,250.7 |
| | 1,082.7 |
| | 4,680.3 |
| | 3,118.4 |
|
| Operating income (loss) | | 90.8 |
| | (2.8 | ) | | 74.0 |
| | (5.1 | ) |
| Interest expense | | 34.1 |
| | 13.9 |
| | 62.5 |
| | 40.7 |
|
| Interest income | | (0.9 | ) | | (0.2 | ) | | (2.7 | ) | | (0.9 | ) |
| (Income) loss from equity method investments | | (5.1 | ) | | 5.1 |
| | (9.7 | ) | | 33.7 |
|
| Loss on impairment of equity method investment | | — |
| | 245.3 |
| | — |
| | 245.3 |
|
| Gain on remeasurement of equity method investment | | (190.1 | ) | | — |
| | (190.1 | ) | | — |
|
| Other expense, net | | 0.8 |
| | 0.1 |
| | 0.9 |
| | 0.6 |
|
| Total non-operating (income) expenses, net | | (161.2 | ) | | 264.2 |
| | (139.1 | ) | | 319.4 |
|
| Income (loss) from continuing operations before income tax expense (benefit) | | 252.0 |
| | (267.0 | ) | | 213.1 |
| | (324.5 | ) |
| Income tax expense (benefit) | | 133.5 |
| | (103.3 | ) | | 111.5 |
| | (136.8 | ) |
| Income (loss) from continuing operations | | 118.5 |
| | (163.7 | ) | | 101.6 |
| | (187.7 | ) |
| Discontinued operations: | | | | | | | | |
| (Loss) income from discontinued operations | | (6.4 | ) | | 9.2 |
| | (6.4 | ) | | 8.1 |
|
| Income tax (benefit) expense | | (2.3 | ) | | 3.2 |
| | (2.3 | ) | | 2.6 |
|
| (Loss) income from discontinued operations, net of tax | | (4.1 | ) | | 6.0 |
| | (4.1 | ) | | 5.5 |
|
| Net income (loss) | | 114.4 |
| | (157.7 | ) | | 97.5 |
| | (182.2 | ) |
| Net income attributed to non-controlling interest | | 10.0 |
| | 4.0 |
| | 19.8 |
| | 15.7 |
|
| Net income (loss) attributable to Delek | | $ | 104.4 |
| | $ | (161.7 | ) | | $ | 77.7 |
| | $ | (197.9 | ) |
| Basic income (loss) per share: | | | | | | | | |
| Income (loss) from continuing operations | | $ | 1.35 |
| | $ | (2.71 | ) | | $ | 1.20 |
| | $ | (3.28 | ) |
| (Loss) income from discontinued operations | | $ | (0.05 | ) | | $ | 0.10 |
| | $ | (0.06 | ) | | $ | 0.09 |
|
| Total basic income (loss) per share | | $ | 1.30 |
| | $ | (2.61 | ) | | $ | 1.14 |
| | $ | (3.19 | ) |
| Diluted income (loss) per share: | | | | | | | | |
| Income (loss) from continuing operations | | $ | 1.34 |
| | $ | (2.71 | ) | | $ | 1.19 |
| | $ | (3.28 | ) |
| (Loss) income from discontinued operations | | $ | (0.05 | ) | | $ | 0.10 |
| | $ | (0.06 | ) | | $ | 0.09 |
|
| Total diluted income (loss) per share | | $ | 1.29 |
| | $ | (2.61 | ) | | $ | 1.13 |
| | $ | (3.19 | ) |
| Weighted average common shares outstanding: | | | | | | | | |
| Basic | | 80,581,762 |
| | 61,834,968 |
| | 68,272,918 |
| | 61,931,040 |
|
| Diluted | | 81,245,405 |
| | 61,834,968 |
| | 68,975,974 |
| | 61,931,040 |
|
| Dividends declared per common share outstanding | | $ | 0.15 |
| | $ | 0.15 |
| | $ | 0.45 |
| | $ | 0.45 |
|
See accompanying notes to condensed consolidated financial statements
Delek US Holdings, Inc.
Condensed Consolidated Statements of Changes in Stockholders' Equity (Unaudited)
(In millions, except share and per share data)
| | | | | | | | | | | | | | | | | | | | | | | | | | | | | | | | | | | | | | | | | | | | | | | | | | | | | | | | |
| | Three Months Ended September 30, 2021 |
| | Common Stock | | Additional Paid-in Capital | | Accumulated Other Comprehensive Income | | Retained Earnings | | Treasury Stock | | Non-Controlling Interest in Subsidiaries | | Total Stockholders' Equity |
| | Shares | | Amount | | Shares | | Amount | |
| Balance at June 30, 2021 | | 91,637,661 | | $ | 0.9 | | | $ | 1,192.6 | | | $ | (7.4) | | | $ | 342.0 | | | (17,575,527) | | $ | (694.1) | | | $ | 118.4 | | | $ | 952.4 | |
| | | | | | | | | | | | | | | | | |
| Net income | | — | | — | | | — | | | — | | | 18.1 | | | — | | | — | | | 8.8 | | | 26.9 | |
| | | | | | | | | | | | | | | | | | |
| | | | | | | | | | | | | | | | | | |
| | | | | | | | | | | | | | | | | | |
| Distributions to non-controlling interests | | — | | — | | | — | | | — | | | — | | | — | | | — | | | (8.2) | | | (8.2) | |
| Equity-based compensation expense | | — | | — | | | 6.8 | | | — | | | — | | | — | | | — | | | 0.1 | | | 6.9 | |
| | | | | | | | | | | | | | | | | | |
| | | | | | | | | | | | | | | | | | |
| | | | | | | | | | | | | | | | | | |
| Taxes paid due to the net settlement of equity-based compensation | | — | | — | | | (0.4) | | | — | | | — | | | — | | | — | | | — | | | (0.4) | |
| Exercise of equity-based awards | | 62,803 | | — | | | — | | | — | | | — | | | — | | | — | | | — | | | — | |
| Other | | — | | — | | | 0.2 | | | — | | | — | | | — | | | — | | | (0.2) | | | — | |
| Balance at September 30, 2021 | | 91,700,464 | | | $ | 0.9 | | | $ | 1,199.2 | | | $ | (7.4) | | | $ | 360.1 | | | (17,575,527) | | | $ | (694.1) | | | $ | 118.9 | | | $ | 977.6 | |
| | | | | | | | | | | | | | | | | | | | | | | | | | | | | | | | | | | | | | | | | | | | | | | | | | | | | | | | |
| | Three Months Ended September 30, 2020 |
| | Common Stock | | Additional Paid-in Capital | | Accumulated Other Comprehensive Income | | Retained Earnings | | Treasury Stock | | Non-Controlling Interest in Subsidiaries | | Total Stockholders' Equity |
| | Shares | | Amount | | | | | Shares | | Amount | | |
| Balance at June 30, 2020 | | 91,232,964 | | | $ | 0.9 | | | $ | 1,160.1 | | | $ | 0.5 | | | $ | 926.4 | | | (17,575,527) | | | $ | (694.1) | | | $ | 165.5 | | | $ | 1,559.3 | |
| Net (loss) income | | — | | | — | | | — | | | — | | | (88.1) | | | — | | | — | | | 11.2 | | | (76.9) | |
| Other comprehensive loss related to commodity contracts, net | | — | | | — | | | — | | | (0.5) | | | — | | | — | | | — | | | — | | | (0.5) | |
| Common stock dividends ($0.31 per share) | | — | | | — | | | — | | | — | | | (23.0) | | | — | | | — | | | — | | | (23.0) | |
| Distribution to non-controlling interest | | — | | | — | | | — | | | — | | | — | | | — | | | — | | | (8.2) | | | (8.2) | |
| Equity-based compensation expense | | — | | | — | | | 6.7 | | | — | | | — | | | — | | | — | | | — | | | 6.7 | |
| Repurchases of non-controlling interests | | — | | | — | | | (23.5) | | | — | | | — | | | — | | | — | | | 0.4 | | | (23.1) | |
| Impact from IDR Simplification transaction of Delek Logistics LP | | — | | | — | | | 37.2 | | | — | | | — | | | — | | | — | | | (50.8) | | | (13.6) | |
| Taxes paid due to the net settlement of equity-based compensation | | — | | | — | | | (0.4) | | | — | | | — | | | — | | | — | | | — | | | (0.4) | |
| Exercise of equity-based awards | | 68,265 | | | — | | | — | | | — | | | — | | | — | | | — | | | — | | | — | |
| | | | | | | | | | | | | | | | | | |
| Balance at September 30, 2020 | | 91,301,229 | | | $ | 0.9 | | | $ | 1,180.1 | | | $ | — | | | $ | 815.3 | | | (17,575,527) | | | $ | (694.1) | | | $ | 118.1 | | | $ | 1,420.3 | |
Delek US Holdings, Inc.
Condensed Consolidated Statements of Changes in Stockholders' Equity (Unaudited)
(In millions, except share and per share data)
| | | | | | | | | | | | | | | | | | | | | | | | | | | | | | | | | | | | | | | | | | | | | | | | | | | | | | | | |
| | Nine Months Ended September 30, 2021 |
| | Common Stock | | Additional Paid-in Capital | | Accumulated Other Comprehensive Income | | Retained Earnings | | Treasury Stock | | Non-Controlling Interest in Subsidiaries | | Total Stockholders' Equity |
| | Shares | | Amount | | Shares | | Amount | |
| Balance at December 31, 2020 | | 91,356,868 | | $ | 0.9 | | | $ | 1,185.1 | | | $ | (7.2) | | | $ | 522.0 | | | (17,575,527) | | $ | (694.1) | | | $ | 118.4 | | | $ | 1,125.1 | |
| Net (loss) income | | — | | — | | | — | | | — | | | (161.6) | | | — | | | — | | | 24.7 | | | (136.9) | |
| Other comprehensive loss related to commodity contracts, net | | — | | — | | | — | | | (0.2) | | | — | | | — | | | — | | | — | | | (0.2) | |
| | | | | | | | | | | | | | | | | |
| | | | | | | | | | | | | | | | | | |
| Distributions to non-controlling interests | | — | | — | | | — | | | — | | | — | | | — | | | — | | | (24.1) | | | (24.1) | |
| Equity-based compensation expense | | — | | — | | | 17.3 | | | — | | | — | | | — | | | — | | | 0.1 | | | 17.4 | |
| | | | | | | | | | | | | | | | | |
| | | | | | | | | | | | | | | | | |
| | | | | | | | | | | | | | | | | |
| | | | | | | | | | | | | | | | | |
| | | | | | | | | | | | | | | | | |
| | | | | | | | | | | | | | | | | | |
| | | | | | | | | | | | | | | | | |
| | | | | | | | | | | | | | | | | |
| Taxes paid due to the net settlement of equity-based compensation | | — | | — | | | (3.4) | | | — | | | — | | | — | | | — | | | — | | | (3.4) | |
| Exercise of equity-based awards | | 343,596 | | | — | | | — | | | — | | | — | | | — | | | — | | | — | | | — | |
| Other | | — | | | — | | | 0.2 | | | — | | | (0.3) | | | — | | | — | | | (0.2) | | | (0.3) | |
| Balance at September 30, 2021 | | 91,700,464 | | | $ | 0.9 | | | $ | 1,199.2 | | | $ | (7.4) | | | $ | 360.1 | | | (17,575,527) | | | $ | (694.1) | | | $ | 118.9 | | | $ | 977.6 | |
| | | | | | | | | | | | | | | | | | | | | | | | | | | | | | | | | | | | | | | | | | | | | | | | | | | | | | | | |
| | Nine Months Ended September 30, 2020 |
| | Common Stock | | Additional Paid-in Capital | | Accumulated Other Comprehensive Income | | Retained Earnings | | Treasury Stock | | Non-Controlling Interest in Subsidiaries | | Total Stockholders' Equity |
| | Shares | | Amount | | | | | Shares | | Amount | | |
| Balance at December 31, 2019 | | 90,987,025 | | | $ | 0.9 | | | $ | 1,151.9 | | | $ | 0.1 | | | $ | 1,205.6 | | | (17,516,814) | | | $ | (692.2) | | | $ | 169.0 | | | $ | 1,835.3 | |
| Cumulative effect of adopting accounting principle regarding measurement of credit losses on financial instruments, net | | — | | | — | | | — | | | — | | | (6.5) | | | — | | | — | | | — | | | (6.5) | |
| Net (loss) income | | — | | | — | | | — | | | — | | | (314.8) | | | — | | | — | | | 29.4 | | | (285.4) | |
| Other comprehensive loss related to commodity contracts, net | | — | | | — | | | — | | | (0.2) | | | — | | | — | | | — | | | — | | | (0.2) | |
| | | | | | | | | | | | | | | | | |
| Common stock dividends ($0.93 per share) | | — | | | — | | | — | | | — | | | (69.0) | | | — | | | — | | | — | | | (69.0) | |
| Distribution to non-controlling interest | | — | | | — | | | — | | | — | | | — | | | — | | | — | | | (25.0) | | | (25.0) | |
| Equity-based compensation expense | | — | | | — | | | 17.6 | | | — | | | — | | | — | | | — | | | 0.1 | | | 17.7 | |
| Repurchase of common stock | | — | | | — | | | — | | | — | | | — | | | (58,713) | | | (1.9) | | | — | | | (1.9) | |
| Repurchases of non-controlling interests | | — | | | — | | | (24.3) | | | — | | | — | | | — | | | — | | | (4.6) | | | (28.9) | |
| Impact from IDR Simplification transaction of Delek Logistics LP | | — | | | — | | | 37.2 | | | — | | | — | | | — | | | — | | | (50.8) | | | (13.6) | |
| Taxes paid due to the net settlement of equity-based compensation | | — | | | — | | | (2.3) | | | — | | | — | | | — | | | — | | | — | | | (2.3) | |
| Exercise of equity-based awards | | 314,204 | | | — | | | — | | | — | | | — | | | — | | | — | | | — | | | — | |
| Other | | — | | | — | | | — | | | 0.1 | | | — | | | — | | | — | | | — | | | 0.1 | |
| Balance at September 30, 2020 | | 91,301,229 | | | $ | 0.9 | | | $ | 1,180.1 | | | $ | — | | | $ | 815.3 | | | (17,575,527) | | | $ | (694.1) | | | $ | 118.1 | | | $ | 1,420.3 | |
See accompanying notes to condensed consolidated financial statements
Delek US Holdings, Inc.
Condensed Consolidated Statements of Cash Flows (Unaudited)
(In millions)
| | | | | | | | | | | | | | |
| | | Nine Months Ended September 30, |
| | 2021 | | 2020 |
| Cash flows from operating activities: | | | | |
| Net loss | | $ | (136.9) | | | $ | (285.4) | |
| Adjustments to reconcile net loss to net cash provided by (used in) operating activities: | | | | |
| Depreciation and amortization | | 195.6 | | | 177.4 | |
| | | | |
| Non-cash lease expense | | 40.8 | | | 34.0 | |
| Deferred income taxes | | (50.3) | | | 32.9 | |
| | | | |
| Income from equity method investments | | (14.5) | | | (28.6) | |
| Dividends from equity method investments | | 19.0 | | | 21.6 | |
| Non-cash lower of cost or market/net realizable value adjustment | | (29.9) | | | 65.6 | |
| | | | |
| | | | |
| | | | |
| | | | |
| Gain on sale of non-operating refinery | | — | | | (56.8) | |
| | | | |
| | | | |
| | | | |
| | | | |
| Other | | 22.2 | | | 28.2 | |
| Changes in assets and liabilities: | | | | |
| Accounts receivable | | (473.6) | | | 268.9 | |
| Inventories and other current assets | | (186.0) | | | (42.1) | |
| Fair value of derivatives | | 22.4 | | | (0.5) | |
| Accounts payable and other current liabilities | | 662.2 | | | (464.9) | |
| Obligation under Supply and Offtake Agreements | | 130.8 | | | (154.1) | |
| Non-current assets and liabilities, net | | 8.4 | | | 4.0 | |
| | | | |
| | | | |
| Net cash provided by (used in) operating activities | | 210.2 | | | (399.8) | |
| Cash flows from investing activities: | | | | |
| | | | |
| Equity method investment contributions | | (1.6) | | | (30.8) | |
| Distributions from equity method investments | | 6.3 | | | 72.0 | |
| Purchases of property, plant and equipment | | (163.1) | | | (241.7) | |
| | | | |
| Purchase of intangible assets | | (0.8) | | | (2.6) | |
| Proceeds from sale of property, plant and equipment | | 11.6 | | | 0.2 | |
| | | | |
| Proceeds from sale of non-operating refinery | | — | | | 39.9 | |
| Insurance proceeds | | 4.4 | | | — | |
| | | | |
| | | | |
| | | | |
| Net cash used in investing activities | | (143.2) | | | (163.0) | |
| Cash flows from financing activities: | | | | |
| Proceeds from long-term revolvers | | 1,232.8 | | | 1,798.1 | |
| Payments on long-term revolvers | | (1,718.5) | | | (1,545.8) | |
| Proceeds from term debt | | 400.0 | | | 185.0 | |
| Payments on term debt | | (40.1) | | | (34.6) | |
| Proceeds from product financing agreements | | 667.8 | | | 222.0 | |
| Repayments of product financing agreements | | (532.2) | | | (79.4) | |
| | | | |
| Taxes paid due to the net settlement of equity-based compensation | | (3.4) | | | (2.3) | |
| | | | |
| Repurchase of common stock | | — | | | (1.9) | |
| Repurchase of non-controlling interest | | — | | | (28.9) | |
| Distribution to non-controlling interest | | (24.1) | | | (25.0) | |
| Impact of IDR Simplification transaction of Delek Logistics LP | | — | | | (2.1) | |
| Dividends paid | | — | | | (69.0) | |
| | | | |
| Deferred financing costs paid | | (6.2) | | | (0.7) | |
| | | | |
| | | | |
| Net cash (used in) provided by financing activities | | (23.9) | | | 415.4 | |
| Net increase (decrease) in cash and cash equivalents | | 43.1 | | | (147.4) | |
| Cash and cash equivalents at the beginning of the period | | 787.5 | | | 955.3 | |
| | | | |
| | | | |
| Cash and cash equivalents at the end of the period | | $ | 830.6 | | | $ | 807.9 | |
| | | | |
Delek US Holdings, Inc.
Condensed Consolidated Statements of Cash Flows (Unaudited) (continued)
(In millions)
| | | | | | | | | | | | | | |
| | |
| | | | |
| | Nine Months Ended September 30, |
| | 2021 | | 2020 |
| Supplemental disclosures of cash flow information: | | | | |
| Cash paid during the period for: | | | | |
| Interest, net of capitalized interest of $0.4 million and $0.2 million in the 2021 and 2020 periods, respectively | | $ | 79.1 | | | $ | 91.1 | |
| Income taxes | | $ | 4.1 | | | $ | 3.3 | |
| Non-cash investing activities: | | | | |
| | | | |
| | | | |
| Decrease in accrued capital expenditures | | $ | (1.5) | | | $ | (33.9) | |
| Non-cash financing activities: | | | | |
| | | | |
| Non-cash lease liability arising from obtaining right of use assets during the period | | $ | 44.0 | | | $ | 30.7 | |
| | | | |
| | | | |
| | | | |
| | | | |
See accompanying notes to condensed consolidated financial statements
Delek US Holdings, Inc.
Condensed Consolidated Statements of Comprehensive Income (Unaudited)
(In millions)
| | | | | | | | | | | | | | | | | | | | | | | | | | |
| | Three Months Ended | | Nine Months Ended |
| | September 30, | | September 30, |
| | | 2021 | | 2020 | | 2021 | | 2020 |
| Net income (loss) | | $ | 26.9 | | | $ | (76.9) | | | $ | (136.9) | | | $ | (285.4) | |
| Other comprehensive income (loss): | | | | | | | | |
| Commodity contracts designated as cash flow hedges: | | | | | | | | |
| | | | | | | | |
| | | | | | | | |
| Net loss related to commodity cash flow hedges | | — | | | (0.6) | | | (0.2) | | | (0.3) | |
| Income tax benefit | | — | | | (0.1) | | | — | | | (0.1) | |
| Net comprehensive loss on commodity contracts designated as cash flow hedges | | — | | | (0.5) | | | (0.2) | | | (0.2) | |
| | | | | | | | |
| | | | | | | | |
| | | | | | | | |
| | | | | | | | |
| | | | | | | | |
| | | | | | | | |
| | | | | | | | |
| | | | | | | | |
| | | | | | | | |
| | | | | | | | |
| | | | | | | | |
| | | | | | | | |
| | | | | | | | |
| | | | | | | | |
| | | | | | | | |
| | | | | | | | |
| | | | | | | | |
| | | | | | | | |
| | | | | | | | |
| | | | | | | | |
| | | | | | | | |
| | | | | | | | |
| | | | | | | | |
| Other (loss) income, net of taxes | | — | | | — | | | — | | | 0.1 | |
| Total other comprehensive loss | | — | | | (0.5) | | | (0.2) | | | (0.1) | |
| Comprehensive income (loss) | | 26.9 | | | (77.4) | | | (137.1) | | | (285.5) | |
| Comprehensive income attributable to non-controlling interest | | 8.8 | | | 11.2 | | | 24.7 | | | 29.4 | |
| Comprehensive income (loss) attributable to Delek | | $ | 18.1 | | | $ | (88.6) | | | $ | (161.8) | | | $ | (314.9) | |
|
| | | | | | | | | | | | | | | | |
| | | Three Months Ended September 30, | | Nine Months Ended September 30, |
| | | 2017 | | 2016 | | 2017 | | 2016 |
| Net income (loss) attributable to Delek | | $ | 104.4 |
| | $ | (161.7 | ) | | $ | 77.7 |
| | $ | (197.9 | ) |
| Other comprehensive income (loss): | | | | | | | | |
| Commodity contracts designated as cash flow hedges: | | | | | | | | |
| Unrealized gains (losses), net of ineffectiveness gains of $0.1 million and $0.5 million for the three and nine months ended September 30, 2017, respectively, and $2.2 million and $2.7 million for the three and nine months ended September 30, 2016, respectively | | 3.4 |
| | (2.2 | ) | | (6.4 | ) | | 5.7 |
|
| Realized (gains) losses reclassified to cost of goods sold | | (1.0 | ) | | 7.0 |
| | 38.5 |
| | 21.3 |
|
| Increase related to commodity cash flow hedges, net | | 2.4 |
| | 4.8 |
| | 32.1 |
| | 27.0 |
|
| Income tax expense | | (0.8 | ) | | (1.7 | ) | | (11.2 | ) | | (9.4 | ) |
| Net comprehensive income on commodity contracts designated as cash flow hedges | | 1.6 |
| | 3.1 |
| | 20.9 |
| | 17.6 |
|
| | | | | | | | | |
| Interest rate contracts designated as cash flow hedges: | | | | | | | | |
| Unrealized gains | | 0.1 |
| | — |
| | 0.1 |
| | — |
|
| Realized gains reclassified to interest expense | | 0.1 |
| | — |
| | 0.1 |
| | — |
|
| Increase related to interest rate cash flow hedges, net | | 0.2 |
| | — |
| | 0.2 |
| | — |
|
| Income tax expense | | (0.1 | ) | | — |
| | (0.1 | ) | | — |
|
| Net comprehensive income on interest rate contracts designated as cash flow hedges | | 0.1 |
| | — |
| | 0.1 |
| | — |
|
| | | | | | | | | |
| Foreign currency translation gain | | — |
| | — |
| | — |
| | 0.2 |
|
| | | | | | | | | |
| Other comprehensive income (loss) from equity method investments, net of tax expense of $2.2 million for the both the three and nine months ended September 30, 2017, and net of tax expense of a nominal amount and a benefit of $0.1 million for the three and nine months ended September 30, 2016 | | 4.1 |
| | 0.1 |
| | 4.1 |
| | (0.1 | ) |
| | | | | | | | | |
| Postretirement benefit plans: | | | | | | | | |
| Unrealized gain arising during the year related to: | | | | | | | | |
| Net actuarial gain | | 1.0 |
| | — |
| | 1.0 |
| | — |
|
| Curtailment gain | | 6.3 |
| | — |
| | 6.3 |
| | — |
|
| Gain reclassified to earnings: | | | | | | | | |
| Recognized due to curtailment | | (6.1 | ) | | — |
| | (6.1 | ) | | — |
|
| Increase related to postretirement benefit plans, net | | 1.2 |
| | — |
| | 1.2 |
| | — |
|
| Income tax expense | | (0.4 | ) | | — |
| | (0.4 | ) | | — |
|
| Net comprehensive income on postretirement benefit plans | | 0.8 |
| | — |
| | 0.8 |
| | — |
|
| Total other comprehensive income | | 6.6 |
| | 3.2 |
| | 25.9 |
| | 17.7 |
|
| Comprehensive income (loss) attributable to Delek | | $ | 111.0 |
| | $ | (158.5 | ) | | $ | 103.6 |
| | $ | (180.2 | ) |
See accompanying notes to condensed consolidated financial statements
Delek US Holdings, Inc.
Condensed Consolidated Statements of Cash Flows (Unaudited)
(In millions)
|
| | | | | | | | |
| | | Nine Months Ended September 30, |
| | | 2017 | | 2016 |
| Cash flows from operating activities: | | | | |
| Net income (loss) | | $ | 97.5 |
| | $ | (182.2 | ) |
| Adjustments to reconcile net income (loss) to net cash (used in) provided by operating activities: | | | | |
| Depreciation and amortization | | 105.4 |
| | 86.6 |
|
| Amortization of deferred financing costs and debt discount | | 5.3 |
| | 3.5 |
|
| Accretion of asset retirement obligations | | 0.4 |
| | 0.3 |
|
| Amortization of unfavorable contract liability | | (4.4 | ) | | — |
|
| Deferred income taxes | | 97.8 |
| | (138.6 | ) |
| (Income) loss from equity method investments | | (9.7 | ) | | 33.7 |
|
| Dividends from equity method investments | | 12.0 |
| | 15.2 |
|
| Loss on disposal of assets | | 1.0 |
| | 2.2 |
|
| Impairment of equity method investment | | — |
| | 245.3 |
|
| Gain on remeasurement of equity method investment |
| (190.1 | ) |
| — |
|
| Equity-based compensation expense | | 12.6 |
| | 12.5 |
|
| Income tax benefit of equity-based compensation | | — |
| | 2.0 |
|
| Loss (income) from discontinued operations | | 4.1 |
| | (5.5 | ) |
| Changes in assets and liabilities, net of acquisitions: | | |
| | |
|
| Accounts receivable | | (57.5 | ) | | 20.7 |
|
| Inventories and other current assets | | (38.1 | ) | | (35.7 | ) |
| Fair value of derivatives | | 18.9 |
| | 28.0 |
|
| Accounts payable and other current liabilities | | 6.6 |
| | 9.5 |
|
| Obligation under Supply and Offtake Agreement | | 64.1 |
| | (0.5 | ) |
| Non-current assets and liabilities, net | | (35.4 | ) | | (1.7 | ) |
| Cash provided by operating activities - continuing operations | | 90.5 |
| | 95.3 |
|
| Cash (used in) provided by operating activities - discontinued operations | | (7.2 | ) | | 26.2 |
|
| Net cash provided by operating activities | | 83.3 |
| | 121.5 |
|
| Cash flows from investing activities: | | |
| | |
| Cash acquired in business combinations | | 200.5 |
| | — |
|
| Equity method investment contributions | | (4.8 | ) | | (54.7 | ) |
| Purchases of property, plant and equipment | | (108.4 | ) | | (28.2 | ) |
| Purchase of intangible assets | | (5.5 | ) | | (0.7 | ) |
| Proceeds from sales of assets | | — |
| | 0.2 |
|
| Cash provided by (used in) investing activities - continuing operations | | 81.8 |
| | (83.4 | ) |
| Cash used in investing activities - discontinued operations | | 13.5 |
| | (14.2 | ) |
| Net cash provided by (used in) investing activities | | 95.3 |
| | (97.6 | ) |
| Cash flows from financing activities: | | |
| | |
| Proceeds from long-term revolvers | | 781.7 |
| | 235.6 |
|
| Payments on long-term revolvers | | (920.5 | ) | | (212.2 | ) |
| Proceeds from term debt | | 248.1 |
| | 40.4 |
|
| Payments on term debt | | (79.9 | ) | | (42.3 | ) |
| Proceeds from product financing agreements | | 21.0 |
| | 50.4 |
|
| Repayments of product financing agreements | | (9.0 | ) | | — |
|
| Taxes paid due to the net settlement of equity-based compensation | | — |
| | (0.8 | ) |
| Income tax benefit expense of equity-based compensation | | (2.7 | ) | | (2.0 | ) |
| Repurchase of common stock | | — |
| | (6.0 | ) |
| Repurchase of non-controlling interest | | (7.3 | ) | | — |
|
| Distribution to non-controlling interest | | (23.8 | ) | | (17.7 | ) |
| Dividends paid | | (31.3 | ) | | (28.1 | ) |
| Deferred financing costs paid | | (6.1 | ) | | (1.9 | ) |
| Cash (used in) provided by financing activities - continuing operations | | (29.8 | ) | | 15.4 |
|
| Cash used in financing activities - discontinued operations | | — |
| | (11.2 | ) |
| Net cash (used in) provided by financing activities | | (29.8 | ) | | 4.2 |
|
| Net increase in cash and cash equivalents | | 148.8 |
| | 28.1 |
|
| Cash and cash equivalents at the beginning of the period | | 689.2 |
| | 287.2 |
|
| Cash and cash equivalents at the end of the period | | 838.0 |
| | 315.3 |
|
| Less cash and cash equivalents of discontinued operations at the end of the period | | 6.3 |
| | 17.9 |
|
| Cash and cash equivalents of continuing operations at the end of the period | | $ | 831.7 |
| | $ | 297.4 |
|
| | | | | |
Delek US Holdings, Inc.
Condensed Consolidated Statements of Cash Flows (Unaudited)(Continued)
(In millions)
|
| | | | | | | | |
| | | Nine Months Ended September 30, |
| | | 2017 | | 2016 |
| Supplemental disclosures of cash flow information: | | | | |
| Cash paid during the period for: | | | | |
| Interest, net of capitalized interest of $0.2 and $0.1 for the nine months ended September 30, 2017 and 2016, respectively. | | $ | 52.7 |
| | $ | 36.6 |
|
| Income taxes | | $ | 70.6 |
| | $ | 1.7 |
|
| Non-cash investing activities: | | | | |
| Increase (decrease) in accrued capital expenditures | | $ | 2.4 |
| | $ | (4.0 | ) |
| Non-cash financing activities: |
|
|
|
|
| Common stock issued in connection with the Delek/Alon Merger |
| $ | 509.0 |
|
| $ | — |
|
| Equity instruments issued in connection with the Delek/Alon Merger | | $ | 21.7 |
| | $ | — |
|
See accompanying notes to condensed consolidated financial statements
Delek US Holdings, Inc.
Notes to Condensed Consolidated Financial Statements (Unaudited)
1.
Note 1 - Organization and Basis of Presentation
Delek US Holdings, Inc. is the sole shareholder or owner of membership interests,operates through its wholly-owned subsidiaryconsolidated subsidiaries, which include Delek US Energy, Inc., of ("Delek Refining, Inc. ("Refining"Energy"), Delek Finance, Inc., Delek Marketing & Supply, LLC, Lion Oil Company ("Lion Oil"), Delek Renewables, LLC, Delek Rail Logistics, Inc., Delek Logistics Services Company, Delek Helena, LLC, Delek Land Holdings, LLC, (and its subsidiaries) and is also the sole shareholder of Alon USA Energy, Inc. ("Alon") (and in Alon's wholly-owned subsidiaries by virtue of Delek's ownership of Alon)its subsidiaries).
Effective July 1, 2017 (the "Effective Time"), we acquired the outstanding common stock of Alon (previously listed under NYSE: ALJ) (the "Delek/Alon Merger", as further discussed in Note 2), resulting in a new post-combination consolidated registrant renamed as Delek US Holdings, Inc. (“New Delek”), with Alon and the previous Delek US Holdings, Inc. (“Old Delek”) surviving as wholly-owned subsidiaries. New Delek is the successor issuer to Old Delek and Alon pursuant to Rule 12g-3(c) under the Securities Exchange Act of 1934, as amended (the "Exchange Act"). In addition, as a result of the Delek/Alon Merger, the shares of common stock of Old Delek and Alon were delisted from the New York Stock Exchange in July 2017, and their respective reporting obligations under the Exchange Act were terminated.
Unless otherwise noted or the context requires otherwise, the disclosures and financial information included in this report for the periods prior to July 1, 2017 reflect that of Old Delek, and the disclosures and financial information included in this report for the periods beginning July 1, 2017 reflect that of New Delek. The terms "we," "our," "us," "Delek" and the "Company" are used in this report to refer to Old Delek and its consolidated subsidiaries for the periods prior to July 1, 2017, and New Delek and its consolidated subsidiaries for the periods on or after July 1, 2017, unless otherwise noted. Newsubsidiaries. Delek's Common Stockcommon stock is listed on the New York Stock Exchange ("NYSE") under the symbol "DK."
In August 2016, we entered into a definitive equity purchase agreement (the "Purchase Agreement") with Compañía de Petróleos de Chile COPEC S.A. and its subsidiary, Copec Inc., a Delaware corporation (collectively, "COPEC"). Under the terms of the Purchase Agreement, Delek agreed to sell, and COPEC agreed to purchase, 100% of the equity interests in Delek's wholly-owned subsidiaries MAPCO Express, Inc., MAPCO Fleet, Inc., Delek Transportation, LLC, NTI Investments, LLC and GDK Bearpaw, LLC (collectively, the “Retail Entities”) for cash consideration of $535.0 million, subject to customary adjustments (the “Retail Transaction”). The Retail Transaction closed in November 2016.
As a result of the Purchase Agreement, we met the requirements under the provisions of Accounting Standards Codification ("ASC") 205-20, Presentation of Financial Statements - Discontinued Operations ("ASC 205-20") and ASC 360, Property, Plant and Equipment ("ASC 360"), to report the results of the Retail Entities as discontinued operations and to classify the Retail Entities as a group of assets held for sale. See Note 5 for further information regarding the Retail Entities.
Having classified the Retail Entities as assets held for sale, the condensed consolidated statements of income for the three and nine months ended September 30, 2016 have been reclassified to reflect the results of the Retail Entities as income from discontinued operations, net of taxes.
During the third quarter 2017, we committed to a plan to sell 100% of our equity interests in (or substantially all of the assets of) our subsidiaries associated with our Paramount and Long Beach, California refineries and Alon's California renewable fuels facility, which were acquired as part of the Delek/Alon Merger (collectively, the "California Discontinued Entities"). As a result of this decision and commitment to a plan, and because it was made within three months of the Delek/Alon Merger, we met the requirements under ASC 205-20 and ASC 360 to report the results of the California Discontinued Entities as discontinued operations and to classify the California Discontinued Entities as a group of assets held for sale. The sale of the California Discontinued Entities is currently anticipated to occur within the next 12 months. See Note 5 for further information regarding the California Discontinued Entities.
Our condensed consolidated financial statements include the accounts of Delek and its consolidated subsidiaries. Certain information and footnote disclosures normally included in annual financial statements prepared in accordance with United States ("U.S.") Generally Accepted Accounting Principles ("GAAP") have been condensed or omitted, although management believes that the disclosures herein are adequate to make the financial information presented not misleading. Our unaudited condensed consolidated financial statements have been prepared in conformity with GAAP applied on a consistent basis with those of the annual audited consolidated financial statements included in our Annual Report on Form 10-K filed with the Securities and Exchange Commission ("SEC") on February 28, 2017March 1, 2021 (the "Annual Report on Form 10-K") and in accordance with the rules and regulations of the SEC. These unaudited condensed consolidated financial statements should be read in conjunction with the audited consolidated financial statements and the notes thereto for the year ended December 31, 20162020 included in our Annual Report on Form 10-K.
Our condensed consolidated financial statements include Delek Logistics Partners, LP ("Delek Logistics"), Alon USA Partners, LP (the "Alon Partnership") and AltAir Paramount LLC ("AltAir")NYSE:DKL), allwhich is a variable interest entities.entity ("VIE"). As the indirect owner of the general partnerspartner of Delek Logistics, and the Alon Partnership and the managing member of AltAir, we have the ability to direct the activities of these entitiesthis entity that most significantly impact theirits economic performance. We are also considered to be the primary beneficiary for accounting purposes for all of these
entitiesthis entity and are Delek Logistics' primary customer. As Delek Logistics does not derive an amount of gross margin material to us from third parties, there is limited risk to Delek associated with Delek Logistics' operations. However, in the event that Delek Logistics the Alon Partnership or AltAir incurs a loss, our operating results will reflect theirsuch loss, net of intercompany eliminations, to the extent of our ownership interest in these entities. AltAir's results are included in discontinued operations - see Note 5.this entity.
In the opinion of management, all adjustments necessary for a fair presentation of the financial condition and the results of operations for the interim periods have been included. All significant intercompany transactions and account balances have been eliminated in consolidation. All adjustments are of a normal, recurring nature. Operating results for the interim period should not be viewed as representative of results that may be expected for any future interim period or for the full year.
Accounting Policies
With the exception of the policy updates below, there have been no new or material changes to the significant accounting policies discussed in the Company’s Annual Report on Form 10-K for the fiscal year ended December 31, 2020.
Risks and Uncertainties Arising from the COVID-19 Pandemic
U.S. economic activity continued on a recovery trend during the quarter ended September 30, 2021, albeit remaining subject to heightened levels of uncertainty related to the on-going impact of the COVID-19 outbreak that developed into a pandemic in March 2020 (the “COVID-19 Pandemic” or the “Pandemic”), and the spread of new variants of the virus. Most of the restrictions imposed in the prior year to prevent its spread have been eased and government vaccination campaigns continue. Compared to the prior year, the economic recovery trends in the three and nine months ended September 30, 2021 included a resumption of flights by major airlines and increased motor vehicle use. This has in turn resulted in increased demand and market prices for crude oil and certain of our products. Nonetheless, there remains continued uncertainty about the duration and future impact of the COVID-19 Pandemic.
Uncertainties related to the impact of the COVID-19 Pandemic and other events exist that could impact our future results of operations and financial position, the nature of which and the extent to which are currently unknown. To the extent these uncertainties have been identified and are believed to have had a material impact on our current period results of operations or financial position based on the requirements for assessing such financial statement impact under GAAP, we have considered them in the preparation of our unaudited financial statements as of and for the three and nine months ended September 30, 2021. The application of accounting policies impacted by such considerations include (but are not necessarily limited to) the following:
•The interim evaluation of indefinite-lived intangibles and goodwill for potential impairment, where indicators exist, as defined by GAAP;
•The interim evaluation of long-lived assets for potential impairment, where indicators exist, as defined by GAAP;
•The interim evaluation of joint ventures for potential impairment, where indicators exist, as defined by GAAP;
•The evaluation of derivatives and hedge accounting for counterparty risk and changes in forecasted transactions, as provided for under GAAP;
•The evaluation of inventory valuation allowances that may be warranted under the lower of cost or net realizable value analysis, for first-in, first-out (“FIFO”), and the lower of cost or market analysis, for last-in, first-out ("LIFO"), pursuant to GAAP;
Notes to Condensed Consolidated Financial Statements (Unaudited)
•The consideration of debt modifications and/or covenant requirements, as applicable;
•The evaluation of commitments and contingencies, including changes in concentrations, as applicable;
•The interim evaluation of the impact of changing forecasts on our assessment of deferred tax asset valuation allowances and annual effective tax rates; and
•The interim evaluation of our ability to continue as a going concern.
Reclassifications
Certain prior period amounts have been reclassified in order to conform to the current yearperiod presentation.
Accounting Policies Update
The following condensed accounting policies represent updates to those policies disclosed in our annual report on Form 10-K, and primarily relate to the integration of the Alon operations and accounts into our accounting and reporting framework.
Segment Reporting
Following the Delek/Alon Merger, Delek's business includes retail operations. Management views aggregated operating results in primarily three reportable segments: refining, logistics and retail. Our corporate activities, results of our asphalt operations and certain other immaterial operating segments, our equity method investments in Alon prior to the Delek/Alon Merger and intercompany eliminations are reported in the corporate, other and eliminations segment. The retail segment markets gasoline, diesel and other refined petroleum products, and convenience merchandise through a network of company-operated retail fuel and convenience stores. Segment reporting is more fully discussed in Note 14.
Accounts Receivable
Accounts receivable primarily consists of trade receivables generated in the ordinary course of business. Delek recorded an allowance for doubtful accounts related to trade receivables of $4.8 million as of September 30, 2017. Delek had no allowance for doubtful accounts as of December 31, 2016.
Credit is extended based on evaluation of the customer’s financial condition. We perform ongoing credit evaluations of our customers and require letters of credit, prepayments or other collateral or guarantees as management deems appropriate. Allowance for doubtful accounts is based on a combination of current sales and specific identification methods.
Credit risk is minimized as a result of the ongoing credit assessment of our customers and a lack of concentration in our customer base. Credit losses are charged to allowance for doubtful accounts when deemed uncollectible. Our allowance for doubtful accounts is reflected as a reduction of accounts receivable in the consolidated balance sheets.
Inventory
Crude oil, work-in-process, refined products, blendstocks and asphalt inventory for all of our operations, excluding the refinery located in Tyler, Texas (the "Tyler refinery") and merchandise inventory in our Retail segment, are stated at the lower of cost determined using the first-in, first-out (“FIFO”) basis or net realizable value. Cost of all inventory at the Tyler refinery is determined using the last-in, first-out (“LIFO”) inventory valuation method and inventory is stated at the lower of cost or market. Retail merchandise inventory consists of cigarettes, beer, convenience merchandise and food service merchandise and is stated at estimated cost as determined by the retail inventory method.
Property, Plant and Equipment
Depreciation for retail store equipment and site improvements is computed using the straight-line method over management's estimated useful lives of the related assets, which is 7-40 years.
Asset Retirement Obligations
In the retail segment, we have asset retirement obligations related to the removal of underground storage tanks and the removal of brand signage at owned and leased retail sites which are legally required under the applicable leases. The asset retirement obligation for storage tank removal on leased retail sites is accreted over the expected life of the owned retail site or the average retail site lease term.
We have asset retirement obligations with respect to our refineries due to various legal obligations to clean and/or dispose of these assets at the time they are retired. However, the majority of these assets can be used for extended and indeterminate periods of time provided that they are properly maintained and/or upgraded. It is our practice and intent to continue to maintain these assets and make improvements based on technological advances.
Revenue Recognition
In the retail segment, we derive service revenues from the sale of lottery tickets, money orders, car washes and other ancillary product and service offerings. Retail segment service revenue and related costs are recorded at gross amounts and net amounts, as appropriate, in accordance with the provisions of ASC 605-45, Revenue Recognition - PrincipalAgent Considerations ("ASC 605-45").
Cost of Goods Sold and Operating Expenses
For the retail segment, cost of goods sold comprises the costs of specific products sold. Retail cost of sales includes motor fuels and merchandise. Retail fuel cost of sales represents the cost of purchased fuel, including transportation costs. Merchandise cost of sales includes the delivered cost of merchandise purchases, net of merchandise rebates and commissions. Operating expenses include costs such as wages of employees, lease expense, utility expense and other costs of operating the stores.
Asphalt cost of sales includes costs of purchased asphalt, blending materials and transportation costs.
Interest Expense
Interest expense includes interest expense on debt, letters of credit, financing fees, the amortization, net of accretion, of debt discounts or premium and amortization of deferred debt issuance costs, but excludes capitalized interest. Original issuance discount and debt issuance costs are amortized ratably over the term of the related debt.
Postretirement Benefits
In connection with the Delek/Alon Merger, we now have defined benefit pension and postretirement medical plans for certain former Alon employees. We recognize the underfunded status of our defined benefit pension and postretirement medical plans as a liability. Changes in the funded status of our defined benefit pension and postretirement medical plans are recognized in other comprehensive income in the period when the changes occur. The funded status represents the difference between the projected benefit obligation and the fair value of the plan assets. The projected benefit obligation is the present value of benefits earned to date by plan participants, including the effect of assumed future salary increases. Plan assets are measured at fair value. We use December 31, of each year, as the measurement date for plan assets and obligations for all of our defined benefit pension and postretirement medical plans. See Note 18 for more information regarding our postretirement benefits.
New Accounting Pronouncements Adopted During 2021
ASU 2020-01, Investments—Equity Securities (Topic 321), Investments—Equity Method and Joint Ventures (Topic 323), and Derivatives and Hedging (Topic 815)—Clarifying the Interactions between Topic 321, Topic 323, and Topic 815
In August 2017,January 2020, the Financial Account Standards Board ("FASB") issued Accounting Standards Board (the "FASB"Update ("ASU") issued2020-01 which is intended to clarify interactions between the guidance to better align financial reportingaccount for hedging activities with the economic objectivescertain equity securities under Topics 321, 323 and 815, and improve current GAAP by reducing diversity in practice and increasing comparability of those activities for both financial (e.g., interest rate) and commodity risks.accounting. The guidance was intended to create more transparency in the presentation of financial results, both on the face of the financial statements and in the footnotes, and simplify the application of hedge accounting guidance. This amendmentpronouncement is effective for fiscal years beginning after December 15, 2018, and interim periods within those fiscal years. Companies are required to apply the amendment on a modified retrospective transition method in which the cumulative effect of the change will be recognized within equity in the consolidated balance sheet as of the date of adoption. Early adoption is permitted, including in an interim period. If a company early adopts in an interim period, any adjustments should be reflected as of the beginning of the fiscal year that includes the interim period. We expect to adopt this guidance on or before the effective date and are currently evaluating the impact that adopting this new guidance will have on our business, financial condition and results of operations.
In May 2017, the FASB issued guidance that clarifies when changes to the terms or conditions of a share-based payment award must be accounted for as modifications. The modification accounting guidance applies if the value, vesting conditions or classification of the award changes. This guidance is effective for fiscal years beginning after December 15, 2017, and interim periods within those fiscal years and can be early adopted for any interim or annual financial statements that have not yet been issued. We expect to adopt this guidance on or before the effective date and are currently evaluating the impact that adopting this new guidance will have on our business, financial condition and results of operations.
In March 2017, the FASB issued guidance that will require that an employer disaggregate the service cost component from the other components of net benefit cost with respect to defined benefit postretirement employee benefit plans. Service cost is required to be reported in the same line item or items as other compensation costs arising from services rendered by the pertinent employees during the period. The other components of net periodic benefit cost are required to be reported outside the subtotal for operating income. Additionally, only the service cost component of net benefit costs are eligible for capitalization. The guidance is effective January 1, 2018, with early adoption permitted. We expect to adopt this guidance on or before the effective date and are currently evaluating the impact that adopting this new guidance will have on our business, financial condition and results of operations.
In January 2017, the FASB issued guidance concerning the goodwill impairment test that eliminates Step 2, which required a comparison of the implied fair value of goodwill of the reporting unit with the carrying amount of that goodwill for that reporting unit. It also eliminates the requirements for any reporting unit with a zero or negative carrying amount to perform a qualitative assessment and, if it fails that qualitative assessment, to perform Step 2 of the goodwill impairment test. An entity still has the option to perform the qualitative assessment for a reporting unit to determine if the quantitative impairment test is necessary. This guidance is effective for annual or any interim goodwill impairment tests in fiscal years beginning after December 15, 2019. Early adoption is permitted for interim or annual goodwill impairment tests performed on testing dates after January 1, 2017.2020. We expect to adopt this guidance on or before the effective date and we do not anticipate that the adoption will have a material impact on our business, financial condition or results of operations.
In January 2017, the FASB issued guidance clarifying the definition of a business in order to assist entities with evaluating when a set of transferred assets and activities is considered a business. In general, we expect that the revised definition will result in fewer acquisitions being accounted for as business combinations than under the current guidance. This guidance is effective for fiscal years beginning after December 15, 2017, and interim periods within those fiscal years. Early adoption is permitted under certain circumstances. We early adopted this guidance during the three months ended September 30, 2017, and as a result accounted for two immaterial acquisitions occurring during the three months ended September 30, 2017 as asset acquisitions rather than business combinations. The adoption did not have a material impact on our business, financial condition and results of operations.
In June 2016, the FASB issued guidance requiring the measurement of all expected credit losses for financial assets held at the reporting date based on historical experience, current conditions, and reasonable and supportable forecasts. Financial institutions and other organizations will now use forward-looking information to better inform their credit loss estimates. This guidance is effective for interim and annual periods beginning after December 15, 2019. We expect to adopt this guidance on or before the effective date and are currently evaluating the impact that adopting this new guidance will have on our business, financial condition and results of operations.
In March 2016, the FASB issued guidance that simplifies several aspects of the accounting for share-based payment award transactions, including the accounting for excess tax benefits and deficiencies, classification of awards as either equity or liabilities and classification of excess tax benefits on the statement of cash flows. This guidance is effective for fiscal years beginning after December 15, 2016, and interim periods within those fiscal years and can be early adopted for any interim or annual financial statements that have not yet been issued. We prospectively adopted this guidance on January 1, 20172021 and the adoption did not have a material impact on our business, financial condition or results of operations.
ASU 2019-12, Simplifying the Accounting for Income Taxes
In January 2016,December 2019, the FASB issued guidance that affects theintended to simplify various aspects related to accounting for equity investments, financial liabilities accounted for underincome taxes, eliminate certain exceptions within Accounting Standards Codification ("ASC") 740, Income Taxes (“ASC 740”) and clarify certain aspects of the fair value option and the presentation and disclosure requirements for financial instruments. Under the newcurrent guidance all equity investments in
unconsolidated entities (other than those accounted for using the equity method of accounting) will generally be measured at fair value through earnings. There will no longer be an available-for-sale classification for equity securities with readily determinable fair values. For financial liabilities when the fair value option has been elected, changes in fair value due to instrument-specific credit risk will be recognized separately in other comprehensive income. It will require public business entities to use the exit price notion when measuring the fair value of financial instruments for disclosure purposes and separate presentation of financial assets and financial liabilities by measurement category and form of financial asset, and will eliminate the requirement for public business entities to disclose the method and significant assumptions used to estimate the fair value that is required to be disclosed for financial instruments measured at amortized cost.The new guidancepromote consistency among reporting entities. The pronouncement is effective for annual reportingfiscal years and for interim periods within those fiscal years beginning after December 15, 2017, including interim reporting periods within that reporting period.2020. We expect to adoptadopted this guidance on or beforeJanuary 1, 2021 and the effective date and currently doadoption did not expect this new guidance to have a material impact on our business, financial condition or results of operations.
ASU 2018-14, Compensation - Changes to the Disclosure Requirements for Defined Benefit Plans
In July 2015,August 2018, the FASB issued guidance requiring entitiesrelated to measure FIFO or average cost inventory at the lower of costdisclosure requirements for defined benefit plans. The pronouncement eliminates, modifies and net realizable value. Net realizable value is the estimated selling prices in the ordinary course of business, less reasonably predictable costs of completion, disposal, and transportation. This guidance does not change the measurement of inventory measured using LIFO or the retail inventory method. This guidanceadds disclosure requirements for defined benefit plans. The pronouncement is effective for fiscal years beginning after December 15, 2016, and interim periods within those fiscal years.2020. We adopted this guidance on January 1, 20172021 and the adoption did not have a material impact on our business, financial condition or results of operations.
Accounting Pronouncements Not Yet Adopted
ASU 2020-06, Debt—Debt with Conversion and Other Options (Subtopic 470-20) and Derivatives and Hedging—Contracts in Entity's Own Equity (Subtopic 815-40): Accounting for Convertible Instruments and Contracts in an Entity’s Own Equity
In May 2014,August 2020, the FASB issued ASU 2020-06, which is intended to simplify the accounting for certain financial instruments with characteristics of liabilities and equity, including convertible instruments and contracts in an entity's own equity. The guidance regarding “Revenue from Contracts with Customers,” to clarifyallows for either full retrospective adoption or modified retrospective adoption. The pronouncement is effective for fiscal years and interim periods within those fiscal years beginning after December 15, 2021, and early adoption is permitted. The Company is evaluating the principles for recognizing revenue. The core principleimpact of this guidance but does not currently expect adopting this new guidance will have a material impact on its condensed consolidated financial statements and related disclosures.
ASU 2020-04, Facilitation of the newEffects of Reference Rate Reform on Financial Reporting (Topic 848)
In March 2020, the FASB issued an amendment which is intended to provide temporary optional expedients and exceptions to GAAP guidance is that an entity should recognize revenue to depicton contracts, hedge accounting and other transactions affected by the transfer of promised goods or services to customers in an amount that reflectsexpected market transition from the consideration to which the entity expects to be entitled in exchange for those goods or services. The guidance also requires improved interimLondon Interbank Offered Rate ("LIBOR") and annual disclosures that enable the users of financial statements to better understand the nature, amount, timing, and uncertainty of revenues and cash flows arising from contracts with customers. The newother interbank rates. This guidance is effective for annual reporting periodsall entities at any time beginning afteron March 12, 2020 through December 15, 2017, including31, 2022 and may be applied from the beginning of an interim reporting periods withinperiod that reporting period, and can be adopted retrospectively. We expect to adoptincludes the issuance date of the ASU. The Company is currently evaluating the impact this guidance may have on January 1, 2018.its condensed consolidated financial statements and related disclosures.
Notes to Condensed Consolidated Financial Statements (Unaudited)
Note 2 - Segment Data
We aggregate our operating units into three reportable segments: Refining, Logistics, and Retail. Operations that are not specifically included in the reportable segments are included in Corporate, Other and Eliminations, which consist of the following:
•our corporate activities;
•results of certain immaterial operating segments, including our Canadian crude trading operations (as discussed in Note 9);
•wholesale crude operations;
•Alon's asphalt terminal operations; and
•intercompany eliminations.
Decisions concerning the allocation of resources and assessment of operating performance are made based on this segmentation. Management measures the operating performance of each of the reportable segments based on the segment contribution margin. Segment contribution margin is defined as net revenues less cost of materials and other and operating expenses, excluding depreciation and amortization.
Refining Segment
The refining segment processes crude oil and other feedstocks for the manufacture of transportation motor fuels, including various grades of gasoline, diesel fuel and aviation fuel, asphalt and other petroleum-based products that are distributed through owned and third-party product terminals. The refining segment has a combined nameplate capacity of 302,000 barrels per day ("bpd") as of September 30, 2021, including the following:
•75,000 bpd Tyler, Texas refinery (the "Tyler refinery");
•80,000 bpd El Dorado, Arkansas refinery (the "El Dorado refinery");
•73,000 bpd Big Spring, Texas refinery (the "Big Spring refinery"); and
•74,000 bpd Krotz Springs, Louisiana refinery (the "Krotz Springs refinery").
The refining segment also owns and operates 3 biodiesel facilities involved in the production of biodiesel fuels and related activities, located in Crossett, Arkansas, Cleburne, Texas and New Albany, Mississippi. The biodiesel industry has historically been substantially aided by federal and state tax incentives. One tax incentive program that has been significant to our renewable fuels facilities is the federal blender's tax credit (also known as the biodiesel tax credit or "BTC"). The BTC provides a $1.00 refundable tax credit per gallon of pure biodiesel to the first blender of biodiesel with petroleum-based diesel fuel. The blender's tax credit was re-enacted in December 2019 for the years 2020 through 2022.
On May 7, 2020, we sold our equity interests in Alon Bakersfield Property, Inc., an indirect wholly-owned subsidiary that owned our non-operating refinery located in Bakersfield, California, to a subsidiary of Global Clean Energy Holdings, Inc. (“GCE”) for total cash consideration of $40.0 million. As a result of this sale, we recognized a gain of $56.8 million, largely due to the buyer assuming substantially all of the asset retirement obligations and environmental liabilities associated with this refinery. As part of our effortsthe transaction, GCE granted a call option to prepare for adoption, beginning in 2016, we formedDelek to acquire up to a project implementation team as well as a project timeline to evaluate this new standard for the subsidiaries of Delek prior to the acquisition of Alon. We also reviewed and gained an understanding of the new revenue recognition accounting guidance, performed scoping to identify and evaluate revenue streams under the new standard, and continue to review industry specific implementation guidance. During the third quarter of 2017, we developed our control framework over revenue recognition, including implementation, and we performed testing to confirm our understanding of identified revenue streams of Old Delek. In connection with the Delek/Alon Merger which was effective July 1, 2017, we performed a similar analysis of the revenue streams/contracts of Alon and its subsidiaries in connection with our integration efforts.
We are continuing to evaluate the impact of the standard on our business processes, accounting systems, controls and financial statement disclosures, including the integration of Alon, and expect to implement any changes to accommodate the new accounting and disclosure requirements prior to adoption on January 1, 2018. We preliminarily expect to use the modified retrospective adoption method to apply this standard, under which the cumulative effect of initially applying the new guidance will be recognized as an adjustment to the opening balance of retained earnings33 1/3% limited member interest in the first quarteracquiring subsidiary of 2018.
2. Acquisitions
In January 2017, we announced that Old Delek (and various related entities) entered into the Merger Agreement with Alon, as subsequently amended on February 27 and April 21, 2017. The related Merger (the "Merger" or the "Delek/Alon Merger") was effective July 1, 2017 (as previously defined, the “Effective Time”), resulting in a new post-combination consolidated registrant renamed as Delek US Holdings, Inc. (as previously defined, “New Delek”), with Alon and Old Delek surviving as wholly-owned subsidiaries of New Delek. New Delek is the successor issuerGCE for up to Old Delek and Alon pursuant to Rule 12g-3(c) under the Exchange Act, as amended. In addition, as a result of the Delek/Alon Merger, the shares of common stock of Old Delek and Alon were delisted from the New York Stock Exchange in July 2017, and their respective reporting obligations under the Exchange Act were terminated. Prior to the Merger, Old Delek owned a non-controlling equity interest of approximately 47% of the outstanding shares of Alon , which was accounted for under the equity method of accounting (See Note 4).
Subject to the terms and conditions of the Merger Agreement, at the Effective Time, each issued and outstanding share of Alon Common Stock, other than shares owned by Old Delek and its subsidiaries or held in the treasury of Alon, was converted into the right to receive 0.504 of a share of New Delek Common Stock, or, in the case of fractional shares of New Delek Common Stock, cash (without interest) in an amount equal to the product of (i) such fractional part of a share of New Delek Common Stock multiplied by (ii) $25.96 per share, which was the volume weighted average price of the Old Delek Common Stock, par value $0.01 per share as reported on the NYSE Composite Transactions Reporting System for the twenty consecutive New York Stock Exchange (“NYSE”) full trading days ending on June 30, 2017. Each outstanding share of restricted Alon Common Stock was assumed by New Delek and converted into restricted stock denominated in shares of New Delek Common Stock, using the conversion rate applicable to the Merger. Committed but unissued share-based awards were exchanged and converted into rights to receive share-based awards indexed to New Delek Common Stock.
In addition,$13.3 million, subject to certain adjustments. Such option is exercisable by Delek through the terms and conditions of the Merger Agreement, each share of Old Delek Common Stock or fraction thereof issued and outstanding immediately prior to the Effective Time (other than Old Delek Common Stock held in the treasury of Old Delek,90th day after GCE demonstrates commercial operations, as contractually defined, which was retired in connection with the Merger) was converted at the Effective Time into the right to receive one validly issued, fully paid and non‑assessable share of New Delek Common Stock or such fraction thereof equal to the fractional share of New Delek Common Stock. All existing Old Delek stock options, restricted stock awards and stock appreciation rights were converted into equivalent rights with respect to New Delek Common Stock.
In connection with the Merger, Alon, New Delek and U.S. Bank National Association, as trustee (the “Trustee”) entered into a First Supplemental Indenture (the “Supplemental Indenture”), effective as of July 1, 2017, supplementing the Indenture, datedhas not yet occurred as of September 16, 2013 (the “Indenture”), pursuant to which Alon issued its 3.00% Convertible Senior Notes due 2018 (the “Notes”), which were convertible into shares of Alon’s Common Stock, par value $0.01 per share or cash or a combination of cash and Alon Common Stock, all as provided in the Indenture. 30, 2021.
The Supplemental Indenture provides that, as of the Effective Time, the right to convert each $1,000 principal amount of the Notes based on a number of shares of Alon Common Stock equal to the Conversion Rate (as defined in the Indenture) in effect immediately prior to the Merger was changed into a right to convert each $1,000 principal amount of Notes into or based on a number of shares of New Delek Common Stock (at the exchange rate of 0.504), par value $0.01 per share, equal to the Conversion Rate in effect immediately prior to the Merger. In addition, the Supplemental Indenture provides that, as of the Effective Time, New Delek fully and unconditionally guaranteed, on a senior basis, Alon’s obligations under the Notes.
In connection with the Indenture, Alon also entered into equity instruments, including Purchased Options and Warrants (see Note 8 for further discussion), designed, in combination, to hedge the risk associated with the potential exercise of the conversion feature of the Notes and to minimize the dilutive effect of such potential conversion. These equity instruments, in addition to the conversion feature, represent equity instruments originally indexed to Alon Common Stock that were exchanged for instruments with terms designed to preserve the original economic intent of such instruments and indexed to New Delek Common Stock in connection with the Merger. See Note 8.
Alon is a refiner and marketer of petroleumrefining segment's petroleum-based products operatingare marketed primarily in the south central, southwestern and western regions of the United States. Alon owns 100% of the general partnerThis segment also ships and 81.6% of the limited partner interestssells gasoline into wholesale markets in the southern and eastern United States. Motor fuels are sold under the Alon Partnership, which owns a crude oil refinery in Big Spring, Texas with a crude oil throughput capacity of 73,000 bpd and an integrated wholesale marketing business.or Delek brand through various terminals to supply Alon or Delek branded retail sites. In addition, Alon directlysells motor fuels through its wholesale distribution network on an unbranded basis.
Logistics Segment
Our logistics segment owns aand operates crude oil refinery in Krotz Springs, Louisiana with aand refined products logistics and marketing assets. The logistics segment generates revenue by charging fees for gathering, transporting and storing crude oil throughput capacityand for marketing, distributing, transporting and storing intermediate and refined products in select regions of 74,000 bpd. Alon also owns crude oil refineries in California, which have not processed crude oil since 2012. Alon is a marketer of asphalt, which it distributes through asphalt terminals located predominantly in the southwestern and western United States. Alon is the largest 7-Eleven licensee in thesoutheastern United States and operates approximately 300 convenience stores which market motor fuels in centralWest Texas for our refining segment and west Texasthird parties, and New Mexico.
Transaction costs incurred by the Company totaled approximately $18.4 million, inclusivesales of $11.3 million of merger costs and $7.1 million of non-recurring costs associated with the transaction, for the three months ended September 30, 2017, and $22.4 million, inclusive of $15.3 million of merger costs and $7.1 million of non-recurring costs associated with the transaction, for the nine months ended September 30, 2017. Such costs were included in general and administrative expenseswholesale products in the accompanying condensed consolidated statementsWest Texas market.
Retail Segment
Our retail segment consists of income.
The Merger is accounted for using the acquisition method of accounting, which requires, among other things, that assets acquired at their fair values250 owned and liabilities assumed be recognized on the balance sheet as of the acquisition date.
The components of the consideration transferred were as follows (dollars in millions, except per share amounts):
|
| | | | | | |
| Delek common stock issued | 19,250,795 |
| |
| Ending price per share of Delek Common Stock immediately before the Effective Time | $ | 26.44 |
| |
| Total value of common stock consideration | | $ | 509.0 |
|
Additional consideration (1) | | 21.7 |
|
Fair value of Delek's pre-existing equity method investment in Alon (2) | | 449.0 |
|
| | | $ | 979.7 |
|
The preliminary allocation of the aggregate purchase priceleased convenience store sites as of September 30, 2017 is summarized as follows (in millions),2021, located primarily in Central and is inclusiveWest Texas and New Mexico. These convenience stores typically offer various grades of gasoline and diesel primarily under the California Discontinued Entities discussed in Note 5:
|
| | | | |
| Cash | | $ | 215.3 |
|
| Receivables | | 176.9 |
|
| Inventories | | 255.5 |
|
| Prepaids and other current assets | | 31.4 |
|
Property, plant and equipment (3) | | 1,183.1 |
|
| Equity method investments | | 31.0 |
|
Acquired intangible assets (4) | | 65.0 |
|
Goodwill (5) | | 784.8 |
|
| Other non-current assets | | 37.0 |
|
| Accounts payable | | (259.7 | ) |
| Obligation under Supply & Offtake Agreements | | (198.0 | ) |
| Current portion of environmental liabilities | | (7.5 | ) |
| Other current liabilities | | (266.5 | ) |
| Environmental liabilities and asset retirement obligations, net of current portion | | (141.7 | ) |
| Deferred income taxes | | (280.4 | ) |
| Debt | | (568.0 | ) |
Other non-current liabilities (6) | | (78.5 | ) |
| Fair value of net assets acquired | | $ | 979.7 |
|
(1) Additional consideration includes the fair value of certain equity instruments originally indexed to Alon stock that were exchanged for instruments indexed to New Delek's stock,or Delek brand name and food products, food service, tobacco products, non-alcoholic and alcoholic beverages, general merchandise as well as money grams to the fair valuepublic, primarily under the 7-Eleven and DK or Alon brand names. Substantially all of certain share-based payments that were requiredthe motor fuel sold through
Notes to Condensed Consolidated Financial Statements (Unaudited)
our retail segment is supplied by our Big Spring refinery, which is transferred to the retail segment at prices substantially determined by reference to published commodity pricing information. In November 2018, we terminated the license agreement with 7-Eleven, Inc. The terms of such agreement and subsequent amendments require the removal of all 7-Eleven branding on a store-by-store basis by December 31, 2023.
Significant Inter-segment Transactions
All inter-segment transactions have been eliminated in consolidation and consist primarily of the following:
•refining segment refined product sales to the retail segment to be exchanged for awards indexedsold through the store locations;
•refining segment sales of asphalt and refined product to New Delek's stockentities included in connectioncorporate, other and eliminations;
•logistics segment service fee revenue under service agreements with the Delek/Alon Merger.
(2) The fair value of Delek's pre-existing equity method investment in Alon wasrefining segment based on the quoted market pricenumber of shares of Alon.
(3) This preliminary fair value of property, plantgallons sold and equipment is based onto share a valuation using a combinationportion of the income, costmargin achieved in return for providing marketing, sales and market approaches. The useful lives are based upon guidelines for similar equipment, chronological age since installationcustomer services;
•logistics segment sales of wholesale finished product to our refining segment; and consideration of costs spent on upgrades, repairs, turnarounds
•logistics segment crude transportation, terminalling and rebuilds.
(4) The acquired intangible assets amount includes the following identified intangibles:
•Third-party fuel supply agreement intangible that is subject to amortization with a preliminary fair value of $43.0 million, which will be amortized over a 10-year useful life. We recognized amortization expensestorage fee revenue from our refining segment for the three months ended September 30, 2017utilization of $1.1 million. pipeline, terminal and storage assets.
Business Segment Operating Performance
The estimated amortizationfollowing is $1.1 milliona summary of business segment operating performance as measured by contribution margin for the fourth quarter of 2017 and $4.3 million for each of the five succeeding fiscal years.period indicated (in millions):
•Fuel trade name intangible preliminarily valued at $8.0 million, which will be amortized over 5 years. We recognized amortization expense for the three months ended September 30, 2017 of $0.4 million. The estimated amortization is $0.4 million. for the fourth quarter of 2017 and $1.6 million for each of the four succeeding fiscal years, with $0.8 million the fifth year. | | | | | | | | | | | | | | | | | | | | | | | | | | | | | | | | |
| | | Three Months Ended September 30, 2021 |
| | Refining | | Logistics | | Retail | | Corporate,
Other and Eliminations | | Consolidated |
| Net revenues (excluding inter-segment fees and revenues) | | $ | 2,603.8 | | | $ | 79.8 | | | $ | 206.5 | | | $ | 66.4 | | | $ | 2,956.5 | |
| Inter-segment fees and revenues | | 210.8 | | | 109.8 | | | — | | | (320.6) | | | — | |
| Operating costs and expenses: | | | | | | | | | | |
| Cost of materials and other | | 2,640.4 | | | 105.1 | | | 165.2 | | | (240.6) | | | 2,670.1 | |
| Operating expenses (excluding depreciation and amortization presented below) | | 82.8 | | | 17.3 | | | 23.4 | | | (0.7) | | | 122.8 | |
| Segment contribution margin | | $ | 91.4 | | | $ | 67.2 | | | $ | 17.9 | | | $ | (12.9) | | | 163.6 | |
| Depreciation and amortization | | $ | 45.9 | | | $ | 10.2 | | | $ | 3.0 | | | $ | 1.7 | | | 60.8 | |
| General and administrative expenses | | | | | | | | | | 58.7 | |
| | | | | | | | | | |
| Other operating income, net | | | | | | | | | | (1.7) | |
| Operating income | | | | | | | | | | $ | 45.8 | |
| Capital spending (excluding business combinations) | | $ | 14.5 | | | $ | 4.2 | | | $ | 1.9 | | | $ | 8.3 | | | $ | 28.9 | |
•Liquor license intangible preliminarily valued at $8.5 million, which has an indefinite life.
•Colonial Pipeline shipping rights intangible preliminarily valued at $1.9 million, which has an indefinite life.
•Refinery permits preliminarily valued at $3.1 million, which have an indefinite life.
•Below market lease intangible preliminarily valued at $0.5 million, which will be amortized over the remaining lease term (excludes certain leases that are still being evaluated for above or below market considerations).
| | | | | | | | | | | | | | | | | | | | | | | | | | | | | | | | |
| | | Three Months Ended September 30, 2020 |
| | Refining | | Logistics | | Retail | | Corporate,
Other and Eliminations | | Consolidated |
| Net revenues (excluding inter-segment fees and revenues) | | $ | 1,450.8 | | | $ | 49.4 | | | $ | 177.7 | | | $ | 385.0 | | | $ | 2,062.9 | |
Inter-segment fees and revenues | | 112.7 | | | 92.8 | | | — | | | (205.5) | | | — | |
| Operating costs and expenses: | | | | | | | | | | |
| Cost of materials and other | | 1,479.2 | | | 60.7 | | | 136.3 | | | 199.7 | | | 1,875.9 | |
| Operating expenses (excluding depreciation and amortization presented below) | | 102.1 | | | 14.3 | | | 23.1 | | | 0.2 | | | 139.7 | |
| Segment contribution margin | | $ | (17.8) | | | $ | 67.2 | | | $ | 18.3 | | | $ | (20.4) | | | 47.3 | |
| Depreciation and amortization | | $ | 50.3 | | | $ | 9.4 | | | $ | 2.9 | | | $ | 2.6 | | | 65.2 | |
| General and administrative expenses | | | | | | | | | | 57.0 | |
| Other operating expense, net | | | | | | | | | | 0.3 | |
| Operating loss | | | | | | | | | | $ | (75.2) | |
| Capital spending (excluding business combinations) | | $ | 0.6 | | | $ | 3.2 | | | $ | 0.7 | | | $ | 0.2 | | | $ | 4.7 | |
Notes to Condensed Consolidated Financial Statements (Unaudited)
(5) Goodwill generated | | | | | | | | | | | | | | | | | | | | | | | | | | | | | | | | |
| | | Nine Months Ended September 30, 2021 |
| | Refining | | Logistics | | Retail | | Corporate,
Other and Eliminations | | Consolidated |
| Net revenues (excluding inter-segment fees and revenues) | | $ | 6,415.1 | | | $ | 202.6 | | | $ | 590.3 | | | $ | 332.2 | | | $ | 7,540.2 | |
| Inter-segment fees and revenues | | 555.3 | | | 308.4 | | | — | | | (863.7) | | | — | |
| Operating costs and expenses: | | | | | | | | | | |
| Cost of materials and other | | 6,609.9 | | | 275.0 | | | 466.4 | | | (479.9) | | | 6,871.4 | |
| Operating expenses (excluding depreciation and amortization presented below) | | 310.2 | | | 46.9 | | | 67.2 | | | 8.9 | | | 433.2 | |
| Segment contribution margin | | $ | 50.3 | | | $ | 189.1 | | | $ | 56.7 | | | $ | (60.5) | | | 235.6 | |
| Depreciation and amortization | | $ | 149.0 | | | $ | 30.9 | | | $ | 9.6 | | | $ | 6.1 | | | 195.6 | |
| General and administrative expenses | | | | | | | | | | 164.4 | |
| | | | | | | | | | |
| Other operating income, net | | | | | | | | | | (4.7) | |
| Operating loss | | | | | | | | | | $ | (119.7) | |
| Capital spending (excluding business combinations) | | $ | 133.0 | | | $ | 14.6 | | | $ | 3.2 | | | $ | 10.8 | | | $ | 161.6 | |
| | | | | | | | | | | | | | | | | | | | | | | | | | | | | | | | |
| | | Nine Months Ended September 30, 2020 |
| | Refining | | Logistics | | Retail | | Corporate,
Other and Eliminations | | Consolidated |
| Net revenues (excluding inter-segment fees and revenues) | | $ | 4,021.9 | | | $ | 133.4 | | | $ | 521.7 | | | $ | 742.6 | | | $ | 5,419.6 | |
Inter-segment fees and revenues | | 346.5 | | | 289.9 | | | — | | | (636.4) | | | — | |
| Operating costs and expenses: | | | | | | | | | | |
| Cost of materials and other | | 4,314.4 | | | 205.9 | | | 400.0 | | | 144.0 | | | 5,064.3 | |
| Operating expenses (excluding depreciation and amortization presented below) | | 302.5 | | | 41.5 | | | 66.8 | | | 11.2 | | | 422.0 | |
| Segment contribution margin | | $ | (248.5) | | | $ | 175.9 | | | $ | 54.9 | | | $ | (49.0) | | | (66.7) | |
| Depreciation and amortization | | $ | 132.3 | | | $ | 24.4 | | | $ | 9.1 | | | $ | 11.6 | | | 177.4 | |
| General and administrative expenses | | | | | | | | | | 184.4 | |
| Other operating income, net | | | | | | | | | | (14.6) | |
| Operating loss | | | | | | | | | | $ | (413.9) | |
| Capital spending (excluding business combinations) | | $ | 180.9 | | | $ | 6.9 | | | $ | 8.2 | | | $ | 12.0 | | | $ | 208.0 | |
Other Segment Information
Total assets by segment were as a result of the Merger consists of the value of expected synergies from combining operations, the acquisition of an existing integrated refining, marketing and retail business located in areas with access to cost–advantaged feedstocks with an assembled workforce that cannot be duplicated at the same costs by a new entrant, and the strategic advantages of having a larger market presence. The total amount of goodwill that is expected to be deductible for tax purposes is $15.5 million . Goodwill has been preliminarily allocated to reportable segments based on various factors that are still being evaluated. Accordingly, such allocations are considered preliminary and may change within the permissible measurement period, not to exceed one year. The preliminary allocation of goodwill to reportable segments is as follows: Refining - $708.4 million and Retail- $58.5 million. The remainder relates to the asphalt operations, which is included in the corporate, other and eliminations segment.
(6) The assumed other non-current liabilities include liabilities related to below-market leases preliminarily fair valued at $8.4 million, which will be amortized over the remaining lease term (excludes certain leases that are still being evaluated for above or below market considerations).
The allocation of the purchase price was based upon a preliminary valuation. Our estimates and assumptions are subject to change during the purchase price allocation measurement period, not to exceed one year from the acquisition date. The primary areas of the purchase price allocation that are not yet finalized relate to the following:
•finalizing the valuation, segment allocation and assignment of remaining useful lives associated with property, plant and equipment acquired;
•finalizing the valuation of certain in-place contracts or contractual relationships (including but not limited to leases), including determining the appropriate amortization period;
•finalizing the review and valuation of environmental liabilities and asset retirement obligations (see Note 17));
•finalizing the evaluation and valuation of certain legal matters and/or other loss contingencies, including those that we may not yet be aware of but that meet the requirement to qualify as a pre-acquisition contingency (see Note 17);
•finalizing our review and valuation of identifiable intangible assets; and
•finalizing our estimate of the impact of purchase accounting on deferred income tax assets or liabilities.
To the extent possible, estimates have been considered and recorded, as appropriate, for the items above based on the information availablefollows as of September 30, 2017. We will continue to evaluate these items until they are satisfactorily resolved and adjust our purchase price allocation accordingly, within the allowable measurement period (not to exceed one year from the date of acquisition), as defined by ASC 805.2021 (in millions):
The following unaudited pro forma financial information presents the condensed combined results of operations of Delek and Alon for the nine months ended September 30, 2017 and the three and nine month periods ended September 30, 2016 as if the Delek/Alon Merger had occurred on January 1, 2016. The unaudited pro forma financial information is not intended to represent or be indicative of the consolidated results of operations that would have been reported had the Delek/Alon merger been completed as of January 1, 2016, and should not be taken as indicative of New Delek's future consolidated results of operations. In addition, the unaudited pro forma condensed combined results of operations do not reflect any cost savings or associated costs to achieve such savings from operating efficiencies, synergies, debt refinancing or other restructuring that may result from the Delek/Alon Merger. The pro forma financial information also does not reflect certain non-recurring adjustments that have been or are expected to be recorded in connection with the Delek/Alon Merger, including any accrual for integration costs or transactions costs related to the Merger, nor any retrospective adjustments related to the conforming of Alon's accounting policies to Delek's accounting policies, as such adjustments are impracticable to determine. Pro forma adjustments are tax-effected at the Company's estimated statutory tax rates. | | | | | | | | | | | | | | | | | | | | | | | | | | | | | | | | |
| | Refining | | Logistics | | Retail | | Corporate,
Other and Eliminations | | Consolidated |
| Total assets | | $ | 6,513.7 | | | $ | 930.5 | | | $ | 247.8 | | | $ | (925.1) | | | $ | 6,766.9 | |
| Less: | | | | | | | | | | |
| Inter-segment notes receivable | | (991.8) | | | — | | | — | | | 991.8 | | | — | |
| Inter-segment right of use lease assets | | (282.2) | | | — | | | — | | | 282.2 | | | — | |
| Total assets, excluding inter-segment notes receivable and right of use assets | | $ | 5,239.7 | | | $ | 930.5 | | | $ | 247.8 | | | $ | 348.9 | | | $ | 6,766.9 | |
|
| | | | | | | | | | | | | |
| | | Three Months Ended | | Nine Months Ended |
| | | September 30, | | September 30, |
| (in millions, except per share data) | | | 2016 | | 2017 | | 2016 |
| Net sales | | | $ | 2,119.9 |
| | $ | 7,003.6 |
| | $ | 6,005.8 |
|
| Net income (loss) attributable to Delek | | | 10.2 |
| | 2.6 |
| | (23.6 | ) |
| Earnings (loss) per share: | | | | | | | |
| Basic | | | $ | 0.12 |
| | $ | 0.03 |
| | $ | (0.29 | ) |
| Diluted | | | 0.12 |
| | 0.03 |
| | (0.29 | ) |
The unaudited pro forma statements of operations reflect the following adjustments:
| | |
(a) | To eliminate transactions between Delek and Alon for purchases and sales of refined product reducing revenue and the associated cost of goods sold. Such pro forma eliminations reduced combined pro forma sales by $3.7 million for the three months ended September 30, 2016, and $20.4 million and $9.6 million for the nine months ended September 30, 2017 and 2016, respectively.
|
ASC 820 requires disclosures that categorize assets and liabilities measured at fair value into one of three different levels depending on the observability of the inputs employed in the measurement. Level 1 inputs are quoted prices in active markets for identical assets or liabilities. Level 2 inputs are observable inputs other than quoted prices included within Level 1 for the asset or liability, either directly or indirectly through market-corroborated inputs. Level 3 inputs are unobservable inputs for the asset or liability reflecting our assumptions about pricing by market participants.
The derivative values above are based on analysis of each contract as the fundamental unit of account as required by ASC 820. In the table above, derivative assets and liabilities with the same counterparty are not netted where the legal right of offset exists. This differs from the presentation in the financial statements which reflects our policy, wherein we have elected to offset the fair value amounts recognized for multiple derivative instruments executed with the same counterparty and where the legal right of offset exists. As of September 30, 20172021 and December 31, 2016, $16.32020, $9.4 million and $14.7$14.8 million, respectively, of cash collateral was held by counterparty brokerage firms and has been netted with the net derivative positions with each counterparty. See Note 169 for further information regarding derivative instruments.
We primarily utilize OTC commodity swaps, generally with maturity dates of three years or less, and interest rate swap and cap agreements to achieve these objectives. OTC commodity swap contracts require cash settlement for the commodity based on the difference between a fixed or floating price and the market price on the settlement date. Interest rate swap and cap agreements economically hedge floating rate debt by exchanging interest rate cash flows, based on a notional amount from a floating rate to a fixed rate. Effective with the Delek/Alon Merger, we have interest rate swap agreements, maturing March 2019, that effectively fix the variable LIBOR interest component of the term loans within the Alon Retail Credit Agreement. The aggregate notional amount under these agreements covers approximately 77% of the outstanding principal of these term loans throughout the duration of the interest rate swaps. See Note 8 for further information. At this time, we do not believe there is any material credit risk with respect to the counterparties to these contracts.
From time to time, we also enter into future commitments to purchase or sell RINs at fixed prices and quantities, which are used to manage the costs associated with our RINs Obligation. These future RIN commitment contracts meet the definition of derivative instruments under ASC 815, and are recorded at estimated fair value in accordance with the provisions of ASC 815. Changes in the fair value of these future RIN commitment contracts are recorded in cost of goods sold on the consolidated statements of income.
In accordance with ASC 815, certain of our OTC commodity swap contracts and our interest rate agreements have been designated as cash flow hedges and the effective portion of the change in fair value between the execution date and the end of period has been recorded in other comprehensive income. The effective portion of the fair value of these contracts is recognized in income at the time the positions are closed and the hedged transactions are recognized in income.
From time to time, we also enter into futures contracts with supply vendors that secure supply of product to be purchased for use in the normal course of business at our refining segment. These contracts are priced based on an index that is clearly and closely related to the product being purchased, contain no net settlement provisions and typically qualify under the normal purchase exemption from derivative accounting treatment under ASC 815.
The following table presents the fair value of our derivative instruments as of September 30, 2017 and December 31, 2016. The fair value amounts below are presented on a gross basis and do not reflect the netting of asset and liability positions permitted under our master netting arrangements, including cash collateral on deposit with our counterparties. We have elected to offset the recognized fair value amounts for multiple derivative instruments executed with the same counterparty in our financial statements. As a result, the asset and liability amounts below differ from the amounts presented in our condensed consolidated balance sheets. See Note 15 for further information regarding the fair value of derivative instruments (in millions):
|
| | | | | | | | | | | | | | | | | |
| | | | September 30, 2017 | | December 31, 2016 |
| Derivative Type | Balance Sheet Location | | Assets | | Liabilities | | Assets | | Liabilities |
| Derivatives not designated as hedging instruments: | | | | | | | | |
OTC commodity swaps(1) | Other current assets | | $ | 85.2 |
| | $ | (82.0 | ) | | $ | 37.4 |
| | $ | (30.6 | ) |
OTC commodity swaps(1) | Other current liabilities | | 14.6 |
| | (23.4 | ) | | 14.4 |
| | (35.2 | ) |
OTC commodity swaps(1) | Other long term assets | | 1.1 |
| | (1.1 | ) | | — |
| | — |
|
OTC commodity swaps(1) | Other long term liabilities | | 3.7 |
| | (3.9 | ) | | — |
| | — |
|
RIN commitment contracts(2) | Other current assets | | 0.5 |
| | — |
| | — |
| | — |
|
RIN commitment contracts(2) | Other current liabilities | | — |
| | (11.7 | ) | | — |
| | (0.8 | ) |
| | | | | | | | | | |
| Derivatives designated as hedging instruments: | | | | | | | | |
OTC commodity swaps(1) | Other current assets | | — |
| | — |
| | 0.1 |
| | (2.5 | ) |
OTC commodity swaps(1) | Other current liabilities | | — |
| | (22.6 | ) | | 1.2 |
| | (18.0 | ) |
OTC commodity swaps(1) | Other long term assets | | — |
| | — |
| | — |
| | — |
|
OTC commodity swaps(1) | Other long term liabilities | | — |
| | — |
| | — |
| | (17.3 | ) |
| Interest rate derivatives | Other long term liabilities | | — |
| | (1.3 | ) | | — |
| | — |
|
| Total gross fair value of derivatives | | $ | 105.1 |
| | $ | (146.0 | ) | | $ | 53.1 |
| | $ | (104.4 | ) |
Less: Counterparty netting and cash collateral(3) | | 86.8 |
| | (103.1 | ) | | 46.3 |
| | (61.0 | ) |
| Less: Amounts subject to master netting arrangements that are not netted on the balance sheet | | 0.1 |
| | (0.1 | ) | | — |
| | — |
|
| Total net fair value of derivatives | | $ | 18.2 |
| | $ | (42.8 | ) | | $ | 6.8 |
| | $ | (43.4 | ) |
| | | | | |
(1)
28 | | As of September 30, 2017 and December 31, 2016, we had open derivative positions representing 44,728,393 barrels and 9,348,000 barrels, respectively, of crude oil and refined petroleum products. Of these open positions, contracts representing 575,000 barrels and 3,392,000 barrels were designated as cash flow hedging instruments as of September 30, 2017 and December 31, 2016, respectively. |
| |
(2)
| As of September 30, 2017 and December 31, 2016, we had open RIN contracts representing 443,756,545 and 36,750,000 RINs, respectively. |
| |
(3)
| As of September 30, 2017 and December 31, 2016, $16.3 million and $14.7 million, respectively, of cash collateral held by counterparties has been netted with the derivatives with each counterparty. |
Total losses on our commodity derivatives and RIN commitment contracts recorded in cost of goods sold on the condensed consolidated statements of income for the three and nine months ended September 30, 2017 and 2016 are as follows (in millions):
|
| | | | | | | | | | | | | | | | |
| | | Three Months Ended September 30, | | Nine Months Ended September 30, |
| | | 2017 | | 2016 | | 2017 | | 2016 |
| Gains (losses) on commodity derivatives not designated as hedging instruments | | $ | (15.5 | ) | | $ | 3.2 |
| | $ | (5.6 | ) | | $ | (9.5 | ) |
| Realized losses reclassified out of OCI on commodity derivatives designated as cash flow hedging instruments | | 1.0 |
| | (7.0 | ) | | (38.5 | ) | | (21.3 | ) |
| Gains recognized on commodity derivatives due to cash flow hedging ineffectiveness | | 0.1 |
| | 2.2 |
| | 0.5 |
| | 2.7 |
|
| Total | | $ | (14.4 | ) | | $ | (1.6 | ) | | $ | (43.6 | ) | | $ | (28.1 | ) |
Notes to Condensed Consolidated Financial Statements (Unaudited)
For cash flow hedges, no component of the derivative instruments’ gains or losses was excluded from the assessment of hedge effectiveness for the three and nine months ended September 30, 2017 or 2016. As of September 30, 2017 and December 31, 2016, losses of $4.7 million and $16.2 million, respectively, on cash flow hedges, net of tax, primarily related to future purchases of crude oil and the associated sale of finished grade fuel, remained in accumulated other comprehensive income. Losses of $0.7 million and $25.0 million, net of tax, on settled commodity contracts were reclassified into cost of goods sold in the condensed consolidated statements of income during the three and nine months ended September 30, 2017, respectively. Losses of $4.5 million and $13.9 million, net of tax, on settled commodity contracts were reclassified into cost of goods sold in the condensed consolidated statements of income during the three and nine months ended September 30, 2016, respectively. We estimate that $7.2 million of deferred losses related to commodity cash flow hedges will be reclassified into cost of goods sold over the next 12 months as a result of hedged transactions that are forecasted to occur. As of September 30, 2017, gains of $0.1 million, net of tax, related to the interest rate cash flow hedges, remained in accumulated other comprehensive income. We estimate that a nominal amount of deferred gains related to interest rate cash flow hedges will be reclassified into interest expense over the next 12 months as a result of hedged transactions that are forecasted to occur. Related to Alon's interest rate swap cash flow hedges, we recognized $0.1 million in interest expense on the condensed consolidated statements of income, and there was no cash flow hedge ineffectiveness for the three months ended September 30, 2017. There are no interest rate derivatives that are not designated as hedging instruments.
For the nine months ended September 30, 2017 and September 30, 2016, there were no amounts reclassified from accumulated other comprehensive income into income as a result of the discontinuation of cash flow hedge accounting.
17.Note 11 - Commitments and Contingencies
Litigation
In the ordinary conduct of our business, we are from time to time subject to lawsuits, investigations and claims, including environmental claims and employee-related matters.
Although we cannot predict with certainty the ultimate resolution of lawsuits, investigations and claims asserted against us, including civil penalties or other enforcement actions, we do not believe that any currently pending legal proceeding or proceedings to which we are a party will have a material adverse effect on our business, financial conditionstatements. Certain environmental matters that have or resultsmay result in penalties or assessments are discussed below in the "Environmental, Health and Safety" section of operations.
this note.
One of our Alon subsidiaries was partythe defendant in a legal action related to an easement dispute arising from a purchase of property that occurred in October 2013. In June 2019, the court found in favor of the plaintiffs and assessed damages against such subsidiary, which were reduced in the fourth quarter of 2019 to $6.4 million. Such amount is included as of September 30, 2021 and December 31, 2020 in accrued expenses and other current liabilities on the accompanying condensed consolidated balance sheet. The matter is currently under appeal, but has been remanded to the district court regarding jurisdictional issues.
On June 19, 2017, the Arkansas Teacher Retirement System filed a lawsuit in the Delaware Court of Chancery (Arkansas Teacher Retirement System v. Alon USA Energy, Inc., et al., Case No. 2017-0453), asserting claims for breach of fiduciary duty in connection with the business combination of Delek US Holdings, Inc. and Alon USA Energy, Inc. Following a mediation, the parties to the litigation agreed to a lawsuit alleging breachsettlement and release of contract pertainingall claims of the plaintiff class in exchange for the defendants' agreement to an asphalt supply agreement. Duringpay $44.8 million into a settlement fund, of which our insurance carriers agreed to fund approximately $42.5 million under the three months endedapplicable insurance policies and pursuant to varying limits and limitations. The settlement, in which the Company and other defendants expressly deny all assertions of wrongdoing or fault, was approved by the Court on October 29, 2021. In addition to the $2.3 million of the settlement that was not covered by insurance, we accrued $4.2 million of estimated unpaid and remaining legal fees. As of September 30, 2017, we reached a settlement on this matter which was2021 the remaining unpaid balance is $0.8 million, and is included in accrued expenses and other current liabilities in purchase accounting as part ofon the fair value of the liabilities assumed in the Delek/Alon Merger.accompanying condensed consolidated balance sheet.
Self-insurance
Delek is self-insured forWith respect to workers’ compensation claims, we are subject to claims losses up to a $1.0$4.0 million deductible on a per-accident basis. We self-insure forper accident basis, general liability claims up to $4.0 million on a per-occurrence basis.per occurrence basis and medical claims for eligible full-time employees up to $0.3 million per covered individual per calendar year. We self-insure forare also subject to auto liability up to a $1.0 million deductible on a per-accident basis for claims incurred in recent periods, andlosses up to a $4.0 million deductible for remaining claims from certain prior periods.
on a per accident basis.
We have umbrella liability insurance available to each of our segments in an amount determined reasonable by management.
Environmental, Health and Safety
We are subject to extensive federal, state and local environmental and safety laws and regulations enforced by various agencies, including the EPA, the United States Department of Transportation, the Occupational Safety and Health Administration, as well as numerous state, regional and local environmental, safety and pipeline agencies.
These laws and regulations govern the discharge of materials into the environment, waste management practices, pollution prevention measures and the composition of the fuels we produce, as well as the safe operation of our plants and pipelines and the safety of our workers and the public. Numerous permits or other authorizations are required under these laws and regulations for the operation of our refineries, biodieselrenewable fuels facilities, terminals, pipelines, underground storage tanks, ("USTs"), trucks, rail cars and related operations, and may be subject to revocation, modification and renewal.
These laws and permits raise potential exposure to future claims and lawsuits involving environmental and safety matters which could include soil and water contamination, air pollution, personal injury and property damage allegedly caused by substances which we manufactured, handled, used, released or disposed of, transported, or that relate to pre-existing conditions for which we have assumed responsibility. We believe that our current operations are in substantial compliance with existing environmental and safety requirements. However, there have been and will continue to be ongoing discussions about environmental and safety matters between us and federal and state authorities, including notices of violations, citations and other enforcement actions, some of which have resulted or may result in changes to operating procedures and in capital expenditures. While it is often difficult to quantify future environmental or safety related expenditures, we anticipate that continuing capital investments and changes in operating procedures will be required for the foreseeable future to comply with existing and new requirements, as well as evolving interpretations and more strict enforcement of existing laws and regulations.
Our recently acquired Big Spring refinery has been negotiating an agreement with EPA for over 10 years under EPA’s National Petroleum Refinery Initiative regarding alleged historical violations of the federal Clean Air Act. A Consent Decree resolving these alleged historical violations for the Big Spring refinery was lodged with the United States District Court for the Northern District of Texas on June 6, 2017, and we expect that Consent Decree to become final later this year. If finalized, the Consent Decree will require payment of a $0.5 million civil penalty and capital expenditures for pollution control equipment that may be significant over the next 5 years.
As of September 30, 2017,2021, we have recorded an environmental liability of approximately $77.1$112.1 million, primarily related to the estimated probable costs of remediating or otherwise addressing certain environmental issues of a non-capital nature at the Tyler, El Dorado, Big Spring, Krotz Springs and Californiaour refineries, as well as terminals, some of which we no longer own. This liability includes estimated costs for ongoing investigation and remediation efforts which were already being performed by the former operators of the refineries and terminals prior to our acquisition of those facilities, for known contamination of soil and groundwater, as well as estimated costs for additional issues which have been identified subsequent to the acquisitions. We expect approximately $0.1 million of this amount to be reimbursable by a prior owner of the El Dorado refinery, which we have recorded in other current assets in our condensed consolidated balance sheet as of September 30, 2017. We expect approximately $2.9 million of this amount to be reimbursable by a prior owner of certain assets associated with the Paramount refinery, and have recorded $0.6 million in other current assets and $2.3 million in other non-current assets in our condensed consolidated balance sheet as of September 30, 2017.
groundwater. Approximately $7.3$2.8 million of the total liability is expected to be expended over the next 12 months, with most of the balance expended by 2046.2032, although some costs may extend up to 30 years. In the future, we could be
Notes to Condensed Consolidated Financial Statements (Unaudited)
required to extend the expected remediation period or undertake additional investigations of our refineries, pipelines and terminal facilities, which could result in the recognition of additional remediation liabilities.
We are also subject to various regulatory requirements related to carbon emissions and the compliance requirements to remit environmental credit obligations due to the EPA or other regulatory agencies, the most significant of which relates to the RINs Obligation subject to the EPA’s RFS-2 regulations (as defined in our accounting policies in Note 1 to the audited consolidated financial statements included in Item. 8 Financial Statements and Supplementary Data, of our December 31, 2020 Annual Report on Form 10-K). The RFS-2 regulations are highly complex and evolving, requiring us to periodically update our compliance systems. As part of our on-going monitoring and compliance efforts, on an annual basis we engage a third party to perform procedures to review our RINs inventory, processes and compliance. The results of such procedures may include procedural findings but may also include findings regarding the usage of RINs to meet past obligations, the treatment of exported RINs, and the propriety of RINs on-hand and related adjustments to our RINs inventory, which (to the extent they are valued) offset our RINs Obligation. Such adjustments may also require communication with the EPA if they involve reportable non-compliance which could lead to the assessment of penalties. Based on management’s review which was completed during the second quarter 2021, we recorded a RINs inventory true-up adjustment totaling $(12.3) million which increased our recorded RINs Obligation. We have also self-reported our related instances of non-compliance to the EPA, and while we cannot yet estimate the extent of penalties that may be assessed, it is not expected to be material in relation to our total RINs Obligation.
Other Losses and Contingencies
Delek maintains property damage insurance policies which have varying deductibles. Delek also maintains business interruption insurance policies, with varying coverage limits and waiting periods. Covered losses in excess of the deductible and outside of the waiting period will be recoverable under the property and business interruption insurance policies.
El Dorado Refinery Fire
On February 27, 2021, our El Dorado refinery experienced a fire in its Penex unit. NaN employees were injured in the fire, which was investigated by the Occupational Safety and Health Administration. Contrary to initial assessments, and despite occurring during the early stages of turnaround activity, the facility did suffer operational disruptions as a result of the fire. During the nine months ended September 30, 2021, we incurred workers' compensation losses of $3.8 million associated with the fire, which is included in operating expenses in the accompanying condensed consolidated statements of income. Additionally, we recognized accelerated depreciation of $1.0 million in the nine months ended September 30, 2021 due to property damaged in the fire, which was recovered during the three months ended September 30, 2021. An additional $3.4 million was recognized as a gain, in excess of these losses, during the three months ended September 30, 2021. We continue to incur repair costs that may be recoverable under property and casualty insurance policies. If applicable, we accrue receivables for probable insurance or other third-party recoveries. Work to determine the full extent of covered business interruption and property and casualty losses and potential insurance claims is ongoing and may result in the future recognition of insurance recoveries.
Winter Storm Uri
During February 2021, the Company experienced a severe weather event ("Winter Storm Uri") which temporarily impacted operations at all of our refineries. Due to the extreme freezing conditions, we experienced reduced throughputs at our refineries as there was a disruption in the crude supply, as well as damages to various units at our refineries requiring additional operating and capital expenditures. We recognized additional operating expenses in the amount of $28.4 million in the nine months ended September 30, 2021 due to property damaged in the freeze, and we continue to incur repair costs that may be recoverable under property and casualty insurance policies. If applicable, we accrue receivables for probable insurance or other third-party recoveries. During the three months ended September 30, 2021, we recorded $17.0 million in receivables from the insurers for those losses. Work to determine the full extent of covered business interruption and property and casualty losses and potential insurance claims is ongoing and is expected to result in additional future recognition of insurance recoveries.
Crude Oil and Other Releases
We have experienced several crude oil and other releases from pipelines owned byinvolving our logistics segment, including, but not limited to,assets. There were no material releases that occurred during the nine months ended September 30, 2021. For releases that occurred in prior years, we have received regulatory closure or a release at Magnolia Station in March 2013, a release near Fouke, Arkansas in April 2015 and a release near Woodville, Texas in January 2016. In June 2015, the United States Department of Justice notified Delek Logistics that they were evaluating an enforcement action on behalfmajority of the EPA with regardcleanup and remediation efforts are substantially complete. For the release sites that have not yet received regulatory closure, we expect to potential Clean Water Act violations arising from the March 2013 Magnolia Station release. We are currently attempting to negotiate a resolution to this matter with the EPAreceive regulatory closure in 2021 and the ADEQ, which may include monetary penalties and/or other relief. Based on current information available to us, we do not believe the totalanticipate material costs associated with these events, whether alone or in the aggregate, including any fines or penalties will have a material adverse effect uponor the completion of activities that may be needed to achieve regulatory closure. Expenses incurred for the remediation of these crude oil and other releases are included in operating expenses in our business, financial condition or resultscondensed consolidated statements of operations.income.
Letters of Credit
As of September 30, 2017,2021, we had in place letters of credit totaling approximately $146.0$278.3 million with various financial institutions securing obligations primarily with respect to our commodity purchasestransactions for the refining segment and certain of our gasoline and diesel purchases for the logistics segment and our workers’ compensation and auto liability self-insuranceinsurance programs. NoThere were no amounts were drawn by beneficiaries of these letters of credit at September 30, 2017.
2021.
Operating Leases
Delek leases buildings, equipment and corporate office space under agreements expiring at various dates through 2035 after considering available renewal options. Many of these leases contain renewal options and require DelekNotes to pay executory costs (such as property taxes, maintenance and insurance).
Updated for the effects of the Delek/Alon Merger, the following is our estimate of future minimum lease payments for operating leases having remaining noncancelable terms in excess of one year as of September 30, 2017 (in millions):
Condensed Consolidated Financial Statements (Unaudited)
|
| | | | |
| 4th Quarter 2017 | | $ | 11.6 |
|
| 2018 | | 38.9 |
|
| 2019 | | 22.2 |
|
| 2020 | | 13.7 |
|
| 2021 | | 9.9 |
|
| Thereafter | | 34.6 |
|
| Total future minimum lease payments | | $ | 130.9 |
|
18. Employees
Workforce Update
Approximately 134 employees who work at our Big Spring refinery are covered by a collective bargaining agreement that expires April 1, 2019. None of the other employees of Alon are represented by a union.
Retirement Plans Update
Effective with the Delek/Alon Merger (see Note 2),Under ASC 740 we now have four defined benefit pension plans covering substantially all of Alon's employees, excluding employees of the retail segment. The benefits are based on years of service and the employee’s final average monthly compensation. Our funding policy isused an estimated annual tax rate to contribute annually no less than the minimum required nor more than the maximum amount that can be deducted for federalrecord income tax purposes. Contributions are intended to provide not only for benefits attributed to service to date but also for those benefits expected to be earned in the future. The plans were frozen for non-union employees effective September 30, 2017.
The components of net periodic benefit cost related to our benefit planstaxes for the three and nine months ended September 30, 2017 consisted2021 and September 30, 2020. Our effective tax rate was 18.5% and 27.6% for the three and nine months ended September 30, 2021, respectively, and 16.9% and 32.0% for the three and nine months ended September 30, 2020, respectively. The difference between the effective tax rate and the statutory rate is generally attributable to permanent differences and discrete items. The change in our effective tax rate for the three and nine months ended September 30, 2021 as compared to the three and nine months ended September 30, 2020 was primarily due to the impact of credits and permanent differences on the following:tax rate due to changes in pre-tax book income and adjustments reported in 2020 to reflect the reversal of a valuation allowance for deferred tax assets in partnership investments and federal net operating loss carryback to a prior 35% tax rate year coupled with the impact of changes in the third quarter estimated annual effective tax rate applied to year-to date loss for the nine months ended September 30, 2021 and September 30, 2020.
As of December 31, 2020, we recorded a current income tax receivable of $135.6 million and a non-current tax receivable of $20.6 million, related to the federal net operating loss carryback as allowed per the Coronavirus Aid Relief, and Economic Security Act (the "CARES Act") which was enacted in March 2020. The full amount of this federal income tax receivable, totaling $156.2 million, was received in July and August of 2021.
Note 13 - Related Party Transactions
Our related party transactions consist primarily of transactions with our equity method investees (See Note 5). Transactions with our related parties were as follows for the periods presented (in millions):
| | | | | | | | | | | | | | | | | | | | | | | | | | |
| | Three Months Ended September 30, | | Nine Months Ended September 30, |
| | 2021 | | 2020 | | 2021 | | 2020 |
Revenues (1) | | $ | 25.7 | | | $ | 27.6 | | | $ | 55.3 | | | $ | 57.5 | |
Cost of materials and other (2) | | $ | 12.4 | | | $ | 10.9 | | | $ | 37.4 | | | $ | 31.4 | |
(1)Consists primarily of asphalt sales which are recorded in corporate, other and eliminations segment.
(2)Consists primarily of pipeline throughput fees paid by the refining segment and asphalt purchases.
Note 14 - Other Current Assets and Liabilities
The detail of other current assets is as follows (in millions):
| | | | | | | | | | | |
| Other Current Assets | September 30, 2021 | | December 31, 2020 |
| | | |
| Short-term derivative assets (see Note 9) | 45.1 | | | 72.9 | |
| Prepaid expenses | 19.2 | | | 21.8 | |
| Income and other tax receivables | $ | 4.5 | | | $ | 142.0 | |
| | | |
| | | |
| | | |
| | | |
| Other | 11.5 | | | 19.7 | |
| Total | $ | 80.3 | | | $ | 256.4 | |
The detail of accrued expenses and other current liabilities is as follows (in millions):
| | | | | | | | | | | |
| Accrued Expenses and Other Current Liabilities | September 30, 2021 | | December 31, 2020 |
| | | |
| Product financing agreements | $ | 342.5 | | | $ | 198.0 | |
| Crude purchase liabilities | 142.3 | | | 62.1 | |
| Income and other taxes payable | 99.2 | | | 109.5 | |
| Consolidated Net RINs Obligation deficit (see Note 10) | 92.7 | | | 59.6 | |
| Employee costs | 36.9 | | | 30.2 | |
| Short-term derivative liabilities (see Note 9) | 30.7 | | | 35.8 | |
| Inventory reserve | 29.5 | | | — | |
| Deferred revenue | 12.9 | | | 16.5 | |
| | | |
| | | |
| | | |
| | | |
| Other | 53.3 | | | 34.7 | |
| Total | $ | 840.0 | | | $ | 546.4 | |
Notes to Condensed Consolidated Financial Statements (Unaudited)
|
| | | | |
| Components of net periodic benefit cost: | | |
| Service cost | | $ | 1.0 |
|
| Interest cost | | 1.3 |
|
| Expected return on plan assets | | (1.4 | ) |
| Recognition due to curtailment | | (6.1 | ) |
| Net periodic benefit cost | | $ | (5.2 | ) |
Net periodic benefit costs
Note 15 - Equity-Based Compensation
Delek US Holdings, Inc. 2006 and 2016 and Alon USA Energy, Inc. 2005 Long-Term Incentive Plans (collectively, the "Incentive Plans")
On May 6, 2021, the Company's stockholders approved an amendment to the Delek US Holdings, Inc. 2016 Long-Term Incentive Plan that increased the number of shares of common stock available for issuance under this plan by 3,215,000 shares to 14,235,000 shares.
Compensation expense related to equity-based awards granted under the Incentive Plans amounted to $6.5 million and $16.7 million for the three and nine months ended September 30, 2021, respectively, and $6.6 million and $17.4 million for the three and nine months ended September 30, 2020, respectively. These amounts are included as part ofin general and administrative expenses in the accompanying condensed consolidated statements of income. As of September 30, 2021, there was $39.5 million of total unrecognized compensation cost related to non-vested share-based compensation arrangements, which is expected to be recognized over a weighted-average period of 1.5 years.
Our contributions to these pension plansWe issued net shares of common stock of 62,803 and 343,596 as a result of exercised or vested equity-based awards during the three and nine months ended September 30, 2017 were $5.3 million,2021, respectively, and we expect68,265 and 314,204 for the three and nine months ended September 30, 2020, respectively. These amounts are net of 11,781 and 159,110 shares withheld to contribute $0.7 millionsatisfy employee tax obligations related to these pension plansthe exercises and vesting during the remainderthree and nine months ended September 30, 2021, and 31,020 and 161,469 for the three and nine months ended September 30, 2020, respectively
Delek Logistics GP, LLC 2012 Long-Term Incentive Plan
The Delek Logistics GP, LLC 2012 Long-Term Incentive Plan (the "LTIP") was adopted by the Delek Logistics GP, LLC board of 2017.
Our overall expected long-term rate of return on assets, effectivedirectors in connection with the Delek/Alon merger,completion of Delek Logistics' initial public offering in November 2012. The LTIP is 7.45%.
Also, effective withadministered by the Delek/Alon Merger, our 401(k) savings plans are available to eligible Alon employees, for which contributions are matched up at varying levels ranging from 4.5% to 8% of eligible compensation.
Postretirement Medical Plan
In addition to providing pension benefits, Alon has an unfunded postretirement medical plan covering certain health care and life insurance benefits for certain employees of Alon, that retired prior to January 2, 2017, who met eligibility requirements in the plan documents. This plan is closed to new participants. The health care benefits in excess of certain limits are insured.
19. Subsequent Events
Planned Acquisition of Non-controlling Interest in Alon Partnership
On November 8, 2017, Delek and the Alon Partnership entered into a definitive merger agreement under which Delek will acquire all of the outstanding limited partner units which Delek does not already own in an all-equity transaction. Delek currently owns approximately 51.0 million limited partner units of the Alon Partnership, or approximately 81.6% of the outstanding units. Under terms of the merger agreement, the owners of the remaining outstanding units in the Alon Partnership that Delek does not currently own will receive a fixed exchange ratio of 0.49 Delek shares for each limited partner unit of the Alon Partnership. This transaction was approved by all voting membersConflicts Committee of the board of directors of Delek Logistics' general partner. On June 9, 2021, the general partner of the Alon Partnership upon the recommendation from its conflicts committee and by theDelek Logistics GP, LLC board of directors amended the LTIP and increased the number of Delek. This transactioncommon units representing limited partner interests in Delek Logistics (the "Common Units") authorized for issuance under this plan by 300,000 Common Units to 912,207 Common Units. The term of the LTIP was also extended to June 9, 2031.
Delek US Holdings, Inc. Employee Stock Purchase Plan
On June 2, 2021, the Company's board of directors adopted the Delek US Holdings, Inc. Employee Stock Purchase Plan (the "ESPP"). The ESPP is expected to closestructured as a qualified employee stock purchase plan under Section 423 of the U.S. Internal Revenue Code of 1986. The Company authorized the issuance of 2,000,000 shares of common stock under the ESPP. On each purchase date, eligible employees (as defined in the firstESPP) can purchase the Company's stock at a price per share equal to 85.0% of the closing price of the Company's common stock on the exercise date, but no less than par value. There are 4 offering periods of three months during each fiscal year, beginning each January 1st, April 1st, July 1st, and October 1st. No shares of common stock were issued under the ESPP as of September 30, 2021.
Note 16 - Shareholders' Equity
Dividends Suspension
We elected to suspend dividends beginning in the fourth quarter of 2018.2020 in order to conserve capital.
Dividend DeclarationStock Repurchase Program
On November 7, 2017,6, 2018, our Board of Directors votedauthorized a share repurchase program for up to declare a quarterly cash dividend$500.0 million of $0.15 perDelek common stock. Any share repurchases under the repurchase program may be implemented through open market transactions or in privately negotiated transactions, in accordance with applicable securities laws. The timing, price and size of repurchases are made at the discretion of management and will depend on prevailing market prices, general economic and market conditions and other considerations. The repurchase program does not obligate us to acquire any particular amount of stock and does not expire. In the second quarter of 2020, we elected to suspend the share repurchase program. During the nine months ended September 30, 2020, 58,713 shares of our common stock payablewere repurchased for a total of $1.9 million; none of which were repurchased during the third quarter of 2020. No repurchases of our common stock were made in the three and nine months ended September 30, 2021. As of September 30, 2021, there was $229.7 million of authorization remaining under Delek's aggregate stock repurchase program.
Stockholder Rights Plan
On March 20, 2020, our Board of Directors declared a dividend of one preferred share purchase right (a “Right”) for each outstanding share of Delek’s common stock and adopted a stockholder rights plan (the “Rights Agreement”). The dividend was distributed in a non-
Notes to Condensed Consolidated Financial Statements (Unaudited)
cash transaction on December 15, 2017March 30, 2020 to shareholdersthe stockholders of record on November 22, 2017.that date. The Rights traded with Delek’s common stock and expired in accordance with the terms of the Rights Agreement on March 19, 2021.
Note 17 - Leases
We lease certain retail stores, land, building and various equipment from others. Leases with an initial term of 12 months or less are not recorded on the balance sheet; we recognize lease expense for these leases on a straight-line basis over the lease term. Most leases include one or more options to renew, with renewal terms that can extend the lease term from one to 15 years or more. The exercise of existing lease renewal options is at our sole discretion. Certain leases also include options to purchase the leased property. The depreciable life of assets and leasehold improvements are limited by the expected lease term, unless there is a transfer of title or purchase option reasonably certain of exercise.
Some of our lease agreements include a rate based on equipment usage and others include a rate with fixed increases or inflationary indices based increase. Our lease agreements do not contain any material residual value guarantees or material restrictive covenants. We rent or sublease certain real estate and equipment to third parties. Our sublease portfolio consists primarily of operating leases within our retail stores and crude storage equipment.
As of September 30, 2021, $25.0 million of our net property, plant, and equipment balance is subject to an operating lease. This agreement does not include options for the lessee to purchase our leasing equipment, nor does it include any material residual value guarantees or material restrictive covenants. The agreement includes a one-year renewal option and certain variable payment based on usage.
The following table presents additional information related to our operating leases in accordance ASC 842, Leases ("ASC 842"):
| | | | | | | | | | | | | | | | | | | | | | | | | | |
| | Three Months Ended September 30, | | Nine Months Ended September 30, |
| (in millions) | | 2021 | | 2020 | | 2021 | | 2020 |
| Lease Cost | | | | | | | | |
Operating lease costs (1) | | $ | 15.7 | | | $ | 16.9 | | | $ | 51.2 | | | $ | 48.5 | |
Short-term lease costs (2) | | 7.0 | | | 5.4 | | | 27.5 | | | 19.1 | |
| Sublease income | | (2.0) | | | (1.8) | | | (5.8) | | | (5.7) | |
| Net lease costs | | $ | 20.7 | | | $ | 20.5 | | | $ | 72.9 | | | $ | 61.9 | |
| Other Information | | | | | | | | |
| Cash paid for amounts included in the measurement of lease liabilities: | | | | | | | | |
Operating cash flows from operating leases (1) | | $ | (16.5) | | | $ | (16.9) | | | $ | (52.8) | | | $ | (48.5) | |
| Leased assets obtained in exchange for new operating lease liabilities | | $ | 14.2 | | | $ | 8.5 | | | $ | 28.4 | | | $ | 30.7 | |
| Leased assets obtained in exchange for new financing lease liabilities | | $ | 3.2 | | | $ | — | | | $ | 15.6 | | | $ | — | |
| | | | | | | | |
| | | | | | September 30, 2021 | | September 30, 2020 |
| | | | | | | | |
| Weighted-average remaining lease term (years) operating leases | | | | | | 4.8 | | 6.1 |
| Weighted-average remaining lease term (years) financing leases | | | | | | 6.7 | | N/A |
Weighted-average discount rate operating leases (3) | | | | | | 6.4 | % | | 5.9 | % |
Weighted-average discount rate financing leases (3) | | | | | | 3.2 | % | | N/A |
(1)Includes an immaterial amount of financing lease cost.
(2)Includes an immaterial amount of variable lease cost.
(3) Our discount rate is primarily based on our incremental borrowing rate in accordance with ASC 842.
Management's Discussion and Analysis
ITEM 2.MANAGEMENT’S DISCUSSION AND ANALYSIS OF FINANCIAL CONDITION AND RESULTS OF OPERATIONS
Management’s Discussion and Analysis of Financial Condition and Results of Operations ("MD&A") is management’s analysis of our financial performance and of significant trends that may affect our future performance. The MD&A should be read in conjunction with our condensed consolidated financial statements and related notes included elsewhere in this Quarterly Report on Form 10-Q and in the Annual Report on Form 10-K filed with the Securities and Exchange Commission ("SEC") on February 28, 2017March 1, 2021 (the "Annual Report on Form 10-K"). Those statements in the MD&A that are not historical in nature should be deemed forward-looking statements that are inherently uncertain.
In January 2017, we announced that Delek US Holdings, Inc. (and various related entities) had entered into an Agreement and Plan of Merger with Alon USA Energy, Inc. (NYSE: ALJ) ("Alon"), as subsequently amended on February 27 and April 21, 2017 (as so amended, the "Merger Agreement"). The related Merger (the "Merger" or the "Delek/Alon Merger") was effective July 1, 2017 (the “Effective Time”), resulting inis a new post-combination consolidated registrant renamed as Delek US Holdings, Inc. (“New Delek”), with Alon and the previous Delek US Holdings, Inc. (“Old Delek”) surviving as wholly-owned subsidiaries. New Delek is the successor issuer to Old Delek and Alon pursuant to Rule 12g-3(c) under the Securities Exchange Act of 1934 (the "Exchange1933, as amended ("Securities Act"), as amended. In addition, as a result of the Delek/Alon Merger, the shares of common stock of Old Delek and Alon were delisted fromis listed on the New York Stock Exchange in July 2017, and their respective reporting obligations("NYSE") under the Exchange Act were terminated. Concurrently, the shares of common stock of New Delek began trading under Old Delek's former ticker symbol "DK." Prior to July 1, 2017, Old Delek owned a non-controlling equity interest of approximately 47% of the outstanding shares (the "ALJ Shares") in Alon. Alon is a refiner and marketer of petroleum products, operating primarily in the south central, southwestern and western regions of the United States. Alon owns 100% of the general partner and 81.6% of the limited partner interests in Alon USA Partners, LP (NYSE: ALDW), which owns a crude oil refinery in Big Spring, Texas with a crude oil throughput capacity of 73,000 bpd and an integrated wholesale marketing business. In addition, Alon directly owns a crude oil refinery in Krotz Springs, Louisiana with a crude oil throughput capacity of 74,000 bpd. Alon also owns crude oil refineries in California, which have not processed crude oil since 2012. Alon is a marketer of asphalt, which it distributes through asphalt terminals located predominantly in the southwestern and western United States. Alon is the largest 7-Eleven licensee in the United States and operates approximately 300 convenience stores which market motor fuels primarily in central and west Texas and New Mexico.
"DK". Unless otherwise noted or the context requires otherwise, the terms "we," "our," "us," "Delek" and the "Company" are used in this report to refer to Old Delek US Holdings, Inc. and its consolidated subsidiaries for all periods presented. You should read the periods priorfollowing discussion of our financial condition and results of operations in conjunction with our historical condensed consolidated financial statements and notes thereto.
The Company announces material information to July 1,2017,the public about the Company, its products and New Delekservices and other matters through a variety of means, including filings with the SEC, press releases, public conference calls, the Company’s website (www.delekus.com), the investor relations section of its consolidated subsidiaries forwebsite (ir.delekus.com), the periods on news section of its website (www.delekus.com/news), and/or after July 1, 2017.social media, including its Twitter account (@DelekUSHoldings). The Company encourages investors and others to review the information it makes public in these locations, as such information could be deemed to be material information. Please note that this list may be updated from time to time.
Forward-Looking Statements
This Quarterly Report on Form 10-Q contains "forward-looking statements" within the meaning of Section 27A of the Securities Act of 1933, as amended, and Section 21E of the Securities Exchange Act of 1934 as amended (the "Exchange("Exchange Act"). These forward-looking statements reflect our current estimates, expectations and projections about our future results, performance, prospects and opportunities. Forward-looking statements include, among other things, statements regarding the effect, impact, potential duration or other implications of, or expectations expressed with respect to, the outbreak of COVID-19, its development into a pandemic in March 2020, and any subsequent mutation of COVID-19 into one or more variants (the "COVID-19 Pandemic" or the "Pandemic") and the actions of members of the Organization of Petroleum Exporting Countries ("OPEC") and other leading oil producing countries (together with OPEC, “OPEC+”), with respect to oil production and pricing, and statements regarding our efforts and plans in response to such events, the information concerning our planned capital expenditures by segment for 2021, possible future results of operations, business and growth strategies, financing plans, expectations that regulatory developments or other matters will or will not have a material adverse effect on our business or financial condition, our competitive position and the effects of competition, the projected growth of the industry in which we operate, and the benefits and synergies to be obtained from our completed and any future acquisitions, statements of management’s goals and objectives, and other similar expressions concerning matters that are not historical facts. Words such as "may," "will," "should," "could," "would," "predicts," "potential," "continue," "expects," "anticipates," "future," "intends," "plans," "believes," "estimates," "appears," "projects" and similar expressions, as well as statements in future tense, identify forward-looking statements.
Forward-looking statements should not be read as a guarantee of future performance or results, and will not necessarily be accurate indications of the times at, or by, which such performance or results will be achieved. Forward-looking information is based on information available at the time and/or management’s good faith belief with respect to future events, and is subject to risks and uncertainties that could cause actual performance or results to differ materially from those expressed in the statements. Important factors that, individually or in the aggregate, could cause such differences include, but are not limited to:
•volatility in our refining margins or fuel gross profit as a result of changes in the prices of crude oil, other feedstocks and refined petroleum products;
risk factors relating to the Delek/Alon Merger, including but not limited to risks surrounding the combining of operations, financial position and cash flows as well as systems, processes and controls going forward, as further discussed in Part II, Item 1A, "Risk Factors";
our ability to execute our strategy of growth through acquisitionsproducts and the transactional risks inherent in such acquisitions;
acquired assets may suffer a diminishment in fair value, which may require us to record a write-down or impairment;
liabilities related to, and the effectsimpact of the sale of the Retail Entities (as defined below);COVID-19 Pandemic on such demand;
•reliability of our operating assets;
competition;•actions of our competitors and customers;
•changes in, or the failure to comply with, the extensive government regulations applicable to our industry segments;segments, including current and future restrictions on commercial and economic activities in response to the COVID-19 Pandemic or future pandemics;
diminution
•our ability to execute our strategy of growth through acquisitions and capital projects and changes in the expected value of and benefits derived therefrom, including any ability to successfully integrate acquisitions, realize expected synergies or achieve operational efficiency and effectiveness;
•diminishment in value of long-lived assets may result in an impairment in the carrying value of the assets on our balance sheet and a resultant loss recognized in the statement of operations;
•the unprecedented market environment and economic effects of the COVID-19 Pandemic, including uncertainty
Management's Discussion and Analysis
regarding the timing, pace and extent of economic recovery in the United States ("U.S.") due to the COVID-19 Pandemic;
•general economic and business conditions affecting the southern, southwestern and western United States;U.S., particularly levels of spending related to travel and tourism and the ongoing and future impacts of the COVID-19 Pandemic;
•volatility under our derivative instruments;
•deterioration of creditworthiness or overall financial condition of a material counterparty (or counterparties);
•unanticipated increases in cost or scope of, or significant delays in the completion of, our capital improvement and periodic turnaround projects;
•risks and uncertainties with respect to the quantities and costs of refined petroleum products supplied to our pipelines and/or held in our terminals;
•operating hazards, natural disasters, weather related disruptions, casualty losses and other matters beyond our control;
•increases in our debt levels or costs;
•possibility of accelerated repayment on a portion of the J. Aron supply and offtake liability if the purchase price adjustment feature triggers a change on the re-pricing dates;
•changes in our ability to continue to access the credit markets;
•compliance, or failure to comply, with restrictive and financial covenants in our various debt agreements;
•the inabilitysuspension of our subsidiaries to freely make dividends, loans or other cash distributions to us;quarterly dividend;
•seasonality;
•acts of terrorism (including cyber-terrorism) aimed at either our facilities or other facilities that could impair our ability to produce or transport refined products or receive feedstocks;
•future decisions by OPEC+ members regarding production and pricing and disputes between OPEC+ members regarding the same;
•disruption, failure, or cybersecurity breaches affecting or targeting our IT systems and controls, our infrastructure, or the infrastructure of our cloud-based IT service providers;
•changes in the cost or availability of transportation for feedstocks and refined products; and
•other factors discussed under the headings "Management’s Discussion and Analysis of Financial Condition and Results of Operations" and "Risk Factors" and in our other filings with the SEC.
In light of these risks, uncertainties and assumptions, our actual results of operations and execution of our business strategy could differ materially from those expressed in, or implied by, the forward-looking statements, and you should not place undue reliance upon them. In addition, past financial and/or operating performance is not necessarily a reliable indicator of future performance, and you should not use our historical performance to anticipate future results or period trends. We can give no assurances that any of the events anticipated by any forward-looking statements will occur or, if any of them do, what impact they will have on our results of operations and financial condition.
Forward-lookingAll forward-looking statements speak only as ofincluded in this report are based on information available to us on the date the statements are made.of this report. We assumeundertake no obligation to revise or update any forward-looking statements to reflect actual results, changes in assumptionsas a result of new information, future events or changes in other factors affecting forward-looking information except to the extent required by applicable securities laws. If we do update one or more forward-looking statements, no inference should be drawn that we will make additional updates with respect thereto or with respect to other forward-looking statements.otherwise.
Executive Summary and Strategic Overview
We are an integrated downstream energy business focused on petroleum refining, the transportation, storage and wholesale distribution of crude oil, intermediate and refined products and convenience store retailing. Prior to August 2016, we aggregated ourOur operating units into three reportable segments:segments consist of refining, logistics, and retail. However,retail, and are discussed in August 2016, we entered into a definitive equity purchase agreement to sell 100%the sections that follow.
The Impact of the equity interestsCOVID-19 Pandemic
The COVID-19 Pandemic has resulted in Delek's wholly-owned subsidiaries MAPCO Express, Inc.significant economic disruption globally, including in the U.S. and specific geographic areas where we operate. Actions taken by various governmental authorities, individuals and companies around the world to prevent the spread of COVID-19 through both voluntary and mandated social distancing, curfews, shutdowns and expanded safety measures have restricted travel, many business operations, public gatherings and the overall level of individual movement and in-person interaction across the globe. This has in turn significantly reduced global economic activity which has had a significant impact on the nature and extent of travel. The COVID-19 Pandemic has had a devastating impact on the airline industry, dramatically reducing the number of domestic flights and, due to foreign travel bans and immigration restrictions abroad as well as traveler concerns over exposure, virtually eliminating international travel originating from the U.S. to many parts of the world. Additionally, the COVID-19 Pandemic has had a significant negative impact on motor vehicle activity. As a result, and particularly during 2020, we experienced a decline in the demand for, and thus also the market prices of, crude oil and certain of our products, particularly our refined petroleum products and most notably gasoline and jet fuel. Uncertainty about the duration of the COVID-19 Pandemic has caused periodic storage constraints in the U.S. resulting from over-supply
Management's Discussion and Analysis
of produced oil. Additionally, significant environmental events, such as extreme weather conditions or natural disasters can impact pipeline accessibility and utilization, other supply sources, as well as demand. While in the last several months, we have seen successful domestic efforts to distribute the COVID-19 vaccine across the U.S., MAPCO Fleet, Inc.,which has led to some improved stability in the capital markets as well as improved pricing in crude oil, refined products, and related forward curves, there continues to be general economic uncertainty, and, accordingly, demand for refined product and for our logistics assets has not yet returned to normal levels. Such uncertainty has been further aggravated by the mutation of the COVID-19 virus into one or more variants and plateauing demand for currently available vaccines. Based on these conditions and events, downward pressure on commodity prices, crack spreads and demand remains a significant risk and could continue for the near term.
We have previously identified the following known uncertainties resulting from the COVID-19 Pandemic. And while the risk surrounding these uncertainties appears to be lessening, they still represent risks that could impact our operations, financial condition and results of operations. They are as follows:
•Significant declines and/or volatility in prices of refined products we sell and the feedstocks we purchase as well as in crack spreads resulting from the COVID-19 Pandemic could have a significant impact on our revenues, cost of sales, operating income and liquidity, as well to the carrying value of our long-lived or indefinite-lived assets;
•A decline in the market prices of refined products and feedstocks below the carrying value in our inventory may result in the adjustment of the value of our inventories to the lower market price and a corresponding loss on the value of our inventories (see also Note 1 to our Condensed Consolidated Financial Statements included in Part I, Item 1 of this Quarterly Report on Form 10-Q for additional discussion of specific financial statement risks);
•The decline in demand for refined products could significantly impact the demand for throughput at our refineries, unfavorably impacting operating results at our refineries, and could impact the demand for storage, which could impact our logistics segment;
•The decline in demand and margins impacting current results and forecasts could result in impairments in certain of our long-lived or indefinite-lived assets, including goodwill, or have other financial statement impacts that cannot currently be anticipated (see also Note 1 to our Condensed Consolidated Financial Statements included in Part I, Item 1 of this Quarterly Report on Form 10-Q for additional discussion of specific financial statement risks);
•A significant reduction or suspension in U.S. crude oil production could adversely affect our suppliers and sources of crude oil;
•An outbreak in one of our refineries, exacerbated by a limited pool of qualified replacements as well as quarantine protocols, could cause significant disruption in our production or, worst case, temporary idling of the facility;
•The restrictions on travel and requirements for social distancing could significantly impact the traffic at our convenience stores, particularly the demand for fuel;
•Customers of the refining segment as well as third-party customers of the logistics segment may experience financial difficulties which could interrupt the volumes ordered by those customers and/or could impact the credit worthiness of such customers and the collectability of their outstanding receivables;
•The impact of COVID-19 or protocols implemented in response to COVID-19 by key or specialty suppliers may negatively affect our ability to obtain specialty equipment or services when needed;
•Equity method investees may be significantly impacted by the COVID-19 Pandemic which may increase the risk of impairment of those investments;
•Access to capital markets may be significantly impacted by the volatility and uncertainty in the oil and gas market specifically which could restrict our ability to raise funds; while our current liquidity needs are managed by existing facilities, sources of future liquidity needs may be impacted by the volatility in the debt market and the availability and pricing of such funds as a result of the COVID-19 Pandemic; and
•The U.S. Federal Government has enacted certain stimulus and relief measures and may consider additional relief legislation. Beyond the direct impact of existing legislation on Delek Transportation, LLC, NTI Investments, LLC and GDK Bearpaw, LLC (collectively,in the “Retail Entities”)current or prior periods (as applicable), the assetsextent to which the provisions of the existing or any future legislation will achieve its intention to stimulate or provide relief to the greater U.S. economy and/or consumer, as well as the impact and success of such efforts, remains unknown.
Other uncertainties related to the impact of the COVID-19 Pandemic as well as global geopolitical factors may exist that have not been identified or that are not specifically listed above, and could impact our future results of operations and financial position, the nature of which and the extent to which are currently unknown. The U.S. Federal Government's passage and/or enactment of additional stimulus and relief measures, as well as their future actions may impact the extent to which the risk underlying these uncertainties are realized. To the extent these uncertainties have been identified and are believed to have an impact on our current period results of operations or financial position based on the requirements for assessing such financial statement impact under U.S. Generally Accepted Accounting
Management's Discussion and Analysis
Principles ("GAAP"), we have considered them in the preparation of our unaudited financial statements as of and for the nine months ended September 30, 2021, which are included in Item 1, of this Quarterly Report on Form 10-Q.
In addition, management has actively responded to the continuing impact of the COVID-19 Pandemic on our business. Additionally, to the extent warranted, we continue to monitor the impact and implement measures to mitigate the risk. Such efforts include (but are not limited to) the following:
•Reviewing planned production throughputs at our refineries and planning for optimization of operations;
•Coordinating planned maintenance activities with possible downtime as a result of possible reductions in throughputs;
•Searching for additional storage capacity if needed to store potential builds in crude oil or refined product inventories;
•Finding additional suppliers for key or specialty items or securing inventory or priority status with existing vendors;
•Reducing discretionary capital expenditures;
•Suspending the share repurchase program and dividend distributions until our internal parameters are met for resuming such activities;
•Taking advantage of the income and payroll tax relief afforded to us by the Coronavirus Aid Relief, and Economic Security Act (the "CARES Act") or other Pandemic relief legislation;
•Implementing regular site cleaning and disinfecting procedures;
•Adopting remote working where possible and when immediate exposure risk warrants, and where on-site operations are required, taking appropriate safety precautions;
•Identifying alternative financing solutions as needed to enhance our access to sources of liquidity; and
•Enacting cost reduction measures across the organization, including reducing contract services, reducing overtime and other employee related costs, and reducing or eliminating non-critical travel.
The most significant of these efforts to date as well as specifically identified measures that are anticipated in the near term, in terms of realized or anticipated impact, include the following:
•For the year ended December 31, 2020 pursuant to the provisions of the CARES Act, we recognized $16.8 million of current federal income tax benefit attributable to anticipated tax refunds from net operating loss carryback to prior 35% tax rate years, and deferred $10.9 million of payroll tax payments which will be payable in equal installments in December 2021 and December 2022. Additionally, we recorded a current income tax receivable of $135.6 million and a non-current tax receivable of $20.6 million as of December 31, 2020, related to the net operating loss carryback, all of which was received in the third quarter of 2021.
•We made significant efforts to reduce our capital spending, particularly on growth and non-critical sustaining maintenance projects. See the "Liquidity and Capital Resources" section of Item 2. MD&A for further information.
•In light of the weak macro-economic environment, we elected to pull forward turnaround work into the fourth quarter of 2020 on certain units at our Krotz Springs refinery that was conducted on a straight-time basis. This allowed us to continue running the more profitable units of the refinery and should help improve economics toward a break-even level. We completed this turnaround work late in the first quarter 2021 and have since returned to normalized production.
•Additionally, we developed a cost savings plan for 2021 designed to continue to reduce operating expenses and general and administrative expenses. The majority of the expected operating expenses reduction is attributable to the temporary unit optimization at the Krotz Springs refinery, while also implementing other efforts such as targeted budgeting around outside contractor expenses and deferral of certain non-critical, non-capitalizable maintenance activities. Furthermore, both operating and general and administrative expenses were favorably impacted by a cumulative reduction in workforce, some of which were temporary. Reductions in workforce were made possible in large part by significant efforts to improve process efficiency and leverage technology where cost-effective.
•Finally, we elected to suspend share repurchases and dividends beginning in the second and fourth quarters of 2020, respectively, in order to conserve capital. This has helped us maintain our liquidity and manage our cost of capital impacted by the Pandemic, as well as provided additional flexibility to pursue opportunities to provide value to investors with respect to our stock price, which we believe is undervalued.
The combination of these efforts had a mitigating impact on cash flows as well as our operations, which we believe has improved our liquidity positioning and operational flexibility and response in anticipation of the continued economic impacts of the COVID-19 Pandemic. See the "Liquidity and Capital Resources" section of Item 2. MD&A for further information.
The extent to which our future results are affected by the COVID-19 Pandemic will depend on various factors and consequences beyond our control, such as the duration and scope of the Pandemic; additional actions by businesses and governments in response to the
Management's Discussion and Analysis
Pandemic, the speed and effectiveness of responses to combat the virus and any new variants and the challenges with the vaccination rollout. The COVID-19 Pandemic, and the volatile regional and global economic conditions stemming from the Pandemic, could also exacerbate the risk factors identified in our Annual Report on Form 10-K for the fiscal year ended December 31, 2020 and in this Form 10-Q, as applicable. The COVID-19 Pandemic may also materially adversely affect our results in a manner that is either not currently known or that we do not currently consider to be a significant risk to our business.
Other Significant Events
During February 2021, the Company experienced a severe weather event ("Winter Storm Uri") which temporarily impacted operations at all of our refineries. Due to the extreme freezing conditions, and despite the acceleration of planned and ongoing turnaround work at the El Dorado and Krotz Spring refineries (which provided some mitigation), we experienced reduced throughputs at our refineries as there was a disruption in the crude supply, increases in natural gas costs, as well as damages to various units at our refineries requiring additional operating and capital expenditures.
On February 27, 2021, our El Dorado refinery experienced a fire in its Penex unit, in which six Delek employees were injured. Our on-site emergency response team, with the assistance of the El Dorado Fire Department, extinguished the fire, and we immediately began to monitor the air quality within the refinery and the community. The incident was investigated by the Occupational Safety and Health Administration and Chemical Safety Board and resulted in operational disruptions as well as property and casualty damages..
To date, we have recognized approximately $21.4 million ($16.6 million after-tax) of insurance recoveries all related to property and casualty claims, $4.4 million of which related to replacement cost coverage on property losses and which helps offset corresponding capital expenditures, and the remaining $17.0 million of which relates to repairs and other operating expenses incurred in connection with our property and casualty damages. We have additional property and casualty claims, as well as business interruption claims, that are outstanding and still pending, and which are expected to be recognized in future quarters.
The refining segment (or "Refining") processes crude oil and other feedstocks for the manufacture of transportation motor fuels, including various grades of gasoline, diesel fuel and aviation fuel, asphalt and other petroleum-based products that are distributed through owned and third-party product terminals. The refining segment has a combined nameplate capacity of 302,000 barrels per day as of September 30, 2021. A high-level summary of the refinery activities is presented below:
| | | | | | | | | | | | | | |
| Tyler, Texas refinery (the "Tyler refinery") | El Dorado, Arkansas refinery (the "El Dorado refinery") | Big Spring, Texas refinery (the "Big Spring refinery") | Krotz Springs, Louisiana refinery (the "Krotz Springs refinery") |
| Total Nameplate Capacity (barrels per day ("bpd")) | 75,000 | 80,000 (1) | 73,000 | 74,000 |
| Primary Products | Gasoline, jet fuel, ultra-low-sulfur diesel, liquefied petroleum gases, propylene, petroleum coke and sulfur | Gasoline, ultra-low-sulfur diesel, liquefied petroleum gases, propylene, asphalt and sulfur | Gasoline, jet fuel, ultra-low-sulfur diesel, liquefied petroleum gases, propylene, aromatics and sulfur | Gasoline, jet fuel, high-sulfur diesel, light cycle oil, liquefied petroleum gases, propylene and ammonium thiosulfate |
| Relevant Crack Spread Benchmark | Gulf Coast 5-3-2 | Gulf Coast 5-3-2 (2) | Gulf Coast 3-2-1 (3) | Gulf Coast 2-1-1 (4) |
| Marketing and Distribution | The refining segment's petroleum-based products are marketed primarily in the south central, southwestern and western regions of the United States, and the refining segment also ships and sells gasoline into wholesale markets in the southern and eastern United States. Motor fuels are sold under the Alon or Delek brand through various terminals to supply Alon or Delek branded retail sites. In addition, we sell motor fuels through our wholesale distribution network on an unbranded basis. |
(1) While the El Dorado refinery has a total nameplate capacity of 80,000 bpd, in order to qualify for the small refinery exemption under the EPA’s Renewable Fuel Standards regulations total output cannot exceed 75,000 bpd. We currently expect that the El Dorado refinery’s output will remain under the 75,000 bpd threshold in the current economic environment.
(2) While there is variability in the crude slate and the product output at the El Dorado refinery, we compare our per barrel refined product margin to the U.S. Gulf Coast ("Gulf Coast") 5-3-2 crack spread because we believe it to be the most closely aligned benchmark.
(3) Our Big Spring refinery is capable of processing substantial volumes of sour crude oil, which has historically cost less than intermediate, and/or substantial volumes of sweet crude oil, and therefore the West Texas Intermediate ("WTI") Cushing/ West Texas Sour ("WTS") price differential, taking into account differences in production yield, is an important measure for helping us make strategic, market-respondent production decisions.
(4) The Krotz Springs refinery has the capability to process substantial volumes of light sweet crude oil to produce a high percentage of refined light products.
Our refining segment also owns and operates three biodiesel facilities involved in the production of biodiesel fuels and related activities, located in Crossett, Arkansas, Cleburne, Texas, and New Albany, Mississippi.
Management's Discussion and Analysis
Our logistics segment (or "Logistics") gathers, transports and stores crude oil and markets, distributes, transports and stores refined products in select regions of the southeastern United States and West Texas for our refining segment and third parties. It is comprised of the consolidated balance sheet and results of operations of Delek Logistics Partners, LP ("Delek Logistics", NYSE:DKL), where we owned an 80.0% interest in Delek Logistics at September 30, 2021. Delek Logistics was formed by Delek in 2012 to own, operate, acquire and construct crude oil and refined products logistics and marketing assets. A substantial majority of Delek Logistics' assets are currently integral to our refining and marketing operations. The logistics segment's pipelines and transportation business owns or leases capacity on approximately 400 miles of crude oil transportation pipelines, approximately 450 miles of refined product pipelines, and an approximately 900-mile crude oil gathering system and associated crude oil storage tanks with an aggregate of approximately 10.2 million barrels of active shell capacity. It also owns and operates ten light product terminals and markets light products using third-party terminals. Logistics has strategic investments in pipeline joint ventures that provide access to pipeline capacity as well as the potential for earnings from joint venture operations. The logistics segment owns or leases approximately 264 tractors and 353 trailers used to haul primarily crude oil and other products for related and third parties.
Our retail segment (or "Retail") at that time (the “Retail Transaction”). The Retail Transaction closed in November 2016.
Effective with the Delek/Alon Merger July 1, 2017, Delek's retail segment nowSeptember 30, 2021 includes the operations of Alon's approximately 300250 owned and leased convenience store sites located primarily in Central and West Texas and New Mexico. TheseOur convenience stores typically offer various grades of gasoline and diesel under the DK or Alon brand name and food products, food service, tobacco products, non-alcoholic and alcoholic beverages, general merchandise as well as money ordersgrams to the public, primarily under the 7-Eleven and DK or Alon brand names.names pursuant to a license agreement with 7-Eleven, Inc. In November 2018, we terminated the license agreement with 7-Eleven, Inc. and the terms of such termination and subsequent amendments require the removal of all 7-Eleven branding on a store-by-store basis by December 31, 2023. Merchandise sales at our convenience store sites will continue to be sold under the 7-Eleven brand name until 7-Eleven branding is removed pursuant to the termination. As of September 30, 2021, we have removed the 7-Eleven brand name at 57 of our store locations. Substantially all of the motor fuel sold through our retail segment is supplied by our Big Spring refinery, which is transferred to the retail segment at prices substantially determined by reference to published commodity pricing information. In connection with our Retail strategic initiatives, we closed or sold 49 under-performing or non-strategic store locations since the fourth quarter of 2018.
The cost to acquire the refined fuel products we sell to our wholesale customers in our logistics segment and at our convenience stores in our retail segment depends on numerous factors beyond our control, including the supply of, and demand for, crude oil, gasoline and other refined petroleum products which, in turn, depend on, among other factors, changes in domestic and foreign economies, weather conditions, domestic and foreign political affairs, production levels, the availability of imports, the marketing of competitive fuels and government regulation. Our retail merchandise sales are driven by convenience, customer service, competitive pricing and branding. Motor fuel margin is sales less the delivered cost of fuel and motor fuel taxes, measured on a cents per gallon basis. Our motor fuel margins are impacted by local supply, demand, weather, competitor pricing and product brand.
| | |
| Corporate and Other Overview |
Our corporate activities, results of certain immaterial operating segments, (including our asphalt terminal operations, effective with the Delek/Alon Merger), our non-controlling equity interest of approximately 47% of the outstanding shares in Alon (which was accounted for as an equity method investment) prior to the Delek/Alon Mergerwholesale crude operations, and intercompany eliminations are reported in the corporate, other and eliminations in our segment disclosures. Additionally, our corporate activities include certain of our commodity and other hedging activities.
Management's Discussion and Analysis
The Road So Far: A Recent Look Back
In recent history, the Company's overall strategy has been to take a disciplined approach that looks to balance returning cash to our shareholders and prudently investing in the business to support safe and reliable operations, while exploring opportunities for growth. Our goal has been to balance the different aspects of this program based on evaluations of each opportunity and how it matches our strategic goals for the Company, while factoring in market conditions and expected cash flows.
In our 2020 Annual Report on Form 10-K, we outlined the specifics around the Company's strategy, including the Five-Year Strategic Framework (which we initially developed in 2019), as well as our corresponding Core Strategic Focus Areas and our Strategic Initiatives. During much of the first half of 2021, our principal focus was on managing the operational and financial risks related to the COVID-19 Pandemic while also maintaining our attention on these Core Strategic Areas of Focus, which in turn continued to guide our objectives and initiatives :
I. Safety and wellness.
II. Reliability and integrity.
III. ��Systems and processes.
IV. Risk-based decision making.
V. Positioning for growth.
That said, as we have previously communicated to you, not only have we consistently reevaluated our initiatives and immediate strategic priorities in light of the significant economic and operational impact of the COVID-19 Pandemic, we also have been continuing to actively review our strategies and related operational objectives and consider the need for changes in order to address the evolving industry and market, while ensuring that we continue to appropriately consider and capitalize on our operational strengths and strategic positioning. The combination of our commitment to strategic thinking combined with the rapidly changing environment has led us to embrace a seismic shift in perspective around our long-term strategic direction and outlook, which now is guiding changes to our strategic framework and objectives. The critical principle underlying this evolving perspective is sustainability, and is discussed in more detail below.
Evolving Focus: A Sustainability Strategy
It is vitally important that our strategic process, especially in view of the evolutionary direction of our macroeconomic and geopolitical environment, involves a continuous evaluation of our business model in terms of long-term economic and operational sustainability. We are operating in a mature industry (the production, logistics and marketing of hydrocarbon-based refined products), with increasingly difficult operational and regulatory challenges and, likewise, pressure on operating costs/gross margins as well as the availability and cost of capital. More consolidation in our industry is expected as the regulatory environment continues to move towards reducing carbon emissions and transitions to renewable energy in the long-term, and evolving consumer and capital markets sentiment, regulations, talent availability, supply chain constraints and customer demand as we move in that direction are expected to cause disruption and increasing pressure in the intermediate term. In order to compete and survive under historic environmental and regulatory changes, companies in our industry will need to be adaptive, forward-thinking and strategic in their approach to long-term sustainability. What this picture looks like, as we come to understand it, is what we refer to as our "Sustainability View."
A New Framework: Long-Term Sustainability
For these reasons, we have launched a process to develop a Long-Term Sustainability Framework, out of which will come our refined strategic objectives and initiatives. Within this Long-Term Sustainability Framework, we have identified the following initial overarching objectives:
I. Focus on Improving Operational Efficiency at Capturing Margins.
II. Redirect Corporate Culture towards Innovation, Excellence, and Operating Discipline.
III. Understand Value Proposition of Costs and Investments and Maximize Return on Investment.
IV. Implement Digital Transformation Strategy.
V. Evaluate Strategic Priorities and Redefine Long-term Sustainable Business Model.
Developing a strategy focused on long-term economic and operational sustainability in a challenging and rapidly changing environment is a larger and more ambitious objective than a strategy that is simply centered on growth and return on shareholder investment in the near-term. For these reasons, it is important to understand the scalability of our strategy and what are the appropriate stages and priorities, recognizing that the inherent complexity of achieving long-term sustainability is a long game requiring both a measured, disciplined approach as well agility and flexibility to changing conditions.
Management's Discussion and Analysis
A Great Start: Stage 1 Initiatives
While this Framework is in its early changes, we have already been hard at work identifying and developing our Stage 1 Initiatives in the context of these overarching objectives, and many of them are well underway in terms of implementation. This progress is in part due to some overlap with our previous strategic objectives (thus also validating that our previous objectives were, in many ways, the right areas of focus), but also the result of the energy and commitment that our sustainability framework is generating in our organization.
Some of the initiatives that are underway and are expected to continue throughout the remainder of 2021 and into 2022 include the following:
•Enterprise-wide cost and waste reduction initiatives as well as initiatives focused on eliminating lost revenue and value leakage;
•Recent and on-going new system implementations that will improve our ability to understand all aspects of our business as well as our ability to make real-time and forward-looking operational decisions.
•Identifying the qualities of a "Delek Leader" and the "Employee of the Future" to help incorporate those qualities into our human capital programs, incentives and rewards.
•Identifying and evaluating the types of investment opportunities that fit our Sustainability View, including consideration of strategic investments or joint ventures in renewables, incubator investments in innovative new technologies, and other core-business investments that could improve our scalability and agility.
•Redefining our framework for evaluating, tracking and understanding the value creation propositions for proposed capital and strategic investments under the context of our evolving Long-Term Sustainability Objectives and our Sustainability View.
We have selected these Stage 1 initiatives because they are all foundational to continued progression toward achieving our overarching strategic objectives under the Long-Term Sustainability Framework, and thus were very intentional. We look forward to reporting to you on our progress on these and other key initiatives, and to providing additional color around this exciting new way of thinking about and planning for the future of our business.
Managing Through the COVID-19 Pandemic
Our principle focus during 2021 has been to execute on the following initiatives, consistent with those discussed above, in the context of the COVID-19 Pandemic:
•effectively implementing and executing on our operating cost savings initiatives;
•continuing to be focused on controlling capital expenditures;
•focusing on operating efficiently;
•continuing to position ourselves to manage our supply chain risk, our customer risk and our liquidity sources;
•continuing to maintain a strong retail business; and
•with our sights also set on recovery from the Pandemic and the future, continuing to explore and investigate potential growth opportunities for midstream or other lines of business.
While, as previously noted above, COVID-19 conditions seem to be improving, we were faced with some unprecedented challenges which required our focus during the first nine months of 2021, including the effects of Winter Storm Uri as well as the El Dorado fire (described above). These events continue to be a significant area of focus as we continue to aggressively pursue insurance recoveries under our existing policies. We believe that managing the efforts listed above, plus managing through the disruption caused by these two unexpected events, were critical to managing our results in this continued challenging environment.
Regulatory Volatility
Our RINs cost and RINs Obligation (as defined in Note 9 to our Condensed Consolidated Financial Statements included in Part I, Item 1 of this Quarterly Report on Form 10-Q) have been negatively impacted by increasing RINs prices during much of 2021 which resulted from an unfavorable ruling against companies previously granted the EPA's Small Refinery Exemptions (or "SREs") under the Renewable Fuel Standard (the "RFS") which governs RINs volume obligations for U.S. hydrocarbon refining companies, importers and blenders. Additionally, a worsening environmental regulatory sentiment in Washington, D.C. following the change in the presidential administration in January 2021 continued to put upward pressure on RIN prices. The 10th Circuit Court of Appeals ruling, which was subsequently appealed and (for the majority of the period) was waiting to be heard by the U.S. Supreme Court, stalled the approval of 2019 SRE applications already submitted (inclusive of 2019 SRE applications for each of our four refineries) and led to the postponement of 2020 SRE applications. Because of these delays and uncertainties, the EPA issued, by Final Rule, extensions on the compliance deadline under the RFS as well as the deadline for submission of the obligated party attestation reports, as follows: the 2019 compliance deadline was extended to November 30, 2021, and the submission deadline for the related report was extended to June 1, 2022, for small refineries; the
Management's Discussion and Analysis
2020 compliance deadline was extended to January 31, 2022, and the submission deadline for the related report was extended to June 1, 2022, for small refineries; and the 2021 compliance deadline remains at March 31, 2022. In late June 2021, the U.S. Supreme Court overturned the previous appeals court's ruling regarding RINs, resulting in market optimism that the stalled SRE applications from 2019, as well as new applications for 2020, may be granted, based on the published criteria. Immediately following this ruling, we undertook efforts to prepare 2020 SRE applications for our refineries and we submitted them in August 2021. Market expectations that at least some SRE applications may be approved and/or that the EPA may reduce certain outstanding compliance requirements, resulted in an improvement in RINs prices during the third quarter of 2021.
Uncertainty remains regarding the likelihood of SREs being granted as well as the potential for EPA relief from certain compliance requirements. While we cannot know the outcome of our SRE applications, Delek has a long history of being granted the waivers with most grants to the Krotz Springs and El Dorado refineries. As an example, in 2018, we were granted SREs for our Tyler, Krotz Springs and El Dorado refineries. Additionally, while our current Net RINs Obligation reflects current RINs market prices as of September 30, 2021, the financial statement impact, including both the income statement and net cash impact, of any future receipt of SRE(s) is not determinable because of the complexity of the Net RINs Obligation and related transactions, where such financial statement impact is dependent upon the following: (1) which refineries receive exemptions; (2) the composition of those specific Net RINs Obligation (in terms of the vintages of RINs we currently own versus the waived RINs Obligation) and the related market prices at the date each exemption is granted; (3) the composition of our RINs forward commitment contracts that may be settled or positions closed as a result of any exemption and the related gains or losses; (4) the settlement requirements of related RINs product financing arrangements; and (5) the quantity of and dates at which excess RINs can be sold and the sales price (see also Note 9, Note 10 and Note 14 to the condensed consolidated financial statements included as well as our related accounting policies related to RINs included in Note 2 to the audited consolidated financial statements included in Item 8. Financial Statements and Supplementary Data, of our December 31, 2020 Annual Report on Form 10-K). We note that our total gross RINs Obligation for 2020, for all four refineries, was approximately 340 million RINs, across all RIN categories, and that receipt of any SREs could result in significant benefit, both in terms of income statement effect and cash flows.
Regardless of whether we expect to be granted SREs, we continue to actively manage our RINs inventory portfolio as well as monitor prices and positions on existing and expected RINs Obligations to mitigate our income statement and cash flow exposure. See additional discussion of the effect of RINs prices and volatility on our refining margins in the "Market Trends" section below.
Other Strategic Activity
In addition to these management efforts, we successfully executed on several strategic opportunities as described below.
Wink to Webster Contract Termination
On September 30, 2021 Wink to Webster Pipeline LLC (“WWP”) made the decision to buy Delek out of the Midland Connector Financing Commitment Agreement which provided an interest-free commitment to fund us up to $65.0 million upon completion of a connector to connect the WWP long-haul pipeline to our Big Spring Gathering System, with repayment over 14 years. The buy-out totaled $27.5 million and represented the estimated incremental cost of capital to fund the $65.0 million in expenditures over a 14-year term, and enabled us to recover approximately $18.0 million of capital expenditures that we may not have incurred had it not been for the financing commitment, including approximately $6.6 million that was written off during the third quarter. As a result of the transaction, we recognized $20.9 million of other non-operating income in the third quarter, representing the excess over our current period recognized write-offs. (See further discussion in Note 5 to our Condensed Consolidated Financial Statements included in Part I, Item 1 of this Quarterly Report on Form 10-Q).
Delek US Holdings, Inc. Employee Stock Purchase Plan
In June 2021, the Company's board of directors adopted the Delek US Holdings, Inc. Employee Stock Purchase Plan (the "ESPP"). The ESPP is structured as a qualified employee stock purchase plan. The Company authorized the issuance of 2,000,000 shares of common stock under the ESPP. On each purchase date, eligible employees (as defined in the ESPP) can purchase the Company's stock at a price per share equal to 85.0% of the closing price of the Company's common stock on the exercise date, but no less than par value. There are four offering periods of three months during each fiscal year, beginning each January 1st, April 1st, July 1st, and October 1st. (See further discussion in Note 15 to our Condensed Consolidated Financial Statements included in Part I, Item 1 of this Quarterly Report on Form 10-Q).
Delek Logistics 2028 Notes
On May 24, 2021, Delek Logistics and its wholly owned subsidiary Delek Logistics Finance Corp. (“Finance Corp.” and together with Delek Logistics, the “Co-issuers”), issued $400.0 million in aggregate principal amount of the Co-issuers 7.125% Senior Notes due 2028 (the “Delek Logistic 2028 Notes”) at par, pursuant to an indenture with U.S. Bank, National Association as trustee. The Delek Logistics 2028 Notes are general unsecured senior obligations of the Co-issuers and are unconditionally guaranteed jointly and severally on a senior unsecured basis by Delek Logistics’ subsidiaries other than Finance Corp. The Delek Logistic 2028 Notes rank equal in right of payment with all existing and future senior indebtedness of the Co-issuers, and senior in right of payment to any future subordinated indebtedness
Management's Discussion and Analysis
of the Co-issuers. The Delek Logistic 2028 Notes will mature on June 1, 2028, and interest is payable semi-annually in arrears on each June 1 and December 1, commencing December 1, 2021. (See further discussion in Note 8 to our Condensed Consolidated Financial Statements included in Part I, Item 1 of this Quarterly Report on Form 10-Q)
Exclusive Supply Agreement
In May 2021, we executed an exclusive supply and strategic relationship agreement with Baker Petrolite LLC (an affiliate of Baker Hughes Company) ("Baker"). The agreement provides that, under certain circumstances, Baker will supply certain chemicals exclusively to us within a defined territory. Those chemicals allow us, through blending competencies utilizing proprietary intellectual property, to clarify slurry which can then be used in International Maritime Organization-compliant products. The agreement has a 5-year initial term and a 5-year extension option.
Our results of operations are significantly affected by fluctuations in the prices of certain commodities, including, but not limited to, crude oil, gasoline, distillate fuel, biofuels, natural gas and electricity, among others. Historically, the impact of commodity price volatility on our refining margins (as defined in our "Non-GAAP Measures" in MD&A Item 2.), specifically as it relates to the price of crude oil as compared to the price of refined products and timing differences in the movements of those prices (subject to our inventory costing methodology), as well as location differentials, may be favorable or unfavorable compared to peers. Additionally, our refining margin profitability is impacted by regulatory factors, including the cost of RINs.
During 2021, despite improved consumer demand resulting from stabilization in cases of COVID-19 and decreasing mortality rates during much of the period and across much of the country, and corresponding to the availability of vaccines, improvements in domestic refining margins have been slow to materialize. This is largely attributable to the increasing supply from international markets where consumer demand improvement has lagged behind the U.S and, similarly, the closing of much of the U.S. export arbitrage. The U.S. market for transportation fuels has attracted higher infusion of international supply due in part to supply disruptions in the U.S. that occurred during the first nine months of 2021. In February 2021, the operations of many U.S. refineries, including ours, were temporarily disrupted due to the negative effects arising out of Winter Storm Uri. This contributed to a significant depletion of transportation fuel inventories throughout much of the country. Additionally, in May 2021, there was a cybersecurity incident with the Colonial Pipeline which resulted in pipeline shutdowns that interrupted supply to much of the eastern U.S. for six days, and which caused disruption for Delek primarily at our Krotz Springs refinery. As a result of both of these events, the U.S. market attracted higher levels of supply from international markets, which diluted price increases and associated refining margins.
Furthermore, while there have been improving crack spreads during 2021, driven largely by the improvement in domestic consumer demand and the modest economic improvement and outlook associated with stabilizing Pandemic uncertainties, the ability of U.S. refiners to capture those improvements were significantly dampened by sharply increasing RIN prices. As previously discussed, the RINs market was impacted by last year's judicial rulings imposing limitations on smaller refinery's abilities to qualify for the EPA's SREs under the RFS, combined with worsening environmental regulatory sentiment coming out of Washington, D.C.. These conditions were pervasive for the majority of the first half of 2021. Following the June 2021 U.S. Supreme Court reversal of the lower court's ruling, however, there was a notable improvement in market optimism that existing SRE applications from 2019, as well as new applications for 2020, may be granted. As a result, we saw some improvement in RIN prices during the third quarter 2021, in anticipation of possible EPA relief.
See the following pages for further discussion on how certain key market trends impact our refining margins.
Management's Discussion and Analysis
WTI crude oil represents the largest component of our crude slate at all of our refineries, and can be sourced through our gathering channels or optimization efforts from Midland, Texas or Cushing, Oklahoma or other locations. The table below reflects the quarterly average prices of WTI Midland and WTI Cushing crude oil for each of the quarterly periods in 2020 and for the three quarterly periods in 2021. As shown in the historical graph, WTI Midland crude prices can be favorable or unfavorable as compared to WTI Cushing.
| | | | | | |
| Crude Pricing Differentials | | | | |
| | | | |
| | | | |
| | | | |
| | | | |
| | | | |
| | | | |
| | | | |
| | | | |
| | | | |
As U.S. crude oil production has increased over recent years, domestic refiners have benefited from the discount for WTI Cushing compared to Brent ("Brent"), a global benchmark crude. This generally leads to higher margins in our refineries, as refined product prices are influenced by Brent crude prices and the majority of our crude supply is WTI-linked. Because of our positioning in the Permian basin, including our access to significant sources of WTI Midland crude through our gathering system, we are even further benefited by discounts for WTI Midland/WTI Cushing differentials. When these discounts shrink or become premiums, our reliance on WTI-linked crude pricing, and specifically WTI Midland crude, can negatively impact our refining margins. Conversely, as these price discounts widen, so does our competitive advantage, created specifically by our access to WTI Midland crude sourced through our gathering systems.
The chart below illustrates the key differentials impacting our refining operations, including WTI Cushing to Brent, WTI Midland to WTI Cushing, and Louisiana Light Sweet crude oil ("LLS") to WTI Cushing for each of the quarterly periods in 2020 and for the three quarterly periods in 2021.
Management's Discussion and Analysis
Our refineries produce the following products:
| | | | | | | | | | | | | | |
| Tyler Refinery | El Dorado Refinery | Big Spring Refinery | Krotz Springs Refinery |
| Primary Products | Gasoline, jet fuel, ultra-low-sulfur diesel, liquefied petroleum gases, propylene, petroleum coke and sulfur | Gasoline, ultra-low-sulfur diesel, liquefied petroleum gases, propylene, asphalt and sulfur | Gasoline, jet fuel, ultra-low-sulfur diesel, liquefied petroleum gases, propylene, aromatics and sulfur | Gasoline, jet fuel, high-sulfur diesel, light cycle oil, liquefied petroleum gases, propylene and ammonium thiosulfate |
The charts below illustrate the quarterly average prices of Gulf Coast Gasoline (CBOB), U.S. High Sulfur Diesel ("HSD") and U.S. Ultra Low Sulfur Diesel ("ULSD") for each of the quarterly periods in 2020 and for the three quarterly periods in 2021.
Crack spreads are used as benchmarks for predicting and evaluating a refinery's product margins by measuring the difference between the market price of feedstocks/crude oil and the resultant refined products. Generally, a crack spread represents the approximate refining margin resulting from processing one barrel of crude oil into its outputs, generally gasoline and diesel fuel.
The table below reflects the quarterly average Gulf Coast 5-3-2 ULSD, 3-2-1 ULSD and 2-1-1 HSD/LLS crack spreads for each of the quarterly periods in 2020 and for the three quarterly periods in 2021. As the chart illustrates, the 3-2-1 crack spread has consistently outperformed the 5-3-2 and the 2-1-1 crack spreads. When market conditions consist of near-capacity throughputs and no significant outages, our Big Spring refinery, whose benchmark is the 3-2-1 crack spread, should outperform our other refineries in terms of refining margin, which are benchmarked against either the 5-3-2 or the 2-1-1 crack spreads.
Management's Discussion and Analysis
Environmental regulations and the political environment continue to affect our refining margins in the form of volatility in the price of RINs. On a consolidated basis, we work to balance our RINs Obligation in order to minimize the effect of RINs on our results. While we generate RINs in both our refining and logistics segments through our ethanol blending and biodiesel production and blending, our refining segment still needs to purchase additional RINs to satisfy its obligations. The cost to purchase these additional RINs is a significant cash outflow for our business. Additionally, increases in the market prices of RINs generally adversely affect our results of operations through changes in fair value to our existing RINs Obligation, to the extent we do not have offsetting RINs inventory on hand or effective economic hedges through net forward purchase commitments. The volatility of RINs prices is highly sensitive to regulatory and political influence and conditions, and therefore often does not correlate to movements in crude oil prices, refined product prices or crack spreads. Additionally, the pricing of RINs and the resulting impact on a refiner's margins is dependent on the type of refined product produced. Furthermore, RIN prices are impacted by market expectations regarding whether the EPA may grant certain SREs. The 2020 unfavorable SRE judicial rulings, as well as the changes in regulatory sentiment following the presidential administration change, have caused significant increases in RINs prices to all-time highs. Subsequently, in late June 2021, the U.S. Supreme Court overturned the previous appeals court's ruling regarding RINs, resulting in market optimism regarding the granting of SRE applications. Because of the volatility in RINs prices, it is not possible to predict future RINs cost with certainty, and movements in RIN prices can have significant and unanticipated adverse effects on our refining margins that are outside of our control.
The chart below illustrates the volatility in RINs beginning with the first quarter of 2020 through the third quarter of 2021.
Management's Discussion and Analysis
| | |
| Other Required Information |
Contractual Obligations
Information regarding our known contractual obligations and commercial commitments of the types described below as of September 30, 2021, is set forth in the following table (in millions):
| | | | | | | | | | | | | | | | | | | | | | | | | | | | | | | | |
| | Payments Due by Period |
| | <1 Year | | 1-3 Years | | 3-5 Years | | >5 Years | | Total |
| Long term debt and notes payable obligations | | $ | 63.4 | | | $ | 315.8 | | | $ | 1,474.3 | | | $ | 400.0 | | | $ | 2,253.5 | |
Interest(1) | | 93.6 | | | 172.7 | | | 92.2 | | | 57.0 | | | 415.5 | |
Operating lease commitments(2)(6) | | 73.2 | | | 390.5 | | | 175.1 | | | 150.0 | | | 788.8 | |
| | | | | | | | | | |
Product financing commitments(3) | | 342.5 | | | — | | | — | | | — | | | 342.5 | |
Transportation agreements(4) | | 126.2 | | | 194.4 | | | 187.2 | | | 77.1 | | | 584.9 | |
J. Aron supply and offtake obligations (5) | | 15.5 | | | 333.7 | | | — | | | — | | | 349.2 | |
| Total | | $ | 714.4 | | | $ | 1,407.1 | | | $ | 1,928.8 | | | $ | 684.1 | | | $ | 4,734.4 | |
(1) Expected interest payments on debt outstanding at September 30, 2021. Floating interest rate debt is calculated using September 30, 2021 rates. For additional information, see Note 8 of our condensed consolidated financial statements included in Item 1. Financial Statements, of this Quarterly Report on Form 10-Q.
(2) Amounts reflect future estimated lease payments under operating leases having remaining non-cancelable terms in excess of one year as of September 30, 2021.
(3) Balances consist of contractual obligations under RINs product financing arrangements.
(4) Balances consist of obligations under agreements with third parties (not including Delek Logistics) for the transportation of crude oil to our refineries.
(5) Balances consists of contractual obligations under the J. Aron Supply and Offtake Agreements, including annual fees and principal obligation for the Baseline Volume Step-Out Liability. For additional information, see Note 7 of our condensed consolidated financial statements included in Item 1. Financial Statements, of this Quarterly Report on Form 10-Q.
(6) Includes an immaterial amount of financing lease cost.
Critical Accounting Policies
The preparation of our condensed consolidated financial statements requires us to make estimates and judgments that affect the reported amounts of assets, liabilities, revenues and expenses and related disclosure of contingent assets and liabilities. The SEC has defined critical accounting policies as those that are both most important to the portrayal of our financial condition and results of operations, and require our most difficult, subjective or complex judgments or estimates. Based on this definition and as further described in our 2020 Annual Report on Form 10-K, we believe our critical accounting policies include the following: (i) estimating our quarterly inventory adjustments using the last-in, first-out valuation method for the Tyler refinery, (ii) evaluating impairment for property, plant and equipment and definite life intangibles, (iii) evaluating potential impairment of goodwill, (iv) estimating environmental expenditures, and (v) estimating asset retirement obligations. Additionally, we have identified the following critical accounting policy that impacts the nine months ended September 30, 2021:
Under Accounting Standards Codification ("ASC") 740, Income Taxes (“ASC 740”), we use an estimated annual effective tax rate ("AETR") to record income taxes. The development of the estimated AETR involves significant judgment, particularly early in the year and in times of economic uncertainty. As of and during the nine months ended September 30, 2021, our estimates of the expected AETR reflected inputs which are subject to judgment including (but not necessarily limited to) the following:
•Forecasted pre-tax GAAP income or loss for the year
•Estimates of expected permanent differences in GAAP income or loss and taxable income or loss for the year
•Forecasted capital expenditures for the year and future years (where such activities were significantly impacted by the recent weather event and can likewise be impacted by unanticipated events)
•Expected applicable jurisdictional tax rates
•Estimated impact of possible deduction and tax credit limitations
•Estimates regarding net operating losses, carryback and carryforward provisions (and limitations) and valuation allowances
All of these inputs are subject to significant judgment and assumptions about future events impacting 2021, some of which are based on historical trends and results, operational plans, and projections regarding future pricing and profitability (where we utilize third party forward curves and pricing sources, where possible, but where expectations regarding capture rates and other factors involve judgment). We also note that, while economic conditions affecting our industry and industry outlooks related to COVID-19 are stabilizing and improving, there
Management's Discussion and Analysis
remains a level of uncertainty related to COVID-19 and the expectations for recovery that increases the level of judgment involved with some of these assumptions. Accordingly, where appropriate, we may consider the probability of certain components in determining what we believe to be a reasonable estimate based on conditions and events that were in existence as of our reporting date, which may also involve the use of significant management judgment. Furthermore, many of our assumptions are inter-relational, where changing one assumption can impact other assumptions (e.g., in terms of the applicability of or limitations under various tax code provisions).
The nature of the AETR estimation approach for recording income taxes requires continuous review and adjustment during the year based on actual results, and as better information regarding forecasted results and assumptions becomes available. Significant changes in any of these assumptions or in actual results compared to our forecasts and assumptions could cause material changes in our AETR, which could result in cumulative adjustments to reflect the new estimates in future periods.
We have developed and utilized methodologies and rationales for the development of our assumptions, subject to internal controls and sensitivity or probability assessments, as appropriate, and we believe our process provides a reasonable basis for our estimated AETR as well as the income taxes as of and for the nine months ended September 30, 2021.
Goodwill and Potential Impairment
Our annual goodwill impairment analysis is performed during the fourth quarter of each year. Under Accounting Standards Codification ("ASC") ASC 350, Intangibles - Goodwill and Other, goodwill of a reporting unit shall be tested for impairment between annual tests if an event occurs or circumstances change that would more likely than not reduce the fair value of a reporting unit below its carrying amount.
In our assessment of the potential indicators of impairment, we considered the continued impact of the COVID-19 pandemic, including the the significant rise in number and severity of COVID-19 cases related to the spread of the Delta variant since the second quarter of 2021, as well as the impact of our stock price, which continues to be depressed, on our market capitalization. To determine whether these negative developments arising due to the Pandemic that occurred through September 30, 2021, would more likely than not reduce the fair value of a reporting unit below its carrying amount, we performed certain analyses on the most significant inputs in our valuation model to evaluate the impact of these events on the fair value of our reporting units. Based on our initial qualitative analysis, we determined that there was sufficient risk present associated with our Krotz Springs refinery (“KSR”) reporting unit to indicate that the fair value of that reporting unit were more likely than not to have declined below the carrying value as of August 31, 2021. Accordingly, we performed a quantitative assessment of goodwill on the KSR reporting unit as of August 31, 2021.
The estimated fair value of the reporting unit was determined using a combination of a discounted cash flow ("DCF") analysis and a market approach. The DCF analysis was based on our current projection of cash flows which reflected our updated estimates for long-term growth rates, gross margin, capital expenditures and the Weighted Average Cost of Capital or "WACC", which we adjusted to reflect the uncertainties that exist in the market as a result of the Pandemic. For the market approach, we applied an average historical multiple for guideline companies to estimated income before taxes, interest, depreciation, and amortization. Our analysis included a reconciliation of the estimated fair value of all reporting units to the company’s market capitalization. Based on the quantitative analysis, we concluded that the goodwill attributed to the KSR reporting unit was not impaired as of August 31, 2021, and the fair value was substantially in excess of its carrying value. We performed a sensitivity analysis on our impairment test, noting that 1% change in our WACC or long-term growth rate, assuming no other changes in any if the other key assumptions, would not result in an impairment of this reporting unit. The fair value measurements for individual reporting units’ estimated fair values represent Level 3 measurements.
Fair value determinations require considerable judgment and are sensitive to changes in underlying assumptions and factors. As a result, there can be no assurance that the estimates and assumptions made for purposes of the interim goodwill impairment test will prove to be an accurate prediction of the future.
We updated our assessment from a sensitivity perspective to consider events that had occurred and conditions that existed as of September 30, 2020, noting no changes to our August 31, 2021 conclusion. Because conditions and events are rapidly changing, we continue to monitor developments with these events and their impact on our valuation. Continued or worsening adverse changes to these factors, as well as their impact on our cash flows, market capitalization and other assumptions and inputs, may result in the need to recognize an impairment in future periods. Specifically with respect to the KSR reporting units, it is at least reasonably possible that continued or worsening adverse change to these factors, or the presence of new factors having a negative impact on our projection of future cash flows not known as of September 30, 2020, may result in a future impairment which could be material. We will perform our annual goodwill assessment during the fourth quarter.
Other than as described above, for all financial statement periods presented, there have been no material modifications to the application of these critical accounting policies or estimates since our most recently filed Annual Report on Form 10-K. See Note 1 of the condensed consolidated financial statements in Item 1. Financial Statements, for discussion of updates to our accounting policies.
Management's Discussion and Analysis
Non-GAAP Measures
Our management uses certain “non-GAAP” operational measures to evaluate our operating segment performance and non-GAAP financial measures to evaluate past performance and prospects for the future to supplement our GAAP financial information presented in accordance with U.S. GAAP. These financial and operational non-GAAP measures are important factors in assessing our operating results and profitability and include:
•Refining margin - calculated as the difference between net refining revenues and total cost of materials and other;
•Refined product margin - calculated as the difference between net revenues attributable to refined products (produced and purchased) and related cost of materials and other (which is applicable to both the refining segment and the West Texas wholesale marketing activities within our logistics segment); and
•Refining margin per barrels sold - calculated as refining margin divided by our average refining sales in barrels per day (excluding purchased barrels) multiplied by 1,000 and multiplied by the number of days in the period.
We believe these non-GAAP operational and financial measures are useful to investors, lenders, ratings agencies and analysts to assess our ongoing performance because, when reconciled to their most comparable GAAP financial measure, they provide improved comparability between periods through the exclusion of certain items that we believe are not indicative of our core operating performance and that may obscure our underlying results and trends.
Non-GAAP measures have important limitations as analytical tools, because they exclude some, but not all, items that affect net earnings and operating income. These measures should not be considered substitutes for their most directly comparable U.S. GAAP financial measures.
Non-GAAP Reconciliations
The following table provides a reconciliation of refining margin to the most directly comparable U.S. GAAP measure, gross margin:
Reconciliation of refining margin to gross margin (in millions)
| | | | | | | | | | | | | | | | | | | | | | | | | | |
| Refining Segment |
| | Three Months Ended September 30, | | Nine Months Ended September 30, |
| | 2021 | | 2020 | | 2021 | | 2020 |
| Net revenues | | $ | 2,814.6 | | | $ | 1,563.5 | | | $ | 6,970.4 | | | $ | 4,368.4 | |
| Cost of sales | | 2,769.1 | | | 1,631.6 | | | 7,069.1 | | | 4,749.2 | |
| Gross margin | | 45.5 | | | (68.1) | | | (98.7) | | | (380.8) | |
| Add back (items included in cost of sales): | | | | | | | | |
| Operating expenses (excluding depreciation and amortization) | | 82.8 | | | 102.1 | | | 310.2 | | | 302.5 | |
| Depreciation and amortization | | 45.9 | | | 50.3 | | | 149.0 | | | 132.3 | |
| Refining margin | | $ | 174.2 | | | $ | 84.3 | | | $ | 360.5 | | | $ | 54.0 | |
Management's Discussion and Analysis
Summary Financial and Other Information
The following table provides summary financial data for Delek:
Summary Statement of Operations Data (in millions)(1)
| | | | | | | | | | | | | | | | | | | | | | | | | | |
| Consolidated |
| | Three Months Ended | | Nine Months Ended |
| | September 30, | | September 30, |
| | 2021 | | 2020 | | 2021 | | 2020 |
| Net revenues | | $ | 2,956.5 | | | $ | 2,062.9 | | | $ | 7,540.2 | | | $ | 5,419.6 | |
Total operating costs and expenses(2) | | 2,910.7 | | | 2,138.1 | | | 7,659.9 | | | 5,833.5 | |
Operating income (loss)(2) | | 45.8 | | | (75.2) | | | (119.7) | | | (413.9) | |
| Total non-operating expense, net | | 12.8 | | | 17.3 | | | 69.5 | | | 6.1 | |
| Income (loss) before income tax expense (benefit) | | 33.0 | | | (92.5) | | | (189.2) | | | (420.0) | |
| Income tax expense (benefit) | | 6.1 | | | (15.6) | | | (52.3) | | | (134.6) | |
| | | | | | | | |
| | | | | | | | |
| Net income (loss) | | 26.9 | | | (76.9) | | | (136.9) | | | (285.4) | |
| Net income attributed to non-controlling interests | | 8.8 | | | 11.2 | | | 24.7 | | | 29.4 | |
| Net loss attributable to Delek | | $ | 18.1 | | | $ | (88.1) | | | $ | (161.6) | | | $ | (314.8) | |
(1) This information is presented at a summary level for your reference. See the Consolidated Condensed Statements of Income included in Item 1. to this Quarterly Report on Form 10-Q for more detail regarding our results of operations and net loss per share.
(2 ) As of September 30, 2021, we recorded an immaterial cumulative correction relating to prior periods to capitalize manufacturing overhead costs that should have been included in refining finished goods totaling $21.5 million. The impact of the balance sheet error correction would not have been material to the prior periods presented and is not material to total inventory or to beginning retained earnings. Of that amount, $14.0 million was recognized as a reduction of operating expenses and $7.5 million was recognized as a reduction of depreciation in the refining segment.
We report operating results in three reportable segments:
•Refining
•Logistics
•Retail
Decisions concerning the allocation of resources and assessment of operating performance are made based on this segmentation. Management measures the operating performance of each of theits reportable segments based on the segment contribution margin.margin which is defined as net revenues less costs of materials and other and operating expenses, excluding depreciation and amortization.
Results of Operations
Consolidated Results of Operations — Comparison of the Three and Nine Months Ended September 30, 2021 versus the Three and Nine Months Ended September 30, 2020
Net Loss
Q3 2021 vs. Q3 2020
Consolidated net income for the third quarter of 2021 was $26.9 million compared to net loss of $76.9 million for the third quarter of 2020. Consolidated net income attributable to Delek for the third quarter of September 30, 2021 was $18.1 million, or $0.24 per basic share, compared to net loss of $88.1 million, or $(1.20) per basic share, for the third quarter 2020. Explanations for significant drivers impacting net income as compared to the comparable period of the prior year are discussed in the sections below.
YTD 2021 vs. YTD 2020
Consolidated net loss for the nine months ended September 30, 2021 was $136.9 million compared to net loss of $285.4 million for the nine months ended September 30, 2020. Consolidated net loss attributable to Delek for the nine months ended September 30, 2021 was $161.6 million, or $(2.19) per basic share, compared to a net loss of $314.8 million, or $(4.28) per basic share, for the nine months ended September 30, 2020. Explanations for significant drivers impacting net loss as compared to the comparable period of the prior year are discussed in the sections below.
Management's Discussion and Analysis
Net Revenues
Q3 2021 vs. Q3 2020
In regardsthe third quarters of 2021 and 2020, we generated net revenues of $2,956.5 million and $2,062.9 million, respectively, an increase of $893.6 million, or 43.3%. The increase in net revenues was primarily driven by the following factors:
•in our refining segment, increases in the average price of U.S. Gulf Coast gasoline of 86.56%, ULSD of 79.25%, and HSD of 75.13%;
•in our logistics segment, increases in the average volumes of gasoline sold and in the average sales prices per gallon of gasoline and diesel sold in our West Texas marketing operations; and
•in our retail segment, increases in fuel sales primarily attributable to a 47.9% increase in average price charged per gallon sold.
YTD 2021 vs. YTD 2020
For the nine months ended September 30, 2021 and 2020, we generated net revenues of $7,540.2 million and $5,419.6 million, respectively, an increase of $2,120.6 million, or 39.1%. The increase in net revenues was primarily driven by the following factors:
•in our refining segment, increases in the average price of U.S. Gulf Coast gasoline of 83.2%, ULSD of 62.6%, and HSD of 60.1%;
•in our logistics segment, increases in the average sales prices per gallon of gasoline and diesel sold in our West Texas marketing operations, as well increased revenues associated with agreements executed in the nine months ended September 30, 2020, partially offset by decreased throughputs due to the aforementioned asphalt operations, we ownimpact of Winter Storm Uri; and
•in our retail segment, increases in fuel sales primarily attributable to a 38.7% increase in average price charged per gallon sold.
Total Operating Costs and Expenses Cost of Materials and Other
Q3 2021 vs. Q3 2020
Cost of materials and other was $2,670.1 million for the third quarter of 2021 compared to $1,875.9 million for the third quarter of 2020, an increase of $794.2 million, or operate 10 asphalt terminals located42.3%. The net increase in cost of materials and other was primarily driven by the following:
•increases in cost of crude oil feedstocks at the refineries, including a 72.6% increase in the average cost of WTI Cushing crude oil and a 72.4% increase in the average cost of WTI Midland crude oil;
•increases in average RINs costs during the third quarter of 2021 compared to the third quarter of 2020;
•increases in the average volumes of gasoline sold and average cost per gallon of gasoline and diesel sold in our West Texas (Big Spring), Washington (Richmond Beach), California (Paramount, Long Beach, Elk Grove, Bakersfieldmarketing operations; and Mojave), Arizona (Phoenix)
•an increase in retail cost of materials and other due to 56.0% increase in average cost per gallon sold applied to higher fuel sales volumes.
YTD 2021 vs. YTD 2020
Cost of materials and other was $6,871.4 million for the nine months ended September 30, 2021 compared to $5,064.3 million for the nine months ended September 30, 2020, an increase of $1,807.1 million, or 35.7%. The net increase in cost of materials and other was primarily driven by the following:
•increases in cost of crude oil feedstocks at the refineries, including a 67.0% increase in the average cost of WTI Cushing crude oil and a 68.0% increase in the average cost of WTI Midland crude oil;
•increases in average RINs costs during the nine months ended September 30, 2021 compared to the nine months ended September 30, 2020;
•increases in the average cost per gallon of gasoline and diesel sold, partially offset by decreases in the average volumes of gasoline and diesel sold in our West Texas marketing operations; and
•an increase in retail fuel cost of materials and other primarily attributable to a 46.6% increase in average cost per gallon sold.
Such increases were partially offset by the following:
•an increase in commodity hedging gains to a loss of $46.2 million recognized during the nine months ended September 30, 2021 from a loss of $85.2 million recognized during the nine months ended September 30, 2020;
•the benefit (expense) of $29.9 million related to the change in pre-tax inventory valuation recognized during the nine months ended September 30, 2021 compared to $(65.6) million recognized during the nine months ended September 30, 2020.
Management's Discussion and Analysis
Operating Expenses
Q3 2021 vs. Q3 2020
Operating expenses were $122.8 million for the third quarter of 2021 compared to $139.7 million for the third quarter of 2020, a decrease of $16.9 million, or 12.1%. The decrease in operating expenses was primarily driven by the following:
•a one-time favorable adjustment of $14.0 million in the current period to reflect the cumulative error correction to capitalize manufacturing overhead in refining finished goods inventory; and
•insurance recoveries of $17.0 million related to losses associated with Winter Storm Uri.
Such decreases were partially offset by the following:
•an increase in variable expenses due to natural gas pricing increases in the third quarter of 2021;
•increases in our logistics segment due to terminating certain cost cutting measures previously implemented in response to the Pandemic, as well as asphalt terminalsincreased variable costs due to higher throughput; and
•increases in whichour refining segment at our Krotz Springs refinery associated with new slurry operations and costs associated with Hurricane Ida.
YTD 2021 vs. YTD 2020
Operating expenses were $433.2 million for the nine months ended September 30, 2021 compared to $422.0 million for the nine months ended September 30, 2020, an increase of $11.2 million, or 2.7%. The increase in operating expenses was primarily driven by the following:
•an increase in variable expenses primarily associated with higher natural gas costs during the February 2021 severe freezing conditions that affected most of the regions where we own operate and higher natural gas pricing during the third quarter of 2021;
•an increase in Big Spring variable costs due to the refinery being shut down for turnaround activities during the first and second quarters of 2020;
•increases in our logistics segment due to terminating certain cost cutting measures previously implemented in response to the Pandemic, as well as increased variable costs due to higher throughput; and
•increases in maintenance, outside services and lease costs due to continued costs associated with Winter Storm Uri as well as unit outages at certain of our refineries.
Such increases were partially offset by the following:
•a 50% interest locatedone-time favorable adjustment of $14.0 million in Fernley, Nevada,the third quarter of 2021 to reflect the cumulative error correction to capitalize manufacturing overhead in refining finished goods inventory;
•insurance recoveries of $17.0 million related to losses associated with Winter Storm Uri.
General and Brownwood, Texas.Administrative Expenses
Q3 2021 vs. Q3 2020
General and administrative expenses were $58.7 million for the third quarter of 2021 compared to $57.0 million for the third quarter of 2020, an increase of $1.7 million, or 3.0%.
YTD 2021 vs. YTD 2020
General and administrative expenses were $164.4 million and $184.4 million for the nine months ended September 30, 2021 and 2020, respectively, a decrease of $20.0 million, or 10.8%. The operationsdecrease in which we have general and administrative expense was primarily driven by the following:
•a 50% interest are recorded underdecrease in employee expenses partially due to additional severance costs incurred in prior year and suspension of matching contributions to our 401(k) plan for the equity methodfirst half of accounting. We purchase non-blended asphalt from2021 while the plan was still in place during the nine months ended September 30, 2020; and
•a decrease in contract services due to additional legal and consulting services associated with the drop downs in prior year and cost reduction measures.
Management's Discussion and Analysis
Depreciation and Amortization
Q3 2021 vs. Q3 2020
Depreciation and amortization (included in both cost of sales and other operating expenses) was $60.8 million for the third partiesquarter of 2021 compared to $65.2 million for the third quarter of 2020, a decrease of $4.4 million, or 6.7% primarily due to the following:
•a one-time favorable adjustment of $7.5 million in additionthe current period to non-blended asphalt produced atreflect the cumulative error correction to capitalize manufacturing overhead in refining finished goods inventory;
•an offsetting increase due to depreciation associated with assets added during the El Dorado refinery turnaround in the first quarter of 2021, as well as other refining assets placed in service.
YTD 2021 vs. YTD 2020
Depreciation and amortization (included in both cost of sales and other operating expenses) was $195.6 million compared to $177.4 million for the nine months ended September 30, 2021 and 2020, respectively, an increase of $18.2 million, or 10.3%, primarily due to depreciation associated with assets added during the Big Spring refinery. We market asphalt through our terminalsrefinery turnaround in the first quarter of 2020 and the El Dorado refinery turnaround in 2021, as blended and non-blended asphalt. Saleswell as other refining assets placed in service.
Other Operating Income, Net
Q3 2021 vs. Q3 2020
Other operating income, net decreased by $2.0 million in the third quarter of asphalt are seasonal with2021 to $1.7 million compared to a loss of $0.3 million in the majoritythird quarter of sales occurring between May and October.2020.
PriorYTD 2021 vs. YTD 2020
Other operating income, net decreased by $9.9 million during the nine months ended September 30, 2021 to $4.7 million compared to $14.6 million during the nine months ended September 30, 2020 primarily due to unrealized gain of $10.6 million on the underlying commodity related tie the Strategic Petroleum Reserve financial asset during the prior year period.
Non-operating Expenses, Net
Interest Expense
Q3 2021 vs. Q3 2020
Interest expense increased by $5.8 million, or 18.2%, to $37.7 million in the third quarter of 2021 compared to $31.9 million in the third quarter of 2020, primarily driven by the following:
•an increase in the average effective interest rate of 0.96% in the third quarter of 2021 compared to the Delek/Alon Merger,third quarter of 2020 (where effective interest rate is calculated as interest expense divided by the refining segment operated refineriesnet average borrowings/obligations outstanding); and partially offset by,
•a decrease in Tyler, Texas (the "Tyler refinery")net average borrowings outstanding (including the obligations under the supply and El Dorado, Arkansas (the "El Dorado refinery") withofftake agreements which have an associated interest charge) of approximately $62.4 million in the third quarter of 2021 (calculated as a combined design crude throughput (nameplate) capacitysimple average of 155,000 barrels per day ("bpd")beginning borrowings/obligations and ending borrowings/obligations for the period) compared to the third quarter of 2020.
YTD 2021 vs. YTD 2020
Interest expense increased by $2.5 million, or 2.6%, includingto $100.5 million during the 75,000 bpd Tyler refinerynine months ended September 30, 2021 compared to $98.0 million during the nine months ended September 30, 2020, primarily driven by the following:
•an increase in the average effective interest rate of 0.07% during the nine months ended September 30, 2021 compared to the nine months ended September 30, 2020 (where effective interest rate is calculated as interest expense divided by the net average borrowings/obligations outstanding); and
•an increase in net average borrowings outstanding (including the obligations under the supply and offtake agreements which have an associated interest charge) of approximately $30.8 million during the nine months ended September 30, 2021 (calculated as a simple average of beginning borrowings/obligations and ending borrowings/obligations for the period) compared to the nine months ended September 30, 2020.
Results from Equity Method Investments
Q3 2021 vs. Q3 2020
We recognized income of $2.9 million from equity method investments during the third quarter of 2021, compared to $12.8 million for the third quarter of 2020, a decrease of $9.9 million. This decrease was primarily driven by the following:
Management's Discussion and Analysis
•a decrease in income from our investment in W2W Holdings LLC to a loss of $8.8 million in the third quarter of 2021 from income of $0.2 million in the third quarter of 2020.
YTD 2021 vs. YTD 2020
During the nine months ended September 30, 2021, we recognized income of $14.5 million from equity method investments, compared to $28.6 million for the nine months ended September 30, 2020, an decrease of $14.1 million. This decrease was primarily driven by the following:
•decrease in income from our logistics' equity method investments due to lower volumes as the impact of the February 2021 Winter Storm Uri was pervasive across all of our equity method investments' pipeline systems; and
•a decrease in income from our investment in W2W Holdings LLC to a loss of $12.9 million in the third quarter of 2021 from a loss of $1.8 million in the third quarter of 2020.
Other
During the three and nine months ended September 30, 2021, we recognized a receivable of $27.5 million, $20.9 million of which is included as a gain in other income, related to payment to be received from a loan buy-out agreement between Wink to Webster Pipeline LLC and the 80,000 bpd El Dorado refinery. Our refining segment also included two biodiesel facilitiesCompany. Refer to Note 5 of the condensed consolidated financial statements in Item 1. Financial Statements, for additional information.
During the nine months ended September 30, 2020, we own and operate that are engaged inrecognized a gain of $56.8 million on the productionsale of biodiesel fuels and related activities, located in Crossett, Arkansas and Cleburn, Texas. Effective with the Delek/Alon Merger, our refining segment now also includes a crude oil refinery located in Big Spring, Texas with a nameplate capacity of 73,000 bpd, a crude oil refinery located in Krotz Springs, Louisiana with a nameplate capacity of 74,000 bpd, and a heavy crude oilnon-operating refinery located in Bakersfield, California. The Bakersfield, California refinery has not processed crude oil since 2012 due toSee Note 2 of the high cost of crude oil relative to product yield and low asphalt demand.
Our corporate, other and eliminations category in the segment footnote tables in Note 14 of thecondensed consolidated financial statements in Item 1,1. Financial Statements, subsequentfor additional information.Income Taxes
Q3 2021 vs. Q3 2020
Income tax expense increased by $21.7 million in the third quarter of 2021 compared to the Delek/Alon Merger, includesthird quarter of 2020, primarily driven by the operationsfollowing:
•pre-tax income of $33.0 million in the Paramount, Californiathird quarter of 2021, as compared to loss of $92.5 million for the third quarter of 2020; and Long Beach, California heavy crude oil refineries,
•an increase in our effective tax rate which have not processed crude oil since 2012,was 18.5% for the third quarter of 2021, compared to 16.9% for the third quarter of 2020 primarily due to the following:
◦the impact of credits and a renewable fuels facility located atpermanent differences on the Paramount, California refinery (in which we own a majority ownership interest), which has a throughput capacitytax rate due to changes in pre-tax book income; and
◦changes in the third quarter estimated AETR applied to year-to-date loss for the third quarter of 3,000 bpd and converts tallow and vegetable oils into renewable fuels. The produced renewable fuels are drop-in replacements2020 exceeded changes in AETR applied to year-to-date loss for petroleum-based fuels. The renewable fuels facility generates both state andthe third quarter of 2021; offset by
◦2020 federal environmental credits as well as the federal blender’s tax credit, when effective. As a result of Delek management's committingnet operating loss carryback to a planprior 35% tax rate year creating a 14% rate benefit reported in the third quarter of 2020.
YTD 2021 vs. YTD 2020
Income tax benefit decreased by $82.3 million during the nine months ended September 30, 2021 compared to sell 100%the same period for 2020, primarily driven by the following:
•pre-tax loss of $189.2 million in the nine months ended September 30, 2021, as compared to pre-tax loss of $420.0 million for the nine months ended September 30, 2020; and
•a decrease in our equity interestseffective tax rate which was 27.6% for the nine months ended September 30, 2021, compared to 32.0% for the nine months ended September 30, 2020 primarily due to the following:
◦the reversal of a valuation allowance attributable to book-tax basis differences in (or substantially all of the assets of) our subsidiaries associated with the operations of our Paramount and Long Beach, California refineries and our California renewable fuels facility, which were acquired as part of the Delek/Alon Merger (collectively, the "California Discontinued Entities"), we met the requirements under Accounting Standards Codification ("ASC") 205-20, Presentation of Financial Statements - Discontinued Operations ("ASC 205-20") and ASC 360, Property, Plant and Equipment ("ASC 360") to report the results of those operations as discontinued operations and to classify the applicable assets of the California Discontinued Entitiespartnership investments reported as a groupdiscrete benefit in the first quarter of assets held for sale.2020; and
We own◦2020 federal net operating loss carryback to a prior 35% tax rate year creating a 14% rate benefit reported in the Big Spring refinerythird quarter of 2020; offset by
◦the impact of credits and its integrated wholesale marketing operations through Alon USA Partners, LP (the "Alon Partnership"). Our marketing of transportation fuels produced at the Big Spring refinery is focused on Central and West Texas, Oklahoma, New Mexico and Arizona. We provide substantially all of our branded customers motor fuels, brand support and payment processing services in addition to the license of the Alon brand name and associated trade dress. We market transportation fuel production from our Krotz Springs refinery substantially through bulk sales and exchange channels. These bulk sales and exchange arrangements are entered into with various oil companies and trading companies and are transported to marketspermanent differences on the Mississippi Rivertax rate due to changes in pre-tax book income.
Management's Discussion and the Atchafalaya River, as well as to the Colonial Pipeline.Analysis
Our logistics segment gathers, transports
The tables and stores crude oil and markets, distributes, transports and stores refined products in select regions of the southeastern United States and west Texas forcharts below set forth certain information concerning our refining segment and third parties.operations ($ in millions, except per barrel amounts):
At | | | | | | | | | | | | | | | | | | | | | | | | | | |
| Refining Segment Margins |
| | Three Months Ended | | Nine Months Ended |
| | September 30, | | September 30, |
| | 2021 | | 2020 | | 2021 | | 2020 |
| Net revenues | | $ | 2,814.6 | | | $ | 1,563.5 | | | $ | 6,970.4 | | | $ | 4,368.4 | |
| Cost of materials and other | | 2,640.4 | | | 1,479.2 | | | 6,609.9 | | | 4,314.4 | |
| Refining margin | | 174.2 | | | 84.3 | | | 360.5 | | | 54.0 | |
Operating expenses (excluding depreciation and amortization)(1) | | 82.8 | | | 102.1 | | | 310.2 | | | 302.5 | |
Contribution margin(1) | | $ | 91.4 | | | $ | (17.8) | | | $ | 50.3 | | | $ | (248.5) | |
(1) As of September 30, 2017,2021, we ownrecorded an immaterial cumulative correction relating to prior periods to capitalize manufacturing overhead costs that should have been included in refining finished goods totaling $21.5 million. The impact of the balance sheet error correction resulted in a 61.5% limited partner interestreduction in Delek Logistics Partners, LP ("Delek Logistics") and a 94.6% interestoperating expenses $14.0 million in the entity that ownsthree and nine months ended September 30, 2021, and would not have been material to the entire 2.0% general partner interest in Delek Logistics and all of the incentive distribution rights. Delek Logistics was formed by Delek in 2012 to own, operate, acquire and construct crude oil and refined products logistics and marketing assets. Delek Logistics' initial assets were contributed by us and included certain assets formerly owned or used by certain of our subsidiaries. A substantial majority of Delek Logistics' assets are currently integral to our refining and marketing operations.prior periods presented.
Factors Impacting Refining Profitability
Our profitability in the refining segment is substantially determined by the difference between the cost of the crude oil feedstocks we purchase and the price of the refined products we sell, referred to as the "crack spread", "refining margin" or "refined product margin." margin". Refining margin is used as a metric to assess a refinery's product margins against market crack spread trends, where "crack spread" is a measure of the difference between market prices for crude oil and refined products and is a commonly used proxy within the industry to estimate or identify trends in refining margins.
The cost
to acquire feedstocks and the price of the refined petroleum products we ultimately sell from our refineries depend on numerous factors beyond our control, including the supply of, and demand for, crude oil, gasoline and other refined petroleum products which, in turn, depend on, among other factors, changes in domestic and foreign economies, weather conditions such as hurricanes or tornadoes, local, domestic and foreign political affairs, global conflict, production levels, the availability of imports, the marketing of competitive fuels and government regulation. Other significant factors that influence our results in the refining segment include operating costs (particularly the cost of natural gas used for fuel and the cost of electricity), seasonal factors, refinery utilization rates and planned or unplanned maintenance activities or turnarounds. Moreover, while the fluctuations in the cost of crude oil are typically reflected in the prices of light refined products, such as gasoline and diesel fuel, the price of other residual products, such as asphalt, coke, carbon black oil and liquefied petroleum gas ("LPG"), are less likely to move in parallel with crude cost. This could cause additional pressure on our realized margin during periods of rising or falling crude oil prices.
Additionally, our margins are impacted by the pricing differentials of the various types and sources of crude oil we use at our refineries and their relation to product pricing, such as the differentials between Midland West Texas Intermediatepricing. Our crude oil ("WTI") and WTI Cushing or WTI Cushing and Brent crude oil.
For our Tyler refinery, we compare our per barrel refined product margin to a well established industry metric: the U.S. Gulf Coast ("Gulf Coast") 5-3-2 crack spread. The Gulf Coast 5-3-2 crack spreadslate is used as a benchmark for measuring a refinery's product margins by measuring the difference between the market price of light products and crude oil. It represents the approximate gross margin resulting from processing one barrel of crude oil into three-fifths of a barrel of gasoline and two-fifths of a barrel of high-sulfur diesel. We calculate the Gulf Coast 5-3-2 crack spread using the market value of U.S. Gulf Coast Pipeline CBOB and U.S. Gulf Coast Pipeline No. 2 Heating Oil (high sulfur diesel) and the first month futures price of WTI on the New York Mercantile Exchange ("NYMEX"). U.S. Gulf Coast CBOB is a grade of gasoline commonly blended with biofuels and marketed as Regular Unleaded at retail locations. U.S. Gulf Coast Pipeline No. 2 Heating Oil is a petroleum distillate that can be used as either a diesel fuel or a fuel oil. This is the standard by which other distillate products (such as ultra low sulfur diesel) are priced. The NYMEX is a commodities trading exchange where contracts for the future delivery of petroleum products are bought and sold.
The crude oil and product slate flexibility of the El Dorado refinery allows us to take advantage of changes in the crude oil and product markets; therefore, we anticipate that the quantities and varieties of crude oil processed and products manufactured at the El Dorado refinery will continue to vary. Thus, we do not believe that it is possible to develop a reasonable refined product margin benchmark that would accurately portray our refined product margins at the El Dorado refinery.
For our Big Spring refinery, we compare our per barrel refined product margin to the Gulf Coast 3-2-1 crack spread. The Gulf Coast 3-2-1 crack spread is calculated assuming that three barrels of WTI Cushing crude oil are converted, or cracked, into two barrels of Gulf Coast conventional gasoline and one barrel of Gulf Coast ultra-low sulfur diesel. Our Big Spring refinery is capable of processing substantial volumes of sour crude oil, which has historically cost less than intermediate, and/or substantial volumes of sweet crude oils, based on price differentials. We measure the cost advantage of refining sour crude oil by calculating the difference between the price of WTI Cushing crude oil and the price of West Texas Sour ("WTS"), a medium, sour crude oil. We refer to this differential as the WTI Cushing/WTS, or sweet/sour, spread. A widening of the sweet/sour spread can favorably influence the operating margin for our Big Spring refinery. The Big Spring refinery’s crude oil input is primarilypredominantly comprised of WTI and WTS Midland. In addition, the location of the Big Spring refinery near Midland, the largest origination terminal for West Texas crude oil, provides reliable crude sourcing with a relatively low transportation cost. Additionally, we have the ability to source locally produced crude at Big Spring by pipeline and truck, which enables us to better control quality and eliminate the cost of transporting our crude supply from Midland. The WTI Cushing less WTI Midland spread represents the differential between the average per barrel priceoil. Therefore, favorable differentials of WTI Cushingcompared to other crude oilwill favorably impact our operating results, and vice versa. Additionally, because of our gathering system presence in the Midland area and the average per barrel pricesignificant source of WTI Midland crude oil.
Forspecifically from that region into our Krotz Springs refinery, we compare our per barrel refined product margin to the Gulf Coast 2-1-1 high sulfur diesel crack spread. A Gulf Coast 2-1-1 high sulfur diesel crack spread is calculated assuming that two barrels of Light Louisiana Sweet (“LLS”) crude oil are converted into one barrel of Gulf Coast conventional gasoline and one barrel of Gulf Coast high sulfur diesel. The Krotz Springs refinery has the capability to process substantial volumes of low-sulfur, or sweet, crude oils to producenetwork, a high percentage of refined light products. Sweet crude oil typically comprises 100% of the Krotz Springs refinery’s crude oil input. The Krotz Springs refinery’s crude oil input is primarily comprised of LLS and WTI Midland.
A widening of the WTI Cushing less WTI Midland spread will favorably influence the operating margin for our refineries. Alternatively, a narrowing of this differential will have an adverse effect on our operating margins. Global product prices are influenced by the price of Brent crude which is a global benchmark crude. Global product prices influence product prices in the U.S. As a result, our refineries are influenced by the spread between Brent crude and WTI Cushing.Midland. The Brent less WTI CushingMidland spread represents the differential between the average per barrel price of Brent crude oil and the average per barrel price of WTI CushingMidland crude oil. A widening of the spread between Brent and WTI CushingMidland will favorably influence our refineries' operating margins. Also, the Krotz Springs refinery is influenced by the spread between Brent crude and LLS. The Brent less LLS spread represents the differential between the average per barrel price of Brent crude oil and the average per barrel price of LLS crude oil. A discount in LLS relative to Brent will favorably influence the Krotz Springs refinery operating margin.
The cost to acquire the refined fuel products we sell to our wholesale customers in our logistics segment and at our convenience stores in our retail segment depends on numerous factors beyond our control, including the supply of, and demand for, crude oil, gasoline and other refined petroleum products which, in turn,largely depend on among otherthe factors changes in domestic and foreign economies, weather conditions,
domestic and foreign political affairs, production levels, the availability of imports, the marketing of competitive fuels and government regulation.discussed above. Our retail merchandise sales are driven by convenience, customer service, competitive pricing and branding. Motor fuel margin is sales less the delivered cost of fuel and motor fuel taxes, measured on a cents per gallon basis. Our motor fuel margins are impacted by local supply, demand, weather, competitor pricing and product brand.
AsIn addition to the above, it continues to be a strategic and operational objective to manage price and supply risk related to crude oil that is used in refinery production, and to develop strategic sourcing relationships. For that purpose, from a pricing perspective, we enter into commodity derivative contracts to manage our price exposure to our inventory positions, future purchases of crude oil and ethanol, future
Management's Discussion and Analysis
sales of refined products or to fix margins on future production. We also enter into future commitments to purchase or sell RINs at fixed prices and quantities, which are used to manage our RINs Obligation. Additionally, from a sourcing perspective, we often enter into purchase and sale contracts with vendors and customers or take physical or financial commodity positions for crude oil that may not be used immediately in production, but that may be used to manage the overall supply and availability of crude expected to ultimately be needed for production and/or to meet minimum requirements under strategic pipeline arrangements, and also to optimize and hedge availability risks associated with crude that we ultimately expect to use in production. Such transactions are inherently based on certain assumptions and judgments made about the current and possible future availability of crude. Therefore, when we take physical or financial positions for optimization purposes, our intent is generally to take offsetting positions in quantities and at prices that will advance these objectives while minimizing our positional and financial statement risk. However, because of the volatility of the market in terms of pricing and availability, it is possible that we may have material positions with timing differences or, more rarely, that we are unable to cover a position with an offsetting position as intended. Such differences could have a material impact on the classification of resulting gains/losses, assets or liabilities, and could also significantly impact refining contribution margin.
Finally, as part of our overall business strategy, we regularly evaluate opportunities to expand our portfolio of businesses and may at any time be discussing or negotiating a transaction that, if consummated, could have a material effect on our business, financial condition, liquidity or results of operations.
Management's Discussion and Analysis
In January 2017,
| | | | | | | | | | | | | | | | | | | | | | | | | | |
| Refinery Statistics |
| | Three Months Ended | | Nine Months Ended |
| | September 30, | | September 30, |
| | 2021 | | 2020 | | 2021 | | 2020 |
| | (Unaudited) | | (Unaudited) |
| Tyler, TX Refinery | | | | | | | | |
| Days in period | | 92 | | | 92 | | | 273 | | | 274 | |
Total sales volume - refined product (average barrels per day)(1) | | 74,904 | | | 77,386 | | | 75,225 | | | 74,050 | |
| | | | | | | | |
| Products manufactured (average barrels per day): | | | | | | | | |
| Gasoline | | 35,221 | | | 40,383 | | | 37,410 | | | 39,221 | |
| Diesel/Jet | | 28,452 | | | 31,612 | | | 28,883 | | | 28,980 | |
| Petrochemicals, LPG, natural gas liquids ("NGLs") | | 2,196 | | | 3,848 | | | 2,001 | | | 3,022 | |
| Other | | 1,620 | | | 1,763 | | | 1,575 | | | 1,442 | |
| Total production | | 67,489 | | | 77,606 | | | 69,869 | | | 72,665 | |
| Throughput (average barrels per day): | | | | | | | | |
| Crude Oil | | 67,199 | | | 72,651 | | | 68,206 | | | 67,693 | |
| Other feedstocks | | 528 | | | 4,975 | | | 2,021 | | | 5,422 | |
| Total throughput | | 67,727 | | | 77,626 | | | 70,227 | | | 73,115 | |
| Total refining revenue ($ in millions) | | $ | 643.9 | | | $ | 383.8 | | | $ | 1,759.0 | | | $ | 1,055.3 | |
| Cost of materials and other ($ in millions) | | 595.5 | | | 392.4 | | | 1,625.0 | | | 1,003.0 | |
| Total refining margin ($ in millions) | | $ | 48.4 | | | $ | (8.6) | | | $ | 134.0 | | | $ | 52.3 | |
| Per barrel of refined product sales: | | | | | | | | |
| Tyler refining margin | | $ | 7.03 | | | $ | (1.21) | | | 6.52 | | | $ | 2.58 | |
| Direct operating expenses | | $ | 3.20 | | | $ | 3.28 | | | 3.42 | | | $ | 3.35 | |
| Crude Slate: (% based on amount received in period) | | | | | | | | |
| WTI crude oil | | 87.8 | % | | 89.0 | % | | 89.6 | % | | 92.1 | % |
| East Texas crude oil | | 12.2 | % | | 11.0 | % | | 10.1 | % | | 7.9 | % |
| Other | | — | % | | — | % | | 0.3 | % | | — | % |
| | | | | | | | |
| El Dorado, AR Refinery | | | | | | | | |
| Days in period | | 92 | | | 92 | | | 273 | | | 274 | |
Total sales volume - refined product (average barrels per day)(1) | | 89,909 | | | 79,594 | | | 65,147 | | | 77,742 | |
| | | | | | | | |
| Products manufactured (average barrels per day): | | | | | | | | |
| Gasoline | | 40,108 | | | 36,801 | | | 28,017 | | | 35,855 | |
| Diesel | | 31,922 | | | 30,709 | | | 22,208 | | | 29,473 | |
| Petrochemicals, LPG, NGLs | | 1,235 | | | 1,678 | | | 933 | | | 1,933 | |
| Asphalt | | 7,595 | | | 7,268 | | | 5,768 | | | 6,655 | |
| Other | | 720 | | | 825 | | | 588 | | | 801 | |
| Total production | | 81,580 | | | 77,281 | | | 57,514 | | | 74,717 | |
| Throughput (average barrels per day): | | | | | | | | |
| Crude Oil | | 78,744 | | | 74,235 | | | 56,026 | | | 72,427 | |
| Other feedstocks | | 4,115 | | | 2,814 | | | 2,419 | | | 2,610 | |
| Total throughput | | 82,859 | | | 77,049 | | | 58,445 | | | 75,037 | |
| Total refining revenue ($ in millions) | | $ | 728.4 | | | $ | 452.6 | | | $ | 1,654.6 | | | $ | 1,407.8 | |
| Cost of materials and other ($ in millions) | | 709.2 | | | 405.6 | | | 1,639.2 | | | 1,399.1 | |
| Total refining margin ($ in millions) | | $ | 19.2 | | | $ | 47.0 | | | $ | 15.4 | | | $ | 8.7 | |
| Per barrel of refined product sales: | | | | | | | | |
| El Dorado refining margin | | $ | 2.32 | | | $ | 6.42 | | | $ | 0.87 | | | $ | 0.41 | |
| Direct operating expenses | | $ | 1.75 | | | $ | 3.25 | | | $ | 3.87 | | | $ | 3.73 | |
| Crude Slate: (% based on amount received in period) | | | | | | | | |
| WTI crude oil | | 56.9 | % | | 69.9 | % | | 51.6 | % | | 52.2 | % |
| Local Arkansas crude oil | | 14.7 | % | | 17.7 | % | | 20.2 | % | | 17.2 | % |
| Other | | 28.4 | % | | 12.4 | % | | 28.2 | % | | 30.5 | % |
Management's Discussion and Analysis
| | | | | | | | | | | | | | | | | | | | | | | | | | |
| Refinery Statistics (continued) |
| | Three Months Ended | | Nine Months Ended |
| | September 30, | | September 30, |
| | 2021 | | 2020 | | 2021 | | 2020 |
| | (Unaudited) | | (Unaudited) |
| Big Spring, TX Refinery | | | | | | | | |
| Days in period | | 92 | | | 92 | | | 273 | | | 274 | |
Total sales volume - refined product (average barrels per day) (1) | | 72,142 | | | 75,884 | | | 70,023 | | | 61,602 | |
| | | | | | | | |
| Products manufactured (average barrels per day): | | | | | | | | |
| Gasoline | | 36,051 | | | 38,106 | | | 34,133 | | | 29,532 | |
| Diesel/Jet | | 27,036 | | | 28,777 | | | 24,510 | | | 22,190 | |
| Petrochemicals, LPG, NGLs | | 3,528 | | | 3,923 | | | 3,672 | | | 2,959 | |
| Asphalt | | 1,589 | | | 2,235 | | | 1,464 | | | 1,715 | |
| Other | | 1,354 | | | 1,397 | | | 1,416 | | | 1,030 | |
| Total production | | 69,558 | | | 74,438 | | | 65,195 | | | 57,426 | |
| Throughput (average barrels per day): | | | | | | | | |
| Crude oil | | 70,473 | | | 72,779 | | | 66,693 | | | 57,725 | |
| Other feedstocks | | 576 | | | 2,067 | | | (68) | | | 746 | |
| Total throughput | | 71,049 | | | 74,846 | | | 66,625 | | | 58,471 | |
| Total refining revenue ($ in millions) | | $ | 677.1 | | | $ | 401.9 | | | $ | 1,794.1 | | | $ | 1,104.4 | |
| Cost of materials and other ($ in millions) | | 630.1 | | | 374.0 | | | 1,663.4 | | | 1,069.3 | |
| Total refining margin ($ in millions) | | $ | 47.0 | | | $ | 27.9 | | | $ | 130.7 | | | $ | 35.1 | |
| Per barrel of refined product sales: | | | | | | | | |
| Big Spring refining margin | | $ | 7.07 | | | $ | 4.00 | | | $ | 6.84 | | | $ | 2.07 | |
| Direct operating expenses | | $ | 2.93 | | | $ | 3.88 | | | $ | 4.86 | | | $ | 4.47 | |
| Crude Slate: (% based on amount received in period) | | | | | | | | |
| WTI crude oil | | 75.9 | % | | 63.7 | % | | 68.7 | % | | 70.3 | % |
| WTS crude oil | | 24.1 | % | | 36.3 | % | | 31.3 | % | | 29.7 | % |
| | | | | | | | |
| Krotz Springs, LA Refinery | | | | | | | | |
| Days in period | | 92 | | | 92 | | | 273 | | | 274 | |
Total sales volume - refined product (average barrels per day) (1) | | 74,493 | | | 67,465 | | | 59,107 | | | 69,965 | |
| Products manufactured (average barrels per day): | | | | | | | | |
| Gasoline | | 31,465 | | | 32,287 | | | 23,639 | | | 26,872 | |
| Diesel/Jet | | 26,364 | | | 23,686 | | | 19,075 | | | 25,447 | |
| Heavy Oils | | 1,216 | | | 729 | | | 759 | | | 559 | |
| Petrochemicals, LPG, NGLs | | 6,151 | | | 3,394 | | | 4,690 | | | 2,417 | |
| Other | | 3,960 | | | 4,020 | | | 7,267 | | | 11,117 | |
| Total production | | 69,156 | | | 64,116 | | | 55,430 | | | 66,412 | |
| Throughput (average barrels per day): | | | | | | | | |
| Crude Oil | | 65,583 | | | 60,150 | | | 50,197 | | | 64,019 | |
| Other feedstocks | | 2,713 | | | 3,028 | | | 5,413 | | | 2,415 | |
| Total throughput | | 68,296 | | | 63,178 | | | 55,610 | | | 66,434 | |
| Total refining revenue ($ in millions) | | $ | 745.2 | | | $ | 335.9 | | | $ | 1,752.3 | | | $ | 999.1 | |
| Cost of materials and other ($ in millions) | | 705.9 | | | 339.1 | | | 1,679.9 | | | 1,016.8 | |
| Total refining margin ($ in millions) | | $ | 39.3 | | | $ | (3.2) | | | $ | 72.4 | | | $ | (17.7) | |
| Per barrel of refined product sales: | | | | | | | | |
| Krotz Springs refining margin | | $ | 5.73 | | | $ | (0.50) | | | $ | 4.48 | | | $ | (0.92) | |
| Direct operating expenses | | $ | 3.69 | | | $ | 4.25 | | | $ | 4.55 | | | $ | 3.72 | |
| Crude Slate: (% based on amount received in period) | | | | | | | | |
| WTI Crude | | 62.5 | % | | 72.6 | % | | 65.5 | % | | 69.3 | % |
| Gulf Coast Sweet Crude | | 37.5 | % | | 24.6 | % | | 33.8 | % | | 29.8 | % |
| Other | | — | % | | 2.8 | % | | 0.7 | % | | 0.9 | % |
(1) Includes inter-refinery sales and sales to other segments which are eliminated in consolidation. See tables below.
Management's Discussion and Analysis
Included in the refinery statistics above are the following inter-refinery and sales to other segments:
| | | | | | | | | | | | | | | | | | | | | | | | | | |
| Inter-refinery Sales |
| | Three Months Ended | | Nine Months Ended |
| | September 30, | | September 30, |
| (in barrels per day) | | 2021 | | 2020 | | 2021 | | 2020 |
| | (Unaudited) | | (Unaudited) |
| | | | | | | | |
| Tyler refined product sales to other Delek refineries | | 1,712 | | | 2,479 | | | 1,866 | | 1,813 | |
| El Dorado refined product sales to other Delek refineries | | 736 | | | 854 | | | 715 | | 1,075 | |
| Big Spring refined product sales to other Delek refineries | | 580 | | | 2,294 | | | 727 | | 1,532 | |
| Krotz Springs refined product sales to other Delek refineries | | 1 | | | 14 | | | 197 | | 167 | |
| | | | | | | | | | | | | | | | | | | | | | | | | | |
| Refinery Sales to Other Segments |
| | Three Months Ended | | Nine Months Ended |
| | September 30, | | September 30, |
| (in barrels per day) | | 2021 | | 2020 | | 2021 | | 2020 |
| | (Unaudited) | | (Unaudited) |
| | | | | | | | |
| Tyler refined product sales to other Delek segments | | 50 | | | 1,069 | | | 619 | | 1,953 | |
| El Dorado refined product sales to other Delek segments | | 9 | | | 27 | | | 9 | | 122 | |
| Big Spring refined product sales to other Delek segments | | 22,298 | | | 22,835 | | | 22,196 | | 22,839 | |
| Krotz Springs refined product sales to other Delek segments | | 3,180 | | | 1,002 | | | 2,423 | | | 336 | |
| | | | | | | | | | | | | | | | | | | | | | | | | | |
| Pricing Statistics (average for the period presented) |
| | Three Months Ended | | Nine Months Ended |
| | September 30, | | September 30, |
| | 2021 | | 2020 | | 2021 | | 2020 |
| | (Unaudited) | | (Unaudited) |
| | | | | | | | |
| WTI — Cushing crude oil (per barrel) | | $ | 70.54 | | | $ | 40.88 | | | $ | 65.06 | | | $ | 38.95 | |
| WTI — Midland crude oil (per barrel) | | $ | 70.74 | | | $ | 41.03 | | | $ | 65.48 | | | $ | 38.98 | |
| WTS -- Midland crude oil (per barrel) | | $ | 70.58 | | | $ | 40.99 | | | $ | 65.43 | | | $ | 38.84 | |
| LLS (per barrel) | | $ | 71.46 | | | $ | 42.46 | | | $ | 66.69 | | | $ | 40.67 | |
| Brent crude oil (per barrel) | | $ | 73.15 | | | $ | 43.34 | | | $ | 67.96 | | | $ | 42.56 | |
| | | | | | | | |
| U.S. Gulf Coast 5-3-2 crack spread (per barrel) - utilizing HSD | | $ | 13.53 | | | $ | 5.13 | | | $ | 11.90 | | | $ | 5.88 | |
U.S. Gulf Coast 5-3-2 crack spread (per barrel) (1) | | $ | 18.46 | | | $ | 7.49 | | | $ | 16.32 | | | $ | 8.30 | |
U.S. Gulf Coast 3-2-1 crack spread (per barrel) (1) | | $ | 19.72 | | | $ | 8.15 | | | $ | 17.53 | | | $ | 8.92 | |
U.S. Gulf Coast 2-1-1 crack spread (per barrel) (1) | | $ | 11.91 | | | $ | 3.51 | | | $ | 9.84 | | | $ | 4.72 | |
| | | | | | | | |
| U.S. Gulf Coast Unleaded Gasoline (per gallon) | | $ | 2.15 | | | $ | 1.15 | | | $ | 1.95 | | | $ | 1.07 | |
| Gulf Coast Ultra low sulfur diesel (per gallon) | | $ | 2.08 | | | $ | 1.16 | | | $ | 1.92 | | | $ | 1.18 | |
| U.S. Gulf Coast high sulfur diesel (per gallon) | | $ | 1.79 | | | $ | 1.02 | | | $ | 1.65 | | | $ | 1.03 | |
Natural gas (per MMBTU) (2) | | $ | 4.32 | | | $ | 2.12 | | | $ | 3.35 | | | $ | 1.92 | |
(1) For our Tyler and El Dorado refineries, we announced that Old Delek (and various related entities) entered into a Merger Agreement with Alon, as subsequently amended on February 27 and April 21, 2017. The related mergers (the "Mergers" or the "Delek/Alon Merger") were effective July 1, 2017 (as previously defined, the “Effective Time”), resulting in a new post-combination consolidated registrant renamed as Delek US Holdings, Inc. (as previously defined, “New Delek”), with Alon and Old Delek surviving as wholly-owned subsidiaries of New Delek. New Delek is the successor issuer to Old Delek and Alon pursuant to Rule 12g-3(c) under the Exchange Act, as amended. In addition, as a result of the Delek/Alon Merger, the shares of common stock of Old Delek and Alon were delisted from the New York Stock Exchange in July 2017, and their respective reporting obligations under the Exchange Act were terminated. The Mergers resulted in total stock consideration paid of approximately $509.0 million consisting of approximately 19.3 million incremental shares of New Delek Common Stock.
Subjectcompare our per barrel refining product margin to the terms and conditions of the Merger Agreement, at the Effective Time, each issued and outstanding share of Alon Common Stock, other than shares owned by Old Delek and its subsidiaries or held in the treasury of Alon, was converted into the right to receive 0.504 of a share of New Delek Common Stock, or, in the case of fractional shares of New Delek Common Stock, cash (without interest) in an amount equal to the product of (i) such fractional part of a share of New Delek Common Stock multiplied by (ii) $25.96 per share, which was the volume weighted average price of the Old Delek Common Stock, par value $0.01 per share as reported on the NYSE Composite Transactions Reporting System for the twenty consecutive NYSE full trading days ending on June 30, 2017. Each outstanding share of restricted Alon Common Stock was assumed by New Delek and converted into restricted stock denominated in shares of New Delek Common Stock. Committed but unissued share-based awards were exchanged and converted into rights to receive share-based awards indexed to New Delek Common Stock. Conversions of restricted shares and unissued share-based awards were also subject to the exchange ratio.
In addition, subject to the terms and conditions of the Merger Agreement, each share of Old Delek Common Stock or fraction thereof issued and outstanding immediately prior to the Effective Time (other than Old Delek Common Stock held in the treasury of Old Delek) was converted at the Effective Time into the right to receive one validly issued, fully paid and non‑assessable share of New Delek Common Stock or such fraction thereof equal to the fractional share of New Delek Common Stock. All existing Old Delek stock options, restricted stock awards and stock appreciation rights were converted into equivalent rights with respect to New Delek Common Stock.
In connection with the Mergers, Alon, New Delek and U.S. Bank National Association, as trustee (the “Trustee”) entered into a First Supplemental Indenture (the “Supplemental Indenture”), effective as of July 1, 2017, supplementing the Indenture, dated as of September 16, 2013 (the “Indenture”), pursuant to which Alon issued its 3.00% Convertible Senior Notes due 2018 (the “Notes”), which were convertible into shares of Alon’s Common Stock, par value $0.01 per share or cash or a combination of cash and Alon Common Stock, all as provided in the Indenture. The Supplemental Indenture provides that, as of the Effective Time, the right to convert each $1,000 principal amount of the Notes based on a number of shares of Alon Common Stock equal to the Conversion Rate (as defined in the Indenture) in effect immediately prior to the Mergers was changed into a right to convert each $1,000 principal amount of Notes into or based on a number of shares of New Delek Common Stock (at the exchange ratio of 0.504), par value $0.01 per share, equal to the Conversion Rate in effect immediately prior to the Mergers. In addition, the Supplemental Indenture provides that, as of the Effective Time, New Delek fully and unconditionally guaranteed, on a senior basis, Alon’s obligations under the Notes.
The primary purpose of the Mergers was to enter into a strategic combination that has resulted in a larger, more diverse company that we believe is well positioned to take advantage of opportunities in the market and better navigate the cyclical nature of the business. The combination is also expected to provide opportunities for synergies across the organization as well as create a refining system that enhances its position as a significant buyer of crude from the Permian Basin among the independent refiners.
California Discontinued Entities
During the third quarter 2017, we committed to a plan to sell 100% of our equity interests in (or substantially all of the assets of) Delek's subsidiaries associated with our Paramount and Long Beach, California refineries and our California renewable fuels facility, which were acquired as part of the Delek/Alon Merger (collectively, the "California Discontinued Entities"). As a result of this decision and commitment to a plan, and because it was made within three months of the Delek/Alon Merger, we met the requirements under ASC 205-20 and ASC 360 to report
the results of the California Discontinued Entities as discontinued operations and to classify the California Discontinued Entities as a group of assets held for sale. The sale of the California Discontinued Entities is currently anticipated to occur within the next 12 months. The property, plant and equipment of the California Discontinued Entities were recorded at fair value as part of the Delek/Alon Merger, and we did not record any depreciation of these assets since the Delek/Alon Merger.
Planned Acquisition of Non-controlling Interest in Alon Partnership
On November 8, 2017, Delek and the Alon Partnership entered into a definitive merger agreement under which Delek will acquire all of the outstanding limited partner units which Delek does not already own in an all-equity transaction. Delek currently owns approximately 51.0 million limited partner units of the Alon Partnership, or approximately 81.6% of the outstanding units. Under terms of the merger agreement, the owners of the remaining outstanding units in the Alon Partnership that Delek does not currently own will receive a fixed exchange ratio of 0.49 Delek shares for each limited partner unit of the Alon Partnership. This transaction was approved by all voting members of the board of directors of the general partner of the Alon Partnership upon the recommendation from its conflicts committee and by the board of directors of Delek. This transaction is expected to close in the first quarter of 2018.
El Dorado Refinery RIN Waiver
In March 2017, the El Dorado refinery received approval from the Environmental Protection Agency for a small refinery exemption from the requirements of the renewable fuel standard for the 2016 calendar year. This waiver resulted in approximately $47.5 million of Renewable Identification Number ("RIN") expense reduction during the nine months ended September 30, 2017, based on an aggregated average price of $0.45 per RIN.
Return to Shareholders
Dividends
On September 13, 2017, we paid a regular quarterly dividend of $0.15 per share of our common stock, declared on August 1, 2017 to shareholders of record on August 23, 2017. On November 7, 2017, our Board of Directors voted to declare a quarterly cash dividend of $0.15 per share of our common stock, payable on December 15, 2017 to shareholders of record on November 22, 2017.
Share Repurchase Program
In December 2016, our Board of Directors authorized a share repurchase program for up to $150.0 million of Delek common stock. Any share repurchases under the repurchase program may be implemented through open market transactions or in privately negotiated transactions, in accordance with applicable securities laws. The timing, price, and size of repurchases will be made at the discretion of management and will depend on prevailing market prices, general economic and market conditions and other considerations. The repurchase program does not obligate us to acquire any particular amount of stock and does not expire. There were no shares repurchased during the three and six months ended September 30, 2017.
Market Trends
Our results of operations are significantly affected by fluctuations in the prices of certain commodities, including, but not limited to, crude oil, gasoline, distillate fuel, biofuels and natural gas and electricity, among others. Historically, our profitability has been affected by commodity price volatility, specifically as it relates to the price of crude oil and refined products.
The table below reflects the quarterly high, low and average prices of WTI Cushing crude oil for each of the quarterly periods in 2016 and the nine months ended September 30, 2017.
The table below reflects the quarterly high, low and average 5-3-2 crack spread for each of the quarterly periods in 2016 and the nine months ended September 30, 2017. The average Gulf Coast 5-3-2 crack spread increasedconsisting of WTI Cushing crude, U.S. Gulf Coast (CBOB) and U.S. Gulf Coast Pipeline No. 2 heating oil (ultra low sulfur diesel). For our Big Spring refinery, we compare our refined product margin to $12.46 during the first nine months of 2017 from $9.15 during the first nine months of 2016.
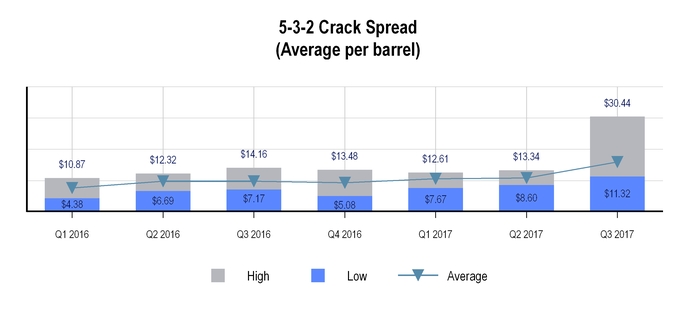
The table below reflects the quarterly high, low and averageGulf Coast 3-2-1 crack spread (Bigconsisting of WTI Cushing crude, Gulf Coast 87 Conventional gasoline and Gulf Coast ultra low sulfur diesel, and for our Krotz Springs refinery, we compare our per barrel refined product margin to the Gulf Coast 2-1-1 crack spread consisting of LLS crude oil, Gulf Coast 87 Conventional gasoline and U.S. Gulf Coast Pipeline No. 2 heating oil (high sulfur diesel). The Tyler refinery's crude oil input is primarily WTI Midland and East Texas, while the El Dorado refinery's crude input is primarily a combination of WTI Midland, local Arkansas and other domestic inland crude oil. The Big Spring benchmark)refinery’s crude oil input is primarily comprised of WTS and WTI Midland. The Krotz Springs refinery’s crude oil input is primarily comprised of LLS and WTI Midland.
(2) One Million British Thermal Units ("MMBTU").
Management's Discussion and Analysis
Refining Segment Operational Comparison of the Three and Nine Months Ended September 30, 2021 versus the Three and Nine Months Ended September 30, 2020
Net Revenues
Q3 2021 vs. Q3 2020
Net revenues for the refining segment increased by $1,251.1 million, or 80.0%, in the third quarter of 2021 compared to the third quarter of 2020, primarily driven by the following:
•increases in the average price of U.S. Gulf Coast gasoline of 86.56%, ULSD of 79.25%, and HSD of 75.13%; and
•an increase in sales volumes of refined and purchased product of 1.3 million barrels and 0.1 million barrels, respectively.
Net revenues included sales to our retail segment of $92.3 million and $57.6 million, sales to our logistics segment of $89.9 million and $45.1 million, and sales to our other segment of $28.7 million and $9.9 million for the three months ended September 30, 2017, the period since the Delek/Alon Merger.2021 and September 30, 2020, respectively. We eliminate this intercompany revenue in consolidation.
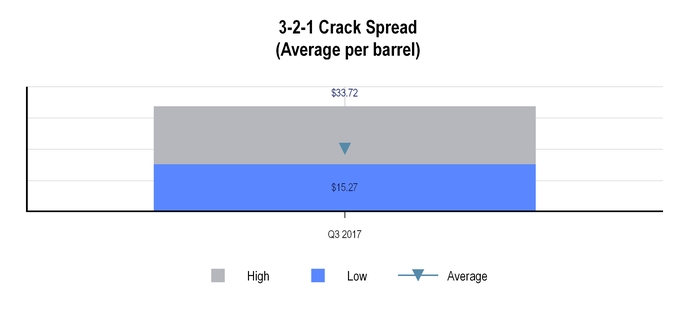
The table below reflects the quarterly high, low and average 2-1-1 crack spread (Krotz Springs benchmark)Net revenues for the three months ended September 30, 2017, the period since the Delek/Alon Merger.
The market price of refined products contributed to the increase in the Gulf Coast 5-3-2 crack spreadrefining segment increased by $2,602.0 million, or 59.6%, in the nine months ended September 30, 2017, with2021 compared to the U.S. Gulf Coast price of gasoline increasing 20.6%, from an average of $1.26 per gallon in the first nine months of 2016 to $1.52 per gallonended September 30, 2020, primarily driven by the following:
•increases in the first nine months of 2017 and the U.S. Gulf Coast price of High Sulfur Diesel increased 25.0%, from an average of $1.12 per gallon in the first nine months of 2016 to $1.40 per gallon in the first nine months of 2017. The charts below illustrate the average price of U.S. Gulf Coast Gasolinegasoline of 83.2%, ULSD of 62.6%, and U.S. High Sulfur Diesel for eachHSD of 60.1%; and
•decreases in sales volume of refined product totaling 3.7 million barrels, partially due to the quarterly periods in 2016temporary suspension of crude refining unit production at our Krotz Springs refinery from November 2020 through February 2021 and the nine months ended September 30, 2017.
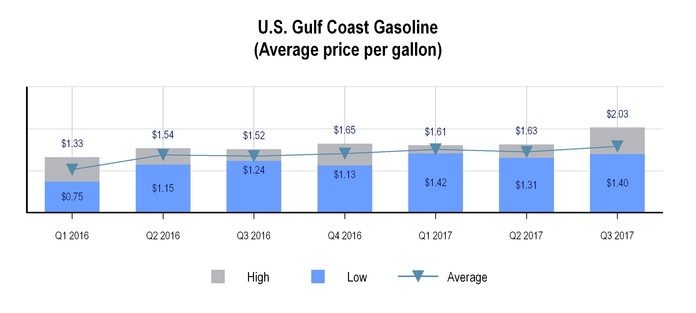
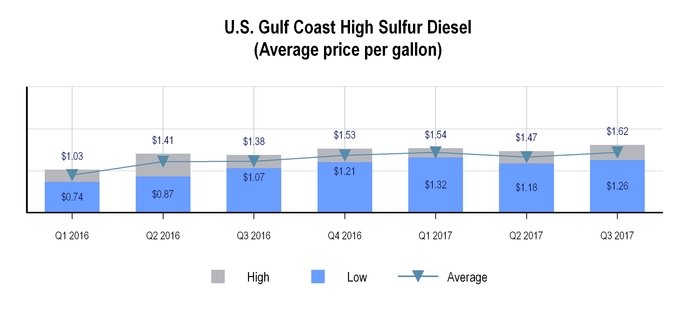
As US crude oil production has increased, we have seen the discount for WTI Cushing widen compared to Brent. This generally leads to higher margins inrelated turnaround activities, severe weather impacting our refineries as refined product prices are influenced by Brent crude prices. The discount for WTI Cushing compared to Brent increased to $3.18 during the first nine months of 2017 from $1.81 during the first nine months of 2016. Additionallyin February 2021, and turnaround at our refineries continue to have greater access to WTI Midland and WTI Midland-linked crude feedstocks compared to certain of our competitors. The discount for WTI Midland compared to WTI Cushing increased to $0.53 during the first nine months of 2017 from $0.18 during the first nine months of 2016. As these price discounts increase, so does our competitive advantage created by our access to WTI-linked crude oil. The chart below illustrates the differentials of both Brent crude oil and WTI Midland crude oil as compared to WTI Cushing crude oil for each of the quarterly periods in 2016 and the nine months ended September 30, 2017.
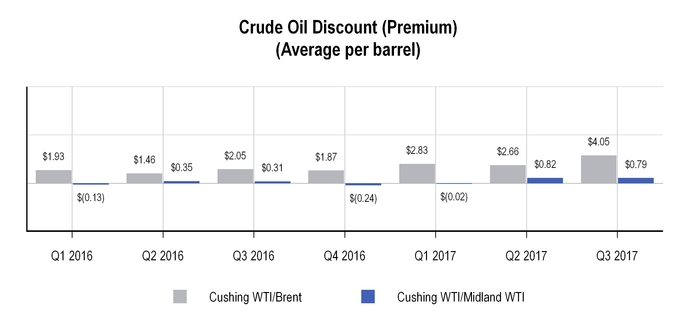
Environmental regulations continue to affect our margins in the form of the increasing cost of RINs. On a consolidated basis, we work to balance our RINs obligations in order to minimize the effect of RINs on our results. While we generate RINs in both our refining and logistics segments through our ethanol blending and biodiesel production, our refining segment needs to purchase additional RINs to satisfy its obligations. As a result, increases in the price of RINs generally adversely affect our results of operations. It is not possible at this time to predict with certainty what future volumes or costs may be, but given the increase in required volumes and the volatile price of RINs, the cost of purchasing sufficient RINs could have an adverse impact on our results of operations if we are unable to recover those costs in the price of our refined products. The chart below illustrates the volatile nature of the price for RINs for each of the quarterly periods in 2016 and the nine months ended September 30, 2017.
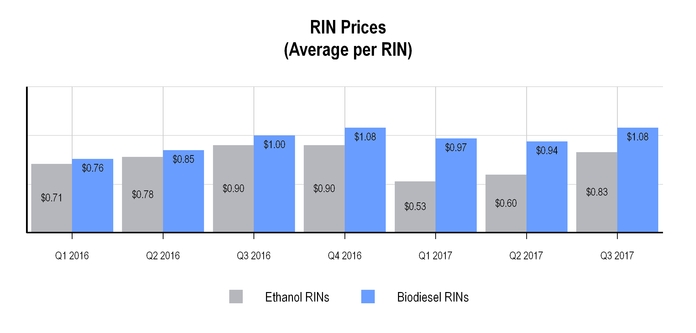
Seasonality
Demand for gasoline and asphalt products is generally lower during the winter months due to seasonal decreases in motor vehicle traffic and road and home construction. Additionally, varying vapor pressure requirements between the summer and winter months tighten summer gasoline supply. As a result, our operating results are generally lower during the first and fourth quarters of the year for all out segments. The effects of seasonal demand for gasoline areEl Dorado refinery, partially offset by seasonality in demand for diesel, which is generally higher in winter months as east-west trucking traffic moves south to avoid winter conditions on northern routes.
Critical Accounting Policies
The preparation of our consolidated financial statements requires us to make estimates and judgments that affect the reported amounts of assets, liabilities, revenues and expenses and related disclosure of contingent assets and liabilities. The SEC has defined critical accounting policies as those that are both most important to the portrayal of our financial condition and results of operations and require our most difficult, complex or subjective judgments or estimates. Based on this definition and as further described in our Annual Report on Form 10-K, we believe our critical accounting policies include the following: (i) determining our inventory using the last-in, first-out valuation method, (ii) evaluating impairment for property, plant and equipment and definite life intangibles, (iii) valuing goodwill and evaluating potential impairment, and (iv) estimating environmental expenditures. For all financial statement periods presented, there have been no material modifications to the application of these critical accounting policies or estimates since our most recently filed Annual Report on Form 10-K. See Note 1 of Item 1. Financial Statements for discussion of updates to our accounting policies.
Summary Financial and Other Information
The following table provides summary financial data for Delek (in millions, except share and per share data):
|
| | | | | | | | | | | | | | | | |
| | | Three Months Ended | | Nine Months Ended |
| Statement of Operations Data | | September 30, | | September 30, |
| | | 2017 | | 2016 | | 2017 | | 2016 |
| Net sales: | | | | | | | | |
| Refining | | $ | 2,113.8 |
| | $ | 1,013.2 |
| | $ | 4,366.3 |
| | $ | 2,918.2 |
|
| Logistics | | 130.7 |
| | 107.5 |
| | 386.9 |
| | 323.4 |
|
| Retail | | 213.9 |
| | — |
| | 213.9 |
| | — |
|
| Other | | (116.9 | ) | | (40.8 | ) | | (212.8 | ) | | (128.3 | ) |
| Net sales | | $ | 2,341.5 |
| | $ | 1,079.9 |
| | $ | 4,754.3 |
| | $ | 3,113.3 |
|
| Operating costs and expenses: | | | | | | | | |
| Cost of goods sold | | 1,988.1 |
| | 965.6 |
| | 4,181.6 |
| | 2,806.7 |
|
| Operating expenses | | 153.2 |
| | 61.0 |
| | 276.5 |
| | 187.8 |
|
| Insurance proceeds — business interruption | | — |
| | — |
| | — |
| | (42.4 | ) |
| General and administrative expenses | | 61.8 |
| | 24.9 |
| | 115.8 |
| | 77.5 |
|
| Depreciation and amortization | | 46.9 |
| | 29.0 |
| | 105.4 |
| | 86.6 |
|
| Other operating expense | | 0.7 |
| | 2.2 |
| | 1.0 |
| | 2.2 |
|
| Total operating costs and expenses | | 2,250.7 |
| | 1,082.7 |
| | 4,680.3 |
| | 3,118.4 |
|
| Operating (loss) income | | 90.8 |
| | (2.8 | ) | | 74.0 |
| | (5.1 | ) |
| Interest expense | | 34.1 |
| | 13.9 |
| | 62.5 |
| | 40.7 |
|
| Interest income | | (0.9 | ) | | (0.2 | ) | | (2.7 | ) | | (0.9 | ) |
| (Income) loss from equity method investments | | (5.1 | ) | | 5.1 |
| | (9.7 | ) | | 33.7 |
|
| Loss on impairment of equity method investment | | — |
| | 245.3 |
| | — |
| | — |
|
| Gain on investment in Alon | | (190.1 | ) | | — |
| | (190.1 | ) | | 245.3 |
|
| Other expense (income), net | | 0.8 |
| | 0.1 |
| | 0.9 |
| | 0.6 |
|
| Total non-operating expenses, net | | (161.2 | ) | | 264.2 |
| | (139.1 | ) | | 319.4 |
|
| Income (loss) from continuing operations before income tax expense (benefit) | | 252.0 |
| | (267.0 | ) | | 213.1 |
| | (324.5 | ) |
| Income tax expense (benefit) | | 133.5 |
| | (103.3 | ) | | 111.5 |
| | (136.8 | ) |
| Income (loss) from continuing operations | | 118.5 |
| | (163.7 | ) | | 101.6 |
| | (187.7 | ) |
| (Loss) income from discontinued operations, net of tax | | (4.1 | ) | | 6.0 |
| | (4.1 | ) | | 5.5 |
|
| Net income (loss) | | 114.4 |
| | (157.7 | ) | | 97.5 |
| | (182.2 | ) |
| Net income attributed to non-controlling interest | | 10.0 |
| | 4.0 |
| | 19.8 |
| | 15.7 |
|
| Net income (loss) attributable to Delek | | $ | 104.4 |
| | $ | (161.7 | ) | | $ | 77.7 |
| | $ | (197.9 | ) |
| Basic earnings per share: | | | | | | | | |
| Income (loss) from continuing operations | | $ | 1.35 |
| | $ | (2.71 | ) | | $ | 1.20 |
| | $ | (3.28 | ) |
| (Loss) income from discontinued operations | | (0.05 | ) | | 0.10 |
| | (0.06 | ) | | 0.09 |
|
| Total basic income (loss) per share | | $ | 1.30 |
| | $ | (2.61 | ) | | $ | 1.14 |
| | $ | (3.19 | ) |
| Diluted earnings per share: | |
|
| | | | | | |
| Income (loss) from continuing operations | | $ | 1.34 |
| | $ | (2.71 | ) | | $ | 1.19 |
| | $ | (3.28 | ) |
| (Loss) income from discontinued operations | | (0.05 | ) | | 0.10 |
| | (0.06 | ) | | 0.09 |
|
| Total diluted income (loss) per share | | $ | 1.29 |
| | $ | (2.61 | ) | | $ | 1.13 |
| | $ | (3.19 | ) |
Results of Operations
Consolidated Results of Operations — Comparison of the Three Months Ended September 30, 2017 versus the Three Months Ended September 30, 2016
Net Income (Loss)
Consolidated net income for the third quarter of 2017 was $104.4a 2.1 million or $1.30 per basic share, compared to net loss of $161.7 million, or $2.61 per basic share, for the third quarter of 2016.
Net Sales
In the third quarters of 2017 and 2016, we generated net sales of $2,341.5 million and $1,079.9 million, respectively, an increase of $1,261.6 million, or 116.8%. Thebarrel increase in netpurchased product sales was primarily due to the addition of Alon financial results as a result of Delek/Alon Merger (effective July 1, 2017), which contributed net sales of $970.5 million during the third quarter of 2017, and the effects of increases in the price of finished petroleum products at our refineries and in the logistics segment, combined with increases in sales volume at our refineries.
Cost of Goods Sold
Cost of goods sold was $1,988.1 million for the third quarter of 2017 compared to $965.6 million for the third quarter of 2016, an increase of $1,022.5 million, or 105.9%. The increase in cost of goods sold was primarily due to the addition of Alon financial results as a result of the Delek/Alon Merger, which contributed cost of goods sold of $789.9 million during the third quarter of 2017, the increase in the cost of both crude oil feedstocks at the refineries and refined products in the logistics segment, as well as increased sales volumes at our Big Spring refinery which was in a turnaround in the prior year period.
Net revenues included sales to our refineries.
Operating Expenses
Operating expenses were $153.2 million for the third quarterretail segment of 2017 compared to $61.0 million for the third quarter of 2016, an increase of $92.2 million, or 151.1%. The increase in operating expenses was primarily due to the addition of Alon financial results as a result of the Delek/Alon Merger, which contributed operating expenses of $87.9 million during the third quarter of 2017.
General and Administrative Expenses
General and administrative expenses were $61.8$253.8 million and $24.9$166.6 million, for the third quarter of 2017 and 2016, respectively, an increase of $36.9 million, or 148.2%. The increase was primarily due due to the addition of Alon financial results as a result of the Delek/Alon Merger, which contributed general and administrative expenses of $20.7 million during the third quarter of 2017, as well integration costs related to the Merger in the third quarter of 2017 totaling $18.4 million.
In connection with the Merger, we assumed Alon's existing post-retirement benefit plans and recorded the net unfunded pension obligations as part of the purchase price allocation. During the third quarter of 2017, we elected to freeze certain of the plans, resulting in the recognition of a gain due to curtailment of $6.1 million in the
third quarter of 2017. Net periodic benefit costs are included as part of general and administrative expenses in the accompanying condensed consolidated statements of income. See Note 18 of the condensed consolidated financial statements in Item 1, Financial Statements, for additional information about our defined benefit pension plans.
Depreciation and Amortization
Depreciation and amortization was $46.9 million for the third quarter of 2017 compared to $29.0 million for the third quarter of 2016, an increase of $17.9 million, or 61.7%. The increase in depreciation expense was primarily attributable due to the addition of Alon property, plant and equipment of $1,183.1 million (at preliminary fair value) and amortizable intangibles of $51.0 million (at preliminary fair value) as a result of the Delek/Alon Merger and other capital expenditures and acquisitions completed to date in 2017 as compared to 2016. The acquisition of Alon contributed $15.7 million in additional depreciation and amortization during the third quarter of 2017.
Interest Expense
Interest expense was $34.1 million for the third quarter of 2017 compared to $13.9 million for the third quarter of 2016, an increase of $20.2 million, or 145.3%. The increase was primarily attributable to the addition of assumed debt totaling $568.0 million (at fair value) in connection with the Delek/Alon Merger and increases in the weighted average interest rate under our credit facilities.
Results from Equity Method Investments
During the third quarter of 2017, we recognized income from equity method investments of $5.1 million, compared to a loss of $5.1 million for the third quarter of 2016. Changes in the results from equity method investments for the third quarter of 2016 were primarily attributablesales to our the fact that we no longer have an equity method investment in Alon in the third quarterlogistics segment of 2017, whereas we recorded our proportionate share of the net loss from our investment in Alon of $4.2$229.8 million and amortization of the excess of our investment over our equity in the underlying net assets of Alon of $0.6$155.7 million in the third quarter of 2016, combined with the effect of adding equity method investments owned by Alon in connection with the Merger, all of which had income in 2017.
Loss on Impairment of Equity Method Investment
We recorded an impairment charge of $245.3 million on our equity method investment in the third quarter of 2016, dueand sales to our determination that the decline in the market valueother segment of our ALJ Shares was other than temporary. There was no impairment recognized in the third quarter of 2017.
Gain on Remeasurement of Equity Method Investment
We recorded a gain of $190.1 million on our equity method investment in Alon in the third quarter of 2017, due to the remeasurement of the investment in connection with the Merger, where the remeasured pre-existing non-controlling interest is included as part of the purchase price consideration in recording
the acquisition of Alon, net of the reversal of the accumulated other comprehensive income previously recorded related to the equity method investment in Alon.
Income Taxes
Under ASC 740, Income Taxes (“ASC 740”), companies are required to apply an estimated annual tax rate to interim period results on a year-to-date basis; however, the estimated annual tax rate should not be applied to interim financial results if a reliable estimate cannot be made. In this situation, the interim tax rate should be based on actual year-to-date results. Based on our current projections, which have fluctuated as a result of changes in crude oil prices and the related crack spreads, we believe that using actual year-to-date results to compute our effective tax rate will produce a more reliable estimate of our tax expense or benefit. As such, we recorded a tax provision for the three and nine months ended September 30, 2017 and 2016 based on actual year-to-date results, in accordance with ASC 740.
Income tax expense was $133.5 million for the third quarter of 2017, compared to benefit of $103.3 million for the third quarter of 2016, an increase in expense of $236.8 million. The increase in expense was primarily attributable to pre-tax income of $252.0 million in the third quarter of 2017, as compared to pre-tax loss of $267.0 million for the third quarter of 2016. Our effective tax rate was 53.0% for the third quarter of 2017, compared to 38.7% for the third quarter of 2016. The increase in our effective tax rate was primarily due to the reversal of the deferred tax asset related to our equity method investment in Alon.
Consolidated Results of Operations — Comparison of the Nine Months Ended September 30, 2017 versus the Nine Months Ended September 30, 2016
Net Income (Loss)
Consolidated net income for the nine months ended September 30, 2017 was $77.7 million, or $1.14 per basic share, compared to net loss of $197.9 million, or $3.19 per basic share, for the nine months ended September 30, 2016.
Net Sales
For the nine months ended September 30, 2017 and 2016, we generated net sales of $4,754.3$71.7 million and $3,113.3 million, respectively, an increase of $1,641.0 million, or 52.7%. The increase in net sales was primarily due to the addition of Alon financial results as a result of the Delek/Alon Merger, which contributed net sales of $970.5 million during the nine months ended September 30, 2017, and the effects of increases in the price of finished petroleum products at our refineries, combined with increases in sales volumes in our refining and logistics segments during the nine months ended September 30, 2017, compared to the same period in 2016.
Cost of Goods Sold
Cost of goods sold was $4,181.6$24.2 million for the nine months ended September 30, 2017,2021 and 2020, respectively. We eliminate this intercompany revenue in consolidation.
Cost of Materials and Other
Q3 2021 vs. Q3 2020
Cost of materials and other increased by $1,161.2 million, or 78.5%, in the third quarter of 2021 compared to $2,806.7 millionthe third quarter of 2020, primarily driven by the following:
•increases in the cost of WTI Cushing crude oil, from an average of $40.88 per barrel to an average of $70.54, or 72.6%;
•increases in the cost of WTI Midland crude oil, from an average of $41.03 per barrel to an average of $70.74, or 72.4%;
•increase in RINs costs from an average cost per RIN of $0.47 and $0.67 for ethanol and biodiesel RINs, respectively during the nine months ended September 30, 2016, third quarter of 2020 to and average of $1.41 and $2.40 during the third quarter of 2021; and
Management's Discussion and Analysis
•an increase in sales volumes.
YTD 2021 vs. YTD 2020
Cost of $1,374.9materials and other increased by $2,295.5 million, or 49.0%. The increase in cost of goods sold primarily related to the addition of Alon financial results as a result of the Delek/Alon Merger, which contributed cost of goods sold of $789.9 million53.2%, during the nine months ended September 30, 2017, and the increase in the cost of both crude oil feedstocks at the refineries and refined products in the logistics segment, as well as increases in sales volumes in our refining and logistics segments, partially offset by the $47.5 million reduction in RINs expense associated with the RINs waiver received by the El Dorado refinery in the first quarter of 2017.
Operating Expenses
Operating expenses were $276.5 million for2021 compared to the nine months ended September 30, 2017 compared2020, primarily driven by the following:
•increases in the cost of WTI Cushing crude oil, from an average of $38.95 per barrel to $187.8 millionan average of $65.06, or 67.0%;
•increases in the cost of WTI Midland crude oil, from an average of $38.98 per barrel to an average of $65.48, or 68.0%; and
•increases in RINs costs from an average cost per RIN of $0.37 and $0.56 for the nine months ended September 30, 2016, an increase of $88.7 million, or 47.2%. The increase in operating expenses was primarily due to the addition of Alon financial results as a result of the Delek/Alon Merger, which contributed operating expenses of $87.9 millionethanol and biodiesel RINs, respectively during the nine months ended September 30, 2017.
General2020 to an average of $1.37 and Administrative Expenses
General and administrative expenses were $115.8 million and $77.5 million for the nine months ended September 30, 2017 and 2016, respectively, an increase of $38.3 million, or 49.4%. The increase was primarily due to the addition of Alon financial results as a result of the Delek/Alon Merger, which contributed general and administrative expenses of $20.7 million$2.24 during the nine months ended September 30, 2017, as well as2021.
These increases were partially offset by the following:
•the benefit (expense) of $29.9 million related transaction costs incurredto the change in pre-tax inventory valuation recognized during the nine months ended September 30, 2017.
In connection with the Merger, we assumed Alon's existing post-retirement benefit plans and recorded the net unfunded pension obligations as part of the purchase price allocation. During the third quarter of 2017, we elected2021 compared to freeze certain of the plans, resutlting in the recognition of a gain due to curtailment of $6.1$(65.8) million recognized during the nine months ended September 30, 2017. Net periodic benefit costs is included2020;
•a decrease in generalsales volumes; and administrative expenses
•a decrease in the accompanying condensed consolidated statements of income. See Note 18 of the condensed consolidated financial statements in Item 1, Financial Statements, for additional information about our defined benefit pension plans.
Depreciation and Amortization
Depreciation and amortization was $105.4hedging losses to $38.1 million compared to $86.6 million for the the nine months ended September 30, 2017 and 2016, respectively, an increase of $18.8 million, or 21.7%. The increase in depreciation expense was primarily attributable due to the addition of Alon property, plant and equipment $1,183.1 million (at preliminary fair value) and amortizable intangibles of $51.0 million(at preliminary fair value) as a result of the Delek/Alon Merger and other capital expenditures and acquisitions completed to date in 2017 as compared to 2016. The acquisition of Alon contributed $15.7 million in additional depreciation and amortization during the the nine months ended September 30, 2017.
Interest Expense
Interest expense was $62.5 million compared to $40.7 million for the nine months ended September 30, 2017 and 2016, respectively, an increase of $21.8 million, or 53.6%. The increase was primarily attributable to the addition of assumed debt totaling $568.0 million (at fair value) in connection with the Delek/Alon Merger and increases in the weighted average interest rate under our credit facilities.
Results from Equity Method Investments
During the nine months ended September 30, 2017, we recognized income from equity method investments of $9.7 million, compared to loss of $33.7 million for the nine months ended September 30, 2016. Changes in the results from equity method investments for the nine months ended September 30, 2017 and 2016 were primarily attributable to our the fact that we no longer have an equity method investment in Alon during the third quarter of September 30, 2017. We recognized our proportionate share of the net income from our investment in Alon of $4.5 million, net of $1.3 million in amortization of the excess of our investment over our equity in the underlying net assets of Alon for the nine months ended September 30, 2017, as compared to our proportionate share of the net loss from our investment in Alon of $31.0 million and $2.0 million in amortization of the excess of our investment over our equity in the underlying net assets of Alon for the nine months ended September 30, 2016. Additionally, the increase is also attributable to our proportionate share of net income for equity method investments owned by Alon and acquired by Delek in connection with the Merger.
Loss on Impairment of Equity Method Investment
We recorded an impairment charge of $245.3 million on our equity method investment in the nine months ended September 30, 2016, due to our determination that the decline in the market value of our ALJ Shares was other than temporary. There was no impairment recognized in the nine months ended September 30, 2017.
Gain on Remeasurement of Equity Method Investment
We recorded a gain of $190.1 million on our equity method investment in Alon during the nine months ended September 30, 2017, due2021 as compared to the remeasurement of the investment in connection with the Merger, where the remeasured pre-existing non-controlling
interest is included as part of the purchase price consideration in recording the acquisition of Alon, net of the reversal of the other comprehensive income previously recorded related to the equity method investment in Alon.
Income Taxes
Under ASC 740, Income Taxes (“ASC 740”), companies are required to apply an estimated annual tax rate to interim period results on a year-to-date basis; however, the estimated annual tax rate should not be applied to interim financial results if a reliable estimate cannot be made. In this situation, the interim tax rate should be based on actual year-to-date results. Based on our current projections, which have fluctuated as a result of changes in oil prices and related crack spread, we believe that using actual year-to-date results to compute our effective tax rate will produce a more reliable estimate of our tax expense for$63.5 million recognized during the nine months ended September 30, 2017. As such, in contrast with our previous methods of recording income tax expense, we recorded a tax provision for the nine months ended September 30, 2017 based on actual year-to-date results, in accordance with ASC 740.2020.
Income tax expense was $111.5 million for the nine months ended September 30, 2017, compared to income tax benefit of $136.8 million for the nine months ended September 30, 2016, an increase in expense of $248.3 million. The increase in expense was primarily attributable to pre-tax income of $213.1 million compared to pre-tax loss of $324.5 million for the nine months ended September 30, 2017 and 2016, respectively. Our effective tax rate was 52.3% compared to 42.2% for the for the nine months ended September 30, 2017 and 2016, respectively. The increase in our effective tax rate was primarily due to the the reversal of the deferred tax asset related to the equity method investment in Alon.
Operating Segments
We report operating results in three reportable segments: refining, logistics and retail. Decisions concerning the allocation of resources and assessment of operating performance are made based on this segmentation. Management measures the operating performance of each of its reportable segments based on the segment contribution margin.
Refining Segment
The tables and charts below set forth certain information concerning our refining segment operations ($ in millions, except per barrel amounts):
|
| | | | | | | | | | | | | | | | |
| | | Three Months Ended September 30, | | Nine Months Ended September 30, |
| | | 2017 | | 2016 | | 2017 | | 2016 |
| Net sales | | $ | 2,113.8 |
| | $ | 1,013.2 |
| | $ | 4,366.3 |
| | $ | 2,918.2 |
|
| Cost of goods sold | | 1,823.2 |
| | 923.7 |
| | 3,888.5 |
| | 2,675.1 |
|
| Gross margin | | 290.6 |
| | 89.5 |
| | 477.8 |
| | 243.1 |
|
| Operating expenses | | 110.5 |
| | 51.7 |
| | 212.9 |
| | 159.6 |
|
| Insurance proceeds — business interruption | | — |
| | — |
| | — |
| | (42.4 | ) |
| Contribution margin | | $ | 180.1 |
| | $ | 37.8 |
| | $ | 264.9 |
| | $ | 125.9 |
|
|
| | | | | | | | | | | | | | | | |
| Refining Segment | | Three Months Ended September 30, | | Nine Months Ended September 30, |
| | | 2017 | | 2016 | | 2017 | | 2016 |
| Tyler, TX Refinery | | (Unaudited) | | (Unaudited) |
| Days in period | | 92 |
| | 92 |
| | 273 |
| | 274 |
|
Total sales volume (average barrels per day)(1) | | 77,719 |
| | 72,456 |
| | 73,865 |
| | 73,055 |
|
| Products manufactured (average barrels per day): | | | | | | | | |
| Gasoline | | 42,448 |
| | 38,909 |
| | 39,313 |
| | 38,192 |
|
| Diesel/Jet | | 30,192 |
| | 27,215 |
| | 28,474 |
| | 27,836 |
|
| Petrochemicals, LPG, NGLs | | 2,052 |
| | 3,195 |
| | 2,422 |
| | 2,760 |
|
| Other | | 1,797 |
| | 1,483 |
| | 1,668 |
| | 1,561 |
|
| Total production | | 76,489 |
| | 70,802 |
| | 71,877 |
| | 70,349 |
|
| Throughput (average barrels per day): | | | | | | | | |
| Crude Oil | | 71,898 |
| | 68,954 |
| | 67,157 |
| | 67,462 |
|
| Other feedstocks | | 6,750 |
| | 2,945 |
| | 6,108 |
| | 3,723 |
|
| Total throughput | | 78,648 |
| | 71,899 |
| | 73,265 |
| | 71,185 |
|
| Per barrel of sales: | | | | | | | | |
| Tyler refining margin | | $ | 13.63 |
| | $ | 8.10 |
| | $ | 8.07 |
| | $ | 7.56 |
|
| Direct operating expenses | | $ | 3.39 |
| | $ | 3.56 |
| | $ | 3.62 |
| | $ | 3.69 |
|
| Crude Slate: (% based on amount received in period) | | | | | | | | |
| WTI crude oil | | 83 | % | | 82 | % | | 81 | % | | 82 | % |
| East Texas crude oil | | 17 | % | | 18 | % | | 18 | % | | 18 | % |
| | | | | | | | | |
| El Dorado, AR Refinery | | | | | | | | |
| Days in period | | 92 |
| | 92 |
| | 273 |
| | 274 |
|
Total sales volume (average barrels per day)(2) | | 84,610 |
| | 76,893 |
| | 81,679 |
| | 78,863 |
|
| Products manufactured (average barrels per day): | | | | | | | | |
| Gasoline | | 37,267 |
| | 39,120 |
| | 37,853 |
| | 40,545 |
|
| Diesel | | 28,610 |
| | 27,367 |
| | 27,373 |
| | 27,046 |
|
| Petrochemicals, LPG, NGLs | | 1,776 |
| | 1,325 |
| | 1,728 |
| | 957 |
|
| Asphalt | | 6,741 |
| | 5,836 |
| | 6,671 |
| | 4,744 |
|
| Other | | 1,255 |
| | 1,298 |
| | 1,087 |
| | 1,039 |
|
| Total production | | 75,649 |
| | 74,946 |
| | 74,712 |
| | 74,331 |
|
| Throughput (average barrels per day): | | |
| | |
| | |
| | |
|
| Crude Oil | | 74,733 |
| | 72,578 |
| | 74,098 |
| | 72,652 |
|
| Other feedstocks | | 2,734 |
| | 3,639 |
| | 1,908 |
| | 3,261 |
|
| Total throughput | | 77,467 |
| | 76,217 |
| | 76,006 |
| | 75,913 |
|
| Per barrel of sales: | | |
| | |
| | |
| | |
|
| El Dorado refining margin | | $ | 7.48 |
| | $ | 4.26 |
| | $ | 7.94 |
| | $ | 3.77 |
|
| Direct operating expenses | | $ | 3.68 |
| | $ | 3.73 |
| | $ | 3.58 |
| | $ | 3.75 |
|
| Crude Slate: (% based on amount received in period) | | | | | | | | |
| WTI crude oil | | 62 | % | | 64 | % | | 63 | % | | 67 | % |
| Local Arkansas crude oil | | 11 | % | | 21 | % | | 11 | % | | 21 | % |
| Other | | 27 | % | | 15 | % | | 26 | % | | 12 | % |
|
| | | | |
| Refining Segment | | Three Months Ended September 30, |
| | | 2017 |
| Big Spring, TX Refinery (acquired on July 1, 2017) | | (Unaudited) |
| Days in period | | 92 |
|
Total sales volume (average barrels per day) (3) | | 74,357 |
|
| Products manufactured (average barrels per day): | | |
| Gasoline | | 35,990 |
|
| Diesel/Jet | | 27,001 |
|
| Petrochemicals, LPG, NGLs | | 2,956 |
|
| Asphalt | | 1,213 |
|
| Other | | 2,196 |
|
| Total production | | 69,356 |
|
| Throughput (average barrels per day): | | |
| Crude Oil | | 69,117 |
|
| Other feedstocks | | 605 |
|
| Total throughput | | 69,722 |
|
| Per barrel of sales: | | |
| Big Spring refining margin | | $ | 11.71 |
|
| Direct operating expenses | | $ | 3.88 |
|
| Crude Slate: (% based on amount received in period) | | |
| WTI crude oil | | 75 | % |
| WTS crude oil | | 25 | % |
| | | |
| Krotz Springs, LA Refinery (acquired on July 1, 2017) | | |
| Days in period | | 92 |
|
| Total sales volume (average barrels per day) | | 71,129 |
|
| Products manufactured (average barrels per day): | | |
| Gasoline | | 32,383 |
|
| Diesel/Jet | | 21,792 |
|
| Heavy Oils | | 6,202 |
|
| Other | | 7,743 |
|
| Total production | | 68,120 |
|
| Throughput (average barrels per day): | | |
|
| Crude Oil | | 68,998 |
|
| Other feedstocks | | (706 | ) |
| Total throughput | | 68,292 |
|
| Per barrel of sales: | | |
|
| Krotz Springs refining margin | | $ | 8.18 |
|
| Direct operating expenses | | $ | 4.08 |
|
| Crude Slate: (% based on amount received in period) | | |
| WTI Crude | | 46 | % |
| Gulf Coast Sweet Crude | | 54 | % |
| | | |
|
| | | | | | | | | | | | | | | | |
| Pricing statistics (average for the period presented): | | Three Months Ended September 30, | | Nine Months Ended September 30, |
| | | 2017 | | 2016 | | 2017 | | 2016 |
| | | (Unaudited) | | (Unaudited) |
| | | | | | | | | |
| WTI — Cushing crude oil (per barrel) | | $ | 48.16 |
| | $ | 44.88 |
| | $ | 49.31 |
| | $ | 41.40 |
|
| WTI — Midland crude oil (per barrel) | | $ | 47.37 |
| | $ | 45.17 |
| | $ | 48.78 |
| | $ | 41.21 |
|
WTS -- Midland crude oil (per barrel) (4) | | $ | 47.19 |
| | $ | 43.41 |
| | $ | 48.16 |
| | $ | 40.57 |
|
LLS (per barrel) (4) | | $ | 51.62 |
| | $ | 46.52 |
| | $ | 51.72 |
| | $ | 43.19 |
|
| Brent crude oil (per barrel) | | $ | 52.21 |
| | $ | 46.93 |
| | $ | 52.49 |
| | $ | 43.21 |
|
| | | | | | | | | |
| US Gulf Coast 5-3-2 crack spread (per barrel) | | $ | 15.92 |
| | $ | 9.85 |
| | $ | 12.46 |
| | $ | 9.15 |
|
US Gulf Coast 3-2-1 crack spread (per barrel) (4) | | $ | 20.16 |
| | $ | 13.16 |
| | $ | 16.20 |
| | $ | 12.25 |
|
US Gulf Coast 2-1-1 crack spread (per barrel) (4) | | $ | 13.63 |
| | $ | 9.21 |
| | $ | 11.30 |
| | $ | 8.28 |
|
| | | | | | | | | |
| US Gulf Coast Unleaded Gasoline (per gallon) | | $ | 1.58 |
| | $ | 1.35 |
| | $ | 1.52 |
| | $ | 1.26 |
|
| Gulf Coast Ultra low sulfur diesel (per gallon) | | $ | 1.62 |
| | $ | 1.37 |
| | $ | 1.55 |
| | $ | 1.25 |
|
| US Gulf Coast high sulfur diesel (per gallon) | | $ | 1.44 |
| | $ | 1.23 |
| | $ | 1.40 |
| | $ | 1.12 |
|
| Natural gas (per MMBTU) | | $ | 2.95 |
| | $ | 2.79 |
| | $ | 3.05 |
| | $ | 2.35 |
|
| |
(1) | Total sales volume includes 869 and 851 bpd sold to the logistics segment during the three and nine months ended September 30, 2017, respectively, and 114 and 686 bpd during the three and nine months ended September 30, 2016, respectively. Total sales volume also includes sales of 350 and 121 bpd of intermediate and finished products to the El Dorado refinery during the three and nine months ended September 30, 2017, respectively, and 885 and 659 bpd during the three and nine months ended September 30, 2016, respectively. Total sales volume also includes 49 bpd of produced finished product sold to the Alon Partnership during the three months ended September 30, 2017. Total sales volume excludes 3,038 and 4,536 bpd of wholesale activity during the three and nine months ended September 30, 2017, respectively, and 1,778 and 843 during the three and nine months ended September 30, 2016, respectively. |
| |
(2) | Total sales volume includes 460 and 674 bpd of produced finished product sold to the Tyler refinery during the three and nine months ended September 30, 2017, respectively, and includes 996 bpd of produced finished product sold to Alon Asphalt Company during the three months ended September 30, 2017. There were no produced finished products sold to the Tyler refinery during the three and nine months ended September 30, 2016. Total sales volume excludes 23,921 and 19,236 bpd of wholesale activity during the three and nine months ended September 30, 2017, respectively, and 19,671 and 21,606 bpd during the three and nine months ended September 30, 2016, respectively. |
| |
(3) | Total sales volume includes 14,071 bpd sold to the retail segment during the three months ended September 30, 2017.
|
| |
(4) | For our Tyler and El Dorado refineries, we compare our per barrel refining product margin to the Gulf Coast 5-3-2 crack spread consisting of WTI Cushing crude, U.S. Gulf Coast CBOB and U.S, Gulf Coast Pipeline No. 2 heating oil (high sulfur diesel). For our Big Spring refinery, we compare our per barrel refined product margin to the Gulf Coast 3-2-1 crack spread consisting of WTI Cushing crude, Gulf Coast 87 Conventional gasoline and Gulf Coast ultra low sulfur diesel, and for our Krotz Springs refinery, we compare our per barrel refined product margin to the Gulf Coast 2-1-1 crack spread consisting of LLS crude oil, Gulf Coast 87 Conventional gasoline and U.S, Gulf Coast Pipeline No. 2 heating oil (high sulfur diesel). The Tyler refinery's crude oil input is primarily WTI Midland and east Texas, while the El Dorado refinery's crude input is primarily combination of WTI Midland, local Arkansas and other domestic inland crude oil. The Big Spring refinery’s crude oil input is primarily comprised of WTS and WTI Midland. The Krotz Springs refinery’s crude oil input is primarily comprised of LLS and WTI Midland. The Big Spring and Krotz Springs refineries were acquired July 1, 2017 as part of the Delek/Alon Merger, so Gulf Coast 3-2-1 and 2-1-1 crack spreads, LLS and WTS statistics are presented only for the period Delek owned these refineries. |
Refining Segment Operational Comparison of the Three Months Ended September 30, 2017 versus the Three Months Ended September 30, 2016
Net Sales
Net sales for the refining segment were $2,113.8 million for the third quarter of 2017 compared to $1,013.2 million for the third quarter of 2016, an increase of $1,100.6 million, or 108.6%. The increase in net sales primarily resulted from the addition of the Big Spring and Krotz Springs refineries in connection with the Delek/Alon Merger, which contributed 74,357 and 71,129 average barrels sold per day, respectively, to the third quarter of 2017, combined with increases in refined product sales prices, including unleaded gasoline, Ultra-Low-Sulfur diesel ("ULSD"), and High-Sulfur diesel ("HSD") and increases in sales volumes at the Tyler and El Dorado refineries. The refineries were favorably impacted by reduced supply caused by hurricane activity that occurred during the third quarter of 2017.
Cost of Goods Sold
Cost of goods sold for the third quarter of 2017 for the refining segment was $1,823.2 million compared to $923.7 million for the third quarter of 2016, an increase of $899.5 million, or 97.4%. This increase was primarily attributable to the increase in sales volumes
associated with the addition of the Big Spring and Krotz Springs refineries in connection with the Delek/Alon Merger and increased sales volumes at the Tyler and El Dorado refineries, combined with an increase in the cost of WTI - Cushing crude oil, from an average of $44.88 per barrel in the third quarter of 2016 to an average of $48.16 in the third quarter of 2017, and an increase in the cost of WTI - Midland crude oil per barrel from an average of $44.57 per barrel in the third quarter of 2016 to an average of $47.37 in the third quarter of 2017.
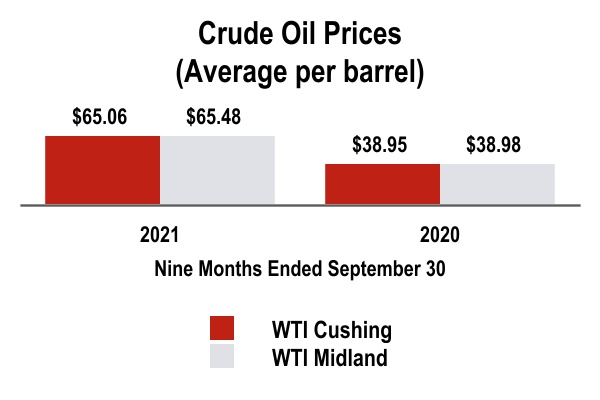
Our refining segment purchases finished product from our logistics segment and has multiple service agreements with our logistics segment which, among other things, require the refining segment to pay terminalling and storage fees based on the throughput volume of crude and finished product in the logistics segment pipelines and the volume of crude and finished product stored in the logistics segment storage tanks.tanks, subject to minimum volume commitments. These costs and fees were $33.3$109.3 million and $30.4$92.4 million during the third quarters of 20172021 and 2016,2020, respectively, and $307.0 million and $288.3 million during the nine months ended September 30, 2021 and 2020, respectively. We eliminate these intercompany fees in consolidation.
Operating expenses for the refining segment were $110.5 million for the third quarter of 2017 compared to $51.7 million for the third quarter of 2016, an increase of $58.8Refining Margin
Q3 2021 vs. Q3 2020
Refining margin increased by $89.9 million, or 113.7%. The increase in operating expenses was primarily due to the addition of the Big Spring and Krotz Springs refineries in connection with the Delek/Alon Merger.
Contribution Margin
Contribution margin for the refining segment increased to $180.1 million, or 90.0% of our consolidated segment contribution margin,106.6%, in the third quarter of 2017,2021 compared to $37.8 million, or 70.9% of our consolidated segment contribution margin, in the third quarter of 2016. The refining segment contribution margin increase was2020, primarily attributable todriven by the addition offollowing:
•a 163.7% improvement in the Big Spring5-3-2 crack spread (the primary measure for the Tyler refinery and Krotz Springs refineries in connection with the Delek/Alon Merger, combined with the 61.6%El Dorado refinery), a 142.0% improvement in the average Gulf Coast 5-3-23-2-1 crack spread (the primary measure for the Big Spring refinery), and a 239.3% improvement in the average Gulf Coast 2-1-1 crack spread (the primary measure for the Krotz Springs refinery).
Such increase was partially offset by the following:
• increases in average RINs costs in the third quarter of 2017 as2021 compared to the third quarter of 2016 which favorably impacted our2020; and
•a $13.5 million decrease in hedging gains.
Management's Discussion and Analysis
YTD 2021 vs. YTD 2020
Refining margin increased by $306.5 million, or 567.6%, in the nine months ended September 30, 2021 compared to the nine months ended September 30, 2020, primarily driven by the following:
•a 102.4% improvement in the 5-3-2 crack spread (the primary measure for the Tyler refinery and El Dorado refineries. Partially offsetting our contribution marginrefinery), a 96.5% improvement in the average Gulf Coast 3-2-1 crack spread (the primary measure for the Big Spring refinery), and a 108.5% improvement in the average Gulf Coast 2-1-1 crack spread (the primary measure for the Krotz Springs refinery);
•a $25.4 million decrease in hedging losses; and
•an increase in reversal benefit of inventory valuation reserve of during the during the nine months of 2021 compared to the prior year period.
These increases were partially offset by the following:
•increases in average RINs costs during the nine months ended September 30, 2021 compared to the nine months ended September 30, 2020; and
•a 20.4% increase purchased product volumes sold, while overall sales volumes decreased.
Management's Discussion and Analysis
Operating Expenses
Q3 2021 vs. Q3 2020
Operating expenses decreased by $19.3 million, or 18.9%, in the third quarter of 2017 was the recognition of the inventory fair value adjustment associated with purchase accounting as an increase in cost of goods sold during that period totaling $33.2 million, as the inventory acquired was sold.
Margins at the Tyler and El Dorado refineries were positively impacted in the third quarter of 20172021 compared to the third quarter of 20162020, primarily driven by the following:
•a one-time favorable adjustment of $14.0 million in the current period to reflect the cumulative error correction to capitalize manufacturing overhead in refining finished goods inventory; and
• insurance recoveries of $17.0 million related to losses associated with Winter Storm Uri.
Such decreases were offset by the 61.6%following:
•an increase in the average Gulf Coast 5-3-2 crack spreadvariable expenses due to natural gas pricing increases in the third quarter of 20172021; and
•increases at our Krotz Spring refinery due to additional costs incurred as a result of Hurricane Ida, and higher operating expenses due to slurry operations which did not exist in the third quarter of 2020.
YTD 2021 vs. YTD 2020
Operating expenses increased by $7.7 million, or 2.5%, during the nine months ended September 30, 2021 compared to the nine months ended September 30, 2020, primarily driven by the following:
•an increase in outside services, maintenance and lease costs primarily due to continued repairs and equipment rentals related to Winter Storm Uri;
•an increase in Big Spring variable costs due to the refinery being shut down for turnaround activities during the first and second quarters of 2020;
Management's Discussion and Analysis
•an increase in utilities costs primarily associated with higher natural gas costs during the February 2021 related to Winter Storm Uri and pricing increases in the third quarter of 2021.
Such increases were offset by the following:
•a one-time favorable adjustment of $14.0 million in the third quarter of 2021 to reflect the cumulative error correction to capitalize manufacturing overhead in refining finished goods inventory; and
• insurance recoveries of $17.0 million related to losses associated with Winter Storm Uri.
Contribution Margin
Q3 2021 vs. Q3 2020
Contribution margin increased by $109.2 million, or a 4.4% improvement in contribution margin percentage, in the third quarter of 2021 compared to the third quarter of 2016, as well as improvements2020, primarily driven by the following:
•an increase in the WTI Cushing/Brent discount of 97.56% and in the WTI Cushing/WTI Midland discount of 154.8% in the third quarter of 2017 as compared to the third quarter of 2016,refining margin primarily driven by improved crack spreads, partially offset by higher average RINs costs and a decrease in hedging gains; and
•a decrease in operating expenses in the third quarter of 2017 as compared to the third quarter of 2016.$19.3 million, or 18.9%.
Refining Segment Operational Comparison of the Nine Months Ended September 30, 2017 versus the Nine Months Ended September 30, 2016YTD 2021 vs. YTD 2020
Net Sales
Net sales for the refining segment were $4,366.3Contribution margin increased by $298.8 million for the nine months ended September 30, 2017 compared to $2,918.2 million for the nine months ended September 30, 2016, an increase of $1,448.1 million, or 49.6%. Significant contributors to the increase in net sales included the addition of the Big Spring and Krotz Springs refineries in connection with the Delek/Alon Merger in the third quarter of 2017, as well as increases in the price of both U.S. Gulf Coast gasoline, ULSD and HSD in the nine months ended September 30, 2017 as2021 compared to the nine months ended September 30, 2016.2020, primarily driven by the following:
Cost of Goods Sold
Cost of goods sold for the refining segment for the nine months ended September 30, 2017 was $3,888.5 million, compared to $2,675.1 million for the nine months ended September 30, 2016, an increase of $1,213.4 million, or 45.4%. This increase was primarily attributable to the addition of the Big Spring and Krotz Springs refineries in connection with the Delek/Alon Merger in the third quarter of 2017, combined with •an increase in refining margin primarily driven by an overall increase in the cost of WTI - Cushing crude oil from an average of $41.40 per barrel for the nine months ended September 30, 2016 to an average of $49.31 during the nine months ended September 30, 2017, andcrack spreads, an increase in the cost of WTI - Midland crude oil, from an average of $41.21 per barrel for the nine months ended September 30, 2016reversal benefit related to an
average of $48.78 for the nine months ended September 30, 2017. These increases wereinventory valuation reserves and decrease in hedging losses, partially offset by the $47.5 million reductionhigher percentage of purchased product sold and increase in average RINs expense associated with the RINs waiver receivedcost.
Such increase was offset by the El Dorado refinery in the first quarter of 2017.following:
Our refining segment has multiple service agreements with our logistics segment which, among other things, require the refining segment to pay terminalling and storage fees based on the throughput volume of crude and finished product in the logistics segment pipelines and the volume of crude and finished product stored in the logistics segment storage tanks. These fees were $97.5 million and $92.1 million during the nine months ended September 30, 2017 and 2016, respectively. We eliminate these intercompany fees in consolidation.
Operating Expenses
Operating expenses for the refining segment were $212.9 million for the nine months ended September 30, 2017 compared to $159.6 million for the nine months ended September 30, 2016, •an increase of $53.3 million, or 33.4%. The increase in operating expenses was primarily due to the addition of the Big Spring and Krotz Springs refineries in connection with the Delek/Alon Merger in the third quarter of 2017.
Contribution Margin
Contribution margin for the refining segment increased to $264.9$7.7 million, or 89.4% of our consolidated segment contribution margin, in the nine months ended September 30, 2017, compared to $125.9 million, or 78.1% of our consolidated segment contribution margin, in the nine months ended September 30, 2016.2.5%
The refining segment contribution margin increase was primarily attributable to the addition of the Big Spring and Krotz Springs refineries in connection with the Delek/Alon Merger in the third quarter of 2017, combined with the 36.2% improvement in the average Gulf Coast 5-3-2 crack spread in the nine months ended September 30, 2017 as compared to the nine months ended September 30, 2016, which favorably impacted the period-over-period margins at the El Dorado refinery, offset by business interruption insurance proceeds of $42.4 million associated with a settlement of litigation received in the first quarter of 2016 that did not recur in 2017. This increase was also favorably impacted by a reduction in RINs expense, primarily associated with the $47.5 million reduction in RINs expense associated with the RINs waiver received by the El Dorado refinery in the first quarter of 2017. Partially offsetting our contribution margin nine months ended September 30, 2017 was the recognition of the inventory fair value adjustment associated with purchase accounting as an increase in cost of goods sold during the third quarter of 2017 totaling $33.2 million, as the inventory acquired was sold.
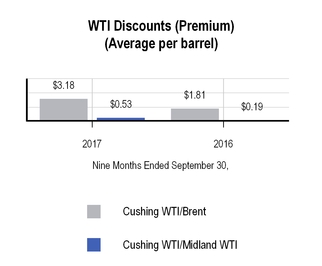
Margins at the Tyler and El Dorado refineries were positively impacted by the 36.2% increase in the Gulf Coast 5-3-2 crack spread in the nine months ended September 30, 2017, as compared to the nine months ended September 30, 2016, offset by losses on derivative positions of $1.6 million for the nine months ended September 30, 2017 compared to gains of $1.5 million for the nine months ended September 30, 2016, higher net inventory valuation losses during the nine months ended September 30, 2017, as compared to the nine months ended September 30, 2016 and a contango futures market during the nine months ended September 30, 2017.
Management's Discussion and Analysis
The table below sets forth certain information concerning our logistics segment operations ($ in millions, except per barrel amounts):
| | | | | | | | | | | | | | | | | | | | | | | | | | |
| Logistics Contribution Margin and Operating Information |
| | Three Months Ended | | Nine Months Ended |
| | September 30, | | September 30, |
| | 2021 | | 2020 | | 2021 | | 2020 |
| Net revenues | | $ | 189.6 | | | $ | 142.2 | | | $ | 511.0 | | | $ | 423.3 | |
| Cost of materials and other | | 105.1 | | | 60.7 | | | 275.0 | | | 205.9 | |
| Operating expenses (excluding depreciation and amortization) | | 17.3 | | | 14.3 | | | 46.9 | | | 41.5 | |
| Contribution margin | | $ | 67.2 | | | $ | 67.2 | | | $ | 189.1 | | | $ | 175.9 | |
| Operating Information: | | | | | | | | |
East Texas - Tyler Refinery sales volumes (average bpd) (1) | | 71,847 | | | 73,417 | | | 72,791 | | | 70,376 | |
| Big Spring wholesale marketing throughputs (average bpd) | | 81,880 | | | 78,659 | | | 76,680 | | | 73,701 | |
| | | | | | | | |
| West Texas wholesale marketing throughputs (average bpd) | | 10,560 | | | 9,948 | | | 10,033 | | | 11,718 | |
| West Texas wholesale marketing margin per barrel | | $ | 3.33 | | | $ | 3.42 | | | $ | 3.64 | | | $ | 2.37 | |
Terminalling throughputs (average bpd) (2) | | 144,355 | | | 160,843 | | | 142,959 | | | 145,240 | |
| Throughputs (average bpd): | | | | | | | | |
| Lion Pipeline System: | | | | | | | | |
| Crude pipelines (non-gathered) | | 81,929 | | | 78,244 | | | 60,344 | | | 76,750 | |
| Refined products pipelines to Enterprise Systems | | 62,263 | | | 55,740 | | | 42,733 | | | 55,315 | |
| SALA Gathering System | | 14,086 | | | 13,659 | | | 14,056 | | | 13,520 |
| East Texas Crude Logistics System | | 18,644 | | | 22,591 | | | 24,045 | | | 15,705 |
Big Spring Gathering Assets (3) | | 84,325 | | | 90,719 | | | 79,251 | | | 85,845 | |
| Plains Connection System | | 131,571 | | | 104,314 | | | 120,905 | | | 96,961 | |
| | | | | | | | |
|
| | | | | | | | | | | | | | | | |
| | | Three Months Ended September 30, | | Nine Months Ended September 30, |
| | | 2017 | | 2016 | | 2017 | | 2016 |
| Logistics Segment Contribution: | | | | | | | | |
| Net sales | | $ | 130.7 |
| | $ | 107.5 |
| | $ | 386.9 |
| | $ | 323.4 |
|
| Cost of goods sold | | 89.1 |
| | 73.5 |
| | 266.7 |
| | 213.4 |
|
| Gross margin | | 41.6 |
| | 34.0 |
| | 120.2 |
| | 110.0 |
|
| Operating expenses | | 10.7 |
| | 9.2 |
| | 31.0 |
| | 28.4 |
|
| Contribution margin | | $ | 30.9 |
| | $ | 24.8 |
| | $ | 89.2 |
| | $ | 81.6 |
|
| | | | | | | | | |
| Operating Information: | | | | | | | | |
East Texas - Tyler Refinery sales volumes (average bpd) (1) | | 74,357 |
| | 67,812 |
| | 71,917 |
| | 68,137 |
|
| West Texas wholesale marketing throughputs (average bpd) | | 12,929 |
| | 12,162 |
| | 13,647 |
| | 13,039 |
|
| West Texas wholesale marketing margin per barrel | | $ | 4.00 |
| | $ | 1.16 |
| | $ | 3.62 |
| | $ | 1.24 |
|
Terminalling throughputs (average bpd) (2) | | 127,229 |
| | 120,099 |
| | 123,780 |
| | 121,791 |
|
| Throughputs (average bpd) | | | | | | | | |
| Lion Pipeline System: | | | | | | | | |
| Crude pipelines (non-gathered) | | 60,247 |
| | 55,217 |
| | 59,653 |
| | 55,951 |
|
| Refined products pipelines to Enterprise Systems | | 51,623 |
| | 47,974 |
| | 50,933 |
| | 51,794 |
|
| SALA Gathering System | | 15,997 |
| | 17,237 | | 16,160 |
| | 18,172 |
| East Texas Crude Logistics System | | 15,260 |
| | 17,026 | | 15,006 |
| | 13,108 |
| El Dorado Rail Offloading Rack | | — |
| | — |
| | — |
| | — |
|
_____________________________
| |
(1)
| Excludes jet fuel and petroleum coke. |
(2)Consists of terminalling throughputs at our Tyler, Big Spring, Big Sandy and Mount Pleasant, Texas terminals, El Dorado and North Little Rock, Arkansas terminals and Memphis and Nashville, Tennessee terminals.(3)Prior-year period throughputs for the Big Spring Gathering Assets are for the 180 days we owned the assets following the Big Spring Gathering Assets Acquisition effective March 31, 2020.
| | |
(2)
| Consists of terminalling throughputs at our Tyler, Big Sandy and Mount Pleasant, Texas, El Dorado and North Little Rock, Arkansas, and Memphis and Nashville, Tennessee terminals. |
Logistics Segment Operational Comparison of the Three and Nine Months Ended September 30, 20172021 versus the Three and Nine Months Ended September 30, 20162020
Net SalesRevenues
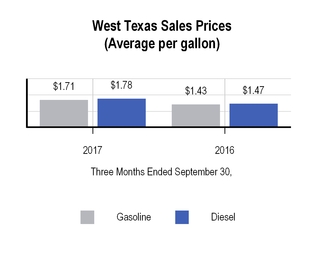
Net sales for the logistics segment were $130.7revenues increased by $47.4 million, or 33.3%, in the third quarter of 2017,2021 compared to $107.5 million for the third quarter of 2016, an 2020, primarily driven by the following:
•increased revenues at our Big Spring Refinery Crude Pipeline (the "BSR Crude Pipeline"), as a result of new contracts executed in the second quarter of 2020, which had higher throughput volumes during the third quarter of 2021 compared to the third quarter of 2020;
•increased revenues for the Trucking assets, due to higher volumes transported from El Dorado;
•increase in revenues for the Paline pipeline and Plains connection system, due to higher throughput volumes;
•increases in the average volumes of $23.2gasoline sold and in the average sales prices per gallon of gasoline and diesel sold in our West Texas marketing operations as follows:
◦the average sales prices of gasoline and diesel sold increased by $0.93 per gallon and $0.95 per gallon, respectively; and
◦the average volumes of gasoline sold increased by 2.9 million gallons, while diesel volumes sold decreased 0.5 million gallons.
Net revenues included sales to our refining segment of $109.3 million and $92.4 million for the three months ended September 30, 2021 and September 30, 2020, respectively, and sales to our other segment of $0.5 million and $0.4 million for the three months ended September 30, 2021 and 2020, respectively. We eliminate this intercompany revenue in consolidation.
Management's Discussion and Analysis
YTD 2021 vs. YTD 2020
Net revenues increased by $87.7 million, or 21.6%. The increase was20.7%, in the nine months ended September 30, 2021 compared to the nine months ended September 30, 2020, primarily attributabledriven by the following:
•increased revenues associated with agreements executed in connection with Big Spring Gathering System and Delek Trucking acquisitions, which were effective March 31, 2020 and May 1, 2020, respectively. Refer to Note 4 of the condensed consolidated financial statements in Item 1. Financial Statements, for additional information;
•increased revenues at our BSR Crude Pipeline, as a result of new contracts executed in the second quarter of 2020; and
•increases in the average sales prices per gallon of gasoline and diesel sold, partially offset by decreases in the average volumes of gasoline and in volumesdiesel sold in our westWest Texas marketing operations. Theoperations:
◦the average sales prices per gallon of gasoline and diesel sold increased $0.28$0.69 per gallon and $0.31$0.69 per gallon, respectively; and
◦the average volumes of gasoline sold decreased 10.7 million gallons, partially offset by a 9.0 million decrease of diesel gallons sold.
Such increases were partially offset by the following:
•decreases in throughputs due to the impact of the severe freezing conditions that affected most of the regions where we operate resulting in lower volumes outside of contractual minimum volume commitments during the nine months ended September 30, 2021 when compared to the nine months ended September 30, 2020.
•decreases in throughputs at the Paline pipeline due to scheduled pipeline maintenance.
Net revenues included sales to our refining segment of $307.0 million and $288.3 million for the nine months ended September 30, 2021 and 2020, respectively, duringand sales to our other segment of $1.4 million and $1.6 million for the nine months ended September 30, 2021 and 2020, respectively. We eliminate this intercompany revenue in consolidation.
Management's Discussion and Analysis
Cost of Materials and Other
Q3 2021 vs. Q3 2020
Cost of materials and other for the logistics segment increased $44.4 million, or 73.1%, in the third quarter of 20172021 compared to the third quarter of 2016. The net increase of gasoline and diesel volumes sold was 3.1 million gallons.2020 primarily driven by the following:
Net sales included $5.2 million and $4.1 million of net service fees paid by our refining segment to our logistics segment during the third quarter of 2017 and 2016, respectively. These service fees are based on the number of gallons sold and a shared portion of the margin achieved in return for providing sales and customer support services. Net sales also included crude and refined product transportation, terminalling and storage fees paid by our refining segment to our logistics segment. These fees were $33.3 million and $30.4 million in the third quarter of 2017 and 2016, respectively. The logistics segment also sold $1.4 million and $1.8 million of RINs to the refining segment in the third quarter of 2017 and 2016, respectively. These intercompany sales and fees are eliminated in consolidation.
Cost of Goods Sold
Cost of goods sold for the logistics segment increased $15.6 million, or 21.2%, to $89.1 million in the third quarter of 2017, compared to $73.5 million in the third quarter of 2016. The increase in cost of goods sold was primarily attributable to •increases in the average cost per gallon of gasoline and diesel sold, and increases in volumes purchasedthe volume of gasoline sold in our westWest Texas marketing operations. Theoperations:
◦the average cost per gallon of gasoline and diesel purchasedsold increased $0.18$1.01 per gallon and $0.22$0.96 per gallon, respectively, during respectively; and
◦the third quarter of 2017 compared to the third quarter of 2016. The net increaseaverage volumes of gasoline andincreased by 2.9 million gallons, while diesel volumes sold was 3.1decreased by 0.5 million gallons.
Operating ExpensesOur logistics segment purchased product from our refining segment of $89.9 million and $45.1 million for the three months ended September 30, 2021 and September 30, 2020, respectively. We eliminate these intercompany costs in consolidation.
Operating expensesYTD 2021 vs. YTD 2020
Cost of materials and other for the logistics segment were approximately $10.7 million and $9.2 million for the third quarter of 2017 and 2016, respectively, an increase of $1.5increased $69.1 million, or 16.3%. The increase33.6%, in operating expenses was primarily due to increases in maintenance and labor costs associated with certain of our tanks and pipelines as a result of planned maintenance activity and increased usage due to additional customers using our pipeline assets.
Contribution Margin
Contribution margin for the logistics segment for the third quarter of 2017 was $30.9 million, or 15.4% of our consolidated segment contribution margin, compared to $24.8 million, or 46.5% of our consolidated segment contribution margin, in the third quarter of 2016, an increase of $6.1 million, or 24.6%. The increase in contribution margin was primarily attributable to improved contribution margin in our west Texas operations as a result of continued increased drilling activity in the region, which has improved market conditions and increased demand. Additionally, contribution margin in our west Texas operations benefited from higher margins during a period of product supply disruptions associated with Hurricane Harvey. Also contributing to the increase in contribution margin were increased fees associated with Delek Logistics' marketing agreement with Delek and our Paline Pipeline as a result of increased throughput and sales to third parties, respectively.
Logistics Segment Operational Comparison of the Nine Months Ended September 30, 2017 versus the Nine Months Ended September 30, 2016
Net Sales
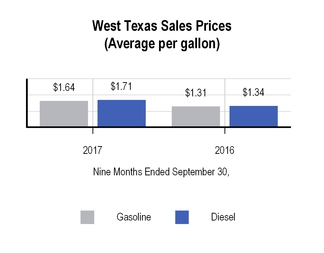
Net sales for the logistics segment were $386.9 million during the nine months ended September 30, 2017, compared to $323.4 million during the nine months ended September 30, 2016, an increase of $63.5 million, or 19.6%. The increase was primarily attributable to increases in the average sales prices per gallon of gasoline and diesel and in volumes sold in our west Texas marketing operations. The average sales prices per gallon of gasoline and diesel sold increased $0.33 per gallon and $0.37 per gallon, respectively, during the nine months ended September 30, 20172021 compared to the nine months ended September 30, 2016. Gallons of gasoline and diesel sold in west Texas increased 3.6 million gallons and 3.0 million gallons, respectively, during2020 primarily driven by the nine months ended September 30, 2017 compared to the nine months ended September 30, 2016. Partially offsetting the increase was a decline in fees on our Paline Pipeline System. During the nine months ended September 30, 2017, the Paline Pipeline System was a FERC regulated pipeline with a tariff established for potential shippers, compared to the nine months ended September 30, 2016, when the pipeline capacity was under contract with two third parties for a monthly fee.following:
Net sales included $14.8 million and $12.2 million of net service fees paid by our refining segment to our logistics segment during the nine months ended September 30, 2017 and 2016, respectively. These service fees are based on the number of gallons sold and a shared portion of the margin achieved in return for providing sales and customer support services. Net sales also included crude and refined product transportation, terminalling and storage fees paid by our refining segment to our logistics segment. These fees were $97.5 million and $92.1 million in the nine months ended September 30, 2017 and 2016, respectively. The logistics segment also sold $3.9 million and $4.7 million of RINs to the refining segment in the nine months ended September 30, 2017 and 2016, respectively. These intercompany sales and fees are eliminated in consolidation.
Cost of Goods Sold
Cost of goods sold for the logistics segment increased $53.3 million, or 25.0%, to $266.7 million in the nine months ended September 30, 2017, compared to $213.4 million in the nine months ended September 30, 2016. The increase in cost of goods sold was primarily attributable to •increases in the average cost per gallon of gasoline and diesel sold, partially offset by decreases in the average volumes of gasoline and in volumes purchaseddiesel sold in our westWest Texas marketing operations. Theoperations:
◦the average cost per gallon of gasoline and diesel purchasedsold increased $0.28$0.75 per gallon and $0.31$0.68 per gallon, respectively, duringrespectively; and
◦the average volumes of gasoline and diesel sold increased by 10.7 million gallons and 9.0 million gallons, respectively.
Our logistics segment purchased product from our refining segment of $229.8 million and $155.7 million for the nine months ended September 30, 2017,2021 and September 30, 2020, respectively. We eliminate these intercompany costs in consolidation.
Operating Expenses
Q3 2021 vs. Q3 2020
Operating expenses increased by $3.0 million, or 21.0%, in the third quarter of 2021 compared to the third quarter of 2020, driven by the following:
•increases in employee and outside service costs after cost cutting measures previously implemented to respond to the COVID-19 Pandemic, including delaying non-essential projects, ended;
•increase in energy costs, due to higher natural gas prices; and
•increases in utilities, maintenance and other variable expenses due to higher throughput.
YTD 2021 vs. YTD 2020
Operating expenses increased by $5.4 million, or 13.0%, in the nine months ended September 30, 2021 compared to the nine months ended September 30, 2016. Gallons2020, driven by the following:
•increases in employee and outside service costs after cost cutting measures implemented to respond to the COVID-19 Pandemic, including delaying non-essential projects, ended;
Management's Discussion and Analysis
•increase in energy costs due to higher natural gas prices;
•increases in variable expenses such as maintenance and materials costs due to higher throughput; and
•increases in utility costs as a result of gasoline and diesel purchasedsignificantly higher energy costs during the February 2021 severe freezing conditions that affected most of the regions where we operate.
Contribution Margin
Q3 2021 vs. Q3 2020
Contributionmarginremained stable at $67.2 million in west Texas the third quarter of 2021 compared to the third quarter of 2020 as increases in gross margin were offset by higher operating costs.
YTD 2021 vs. YTD 2020
Contributionmarginincreased 3.6by $13.2 million, gallons and 3.0 million gallons, respectively, duringor 7.5%, in the nine months ended September 30, 20172021 compared to the nine months ended September 30, 2016.2020, primarily driven by the following:
Operating Expenses
Operating expenses for the logistics segment were $31.0 million and $28.4 million for the nine months ended September 30, 2017 and 2016, respectively, •an increase in gross margin of $2.6 million, or 9.2%. The$1.27 per barrel in our West Texas marketing operations; and
•increases in revenues associated with agreements executed in connection with Big Spring Gathering System and Delek Trucking acquisitions.
Such increases were partially offset by the following:
•a decrease in gasoline and diesel volumes sold in our West Texas marketing operations; and
•an increase in operating expenses was primarily due to increases in labor and utilities costs associated with certain of our pipelines as a result of increased usage and higher maintenance costs associated with certain of our tanks at our tank farms. Partially offsetting these increases were a reduction in operating expenses for one of our terminal locations at which we incurred costs related to internal tank contamination during the nine months ended September 30, 2016 and decreases in maintenance costs at our Memphis Terminal.
Contribution Margin
Contribution margin for the logistics segment for the nine months ended September 30, 2017 was $89.2 million, or 30.1% of our consolidated segment contribution margin, compared to $81.6 million, or 50.6% of our consolidated segment contribution margin, for the nine months ended September 30, 2016, an increase of $7.6 million, or 9.3%. The increase in contribution margin was primarily attributable to improved contribution margin in our west Texas operations as a result of increased drilling activity in the region,
which has improved market conditions and increased demand. Additionally, contribution margin in our west Texas operations benefited from higher margins during a period of product supply disruptions associated with Hurricane Harvey. Also contributing to the increase were increased fees associated with our marketing agreement with Delek as a result of increased throughput, volume increases at our Nashville and Tyler Terminals and a reduction in operating expenses at our Memphis and El Dorado Terminals. Partially offsetting these increases was a decline in fees on our Paline Pipeline System as described above.
Management's Discussion and Analysis
The Retail Segment was not reported for the three and nine month periods ended September 30, 2016, or for periods in 2017 prior to July 1, 2017 (the date of the Delek/Alon Merger), as our previous Retail Entities had been discontinued, and the new Retail Segment was not acquired until July 1, 2017. The table below sets forth certain information concerning our retail segment operations ($(gross sales $ in millions, exceptmillions):
| | | | | | | | | | | | | | | | | | | | | | | | | | |
| Retail Contribution Margins |
| | Three Months Ended | | Nine Months Ended |
| | September 30, | | September 30, |
| | | 2021 | | 2020 | | 2021 | | 2020 |
| Net revenues | | $ | 206.5 | | | $ | 177.7 | | | $ | 590.3 | | | $ | 521.7 | |
| Cost of materials and other | | 165.2 | | | 136.3 | | | 466.4 | | | 400.0 | |
| Operating expenses (excluding depreciation and amortization) | | 23.4 | | | 23.1 | | | 67.2 | | | 66.8 | |
| Contribution margin | | $ | 17.9 | | | $ | 18.3 | | | $ | 56.7 | | | $ | 54.9 | |
| | | | | | | | |
| Operating Information |
| | | | | | |
| | | | | | |
| | | | | | | | |
| Number of stores (end of period) | | 250 | | | 253 | | | 250 | | | 253 | |
| Average number of stores | | 250 | | | 253 | | | 250 | | | 253 | |
| Average number of fuel stores | | 245 | | | 248 | | | 245 | | | 248 | |
| Retail fuel sales | | $ | 124.9 | | | $ | 90.9 | | | $ | 349.5 | | | $ | 273.8 | |
| Retail fuel sales (thousands of gallons) | | 41,912 | | | 45,096 | | | 124,655 | | | 135,471 | |
| Average retail gallons sold per average number of fuel stores (in thousands) | | 171 | | | 182 | | | 510 | | | 547 | |
| Average retail sales price per gallon sold | | $ | 2.98 | | | $ | 2.01 | | | $ | 2.80 | | | $ | 2.02 | |
Retail fuel margin ($ per gallon) (1) | | $ | 0.327 | | | $ | 0.311 | | | $ | 0.356 | | | $ | 0.352 | |
| Merchandise sales (in millions) | | $ | 81.7 | | | $ | 86.8 | | | $ | 240.9 | | | $ | 247.9 | |
| Merchandise sales per average number of stores (in millions) | | $ | 0.3 | | | $ | 0.3 | | | $ | 1.0 | | | $ | 1.0 | |
| Merchandise margin % | | 33.7 | % | | 31.6 | % | | 33.1 | % | | 31.3 | % |
| | | | | | | | |
| | | | | | | | |
| | | | | | | | |
| | | | | | | | |
| | | | | | | | |
| | | | | | | | |
| | | | | | | | | | | | | | | | | | | | | | | | | | |
Same-Store Comparison (2) |
| | Three Months Ended | | Nine Months Ended |
| | September 30, | | September 30, |
| | 2021 | | 2020 | | 2021 | | 2020 |
Change in same-store fuel gallons sold | | (5.9) | % | | (18.8) | % | | (9.6) | % | | (15.6) | % |
| | | | | | | | |
| Change in same-store merchandise sales | | (7.1) | % | | 8.7 | % | | (3.1) | % | | 8.8 | % |
(1)Retail fuel margin represents gross margin on fuel sales in the retail segment, and is calculated as retail fuel sales revenue less retail fuel cost of sales. The retail fuel margin per gallon amounts):calculation is derived by dividing retail fuel margin by the total retail fuel gallons sold for the period.
(2)Same-store comparisons include period-over-period changes in specified metrics for stores that were in service at both the beginning of the earliest period and the end of the most recent period used in the comparison. |
| | | | | |
| | | Three Months Ended September 30, |
| | | 2017 | |
| Net sales | | $ | 213.9 |
| |
| Cost of goods sold | | 174.6 |
| |
| Gross margin | | 39.3 |
| |
| Operating expenses | | 25.8 |
| |
| Contribution margin | | $ | 13.5 |
| |
| Operating Information: | | | |
| Number of stores (end of period) | | 302 |
| |
| Average number of stores | | 302 |
| |
Retail Segment Operational Comparison of the Three and Nine Months Ended September 30, 20172021 versus the Three and Nine Months Ended September 30, 20162020
Net SalesRevenue
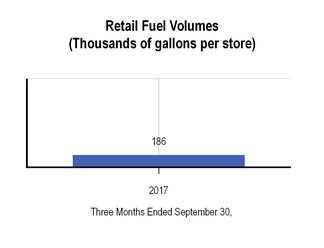
Net salesrevenues for the retail segment increased by $28.8 million, or 16.2%, in the third quarter of 2017 were $213.9 million. The net sales were due2021 compared to the addition of approximately 300 convenience stores which market motor fuels in central and west Texas and New Mexico in connection with the Delek/Alon Merger. Retail fuel gallons sold for the retail segment were 54.4 million gallons for the third quarter of 2017, and2020, primarily driven by the following:
•an increase in total fuel sales including wholesale dollars,which were $123.5$124.9 million in the third quarter of 2017. Merchandise sales for the retail segment were $91.32021 compared to $90.9 million in the third quarter of 2017.2020, primarily attributable to an increase of $0.96 in average price charged per gallon sold; and
Cost of Goods Sold
Cost of goods sold for the retail segment was $174.6•slightly offset by a decrease in merchandise sales to $81.7 million in the third quarter of 2017 and was2021 compared to $86.8 million in the third quarter of 2020 attributable to a same-store sales decrease of 7.1%.
Management's Discussion and Analysis
2021 vs. YTD 2020
Net revenues for the additionretail segment increased by $68.6 million, or 13.1%, in the nine months ended September 30, 2021 compared to the nine months ended September 30, 2020, primarily driven by the following:
•an increase in total fuel sales which were $349.5 million in the nine months of approximately 300 convenience stores which market motor fuels2021 compared to $273.8 million in centralthe nine months of 2020, primarily attributable to a $0.78 increase in average price charged per gallon sold, slightly offset by a decrease in total retail fuel gallons sold; and west Texas
•slightly offset by a decrease in merchandise sales to $240.9 million in the nine months of 2021 compared to $247.9 million in the nine months of 2020, primarily driven by the same-store sales decrease of 3.1%.
Cost of Materials and New MexicoOther
Q3 2021 vs. Q3 2020
Cost of materials and other for the retail segment increased by $28.9 million, or 21.2%, in connection with the Delek/Alon Merger.third quarter of 2021 compared to the third quarter of 2020, primarily driven by the following:
•an increase in average cost per gallon of $0.95 or 56.0% applied to fuel sales volumes that decreased period over period.
Our retail segment purchased finished product from our refining segment of $92.3 million and $57.6 million for the three months ended September 30, 2021 and September 30, 2020, respectively. We eliminate this intercompany cost in consolidation.
YTD 2021 vs. YTD 2020
Cost of materials and other for the retail segment increased by $66.4 million, or 16.6%, in the nine months ended September 30, 2021 compared to the nine months ended September 30, 2020, primarily driven by the following:
•an increase in average cost per gallon of $0.78 or 46.6% applied to fuel sales volumes that decreased period over period.
Our retail segment purchased finished product from our refining segment of $253.8 million and $166.6 million for the nine months ended September 30, 2021 and September 30, 2020, respectively. We eliminate this intercompany cost in consolidation.
Management's Discussion and Analysis
Operating Expenses
Q3 2021 vs. Q3 2020
Operating expenses for the retail segment were $25.8increased by $0.3 million, or 1.3% in the third quarter of 2017 and was attributable2021 compared to the additionthird quarter of approximately 300 convenience stores which market motor fuels2020.
YTD 2021 vs. YTD 2020
Operating expenses for the retail segment increased by $0.4 million, or 0.6% in central and west Texas and New Mexico in connection with the Delek/Alon Merger.nine months ended September 30, 2021 compared to the nine months ended September 30, 2020.
Contribution Margin
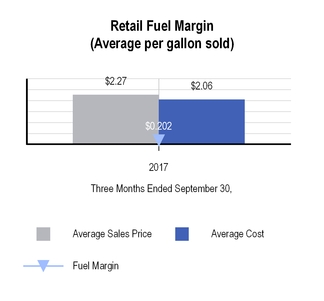
Contribution margin for the retail segment was $13.5decreased by $0.4 million, or 6.7%2.2%, in the third quarter of our consolidated segment contribution margin and was attributable2021 compared to the additionthird quarter of approximately 300 convenience stores which market motor fuels2020, primarily driven by the following:
•a 5.9% decrease in centralmerchandise sales, offset by an improvement in merchandise margin percentage of 2.1%; and west Texas
•a decrease in fuel sales volume, partially offset by increase in average fuel margin of $0.016 per gallon.
YTD 2021 vs. YTD 2020
Contribution margin for the retail segment increased by $1.8 million, or 3.3%, in the nine months ended September 30, 2021, compared to the nine months ended September 30, 2020, primarily driven by the following:
•2.8% decrease in merchandise sales, partially offset by an improvement in merchandise margin percentage of 1.8%; and New Mexico
•a decrease in connection with the Delek/Alon Merger.fuel sales volume, partially offset by increase in average fuel margin of $0.004 per gallon.
Management's Discussion and Analysis
Liquidity and Capital Resources
Our primary sources of liquidity and capital resources are
•cash generated from our operating activities, activities;
•borrowings under our debt facilitiesfacilities; and
•potential issuances of additional equity and debt securities.
At September 30, 2021 our total liquidity amounted to $2.1 billion comprised primarily of $721.7 million in unused credit commitments under the Delek Revolving Credit Facility (as defined in Note 8 of the condensed consolidated financial statements in Item 1. Financial Statements), $589.1 million in unused credit commitments under the Delek Logistics Credit Facility (as defined in Note 8 of the condensed consolidated financial statements in Item 1. Financial Statements) and $830.6 million in cash and cash equivalents. Historically, we have generated adequate cash from operations to fund ongoing working capital requirements, pay quarterly cash dividends and operational capital expenditures. In response to the COVID-19 Pandemic and the decline in oil prices, on November 5, 2020, we announced that we have elected to suspend dividends in order to conserve capital. Other funding sources including borrowings under existing credit agreements and issuance of equity and debt securities have been utilized to meet our funding requirements and support our growth capital projects and acquisitions. In addition, we have historically been able to source funding at terms that reflect market conditions, our financial position and our credit ratings. We believecontinue to monitor market conditions, our financial position and our credit ratings and expect future funding sources to be at terms that cash generated from these sourcesare sustainable and profitable for the Company. However, there can be no assurances regarding the availability of any future debt or equity financings or whether such financings can be made available on terms that are acceptable to us; any execution of such financing activities will be sufficientdependent on the contemporaneous availability of functioning debt or equity markets. Additionally, new debt financing activities will be subject to the satisfaction of any debt incurrence limitation covenants in our existing financing agreements. Our debt limitation covenants in our existing financing documents are usual and customary for credit agreements of our type and reflective of market conditions at the time of their execution. Additionally, our ability to satisfy working capital requirements, to service our debt obligations, to fund planned capital expenditures, or to pay dividends will depend upon future operating performance, which will be affected by prevailing economic conditions in the oil industry and other financial and business factors, including the current COVID-19 Pandemic and oil prices, some of which are beyond our control.
If market conditions were to change, for instance due to the significant decline in oil prices or uncertainty created by the COVID-19 Pandemic, and our revenue was reduced significantly or operating costs were to increase significantly, our cash flows and liquidity could be unfavorably impacted.
As of September 30, 2021, we believe we were in compliance with all of our debt maintenance covenants, where the most significant long-term obligation subject to such covenants was the Delek Logistics Credit Facility (see Note 8 of the condensed consolidated financial statements in Item 1. Financial Statements). After considering the current effect of the uncertainty created by the COVID-19 Pandemic on our operations, we currently expect to remain in compliance with our existing debt maintenance covenants, though we can provide no assurances, particularly if conditions significantly worsen beyond our ability to predict. Additionally, we were in compliance with incurrence covenants during the quarter ended September 30, 2021 to the extent that any of our activities triggered these covenants. However, given the uncertainty around economic conditions arising from the COVID-19 Pandemic, it is at least reasonably possible that conditions could change significantly, and that such changes could adversely impact our ability to meet some of these incurrence covenants. Inability to meet the incurrence covenants could impose certain incremental restrictions on our ability to incur new debt and also may limit whether and the extent to which we may resume paying dividends, as well as impose additional restrictions on our ability to repurchase our stock, make new investments and incur new liens (among others). Such restrictions would generally remain in place until such quarter that we are able to satisfy the anticipated cash requirements associated withapplicable incurrence based covenants. In the event that we are subject to these incremental restrictions, we believe that we have sufficient current and alternative sources of liquidity, including (but not limited to) the following: available borrowings under our existing operationsWells Fargo Revolving Credit Facility, and for Delek Logistics, under its Delek Logistics Credit Facility (each as defined in Note 8 of the condensed consolidated financial statements in Item 1. Financial Statements); the allowance to incur additional secured debt under the Term Loan Credit Facility (as defined in Note 8 of the condensed consolidated financial statements in Item 1. Financial Statements); as well as the possibility of obtaining other secured and unsecured debt, raising capital expenditures for at least the next 12 months.through equity issuance, or taking advantage of transactional financing opportunities such as sale-leasebacks, each as otherwise contemplated and allowed under our incurrence covenants.
Cash Flows
The following table sets forth a summary of our consolidated cash flows for the nine months ended September 30, 2017 and 2016 (in millions):
| | | | | | | | | | | | | | |
| Consolidated |
| | | Nine Months Ended September 30, |
| | | 2021 | | 2020 |
| Cash Flow Data: | | | | |
| Operating activities | | $ | 210.2 | | | $ | (399.8) | |
| Investing activities | | (143.2) | | | (163.0) | |
| Financing activities | | (23.9) | | | 415.4 | |
| Net increase (decrease) | | $ | 43.1 | | | $ | (147.4) | |
|
| | | | | | | | |
| | | Nine Months Ended September 30, |
| | | 2017 | | 2016 |
| Cash Flow Data: | | | | |
| Operating activities | | $ | 83.3 |
| | $ | 121.5 |
|
| Investing activities | | 95.3 |
| | (97.6 | ) |
| Financing activities | | (29.8 | ) | | 4.2 |
|
| Net increase | | $ | 148.8 |
| | $ | 28.1 |
|
Cash Flows from Operating Activities
Net cash provided by operating activities was $83.3$210.2 million for the nine months ended September 30, 2017,2021, compared to net cash providedused of $121.5$399.8 million for the comparable period of 2016. The decrease2020. Cash receipts from customers and cash payments to suppliers and for salaries increased resulting in a net $601.4 million increase in cash flows from operations was primarily due to theprovided by operating activities. Additionally, cash paid for debt interest decreased by $12.0 million. Partially offsetting these increases in cash provided were an increase in net income for the nine months ended September 30, 2017taxes paid of $97.5$0.8 million compared to net loss of $182.2 million in the same period of 2016, and a decrease in cash used to pay the obligation under the Supply and Offtake Agreementdividends received of $64.1 million, offset by the non-cash gain on the remeasurement of the equity method investment in Alon of $190.1 million and increases in accounts receivable and inventory and other non-current assets. Additionally, the disposed retail segment provided $26.2 million of cash flows from operations in 2016 that was not recurring in 2017.$2.6 million.
Cash Flows from Investing Activities
Net cash provided byused in investing activities was $95.3$143.2 million for the first nine months of 2017,2021, compared to net cash used of $97.6$163.0 million in the comparable period of 2016.2020. The increasedecrease in cash flows fromused in investing activities was primarily due the cash acquired in the Delek/Alon Merger of $200.5 million (excluding the cash acquired attributable to the Discontinued California Entities) and a decrease in equity method contributions of $49.9 million, partially offset by an increase in cash purchases of property, plant and equipment which increaseddecreased from $28.2$241.7 million in 2016,2020, to $108.4$163.1 million in 2017.2021, partially attributable to delaying non-essential projects in light of the COVID-19 Pandemic. Additionally, equity method investment contributions decreased $29.2 million primarily due to contributions made related to our Red River Pipeline Joint Venture and WWP Project Financing JV (each as defined in Note 5 of the condensed consolidated financial statements in Item 1. Financial Statements) for $11.8 million and $18.9 million, respectively, during the nine months ended September 30, 2020. During the nine months ended September 30, 2021, we contributed $1.4 million related to our Red River Pipeline Joint Venture and $0.2 million related to our WWP Project Financing JV.
These decreases in cash used in investing activities were partially offset by distributions received in the prior year from our WWP Project Financing JV to return excess capital contributions made in the amount of $69.3 million and proceeds of $39.9 million from the sale of the Bakersfield refinery in the prior year for which there was no comparable activity in the current year period.
Cash Flows from Financing Activities
Net cash used in financing activities was $29.8$23.9 million for the
nine months ended September 30, 2017, compared to cash provided of $4.2 million in the comparable 2016 period. The decrease in net cash flows from financing activities was primarily attributable to net repayments under our revolving credit facilities of $138.8 million in the nine months ended September 30, 20172021, compared to net borrowings $23.4cash provided of $415.4 million in the comparable period of 2016, a2020 period. This decrease in proceedscash provided was predominantly due to net payments on long-term revolvers and term debt of repayments associated with product financing agreements of $38.4 million, and a $7.3 million repurchase of non-controlling interest, offset by net borrowings under our term loans of $168.2$125.8 million during the nine months ended September 30, 20172021, compared to net repaymentsproceeds of $1.9$402.7 million in the comparable 20162020 period.
Such decreases were partially offset by an increase in net proceeds from inventory financing arrangements to $135.6 million for the nine months ended September 30, 2021 compared to $142.6 million in the comparable 2020 period. Additionally, cash provided increased $69.0 million due to suspension of dividends in the disposed retail segment used $11.2 millionfourth quarter of cash flows from financing activities in 2016 that was not recurring in 2017.2020.
Cash Position, Indebtedness and IndebtednessOther Financing Arrangements
As of September 30, 2017,2021, our total cash and cash equivalents were $831.7$830.6 million and we had total long-term indebtedness of approximately $1,427.8$2,222.2 million. The total long-term indebtedness is net of deferred financing costs and debt discount of $11.1 million and $20.2 million, respectively. Additionally, we had letters of credit issued of approximately $278.3 million. Total unused credit commitments or borrowing base availability, as applicable, under our five separate revolving credit facilities was approximately $898.2$1,310.8 million. Our total long-term indebtedness consisted of the following:
•an aggregate principal amount of $1,263.3 million under the Term Loan Credit Facility, due on March 30, 2025, with effective interest rate of 3.51%;
•an aggregate principal amount of $29.3 million in outstanding borrowings under the Delek Hapoalim Term Loan, due on December 31, 2022, with effective interest rate of 3.65%;
•an aggregate principal amount of $260.9 million under the Delek Logistics Credit Facility, due on September 28, 2023, with average borrowing rate of 2.62%;
•an aggregate principal amount of $250.0 million under the Delek Logistics 2025 Notes, due in 2025, with effective interest rate of 7.21%;
•an aggregate principal amount of $400.0 million under the Delek Logistics 2028 Notes, due in 2028, with effective interest rate of 7.41%;
•an aggregate principal amount of $50.0 million under the Reliant Bank Revolver, due on June 30, 2022, with fixed interest rate of 4.50%; and
•the Revolving Credit Facility, due on March 30, 2023, with borrowing rate of 3.50% for base rate loans, and we had letters of credit issued of approximately $146.0 million. We believe we were in compliance with our covenants in all debt facilities as of September 30, 2017. no principal amount outstanding.
See Note 8 of the condensed consolidated financial statements in Item 1,1. Financial Statements, for additional information about our revolvingseparate credit facilities.facilities included in long-term indebtedness.
Capital Spending
A key component of our long-term strategy is our capital expenditure program. Our capital expenditures for the nine months ended September 30, 20172021 were $98.7$161.6 million, (excluding capital spending associated with the California Discontinued Entities of $0.4 million), of which approximately $69.6$133.0 million was spent in our refining segment, $8.7$14.6 million in our logistics segment, $10.6$3.2 million in our retail segment and $9.8$10.8 million primarily at the holding company level. The following table summarizes our actual capital expenditures for the nine months ended September 30, 20172021 and planned capital expenditures for the full year 2017 (including Alon capital expenditures since the Delek/Alon Merger of $82.0 million)2021 by operating segment and major category (in millions):
| | | | | | | | | | | | | | |
| | Full Year
2021 Forecast | | Nine Months Ended September 30, 2021 |
| Refining |
Sustaining maintenance, including turnaround activities (1) | | $ | 153.6 | | | $ | 131.5 | |
| Regulatory | | 1.7 | | | 1.3 | |
| Discretionary projects | | 0.2 | | | 0.2 | |
| Refining segment total | | 155.5 | | | 133.0 | |
| | | | |
| Logistics |
| Regulatory | | 3.4 | | | 1.4 | |
| Sustaining maintenance | | 1.6 | | | 1.2 | |
| Discretionary projects | | 19.6 | | | 12.0 | |
| Logistics segment total | | 24.6 | | | 14.6 | |
| | | | |
| Retail |
| Regulatory | | — | | | — | |
| Sustaining maintenance | | 2.8 | | | 2.0 | |
| Discretionary projects | | 2.1 | | | 1.2 | |
| Retail segment total | | 4.9 | | | 3.2 | |
| | | | |
| Other |
| Regulatory | | 4.3 | | | 3.5 | |
| Sustaining maintenance | | 12.5 | | | 5.8 | |
| Discretionary projects | | 5.2 | | | 1.5 | |
| Other total | | 22.0 | | | 10.8 | |
| Total capital spending | | $ | 207.0 | | | $ | 161.6 | |
Management's Discussion and Analysis
|
| | | | | | | | |
| | | Full Year
2017 Forecast | | Nine Months Ended September 30, 2017 |
| Refining: | | | | |
| Sustaining maintenance, including turnaround activities | | $ | 50.9 |
| | $ | 30.9 |
|
| Regulatory | | 21.1 |
| | 8.7 |
|
| Discretionary projects | | 42.8 |
| | 30.0 |
|
| Refining segment total | | 114.8 |
| | 69.6 |
|
| Logistics: | | | | |
| Regulatory | | 3.4 |
| | 0.9 |
|
| Sustaining maintenance | | 6.8 |
| | 4.4 |
|
| Discretionary projects | | 6.8 |
| | 3.4 |
|
| Logistics segment total | | 17.0 |
| | 8.7 |
|
| Retail: | | | | |
| Regulatory | | 0.6 |
| | 0.2 |
|
| Sustaining maintenance | | 1.6 |
| | 0.8 |
|
| Discretionary projects | | 13.5 |
| | 9.6 |
|
| Retail segment total | | 15.7 |
| | 10.6 |
|
| Other: | | | | |
| Regulatory | | 0.5 |
| | 0.1 |
|
| Sustaining maintenance | | 0.2 |
| | 1.2 |
|
| Discretionary projects | | 13.4 |
| | 8.5 |
|
| Other total | | 14.1 |
| | 9.8 |
|
| Total capital spending | | $ | 161.6 |
| | $ | 98.7 |
|
The amount of our capital expenditure budget is subject to change due to unanticipated increases in the cost, scope and completion time for our capital projects. For example, we may experience increases in the cost of and/or timing to obtain necessary equipment required for our continued compliance with government regulations or to complete improvement projects or scheduled maintenance activities. Additionally, the scope and cost of employee or contractor labor expense related to installation of that equipment could exceed our projections. Our capital expenditure budget may also be revised as management continues to evaluate projects for reliability or profitability.
Off-Balance Sheet Arrangements
We have no material off-balance sheet arrangements through the date of the filing of this Quarterly Report on Form 10-Q.
Contractual Obligations and Commitments
Information regarding our known contractual obligations of the types described below have materially changed during the quarter ended September 30, 2017 due to the Delek/Alon Merger. The amounts as of September 30, 2017 are set forth in the following table (in millions):
|
| | | | | | | | | | | | | | | | | | | | |
| | | Payments Due by Period |
| | | <1 Year | | 1-3 Years | | 3-5 Years | | >5 Years | | Total |
| Long-term debt and notes payable obligations | | $ | 358.6 |
| | $ | 770.0 |
| | $ | 68.9 |
| | $ | 250.0 |
| | $ | 1,447.5 |
|
Interest(1) | | 79.9 |
| | 72.1 |
| | 36.7 |
| | 44.9 |
| | 233.6 |
|
Operating lease commitments(2) | | 42.6 |
| | 40.8 |
| | 18.8 |
| | 28.7 |
| | 130.9 |
|
Purchase commitments(3) | | 450.4 |
| | 1.3 |
| | — |
| | — |
| | 451.7 |
|
Transportation agreements(4) | | 115.1 |
| | 217.7 |
| | 131.9 |
| | 173.2 |
| | 637.9 |
|
| Total | | $ | 1,046.6 |
| | $ | 1,101.9 |
| | $ | 256.3 |
| | $ | 496.8 |
| | $ | 2,901.6 |
|
| |
(1)
| Expected interest payments on debt outstanding under credit facilities in place at September 30, 2017. Floating interest rate debt is calculated using September 30, 2017 rates. |
| |
(2)
| Amounts reflect future estimated lease payments under operating leases having remaining non-cancelable terms in excess of one year as of September 30, 2017. |
| |
(3)
| We have supply agreements to secure certain quantities of crude oil, finished product and other resources used in production at both fixed and market prices. We have estimated future payments under the market based agreements using current market rates. |
| |
(4)
| Balances consist of contractual obligations under agreements with third parties (not including Delek Logistics) for the transportation of crude oil to our refineries. |
ITEM 3. QUANTITATIVE AND QUALITATIVE DISCLOSURES ABOUT MARKET RISK
These disclosures should be read in conjunction with the condensed consolidated financial statements, "Management's Discussion and Analysis of Financial Condition and Results of Operations," and other information presented herein, as well as in the "Quantitative and Qualitative Disclosures About Market Risk" section contained in our Annual Report on Form 10-K.10-K, filed on March 1, 2021.
Price Risk Management Activities.Activities
At times, we enter into the following instruments/transactions in order to manage our market-indexed pricing risk: commodity derivative contracts which we use to manage our price exposure to our inventory positions, future purchases of crude oil and ethanol, future sales of refined products or to fix margins on future production. We also enter intoproduction; and future commitments to purchase or sell RINs at fixed prices and quantities, which are used to manage the costs associated with our RINs obligations. These future RIN commitmentsobligations and meet the definition of derivative instruments under ASC 815, Derivatives and Hedging ("ASC 815"). In accordance with ASC 815, all of these commodity contracts and future purchase commitments are recorded at fair value, and any change in fair value between periods has historically been recorded in the profit and loss section of our condensed consolidated financial statements. Occasionally, at inception, the companyCompany will elect to designate the commodity derivative contracts as cash flow hedges under ASC 815. Gains or losses on commodity derivative contracts accounted for as cash flow hedges are recognized in other comprehensive income on the condensed consolidated balance sheets and, ultimately, when the forecasted transactions are completed, in net salesrevenues or cost of goods soldmaterials and other in the condensed consolidated statements of income.
The following table sets forth information relating to our open commodity derivative contracts as of September 30, 20172021 ($ in millions).:
| | | | | | | | | | | | | | | | | | | | | | | | | | | | | | | | | | | | | | |
| | Total Outstanding | | Notional Contract Volume by Year of Maturity | | | | |
| Contract Description | | Fair Value | | Notional Contract Volume | | 2021 | | 2022 | | 2023 | | | | | | |
| Contracts not designated as hedging instruments: | | | | | | | | | | | | | | | | |
Crude oil price swaps - long(1) | | $ | 72.4 | | | 17,305,000 | | | 11,776,000 | | | 5,529,000 | | | — | | | | | | | |
Crude oil price swaps - short(1) | | (77.7) | | | 12,387,000 | | | 11,937,000 | | | 450,000 | | | — | | | | | | | |
Inventory, refined product and crack spread swaps - long(1) | | 33.8 | | | 72,450,000 | | | 13,250,000 | | | 44,400,000 | | | 14,800,000 | | | | | | | |
Inventory, refined product and crack spread swaps - short(1) | | (53.6) | | | 73,011,000 | | | 13,811,000 | | | 44,400,000 | | | 14,800,000 | | | | | | | |
| | | | | | | | | | | | | | | | |
| | | | | | | | | | | | | | | | |
RIN commitment contracts - long(2) | | (1.4) | | | 19,750,000 | | | — | | | — | | | — | | | | | | | |
RIN commitment contracts - short(2) | | 13.7 | | | 48,000,000 | | | — | | | — | | | — | | | | | | | |
| Total | | $ | (12.8) | | | 242,903,000 | | | 50,774,000 | | | 94,779,000 | | | 29,600,000 | | | | | | | |
| | | | | | | | | | | | | | | | |
| | | | | | | | | | | | | | | | |
| | | | | | | | | | | | | | | | |
| | | | | | | | | | | | | | | | |
| | | | | | | | | | | | | | | | |
| | | | | | | | | | | | | | | | |
|
| | | | | | | | | | | | | | | | |
| | | Total Outstanding | | Notional Contract Volume by Year of Maturity |
| Contract Description | | Fair Value | | Notional Contract Volume | | 2017 | | 2018 | | 2019 |
| Contracts not designated as hedging instruments: | | | | | | | | | | |
Crude oil price swaps - long(1) | | $ | 2.6 |
| | 3,090,000 |
| | 180,000 |
| | 2,910,000 |
| | — |
|
Crude oil price swaps - short(1) | | (5.4 | ) | | 3,590,000 |
| | 180,000 |
| | 3,410,000 |
| | — |
|
Inventory, refined product and crack spread swaps - long(1) | | 30.0 |
| | 20,701,197 |
| | 13,181,197 |
| | 7,520,000 |
| | — |
|
Inventory, refined product and crack spread swaps - short(1) | | (33.0 | ) | | 16,772,197 |
| | 11,747,197 |
| | 5,025,000 |
| | — |
|
RIN commitment contracts - long(2) | | (34.6 | ) | | 249,616,545 |
| | 249,616,545 |
| | — |
| | — |
|
RIN commitment contracts - short(2) | | 23.4 |
| | 194,140,000 |
| | 194,140,000 |
| | — |
| | — |
|
| Total | | $ | (17.0 | ) | | 487,909,939 |
| | 469,044,939 |
| | 18,865,000 |
| | — |
|
| Contracts designated as cash flow hedging instruments: | | | | | | | | | | |
Crude oil price swaps - long(1) | | $ | (22.6 | ) | | 575,000 |
| | — |
| | 575,000 |
| | — |
|
| Total | | $ | (22.6 | ) | | 575,000 |
| | — |
| | 575,000 |
| | — |
|
(1)Volume in barrels
(2)Volume in RINs
Interest Risk Management Activities.Activities
We have market exposure to changes in interest rates relating to our outstanding floating rate borrowings, which totaled approximately $935.4$1,553.5 million as of September 30, 2017.
We help manage this risk through interest rate swap and cap agreements that we may periodically enter into in order to modify the interest rate characteristics of our outstanding long-term debt. In accordance with ASC 815, all interest rate hedging instruments are recorded at fair value and any changes in the fair value between periods are recognized in earnings. The fair values of our interest rate swaps and cap agreements are obtained from dealer quotes. These values represent the estimated amount that we would receive or pay to terminate the agreements taking into account the difference between the contract rate of interest and rates currently quoted for agreements, of similar terms and maturities. We expect that any interest rate derivatives held would reduce our exposure to short-term interest rate movements. As of September 30, 2017, we had four floating-to-fixed interest rate derivative agreements in place for a notional amount of $69.8 million, which all mature in March 2019. The estimated fair value of our interest rate derivative liability was $1.3 million as of September 30, 2017.
2021. The annualized impact of a hypothetical one percent change in interest rates on our floating rate debt after considering the interest rate swaps, outstanding as of September 30, 20172021 would be to change interest expense by approximately $8.7$15.5 million.
Management's Discussion and Analysis
Commodity Derivatives Trading Activities
We enter into active trading positions in a variety of commodity derivatives, which include forward physical contracts, swap contracts, and futures contracts. These trading activities are undertaken by using a range of contract types in combination to create incremental gains by capitalizing on crude oil supply and pricing seasonality. These contracts all had remaining durations of less than one year as of September 30, 2021, and are classified as held for trading and are recognized at fair value with changes in fair value recognized in the income statement.
The following table sets forth information relating to trading commodity derivative contracts held for trading purposes as of September 30, 2021:
| | | | | | | | |
| Contract Description | | Less than 1 year |
| Over the counter forward sales contracts (crude) | | |
Notional contract volume (1) | | 846,465 | |
| Weighted-average market price (per barrel) | | $ | 64.30 | |
| Contractual volume at fair value (in millions) | | $ | 54.4 | |
| Over the counter forward purchase contracts (crude) | | |
Notional contract volume (1) | | 705,483 | |
| Weighted-average market price (per barrel) | | $ | 64.17 | |
| Contractual volume at fair value (in millions) | | $ | 45.4 | |
(1) Volume in barrels
ITEM 4.CONTROLS AND PROCEDURES [NEEDS TO BE UPDATED]
(a) Evaluation of Disclosure Controls and Procedures
Our management has evaluated,disclosure controls and procedures are designed to provide reasonable assurance that the information that we are required to disclose in reports we file under the Exchange Act is accumulated and appropriately communicated to management. We carried out an evaluation required by Rule 13a-15(b) of the Exchange Act, under the supervision and with the participation of our principal executivemanagement, including the Chief Executive Officer and principal financial officers,Chief Financial Officer, of the effectiveness of the design and operation of our disclosure controls and procedures (as defined in Rule 13a-15(e) or Rule 15d-15(e) under the Exchange Act) as ofat the end of the period covered by this report,reporting period. Based on that evaluation, the Chief Executive Officer and has, based on this evaluation,Chief Financial Officer concluded that our disclosure controls and procedures arewere effective to provide reasonable assurance that information required to be disclosed by us in the reports that we file or submit under the Exchange Act is recorded, processed, summarized and reported within the time periods specified in the SEC's rules and forms including, without limitation, controls and procedures designed to ensure that information required to be disclosed by us in the reports that we file or submit under the Exchange Act is accumulated and communicated to our management, including our principal executive and principal financial officers, as appropriate to allow timely decisions regarding required disclosures.
(b) Changes in Internal Control over Financial Reporting
We acquired Alon USA Energy, Inc. ("Alon")on July 1, 2017, and its total assets and revenues constituted 53% and 41%, respectively, of Delek's consolidated total assets and revenues as shown on our consolidated financial statements as of and for the nine months ended September 30, 2017. We will exclude Alon's internal control over financial reporting from the scope of management's 2017 annual assessmentend of the effectiveness of Delek's disclosure controls and procedures. This exclusion is in accordance with the general guidance issued by the Staff of the SEC that an assessment of a recent business combination may be omitted from management's report on internal control over financial reporting in the first year of consolidation.period.
In connection with the Delek/Alon Merger, we are integrating Alon's internal controls over financial reporting into our financial reporting framework. Such changesThere have resulted and may continue to result inbeen no changes in our internal control over financial reporting (as describedidentified in Rule 13a-15(f) and 15d-15(f) underconnection with the evaluation required by paragraph (d) of Exchange Act)Act Rules 13a-15 or 15d-15 that materially affect our internal control over financial reporting. Other than the changes that have and may continue to result from such integration, there has been no change in our internal control over financial reporting (as described in Rule 13a-15(f) and 15d-15(f) under the Exchange Act)occurred during the third quarter ended September 30, 2017of 2021 that hashave materially affected, or isare reasonably likely to materially affect, our internal control over financial reporting. Although we have a flexible work schedule that allows both on-site and remote work arrangements for employees, we have not experienced a material impact to our internal control over financial reporting. We are continually monitoring and assessing the COVID-19 Pandemic to minimize the impact on the design and operating effectiveness of our internal controls.
Legal Proceedings, Risk Factors, Unregistered Sales of Equity Securities and Other Information
PART II.
Part II - OTHER INFORMATION
ITEM 1.LEGAL PROCEEDINGS
OneIn the ordinary conduct of our Alon subsidiaries wasbusiness, we are from time to time subject to lawsuits, investigations and claims, including, environmental claims and employee-related matters. Although we cannot predict with certainty the ultimate resolution of lawsuits, investigations and claims asserted against us, including civil penalties or other enforcement actions, we do not believe that any currently pending legal proceeding or proceedings to which we are a party will have a material adverse effect on our business, financial condition or results of operations. See Note 11 to a lawsuit alleging breach of contract pertaining to an asphalt supply agreement. Duringour accompanying condensed consolidated financial statements, which is incorporated by reference in this Item 1, for additional information. Aside from the three months ended September 30, 2017, we reached a settlement on this matter.
Our recently acquired Big Spring refinery hasdisclosure updated in Note 11, there have been negotiating an agreement with EPA for over 10 years under EPA’s National Petroleum Refinery Initiative regarding alleged historical violations of the Clean Air Act ("CAA"). Accordingno material developments to the EPA, approximately 95% of the nation’s refining capacity has entered into “global” settlements under this EPA enforcement initiative. Our El Dorado and Tyler refineries entered into similar global settlementsproceedings previously reported in 2002 and 2009. A similar Consent Decree covering the Krotz Springs refinery, entered into in 2005 by a previous owner, was terminated by the court in October 2017. A Consent Decree resolving these alleged historical violations for the Big Spring refinery was lodged with the United States District Court for the Northern District of Texasour Annual Report on June 6, 2017, and we expect that Consent Decree to become final later this year. If finalized, the Consent Decree will require payment of a $456,250 civil penalty and capital expenditures for pollution control equipment that may be significant over the next 5 years.Form 10-K filed on March 1, 2021.
ITEM 1A.RISK FACTORS
In January 2017, we announced that Delek (and various related entities) had entered into an Agreement and Plan of Merger with Alon USA Energy, Inc. (NYSE: ALJ) ("Alon"), as subsequently amended on February 27 and April 21, 2017 (as so amended, the "Merger Agreement"). The related Merger (the "Delek/Alon Merger" or the "Merger") was effective July 1, 2017 (the “Effective Time”), resulting in a new post-combination consolidated registrant renamed as Delek US Holdings, Inc. (“New Delek”), with Alon and the previous Delek US Holdings, Inc. (“Old Delek”) surviving as wholly-owned subsidiaries. New Delek is the successor issuer to Old Delek and Alon pursuant to Rule 12g-3(c) under the Securities Exchange Act of 1934, as amended (the "Exchange Act"). In addition, as a result of the Delek/Alon Merger, the shares of common stock of Old Delek and Alon were delisted from the New York Stock Exchange in July 2017, and their respective reporting obligations under the Exchange Act were terminated. The Risk Factors considered for presentation herein are based on identified and anticipated risks to New Delek unless specifically attributed to one of its subsidiaries in the discussion below.
There have beenwere no material changes induring the nine months ended September 30, 2021 to the risk factors previously disclosedidentified in "Item 1A. Risk Factors" of Old Delek'sthe Company’s fiscal 2020 Annual Report on Form 10-K, except as disclosed below, which updatesdescribed below.
Stockholder activism may negatively impact the risk factors previously disclosedprice of our common stock.
Our stockholders may from time to time engage in Part I, Item 1Aproxy solicitations, advance stockholder proposals or otherwise attempt to effect changes or acquire control over us. Campaigns by stockholders to effect changes at publicly traded companies are sometimes led by investors seeking to increase short-term stockholder value through actions such as financial restructuring, increased debt, special dividends, stock repurchases or sales of Old Delek's Annual Report on Form 10-K forassets or the year ended December 31, 2016.
We mayentire company. Responding to proxy contests and other actions by activist stockholders can be unable to integrate successfullycostly and time-consuming, disrupting our operations and diverting the businessesattention of Old Delekour Board of Directors and Alon and realize the anticipated benefits of the Delek/Alon Merger.
The Delek/Alon Merger involve the combination of two companies which, prior to July 1, 2017, operated as independent public companies. We must devote significantsenior management attention and resources to integrating the business practices and operations of Old Delek and Alon. We may fail to realize some or all of the anticipated benefits of the Delek/Alon Merger if the integration process takes longer than expected or is more costly than expected. Potential difficulties we may encounter in the integration process include the following:
the inability to successfully combine the businesses of Old Delek and Alon in a manner that permits us to achieve the synergies anticipated to result from the Delek/Alon Merger, which would result in the anticipated benefitspursuit of the Delek/Alon Mergerbusiness strategies. If individuals are elected or appointed to our Board of Directors who do not being realized partly or wholly in the time frame currently anticipated or at all;
lost sales and customers as a result of certain customers of either of the two companies deciding not to do businessagree with us;
complexities associated with managing the combined businesses;
integrating personnel from the two companies;
challenges in the creation of uniform standards, controls, procedures, policies and information systems;
potential unknown liabilities and unforeseen increased expenses, delays or regulatory conditions associated with the Delek/Alon Merger; and
performance shortfalls as a result of the diversion of management’s attention caused by completing the Delek/Alon Merger and integrating the companies’ operations.
We are expected to incur substantial expenses related to the integration of Old Delek and Alon.
We are expected to incur substantial expenses in connection with the integration of the business, policies, procedures, operations, technologies and systems of Alon with those of Old Delek. There are a large number of systems that must be integrated, including management information, purchasing, administrative, accounting and finance, sales, marketing, billing, payroll and benefits, installation, engineering, infrastructure and regulatory compliance, among others. While we have assumed that a certain level of expenses would be incurred, there are a number of factors beyond our control that couldstrategic plans, it may adversely affect the total amount or the timingability of allour Board of the expected integration expenses. Moreover, many of the expenses that will be incurred are, by their nature, difficultDirectors to estimate. These integration expenses likely will result in us taking significant charges against earnings, but the amountfunction effectively and timing of such charges is uncertain, and if such charges are greater than expected, they could offset the cost synergies that New Delek expects to achieve from the Delek/Alon Merger.
We may refinance a significant amount of indebtedness and otherwise require additional financing; we cannot guarantee that we will be able to obtain the necessary funds on favorable terms or at all.
We may elect to refinance certain of Old Delek's or Alon’s indebtedness even if not required to do so by the terms of such indebtedness. In addition, we may need or want to raise additional funds for our operations. We have been and may continue to be engaged in discussions with certain potential financing sources, which could provide a source of additional funds and liquidity for our operations. However, our ability to obtain such financing will depend on, among other factors, prevailing market conditionseffectively and timely implement our strategic plans and create additional value for our stockholders. As a result, stockholder campaigns could adversely affect our results of operations, financial condition and cash flows.
In January 2021, CVR Energy, Inc. ("CVR Energy"), the owner (at that time) of approximately 15% of our outstanding common stock, proposed three director candidates to be considered at the timeour 2021 Annual Meeting. CVR Energy also proposed a series of the proposed financingoperational and other factors beyondstrategic changes to our control. There is no assurance that we will be ablebusiness. On May 6, 2021, our stockholders rejected CVR Energy’s director candidates and voted to obtain additional financing on terms acceptable to us, or at all.
elect all eight of Delek's nominees. As a result of the Delek/Alon Merger,contested director election, we are subjectincurred significant costs during 2021.
Any perceived uncertainties as to significant additional indebtedness as comparedour future direction and control, our ability to execute on our strategy, or changes to the indebtedness of Old Delek, which could adversely affect us, including by decreasing our business flexibility and increasing our interest expense.
As of September 30, 2017, our consolidated indebtedness was approximately $1,427.8 million, as compared to Old Delek's consolidated indebtedness of approximately $822.5 million as of June 30, 2017. As a result, we are subject to substantially increased indebtedness in comparison to Old Delek’s indebtedness on a recent historical basis. We may have to incur additional indebtedness in connection with any extinguishmentcomposition of our debt, as well as for our ongoing business needs. Increased indebtednessboard of directors or senior management team arising from future proposals from stockholders could havelead to the effect, among other things,perception of reducing our flexibility to respond to changing business and economic conditions and increasing our interest expense. The increased levels of indebtedness could reduce funds available for working capital, capital expenditures, acquisitions, share repurchases, dividends and other general corporate purposes.
Our future results will suffer if we do not effectively manage our expanded operations followinga change in the Delek/Alon Merger.
The size and scope of operationsdirection of our business have increased beyond the current size and scope of operations of either Old Delek’s or Alon’s businesses prior to the Delek/Alon Merger. In addition, we may continue to expand our size and operations through additional acquisitions or other strategic transactions. Our future success depends, in part, upon our ability to manage our expanded business,instability which may pose substantial challenges for management, including challenges relatedbe exploited by our competitors, result in the loss of potential business opportunities, and make it more difficult to the managementpursue our strategic initiatives or attract and monitoringretain qualified personnel and business partners, any of new operations and associated increased costs and complexity. There can be no assurance that we will be successful or that we will realize the expected economies of scale, synergies and other benefits currently anticipated from the Delek/Alon Merger or anticipated from any additional acquisitions or strategic transactions.
The Delek/Alon Mergerwhich could adversely affect our relationships with employees, customers, commercial partners, financing parties and other third parties.
Uncertainty about the effect of the Delek/Alon Merger on employees, customers, commercial partners and other third parties may have an adverse effect, on us. These uncertaintieswhich may cause customers, suppliers, commercial partners, financing parties and others that dealt with Alon or Old Delek to seek to change, delay or defer decisions with respect to existing or future business relationships. These uncertainties may impair our ability to retain, hire and motivate certain current and prospective employees. If key employees, customers, suppliers, commercial partners, financing parties and other third parties terminate or change, or seek to terminate or change, their existing relationships with us,be material, on our business and operating results.
In addition, actions such as those described above could be harmed.
Thecause significant fluctuations in the trading priceprices of our common stock is likely to be volatile.based on temporary or speculative market perceptions or other factors that do not necessarily reflect the underlying fundamentals and prospects of our business.
The trading price of Old Delek common stock and Alon common stock priorLikewise, to the Delek/Alon Merger were highly volatile. The trading priceextent that we implement any proposals made by any of our common stockshareholders, the resulting changes in our business, assets, results of operations and financial condition could also be subject to wide fluctuations in response to various factors, some of which are beyond our control. The stock market in general,material and the market for energy companies in particular, has experienced extreme price and volume fluctuations thatcould have often been unrelated or disproportionate to the operating performance of those companies. Broad market and industry factors may seriously affect the market price of companies’ stock, including ours, regardless of actual operating performance. In addition, in the past, following periods of
volatility in the overall market and the market price of a particular company’s securities, securities class action litigation has often been instituted against these companies. Any such stockholder litigation could result in substantial costs and a diversion of the attention and resources of our management.
The Delek/Alon Merger may not be as accretive to our earnings per share as anticipated,an impact, which may negatively affectbe material, on the market price of our common stock.
We currently anticipate that the Delek/Alon Merger will be accretive to earnings per share in 2018, assuming certain pre-tax synergies are realized. This expectation, however, is based on preliminary estimates which may materially change. We could encounter additional transaction-related costs or other factors such as the failure to realize all of the benefits anticipated in the Delek/Alon Merger. All of these factors could decrease or delay the expected accretive effect of the Delek/Alon Merger and cause a decrease in the market price of our common stock.
We will record goodwill and other intangible assets that could become impaired and result in material non-cash charges to our results of operations in the future.
The Delek/Alon Merger has been accounted for as an acquisition by us of Alon in accordance with accounting principles generally accepted in the United States. Under the acquisition method of accounting, the assets and liabilities of Alon and its subsidiaries have been recorded, as of the completion of the Delek/Alon Merger, at their respective fair values. Under the acquisition method of accounting, the total purchase price has been preliminarily allocated to Alon’s tangible assets and liabilities and identifiable intangible assets based on their estimated fair values as of the date of completion of the Delek/Alon Merger. The excess of the purchase price over those estimated fair values has been recorded as goodwill. To the extent the value of goodwill or intangibles becomes impaired, we may be required to incur material non-cash charges relating to such impairment. Our operating results may be significantly impacted from both the impairment and the underlying trends in the business that triggered the impairment.
We operate in a highly regulated industry and increased costs of compliance with, or liability for violation of, existing or future laws, regulations and other requirements could significantly increase our costs of doing business, thereby adversely affecting our profitability.
Our industry is subject to extensive laws, regulations, permits and other requirements including, but not limited to, those relating to the environment, fuel composition, safety, transportation, pipeline tariffs, employment, labor, immigration, minimum wages, overtime pay, health care benefits, working conditions, public accessibility, retail fuel pricing,the sale of alcohol and tobacco and other requirements. These permits, laws and regulations are enforced by federal agencies including the United States ("U.S.") Environmental Protection Agency ("EPA"), U.S. Department of Transportation, Pipeline and Hazardous Materials Safety Administration, Federal Motor Carrier Safety Administration, Federal Railroad Administration, the Occupational Safety and Health Administration ("OSHA"), National Labor Relations Board, Equal Employment Opportunity Commission, Federal Trade Commission and the Federal Energy Regulatory Commission ("FERC"), and numerous other state and federal agencies. We anticipate that compliance with environmental, health and safety regulations could require us to spend significant amounts in capital costs during the next five years. These estimates do not include amounts related to capital investments that management has deemed to be strategic investments. These amounts could materially change as a result of governmental and regulatory actions.
Various permits, licenses, registrations and other authorizations are required under these laws for the operation of our refineries, terminals, pipelines, retail locations and related operations, and these permits are subject to renewal and modification that may require operational changes involving significant costs. If key permits cannot be renewed or are revoked, the ability to continue operation of the affected facilities could be threatened.
Ongoing compliance with or violation of laws, regulations and other requirements could also have a material adverse effect on our business, financial condition and results of operations. We face potential exposure to future claims and lawsuits involving environmental matters including but not limited to, soil, groundwater and waterway contamination, air pollution, personal injury and property damage allegedly caused by substances we manufactured, handled, used, released or disposed. We are and have been the subject of various state, federal and private proceedings relating to environmental regulations, conditions and inquiries.
In addition, new legal requirements, new interpretations of existing legal requirements, increased legislative activity and governmental enforcement and other developments could require us to make additional unforeseen expenditures. Companies in the petroleum industry, such as us, are often the target of activist and regulatory activity regarding pricing, safety, environmental compliance, derivatives trading and other business practices which could result in price controls, fines, increased taxes or other actions affecting the conduct of our business. For example, consumer activists are lobbying various authorities to enact laws and regulations mandating the removal of tetra-ethyl lead from aviation gasoline. Other activists seek to require reductions in greenhouse gas emissions from our refineries and fuel products and are increasingly protesting new energy infrastructure projects such as pipelines and crude by rail facilities. The specific impact of laws and regulations or other actions may vary depending on a number of factors, including the age and location of operating facilities, marketing areas, crude oil and feedstock
sources and production processes.
We generate wastes that may be subject to the Resource Conservation and Recovery Act ("RCRA") and comparable state and local requirements. The EPA and various state agencies have limited the approved methods of managing, transporting, recycling and disposal of hazardous and certain non-hazardous wastes. Our refineries are large quantity generators of hazardous waste and require hazardous waste permits issued by the EPA or state agencies. Additionally, certain of our other facilities such as terminals and biodiesel plants generate lesser quantities of hazardous wastes.
Under RCRA and the Comprehensive Environmental Response, Compensation and Liability Act ("CERCLA") and other federal, state and local environmental requirements, as the owner or operator of refineries, biodiesel plants, bulk terminals, pipelines, tank farms, rail cars, trucks and retail locations, we may be liable for the costs of removal or remediation of contamination at our existing or former locations, whether we knew of, or were responsible for, the presence of such contamination. We have incurred such liability in the past and several of our current and former locations are the subject of ongoing remediation projects. The failure to timely report and properly remediate contamination may subject us to liability to third parties and may adversely affect our ability to sell or rent our property or to borrow money using our property as collateral. Additionally, persons who arrange for the disposal or treatment of hazardous substances also may be liable for the costs of removal or remediation of these substances at sites where they are located, regardless of whether the site is owned or operated by that person. We typically arrange for the treatment or disposal of hazardous substances in our refining and other operations. Therefore, we may be liable for removal or remediation costs, as well as other related costs, including fines, penalties and damages resulting from injuries to persons, property and natural resources. Our El Dorado refinery is a minor potentially responsible party at a Superfund site for which we expect our costs to be non-material. In the future, we may incur substantial expenditures for investigation or remediation of contamination that has not been discovered at our current or former locations or locations that we may acquire.
Our operations are subject to certain requirements of the federal Clean Air Act (“CAA”) as well as related state and local laws and regulations governing air emissions. Certain CAA regulatory programs applicable to our refineries, terminals and other operations require capital expenditures for the installation of air pollution control devices, operational procedures to minimize emissions and monitoring and reporting of emissions. In 2012, the EPA announced an industry-wide enforcement initiative directed at flaring operations and performance at refineries and petrochemical plants and finalized revisions to New Source Performance Standard ("NSPS") Subpart Ja that primarily affects flares and process heaters. We completed capital and other projects at our refineries related to flare compliance with NSPS Ja in 2015 and 2016.
Our recently acquired Big Spring refinery has been negotiating an agreement with EPA for over 10 years under EPA’s National Petroleum Refinery Initiative regarding alleged historical violations of the CAA. According to the EPA, approximately 95% of the nation’s refining capacity has entered into “global” settlements under this EPA enforcement initiative. Our El Dorado and Tyler refineries entered into similar global settlements in 2002 and 2009. A similar Consent Decree covering the Krotz Springs refinery, entered into in 2005 by a previous owner, was terminated by the court in October 2017. A Consent Decree resolving these alleged historical violations for the Big Spring refinery was lodged with the United States District Court for the Northern District of Texas on June 6, 2017, and we expect that Consent Decree to become final later this year. If finalized, the Consent Decree will require payment of a $456,250 civil penalty and capital expenditures for pollution control equipment that may be significant over the next 5 years.
In 2015, EPA finalized reductions in the National Ambient Air Quality Standard (NAAQS) for ozone, from 75 ppb to 70 ppb. Our Tyler refinery is likely to be located in an area reclassified as non-attainment with the new standard. While we do not yet know what specific actions we will be required to take or when, it is possible we will have to install additional air pollution control equipment for ozone forming emissions or change the formulation of gasoline we make for use in some areas. We do not believe such capital expenditures or the changes in our operation will result in a material adverse effect on our business.
In late 2015, the EPA finalized additional rules regulating refinery air emissions from a variety of sources (such as cokers, flares, tanks, and other process units) through additional NSPS and National Emission Standards for Hazardous Air Pollutants and changing the way emissions from startup, shutdown and malfunction operations are regulated (the "Refinery Risk and Technology Review Rules" or “RTR”). The RTR rule also requires that starting in January 2018 we monitor property line benzene concentrations at our refineries and starting in 2019 report those concentrations quarterly to EPA, which will make the results available to the public. Even though the concentrations are not expected to exceed regulatory or health based standards, the availability of such data may increase the likelihood of lawsuits against our refineries by the local public or organized public interest groups. Compliance with the rules will require additional capital projects and changes in the way we operate some equipment over the next three years but is not expected to have a material adverse effect on our business, financial condition or results of operations.
In addition to our operations, many of the fuel products we manufacture are subject to requirements of the CAA as well as related state and local laws and regulations. The EPA has the authority under the CAA to modify the formulation of the refined transportation fuel products we manufacture in order to limit the emissions associated with their final use. In 2007, the EPA issued final Mobile Source Air Toxic II rules for gasoline formulation that required the reduction of average benzene content beginning January 1, 2011 and the reduction of maximum annual average benzene content by July 1, 2012. We have purchased credits in the past to comply with these content requirements for two of our
refineries. Although credits have been readily available, there can be no assurance that such credits will continue to be available for purchase at reasonable prices or at all and we could have to implement capital projects in the future to reduce benzene levels.
In March 2014, the EPA issued final Tier 3 gasoline rules that require a reduction in annual average gasoline sulfur content from 30 ppm to 10 ppm by January 1, 2017 for "large refineries" and retains the current maximum per-gallon sulfur content limit of 80 ppm. Under the final rules, all of our refineries are considered “small refineries” and are exempt from complying with the rules' requirements until January 1, 2020. We anticipate that our refineries will meet these new limits when they become effective and that capital spending at our refineries over the next two to three years may be significant. In April 2016, EPA finalized a change to the Tier 3 standard requiring small volume refineries that increase their annual average crude processing rate above 75,000 bpd to meet the Tier 3 sulfur limits 30 months from that “disqualifying” date. We do not anticipate that this rule change will affect our refineries.
Our operations are also subject to the Federal Clean Water Act (“CWA”), the Oil Pollution Act of 1990 (“OPA-90”) and comparable state and local requirements. The CWA and similar laws prohibit any discharge into surface waters, ground waters, injection wells and publicly-owned treatment works except as allowed by pre-treatment permits and National Pollutant Discharge Elimination System (“NPDES”) permits, issued by federal, state and local governmental agencies. The OPA-90 prohibits the discharge of oil into Waters of the U.S. and requires that affected facilities have plans in place to respond to spills and other discharges. The CWA also regulates filling or discharges to wetlands and other Waters of the U.S. In 2015, the EPA, in conjunction with the Army Corps of Engineers, issued a final rule regarding the definition of “Waters of the U.S.,” which expanded the regulatory reach of the existing clean water regulations. Although the final rule is currently stayed pending litigation, if the rule becomes enforceable, it could increase costs for expanding our facilities or constructing new facilities, including pipelines.
We are subject to regulation by the United States Department of Transportation and various state agencies in connection with our pipeline, trucking and rail transportation operations. These regulatory authorities exercise broad powers, governing activities such as the authorization to operate hazardous materials pipelines and engage in motor carrier operations. There are additional regulations specifically relating to the transportation industry, including integrity management of pipelines, testing and specification of equipment, product handling and labeling requirements and personnel qualifications. The transportation industry is subject to possible regulatory and legislative changes that may affect the economics of our business by requiring changes in operating practices or pipeline construction or by changing the demand for common or contract carrier services or the cost of providing truckload services. Possible changes include, among other things, increasingly stringent environmental regulations, increased frequency and stringency for testing and repairing pipelines, replacement of older pipelines, changes in the hours of service regulations that govern the amount of time a driver may drive in any specific period, onboard black box recorder devices or limits on vehicle weight and size and properties of the materials that can be shipped. Required changes to the specifications governing rail cars carrying crude oil will eliminate the most commonly used tank car or require that such cars be upgraded. In January 2017, PHMSA announced they were considering limits on the volatility of crude oil that could be shipped by rail and other modes of transportation. These rules could limit the availability of tank cars to transport crude to our refineries and increase the cost of crude oil transported by rail or truck. In addition to the substantial remediation costs that could be caused by leaks or spills from our pipelines, regulators could prohibit our use of affected portions of the pipeline for extended periods thereby interrupting the delivery of crude oil to, or the distribution of refined products from, our refineries.
Our operations are subject to various laws and regulations relating to occupational health and safety and process safety administered by OSHA, EPA and various state equivalent agencies. We maintain safety, training, design standards, mechanical integrity and maintenance programs as part of our ongoing efforts to ensure compliance with applicable laws and regulations and protect the safety of our workers and the public. More stringent laws or regulations or adverse changes in the interpretation of existing laws or regulations by government agencies could have an adverse effect on our financial position and the results of our operations and could require substantial expenditures for the installation and operation of systems and equipment.
Health and safety legislation and regulations change frequently. We cannot predict what additional health and safety legislation or regulations will be enacted or become effective in the future or how existing or future laws or regulations will be administered or interpreted with respect to our operations. Compliance with applicable health and safety laws and regulations has required and continues to require substantial expenditures. Future process safety rules could also mandate changes to the way we operate, the processes and chemicals we use and the materials from which our process units are constructed. Such regulations could have a significant negative effect on our operations and profitability. For example, in response to Executive Order 13650, Improving Chemical Facility Safety and Security, OSHA announced it intends to propose comprehensive changes to process safety requirements. In January 2017, the EPA finalized changes to process safety requirements in its Risk Management Program rules that require evaluation of safer alternatives and technologies, expanded routine audits, independent third party audits following certain process safety events and increased sharing of information with the public and emergency response organizations. Pending reconsideration of this rule, EPA has subsequently delayed the effective date until 2019.
Environmental regulations are becoming more stringent and new environmental laws and regulations are continuously being enacted or proposed. Compliance with any future legislation or regulation of our produced fuels, including renewable fuel or carbon content; greenhouse gas ("GHG") emissions; sulfur, benzene or other toxic content; vapor pressure; octane; or other fuel characteristics, may result in increased capital and operating costs and may have a material adverse effect on our results of operations and financial condition. While it is impractical
to predict the impact that potential regulatory and activist activity may have, such future activity may result in increased costs to operate and maintain our facilities, as well as increased capital outlays to improve our facilities. Such future activity could also adversely affect our ability to expand production, result in damaging publicity about us, or reduce demand for our products. Our need to incur costs associated with complying with any resulting new legal or regulatory requirements that are substantial and not adequately provided for, could have a material adverse effect on our business, financial condition and results of operations.
The Dodd-Frank Wall Street Reform and Consumer Protection Act (the "Dodd-Frank Act") is comprehensive financial reform legislation that, among other things, establishes comprehensive federal oversight and regulation of over-the-counter derivatives and many of the entities that participate in that market. Although the Dodd-Frank Act was enacted on July 21, 2010, the Commodity Futures Trading Commission, or CFTC, and the SEC, along with certain other regulators, must promulgate final rules and regulations to implement many of the Dodd-Frank Act's provisions relating to over-the-counter derivatives. While some of these rules have been finalized, others have not; and, as a result, the final form and timing of the implementation of the new regulatory regime affecting commodity derivatives remains uncertain.
Finally, the Patient Protection and Affordable Care Act (the “ACA”) as well as other healthcare reform legislation being considered by Congress and state legislatures may have an impact on our business. Although many of the rules, reforms and regulations required to implement the ACA have not yet been adopted, and consequently the precise costs of complying with the ACA remain unknown, an increase in our employee healthcare-related costs appears likely and that increase could be extensive and changes to our healthcare cost structure could have a significant, negative impact on our business.
We may incur significant costs and liabilities with respect to investigation and remediation of environmental conditions at our refineries.
Prior to our purchase of our refineries and terminals, the previous owners had been engaged for many years in the investigation and remediation of hydrocarbons and other materials which contaminated soil and groundwater at the purchased facilities. Upon purchase of the facilities, we became responsible and liable for certain costs associated with the continued investigation and remediation of known and unknown impacted areas at the refineries. In the future, it may be necessary to conduct further assessments and remediation efforts at impacted areas at our refinery, pipeline, tank, terminal and store locations and elsewhere. In addition, we have identified and self-reported certain other environmental matters subsequent to our purchase of the refineries.
Based upon environmental evaluations performed internally and by third parties we recorded and periodically update environmental liabilities and accrued amounts we believe are sufficient to complete remediation. We expect remediation of soil, sediment and groundwater at some properties to continue for the foreseeable future. The need to make future expenditures for these purposes that exceed the amounts we estimated and accrued for could have a material adverse effect on our business, financial condition and results of operations.
Alon indemnified certain parties to which they sold assets for costs and liabilities that may be incurred as a result of environmental conditions existing at the time of the sale. As a result of our purchase of Alon, if we are forced to incur costs or pay liabilities in connection with these indemnifications, such costs and payments could be significant and adversely affect our business, results of operations and cash flows.
In the future, we may incur substantial expenditures for investigation or remediation of contamination that has not been discovered at our current or former locations or locations that we may acquire. Our handling and storage of petroleum and hazardous substances may lead to additional contamination at our facilities or along our pipelines and at facilities to which we send or have sent wastes or by-products for treatment of disposal. In addition, new legal requirements, new interpretations of existing legal requirements, increased legislative activity and governmental enforcement and other developments could require us to make additional unforeseen expenditures. As a result, we may be subject to additional investigation and cleanup costs, governmental penalties and third party suits alleging personal injury and property damage. Joint and several strict liability may be incurred in connection with releases of petroleum hydrocarbons, hazardous substances and/or wastes. Liabilities for future remediation costs are recorded when environmental assessments and/or remedial efforts are probable and the costs can be reasonably estimated as material. Other than for assessments, the timing and magnitude of these accruals generally are based on the completion of investigations or other studies or a commitment to a formal plan of action.
Adverse weather conditions or other unforeseen developments could damage our facilities, reduce customer traffic and impair our ability to produce and deliver refined petroleum products or receive supplies for our retail fuel and convenience stores.
The regions in which we operate are susceptible to severe storms, including hurricanes, thunderstorms, tornadoes, floods, extended periods of rain, ice storms and snow, all of which we have experienced in the past few years. Our refineries located in California and the related pipeline and asphalt terminals are located in areas with a history of earthquakes, some of which have been quite severe. In addition, for a variety of reasons, many members of the scientific community believe that climate changes are occurring that could have significant physical effects, such as increased frequency and severity of storms, droughts and floods and other climatic events. If any such effects were to occur, they could have an adverse effect on our assets and operations.
Inclement weather conditions, earthquakes or other unforeseen developments could damage our facilities, interrupt production, adversely impact consumer behavior, travel and retail fuel and convenience store traffic patterns or interrupt or impede our ability to operate our locations. If such conditions prevail near our refineries, they could interrupt or undermine our ability to produce and transport products from our refineries and receive and distribute products at our terminals. Regional occurrences, such as energy shortages or increases in energy prices, fires and other natural disasters, could also hurt our business. The occurrence of any of these developments could have a material adverse effect on our business, financial condition and results of operations.
Shareholder litigation against us and certain of our current or Our former directors could divert management time and result in the payment of damages if the plaintiffs are successful.
As more fully described in a Form 8-K filed by Old Delek on June 19, 2017, in June 2017, three purported stockholders of Alon and one purported stockholder of Old Delek filed four lawsuits in connection with the Delek/Alon Merger. Three of the lawsuits, Stephen Page v. Alon USA Energy Inc., et al., Case No. 1:17-cv-00671-RGA (D. Del.), David Phelps v. Delek US Holdings, Inc., et al., Case No. 3:17-cv-00910 (M.D. Tenn.) and Joseph Adler v. Alon USA Energy, Inc., et al., Case No. 1:17-cv-00742-UNA (D. Del.), alleged that the defendants violated Section 14(a) of the Exchange Act, and Rule 14a-9 promulgated thereunder, by filing the joint proxy statement/prospectus relating to the proposed Delek/Alon Merger which allegedly failed to disclose and/or misrepresented material information about the proposed Alon/Delek Merger. Each of Old Delek and Alon determined to voluntarily supplement the joint proxy statement/prospectus by filing Current Reports on Form 8-K in order to moot certain of the plaintiffs’ disclosure claims, alleviate the costs, risks and uncertainties inherent in litigation and provide additional information to their respective stockholders. To date, the Page and Phelps lawsuits have been dismissed with prejudice, subject to the plaintiffs’ right to seek a “mootness” fee.
The fourth lawsuit, Arkansas Teacher Retirement System v. Alon USA Energy, Inc., et al., Case No. 2017-0453, filed in the Delaware Court of Chancery, alleges breach of fiduciary duty claims. Specifically, it alleges that Old Delek used its position as a purportedly controlling stockholder of Alon’s to obtain buyout terms from Alon at an unfairly discounted price, and that the defendant Alon directors breached their fiduciary duties allegedly owed to the plaintiff stockholder and purported class by engaging in conduct that led to the sale of Alon’s shares at an unfairly discounted price. The plaintiff has asked the Delaware Chancery Court to, among other things, award damages to the plaintiff and purported class in an amount to be determined at trial, award additional shares of our common stock to the plaintiff and purported class and award the plaintiff attorneys’ and experts’ fees. Although we believe the plaintiff’s claims are without merit, we cannot predict the outcome of or estimate the possible loss or range of loss from this litigation.
The defense or settlement of the shareholder actions disclosed above could be time-consuming and expensive, and divert the attention of our management away from operating the business. If any one or more of these legal proceedings is adversely resolved against us, it could have an adverse effect on our financial condition, results of operations or liquidity.
The termination or expiration of our supply and offtake agreements could have a material adverse effect on our liquidity.
Our supply and offtake agreements with J. Aron, have expiration dates ranging from May 2019 to May 2021. Pursuant to the agreements, J. Aron purchases a substantial portion of the crude oil and refined products in our refineries’ inventory at market prices. Upon any termination of the agreements, including at expiration or in connection with a force majeure or default, the parties are required to negotiate with third parties for the assignment to us of certain contracts, commitments and arrangements, including procurement contracts, commitments for the sale of product and pipeline, terminalling, storage and shipping arrangements. Additionally, upon any termination, we will be required to repurchase or refinance the consigned crude oil and refined products from J. Aron at then market prices, which may have a material impact on our working capital needs.
We conduct our convenience store business under a license agreement with 7-Eleven, and the loss of this license could adversely affect the results of operations of our retail segment.
Our convenience store operations are primarily conducted under the 7-Eleven name pursuant to a license agreement between 7-Eleven, Inc. and Alon. 7-Eleven may terminate the agreement if Alon defaults on its obligations under the agreement. This termination would result in our convenience stores losing the use of the 7-Eleven brand name, the accompanying 7-Eleven advertising and certain other brand names and products used exclusively by 7-Eleven. Termination of the license agreement could have a material adverse effect on our retail operations.
We rely on information technology in our operations, and any material failure, inadequacy, interruption or security failure of that technology could harm our business.
We rely on information technology systems across our operations, including management of our supply chain, point of sale processing at our retail sites and various other processes and transactions. We rely on commercially available systems, software, tools and monitoring to provide security for processing, transmission and storage of confidential customer information, such as payment card and personal credit information.
In addition, the systems currently used for certain transmission and approval of payment card transactions, and the technology utilized in payment cards themselves, may put certain payment card data at risk. These standards for determining the required controls applicable to these systems are mandated by credit card issuers and administered by the Payment Card Industry Security Standards Counsel and not by us. The regulatory environment surrounding information security and privacy is increasingly demanding, with the frequent imposition of new and constantly changing requirements. We have taken the necessary steps to comply with the Payment Card Industry Data Security Standards (PCI-DSS) at all of our locations. However, compliance with these requirements may result in cost increases due to necessary systems changes and the development of new administrative processes.
In recent years, several retailers have experienced data breaches resulting in the exposure of sensitive customer data, including payment card information. Any compromise or breach of our information and payment technology systems could cause interruptions in our operations, damage our reputation, reduce our customers' willingness to visit our sites and conduct business with them, or expose us to litigation from customers or sanctions for violations of the PCI-DSS. In addition, a compromise of our internal data network at any of our refining or terminal locations may have disruptive impacts similar to that of our retail operations. These disruptions could range from inconvenience in accessing business information to a disruption in our refining operations. Cost increases may be incurred in this area to combat the continued escalation of cyber-attacks and/or disruptive criminal activity.
Also, we utilize information technology systems and controls that monitor the movement of petroleum products through our pipelines and terminals. An undetected failure of these systems could result in environmental damage, operational disruptions, regulatory enforcement or private litigation. Further, the failure of any of our systems to operate effectively, or problems we may experience with transitioning to upgraded or replacement systems, could significantly harm our business and operations and cause us to incur significant costs to remediate such problems.
A substantial portion of the workforce at our refineries is unionized, and we may face labor disruptions that would interfere with our operations.
As of September 30, 2017, we employed 315 and 455 people in our Tyler and El Dorado operations, respectively. From among these employees, 172 operations, maintenance and warehouse hourly employees and 43 truck drivers at the Tyler refinery were represented by the United Steel, Paper and Forestry, Rubber, Manufacturing, Energy, Allied Industrial and Service Workers International Union and its Local 202. The Tyler operations, maintenance and warehouse hourly employees are currently covered by a collective bargaining agreement that expires January 31, 2019. The Tyler truck drivers are currently covered by a collective bargaining agreement that expires March 1, 2018. As of September 30, 2017, 177 operations and maintenance hourly employees at the El Dorado refinery were represented by the International Union of Operating Engineers and its Local 381. These employees are covered by a collective bargaining agreement which expires on August 1, 2021. Although these collective bargaining agreements contain provisions to discourage strikes or work stoppages, we cannot assure you that strikes or work stoppages will not occur. As of September 30, 2017, 39 of our El Dorado based drivers for Lion Oil Company were represented by the United Steel, Paper and Forestry, Rubber, Manufacturing, Energy, Allied Industrial and Service Workers International, AFL-CIO and four of our El Dorado refinery warehouse hourly employees were represented by the International Union of Operating Engineers and its Local 381. Negotiations toward collective bargaining agreements with the new bargaining units is underway. A strike or work stoppage could have a material adverse effect on our business, financial condition and results of operations.
As of September 30, 2017, Alon employed approximately 195 people at its Big Spring refinery, approximately 134 of whom were covered by a collective bargaining agreement that expires April 1, 2019. Our current labor agreement may not prevent a strike or work stoppage in the future, and any such work stoppage could have a material adverse effect on our results of operations and financial condition.
Our retail segment is subject to loss of market share or pressure to reduce prices in order to compete effectively with a changing group of competitors in a fragmented retail industry.
The markets in which we operate our retail fuel and convenience stores are highly competitive and characterized by ease of entry and constant change in the number and type of retailers offering the products and services found in our stores. We compete with other convenience store chains, gas stations, supermarkets, drug stores, discount stores, dollar stores, club stores, mass merchants, fast food operations, independent owner-operators and other retail outlets. In some of our markets, our competitors have been in existence longer and have greater financial, marketing and other resources than us. In addition, independent owner-operators can generally operate stores with lower overhead costs than ours. As a result, our competitors may be able to respond better to changes in the economy and new opportunities within the industry.
Several non-traditional retailers, such as supermarkets, club stores and mass merchants, have affected the convenience store industry by entering the retail fuel business and/or selling merchandise traditionally found in convenience stores. Many of these competitors are substantially larger than we are. Because of their diversity, integration of operations and greater resources, these companies may be better able to withstand volatile market conditions or levels of low or no profitability. In addition, these retailers may use promotional pricing or discounts, both at the pump and in the store, to encourage in-store merchandise sales. These activities by our competitors could adversely affect our profit margins. Additionally, our convenience stores could lose market share, relating to both gasoline and merchandise, to these and other retailers, which could adversely affect our business, results of operations and cash flows. Our convenience stores compete in large part based on their ability to offer convenience to customers. Consequently, changes in traffic patterns and the type, number and location of competing stores could result in the loss of customers and reduced sales and profitability at affected stores. These non-traditional gasoline and/or convenience merchandise retailers may obtain a significant share of the retail fuels market, may obtain a significant share of the convenience store merchandise market and their market share in each market is expected to grow.
We may not be able to successfully execute our strategy of growth through acquisitions.
A significant part of our growth strategy is to acquire assets such as refineries, pipelines, terminals, and retail fuel and convenience stores that complement our existing assets and/or broaden our geographic presence. If attractive opportunities arise, we may also acquire assets in new lines of business that are complementary to our existing businesses. From our inception in 2001 through September 2017, we acquired the Tyler and El Dorado refineries, developed our logistics segment through the acquisition of transportation and marketing assets and acquired Alon USA. We expect to continue to acquire assets that complement our existing assets and/or broaden our geographic presence as a major element of our growth strategy. However, the occurrence of any of the following factors could adversely affect our growth strategy:
•We may not be able to identify suitable acquisition candidates or acquire additional assets on favorable terms;
•We usually compete with others to acquire assets, which competition may increase, and any level of competition could result in decreased availability or increased prices for acquisition candidates;
•We may experience difficulty in anticipating the timing and availability of acquisition candidates;
•We may not be able to obtain the necessary financing, on favorable terms or at all, to finance any of our potential acquisitions; and
•As a public company, we are subject to reporting obligations, internal controls and other accounting requirements with respect to any business we acquire, which may prevent or negatively affect the valuation of some acquisitions we might otherwise deem favorable or increase our acquisition costs.
Our operating results are seasonal and generally lower in the first and fourth quarters of the year for our refining and logistics segments and in the first quarter of the year for our retail segment. We depend on favorable weather conditions in the spring and summer months.
Demand for gasoline, convenience merchandise and asphalt products is generally higher during the summer months than during the winter months due to seasonal increases in motor vehicle traffic and road and home construction. Varying vapor pressure requirements between the summer and winter months also tighten summer gasoline supply. As a result, the operating results of our refining segment and logistics segment are generally lower for the first and fourth quarters of each year. Seasonal fluctuations in traffic also affect sales of motor fuels and merchandise in our retail fuel and convenience stores. As a result, the operating results of our retail segment are generally lower for the first quarter of the year.
Weather conditions in our operating area also have a significant effect on our operating results in our retail segment. Customers are more likely to purchase more gasoline and higher profit margin items such as fast foods, fountain drinks and other beverages during the spring and summer months. Unfavorable weather conditions during these months and a resulting lack of the expected seasonal upswings in traffic and sales could have a material adverse effect on our business, financial condition and results of operations.
We may seek to diversify our retail fuel and convenience store operations by entering new geographic areas, which may present operational and competitive challenges.
In the future, we may seek to grow by selectively operating stores in geographic areas other than those in which we currently operate, or in which we currently have a relatively small number of stores. This growth strategy would present numerous operational and competitive challenges to our senior management and employees and would place significant pressure on our operating systems. In addition, we cannot assure you that consumers located in the regions in which we may expand our operations would be as receptive to our stores as consumers in our existing markets. The success of any such growth plans will depend in part upon our ability to:
•select, and compete successfully in, new markets;
•obtain suitable sites at acceptable costs;
•identify and contract with financially stable developers;
•realize an acceptable return on the capital invested in new facilities;
•hire, train, and retain qualified personnel;
•integrate new retail fuel and convenience stores into our existing distribution, inventory control, and information systems;
•expand relationships with our suppliers or develop relationships with new suppliers; and
•secure adequate financing, to the extent required.
We cannot assure you that we will achieve our development goals, manage our growth effectively, or operate our existing and new retail fuel and convenience stores profitability. The failure to achieve any of the foregoing could have a material adverse effect on our business, financial condition and results of operations.
Our retail segment is dependent on fuel sales which makes us susceptible to increases in the cost of gasoline and interruptions in fuel supply.
Our dependence on fuel sales makes us susceptible to increases in the cost of gasoline and diesel fuel and fuel profit margins have a significant impact on our earnings. The volume of fuel sold by us and our fuel profit margins are affected by numerous factors beyond our control, including the supply and demand for fuel, volatility in the wholesale fuel market and the pricing policies of competitors in local markets. Although we can rapidly adjust our pump prices to reflect higher fuel costs, a material increase in the price of fuel could adversely affect demand. A material, sudden increase in the cost of fuel that causes our fuel sales to decline could have a material adverse effect on our business, financial condition and results of operations.
In addition, credit card interchange fees are typically calculated as a percentage of the transaction amount rather than a percentage of gallons sold, higher refined product prices often result in negative consequences for our retail operations such as higher credit card expenses, lower retail fuel gross margin per gallon and reduced demand for gasoline and diesel. These conditions could result in fewer retail gallons sold and fewer retail merchandise transactions, which could have a material adverse effect on our business, financial condition and results of operations.
Our dependence on fuel sales also makes us susceptible to interruptions in fuel supply. Gasoline sales generate customer traffic to our retail fuel and convenience stores and any decrease in gasoline sales, whether due to shortage or otherwise, could adversely affect our merchandise sales. A serious interruption in the supply of gasoline to our retail fuel and convenience stores could have a material adverse effect on our business, financial condition and results of operations.
If there is negative publicity concerning our brand names or the brand names of our suppliers, fuel and merchandise sales in our retail segment may suffer.
Negative publicity, regardless of whether the concerns are valid, concerning food, beverage, fuel or other product quality, food, beverage or other product safety or other health concerns, facilities, employee relations or other matters may materially and adversely affect demand for products offered at our stores and could result in a decrease in customer traffic to our stores. We offer food products in our stores that are marketed under our brand names and certain nationally recognized brands. These nationally recognized brands have significant operations at facilities owned and operated by third parties and negative publicity concerning these brands as a result of events that occur at facilities that we do not control could also adversely affect customer traffic to our stores. Additionally, we may be the subject of complaints or litigation arising from food or beverage-related illness or injury in general which could have a negative impact on our business. Health concerns, poor food, beverage, fuel or other product quality or operating issues stemming from one store or a limited number of stores can materially and adversely affect the operating results of some or all of our stores and harm our proprietary brands.
Wholesale cost increases, vendor pricing programs and tax increases applicable to tobacco products, as well as campaigns to discourage their use, could adversely impact our results of operations in our retail segment.
Increases in the retail price of tobacco products as a result of increased taxes or wholesale costs could materially impact our cigarette sales volume and/or revenues, merchandise gross profit and overall customer traffic. Cigarettes are subject to substantial and increasing excise taxes at both a state and federal level. In addition, national and local campaigns to discourage the use of tobacco products may have an adverse effect on demand for these products. A reduction in cigarette sales volume and/or revenues, merchandise gross profit from tobacco products or overall customer demand for tobacco products could have a material adverse effect on the business, financial condition and results of operations of our retail segment.
Major cigarette manufacturers currently offer substantial rebates to us; however, there can be no assurance that such rebate programs will continue. We include these rebates as a component of our gross margin from sales of cigarettes. In the event these rebates are decreased or eliminated, our wholesale cigarette costs will increase. For example, certain major cigarette manufacturers have offered rebate programs that provide rebates only if we follow the manufacturer's retail pricing guidelines. If we do not receive the rebates because we do not participate in the program or if the rebates we receive by participating in the program do not offset or surpass the revenue lost as a result of complying with the manufacturer's pricing guidelines, our cigarette gross margin will be adversely impacted. In general, we attempt to pass wholesale price increases on to our customers. However, competitive pressures in our markets may adversely impact our ability to do so. In addition, reduced retail display allowances on cigarettes offered by cigarette manufacturers negatively impact gross margins. These factors could materially impact our retail price of cigarettes, cigarette sales volume and/or revenues, merchandise gross profit and overall customer traffic, which could in turn have a material adverse effect on our business, financial condition and results of operations.
ITEM 5.OTHER INFORMATION
Dividend Declaration
On November 7, 2017, Delek's4, 2021, David Wiessman notified the Company of his intention to resign from the Board of Directors voted(the “Board”) of the Company and its committees effective as of November 10, 2021. Mr. Wiessman’s resignation was not due to declareany disagreement with the Board or the Company’s management or any matter related to the Company’s operations, policies or practices. The Company thanks Mr. Wiessman for the service and leadership he has provided since joining the Board in 2017. The Nominating and Corporate Governance Committee and Board are conducting a quarterly cash dividend of $0.15 per share of our common stock, payablesearch for a director with a focus on December 15, 2017 to shareholders of record on November 22, 2017.
candidates with diversity in gender, race, ethnic background, and professional experience.
Exhibits
ITEM 6.EXHIBITS
|
| | | | | | | | | | |
| Exhibit No. | | Description |
2.1 |
| ^ | | Agreement and Plan of Merger dated as of January 2, 2017, among Delek US Holdings, Inc., Delek Holdco, Inc., Dione Mergeco, Inc., Astro Mergeco, Inc. and Alon USA Energy, Inc. (incorporated by reference to Exhibit 2.1 to Old Delek’s Form 8-K filed on January 3, 2017).
|
2.2 |
| | | First Amendment to Agreement and Plan of Merger dated as of February 27, 2017, among Delek US Holdings, Inc. Delek Holdco, Inc., Dion Mergco, Inc, Astro Mergco, Inc. and Alon USA Energy, Inc. (incorporated by reference to Exhibit 2.6 to Old Delek’s Form 10-K filed on February 28, 2017). |
2.3 |
| | | Second Amendment to Agreement and Plan of Merger dated as of April 21, 2017, among Delek US Holdings, Inc. Delek Holdco, Inc., Dion Mergco, Inc, Astro Mergco, Inc. and Alon USA Energy, Inc. (incorporated by reference to Annex B-2 to the Company’s Proxy Statement/Prospectus filed pursuant to Rule 424(b)(3) on May 30, 2017).
|
10.1 |
| | | First Supplemental Indenture, effective as of July 1, 2017, by and among Alon USA Energy, Inc., Delek US Holdings Inc. (f/k/a Delek Holdco, Inc.) and U.S. Bank National Association, as Trustee (incorporated by reference to Exhibit 10.1 to the Company’s Form 8-K12B filed on July 3, 2017). |
10.2 |
| § | | Alon USA Energy, Inc. Second Amended and Restated 2005 Incentive Compensation Plan, as amended (incorporated by reference to Exhibit 4.6 to the Company’s Form S-8 filed on July 10, 2017).
|
|
# | § * | | Executive Employment Agreement, effective November 1, 2017, by and between Delek US Holdings, Inc. and Ezra Uzi Yemin. |
|
| * | | Certification of the Company’s Chief Executive Officer pursuant to Rule 13a-14(a)/15(d)-14(a) under the Securities Exchange Act of 1934, as amended. |
| | | |
|
# | * | | |
| | | |
|
## | ** | | |
| | | |
|
## | ** | | |
101 |
| | |
| 101 | | | The following materials from Delek US Holdings, Inc.’s Quarterly Report on Form 10-Q for the quarterly period ended September 30, 2017,2021, formatted in Inline XBRL (eXtensible Business Reporting Language): (i) Condensed Consolidated Balance Sheets as of September 30, 20172021 and December 31, 20162020 (Unaudited), (ii) Condensed Consolidated Statements of Income for the three and nine months ended September 30, 20172021 and 20162020 (Unaudited), (iii) Condensed Consolidated Statements of Comprehensive Income for the three and nine months ended September 30, 20172021 and 20162020 (Unaudited), (iv) Condensed Consolidated Statements of Changes in Stockholders' Equity for the three and nine months ended September 30, 2021 and 2020 (Unaudited), (v) Condensed Consolidated Statements of Cash Flows for the nine months ended September 30, 20172021 and 20162020 (Unaudited), and (v)(vi) Notes to Condensed Consolidated Financial Statements (Unaudited). |
| | | |
§104 | Management contract or compensatory plan or arrangement. | | The cover page from Delek US Holdings, Inc.'s Quarterly Report on Form 10-Q for the quarter ended September 30, 2021, has been formatted in Inline XBRL. |
| | | | | | | | |
*# | | Filed herewith.herewith |
| ## | | Furnished herewith |
| | | | | |
**78 | | Furnished herewith. |
| |
^ | Certain schedules and exhibits have been omitted pursuant to Item 601(b)(2) of Regulation S-K. The Company agrees to furnish supplementally a copy of any of the omitted schedules or exhibits upon request by the United States Securities and Exchange Commission, provided, however, that Delek may request confidential treatment pursuant to Rule 24b-2 of the Exchange Act, as amended, for any schedules or exhibits so furnished. |
SIGNATURES
Pursuant to the requirements of the Securities Exchange Act of 1934, the registrant has duly caused this report to be signed on its behalf by the undersigned, thereunto duly authorized.
| | | | | |
| Delek US Holdings, Inc. |
| |
Delek US Holdings, Inc. |
| By: | |
By: | /s/ Ezra Uzi Yemin |
| Ezra Uzi Yemin |
| Director (Chairman), President and Chief Executive Officer
(Principal Executive Officer)
|
| |
| By: | /s/ Kevin KremkeReuven Spiegel |
| Kevin KremkeReuven Spiegel |
| Executive Vice President and Chief Financial Officer
(Principal Financial and Accounting Officer)
|
Dated: November 5, 2021