UNITED STATES
SECURITIES AND EXCHANGE COMMISSION
Washington, D.C. 20549
Form 10-Q
(Mark One)
| | | | | | | | | | | | | | |
| ☑ | | QUARTERLY REPORT PURSUANT TO SECTION 13 OR 15(d) OF THE SECURITIES EXCHANGE ACT OF 1934 |
| | | | |
| | For the quarterly period ended | SeptemberJune 30, 20202021 | |
or
| | | | | | | | |
| ☐ | | TRANSITION REPORT PURSUANT TO SECTION 13 OR 15(d) OF THE SECURITIES EXCHANGE ACT OF 1934 |
| | |
| | For the transition period from to |
Commission file number 001-38142
DELEK US HOLDINGS, INC.
(Exact name of registrant as specified in its charter)
| | | | | | | | | | | |
| Delaware | | 35-2581557 |
| (State or other jurisdiction of incorporation or organization) | (I.R.S. Employer Identification No.) |
| |
| 7102 Commerce Way | Brentwood | Tennessee | 37027 |
| (Address of principal executive offices) | | | (Zip Code) |
(615) 771-6701
(Registrant’s telephone number, including area code)
Not Applicable
(Former name, former address and former fiscal year, if changed since last report)
Indicate by check mark whether the registrant: (1) has filed all reports required to be filed by Section 13 or 15(d) of the Securities Exchange Act of 1934 during the preceding 12 months (or for such shorter period that the registrant was required to file such reports), and (2) has been subject to such filing requirements for the past 90 days. Yes ☑ No ☐
Indicate by check mark whether the registrant has submitted electronically every Interactive Data File required to be submitted pursuant to Rule 405 of Regulation S-T during the preceding 12 months (or for such shorter period that the registrant was required to submit such files). Yes ☑ No ☐
Indicate by check mark whether the registrant is a large accelerated filer, an accelerated filer, a non-accelerated filer, a smaller reporting company or an emerging growth company. See the definitions of "large accelerated filer," "accelerated filer," "smaller reporting company" and "emerging growth company" in Rule 12b-2 of the Exchange Act.
| | | | | | | | | | | | | | | | | | | | | | | | | | | | | |
| Large accelerated filer | ☑ | Accelerated filer | ☐ | Non-accelerated filer | ☐ | Smaller reporting company | ☐ | Emerging growth company | ☐ |
If an emerging growth company, indicate by check mark if the registrant has elected not to use the extended transition period for complying with any new or revised financial accounting standards provided pursuant to Section 13(a) of the Exchange Act. ☐
Indicate by check mark whether the registrant is a shell company (as defined in Rule 12b-2 of the Exchange Act). Yes ☐ No ☑
Securities registered pursuant to Section 12(b) of the Act:
| | | | | | | | | | | | | | |
| Title of Each Class | | Trading Symbol | | Name of Each Exchange on Which Registered |
| Common Stock, par value $0.01 | | DK | | New York Stock Exchange |
| | | | |
|
At OctoberJuly 30, 2020,2021, there were 73,725,75874,062,177 shares of common stock, $0.01 par value, outstanding (excluding securities held by, or for the account of, the Company or its subsidiaries).
Delek US Holdings, Inc.
Quarterly Report on Form 10-Q
For the Quarterly Period Ended SeptemberJune 30, 20202021
Part I - FINANCIAL INFORMATION
ITEM 1. FINANCIAL STATEMENTS
Delek US Holdings, Inc.
Condensed Consolidated Balance Sheets (Unaudited)
(In millions, except share and per share data)
| | | September 30, 2020 | | December 31, 2019 | | June 30, 2021 | | December 31, 2020 |
| ASSETS | ASSETS | | | | | ASSETS | | | | |
| Current assets: | Current assets: | | | | | Current assets: | | | | |
| Cash and cash equivalents | Cash and cash equivalents | | $ | 807.9 | | | $ | 955.3 | | Cash and cash equivalents | | $ | 833.0 | | | $ | 787.5 | |
| Accounts receivable, net | Accounts receivable, net | | 518.7 | | | 792.6 | | Accounts receivable, net | | 826.3 | | | 527.9 | |
| | Inventories, net of inventory valuation reserves | Inventories, net of inventory valuation reserves | | 672.0 | | | 946.7 | | Inventories, net of inventory valuation reserves | | 1,031.2 | | | 727.7 | |
| | Other current assets | Other current assets | | 515.9 | | | 268.7 | | Other current assets | | 271.0 | | | 256.4 | |
| Total current assets | Total current assets | | 2,514.5 | | | 2,963.3 | | Total current assets | | 2,961.5 | | | 2,299.5 | |
| Property, plant and equipment: | Property, plant and equipment: | | | | | Property, plant and equipment: | | | | |
| Property, plant and equipment | Property, plant and equipment | | 3,515.7 | | | 3,362.8 | | Property, plant and equipment | | 3,630.7 | | | 3,519.5 | |
| Less: accumulated depreciation | Less: accumulated depreciation | | (1,091.8) | | | (934.5) | | Less: accumulated depreciation | | (1,268.1) | | | (1,152.3) | |
| Property, plant and equipment, net | Property, plant and equipment, net | | 2,423.9 | | | 2,428.3 | | Property, plant and equipment, net | | 2,362.6 | | | 2,367.2 | |
| Operating lease right-of-use assets | Operating lease right-of-use assets | | 180.3 | | | 183.6 | | Operating lease right-of-use assets | | 168.1 | | | 182.0 | |
| Goodwill | Goodwill | | 855.7 | | | 855.7 | | Goodwill | | 729.7 | | | 729.7 | |
| Other intangibles, net | Other intangibles, net | | 109.0 | | | 110.3 | | Other intangibles, net | | 105.7 | | | 107.8 | |
| Equity method investments | Equity method investments | | 373.1 | | | 407.3 | | Equity method investments | | 360.8 | | | 363.6 | |
| Other non-current assets | Other non-current assets | | 68.5 | | | 67.8 | | Other non-current assets | | 100.0 | | | 84.3 | |
| Total assets | Total assets | | $ | 6,525.0 | | | $ | 7,016.3 | | Total assets | | $ | 6,788.4 | | | $ | 6,134.1 | |
| LIABILITIES AND STOCKHOLDERS’ EQUITY | LIABILITIES AND STOCKHOLDERS’ EQUITY | | | | | LIABILITIES AND STOCKHOLDERS’ EQUITY | | | | |
| Current liabilities: | Current liabilities: | | | | | Current liabilities: | | | | |
| Accounts payable | Accounts payable | | $ | 973.1 | | | $ | 1,599.7 | | Accounts payable | | $ | 1,654.0 | | | $ | 1,144.0 | |
| | Current portion of long-term debt | Current portion of long-term debt | | 33.4 | | | 36.4 | | Current portion of long-term debt | | 46.4 | | | 33.4 | |
| Obligation under Supply and Offtake Agreements | Obligation under Supply and Offtake Agreements | | 102.8 | | | 332.5 | | Obligation under Supply and Offtake Agreements | | 167.3 | | | 129.2 | |
| | Current portion of operating lease liabilities | Current portion of operating lease liabilities | | 47.8 | | | 40.5 | | Current portion of operating lease liabilities | | 44.8 | | | 50.2 | |
| Accrued expenses and other current liabilities | Accrued expenses and other current liabilities | | 657.1 | | | 346.8 | | Accrued expenses and other current liabilities | | 878.8 | | | 546.4 | |
| Total current liabilities | Total current liabilities | | 1,814.2 | | | 2,355.9 | | Total current liabilities | | 2,791.3 | | | 1,903.2 | |
| Non-current liabilities: | Non-current liabilities: | | | | | Non-current liabilities: | | | | |
| Long-term debt, net of current portion | Long-term debt, net of current portion | | 2,440.6 | | | 2,030.7 | | Long-term debt, net of current portion | | 2,197.9 | | | 2,315.0 | |
| Obligation under Supply and Offtake Agreements | Obligation under Supply and Offtake Agreements | | 220.4 | | | 144.8 | | Obligation under Supply and Offtake Agreements | | 329.0 | | | 224.9 | |
| Environmental liabilities, net of current portion | Environmental liabilities, net of current portion | | 106.1 | | | 137.9 | | Environmental liabilities, net of current portion | | 109.4 | | | 107.4 | |
| Asset retirement obligations | Asset retirement obligations | | 37.2 | | | 68.6 | | Asset retirement obligations | | 38.2 | | | 37.5 | |
| Deferred tax liabilities | Deferred tax liabilities | | 316.2 | | | 267.9 | | Deferred tax liabilities | | 202.3 | | | 255.5 | |
| Operating lease liabilities, net of current portion | Operating lease liabilities, net of current portion | | 132.6 | | | 144.3 | | Operating lease liabilities, net of current portion | | 122.4 | | | 131.8 | |
| Other non-current liabilities | Other non-current liabilities | | 37.4 | | | 30.9 | | Other non-current liabilities | | 45.5 | | | 33.7 | |
| Total non-current liabilities | Total non-current liabilities | | 3,290.5 | | | 2,825.1 | | Total non-current liabilities | | 3,044.7 | | | 3,105.8 | |
| Stockholders’ equity: | Stockholders’ equity: | | | | | Stockholders’ equity: | | | | |
| Preferred stock, $0.01 par value, 10,000,000 shares authorized, 0 shares issued and outstanding | Preferred stock, $0.01 par value, 10,000,000 shares authorized, 0 shares issued and outstanding | | 0 | | | 0 | | Preferred stock, $0.01 par value, 10,000,000 shares authorized, 0 shares issued and outstanding | | 0 | | | 0 | |
| Common stock, $0.01 par value, 110,000,000 shares authorized, 91,301,229 shares and 90,987,025 shares issued at September 30, 2020 and December 31, 2019, respectively | | 0.9 | | | 0.9 | | |
| Common stock, $0.01 par value, 110,000,000 shares authorized, 91,637,661 shares and 91,356,868 shares issued at June 30, 2021 and December 31, 2020, respectively | | Common stock, $0.01 par value, 110,000,000 shares authorized, 91,637,661 shares and 91,356,868 shares issued at June 30, 2021 and December 31, 2020, respectively | | 0.9 | | | 0.9 | |
| Additional paid-in capital | Additional paid-in capital | | 1,180.1 | | | 1,151.9 | | Additional paid-in capital | | 1,192.6 | | | 1,185.1 | |
| Accumulated other comprehensive income | | 0 | | | 0.1 | | |
| Treasury stock, 17,575,527 shares and 17,516,814 shares, at cost, as of September 30, 2020 and December 31, 2019, respectively | | (694.1) | | | (692.2) | | |
| Accumulated other comprehensive loss | | Accumulated other comprehensive loss | | (7.4) | | | (7.2) | |
| Treasury stock, 17,575,527 shares, at cost, as of June 30, 2021 and December 31, 2020 | | Treasury stock, 17,575,527 shares, at cost, as of June 30, 2021 and December 31, 2020 | | (694.1) | | | (694.1) | |
| Retained earnings | Retained earnings | | 815.3 | | | 1,205.6 | | Retained earnings | | 342.0 | | | 522.0 | |
| Non-controlling interests in subsidiaries | Non-controlling interests in subsidiaries | | 118.1 | | | 169.0 | | Non-controlling interests in subsidiaries | | 118.4 | | | 118.4 | |
| Total stockholders’ equity | Total stockholders’ equity | | 1,420.3 | | | 1,835.3 | | Total stockholders’ equity | | 952.4 | | | 1,125.1 | |
| Total liabilities and stockholders’ equity | Total liabilities and stockholders’ equity | | $ | 6,525.0 | | | $ | 7,016.3 | | Total liabilities and stockholders’ equity | | $ | 6,788.4 | | | $ | 6,134.1 | |
See accompanying notes to condensed consolidated financial statements
Delek US Holdings, Inc.
Condensed Consolidated Statements of OperationsIncome (Unaudited)
(In millions, except share and per share data)
| | | Three Months Ended | | Nine Months Ended | | Three Months Ended | | Six Months Ended |
| | September 30, | | September 30, | | June 30, | | June 30, |
| | | | 2020 | | 2019 | | 2020 | | 2019 | | | 2021 | | 2020 | | 2021 | | 2020 |
| Net revenues | Net revenues | | $ | 2,062.9 | | | $ | 2,334.3 | | | $ | 5,419.6 | | | $ | 7,014.5 | | Net revenues | | $ | 2,191.5 | | | $ | 1,535.5 | | | $ | 4,583.7 | | | $ | 3,356.7 | |
| Cost of sales: | Cost of sales: | | | | | | Cost of sales: | | | | | |
| Cost of materials and other | Cost of materials and other | | 1,875.9 | | | 1,964.1 | | | 5,064.3 | | | 5,731.2 | | Cost of materials and other | | 1,995.8 | | | 1,277.8 | | | 4,201.3 | | | 3,188.4 | |
| Operating expenses (excluding depreciation and amortization presented below) | Operating expenses (excluding depreciation and amortization presented below) | | 115.7 | | | 141.7 | | | 348.3 | | | 418.4 | | Operating expenses (excluding depreciation and amortization presented below) | | 129.6 | | | 103.4 | | | 257.6 | | | 232.6 | |
| Depreciation and amortization | Depreciation and amortization | | 59.4 | | | 43.8 | | | 160.0 | | | 125.7 | | Depreciation and amortization | | 60.5 | | | 53.6 | | | 122.8 | | | 100.6 | |
| Total cost of sales | Total cost of sales | | 2,051.0 | | | 2,149.6 | | | 5,572.6 | | | 6,275.3 | | Total cost of sales | | 2,185.9 | | | 1,434.8 | | | 4,581.7 | | | 3,521.6 | |
| | Operating expenses related to retail and wholesale business (excluding depreciation and amortization presented below) | Operating expenses related to retail and wholesale business (excluding depreciation and amortization presented below) | | 24.0 | | | 25.2 | | | 73.7 | | | 77.5 | | Operating expenses related to retail and wholesale business (excluding depreciation and amortization presented below) | | 31.5 | | | 24.4 | | | 52.8 | | | 49.7 | |
| General and administrative expenses | General and administrative expenses | | 57.0 | | | 65.6 | | | 184.4 | | | 197.3 | | General and administrative expenses | | 58.6 | | | 61.7 | | | 105.7 | | | 127.4 | |
| Depreciation and amortization | Depreciation and amortization | | 5.8 | | | 6.0 | | | 17.4 | | | 21.0 | | Depreciation and amortization | | 5.8 | | | 6.0 | | | 12.0 | | | 11.6 | |
| | Other operating loss (income), net | | 0.3 | | | 0.5 | | | (14.6) | | | (0.7) | | |
| | Other operating income, net | | Other operating income, net | | (4.9) | | | (14.2) | | | (3.0) | | | (14.9) | |
| Total operating costs and expenses | Total operating costs and expenses | | 2,138.1 | | | 2,246.9 | | | 5,833.5 | | | 6,570.4 | | Total operating costs and expenses | | 2,276.9 | | | 1,512.7 | | | 4,749.2 | | | 3,695.4 | |
| Operating (loss) income | Operating (loss) income | | (75.2) | | | 87.4 | | | (413.9) | | | 444.1 | | Operating (loss) income | | (85.4) | | | 22.8 | | | (165.5) | | | (338.7) | |
| Interest expense | Interest expense | | 31.9 | | | 33.9 | | | 98.0 | | | 95.4 | | Interest expense | | 33.2 | | | 29.8 | | | 62.8 | | | 66.1 | |
| Interest income | Interest income | | (0.9) | | | (3.2) | | | (3.1) | | | (9.0) | | Interest income | | (0.1) | | | (0.5) | | | (0.3) | | | (2.2) | |
| Income from equity method investments | Income from equity method investments | | (12.8) | | | (16.5) | | | (28.6) | | | (28.4) | | Income from equity method investments | | (6.8) | | | (10.7) | | | (11.6) | | | (15.8) | |
| | Loss (gain) on sale of non-operating refinery | | 0.1 | | | 0 | | | (56.8) | | | 0 | | |
| Gain on sale on non-operating refinery | | Gain on sale on non-operating refinery | | 0 | | | (56.9) | | | 0 | | | (56.9) | |
| | Other (income) expense, net | | (1.0) | | | (0.2) | | | (3.4) | | | 3.3 | | |
| Total non-operating expense, net | | 17.3 | | | 14.0 | | | 6.1 | | | 61.3 | | |
| (Loss) income before income tax (benefit) expense | | (92.5) | | | 73.4 | | | (420.0) | | | 382.8 | | |
| Income tax (benefit) expense | | (15.6) | | | 13.4 | | | (134.6) | | | 83.8 | | |
| (Loss) income from continuing operations, net of tax | | (76.9) | | | 60.0 | | | (285.4) | | | 299.0 | | |
| Discontinued operations: | | | | | | | | | |
| Loss from discontinued operations, including loss on sale of discontinued operations | | 0 | | | 0 | | | 0 | | | (1.0) | | |
| Other expense (income), net | | Other expense (income), net | | 6.8 | | | (1.5) | | | 5.8 | | | (2.4) | |
| Total non-operating expense (income), net | | Total non-operating expense (income), net | | 33.1 | | | (39.8) | | | 56.7 | | | (11.2) | |
| (Loss) income before income tax benefit | | (Loss) income before income tax benefit | | (118.5) | | | 62.6 | | | (222.2) | | | (327.5) | |
| Income tax benefit | Income tax benefit | | 0 | | | 0 | | | 0 | | | (0.2) | | Income tax benefit | | (46.0) | | | (35.9) | | | (58.4) | | | (119.0) | |
| Loss from discontinued operations, net of tax | | 0 | | | 0 | | | 0 | | | (0.8) | | |
| | Net (loss) income | Net (loss) income | | (76.9) | | | 60.0 | | | (285.4) | | | 298.2 | | Net (loss) income | | (72.5) | | | 98.5 | | | (163.8) | | | (208.5) | |
| Net income attributed to non-controlling interests | Net income attributed to non-controlling interests | | 11.2 | | | 8.7 | | | 29.4 | | | 20.3 | | Net income attributed to non-controlling interests | | 8.6 | | | 10.8 | | | 15.9 | | | 18.2 | |
| Net (loss) income attributable to Delek | Net (loss) income attributable to Delek | | $ | (88.1) | | | $ | 51.3 | | | $ | (314.8) | | | $ | 277.9 | | Net (loss) income attributable to Delek | | $ | (81.1) | | | $ | 87.7 | | | $ | (179.7) | | | $ | (226.7) | |
| Basic (loss) income per share: | | | | | | | | | |
| (Loss) income from continuing operations | | $ | (1.20) | | | $ | 0.68 | | | $ | (4.28) | | | $ | 3.64 | | |
| Loss from discontinued operations | | 0 | | | $ | 0 | | | 0 | | | (0.01) | | |
| | Basic (loss) income per share | Basic (loss) income per share | | $ | (1.20) | | | $ | 0.68 | | | $ | (4.28) | | | $ | 3.63 | | Basic (loss) income per share | | $ | (1.10) | | | $ | 1.19 | | | $ | (2.43) | | | $ | (3.08) | |
| Diluted (loss) income per share: | | | | | | | | | |
| (Loss) income from continuing operations | | $ | (1.20) | | | $ | 0.68 | | | $ | (4.28) | | | $ | 3.61 | | |
| Loss from discontinued operations | | 0 | | | 0 | | | 0 | | | (0.01) | | |
| | Diluted (loss) income per share | Diluted (loss) income per share | | $ | (1.20) | | | $ | 0.68 | | | $ | (4.28) | | | $ | 3.60 | | Diluted (loss) income per share | | $ | (1.10) | | | $ | 1.18 | | | $ | (2.43) | | | $ | (3.08) | |
| | Dividends declared per common share outstanding | Dividends declared per common share outstanding | | $ | 0.31 | | | $ | 0.29 | | | $ | 0.93 | | | $ | 0.84 | | Dividends declared per common share outstanding | | $ | 0 | | | $ | 0.31 | | | $ | 0 | | | $ | 0.62 | |
See accompanying notes to condensed consolidated financial statements
Delek US Holdings, Inc.
Condensed Consolidated Statements of Comprehensive OperationsIncome (Unaudited)
(In millions)
| | | Three Months Ended | | Nine Months Ended | | Three Months Ended | | Six Months Ended |
| | September 30, | | September 30, | | June 30, | | June 30, |
| | | | 2020 | | 2019 | | 2020 | | 2019 | | | 2021 | | 2020 | | 2021 | | 2020 |
| Net (loss) income | Net (loss) income | | $ | (76.9) | | | $ | 60.0 | | | $ | (285.4) | | | $ | 298.2 | | Net (loss) income | | $ | (72.5) | | | $ | 98.5 | | | $ | (163.8) | | | $ | (208.5) | |
| Other comprehensive income (loss): | Other comprehensive income (loss): | | | | | | | | Other comprehensive income (loss): | | | | | | | |
| Commodity contracts designated as cash flow hedges: | Commodity contracts designated as cash flow hedges: | | | | | | Commodity contracts designated as cash flow hedges: | | | | | |
| | Net loss related to commodity cash flow hedges | | (0.6) | | | (19.8) | | | (0.3) | | | (23.2) | | |
| Net (loss) gain related to commodity cash flow hedges | | Net (loss) gain related to commodity cash flow hedges | | 0 | | | (1.4) | | | (0.2) | | | 0.3 | |
| Income tax benefit | Income tax benefit | | (0.1) | | | (4.1) | | | (0.1) | | | (4.8) | | Income tax benefit | | 0 | | | (0.3) | | | 0 | | | 0 | |
| Net comprehensive loss on commodity contracts designated as cash flow hedges | | (0.5) | | | (15.7) | | | (0.2) | | | (18.4) | | |
| Net comprehensive (loss) income on commodity contracts designated as cash flow hedges | | Net comprehensive (loss) income on commodity contracts designated as cash flow hedges | | 0 | | | (1.1) | | | (0.2) | | | 0.3 | |
| | Other income, net of taxes | Other income, net of taxes | | 0 | | | 0.1 | | | 0.1 | | | 0.5 | | Other income, net of taxes | | 0 | | | 0.4 | | | 0 | | | 0.1 | |
| Total other comprehensive loss | | (0.5) | | | (15.6) | | | (0.1) | | | (17.9) | | |
| Total other comprehensive (loss) gain | | Total other comprehensive (loss) gain | | 0 | | | (0.7) | | | (0.2) | | | 0.4 | |
| Comprehensive (loss) income | Comprehensive (loss) income | | (77.4) | | | 44.4 | | | (285.5) | | | 280.3 | | Comprehensive (loss) income | | (72.5) | | | 97.8 | | | (164.0) | | | (208.1) | |
| Comprehensive income attributable to non-controlling interest | Comprehensive income attributable to non-controlling interest | | 11.2 | | | 8.7 | | | 29.4 | | | 20.3 | | Comprehensive income attributable to non-controlling interest | | 8.6 | | | 10.8 | | | 15.9 | | | 18.2 | |
| Comprehensive (loss) income attributable to Delek | Comprehensive (loss) income attributable to Delek | | $ | (88.6) | | | $ | 35.7 | | | $ | (314.9) | | | $ | 260.0 | | Comprehensive (loss) income attributable to Delek | | $ | (81.1) | | | $ | 87.0 | | | $ | (179.9) | | | $ | (226.3) | |
See accompanying notes to condensed consolidated financial statements
Delek US Holdings, Inc.
Condensed Consolidated Statements of Changes in Stockholders' Equity (Unaudited)
(In millions, except share and per share data)
| | | | | | | | | | | | | | | | | | | | | | | | | | | | | | | | | | | | | | | | | | | | | | | | | | | | | | | | |
| | Three Months Ended September 30, 2020 |
| | Common Stock | | Additional Paid-in Capital | | Accumulated Other Comprehensive Income | | Retained Earnings | | Treasury Stock | | Non-Controlling Interest in Subsidiaries | | Total Stockholders' Equity |
| | Shares | | Amount | | Shares | | Amount | |
| Balance at | June 30, 2020 | 91,232,964 | | $ | 0.9 | | | $ | 1,160.1 | | | $ | 0.5 | | | $ | 926.4 | | | (17,575,527) | | $ | (694.1) | | | $ | 165.5 | | | $ | 1,559.3 | |
| | | | | | | | | | | | | | | | | |
| Net (loss) income | — | | — | | | — | | | — | | | (88.1) | | | — | | | — | | | 11.2 | | | (76.9) | |
| Other comprehensive loss related to commodity contracts, net | — | | — | | | — | | | (0.5) | | | — | | | — | | | — | | | — | | | (0.5) | |
| | | | | | | | | | | | | | | | | |
| Common stock dividends ($0.31 per share) | — | | — | | | — | | | — | | | (23.0) | | | — | | | — | | | — | | | (23.0) | |
| Distributions to non-controlling interests | — | | — | | | — | | | — | | | — | | | — | | | — | | | (8.2) | | | (8.2) | |
| Equity-based compensation expense | — | | — | | | 6.7 | | | — | | | — | | | — | | | — | | | — | | | 6.7 | |
| | | | | | | | | | | | | | | | | |
| | | | | | | | | | | | | | | | | |
| Repurchase of non-controlling interests | — | | | — | | | (23.5) | | | — | | | — | | | — | | | — | | | 0.4 | | | (23.1) | |
| Impact from IDR Simplification transaction of Delek Logistics LP | — | | | — | | | 37.2 | | | — | | | — | | | — | | | — | | | (50.8) | | | (13.6) | |
| Taxes paid due to the net settlement of equity-based compensation | — | | — | | | (0.4) | | | — | | | — | | | — | | | — | | | — | | | (0.4) | |
| Exercise of equity-based awards | 68,265 | | | — | | | — | | | — | | | — | | | — | | | — | | | — | | | — | |
| | | | | | | | | | | | | | | | | |
| Balance at | September 30, 2020 | 91,301,229 | | | $ | 0.9 | | | $ | 1,180.1 | | | $ | 0 | | | $ | 815.3 | | | (17,575,527) | | | $ | (694.1) | | | $ | 118.1 | | | $ | 1,420.3 | |
| | | | | | | | | | | | | | | | | | | | | | | | | | | | | | | | | | | | | | | | | | | | | | | | | | | | | | | | |
| | Three Months Ended June 30, 2021 |
| | Common Stock | | Additional Paid-in Capital | | Accumulated Other Comprehensive Income | | Retained Earnings | | Treasury Stock | | Non-Controlling Interest in Subsidiaries | | Total Stockholders' Equity |
| | Shares | | Amount | | Shares | | Amount | |
| Balance at March 31, 2021 | | 91,450,724 | | $ | 0.9 | | | $ | 1,188.6 | | | $ | (7.4) | | | $ | 423.2 | | | (17,575,527) | | $ | (694.1) | | | $ | 117.7 | | | $ | 1,028.9 | |
| | | | | | | | | | | | | | | | | |
| Net (loss) income | | — | | — | | | — | | | — | | | (81.1) | | | — | | | — | | | 8.6 | | | (72.5) | |
| | | | | | | | | | | | | | | | | | |
| | | | | | | | | | | | | | | | | | |
| | | | | | | | | | | | | | | | | | |
| Distributions to non-controlling interests | | — | | — | | | — | | | — | | | — | | | — | | | — | | | (7.9) | | | (7.9) | |
| Equity-based compensation expense | | — | | — | | | 5.9 | | | — | | | — | | | — | | | — | | | 0 | | | 5.9 | |
| | | | | | | | | | | | | | | | | | |
| | | | | | | | | | | | | | | | | | |
| | | | | | | | | | | | | | | | | | |
| Taxes paid due to the net settlement of equity-based compensation | | — | | — | | | (1.9) | | | — | | | — | | | — | | | — | | | 0 | | | (1.9) | |
| Exercise of equity-based awards | | 186,937 | | — | | | — | | | — | | | — | | | — | | | — | | | — | | | — | |
| Other | | — | | — | | | 0 | | | 0 | | | (0.1) | | | — | | | 0 | | | 0 | | | (0.1) | |
| Balance at June 30, 2021 | | 91,637,661 | | | $ | 0.9 | | | $ | 1,192.6 | | | $ | (7.4) | | | $ | 342.0 | | | (17,575,527) | | | $ | (694.1) | | | $ | 118.4 | | | $ | 952.4 | |
| | | | | | | | | | | | | | | | | | | | | | | | | | | | | | | | | | | | | | | | | | | | | | | | | | | | | | | | |
| | Three Months Ended June 30, 2020 |
| | Common Stock | | Additional Paid-in Capital | | Accumulated Other Comprehensive Income | | Retained Earnings | | Treasury Stock | | Non-Controlling Interest in Subsidiaries | | Total Stockholders' Equity |
| | Shares | | Amount | | | | | Shares | | Amount | | |
| Balance at March 31, 2020 | | 91,089,920 | | | $ | 0.9 | | | $ | 1,157.4 | | | $ | 1.2 | | | $ | 861.6 | | | (17,575,527) | | | $ | (694.1) | | | $ | 162.9 | | | $ | 1,489.9 | |
| Net income | | — | | | — | | | — | | | — | | | 87.7 | | | — | | | — | | | 10.8 | | | 98.5 | |
| Other comprehensive loss related to commodity contracts, net | | — | | | — | | | — | | | (1.1) | | | — | | | — | | | — | | | — | | | (1.1) | |
| Common stock dividends ($0.31 per share) | | — | | | — | | | — | | | — | | | (22.9) | | | — | | | — | | | 0 | | | (22.9) | |
| Distribution to non-controlling interest | | — | | | — | | | — | | | — | | | — | | | — | | | — | | | (8.2) | | | (8.2) | |
| Equity-based compensation expense | | — | | | — | | | 4.7 | | | — | | | — | | | — | | | — | | | 0 | | | 4.7 | |
| Repurchase of non-controlling interest | | — | | | — | | | (0.8) | | | — | | | — | | | — | | | — | | | 0 | | | (0.8) | |
| Taxes paid due to the net settlement of equity-based compensation | | — | | | — | | | (1.2) | | | — | | | — | | | — | | | — | | | 0 | | | (1.2) | |
| Exercise of equity-based awards | | 143,044 | | | — | | | — | | | — | | | — | | | — | | | — | | | — | | | — | |
| Other | | — | | | — | | | 0 | | | 0.4 | | | 0 | | | — | | | 0 | | | 0 | | | 0.4 | |
| Balance at June 30, 2020 | | 91,232,964 | | | $ | 0.9 | | | $ | 1,160.1 | | | $ | 0.5 | | | $ | 926.4 | | | (17,575,527) | | | $ | (694.1) | | | $ | 165.5 | | | $ | 1,559.3 | |
Delek US Holdings, Inc.
Condensed Consolidated Statements of Changes in Stockholders' Equity (Unaudited)
(In millions, except share and per share data)
| | | | | | | | | | | | | | | | | | | | | | | | | | | | | | | | | | | | | | | | | | | | | | | | | | | | | | | | |
| | Three Months Ended September 30, 2019 |
| | Common Stock | | Additional Paid-in Capital | | Accumulated Other Comprehensive Income | | Retained Earnings | | Treasury Stock | | Non-Controlling Interest in Subsidiaries | | Total Stockholders' Equity |
| | Shares | | Amount | | | | | Shares | | Amount | | |
| Balance at | June 30, 2019 | 90,861,698 | | | $ | 0.9 | | | $ | 1,140.3 | | | $ | 26.3 | | | $ | 1,165.9 | | | (15,416,502) | | | $ | (618.9) | | | $ | 171.7 | | | $ | 1,886.2 | |
| Net income | — | | | — | | | — | | | — | | | 51.3 | | | — | | | — | | | 8.7 | | | 60.0 | |
| Other comprehensive loss related to commodity contracts, net | — | | | — | | | — | | | (15.7) | | | — | | | — | | | — | | | — | | | (15.7) | |
| Common stock dividends ($0.29 per share) | — | | | — | | | — | | | — | | | (21.8) | | | — | | | — | | | 0 | | | (21.8) | |
| Distribution to non-controlling interest | — | | | — | | | — | | | — | | | — | | | — | | | — | | | (8.2) | | | (8.2) | |
| Equity-based compensation expense | — | | | — | | | 7.3 | | | — | | | — | | | — | | | — | | | 0.1 | | | 7.4 | |
| Repurchase of common stock | — | | | — | | | — | | | — | | | — | | | (1,236,854) | | | (43.0) | | | 0 | | | (43.0) | |
| Taxes paid due to the net settlement of equity-based compensation | — | | | — | | | (1.5) | | | — | | | — | | | — | | | — | | | — | | | (1.5) | |
| Exercise of equity-based awards | 78,695 | | | — | | | — | | | — | | | — | | | — | | | — | | | — | | | — | |
| Other | — | | | — | | | 0 | | | 0.1 | | | (0.1) | | | — | | | 0 | | | 0 | | | 0 | |
| Balance at | September 30, 2019 | 90,940,393 | | | $ | 0.9 | | | $ | 1,146.1 | | | $ | 10.7 | | | $ | 1,195.3 | | | (16,653,356) | | | $ | (661.9) | | | $ | 172.3 | | | $ | 1,863.4 | |
| | | | | | | | | | | | | | | | | | | | | | | | | | | | | | | | | | | | | | | | | | | | | | | | | | | | | | | | |
| | Six Months Ended June 30, 2021 |
| | Common Stock | | Additional Paid-in Capital | | Accumulated Other Comprehensive Income | | Retained Earnings | | Treasury Stock | | Non-Controlling Interest in Subsidiaries | | Total Stockholders' Equity |
| | Shares | | Amount | | Shares | | Amount | |
| Balance at December 31, 2020 | | 91,356,868 | | $ | 0.9 | | | $ | 1,185.1 | | | $ | (7.2) | | | $ | 522.0 | | | (17,575,527) | | $ | (694.1) | | | $ | 118.4 | | | $ | 1,125.1 | |
| Net (loss) income | | — | | — | | | — | | | — | | | (179.7) | | | — | | | — | | | 15.9 | | | (163.8) | |
| Other comprehensive loss related to commodity contracts, net | | — | | — | | | — | | | (0.2) | | | — | | | — | | | — | | | — | | | (0.2) | |
| | | | | | | | | | | | | | | | | |
| | | | | | | | | | | | | | | | | | |
| Distributions to non-controlling interests | | — | | — | | | — | | | — | | | — | | | — | | | — | | | (15.9) | | | (15.9) | |
| Equity-based compensation expense | | — | | — | | | 10.5 | | | — | | | — | | | — | | | — | | | 0 | | | 10.5 | |
| | | | | | | | | | | | | | | | | |
| | | | | | | | | | | | | | | | | |
| | | | | | | | | | | | | | | | | |
| | | | | | | | | | | | | | | | | |
| | | | | | | | | | | | | | | | | |
| | | | | | | | | | | | | | | | | | |
| | | | | | | | | | | | | | | | | |
| | | | | | | | | | | | | | | | | |
| Taxes paid due to the net settlement of equity-based compensation | | — | | — | | | (3.0) | | | — | | | — | | | — | | | — | | | 0 | | | (3.0) | |
| Exercise of equity-based awards | | 280,793 | | | — | | | — | | | — | | | — | | | — | | | — | | | — | | | — | |
| Other | | — | | | — | | | 0 | | | 0 | | | (0.3) | | | — | | | 0 | | | 0 | | | (0.3) | |
| Balance at June 30, 2021 | | 91,637,661 | | | $ | 0.9 | | | $ | 1,192.6 | | | $ | (7.4) | | | $ | 342.0 | | | (17,575,527) | | | $ | (694.1) | | | $ | 118.4 | | | $ | 952.4 | |
| | | | | | | | | | | | | | | | | | | | | | | | | | | | | | | | | | | | | | | | | | | | | | | | | | | | | | | | |
| | Six Months Ended June 30, 2020 |
| | Common Stock | | Additional Paid-in Capital | | Accumulated Other Comprehensive Income | | Retained Earnings | | Treasury Stock | | Non-Controlling Interest in Subsidiaries | | Total Stockholders' Equity |
| | Shares | | Amount | | | | | Shares | | Amount | | |
| Balance at December 31, 2019 | | 90,987,025 | | | $ | 0.9 | | | $ | 1,151.9 | | | $ | 0.1 | | | $ | 1,205.6 | | | (17,516,814) | | | $ | (692.2) | | | $ | 169.0 | | | $ | 1,835.3 | |
| Cumulative effect of adopting accounting principle regarding measurement of credit losses on financial instruments, net | | — | | | — | | | — | | | — | | | (6.5) | | | — | | | — | | | — | | | (6.5) | |
| Net (loss) income | | — | | | — | | | — | | | — | | | (226.7) | | | — | | | — | | | 18.2 | | | (208.5) | |
| Other comprehensive income related to commodity contracts, net | | — | | | — | | | — | | | 0.3 | | | — | | | — | | | — | | | — | | | 0.3 | |
| | | | | | | | | | | | | | | | | |
| Common stock dividends ($0.62 per share) | | — | | | — | | | — | | | — | | | (46.0) | | | — | | | — | | | 0 | | | (46.0) | |
| Distribution to non-controlling interest | | — | | | — | | | — | | | — | | | — | | | — | | | — | | | (16.8) | | | (16.8) | |
| Equity-based compensation expense | | — | | | — | | | 10.9 | | | — | | | — | | | — | | | — | | | 0.1 | | | 11.0 | |
| Repurchase of common stock | | — | | | — | | | — | | | — | | | — | | | (58,713) | | | (1.9) | | | — | | | (1.9) | |
| Repurchases of non-controlling interests | | — | | | — | | | (0.8) | | | — | | | — | | | — | | | — | | | (5.0) | | | (5.8) | |
| Taxes paid due to the net settlement of equity-based compensation | | — | | | — | | | (1.9) | | | — | | | — | | | — | | | — | | | 0 | | | (1.9) | |
| Exercise of equity-based awards | | 245,939 | | | — | | | — | | | — | | | — | | | — | | | — | | | — | | | — | |
| Other | | — | | | — | | | 0 | | | 0.1 | | | 0 | | | — | | | 0 | | | 0 | | | 0.1 | |
| Balance at June 30, 2020 | | 91,232,964 | | | $ | 0.9 | | | $ | 1,160.1 | | | $ | 0.5 | | | $ | 926.4 | | | (17,575,527) | | | $ | (694.1) | | | $ | 165.5 | | | $ | 1,559.3 | |
Delek US Holdings, Inc.
Condensed Consolidated Statements of Changes in Stockholders' Equity (Unaudited)
(In millions, except share and per share data)
| | | | | | | | | | | | | | | | | | | | | | | | | | | | | | | | | | | | | | | | | | | | | | | | | | | | | | | | |
| | Nine Months Ended September 30, 2020 |
| | Common Stock | | Additional Paid-in Capital | | Accumulated Other Comprehensive Income | | Retained Earnings | | Treasury Stock | | Non-Controlling Interest in Subsidiaries | | Total Stockholders' Equity |
| | Shares | | Amount | | Shares | | Amount | |
| Balance at | December 31, 2019 | 90,987,025 | | $ | 0.9 | | | $ | 1,151.9 | | | $ | 0.1 | | | $ | 1,205.6 | | | (17,516,814) | | $ | (692.2) | | | $ | 169.0 | | | $ | 1,835.3 | |
| Cumulative effect of adopting accounting principle regarding measurement of credit losses on financial instruments, net | — | | — | | | — | | | — | | | (6.5) | | | — | | | — | | | — | | | (6.5) | |
| Net (loss) income | — | | — | | | — | | | — | | | (314.8) | | | — | | | — | | | 29.4 | | | (285.4) | |
| Other comprehensive loss related to commodity contracts, net | — | | — | | | — | | | (0.2) | | | — | | | — | | | — | | | — | | | (0.2) | |
| | | | | | | | | | | | | | | | | |
| Common stock dividends ($0.93 per share) | — | | — | | | — | | | — | | | (69.0) | | | — | | | — | | | 0 | | | (69.0) | |
| Distributions to non-controlling interests | — | | — | | | — | | | — | | | — | | | — | | | — | | | (25.0) | | | (25.0) | |
| Equity-based compensation expense | — | | — | | | 17.6 | | | — | | | — | | | — | | | — | | | 0.1 | | | 17.7 | |
| | | | | | | | | | | | | | | | | |
| | | | | | | | | | | | | | | | | |
| | | | | | | | | | | | | | | | | |
| | | | | | | | | | | | | | | | | |
| | | | | | | | | | | | | | | | | |
| Repurchase of common stock | — | | | — | | | — | | | — | | | — | | | (58,713) | | | (1.9) | | | 0 | | | (1.9) | |
| Repurchases of non-controlling interests | — | | | — | | | (24.3) | | | — | | | — | | | — | | | — | | | (4.6) | | | (28.9) | |
| Impact from IDR Simplification transaction of Delek Logistics LP | — | | | — | | | 37.2 | | | — | | | — | | | — | | | — | | | (50.8) | | | (13.6) | |
| Taxes paid due to the net settlement of equity-based compensation | — | | — | | | (2.3) | | | — | | | — | | | — | | | — | | | 0 | | | (2.3) | |
| Exercise of equity-based awards | 314,204 | | | — | | | — | | | — | | | — | | | — | | | — | | | — | | | — | |
| Other | — | | | — | | | 0 | | | 0.1 | | | 0 | | | — | | | 0 | | | 0 | | | 0.1 | |
| Balance at | September 30, 2020 | 91,301,229 | | | $ | 0.9 | | | $ | 1,180.1 | | | $ | 0 | | | $ | 815.3 | | | (17,575,527) | | | $ | (694.1) | | | $ | 118.1 | | | $ | 1,420.3 | |
Delek US Holdings, Inc.
Condensed Consolidated Statements of Changes in Stockholders' Equity (Unaudited) (Continued)
(In millions, except share and per share data)
| | | | | | | | | | | | | | | | | | | | | | | | | | | | | | | | | | | | | | | | | | | | | | | | | | | | | | | | |
| | Nine Months Ended September 30, 2019 |
| | Common Stock | | Additional Paid-in Capital | | Accumulated Other Comprehensive Income | | Retained Earnings | | Treasury Stock | | Non-Controlling Interest in Subsidiaries | | Total Stockholders' Equity |
| | Shares | | Amount | | | | | Shares | | Amount | | |
| Balance at | December 31, 2018 | 90,478,075 | | | $ | 0.9 | | | $ | 1,135.4 | | | $ | 28.6 | | | $ | 981.8 | | | (12,477,780) | | | $ | (514.1) | | | $ | 175.5 | | | $ | 1,808.1 | |
| Net income | — | | | — | | | — | | | — | | | 277.9 | | | — | | | — | | | 20.3 | | | 298.2 | |
| Other comprehensive loss related to commodity contracts, net | — | | | — | | | — | | | (18.4) | | | — | | | — | | | — | | | — | | | (18.4) | |
| | | | | | | | | | | | | | | | | |
| Common stock dividends ($0.84 per share) | — | | | — | | | — | | | — | | | (64.3) | | | — | | | — | | | 0 | | | (64.3) | |
| Distribution to non-controlling interest | — | | | — | | | — | | | — | | | — | | | — | | | — | | | (23.8) | | | (23.8) | |
| Equity-based compensation expense | — | | | — | | | 18.9 | | | — | | | — | | | — | | | — | | | 0.3 | | | 19.2 | |
| Repurchase of common stock | — | | | — | | | — | | | — | | | — | | | (4,175,576) | | | (147.8) | | | 0 | | | (147.8) | |
| Taxes paid due to the net settlement of equity-based compensation | — | | | — | | | (8.4) | | | — | | | — | | | — | | | — | | | 0 | | | (8.4) | |
| Exercise of equity-based awards | 462,318 | | | — | | | — | | | — | | | — | | | — | | | — | | | — | | | — | |
| Other | — | | | — | | | 0.2 | | | 0.5 | | | (0.1) | | | — | | | 0 | | | 0 | | | 0.6 | |
| Balance at | September 30, 2019 | 90,940,393 | | | $ | 0.9 | | | $ | 1,146.1 | | | $ | 10.7 | | | $ | 1,195.3 | | | (16,653,356) | | | $ | (661.9) | | | $ | 172.3 | | | $ | 1,863.4 | |
See accompanying notes to condensed consolidated financial statements
Delek US Holdings, Inc.
Condensed Consolidated Statements of Cash Flows (Unaudited)
(In millions)
| | | | | Nine Months Ended September 30, | | | Six Months Ended June 30, |
| | 2020 | | 2019 | | 2021 | | 2020 |
| Cash flows from operating activities: | Cash flows from operating activities: | | | | | Cash flows from operating activities: | | | | |
| Net (loss) income | | $ | (285.4) | | | $ | 298.2 | | |
| Adjustments to reconcile net (loss) income to net cash (used in) provided by operating activities: | | | | | |
| Net loss | | Net loss | | $ | (163.8) | | | $ | (208.5) | |
| Adjustments to reconcile net loss to net cash provided by (used in) operating activities: | | Adjustments to reconcile net loss to net cash provided by (used in) operating activities: | | | | |
| Depreciation and amortization | Depreciation and amortization | | 177.4 | | | 146.7 | | Depreciation and amortization | | 134.8 | | | 112.2 | |
| Other amortization/accretion | | 7.8 | | | 7.1 | | |
| | Non-cash lease expense | Non-cash lease expense | | 34.0 | | | 29.6 | | Non-cash lease expense | | 28.1 | | | 21.9 | |
| Deferred income taxes | Deferred income taxes | | 32.9 | | | 26.3 | | Deferred income taxes | | (52.9) | | | 65.9 | |
| | Income from equity method investments | Income from equity method investments | | (28.6) | | | (28.4) | | Income from equity method investments | | (11.6) | | | (15.8) | |
| Dividends from equity method investments | Dividends from equity method investments | | 21.6 | | | 11.7 | | Dividends from equity method investments | | 10.6 | | | 14.3 | |
| Non-cash lower of cost or market/net realizable value adjustment | Non-cash lower of cost or market/net realizable value adjustment | | 65.6 | | | (31.5) | | Non-cash lower of cost or market/net realizable value adjustment | | (30.1) | | | 75.1 | |
| | Gain on sale of non-operating refinery | Gain on sale of non-operating refinery | | (56.8) | | | 0 | | Gain on sale of non-operating refinery | | 0 | | | (56.9) | |
| | Equity-based compensation expense | | 17.7 | | | 19.2 | | |
| | | Other | Other | | 2.7 | | | 2.6 | | Other | | 13.9 | | | 17.4 | |
| Changes in assets and liabilities: | Changes in assets and liabilities: | | | | | Changes in assets and liabilities: | | | | |
| Accounts receivable | Accounts receivable | | 268.9 | | | (319.4) | | Accounts receivable | | (298.4) | | | 307.2 | |
| Inventories and other current assets | Inventories and other current assets | | (42.1) | | | (180.0) | | Inventories and other current assets | | (302.5) | | | 125.0 | |
| Fair value of derivatives | Fair value of derivatives | | (0.5) | | | (12.8) | | Fair value of derivatives | | (7.1) | | | (23.6) | |
| Accounts payable and other current liabilities | Accounts payable and other current liabilities | | (464.9) | | | 474.3 | | Accounts payable and other current liabilities | | 671.4 | | | (594.6) | |
| Obligation under Supply and Offtake Agreements | Obligation under Supply and Offtake Agreements | | (154.1) | | | 46.4 | | Obligation under Supply and Offtake Agreements | | 148.6 | | | (163.3) | |
| Non-current assets and liabilities, net | Non-current assets and liabilities, net | | 4.0 | | | (41.6) | | Non-current assets and liabilities, net | | (6.1) | | | 0.6 | |
| | Net cash (used in) provided by operating activities | | (399.8) | | | 448.4 | | |
| Net cash provided by (used in) operating activities | | Net cash provided by (used in) operating activities | | 134.9 | | | (323.1) | |
| Cash flows from investing activities: | Cash flows from investing activities: | | | | | Cash flows from investing activities: | | | | |
| | Equity method investment contributions | Equity method investment contributions | | (30.8) | | | (214.0) | | Equity method investment contributions | | (1.6) | | | (29.5) | |
| Distributions from equity method investments | Distributions from equity method investments | | 72.0 | | | 0.8 | | Distributions from equity method investments | | 5.4 | | | 71.0 | |
| Purchases of property, plant and equipment | Purchases of property, plant and equipment | | (241.7) | | | (305.7) | | Purchases of property, plant and equipment | | (132.7) | | | (235.4) | |
| | Purchase of intangible assets | Purchase of intangible assets | | (2.6) | | | (0.8) | | Purchase of intangible assets | | (0.7) | | | (2.1) | |
| Proceeds from sale of property, plant and equipment | Proceeds from sale of property, plant and equipment | | 0.2 | | | 0.3 | | Proceeds from sale of property, plant and equipment | | 10.9 | | | 0.2 | |
| Proceeds from sale of retail stores | | 0 | | | 9.9 | | |
| | Proceeds from sale of non-operating refinery | Proceeds from sale of non-operating refinery | | 39.9 | | | 0 | | Proceeds from sale of non-operating refinery | | 0 | | | 39.9 | |
| | Net cash used in investing activities | Net cash used in investing activities | | (163.0) | | | (509.5) | | Net cash used in investing activities | | (118.7) | | | (155.9) | |
| Cash flows from financing activities: | | Cash flows from financing activities: | | | | |
| Proceeds from long-term revolvers | | Proceeds from long-term revolvers | | 1,026.5 | | | 1,583.7 | |
| Payments on long-term revolvers | | Payments on long-term revolvers | | (1,501.3) | | | (1,352.1) | |
| Proceeds from term debt | | Proceeds from term debt | | 400.0 | | | 185.0 | |
| Payments on term debt | | Payments on term debt | | (26.7) | | | (31.2) | |
| Proceeds from product financing agreements | | Proceeds from product financing agreements | | 458.2 | | | 86.4 | |
| Repayments of product financing agreements | | Repayments of product financing agreements | | (302.2) | | | (26.5) | |
| | Taxes paid due to the net settlement of equity-based compensation | | Taxes paid due to the net settlement of equity-based compensation | | (3.0) | | | (1.9) | |
| | Repurchase of common stock | | Repurchase of common stock | | 0 | | | (1.9) | |
| Repurchase of non-controlling interest | | Repurchase of non-controlling interest | | 0 | | | (5.8) | |
| Distribution to non-controlling interest | | Distribution to non-controlling interest | | (15.9) | | | (16.8) | |
| Dividends paid | | Dividends paid | | 0 | | | (46.0) | |
| | Deferred financing costs paid | | Deferred financing costs paid | | (6.3) | | | (0.2) | |
| | Net cash provided by financing activities | | Net cash provided by financing activities | | 29.3 | | | 372.7 | |
| Net increase (decrease) in cash and cash equivalents | | Net increase (decrease) in cash and cash equivalents | | 45.5 | | | (106.3) | |
| Cash and cash equivalents at the beginning of the period | | Cash and cash equivalents at the beginning of the period | | 787.5 | | | 955.3 | |
| | Cash and cash equivalents at the end of the period | | Cash and cash equivalents at the end of the period | | $ | 833.0 | | | $ | 849.0 | |
|
Delek US Holdings, Inc.
Condensed Consolidated Statements of Cash Flows (Unaudited) (continued)
(In millions)
| | | | | | | | | | | | | | |
| | Nine Months Ended September 30, |
| | 2020 | | 2019 |
| | | | |
| | | | |
| | | | |
| | | | |
| | | | |
| | | | |
| | | | |
| | | | |
| | | | |
| | | | |
| | | | |
| | | | |
| | | | |
| | | | |
| | | | |
| | | | |
| | | | |
| | | | |
| | | | |
| | | | |
| | | | |
| | | | |
| | | | |
| | | | |
| | | | |
| | | | |
| | | | |
| | | | |
| | | | |
| | | | |
| | | | |
| | | | |
| | | | |
| | | | |
| | | | |
| | | | |
| | | | |
| | | | |
| | | | |
| | | | |
| | | | |
| | | | |
| | | | |
| | | | |
| | | | |
| Cash flows from financing activities: | | | | |
| Proceeds from long-term revolvers | | $ | 1,798.1 | | | $ | 1,278.4 | |
| Payments on long-term revolvers | | (1,545.8) | | | (1,278.9) | |
| Proceeds from term debt | | 185.0 | | | 246.8 | |
| Payments on term debt | | (34.6) | | | (31.5) | |
| Proceeds from product financing agreements | | 222.0 | | | 40.8 | |
| Repayments of product financing agreements | | (79.4) | | | (22.2) | |
| | | | |
| Taxes paid due to the net settlement of equity-based compensation | | (2.3) | | | (8.4) | |
| | | | |
| Repurchase of common stock | | (1.9) | | | (147.8) | |
| Repurchase of non-controlling interest | | (28.9) | | | 0 | |
| Distribution to non-controlling interest | | (25.0) | | | (23.8) | |
| Impact of IDR Simplification transaction of Delek Logistics LP | | (2.1) | | | 0 | |
| Dividends paid | | (69.0) | | | (64.3) | |
| | | | |
| Deferred financing costs paid | | (0.7) | | | (0.9) | |
| | | | |
| | | | |
| Net cash provided by (used in) financing activities | | 415.4 | | | (11.8) | |
| Net decrease in cash and cash equivalents | | (147.4) | | | (72.9) | |
| Cash and cash equivalents at the beginning of the period | | 955.3 | | | 1,079.3 | |
| | | | |
| | | | |
| Cash and cash equivalents at the end of the period | | $ | 807.9 | | | $ | 1,006.4 | |
| | | | |
| | | | | | | | | | | | | | |
| | |
| | | | |
| Supplemental disclosures of cash flow information: | | | | |
| Cash paid during the period for: | | | | |
| Interest, net of capitalized interest of $0.2 million and $1.2 million in the 2020 and 2019 periods, respectively | | $ | 91.1 | | | $ | 88.3 | |
| Income taxes | | $ | 3.3 | | | $ | 73.3 | |
| Non-cash investing activities: | | | | |
| | | | |
| | | | |
| (Decrease) increase in accrued capital expenditures | | $ | (33.9) | | | $ | 19.1 | |
| Non-cash financing activities: | | | | |
| Non-cash lease liability arising from recognition of right of use assets upon adoption of Accounting Standards Update ("ASU") 2016-02 | | $ | 0 | | | $ | 211.0 | |
| Non-cash lease liability arising from obtaining right of use assets during the period | | $ | 30.7 | | | $ | 9.6 | |
| | | | |
| | | | |
| | | | |
| | | | |
| | | | | | | | | | | | | | |
| | |
| | | | |
| | Six Months Ended June 30, |
| | 2021 | | 2020 |
| Supplemental disclosures of cash flow information: | | | | |
| Cash paid during the period for: | | | | |
| Interest, net of capitalized interest of $0.5 million and $0.2 million in the 2021 and 2020 periods, respectively | | $ | 55.7 | | | $ | 66.1 | |
| Income taxes | | $ | 4.0 | | | $ | 0.2 | |
| Non-cash investing activities: | | | | |
| | | | |
| | | | |
| Increase (decrease) in accrued capital expenditures | | $ | 0.1 | | | $ | (33.1) | |
| Non-cash financing activities: | | | | |
| | | | |
| Non-cash lease liability arising from obtaining right of use assets during the period | | $ | 26.4 | | | $ | 22.2 | |
| | | | |
| | | | |
| | | | |
| | | | |
See accompanying notes to condensed consolidated financial statements
Notes to Condensed Consolidated Financial Statements (Unaudited)
Note 1 - Organization and Basis of Presentation
Delek US Holdings, Inc. operates through its consolidated subsidiaries, which include Delek US Energy, Inc. ("Delek Energy") (and its subsidiaries) and Alon USA Energy, Inc. ("Alon") (and its subsidiaries). The terms "we," "our," "us," "Delek" and the "Company" are used in this report to refer to Delek and its consolidated subsidiaries. Delek's Common Stockcommon stock is listed on the New York Stock Exchange ("NYSE") under the symbol "DK."
Our condensed consolidated financial statements include the accounts of Delek and its subsidiaries. Certain information and footnote disclosures normally included in annual financial statements prepared in accordance with U.S. Generally Accepted Accounting Principles ("GAAP") have been condensed or omitted, although management believes that the disclosures herein are adequate to make the financial information presented not misleading. Our unaudited condensed consolidated financial statements have been prepared in conformity with GAAP applied on a consistent basis with those of the annual audited consolidated financial statements included in our Annual Report on Form 10-K filed with the Securities and Exchange Commission ("SEC") on February 28, 2020March 1, 2021 (the "Annual Report on Form 10-K") and in accordance with the rules and regulations of the SEC. These unaudited condensed consolidated financial statements should be read in conjunction with the audited consolidated financial statements and the notes thereto for the year ended December 31, 20192020 included in our Annual Report on Form 10-K.
Our condensed consolidated financial statements include Delek Logistics Partners, LP ("Delek Logistics"), NYSE:DKL), which is a variable interest entity.entity ("VIE"). As the indirect owner of the general partner of Delek Logistics, we have the ability to direct the activities of this entity that most significantly impact its economic performance. We are also considered to be the primary beneficiary for accounting purposes for this entity and are Delek Logistics' primary customer. As Delek Logistics does not derive an amount of gross margin material to us from third parties, there is limited risk to Delek associated with Delek Logistics' operations. However, in the event that Delek Logistics incurs a loss, our operating results will reflect such loss, net of intercompany eliminations, to the extent of our ownership interest in this entity.
In the opinion of management, all adjustments necessary for a fair presentation of the financial condition and the results of operations for the interim periods have been included. All significant intercompany transactions and account balances have been eliminated in consolidation. All adjustments are of a normal, recurring nature. Operating results for the interim period should not be viewed as representative of results that may be expected for any future interim period or for the full year.
Accounting Policies
With the exception of the policy updates below, there have been no new or material changes to the significant accounting policies discussed in the Company’s Annual Report on Form 10-K for the fiscal year ended December 31, 2019.2020.
Risks and Uncertainties Arising from the COVID-19 Pandemic and
U.S. economic activity continued on a recovery trend during the OPEC Production Disputes
Thequarter ended June 30, 2021, albeit remaining subject to heightened levels of uncertainty related to the on-going impact of the COVID-19 outbreak of COVID-19 and its developmentthat developed into a pandemic in March 2020 (the "COVID-19 Pandemic") has resulted in significant economic disruption globally, including in“COVID-19 Pandemic” or the U.S.“Pandemic”), and specific geographic areas where we operate. Actions taken by various governmental authorities, individuals and companies around the world to prevent the spread of COVID-19 through social distancingnew variants of the virus. Most of the restrictions imposed in the prior year to prevent its spread have restricted travel, many business operations, public gatheringsbeen eased and government vaccination campaigns continue. Compared to the overall levelprior year, the economic recovery trends in the three and six months ended June 30, 2021 included a resumption of individual movementflights by major airlines and in-person interaction across the globe.increased motor vehicle use. This has in turn significantly reduced global economic activity and resulted in airlines dramatically cutting back on flightsincreased demand and a decrease in motor vehicle use at a time when seasonal driving patterns typically result in an increase of consumer demand for gasoline. As a result, there has also been a decline in the demand for, and thus also the market prices of,for crude oil and certain of our products. In April and June 2020, an agreement was reached to cut oil production between the members of the Organization of Petroleum Exporting Countries ("OPEC") and other leading oil producing countries (together with OPEC, “OPEC+”), as part of the efforts to resolve the oil production disputes ("OPEC Production Disputes") that significantly affected crude oil prices beginning in first quarter of 2020 and to provide stability in the oil markets. While OPEC+ have reached an agreement to cut oil production,Nonetheless, there remains continued uncertainty about the duration and future impact of the COVID-19 Pandemic has caused storage constraints in the United States resulting from over-supply of produced oil. Therefore, downward pressure on commodity prices has remained and could continue for the foreseeable future.Pandemic.
Uncertainties related to the impact of the COVID-19 Pandemic and other events exist that could impact our future results of operations and financial position, the nature of which and the extent to which are currently unknown. To the extent these uncertainties have been identified and are believed to have anhad a material impact on our current period results of operations or financial position based on the requirements for assessing such financial statement impact under GAAP, we have considered them in the preparation of our unaudited financial statements as of and for the three and ninesix months ended SeptemberJune 30, 2020.2021. The application of accounting policies impacted by such considerations include (but are not necessarily limited to) the following:
•The interim evaluation of the risk of credit losses and the determination of our allowance for credit losses, pursuant to GAAP;
•The interim evaluation of long-lived assets for potential impairment, where indicators exist, as defined by GAAP;
•The interim evaluation of indefinite-lived intangibles and goodwill for potential impairment, where indicators exist, as defined by GAAP;
Notes to Condensed Consolidated Financial Statements (Unaudited)
•The interim evaluation of long-lived assets for potential impairment, where indicators exist, as defined by GAAP;•The interim evaluation of joint ventures for potential impairment, where indicators exist, as defined by GAAP;
•The evaluation of derivatives and hedge accounting for counterparty risk and changes in forecasted transactions, as provided for under GAAP;
•The evaluation of inventory valuation allowances that may be warranted under the lower of cost or net realizable value analysis, for first-in, first-out (“FIFO”), and the lower of cost or market analysis, for last-in, first-out ("LIFO"), pursuant to GAAP;
Notes to Condensed Consolidated Financial Statements (Unaudited)
•The consideration of debt modifications and/or covenant requirements, as applicable;
•The evaluation of commitments and contingencies, including changes in concentrations, as applicable;
•The interim evaluation of the impact of changing forecasts on our assessment of deferred tax asset valuation allowances and annual effective tax rates; and
•The interim evaluation of our ability to continue as a going concern.
Credit Losses
Under ASU 2016-13, Financial Instruments - Measurement of Credit Losses on Financial Instruments (as codified in Accounting Standards Codification ("ASC") 326), we have applied the expected credit loss model for recognition and measurement of impairments in financial assets measured at amortized cost or at fair value through other comprehensive income including accounts receivables. The expected credit loss model is also applied for notes receivables and contractual holdbacks to which ASU 2016-13 applies and which are not accounted for at fair value through profit or loss. The loss allowance for the financial asset is measured at an amount equal to the lifetime expected credit losses. If the credit risk on the financial asset has decreased significantly since initial recognition, the loss allowance for the financial asset is re-measured. Changes in loss allowances are recognized in profit and loss. For trade receivables, a simplified impairment approach is applied recognizing expected lifetime losses from initial recognition.
Reclassifications
Certain prior period amounts have been reclassified in order to conform to the current period presentation.
New Accounting Pronouncements Adopted During 20202021
ASU 2018-15, Intangible - Customer’s Accounting for Implementation Costs Incurred in a Cloud Computing Arrangement That Is a Service Contract2020-01, Investments—Equity Securities (Topic 321), Investments—Equity Method and Joint Ventures (Topic 323), and Derivatives and Hedging (Topic 815)—Clarifying the Interactions between Topic 321, Topic 323, and Topic 815
In August 2018,January 2020, the Financial Account Standards Board ("FASB") issued Accounting Standards Board (the "FASB"Update ("ASU") issued2020-01 which is intended to clarify interactions between the guidance related to customers’ accountingaccount for implementation costs incurredcertain equity securities under Topics 321, 323 and 815, and improve current GAAP by reducing diversity in a cloud computing arrangement that is considered a service contract. This pronouncement aligns the requirements for capitalizing implementation costs in such arrangements with the requirements for capitalizing implementation costs incurred to develop or obtain internal-use software. Thispractice and increasing comparability of accounting. The pronouncement is effective for fiscal years and for interim periods within those fiscal years beginning after December 15, 2019.2020. We adopted this guidance on January 1, 20202021 and the adoption did not have a material impact on our business, financial condition or results of operations.
ASU 2018-13, Fair Value Measurement - Changes to2019-12, Simplifying the Disclosure RequirementsAccounting for Fair Value MeasurementIncome Taxes
In August 2018,December 2019, the FASB issued guidance intended to simplify various aspects related to disclosure requirementsaccounting for fair value measurements. The pronouncement eliminates, modifiesincome taxes, eliminate certain exceptions within Accounting Standards Codification ("ASC") 740, Income Taxes (“ASC 740”) and adds disclosure requirements for fair value measurements.clarify certain aspects of the current guidance to promote consistency among reporting entities. The pronouncement is effective for fiscal years and for interim periods within those fiscal years beginning after December 15, 2019, with early adoption permitted.2020. We adopted this guidance on January 1, 20202021 and the adoption did not have a material impact on our business, financial condition or results of operations. See Note 10.
ASU 2016-13, Financial Instruments2018-14, Compensation - Measurement of Credit Losses on Financial InstrumentsChanges to the Disclosure Requirements for Defined Benefit Plans
In June 2016,August 2018, the FASB issued guidance requiring the measurement of all expected credit lossesrelated to disclosure requirements for financial assets held at the reporting date based on historical experience, current conditions,defined benefit plans. The pronouncement eliminates, modifies and reasonable and supportable forecasts. Organizations will now use forward-looking information to better inform their credit loss estimates. This guidanceadds disclosure requirements for defined benefit plans. The pronouncement is effective for interim and annual periodsfiscal years beginning after December 15, 2019.2020. We adopted this guidance on January 1, 2020 using2021 and the modified retrospective approach as of the adoption date. The adoption did not have a material impact on the Company’s operatingour business, financial condition or results financial position or disclosures.
Notes to Condensed Consolidated Financial Statements (Unaudited)
of operations.Accounting Pronouncements Not Yet Adopted
ASU 2020-06, Debt—Debt with Conversion and Other Options (Subtopic 470-20) and Derivatives and Hedging—Contracts in Entity's Own Equity (Subtopic 815-40): Accounting for Convertible Instruments and Contracts in an Entity’s Own Equity
In August 2020, the FASB issued ASU 2020-06, which is intended to simplify the accounting for certain financial instruments with characteristics of liabilities and equity, including convertible instruments and contracts in an entity's own equity. The guidance allows for either full retrospective adoption or modified retrospective adoption. The pronouncement is effective for fiscal years and interim periods within those fiscal years beginning after December 15, 2021, and early adoption is permitted. The Company is evaluating the impact of this guidance but does not currently expect adopting this new guidance will have a material impact on its condensed consolidated financial statements and related disclosures.
ASU 2020-04, Facilitation of the Effects of Reference Rate Reform on Financial Reporting (Topic 848)
In March 2020, the FASB issued an amendment which is intended to provide temporary optional expedients and exceptions to GAAP guidance on contracts, hedge accounting and other transactions affected by the expected market transition from the London Interbank Offered Rate ("LIBOR") and other interbank rates. This guidance is effective for all entities at any time beginning on March 12, 2020 through December 31, 2022 and may be applied from the beginning of an interim period that includes the issuance date of the ASU. The Company is currently evaluating the impact this guidance may have on its condensed consolidated financial statements and related disclosures.
ASU 2020-01, Investments—Equity Securities (Topic 321), Investments—Equity Method and Joint Ventures (Topic 323), and Derivatives and Hedging (Topic 815)—Clarifying the Interactions between Topic 321, Topic 323, and Topic 815
In January 2020, the FASB issued ASU 2020-01 which is intended to clarify interactions between the guidance to account for certain equity securities under Topics 321, 323 and 815, and improve current GAAP by reducing diversity in practice and increasing comparability of accounting. The pronouncement is effective for fiscal years and interim periods within those fiscal years beginning after December 15, 2020, and early adoption is permitted. The Company is currently evaluating the impact this guidance may have on its consolidated financial statements and related disclosures.
ASU 2019-12, Simplifying the Accounting for Income Taxes
In December 2019, the FASB issued guidance intended to simplify various aspects related to accounting for income taxes, eliminate certain exceptions within ASC 740 and clarify certain aspects of the current guidance to promote consistency among reporting entities. The pronouncement is effective for fiscal years and for interim periods within those fiscal years beginning after December 15, 2020, with early adoption permitted. We expect to adopt this guidance on the effective date and are currently evaluating the impact that adopting this new guidance will have on our business, financial condition and results of operations.
ASU 2018-14, Compensation - Changes to the Disclosure Requirements for Defined Benefit Plans
In August 2018, the FASB issued guidance related to disclosure requirements for defined benefit plans. The pronouncement eliminates, modifies and adds disclosure requirements for defined benefit plans. The pronouncement is effective for fiscal years beginning after December 15, 2020, and early adoption is permitted. We expect to adopt this guidance on the effective date and do not expect adopting this new guidance will have a material impact on our business, financial condition or results of operations.
Note 2 - Segment Data
We aggregate our operating units into three reportable segments: Refining, Logistics, and Retail. Operations that are not specifically included in the reportable segments are included in Corporate, Other and Eliminations, which consist of the following:
•our corporate activities;
•results of certain immaterial operating segments, including our Canadian crude trading operations (as discussed in Note 9);
Notes to Condensed Consolidated Financial Statements (Unaudited)
•wholesale crude operations;
•Alon's asphalt terminal operations; and
•intercompany eliminations.
Decisions concerning the allocation of resources and assessment of operating performance are made based on this segmentation. Management measures the operating performance of each of the reportable segments based on the segment contribution margin. Segment contribution margin is defined as net revenues less cost of materials and other and operating expenses, excluding depreciation and amortization.
During the first quarter of 2020, we revised the structure of the internal financial information reviewed by management and began allocating the results of hedging activity associated with managing risks of our refineries, previously reported in corporate, other and
Notes to Condensed Consolidated Financial Statements (Unaudited)
eliminations, to our refining segment. The historical results of this hedging activity have been reclassified to conform to the current presentation. The assets and/or liabilities associated with this hedging activity have not been allocated to the refining segment.
Refining Segment
The refining segment processes crude oil and other feedstocks for the manufacture of transportation motor fuels, including various grades of gasoline, diesel fuel and aviation fuel, asphalt and other petroleum-based products that are distributed through owned and third-party product terminals. The refining segment has a combined nameplate capacity of 302,000 barrels per day ("bpd") as of SeptemberJune 30, 2020,2021, including the following:
•75,000 bpd Tyler, Texas refinery (the "Tyler refinery");
•80,000 bpd El Dorado, Arkansas refinery (the "El Dorado refinery");
•73,000 bpd Big Spring, Texas refinery (the "Big Spring refinery"); and
•74,000 bpd Krotz Springs, Louisiana refinery (the "Krotz Springs refinery"); and
•a non-operating refinery located in Bakersfield, California, which was sold May 7, 2020..
The refining segment also owns and operates 3 biodiesel facilities involved in the production of biodiesel fuels and related activities, located in Crossett, Arkansas, Cleburne, Texas and New Albany, Mississippi (acquired in October 2019).Mississippi. The biodiesel industry has historically been substantially aided by federal and state tax incentives. One tax incentive program that has been significant to our renewable fuels facilities is the federal blender's tax credit (also known as the biodiesel tax credit or "BTC"). The BTC provides a $1.00 refundable tax credit per gallon of pure biodiesel to the first blender of biodiesel with petroleum-based diesel fuel. The blender's tax credit was re-enacted in December 2019 for the years 2020 through 2022 and was retroactively reinstated for 2018 and 2019.2022.
On May 7, 2020, we sold our equity interests in Alon Bakersfield Property, Inc., an indirect wholly-owned subsidiary that ownsowned our non-operating refinery located in Bakersfield, California, to a subsidiary of Global Clean Energy Holdings, Inc. (“GCE”) for total cash consideration of $40.0 million. As a result of this sale, we recognized a gain of $56.8$56.9 million during the second quarter of 2020, largely due to the buyer assuming substantially all of the asset retirement obligations and environmental liabilities associated with this refinery, which is included in gain on sale of non-operating refinery on the accompanying condensed consolidated statements of income.refinery. As part of the transaction, GCE granted a call option to Delek to acquire up to a 33 1/3% limited member interest in the acquiring subsidiary of GCE for up to $13.3 million, subject to certain adjustments. Such option is exercisable by Delek through the 90th day after GCE demonstrates commercial operations, as contractually defined.defined, which has not yet occurred as of June 30, 2021.
The refining segment's petroleum-based products are marketed primarily in the south central, southwestern and western regions of the United States. This segment also ships and sells gasoline into wholesale markets in the southern and eastern United States. Motor fuels are sold under the Alon or Delek brand through various terminals to supply Alon or Delek branded retail sites. In addition, Alon sells motor fuels through its wholesale distribution network on an unbranded basis.
Logistics Segment
Our logistics segment owns and operates crude oil and refined products logistics and marketing assets. The logistics segment generates revenue by charging fees for gathering, transporting and storing crude oil and for marketing, distributing, transporting and storing intermediate and refined products in select regions of the southeastern United States and West Texas for our refining segment and third parties, and sales of wholesale products in the West Texas market.
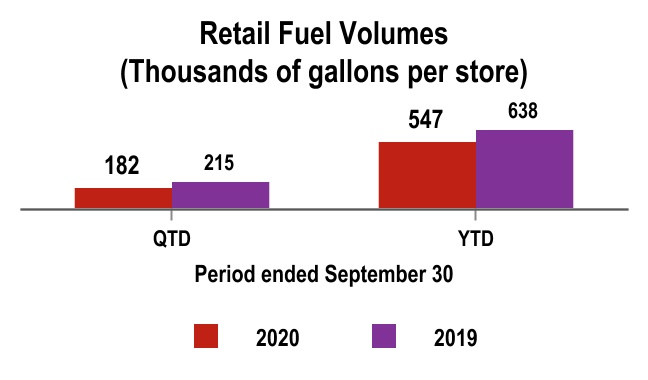
Retail Segment
Our retail segment consists of 253252 owned and leased convenience store sites as of SeptemberJune 30, 2020,2021, located primarily in Central and West Texas and New Mexico. These convenience stores typically offer various grades of gasoline and diesel primarily under the Alon or Delek brand name and food products, food service, tobacco products, non-alcoholic and alcoholic beverages, general merchandise as well as money ordersgrams to the public, primarily under the 7-Eleven and DK or Alon brand names. Substantially all of the motor fuel sold through our retail segment is supplied by our Big Spring refinery, which is transferred to the retail segment at prices substantially determined by reference to published commodity pricing information. In November 2018, we terminated the license agreement with 7-Eleven, Inc. ThisThe terms of such agreement was amended in April 2020 to extendand subsequent amendments require the date for the required removal of all 7-Eleven branding on a store-by-store basis fromby December 31, 2021 to December 31, 2022. Merchandise sales at our convenience store sites will continue to be sold under the 7-Eleven brand name until 7-Eleven branding is removed at such convenience store sites.2023.
Significant Inter-segment Transactions
All inter-segment transactions have been eliminated in consolidation and consist primarily of the following:
•refining segment refined product sales to the retail segment to be sold through the store locations;
Notes to Condensed Consolidated Financial Statements (Unaudited)
•refining segment sales of asphalt and refined product to entities included in corporate, other and eliminations;
•logistics segment service fee revenue under service agreements with the refining segment based on the number of gallons sold and to share a portion of the margin achieved in return for providing marketing, sales and customer services;
Notes to Condensed Consolidated Financial Statements (Unaudited)
•logistics segment sales of wholesale finished product to our refining segment; and
•logistics segment crude transportation, terminalling and storage fee revenue from our refining segment for the utilization of pipeline, terminal and storage assets.
Business Segment Operating Performance
The following is a summary of business segment operating performance as measured by contribution margin for the period indicated (in millions):
| | | | | Three Months Ended September 30, 2020 | | | Three Months Ended June 30, 2021 |
| (In millions) | (In millions) | | Refining | | Logistics | | Retail | | Corporate,
Other and Eliminations | | Consolidated | (In millions) | | Refining | | Logistics | | Retail | | Corporate, Other and Eliminations (1) | | Consolidated (1) |
| Net revenues (excluding inter-segment fees and revenues) | Net revenues (excluding inter-segment fees and revenues) | | $ | 1,450.8 | | | $ | 49.4 | | | $ | 177.7 | | | $ | 385.0 | | | $ | 2,062.9 | | Net revenues (excluding inter-segment fees and revenues) | | $ | 2,226.9 | | | $ | 66.1 | | | $ | 209.0 | | | $ | (310.5) | | | $ | 2,191.5 | |
| Inter-segment fees and revenues | Inter-segment fees and revenues | | 112.7 | | | 92.8 | | | 0 | | | (205.5) | | | — | | Inter-segment fees and revenues | | 188.8 | | | 102.4 | | | 0 | | | (291.2) | | | — | |
| Operating costs and expenses: | Operating costs and expenses: | | | | | | | | | | | Operating costs and expenses: | | | | | | | | | | |
| Cost of materials and other | Cost of materials and other | | 1,479.2 | | | 60.7 | | | 136.3 | | | 199.7 | | | 1,875.9 | | Cost of materials and other | | 2,321.8 | | | 88.8 | | | 164.7 | | | (579.5) | | | 1,995.8 | |
| Operating expenses (excluding depreciation and amortization presented below) | Operating expenses (excluding depreciation and amortization presented below) | | 102.1 | | | 14.3 | | | 23.1 | | | 0.2 | | | 139.7 | | Operating expenses (excluding depreciation and amortization presented below) | | 113.8 | | | 15.5 | | | 22.4 | | | 9.4 | | | 161.1 | |
| Segment contribution margin | Segment contribution margin | | $ | (17.8) | | | $ | 67.2 | | | $ | 18.3 | | | $ | (20.4) | | | 47.3 | | Segment contribution margin | | $ | (19.9) | | | $ | 64.2 | | | $ | 21.9 | | | $ | (31.6) | | | 34.6 | |
| Depreciation and amortization | Depreciation and amortization | | $ | 50.3 | | | $ | 9.4 | | | $ | 2.9 | | | $ | 2.6 | | | 65.2 | | Depreciation and amortization | | $ | 51.0 | | | $ | 10.0 | | | $ | 3.4 | | | $ | 1.9 | | | 66.3 | |
| General and administrative expenses | General and administrative expenses | | | | | | | | | | 57.0 | | General and administrative expenses | | | | | | | | | | 58.6 | |
| Other operating loss, net | | | | | | | | | | 0.3 | | |
| | Other operating income, net | | Other operating income, net | | | | | | | | | | (4.9) | |
| Operating loss | Operating loss | | | | | | | | | | $ | (75.2) | | Operating loss | | | | | | | | | | $ | (85.4) | |
| Capital spending (excluding business combinations) | Capital spending (excluding business combinations) | | $ | 0.6 | | | $ | 3.2 | | | $ | 0.7 | | | $ | 0.2 | | | $ | 4.7 | | Capital spending (excluding business combinations) | | $ | 60.7 | | | $ | 2.6 | | | $ | 0.5 | | | $ | 1.9 | | | $ | 65.7 | |
| | | | | | | | | | | | | | | | | | | | | | | | | | | | | | | | |
| | | Three Months Ended September 30, 2019 |
| | Refining (1) | | Logistics | | Retail | | Corporate,
Other and Eliminations (1) | | Consolidated |
| Net revenues (excluding inter-segment fees and revenues) | | $ | 2,036.9 | | | $ | 71.4 | | | $ | 218.5 | | | $ | 7.5 | | | $ | 2,334.3 | |
Inter-segment fees and revenues | | 139.9 | | | 66.2 | | | 0 | | | (206.1) | | | — | |
| Operating costs and expenses: | | | | | | | | | | |
| Cost of materials and other | | 1,906.0 | | | 72.6 | | | 176.4 | | | (190.9) | | | 1,964.1 | |
| Operating expenses (excluding depreciation and amortization presented below) | | 120.7 | | | 18.4 | | | 23.5 | | | 4.3 | | | 166.9 | |
| Segment contribution margin | | $ | 150.1 | | | $ | 46.6 | | | $ | 18.6 | | | $ | (12.0) | | | 203.3 | |
| Depreciation and amortization | | $ | 34.6 | | | $ | 6.6 | | | $ | 3.0 | | | $ | 5.6 | | | 49.8 | |
| General and administrative expenses | | | | | | | | | | 65.6 | |
| Other operating loss, net | | | | | | | | | | 0.5 | |
| Operating income | | | | | | | | | | $ | 87.4 | |
| Capital spending (excluding business combinations) | | $ | 63.3 | | | $ | 4.0 | | | $ | 3.8 | | | $ | 39.4 | | | $ | 110.5 | |
| | | | | | | | | | | | | | | | | | | | | | | | | | | | | | | | |
| | | Three Months Ended June 30, 2020 |
| | Refining | | Logistics | | Retail | | Corporate,
Other and Eliminations | | Consolidated |
| Net revenues (excluding inter-segment fees and revenues) | | $ | 1,001.9 | | | $ | 27.3 | | | $ | 165.4 | | | $ | 340.9 | | | $ | 1,535.5 | |
Inter-segment fees and revenues | | 75.1 | | | 90.4 | | | 0 | | | (165.5) | | | — | |
| Operating costs and expenses: | | | | | | | | | | |
| Cost of materials and other | | 928.6 | | | 43.9 | | | 119.6 | | | 185.7 | | | 1,277.8 | |
| Operating expenses (excluding depreciation and amortization presented below) | | 88.7 | | | 12.4 | | | 21.5 | | | 5.2 | | | 127.8 | |
| Segment contribution margin | | $ | 59.7 | | | $ | 61.4 | | | $ | 24.3 | | | $ | (15.5) | | | 129.9 | |
| Depreciation and amortization | | $ | 44.8 | | | $ | 8.7 | | | $ | 3.3 | | | $ | 2.8 | | | 59.6 | |
| General and administrative expenses | | | | | | | | | | 61.7 | |
| Other operating income, net | | | | | | | | | | (14.2) | |
| Operating income | | | | | | | | | | $ | 22.8 | |
| Capital spending (excluding business combinations) | | $ | 12.2 | | | $ | 0.7 | | | $ | 1.3 | | | $ | 0.8 | | | $ | 15.0 | |
Notes to Condensed Consolidated Financial Statements (Unaudited)
| | | | | Nine Months Ended September 30, 2020 | | | Six Months Ended June 30, 2021 |
| (In millions) | (In millions) | | Refining | | Logistics | | Retail | | Corporate,
Other and Eliminations | | Consolidated | (In millions) | | Refining | | Logistics | | Retail | | Corporate,
Other and Eliminations | | Consolidated |
| Net revenues (excluding inter-segment fees and revenues) | Net revenues (excluding inter-segment fees and revenues) | | $ | 4,021.9 | | | $ | 133.4 | | | $ | 521.7 | | | $ | 742.6 | | | $ | 5,419.6 | | Net revenues (excluding inter-segment fees and revenues) | | $ | 3,811.4 | | | $ | 122.8 | | | $ | 383.8 | | | $ | 265.7 | | | $ | 4,583.7 | |
| Inter-segment fees and revenues | Inter-segment fees and revenues | | 346.5 | | | 289.9 | | | 0 | | | (636.4) | | | — | | Inter-segment fees and revenues | | 344.4 | | | 198.6 | | | 0 | | | (543.0) | | | — | |
| Operating costs and expenses: | Operating costs and expenses: | | | | | | | | | | | Operating costs and expenses: | | | | | | | | | | |
| Cost of materials and other | Cost of materials and other | | 4,314.4 | | | 205.9 | | | 400.0 | | | 144.0 | | | 5,064.3 | | Cost of materials and other | | 3,969.5 | | | 169.9 | | | 301.2 | | | (239.3) | | | 4,201.3 | |
| Operating expenses (excluding depreciation and amortization presented below) | Operating expenses (excluding depreciation and amortization presented below) | | 302.5 | | | 41.5 | | | 66.8 | | | 11.2 | | | 422.0 | | Operating expenses (excluding depreciation and amortization presented below) | | 227.4 | | | 29.6 | | | 43.8 | | | 9.6 | | | 310.4 | |
| Segment contribution margin | Segment contribution margin | | $ | (248.5) | | | $ | 175.9 | | | $ | 54.9 | | | $ | (49.0) | | | (66.7) | | Segment contribution margin | | $ | (41.1) | | | $ | 121.9 | | | $ | 38.8 | | | $ | (47.6) | | | 72.0 | |
| Depreciation and amortization | Depreciation and amortization | | $ | 132.3 | | | $ | 24.4 | | | $ | 9.1 | | | $ | 11.6 | | | 177.4 | | Depreciation and amortization | | $ | 103.1 | | | $ | 20.7 | | | $ | 6.6 | | | $ | 4.4 | | | 134.8 | |
| General and administrative expenses | General and administrative expenses | | | | | | | | | | 184.4 | | General and administrative expenses | | | | | | | | | | 105.7 | |
| | Other operating income, net | Other operating income, net | | | | | | | | | | (14.6) | | Other operating income, net | | | | | | | | | | (3.0) | |
| Operating loss | Operating loss | | | | | | | | | | $ | (413.9) | | Operating loss | | | | | | | | | | $ | (165.5) | |
| Capital spending (excluding business combinations) | Capital spending (excluding business combinations) | | $ | 180.9 | | | $ | 6.9 | | | $ | 8.2 | | | $ | 12.0 | | | $ | 208.0 | | Capital spending (excluding business combinations) | | $ | 118.5 | | | $ | 10.4 | | | $ | 1.3 | | | $ | 2.5 | | | $ | 132.7 | |
| | | | | Nine Months Ended September 30, 2019 | | | Six Months Ended June 30, 2020 |
| | Refining (1) | | Logistics | | Retail | | Corporate,
Other and Eliminations (1) | | Consolidated | | Refining | | Logistics | | Retail | | Corporate,
Other and Eliminations | | Consolidated |
| Net revenues (excluding inter-segment fees and revenues) | Net revenues (excluding inter-segment fees and revenues) | | $ | 6,096.7 | | | $ | 254.3 | | | $ | 640.2 | | | $ | 23.3 | | | $ | 7,014.5 | | Net revenues (excluding inter-segment fees and revenues) | | $ | 2,571.1 | | | $ | 84.2 | | | $ | 344.0 | | | $ | 357.4 | | | $ | 3,356.7 | |
Inter-segment fees and revenues | Inter-segment fees and revenues | | 539.9 | | | 191.1 | | | 0 | | | (731.0) | | | — | | Inter-segment fees and revenues | | 233.8 | | | 196.9 | | | 0 | | | (430.7) | | | — | |
| Operating costs and expenses: | Operating costs and expenses: | | | | | | | | | | | Operating costs and expenses: | | | | | | | | | | |
| Cost of materials and other | Cost of materials and other | | 5,629.8 | | | 262.7 | | | 521.9 | | | (683.2) | | | 5,731.2 | | Cost of materials and other | | 2,835.2 | | | 145.2 | | | 263.7 | | | (55.7) | | | 3,188.4 | |
| Operating expenses (excluding depreciation and amortization presented below) | Operating expenses (excluding depreciation and amortization presented below) | | 356.7 | | | 51.8 | | | 71.9 | | | 15.5 | | | 495.9 | | Operating expenses (excluding depreciation and amortization presented below) | | 200.4 | | | 27.2 | | | 43.7 | | | 11.0 | | | 282.3 | |
| Segment contribution margin | Segment contribution margin | | $ | 650.1 | | | $ | 130.9 | | | $ | 46.4 | | | $ | (40.0) | | | 787.4 | | Segment contribution margin | | $ | (230.7) | | | $ | 108.7 | | | $ | 36.6 | | | $ | (28.6) | | | (114.0) | |
| Depreciation and amortization | Depreciation and amortization | | $ | 98.9 | | | $ | 19.8 | | | $ | 11.5 | | | $ | 16.5 | | | 146.7 | | Depreciation and amortization | | $ | 82.0 | | | $ | 15.0 | | | $ | 6.2 | | | $ | 9.0 | | | 112.2 | |
| General and administrative expenses | General and administrative expenses | | | | | | | | | | 197.3 | | General and administrative expenses | | | | | | | | | | 127.4 | |
| Other operating income, net | Other operating income, net | | | | | | | | | | (0.7) | | Other operating income, net | | | | | | | | | | (14.9) | |
| Operating income | | | | | | | | | | $ | 444.1 | | |
| Operating loss | | Operating loss | | | | | | | | | | $ | (338.7) | |
| Capital spending (excluding business combinations) | Capital spending (excluding business combinations) | | $ | 193.8 | | | $ | 6.2 | | | $ | 14.3 | | | $ | 110.5 | | | $ | 324.8 | | Capital spending (excluding business combinations) | | $ | 180.3 | | | $ | 3.7 | | | $ | 7.5 | | | $ | 11.8 | | | $ | 203.3 | |
(1)The refining segment results of operations for the threeReflects an adjustment to net down year-to-date net revenues and nine months ended September 30, 2019, includes hedging gains, a component of cost of materials and other of $22.6approximately $362 million and $50.0 million, respectively, which was previouslyrelated to certain crude wholesale net settled transactions included and reported in corporate, other and eliminations.eliminations that occurred during the three months ended March 31, 2021, which was not reflected in the unaudited condensed consolidated financial statements as of and for the three months ended March 31, 2021, as filed on our March 31, 2021 Quarterly Report on Form 10-Q on May 6, 2021. Such uncorrected adjustment, as well as the subsequent out-of-period correction reflected above, did not relate to any of our reportable segments, had no impact on segment contribution margin, consolidated contribution margin or consolidated operating loss, and are not considered material to the condensed consolidated financial statements in either period.
Other Segment Information
Total assets by segment were as follows as of SeptemberJune 30, 2020:2021:
| | | Refining | | Logistics | | Retail | | Corporate,
Other and Eliminations | | Consolidated | | Refining | | Logistics | | Retail | | Corporate,
Other and Eliminations | | Consolidated |
| Total assets | Total assets | | $ | 6,103.2 | | | $ | 957.7 | | | $ | 299.1 | | | $ | (835.0) | | | $ | 6,525.0 | | Total assets | | $ | 6,458.7 | | | $ | 935.5 | | | $ | 257.5 | | | $ | (863.3) | | | $ | 6,788.4 | |
| Less: | Less: | | | | | | | | | | | Less: | | | | | | | | | | |
| Inter-segment notes receivable | Inter-segment notes receivable | | (1,326.3) | | | 0 | | | 0 | | | 1,326.3 | | | — | | Inter-segment notes receivable | | (1,225.8) | | | 0 | | | 0 | | | 1,225.8 | | | — | |
| Inter-segment right of use lease assets | Inter-segment right of use lease assets | | (393.8) | | | 0 | | | 0 | | | 393.8 | | | — | | Inter-segment right of use lease assets | | (304.1) | | | 0 | | | 0 | | | 304.1 | | | — | |
| Total assets, excluding inter-segment notes receivable and right of use assets | Total assets, excluding inter-segment notes receivable and right of use assets | | $ | 4,383.1 | | | $ | 957.7 | | | $ | 299.1 | | | $ | 885.1 | | | $ | 6,525.0 | | Total assets, excluding inter-segment notes receivable and right of use assets | | $ | 4,928.8 | | | $ | 935.5 | | | $ | 257.5 | | | $ | 666.6 | | | $ | 6,788.4 | |
Notes to Condensed Consolidated Financial Statements (Unaudited)
Property, plant and equipment and accumulated depreciation as of SeptemberJune 30, 20202021 and depreciation expense by reporting segment for the three and ninesix months ended SeptemberJune 30, 20202021 are as follows (in millions):
| | | Refining | | Logistics | | Retail | | Corporate,
Other and Eliminations | | Consolidated | | Refining | | Logistics | | Retail | | Corporate,
Other and Eliminations | | Consolidated |
| Property, plant and equipment | Property, plant and equipment | | $ | 2,558.2 | | | $ | 684.2 | | | $ | 164.8 | | | $ | 108.5 | | | $ | 3,515.7 | | Property, plant and equipment | | $ | 2,666.1 | | | $ | 701.8 | | | $ | 165.7 | | | $ | 97.1 | | | $ | 3,630.7 | |
| Less: Accumulated depreciation | Less: Accumulated depreciation | | (758.9) | | | (216.7) | | | (45.4) | | | (70.8) | | | (1,091.8) | | Less: Accumulated depreciation | | (898.6) | | | (247.1) | | | (54.4) | | | (68.0) | | | (1,268.1) | |
| Property, plant and equipment, net | Property, plant and equipment, net | | $ | 1,799.3 | | | $ | 467.5 | | | $ | 119.4 | | | $ | 37.7 | | | $ | 2,423.9 | | Property, plant and equipment, net | | $ | 1,767.5 | | | $ | 454.7 | | | $ | 111.3 | | | $ | 29.1 | | | $ | 2,362.6 | |
| Depreciation expense for the three months ended September 30, 2020 | | $ | 48.5 | | | $ | 9.5 | | | $ | 2.7 | | | $ | 2.6 | | | $ | 63.3 | | |
| Depreciation expense for the nine months ended September 30, 2020 | | $ | 127.3 | | | $ | 24.4 | | | $ | 8.5 | | | $ | 11.6 | | | $ | 171.8 | | |
| Depreciation expense for the three months ended June 30, 2021 | | Depreciation expense for the three months ended June 30, 2021 | | $ | 49.4 | | | $ | 10.0 | | | $ | 3.2 | | | $ | 1.9 | | | $ | 64.5 | |
| Depreciation expense for the six months ended June 30, 2021 | | Depreciation expense for the six months ended June 30, 2021 | | $ | 99.8 | | | $ | 20.7 | | | $ | 6.2 | | | $ | 4.4 | | | $ | 131.1 | |
In accordance with ASC 360, Property, Plant and Equipment ("ASC 360"), Delek evaluates the realizability of property, plant and equipment as events occur that might indicate potential impairment. There were no indicators of impairment related to our property, plant and equipment as of SeptemberJune 30, 20202021 (see Note 1 for further discussion on the impact of COVID-19 Pandemic and OPEC Production Disputes)Pandemic).
Note 3 - Earnings (Loss) Per Share
Basic earnings per share (or "EPS") is computed by dividing net income (loss) by the weighted average common shares outstanding. Diluted earnings per share is computed by dividing net income (loss), as adjusted for changes to income that would result from the assumed settlement of the dilutive equity instruments included in diluted weighted average common shares outstanding, by the diluted weighted average common shares outstanding. For all periods presented, we have outstanding various equity-based compensation awards that are considered in our diluted EPS calculation (when to do so would be dilutive), and is inclusive of awards disclosed in Note 15 to these condensed consolidated financial statements. For those instruments that are indexed to our common stock, they are generally dilutive when the market price of the underlying indexed share of common stock is in excess of the exercise price.
Notes to Condensed Consolidated Financial Statements (Unaudited)
The following table sets forth the computation of basic and diluted earnings per share.
| | | Three Months Ended | | Nine Months Ended | | Three Months Ended | | Six Months Ended |
| | September 30, | | September 30, | | June 30, | | June 30, |
| | | | 2020 | | 2019 | | 2020 | | 2019 | | | 2021 | | 2020 | | 2021 | | 2020 |
| Numerator: | Numerator: | | | | | | | | | Numerator: | | | | | | | | |
| Numerator for EPS | Numerator for EPS | | | | | | Numerator for EPS | | | | | |
| (Loss) income from continuing operations, net of tax | | $ | (76.9) | | | $ | 60.0 | | | $ | (285.4) | | | $ | 299.0 | | |
| Less: Income from continuing operations attributed to non-controlling interest | | 11.2 | | | 8.7 | | | 29.4 | | | 20.3 | | |
| (Loss) Income from continuing operations attributable to Delek | | $ | (88.1) | | | $ | 51.3 | | | $ | (314.8) | | | $ | 278.7 | | |
| Net (loss) income | | Net (loss) income | | $ | (72.5) | | | $ | 98.5 | | | $ | (163.8) | | | $ | (208.5) | |
| Less: Income attributed to non-controlling interest | | Less: Income attributed to non-controlling interest | | 8.6 | | | 10.8 | | | 15.9 | | | 18.2 | |
| Numerator for basic and diluted EPS attributable to Delek | | Numerator for basic and diluted EPS attributable to Delek | | $ | (81.1) | | | $ | 87.7 | | | $ | (179.7) | | | $ | (226.7) | |
| | | Numerator for EPS - discontinued operations | | | | | | |
| | Loss from discontinued operations attributable to Delek | | $ | 0 | | | $ | 0 | | | $ | 0 | | | $ | (0.8) | | |
| | | Denominator: | Denominator: | | | | | | Denominator: | | | | | |
| Weighted average common shares outstanding (denominator for basic EPS) | Weighted average common shares outstanding (denominator for basic EPS) | | 73,669,310 | | | 75,028,562 | | | 73,551,970 | | | 76,463,435 | | Weighted average common shares outstanding (denominator for basic EPS) | | 73,911,582 | | | 73,547,582 | | | 73,857,975 | | | 73,492,656 | |
| | Dilutive effect of stock-based awards | Dilutive effect of stock-based awards | | 0 | | | 673,749 | | | 0 | | | 704,399 | | Dilutive effect of stock-based awards | | 0 | | | 480,461 | | | 0 | | | 0 | |
| Weighted average common shares outstanding, assuming dilution (denominator for diluted EPS) | Weighted average common shares outstanding, assuming dilution (denominator for diluted EPS) | | 73,669,310 | | | 75,702,311 | | | 73,551,970 | | | 77,167,834 | | Weighted average common shares outstanding, assuming dilution (denominator for diluted EPS) | | 73,911,582 | | | 74,028,043 | | | 73,857,975 | | | 73,492,656 | |
| EPS: | | EPS: | | | | | | | | |
| | EPS: | | | | | | |
| Basic (loss) income per share: | | | | | | |
| (Loss) Income from continuing operations | | $ | (1.20) | | | $ | 0.68 | | | $ | (4.28) | | | $ | 3.64 | | |
| Loss from discontinued operations | | 0 | | | 0 | | | $ | 0 | | | (0.01) | | |
| | Basic (loss) income per share | Basic (loss) income per share | | $ | (1.20) | | | $ | 0.68 | | | $ | (4.28) | | | $ | 3.63 | | Basic (loss) income per share | | $ | (1.10) | | | $ | 1.19 | | | $ | (2.43) | | | $ | (3.08) | |
| Diluted (loss) income per share: | | | | | | | | | |
| (Loss) Income from continuing operations | | $ | (1.20) | | | $ | 0.68 | | | $ | (4.28) | | | $ | 3.61 | | |
| Loss from discontinued operations | | $ | 0 | | | 0 | | | $ | 0 | | | (0.01) | | |
| | Diluted (loss) income per share | Diluted (loss) income per share | | $ | (1.20) | | | $ | 0.68 | | | $ | (4.28) | | | $ | 3.60 | | Diluted (loss) income per share | | $ | (1.10) | | | $ | 1.18 | | | $ | (2.43) | | | $ | (3.08) | |
| | The following equity instruments were excluded from the diluted weighted average common shares outstanding because their effect would be antidilutive: | The following equity instruments were excluded from the diluted weighted average common shares outstanding because their effect would be antidilutive: | | | | | | The following equity instruments were excluded from the diluted weighted average common shares outstanding because their effect would be antidilutive: | | | | | | | | |
| Antidilutive stock-based compensation (because average share price is less than exercise price) | Antidilutive stock-based compensation (because average share price is less than exercise price) | | 3,873,055 | | | 1,846,919 | | | 3,807,699 | | | 2,003,283 | | Antidilutive stock-based compensation (because average share price is less than exercise price) | | 659,005 | | | 3,922,290 | | | 678,426 | | | 3,328,789 | |
| Antidilutive due to loss | Antidilutive due to loss | | 363,603 | | | 0 | | | 330,412 | | | 0 | | Antidilutive due to loss | | 2,983,783 | | | 0 | | | 2,802,950 | | | 372,220 | |
| Total antidilutive stock-based compensation | Total antidilutive stock-based compensation | | 4,236,658 | | | 1,846,919 | | | 4,138,111 | | | 2,003,283 | | Total antidilutive stock-based compensation | | 3,642,788 | | | 3,922,290 | | | 3,481,376 | | | 3,701,009 | |
|
Notes to Condensed Consolidated Financial Statements (Unaudited)
Note 4 - Delek Logistics
Delek Logistics is a publicly traded limited partnership that was formed by Delek in 2012 to own, operate, acquire and construct crude oil and refined products logistics and marketing assets. A substantial majority of Delek Logistics' assets are integral to Delek’s refining and marketing operations.
On August 13, 2020, Delek Logistics completed a transaction to eliminate the incentive distribution rights ("IDRs") held by Delek Logistics GP, LLC, the general partner, and convert the 2.0% economic general partner interest into a non-economic general partner interest in exchange for total consideration consisting of $45.0 million cash and 14.0 million newly issued common limited partner units. Contemporaneously, we repurchased 5.2% ownership interest in the general partner from affiliates, who are also members of the general partner's management and board of directors, for $23.1 million, increasing our ownership interest in the general partner to 100.0%.
As a result of these transactions, the non-controlling interest in our consolidated balance sheets decreased by $50.8 million, with a $37.2 million increase to additional paid-in capital which is net of $11.5 million related to deferred income taxes and $2.1 million of transaction costs.
In August 2020, Delek Logistics filed a shelf registration statement, which subsequently became effective, with the U.S. Securities and Exchange Commission for the proposed re-sale or other disposition from time to time by Delek of up to 14.0 million common limited partner units representing our limited partner interests in Delek Logistics.
As of SeptemberJune 30, 2020,2021, we owned an 80.0% interest in Delek Logistics, consisting of 34,745,868 common limited partner units and the non-economic general partner interest. The limited partner interests in Delek Logistics not owned by us are reflected in net income attributable to non-controlling interest in the accompanying condensed consolidated statements of income and in non-controlling interest in subsidiaries in the accompanying condensed consolidated balance sheets.
On August 13, 2020, Delek Logistics completed a transaction to eliminate the incentive distribution rights ("IDRs") held by Delek Logistics GP, LLC, the general partner, and convert the economic general partner interest into a non-economic general partner interest in exchange for total consideration consisting of $45.0 million cash and 14.0 million newly issued common limited partner units. Contemporaneously, we repurchased the 5.2% ownership interest in the general partner from affiliates, who are also members of the general partner's management and board of directors, for $23.1 million, increasing our ownership interest in the general partner to 100.0%. As a result of these transactions, the non-controlling interest in our consolidated balance sheets decreased by $50.8 million, with a $37.2 million increase to additional paid-in capital which is net of $11.5 million related to deferred income taxes and $2.1 million of transaction costs, none of which was recognized during the three and six months ended June 30, 2020.
In August 2020, Delek Logistics filed a shelf registration statement, which subsequently became effective, with the SEC for the proposed re-sale or other disposition from time to time by Delek of up to 14.0 million common limited partner units representing our limited partner interests in Delek Logistics. No units were sold as of June 30, 2021.
We have agreements with Delek Logistics that, among other things, establish fees for certain administrative and operational services provided by us and our subsidiaries to Delek Logistics, provide certain indemnification obligations and establish terms for fee-based commercial logistics and marketing services provided by Delek Logistics and its subsidiaries to us. The revenues and expenses associated with these agreements are eliminated in consolidation.
Delek Logistics is a variable interest entity,VIE, as defined under GAAP, and is consolidated into our condensed consolidated financial statements, representing our logistics segment. The assets of Delek Logistics can only be used to settle its own obligations and its creditors have no recourse to our assets. Exclusive of intercompany balances and the marketing agreement intangible asset between Delek Logistics and Delek which are eliminated in consolidation, the Delek Logistics condensed consolidated balance sheets as presented below are included in the condensed consolidated balance sheets of Delek (unaudited, in millions).
| | | | | | | | | | | | | | |
| | | | |
| | June 30, 2021 | | December 31, 2020 |
| ASSETS | | | | |
| Cash and cash equivalents | | $ | 2.2 | | | $ | 4.2 | |
| Accounts receivable | | 18.0 | | | 15.7 | |
| Accounts receivable from related parties | | 0 | | | 5.9 | |
| Inventory | | 2.0 | | | 3.1 | |
| Other current assets | | 0.9 | | | 0.4 | |
| Property, plant and equipment, net | | 454.8 | | | 464.8 | |
| Equity method investments | | 252.0 | | | 253.7 | |
| Operating lease right-of-use assets | | 25.1 | | | 24.2 | |
| Goodwill | | 12.2 | | | 12.2 | |
| Intangible assets, net | | 157.2 | | | 160.1 | |
| Other non-current assets | | 11.1 | | | 12.1 | |
| Total assets | | $ | 935.5 | | | $ | 956.4 | |
| LIABILITIES AND DEFICIT | | | | |
| Accounts payable | | $ | 4.8 | | | $ | 6.7 | |
| Accounts payable to related parties | | 36.8 | | | 0 | |
| | | | |
| Current portion of operating lease liabilities | | 8.0 | | | 8.7 | |
| Accrued expenses and other current liabilities | | 17.9 | | | 12.9 | |
| Long-term debt | | 928.7 | | | 992.3 | |
| Asset retirement obligations | | 6.2 | | | 6.0 | |
| | | | |
| Operating lease liabilities, net of current portion | | 17.0 | | | 15.4 | |
| Other non-current liabilities | | 23.9 | | | 22.7 | |
| Deficit | | (107.8) | | | (108.3) | |
| Total liabilities and deficit | | $ | 935.5 | | | $ | 956.4 | |
Notes to Condensed Consolidated Financial Statements (Unaudited)
| | | | | | | | | | | | | | |
| | September 30, 2020 | | December 31, 2019 |
| | |
| ASSETS | | | | |
| Cash and cash equivalents | | $ | 6.0 | | | $ | 5.5 | |
| Accounts receivable | | 17.5 | | | 13.2 | |
| Accounts receivable from related parties | | 9.9 | | | 0 | |
| Inventory | | 1.7 | | | 12.6 | |
| Other current assets | | 0.4 | | | 2.3 | |
| Property, plant and equipment, net | | 467.5 | | | 295.0 | |
| Equity method investments | | 255.4 | | | 247.0 | |
| Operating lease right-of-use assets | | 18.1 | | | 3.7 | |
| Goodwill | | 12.2 | | | 12.2 | |
| Intangible assets, net | | 161.8 | | | 146.6 | |
| Other non-current assets | | 7.0 | | | 6.3 | |
| Total assets | | $ | 957.5 | | | $ | 744.4 | |
| LIABILITIES AND DEFICIT | | | | |
| Accounts payable | | $ | 4.7 | | | $ | 12.5 | |
| Accounts payable to related parties | | 0 | | | 8.9 | |
| | | | |
| Current portion of operating lease liabilities | | 5.5 | | | 1.4 | |
| Accrued expenses and other current liabilities | | 13.8 | | | 12.2 | |
| Long-term debt | | 1,006.1 | | | 833.1 | |
| Asset retirement obligations | | 5.9 | | | 5.6 | |
| Deferred tax liabilities | | 1.2 | | | 0.2 | |
| Operating lease liabilities, net of current portion | | 12.6 | | | 2.3 | |
| Other non-current liabilities | | 19.2 | | | 19.3 | |
| Deficit | | (111.5) | | | (151.1) | |
| Total liabilities and deficit | | $ | 957.5 | | | $ | 744.4 | |
Effective May 1, 2020, Delek through its wholly owned subsidiaries Lion Oil Company, (“LLC ("Lion Oil”Oil") and Delek Refining, Ltd. (“Delek Refining”) contributed certain leased and owned tractors and trailers and related assets used in the provision of trucking and transportation services for crude oil, petroleum and certain other products throughout Arkansas, Oklahoma and Texas to Delek Trucking, LLC (“Delek Trucking”), a direct wholly owned subsidiary of. Lion Oil. Following this contribution, Lion Oil then sold all of the issued and outstanding membership interests in Delek Trucking (the “Acquisition”“Trucking Acquisition”) to DKL Transportation, LLC (“DKL Transportation”), a wholly owned subsidiary of Delek Logistics.. Promptly following the consummation of the Trucking Acquisition, Delek Trucking merged with and into DKL Transportation, with DKL Transportation, a wholly owned subsidiary of Delek Logistics, continuing as the surviving entity. Total consideration for the Trucking Acquisition was approximately $48.0 million in cash, subject to certain post-closing adjustments, financed primarily with borrowings underon the Delek Logistics’ revolving credit facility. In connection with the Acquisition, Delek Refining, Lion Oil and DKL Transportation entered into a Transportation Services Agreement pursuant to which DKL Transportation will gather, coordinate the pickup of, transport and deliver petroleum products for Delek Refining and Lion Oil, as well as provide ancillary services as requested.Logistics Credit Facility (as defined in Note 8). Prior periods have not been recast in our Note 2 - Segment Data, Note 2, as these assets did not constitute a business in accordance with ASU 2017-01, Clarifying the Definition of a Business("ASU 2017-01"), and the transaction was accounted for as an acquisition of assets between entities under common control.
Effective March 31, 2020, Delek Logistics, through its wholly-owned subsidiary DKL Permian Gathering, LLC, acquired the Big Spring Gathering System, located in Howard, Borden and Martin Counties, Texas, from Delek, which included the execution of related commercial agreements. In connection with the closing of the transaction, Delek, Delek Logistics and various of their respective subsidiaries entered into a Throughput and Deficiency Agreement (the “T&D Agreement”). Under the T&D Agreement, Delek Logistics will operate and maintain the Big Spring Gathering System connecting our interests in and to certain crude oil production with the Delek Logistics' Big Spring, Texas terminal and provide gathering, transportation and other related services. The total consideration was subject to certain post-closing adjustments and was comprised of $100.0 million in cash and 5.0 million common units representing a limited partner interest in Delek Logistics. The cash component of this dropdown was financed with borrowings on the DKL Credit Facility (as defined in Note 8). Prior periods have not been recast in our Segment Data Note 2, as these assets did not constitute a business in accordance with ASU 2017-01 and the transaction was accounted for as an acquisition of assets between entities under common control.
Additionally, in March 2020, we purchased 451,822 of Delek Logistics limited partner units from an investor pursuant to a Common Unit Purchase Agreement between Delek Marketing & Supply, LLC and such investor. The purchase price of the units amounted to approximately $5.0 million.
Notes to Condensed Consolidated Financial Statements (Unaudited)
Note 5 - Equity Method Investments
Wink to Webster Pipeline
On July 30, 2019, we, through our wholly-owned direct subsidiary Delek US Energy, Inc. ("Delek Energy" or "Delek Member"), entered into a limited liability company agreement (the “LLCA”) and related agreements with multiple joint venture members of Wink to Webster Pipeline LLC (“WWP”). Pursuant to the LLCA, Delek Energy acquired a 15% ownership interest in WWP.WWP ("WWP Joint Venture"). WWP intends to construct and operate a crude oil pipeline system from Wink, Texas to Webster, Texas along with certain pipelines from Webster, Texas to other destinations in the Gulf Coast area. Pursuant to the LLCA, Delek Energy will be required to contribute its percentage interest of the applicable construction costs (including certain costs previously incurred by WWP) and, at the date we acquired our ownership interest, it was anticipated that Delek Energy’s capital contributions would total approximately $340 million to $380 million over the course of construction (expected to be two to three years). Construction of the crude oil pipeline system remains ongoing, where the main segment of the pipeline system connecting the Permian Basin to Houston, Texas was recently completed and began transporting crude oil in October 2020.
During the ninesix months ended SeptemberJune 30, 2020, and September 30, 2019, we made capital contributions totaling $18.9 million and $75.3 million, respectively. As of December 31, 2019, Delek's investment balance in WWP totaled $125.3 million and we recognized a nominal amount of income on the investment for the three and nine months ended September 30, 2019.million.
On February 21, 2020, we, through our wholly-owned direct subsidiary Delek Energy, entered into the W2W Holdings LLC ("HoldCo") Agreement with MPLX Operations LLC ("MPLX") (collectively, with its wholly-owned subsidiaries, the "WWP Project Financing Joint Venture" or the "WWP Project Financing JV"). The WWP Project Financing JV was created for the specific purpose of obtaining financing through its wholly-owned subsidiary, W2W Finance LLC, to fund the majority of our combined capital calls resulting from and occurring during the construction period of the pipeline system under the WWP Joint Venture, and to service that debt. In connection with the arrangement, both Delek Energy and MPLX contributed their respective 15% ownership interests to the WWP Project Financing JV as collateral for and in service of the related project financing. Accordingly, distributions received from WWP through the WWP Project Financing JV will first be applied in service of the related project financing debt, with excess distributions being made to the members of the WWP Project Financing JV as provided for in the W2W Holdings LLC Agreement and as allowed under the project financing debt. The obligations of the members under the W2W Holdings LLC Agreement are guaranteed by the parents of the members of the WWP Project Financing JV.
The Company evaluated Delek Member'sEnergy's investment in HoldCoW2W Holdings LLC ("HoldCo") and determined that HoldCo is a variable interest entity.VIE. The Company determined it is not the primary beneficiary since it does not have the power to direct activities that most significantly impact HoldCo. The Company does not hold a controlling financial interest in HoldCo because no single party has the power to direct the activities that most significantly impact HoldCo’s economic performance since power to make the decisions about the significant activities is shared equally with MPLX and all significant decisions require unanimous consent of the Boardboard of Directors.directors of HoldCo. The Company accounts for its investment in HoldCo using the equity method of accounting due to its significant influence with its 50% membership interest.
The Company's maximum exposure to any losses incurred by HoldCo is limited to its investment. As of SeptemberJune 30, 2020,2021, except for the guarantee of member obligations under the W2W Holdings LLC Agreement, the Company does not have other existing guarantees with or to HoldCo, or any third-party work contracted with it.
As of SeptemberJune 30, 2021 and December 31, 2020, Delek's investment balance in WWP Project Financing Joint Venture totaled $73.3$62.6 million and $66.6 million, respectively, and is included as part of total assets in corporate, other and eliminations in our segment disclosure. During the ninesix months ended SeptemberJune 30, 2020, we received distributions of $69.3 million from WWP Project Financing Joint Venture to return excess contributions made. In addition on the investment, we recognized income totaling $0.2 million and a loss of $1.8$3.9 million and $4.1 million for the three and nine six
Notes to Condensed Consolidated Financial Statements (Unaudited)
months ended SeptemberJune 30, 2021, respectively, and a loss of $0.9 million and $2.0 million for the three and six months ended June 30, 2020, respectively.
Delek Logistics Investments
In May 2019, Delek Logistics, through its wholly owned indirect subsidiary DKL Pipeline, LLC (“DKL Pipeline”), entered into a Contribution and Subscription Agreement (the “Contribution Agreement”) with Plains Pipeline, L.P. (“Plains”) and Red River Pipeline Company LLC (“Red River”). Pursuant to the Contribution Agreement, DKL Pipeline contributed $124.7 million, substantially all of which was financed under the Delek Logistics Credit Facility (as defined in Note 8), to Red River in exchange for a 33% membership interest in Red River and DKL Pipeline’s admission as a member of Red River (the "Red River Pipeline Joint Venture"). Red River owns a 16-inch crude oil pipeline running from Cushing, Oklahoma to Longview, Texas. In August 2020, Red River completed a planned expansion project to increase the pipeline capacity which commenced operations on October 1, 2020. Delek Logistics contributed an additional $3.5 million related to such expansion project in May 2019.2019 and during 2020 made additional capital contributions of $12.2 million based on capital calls received. During the ninesix months ended SeptemberJune 30, 2020,2021, we made additional capital contributions totaling $11.8$1.4 million based on capital calls received. As of SeptemberJune 30, 20202021 and December 31, 2019,2020, Delek's investment balance in Red River totaled $143.5$143.2 million and $131.0$141.8 million, respectively. We recognized income on the investment totaling $2.0$3.7 million and $6.8$6.0 million and for the three and six months ended June 30, 2021, respectively, and $2.9 million and $4.7 million for the three and ninesix months ended SeptemberJune 30, 2020, respectively and $4.7 million and $7.0 million for the three and nine months ended September 30, 2019, respectively. This investment is accounted for using the equity method and is included as part of total assets in our
Notes to Condensed Consolidated Financial Statements (Unaudited)
logistics segment.
In addition to Red River, Delek Logistics has 2 joint ventures that own and operate logistics assets, and which serve third parties and subsidiaries of Delek. We own a 50% membership interest in the entity formed with an affiliate of Plains All American Pipeline, L.P. to operate one of these pipeline systems (the "Caddo Pipeline") and a 33% membership interest in Andeavor Logistics Rio Pipeline LLC which operates the other pipeline system (the "Rio Pipeline"). As of SeptemberJune 30, 20202021 and December 31, 2019,2020, Delek Logistics' investment balances in these joint ventures totaled $111.8$108.9 million and $116.0$111.9 million, respectively, and were accounted for using the equity method. We recognized income on these investments totaling $2.9 million and $10.1$4.6 million for the three and ninesix months ended SeptemberJune 30, 2020,2021, respectively, and $3.7$3.5 million and $7.9$7.3 million for the three and ninesix months ended SeptemberJune 30, 2019,2020, respectively.
Other Investments
We have a 50% interest in a joint venture that owns an asphalt terminal located in Brownwood, Texas. As of SeptemberJune 30, 20202021 and December 31, 2019,2020, Delek's investment balance in this joint venture was $40.7$41.8 million and $30.7$39.3 million, respectively. We recognized income on this investment totaling $7.5$3.9 million and $13.0$4.8 million for the three and ninesix months ended SeptemberJune 30, 2020,2021, respectively, and $7.9$5.0 million and $13.1$5.5 million for the three and ninesix months ended SeptemberJune 30, 2019,2020, respectively. This investment is accounted for using the equity method and is included as part of total assets in corporate, other and eliminations in our segment disclosure.
Delek Renewables, LLC, a wholly-owned subsidiary of Delek, has a joint venture that owns, operates and maintains a terminal consisting of an ethanol unit train facility with an ethanol tank in North Little Rock, Arkansas. As of SeptemberJune 30, 20202021 and December 31, 2019,2020, Delek Renewables, LLC's investment balance in this joint venture was $3.8$4.3 million and $4.3$4.0 million, respectively, and was accounted for using the equity method. We recognized income on this investment totaling $0.2 million and $0.3 million for the three and six months ended June 30, 2021, respectively, and $0.2 million and $0.3 million for the three and six months ended June 30, 2020, respectively. The investment in this joint venture is reflected in the refining segment.
Note 6 - Inventory
Crude oil, work in process, refined products, blendstocks and asphalt inventory for all of our operations, excluding the Tyler refinery and merchandise inventory in our retail segment, are stated at the lower of cost determined using FIFO basis or net realizable value. Cost of all inventory at the Tyler refinery is determined using the LIFO inventory valuation method and inventory is stated at the lower of cost or market. Retail merchandise inventory consists of cigarettes, beer, convenience merchandise and food service merchandise and is stated at estimated cost as determined by the retail inventory method.
Carrying value of inventories consisted of the following (in millions):
| | | September 30, 2020 | | December 31, 2019 | | June 30, 2021 | | December 31, 2020 |
| Refinery raw materials and supplies | Refinery raw materials and supplies | | $ | 261.4 | | | $ | 400.4 | | Refinery raw materials and supplies | | $ | 415.0 | | | $ | 270.7 | |
| Refinery work in process | Refinery work in process | | 82.9 | | | 109.1 | | Refinery work in process | | 140.2 | | | 92.1 | |
| Refinery finished goods | Refinery finished goods | | 299.1 | | | 397.5 | | Refinery finished goods | | 437.1 | | | 327.1 | |
| Retail fuel | Retail fuel | | 5.9 | | | 7.3 | | Retail fuel | | 9.3 | | | 6.2 | |
| Retail merchandise | Retail merchandise | | 21.0 | | | 19.8 | | Retail merchandise | | 27.6 | | | 28.5 | |
| Logistics refined products | Logistics refined products | | 1.7 | | | 12.6 | | Logistics refined products | | 2.0 | | | 3.1 | |
| Total inventories | Total inventories | | $ | 672.0 | | | $ | 946.7 | | Total inventories | | $ | 1,031.2 | | | $ | 727.7 | |
Notes to Condensed Consolidated Financial Statements (Unaudited)
At SeptemberJune 30, 2020,2021, we recorded a pre-tax inventory valuation reserve of $67.5$0.9 million, $65.0 millionNaN of which related to LIFO inventory, due to a market price decline below our cost of certain inventory products. At December 31, 2019,2020, we recorded a pre-tax inventory valuation reserve of $1.7$31.1 million, $1.2$30.3 million of which related to LIFO inventory, which reversed in the first quarter of 20202021 due to the sale of inventory quantities that gave rise to the December 31, 20192020 reserve. We recognized a net reduction (increase) in cost of materials and other in the accompanying condensed consolidated statements of income related to the change in pre-tax inventory valuation of $9.5$9.7 million and $(65.6)$30.1 million for the three and ninesix months ended SeptemberJune 30, 2020,2021, respectively, and $(20.0)$203.1 million and $31.5$(75.1) million for the three and ninesix months ended SeptemberJune 30, 2019,2020, respectively.
Note 7 - Crude Oil Supply and Inventory Purchase Agreement
Delek has Supply and Offtake Agreements with J. Aron & Company ("J. Aron") in connection with its El Dorado, Big Spring and Krotz Springs refineries (collectively, the "Supply and Offtake Agreements"). Pursuant to the Supply and Offtake Agreements, (i) J. Aron agrees to sell to us, and we agree to buy from J. Aron, at market prices, crude oil for processing at these refineries and (ii) we agree to sell, and J. Aron agrees to buy, at market prices, certain refined products produced at these refineries. The Supply and Offtake Agreements also provide for the lease to J. Aron of crude oil and refined product storage facilities, and the identification of prospective purchasers of refined products on J. Aron’s behalf. At the inception of the Supply and Offtake Agreements, we transferred title to a certain number of barrels of crude and other inventories to J. Aron (the "Step-In"), and the Supply and Offtake Agreements require the repurchase of remaining inventory (including certain "Baseline Volumes") at the termination of those Agreements (the "Step-Out"). The Supply and Offtake Agreements are accounted for as inventory financing arrangements under the fair value election provided by ASC 815 Derivatives and Hedging ("ASC 815") and ASC 825, Financial Instruments ("ASC 825").
Barrels subject to the Supply and Offtake Agreements are as follows:
| | (in millions) | (in millions) | | El Dorado | | Big Spring | | Krotz Springs | (in millions) | | El Dorado | | Big Spring | | Krotz Springs |
| Baseline Volumes pursuant to the respective Supply and Offtake Agreements | Baseline Volumes pursuant to the respective Supply and Offtake Agreements | | 2.0 | | | 0.8 | | | 1.3 | | Baseline Volumes pursuant to the respective Supply and Offtake Agreements | | 2.0 | | | 0.8 | | | 1.3 | |
Barrels of inventory consigned under the respective Supply and Offtake Agreements as of September 30, 2020 (1) | | 3.8 | | | 1.3 | | | 1.4 | | |
Barrels of inventory consigned under the respective Supply and Offtake Agreements as of December 31, 2019 (1) | | 3.5 | | | 2.0 | | | 1.7 | | |
Barrels of inventory consigned under the respective Supply and Offtake Agreements as of June 30, 2021 (1) | | Barrels of inventory consigned under the respective Supply and Offtake Agreements as of June 30, 2021 (1) | | 3.6 | | | 1.4 | | | 1.3 | |
Barrels of inventory consigned under the respective Supply and Offtake Agreements as of December 31, 2020 (1) | | Barrels of inventory consigned under the respective Supply and Offtake Agreements as of December 31, 2020 (1) | | 4.0 | | | 1.3 | | | 1.2 | |
(1) Includes Baseline Volumes plus/minus over/short quantities.
The Supply and Offtake Agreements have certain termination provisions, which may include requirements to negotiate with third parties for the assignment to us of certain contracts, commitments and arrangements, including procurement contracts, commitments for the sale of product, and pipeline, terminalling, storage and shipping arrangements.
The Supply and Offtake Agreements were amended in December 2018 for Big Spring and in January 2019 for El Dorado and Krotz Springs so that the Baseline Step-Out Liabilities, as defined below, were based upon a fixed price. As a result, we recorded gains on the change in fair value resulting from the modification in cost of materials and other in the periods in which the amendments occurred, including a gain of $7.6 million which was recognized in the first quarter of 2019. As a result of these amendments, the subsequent changes in fair value of the Baseline Step-Out Liabilities were recorded in interest expense.
In January 2020, we amended our three Supply and Offtake Agreements so that the repurchase of Baseline Volumes at the end of the Supply and Offtake Agreement term (representing the "Baseline Step-Out Liability" or, collectively, the "Baseline Step-Out Liabilities") was based on market-indexed prices subject to commodity price risk. As a result of the amendment, such Baseline Step-Out Liabilities continued to be recorded at fair value under the fair value election provided by ASC 815 and ASC 825, where the fair value now reflected changes in commodity price risk rather than interest rate risk with subsequent changes in fair value being recorded in cost of materials and other. We recognized a loss in the first quarter of 2020 of $1.5 million on the change in fair value resulting from the modification.
In April 2020, we amended and restated our three Supply and Offtake Agreements to renew and extend the terms to December 30, 2022, with J. Aron having the sole discretion to further extend to May 30, 2025 by giving at least 6 months prior notice to the current maturity date. As part of this amendment, there were changes to the underlying market index, annual fee, the crude purchase fee, crude roll fees and timing of cash settlements related to periodic price adjustments (the "Periodic Price Adjustments"). The Baseline Step-Out Liabilities continue to be recorded at fair value under the fair value election included under ASC 815 and ASC 825. The Baseline Step-Out Liabilities have a floating component whose fair value reflects changes to commodity price risk with changes in fair value recorded in cost of materials and other and a fixed component whose fair value reflects changes to interest rate risk with changes in fair value recorded in interest expense. There was no amendment date change in fair value resulting from the modification. The Baseline Step-Out Liabilities are reflected as non-current liabilities on our consolidated balance sheet to the extent that they are not contractually due within twelve months.
Pursuant to the Periodic Price Adjustments provision in the Supply and Offtake Agreements, the Company may be required to pay down all or a portion of the fixed component of the Baseline Step-Out Liabilities or may receive additional proceeds depending on the change in fair value of the inventory collateral subject to a threshold at certain specified Periodicperiodic pricing dates (the "Periodic Pricing Dates,Dates"), which occur on October 1st and May 1st, annually, not to extend beyond expiration of the Supply and Offtake Agreements. Additionally, at the Periodic Pricing Dates, if a Periodic Price Adjustment is triggered, the prospective pricing underlying the fixed component of the Baseline Step-Out Liabilities will be adjusted to reflect either the pay-down or the incremental proceeds, accordingly. On October 1, 2020, the provision was triggered and a paydown amounting to $20.8 million was made to J. Aron on October 30, 2020. The prospective pricing underlying the
fixed component of the Baseline Step-Out liabilities was adjusted accordingly to reflect this payment, resulting in a reduction to the fixed differential component of our long-term Supply and Offtake Obligation totaling $20.8 million and a prospective contractual reset of the fixed differentials subject to future Periodic Price Adjustments. Contemporaneous with the payment, J. Aron separately refunded to us the $10.0 million of deferred additional monthly fees. On May 1, 2021 the provision was triggered and on May 28, 2021, $15.2 million of incremental proceeds were received from J. Aron. Effective June 4, 2021, J. Aron terminated our $10.0 million letter of credit that was issued to them under the terms of the Supply and Offtake Agreement. As of SeptemberJune 30, 2020,2021, the fixed component of the Baseline Step-Out Liabilities subject to the Periodic Price Adjustments amounted to approximately $58.8$38.6 million. All or someSome portion of that amount may become due or payable in periods occurring within twelve months, if Periodic Price Adjustments are triggered in October 2020 and May
2021. See Note 19 - Subsequent Events, for details on the subsequent Periodic Price Adjustment and paydown triggered on October 1, 2020.Pricing Dates.
Monthly activity resulting in over and short volumes continue to be valued using market-indexed pricing, and are included in current liabilities (or receivables) on our condensed consolidated balance sheet.
Net balances payable (receivable) under the Supply and Offtake Agreements were as follows as of the balance sheet dates:
| | (in millions) | (in millions) | | El Dorado | | Big Spring | | Krotz Springs | | Total | (in millions) | | El Dorado | | Big Spring | | Krotz Springs | | Total |
| Balances as of September 30, 2020: | | | | | | | | | |
| Balances as of June 30, 2021: | | Balances as of June 30, 2021: | | | | | | | | |
| Baseline Step-Out Liability | Baseline Step-Out Liability | | $ | 100.5 | | | $ | 49.1 | | | $ | 70.8 | | | $ | 220.4 | | Baseline Step-Out Liability | | $ | 158.9 | | | $ | 68.2 | | | $ | 101.9 | | | $ | 329.0 | |
| Revolving over/short inventory financing liability | Revolving over/short inventory financing liability | | 80.6 | | | 19.7 | | | 2.5 | | | 102.8 | | Revolving over/short inventory financing liability | | 122.8 | | | 44.9 | | | (0.4) | | | 167.3 | |
| Total Obligations Under Supply and Offtake Agreements | Total Obligations Under Supply and Offtake Agreements | | 181.1 | | | 68.8 | | | 73.3 | | | 323.2 | | Total Obligations Under Supply and Offtake Agreements | | 281.7 | | | 113.1 | | | 101.5 | | | 496.3 | |
| Less: Current portion | Less: Current portion | | 80.6 | | | 19.7 | | | 2.5 | | | 102.8 | | Less: Current portion | | 122.8 | | | 44.9 | | | (0.4) | | | 167.3 | |
| Obligations Under Supply and Offtake Agreements - Noncurrent portion | Obligations Under Supply and Offtake Agreements - Noncurrent portion | | $ | 100.5 | | | $ | 49.1 | | | $ | 70.8 | | | $ | 220.4 | | Obligations Under Supply and Offtake Agreements - Noncurrent portion | | $ | 158.9 | | | $ | 68.2 | | | $ | 101.9 | | | $ | 329.0 | |
| Other current payable for monthly activity true-up | | $ | 12.6 | | | $ | 1.0 | | | $ | 0 | | | $ | 13.6 | | |
| Other current payable (receivable) for monthly activity true-up | | Other current payable (receivable) for monthly activity true-up | | $ | 17.8 | | | $ | (0.5) | | | $ | 18.8 | | | $ | 36.1 | |
| | (in millions) | (in millions) | | El Dorado | | Big Spring | | Krotz Springs | | Total | (in millions) | | El Dorado | | Big Spring | | Krotz Springs | | Total |
| Balances as of December 31, 2019: | | | | | | | | | |
| Balances as of December 31, 2020: | | Balances as of December 31, 2020: | | | | | | | | |
| Baseline Step-Out Liability | Baseline Step-Out Liability | | $ | 125.5 | | | $ | 57.2 | | | $ | 87.6 | | | $ | 270.3 | | Baseline Step-Out Liability | | $ | 106.3 | | | $ | 47.9 | | | $ | 70.7 | | | $ | 224.9 | |
| Revolving over/short inventory financing liability | | 93.0 | | | 73.5 | | | 40.5 | | | 207.0 | | |
| Revolving over/short inventory financing liability (receivable) | | Revolving over/short inventory financing liability (receivable) | | 102.0 | | | 25.3 | | | (4.5) | | | 122.8 | |
| Total Obligations Under Supply and Offtake Agreements | Total Obligations Under Supply and Offtake Agreements | | 218.5 | | | 130.7 | | | 128.1 | | | 477.3 | | Total Obligations Under Supply and Offtake Agreements | | 208.3 | | | 73.2 | | | 66.2 | | | 347.7 | |
Less: Current portion | Less: Current portion | | 218.5 | | | 73.5 | | | 40.5 | | | 332.5 | | Less: Current portion | | 102.0 | | | 25.3 | | | (4.5) | | | 122.8 | |
| Obligations Under Supply and Offtake Agreements - Noncurrent portion | Obligations Under Supply and Offtake Agreements - Noncurrent portion | | $ | 0 | | | $ | 57.2 | | | $ | 87.6 | | | $ | 144.8 | | Obligations Under Supply and Offtake Agreements - Noncurrent portion | | $ | 106.3 | | | $ | 47.9 | | | $ | 70.7 | | | $ | 224.9 | |
| Other current receivable for monthly activity true-up | | $ | (16.4) | | | $ | (3.1) | | | $ | (3.5) | | | $ | (23.0) | | |
| Other current payable for monthly activity true-up | | Other current payable for monthly activity true-up | | $ | 6.6 | | | $ | 7.0 | | | $ | 0 | | | $ | 13.6 | |
(1) Current portion for Krotz Springs includes $1.9 million of current portion of obligations under Supply and Offtake Agreements and $6.4 million of current assets presented in our condensed consolidated balance sheet.
The Supply and Offtake Agreements require payments of fixed annual fees which are factored into the interest rate yield under the fair value accounting model. Recurring cash fees paid during the periods presented were as follows:
| | | | | | | | | | | | | | | | | | | | | | | | | | |
| (in millions) | | El Dorado | | Big Spring | | Krotz Springs | | Total |
| Recurring cash fees paid during the three months ended September 30, 2020 | | $ | 1.5 | | | $ | 0.7 | | | $ | 1.1 | | | $ | 3.3 | |
| Recurring cash fees paid during the three months ended September 30, 2019 | | $ | 2.9 | | | $ | 1.5 | | | $ | 2.5 | | | $ | 6.9 | |
| Recurring cash fees paid during the nine months ended September 30, 2020 | | $ | 7.4 | | | $ | 2.8 | | | $ | 3.1 | | | $ | 13.3 | |
| Recurring cash fees paid during the nine months ended September 30, 2019 | | $ | 8.5 | | | $ | 4.4 | | | $ | 7.6 | | | $ | 20.5 | |
| | | | | | | | | | | | | | | | | | | | | | | | | | |
| (in millions) | | El Dorado | | Big Spring | | Krotz Springs | | Total |
| Recurring cash fees paid during the three months ended June 30, 2021 | | $ | 2.8 | | | $ | 0.8 | | | $ | 1.1 | | | $ | 4.7 | |
| Recurring cash fees paid during the three months ended June 30, 2020 | | $ | 2.7 | | | $ | 1.1 | | | $ | 1.0 | | | $ | 4.8 | |
| Recurring cash fees paid during the six months ended June 30, 2021 | | $ | 5.2 | | | $ | 1.5 | | | $ | 2.2 | | | $ | 8.9 | |
| Recurring cash fees paid during the six months ended June 30, 2020 | | $ | 5.9 | | | $ | 2.1 | | | $ | 2.0 | | | $ | 10.0 | |
Interest expense recognized under the Supply and Offtake Agreements includes the yield attributable to recurring cash fees, one-time cash fees (e.g., in connection with amendments), as well as other changes in fair value, which may increase or decrease interest expense. Total interest expense incurred during the periods presented was as follows:
| | | | | | | | | | | | | | | | | | | | | | | | | | |
| (in millions) | | El Dorado | | Big Spring | | Krotz Springs | | Total |
| Interest expense for the three months ended September 30, 2020 | | $ | 1.5 | | | $ | 0.7 | | | $ | 1.1 | | | $ | 3.3 | |
| Interest expense for the three months ended September 30, 2019 | | $ | 3.7 | | | $ | 2.0 | | | $ | 2.7 | | | $ | 8.4 | |
| Interest expense for the nine months ended September 30, 2020 | | $ | 7.8 | | | $ | 5.9 | | | $ | 3.5 | | | $ | 17.2 | |
| Interest expense for the nine months ended September 30, 2019 | | $ | 10.9 | | | $ | 3.6 | | | $ | 8.8 | | | $ | 23.3 | |
| | | | | | | | | | | | | | | | | | | | | | | | | | |
| (in millions) | | El Dorado | | Big Spring | | Krotz Springs | | Total |
| Interest expense for the three months ended June 30, 2021 | | $ | 2.8 | | | $ | 0.8 | | | $ | 1.1 | | | $ | 4.7 | |
| Interest expense for the three months ended June 30, 2020 | | $ | 2.7 | | | $ | 1.1 | | | $ | 1.0 | | | $ | 4.8 | |
| Interest expense for the six months ended June 30, 2021 | | $ | 5.2 | | | $ | 1.5 | | | $ | 2.2 | | | $ | 8.9 | |
| Interest expense for the six months ended June 30, 2020 | | $ | 6.3 | | | $ | 5.2 | | | $ | 2.4 | | | $ | 13.9 | |
Reflected in interest expense are losses totaling $3.9 million for the ninesix months ended SeptemberJune 30, 2020, and gains totaling $7.7 million and gains totaling $11.4 million for the three and nine months ended September 30, 2019, respectively, related to the changes in fair value in the Baseline Step-Out Liabilities component of Obligations Underunder Supply and Offtake Agreements. There were 0 such gainslosses for the three
or losses for threeand six months ended SeptemberJune 30, 2020.2021.
We maintained letters of credit under the Supply and Offtake Agreements as follows:
| | | | | | | | | | | | | | | | | |
| (in millions) | | | El Dorado | | Big Spring and Krotz Springs |
| Letters of credit outstanding as of | September 30, 2020 | | $ | 170.0 | | | $ | 10.0 | |
| Letters of credit outstanding as of | December 31, 2019 | | $ | 180.0 | | | $ | 44.0 | |
| | | | | | | | | | | | | | |
| (in millions) | | El Dorado | | Big Spring and Krotz Springs |
| Letters of credit outstanding as of June 30, 2021 | | $ | 195.0 | | | $ | 0 | |
| Letters of credit outstanding as of December 31, 2020 | | $ | 195.0 | | | $ | 10.0 | |
Note 8 - Long-Term Obligations and Notes Payable
Outstanding borrowings, net of unamortized debt discounts and certain deferred financing costs, under Delek’s existing debt instruments are as follows (in millions):
| | | September 30, 2020 | | December 31, 2019 | | June 30, 2021 | | December 31, 2020 |
| Revolving Credit Facility | Revolving Credit Facility | | $ | 110.0 | | | $ | 30.0 | | Revolving Credit Facility | | $ | 0 | | | $ | 0 | |
Term Loan Credit Facility (1) | Term Loan Credit Facility (1) | | 1,248.6 | | | 1,069.5 | | Term Loan Credit Facility (1) | | 1,243.4 | | | 1,246.8 | |
Hapoalim Term Loan (2) | | Hapoalim Term Loan (2) | | 39.2 | | | 39.3 | |
| Delek Logistics Credit Facility | Delek Logistics Credit Facility | | 760.7 | | | 588.4 | | Delek Logistics Credit Facility | | 288.8 | | | 746.6 | |
Hapoalim Term Loan (2) | | 39.3 | | | 39.5 | | |
Delek Logistics Notes (3) | | 245.4 | | | 244.7 | | |
Delek Logistics 2025 Notes (3) | | Delek Logistics 2025 Notes (3) | | 246.2 | | | 245.7 | |
Delek Logistics 2028 Notes (4) | | Delek Logistics 2028 Notes (4) | | 393.7 | | | 0 | |
| Reliant Bank Revolver | Reliant Bank Revolver | | 50.0 | | | 50.0 | | Reliant Bank Revolver | | 33.0 | | | 50.0 | |
| Promissory Notes | Promissory Notes | | 20.0 | | | 45.0 | | Promissory Notes | | 0 | | | 20.0 | |
| | | | 2,474.0 | | | 2,067.1 | | | | 2,244.3 | | | 2,348.4 | |
| Less: Current portion of long-term debt and notes payable | Less: Current portion of long-term debt and notes payable | | 33.4 | | | 36.4 | | Less: Current portion of long-term debt and notes payable | | 46.4 | | | 33.4 | |
| | | | $ | 2,440.6 | | | $ | 2,030.7 | | | | $ | 2,197.9 | | | $ | 2,315.0 | |
(1)Net of deferred financing costs of $3.0$2.5 million and $3.5$2.9 million and debt discount of $24.7$20.6 million and $12.5$23.3 million at SeptemberJune 30, 20202021 and December 31, 2019,2020, respectively.
(2)Net of deferred financing costs of $0.2$0.1 million and $0.3$0.2 million and debt discount of $0.2$0.1 million and $0.2$0.1 million at SeptemberJune 30, 20202021 and December 31, 2019,2020, respectively.
(3)Net of deferred financing costs of $3.5$2.9 million and $4.0$3.3 million and debt discount of $1.1$0.9 million and $1.3$1.0 million at SeptemberJune 30, 20202021 and December 31, 2019,2020, respectively.
(4)Net of deferred financing costs of $6.3 million at June 30, 2021.
Delek Revolver and Term Loan
On March 30, 2018 (the "Closing Date"), Delek entered into (i) a new term loan credit agreement with Wells Fargo Bank, National Association, as administrative agent (the "Term Administrative Agent"), Delek, as borrower, certain subsidiaries of Delek, as guarantors, and the lenders from time to time party thereto, providing for a senior secured term loan facility in an amount of $700.0 million (the "Term Loan Credit Facility") and (ii) a second amended and restated credit agreement with Wells Fargo Bank, National Association, as administrative agent (the "Revolver Administrative Agent"), Delek, as borrower, certain subsidiaries of Delek, as guarantors, and the other lenders party thereto, providing for a senior secured asset-based revolving credit facility with commitments of $1.0 billion (the "Revolving Credit Facility" and, together with the Term Loan Credit Facility, the "New Credit Facilities").
The Revolving Credit Facility permits borrowings in Canadian dollars of up to $50.0 million. The Revolving Credit Facility also permits the issuance of letters of credit of up to $400.0 million, including letters of credit denominated in Canadian dollars of up to $10.0 million. Delek may designate restricted subsidiaries as additional borrowers under the Revolving Credit Facility.
The Term Loan Credit Facility was drawn in full for $700.0 million on the Closing Date at an original issue discount of 0.50%. Proceeds under the Term Loan Credit Facility, as well as proceeds of approximately $300.0 million in borrowings under the Revolving Credit Facility on the Closing Date, were used to repay certain indebtedness of Delek and its subsidiaries (the “Refinancing”), as well as certain fees, costs and expenses in connection with the closing of the New Credit Facilities, with any remaining proceeds held in cash. Proceeds of future borrowings under the Revolving Credit Facility willmay be used for working capital and general corporate purposes of Delek and its subsidiaries.
Notes to Condensed Consolidated Financial Statements (Unaudited)
On May 22, 2019 (the "First Incremental Effective Date"), we amended the Term Loan Credit Facility agreement pursuant to the terms of the First Incremental Amendment to Term Loan Credit Agreement (the "Incremental Amendment"). Pursuant to the Incremental Amendment, the Company borrowed $250.0 million in aggregate principal amount of incremental term loans (the “Incremental Term Loans”) at an original issue discount of 0.75%, increasing the aggregate principal amount of loans outstanding under the Term Loan Credit Facility on the First Incremental Effective Date to $943.0 million.. On November 12, 2019 (the "Second Incremental Effective Date"), we amended the Term Loan Credit facility agreement pursuant to the terms of the Second Incremental Amendment to the Term Loan Credit Agreement (the "Second Incremental Amendment") and borrowed $150.0 million in aggregate principal amount of incremental term loans (the "Incremental Loans") at an original issue discount of 1.21%, increasing the aggregate principal amount of loans outstanding under the Term Loan Credit Facility on the Second Incremental Effective Date to $1,088.3 million.. The terms of the Incremental Term Loans and Incremental Loans are substantially identical to the terms applicable to the initial term loans under the Term Loan Credit Facility borrowed in March 2018. There are no restrictions on the Company's use of the proceeds of the Incremental Term Loans and Incremental Loans. The proceeds may be used for (i) reducing utilizations under the Revolving Credit Facility, (ii) general corporate purposes and (iii) paying transaction fees and expenses associated with the incremental amendments.
On May 19, 2020, we amended the Term Loan Credit Facility agreement and borrowed $200.0 million in aggregate principal amount of incremental term loans (the “Third Incremental Term Loan”) at an original issue discount of 7.00%. The Third Incremental Term Loan constitutes a separate class of term loanloans (the "Class B Loan"Loans") under the Term Loan Credit Facility from those initially borrowed in March 2018 and the incremental term loans borrowed in May 2019 and November 2019 (collectively, the "Class A Loans"). Delek will be required to pay a make-whole prepayment fee if the Third Incremental Term Loan is prepaid pursuant to an optional prepayment, in connection with a non-permitted debt issuance or in connection with an acceleration within one year of the incurrence of the Third Incremental Term Loan. Delek may voluntarily prepay the outstanding Third Incremental Term LoansLoan at any time subject to customary “breakage”breakage costs with respect to LIBOR loans and subject to a prepayment premium of 1.00% in connection with certain customary repricing events that may occur during the period from the day after the first anniversary of the Third Incremental Term Loan through the second anniversary of the Third Incremental Term Loan. The other terms of the Third Incremental Term Loan are substantially identical to the terms applicable to the Class A Loans. The proceeds of the Third Incremental Term Loan may be used (i) for general corporate purposes and (ii) to pay transaction fees and expenses associated with the Third Incremental Term Loan.
Interest and Unused Line Fees
The interest rates applicable to borrowings under the Term Loan Credit Facility and the Revolving Credit Facility are based on a fluctuating rate of interest measured by reference to either, at Delek’s option, (i) a base rate, plus an applicable margin, or (ii) a reserve-adjusted LIBOR, plus an applicable margin (or, in the case of Revolving Credit Facility borrowings denominated in Canadian dollars, the Canadian dollar bankers' acceptances rate ("CDOR")). The initial applicable margin for all Term Loan Credit Facility borrowings was 1.50% per annum with respect to base rate borrowings and 2.50% per annum with respect to LIBOR borrowings. On October 26, 2018, Delek entered into an amendment to the Term Loan Credit Facility (the “First Amendment”) to reduce the margin on certain borrowings under the Term Loan Credit Facility and incorporate certain other changes. The First Amendment decreased the applicable margins for Class A Loans under (i) Base Rate Loans from 1.50%by 0.25% to 1.25% and (ii) LIBOR Rate Loans from 2.50%by 0.25% to 2.25%, as such terms are defined in the Term Loan Credit Facility. Class B Loans incurred under the Third Incremental Term Loan bear interest at a rate that is determined, at the Company’s election, at LIBOR or at base rate, in each case, plus an applicable margin of 5.50% with respect to LIBOR borrowings and 4.50% with respect to base rate borrowings. Additionally, Class B loans that are LIBOR borrowings are subject to a minimum LIBOR rate floor of 1.00%.
The initial applicable margin for Revolving Credit Facility borrowings was 0.25% per annum with respect to base rate borrowings and 1.25% per annum with respect to LIBOR and CDOR borrowings, and the applicable margin for such borrowings after September 30, 2018 is based on Delek’s excess availability as determined by reference to a borrowing base, ranging from 0.25% to 0.75% per annum with respect to base rate borrowings and from 1.25% to 1.75% per annum with respect to LIBOR and CDOR borrowings.
In addition, the Revolving Credit Facility requires Delek to pay an unused line fee on the average amount of unused commitments thereunder in each quarter, which the fee is at a rate of 0.25% or 0.375% per annum, depending on average commitment usage for such quarter. As of SeptemberJune 30, 2020,2021, the unused line fee was 0.375% per annum.
Maturity and Repayments
The Revolving Credit Facility will mature and the commitments thereunder will terminate on March 30, 2023. The Term Loan Credit Facility matures on March 30, 2025 and requires scheduled quarterly principal payments on the last business day of the applicable quarter. Pursuant to the Incremental Amendment, quarterly payments increased from $1.75 million to $2.38 million. Pursuant to the Second Incremental Amendment, the quarterly payments increased to $2.75 million commencing with December 31, 2019.2019 on the Class A Loans. Additionally, the Term Loan Credit Facility requires prepayments by Delek with the net cash proceeds from certain debt incurrences, asset dispositions and insurance or condemnation events with respect to Delek’s assets, subject to certain exceptions, thresholds and reinvestment rights. The Term Loan Credit Facility also requires annual prepayments with a variable percentage of Delek’s excess cash flow, ranging from 50.0% to
Notes to Condensed Consolidated Financial Statements (Unaudited)
0% depending on Delek’s consolidated fiscal year end secured net leverage ratio. The Third Incremental Term Loan requires quarterly payments on the Class B Loans of $0.5 million commencing June 30, 2020.
Guarantee and Security
The obligations of the borrowers under the New Credit Facilities are guaranteed by Delek and each of its direct and indirect, existing and future, wholly-owned domestic subsidiaries, subject to customary exceptions and limitations, and excluding Delek Logistics Partners, LP, Delek Logistics GP, LLC, and each subsidiary of the foregoing (collectively, the "MLP Subsidiaries"). Borrowings under the New Credit Facilities are also guaranteed by DK Canada Energy ULC, a British Columbia unlimited liability company and a wholly-owned restricted subsidiary of Delek.
Notes to Condensed Consolidated Financial Statements (Unaudited)
The Revolving Credit Facility is secured by a first priority lien over substantially all of Delek’s and each guarantor's receivables, inventory, renewable identification numbers ("RINs"), instruments, intercompany loan receivables, deposit and securities accounts and related books and records and certain other personal property, subject to certain customary exceptions (the "Revolving Priority Collateral"), and a second priority lien over substantially all of Delek's and each guarantor's other assets, including all of the equity interests of any subsidiary held by Delek or any guarantor (other than equity interests in certain MLP Subsidiaries) subject to certain customary exceptions, but excluding real property (such real property and equity interests, the "Term Priority Collateral").
The Term Loan Credit Facility is secured by a first priority lien on the Term Priority Collateral and a second priority lien on the Revolving Priority Collateral, all in accordance with an intercreditor agreement between the Term Administrative Agent and the Revolver Administrative Agent and acknowledged by Delek and the subsidiary guarantors. Certain excluded assets are not included in the Term Priority Collateral and the Revolving Priority Collateral.
Additional Information
At SeptemberJune 30, 2020,2021, the weighted average borrowing rate under the Revolving Credit Facility was 3.50% and was comprised entirely of a base rate borrowing, and thethere were 0 principal amountamounts outstanding thereunder was $110.0 million.. Additionally, there were letters of credit issued of approximately $227.3$305.9 million as of SeptemberJune 30, 20202021 under the Revolving Credit Facility. Unused credit commitments under the Revolving Credit Facility, as of SeptemberJune 30, 2020,2021, were approximately $662.7$694.1 million.
At SeptemberJune 30, 2020,2021, the weighted average borrowing rate under the Term Loan Credit Facility was approximately 3.04%3.00% comprised entirely of LIBOR borrowings, and the principal amount outstanding thereunder was $1,276.3$1,266.5 million. As of SeptemberJune 30, 2020,2021, the effective interest rate related to the Term Loan Credit Facility was 3.57%3.53%.
Delek Hapoalim Term Loan
On December 31, 2019, Delek entered into a term loan credit and guaranty agreement (the "Agreement") with Bank Hapoalim B.M. ("BHI") as the administrative agent. Pursuant to the Agreement, on December 31, 2019, Delek borrowed $40.0 million (the "BHI Term Loan"). The interest rate under the Agreement is equal to LIBOR plus a margin of 3.00%. The Agreement has a current maturity of December 31, 2022 and requires quarterly loan amortization payments of $0.1 million, commencing March 31, 2020. Proceeds may be used for general corporate purposes. The Agreement has an accordion feature that allows increasing the term loan by up to maximum size of $100.0an additional $60.0 million in principal, subject to receiving increased or new commitments from lenders and the satisfaction of certain other conditions precedent. Any such additional borrowings must be completed by December 31, 2021. On December 30, 2020 and June 28, 2021, we amended the BHI Term Loan to modify one of the required quarterly financial covenant metrics; there were no other changes as a result of these amendments.
At SeptemberJune 30, 2020,2021, the weighted average borrowing rate under the term loan was approximately 3.15%3.10% comprised entirely of a LIBOR borrowing and the principal amount outstanding thereunder was $39.7$39.4 million. As of SeptemberJune 30, 2020,2021, the effective interest rate related to the BHI Term Loan was 3.58%3.53%.
Delek Logistics Credit Facility
On September 28, 2018, Delek Logistics and all of its subsidiaries entered into a third amended and restated senior secured revolving credit agreement with Fifth Third Bank ("Fifth Third") as administrative agent and a syndicate of lenders (hereafter, the "Delek Logistics Credit Facility") with lender commitments of 850.0 million. The Delek Logistics Credit Facility also contains an accordion feature whereby Delek Logistics can increase the size of the credit facility to an aggregate of $1.0 billion, subject to receiving increased or new commitments from lenders and the satisfaction of certain other conditions precedent.
The obligations under the Delek Logistics Credit Facility remain secured by first priority liens on substantially all of Delek Logistics' tangible and intangible assets. Additionally, a subsidiary of Delek provided a limited guaranty of Delek Logistics' obligations under the Delek Logistics Credit Facility. The guaranty was (i) limited to an amount equal to the principal amount, plus unpaid and accrued interest, of a promissory note made by Delek in favor of the subsidiary guarantor (the "Holdings Note") and (ii) secured by the subsidiary guarantor's pledge of the Holdings Note to the Delek Logistics Credit Facility lenders. Effective March 30, 2020, the limited guaranty and pledge of the Holdings Note was terminated pursuant to a guaranty and pledge release approved by the required lenders under the Delek Logistics Credit Facility.
Notes to Condensed Consolidated Financial Statements (Unaudited)
The Delek Logistics Credit Facility has a maturity date of September 28, 2023. Borrowings under the Delek Logistics Credit Facility bear interest at either a U.S. dollar prime rate, Canadian dollar prime rate, LIBOR, or a CDOR rate, in each case plus applicable margins, at the election of the borrowers and as a function of draw down currency. The applicable margin in each case and the fee payable for the unused revolving commitments vary based upon Delek Logistics' most recent total leverage ratio calculation delivered to the lenders, as called for and defined under the terms of the Delek Logistics Credit Facility. At SeptemberJune 30, 2020,2021, the weighted average borrowing rate was approximately 2.69%2.50%. Additionally, the Delek Logistics Credit Facility requires Delek Logistics to pay a leverage ratio dependent quarterly fee on the average unused revolving commitment. As of SeptemberJune 30, 2020,2021, this fee was 0.40%0.35% on an annualized basis.
In connection with the elimination of IDRs in August 2020, Delek Logistics entered into a First Amendment to the Delek Logistics Credit Facility which, among other things, permitted the transfer of cash and equity consideration for the elimination of IDRs. It also modified the total leverage ratio and the senior leverage ratio (each as defined in the Delek Logistics Credit Facility) calculations to reduce the total funded debt (as defined in the Delek Logistics Credit Facility) component thereof by the total amount of unrestricted consolidated cash and cash equivalents on the balance sheet of the Delek Logistics and its subsidiaries up to $20.0 million.
Notes to Condensed Consolidated Financial Statements (Unaudited)
As of SeptemberJune 30, 2020,2021, Delek Logistics had $760.7$288.8 million of outstanding borrowings under the Delek Logistics Credit Facility, with no letters of credit in place. Unused credit commitments under the Delek Logistics Credit Facility, as of SeptemberJune 30, 2020,2021, were $89.3$561.2 million.
Delek Logistics 2025 Notes
On May 23, 2017, Delek Logistics and Delek Logistics Finance Corp. (collectively, the “Issuers”) issued $250.0 million in aggregate principal amount of 6.75% senior notes due 2025 (the “Delek Logistics 2025 Notes”) at a discount. The Delek Logistics 2025 Notes are general unsecured senior obligations of the Issuers. The Delek Logistics 2025 Notes are unconditionally guaranteed jointly and severally on a senior unsecured basis by Delek Logistics' existing subsidiaries (other than Delek Logistics Finance Corp., the "Guarantors") and will be unconditionally guaranteed on the same basis by certain of Delek Logistics' future subsidiaries. The Delek Logistics 2025 Notes rank equal in right of payment with all existing and future senior indebtedness of the Issuers, and senior in right of payment to any future subordinated indebtedness of the Issuers. Interest on the Delek Logistics 2025 Notes is payable semi-annually in arrears on each May 15 and November 15, commencing November 15, 2017.
In May 2018, the Delek Logistics 2025 Notes were exchanged for new notes with terms substantially identical in all material respects with the Delek Logistic 2025 Notes except the new notes do not contain terms with respect to transfer restrictions.
All or part of the Delek Logistics 2025 Notes are currently redeemable, subject to certain conditions and limitations, at a redemption price of 103.375% of the redeemed principal, plus accrued and unpaid interest, if any. Beginning on May 15, 2020,2022, the Issuers may, subject to certain conditions and limitations, redeem all or part of the Delek Logistics 2025 Notes, at a redemption price of 105.063%101.688% of the redeemed principal for the twelve-month period beginning on May 15, 2020, 103.375% for the twelve-month period beginning on May 15, 2021, 101.688% for the twelve-month period beginning on May 15, 2022, and 100.00% beginning on May 15, 2023 and thereafter, plus accrued and unpaid interest, if any.
In the event of a change of control, accompanied or followed by a ratings downgrade within a certain period of time, subject to certain conditions and limitations, the Issuers will be obligated to make an offer for the purchase of the Delek Logistics 2025 Notes from holders at a price equal to 101% of the principal amount thereof, plus accrued and unpaid interest.
In May 2018, the Delek Logistics Notes were exchanged for new notes with terms substantially identical in all material respects with the 2025 Notes except the new notes do not contain terms with respect to transfer restrictions.
As of SeptemberJune 30, 2020,2021, we had $250.0 million in outstanding principal amount under the Delek Logistics Notes. As of September 30, 2020,2025 Notes, and the effective interest rate relatedwas 7.21%.
Delek Logistics 2028 Notes
On May 24, 2021, Delek Logistics and its wholly owned subsidiary Delek Logistics Finance Corp. (“Finance Corp.” and together with Delek Logistics, the “Co-issuers”), sold $400.0 million in aggregate principal amount of the Co-issuers 7.125% Senior Notes due 2028 (the “Delek Logistics 2028 Notes”), at par, pursuant to an indenture with U.S. Bank, National Association as trustee. The Delek Logistics 2028 Notes are general unsecured senior obligations of the Co-issuers and are unconditionally guaranteed jointly and severally on a senior unsecured basis by Delek Logistics’ subsidiaries other than Finance Corp. and will be unconditionally guaranteed on the same basis by certain of Delek Logistics’ future subsidiaries. The Delek Logistics 2028 Notes rank equal in right of payment with all existing and future senior indebtedness of the Co-issuers, and senior in right of payment to any future subordinated indebtedness of the Co-issuers. The Delek Logistics 2028 Notes will mature on June 1, 2028, and interest is payable semi-annually in arrears on each June 1 and December 1, commencing December 1, 2021.
At any time prior to June 1, 2024, the Co-issuers may redeem up to 35% of the aggregate principal amount of the Delek Logistics 2028 Notes with the net cash proceeds of one or more equity offerings by Delek Logistics at a redemption price of 107.125% of the redeemed principal amount, plus accrued and unpaid interest, if any, subject to certain conditions and limitations. Prior to June 1, 2024, the Co-issuers may also redeem all or part of the Delek Logistics 2028 Notes at a redemption price of the principal amount plus accrued and unpaid interest, if any, plus a "make whole" premium, subject to certain conditions and limitations. In addition, beginning on June 1, 2024, the Co-issuers may, subject to certain conditions and limitations, redeem all or part of the Delek Logistics 2028 Notes, at a redemption price of 103.563% of the redeemed principal for the twelve-month period beginning on June 1, 2024, 101.781% for the twelve-month period beginning on June 1, 2025, and 100.00% beginning on June 1, 2026 and thereafter, plus accrued and unpaid interest, if any.
In the event of a change of control, accompanied or followed by a ratings downgrade within a certain period of time, subject to certain conditions and limitations, the Co-issuers will be obligated to make an offer for the purchase of the Delek Logistics 2028 Notes from holders at a price equal to 101% of the principal amount thereof, plus accrued and unpaid interest.
As of June 30, 2021, we had $400.0 million in outstanding principal amount under the Delek Logistics 2028 Notes, and the effective interest rate was 7.22%7.41%.
Notes to Condensed Consolidated Financial Statements (Unaudited)
Reliant Bank Revolver
Delek has an unsecured revolving credit agreement with Reliant Bank (the "Reliant Bank Revolver"). On December 16, 2019, we amended the Reliant Bank Revolver to extend the maturity date to June 30, 2022, reduce the fixed interest rate from 4.75% to 4.50% per annum and increase the revolver commitment amount from $30.0 million to $50.0 million. There were no other significant changes to the agreement in connection with this amendment. On December 9, 2020 and June 17, 2021, we amended the Reliant Bank Revolver to modify a required quarterly financial covenant metric; there were no other changes as a result of these amendments. The revolving credit agreement requires us to pay a quarterly fee of 0.50% on an annualized basis on the average unused revolving commitment. As of SeptemberJune 30, 2020,2021, we had $50.0$33.0 million outstanding and had 0$17.0 million of unused credit commitments under the Reliant Bank Revolver.
Promissory Notes
Delek hashad 4 notes payable (the "Promissory Notes") with various assignees of Alon Israel Oil Company, Ltd., the holder of a predecessor consolidated promissory note, which bearbore interest at a fixed rate of 5.50% per annum and which, collectively, requirerequired annual principal amortization payments of $25.0 million, to be made each January through 2020, followed bywith a final principal amortization payment of $20.0 million which was paid at maturity of the Promissory Notes on January 4, 2021. As of September 30, 2020, a total principal amount of $20.0 million was outstanding under the Promissory Notes.
Restrictive Covenants
Under the terms of our Revolving Credit Facility, Term Loan Credit Facility, Delek Logistics Credit Facility, Delek Logistics 2025 Notes, Delek Logistics 2028 Notes, Reliant Bank Revolver and BHI Agreement, we are required to comply with certain usual and customary financial and non-financial covenants. The
Notes to Condensed Consolidated Financial Statements (Unaudited)
terms and conditions of the Revolving Credit Facility include periodic compliance with a springing minimum fixed charge coverage ratio financial covenant if excess availability under the revolver borrowing base is below certain thresholds, as defined in the credit agreement. The Term Loan Credit Facility does not have any financial maintenance covenants. We believe we were in compliance with all covenant requirements under each of our credit facilities as of SeptemberJune 30, 2020.2021.
Certain of our debt facilities contain limitations on the incurrence of additional indebtedness, making of investments, creation of liens, dispositions and acquisitions of assets, and making of restricted payments and transactions with affiliates. These covenants may also limit the payment, in the form of cash or other assets, of dividends or other distributions, or the repurchase of shares with respect to the equity of certain of our subsidiaries.equity. Additionally, some of our debt facilities limit our ability to make investments, including extensions of loans or advances to, or acquisitions of equity interests in, or guarantees of obligations of, certain other entities.
Note 9 - Derivative Instruments
We use the majority of our derivatives to reduce normal operating and market risks with the primary objective of reducing the impact of market price volatility on our results of operations. As such, our use of derivative contracts is aimed at:
•limiting theour exposure to commodity price fluctuations of commodityon inventory above or below target levels at(where appropriate) within each of our segments;
•managing our exposure to commodity price risk associated with the purchase or sale of crude oil, feedstocksfeedstocks/intermediates and finished grade fuel products atwithin each of our segments;
•managing our exposure to market crack spread fluctuations;
•managing the cost of our credits for commitments required by the U.S. Environmental Protection Agency ("EPA") to blend biofuels into fuel products ("RINs Obligation") using future commitments to purchase or sell renewable identification numbers ("RINs")RINs at fixed prices and quantities; and
•limiting the exposure to interest rate fluctuations on our floating rate borrowings.
We primarily utilize commodity swaps, futures, forward contracts and options contracts, generally with maturity dates of three years or less, and from time to time interest rate swapswaps or cap agreements,caps to achieve these objectives. Futures contracts are standardized agreements, traded on a futures exchange, to buy or sell thea commodity at a predetermined price and location at a specified future date. Options provide the right, but not the obligation to buy or sell the commodity at a specified price in the future. Commodity swapswaps and futures contracts require cash settlement for the commodity based on the difference between a fixed or floating price and the market price on the settlement date, and options require paymentpayment/receipt of an upfront premium. Because these derivatives are entered into to achieve objectives specifically related to our inventory and production risks, such gains and losses (to the extent not designated as accounting hedges and recognized on an unrealized basis in other comprehensive income) are recognized in cost of materials and other.
Forward contracts are agreements to buy or sell a commodity at a predetermined price at a specified future date, and for our transactions, generally require physical delivery. Forward contracts where the underlying commodity will be used or sold in the normal course of business qualify as normal purchases and normal sales pursuant to ASC 815815. If we elect the normal purchases and normal sales exception, such forward contracts are not accounted for as derivative instruments. Rather, such forward contractsinstruments but rather are accounted for under other applicable GAAP. ForwardCommodity forward contracts entered into for trading purposes that do not meet the normal purchases, normal sales exception are accounted for as derivative instruments are recorded at fair value with changes in fair value
Notes to Condensed Consolidated Financial Statements (Unaudited)
recognized in earnings in the period of change. As of SeptemberJune 30, 20202021 and December 31, 2019,2020, and for the three and ninesix months ended SeptemberJune 30, 2021 and June 30, 2020, and September 30, 2019, all of our commodity fixed-price forward contracts that were accounted for as derivative instruments primarily consisted of contracts related to our Canadian crude trading operations. Since Canadian crude trading activity is not related to managing supply or pricing risk of the actual inventory that will be used in production, such unrealized and realized gains and losses are recognized in other operating income, net rather than cost of materials and other on the accompanying condensed consolidated statements of income.
Futures, swaps or other commodity related derivative instruments that are utilized to specifically provide economic hedges on our Canadian forward contract or investment positions are recognized in other operating income, net because that is where the related underlying transactions are reflected.
From time to time, we also enter into future commitments to purchase or sell RINs at fixed prices and quantities, which are used to manage the costs associated with our RINs Obligation. These future RINRINs commitment contracts meet the definition of derivative instruments under ASC 815, and are recorded at estimated fair value in accordance with the provisions of ASC 815. Changes in the fair value of these future RINRINs commitment contracts are recorded in cost of materials and other on the condensed consolidated statements of income.
As of SeptemberJune 30, 2020,2021, we do not believe there is any material credit risk with respect to the counterparties to any of our derivative contracts.
In accordance with ASC 815, certain of our commodity swap contracts have been designated as cash flow hedges and the change in fair value between the execution date and the end of period has been recorded in other comprehensive income. The fair value of these contracts is recognized in income in the same financial statement line item as hedged transaction at the time the positions are closed and
Notes to Condensed Consolidated Financial Statements (Unaudited)
the hedged transactions are recognized in income.
The following table presents the fair value of our derivative instruments as of SeptemberJune 30, 20202021 and December 31, 2019.2020. The fair value amounts below are presented on a gross basis and do not reflect the netting of asset and liability positions permitted under our master netting arrangements, including cash collateral on deposit with our counterparties. We have elected to offset the recognized fair value amounts for multiple derivative instruments executed with the same counterparty in our financial statements. As a result, the asset and liability amounts below differ from the amounts presented in our condensed consolidated balance sheets. See Note 10 for further information regarding the fair value of derivative instruments (in millions).
| | | September 30, 2020 | | December 31, 2019 | | June 30, 2021 | | December 31, 2020 |
| Derivative Type | Derivative Type | Balance Sheet Location | | Assets | | Liabilities | | Assets | | Liabilities | Derivative Type | Balance Sheet Location | | Assets | | Liabilities | | Assets | | Liabilities |
| Derivatives not designated as hedging instruments: | Derivatives not designated as hedging instruments: | | | | | | | | | Derivatives not designated as hedging instruments: | | | | | | | | |
Commodity derivatives(1) | Commodity derivatives(1) | Other current assets | | $ | 90.9 | | | $ | (71.3) | | | $ | 188.9 | | | $ | (202.1) | | Commodity derivatives(1) | Other current assets | | $ | 22.4 | | | $ | (3.1) | | | $ | 48.9 | | | $ | (24.8) | |
Commodity derivatives(1) | Commodity derivatives(1) | Other current liabilities | | 881.2 | | | (896.2) | | | 24.4 | | | (34.0) | | Commodity derivatives(1) | Other current liabilities | | 98.2 | | | (122.4) | | | 930.7 | | | (943.8) | |
Commodity derivatives(1) | Commodity derivatives(1) | Other long-term assets | | 0.1 | | | 0 | | | 0 | | | 0 | | Commodity derivatives(1) | Other long-term assets | | 0 | | | 0 | | | 2.4 | | | (2.3) | |
Commodity derivatives(1) | Commodity derivatives(1) | Other long-term liabilities | | 374.9 | | | (376.7) | | | 23.4 | | | (24.8) | | Commodity derivatives(1) | Other long-term liabilities | | 15.0 | | | (15.2) | | | 415.2 | | | (415.8) | |
RIN commitment contracts(2) | RIN commitment contracts(2) | Other current assets | | 2.9 | | | 0 | | | 0.6 | | | 0 | | RIN commitment contracts(2) | Other current assets | | 42.6 | | | 0 | | | 33.6 | | | 0 | |
RIN commitment contracts(2) | RIN commitment contracts(2) | Other current liabilities | | 0 | | | (1.1) | | | 0 | | | (1.9) | | RIN commitment contracts(2) | Other current liabilities | | 0 | | | (2.0) | | | 0 | | | (22.5) | |
| | Derivatives designated as hedging instruments: | Derivatives designated as hedging instruments: | | | | | | Derivatives designated as hedging instruments: | | | | | |
Commodity derivatives (1) | Commodity derivatives (1) | Other current assets | | 2.7 | | | (1.5) | | | 3.4 | | | (2.0) | | Commodity derivatives (1) | Other current assets | | 0 | | | 0 | | | 0.5 | | | (0.3) | |
| Commodity derivatives (1) | Other long-term assets | | 0 | | | 0 | | | 0.2 | | | (0.1) | | |
| | | Total gross fair value of derivatives | Total gross fair value of derivatives | | $ | 1,352.7 | | | $ | (1,346.8) | | | $ | 240.9 | | | $ | (264.9) | | Total gross fair value of derivatives | | $ | 178.2 | | | $ | (142.7) | | | $ | 1,431.3 | | | $ | (1,409.5) | |
Less: Counterparty netting and cash collateral(3) | Less: Counterparty netting and cash collateral(3) | | 1,319.6 | | | (1,328.7) | | | 210.7 | | | (249.5) | | Less: Counterparty netting and cash collateral(3) | | 113.4 | | | (121.4) | | | 1,358.3 | | | (1,373.1) | |
| Total net fair value of derivatives | Total net fair value of derivatives | | $ | 33.1 | | | $ | (18.1) | | | $ | 30.2 | | | $ | (15.4) | | Total net fair value of derivatives | | $ | 64.8 | | | $ | (21.3) | | | $ | 73.0 | | | $ | (36.4) | |
(1)As of SeptemberJune 30, 20202021 and December 31, 2019,2020, we had open derivative positions representing 193,693,716212,533,990 and 86,484,065159,682,606 barrels, respectively, of crude oil and refined petroleum products. Of theseThere were 0 open positions contracts representing 90,000 and 600,000 barrels were designated as cash flow hedging instruments as of SeptemberJune 30, 20202021 and December 31, 2019, respectively.2020. Additionally, as of September 30, 2020 and December 31, 2019,2020, we had open derivative positions representing 13,180,000 and 40,050,000 One Million British Thermal Units ("MMBTU")22,130,000 MMBTU of natural gas products, respectively.products. There were 0 open natural gas positions as of June 30, 2021.
(2)As of SeptemberJune 30, 20202021 and December 31, 2019,2020, we had open RINRINs commitment contracts representing 59,200,00083,460,000 and 147,000,000282,150,000 RINs, respectively.
(3)As of SeptemberJune 30, 20202021 and December 31, 2019, $9.12020, $8.0 million and $38.8$14.8 million, respectively, of cash collateral held by counterparties has been netted with the derivatives with each counterparty.
Total gains (losses) on our hedging derivatives and RINRINs commitment contracts recorded in the condensed consolidated statements of income are as follows (in millions):
| | | | | | | | | | | | | | | | | | | | | | | | | | |
| | Three Months Ended September 30, | | Nine Months Ended September 30, |
| | 2020 | | 2019 | | 2020 | | 2019 |
Gains (losses) on commodity derivatives not designated as hedging instruments recognized in cost of materials and other (1) | | $ | 5.1 | | | $ | 34.2 | | | $ | (85.8) | | | $ | 118.5 | |
Gains (losses) on commodity derivatives not designated as hedging instruments recognized in other operating income, net (1) (2) | | 0.1 | | | (0.3) | | | 7.9 | | | 0.2 | |
| Realized gains (losses) reclassified out of accumulated other comprehensive income and into cost of materials and other on commodity derivatives designated as cash flow hedging instruments | | 0.8 | | | (21.1) | | | 3.7 | | | (55.0) | |
| | | | | | | | |
| Total gains (losses) | | $ | 6.0 | | | $ | 12.8 | | | $ | (74.2) | | | $ | 63.7 | |
Notes to Condensed Consolidated Financial Statements (Unaudited)
| | | | | | | | | | | | | | | | | | | | | | | | | | |
| | Three Months Ended June 30, | | Six Months Ended June 30, |
| | 2021 | | 2020 | | 2021 | | 2020 |
Gains (losses) on derivatives not designated as hedging instruments recognized in cost of materials and other (1) | | $ | 22.2 | | | $ | (156.6) | | | $ | 79.6 | | | $ | (91.0) | |
(Losses) gains on commodity derivatives not designated as hedging instruments recognized in other operating income, net (1) (2) | | (4.4) | | | (3.7) | | | (5.5) | | | 7.9 | |
| Realized gains reclassified out of accumulated other comprehensive income and into cost of materials and other on commodity derivatives designated as cash flow hedging instruments | | 0 | | | 2.2 | | | 0.2 | | | 2.9 | |
| | | | | | | | |
| Total gains (losses) | | $ | 17.8 | | | $ | (158.1) | | | $ | 74.3 | | | $ | (80.2) | |
(1) Gains (losses) on commodity derivatives that are economic hedges but not designated as hedging instruments include unrealized gains (losses) gains of $(19.4)$(21.2) million and $9.2$(9.4) million for the three and ninesix months ended SeptemberJune 30, 2020,2021, respectively, and $0.5$(23.4) million and $(30.1)$28.6 million for the three and ninesix months endedSeptember 30, 2019, respectively. Of these amounts, approximately $0.4 million and$(13.0) millionas of September June 30, 2020, and September 30, 2019, respectively, represent unrealized gains (losses) where the instrument has matured but where it has not cash settled as of period end. Derivative instruments that have matured but not cash settled at the balance sheet date continue to be reflected in derivative assets or liabilities on our balance sheet.respectively.
(2) See separate table below for disclosures about "trading derivatives."
The effect of cash flow hedge accounting on the condensed consolidated statements of income is as follows (in millions):
Notes to Condensed Consolidated Financial Statements (Unaudited)
| | | Three Months Ended September 30, | | Nine Months Ended September 30, | | Three Months Ended June 30, | | Six Months Ended June 30, |
| | 2020 | | 2019 | | 2020 | | 2019 | | 2021 | | 2020 | | 2021 | | 2020 |
| Gain (loss) on cash flow hedging relationships recognized in cost of materials and other: | Gain (loss) on cash flow hedging relationships recognized in cost of materials and other: | | | | | | | | | Gain (loss) on cash flow hedging relationships recognized in cost of materials and other: | | | | | | | | |
| Commodity contracts: | Commodity contracts: | | | | | | Commodity contracts: | | | | | |
| Hedged items | Hedged items | | $ | (0.8) | | | $ | 21.1 | | | $ | (3.7) | | | $ | 55.0 | | Hedged items | | $ | 0 | | | $ | (2.2) | | | $ | (0.2) | | | $ | (2.9) | |
| Derivative designated as hedging instruments | Derivative designated as hedging instruments | | 0.8 | | | (21.1) | | | 3.7 | | | (55.0) | | Derivative designated as hedging instruments | | 0 | | | 2.2 | | | 0.2 | | | 2.9 | |
| Total | Total | | $ | 0 | | | $ | 0 | | | $ | 0 | | | $ | 0 | | Total | | $ | 0 | | | $ | 0 | | | $ | 0 | | | $ | 0 | |
For cash flow hedges, 0 component of the derivative instruments’ gains or losses was excluded from the assessment of hedge effectiveness for the three and ninesix months ended SeptemberJune 30, 20202021 or 2019. Gains,2020. There were 0 gains (losses), net of tax, on settled commodity contracts of $0.7during the three months ended June 30, 2021, and $3.0$0.2 million during the six months ended June 30, 2021, and $1.7 million and $2.3 million during the three and ninesix months ended SeptemberJune 30, 2020, respectively, and $(16.6) million and $(43.4) million during the three and nine months ended September 30, 2019, respectively,which were reclassified into cost of materials and other in the condensed consolidated statements of income. As of SeptemberJune 30, 2020,2021, we estimate that $1.2 million0 amount of deferred gains related to commodity cash flow hedges will be reclassified into cost of materials and other over the next 12 months as a result of hedged transactions that are forecasted to occur.
Total (losses) gains on our trading physical forward contract derivatives (none of which were designated as hedging instruments) recorded in other operating loss (income),income, net on the condensed consolidated statements of income are as follows (in millions):
| | | | | | | | | | | | | | | | | | | | | | | | | | |
| | Three Months Ended September 30, | | Nine Months Ended September 30, |
| | 2020 | | 2019 | | 2020 | | 2019 |
| Realized (losses) gains | | $ | (0.4) | | | $ | (1.4) | | | $ | (3.4) | | | $ | 3.3 | |
| Unrealized (losses) gains | | 0.2 | | | 4.5 | | | (0.5) | | | 6.6 | |
| Total | | $ | (0.2) | | | $ | 3.1 | | | $ | (3.9) | | | $ | 9.9 | |
| | | | | | | | | | | | | | | | | | | | | | | | | | |
| | Three Months Ended June 30, | | Six Months Ended June 30, |
| | 2021 | | 2020 | | 2021 | | 2020 |
| Realized gains (losses) | | $ | 2.5 | | | $ | (1.2) | | | $ | 2.1 | | | $ | (2.9) | |
| Unrealized gains (losses) | | 0.8 | | | 0.3 | | | 0.4 | | | (0.7) | |
| Total | | $ | 3.3 | | | $ | (0.9) | | | $ | 2.5 | | | $ | (3.6) | |
Note 10 - Fair Value Measurements
Our assets and liabilities that are measured at fair value include commodity derivatives, investment commodities, environmental credits obligations and Supply and Offtake Agreements. Delek applies the provisions of ASC 820, Fair Value Measurements ("ASC 820"), which defines fair value, establishes a framework for its measurement and expands disclosures about fair value measurements. ASC 820 requires disclosures that categorize assets and liabilities measured at fair value into one of three different levels depending on the observability of the inputs employed in the measurement. Level 1 inputs are quoted prices in active markets for identical assets or liabilities. Level 2 inputs are observable inputs other than quoted prices included within Level 1 for the asset or liability, either directly or indirectly through market-corroborated inputs. Level 3 inputs are unobservable inputs for the asset or liability reflecting our assumptions about pricing by market participants.
Notes to Condensed Consolidated Financial Statements (Unaudited)
Our commodity derivative contracts, which consist of commodity swaps, exchange-traded futures, options and physical commodity forward purchase and sale contracts (that do not qualify as normal purchases or normal sales exception under ASC 815), are valued based on exchange pricing and/or price index developers such as Platts or Argus and are, therefore, classified as Level 2.
Investment commodities, which represent those commodities (generally crude oil) physically on hand as a result of trading activities with physical forward contracts, are valued using published market prices of the commodity on the applicable exchange and are, therefore, classified as Level 1. Such investment stores, included in other current assets on the condensed consolidated balance sheets, are maintained on a weighted average cost basis for determining realized gains and losses on physical sales under forward contracts, and ending balances are adjusted to fair value at each reporting date. The unrealized gain (loss) on commodity investments for the three and nine months ended September 30, 2020 totaled $0.1 million and $1.0 million, respectively, and totaled $0.1 million and $(1.9) million for the three and nine months ended September 30, 2019, respectively.
In April 2020, we entered into a contract with the Department of Energy to deposit one million barrels of crude oil into one of the Strategic Petroleum Reserve ("SPR") storage locations where they will be stored on our behalf until October 2020 for a fee of approximately 100,000 barrels. The fee of 100,000 barrels was recorded as a prepaid asset at cost, and the right to receive the 900,000 barrels was recorded as a financial asset (the "Right to receive crude oil barrels"), measured at fair value based on the value of the underlying commodity using published market prices of the commodity on the applicable exchange. Such asset is, therefore, classified as Level 2. The unrealized gain
Notes to Condensed Consolidated Financial Statements (Unaudited)
on the underlying commodity related to the SPR financial asset for the three and nine months ended September 30, 2020 of $0.9 million and $10.6 million was recorded in other (income) expense, net.
Our RINRINs commitment contracts are future commitments to purchase or sell RINs at fixed prices and quantities, which are used to manage the costs associated with our Consolidated Net RINs Obligation.Obligation (as defined in our accounting policies in Note 1 to the audited consolidated financial statements included in Item. 8 Financial Statements and Supplementary Data, of our December 31, 2020 Annual Report on Form 10-K). These RINRINs commitment contracts (which are forward contracts accounted for as derivatives – see Note 9) are categorized as Level 2, and are measured at fair value based on quoted prices from an independent pricing service.
Our environmental credits obligation surplus or deficit is based onincludes the amount ofConsolidated Net RINs Obligation surplus or deficit, as well as other emissions creditsenvironmental credit obligation surplus or deficit positions subject to fair value accounting that we must purchase, net of amounts internally generated and purchased and the price of those RINs or other emissions credits as of the balance sheet date, by refinery/obligor.pursuant to our accounting policy (see Note 14). The environmental credits obligation surplus or deficit is categorized as Level 2 if measured at fair value either directly through observable inputs or indirectly through market-corroborated inputs.
As of and for the ninesix months ended SeptemberJune 30, 20202021 and 2019,2020, we elected to account for our J. Aron step-out liability at fair value in accordance with ASC 825, as it pertains to the fair value option. This standard permits the election to carry financial instruments and certain other items similar to financial instruments at fair value on the balance sheet, with all changes in fair value reported in earnings. With respect to the amended and restated Supply and Offtake Agreements, such amendments being effective April 2020 for all the agreements, we apply fair value measurement as follows: (1) we determine fair value for our amended variable step-out liability based on changes in fair value related to market volatility based on a floating commodity-index price, and for our amended fixed step-out liability based on changes to interest rates and the timing and amount of expected future cash settlements where such obligation is categorized as Level 2.2 Gains (losses) related to changes in fair value due to commodity-index price are recorded as a component of cost of materials and other, and changes in fair value due to interest rate risk are recorded as a component of interest expense in the condensed consolidated statements of income; and (2) we determine fair value of the commodity-indexed revolving over/short inventory financing liability based on the market prices for the consigned crude oil and refined products collateralizing the financing/funding where such obligation is categorized as Level 2 and is presented in the current portion of the Obligation under Supply and Offtake Agreements on our condensed consolidated balance sheets. Gains (losses) related to the change in fair value are recorded as a component of cost of materials and other in the condensed consolidated statements of income. Before the January 2020 amendments, we determined the fair value for the fixed price step-out liability based on changes to interest rates reflecting changes to the interest rate risk, with obligation categorized as Level 2.
For all other financial instruments, the fair value approximates the historical or amortized cost basis comprising our carrying value and therefore are not included in the table below.
The fair value hierarchy for our financial assets and liabilities accounted for at fair value on a recurring basis was as follows (in millions):
| | | | | September 30, 2020 | | | June 30, 2021 |
| | | | Level 1 | | Level 2 | | Level 3 | | Total | | | Level 1 | | Level 2 | | Level 3 | | Total |
| Assets | Assets | | | | | | | | | Assets | | | | | | | | |
| Commodity derivatives | Commodity derivatives | | $ | 0 | | | $ | 1,349.8 | | | $ | 0 | | | $ | 1,349.8 | | Commodity derivatives | | $ | 0 | | | $ | 135.6 | | | $ | 0 | | | $ | 135.6 | |
| Commodity investments | | 1.0 | | | 0 | | | 0 | | | 1.0 | | |
| Right to receive crude oil barrels | | 0 | | | 36.6 | | | 0 | | | 36.6 | | |
| RIN commitment contracts | | 0 | | | 2.9 | | | 0 | | | 2.9 | | |
| | RINs commitment contracts | | RINs commitment contracts | | 0 | | | 42.6 | | | 0 | | | 42.6 | |
| | Total assets | Total assets | | 1.0 | | | 1,389.3 | | | 0 | | | 1,390.3 | | Total assets | | 0 | | | 178.2 | | | 0 | | | 178.2 | |
| Liabilities | Liabilities | | | | | | | | | Liabilities | | | | | | | | |
| Commodity derivatives | Commodity derivatives | | 0 | | | (1,345.7) | | | 0 | | | (1,345.7) | | Commodity derivatives | | 0 | | | (140.7) | | | 0 | | | (140.7) | |
| | RIN commitment contracts | | 0 | | | (1.1) | | | 0 | | | (1.1) | | |
| RINs commitment contracts | | RINs commitment contracts | | 0 | | | (2.0) | | | 0 | | | (2.0) | |
| Environmental credits obligation deficit | Environmental credits obligation deficit | | 0 | | | (233.6) | | | 0 | | | (233.6) | | Environmental credits obligation deficit | | 0 | | | (139.8) | | | 0 | | | (139.8) | |
| J. Aron supply and offtake obligations | J. Aron supply and offtake obligations | | 0 | | | (323.2) | | | 0 | | | (323.2) | | J. Aron supply and offtake obligations | | 0 | | | (496.3) | | | 0 | | | (496.3) | |
| Total liabilities | Total liabilities | | 0 | | | (1,903.6) | | | 0 | | | (1,903.6) | | Total liabilities | | 0 | | | (778.8) | | | 0 | | | (778.8) | |
| Net assets (liabilities) | Net assets (liabilities) | | $ | 1.0 | | | $ | (514.3) | | | $ | 0 | | | $ | (513.3) | | Net assets (liabilities) | | $ | 0 | | | $ | (600.6) | | | $ | 0 | | | $ | (600.6) | |
Notes to Condensed Consolidated Financial Statements (Unaudited)
| | | | | December 31, 2019 | | | December 31, 2020 |
| | | | Level 1 | | Level 2 | | Level 3 | | Total | | | Level 1 | | Level 2 | | Level 3 | | Total |
| Assets | Assets | | | | | | | | | Assets | | | | | | | | |
| Commodity derivatives | Commodity derivatives | | $ | 0 | | | $ | 240.3 | | | $ | 0 | | | $ | 240.3 | | Commodity derivatives | | $ | 0 | | | $ | 1,397.7 | | | $ | 0 | | | $ | 1,397.7 | |
| Investment commodities | | 12.1 | | | 0 | | | 0 | | | 12.1 | | |
| RIN commitment contracts | | 0 | | | 0.6 | | | 0 | | | 0.6 | | |
| Environmental credits obligation surplus | | 0 | | | 16.8 | | | 0 | | | 16.8 | | |
| | RINs commitment contracts | | RINs commitment contracts | | 0 | | | 33.6 | | | 0 | | | 33.6 | |
| | Total assets | Total assets | | 12.1 | | | 257.7 | | | 0 | | | 269.8 | | Total assets | | 0 | | | 1,431.3 | | | 0 | | | 1,431.3 | |
| Liabilities | Liabilities | | | | | | | | | Liabilities | | | | | | | | |
| | Commodity derivatives | Commodity derivatives | | 0 | | | (263.0) | | | 0 | | | (263.0) | | Commodity derivatives | | 0 | | | (1,387.0) | | | 0 | | | (1,387.0) | |
| RIN commitment contracts | | 0 | | | (1.9) | | | 0 | | | (1.9) | | |
| RINs commitment contracts | | RINs commitment contracts | | 0 | | | (22.5) | | | 0 | | | (22.5) | |
| Environmental credits obligation deficit | Environmental credits obligation deficit | | 0 | | | (18.5) | | | 0 | | | (18.5) | | Environmental credits obligation deficit | | 0 | | | (59.6) | | | 0 | | | (59.6) | |
| J. Aron supply and offtake obligations | J. Aron supply and offtake obligations | | 0 | | | (477.3) | | | 0 | | | (477.3) | | J. Aron supply and offtake obligations | | 0 | | | (354.1) | | | 0 | | | (354.1) | |
| Total liabilities | Total liabilities | | 0 | | | (760.7) | | | 0 | | | (760.7) | | Total liabilities | | 0 | | | (1,823.2) | | | 0 | | | (1,823.2) | |
| Net assets (liabilities) | Net assets (liabilities) | | $ | 12.1 | | | $ | (503.0) | | | $ | 0 | | | $ | (490.9) | | Net assets (liabilities) | | $ | 0 | | | $ | (391.9) | | | $ | 0 | | | $ | (391.9) | |
The derivative values above are based on analysis of each contract as the fundamental unit of account as required by ASC 820. In the table above, derivative assets and liabilities with the same counterparty are not netted where the legal right of offset exists. This differs from the presentation in the financial statements which reflects our policy, wherein we have elected to offset the fair value amounts recognized for multiple derivative instruments executed with the same counterparty and where the legal right of offset exists. As of SeptemberJune 30, 20202021 and December 31, 2019, $9.12020, $8.0 million and $38.8$14.8 million, respectively, of cash collateral was held by counterparty brokerage firms and has been netted in the financial statements with the net derivative positions with each counterparty. See Note 9 for further information regarding derivative instruments.
Note 11 - Commitments and Contingencies
Litigation
In the ordinary conduct of our business, we are from time to time subject to lawsuits, investigations and claims, including environmental claims and employee-related matters. Although we cannot predict with certainty the ultimate resolution of lawsuits, investigations and claims asserted against us, including civil penalties or other enforcement actions, we do not believe that any currently pending legal proceeding or proceedings to which we are a party will have a material adverse effect on our financial statements. Certain environmental matters that have or may result in penalties or assessments are discussed below in the "Environmental, Health and Safety" section of this note.
On April 8, 2021, an action titled CVR Energy Inc. v. Delek US Holdings, Inc., Case No. 2021-0297-JTL, was filed in the Court of Chancery of the State of Delaware. The complaint asserted claims arising out of the Company's response to the plaintiff's demand to inspect certain books and records of the Company purportedly pursuant to Section 220 of the Delaware General Corporation Law. The matter was dismissed on May 13, 2021 by the parties.
One of our Alon subsidiaries was the defendant in a legal action related to an easement dispute arising from a purchase of property that occurred in October 2013. In June 2019, the court found in favor of the plaintiffs and assessed damages against such subsidiary, which were reduced in the fourth quarter of 2019 to $6.4 million. Such amount is included as of SeptemberJune 30, 2021 and December 31, 2020 in accrued expenses and other current liabilities on the accompanying condensed consolidated balance sheet. The matter is currently under appeal.
On June 19, 2017, the Arkansas Teacher Retirement System filed a lawsuit in the Delaware Court of Chancery (Arkansas Teacher Retirement System v. Alon USA Energy, Inc., et al., Case No. 2017-0453), asserting claims for breach of fiduciary duty in connection with the business combination of Delek US Holdings, Inc. and Alon USA Energy, Inc. Following a mediation, the parties to the litigation have agreed to a settlement and release of all claims of the plaintiff class in exchange for the defendants' agreement to pay $44.8 million into a settlement fund, of which our insurance carriers agreed to fund approximately $42.5 million under the applicable insurance policies and pursuant to varying limits and limitations. The settlement, in which the Company and other defendants expressly deny all assertions of wrongdoing or fault, is subject to approval by the court after notice and a fairness hearing, which is scheduled for October 29, 2021. In addition to the $2.3 million of the settlement that is not covered by insurance, we have accrued $4.2 million as estimated unpaid and remaining legal fees, for a total accrual of approximately $6.5 million as of June 30, 2021. Such amount is included as of June 30, 2021 in accrued expenses and other current liabilities on the accompanying condensed consolidated balance sheet.
Notes to Condensed Consolidated Financial Statements (Unaudited)
Self-insurance
Delek records a self-insurance accrual forWith respect to workers’ compensation claims, we are subject to claims losses up to a $4.0 million deductible on a per accident basis, general liability claims up to $4.0 million on a per occurrence basis and medical claims for eligible full-time employees up to $0.3 million per covered individual per calendar year. We are also record a self-insurance accrual forsubject to auto liability claims losses up to a $4.0 million deductible on a per accident basis.
We have umbrella liability insurance available to each of our segments in an amount determined reasonable by management.
Environmental, Health and Safety
We are subject to extensive federal, state and local environmental and safety laws and regulations enforced by various agencies, including the EPA, the United States Department of Transportation, the Occupational Safety and Health Administration, as well as numerous state, regional and local environmental, safety and pipeline agencies. These laws and regulations govern the discharge of materials into the environment, waste management practices, pollution prevention measures and the composition of the fuels we produce, as well as the safe operation of our plants and pipelines and the safety of our workers and the public. Numerous permits or other authorizations are required under these laws and regulations for the operation of our refineries, renewable fuels facilities, terminals, pipelines, underground
Notes to Condensed Consolidated Financial Statements (Unaudited)
storage tanks, trucks, rail cars and related operations, and may be subject to revocation, modification and renewal.
These laws and permits raise potential exposure to future claims and lawsuits involving environmental and safety matters which could include soil and water contamination, air pollution, personal injury and property damage allegedly caused by substances which we manufactured, handled, used, released or disposed of, transported, or that relate to pre-existing conditions for which we have assumed responsibility. We believe that our current operations are in substantial compliance with existing environmental and safety requirements. However, there have been and will continue to be ongoing discussions about environmental and safety matters between us and federal and state authorities, including notices of violations, citations and other enforcement actions, some of which have resulted or may result in changes to operating procedures and in capital expenditures. While it is often difficult to quantify future environmental or safety related expenditures, we anticipate that continuing capital investments and changes in operating procedures will be required for the foreseeable future to comply with existing and new requirements, as well as evolving interpretations and more strict enforcement of existing laws and regulations.
As of SeptemberJune 30, 2020,2021, we have recorded an environmental liability of approximately $112.7$112.0 million, primarily related to the estimated probable costs of remediating or otherwise addressing certain environmental issues of a non-capital nature at our refineries, as well as terminals, some of which we no longer own. This liability includes estimated costs for ongoing investigation and remediation efforts for known contamination of soil and groundwater. Approximately $6.6$2.6 million of the total liability is expected to be expended over the next 12 months, with most of the balance expended by 2032, although some costs may extend up to 30 years. In the future, we could be required to extend the expected remediation period or undertake additional investigations of our refineries, pipelines and terminal facilities, which could result in the recognition of additional remediation liabilities.
We are also subject to various regulatory requirements related to carbon emissions and the compliance requirements to remit environmental credit obligations due to the EPA or other regulatory agencies, the most significant of which relates to the RINs Obligation subject to the EPA’s RFS-2 regulations (as as defined in our accounting policies in Note 1 to the audited consolidated financial statements included in Item. 8 Financial Statements and Supplementary Data, of our December 31, 2020 Annual Report on Form 10-K). The RFS-2 regulations are highly complex and evolving, requiring us to periodically update our compliance systems. As part of our on-going monitoring and compliance efforts, on an annual basis we engage a third party to perform procedures to review our RINs inventory, processes and compliance. The results of such procedures may include procedural findings but may also include findings regarding the usage of RINs to meet past obligations, the treatment of exported RINs, and the propriety of RINs on-hand and related adjustments to our RINs inventory, which (to the extent they are valued) offset our RINs Obligation. Such adjustments may also require communication with the EPA if they involve reportable non-compliance which could lead to the assessment of penalties. Based on management’s review which was completed during the second quarter 2021, we recorded a RINs inventory true-up adjustment during the three and six months ended June 30, 2021 totaling $(12.3) million which increased our recorded RINs Obligation. We have also self-reported our related instances of non-compliance to the EPA, and while we cannot yet estimate the extent of penalties that may be assessed, it is not expected to be material in relation to our total RINs Obligation.
Other Losses and Contingencies
Delek maintains property damage insurance policies which have varying deductibles. Delek also maintains business interruption insurance policies, with varying coverage limits and waiting periods. Covered losses in excess of the deductible and outside of the waiting period will be recoverable under the property and business interruption insurance policies.
El Dorado Refinery Fire
On February 27, 2021, our El Dorado refinery experienced a fire in its Penex unit. NaN employees were injured in the fire, which is currently being investigated by the Occupational Safety and Health Administration. Contrary to initial assessments, and despite occurring during the
Notes to Condensed Consolidated Financial Statements (Unaudited)
early stages of turnaround activity, the facility did suffer operational disruptions as a result of the fire. During the six months ended June 30, 2021, we incurred workers' compensation losses of $3.8 million associated with the fire, which is included in operating expenses in the accompanying condensed consolidated statements of income. Additionally, we recognized accelerated depreciation of $1.0 million in the six months ended June 30, 2021 due to property damaged in the fire, and we continue to incur repair costs that may be recoverable under property and casualty insurance polices. Work to determine the full extent of covered business interruption and property and casualty losses and potential insurance claims is ongoing and may result in the future recognition of insurance recoveries. The extent of any incremental losses is not yet determinable and may also be subject to insurance recoveries.
Winter Storm Uri
During February 2021, the Company experienced a severe weather event ("Winter Storm Uri") which temporarily impacted operations at all of our refineries. Due to the extreme freezing conditions, we experienced reduced throughputs at our refineries as there was a disruption in the crude supply, as well as damages to various units at our refineries requiring additional operating and capital expenditures. The majority of our losses related to Winter Storm Uri resulted from the operational disruptions and related lost profit which are not accruable under ASC 450, Contingencies, but which may be covered under our business interruption insurance policies. Work to determine the full extent of covered business interruption losses, as well as any property and casualty losses, and potential insurance claims is ongoing and may result in the future recognition of insurance recoveries. The extent of any incremental losses is not yet determinable and may also be subject to insurance recoveries.
Crude Oil and Other Releases
We have experienced several crude oil and other releases involving our assets. There were 0 material releases that occurred during the ninesix months ended SeptemberJune 30, 2020.2021. For releases that occurred in prior years, we have received regulatory closure or a majority of the cleanup and remediation efforts are substantially complete. For the release sites that have not yet received regulatory closure, we expect to receive regulatory closure in late 2020 or 2021 and do not anticipate material costs associated with any fines or penalties or to complete activities that may be needed to achieve regulatory closure.
Expenses incurred for the remediation of these crude oil and other releases are included in operating expenses in our condensed consolidated statements of income.
Letters of Credit
As of SeptemberJune 30, 2020,2021, we had in place letters of credit totaling approximately $227.3$305.9 million with various financial institutions securing obligations primarily with respect to our commodity transactions for the refining segment and certain of our insurance programs. There were 0 amounts drawn by beneficiaries of these letters of credit at SeptemberJune 30, 2020.2021.
Note 12 - Income Taxes
Under ASC 740Income Taxes (“ASC 740”) we used an estimated annual tax rate to record income taxes for the three and ninesix months ended SeptemberJune 30, 20202021 and SeptemberJune 30, 2019.2020. Our effective tax rate was 16.9%38.8% and 32.0%26.3% for the three and ninesix months ended SeptemberJune 30, 2020,2021, respectively, compared to 18.3% and 21.9%(57.3)% and 36.3% for the three and ninesix months ended SeptemberJune 30, 2019,2020, respectively. The difference between the effective tax rate and the statutory rate is generally attributable to permanent differences and discrete items. The change in our effective tax rate for the three and ninesix months ended SeptemberJune 30, 20202021 as compared to the three and ninesix months ended SeptemberJune 30, 20192020 was primarily due to tax benefit for federal tax credits attributable to the Company’s biodiesel blending operations that were re-enacted in December 2019, reversal of a valuation allowance for deferred tax assets in partnership investments due to changes in the future realizability of deferred tax basis differences, and expectedfederal net operating loss carryback provided under the CARES Act which allows the Company to recover federal taxes paid ina prior years at a 35% tax rate creating a 14%year recorded as discrete adjustments during the first and second quarters of 2020 coupled with the impact of changes in the second quarter estimated annual effective tax rate benefit.applied to year-to date loss for the six months ended June 30, 2021 and June 30, 2020.
On March 27,As of December 31, 2020, we recorded a current income tax receivable of $135.6 million and a non-current tax receivable of $20.6 million, related to the federal net operating loss carryback as allowed per the Coronavirus Aid Relief, and Economic Security Act (the "CARES Act") which was enacted into law.in March 2020. The CARES Act includes several significant provisions for corporations, including the usagefull amount of net operating losses, interest deductions and payroll benefits. The Company recognized $16.8 million of current federal income tax benefit for the nine months ended September 30, 2020, attributable to anticipated tax refunds from net operating loss carryback to prior 35% tax rate years under the CARES Act. Additionally, we recorded anthis federal income tax receivable, totaling $165.6$156.2 million, aswas received in July and August of September 30, 2020 related to the federal net operating loss carryback.2021.
Notes to Condensed Consolidated Financial Statements (Unaudited)
Note 13 - Related Party Transactions
Our related party transactions consist primarily of transactions with our equity method investees (See Note 5). Transactions with our related parties were as follows for the periods presented:
| | | Three Months Ended September 30, | | Nine Months Ended September 30, | | Three Months Ended June 30, | | Six Months Ended June 30, |
| (in millions) | (in millions) | | 2020 | | 2019 | | 2020 | | 2019 | (in millions) | | 2021 | | 2020 | | 2021 | | 2020 |
Revenues (1) | Revenues (1) | | $ | 27.6 | | | $ | 45.1 | | | $ | 57.5 | | | $ | 73.3 | | Revenues (1) | | $ | 19.2 | | | $ | 22.2 | | | $ | 29.6 | | | $ | 29.9 | |
Cost of materials and other (2) | Cost of materials and other (2) | | $ | 10.9 | | | $ | 20.3 | | | $ | 31.4 | | | $ | 33.7 | | Cost of materials and other (2) | | $ | 9.9 | | | $ | 11.4 | | | $ | 25.0 | | | $ | 20.5 | |
(1)Consists primarily of asphalt sales which are recorded in corporate, other and eliminations segment.
(2)Consists primarily of pipeline throughput fees paid by the refining segment and asphalt purchases.
Note 14 - Other Current Assets and Liabilities
The detail of other current assets is as follows (in millions):
| | Other Current Assets | Other Current Assets | September 30, 2020 | | December 31, 2019 | Other Current Assets | June 30, 2021 | | December 31, 2020 |
| RINs assets | $ | 231.1 | | | $ | 14.5 | | |
| | Income and other tax receivables | Income and other tax receivables | 181.1 | | | 61.9 | | Income and other tax receivables | $ | 146.7 | | | $ | 142.0 | |
| Right to receive crude oil barrels (see Note 10) | 36.6 | | | 0 | | |
| | Short-term derivative assets (see Note 9) | Short-term derivative assets (see Note 9) | 33.0 | | | 30.2 | | Short-term derivative assets (see Note 9) | 64.8 | | | 72.9 | |
| Prepaid expenses | Prepaid expenses | 19.2 | | | 21.9 | | Prepaid expenses | 24.8 | | | 21.8 | |
| Environmental Credits Obligation surplus (see Note 10) | 7.3 | | | 16.8 | | |
| | Biodiesel tax credit (see Note 2) | 3.2 | | | 97.5 | | |
| Investment commodities | 1.0 | | | 12.1 | | |
| | Other | Other | 3.4 | | | 13.8 | | Other | 34.7 | | | 19.7 | |
| Total | Total | $ | 515.9 | | | $ | 268.7 | | Total | $ | 271.0 | | | $ | 256.4 | |
The detail of other non-current assets is as follows (in millions):
| | | | | | | | | | | |
| Other Non-Current Assets | September 30, 2020 | | December 31, 2019 |
| Supply and Offtake receivable | $ | 32.7 | | | $ | 32.7 | |
| Other equity Investments | 10.4 | | | 8.9 | |
| Deferred financing costs | 7.3 | | | 8.5 | |
| | | |
| | | |
| Other | 18.1 | | | 17.7 | |
| Total | $ | 68.5 | | | $ | 67.8 | |
Notes to Condensed Consolidated Financial Statements (Unaudited)
The detail of accrued expenses and other current liabilities is as follows (in millions):
| | | | | | | | | | | |
| Accrued Expenses and Other Current Liabilities | September 30, 2020 | | December 31, 2019 |
| Environmental Credits Obligation deficit (see Note 10) | $ | 237.6 | | | $ | 18.5 | |
| Product financing agreements | 168.5 | | | 21.1 | |
| Income and other taxes payable | 88.3 | | | 119.6 | |
| Crude purchase liabilities | 74.3 | | | 72.1 | |
| Employee costs | 23.8 | | | 47.6 | |
| Short-term derivative liabilities (see Note 9) | 16.3 | | | 14.1 | |
| Interest payable | 9.6 | | | 8.8 | |
| Environmental liabilities (see Note 11) | 6.6 | | | 8.2 | |
| Accrued utilities | 3.7 | | | 4.4 | |
| Tank inspection liabilities | 3.1 | | | 5.6 | |
| Other | 25.3 | | | 26.8 | |
| Total | $ | 657.1 | | | $ | 346.8 | |
The detail of other non-current liabilities is as follows (in millions):
| | | | | | | | | | | |
| Other Non-Current Liabilities | September 30, 2020 | | December 31, 2019 |
| Liability for unrecognized tax benefits | $ | 15.2 | | | $ | 12.1 | |
| Tank inspection liabilities | 9.4 | | | 9.9 | |
| Pension and other postemployment benefit liabilities, net | 3.1 | | | 5.3 | |
| Long-term derivative liabilities (see Note 9) | 1.8 | | | 1.4 | |
| Deferred payroll taxes | 7.8 | | | 0 | |
| Other | 0.1 | | | 2.2 | |
| Total | $ | 37.4 | | | $ | 30.9 | |
| | | | | | | | | | | |
| Accrued Expenses and Other Current Liabilities | June 30, 2021 | | December 31, 2020 |
| | | |
| Product financing agreements | $ | 358.8 | | | $ | 198.0 | |
| Consolidated Net RINs Obligation deficit (see Note 10) | 139.8 | | | 59.6 | |
| Crude purchase liabilities | 116.4 | | | 62.1 | |
| Income and other taxes payable | 113.4 | | | 109.5 | |
| Deferred revenue | 48.1 | | | 16.5 | |
| Employee costs | 36.1 | | | 30.2 | |
| Short-term derivative liabilities (see Note 9) | 21.1 | | | 35.8 | |
| | | |
| | | |
| | | |
| | | |
| Other | 45.1 | | | 34.7 | |
| Total | $ | 878.8 | | | $ | 546.4 | |
Note 15 - Equity-Based Compensation
Delek US Holdings, Inc. 2006 and 2016 and Alon USA Energy, Inc. 2005 Long-Term Incentive Plans (collectively, the "Incentive Plans")
On May 5, 2020,6, 2021, the Company's stockholders approved an amendment to the Delek US Holdings, Inc. 2016 Long-Term Incentive Plan that increased the number of shares of Common Stockcommon stock available for issuance under this plan by 2,120,0003,215,000 shares to 11,020,00014,235,000 shares.
Compensation expense related to equity-based awards granted under the Incentive Plans amounted to $6.6$5.7 million and $17.4$10.1 million for the three and ninesix months ended SeptemberJune 30, 2020,2021, respectively, and $7.3$5.0 million and $18.7$10.9 million for the three and ninesix months ended SeptemberJune 30, 2019,2020, respectively. These amounts are included in general and administrative expenses in the accompanying condensed consolidated statements of income.
As of SeptemberJune 30, 2020,2021, there was $42.2$45.5 million of total unrecognized compensation cost related to non-vested share-based compensation arrangements, which is expected to be recognized over a weighted-average period of 1.81.7 years.
Notes to Condensed Consolidated Financial Statements (Unaudited)
We issued net shares of common stock of 68,265186,937 and 314,204280,793 as a result of exercised or vested equity-based awards during the three and ninesix months ended SeptemberJune 30, 2020,2021, respectively, and 78,695143,044 and 462,318246,463 for the three and ninesix months ended SeptemberJune 30, 2019,2020, respectively. These amounts are net of 31,02088,478 and 161,469147,329 shares withheld to satisfy employee tax obligations related to the exercises and vesting during the three and ninesix months ended SeptemberJune 30, 2020, respectively,2021, and 146,14868,944 and 470,232130,449 for the three and ninesix months ended SeptemberJune 30, 2019, respectively.2020, respectively
Delek Logistics GP, LLC 2012 Long-Term Incentive Plan
The Delek Logistics GP, LLC 2012 Long-Term Incentive Plan (the "LTIP") was adopted by the Delek Logistics GP, LLC board of directors in connection with the completion of Delek Logistics' initial public offering in November 2012. The LTIP is administered by the Conflicts Committee of the board of directors of Delek Logistics' general partner. On June 9, 2021, the Delek Logistics GP, LLC board of directors amended the LTIP and increased the number of common units representing limited partner interests in Delek Logistics (the "Common Units") authorized for issuance under this plan by 300,000 Common Units to 912,207 Common Units. The term of the LTIP was also extended to June 9, 2031.
Delek US Holdings, Inc. Employee Stock Purchase Plan
NotesOn June 2, 2021, the Company's board of directors adopted the Delek US Holdings, Inc. Employee Stock Purchase Plan (the "ESPP"). The ESPP is structured as a qualified employee stock purchase plan under Section 423 of the U.S. Internal Revenue Code of 1986. The Company authorized the issuance of 2,000,000 shares of common stock under the ESPP. On each purchase date, eligible employees (as defined in the ESPP) can purchase the Company's stock at a price per share equal to Condensed Consolidated Financial Statements (Unaudited)
85.0% of the closing price of the Company's common stock on the exercise date, but no less than par value. There are 4 offering periods of three months during each fiscal year, beginning each January 1st, April 1st, July 1st, and October 1st. NaN shares of common stock were issued under the ESPP as of June 30, 2021.
Note 16 - Shareholders' Equity
Dividends Suspension
DuringWe have elected to suspend dividends beginning in the nine months ended September 30,fourth quarter of 2020 our Board of Directors declared the following dividends:
| | | | | | | | | | | | | | | | | | | | |
Approval Date | | Dividend Amount Per Share | | Record Date | | Payment Date |
February 24, 2020 | | $0.31 | | March 10, 2020 | | March 24, 2020 |
May 4, 2020 | | $0.31 | | May 20, 2020 | | June 3, 2020 |
August 3, 2020 | | $0.31 | | August 19, 2020 | | September 3, 2020 |
in order to conserve capital. Stock Repurchase Program
On November 6, 2018, our Board of Directors authorized a share repurchase program for up to $500.0 million of Delek common stock. Any share repurchases under the repurchase program may be implemented through open market transactions or in privately negotiated transactions, in accordance with applicable securities laws. The timing, price and size of repurchases are made at the discretion of management and will depend on prevailing market prices, general economic and market conditions and other considerations. The repurchase program does not obligate us to acquire any particular amount of stock and does not expire. In the second quarter of 2020, we elected to suspend the share repurchase program. During the ninesix months ended SeptemberJune 30, 2020, 58,713 shares of our common stock were repurchased for a total of $1.9 million. Nomillion; NaN of which were repurchased during the second quarter of 2020. NaN repurchases of our common stock were made in the three and six months ended SeptemberJune 30, 2020. During the three and nine months ended September 30, 2019, we repurchased 1,236,854 and 4,175,576 shares of our common stock for a total of $43.0 million and $147.8 million, respectively.2021. As of SeptemberJune 30, 2020,2021, there was $229.7 million of authorization remaining under Delek's aggregate stock repurchase program.
Stockholder Rights Plan
On March 20, 2020, our Board of Directors declared a dividend of one preferred share purchase right (a “Right”) for each outstanding share of Delek’s common stock and adopted a stockholder rights plan (the “Rights Agreement”). The dividend was distributed in a non-cash transaction on March 30, 2020 to the stockholders of record on that date. The Rights initially tradetraded with and are inseparable from, Delek’s common stock. Once the Rights become exercisable, each Right will allow its holder to purchase one one-thousandth of a share of Series A Junior Participating Preferred Stock, par value $0.01 per share (a “Preferred Share”) for $92.24, subject to adjustment (the “Exercise Price”). This portion of a Preferred Share will give the stockholder approximately the same dividend, voting and liquidation rights as would one share of Delek’s common stock. Prior to exercise, the Right does not give its holder any dividend, voting or liquidation rights.
The Rights will not be exercisable until 10 days afterexpired in accordance with the public announcement that a person or group that has become an “Acquiring Person” (as defined in the Rights Agreement). The point at which these terms are met is otherwise referred to as the "Distribution Date." If a person or group becomes an Acquiring Person, all holders of Rights except the Acquiring Person may, for the Exercise Price, purchase shares of the Company’s common stock with a market value of two times the Exercise Price, based on the market price of the common stock prior to such acquisition. In addition, subject to certain conditions set forth in the Rights Agreement the Board may extinguish the Rights. If the Company is later acquired in a merger or similar transaction after the Distribution Date, all holders of Rights except the Acquiring Person may, for the Exercise Price, purchase shares of the acquiring corporation with a market value of two times the Exercise Price, based on the market price of the acquiring corporation’s stock prior to such merger.
In the event the Company receives a fully financed, all-cash tender offer satisfying the conditions set forth in the Rights Agreement (a “Qualifying Offer”), and certain other events occur, the Rights Agreement provides a mechanism for stockholders holding more than 20% of the shares of Delek common stock then outstanding (excluding shares beneficially owned by the person making the Qualifying Offer) to demand a special meeting of the stockholders of the Company to vote on a resolution exempting such Qualifying Offer from the provisions of the Rights Agreement.
The Rights will expire on March 19, 2021, subject to a possible earlier expiration to the extent provided in the Rights Agreement.
Preferred Stock
On March 20, 2020, our Board of Directors authorized 1,000,000 shares of preferred stock with a par value of $0.01 per share as Series A Junior Participating Preferred Stock.
Notes to Condensed Consolidated Financial Statements (Unaudited)
Note 17 - Employees
Postretirement Benefits
The net periodic (benefit) cost for our postretirement benefit plans was not material for the three and nine months ended September 30, 2020 or 2019. Additionally, our estimated contributions to our pension plans during 2020 have not changed significantly from amounts previously disclosed in the notes to the consolidated financial statements for the year ended December 31, 2019.2021.
Note 1817 - Leases
We lease certain retail stores, land, building and various equipment from others. Leases with an initial term of 12 months or less are not recorded on the balance sheet; we recognize lease expense for these leases on a straight-line basis over the lease term. Most leases include one or more options to renew, with renewal terms that can extend the lease term from one to 15 years or more. The exercise of existing lease renewal options is at our sole discretion. Certain leases also include options to purchase the leased property. The depreciable life of assets and leasehold improvements are limited by the expected lease term, unless there is a transfer of title or purchase option reasonably certain of exercise.
Some of our lease agreements include a rate based on equipment usage and others include a rate with fixed increases or inflationary indices based increase. Our lease agreements do not contain any material residual value guarantees or material restrictive covenants. We
Notes to Condensed Consolidated Financial Statements (Unaudited)
rent or sublease certain real estate and equipment to third parties. Our sublease portfolio consists primarily of operating leases within our retail stores and crude storage equipment.
As of SeptemberJune 30, 2020, $26.82021, $25.5 million of our net property, plant, and equipment balance is subject to an operating lease. This agreement does not include options for the lessee to purchase our leasing equipment, nor does it include any material residual value guarantees or material restrictive covenants. The agreement includes a one-yearone-year renewal option and certain variable payment based on usage.
The following table presents additional information related to our operating leases in accordance ASC 842, Leases ("ASC 842"):
| | | Three Months Ended September 30, | | Nine Months Ended September 30, | | Three Months Ended June 30, | | Six Months Ended June 30, |
| (in millions) | (in millions) | | 2020 | | 2019 | | 2020 | | 2019 | (in millions) | | 2021 | | 2020 | | 2021 | | 2020 |
| Lease Cost | Lease Cost | | | | | | | | | Lease Cost | | | | | | | | |
Operating lease costs | Operating lease costs | | $ | 16.9 | | | $ | 13.5 | | | $ | 48.5 | | | $ | 44.1 | | Operating lease costs | | $ | 17.8 | | | $ | 15.9 | | | $ | 35.5 | | | $ | 31.6 | |
Short-term lease costs (1)(2) | Short-term lease costs (1)(2) | | 5.4 | | | 4.0 | | | 19.1 | | | 11.3 | | Short-term lease costs (1)(2) | | 11.0 | | | 6.1 | | | 20.5 | | | 13.7 | |
| Sublease income | Sublease income | | (1.8) | | | (1.9) | | | (5.7) | | | (6.4) | | Sublease income | | (1.9) | | | (2.0) | | | (3.8) | | | (3.9) | |
| Net lease costs | Net lease costs | | $ | 20.5 | | | $ | 15.6 | | | $ | 61.9 | | | $ | 49.0 | | Net lease costs | | $ | 26.9 | | | $ | 20.0 | | | $ | 52.2 | | | $ | 41.4 | |
| | Other Information | Other Information | | Other Information | | | | | | | | |
| Cash paid for amounts included in the measurement of lease liabilities: | Cash paid for amounts included in the measurement of lease liabilities: | | Cash paid for amounts included in the measurement of lease liabilities: | |
| Operating cash flows from operating leases | | $ | (16.9) | | | $ | (13.5) | | | $ | (48.5) | | | $ | (44.1) | | |
Operating cash flows from operating leases (1) | | Operating cash flows from operating leases (1) | | $ | (17.9) | | | $ | (15.9) | | | $ | (36.2) | | | $ | (31.6) | |
| Leased assets obtained in exchange for new operating lease liabilities | Leased assets obtained in exchange for new operating lease liabilities | | $ | 8.5 | | | $ | 1.5 | | | $ | 30.7 | | | $ | 9.6 | | Leased assets obtained in exchange for new operating lease liabilities | | $ | 6.8 | | | $ | 15.4 | | | $ | 14.2 | | | $ | 22.2 | |
| Leased assets obtained in exchange for new financing lease liabilities | | Leased assets obtained in exchange for new financing lease liabilities | | $ | 0.2 | | | $ | 0 | | | $ | 12.4 | | | $ | 0 | |
| | | September 30, 2020 | | June 30, 2021 | | June 30, 2020 |
| Weighted-average remaining lease term (years) operating leases | Weighted-average remaining lease term (years) operating leases | | 6.1 | Weighted-average remaining lease term (years) operating leases | | 4.9 | | 6.4 |
Weighted-average discount rate operating leases (2) | | 5.9 | % | |
| Weighted-average remaining lease term (years) financing leases | | Weighted-average remaining lease term (years) financing leases | | 7.5 | | N/A |
Weighted-average discount rate operating leases (3) | | Weighted-average discount rate operating leases (3) | | 6.4 | % | | 6.0 | % |
Weighted-average discount rate financing leases (3) | | Weighted-average discount rate financing leases (3) | | 3.3 | % | | N/A |
(1)Includes an immaterial amount of financing lease cost.
(2) Includes an immaterial amount of variable lease cost.
(2)(3) Our discount rate is primarily based on our incremental borrowing rate in accordance with ASC 842.842.
Note 1918 - Subsequent Events
Dividend SuspensionIn July and August 2021, we received a total of $156.2 million in federal income tax refunds related to net operating loss carryback provisions which were enacted under the CARES Act. See Note 12 for additional information.
We have elected to suspend dividends beginning in the fourth quarter of 2020 in order to conserve capital.
Notes to Condensed Consolidated Financial Statements (Unaudited)
Supply and Offtake Agreements
Pursuant to the Supply and Offtake Agreements' Periodic Price Adjustment provision, we determined that the provision was triggered on October 1, 2020 and a paydown amounting to $20.8 million was made to J. Aron on October 30, 2020. The prospective pricing underlying the fixed component of the Baseline Step-Out liabilities will be adjusted accordingly to reflect this payment, resulting in a reduction to the fixed differential component of our long-term Supply and Offtake Obligation totaling $20.8 million and a prospective contractual reset of the fixed differentials subject to future Periodic Price Adjustments. Contemporaneous with the payment, J. Aron separately refunded to us the $10.0 million of deferred additional monthly fees.
Management's Discussion and Analysis
ITEM 2. MANAGEMENT’S DISCUSSION AND ANALYSIS OF FINANCIAL CONDITION AND RESULTS OF OPERATIONS
Management’s Discussion and Analysis of Financial Condition and Results of Operations ("MD&A") is management’s analysis of our financial performance and of significant trends that may affect our future performance. The MD&A should be read in conjunction with our condensed consolidated financial statements and related notes included elsewhere in this Quarterly Report on Form 10-Q and in the Annual Report on Form 10-K as filed with the Securities and Exchange Commission ("SEC") on February 28, 2020March 1, 2021 (the "Annual Report on Form 10-K"). Those statements in the MD&A that are not historical in nature should be deemed forward-looking statements that are inherently uncertain.
Delek US Holdings, Inc. is a registrant pursuant to the Securities Act of 1933, as amended ("Securities Act") and is listed on the New York Stock Exchange ("NYSE") under the ticker symbol "DK". Unless otherwise noted or the context requires otherwise, the terms "we," "our," "us," "Delek" and the "Company" are used in this report to refer to Delek US Holdings, Inc. and its consolidated subsidiaries for all periods presented. You should read the following discussion of our financial condition and results of operations in conjunction with our historical condensed consolidated financial statements and notes thereto.
The Company announces material information to the public about the Company, its products and services and other matters through a variety of means, including filings with the Securities and Exchange Commission,SEC, press releases, public conference calls, the Company’s website (www.delekus.com), the investor relations section of its website (ir.delekus.com), the news section of its website (www.delekus.com/news), and/or social media, including its Twitter account (@DelekUSHoldings). The Company encourages investors and others to review the information it makes public in these locations, as such information could be deemed to be material information. Please note that this list may be updated from time to time.
Forward-Looking Statements
This Quarterly Report on Form 10-Q contains "forward-looking statements" within the meaning of Section 27A of the Securities Act of 1933, as amended, and Section 21E of the Securities Exchange Act.Act of 1934 ("Exchange Act"). These forward-looking statements reflect our current estimates, expectations and projections about our future results, performance, prospects and opportunities. Forward-looking statements include, among other things, statements regarding the effect, impact, potential duration or other implications of, or expectations expressed with respect to, the recent outbreak of COVID-19, its development into a pandemic in March 2020, and any subsequent mutation of COVID-19 into one or more variants (the "COVID-19 Pandemic" or the "Pandemic") and the actions of members of the Organization of Petroleum Exporting Countries (“OPEC”("OPEC") and Russiaother leading oil producing countries (together with OPEC, “OPEC+”), with respect to oil production and pricing, and statements regarding our efforts and plans in response to such events, the information concerning our planned capital expenditures by segment for 2021, possible future results of operations, business and growth strategies, financing plans, expectations that regulatory developments or other matters will or will not have a material adverse effect on our business or financial condition, our competitive position and the effects of competition, the projected growth of the industry in which we operate, and the benefits and synergies to be obtained from our completed and any future acquisitions, statements of management’s goals and objectives, and other similar expressions concerning matters that are not historical facts. Words such as "may," "will," "should," "could," "would," "predicts," "potential," "continue," "expects," "anticipates," "future," "intends," "plans," "believes," "estimates," "appears," "projects" and similar expressions, as well as statements in future tense, identify forward-looking statements.
Forward-looking statements should not be read as a guarantee of future performance or results, and will not necessarily be accurate indications of the times at, or by, which such performance or results will be achieved. Forward-looking information is based on information available at the time and/or management’s good faith belief with respect to future events, and is subject to risks and uncertainties that could cause actual performance or results to differ materially from those expressed in the statements. Important factors that, individually or in the aggregate, could cause such differences include, but are not limited to:
•volatility in our refining margins or fuel gross profit as a result of changes in the prices of crude oil, other feedstocks and refined petroleum products and the impact of the COVID-19 Pandemic on such demand;
•reliability of our operating assets;
•actions of our competitors and customers;
•changes in, or the failure to comply with, the extensive government regulations applicable to our industry segments, including current and future restrictions on commercial and economic activities in response to the COVID-19 Pandemic;Pandemic or future pandemics;
•the possibility of inefficiencies, curtailments, or shutdowns in refinery operations or pipelines, whether due to infection in the workforce or in response to reductions in demand as a result of the COVID-19 Pandemic;
•our ability to execute our strategy of growth through acquisitions and capital projects and changes in the expected value of and benefits derived therefrom, including any ability to successfully integrate acquisitions, realize expected synergies or achieve operational efficiency and effectiveness;
•diminishment in value of long-lived assets may result in an impairment in the carrying value of the assets on our balance sheet and a resultant loss recognized in the statement of operations;
•the unprecedented market environment and economic effects of the COVID-19 Pandemic, including uncertainty regarding the timing, pace and extent of economic recovery in the United States due to the COVID-19 Pandemic;
Management's Discussion and Analysis
regarding the timing, pace and extent of economic recovery in the United States ("U.S.") due to the COVID-19 Pandemic;
•general economic and business conditions affecting the southern, southwestern and western United States,U.S., particularly levels of spending related to travel and tourism and the ongoing and future impacts of the COVID-19 Pandemic;
•volatility under our derivative instruments;
•deterioration of creditworthiness or overall financial condition of a material counterparty (or counterparties);
•unanticipated increases in cost or scope of, or significant delays in the completion of, our capital improvement and periodic turnaround projects;
•risks and uncertainties with respect to the quantities and costs of refined petroleum products supplied to our pipelines and/or held in our terminals;
•operating hazards, natural disasters, weather related disruptions, casualty losses and other matters beyond our control;
•increases in our debt levels or costs;
•possibility of accelerated repayment on a portion of the J. Aron supply and offtake liability if the purchase price adjustment feature triggers a change on the re-pricing dates;
•changes in our ability to continue to access the credit markets;
•compliance, or failure to comply, with restrictive and financial covenants in our various debt agreements;
•the suspension of our quarterly dividend;
•seasonality;
•acts of terrorism (including cyber-terrorism) aimed at either our facilities or other facilities that could impair our ability to produce or transport refined products or receive feedstocks;
•future decisions by OPEC+ members regarding production and pricing and disputes between OPEC+ members regarding such;the same;
•disruption, failure, or cybersecurity breaches affecting or targeting our IT systems and controls, our infrastructure, or the infrastructure of our cloud-based IT service providers;
•changes in the cost or availability of transportation for feedstocks and refined products; and
•other factors discussed under the headings "Management’s Discussion and Analysis of Financial Condition and Results of Operations" and "Risk Factors" and in our other filings with the SEC.
In light of these risks, uncertainties and assumptions, our actual results of operations and execution of our business strategy could differ materially from those expressed in, or implied by, the forward-looking statements, and you should not place undue reliance upon them. In addition, past financial and/or operating performance is not necessarily a reliable indicator of future performance, and you should not use our historical performance to anticipate future results or period trends. We can give no assurances that any of the events anticipated by any forward-looking statements will occur or, if any of them do, what impact they will have on our results of operations and financial condition.
All forward-looking statements included in this report are based on information available to us on the date of this report. We undertake no obligation to revise or update any forward-looking statements as a result of new information, future events or otherwise.
Executive Summary
We are an integrated downstream energy business focused on petroleum refining, the transportation, storage and wholesale distribution of crude oil, intermediate and refined products and convenience store retailing. Our operating segments consist of refining, logistics, and retail, and are discussed in the sections that follow.
The outbreakImpact of the COVID-19 and its development into a pandemic in March 2020 (the "COVID-19 Pandemic" or the "Pandemic")Pandemic
The COVID-19 Pandemic has resulted in significant economic disruption globally, including in the United States ("U.S.") and specific geographic areas where we operate. Actions taken by various governmental authorities, individuals and companies around the world to prevent the spread of COVID-19 through both voluntary and mandated social distancing, curfews, shutdowns and expanded safety measures have restricted travel, many business operations, public gatherings and the overall level of individual movement and in-person interaction across the globe. This has in turn significantly reduced global economic activity which has had a significant impact on the nature and extent of travel. The COVID-19 Pandemic has had a devastating impact on the airline industry, dramatically reducing the number of domestic flights and, due to foreign travel bans and immigration restrictions abroad as well as traveler concerns over exposure, virtually eliminating international travel originating from the U.S. to many parts of the world. Additionally, the COVID-19 Pandemic has had a significant negative impact on motor vehicle use at a time when seasonal driving patterns typically result in an increase of consumer demand for gasoline.activity. As a result, there has
Management's Discussion and Analysis
also beenparticularly during 2020, we experienced a decline in the demand for, and thus also the market prices of, crude oil and certain of our products, particularly our refined petroleum products and most notably gasoline and jet fuel. In April and June 2020, agreements were reached to cut oil production between the members of OPEC and other leading oil producing countries (together with OPEC, “OPEC+”), as part of the efforts to resolve the oil production disputes that significantly affected crude oil prices beginning in the first quarter of 2020 (the "OPEC Production Disputes"), and to provide stability in the oil markets. While OPEC+ have reached an agreement to cut oil production, the uncertaintyUncertainty about the duration of the COVID-19 Pandemic has caused periodic storage constraints in the U.S. resulting from over-supply
Management's Discussion and Analysis
of produced oil. Additionally, significant environmental events, such as extreme weather conditions or natural disasters can impact pipeline accessibility and utilization, other supply sources, as well as demand. While in the last several months, we have seen successful domestic efforts to distribute the COVID-19 vaccine across the U.S., which has led to some improved stability in the capital markets as well as improved pricing in crude oil, refined products, and related forward curves, there continues to be general economic uncertainty, and, accordingly, demand for refined product and for our logistics assets has not yet returned to normal levels. Such uncertainty has been further aggravated by the mutation of the COVID-19 virus into one or more variants and plateauing demand for currently available vaccines. Based on these conditions and events, downward pressure on commodity prices, crack spreads and demand remains a significant risk and could continue for the foreseeable future.
During the latter part of the second quarter of 2020, governmental authorities in various states across the U.S., particularly those in our Permian Basin and U.S. Gulf Coast regions, began to lift many of the restrictions created by actions taken to slow down the spread of COVID-19. These actions have resulted in an increase in the level of individual movement and travel and, in turn, an increase in the demand and market prices for some of our products relative to late March 2020. However, many of the states where such restrictions were lifted have recently experienced a marked increase in the spread of COVID-19 and many governmental authorities in such areas have responded by reimposing certain restrictions they had previously lifted. This response, as well as the increased infection rates, impacts regions that we serve and could significantly impact demand in ways that we cannot predict. Additionally, increased infection rates could impact our refining, logistics and retail operations, particularly in high-infection states, if our employees are personally affected by the illness, both through direct infection and quarantine procedures.
During the three and nine months ended September 30, 2020, Delek has experienced the impact on demand and pricing of these unprecedented conditions, most notably in our refining segment. Our business and our third quarter 2020 results reflect the impact of decreased demand combined with crack spreads that are 53% to 71% lower, on average, compared to the same quarter in the prior year. We have also experienced operational constraints as well, including COVID-19 infections at certain of our company locations that have resulted in re-imposed or expanded remote policies and quarantine protocols. And we continue to be faced with risk from our suppliers and customers who are facing similar challenges.
We havepreviously identified the following known uncertainties resulting from the COVID-19 Pandemic, which is ongoing:Pandemic. And while the risk surrounding these uncertainties appears to be lessening, they still represent risks that could impact our operations, financial condition and results of operations. They are as follows:
•Significant declines and/or volatility in prices of refined products we sell and the feedstocks we purchase as well as in crack spreads resulting from the COVID-19 Pandemic and the OPEC Production Disputes could have a significant impact on our revenues, cost of sales, operating income and liquidity, as well to the carrying value of our long-lived or indefinite-lived assets;
•A decline in the market prices of refined products and feedstocks below the carrying value in our inventory may result in the adjustment of the value of our inventories to the lower market price and a corresponding loss on the value of our inventories (see also Note 1 to our Condensed Consolidated Financial Statements included in Part I, Item 1 of this Quarterly Report on Form 10-Q for additional discussion of specific financial statement risks);
•The decline in demand for refined productproducts could significantly impact the demand for throughput at our refineries, unfavorably impacting operating results at our refineries, and could impact the demand for storage, which could impact our logistics segment;
•The decline in demand and margins impacting current results and forecasts could result in impairments in certain of our long-lived or indefinite-lived assets, including goodwill, or have other financial statement impacts that cannot currently be anticipated (see also Note 1 to our Condensed Consolidated Financial Statements included in Part I, Item 1 of this Quarterly Report on Form 10-Q for additional discussion of specific financial statement risks);
•A significant reduction or suspension in U.S. crude oil production could adversely affect our suppliers and sources of crude oil;
•An outbreak in one of our refineries, exacerbated by a limited pool of qualified replacements as well as quarantine protocols, could cause significant disruption in our production or, worst case, temporary idling of the facility;
•The restrictions on travel and requirements for social distancing could significantly impact the traffic at our convenience stores, particularly the demand for fuel;
•Customers of the refining segment as well as third-party customers of the logistics segment may experience financial difficulties which could interrupt the volumes ordered by those customers and/or could impact the credit worthiness of such customers and the collectability of their outstanding receivables;
•The impact of COVID-19 or protocols implemented in response to COVID-19 by key or specialty suppliers may negatively affect our ability to obtain specialty equipment or services when needed;
•Equity method investees may be significantly impacted by the COVID-19 Pandemic and/or the OPEC Production Disputes, which may increase the risk of impairment of those investments;
•Access to capital markets may be significantly impacted by the volatility and uncertainty in the oil and gas market specifically which could restrict our ability to raise funds;
Management's Discussion and Analysis
•While while our current liquidity needs are managed by existing facilities, sources of future liquidity needs may be impacted by the volatility in the debt market and the availability and pricing of such funds as a result of the COVID-19 Pandemic and the OPEC Production Disputes;Pandemic; and
•The U.S. Federal Government has enacted certain stimulus and relief measures including the Coronavirus Aid, Relief, and Economic Security Act (the "CARES Act") passed on March 27, 2020, and is continuing tomay consider additional relief legislation. Beyond the direct impact of existing legislation on Delek in the current period,or prior periods (as applicable), the extent to which the provisions of the existing or any future legislation will achieve its intention to stimulate or provide relief to the greater U.S. economy and/or consumer, as well as the impact and success of such efforts, remains unknown.
Other uncertainties related to the impact of the COVID-19 Pandemic as well as global geopolitical factors may exist that have not been identified or that are not specifically listed above, and could impact our future results of operations and financial position, the nature of which and the extent to which are currently unknown. Actions taken by OPEC+ in April and June 2020, including the agreement for management of crude oil supply in the hopes of contributing to market stabilization (the "Oil Production Cuts"), as well as theThe U.S. Federal Government's passage and/or enactment of additional stimulus and relief measures, as well as their future actions may impact the extent to which the risk underlying these uncertainties are realized. To the extent these uncertainties have been identified and are believed to have an impact on our current period results of operations or financial position based on the requirements for assessing such financial statement impact under U.S. Generally Accepted Accounting
Management's Discussion and Analysis
Principles ("GAAP"), we have considered them in the preparation of our unaudited financial statements as of and for the ninesix months ended SeptemberJune 30, 2020,2021, which are included in Item 1, of this Quarterly Report on Form 10-Q.
In addition, management continues tohas actively respondresponded to the continuing impact of the COVID-19 Pandemic on our business. Additionally, to the extent warranted, we continue to monitor the impact and implement measures to mitigate the risk. Such efforts include (but are not limited to) the following:
•Reviewing planned production throughputs at our refineries and planning for optimization of operations;
•Coordinating planned maintenance activities with possible downtime as a result of possible reductions in throughputs;
•Searching for additional storage capacity if needed to store potential builds in crude oil or refined product inventories;
•Finding additional suppliers for key or specialty items or securing inventory or priority status with existing vendors;
•Reducing planneddiscretionary capital expenditures for 2020;expenditures;
•Suspending the share repurchase program and dividend distributions until our internal parameters are met for resuming such repurchases, which will continue to include evaluation of our undervalued stock price in relation to opportunities to provide alternative returns and/or accretive value to investors;activities;
•Taking advantage of the income and payroll tax relief afforded to us by the CARES Act;Coronavirus Aid Relief, and Economic Security Act (the "CARES Act") or other Pandemic relief legislation;
•Implementing regular site cleaning and disinfecting procedures;
•Adopting remote working where possible. Wherepossible, and where on-site operations are required, masks are mandatory and our employees have adopted social distancing;
•Reviewing dividend strategy to align with market changes and current economic conditions;taking appropriate safety precautions;
•Identifying alternative financing solutions as needed to enhance our access to sources of liquidity; and
•Enacting cost reduction measures across the organization, including reducing contract services, reducing overtime and other employee related costs, workforce reduction and reducing or eliminating non-critical travel which serves the dual purpose of also complying with recommendations made by the state and federal governments because of the COVID-19 Pandemic.travel.
The most significant of these efforts to date as well as specifically identified measures that are anticipated in the near term, in terms of realized or anticipated impact, include the following:
Pursuant•For the year ended December 31, 2020 pursuant to the provisions of the CARES Act, we recognized $16.8 million of current federal income tax benefit for the nine months ended September 30, 2020, attributable to anticipated tax refunds from net operating loss carryback to prior 35% tax rate years. Additionally, we recorded an income tax receivable totaling $165.6 million as of September 30, 2020 related to the net operating loss carryback, which we expect to collect in the first half of 2021. Finally, weyears, and deferred $7.8$10.9 million of payroll tax payments under the provisions of the CARES Act during the nine months ended September 30, 2020, which will be payable in equal installments in December 2021 and December 2022.
Beginning Additionally, we recorded a current income tax receivable of $135.6 million and a non-current tax receivable of $20.6 million as of December 31, 2020, related to the net operating loss carryback, all of which was received in the secondthird quarter 2020, weof 2021.
•We made significant efforts to reduce our capital spending, particularly on growth and non-critical sustaining maintenance projects. As a result, we have spent $208.0 million in capital expenditures (as discussed further in the "Capital Spending" section of the "Liquidity and Capital Resources" section of Item 2. Management's Discussion and Analysis) during the nine months ended September 30, 2020 compared to our initial full-year forecast included in our December 31, 2019 Annual Report on Form 10-K of $325.7 million. See the "Liquidity and Capital Resources" section of Item 2. Management's Discussion and AnalysisMD&A for further information.
Management's Discussion and Analysis
In light of the weak macro-economic environment, we elected to pull forward turnaround work into the fourth quarter of 2020 on certain units at theour Krotz Springs refinery that will bewas conducted on a straight-time basis. This will allowallowed us to continue running the more profitable units of the refinery and should help improve economics toward a break-even level. AfterWe completed this turnaround work is completelate in the first quarter of next year2021 and depending on market conditions, we have the flexibilitysince returned to optimize operations at Krotz Springs by operating only the units that are producing favorable margins, thereby reducing unnecessary operating expenses, or moving back to full utilization at the facility, should the macro-economic environment and margins improve.normalized production.
•Additionally, we have developed a cost savings plan for 2021 designed to significantlycontinue to reduce operating expenses and general and administrative expenses. The majority of the expected operating expenses reduction is attributable to the temporary unit optimization at the Krotz SpringSprings refinery, while other efforts such as targeted budgeting around outside contractor expenses and deferral of certain non-critical, non-capitalizable maintenance activities are also expected to have a favorable impact. Furthermore, both operating and general and administrative expenses will be favorably impacted by a cumulative reduction in workforce, the first of these reductions of which began in the second quarter 2020, and which are expected to be completed by the fourth quarter.workforce. Reductions in workforce are made possible in large part by significant efforts to improve process efficiency and leverage technology where cost-effective. For the three and nine months ended September 30, 2020, we have incurred incremental severance costs of $1.8 million and $4.6 million related to these workforce reductions. We have also incurred $2.4 million of severance costs subsequent to September 30, 2020.
•Finally, we have elected to suspend share repurchases and dividends beginning in the second and fourth quarterquarters of 2020, respectively, in order to conserve capital. We expect this will help us maintain our liquidity and manage our cost of capital in light ofimpacted by the COVID-19 Pandemic, and lower oil prices. We alsowe believe it will provide us with flexibility to pursue opportunities to provide value to investors with respect to our stock price, which we believe is undervalued.
The combination of these efforts are expected to continue to have a favorable impact on cash flows on a prospective basis and continuing in 2021,as well as our operations process effectiveness, which will reinforceimprove our liquidity positioning and operational flexibility and response in anticipation of the continued economic impacts of the COVID-19 Pandemic. See the "Liquidity and Capital Resources" section of Item 2. Management's Discussion and AnalysisMD&A for further information.
The extent to which our future results are affected by the COVID-19 Pandemic will depend on various factors and consequences beyond our control, such as the duration and scope of the Pandemic; additional actions by businesses and governments in response to the Pandemic, and the speed and effectiveness of responses to combat the virus.virus and any new variants and the challenges with the vaccination
Management's Discussion and Analysis
rollout. The COVID-19 Pandemic, and the volatile regional and global economic conditions stemming from the Pandemic, could also exacerbate the risk factors identified in our Annual Report on Form 10-K for the fiscal year ended December 31, 20192020 and in this Form 10-Q.10-Q, as applicable. The COVID-19 Pandemic may also materially adversely affect our results in a manner that is either not currently known or that we do not currently consider to be a significant risk to our business.
SeeOther Significant Events
During February 2021, the Company experienced a severe weather event ("Winter Storm Uri") which temporarily impacted operations at all of our refineries. Due to the extreme freezing conditions, and despite the acceleration of planned and ongoing turnaround work at the El Dorado and Krotz Spring refineries (which provided some mitigation), we experienced reduced throughputs at our refineries as there was a disruption in the crude supply, increases in natural gas costs, as well as damages to various units at our refineries requiring additional operating and capital expenditures.
On February 27, 2021, our El Dorado refinery experienced a fire in its Penex unit, in which six Delek employees were injured. Our on-site emergency response team, with the assistance of the El Dorado Fire Department, extinguished the fire, and we immediately began to monitor the air quality within the refinery and the community. The incident is currently being investigated by the Occupational Safety and Health Administration and Chemical Safety Board. Contrary to initial assessments, and despite occurring during the early stages of turnaround activity, the facility did suffer operational disruptions as a result of the fire.
Work to determine the full extent of covered business interruption and property and casualty losses and potential insurance claims is ongoing and is expected to result in the future recognition of insurance recoveries. The extent of any incremental losses is not yet determinable and may also "Risk Factors"be subject to insurance recoveries. (See Note 11 to our Condensed Consolidated Financial Statements included in Part II,I, Item 1A.1 of this Quarterly Report on Form 10-Q for further discussion of risks associated with the COVID-19 Pandemicmore information about losses incurred and the OPEC Production Disputes.related insurance coverages).
The refining segment (or "Refining") processes crude oil and other feedstocks for the manufacture of transportation motor fuels, including various grades of gasoline, diesel fuel and aviation fuel, asphalt and other petroleum-based products that are distributed through owned and third-party product terminals. The refining segment has a combined nameplate capacity of 302,000 barrels per day as of SeptemberJune 30, 2020.2021. A high-level summary of the refinery activities is presented below:
| | | Tyler, Texas refinery (the "Tyler refinery") | El Dorado, Arkansas refinery (the "El Dorado refinery") | Big Spring, Texas refinery (the "Big Spring refinery") | Krotz Springs, Louisiana refinery (the "Krotz Springs refinery") | | Tyler, Texas refinery (the "Tyler refinery") | El Dorado, Arkansas refinery (the "El Dorado refinery") | Big Spring, Texas refinery (the "Big Spring refinery") | Krotz Springs, Louisiana refinery (the "Krotz Springs refinery") |
| Total Nameplate Capacity (barrels per day ("bpd")) | Total Nameplate Capacity (barrels per day ("bpd")) | 75,000 | 80,000 | 73,000 | 74,000 | Total Nameplate Capacity (barrels per day ("bpd")) | 75,000 | 80,000 (1) | 73,000 | 74,000 |
| Primary Products | Primary Products | Gasoline, jet fuel, ultra-low-sulfur diesel, liquefied petroleum gases, propylene, petroleum coke and sulfur | Gasoline, ultra-low-sulfur diesel, liquefied petroleum gases, propylene, asphalt and sulfur | Gasoline, jet fuel, ultra-low-sulfur diesel, liquefied petroleum gases, propylene, aromatics and sulfur | Gasoline, jet fuel, high-sulfur diesel, light cycle oil, liquefied petroleum gases, propylene and ammonium thiosulfate | Primary Products | Gasoline, jet fuel, ultra-low-sulfur diesel, liquefied petroleum gases, propylene, petroleum coke and sulfur | Gasoline, ultra-low-sulfur diesel, liquefied petroleum gases, propylene, asphalt and sulfur | Gasoline, jet fuel, ultra-low-sulfur diesel, liquefied petroleum gases, propylene, aromatics and sulfur | Gasoline, jet fuel, high-sulfur diesel, light cycle oil, liquefied petroleum gases, propylene and ammonium thiosulfate |
Relevant Crack Spread Benchmark (1) | Relevant Crack Spread Benchmark (1) | Gulf Coast 5-3-2 | Gulf Coast 5-3-2 (2) | Gulf Coast 3-2-1 (3) | Gulf Coast 2-1-1 (4) | Relevant Crack Spread Benchmark (1) | Gulf Coast 5-3-2 | Gulf Coast 5-3-2 (2) | Gulf Coast 3-2-1 (3) | Gulf Coast 2-1-1 (4) |
| Marketing and Distribution | Marketing and Distribution | The refining segment's petroleum-based products are marketed primarily in the south central, southwestern and western regions of the United States, and the refining segment also ships and sells gasoline into wholesale markets in the southern and eastern United States. Motor fuels are sold under the Alon or Delek brand through various terminals to supply Alon or Delek branded retail sites. In addition, we sell motor fuels through our wholesale distribution network on an unbranded basis. | Marketing and Distribution | The refining segment's petroleum-based products are marketed primarily in the south central, southwestern and western regions of the United States, and the refining segment also ships and sells gasoline into wholesale markets in the southern and eastern United States. Motor fuels are sold under the Alon or Delek brand through various terminals to supply Alon or Delek branded retail sites. In addition, we sell motor fuels through our wholesale distribution network on an unbranded basis. |
(1) The term "crack spread" isWhile the El Dorado refinery has a measuretotal nameplate capacity of 80,000 bpd, in order to qualify for the difference between market prices for crude oil and refined products.small refinery exemption under the EPA’s Renewable Fuel Standards regulations total output cannot exceed 75,000 bpd. We currently expect that the El Dorado refinery’s output will remain under the 75,000 bpd threshold in the current economic environment.
(2) While there is variability in the crude slate and the product output at the El Dorado refinery, we compare our per barrel refined product margin to the U.S. Gulf Coast ("Gulf Coast") 5-3-2 crack spread because we believe it to be the most closely aligned benchmark.
Management's Discussion and Analysis
(3) Our Big Spring refinery is capable of processing substantial volumes of sour crude oil, which has historically cost less than intermediate, and/or substantial volumes of sweet crude oil, and therefore the West Texas Intermediate ("WTI") Cushing/ West Texas Sour ("WTS") price differential, taking into account differences in production yield, is an important measure for helping us make strategic, market-respondent production decisions.
(4) The Krotz Springs refinery has the capability to process substantial volumes of light sweet crude oil to produce a high percentage of refined light products.
Our refining segment also owns and operates three biodiesel facilities involved in the production of biodiesel fuels and related activities, located in Crossett, Arkansas, Cleburne, Texas, and New Albany, Mississippi.
Management's Discussion and Analysis
Our logistics segment (or "Logistics") gathers, transports and stores crude oil and markets, distributes, transports and stores refined products in select regions of the southeastern United States and West Texas for our refining segment and third parties. It is comprised of the consolidated balance sheet and results of operations of Delek Logistics Partners, LP ("Delek Logistics", NYSE:DKL), where we owned an 80.0% interest in Delek Logistics at SeptemberJune 30, 2020.2021. Delek Logistics was formed by Delek in 2012 to own, operate, acquire and construct crude oil and refined products logistics and marketing assets. A substantial majority of Delek Logistics' assets are currently integral to our refining and marketing operations. The logistics segment's pipelines and transportation business owns or leases capacity on approximately 400 miles of crude oil transportation pipelines, approximately 450 miles of refined product pipelines, and an approximately 700-mile900-mile crude oil gathering system and associated crude oil storage tanks with an aggregate of approximately 10.2 million barrels of active shell capacity. Our logistics segmentIt also owns and operates nine light product terminals and markets light products using third-party terminals. The logistics segment alsoLogistics has strategic investments in pipeline joint ventures that provide access to pipeline capacity as well as the potential for earnings from joint venture operations. Additionally, on March 31, 2020, the logistics segment acquired from another of our segments approximately 200 miles of gathering and ancillary assets located in Howard, Borden and Martin Counties, Texas. In May 2020, the logistics segment acquired from another of our segments certain leased and owned tractors and trailers and related assets. The logistics segment owns or leases approximately 273264 tractors and 324353 trailers used to haul primarily crude oil and other products for related and third parties.
Our retail segment (or "Retail") at SeptemberJune 30, 20202021 includes the operations of 253252 owned and leased convenience store sites located primarily in Central and West Texas and New Mexico. Our convenience stores typically offer various grades of gasoline and diesel under the DK or Alon brand name and food products, food service, tobacco products, non-alcoholic and alcoholic beverages, general merchandise as well as money ordersgrams to the public, primarily under the 7-Eleven and DK or Alon brand names pursuant to a license agreement with 7-Eleven, Inc. In November 2018, we terminated the license agreement with 7-Eleven, Inc. This agreement was amended in April 2020 to extend date forand the requiredterms of such termination and subsequent amendment require the removal of all 7-Eleven branding on a store-by-store basis fromby December 31, 2021 to December 31, 2022. As of September 30, 2020, we have removed the 7-Eleven brand name at 57 of our store locations.2023. Merchandise sales at our convenience store sites will continue to be sold under the 7-Eleven brand name until 7-Eleven branding is removed pursuant to the termination. As of June 30, 2021, we have removed the 7-Eleven brand name at 57 of our store locations. Substantially all of the motor fuel sold through our retail segment is supplied by our Big Spring refinery, which is transferred to the retail segment at prices substantially determined by reference to published commodity pricing information. In connection with our retailRetail strategic initiatives, as of September 30, 2020, we have closed or sold 46 under-performing or non-strategic store locations since the fourth quarter of which one was closed during the nine months ended September 30, 2020.2018.
The cost to acquire the refined fuel products we sell to our wholesale customers in our logistics segment and at our convenience stores in our retail segment depends on numerous factors beyond our control, including the supply of, and demand for, crude oil, gasoline and other refined petroleum products which, in turn, depend on, among other factors, changes in domestic and foreign economies, weather conditions, domestic and foreign political affairs, production levels, the availability of imports, the marketing of competitive fuels and government regulation. Our retail merchandise sales are driven by convenience, customer service, competitive pricing and branding. Motor fuel margin is sales less the delivered cost of fuel and motor fuel taxes, measured on a cents per gallon basis. Our motor fuel margins are impacted by local supply, demand, weather, competitor pricing and product brand.
| | |
| Corporate and Other Overview |
Our corporate activities, results of certain immaterial operating segments, including our asphalt terminal operations, our recently commenced wholesale crude operations, and intercompany eliminations are reported in corporate, other and eliminations in our segment disclosures. Additionally, our corporate activities include certain of our commodity and other hedging activities.
Management's Discussion and Analysis
The Company's overall strategy has been to take a disciplined approach that looks to balance returning cash to our shareholders and prudently investing in the business to support safe and reliable operations, while exploring opportunities for growth. Our goal has been to balance the different aspects of this program based on evaluations of each opportunity and how it matches our strategic goals for the company,Company, while factoring in market conditions and expected cash generation.flows.
InHaving taken into account the facesignificance of the economic impact of the COVID-19 Pandemic and the OPEC Production Disputes,production disputes in early 2020, our overall strategy remains unchanged and continuescontinued to be focusedfocus on the following objectives:objectives during the first six months of 2021:
I. Safety and wellness.
II. Reliability and integrity.
III. Systems and processes.
IV. Risk-based decision making.
V. Positioning for growth.
As we look to the remainder of the year and the economic environment that is emerging, and while our core values continue to be the bedrock of the Company's operations and focus, we are actively reviewing our strategies and related operational objectives and will consider the need for changes in order to address the evolving industry and market, while ensuring that we continue to appropriately consider and capitalize on our operational strengths and strategic positioning.
In addition to the above, it continues to be a strategic and operational objective to manage price and supply risk related to crude oil that is used in refinery production, and to develop strategic sourcing relationships. For that purpose, from a pricing perspective, we enter into commodity derivative contracts to manage our price exposure to our inventory positions, future purchases of crude oil and ethanol, future sales of refined products or to fix margins on future production. We also enter into future commitments to purchase or sell renewable identification numbers ("RINs") at fixed prices and quantities, which are used to manage the costs of our credits for commitments required by the U.S. Environmental Protection Agency ("EPA") to blend biofuels into fuel products ("RINs Obligation"). Additionally, from a sourcing perspective, we often enter into purchase and sale contracts with vendors and customers or take financial commodity positions for crude oil that may not be used immediately in production, but that may be used to manage the overall supply and availability of crude expected to ultimately be needed for production and/or to meet minimum requirements under strategic pipeline arrangements, and also to optimize and hedge availability risks associated with crude that we ultimately expect to use in production. Such transactions are inherently based on certain assumptions and judgments made about the current and possible future availability of crude. Therefore, when we take physical or financial positions for optimization purposes, our intent is generally to take offsetting positions in quantities and at prices that will advance these objectives while minimizing our positional and financial statement risk. However, because of the volatility of the market in terms of pricing and availability, it is possible that we may have material positions with timing differences or, more rarely, that we are unable to cover a position with an offsetting position as intended. Such differences could have a material impact on the classification of resulting gains/losses, assets or liabilities, and could also significantly impact net earnings.
With these objectives serving as our guiding principles, we are applying2021 Developments
Our principle focus during 2021 has been to execute on the short-term measures to mitigatefollowing initiatives, consistent with those discussed above in the impactcontext of the COVID-19 Pandemic:
•effectively implementing and executing on our operating cost savings initiatives;
•continuing to be focused on controlling capital expenditures;
•focusing on operating efficiently;
•continuing to position ourselves to manage our supply chain risk, our customer risk and our liquidity sources;
•continuing to maintain a strong retail business; and
•with our sights also set on recovery from the Pandemic and the OPEC Production Disputes described infuture, continuing to explore and investigate potential growth opportunities for midstream or other lines of business.
While, as previously noted above, COVID-19 conditions seem to be improving, we were faced with some unprecedented challenges which required our focus during the 'Business Overview' above. And with these objectives in mind,first half of 2021, including the effects of Winter Storm Uri as well as the El Dorado fire (described above). These events continue to be a significant area of focus as we have achieved the following successescontinue to date in 2020:
2020 Developments
Transactions designed to maximize shareholder return
Dividend Suspension
On November 5, 2020, we announced that we have elected to suspend dividends beginning in the fourth quarter of 2020work on identifying and estimating losses (both realized and incurred and unrealized lost profit) in order to conserve capital. aggressively pursue insurance recoveries under our existing policies. We believe that managing the efforts listed above, plus managing through the disruption caused by these two unexpected events, were critical to managing our results in this continued challenging environment.
Our previous quarterly cash dividend amounts ranged between $0.27 to $0.30 per share for dividends paid throughout 2019RINs cost and was $0.31 per share forRINs Obligation have been negatively impacted during 2021 and as of June 30, 2021 by rapidly escalating RINs prices which resulted from an unfavorable ruling against companies previously granted the dividends paid during each of the three quarterly periods of 2020. The declaration, amount and payment of any future dividends on our common stock will be at the sole discretion of our Board of Directors, and we are not obligated to declare or pay any dividends.EPA's Small Refinery Exemptions (or "SREs") under
Management's Discussion and Analysis
Share Repurchases
During the nine months ended September 30, 2020, Delek repurchased 58,713 sharesRenewable Fuel Standard (the "RFS") which governs RINs volume obligations for an aggregate purchase price of $1.9 million underU.S. hydrocarbon refining companies. Additionally, the most recent share repurchase plan which provided for repurchases of up to $500.0 million and was approved byindustry has been faced with worsening environmental regulatory sentiment in Washington, D.C. following the board on November 6, 2018. As of September 30, 2020, there remained $229.7 million available for repurchases under the most recent repurchase plan. In our efforts to conserve capital, for the time being, we have temporarily suspended the repurchase of shares. However, in light of our November 2020 decision to suspend dividends, we acknowledge that share repurchases could resume and that potential share repurchases would take priority over future dividends or growth capital.
Transactions designed to maximize return on assets
Investment in Midstream Ventures
In July 2019, we acquired a 15% ownership interest in Wink to Webster Pipeline ("WWP"). WWP intends to construct and operate a crude oil pipeline system from Wink, Texas to Webster, Texas along with certain pipelines from Webster, Texas to other destinationschange in the Gulf Coast area. It is expectedpresidential administration in January 2021 has continued to span approximately 650 miles at completion. Under the agreements governing the joint venture, we must contribute our percentage interestput upward pressure on RIN prices. The 10th Circuit Court of the applicable construction costs (including certain costs previously incurred by WWP),Appeals ruling, which was subsequently appealed and it is anticipated that our capital contributions will total approximately $340 million to $380 million over the course of construction (expected to be two to three years). Construction of the crude oil pipeline system remains on schedule, and the main segment of the pipeline system is expected to commence operations in the fourth quarter of 2020, with additional segments expected to be placed in service throughout 2021.
On February 21, 2020, we, through our wholly-owned direct subsidiary Delek Energy, entered into the W2W Holdings LLC ("HoldCo") Agreement with MPLX Operations LLC ("MPLX") (collectively, with its wholly-owned subsidiaries, the "WWP Project Financing Joint Venture" or the "WWP Project Financing JV"). The WWP Project Financing JV was created for the specific purpose of obtaining financing, through its wholly-owned subsidiary, W2W Finance LLC, to fund(for the majority of the period) was waiting to be heard by the U.S. Supreme Court, stalled the approval of 2019 SRE applications already submitted (inclusive of SRE applications for each of our combined capital calls resulting fromfour refineries) and occurring duringled to the construction periodpostponement of 2020 SRE applications. Because of these delays and uncertainties, the EPA issued, by Final Rule, extensions on the compliance deadline under the RFS as well as the deadline for submission of the pipeline system underobligated party attestation reports, as follows: the WWP Joint Venture,2019 compliance deadline was extended to November 30, 2021, and the submission deadline for the related report was extended to serviceJune 1, 2022, for small refineries; and the 2020 compliance deadline was extended to January 31, 2021, and the submission deadline for the related report was extended to June 1, 2022, for small refineries. While the uncertainty regarding the likelihood of SREs persisted, the RINs prices increased significantly, leaving our outlook regarding our ability to capture crack spreads, as well as those of many other downstream companies, also very uncertain. In late June 2021, the U.S. Supreme Court overturned the previous appeals court's ruling regarding RINs, resulting in market optimism that debt.the stalled SRE applications from 2019, as well as new applications for 2020, may be granted, based on the published criteria. Immediately following this ruling, we undertook efforts to prepare 2020 SRE applications for our refineries and we submitted them in August 2021.
While we cannot know the outcome of our SRE applications, we have a history of being granted the waivers for all four refineries, but most often the Krotz Springs and El Dorado refineries. In connection with2018, we were granted SREs for our Tyler, Krotz Springs and El Dorado refineries. Additionally, while our current Net RINs Obligation reflects current RINs market prices as of June 30, 2021, the arrangement,financial statement impact, including both Delek Energythe income statement and MPLX contributed their respective 15% ownership interestsnet cash impact, of any future receipt of SRE(s) is not determinable because of the complexity of the Net RINs Obligation and related transactions, where such financial statement impact is dependent upon the following: (1) which refineries receive exemptions; (2) the composition of those specific Net RINs Obligation (in terms of the vintages of RINs we currently own versus the waived RINs Obligation) and the related market prices at the date each exemption is granted; (3) the composition of our RINs forward commitment contracts that may be settled or positions closed as a result of any exemption and the related gains or losses; (4) the settlement requirements of related RINs product financing arrangements; and (5) the quantity of and dates at which excess RINs can be sold and the sales price (see also Note 9, Note 10 and Note 14 to the WWP Project Financing JVcondensed consolidated financial statements included as collateral for andwell as our related accounting policies related to RINs included in service of the related project financing. Accordingly, distributions received from WWP through the WWP Project Financing JV will first be applied in service of the related project financing debt, with excess distributions being madeNote 2 to the members of the WWP Project Financing JV as provided for in the W2W Holdings LLC Agreement and as allowed under the project financing debt. The obligations of the members under the W2W Holdings LLC Agreement are guaranteed by the parents of the members of the WWP Project Financing JV (i.e., for the Delek member, the guarantee is from Delek US Holdings, Inc.). Our investment is accounted for as an equity method investment.
See further discussion in Note 5 of our condensedaudited consolidated financial statements included in Item 1.8. Financial Statements and Supplementary Data, of our December 31, 2020 Annual Report on Form 10-K). We note that our total gross RINs Obligation for 2020, for all four refineries, was approximately 340 million RINs, across several RIN categories, and that receipt of any SREs could result in significant benefit, both in terms of income statement effect and cash flows.
Regardless of whether we expect to be granted SREs, we continue to actively manage our RINs inventory portfolio as well as monitor prices and positions on existing and expected RINs Obligations to mitigate our income statement and cash flow exposure. See additional discussion of the effect of RINs prices and volatility on our refining margins in the "Market Trends" section below.
In addition to these management efforts, we successfully executed on several strategic opportunities as described below.
Delek US Holdings, Inc. Employee Stock Purchase Plan
In June 2021, the Company's board of directors adopted the Delek US Holdings, Inc. Employee Stock Purchase Plan (the "ESPP"). The ESPP is structured as a qualified employee stock purchase plan. The Company authorized the issuance of 2,000,000 shares of common stock under the ESPP. On each purchase date, eligible employees (as defined in the ESPP) can purchase the Company's stock at a price per share equal to 85.0% of the closing price of the Company's common stock on the exercise date, but no less than par value. There are four offering periods of three months during each fiscal year, beginning each January 1st, April 1st, July 1st, and October 1st. (See further discussion in Note 15 to our Condensed Consolidated Financial Statements included in Part I, Item 1 of this Quarterly Report on Form 10-Q.10-Q).
Increased Investment in Delek Logistics
Effective August 13, 2020, Delek Logistics completed a restructuring transaction to eliminate the incentive distribution rights held by us and convert the 2.0% economic general partner interest into a non-economic general partner interest, in exchange for a total consideration consisting of $45.0 million in cash and 14.0 million newly issued common limited partner units. Contemporaneously, we repurchased 5.2% ownership interest in2028 Notes
On May 24, 2021, Delek Logistics GP LLC, the general partner, from our affiliates, who are also members of the general partner's management and board of directors, for $23.1 million in cash. Subsequent to these transactions, we owned 34,745,868 common limited partner units increasing our ownership to 80.0% of the outstanding common units, and 100% of the outstanding interest in the general partner, Delek Logistics GP, LLC.
Effective May 1, 2020, Delek through its wholly owned subsidiaries Lion Oil Companysubsidiary Delek Logistics Finance Corp. (“Lion Oil”)Finance Corp.” and together with Delek Refining, Ltd. (“Delek Refining”) contributed certain leased and owned tractors and trailers and related assets used inLogistics, the provision of trucking and transportation services for crude oil, petroleum and certain other products throughout Arkansas, Oklahoma and Texas to Delek Trucking, LLC (“Delek Trucking”“Co-issuers”), a direct wholly owned subsidiary of Lion Oil. Following this contribution, Lion Oil sold all$400.0 million in aggregate principal amount of the issued and outstanding membership interests inCo-issuers 7.125% Senior Notes due 2028 (the “Delek Logistic 2028 Notes”) at par, pursuant to an indenture with U.S. Bank, National Association as trustee. The Delek Trucking (the “Acquisition”) to DKL Transportation, LLC (“DKL Transportation”), a wholly owned subsidiary of Delek Logistics. Promptly following the consummationLogistics 2028 Notes are general unsecured senior obligations of the Acquisition, Delek Trucking merged withCo-issuers and into DKL Transportation, with DKL Transportation continuing asare unconditionally guaranteed jointly and severally on a senior unsecured basis by the surviving entity. Total consideration forGuarantors and will be unconditionally guaranteed on the Acquisition was approximately $48.0 million in cash, subject tosame basis by certain post-closing adjustments, primarily financed with borrowings underof the Delek Logistics’ revolving credit facility.future subsidiaries. The Delek Logistic 2028 Notes rank equal in right of payment with all existing and future senior indebtedness of the Co-issuers, and senior in right of payment to any future subordinated indebtedness of the Co-issuers. The Delek Logistic 2028 Notes will mature on June 1, 2028, and interest is payable semi-annually in arrears on each June 1 and December 1, commencing December 1, 2021. (See further discussion in Note 8 to our Condensed Consolidated Financial Statements included in Part I, Item 1 of this Quarterly Report on Form 10-Q).
Effective March 31, 2020, Delek Logistics, through its wholly-owned subsidiary DKL Permian Gathering, LLC, acquired the Big Spring Gathering System, located in Howard, Borden and Martin Counties, Texas, from Delek. Delek Logistics will operate and maintain the Big Spring Gathering System connecting our interests in and to certain crude oil production with the Delek Logistics' Big Spring, Texas terminal and provide gathering, transportation and other related services. The total consideration was subject to certain post-closing adjustments and was comprised of $100.0 million in cash and 5.0 million common units representing limited partner interest in Delek Logistics. The
Management's Discussion and Analysis
cash component of this dropdown was financed with borrowings on the Delek Logistics Credit Facility (as defined in Note 8 of our condensed consolidated financial statements included in Item 1. Financial Statements).
Additionally, in March 2020, we purchased 451,822 of Delek Logistics limited partner units from a public investor for approximately $5.0 million. As a result of these transactions, our ownership in Delek Logistics' common limited partner units was increased to 70.5% at that time. These continued investments enhance our ability to maximize the value of our logistics assets.
See further discussion in Note 4 of our condensed consolidated financial statements included in Item 1. Financial Statements, of this Quarterly Report on Form 10-Q.
Sale of Bakersfield Non-Operating Refinery
On May 7, 2020, we sold our equity interests in Alon Bakersfield Property, Inc., an indirect wholly-owned subsidiary that owns our non-operating refinery located in Bakersfield, California, to a subsidiary of Global Clean Energy Holdings, Inc. (“GCE”) for total cash consideration of $40 million. GCE intends to repurpose the refinery into a renewable diesel plant. As part of the transaction, GCE granted a call option to Delek to acquire up to a 33 1/3% interest in the acquiring subsidiary, GCE Acquisitions, exercisable by Delek through the 90th day after GCE demonstrates commercial operations, as contractually defined.
See further discussion in Note 2 of our condensed consolidated financial statements included in Item 1. Financial Statements, of this Quarterly Report on Form 10-Q.
Transactions designed to minimize the cost of capital/manage financial risk exposures
2020 Amendments toExclusive Supply and Offtake AgreementsAgreement
In January 2020,May 2021, we amended our three Supplyexecuted an exclusive supply and Offtake Agreementsstrategic relationship agreement with J. AronBaker Petrolite LLC (an affiliate of Baker Hughes Company) ("Baker"). The agreement provides that, under certain circumstances, Baker will supply certain chemicals exclusively to us within a defined territory. Those chemicals allow us, through blending competencies utilizing proprietary intellectual property, to clarify slurry which applies to the El Dorado refinery, the Big Spring refinery and the Krotz Springs refinery so that the repurchase of Baseline Volumes at the end of the Supply and Offtake Agreement term (representing the "Baseline Step-Out Liability" or, collectively, the "Baseline Step-Out Liabilities") will be based on market-indexed price subject to commodity price risk with corresponding changes to underlying market-based indices and certain differentials. The amendments resulted in Baseline Step-Out Liabilities for which the fair value is no longer subject to interest rate risk but is now subject to commodity price volatility.
In April 2020, we amended and restated our three Supply and Offtake Agreements to amend and extend the terms to December 30, 2022, with J. Aron having the sole discretion to further extend to May 30, 2025 by providing at least six months notice prior to the maturity date. As part of this amendment, there were changes to the underlying market index, annual fee, the crude purchase fee, crude roll fees and timing of cash settlements related to periodic price adjustments on the fixed differential component of the Baseline Volume Step-Out Liabilities. The amendments provide us dedicated financing for the barrels covered through at least December 2022, and certain specific market-indexed provisions improve our ability to manage our exposure to commodity price volatility during the term of the Agreements.
See further discussion in Note 7 of our condensed consolidated financial statements included in Item 1. Financial Statements, of this Quarterly Report on Form 10-Q.
2020 Amendment to the Term Loan Credit Facility
On May 19, 2020, we amended the Term Loan Credit Facility agreement (as defined in Note 8 of our condensed consolidated financial statements included in Item 1. Financial Statements) and borrowed $200.0 million in aggregate principal amount of incremental term loans (the “Third Incremental Term Loan”) at an original issue discount of 7.00%, requiring quarterly principal amortization payments of $0.5 million commencing with June 30, 2020. The Third Incremental Term Loan constitutes a separate class of term loans under the Term Loan Credit Facility from those initially borrowed in March 2018 and the incremental term loans borrowed in May 2019 and November 2019. There are no restrictions on the Company's use of the proceeds of the Third Incremental Term Loan, and the proceeds maycan then be used (i) for general corporate purposesin International Maritime Organization-compliant products. The agreement has a 5-year initial term and (ii) to pay transaction fees and expenses associated with the Third Incremental Term Loan.
See further discussion in Note 8 of our condensed consolidated financial statements included in Item 1. Financial Statements, of this Quarterly Report on Form 10-Q.
Management's Discussion and Analysis
a 5-year extension option.Market Trends
Our results of operations are significantly affected by fluctuations in the prices of certain commodities, including, but not limited to, crude oil, gasoline, distillate fuel, biofuels, natural gas and electricity, among others. Historically, our profitability has been affected bythe impact of commodity price volatility on our refining margins (as defined in our "Non-GAAP Measures" in MD&A Item 2.), specifically as it relates to the price of crude oil as compared to the price of refined products and refined products. Wetiming differences in the movements of those prices (subject to our inventory costing methodology), as well as location differentials, may be favorable or unfavorable compared to peers. Additionally, our refining margin profitability is impacted by regulatory factors, including the cost of RINs.
During the first half of 2021, despite improved consumer demand resulting from stabilization in cases during much of the period and across much of the country, and corresponding to the availability of vaccines, improvements in domestic refining margins have been slow. This is largely attributable to the increasing supply from international markets where consumer demand improvement has lagged behind the U.S and, similarly, the closing of much of the U.S. export arbitrage. The U.S. market for transportation fuels has attracted higher infusion of international supply due in part to supply disruptions in the U.S. that occurred during the first six months of 2021. In February 2021, the operations of many U.S. refineries, including ours, were temporarily disrupted due to the negative effects arising out of Winter Storm Uri. This contributed to a significant sourcesdepletion of transportation fuel inventories throughout much of the country. Additionally, in May 2021, there was a cybersecurity incident with the Colonial Pipeline which resulted in pipeline shutdowns that interrupted supply to much of the eastern U.S. for six days, and which caused disruption for Delek primarily at our Krotz Springs refinery. As a result of both of these events, the U.S. market attracted higher levels of supply from international markets, which diluted price increases and associated refining margins.
Furthermore, while there have been improving crack spreads during 2021, driven largely by the improvement in domestic consumer demand and the modest economic improvement and outlook associated with stabilizing Pandemic uncertainties, the ability of U.S. refiners to capture those improvements were significantly dampened by sharply increasing RIN prices. As previously discussed, the RINs market was impacted by last year's judicial rulings imposing limitations on smaller refinery's abilities to qualify for the EPA's SREs under the RFS, combined with worsening environmental regulatory sentiment coming out of Washington, D.C.. These conditions were pervasive for the majority of the first half of 2021. Following the June 2021 U.S. Supreme Court reversal of the lower court's ruling, however, there was a notable improvement in market optimism that existing SRE applications from 2019, as well as new applications for 2020, may be granted. While it is possible that SREs may be granted before the extended compliance deadlines, refining companies in the U.S. likely will not see much impact to RINs prices and, accordingly, refining margins until the EPA actually begins granting SREs on a relatively widespread basis.
See below for further discussion on how certain key market trends impact our refining margins.
WTI Midland crude becauseoil represents the largest component of our crude slate at all of our refineries, and can be sourced through our gathering system, and so accordingly favorable pricing of WTIchannels or optimization efforts from Midland, crude compared to other WTI crude can favorably impact our cost of materials and other and therefore our margins compared to other refiners.
Texas or Cushing, Oklahoma. The table below reflects the quarterly average prices of WTI Midland and WTI Cushing crude oil for each of the quarterly periods in 20192020 and for the threetwo quarterly periods in 2020.2021. As shown in the historical graph, WTI Midland crude prices have generally beencan be favorable or unfavorable as compared to WTI Cushing, though that trend has reversed slightly in the fourth quarter 2019 and the third quarter of 2020.Cushing.
Crack spreads are used as benchmarks for predicting and evaluating a refinery's product margins by measuring the difference between the market price of feedstocks and crude oil and refined products. Generally, crack spreads represent the approximate refining margin resulting from processing one barrel of crude oil into its outputs, generally gasoline and diesel fuel.
The table below reflects the quarterly average Gulf Coast 5-3-2 Ultra Low Sulfur Diesel ("ULSD"), 3-2-1 and 2-1-1 crack spreads for each of the quarterly periods in 2019 and for the three quarterly periods in 2020. As the chart illustrates, the 3-2-1 crack spread has consistently outperformed the 5-3-2 and the 2-1-1 crack spreads. In such conditions, things being equal (i.e., near-capacity throughputs and no significant outages), our Big Spring refinery, whose benchmark is the 3-2-1 crack spread, should outperform our other refineries in terms of refining margin.
Management's Discussion and Analysis
| | | | | | |
| Crude Pricing Differentials | | | | |
| | | | |
| | | | |
| | | | |
| | | | |
| | | | |
| | | | |
| | | | |
| | | | |
| | | | |
As U.S. crude oil production has increased over recent years, domestic refiners have benefited from the discount for WTI Cushing compared to Brent ("Brent"), a global benchmark crude. This generally leads to higher margins in our refineries, as refined product prices are influenced by Brent crude prices and the majority of our crude supply is WTI-linked. Because of our positioning in the Permian basin, including our access to significant sources of WTI Midland crude through our gathering system, we are even further benefited by discounts for WTI Midland/WTI Cushing differentials. When these discounts shrink or become premiums, our reliance on WTI-linked crude pricing, and specifically WTI Midland crude, can negatively impact our refining margins. Conversely, as these price discounts widen, so does our competitive advantage, created specifically by our access to WTI Midland crude sourced through our gathering systems.
The chart below illustrates the differentials of both Brent crude oil and WTI Midland crude oil as compared to WTI Cushing crude oil as well as WTI Cushing as compared to Louisiana Light Sweet crude oil ("LLS") for each of the quarterly periods in 2020 and for the two quarterly periods in 2021.
Our refineries produce the following products:
| | | | | | | | | | | | | | |
| Tyler Refinery | El Dorado Refinery | Big Spring Refinery | Krotz Springs Refinery |
| Primary Products | Gasoline, jet fuel, ultra-low-sulfur diesel, liquefied petroleum gases, propylene, petroleum coke and sulfur | Gasoline, ultra-low-sulfur diesel, liquefied petroleum gases, propylene, asphalt and sulfur | Gasoline, jet fuel, ultra-low-sulfur diesel, liquefied petroleum gases, propylene, aromatics and sulfur | Gasoline, jet fuel, high-sulfur diesel, light cycle oil, liquefied petroleum gases, propylene and ammonium thiosulfate |
The charts below illustrate the quarterly average prices of Gulf Coast Gasoline (CBOB), U.S. High Sulfur Diesel ("HSD") and U.S. Ultra Low Sulfur Diesel for each of the quarterly periods in 2019 and for the three quarterly periods in 2020.
| | | | | | |
Crude Pricing Differentials | | | | |
| | | | |
| | | | |
| | | | |
| | | | |
| | | | |
| | | | |
| | | | |
| | | | |
| | | | |
As U.S. crude oil production has increased over recent years, domestic producers have benefited from the discount for WTI Cushing compared to Brent, a global benchmark crude. This generally leads to higher margins in our refineries, as refined product prices are influenced by Brent crude prices and the majority of our crude supply is WTI-linked. Because of our positioning in the Permian basin, we are even further benefited by discounts in the WTI Midland/WTI Cushing differential. When these discounts shrink or become premiums, our reliance on WTI-linked crude pricing, and specifically WTI Midland crude can negatively impact our results. Conversely, as these price discounts increase, so does our competitive advantage, created by our access to WTI-linked crude oil pricing, and specifically WTI Midland crude sources through our gathering systems.
The chart below illustrates the differentials of both Brent crude oil and WTI Midland crude oil as compared to WTI Cushing crude oil as well as WTI Cushing as compared to Louisiana Light Sweet crude oil ("LLS"ULSD") for each of the quarterly periods in 20192020 and for the threetwo quarterly periods in 2020.2021.
Management's Discussion and Analysis
Crack spreads are used as benchmarks for predicting and evaluating a refinery's product margins by measuring the difference between the market price of feedstocks/crude oil and the resultant refined products. Generally, a crack spread represents the approximate refining margin resulting from processing one barrel of crude oil into its outputs, generally gasoline and diesel fuel.
The table below reflects the quarterly average Gulf Coast 5-3-2 ULSD, 3-2-1 and 2-1-1 crack spreads for each of the quarterly periods in 2020 and for the two quarterly periods in 2021. As the chart illustrates, the 3-2-1 crack spread has consistently outperformed the 5-3-2 and the 2-1-1 crack spreads. When market conditions consist of near-capacity throughputs and no significant outages, our Big Spring refinery, whose benchmark is the 3-2-1 crack spread, should outperform our other refineries in terms of refining margin, which are benchmarked against either the 5-3-2 or the 2-1-1 crack spreads.
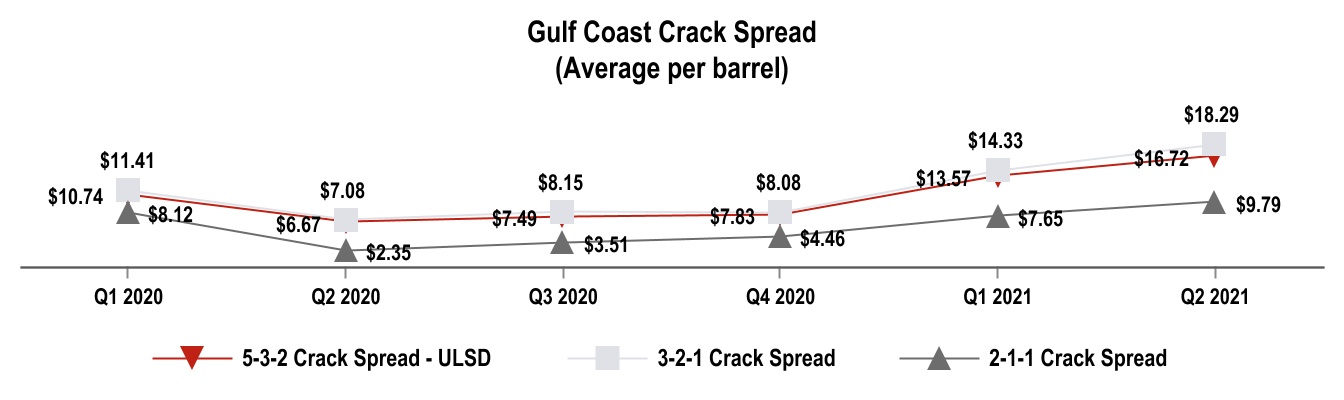
Environmental regulations and the political environment continue to affect our refining margins in the form of volatility in the cost of RINs. On a consolidated basis, we work to balance the cost of our RINs Obligation in order to minimize the effect of RINs on our results. While we generate RINs in both our refining and logistics segments through our ethanol blending and biodiesel production and blending, our refining segment still needs to purchase additional RINs to satisfy its obligations. AsThe cost to purchase these additional RINs is a result,significant cash outflow for our business. Additionally, increases in the pricemarket prices of RINs generally adversely affect our results of operations. Itoperations through changes in fair value to our existing RINs Obligation, to the extent we do not have offsetting RINs inventory on hand or effective economic hedges through net forward purchase commitments. The volatility of RINs prices is highly sensitive to regulatory and political influence and conditions, and therefore often does not correlate to movements in crude oil prices, refined product prices or crack spreads. Additionally, the pricing of RINs and the resulting impact on a refiner's margins is dependent on the type of refined product produced. Furthermore, RIN prices are impacted by market expectations regarding whether the EPA may grant certain SREs. The 2020 unfavorable SRE judicial rulings, as well as the recent changes in regulatory sentiment following the presidential administration change, have caused significant increases in RINs prices to levels not seen in many years. Because of the volatility in RINs prices, it is not possible at this time to predict future RINs cost with certainty, what future volumes or costs may be, but given the volatile price of RINs, the cost of purchasing sufficient RINs couldand movements in RIN prices can have ansignificant and unanticipated adverse impacteffects on our results of operations if werefining margins that are unable to recover those costs in the priceoutside of our refined products. control.
The chart below illustrates the volatility in RINs prices over several quarterly periods, beginning with the first quarter of 20192020 through the thirdsecond quarter of 2020.2021.
Management's Discussion and Analysis
Contractual Obligations
Information regarding our known contractual obligations and commercial commitments of the types described below as of SeptemberJune 30, 2020,2021, is set forth in the following table (in millions):
| | | Payments Due by Period | | Payments Due by Period |
| | <1 Year | | 1-3 Years | | 3-5 Years | | >5 Years | | Total | | <1 Year | | 1-3 Years | | 3-5 Years | | >5 Years | | Total |
| Long term debt and notes payable obligations | Long term debt and notes payable obligations | | $ | 33.4 | | | $ | 986.0 | | | $ | 1,487.3 | | | $ | — | | | $ | 2,506.7 | | Long term debt and notes payable obligations | | $ | 46.4 | | | $ | 353.8 | | | $ | 1,477.5 | | | $ | 400.0 | | | $ | 2,277.7 | |
Interest(1) | Interest(1) | | 84.4 | | | 161.2 | | | 82.0 | | | — | | | 327.6 | | Interest(1) | | 94.4 | | | 176.0 | | | 101.8 | | | 57.0 | | | 429.2 | |
Operating lease commitments(2)(6) | Operating lease commitments(2)(6) | | 54.8 | | | 73.5 | | | 39.9 | | | 51.8 | | | 220.0 | | Operating lease commitments(2)(6) | | 127.4 | | | 385.5 | | | 172.3 | | | 149.4 | | | 834.6 | |
Purchase commitments(3) | | 562.2 | | | — | | | — | | | — | | | 562.2 | | |
| Product financing commitments(3) | | Product financing commitments(3) | | 358.8 | | | — | | | — | | | — | | | 358.8 | |
Transportation agreements(4) | Transportation agreements(4) | | 124.8 | | | 244.7 | | | 129.1 | | | 75.3 | | | 573.9 | | Transportation agreements(4) | | 138.4 | | | 222.4 | | | 189.0 | | | 80.8 | | | 630.6 | |
J. Aron supply and offtake obligations (5) | J. Aron supply and offtake obligations (5) | | 15.5 | | | 239.8 | | | — | | | — | | | 255.3 | | J. Aron supply and offtake obligations (5) | | 15.5 | | | 336.8 | | | — | | | — | | | 352.3 | |
| Total | Total | | $ | 875.1 | | | $ | 1,705.2 | | | $ | 1,738.3 | | | $ | 127.1 | | | $ | 4,445.7 | | Total | | $ | 780.9 | | | $ | 1,474.5 | | | $ | 1,940.6 | | | $ | 687.2 | | | $ | 4,883.2 | |
(1) Expected interest payments on debt outstanding at SeptemberJune 30, 2020.2021. Floating interest rate debt is calculated using SeptemberJune 30, 20202021 rates. For additional information, see Note 8 of our condensed consolidated financial statements included in Item 1. Financial Statements, of this Quarterly Report on Form 10-Q.
(2) Amounts reflect future estimated lease payments under operating leases having remaining non-cancelable terms in excess of one year as of SeptemberJune 30, 2020.2021.
(3) We have supply agreements to secure certain quantitiesBalances consist of crude oil, finishedcontractual obligations under RINs product and other resources used in production at both fixed and market prices. We have estimated future payments under the market-based agreements using current market rates. Excludes purchase commitments in buy-sell transactions which have matching notional amounts with the same counterparty and are generally net settled.financing arrangements.
(4) Balances consist of contractual obligations under agreements with third parties (not including Delek Logistics) for the transportation of crude oil to our refineries.
(5) Balances consists of contractual obligations under the J. Aron Supply and Offtake Agreements, including annual fees and principal obligation for the Baseline Volume Step-Out Liability. For additional information, see Note 7 of our condensed consolidated financial statements included in Item 1. Financial Statements, of this Quarterly Report on Form 10-Q.
(6) Includes an immaterial amount of financing lease cost.
Critical Accounting Policies
The preparation of our condensed consolidated financial statements requires us to make estimates and judgments that affect the reported amounts of assets, liabilities, revenues and expenses and related disclosure of contingent assets and liabilities. The SEC has defined critical accounting policies as those that are both most important to the portrayal of our financial condition and results of operations, and require our most difficult, subjective or complex judgments or estimates. Based on this definition and as further described in our 20192020 Annual Report on Form 10-K, we believe our critical accounting policies include the following: (i) estimating our quarterly inventory adjustments using the last-in, first-out valuation method for the Tyler refinery, (ii) evaluating impairment for property, plant and equipment and definite life intangibles, (iii) evaluating potential impairment of goodwill, (iv) estimating environmental expenditures, and (v) estimating asset retirement obligations.
During Additionally, we have identified the nine months ended September 30, 2020, we updated our critical accounting policies to include accounting policies that have become critical as a result of new transactions. Accordingly, we are adding afollowing critical accounting policy that impacts the six months ended June 30, 2021:
Under Accounting Standards Codification ("ASC") 740, Income Taxes (“ASC 740”), we use an estimated annual effective tax rate ("AETR") to record income taxes. The development of the estimated AETR involves significant judgment, particularly early in the year and in times of economic uncertainty. As of and during the six months ended June 30, 2021, our estimates of the expected AETR reflected inputs which are subject to judgment including (but not necessarily limited to) the following:
•Forecasted pre-tax GAAP income or loss for the year
•Estimates of expected permanent differences in GAAP income or loss and taxable income or loss for the year
•Forecasted capital expenditures for the year and future years (where such activities were significantly impacted by the recent weather event and can likewise be impacted by unanticipated events)
•Expected applicable jurisdictional tax rates
•Estimated impact of possible deduction and tax credit limitations
•Estimates regarding net operating losses, carryback and carryforward provisions (and limitations) and valuation allowances
All of these inputs are subject to significant judgment and assumptions about future events impacting 2021, some of which are based on historical trends and results, operational plans, and projections regarding future pricing and profitability (where we utilize third party forward curves and pricing sources, where possible, but where expectations regarding capture rates and other factors involve judgment). We also note that, while economic conditions affecting our industry and industry outlooks related to evaluating variable interest entitiesCOVID-19 are stabilizing and improving, there remains a level of uncertainty related to reflect the significant judgment that is involved when determining whether an entity is a variable interest entity ("VIE") and evaluating whether we are the primary beneficiary in connection with our new investment in W2W Holdings LLC. See Note 5 of the condensed consolidated financial statements in Item 1. Financial Statements, for discussion of our investment in W2W Holdings LLCCOVID-19 and the related accounting treatment.
Evaluationexpectations for recovery that increases the level of Variable Interest Entities
Our consolidated financial statements includejudgment involved with some of these assumptions. Accordingly, where appropriate, we may consider the financial statementsprobability of our subsidiaries and VIEs, of which we are the primary beneficiary. We evaluate all legal entities in which we hold an ownership or other pecuniary interest to determine if the entity is a VIE. Variable interests can be contractual, ownership or other pecuniary interests in an entity that change with changes in the fair value of the VIE’s assets. If we are not the primary beneficiary, the general partner or another limited partner may consolidate the VIE, and we record the investment as an equity method investment. Significant judgment is exercisedcertain components in determining that a legal entity is a VIE and in evaluating whether we are the primary beneficiary in a VIE. Generally, the primary beneficiary is the party that has both the power to direct the activities that most significantly impact the VIE’s economic performance and the right to receive benefits or obligation to absorb losses that could be potentially significant to the VIE. We evaluate the entity’s need for continuing financial support; the equity holder’s lack of a controlling financial interest; and/or if an equity holder’s voting interests are disproportionate to its obligation to absorb expected losses or receive residual returns. We evaluate our interests in a VIE to determine whether we are the primary beneficiary. We use a primarily qualitative analysis to determine if we are deemed to have a controlling financial interest in the VIE, either on a standalone basis or as part of a related party group. We continually monitor our interests in legal entities for changes in the design or activities of an entity and changes in our interests, including our status as the primary beneficiary to determine if the changes require us to revise our previous conclusions.what
Management's Discussion and Analysis
Additionally, duewe believe to the economicbe a reasonable estimate based on conditions and industry impact of the COVID-19 Pandemic and the OPEC Production Disputes, we also modified the application of certain of our critical accounting policies during andevents that were in existence as of the nine months ended September 30, 2020 as follows:
Goodwill and Potential Impairment
Our annual goodwill impairment analysis is performed during the fourth quarter of each year. Under Accounting Standards Codification ("ASC") ASC 350, Intangibles - Goodwill and Other, goodwill of a reporting unit shall be tested for impairment between annual tests if an event occurs or circumstances change that would more likely than not reduce the fair value of a reporting unit below its carrying amount.
In our assessment of the potential indicators of impairment, we considered the continued impact of the COVID-19 pandemic, including the significant decline in our stock price. We noted a decline in our stock price, which resulted in a decline in our market capitalization since June 30, 2020. To determine whether the decline in market capitalization and other negative developments arising due to the Pandemic that occurred through September 30, 2020, would more likely than not reduce the fair value of a reporting unit below its carrying amount, we performed certain analyses on the most significant inputs in our valuation model to evaluate the impact of these events on the fair value of our reporting units. Based ondate, which may also involve the use of significant management judgment. Furthermore, many of our initial qualitative analysis, we noted that the refining segment was most at risk for potential impairment. Therefore, we performed extensive additional sensitivity analysis and stress testing on certainassumptions are inter-relational, where changing one assumption can impact other assumptions (e.g., in terms of the key assumptions our valuation model.applicability of or limitations under various tax code provisions).
BasedThe nature of the AETR estimation approach for recording income taxes requires continuous review and adjustment during the year based on our analyses, we determined that there was sufficient risk present associated with both our Big Spring refinery (“BSR”)actual results, and Krotz Springs refinery (“KSR”) reporting units to indicate that the fair values of those reporting units were more likely than not to have declined below the carrying value as of September 30, 2020. Accordingly, we updated our estimates of fair value for the BSR and KSR reporting units as of September 30, 2020, using updated inputsbetter information regarding forecasted results and assumptions based on third party data wherebecomes available. The estimated fair valuesSignificant changes in any of the reporting units were determined using a combination of a discounted cash flow ("DCF") analysisthese assumptions or in actual results compared to our forecasts and a market approach. The DCF analysis was based onassumptions could cause material changes in our current projection of cash flowsAETR, which reflected our updated estimates for long-term growth rates, gross margin, capital expenditures and the Weighted Average Cost of Capital or "WACC", which we adjustedcould result in cumulative adjustments to reflect the uncertainties that existnew estimates in the market as a result of the Pandemic. For the market approach, we applied an average historical multiple for guideline companies to estimated income before taxes, interest, depreciation,future periods.
We have developed and amortization. Our analysis included a reconciliation of the estimated fair value of all reporting units to the company’s market capitalization. Based on these quantitative analyses, we concluded that the goodwill balances attributed to the BSRutilized methodologies and KSR reporting unit were not impaired as of September 30, 2020. The fair value measurementsrationales for the individual reporting units’development of our assumptions, subject to internal controls and sensitivity or probability assessments, as appropriate, and we believe our process provides a reasonable basis for our estimated fair values represent Level 3 measurements.
We performed a sensitivity analysis on our impairment test as of September 30, 2020, noting the following:
| | | | | | | | | | | | | | |
| | | Sensitivity |
| Total Goodwill Balance at September 30, 2020 | % Estimated Fair Value exceeds Carrying Value | Increase in WACC that could cause impairment (1) | Decrease in long-term growth rate that could cause impairment (1) |
| BSR | $528.0 | < 10% | 0.5%-1.0% | 1% |
| KSR | 237.2 | <10% | 1.0%-1.5% | 1% |
| | | | |
| (1) Assumes no other changes in any of the key assumptions. |
Fair value determinations require considerable judgment and are sensitive to changes in underlying assumptions and factors. As a result, there can be no assurance that the estimates and assumptions made for purposes of the interim goodwill impairment test will prove to be an accurate prediction of the future.
Our assessment was performed based on events that had occurred and conditions that existed as of September 30, 2020. Because conditions and events are rapidly changing, we continue to monitor developments with these events and their impact on our valuation. Continued or worsening adverse changes to these factors,AETR as well as their impact on our cash flows, market capitalization and other assumptions and inputs, may result in the need to recognize an impairment in future periods. Specifically with respect to the BSR and KSR reporting units, it is at least reasonably possible that continued or worsening adverse change to these factors, or the presence of new factors having a negative impact on our projection of future cash flows not knownincome taxes as of Septemberand for the six months ended June 30, 2020, may result in a future impairment which could be material. We will perform our annual goodwill assessment during the fourth quarter.
Other than as described above, for all financial statement periods presented, there have been no material modifications to the application of these critical accounting policies or estimates since our most recently filed Annual Report on Form 10-K. See Note 1 of the condensed consolidated financial statements in Item 1. Financial Statements, for discussion of updates to our accounting policies.
Management's Discussion and Analysis
2021.Non-GAAP Measures
Our management uses certain “non-GAAP” operational measures to evaluate our operating segment performance and non-GAAP financial measures to evaluate past performance and prospects for the future to supplement our GAAP financial information presented in accordance with U.S. GAAP. These financial and operational non-GAAP measures are important factors in assessing our operating results and profitability and include:
•Refining margin - calculated as the difference between net refining revenues and total cost of materials and other;
•Refined product margin - calculated as the difference between net revenues attributable to refined products (produced and purchased) and related cost of materials and other (which is applicable to both the refining segment and the westWest Texas wholesale marketing activities within our logistics segment); and
•Refining margin per barrels sold - calculated as refining margin divided by our average refining sales in barrels per day (excluding purchased barrels) multiplied by 1,000 and multiplied by the number of days in the period.
We believe these non-GAAP operational and financial measures are useful to investors, lenders, ratings agencies and analysts to assess our ongoing performance because, when reconciled to their most comparable GAAP financial measure, they provide improved comparability between periods through the exclusion of certain items that we believe are not indicative of our core operating performance and theythat may obscure our underlying results and trends.
Non-GAAP measures have important limitations as analytical tools, because they exclude some, but not all, items that affect net earnings and operating income. These measures should not be considered substitutes for their most directly comparable U.S. GAAP financial measures.
Non-GAAP Reconciliations
The following table provides a reconciliation of refining margin to the most directly comparable U.S. GAAP measure, gross margin:
Reconciliation of refining margin to gross margin
| | Refining Segment | Refining Segment | Refining Segment |
| | Three Months Ended September 30, | | Nine Months Ended September 30, | | Three Months Ended June 30, | | Six Months Ended June 30, |
| | 2020 | | 2019 | | 2020 | | 2019 | | 2021 | | 2020 | | 2021 | | 2020 |
| Net revenues | Net revenues | | $ | 1,563.5 | | | $ | 2,176.8 | | | $ | 4,368.4 | | | $ | 6,636.6 | | Net revenues | | $ | 2,415.7 | | | $ | 1,077.0 | | | $ | 4,155.8 | | | $ | 2,804.9 | |
| Cost of sales | Cost of sales | | 1,631.6 | | | 2,061.3 | | | 4,749.2 | | | 6,085.4 | | Cost of sales | | 2,486.6 | | | 1,062.1 | | | 4,300.0 | | | 3,117.6 | |
| Gross margin | Gross margin | | (68.1) | | | 115.5 | | | (380.8) | | | 551.2 | | Gross margin | | (70.9) | | | 14.9 | | | (144.2) | | | (312.7) | |
| Add back (items included in cost of sales): | Add back (items included in cost of sales): | | | | | | Add back (items included in cost of sales): | | | | | |
| Operating expenses (excluding depreciation and amortization) | Operating expenses (excluding depreciation and amortization) | | 102.1 | | | 120.7 | | | 302.5 | | | 356.7 | | Operating expenses (excluding depreciation and amortization) | | 113.8 | | | 88.7 | | | 227.4 | | | 200.4 | |
| Depreciation and amortization | Depreciation and amortization | | 50.3 | | | 34.6 | | | 132.3 | | | 98.9 | | Depreciation and amortization | | 51.0 | | | 44.8 | | | 103.1 | | | 82.0 | |
| Refining margin | Refining margin | | $ | 84.3 | | | $ | 270.8 | | | $ | 54.0 | | | $ | 1,006.8 | | Refining margin | | $ | 93.9 | | | $ | 148.4 | | | $ | 186.3 | | | $ | (30.3) | |
Management's Discussion and Analysis
Summary Financial and Other Information
The following table provides summary financial data for Delek:
Summary Statement of Operations Data (in millions)(1)
| | Consolidated | Consolidated | Consolidated |
| | Three Months Ended | | Nine Months Ended | | Three Months Ended | | Six Months Ended |
| | September 30, | | September 30, | | June 30, | | June 30, |
| | 2020 | | 2019 | | 2020 | | 2019 | | 2021 | | 2020 | | 2021 | | 2020 |
| Net revenues | Net revenues | | $ | 2,062.9 | | | $ | 2,334.3 | | | $ | 5,419.6 | | | $ | 7,014.5 | | Net revenues | | $ | 2,191.5 | | | $ | 1,535.5 | | | $ | 4,583.7 | | | $ | 3,356.7 | |
| Total operating costs and expenses | Total operating costs and expenses | | 2,138.1 | | | 2,246.9 | | | 5,833.5 | | | 6,570.4 | | Total operating costs and expenses | | 2,276.9 | | | 1,512.7 | | | 4,749.2 | | | 3,695.4 | |
| Operating (loss) income | Operating (loss) income | | (75.2) | | | 87.4 | | | (413.9) | | | 444.1 | | Operating (loss) income | | (85.4) | | | 22.8 | | | (165.5) | | | (338.7) | |
| Total non-operating expense, net | | 17.3 | | | 14.0 | | | 6.1 | | | 61.3 | | |
| (Loss) income before income tax (benefit) expense | | (92.5) | | | 73.4 | | | (420.0) | | | 382.8 | | |
| Income tax (benefit) expense | | (15.6) | | | 13.4 | | | (134.6) | | | 83.8 | | |
| (Loss) income from continuing operations, net of tax | | (76.9) | | | 60.0 | | | (285.4) | | | 299.0 | | |
| Loss from discontinued operations, net of tax | | — | | | — | | | — | | | (0.8) | | |
| Total non-operating expense (income), net | | Total non-operating expense (income), net | | 33.1 | | | (39.8) | | | 56.7 | | | (11.2) | |
| (Loss) income before income tax benefit | | (Loss) income before income tax benefit | | (118.5) | | | 62.6 | | | (222.2) | | | (327.5) | |
| Income tax benefit | | Income tax benefit | | (46.0) | | | (35.9) | | | (58.4) | | | (119.0) | |
| | Net (loss) income | Net (loss) income | | (76.9) | | | 60.0 | | | (285.4) | | | 298.2 | | Net (loss) income | | (72.5) | | | 98.5 | | | (163.8) | | | (208.5) | |
| Net income attributed to non-controlling interests | Net income attributed to non-controlling interests | | 11.2 | | | 8.7 | | | 29.4 | | | 20.3 | | Net income attributed to non-controlling interests | | 8.6 | | | 10.8 | | | 15.9 | | | 18.2 | |
| Net (loss) income attributable to Delek US | | $ | (88.1) | | | $ | 51.3 | | | $ | (314.8) | | | $ | 277.9 | | |
| Net (loss) income attributable to Delek | | Net (loss) income attributable to Delek | | $ | (81.1) | | | $ | 87.7 | | | $ | (179.7) | | | $ | (226.7) | |
(1) This information is presented at a summary level for your reference. See the Consolidated Condensed Statements of Income included in Item 1. to this Quarterly Report on Form 10-Q for more detail regarding our results of operations and net loss per share.
We report operating results in three reportable segments:
•Refining
•Logistics
•Retail
Decisions concerning the allocation of resources and assessment of operating performance are made based on this segmentation. Management measures the operating performance of each of its reportable segments based on the segment contribution margin which is defined as net revenues less costs of materials and other and operating expenses, excluding depreciation and amortization.
Results of Operations
Consolidated Results of Operations — Comparison of the Three and NineSix Months Ended SeptemberJune 30, 20202021 versus the Three and NineSix Months Ended SeptemberJune 30, 20192020
Net Loss
Q3Q2 2021 vs. Q2 2020 vs. Q3 2019
Consolidated net loss for the thirdsecond quarter of 20202021 was $76.9$72.5 million compared to net income of $60.0$98.5 million for the thirdsecond quarter of 2019.2020. Consolidated net loss attributable to Delek for the thirdsecond quarter of SeptemberJune 30, 20202021 was $88.1$81.1 million, or $(1.20)$(1.10) per basic share, compared to net income of $51.3$87.7 million, or $0.68$1.19 per basic share, for the thirdsecond quarter 2019.2020. Explanations for significant drivers impacting net income as compared to the comparable period of the prior year are discussed in the sections below.
YTD 20202021 vs. YTD 20192020
Consolidated net loss for the ninesix months ended SeptemberJune 30, 20202021 was $285.4$163.8 million compared to net incomeloss of $298.2$208.5 million for the ninesix months ended SeptemberJune 30, 2019.2020. Consolidated net loss attributable to Delek for the ninesix months ended SeptemberJune 30, 20202021 was $314.8$179.7 million, or $(4.28)$(2.43) per basic share, compared to a net incomeloss of $277.9$226.7 million, or $3.63$(3.08) per basic share, for the ninesix months ended SeptemberJune 30, 2019.2020. Explanations for significant drivers impacting net loss as compared to the comparable period of the prior year are discussed in the sections below.
Net Revenues
Q2 2021 vs. Q2 2020
In the second quarters of 2021 and 2020, we generated net revenues of $2,191.5 million and $1,535.5 million, respectively, an increase of $656.0 million, or 42.7%. The increase in net revenues was primarily driven by the following factors:
Management's Discussion and Analysis
Net Revenues•in our refining segment, increases in the average price of U.S. Gulf Coast gasoline of 145.4%, ULSD of 114.7%, and HSD of 128.2%;
Q3•in our logistics segment, increases in the average volumes of gasoline and diesel sold and in the average sales prices per gallon of gasoline and diesel sold in our West Texas marketing operations; and
•in our retail segment, increases in fuel sales primarily attributable to a 61.8% increase in average price charged per gallon sold.
YTD 2021 vs. YTD 2020 vs. Q3 2019
InFor the third quarters ofsix months ended June 30, 2021 and 2020, and 2019, we generated net revenues of $2,062.9$4,583.7 million and $2,334.3$3,356.7 million, respectively, a decreasean increase of $271.4$1,227.0 million, or 11.6%36.6%. The decreaseincrease in net revenues was primarily driven by the following factors:
•in our refining segment, decreasesincreases in the average price of U.S. Gulf Coast gasoline of 29.9%81.3%, ultra-low sulfur diesel of 37.3%54.0%, and high-sulfur diesel of 41.4%,52.2%;
•in our logistics segment, increases in the average sales prices per gallon of gasoline and diesel sold in our West Texas marketing operations, as well increased revenues associated with agreements executed in six months ended June 30, 2020, partially offset by an increase in barrels sold (both refined and purchased)decreased throughputs due to the impact of 1.2 million barrels;Winter Storm Uri; and
•in our retail segment, decreasesincreases in fuel sales volumes dueprimarily attributable to demand slowdown as a result of COVID-19 Pandemic and reduction in average number of stores, as well as a 19.4% decrease34.1% increase in average price charged per gallon; partially offset by an increase in merchandise sales.
Such decreases were partially offset by:
•increased revenues in our logistics segment associated with agreements executed in connection with Big Spring Gathering System and Delek Trucking acquisitions, partially offset by decreases in the average sales prices per gallon and volumes of diesel gallon sold in our West Texas marketing operations.
YTD 2020 vs. YTD 2019
For the nine months ended September 30, 2020 and 2019, we generated net revenues of $5,419.6 million and $7,014.5 million, respectively, a decrease of $1,594.9 million, or 22.7%. The decrease in net revenues was primarily driven by the following factors:
•in our refining segment, decreases in the average price of U.S. Gulf Coast gasoline of 35.4%, ultra-low sulfur diesel of 37.7%, and high-sulfur diesel of 41.7%;
•in our retail segment, decreases in fuel sales volumes due to demand slowdown as a result of COVID-19 Pandemic and reduction in average number of stores, as well as a 17.9% decrease in average price charged per gallon; partially offset by an increase in merchandise sales; and
•in our logistics segment, decreases in average price per gallon sold in our West Texas marketing operations, partially offset by increased revenue associated with agreements executed in connection with Big Spring Gathering System and Delek Trucking acquisitions, and increased throughputs at our SALA gathering system and Magnolia pipeline.sold.
Total Operating Costs and Expenses
Cost of Materials and Other
Q3Q2 2021 vs. Q2 2020 vs. Q3 2019
Cost of materials and other was $1,875.9$1,995.8 million for the thirdsecond quarter of 2021 compared to $1,277.8 million for the second quarter of 2020, compared to $1,964.1 million for the third quarteran increase of 2019, a decrease of $88.2$718.0 million, or 4.5%56.2%. The net decreaseincrease in cost of materials and other was primarily driven by the following:
•decreasesincreases in cost of crude oil feedstocks at the refineries, including a 27.5% decrease122.3% increase in the average cost of WTI Cushing crude oil and a 26.9% decrease123.1% increase in the average cost of WTI Midland crude oil;
•increases in average RINs costs during the second quarter of 2021 compared to the second quarter of 2020;
•the benefit (expense) of $9.5$9.7 million related to the change in pre-tax inventory valuation recognized during the thirdsecond quarter of 20202021 compared to $(20.0)$203.1 million recognized during the thirdsecond quarter of 2019,2020;
•increases in the average volumes and average cost per gallon of gasoline and diesel sold in our West Texas marketing operations; and
•an increase in retail cost of materials and other due to 86.5% increase in average cost per gallon sold applied to higher fuel sales volumes.
Such increases were partially offset by the following:
•a decrease in commodity hedging losses to a loss of $22.9 million recognized during the second quarter of 2021 from a loss of $153.7 million recognized during the second quarter of 2020.
YTD 2021 vs. YTD 2020
Cost of materials and other was $4,201.3 million for the six months ended June 30, 2021 compared to $3,188.4 million for the six months ended June 30, 2020, an increase of $1,012.9 million, or 31.8%. The net increase in cost of materials and other was primarily driven by the following:
•increases in cost of crude oil feedstocks at the refineries, including a 64.0% increase in the average cost of WTI Cushing crude oil and a 65.5% increase in the average cost of WTI Midland crude oil;
•increases in average RINs costs during the six months ended June 30, 2021 compared to the six months ended June 30, 2020;
•an increase in hedging gains to $5.9a loss of $28.2 million recognized during the third quartersix months ended June 30, 2021 from a loss of 2020 from $13.1$89.2 million recognized during the third quarter of 2019;six months ended June 30, 2020;
•decreasesincreases in the average cost per gallon of gasoline and diesel sold, partially offset by increasesdecreases in averagesthe average volumes of gasoline and diesel sold in our West Texas marketing operations; and
•a decreasean increase in retail fuel cost of materials and other primarily attributable to demand slowdown, a reduction in average number of stores and a decrease41.9% increase in average cost per gallon of $0.49.sold.
YTD 2020 vs. YTD 2019
Cost of materials and other was $5,064.3 million for the nine months ended September 30, 2020 compared to $5,731.2 million for the nine months ended September 30, 2019, a decrease of $666.9 million, or 11.6%. The net decrease in cost of materials and other was primarily drivenSuch increases were partially offset by the following:
•decreasesthe benefit (expense) of $30.1 million related to the change in cost of crude oil feedstocks atpre-tax inventory valuation recognized during the refineries, including a 31.7% decrease insix months ended June 30, 2021 compared to $(75.1) million recognized during the average cost of WTI Cushing crude oil and a 30.2% decrease in the average cost of WTI Midland crude oil;
•decreases in the average volumes of diesel sold and average cost per gallon of gasoline and diesel sold, partially offset by increases in the average volumes of gasoline sold in our West Texas marketing operations; andsix months ended June 30, 2020.
Management's Discussion and Analysis
•a decrease in retail fuel cost of materials and other attributable to demand slowdown, a decrease in average cost per gallon of $0.52 and a reduction in number of stores.
Such decreases were partially offset by the following:
•the (expense) benefit of $(65.6) million related to the change in pre-tax inventory valuation recognized during the nine months ended September 30, 2020 compared to $31.5 million recognized during the nine months ended September 30, 2019;
•a decrease in hedging gains to a loss of $82.1 million recognized during the nine months ended September 30, 2020 from a gain of $63.5 million recognized during the nine months ended September 30, 2019.
Operating Expenses
Q3Q2 2021 vs. Q2 2020 vs. Q3 2019
Operating expenses were $139.7$161.1 million for the thirdsecond quarter of 2021 compared to $127.8 million for the second quarter of 2020, compared to $166.9 million for the third quarteran increase of 2019, a decrease of $27.2$33.3 million, or 16.3%26.1%. The decreaseincrease in operating expenses was primarily driven by the following:
•decreasean increase in outside servicevariable costs across all segmentspartially due to cost reduction measures;
•decreases in the refining segment related employee expenses, maintenancehigher natural gas and electric costs at our refineries as well as higher chemical and cost reductions due to the sale ofcatalyst costs driven by lower comparable year period at our Bakersfield refinery in the second quarter of 2020;Krotz Springs refinery; and
•decreaseincreases in retail operating expensesmaintenance, outside services and lease costs due to reduction in numbercontinued costs associated with Winter Storm Uri as well as unit outages at certain of stores.our refineries.
YTD 20202021 vs. YTD 20192020
Operating expenses were $422.0$310.4 million for the ninesix months ended SeptemberJune 30, 20202021 compared to $495.9$282.3 million for the ninesix months ended SeptemberJune 30, 2019,2020, a decreaseincrease of $73.9$28.1 million, or 14.9%10.0%. The decreaseincrease in operating expenses was primarily driven by the following:
•an increase in variable expenses primarily associated with higher natural gas costs during the February 2021 severe freezing conditions that affected most of the regions where we operate; and
•increases in maintenance, outside services and lease costs due to continued costs associated with Winter Storm Uri as well as unit outages at certain of our refineries.
Such increases were partially offset by the following:
•a decrease in outside service costs across all segmentsexpenses at our El Dorado refinery due to cost reduction measures;current year turnaround activities; and
•decreases in the refining segment related to lower employee, utilities, catalysts and maintenance costs; andcertain cost-cutting measures.
•decrease in retail operating expenses due to reduction in number of stores.
General and Administrative Expenses
Q3Q2 2021 vs. Q2 2020 vs. Q3 2019
General and administrative expenses were $57.0$58.6 million for the thirdsecond quarter of 2021 compared to $61.7 million for the second quarter of 2020, compared to $65.6 million for the third quarter of 2019, a decrease of $8.6$3.1 million, or 13.1%5.0%. The decrease in general and administrative expense was primarily driven by the following:
•a decrease in contract services due to additional legal and consulting services associated with the drop downs in prior year and cost reduction measures;measures.
YTD 2021 vs. YTD 2020
General and administrative expenses were $105.7 million and $127.4 million for the six months ended June 30, 2021 and 2020, respectively, a decrease of $21.7 million, or 17.0%. The decrease in general and administrative expense was primarily driven by the following:
•a decrease in employee expenses partially due to additional severance costs incurred in prior year and suspension of matching contributions to our 401(k) plan for the six months ended June 30, 2021 while the plan was still in place during the six months ended June 30, 2020;
•a decrease in stock-based compensationcontract services due to workforce reductionsadditional legal and consulting services associated with the drop downs in 2020;prior year and cost reduction measures; and
•a decrease in travel related expense due to travel restrictions in place as a result of the COVID-19 Pandemic.
YTD 2020 vs. YTD 2019
General and administrative expenses were $184.4 million and $197.3 million for the nine months ended September 30, 2020 and 2019, respectively, a decrease of $12.9 million, or 6.5%. The decrease in general and administrative expense was primarily driven by the following:
•decrease in contract services due to cost reduction measures;
•decrease in stock-based compensation due to workforce reductions in 2020;
•decrease in travel related expense due to travel restrictions in place as a result of the COVID-19 Pandemic; and
•decrease in loss allowance on a note receivable.
These decreases were partially offset by increases in salaried labor, including severance, partially offset by decrease in incentive accrual.
Management's Discussion and Analysis
Depreciation and Amortization
Q3Q2 2021 vs. Q2 2020 vs. Q3 2019
Depreciation and amortization (included in both cost of sales and other operating expenses) was $65.2$66.3 million for the thirdsecond quarter of 2021 compared to $59.6 million for the second quarter of 2020, an increase of $6.7 million, or 11.2%. This increase was primarily due to depreciation associated with assets added during the El Dorado refinery turnaround in the first quarter of 2021, as well as other refining assets placed in service.
YTD 2021 vs. YTD 2020
Depreciation and amortization (included in both cost of sales and other operating expenses) was $134.8 million compared to $49.8$112.2 million for the third quarter of 2019,six months ended June 30, 2021 and 2020, respectively, an increase of $15.4$22.6 million, or 30.9%20.1%, primarily due to depreciation associated with assets added during the Big Spring refinery turnaround in the first quarter of 2020 and the El Dorado refinery turnaround in 2021, as well as other refining assets placed in serviceservice.
Management's Discussion and Analysis
Other Operating Income, Net
Q2 2021 vs. Q2 2020
Other operating income, net decreased by $9.3 million in late 2019 and firstthe second quarter of 2021 to $4.9 million compared to $14.2 million in the second quarter of 2020.
YTD 20202021 vs. YTD 2019
Depreciation and amortization (included in both cost of sales and other operating expenses) was $177.4 million compared to $146.7 million for the nine months ended September 30, 2020 and 2019, respectively, an increase of $30.7 million, or 20.9%, primarily due to depreciation associated with assets added during the Big Spring refinery turnaround in the first quarter of 2020, the El Dorado turnaround assets added in the second of 2019 and the addition of the alkylation unit at our Krotz Springs refinery late in the second quarter of 2019.
Other Operating Loss (Income), Net
Q3 2020 vs. Q3 2019
Other operating loss, net decreased by $0.2 million in the third quarter of 2020 to a loss of $0.3 million compared to a loss of $0.5 million in the third quarter of 2019.
YTD 2020 vs. YTD 2019
Other operating income, net increaseddecreased by $13.9$11.9 million during the ninesix months ended SeptemberJune 30, 20202021 to $14.6$3.0 million compared to income of $0.7$14.9 million during the ninesix months ended SeptemberJune 30, 2019.2020.
Non-operating Expenses, Net
Interest Expense
Q3Q2 2021 vs. Q2 2020 vs. Q3 2019
Interest expense decreasedincreased by $2.0$3.4 million, or 5.9%11.4%, to $31.9$33.2 million in the thirdsecond quarter of 20202021 compared to $33.9$29.8 million in the thirdsecond quarter of 2019,2020, primarily driven by the following:
•an increase in the average effective interest rate of 0.28% in the second quarter of 2021 compared to the second quarter of 2020 (where effective interest rate is calculated as interest expense divided by the net average borrowings/obligations outstanding); and
•an increase in net average borrowings outstanding (including the obligations under the Supply and Offtake Agreements which have an associated interest charge) of approximately $128.7 million in the second quarter of 2021 (calculated as a simple average of beginning borrowings/obligations and ending borrowings/obligations for the period) compared to the second quarter of 2020.
YTD 2021 vs. YTD 2020
Interest expense decreased by $3.3 million, or 5.0%, to $62.8 million during the six months ended June 30, 2021 compared to $66.1 million during the six months ended June 30, 2020, primarily driven by the following:
•a decrease in the average effective interest rate of 1.18% in0.36% during the third quarter of 2020six months ended June 30, 2021 compared to the third quarter of 2019six months ended June 30, 2020 (where effective interest rate is calculated as interest expense divided by the net average borrowings/obligations outstanding), partially offset by an increase in net average borrowings outstanding (including the obligations under the Supplysupply and Offtake Agreementsofftake agreements which have an associated interest charge) of approximately $430.2$64.9 million induring the third quarter of 2020six months ended June 30, 2021 (calculated as a simple average of beginning borrowings/obligations and ending borrowings/obligations for the period) compared to the third quarter of 2019.
YTD 2020 vs. YTD 2019
Interest expense increased by $2.6 million, or 2.7%, to $98.0 million during the ninesix months ended SeptemberJune 30, 2020 compared to $95.4 million during the nine months ended September 30, 2019, primarily driven by the following:
•an increase in net average borrowings outstanding (including the obligations under the supply and offtake agreements which have an associated interest charge) of approximately $393.8 million during the nine months ended September 30, 2020 (calculated as a simple average of beginning borrowings/obligations and ending borrowings/obligations for the period) compared to the nine months ended September 30, 2019, partially offset by a decrease in the average effective interest rate of 0.69% during the nine months ended September 30, 2020 compared to the nine months ended September 30, 2019 (where effective interest rate is calculated as interest expense divided by the net average borrowings/obligations outstanding).2020.
Results from Equity Method Investments
Q3Q2 2021 vs. Q2 2020 vs. Q3 2019
We recognized income of $12.8$6.8 million from equity method investments during the thirdsecond quarter of 2021, compared to $10.7 million for the second quarter of 2020, compared to $16.5 million for the third quarter of 2019, a decrease of $3.7$3.9 million. This decrease was primarily driven by the following:
•a decrease in income from our investment in W2W Holdings LLC to a loss of $3.9 million in the Red River Joint Venture decreased $2.7second quarter of 2021 from a loss of $0.9 million in the second quarter of 2020.
YTD 2021 vs. YTD 2020
During the six months ended June 30, 2021, we recognized income of $11.6 million from equity method investments, compared to $15.8 million for the six months ended June 30, 2020, an decrease of $4.2 million. This decrease was primarily driven by the following:
•decrease in income from our logistics' equity method investments due to decrease in committedlower volumes in July and August 2020;as the impact of the February 2021 Winter Storm Uri was pervasive across all of our equity method investments' pipeline systems; and
•a decrease in income from our other logistics joint ventures from $3.7investment in W2W Holdings LLC to a loss of $4.1 million in the thirdsecond quarter of 2019 to $2.92021 from a loss of $2.0 million in thirdthe second quarter of 2020.
Management's Discussion and Analysis
During the nine months ended September 30, 2020, we recognized income of $28.6 million from equity method investments, compared to $28.4 million for the nine months ended September 30, 2019, an increase of $0.2 million.
Other
During the ninethree and six months ended SeptemberJune 30, 2020, we recognized a gain of $56.8$56.9 million on the sale of our non-operating refinery located in Bakersfield, California, a nominal amount of which was recognized in the third quarter.California. See Note 2 of the condensed consolidated financial statements in Item 1. Financial Statements, for additional information.
Q3 2020 vs. Q3 2019
Other income increased $0.8 million, to $1.0 million in third quarter of 2020 compared to $0.2 million in the third quarter of 2019.
YTD 2020 vs. YTD 2019
Other income increased $6.7 million, to $3.4 million in the nine months ended September 30, 2020, compared to a loss of $3.3 million in the nine months ended September 30, 2019.
Management's Discussion and Analysis
Income Taxes
Q3Q2 2021 vs. Q2 2020 vs. Q3 2019
Income tax expense decreasedbenefit increased by $29.0$10.1 million in the thirdsecond quarter of 20202021 compared to the thirdsecond quarter of 2019,2020, primarily driven by the following:
•a pre-tax loss of $92.5$118.5 million in the thirdsecond quarter of 2020,2021, as compared to income of $73.4$62.6 million for the thirdsecond quarter of 2019;2020; and
•a decreasean increase in our effective tax rate which was 16.9%38.8% for the thirdsecond quarter of 2020,2021, compared to 18.3%(57.3)% for the thirdsecond quarter of 20192020 primarily due to the following:
◦projected 2020 federal net operating loss carryback to a prior 35% tax rate year creating a 14% rate benefit;benefit reported as a discrete adjustment in the second quarter of 2020; and
◦net decreasechanges in valuation allowance on utilizationthe second quarter estimated AETR applied to year-to-date loss for the second quarter of state attributes.2020 exceeded changes in AETR applied to year-to-date loss for the second quarter of 2021.
YTD 20202021 vs. YTD 20192020
Income tax expensebenefit decreased by $218.4$60.6 million during the ninesix months ended SeptemberJune 30, 20202021 compared to the same period for 2019,2020, primarily driven by the following:
•pre-tax loss of $420.0$222.2 million in the ninesix months ended SeptemberJune 30, 2020,2021, as compared to pre-tax incomeloss of $382.8$327.5 million for the ninesix months ended SeptemberJune 30, 2019;2020; and
•an increasea decrease in our effective tax rate which was 32.0%26.3% for the ninesix months ended SeptemberJune 30, 2020,2021, compared to 21.9%36.3% for the ninesix months ended SeptemberJune 30, 20192020 primarily due to the following:
◦projected 2020 federal net operating loss carryback to a prior 35% tax rate year creating a 14% tax rate arbitrage;benefit reported as a discrete adjustment in the second quarter of 2020; and
◦the reversal of a valuation allowance attributable to book-tax basis differences in partnership investments reported as a discrete benefit in the first quarter; and
◦an increase in the estimated annual effective tax rate applied to year to date loss for the year.quarter of 2020.
Management's Discussion and Analysis
The tables and charts below set forth certain information concerning our refining segment operations ($ in millions, except per barrel amounts):
| | Refining Segment Margins | Refining Segment Margins | Refining Segment Margins |
| | Three Months Ended | | Nine Months Ended | | Three Months Ended | | Six Months Ended |
| | September 30, | | September 30, | | June 30, | | June 30, |
| | 2020 | | 2019 | | 2020 | | 2019 | | 2021 | | 2020 | | 2021 | | 2020 |
| Net revenues | Net revenues | | $ | 1,563.5 | | | $ | 2,176.8 | | | $ | 4,368.4 | | | $ | 6,636.6 | | Net revenues | | $ | 2,415.7 | | | $ | 1,077.0 | | | $ | 4,155.8 | | | $ | 2,804.9 | |
| Cost of materials and other | Cost of materials and other | | 1,479.2 | | | 1,906.0 | | | 4,314.4 | | | 5,629.8 | | Cost of materials and other | | 2,321.8 | | | 928.6 | | | 3,969.5 | | | 2,835.2 | |
| Refining margin | Refining margin | | 84.3 | | | 270.8 | | | 54.0 | | | 1,006.8 | | Refining margin | | 93.9 | | | 148.4 | | | 186.3 | | | (30.3) | |
| Operating expenses (excluding depreciation and amortization) | Operating expenses (excluding depreciation and amortization) | | 102.1 | | | 120.7 | | | 302.5 | | | 356.7 | | Operating expenses (excluding depreciation and amortization) | | 113.8 | | | 88.7 | | | 227.4 | | | 200.4 | |
| Contribution margin | Contribution margin | | $ | (17.8) | | | $ | 150.1 | | | $ | (248.5) | | | $ | 650.1 | | Contribution margin | | $ | (19.9) | | | $ | 59.7 | | | $ | (41.1) | | | $ | (230.7) | |
Factors Impacting Refining Profitability
Our profitability in the refining segment is substantially determined by the difference between the cost of the crude oil feedstocks we purchase and the price of the refined products we sell, referred to as the "crack spread", "refining margin" or "refined product margin". Refining margin is used as a metric to assess a refinery's product margins against market crack spread trends, where "crack spread" is a measure of the difference between market prices for crude oil and refined products and is a commonly used proxy within the industry to estimate or identify trends in refining margins.
The cost to acquire feedstocks and the price of the refined petroleum products we ultimately sell from our refineries depend on numerous factors beyond our control, including the supply of, and demand for, crude oil, gasoline and other refined petroleum products which, in turn, depend on, among other factors, changes in domestic and foreign economies, weather conditions such as hurricanes or tornadoes, local, domestic and foreign political affairs, global conflict, production levels, the availability of imports, the marketing of competitive fuels and government regulation. Other significant factors that influence our results in the refining segment include operating costs (particularly the cost of natural gas used for fuel and the cost of electricity), seasonal factors, refinery utilization rates and planned or unplanned maintenance activities or turnarounds. Moreover, while the fluctuations in the cost of crude oil are typically reflected in the prices of light refined products, such as gasoline and diesel fuel, the price of other residual products, such as asphalt, coke, carbon black oil and liquefied petroleum gas ("LPG") are less likely to move in parallel with crude cost. This could cause additional pressure on our realized margin during periods of rising or falling crude oil prices.
Additionally, our margins are impacted by the pricing differentials of the various types and sources of crude oil we use at our refineries and their relation to product pricing. Our crude slate is predominantly comprised of WTI crude oil. Therefore, favorable differentials of WTI compared to other crude will favorably impact our operating results, and vice versa. Additionally, because of our gathering system presence in the Midland area and the significant source of crude specifically from that region into our network, a widening of the WTI Cushing less WTI Midland spread will favorably influence the operating margin for our refineries. Alternatively, a narrowing of this differential will have an adverse effect on our operating margins. Global product prices are influenced by the price of Brent crude which is a global benchmark crude. Global product prices influence product prices in the U.S. As a result, our refineries are influenced by the spread between Brent crude and WTI Midland. The Brent less WTI Midland spread represents the differential between the average per barrel price of Brent crude oil and the average per barrel price of WTI Midland crude oil. A widening of the spread between Brent and WTI Midland will favorably influence our refineries' operating margins. Also, the Krotz Springs refinery is influenced by the spread between Brent crude and LLS. The Brent less LLS spread represents the differential between the average per barrel price of Brent crude oil and the average per barrel price of LLS crude oil. A discount in LLS relative to Brent will favorably influence the Krotz Springs refinery operating margin.
The cost to acquire the refined fuel products we sell to our wholesale customers in our logistics segment and at our convenience stores in our retail segment depends on numerous factors beyond our control, including the supply of, and demand for, crude oil, gasoline and other refined petroleum products which, in turn, depend on, among other factors, changes in domestic and foreign economies, weather conditions, domestic and foreign political affairs, production levels, the availability of imports, the marketing of competitive fuels and government regulation. Our retail merchandise sales are driven by convenience, customer service, competitive pricing and branding. Motor fuel margin is sales less the delivered cost of fuel and motor fuel taxes, measured on a cents per gallon basis. Our motor fuel margins are impacted by local supply, demand, weather, competitor pricing and product brand.
AsIn addition to the above, it continues to be a strategic and operational objective to manage price and supply risk related to crude oil that is used in refinery production, and to develop strategic sourcing relationships. For that purpose, from a pricing perspective, we enter into
Management's Discussion and Analysis
commodity derivative contracts to manage our price exposure to our inventory positions, future purchases of crude oil and ethanol, future sales of refined products or to fix margins on future production. We also enter into future commitments to purchase or sell RINs at fixed prices and quantities, which are used to manage our RINs Obligation. Additionally, from a sourcing perspective, we often enter into purchase and sale contracts with vendors and customers or take physical or financial commodity positions for crude oil that may not be used immediately in production, but that may be used to manage the overall supply and availability of crude expected to ultimately be needed for production and/or to meet minimum requirements under strategic pipeline arrangements, and also to optimize and hedge availability risks associated with crude that we ultimately expect to use in production. Such transactions are inherently based on certain assumptions and judgments made about the current and possible future availability of crude. Therefore, when we take physical or financial positions for optimization purposes, our intent is generally to take offsetting positions in quantities and at prices that will advance these objectives while minimizing our positional and financial statement risk. However, because of the volatility of the market in terms of pricing and availability, it is possible that we may have material positions with timing differences or, more rarely, that we are unable to cover a position with an offsetting position as intended. Such differences could have a material impact on the classification of resulting gains/losses, assets or liabilities, and could also significantly impact refining contribution margin.
Finally, as part of our overall business strategy, we regularly evaluate opportunities to expand our portfolio of businesses and may at any time be discussing or negotiating a transaction that, if consummated, could have a material effect on our business, financial condition, liquidity or results of operations.
Management's Discussion and Analysis
| | Refinery Statistics | Refinery Statistics | Refinery Statistics |
| | Three Months Ended | | Nine Months Ended | | Three Months Ended | | Six Months Ended |
| | September 30, | | September 30, | | June 30, | | June 30, |
| | 2020 | | 2019 | | 2020 | | 2019 | | 2021 | | 2020 | | 2021 | | 2020 |
| | (Unaudited) | | (Unaudited) | | (Unaudited) | | (Unaudited) |
| Tyler, TX Refinery | Tyler, TX Refinery | | | Tyler, TX Refinery | | |
| Days in period | Days in period | | 92 | | | 92 | | | 274 | | | 273 | | Days in period | | 91 | | | 91 | | | 181 | | | 182 | |
Total sales volume - refined product (average barrels per day)(1) | Total sales volume - refined product (average barrels per day)(1) | | 77,386 | | | 80,981 | | | 74,050 | | | 76,262 | | Total sales volume - refined product (average barrels per day)(1) | | 77,529 | | | 69,746 | | | 75,389 | | | 72,364 | |
| | Products manufactured (average barrels per day): | Products manufactured (average barrels per day): | | | | | | Products manufactured (average barrels per day): | | | | | |
| Gasoline | Gasoline | | 40,383 | | | 41,480 | | | 39,221 | | | 40,281 | | Gasoline | | 37,495 | | | 37,225 | | | 38,522 | | | 38,633 | |
| Diesel/Jet | Diesel/Jet | | 31,612 | | | 33,105 | | | 28,980 | | | 30,685 | | Diesel/Jet | | 30,449 | | | 27,897 | | | 29,102 | | | 27,650 | |
| Petrochemicals, LPG, natural gas liquids ("NGLs") | Petrochemicals, LPG, natural gas liquids ("NGLs") | | 3,848 | | | 3,992 | | | 3,022 | | | 3,129 | | Petrochemicals, LPG, natural gas liquids ("NGLs") | | 2,079 | | | 3,216 | | | 1,903 | | | 2,604 | |
| Other | Other | | 1,763 | | | 1,853 | | | 1,442 | | | 1,560 | | Other | | 1,633 | | | 1,319 | | | 1,552 | | | 1,281 | |
| Total production | Total production | | 77,606 | | | 80,430 | | | 72,665 | | | 75,655 | | Total production | | 71,656 | | | 69,657 | | | 71,079 | | | 70,168 | |
| Throughput (average barrels per day): | Throughput (average barrels per day): | | | | | | | | | Throughput (average barrels per day): | | | | | | | | |
| Crude Oil | Crude Oil | | 72,651 | | | 75,266 | | | 67,693 | | | 70,594 | | Crude Oil | | 72,639 | | | 64,408 | | | 68,718 | | | 65,187 | |
| Other feedstocks | Other feedstocks | | 4,975 | | | 5,565 | | | 5,422 | | | 5,710 | | Other feedstocks | | (384) | | | 5,848 | | | 2,779 | | | 5,648 | |
| Total throughput | Total throughput | | 77,626 | | | 80,831 | | | 73,116 | | | 76,304 | | Total throughput | | 72,255 | | | 70,256 | | | 71,497 | | | 70,835 | |
| Total refining revenue ($ in millions) | Total refining revenue ($ in millions) | | $ | 383.8 | | | $ | 597.6 | | | $ | 1,055.3 | | | $ | 1,656.5 | | Total refining revenue ($ in millions) | | $ | 625.0 | | | $ | 251.8 | | | $ | 1,115.0 | | | $ | 671.4 | |
| Cost of materials and other ($ in millions) | Cost of materials and other ($ in millions) | | 392.4 | | | 508.5 | | | 1,003.0 | | | 1,342.2 | | Cost of materials and other ($ in millions) | | 588.3 | | | 44.1 | | | 1,029.5 | | | 610.6 | |
| Total refining margin ($ in millions) | Total refining margin ($ in millions) | | $ | (8.6) | | | $ | 89.1 | | | $ | 52.3 | | | $ | 314.3 | | Total refining margin ($ in millions) | | $ | 36.7 | | | $ | 207.7 | | | $ | 85.5 | | | $ | 60.8 | |
| Per barrel of refined product sales: | Per barrel of refined product sales: | | | | | | | | | Per barrel of refined product sales: | | | | | | | | |
Tyler refining margin | Tyler refining margin | | $ | (1.21) | | | $ | 11.96 | | | 2.58 | | | $ | 15.09 | | Tyler refining margin | | $ | 5.20 | | | $ | 32.72 | | | 6.26 | | | $ | 4.62 | |
| Direct operating expenses | Direct operating expenses | | $ | 3.28 | | | $ | 3.11 | | | 3.35 | | | $ | 3.77 | | Direct operating expenses | | $ | 3.51 | | | $ | 3.00 | | | 3.54 | | | $ | 3.38 | |
| Crude Slate: (% based on amount received in period) | Crude Slate: (% based on amount received in period) | | | | | | Crude Slate: (% based on amount received in period) | | | | | |
| WTI crude oil | WTI crude oil | | 89.0 | % | | 94.6 | % | | 92.1 | % | | 91.3 | % | WTI crude oil | | 86.7 | % | | 94.2 | % | | 90.6 | % | | 93.3 | % |
| East Texas crude oil | East Texas crude oil | | 11.0 | % | | 2.7 | % | | 7.9 | % | | 8.0 | % | East Texas crude oil | | 13.3 | % | | 5.8 | % | | 9.0 | % | | 6.7 | % |
| Other | Other | | — | % | | 2.8 | % | | — | % | | 0.7 | % | Other | | — | % | | — | % | | 0.4 | % | | — | % |
| | El Dorado, AR Refinery | El Dorado, AR Refinery | | | | | | El Dorado, AR Refinery | | | | | |
| Days in period | Days in period | | 92 | | | 92 | | | 274 | | | 273 | | Days in period | | 91 | | | 91 | | | 181 | | | 182 | |
Total sales volume - refined product (average barrels per day)(1) | Total sales volume - refined product (average barrels per day)(1) | | 79,594 | | | 71,282 | | | 77,742 | | | 58,310 | | Total sales volume - refined product (average barrels per day)(1) | | 55,381 | | | 76,059 | | | 52,561 | | | 76,805 | |
| | Products manufactured (average barrels per day): | Products manufactured (average barrels per day): | | | | | | Products manufactured (average barrels per day): | | | | | |
| Gasoline | Gasoline | | 36,801 | | | 30,766 | | | 35,855 | | | 24,396 | | Gasoline | | 26,143 | | | 34,346 | | | 21,872 | | | 35,376 | |
| Diesel | Diesel | | 30,709 | | | 22,348 | | | 29,473 | | | 18,559 | | Diesel | | 20,534 | | | 30,060 | | | 17,271 | | | 28,849 | |
| Petrochemicals, LPG, NGLs | Petrochemicals, LPG, NGLs | | 1,678 | | | 834 | | | 1,933 | | | 731 | | Petrochemicals, LPG, NGLs | | 808 | | | 2,063 | | | 780 | | | 2,062 | |
| Asphalt | Asphalt | | 7,268 | | | 5,886 | | | 6,655 | | | 5,894 | | Asphalt | | 5,997 | | | 6,049 | | | 4,840 | | | 6,345 | |
| Other | Other | | 825 | | | 713 | | | 801 | | | 678 | | Other | | 603 | | | 605 | | | 521 | | | 788 | |
| Total production | Total production | | 77,281 | | | 60,547 | | | 74,717 | | | 50,258 | | Total production | | 54,085 | | | 73,123 | | | 45,284 | | | 73,420 | |
| Throughput (average barrels per day): | Throughput (average barrels per day): | | | | | | | | | Throughput (average barrels per day): | | | | | | | | |
| Crude Oil | Crude Oil | | 74,235 | | | 58,362 | | | 72,427 | | | 49,199 | | Crude Oil | | 54,086 | | | 71,406 | | | 44,479 | | | 71,514 | |
| Other feedstocks | Other feedstocks | | 2,814 | | | 1,748 | | | 2,610 | | | 1,431 | | Other feedstocks | | 1,451 | | | 2,369 | | | 1,558 | | | 2,506 | |
| Total throughput | Total throughput | | 77,049 | | | 60,110 | | | 75,037 | | | 50,630 | | Total throughput | | 55,537 | | | 73,775 | | | 46,037 | | | 74,020 | |
| Total refining revenue ($ in millions) | Total refining revenue ($ in millions) | | $ | 452.6 | | | $ | 803.8 | | | $ | 1,407.8 | | | $ | 2,379.6 | | Total refining revenue ($ in millions) | | $ | 489.5 | | | $ | 343.3 | | | $ | 926.2 | | | $ | 955.2 | |
| Cost of materials and other ($ in millions) | Cost of materials and other ($ in millions) | | 405.6 | | | 775.9 | | | 1,399.1 | | | 2,246.8 | | Cost of materials and other ($ in millions) | | 479.1 | | | 322.0 | | | 930.0 | | | 993.5 | |
| Total refining margin ($ in millions) | Total refining margin ($ in millions) | | $ | 47.0 | | | $ | 27.9 | | | $ | 8.7 | | | $ | 132.8 | | Total refining margin ($ in millions) | | $ | 10.4 | | | $ | 21.3 | | | $ | (3.8) | | | $ | (38.3) | |
| Per barrel of refined product sales: | Per barrel of refined product sales: | | | | | | | | | Per barrel of refined product sales: | | | | | | | | |
| El Dorado refining margin | El Dorado refining margin | | $ | 6.42 | | | $ | 4.25 | | | $ | 0.41 | | | $ | 8.34 | | El Dorado refining margin | | $ | 2.06 | | | $ | 3.08 | | | $ | (0.39) | | | $ | (2.74) | |
| Direct operating expenses | Direct operating expenses | | $ | 3.25 | | | $ | 5.27 | | | $ | 3.73 | | | $ | 5.88 | | Direct operating expenses | | $ | 5.14 | | | $ | 3.53 | | | $ | 5.71 | | | $ | 3.98 | |
| Crude Slate: (% based on amount received in period) | Crude Slate: (% based on amount received in period) | | | | | | Crude Slate: (% based on amount received in period) | | | | | |
| WTI crude oil | WTI crude oil | | 69.9 | % | | 72.0 | % | | 52.2 | % | | 53.8 | % | WTI crude oil | | 48.9 | % | | 51.4 | % | | 46.9 | % | | 42.9 | % |
| Local Arkansas crude oil | Local Arkansas crude oil | | 17.7 | % | | 20.7 | % | | 17.2 | % | | 25.4 | % | Local Arkansas crude oil | | 20.4 | % | | 14.7 | % | | 25.1 | % | | 17.0 | % |
| Other | Other | | 12.4 | % | | 7.2 | % | | 30.5 | % | | 20.8 | % | Other | | 30.7 | % | | 33.9 | % | | 28.0 | % | | 40.1 | % |
Management's Discussion and Analysis
| | Refinery Statistics (continued) | Refinery Statistics (continued) | Refinery Statistics (continued) |
| | Three Months Ended | | Nine Months Ended | | Three Months Ended | | Six Months Ended |
| | September 30, | | September 30, | | June 30, | | June 30, |
| | 2020 | | 2019 | | 2020 | | 2019 | | 2021 | | 2020 | | 2021 | | 2020 |
| | (Unaudited) | | (Unaudited) | | (Unaudited) | | (Unaudited) |
| Big Spring, TX Refinery | Big Spring, TX Refinery | | | Big Spring, TX Refinery | | |
| Days in period | Days in period | | 92 | | | 92 | | | 274 | | | 273 | | Days in period | | 91 | | | 91 | | | 181 | | | 182 | |
Total sales volume - refined product (average barrels per day) (1) | Total sales volume - refined product (average barrels per day) (1) | | 75,884 | | | 72,909 | | | 61,602 | | | 77,712 | | Total sales volume - refined product (average barrels per day) (1) | | 69,191 | | | 70,679 | | | 68,947 | | | 54,382 | |
| | Products manufactured (average barrels per day): | Products manufactured (average barrels per day): | | | | | | Products manufactured (average barrels per day): | | | | | |
| Gasoline | Gasoline | | 38,106 | | | 33,561 | | | 29,532 | | | 36,276 | | Gasoline | | 33,501 | | | 35,789 | | | 33,159 | | | 25,198 | |
| Diesel/Jet | Diesel/Jet | | 28,777 | | | 28,391 | | | 22,190 | | | 27,796 | | Diesel/Jet | | 25,492 | | | 27,924 | | | 23,226 | | | 18,860 | |
| Petrochemicals, LPG, NGLs | Petrochemicals, LPG, NGLs | | 3,923 | | | 3,755 | | | 2,959 | | | 3,761 | | Petrochemicals, LPG, NGLs | | 4,335 | | | 3,563 | | | 3,745 | | | 2,472 | |
| Asphalt | Asphalt | | 2,235 | | | 2,027 | | | 1,715 | | | 1,815 | | Asphalt | | 1,012 | | | 2,055 | | | 1,400 | | | 1,452 | |
| Other | Other | | 1,397 | | | 1,423 | | | 1,030 | | | 1,339 | | Other | | 1,491 | | | 1,208�� | | | 1,448 | | | 844 | |
| Total production | Total production | | 74,438 | | | 69,157 | | | 57,426 | | | 70,986 | | Total production | | 65,831 | | | 70,539 | | | 62,977 | | | 48,826 | |
| Throughput (average barrels per day): | Throughput (average barrels per day): | | | | | | | | | Throughput (average barrels per day): | | | | | | | | |
| Crude oil | Crude oil | | 72,779 | | | 70,542 | | | 57,725 | | | 71,939 | | Crude oil | | 69,731 | | | 70,327 | | | 64,772 | | | 50,116 | |
| Other feedstocks | Other feedstocks | | 2,067 | | | (1,282) | | | 746 | | | (3) | | Other feedstocks | | (1,704) | | | 1,483 | | | (395) | | | 78 | |
| Total throughput | Total throughput | | 74,846 | | | 69,260 | | | 58,471 | | | 71,936 | | Total throughput | | 68,027 | | | 71,810 | | | 64,377 | | | 50,194 | |
| Total refining revenue ($ in millions) | Total refining revenue ($ in millions) | | $ | 401.9 | | | $ | 592.0 | | | $ | 1,104.4 | | | $ | 1,811.2 | | Total refining revenue ($ in millions) | | $ | 615.1 | | | $ | 292.6 | | | $ | 1,117.1 | | | $ | 702.4 | |
| Cost of materials and other ($ in millions) | Cost of materials and other ($ in millions) | | 374.0 | | | $ | 510.1 | | | 1,069.3 | | | 1,497.7 | | Cost of materials and other ($ in millions) | | 572.0 | | | $ | 241.9 | | | 1,033.2 | | | 695.4 | |
| Total refining margin ($ in millions) | Total refining margin ($ in millions) | | $ | 27.9 | | | $ | 81.9 | | | $ | 35.1 | | | $ | 313.5 | | Total refining margin ($ in millions) | | $ | 43.1 | | | $ | 50.7 | | | $ | 83.9 | | | $ | 7.0 | |
| Per barrel of refined product sales: | Per barrel of refined product sales: | | | | | | | | | Per barrel of refined product sales: | | | | | | | | |
| Big Spring refining margin | Big Spring refining margin | | $ | 4.00 | | | $ | 12.21 | | | $ | 2.07 | | | $ | 14.78 | | Big Spring refining margin | | $ | 6.84 | | | $ | 7.88 | | | $ | 6.72 | | | $ | 0.71 | |
| Direct operating expenses | Direct operating expenses | | $ | 3.88 | | | $ | 4.50 | | | $ | 4.47 | | | $ | 3.98 | | Direct operating expenses | | $ | 5.34 | | | $ | 3.55 | | | $ | 5.88 | | | $ | 4.89 | |
| Crude Slate: (% based on amount received in period) | Crude Slate: (% based on amount received in period) | | | | | | Crude Slate: (% based on amount received in period) | | | | | |
| WTI crude oil | WTI crude oil | | 63.7 | % | | 76.4 | % | | 70.3 | % | | 76.4 | % | WTI crude oil | | 66.4 | % | | 83.9 | % | | 64.7 | % | | 75.1 | % |
| WTS crude oil | WTS crude oil | | 36.3 | % | | 23.6 | % | | 29.7 | % | | 23.6 | % | WTS crude oil | | 33.6 | % | | 16.1 | % | | 35.3 | % | | 24.9 | % |
| | Krotz Springs, LA Refinery | Krotz Springs, LA Refinery | | | | | | Krotz Springs, LA Refinery | | | | | |
| Days in period | Days in period | | 92 | | | 92 | | | 274 | | | 273 | | Days in period | | 91 | | | 91 | | | 181 | | | 182 | |
Total sales volume - refined product (average barrels per day) (1) | Total sales volume - refined product (average barrels per day) (1) | | 67,465 | | | 72,173 | | | 69,965 | | | 75,207 | | Total sales volume - refined product (average barrels per day) (1) | | 77,318 | | | 61,441 | | | 51,286 | | | 71,229 | |
| Products manufactured (average barrels per day): | Products manufactured (average barrels per day): | | | | | | Products manufactured (average barrels per day): | | | | | |
| Gasoline | Gasoline | | 32,287 | | | 34,757 | | | 26,872 | | | 35,760 | | Gasoline | | 33,056 | | | 17,461 | | | 19,661 | | | 24,135 | |
| Diesel/Jet | Diesel/Jet | | 23,686 | | | 27,277 | | | 25,447 | | | 29,137 | | Diesel/Jet | | 26,611 | | | 21,742 | | | 15,370 | | | 26,337 | |
| Heavy Oils | Heavy Oils | | 729 | | | 1,125 | | | 559 | | | 1,108 | | Heavy Oils | | 868 | | | 215 | | | 527 | | | 473 | |
| Petrochemicals, LPG, NGLs | Petrochemicals, LPG, NGLs | | 3,394 | | | 3,814 | | | 2,417 | | | 5,103 | | Petrochemicals, LPG, NGLs | | 6,601 | | | 840 | | | 3,948 | | | 1,923 | |
| Other | Other | | 4,020 | | | — | | | 11,117 | | | 35 | | Other | | 6,705 | | | 18,871 | | | 8,948 | | | 14,704 | |
| Total production | Total production | | 64,116 | | | 66,973 | | | 66,412 | | | 71,143 | | Total production | | 73,841 | | | 59,129 | | | 48,454 | | | 67,572 | |
| Throughput (average barrels per day): | Throughput (average barrels per day): | | | | | | | | | Throughput (average barrels per day): | | | | | | | | |
| Crude Oil | Crude Oil | | 60,150 | | | 69,805 | | | 64,019 | | | 70,757 | | Crude Oil | | 70,883 | | | 59,468 | | | 42,377 | | | 65,975 | |
| Other feedstocks | Other feedstocks | | 3,028 | | | (3,553) | | | 2,415 | | | (596) | | Other feedstocks | | 2,240 | | | 1,114 | | | 6,786 | | | 2,104 | |
| Total throughput | Total throughput | | 63,178 | | | 66,252 | | | 66,434 | | | 70,161 | | Total throughput | | 73,123 | | | 60,582 | | | 49,163 | | | 68,079 | |
| Total refining revenue ($ in millions) | Total refining revenue ($ in millions) | | $ | 335.9 | | | $ | 559.9 | | | $ | 999.1 | | | $ | 1,717.7 | | Total refining revenue ($ in millions) | | $ | 687.4 | | | $ | 219.6 | | | $ | 1,007.1 | | | $ | 663.2 | |
| Cost of materials and other ($ in millions) | Cost of materials and other ($ in millions) | | 339.1 | | | 494.4 | | | 1,016.8 | | | 1,501.6 | | Cost of materials and other ($ in millions) | | 668.4 | | | 223.1 | | | 974.0 | | | 677.7 | |
| Total refining margin ($ in millions) | Total refining margin ($ in millions) | | $ | (3.2) | | | $ | 65.5 | | | $ | (17.7) | | | $ | 216.1 | | Total refining margin ($ in millions) | | $ | 19.0 | | | $ | (3.5) | | | $ | 33.1 | | | $ | (14.5) | |
| Per barrel of refined product sales: | Per barrel of refined product sales: | | | | | | | | | Per barrel of refined product sales: | | | | | | | | |
| Krotz Springs refining margin | Krotz Springs refining margin | | $ | (0.50) | | | $ | 9.88 | | | $ | (0.92) | | | $ | 10.53 | | Krotz Springs refining margin | | $ | 2.71 | | | $ | (0.64) | | | $ | 3.56 | | | $ | (1.12) | |
| Direct operating expenses | Direct operating expenses | | $ | 4.25 | | | $ | 4.27 | | | $ | 3.72 | | | $ | 4.18 | | Direct operating expenses | | $ | 3.96 | | | $ | 3.53 | | | $ | 5.19 | | | $ | 3.47 | |
| Crude Slate: (% based on amount received in period) | Crude Slate: (% based on amount received in period) | | | | | | Crude Slate: (% based on amount received in period) | | | | | |
| WTI Crude | WTI Crude | | 72.6 | % | | 78.7 | % | | 69.3 | % | | 73.9 | % | WTI Crude | | 65.0 | % | | 69.7 | % | | 67.9 | % | | 67.7 | % |
| Gulf Coast Sweet Crude | Gulf Coast Sweet Crude | | 24.6 | % | | 21.3 | % | | 29.8 | % | | 26.1 | % | Gulf Coast Sweet Crude | | 33.5 | % | | 30.3 | % | | 30.9 | % | | 32.3 | % |
| Other | Other | | 2.8 | % | | — | % | | 0.9 | % | | — | % | Other | | 1.5 | % | | — | % | | 1.2 | % | | — | % |
(1) Includes inter-refinery sales and sales to other segments which are eliminated in consolidation. See tables below.
(2) Tyler's refining margin per barrel and the adjusted refining margin per barrel for the second quarter 2020 both reflect the $111.0 million margin benefit of favorable fixed price crude cost transactions during the quarter, but exclude the offsetting realized hedging losses of approximately $(111.0) million. Giving effect to the related hedging losses, the refining margin per barrel would have decreased by $(17.49). Such margin impact was unusually large because of the historic volatility in the crude commodities market during the period.
Management's Discussion and Analysis
Included in the refinery statistics above are the following inter-refinery and sales to other segments:
| | Inter-refinery Sales | Inter-refinery Sales | Inter-refinery Sales |
| | Three Months Ended | | Nine Months Ended | | Three Months Ended | | Six Months Ended |
| | September 30, | | September 30, | | June 30, | | June 30, |
| (in barrels per day) | (in barrels per day) | | 2020 | | 2019 | | 2020 | | 2019 | (in barrels per day) | | 2021 | | 2020 | | 2021 | | 2020 |
| | (Unaudited) | | (Unaudited) | | (Unaudited) | | (Unaudited) |
| | Tyler refined product sales to other Delek refineries | Tyler refined product sales to other Delek refineries | | 2,479 | | | 1,543 | | | 1,813 | | 890 | | Tyler refined product sales to other Delek refineries | | 1,797 | | | 2,190 | | | 1,945 | | 1,477 | |
| El Dorado refined product sales to other Delek refineries | El Dorado refined product sales to other Delek refineries | | 854 | | | 3,946 | | | 1,075 | | 2,611 | | El Dorado refined product sales to other Delek refineries | | 961 | | | 1,074 | | | 704 | | 446 | |
| Big Spring refined product sales to other Delek refineries | Big Spring refined product sales to other Delek refineries | | 2,294 | | | 1,754 | | | 1,532 | | 1,190 | | Big Spring refined product sales to other Delek refineries | | 874 | | | 1,269 | | | 801 | | 1,147 | |
| Krotz Springs refined product sales to other Delek refineries | Krotz Springs refined product sales to other Delek refineries | | 14 | | | 15,189 | | | 167 | | 8,785 | | Krotz Springs refined product sales to other Delek refineries | | 590 | | | 197 | | | 297 | | 245 | |
| | Refinery Sales to Other Segments | Refinery Sales to Other Segments | Refinery Sales to Other Segments |
| | Three Months Ended | | Nine Months Ended | | Three Months Ended | | Six Months Ended |
| | September 30, | | September 30, | | June 30, | | June 30, |
| (in barrels per day) | (in barrels per day) | | 2020 | | 2019 | | 2020 | | 2019 | (in barrels per day) | | 2021 | | 2020 | | 2021 | | 2020 |
| | (Unaudited) | | (Unaudited) | | (Unaudited) | | (Unaudited) |
| | Tyler refined product sales to other Delek segments | Tyler refined product sales to other Delek segments | | 1,069 | | | 18 | | | 1,953 | | 192 | | Tyler refined product sales to other Delek segments | | 897 | | | 1,592 | | | 909 | | 2,400 | |
| El Dorado refined product sales to other Delek segments | El Dorado refined product sales to other Delek segments | | 27 | | | 11 | | | 122 | | 106 | | El Dorado refined product sales to other Delek segments | | 11 | | | 11 | | | 9 | | 169 | |
| Big Spring refined product sales to other Delek segments | Big Spring refined product sales to other Delek segments | | 22,835 | | | 24,404 | | | 22,839 | | 25,735 | | Big Spring refined product sales to other Delek segments | | 22,179 | | | 20,570 | | | 22,145 | | 22,841 | |
| Krotz Springs refined product sales to other Delek segments | Krotz Springs refined product sales to other Delek segments | | 1,002 | | | 408 | | | 336 | | | 271 | | Krotz Springs refined product sales to other Delek segments | | 2,069 | | | — | | | 2,038 | | | — | |
| | Pricing Statistics (average for the period presented) | Pricing Statistics (average for the period presented) | Pricing Statistics (average for the period presented) |
| | Three Months Ended | | Nine Months Ended | | Three Months Ended | | Six Months Ended |
| | September 30, | | September 30, | | June 30, | | June 30, |
| | 2020 | | 2019 | | 2020 | | 2019 | | 2021 | | 2020 | | 2021 | | 2020 |
| | (Unaudited) | | (Unaudited) | | (Unaudited) | | (Unaudited) |
| | WTI — Cushing crude oil (per barrel) | WTI — Cushing crude oil (per barrel) | | $ | 40.88 | | | $ | 56.40 | | | $ | 38.95 | | | $ | 57.03 | | WTI — Cushing crude oil (per barrel) | | $ | 66.19 | | | $ | 29.77 | | | $ | 62.21 | | | $ | 37.93 | |
| WTI — Midland crude oil (per barrel) | WTI — Midland crude oil (per barrel) | | $ | 41.03 | | | $ | 56.12 | | | $ | 38.98 | | | $ | 55.81 | | WTI — Midland crude oil (per barrel) | | $ | 66.41 | | | $ | 29.77 | | | $ | 62.74 | | | $ | 37.90 | |
WTS -- Midland crude oil (per barrel) (1) | WTS -- Midland crude oil (per barrel) (1) | | $ | 40.99 | | | $ | 55.94 | | | $ | 38.84 | | | $ | 55.95 | | WTS -- Midland crude oil (per barrel) (1) | | $ | 66.57 | | | $ | 29.61 | | | $ | 62.73 | | | $ | 37.69 | |
LLS (per barrel) (1) | LLS (per barrel) (1) | | $ | 42.46 | | | $ | 60.58 | | | $ | 40.67 | | | $ | 63.32 | | LLS (per barrel) (1) | | $ | 68.04 | | | $ | 31.30 | | | $ | 64.21 | | | $ | 39.73 | |
| Brent crude oil (per barrel) | Brent crude oil (per barrel) | | $ | 43.34 | | | $ | 62.03 | | | $ | 42.56 | | | $ | 64.73 | | Brent crude oil (per barrel) | | $ | 69.08 | | | $ | 33.35 | | | $ | 65.22 | | | $ | 42.16 | |
| | U.S. Gulf Coast 5-3-2 crack spread (per barrel) - utilizing HSD | U.S. Gulf Coast 5-3-2 crack spread (per barrel) - utilizing HSD | | $ | 5.13 | | | $ | 14.18 | | | $ | 5.88 | | | $ | 14.25 | | U.S. Gulf Coast 5-3-2 crack spread (per barrel) - utilizing HSD | | $ | 11.89 | | | $ | 3.66 | | | $ | 11.04 | | | $ | 6.28 | |
U.S. Gulf Coast 5-3-2 crack spread (per barrel) (1) | U.S. Gulf Coast 5-3-2 crack spread (per barrel) (1) | | $ | 7.49 | | | $ | 16.02 | | | $ | 8.30 | | | $ | 15.77 | | U.S. Gulf Coast 5-3-2 crack spread (per barrel) (1) | | $ | 16.72 | | | $ | 6.67 | | | $ | 15.20 | | | $ | 8.74 | |
U.S. Gulf Coast 3-2-1 crack spread (per barrel) (1) | U.S. Gulf Coast 3-2-1 crack spread (per barrel) (1) | | $ | 8.15 | | | $ | 17.55 | | | $ | 8.92 | | | $ | 17.34 | | U.S. Gulf Coast 3-2-1 crack spread (per barrel) (1) | | $ | 18.29 | | | $ | 7.08 | | | $ | 16.38 | | | $ | 9.32 | |
U.S. Gulf Coast 2-1-1 crack spread (per barrel) (1) | U.S. Gulf Coast 2-1-1 crack spread (per barrel) (1) | | $ | 3.51 | | | $ | 12.03 | | | $ | 4.72 | | | $ | 9.73 | | U.S. Gulf Coast 2-1-1 crack spread (per barrel) (1) | | $ | 9.79 | | | $ | 2.35 | | | $ | 8.75 | | | $ | 5.35 | |
| | U.S. Gulf Coast Unleaded Gasoline (per gallon) | U.S. Gulf Coast Unleaded Gasoline (per gallon) | | $ | 1.15 | | | $ | 1.64 | | | $ | 1.07 | | | $ | 1.65 | | U.S. Gulf Coast Unleaded Gasoline (per gallon) | | $ | 1.99 | | | $ | 0.81 | | | $ | 1.85 | | | $ | 1.02 | |
| Gulf Coast Ultra low sulfur diesel (per gallon) | Gulf Coast Ultra low sulfur diesel (per gallon) | | $ | 1.16 | | | $ | 1.85 | | | $ | 1.18 | | | $ | 1.89 | | Gulf Coast Ultra low sulfur diesel (per gallon) | | $ | 1.95 | | | $ | 0.91 | | | $ | 1.83 | | | $ | 1.19 | |
| U.S. Gulf Coast high sulfur diesel (per gallon) | U.S. Gulf Coast high sulfur diesel (per gallon) | | $ | 1.02 | | | $ | 1.74 | | | $ | 1.03 | | | $ | 1.77 | | U.S. Gulf Coast high sulfur diesel (per gallon) | | $ | 1.67 | | | $ | 0.73 | | | $ | 1.58 | | | $ | 1.04 | |
Natural gas (per MMBTU) (2) | Natural gas (per MMBTU) (2) | | $ | 2.12 | | | $ | 2.33 | | | $ | 1.92 | | | $ | 2.56 | | Natural gas (per MMBTU) (2) | | $ | 2.98 | | | $ | 1.75 | | | $ | 2.85 | | | $ | 1.81 | |
(1) For our Tyler and El Dorado refineries, we compare our per barrel refining product margin to the Gulf Coast 5-3-2 crack spread consisting of WTI Cushing crude, U.S. Gulf Coast CBOB(CBOB) and U.S. Gulf Coast Pipeline No. 2 heating oil (ultra low sulfur diesel). For our Big Spring refinery, we compare our $1.02 per barrel refined product margin to the Gulf Coast 3-2-1 crack spread consisting of WTI Cushing crude, Gulf Coast 87 Conventional gasoline and Gulf Coast ultra low sulfur diesel, and for our Krotz Springs refinery, we compare our per barrel refined product margin to the Gulf Coast 2-1-1 crack spread consisting of LLS crude oil, Gulf Coast 87 Conventional gasoline and U.S. Gulf Coast Pipeline No. 2 heating oil (high sulfur diesel). The Tyler refinery's crude oil input is primarily WTI Midland and eastEast Texas, while the El Dorado refinery's crude input is primarily a combination of WTI Midland, local Arkansas and other domestic inland crude oil. The Big Spring refinery’s crude oil input is primarily comprised of WTS and WTI Midland. The Krotz Springs refinery’s crude oil input is primarily comprised of LLS and WTI Midland.
(2) One Million British Thermal Units ("MMBTU").
Management's Discussion and Analysis
Refining Segment Operational Comparison of the Three and NineSix Months Ended SeptemberJune 30, 20202021 versus the Three and NineSix Months Ended SeptemberJune 30, 20192020
Q3Net Revenues
Q2 2021 vs. Q2 2020 vs. Q3 2019
Net revenues for the refining segment decreasedincreased by $613.3$1,338.7 million, or 28.2%124.3%, in the thirdsecond quarter of 20202021 compared to the thirdsecond quarter of 2019,2020, primarily driven by the following:
•decreasesincreases in the average price of U.S. Gulf Coast gasoline of 29.9%145.41%, ULSD of 37.3%114.67%, and HSD of 41.4%.128.18%; and
Such decreases were partially offset by the following:
•increasesan increase in sales volumevolumes of refined and purchased product totaling 0.7of 0.3 million barrels partially due to our El Dorado refinery which was impacted by vacuum unit outage in the comparable prior year period, and a 0.51.0 million barrel increase in purchased product sales.barrels, respectively.
Net revenues included sales to our retail segment of $57.6$91.8 million and $97.3$40.4 million, sales to our logistics segment of $45.1$74.1 million and $66.6$29.7 million, and sales to our other segment of $9.9$22.9 million and $23.9$5.0 million reduction in sales for the three months ended SeptemberJune 30, 20202021 and SeptemberJune 30, 2019,2020, respectively. We eliminate this intercompany revenue in consolidation.
YTD 20202021 vs. YTD 20192020
Net revenues for the refining segment decreasedincreased by $2,268.2$1,350.9 million, or 34.2%48.2%, in the ninesix months ended SeptemberJune 30, 20202021 compared to the ninesix months ended SeptemberJune 30, 2019,2020, primarily driven by the following:
•decreasesincreases in the average price of U.S. Gulf Coast gasoline of 35.4%81.3%, ULSD of 37.7%54.0%, and HSD of 41.7%52.2%; and
•decreases in sales volume of refined product totaling 0.55.0 million barrels, partially due to scheduledthe temporary suspension of crude refining unit production at our Krotz Springs refinery from November 2020 through February 2021 and related turnaround activities, severe weather impacting our refineries in February 2021, and turnaround at our El Dorado refinery, partially offset by a 2.2 million barrel increase in purchased product sales and increased sales volumes at our Big Spring refinery partially offset by increased sales volumes at our El Dorado refinery due towhich was in a turnaround in the prior year scheduled turnaround activities and production issues, and a 2.0 million barrel decrease in purchased product sales due to decreased demand.period.
Net revenues included sales to our retail segment of $166.6$161.5 million and $289.2$109.0 million, sales to our logistics segment of $155.7$139.9 million and $219.2$110.5 million and sales to our other segment of $24.2$43.0 million and $31.5$14.3 million for the ninesix months ended SeptemberJune 30, 20202021 and 2019,2020, respectively. We eliminate this intercompany revenue in consolidation.
Cost of Materials and Other
Q2 2021 vs. Q2 2020
Cost of materials and other increased by $1,393.2 million, or 150.0%, in the second quarter of 2021 compared to the second quarter of 2020, primarily driven by the following:
•increases in the cost of WTI Cushing crude oil, from an average of $29.77 per barrel to an average of $66.19, or 122.3%;
•increases in the cost of WTI Midland crude oil, from an average of $29.77 per barrel to an average of $66.41, or 123.1%;
•an increase attributable to the $9.6 million change in pre-tax inventory valuation benefit recognized during the second quarter of 2021 compared to $193.7 million recognized during the prior year period;
•increase in RINs costs from an average cost per RIN of $0.40 and $0.54 for ethanol and biodiesel RINs, respectively during the second quarter of 2020 to and average of $1.62 and $1.71 during the second quarter of 2021; and
Management's Discussion and Analysis
Cost•a 31% increase purchased product volumes sold.
These increases were partially offset by the following:
•a decrease in hedging losses to a loss $22.6 million recognized during the second quarter of Materials and Other2021 from a loss of $146.8 million recognized during the second quarter of 2020.
Q3YTD 2021 vs. YTD 2020 vs. Q3 2019
Cost of materials and other decreasedincreased by $426.8$1,134.3 million, or 22.4%40.0%, induring the third quarter of 2020six months ended June 30, 2021 compared to the third quarter of 2019,six months ended June 30, 2020, primarily driven by the following:
•decreasesincreases in the cost of WTI Cushing crude oil, from an average of $56.40$37.93 per barrel to an average of $40.88,$62.21, or 27.5%64.0%;
•decreasesincreases in the cost of WTI Midland crude oil, from an average of $56.12$37.90 per barrel to an average of $41.03,$62.74, or 26.9%65.5%;
•increases in RINs costs from an average cost per RIN of $0.34 and $0.51 for ethanol and biodiesel RINs, respectively during the six months ended June 30, 2020 to an average of $1.34 and $1.44 during the six months ended June 30, 2021; and
•a 31% increase purchased product volumes sold.
These increases were partially offset by the following:
•the benefit (expense) of $9.5$30.2 million related to the change in pre-tax inventory valuation recognized during the third quarter of 2020six months ended June 30, 2021 compared to $(20.0)$(75.3) million recognized during the third quarter of 2019.six months ended June 30, 2020; and
These decreases were partially offset by the following:
•a decrease in hedging gainslosses to $3.0$27.6 million recognized during the third quarter of 2020 from $20.0six months ended June 30, 2021 as compared to $66.4 million recognized during the third quarter of 2019; and
•Increase in sales volumes partially due to production issues at El Dorado refinery in the prior year comparable period.
YTD 2020 vs. YTD 2019
Cost of materials and other decreased by $1,315.4 million, or 23.4%, during the ninesix months ended SeptemberJune 30, 2020 compared to the nine months ended September 30, 2019, primarily driven by the following:
•decreases in the cost of WTI Cushing crude oil, from an average of $57.03 per barrel to an average of $38.95, or 31.7%; and2020.
•decreases in the cost of WTI Midland crude oil, from an average of $55.81 per barrel to an average of $38.98, or 30.2%.
These decreases were partially offset by the following:
•the (expense) benefit of $(65.8) million related to the change in pre-tax inventory valuation recognized during the nine months ended September 30, 2020 compared to $31.3 million recognized during the nine months ended September 30, 2019; and
• a decrease in hedging gains to a loss of $63.5 million recognized during the nine months ended September 30, 2020 from a gain of $64.1 million recognized during the nine months ended September 30, 2019;
Our refining segment purchases finished product from our logistics segment and has multiple service agreements with our logistics segment which, among other things, require the refining segment to pay terminalling and storage fees based on the throughput volume of crude and finished product in the logistics segment pipelines and the volume of crude and finished product stored in the logistics segment storage tanks, subject to minimum volume commitments. These costs and fees were $82.7$101.9 million and $55.4$90.0 million during the thirdsecond quarters of 20202021 and 2019,2020, respectively, and $260.8$197.7 million and $159.8$195.7 million during the ninesix months ended SeptemberJune 30, 20202021 and 2019,2020, respectively. We eliminate these intercompany fees in consolidation.
Refining Margin
Q2 2021 vs. Q2 2020
Refining margin decreased by $54.5 million, or 36.7%, in the second quarter of 2021 compared to the second quarter of 2020, primarily driven by the following:
•increases in average RINs costs in the second quarter of 2021 compared to the second quarter of 2020;
•a decrease attributable to the $9.6 million change in pre-tax inventory valuation benefit recognized during the second quarter of 2021 compared to $193.7 million recognized during the prior year period; and
•a 31% increase purchased product volumes sold, while overall sales increased only 4%.
Such decrease was partially offset by the following:
Management's Discussion and Analysis
Refining Margin•a 224.9% improvement in the 5-3-2 crack spread (the primary measure for the Tyler refinery and El Dorado refinery), a 158.3% improvement in the average Gulf Coast 3-2-1 crack spread (the primary measure for the Big Spring refinery), and a 316.6% improvement in the average Gulf Coast 2-1-1 crack spread (the primary measure for the Krotz Springs refinery); and
Q3•a $124.2 million decrease in hedging losses.
YTD 2021 vs. YTD 2020 vs. Q3 2019
Refining margin decreasedincreased by $186.5$216.6 million, or 68.9%714.9%, in the third quarter of 2020six months ended June 30, 2021 compared to the third quarter of 2019,six months ended June 30, 2020, primarily driven by the following:
•a narrowing of75.8% improvement in the 5-3-2 crack spread (the primary measure for the Tyler refinery and El Dorado refinery), a 75.8% decline in the average WTI Cushing crude oil differential to WTS crude oil to $(0.11) per barrel duringGulf Coast 3-2-1 crack spread (the primary measure for the third quarter of 2020 compared to $0.46 during the third quarter of 2019Big Spring refinery), and narrowing of the average WTI Midland crude oil differential to WTI Cushing crude oil to $(0.15) per barrel during the third quarter of 2020 compared to $0.28 per barrel during the third quarter of 2019;
•a narrowing of the discount between WTI Midland crude oil and Brent crude oil where, during the third quarter of 2020, the WTI Midland crude oil differential to Brent crude oil was an average discount of $2.31 per barrel compared to $5.91 per barrel during the third quarter of 2019;
•a 70.8%63.6% decline in the average Gulf Coast 2-1-1 crack spread (the primary measure for the Krotz Springs refinery);
•a 63.8% decline$38.8 million decrease in the 5-3-2 crack spread (the primary measure for the Tyler refinery and El Dorado refinery);
•a 53.6% decline in the average Gulf Coast 3-2-1 crack spread (the primary measure for the Big Spring refinery);hedging losses; and
•a decreasean increase in hedging gains to $3.0 million recognizedreversal benefit of inventory valuation reserve of during the third quarter of 2020 from $20.0 million recognized during the third quartersix months of 2019.2021 compared to the prior year period.
These decreasesincreases were partially offset by the following:
•an increase attributableincreases in average RINs costs during the six months ended June 30, 2021 compared to the $9.5six months ended June 30, 2020; and
•a 31% increase purchased product volumes sold, while overall sales volumes decreased.
Management's Discussion and Analysis
Operating Expenses
Q2 2021 vs. Q2 2020
Operating expenses increased by $25.1 million, changeor 28.3%, in pre-tax inventory valuation benefit recognized during the thirdsecond quarter of 2021 compared to the second quarter of 2020, primarily driven by the following:
•an increase outside services, maintenance and lease costs primarily due to continued repairs and equipment rentals related to Winter Storm Uri, unplanned unit outage at our Tyler refinery, and additional repairs at our Big Spring and Krotz Springs refineries; and
•an increase in variable cost primarily due to increased catalyst cost incurred at our Krotz Springs refinery and higher natural gas costs.
YTD 2021 vs. YTD 2020
Operating expenses increased by $27.0 million, or 13.5%, during the six months ended June 30, 2021 compared to the six months ended June 30, 2020, primarily driven by the following:
•an expense of $20.0 million recognizedincrease outside services, maintenance and lease costs primarily due to continued repairs and equipment rentals related to Winter Storm Uri;
•an increase in utilities costs primarily associated with higher natural gas costs during the prior year period.February 2021 related to Winter Storm Uri.
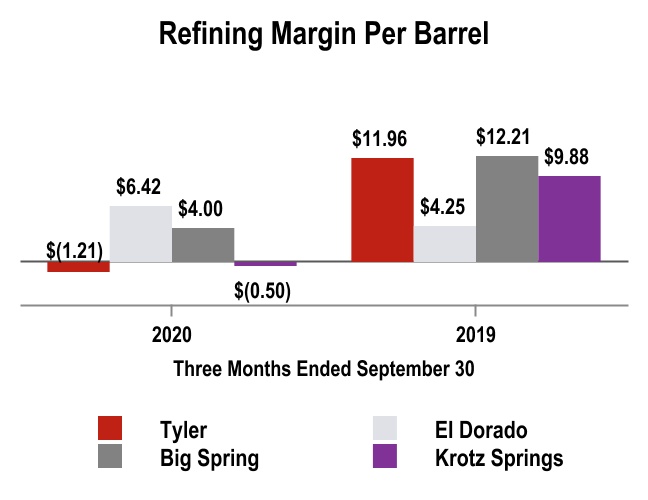
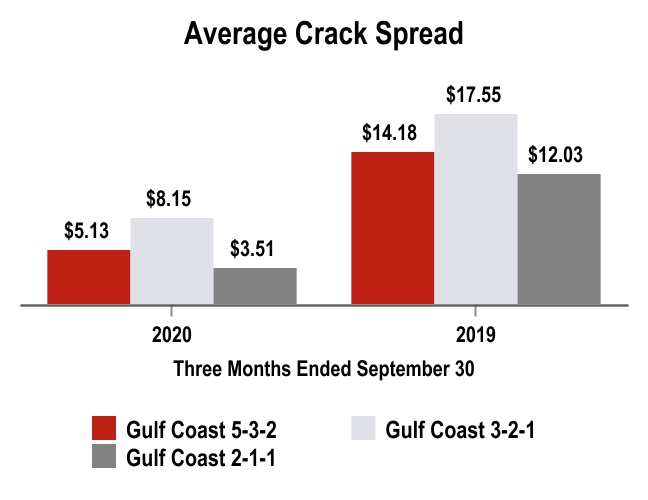
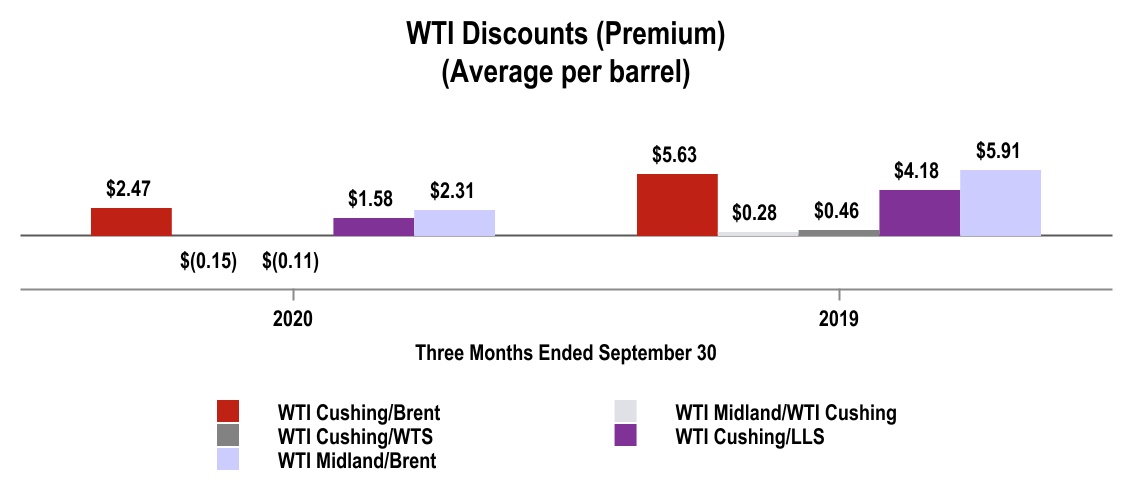
Management's Discussion and Analysis
YTDContribution Margin
Q2 2021 vs. Q2 2020 vs. YTD 2019
RefiningContribution margin decreased by $952.8$79.6 million, or 94.6%,a 6.4% decline in contribution margin percentage, in the nine months ended September 30, 2020second quarter of 2021 compared to the nine months ended September 30, 2019,second quarter of 2020, primarily driven by the following:
•a narrowing of the average discount between WTI Midland crude oil compared to WTI Cushing where, during the nine months of 2020, the average WTI Midland crude oil differential to WTI Cushing crude oil was $(0.03) per barrel compared to $1.22 during the nine months of 2019;
•a narrowing of the average discount between WTI Midland crude oil and Brent crude oil where, during the nine months of 2020, the WTI Midland crude oil differential to Brent crude oil was an average discount of $3.58 per barrel compared to $8.92 per barrel during the same period of 2019;
•a narrowing of the average WTI Cushing crude oil differential to WTS crude oil to $0.11 per barrel during the nine months of 2020 compared to $1.08 during the nine months of 2019;
•a narrowing of the discount between WTI Cushing crude oil compared to Brent where, during the nine months of 2020, the average WTI Cushing crude oil differential to Brent crude oil was $3.88 per barrel compared to $7.70 during the nine months of 2019;
•a 58.7% decline in the 5-3-2 crack spread (the primary measure for the Tyler refinery and El Dorado refinery), a 48.6% decline in the average Gulf Coast 3-2-1 crack spread (the primary measure for the Big Spring refinery), and a 51.5% decline in the average Gulf Coast 2-1-1 crack spread (the primary measure for the Krotz Springs refinery);
•a decrease in hedging gains to a loss of $(63.5) million recognized during the nine months of 2020 from a gain of $64.1 million recognized during the nine months of 2019; and
•refining margin primarily driven by higher average RINs costs, a decrease in reversal benefit ofrelated to inventory valuation reserve and higher percentage of duringpurchased product sold, partially offset by improved crack spreads and decrease in hedging losses; and
•an increase in operating expenses of $25.1 million, or 28.3%.
YTD 2021 vs. YTD 2020
Contribution margin increased by $189.6 million for the during the ninesix months of 2020ended June 30, 2021 compared to the prior year period.six months ended June 30, 2020, primarily driven by the following:
•an increase in refining margin primarily driven by an overall increase in the average crack spreads, an increase in reversal benefit related to inventory valuation reserves and decrease in hedging losses, partially offset by higher percentage of purchased product sold and increase in average RINs cost.
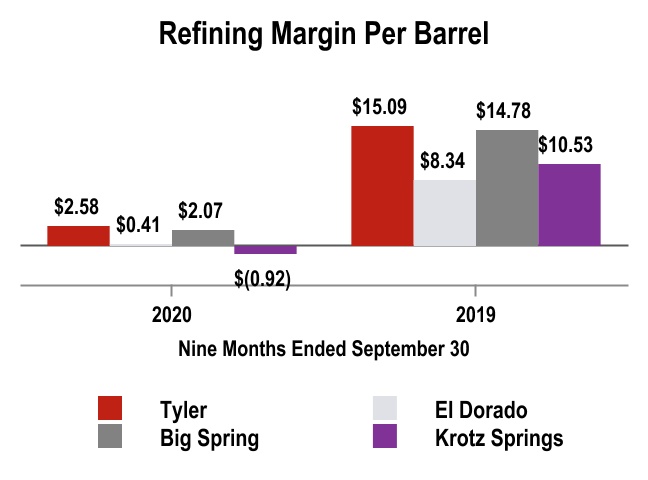
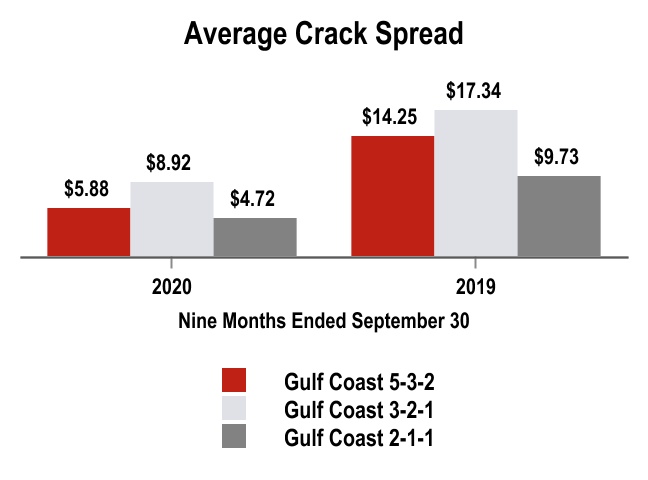
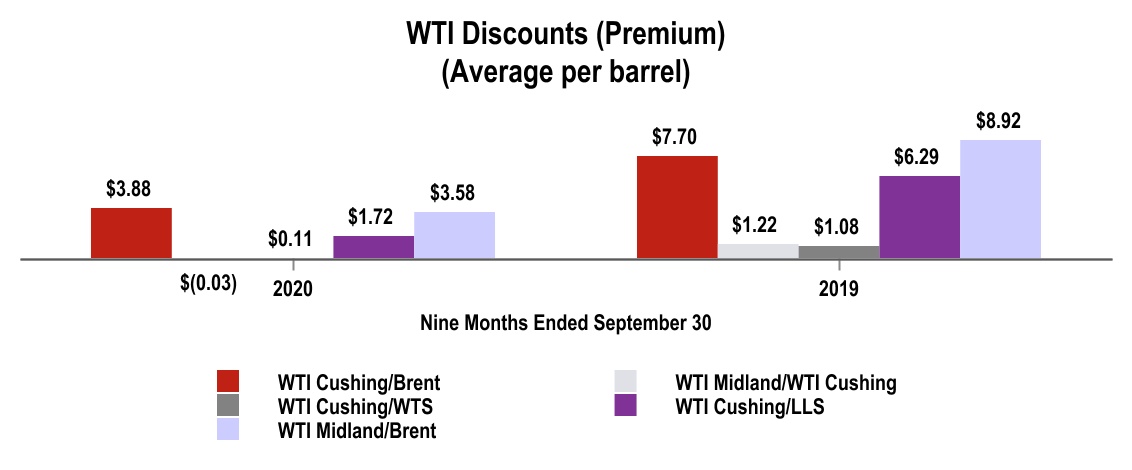
•an increase in operating expenses of $27.0 million, or 13.5%
Management's Discussion and Analysis
Operating Expenses
Q3 2020 vs. Q3 2019
Operating expenses decreased by $18.6 million, or 15.4%, in the third quarter of 2020 compared to the third quarter of 2019, primarily driven by the following:
•decreases in contractor and maintenance costs partially due to cost reduction measures taken in the third quarter of 2020; and
•decreases in employee related costs primarily related to decrease in incentive plan and workforce optimization to reduce overtime rates in the third quarter of 2020; and
•reduced costs as a result of the sale of the Bakersfield refinery in May 2020.
YTD 2020 vs. YTD 2019
Operating expenses decreased by $54.2 million, or 15.2%, during the nine months ended September 30, 2020 compared to the nine months ended September 30, 2019, primarily driven by the following:
•decrease in contract services and inspection costs associated with cost reduction measures taken in the nine months of 2020;
•decrease in maintenance costs due to deferral of projects amidst the COVID-19 Pandemic, and the incurrence of extraordinary maintenance costs at our Big Spring refinery in the comparable prior year period; and
•decreases in utilities and catalyst costs, primarily at our Big Spring and Krotz Springs refineries related to reduced throughput due to turnaround and unit downtime, respectively; and
•reduced costs as a result of the sale of the Bakersfield refinery in May 2020.
Contribution Margin
Q3 2020 vs. Q3 2019
Contribution margin decreased by $167.9 million, or an 8.0% reduction in contribution margin percentage, in the third quarter of 2020 compared to the third quarter of 2019, primarily driven by the following:
•the decline of the Midland WTI crude oil differential to Brent crude oil compared to the prior-year period;
•an overall decline in the average crack spreads; and
•a narrowing of the discount between WTI Cushing and WTS crude oil compared to the third quarter of 2019.
These decreases were partially offset by the following:
•an increase in reversal benefit related to inventory valuation reserve of during the third quarter of 2020 compared to prior year period; and
• decreases in operating expenses across all refineries.
YTD 2029 vs. YTD 2019
Contribution margin decreased by $898.6 million for the nine months ended September 30, 2020 compared to the nine months ended September 30, 2019, primarily driven by the following:
•the decline of the Midland WTI crude oil differential to Brent crude oil compared to the prior-year period;
•reduced performance at our Big Spring refinery due to turnaround;
•an overall decline in the average crack spreads;
•an decrease in reversal benefit related to inventory valuation reserves recognized during the nine months of 2020 compared to the prior year period; and
•a narrowing of the discount between WTI Cushing and WTI crude oil compared to the prior-year period.
These decreases were partially offset by decreases in operating expenses across all refineries.
Management's Discussion and Analysis
The table below sets forth certain information concerning our logistics segment operations ($ in millions, except per barrel amounts):
| | Logistics Contribution Margin and Operating Information | Logistics Contribution Margin and Operating Information | Logistics Contribution Margin and Operating Information |
| | Three Months Ended | | Nine Months Ended | | Three Months Ended | | Six Months Ended |
| | September 30, | | September 30, | | June 30, | | June 30, |
| | 2020 | | 2019 | | 2020 | | 2019 | | 2021 | | 2020 | | 2021 | | 2020 |
| Net revenues | Net revenues | | $ | 142.2 | | | $ | 137.6 | | | $ | 423.3 | | | $ | 445.4 | | Net revenues | | $ | 168.5 | | | $ | 117.7 | | | $ | 321.4 | | | $ | 281.1 | |
| Cost of materials and other | Cost of materials and other | | 60.7 | | | 72.6 | | | 205.9 | | | 262.7 | | Cost of materials and other | | 88.8 | | | 43.9 | | | 169.9 | | | 145.2 | |
| Operating expenses (excluding depreciation and amortization) | Operating expenses (excluding depreciation and amortization) | | 14.3 | | | 18.4 | | | 41.5 | | | 51.8 | | Operating expenses (excluding depreciation and amortization) | | 15.5 | | | 12.4 | | | 29.6 | | | 27.2 | |
| Contribution margin | Contribution margin | | $ | 67.2 | | | $ | 46.6 | | | $ | 175.9 | | | $ | 130.9 | | Contribution margin | | $ | 64.2 | | | $ | 61.4 | | | $ | 121.9 | | | $ | 108.7 | |
| Operating Information: | Operating Information: | | | | | | | | | Operating Information: | | | | | | | | |
East Texas - Tyler Refinery sales volumes (average bpd) (1) | East Texas - Tyler Refinery sales volumes (average bpd) (1) | | 73,417 | | | 83,953 | | | 70,376 | | | 74,607 | | East Texas - Tyler Refinery sales volumes (average bpd) (1) | | 74,565 | | | 65,028 | | | 73,271 | | | 68,839 | |
| Big Spring wholesale marketing throughputs (average bpd) | Big Spring wholesale marketing throughputs (average bpd) | | 78,659 | | | 80,203 | | | 73,701 | | | 83,608 | | Big Spring wholesale marketing throughputs (average bpd) | | 75,136 | | | 76,004 | | | 74,038 | | | 71,195 | |
| | West Texas wholesale marketing throughputs (average bpd) | West Texas wholesale marketing throughputs (average bpd) | | 9,948 | | | 9,535 | | | 11,718 | | | 11,446 | | West Texas wholesale marketing throughputs (average bpd) | | 9,395 | | | 9,143 | | | 9,765 | | | 12,612 | |
| West Texas wholesale marketing margin per barrel | West Texas wholesale marketing margin per barrel | | $ | 3.42 | | | $ | 4.82 | | | $ | 2.37 | | | $ | 4.83 | | West Texas wholesale marketing margin per barrel | | $ | 4.24 | | | $ | 0.64 | | | $ | 3.81 | | | $ | 1.96 | |
Terminalling throughputs (average bpd) (2) | Terminalling throughputs (average bpd) (2) | | 160,843 | | | 170,727 | | | 145,240 | | | 160,621 | | Terminalling throughputs (average bpd) (2) | | 139,987 | | | 138,593 | | | 142,250 | | | 136,961 | |
| Throughputs (average bpd): | Throughputs (average bpd): | | | | | | Throughputs (average bpd): | | | | | |
| Lion Pipeline System: | Lion Pipeline System: | | | | | | Lion Pipeline System: | | | | | |
| Crude pipelines (non-gathered) | Crude pipelines (non-gathered) | | 78,244 | | | 49,477 | | | 76,750 | | | 43,446 | | Crude pipelines (non-gathered) | | 53,316 | | | 79,066 | | | 48,743 | | | 75,995 | |
| Refined products pipelines to Enterprise Systems | Refined products pipelines to Enterprise Systems | | 55,740 | | | 43,518 | | | 55,315 | | | 32,242 | | Refined products pipelines to Enterprise Systems | | 39,193 | | | 56,093 | | | 32,806 | | | 55,110 | |
| SALA Gathering System | SALA Gathering System | | 13,659 | | | 21,632 | | 13,520 | | | 21,143 | SALA Gathering System | | 17,430 | | | 9,447 | | | 14,670 | | | 13,449 |
| East Texas Crude Logistics System | East Texas Crude Logistics System | | 22,591 | | | 25,391 | | 15,705 | | | 21,045 | East Texas Crude Logistics System | | 27,497 | | | 10,275 | | | 26,790 | | | 12,224 |
Big Spring Gathering Assets (3) | Big Spring Gathering Assets (3) | | 90,719 | | | — | | | 85,845 | | | — | | Big Spring Gathering Assets (3) | | 79,589 | | | 105,162 | | | 76,672 | | | 105,162 | |
| Plains Connection System | Plains Connection System | | 104,314 | | | — | | | 96,961 | | | — | | Plains Connection System | | 122,529 | | | — | | | 115,484 | | | — | |
|
(1)Excludes jet fuel and petroleum coke.
(2)Consists of terminalling throughputs at our Tyler, Big Spring, Big Sandy and Mount Pleasant, Texas terminals, El Dorado and North Little Rock, Arkansas terminals and Memphis and Nashville, Tennessee terminals.
(3)ThroughputsPrior-year period throughputs for the Big Spring Gathering Assets are for the approximately 18091 days we owned the assets following the Big Spring Gathering Assets Acquisition effective March 31, 2020.
Logistics Segment Operational Comparison of the Three and NineSix Months Ended SeptemberJune 30, 20202021 versus the Three and NineSix Months Ended SeptemberJune 30, 20192020
Net Revenues
Q3Q2 2021 vs. Q2 2020 vs. Q3 2019
Net revenues increased by $4.6$50.8 million, or 3.3%43.2%, in the thirdsecond quarter of 20202021 compared to the thirdsecond quarter of 2019,2020, primarily driven by the following:
•increasedan increase in revenues associated with agreements executed in connection with Big Spring Gathering System and Delek Trucking acquisitions, which were effective April 1,March 31, 2020 and May 1, 2020, respectively. Refer to Note 4 of the condensed consolidated financial statements in Item 1. Financial Statements, for additional information.
Such increase was partially offset by the following:
•decreasesincreases in the average volumes of gasoline and diesel sold and in the average sales prices per gallon of gasoline and diesel partially offset by in the average sales volume of dieselsold in our West Texas marketing operations.operations:
◦the average volumes of gasoline and diesel sold decreased by 0.3 million gallons and 0.7 million gallons, respectively.
◦the average sales prices of gasoline and diesel and gasoline sold decreased $0.76increased by $1.14 per gallon and $0.60$1.08 per gallon, respectively.
◦the average volumes of diesel sold increased 1.8 million gallons, partially offset by a 0.1 million decrease of gasoline gallons sold.
Net revenues included sales to our refining segment of $92.4$101.9 million and $65.4$90.0 million for the three months ended SeptemberJune 30, 20202021 and SeptemberJune 30, 2019,2020, respectively, and sales to our other segment of $0.4$0.5 million and $0.8$0.4 million for the three months ended SeptemberJune 30, 20202021 and 2019,2020, respectively. We eliminate this intercompany revenue in consolidation.
YTD 2021 vs. YTD 2020
Net revenues increased by $40.3 million, or 14.3%, in the six months ended June 30, 2021 compared to the six months ended June 30, 2020, primarily driven by the following:
Management's Discussion and Analysis
YTD 2020 vs. YTD 2019
Net revenues decreased by $22.1 million, or 5.0%, in the nine months ended September 30, 2020 compared to the nine months ended September 30, 2019, primarily driven by the following:
•decreases in the average sales prices per gallon and volumes of diesel gallon sold, partially offset by increases in the average sales volume of gasoline in our West Texas marketing operations:
◦the average volumes of gasoline sold increased 14.3 million gallons, partially offset by a 9.7 million decrease of diesel gallons sold.
◦the average sales prices per gallon of gasoline and diesel sold decreased $0.51 per gallon and $0.71 per gallon, respectively.
Such decrease was partially offset by the following:
•increased revenues associated with agreements executed in connection with Big Spring Gathering System and Delek Trucking acquisitions, which were effective March 31, 2020 and May 1, 2020, respectively. Refer to Note 4 of the condensed consolidated financial statements in Item 1. Financial Statements, for additional information.
•increased revenues at our SALA Gathering System and MagnoliaBig Spring Refinery Crude Pipeline (the "BSR Crude Pipeline"), as a result of increased throughputnew contracts executed in the second quarter of 2020, during the ninesix months ended SeptemberJune 30, 20202021 when compared to the ninesix months ended SeptemberJune 30, 2019.2020.
•increases in the average sales prices per gallon of gasoline and diesel sold, partially offset by decreases in the average volumes of gasoline and diesel sold in our West Texas marketing operations:
◦the average sales prices per gallon of gasoline and diesel sold increased $0.57 per gallon and $0.55 per gallon, respectively.
◦the average volumes of gasoline sold increased 13.6 million gallons, partially offset by a 8.5 million decrease of diesel gallons sold.
Such increases were partially offset by the following:
•decreases in throughputs due to the impact of the severe freezing conditions that affected most of the regions where we operate resulting in lower volumes outside of contractual minimum volume commitments during the six months ended June 30, 2021 when compared to the six months ended June 30, 2020.
•decreases in throughputs at the Paline pipeline due to scheduled pipeline maintenance.
Net revenues included sales to our refining segment of $288.3$197.7 million and $187.5$195.7 million for the ninesix months ended SeptemberJune 30, 20202021 and 2019,2020, respectively, and sales to our other segment of $1.6$0.9 million and $3.6$1.2 million for the ninesix months ended SeptemberJune 30, 20202021 and 2019,2020, respectively. We eliminate this intercompany revenue in consolidation.
Management's Discussion and Analysis
Cost of Materials and Other
Q3Q2 2021 vs. Q2 2020 vs. Q3 2019
Cost of materials and other for the logistics segment decreased $11.9increased $44.9 million, or 16.4%102.3%, in the thirdsecond quarter of 20202021 compared to the thirdsecond quarter of 20192020 primarily driven by the following:
•decreasesincreases in the average cost per gallon of gasoline and diesel sold, and increases in the volume of diesel and gasoline sold in our West Texas marketing operations:
◦the average volumes of gasoline and diesel sold increased by 0.3 million gallons and 0.7 million gallons, respectively.
◦the average cost per gallon of gasoline and diesel sold increased $1.21 per gallon and $1.04 per gallon, respectively.
Our logistics segment purchased product from our refining segment of $74.1 million and $29.7 million for the three months ended June 30, 2021 and June 30, 2020, respectively. We eliminate these intercompany costs in consolidation.
YTD 2021 vs. YTD 2020
Cost of materials and other for the logistics segment increased $24.7 million, or 17.0%, in the six months ended June 30, 2021 compared to the six months ended June 30, 2020 primarily driven by the following:
•increases in the average cost per gallon of gasoline and diesel sold, partially offset by increasesdecreases in averagesthe average volumes of gasoline and diesel sold in our West Texas marketing operations:
◦the average cost per gallon of gasoline and diesel sold decreased $0.53increased $0.62 per gallon and $0.74$0.52 per gallon, respectively.
◦the average volumes of dieselgasoline sold increased by 1.813.6 million gallons, partially offset by a 0.18.5 million increase in gasolinedecrease of diesel gallons sold.
Our logistics segment purchased product from our refining segment of $45.1$139.9 million and $66.6$110.5 million for the threesix months ended SeptemberJune 30, 20202021 and SeptemberJune 30, 2019,2020, respectively. We eliminate these intercompany costs in consolidation.
YTD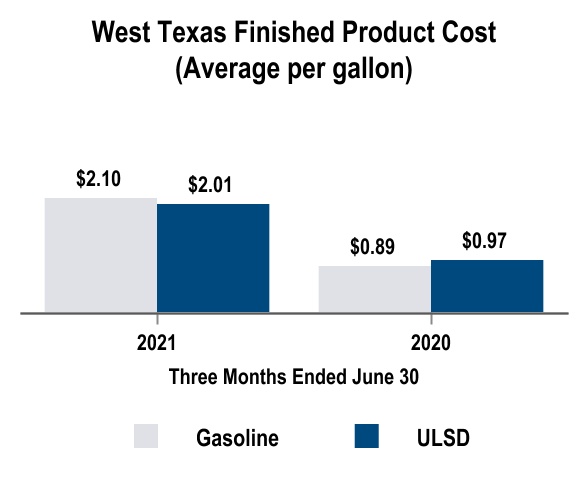
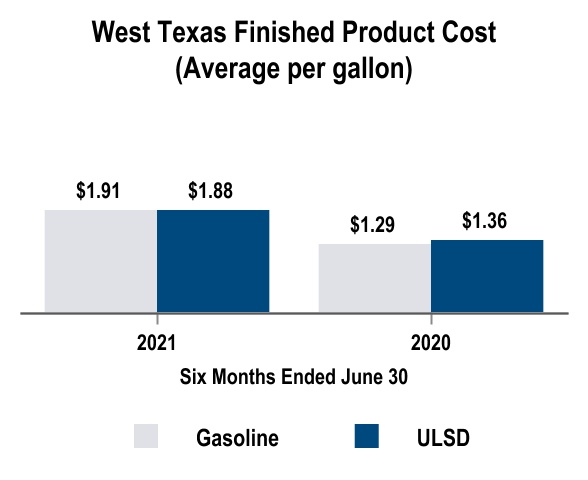
Operating Expenses
Q2 2021 vs. Q2 2020 vs. YTD 2019
Cost of materials and other for the logistics segment decreased $56.8Operating expenses increased by $3.1 million, or 21.6%25.0%, in the nine months ended September 30, 2020second quarter of 2021 compared to the nine months ended September 30, 2019 primarilysecond quarter of 2020, driven by the following:
•decreasesincreases in employee and outside service costs due to reduction of cost cutting measures were implemented to respond to the COVID-19 Pandemic such as delaying non-essential projects; and
•increases in utilities and other variable expenses due to higher throughput.
YTD 2021 vs. YTD 2020
Operating expenses increased by $2.4 million, or 8.8%, in the average volumes of diesel sold and average cost per gallon of gasoline and diesel sold, partially offsetsix months ended June 30, 2021 compared to the six months ended June 30, 2020, driven by the following:
•increases in employee and outside service costs due to the average volumesreduction of gasoline sold in our West Texas marketing operations:
◦cost cutting measures were implemented to respond to the average volumes of gasoline sold increased 14.3 million gallons, partially offset by a 9.7 million decrease of diesel gallons sold.COVID-19 Pandemic such as delaying non-essential projects;
◦the average cost per gallon of gasoline and diesel sold decreased $0.44 per gallon and $0.66 per gallon, respectively.
Our logistics segment purchased product from our refining segment of $155.7 million and $219.2 million for the nine months ended September 30, 2020 and September 30, 2019, respectively. We eliminate these intercompany costs in consolidation.
Management's Discussion and Analysis
Operating Expenses
Q3 2020 vs. Q3 2019
Operating expenses decreased by $4.1 million, or 22.3%, in the third quarter of 2020 compared to the third quarter of 2019, driven by the following:
•decrease in employee and outside services costs due to cost reduction measures implemented to respond to COVID-19 including delaying non-essential projects; and
•decrease in utilities and other variable expenses due to lower production.
YTD 2020 vs. YTD 2019
Operating expenses decreased by $10.3 million, or 19.9%, in the nine months ended September 30, 2020 compared to the nine months ended September 30, 2019, driven by the following:
•decrease in employee and outside services costs due to measures implemented to respond to COVID-19 including delaying non-essential projects;
•lower operating costs associated with allocated contract services pertaining to certain of our assets; and
•decreasesincreases in variable expenses such as utilities, maintenance and materials costs due to lower production.higher throughput; and
•increases in utility costs as a result of significantly higher energy costs during the February 2021 severe freezing conditions that affected most of the regions where we operate.
Contribution Margin
Q3Q2 2021 vs. Q2 2020 vs. Q3 2019
Contribution margin increased by $20.6$2.8 million, or 44.2%4.6%, in the thirdsecond quarter of 20202021 compared to the thirdsecond quarter of 2019,2020, primarily driven by the following:
•an increase in volumes sold and increase in gross margin of $3.60 per barrel in our West Texas marketing operations; and
•increases in revenues associated with agreements executed in connection with Big Spring Gathering System and Delek Trucking acquisitions; and
•decreases in operating expenses.acquisitions.
Such increases were partially offset by the following:
•decreasesan increase in the volumes combined with a decrease in gross margin of $1.4 per barrel in our West Texas marketing operations.operating expenses.
YTD 20202021 vs. YTD 20192020
Contribution margin increased by $45.0$13.2 million, or 34.4%12.1%, in the ninesix months ended SeptemberJune 30, 20202021 compared to the ninesix months ended SeptemberJune 30, 2019,2020, primarily driven by the following:
•an increase in gross margin of $1.85 per barrel in our West Texas marketing operations; and
•increases in revenues associated with agreements executed in connection with Big Spring Gathering System and Delek Trucking acquisitions, Magnolia Pipeline, and SALA Gathering system; and
•decreases in operating expenses.acquisitions.
Such increases were partially offset by the following:
•decreasesa decrease in gross margin per barrelgasoline and diesel volumes sold of $2.46 in our West Texas marketing operations.operations; and
•an increase in operating expenses.
Management's Discussion and Analysis
The table below sets forth certain information concerning our retail segment operations (gross sales $ in millions):
| | Retail Contribution Margins | Retail Contribution Margins | Retail Contribution Margins |
| | Three Months Ended | | Nine Months Ended | | Three Months Ended | | Six Months Ended |
| | September 30, | | September 30, | | June 30, | | June 30, |
| | | | 2020 | | 2019 | | 2020 | | 2019 | | | 2021 | | 2020 | | 2021 | | 2020 |
| Net revenues | Net revenues | | $ | 177.7 | | | $ | 218.5 | | | $ | 521.7 | | | $ | 640.2 | | Net revenues | | $ | 209.0 | | | $ | 165.4 | | | $ | 383.8 | | | $ | 344.0 | |
| Cost of materials and other | Cost of materials and other | | 136.3 | | | 176.4 | | | 400.0 | | | 521.9 | | Cost of materials and other | | 164.7 | | | 119.6 | | | 301.2 | | | 263.7 | |
| Operating expenses (excluding depreciation and amortization) | Operating expenses (excluding depreciation and amortization) | | 23.1 | | | 23.5 | | | 66.8 | | | 71.9 | | Operating expenses (excluding depreciation and amortization) | | 22.4 | | | 21.5 | | | 43.8 | | | 43.7 | |
| Contribution margin | Contribution margin | | $ | 18.3 | | | $ | 18.6 | | | $ | 54.9 | | | $ | 46.4 | | Contribution margin | | $ | 21.9 | | | $ | 24.3 | | | $ | 38.8 | | | $ | 36.6 | |
| | Operating Information | Operating Information | Operating Information |
| | | | Number of stores (end of period) | Number of stores (end of period) | | 253 | | | 263 | | | 253 | | | 263 | | Number of stores (end of period) | | 252 | | | 253 | | | 252 | | | 253 | |
| Average number of stores | Average number of stores | | 253 | | | 263 | | | 253 | | | 263 | | Average number of stores | | 252 | | | 253 | | | 252 | | | 253 | |
| Average number of fuel stores | Average number of fuel stores | | 248 | | | 255 | | | 248 | | | 255 | | Average number of fuel stores | | 247 | | | 248 | | | 247 | | | 248 | |
| Retail fuel sales | Retail fuel sales | | $ | 90.9 | | | $ | 137.4 | | | $ | 273.8 | | | $ | 400.1 | | Retail fuel sales | | $ | 124.5 | | | $ | 75.9 | | | $ | 224.6 | | | $ | 182.9 | |
| Retail fuel sales (thousands of gallons) | Retail fuel sales (thousands of gallons) | | 45,096 | | | 54,943 | | | 135,471 | | | 162,576 | | Retail fuel sales (thousands of gallons) | | 42,978 | | | 42,436 | | | 82,744 | | | 90,376 | |
| Average retail gallons sold per average number of fuel stores (in thousands) | Average retail gallons sold per average number of fuel stores (in thousands) | | 182 | | | 215 | | | 547 | | | 638 | | Average retail gallons sold per average number of fuel stores (in thousands) | | 174 | | | 171 | | | 336 | | | 365 | |
| Average retail sales price per gallon sold | Average retail sales price per gallon sold | | $ | 2.01 | | | $ | 2.50 | | | $ | 2.02 | | | $ | 2.46 | | Average retail sales price per gallon sold | | $ | 2.90 | | | $ | 1.79 | | | $ | 2.71 | | | $ | 2.02 | |
Retail fuel margin ($ per gallon) (1) | Retail fuel margin ($ per gallon) (1) | | $ | 0.311 | | | $ | 0.315 | | | $ | 0.352 | | | $ | 0.269 | | Retail fuel margin ($ per gallon) (1) | | $ | 0.389 | | | $ | 0.445 | | | $ | 0.370 | | | $ | 0.372 | |
| Merchandise sales (in millions) | Merchandise sales (in millions) | | $ | 86.8 | | | $ | 81.5 | | | $ | 247.9 | | | $ | 240.2 | | Merchandise sales (in millions) | | $ | 84.5 | | | $ | 89.4 | | | $ | 159.2 | | | $ | 161.1 | |
| Merchandise sales per average number of stores (in millions) | Merchandise sales per average number of stores (in millions) | | $ | 0.3 | | | $ | 0.3 | | | $ | 1.0 | | | $ | 0.9 | | Merchandise sales per average number of stores (in millions) | | $ | 0.3 | | | $ | 0.4 | | | $ | 0.6 | | | $ | 0.6 | |
| Merchandise margin % | Merchandise margin % | | 31.6 | % | | 30.5 | % | | 31.3 | % | | 30.9 | % | Merchandise margin % | | 32.7 | % | | 30.8 | % | | 32.7 | % | | 31.1 | % |
|
| Same-Store Comparison (2) | Same-Store Comparison (2) | Same-Store Comparison (2) |
| | | Three Months Ended | | Nine Months Ended | | Three Months Ended | | Six Months Ended |
| | September 30, | | September 30, | | June 30, | | June 30, |
| | 2020 | | 2019 | | 2020 | | 2019 | | 2021 | | 2020 | | 2021 | | 2020 |
Change in same-store fuel gallons sold | Change in same-store fuel gallons sold | | (18.8) | % | | 3.0 | % | | (15.6) | % | | 3.1 | % | Change in same-store fuel gallons sold | | 1.3 | % | | (19.7) | % | | (10.7) | % | | (13.9) | % |
| | Change in same-store merchandise sales | Change in same-store merchandise sales | | 8.7 | % | | (1.5) | % | | 8.8 | % | | (1.3) | % | Change in same-store merchandise sales | | (5.4) | % | | 13.1 | % | | (1.9) | % | | 7.6 | % |
(1)Retail fuel margin represents gross margin on fuel sales in the retail segment, and is calculated as retail fuel sales revenue less retail fuel cost of sales. The retail fuel margin per gallon calculation is derived by dividing retail fuel margin by the total retail fuel gallons sold for the period.
(2)Same-store comparisons include period-over-period increases or decreaseschanges in specified metrics for stores that were in service at both the beginning of the earliest period and the end of the most recent period used in the comparison.
Retail Segment Operational Comparison of the Three and NineSix Months Ended SeptemberJune 30, 20202021 versus the Three and NineSix Months Ended SeptemberJune 30, 20192020
Net Revenue
Q3Q2 2021 vs. Q2 2020 vs. Q3 2019
Net revenues for the retail segment decreasedincreased by $40.8$43.6 million, or 18.7%26.4%, in the thirdsecond quarter of 20202021 compared to the thirdsecond quarter of 2019,2020, primarily driven by the following:
•an increase in total fuel sales which were $90.9$124.5 million in the thirdsecond quarter of 2021 compared to $75.9 million in the second quarter of 2020, comparedprimarily attributable to $137.4an increase of $1.11 in average price charged per gallon sold; and
•slightly offset by a decrease in merchandise sales to $84.5 million in the thirdsecond quarter of 2019,2021 compared to $89.4 million in the second quarter of 2020 attributable to the following:a same-store sales decrease of 5.4%.
Management's Discussion and Analysis
◦a decrease in total retail fuel gallons sold for the retail segment to 45.1 million gallons in the third quarter of 2020 compared to 54.9 million gallons in the third quarter of 2019 associated with same-store decrease in fuel volumes of 18.8%, primarily due to demand slowdown as a result of the COVID-19 Pandemic; and
◦a $0.49 decrease in average price charged per gallon.
•merchandise sales were $86.8 million in the third quarter of 2020 compared to $81.5 million in the third quarter of 2019 attributable to the following:
◦same-store sales increase of 8.7% primarily due to strong sales growth for key categories such as beer, cigarettes and packaged beverages, partially offset by $1.5 million decrease related to reduction in number of stores period over period.
YTD 20202021 vs. YTD 20192020
Net revenues for the retail segment decreasedincreased by $118.5$39.8 million, or 18.5%11.6%, in the ninesix months ended SeptemberJune 30, 20202021 compared to the ninesix months ended SeptemberJune 30, 2019,2020, primarily driven by the following:
•an increase in total fuel sales which were $273.8$224.6 million in the ninesix months of 2021 compared to $182.9 million in the six months of 2020, compared to $400.1 million in the nine months of 2019,primarily attributable to the following:
◦a $0.69 increase in average price charged per gallon sold, slightly offset by a decrease in total retail fuel gallons sold of 135.5sold; and
•slightly offset by a decrease in merchandise sales to $159.2 million gallons in the ninesix months of 2021 compared to $161.1 million in the six months of 2020, primarily driven by the same-store sales decrease of 1.9%
Cost of Materials and Other
Q2 2021 vs. Q2 2020
Cost of materials and other for the retail segment increased by $45.1 million, or 37.7%, in the second quarter of 2021 compared to 162.6 million gallons in the nine months of 2019, primarily attributable to same-store decline in fuel volumes of 15.6%, primarily due to demand slowdown in the nine monthssecond quarter of 2020, as a result ofprimarily driven by the COVID-19 Pandemic;following:
◦•a $0.44 decreasean increase in average price chargedcost per gallon; and
◦$11.4 million decrease relatedgallon of $1.16 or 86.5% applied to reduction in number of storesfuel sales volumes that increased period over period.
•Our retail segment purchased finished product from our refining segment of $91.8 million and $40.4 million for the merchandise sales were $247.9three months ended June 30, 2021 and June 30, 2020, respectively. We eliminate this intercompany cost in consolidation.
YTD 2021 vs. YTD 2020
Cost of materials and other for the retail segment increased by $37.5 million, or 14.2%, in the ninesix months of 2020ended June 30, 2021 compared to $240.2 million in the ninesix months of 2019ended June 30, 2020, primarily driven by the following:
▪•same-storean increase in average cost per gallon of $0.69 or 41.9% applied to fuel sales increase of 8.8% due to strong sales growth for key categories such as beer, cigarettes and packaged beverages, partially offset by $11.8 million decrease related to reduction in number of storesvolumes that decreased slightly period over period.
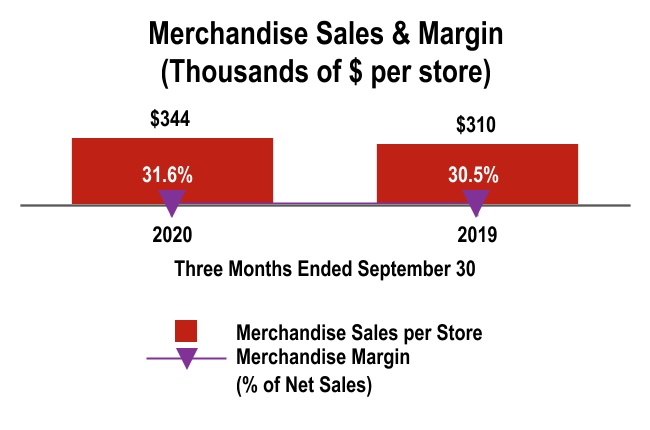
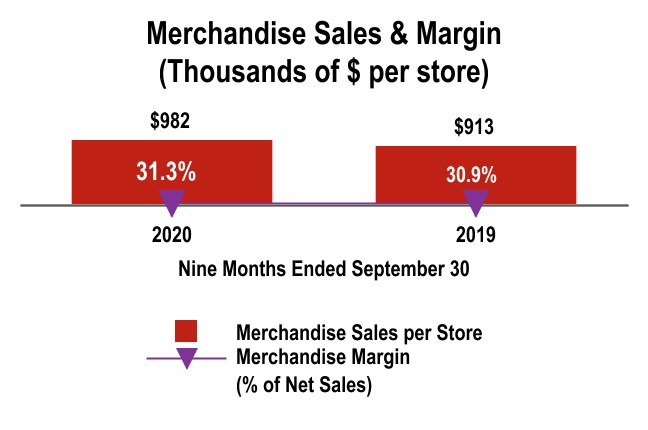
Management's Discussion and Analysis
CostOperating Expenses
Q2 2021 vs. Q2 2020
Operating expenses for the retail segment increased by $0.9 million, or 4.2% in the second quarter of Materials and Other2021 compared to the second quarter of 2020.
Q3YTD 2021 vs. YTD 2020
Operating expenses for the retail segment increased by $0.1 million, or 0.2% in the six months ended June 30, 2021 compared to the six months ended June 30, 2020.
Contribution Margin
Q2 2021 vs. Q3 2019Q2 2020
Cost of materials and otherContribution margin for the retail segment decreased by $40.1$2.4 million, or 22.7%9.9%, in the thirdsecond quarter of 20202021 compared to the thirdsecond quarter of 2019,2020, primarily driven by the following:
•a decrease in average costfuel margin of $0.0570 per gallon of $0.49 or 22.2% applied to fuel sales volumes that decreased period over period; and.gallon;
•$2.4 million decrease due to reduction in number of stores period over period.
Our retail segment purchased finished product from our refining segment of $57.6 million and $97.3 million for the three months ended September 30, 2020 and September 30, 2019. We eliminate this intercompany cost in consolidation.
YTD 2020 vs. YTD 2019
Cost of materials and other for the retail segment decreased by $121.9 million, or 23.4%, in the nine months ended September 30, 2020 compared to the nine months ended September 30, 2019, primarily driven by the following:
•a 5.5% decrease in average cost per gallonmerchandise sales, offset by an improvement in merchandise margin percentage of $0.52 or 23.8% applied to fuel sales volumes that decreased period over period; and2.0%;
•$18.4 million decrease due to reductionand a 4.2% increase in number of stores period over period.operating expenses.
Our retail segment purchased finished product from our refining segment of $166.6 million and $289.2 million for the nine months ended September 30, 2020 and September 30, 2019. We eliminate this intercompany cost in consolidation.
Operating Expenses
Q3 2020 vs. Q3 2019
Operating expenses for the retail segment decreased by $0.4 million, or 1.7% in the third quarter of 2020 compared to the third quarter of 2019 as a result of the reduction in the number of stores, as well as execution of various cost reduction initiatives throughout the business.
YTD 20202021 vs. YTD 2019
Operating expenses for the retail segment decreased by $5.1 million, or 7.1% in the nine months ended September 30, 2020 compared to the nine months ended September 30, 2019. as a result of the reduction in the number of stores, in addition to the execution of various cost reduction initiatives implemented beginning in the second quarter of 2020.
Contribution Margin
Q3 2020 vs. Q3 2019
Contribution margin for the retail segment decreased by $0.3 million, or 1.6%, in the third quarter of 2020 compared to the third quarter of 2019, primarily driven by decrease in fuel sales and a $0.005 per gallon decline in the retail fuel margin, offset by 1.1% increase in merchandise margin.
YTD 2020 vs. YTD 2019
Contribution margin for the retail segment increased by $8.5$2.2 million, or 18.3%6.0%, in the ninesix months ended SeptemberJune 30, 2020,2021, compared to the ninesix months ended SeptemberJune 30, 2019,2020, primarily driven by a $0.083 per gallon improvement in the retail fuel margin and a 0.4%1.6% increase in merchandise margin.
Management's Discussion and Analysis
Liquidity and Capital Resources
Our primary sources of liquidity and capital resources are
•cash generated from our operating activities;
•borrowings under our debt facilities; and
•potential issuances of additional equity and debt securities.
At June 30, 2021 our total liquidity amounted to $2.1 billion comprised primarily of $694.1 million in unused credit commitments under the Delek Revolving Credit Facility (as defined in Note 8 of the condensed consolidated financial statements in Item 1. Financial Statements), $561.2 million in unused credit commitments under the Delek Logistics Credit Facility (as defined in Note 8 of the condensed consolidated financial statements in Item 1. Financial Statements) and $833.0 million in cash and cash equivalents. Historically, we have generated adequate cash from operations to fund ongoing working capital requirements, pay quarterly cash dividends and operational capital expenditures. In response to the COVID-19 Pandemic and the decline in oil prices, on November 5, 2020, we announced that we have elected to suspend dividends in the fourth quarter of 2020 in order to conserve capital. Other funding sources including borrowings under existing credit agreements and issuance of equity and debt securities have been utilized to meet our funding requirements and support our growth capital projects and
Management's Discussion and Analysis
acquisitions. In addition we have historically been able to source funding at terms that reflect market conditions, our financial position and our credit ratings. We continue to monitor market conditions, our financial position and our credit ratings and expect future funding sources to be at terms that are sustainable and profitable for the Company. However, there can be no assurances regarding the availability of any future debt or equity financings or whether such financings can be made available on terms that are acceptable to us; any execution of such financing activities will be dependent on the contemporaneous availability of functioning debt or equity markets. Additionally, new debt financing activities will be subject to the satisfaction of any debt incurrence limitation covenants in our existing financing agreements. Our debt limitation covenants in our existing financing documents are usual and customary for credit agreements of our type and reflective of market conditions at the time of their execution. Additionally, our ability to satisfy working capital requirements, to service our debt obligations, to fund planned capital expenditures, or to pay dividends will depend upon future operating performance, which will be affected by prevailing economic conditions in the oil industry and other financial and business factors, including the current COVID-19 Pandemic and oil prices, some of which are beyond our control.
If market conditions were to change, for instance due to the significant decline in oil prices or uncertainty created by the COVID-19 Pandemic, and our revenue was reduced significantly or operating costs were to increase significantly, our cash flows and liquidity could be unfavorably impacted.
As of SeptemberJune 30, 2020,2021, we believe we were in compliance with all of our debt maintenance covenants, where the most significant long-term obligation subject to such covenants was the Delek Logistics Credit Facility (see Note 8 of the condensed consolidated financial statements in Item 1. Financial Statements). After considering the current effect of the significant decline in oil prices and uncertainty created by the COVID-19 Pandemic on our operations, we currently expect to remain in compliance with our existing debt maintenance covenants, though we can provide no assurances, particularly if conditions significantly worsen beyond our ability to predict. Additionally, we were in compliance with incurrence covenants during the quarter ended SeptemberJune 30, 20202021 to the extent that any of our activities triggered these covenants. However, given the uncertainty around economic conditions arising from the COVID-19 Pandemic, it is at least reasonably possible that conditions could change significantly, and that such changes could adversely impact our ability to meet some of these incurrence covenants. Failure to meet the incurrence covenants could impose certain incremental restrictions on our ability to incur new debt and also may limit whether and the extent to which we may resume paying dividends, as well as impose additional restrictions on our ability to repurchase our stock, make new investments and incur new liens (among others). Such restrictions would generally remain in place until such quarter that we return to compliance under the applicable incurrence based covenants. In the event that we are subject to these incremental restrictions, we believe that we have sufficient current and alternative sources of liquidity, including (but not limited to): the following: available borrowings under our existing Wells Fargo Revolving Credit Facility, and for Delek Logistics, under its Delek Logistics Credit Facility (see(each as defined in Note 8 of the condensed consolidated financial statements in Item 1. Financial Statements); the allowance to incur an additional $200 million of secured debt under the Wells Fargo Term Loan Credit Facility (see(as defined in Note 8 of the condensed consolidated financial statements in Item 1. Financial Statements); as well as the possibility of obtaining other secured and unsecured debt, raising capital through equity issuance, or taking advantage of transactional financing opportunities such as sale-leasebacks, each as otherwise contemplated and allowed under our incurrence covenants.
Cash Flows
The following table sets forth a summary of our consolidated cash flows (in millions):
| | Consolidated | Consolidated | Consolidated |
| | | | Nine Months Ended September 30, | | | Six Months Ended June 30, |
| | | | 2020 | | 2019 | | | 2021 | | 2020 |
| Cash Flow Data: | Cash Flow Data: | | | | | Cash Flow Data: | | | | |
| Operating activities | Operating activities | | $ | (399.8) | | | $ | 448.4 | | Operating activities | | $ | 134.9 | | | $ | (323.1) | |
| Investing activities | Investing activities | | (163.0) | | | (509.5) | | Investing activities | | (118.7) | | | (155.9) | |
| Financing activities | Financing activities | | 415.4 | | | (11.8) | | Financing activities | | 29.3 | | | 372.7 | |
| Net decrease | | $ | (147.4) | | | $ | (72.9) | | |
| Net increase (decrease) | | Net increase (decrease) | | $ | 45.5 | | | $ | (106.3) | |
Cash Flows from Operating Activities
Net cash used in operating activities was $399.8 million for the nine months ended September 30, 2020, compared to cash provided by operating activities was $134.9 million for the six months ended June 30, 2021, compared to net cash used of $448.4$323.1 million for the comparable period of 2019.2020. Cash receipts from customers and cash payments to suppliers and for salaries decreasedincreased resulting in a net $925.3$455.1 million decreaseincrease in cash fromprovided by operating activities mainly due to a decline in the prices and volume of refined product sold.activities. Additionally, cash paid for debt interest increaseddecreased by $2.8$10.4 million. This decrease was partially offset by a $9.9 millionPartially offsetting these increases in cash provided were an increase in cash received for dividendsincome taxes paid of $3.8 million and $70 milliona decrease in cash paid for taxes.dividends received of $3.7 million.
Cash Flows from Investing Activities
Net cash used in investing activities was $163.0$118.7 million for the first ninesix months of 2020,2021, compared to $509.5$155.9 million in the comparable period of 2019.2020. The decrease in cash flows used in investing activities was primarily due to a $183.2decrease in cash purchases of property, plant and equipment which decreased from $235.4 million decrease in 2020, to $132.7 million in 2021, partially attributable to delaying non-essential projects in light of the COVID-19 Pandemic. Additionally, equity method investment contributions decreased $27.9 million primarily due to contributions made related to our obtaining a 33% membership interest in the Red River Pipeline Joint Venture and WWP Project Financing JV (each as defined in May 2019Note 5 of the condensed consolidated financial statements in Item 1. Financial Statements) for $124.7 million.$10.5 million and $18.9 million, respectively, during the six months ended June 30, 2020. During the ninesix months ended SeptemberJune 30, 2020,2021, we contributed $11.8$1.4 million related to our Red River Pipeline Joint Venture and $18.9$0.1 million related to our interest in WWP and WWP Project Financing JV which did not existJV.
These decreases in cash used in investing activities were partially offset by distributions received in the comparable prior year period. Additionally, we received distributions from our WWP Project Financing JV to return excess capital contributions made in the amount of $69.3 million and proceeds of $39.9 million from the sale of the Bakersfield refinery in the prior year for which there was no comparable activity in the priorcurrent year period. We also received proceeds of $39.9 million from the sale of our Bakersfield refinery in the nine months ended September 30, 2020. These decreases in cash used investing activities were partially offset by an increase in cash purchases of property, plant and equipment which increased from $305.7 million in 2019, to $241.7 million in 2020 predominantly attributable to capital expenditures related to turnaround and other sustaining maintenance activities in our refining segment.
Cash Flows from Financing Activities
Net cash provided by financing activities was $415.4$29.3 million for the ninesix months ended SeptemberJune 30, 2020,2021, compared to net cash used of $11.8$372.7 million in the comparable 20192020 period. This increasedecrease in cash provided was predominantly due to net proceeds received frompayments on long-term revolvers and term debt of $252.3$101.5 million during the ninesix months ended SeptemberJune 30, 2020,2021, compared to net paymentsproceeds of $0.5$385.4 million in the comparable 20192020 period. Additionally contributing to this increase
Such decreases were a decrease in repurchases of common stock to $1.9 million for the nine months ended September 30, 2020 compared to $147.8 million in the comparable 2019 period due to management suspending our share repurchase program, andpartially offset by an increase in net proceeds from inventory financing arrangements to $142.6$156.0 million for the ninesix months ended SeptemberJune 30, 20202021 compared to $18.6$59.9 million in the comparable 20192020 period. Partially offsetting this increase was a decrease in net proceeds received from term debtAdditionally, cash provided increased $46.0 million due to $150.4 million during the nine months ended September 30, 2020, compared to $215.3 millionsuspension of dividends in the comparable 2019 period, and a $28.9 million increase in repurchasefourth quarter of non-controlling interests primarily associated with IDR simplification transactions.2020.
Cash Position, Indebtedness and IndebtednessOther Financing Arrangements
As of SeptemberJune 30, 2020,2021, our total cash and cash equivalents were $807.9$833.0 million and we had total long-term indebtedness of approximately $2,474.0$2,244.3 million. The total long-term indebtedness is net of deferred financing costs and debt discount of $6.7$11.8 million and $26.0$21.6 million, respectively. Additionally, we had letters of credit issued of approximately $227.3$305.9 million. Total unused credit commitments or borrowing base availability, as applicable, under our revolving credit facilities was approximately $752.0$1,272.3 million. Our total long-term indebtedness consisted of the following:
•an aggregate principal amount of $110.0 million under the Revolving Credit Facility, due on March 30, 2023, with average borrowing rate of 3.50%;
•an aggregate principal amount of $1,276.3$1,266.5 million under the Term Loan Credit Facility, due on March 30, 2025, with effective interest rate of 3.57%3.53%;
•an aggregate principal amount of $39.7$39.4 million in outstanding borrowings under the Delek Hapoalim Term Loan, due on December 31, 2022, with effective interest rate of 3.58%3.53%;
•an aggregate principal amount of $760.7$288.8 million under the Delek Logistics Credit Facility, due on September 28, 2023, with average borrowing rate of 2.69%2.50%;
•an aggregate principal amount of $250.0 million under the Delek Logistics 2025 Notes, due in 2025, with effective interest rate of 7.22%7.21%;
•an aggregate principal amount of $50.0$400.0 million under the Delek Logistics 2028 Notes, due in 2028, with effective interest rate of 7.41%;
•an aggregate principal amount of $33.0 million under the Reliant Bank Revolver, due on June 30, 2022, with fixed interest rate of 4.50%; and
•an aggregatethe Revolving Credit Facility, due on March 30, 2023, with average borrowing rate of 3.50%, no principal amount of $20.0 million under the Promissory Notes, due on January 04, 2021, with fixed interest rate of 5.50%.outstanding.
See Note 8 of the condensed consolidated financial statements in Item 1. Financial Statements, for additional information about our separate credit facilities.facilities included in long-term indebtedness.
Additionally, we also utilize other financing arrangements to finance operating assets and/or, from time to time, to monetize other assets that may not be needed in the near term, when internal cost of capital and other criteria are met. Such arrangements include our obligation under the supply and offtake arrangements, which finance a significant portion of our first-in, first-out inventory at the refineries and, from time to time, RINs or other non-inventory product financing agreementsliabilities. Our supply and offtake obligation with J. Aron amounted to $323.2$496.3 million at SeptemberJune 30, 2020, $220.42021, $329.0 million of which is due on December 30, 2022, except that a portion (not to exceed $58.8$28.6 million) of this otherwise long-term component is subject to potential earlier payment under the Periodic Price Adjustment provision. See Note 7 of the condensed consolidated financial statements in Item 1. Financial Statements, for additional information about our supply and offtake facilities. Our product financing liabilities consisted primarily of RIN financings as of June 30, 2021, and totaled $358.8 million, all of which is due by December 31, 2021. See further description of these types of arrangements in the Environmental Credits and Related Regulatory Obligations accounting policy disclosed in Note 2 to our audited consolidated financial statements included Item 8. Financial Statements and Supplementary Data, of our December 31, 2020 Annual Report on Form 10-K. For both arrangements and the related commitments, see also our "Contractual Obligations" section included in Item 2. Management's Discussion and and Analysis.
Capital Spending
A key component of our long-term strategy is our capital expenditure program. Our capital expenditures for the ninesix months ended SeptemberJune 30, 20202021 were $208.0$132.7 million, of which approximately $180.9$118.5 million was spent in our refining segment, $6.9$10.4 million in our logistics segment, $8.2$1.3 million in our retail segment and $12.0$2.5 million at the holding company level. The following table summarizes our actual capital expenditures for the ninesix months ended SeptemberJune 30, 20202021 and planned capital expenditures for the full year 20202021 by operating segment and major category (in millions):
| | | | Full Year
2020 Forecast | | Nine Months Ended September 30, 2020 | | | Full Year
2021 Forecast | | Six Months Ended June 30, 2021 |
| Refining | Refining | Refining |
Sustaining maintenance, including turnaround activities | Sustaining maintenance, including turnaround activities | | $ | 159.1 | | | $ | 139.5 | | Sustaining maintenance, including turnaround activities | | $ | 133.4 | | | $ | 117.4 | |
| Regulatory | Regulatory | | 42.3 | | | 41.2 | | Regulatory | | 2.6 | | | 1.0 | |
| Discretionary projects | Discretionary projects | | 1.8 | | | 0.2 | | Discretionary projects | | 0.1 | | | 0.1 | |
| Refining segment total | Refining segment total | | 203.2 | | | 180.9 | | Refining segment total | | 136.1 | | | 118.5 | |
| | Logistics | Logistics | Logistics |
| Regulatory | Regulatory | | 2.2 | | | 1.4 | | Regulatory | | 7.3 | | | 1.1 | |
| Sustaining maintenance | Sustaining maintenance | | 2.3 | | | 0.5 | | Sustaining maintenance | | 3.8 | | | 0.5 | |
| Discretionary projects | Discretionary projects | | 16.5 | | | 5.0 | | Discretionary projects | | 18.4 | | | 8.8 | |
| Logistics segment total | Logistics segment total | | 21.0 | | | 6.9 | | Logistics segment total | | 29.5 | | | 10.4 | |
| | Retail | Retail | Retail |
| Regulatory | Regulatory | | 0.2 | | | 0.2 | | Regulatory | | — | | | — | |
| Sustaining maintenance | Sustaining maintenance | | 3.2 | | | 1.6 | | Sustaining maintenance | | 2.8 | | | 0.9 | |
| Discretionary projects | Discretionary projects | | 6.5 | | | 6.4 | | Discretionary projects | | 1.8 | | | 0.4 | |
| Retail segment total | Retail segment total | | 9.9 | | | 8.2 | | Retail segment total | | 4.6 | | | 1.3 | |
| | Other | Other | Other |
| Regulatory | Regulatory | | 0.5 | | | 0.3 | | Regulatory | | 3.4 | | | 0.9 | |
| Sustaining maintenance | Sustaining maintenance | | 1.9 | | | 0.2 | | Sustaining maintenance | | 3.8 | | | 1.1 | |
Discretionary projects(2) | Discretionary projects(2) | | 12.2 | | | 11.5 | | Discretionary projects(2) | | 3.2 | | | 0.5 | |
| Other total | Other total | | 14.6 | | | 12.0 | | Other total | | 10.4 | | | 2.5 | |
| Total capital spending | Total capital spending | | $ | 248.7 | | | $ | 208.0 | | Total capital spending | | $ | 180.6 | | | $ | 132.7 | |
(1) The forecast excludes forecastedExcludes potential additional capital expenditures on a $65 million discretionary project to complete a connector toassociated with the WWP pipeline, foreffects of Winter Storm Uri and/or the El Dorado fire that are not yet determinable and/or which we have secured pre-approved committed financing from the WWP members, atreasonably expect to be covered under our election. Additionally, our actual capital expenditures exclude approximately $3 million of spend in 2020 on this project that would fall under this separately committed financing.
(2) Excludes purchases of rights-of-way in the amount of $2.6 million in 2020.applicable insurance policies and likewise reimbursable by insurance recoveries.
Management's Discussion and Analysis
The amount of our capital expenditure budget is subject to change due to unanticipated increases in the cost, scope and completion time for our capital projects. For example, we may experience increases in the cost of and/or timing to obtain necessary equipment required for our continued compliance with government regulations or to complete improvement projects or scheduled maintenance activities. Additionally, the scope and cost of employee or contractor labor expense related to installation of that equipment could exceed our projections. Our capital expenditure budget may also be revised as management continues to evaluate projects for reliability or profitability. As a result of the uncertainties associated with the COVID-19 Pandemic, we have decreased our capital spending forecast for 2020 to $248.7 million, down from the prior forecast as reported in our Annual Report on Form 10-K for the year ended December 31, 2019, of $325.7 million. We continue to evaluate the adverse effects of the COVID-19 Pandemic, and may further revise our forecast as a result of changing circumstances.
We have no material off-balance sheet arrangements through the date of the filing of this Quarterly Report on Form 10-Q.
ITEM 3. QUANTITATIVE AND QUALITATIVE DISCLOSURES ABOUT MARKET RISK
These disclosures should be read in conjunction with the condensed consolidated financial statements, "Management's Discussion and Analysis of Financial Condition and Results of Operations," and other information presented herein, as well as in the "Quantitative and Qualitative Disclosures About Market Risk" section contained in our Annual Report on Form 10-K, as filed on February 28, 2020.March 1, 2021.
Price Risk Management Activities
At times, we enter into the following instruments/transactions in order to manage our market-indexed pricing risk: commodity derivative contracts which we use to manage our price exposure to our inventory positions, future purchases of crude oil and ethanol, future sales of
Management's Discussion and Analysis
refined products or to fix margins on future production; and future commitments to purchase or sell RINs at fixed prices and quantities, which are used to manage the costs associated with our RINs obligations and meet the definition of derivative instruments under ASC 815, Derivatives and Hedging ("ASC 815"). In accordance with ASC 815, all of these commodity contracts and future purchase commitments are recorded at fair value, and any change in fair value between periods has historically been recorded in the profit and loss section of our condensed consolidated financial statements. Occasionally, at inception, the Company will elect to designate the commodity derivative contracts as cash flow hedges under ASC 815. Gains or losses on commodity derivative contracts accounted for as cash flow hedges are recognized in other comprehensive income on the condensed consolidated balance sheets and, ultimately, when the forecasted transactions are completed, in net revenues or cost of materials and other in the condensed consolidated statements of income.
The following table sets forth information relating to our open commodity derivative contracts as of SeptemberJune 30, 20202021 ($ in millions):
| | | Total Outstanding | | Notional Contract Volume by Year of Maturity | | | Total Outstanding | | Notional Contract Volume by Year of Maturity | |
| Contract Description | Contract Description | | Fair Value | | Notional Contract Volume | | 2020 | | 2021 | | 2022 | | 2023 | | Contract Description | | Fair Value | | Notional Contract Volume | | 2021 | | 2022 | | 2023 | |
| Contracts not designated as hedging instruments: | Contracts not designated as hedging instruments: | | | | | | | | | | | | | | Contracts not designated as hedging instruments: | | | | | | | | | | | |
Crude oil price swaps - long(1) | Crude oil price swaps - long(1) | | $ | (5.5) | | | 30,394,000 | | | 13,565,000 | | | 16,829,000 | | | — | | | — | | | Crude oil price swaps - long(1) | | $ | 35.4 | | | 15,924,000 | | | 14,994,000 | | | 930,000 | | | — | | |
Crude oil price swaps - short(1) | Crude oil price swaps - short(1) | | (7.2) | | | 30,457,000 | | | 13,808,000 | | | 16,649,000 | | | — | | | — | | | Crude oil price swaps - short(1) | | (35.5) | | | 13,989,000 | | | 13,989,000 | | | — | | | — | | |
Inventory, refined product and crack spread swaps - long(1) | Inventory, refined product and crack spread swaps - long(1) | | 2.4 | | | 65,615,000 | | | 13,130,000 | | | 22,885,000 | | | 22,200,000 | | | 7,400,000 | | | Inventory, refined product and crack spread swaps - long(1) | | 42.2 | | | 89,425,000 | | | 30,225,000 | | | 44,400,000 | | | 14,800,000 | | |
Inventory, refined product and crack spread swaps - short(1) | Inventory, refined product and crack spread swaps - short(1) | | (13.2) | | | 65,762,000 | | | 13,397,000 | | | 22,765,000 | | | 22,200,000 | | | 7,400,000 | | | Inventory, refined product and crack spread swaps - short(1) | | (61.0) | | | 90,394,000 | | | 31,194,000 | | | 44,400,000 | | | 14,800,000 | | |
Natural gas swaps - long(2) | Natural gas swaps - long(2) | | 2.7 | | | 3,237,500 | | | 3,237,500 | | | — | | | — | | | — | | | Natural gas swaps - long(2) | | — | | | — | | | — | | | — | | | — | | |
Natural gas swaps - short(2) | Natural gas swaps - short(2) | | (2.2) | | | 9,942,500 | | | 9,942,500 | | | — | | | — | | | — | | | Natural gas swaps - short(2) | | — | | | — | | | — | | | — | | | — | | |
RIN commitment contracts - long(3) | RIN commitment contracts - long(3) | | 2.8 | | | 34,700,000 | | | 34,700,000 | | | — | | | — | | | — | | | RIN commitment contracts - long(3) | | 40.7 | | | 81,960,000 | | | 81,960,000 | | | — | | | — | | |
RIN commitment contracts - short(3) | RIN commitment contracts - short(3) | | (26.0) | | | 24,500,000 | | | 24,500,000 | | | — | | | — | | | — | | | RIN commitment contracts - short(3) | | 0.1 | | | 1,500,000 | | | 1,500,000 | | | — | | | — | | |
| Total | Total | | $ | (46.2) | | | 264,608,000 | | | 126,280,000 | | | 79,128,000 | | | 44,400,000 | | | 14,800,000 | | | Total | | $ | 21.9 | | | 293,192,000 | | | 173,862,000 | | | 89,730,000 | | | 29,600,000 | | |
| Contracts designated as cash flow hedging instruments: | | | | | | | | | | | | | | |
Crude oil price swaps - long(1) | | $ | — | | | — | | | — | | | — | | | — | | | — | | | |
Crude oil price swaps - short(1) | | — | | | — | | | — | | | — | | | — | | | — | | | |
Inventory, refined product and crack spread swaps - long(1) | | (1.5) | | | 45,000 | | | 45,000 | | | — | | | — | | | — | | | |
Inventory, refined product and crack spread swaps - short(1) | | 2.7 | | | 45,000 | | | 45,000 | | | — | | | — | | | — | | | |
| Total | | $ | 1.2 | | | 90,000 | | | 90,000 | | | — | | | — | | | — | | | |
|
(1)Volume in barrels
(2)Volume in MMBTU
(3)Volume in RINs
Management's Discussion and Analysis
Interest Risk Management Activities
We have market exposure to changes in interest rates relating to our outstanding floating rate borrowings, which totaled approximately $2,186.7$1,594.7 million as of SeptemberJune 30, 2020.2021. The annualized impact of a hypothetical one percent change in interest rates on our floating rate debt as of SeptemberJune 30, 20202021 would be to change interest expense by approximately $21.9$15.9 million.
Commodity Derivatives Trading Activities
In the first half of 2018, we began enteringWe enter into active trading positions in a variety of commodity derivatives, which include forward physical contracts, swap contracts, and futures contracts. These contracts are classified as held for trading and are recognized at fair value with changes in fair value recognized in the income statement. These trading activities are undertaken by using a range of contract types in combination to create incremental gains by capitalizing on crude oil supply and pricing seasonality. These contracts all had remaining durations of less than one year as of SeptemberJune 30, 2020.2021, and are classified as held for trading and are recognized at fair value with changes in fair value recognized in the income statement.
The following table sets forth information relating to commodity derivative contracts held for trading purposes as of SeptemberJune 30, 2020:2021:
| | | | | | | | |
| Contract Description | | Less than 1 year |
| Over the counter forward sales contracts (crude) | | |
Notional contract volume (1) | | 658,0021,701,878 | |
| Weighted-average market price (per barrel) | | $ | 30.8058.69 | |
| Contractual volume at fair value (in millions) | | $ | 20.399.9 | |
| Over the counter forward purchase contracts (crude) | | |
Notional contract volume (1) | | 717,7141,100,112 | |
| Weighted-average market price (per barrel) | | $ | 30.7659.46 | |
| Contractual volume at fair value (in millions) | | $ | 22.165.4 | |
(1) Volume in barrels
Management's Discussion and Analysis
ITEM 4. CONTROLS AND PROCEDURES
Our disclosure controls and procedures are designed to provide reasonable assurance that the information that we are required to disclose in reports we file under the Securities Exchange Act, of 1934, as amended ("the Exchange Act"), is accumulated and appropriately communicated to management. We carried out an evaluation required by Rule 13a-15(b) of the Exchange Act, under the supervision and with the participation of our management, including the Chief Executive Officer and Chief Financial Officer, of the effectiveness of the design and operation of our disclosure controls and procedures at the end of the reporting period. Based on that evaluation, the Chief Executive Officer and Chief Financial Officer concluded that our disclosure controls and procedures were effective as of the end of the reporting period.
There have been no changes in our internal control over financial reporting identified in connection with the evaluation required by paragraph (d) of Exchange Act Rules 13a-15 or 15d-15 that occurred during the thirdsecond quarter of 20202021 that have materially affected, or are reasonably likely to materially affect, our internal control over financial reporting. Although most of our corporatewe have a flexible work schedule that allows both on-site and remote work arrangements for employees, have shifted to a remote working environment due to the COVID-19 Pandemic, we have not experienced a material impact to our internal control over financial reporting. We are continually monitoring and assessing the COVID-19 Pandemic to minimize the impact on the design and operating effectiveness of our internal controls.
Legal Proceedings, Risk Factors, Unregistered Sales of Equity Securities and Other Information
Part II - OTHER INFORMATION
ITEM 1. LEGAL PROCEEDINGS
In the ordinary conduct of our business, we are from time to time subject to lawsuits, investigations and claims, including, environmental claims and employee-related matters. Although we cannot predict with certainty the ultimate resolution of lawsuits, investigations and claims asserted against us, including civil penalties or other enforcement actions, we do not believe that any currently pending legal proceeding or proceedings to which we are a party will have a material adverse effect on our business, financial condition or results of operations. See Note 11 to our accompanying condensed consolidated financial statements, which is incorporated by reference in this Item 1, for additional information. Aside from the disclosure in Note 11, there have been no material developments to the proceedings previously reported in our Annual Report on Form 10-K as amended and filed on February 28, 2020.March 1, 2021.
ITEM 1A. RISK FACTORS
There were no material changes during the ninesix months ended SeptemberJune 30, 20202021 to the risk factors identified in the Company’s fiscal 20192020 Annual Report on Form 10-K, except as noteddescribed below.
The current COVID-19 PandemicStockholder activism may negatively impact the price of our common stock.
Our stockholders may from time to time engage in proxy solicitations, advance stockholder proposals or otherwise attempt to effect changes or acquire control over us. Campaigns by stockholders to effect changes at publicly traded companies are sometimes led by investors seeking to increase short-term stockholder value through actions such as financial restructuring, increased debt, special dividends, stock repurchases or sales of assets or the entire company. Responding to proxy contests and certain developments in the global oil markets have had,other actions by activist stockholders can be costly and may continue to have, an adverse impact ontime-consuming, disrupting our business, our future results of operations and our overall financial performance.
The COVID-19 Pandemic could materially adversely affect our business and operations during 2020 and possibly beyond. In early 2020, global health care systems and economies began to experience strain fromdiverting the spread of the COVID-19 Pandemic. As the virus spread, global economic activity began to slow and future economic activity was forecast to slow with a resulting forecast of a decline in oil and gas demand. The global pandemic has resulted in a dramatic reduction in airline flights and has reduced the number of cars on the road. Governmental actions in response to the COVID-19 Pandemic have resulted in significant business and operational disruptions, including business closures, supply chain disruptions, travel restrictions, stay-at-home orders, and limitations on the availability and effectiveness of the workforce. These impacts have negatively impacted and will likely continue to negatively impact worldwide economic and commercial activity, financial markets, and demand for and prices of oil and gas products for the foreseeable future. These impacts may also precipitate a prolonged economic slowdown and recession.
In response to the decline in demand, OPEC participating countries agreed to adjust downwards their overall production of crude oil through April 30, 2022, with the agreement to be reassessed in December 2021. These declines have been exacerbated by a production dispute between Russia and the members of OPEC, particularly Saudi Arabia, and the subsequent actions taken by such countries as a result thereof. A sustained reduction in crude oil production will potentially affect the global supply, prices of oil and refined products in our market. Additionally, a significant reduction or freeze in crude oil production in the United States will adversely affect our suppliers and source of crude oil.
Global economic growth drives demand for energy from all sources, including fossil fuels. Should the U.S. and global economies experience weakness, demand for energy may decline. Similarly, should growth in global energy production outstrip demand, excess supplies may arise. Declines in demand and excess supplies may result in accompanying declines in commodity prices and deterioration of our financial position along with our ability to operate profitably and our ability to obtain financing to support operations. With respect to our business, we have experienced periodic declines in demand thought to be associated with slowing economic growth in certain markets, including the effects of the COVID-19 Pandemic, coupled with new oil and gas supplies coming on line and other circumstances beyond our control that resulted in oil and gas supply exceeding global demand which, in turn, resulted in steep declines in prices of oil and natural gas. There can be no assurance as to how low the current price decline will persist or that a recurrence of price weakness will not arise in the future.
The COVID-19 Pandemic has resulted in modifications to our business practices, including limiting employee and contractor presence at certain work locations, limiting travel, and reducing capital expenditures for 2020. We may take further actions as required by government authorities or that we determine are in the best interests of our employees, contractors, customers, suppliers and communities. However, there is no assurance that such measures will be sufficient to mitigate the risks posed by the virus, and our ability to successfully execute our business operations could be adversely impacted. In addition, while we have had no COVID-related impairments to date, the continued effects of the COVID-19 Pandemic could result in impairments of long-lived or indefinite-lived assets, including goodwill, at some point in the future. Such impairment charges could be material.
The full impact of the ongoing COVID-19 Pandemic is unknown and is rapidly evolving. It is difficult to predict how significant the impact of the COVID-19 Pandemic including any responses to it, will be on the United States and global economies and our business or for how long disruptions are likely to continue. The extent of such impact will depend on future developments and factors outside of our control, including new information which may emerge concerning the severity or duration of the COVID-19 Pandemic and the evolving governmental and private sector actions to contain the Pandemic or treat its health, economic, and other impacts.
The ultimate extent of the impact of the volatile conditions in the oil and gas industry on our business, financial condition, results of operation and liquidity will also depend largely on future developments, including the extent and duration of any price reductions, any additional decisions by OPEC and disputes between the members of OPEC+.
To the extent COVID-19 and the developments in the global oil markets adversely affects our business, financial condition, results of operation and liquidity, they may also have the effect of heightening many of the other risks described in the “Risk Factors” section included in our Annual Report on Form 10-K for the year ended December 31, 2019 and in this Quarterly Report on Form 10-Q, as those risk factors are amended or supplemented by subsequent Quarterly Reports on Form 10-Q and other reports and documents we file with the SEC after the date hereof.
We have suspended our quarterly dividend and cannot assure you when we will declare dividends in the future.
In the fourth quarter of 2020, we suspended our quarterly dividend of $0.31 per share on our common stock in order to conserve capital in response to the impact of the COVID-19 Pandemic and related market activity. We are not obligated to declare or pay any dividend. Any future declaration, amount and payment of dividends will be at the sole discretion of our Board of Directors; however, because the impact of the COVID-19 Pandemic and related market activity is difficult to predict, we cannot provide assurance as to when our Board of Directors will declare a dividend in the future. The declaration of future dividends on our common stock will be at the discretionattention of our Board of Directors and will depend upon many factors, includingsenior management from the pursuit of business strategies. If individuals are elected or appointed to our Board of Directors who do not agree with our strategic plans, it may adversely affect the ability of our Board of Directors to function effectively and our ability to effectively and timely implement our strategic plans and create additional value for our stockholders. As a result, stockholder campaigns could adversely affect our results of operations, financial condition earnings, capital requirements, restrictions inand cash flows.
In January 2021, CVR Energy, Inc. ("CVR Energy"), the owner (at that time) of approximately 15% of our debt agreementsoutstanding common stock, proposed three director candidates to be considered at our 2021 Annual Meeting. CVR Energy also proposed a series of operational and legal requirements.strategic changes to our business. On May 6, 2021, our stockholders rejected CVR Energy’s director candidates and voted to elect all eight of Delek's nominees. As a result ifof the contested director election, we incurred significant costs during 2021.
Any perceived uncertainties as to our Boardfuture direction and control, our ability to execute on our strategy, or changes to the composition of Directors does not declareour board of directors or pay dividends, yousenior management team arising from future proposals from stockholders could lead to the perception of a change in the direction of our business or instability which may not receivebe exploited by our competitors, result in the loss of potential business opportunities, and make it more difficult to pursue our strategic initiatives or attract and retain qualified personnel and business partners, any returnof which could have an adverse effect, which may be material, on an investmentour business and operating results.
In addition, actions such as those described above could cause significant fluctuations in the trading prices of our common stock unless you sell our common stock for a price greater thanbased on temporary or speculative market perceptions or other factors that which you paid for it.
We are particularly vulnerable to disruptions to our refining operations because our refining operations are concentrated in four facilities.
Because alldo not necessarily reflect the underlying fundamentals and prospects of our refining operations are concentrated inbusiness.
Likewise, to the Tyler, El Dorado, Big Spring and Krotz Springs refineries, significant disruptions at one of these facilities could have a material adverse effect on our consolidated financial results. Refining segment contribution margin comprised approximately 79.4%, 84.2% and 88.3%extent that we implement any proposals made by any of our consolidated contribution margin forshareholders, the 2019, 2018 and 2017 fiscal years, respectively.
Our refineries consist of many processing units, a number of which have beenresulting changes in operation for many years. These processing units undergo periodic shutdowns, known as turnarounds, during which routine maintenance is performed to restore the operation of the equipment to a higher level of performance. Depending on which units are affected, all or a portion of a refinery's production may be halted or disrupted during a maintenance turnaround. We completed a maintenance turnaround at our El Dorado refinery in 2014 and a shortened turnaround that allowed work to be completed on the majority of the process units in March 2019. In addition, we completed a maintenance turnaround at our Tyler refinery in 2015 and a maintenance turnaround for our Big Spring refinery which began January of 2020. We are also subject to unscheduled down time for unanticipated maintenance or repairs.
Refinery operations may also be disrupted by external factors, such as a suspension of feedstock deliveries, cyber-attacks, an interruption of electricity, natural gas, water treatment or other utilities, or a global pandemic such as the recent outbreak of the novel coronavirus. A large number of positive COVID-19 cases at one or more of our refineries could substantially impact our business, financial condition,assets, results of operations and liquidity. Other potentially disruptive factors include natural disasters, severe weather conditions, workplace or environmental accidents, interruptions of supply, work stoppages, losses of permits or authorizations or acts of terrorism.
The stockholder rights plan adopted by our Boardfinancial condition could be material and could have an impact, which may impair an attempt to acquire control of Delek.
On March 20, 2020, our Board of Directors adopted a stockholder rights plan and declared a dividend of one preferred share purchase right for each outstanding sharebe material, on the market price of our common stock to stockholders of record on March 30, 2020. In the event that a person or group acquires beneficial ownership of 15% or more of our then-outstanding common stock, subject to certain exceptions, each right would entitle its holder (other than such person or members of such group) to purchase one one-thousandth of a share of Series A Junior Participating Preferred Stock. In addition, at any time after a person or group acquires 15% or more of our common stock (unless such person or group acquires 50% or more), the Board may exchange one share of our common stock for each outstanding right (other than rights owned by such person or group, which would have become void). The stockholder rights plan could make it more difficult for a third party to acquire control of Delek or a large block of our common stock without the approval of our Board of Directors. Unless extended by the Board prior to expiration, the rights will expire on March 19, 2021.stock.
The periodic price adjustment settlements on the J. Aron Supply and Offtake Agreement may affect our liquidity position.
In April 2020, we amended and restated our three Supply and Offtake Agreements to renew and extend the terms to December 30, 2022, with J. Aron having the sole discretion to further extend to May 30, 2025 by providing at least six months prior notice to the current maturity date. As part of this amendment, there were changes to the underlying market index, annual fee, the crude purchase fee, crude roll fees and timing of cash settlements related to periodic price adjustments ("PPA") on the differentials. The PPA are calculated semi-annually on October 1 and May 1 ("re-pricing dates") and will result in cash settlements, (either payments to J. Aron or receipts of additional funds from J. Aron), based on the market value of the underlying commodity differential compared to the contractual differential, subject to a set threshold
amount. In the event that the periodic price adjustments are triggered on the re-pricing dates, we may be required to make earlier cash payments within three months following the re-pricing date.
ITEM 5. OTHER INFORMATION
Consulting Agreement and Separation Payment
On November 6, 2020, the Company entered into a Consulting Agreement with an effective date of November 3, 2020, (the “Consulting Agreement”) with Frederec Green, the Company’s former Executive Vice President of Corporate Development, following the expiration of his employment agreement on October 31, 2020. Under the Consulting Agreement, Mr. Green will serve as a consultant to the Company until April 30, 2021, unless earlier terminated. The Company will pay Mr. Green $40,000 per quarter during the term of the Consulting Agreement for his services, which will focus on marketing and business development and other related services. Either the Company or Mr. Green may terminate the Consulting Agreement. The Company will also make a one-time payment of $750,000 to Mr. Green in exchange for a release of claims against the Company. Mr. Green’s transition to the consulting arrangement is not the result of any disagreement between Mr. Green and the Company.
Chief Executive Officer Salary Waiver
On November 6, 2020, our President and Chief Executive Officer, Ezra Uzi Yemin agreed to waive 33% of his Base Compensation (as such term is defined in that certain Amended and Restated Executive Employment Agreement dated May 8, 2020, by and between Mr. Yemin and the Company (the “Employment Agreement”)) for a period beginning November 3, 2020 until such time as Mr. Yemin determines, in his sole discretion, to revoke such waiver. Mr. Yemin’s waiver will not affect any of Mr. Yemin’s other rights under the Employment Agreement. If the reduction impacts Mr. Yemin’s participation in, or the level of benefits provided under, any welfare benefit plan provided by the Company, the Company has agreed to provide an equivalent benefit to Mr. Yemin at no additional cost to him.None.
ITEM 6. EXHIBITS
| | | | | | | | | | | |
| Exhibit No. | | Description |
| | | |
| | | |
| | | Exchange Agreement,Indenture, dated as of August 13, 2020,May 24, 2021, among Delek Logistics, Partners, LP, Delek Logistics GP, LLC,Finance Corp., the Guarantors named therein and Delek US Holdings, Inc.U.S. Bank, National Association, as trustee (incorporated by reference to Exhibit 10.14.1 of the Company’sDelek Logistics’ Form 8-K filed on August 14, 2020)May 26, 2021). |
| | | |
| | | |
| | | |
| | | |
| | | |
| | | |
| | | |
| # | | |
| | | |
| # | | |
| | | |
| ## | | |
| | | |
| ## | | |
| | | |
| 101 | | | The following materials from Delek US Holdings, Inc.’s Quarterly Report on Form 10-Q for the quarterly period ended SeptemberJune 30, 2020,2021, formatted in Inline XBRL (eXtensible Business Reporting Language): (i) Condensed Consolidated Balance Sheets as of SeptemberJune 30, 20202021 and December 31, 20192020 (Unaudited), (ii) Condensed Consolidated Statements of Income for the three and ninesix months ended SeptemberJune 30, 20202021 and 20192020 (Unaudited), (iii) Condensed Consolidated Statements of Comprehensive Income for the three and ninesix months ended SeptemberJune 30, 20202021 and 20192020 (Unaudited), (iv) Condensed Consolidated Statements of Changes in Stockholders' Equity for the three and ninesix months ended SeptemberJune 30, 20202021 and 20192020 (Unaudited), (v) Condensed Consolidated Statements of Cash Flows for the ninesix months ended SeptemberJune 30, 20202021 and 20192020 (Unaudited), and (vi) Notes to Condensed Consolidated Financial Statements (Unaudited). |
| | | |
| 104 | | | The cover page from Delek US Holdings, Inc.'s Quarterly Report on Form 10-Q for the quarter ended SeptemberJune 30, 2020, has been formatted in Inline XBRL. |
| | | | | | | | |
| # | | Filed herewith |
| ## | | Furnished herewith |
SIGNATURES
Pursuant to the requirements of the Securities Exchange Act of 1934, the registrant has duly caused this report to be signed on its behalf by the undersigned, thereunto duly authorized.
| | | | | |
| Delek US Holdings, Inc. |
| |
| By: | /s/ Ezra Uzi Yemin |
| | Ezra Uzi Yemin |
| | Director (Chairman), President and Chief Executive Officer
(Principal Executive Officer) |
| |
| By: | /s/ Reuven Spiegel |
| | Reuven Spiegel |
| | Executive Vice President and Chief Financial Officer
(Principal Financial and Accounting Officer) |
Dated: November 6, 2020August 5, 2021