UNITED STATES
SECURITIES AND EXCHANGE COMMISSION
Washington, D.C. 20549
FORM 10-Q
| | | | | |
| ☒ | QUARTERLY REPORT PURSUANT TO SECTION 13 OR 15(d) OF THE SECURITIES EXCHANGE ACT OF 1934 |
For the quarterly period ended September 30, 20202021
or
| | | | | |
| ☐ | TRANSITION REPORT PURSUANT TO SECTION 13 OR 15(d) OF THE SECURITIES EXCHANGE ACT OF 1934 |
For the transition period from to
Commission File Number: 001-38124
GRANITE POINT MORTGAGE TRUST INC.
(Exact name of registrant as specified in its charter)
| | | | | | | | |
| Maryland | | 61-1843143 |
(State or other jurisdiction of
incorporation or organization) | | (I.R.S. Employer
Identification No.) |
| | | | | | | | | | | |
| 3 Bryant Park, Suite 2400A | | |
| New York, | New York | | 10036 |
| (Address of principal executive offices) | | (Zip Code) |
(646) 540-7940(212) 364-5500
(Registrant’s telephone number, including area code)
Securities registered pursuant to Section 12(b) of the Act:
| | | | | | | | | | | | | | |
| Title of each class | | Trading Symbol(s) | | Name of each exchange on which registered |
| Common Stock, par value $0.01 per share | | GPMT | | New York Stock Exchange |
Indicate by check mark whether the registrant (1) has filed all reports required to be filed by Section 13 or 15(d) of the Securities Exchange Act of 1934 during the preceding 12 months (or for such shorter period that the registrant was required to file such reports), and (2) has been subject to such filing requirements for the past 90 days. Yes ☒ No ☐
Indicate by check mark whether the registrant has submitted electronically every Interactive Data File required to be submitted pursuant to Rule 405 of Regulation S-T (§232.405 of this chapter) during the preceding 12 months (or for such shorter period that the registrant was required to submit such files). Yes ☒ No ☐
Indicate by check mark whether the registrant is a large accelerated filer, an accelerated filer, a non-accelerated filer, a smaller reporting company, or an emerging growth company. See the definitions of “large accelerated filer,” “accelerated filer,” “smaller reporting company,” and “emerging growth company” in Rule 12b-2 of the Exchange Act.
| | | | | | | | | | | | | | |
| Large accelerated filer | ☒☐ | | Accelerated filer | ☐☒ |
| Non-accelerated filer | ☐ | | Smaller reporting company | ☐ |
| | | Emerging growth company | ☐ |
If an emerging growth company, indicate by check mark if the registrant has elected not to use the extended transition period for complying with any new or revised financial accounting standards provided pursuant to Section 13(a) of the Exchange Act. ☐
Indicate by check mark whether the registrant is a shell company (as defined in Rule 12b-2 of the Exchange Act). Yes ☐ No ☒
Indicate the number of shares outstanding of each of the issuer’s classes of common stock, as of the latest practicable date.
As of November 6, 2020,4, 2021, there were 55,205,08253,789,465 shares of outstanding common stock, par value $0.01 per share, issued and outstanding.
GRANITE POINT MORTGAGE TRUST INC.
INDEX
| | | | | | | | |
| | Page |
| PART I - FINANCIAL INFORMATION | |
| Item 1. | Financial Statements (unaudited) | |
| | |
| | |
| | |
| | |
| | |
| | |
| | |
| | |
| PART II - OTHER INFORMATION | |
| | |
| | |
| | |
| | |
| | |
| | |
| | |
| |
| |
PART I. FINANCIAL INFORMATION
Item 1. Financial Statements (unaudited)
GRANITE POINT MORTGAGE TRUST INC.
CONDENSED CONSOLIDATED BALANCE SHEETS
(in thousands, except share data)
| | | September 30,
2020 | | December 31,
2019 | | September 30,
2021 | | December 31,
2020 |
| ASSETS | ASSETS | | | | ASSETS | | | |
| Loans held-for-investment | Loans held-for-investment | $ | 4,052,201 | | | $ | 4,226,212 | | Loans held-for-investment | $ | 3,659,691 | | | $ | 3,914,469 | |
| Allowance for credit losses | Allowance for credit losses | (73,339) | | | — | | Allowance for credit losses | (45,480) | | | (66,666) | |
| Loans held-for-investment, net | Loans held-for-investment, net | 3,978,862 | | | 4,226,212 | | Loans held-for-investment, net | 3,614,211 | | | 3,847,803 | |
| Available-for-sale securities, at fair value | 0 | | | 12,830 | | |
| Held-to-maturity securities | 0 | | | 18,076 | | |
| | Cash and cash equivalents | Cash and cash equivalents | 353,679 | | | 80,281 | | Cash and cash equivalents | 154,916 | | | 261,419 | |
| Restricted cash | Restricted cash | 5,326 | | | 79,483 | | Restricted cash | 20,602 | | | 67,774 | |
| Accrued interest receivable | Accrued interest receivable | 11,933 | | | 11,323 | | Accrued interest receivable | 9,898 | | | 12,388 | |
| | Other assets | Other assets | 53,052 | | | 32,657 | | Other assets | 99,563 | | | 30,264 | |
Total Assets (1) | Total Assets (1) | $ | 4,402,852 | | | $ | 4,460,862 | | Total Assets (1) | $ | 3,899,190 | | | $ | 4,219,648 | |
| LIABILITIES AND STOCKHOLDERS’ EQUITY | LIABILITIES AND STOCKHOLDERS’ EQUITY | | | | LIABILITIES AND STOCKHOLDERS’ EQUITY | | | |
| Liabilities | Liabilities | | Liabilities | |
| Repurchase agreements | $ | 1,850,845 | | | $ | 1,924,021 | | |
| Repurchase facilities | | Repurchase facilities | $ | 916,758 | | | $ | 1,708,875 | |
| Securitized debt obligations | Securitized debt obligations | 928,623 | | | 1,041,044 | | Securitized debt obligations | 1,356,429 | | | 927,128 | |
| Asset-specific financings | Asset-specific financings | 123,091 | | | 116,465 | | Asset-specific financings | 44,752 | | | 123,091 | |
| Revolving credit facilities | 0 | | | 42,008 | | |
| Term financing facility | | Term financing facility | 127,867 | | | — | |
| Convertible senior notes | Convertible senior notes | 270,847 | | | 269,634 | | Convertible senior notes | 272,512 | | | 271,250 | |
| | Senior secured term loan facilities | Senior secured term loan facilities | 205,647 | | | 0 | | Senior secured term loan facilities | 208,785 | | | 206,448 | |
| | Dividends payable | Dividends payable | 11,065 | | | 23,063 | | Dividends payable | 13,713 | | | 25,049 | |
| | Other liabilities | Other liabilities | 77,272 | | | 24,491 | | Other liabilities | 25,140 | | | 22,961 | |
Total Liabilities (1) | Total Liabilities (1) | 3,467,390 | | | 3,440,726 | | Total Liabilities (1) | 2,965,956 | | | 3,284,802 | |
| 10% cumulative redeemable preferred stock, par value $0.01 per share; 50,000,000 shares authorized and 1,000 and 1,000 shares issued and outstanding, respectively | 1,000 | | | 1,000 | | |
| Commitments and Contingencies (see Note 10) | | Commitments and Contingencies (see Note 10) | 0 | | 0 |
| 10% cumulative redeemable preferred stock, par value $0.01 per share; 50,000,000 shares authorized and 1,000 shares issued and outstanding ($1,000,000 liquidation preference) | | 10% cumulative redeemable preferred stock, par value $0.01 per share; 50,000,000 shares authorized and 1,000 shares issued and outstanding ($1,000,000 liquidation preference) | 1,000 | | | 1,000 | |
| Stockholders’ Equity | Stockholders’ Equity | | Stockholders’ Equity | |
| Common stock, par value $0.01 per share; 450,000,000 shares authorized and 55,205,082 and 54,853,205 shares issued and outstanding, respectively | 552 | | | 549 | | |
| Common stock, par value $0.01 per share; 450,000,000 shares authorized and 53,789,465 and 55,205,082 shares issued and outstanding, respectively | | Common stock, par value $0.01 per share; 450,000,000 shares authorized and 53,789,465 and 55,205,082 shares issued and outstanding, respectively | 538 | | | 552 | |
| Additional paid-in capital | Additional paid-in capital | 1,057,016 | | | 1,048,484 | | Additional paid-in capital | 1,037,395 | | | 1,058,298 | |
| Accumulated other comprehensive income | 0 | | | 32 | | |
| Cumulative earnings | Cumulative earnings | 80,014 | | | 162,076 | | Cumulative earnings | 164,055 | | | 103,165 | |
| Cumulative distributions to stockholders | Cumulative distributions to stockholders | (203,120) | | | (192,005) | | Cumulative distributions to stockholders | (269,879) | | | (228,169) | |
| Total Stockholders’ Equity | 934,462 | | | 1,019,136 | | |
| Total Granite Point Mortgage Trust, Inc. Stockholders’ Equity | | Total Granite Point Mortgage Trust, Inc. Stockholders’ Equity | 932,109 | | | 933,846 | |
| Non-controlling interests | | Non-controlling interests | 125 | | | — | |
| Total Equity | | Total Equity | $ | 932,234 | | | $ | 933,846 | |
| Total Liabilities and Stockholders’ Equity | Total Liabilities and Stockholders’ Equity | $ | 4,402,852 | | | $ | 4,460,862 | | Total Liabilities and Stockholders’ Equity | $ | 3,899,190 | | | $ | 4,219,648 | |
____________________
(1)The condensed consolidated balance sheets include assets of consolidated variable interest entities, or VIEs, that can only be used to settle obligations of these VIEs, and liabilities of the consolidated VIEs for which creditors do not have recourse to Granite Point Mortgage Trust Inc. At September 30, 20202021 and December 31, 2019,2020, assets of the VIEs totaled $1,252,969$1,824,173 and $1,387,148,$1,255,932, respectively, and liabilities of the VIEs totaled $930,066$1,357,675 and $1,042,122,$928,220, respectively. See Note 34 - Variable Interest Entitiesand Securitized Debt Obligations for additional information.
The accompanying notes are an integral part of these condensed consolidated financial statements.
GRANITE POINT MORTGAGE TRUST INC.
CONDENSED CONSOLIDATED STATEMENTS OF COMPREHENSIVE INCOME (LOSS) INCOME
(in thousands, except share data)
| | | | Three Months Ended | | Nine Months Ended | | | Three Months Ended | | Nine Months Ended |
| | | September 30, | | September 30, | | | September 30, | | September 30, |
| | | 2020 | | 2019 | | 2020 | | 2019 | | | | 2021 | | 2020 | | 2021 | | 2020 | |
| Interest income: | Interest income: | | | | | Interest income: | | | | |
| Loans held-for-investment | Loans held-for-investment | | $ | 56,783 | | | $ | 61,796 | | | $ | 180,341 | | | $ | 176,594 | | | Loans held-for-investment | | $ | 48,312 | | | $ | 56,783 | | | $ | 151,701 | | | $ | 180,341 | | |
| Loans held-for-sale | Loans held-for-sale | | 774 | | | 0 | | | 895 | | | 0 | | | Loans held-for-sale | | — | | | 774 | | | — | | | 895 | | |
| Available-for-sale securities | Available-for-sale securities | | 119 | | | 308 | | | 646 | | | 927 | | | Available-for-sale securities | | — | | | 119 | | | — | | | 646 | | |
| Held-to-maturity securities | Held-to-maturity securities | | 113 | | | 530 | | | 659 | | | 1,804 | | | Held-to-maturity securities | | — | | | 113 | | | — | | | 659 | | |
| Cash and cash equivalents | Cash and cash equivalents | | 57 | | | 810 | | | 424 | | | 2,228 | | | Cash and cash equivalents | | 95 | | | 57 | | | 298 | | | 424 | | |
| Total interest income | Total interest income | | 57,846 | | | 63,444 | | | 182,965 | | | 181,553 | | | Total interest income | | 48,407 | | | 57,846 | | | 151,999 | | | 182,965 | | |
| Interest expense: | Interest expense: | | | | Interest expense: | | | |
| Repurchase agreements | | 12,791 | | | 17,951 | | | 46,742 | | | 48,469 | | | |
| Repurchase facilities | | Repurchase facilities | | 5,451 | | | 12,791 | | | 20,449 | | | 46,742 | | |
| Securitized debt obligations | Securitized debt obligations | | 5,431 | | | 12,467 | | | 21,367 | | | 35,880 | | | Securitized debt obligations | | 8,777 | | | 5,431 | | | 20,523 | | | 21,367 | | |
| Convertible senior notes | Convertible senior notes | | 4,529 | | | 4,503 | | | 13,570 | | | 13,459 | | | Convertible senior notes | | 4,556 | | | 4,529 | | | 13,618 | | | 13,570 | | |
| Term financing facility | | Term financing facility | | 1,453 | | | — | | | 6,208 | | | — | | |
| Asset-specific financings | Asset-specific financings | | 901 | | | 1,119 | | | 2,962 | | | 1,717 | | | Asset-specific financings | | 414 | | | 901 | | | 1,959 | | | 2,962 | | |
| Revolving credit facilities | Revolving credit facilities | | 217 | | | 322 | | | 779 | | | 1,182 | | | Revolving credit facilities | | — | | | 217 | | | — | | | 779 | | |
| Senior secured term loan facilities | Senior secured term loan facilities | | 145 | | | 0 | | | 145 | | | 0 | | | Senior secured term loan facilities | | 5,654 | | | 145 | | | 16,587 | | | 145 | | |
| Total interest expense | Total interest expense | | 24,014 | | | 36,362 | | | 85,565 | | | 100,707 | | | Total interest expense | | 26,305 | | | 24,014 | | | 79,344 | | | 85,565 | | |
| Net interest income | Net interest income | | 33,832 | | | 27,082 | | | 97,400 | | | 80,846 | | | Net interest income | | 22,102 | | | 33,832 | | | 72,655 | | | 97,400 | | |
| | Other (loss) income: | | | | |
| Provision for credit losses | | 5,300 | | | 0 | | | (62,241) | | | 0 | | | |
| Realized losses on sales | | (10,019) | | | 0 | | | (16,913) | | | 0 | | | |
| Other income (loss): | | Other income (loss): | | | |
| Benefit from (provision for) credit losses | | Benefit from (provision for) credit losses | | 5,760 | | | 5,300 | | | 15,072 | | | (62,241) | | |
| | Realized losses on sales of loans held-for-sale | | Realized losses on sales of loans held-for-sale | | — | | | (10,019) | | | — | | | (16,913) | | |
| Fee income | Fee income | | 595 | | | 0 | | | 1,117 | | | 1,115 | | | Fee income | | — | | | 595 | | | — | | | 1,117 | | |
| | Total other (loss) income | | (4,124) | | | 0 | | | (78,037) | | | 1,115 | | | |
| Total other income (loss) | | Total other income (loss) | | 5,760 | | | (4,124) | | | 15,072 | | | (78,037) | | |
| Expenses: | Expenses: | | | | Expenses: | | | |
| Management fees | | 3,974 | | | 3,801 | | | 11,840 | | | 11,013 | | | |
| Incentive fees | | 0 | | | 0 | | | 0 | | | 244 | | | |
| Base management fees | | Base management fees | | — | | | 3,974 | | | — | | | 11,840 | | |
| Compensation and benefits | | Compensation and benefits | | 5,634 | | | — | | | 16,111 | | | — | | |
| Servicing expenses | Servicing expenses | | 914 | | | 1,013 | | | 3,025 | | | 2,671 | | | Servicing expenses | | 1,323 | | | 914 | | | 3,763 | | | 3,025 | | |
| General and administrative expenses | | 5,808 | | | 4,877 | | | 24,421 | | | 15,499 | | | |
| Other operating expenses | | Other operating expenses | | 2,276 | | | 5,808 | | | 6,967 | | | 24,421 | | |
| Restructuring charges | Restructuring charges | | 43,682 | | | 0 | | | 43,682 | | | 0 | | | Restructuring charges | | — | | | 43,682 | | | — | | | 43,682 | | |
| Total expenses | Total expenses | | 54,378 | | | 9,691 | | | 82,968 | | | 29,427 | | | Total expenses | | 9,233 | | | 54,378 | | | 26,841 | | | 82,968 | | |
| (Loss) income before income taxes | | (24,670) | | | 17,391 | | | (63,605) | | | 52,534 | | | |
| Income (loss) before income taxes | | Income (loss) before income taxes | | 18,629 | | | (24,670) | | | 60,886 | | | (63,605) | | |
| Benefit from income taxes | Benefit from income taxes | | (4) | | | (1) | | | (15) | | | (4) | | | Benefit from income taxes | | (1) | | | (4) | | | (4) | | | (15) | | |
| Net (loss) income | | (24,666) | | | 17,392 | | | (63,590) | | | 52,538 | | | |
| Net income (loss) | | Net income (loss) | | 18,630 | | | (24,666) | | | 60,890 | | | (63,590) | | |
| Dividends on preferred stock | Dividends on preferred stock | | 25 | | | 25 | | | 75 | | | 75 | | | Dividends on preferred stock | | 25 | | | 25 | | | 75 | | | 75 | | |
| Net (loss) income attributable to common stockholders | | $ | (24,691) | | | $ | 17,367 | | | $ | (63,665) | | | $ | 52,463 | | | |
| Basic (loss) earnings per weighted average common share | | $ | (0.45) | | | $ | 0.32 | | | $ | (1.15) | | | $ | 1.00 | | | |
| Diluted (loss) earnings per weighted average common share | | $ | (0.45) | | | $ | 0.32 | | | $ | (1.15) | | | $ | 1.00 | | | |
| Net income (loss) attributable to common stockholders | | Net income (loss) attributable to common stockholders | | $ | 18,605 | | | $ | (24,691) | | | $ | 60,815 | | | $ | (63,665) | | |
| Basic earnings (loss) per weighted average common share | | Basic earnings (loss) per weighted average common share | | $ | 0.34 | | | $ | (0.45) | | | $ | 1.11 | | | $ | (1.15) | | |
| Diluted earnings (loss) per weighted average common share | | Diluted earnings (loss) per weighted average common share | | $ | 0.33 | | | $ | (0.45) | | | $ | 1.05 | | | $ | (1.15) | | |
| Dividends declared per common share | Dividends declared per common share | | $ | 0.20 | | | $ | 0.42 | | | $ | 0.20 | | | $ | 1.26 | | | Dividends declared per common share | | $ | 0.25 | | | $ | 0.20 | | | $ | 0.75 | | | $ | 0.20 | | |
| Weighted average number of shares of common stock outstanding: | Weighted average number of shares of common stock outstanding: | | | | | | | | | | Weighted average number of shares of common stock outstanding: | | | | | | | | | |
| Basic | Basic | | 55,205,082 | | | 54,853,205 | | | 55,140,163 | | | 52,492,324 | | | Basic | | 54,453,546 | | | 55,205,082 | | | 54,864,456 | | | 55,140,163 | | |
| Diluted | Diluted | | 55,205,082 | | | 54,853,205 | | | 55,140,163 | | | 52,492,324 | | | Diluted | | 56,735,278 | | | 55,205,082 | | | 70,902,745 | | | 55,140,163 | | |
| Comprehensive (loss) income: | | | | | | | | | | |
| Net (loss) income attributable to common stockholders | | $ | (24,691) | | | $ | 17,367 | | | $ | (63,665) | | | $ | 52,463 | | | |
| Other comprehensive income, net of tax: | | | | |
| Unrealized gain on available-for-sale securities | | 0 | | | 0 | | | 0 | | | 224 | | | |
| Other comprehensive income | | 0 | | | 0 | | | 0 | | | 224 | | | |
| Comprehensive (loss) income | | $ | (24,691) | | | $ | 17,367 | | | $ | (63,665) | | | $ | 52,687 | | | |
| Comprehensive income (loss): | | Comprehensive income (loss): | | | | | | | | | |
| Net income (loss) attributable to common stockholders | | Net income (loss) attributable to common stockholders | | $ | 18,605 | | | $ | (24,691) | | | $ | 60,815 | | | $ | (63,665) | | |
| Other comprehensive income (loss), net of tax: | | Other comprehensive income (loss), net of tax: | | | |
| | Comprehensive income (loss) | | Comprehensive income (loss) | | $ | 18,605 | | | $ | (24,691) | | | $ | 60,815 | | | $ | (63,665) | | |
The accompanying notes are an integral part of these condensed consolidated financial statements.
GRANITE POINT MORTGAGE TRUST INC
CONDENSED CONSOLIDATED STATEMENTS OF STOCKHOLDERS’ EQUITY
(in thousands, except share data)
| | | | | | | | | | | | | | | | | | | | | | | | | | | | | | | | | | | | | | | | | |
| Common Stock | | | | | | | | | | |
| Shares | | Amount | | Additional Paid-in Capital | | Accumulated Other Comprehensive Income (Loss) | | Cumulative Earnings | | Cumulative Distributions to Stockholders | | Total Stockholders’ Equity |
| Balance, December 31, 2018 | 43,621,174 | | | $ | 436 | | | $ | 836,288 | | | $ | (192) | | | $ | 91,875 | | | $ | (100,876) | | | $ | 827,531 | |
| Cumulative effect of adoption of new accounting principle | — | | | — | | | 13 | | | — | | | (13) | | | — | | | 0 | |
| Adjusted balance, January 1, 2019 | 43,621,174 | | | 436 | | | 836,301 | | | (192) | | | 91,862 | | | (100,876) | | | 827,531 | |
| Net income | — | | | — | | | — | | | — | | | 16,969 | | | — | | | 16,969 | |
| Other comprehensive income before reclassifications | — | | | — | | | — | | | 192 | | | — | | | — | | | 192 | |
| Amounts reclassified from accumulated other comprehensive income | — | | | — | | | — | | | 0 | | | — | | | — | | | 0 | |
| Net other comprehensive income | — | | | — | | | — | | | 192 | | | — | | | — | | | 192 | |
| Issuance of common stock, net of offering costs | 8,291,829 | | | 83 | | | 157,145 | | | — | | | — | | | — | | | 157,228 | |
| | | | | | | | | | | | | |
| Common dividends declared | — | | | — | | | — | | | — | | | — | | | (21,913) | | | (21,913) | |
| Preferred dividends declared | — | | | — | | | — | | | — | | | — | | | (25) | | | (25) | |
| | | | | | | | | | | | | |
| Non-cash equity award compensation | 258,918 | | | 3 | | | 1,146 | | | — | | | — | | | — | | | 1,149 | |
| Balance, March 31, 2019 | 52,171,921 | | | 522 | | | 994,592 | | | 0 | | | 108,831 | | | (122,814) | | | 981,131 | |
| Net income | — | | | — | | | — | | | — | | | 18,177 | | | — | | | 18,177 | |
| Other comprehensive income before reclassifications | — | | | — | | | — | | | 32 | | | — | | | — | | | 32 | |
| Amounts reclassified from accumulated other comprehensive income | — | | | — | | | — | | | 0 | | | — | | | — | | | 0 | |
| Net other comprehensive income | — | | | — | | | — | | | 32 | | | — | | | — | | | 32 | |
| Issuance of common stock, net of offering costs | 2,663,095 | | | 27 | | | 50,150 | | | — | | | — | | | — | | | 50,177 | |
| | | | | | | | | | | | | |
| Common dividends declared | — | | | — | | | — | | | — | | | — | | | (23,039) | | | (23,039) | |
| Preferred dividends declared | — | | | — | | | — | | | — | | | — | | | (25) | | | (25) | |
| | | | | | | | | | | | | |
| Non-cash equity award compensation | 18,189 | | | 0 | | | 1,283 | | | — | | | — | | | — | | | 1,283 | |
| Balance, June 30, 2019 | 54,853,205 | | | 549 | | | 1,046,025 | | | 32 | | | 127,008 | | | (145,878) | | | 1,027,736 | |
| | | | | | | | | | | | | |
| | | | | | | | | | | | | |
| Net income | — | | | — | | | — | | | — | | | 17,392 | | | — | | | 17,392 | |
| Other comprehensive income before reclassifications | — | | | — | | | — | | | 0 | | | — | | | — | | | 0 | |
| Amounts reclassified from accumulated other comprehensive income | — | | | — | | | — | | | 0 | | | — | | | — | | | 0 | |
| Net other comprehensive income | — | | | — | | | — | | | 0 | | | — | | | — | | | 0 | |
| Issuance of common stock, net of offering costs | 0 | | | 0 | | | 0 | | | — | | | — | | | — | | | 0 | |
| | | | | | | | | | | | | |
| Common dividends declared | — | | | — | | | — | | | — | | | — | | | (23,038) | | | (23,038) | |
| Preferred dividends declared | — | | | — | | | — | | | — | | | — | | | (25) | | | (25) | |
| | | | | | | | | | | | | |
| Non-cash equity award compensation | 0 | | | 0 | | | 1,175 | | | — | | | — | | | — | | | 1,175 | |
| Balance, September 30, 2019 | 54,853,205 | | | $ | 549 | | | $ | 1,047,200 | | | $ | 32 | | | $ | 144,400 | | | $ | (168,941) | | | $ | 1,023,240 | |
| | | | | | | | | | | | | |
| The accompanying notes are an integral part of these condensed consolidated financial statements. |
| | | | | | | | | | | | | | | | | | | | | | | | | | | | | | | | | | | | | | | | | | | | | | | | | | | | | |
| Common Stock | | | | | | | | | | | | | | |
| Shares | | Amount | | Additional Paid-in Capital | | Accumulated Other Comprehensive Income (Loss) | | Cumulative Earnings | | Cumulative Distributions to Stockholders | | Total Stockholders’ Equity | | Non-controlling Interests | | Total Equity |
| | | | | | | | | | | | | | | | | |
| | | | | | | | | | | | | | | | | |
| | | | | | | | | | | | | | | | | |
| | | | | | | | | | | | | | | | | |
| | | | | | | | | | | | | | | | | |
| | | | | | | | | | | | | | | | | |
| | | | | | | | | | | | | | | | | |
| | | | | | | | | | | | | | | | | |
| | | | | | | | | | | | | | | | | |
| | | | | | | | | | | | | | | | | |
| | | | | | | | | | | | | | | | | |
| | | | | | | | | | | | | | | | | |
| | | | | | | | | | | | | | | | | |
| | | | | | | | | | | | | | | | | |
| | | | | | | | | | | | | | | | | |
| | | | | | | | | | | | | | | | | |
| | | | | | | | | | | | | | | | | |
| | | | | | | | | | | | | | | | | |
| | | | | | | | | | | | | | | | | |
| | | | | | | | | | | | | | | | | |
| | | | | | | | | | | | | | | | | |
| | | | | | | | | | | | | | | | | |
| | | | | | | | | | | | | | | | | |
| | | | | | | | | | | | | | | | | |
| | | | | | | | | | | | | | | | | |
| | | | | | | | | | | | | | | | | |
| | | | | | | | | | | | | | | | | |
| | | | | | | | | | | | | | | | | |
| | | | | | | | | | | | | | | | | |
| | | | | | | | | | | | | | | | | |
| | | | | | | | | | | | | | | | | |
| | | | | | | | | | | | | | | | | |
| | | | | | | | | | | | | | | | | |
| | | | | | | | | | | | | | | | | |
| | | | | | | | | | | | | | | | | |
| Balance, December 31, 2019 | 54,853,205 | | | 549 | | | 1,048,484 | | | 32 | | | 162,076 | | | (192,005) | | | 1,019,136 | | | — | | | 1,019,136 | |
| Cumulative effect of adoption of new accounting principle | — | | | — | | | — | | | — | | | (18,472) | | | — | | | (18,472) | | | — | | | (18,472) | |
| Adjusted balance, January 1, 2020 | 54,853,205 | | | 549 | | | 1,048,484 | | | 32 | | | 143,604 | | | (192,005) | | | 1,000,664 | | | — | | | 1,000,664 | |
| Net loss | — | | | — | | | — | | | — | | | (37,191) | | | — | | | (37,191) | | | — | | | (37,191) | |
| Other comprehensive loss before reclassifications | — | | | — | | | — | | | (4,511) | | | — | | | — | | | (4,511) | | | — | | | (4,511) | |
| Amounts reclassified from accumulated other comprehensive income | — | | | — | | | — | | | 767 | | | — | | | — | | | 767 | | | — | | | 767 | |
| Net other comprehensive loss | — | | | — | | | — | | | (3,744) | | | — | | | — | | | (3,744) | | | — | | | (3,744) | |
| | | | | | | | | | | | | | | | | |
| | | | | | | | | | | | | | | | | |
| | | | | | | | | | | | | | | | | |
| Preferred dividends declared, $25.00 per share | — | | | — | | | — | | | — | | | — | | | (25) | | | (25) | | | — | | | (25) | |
| | | | | | | | | | | | | | | | | |
| Non-cash equity award compensation | 283,680 | | | 3 | | | 1,352 | | | — | | | — | | | — | | | 1,355 | | | — | | | 1,355 | |
| Balance, March 31, 2020 | 55,136,885 | | | 552 | | | 1,049,836 | | | (3,712) | | | 106,413 | | | (192,030) | | | 961,059 | | | — | | | 961,059 | |
| Net loss | — | | | — | | | — | | | — | | | (1,733) | | | — | | | (1,733) | | | — | | | (1,733) | |
| Other comprehensive income before reclassifications | — | | | — | | | — | | | 4,223 | | | — | | | — | | | 4,223 | | | — | | | 4,223 | |
| Amounts reclassified from accumulated other comprehensive income | — | | | — | | | — | | | (511) | | | — | | | — | | | (511) | | | — | | | (511) | |
| Net other comprehensive income | — | | | — | | | — | | | 3,712 | | | — | | | — | | | 3,712 | | | — | | | 3,712 | |
| | | | | | | | | | | | | | | | | |
| | | | | | | | | | | | | | | | | |
| | | | | | | | | | | | | | | | | |
| Preferred dividends declared, $25.00 per share | — | | | — | | | — | | | — | | | — | | | (25) | | | (25) | | | — | | | (25) | |
| | | | | | | | | | | | | | | | | |
| Non-cash equity award compensation | 68,197 | | | — | | | 1,323 | | | — | | | — | | | — | | | 1,323 | | | — | | | 1,323 | |
| Balance, June 30, 2020 | 55,205,082 | | | 552 | | | 1,051,159 | | | — | | | 104,680 | | | (192,055) | | | 964,336 | | | — | | | 964,336 | |
| Net loss | — | | | — | | | — | | | — | | | (24,666) | | | — | | | (24,666) | | | — | | | (24,666) | |
| Issuance of warrants to purchase common stock | — | | | — | | | 4,541 | | | — | | | — | | | — | | | 4,541 | | | — | | | 4,541 | |
| Common dividends declared, $0.20 per share | — | | | $ | — | | | — | | | — | | | — | | | (11,040) | | | (11,040) | | | — | | | (11,040) | |
| Preferred dividends declared, $25.00 per share | — | | | $ | — | | | — | | | — | | | — | | | (25) | | | (25) | | | — | | | (25) | |
| Non-cash equity award compensation | — | | | $ | — | | | 1,316 | | | — | | | — | | | — | | | 1,316 | | | — | | | 1,316 | |
| Balance, September 30, 2020 | 55,205,082 | | | $ | 552 | | | $ | 1,057,016 | | | $ | — | | | $ | 80,014 | | | $ | (203,120) | | | $ | 934,462 | | | — | | | $ | 934,462 | |
| | | | | | | | | | | | | | | | | |
GRANITE POINT MORTGAGE TRUST INC
CONDENSED CONSOLIDATED STATEMENTS OF STOCKHOLDERS’ EQUITY
(in thousands, except share data) (Continued)
| | | | | | | | | | | | | | | | | | | | | | | | | | | | | | | | | | | | | | | | | |
| Common Stock | | | | | | | | | | |
| Shares | | Amount | | Additional Paid-in Capital | | Accumulated Other Comprehensive Income (Loss) | | Cumulative Earnings | | Cumulative Distributions to Stockholders | | Total Stockholders’ Equity |
| Balance, December 31, 2019 | 54,853,205 | | | $ | 549 | | | $ | 1,048,484 | | | $ | 32 | | | $ | 162,076 | | | $ | (192,005) | | | $ | 1,019,136 | |
| Cumulative effect of adoption of new accounting principle | — | | | — | | | — | | | — | | | (18,472) | | | — | | | (18,472) | |
| Adjusted balance, January 1, 2020 | 54,853,205 | | | 549 | | | 1,048,484 | | | 32 | | | 143,604 | | | (192,005) | | | 1,000,664 | |
| Net loss | — | | | — | | | — | | | — | | | (37,191) | | | — | | | (37,191) | |
| Other comprehensive income before reclassifications | — | | | — | | | — | | | (4,511) | | | — | | | — | | | (4,511) | |
| Amounts reclassified from accumulated other comprehensive income | — | | | — | | | — | | | 767 | | | — | | | — | | | 767 | |
| Net other comprehensive income | — | | | — | | | — | | | (3,744) | | | — | | | — | | | (3,744) | |
| Preferred dividends declared | — | | | — | | | — | | | — | | | — | | | (25) | | | (25) | |
| Non-cash equity award compensation | 283,680 | | | 3 | | | 1,352 | | | — | | | — | | | — | | | 1,355 | |
| Balance, March 31, 2020 | 55,136,885 | | | 552 | | | 1,049,836 | | | (3,712) | | | 106,413 | | | (192,030) | | | 961,059 | |
| Net loss | — | | | — | | | — | | | — | | | (1,733) | | | — | | | (1,733) | |
| Other comprehensive income before reclassifications | — | | | — | | | — | | | 4,223 | | | — | | | — | | | 4,223 | |
| Amounts reclassified from accumulated other comprehensive income | — | | | — | | | — | | | (511) | | | — | | | — | | | (511) | |
| Net other comprehensive income | — | | | — | | | — | | | 3,712 | | | — | | | — | | | 3,712 | |
| | | | | | | | | | | | | |
| | | | | | | | | | | | | |
| | | | | | | | | | | | | |
| Preferred dividends declared | — | | | — | | | — | | | — | | | — | | | (25) | | | (25) | |
| | | | | | | | | | | | | |
| Non-cash equity award compensation | 68,197 | | | 0 | | | 1,323 | | | — | | | — | | | — | | | 1,323 | |
| Balance, June 30, 2020 | 55,205,082 | | | 552 | | | 1,051,159 | | | 0 | | | 104,680 | | | (192,055) | | | 964,336 | |
| | | | | | | | | | | | | |
| | | | | | | | | | | | | |
| Net loss | — | | | — | | | — | | | — | | | (24,666) | | | — | | | (24,666) | |
| Other comprehensive income before reclassifications | — | | | — | | | — | | | 0 | | | — | | | — | | | 0 | |
| Amounts reclassified from accumulated other comprehensive income | — | | | — | | | — | | | 0 | | | — | | | — | | | 0 | |
| Net other comprehensive income | — | | | — | | | — | | | 0 | | | — | | | — | | | 0 | |
| Issuance of common stock, net of offering costs | 0 | | | 0 | | | 0 | | | — | | | — | | | — | | | 0 | |
| Issuance of warrants to purchase common stock | — | | | — | | | 4,541 | | | — | | | — | | | — | | | 4,541 | |
| Common dividends declared | — | | | — | | | — | | | — | | | — | | | (11,040) | | | (11,040) | |
| Preferred dividends declared | — | | | — | | | — | | | — | | | — | | | (25) | | | (25) | |
| | | | | | | | | | | | | |
| Non-cash equity award compensation | 0 | | | 0 | | | 1,316 | | | — | | | — | | | — | | | 1,316 | |
| Balance, September 30, 2020 | 55,205,082 | | | $ | 552 | | | $ | 1,057,016 | | | $ | 0 | | | $ | 80,014 | | | $ | (203,120) | | | $ | 934,462 | |
| | | | | | | | | | | | | | | | | | | | | | | | | | | | | | | | | | | | | | | | | | | | | | | | | | | | | |
| Common Stock | | | | | | | | | | | | | | |
| Shares | | Amount | | Additional Paid-in Capital | | Accumulated Other Comprehensive Income (Loss) | | Cumulative Earnings | | Cumulative Distributions to Stockholders | | Total Stockholders’ Equity | | Non-controlling Interests | | Total Equity |
| Balance, December 31, 2020 | 55,205,082 | | | 552 | | | 1,058,298 | | | — | | | 103,165 | | | (228,169) | | | 933,846 | | | — | | | 933,846 | |
| | | | | | | | | | | | | | | | | |
| | | | | | | | | | | | | | | | | |
| Net income | — | | | — | | | — | | | — | | | 27,991 | | | — | | | 27,991 | | | — | | | |
| | | | | | | | | | | | | | | | | |
| | | | | | | | | | | | | | | | | |
| | | | | | | | | | | | | | | | | |
| Restricted stock forfeiture | (97,425) | | | (1) | | | (918) | | | — | | | — | | | — | | | (919) | | | — | | | (919) | |
| Common dividends declared, $0.25 per share | — | | | — | | | — | | | — | | | — | | | (14,008) | | | (14,008) | | | — | | | (14,008) | |
| Preferred dividends declared, $25.00 per share | — | | | — | | | — | | | — | | | — | | | (25) | | | (25) | | | — | | | (25) | |
| Non-cash equity award compensation | — | | | — | | | 1,887 | | | — | | | — | | | — | | | 1,887 | | | — | | | 1,887 | |
| Contributions from non-controlling interests | — | | | — | | | — | | | — | | | — | | | — | | | — | | | 125 | | | 125 | |
| Balance, March 31, 2021 | 55,107,657 | | | 551 | | | 1,059,267 | | | — | | | 131,156 | | | (242,202) | | | 948,772 | | | 125 | | | 948,897 | |
| Net income | — | | | — | | | — | | | — | | | 14,269 | | | — | | | 14,269 | | | — | | | 14,269 | |
| | | | | | | | | | | | | | | | | |
| | | | | | | | | | | | | | | | | |
| | | | | | | | | | | | | | | | | |
| | | | | | | | | | | | | | | | | |
| Restricted stock forfeiture | (17,628) | | | | | (275) | | | — | | | — | | | — | | | (275) | | | — | | | (275) | |
| Repurchase of common stock | (300,891) | | | (3) | | | (4,267) | | | — | | | — | | | — | | | (4,270) | | | — | | | (4,270) | |
| Common dividends declared, $0.25 per share | — | | | — | | | — | | | — | | | — | | | (13,939) | | | (13,939) | | | — | | | (13,939) | |
| Preferred dividends declared, $25.00 per share | — | | | — | | | — | | | — | | | — | | | (25) | | | (25) | | | — | | | (25) | |
| | | | | | | | | | | | | | | | | |
| Non-cash equity award compensation | 1,048 | | | — | | | 1,639 | | | — | | | — | | | — | | | 1,639 | | | — | | | 1,639 | |
| Balance, June 30, 2021 | 54,790,186 | | | 548 | | | 1,056,364 | | | — | | | 145,425 | | | (256,166) | | | 946,171 | | | 125 | | | 946,296 | |
| Net income | — | | | — | | | — | | | — | | | 18,630 | | | — | | | 18,630 | | | — | | | 18,630 | |
| Settlement of warrants to purchase common stock | — | | | — | | | (7,478) | | | — | | | — | | | — | | | (7,478) | | | — | | | (7,478) | |
| Repurchase of common stock | (1,000,721) | | | (10) | | | (13,523) | | | — | | | — | | | — | | | (13,533) | | | — | | | (13,533) | |
| Common dividends declared, $0.25 per share | — | | | — | | | — | | | — | | | — | | | (13,688) | | | (13,688) | | | — | | | (13,688) | |
| Preferred dividends declared, $25.00 per share | — | | | — | | | — | | | — | | | — | | | (25) | | | (25) | | | — | | | (25) | |
| Non-cash equity award compensation | — | | | — | | | 2,032 | | | — | | | — | | | — | | | 2,032 | | | — | | | 2,032 | |
| Balance, September 30, 2021 | 53,789,465 | | | $ | 538 | | | $ | 1,037,395 | | | $ | — | | | $ | 164,055 | | | $ | (269,879) | | | $ | 932,109 | | | $ | 125 | | | $ | 932,234 | |
The accompanying notes are an integral part of these condensed consolidated financial statements.
GRANITE POINT MORTGAGE TRUST INC.
CONDENSED CONSOLIDATED STATEMENTS OF CASH FLOWS
(in (in thousands)
| | | | | | | | | | | | | | |
| | Nine Months Ended | | |
| | September 30, | | |
| | 2020 | | 2019 | | |
| Cash Flows From Operating Activities: | | | | |
| Net (loss) income | | $ | (63,590) | | | $ | 52,538 | | | |
| Adjustments to reconcile net (loss) income to net cash provided by operating activities: | | | | | | |
| Accretion of discounts and net deferred fees on loans held-for-investment | | (12,557) | | | (11,038) | | | |
| Amortization of deferred debt issuance costs on convertible senior notes, securitized debt obligations and term loan facilities | | 4,646 | | | 5,792 | | | |
| Provision for credit losses | | 62,241 | | | 0 | | | |
| | | | | | |
| Realized losses on sales | | 16,913 | | | 0 | | | |
| | | | | | |
| | | | | | |
| | | | | | |
| Equity based compensation | | 3,994 | | | 3,607 | | | |
| | | | | | |
| Net change in assets and liabilities: | | | | | | |
| Increase in accrued interest receivable | | (610) | | | (530) | | | |
| | | | | | |
| | | | | | |
| | | | | | |
| Increase in other assets | | (19,899) | | | (10,157) | | | |
| | | | | | |
| | | | | | |
| | | | | | |
| | | | | | |
| Increase in other liabilities | | 44,911 | | | 10,197 | | | |
| | | | | | |
| Net cash provided by operating activities | | 36,049 | | | 50,409 | | | |
| Cash Flows From Investing Activities: | | | | | | |
| Originations, acquisitions and additional fundings of loans held-for-investment, net of deferred fees | | (314,722) | | | (1,216,679) | | | |
| | | | | | |
| Proceeds from repayment of loans held-for-investment | | 290,838 | | | 468,534 | | | |
| | | | | | |
| | | | | | |
| Principal payments on available-for-sale securities | | 12,798 | | | 0 | | | |
| | | | | | |
| | | | | | |
| Principal payments on held-to-maturity securities | | 18,076 | | | 7,102 | | | |
| | | | | | |
| Proceeds from sales of loans held-for-sale | | 193,538 | | | 0 | | | |
| | | | | | |
| | | | | | |
| Net cash provided by (used in) investing activities | | 200,528 | | | (741,043) | | | |
| | | | | | |
| Cash Flows From Financing Activities: | | | | | | |
| Proceeds from repurchase agreements | | 397,004 | | | 1,014,802 | | | |
| Principal payments on repurchase agreements | | (470,180) | | | (790,433) | | | |
| Proceeds from issuance of securitized debt obligations | | 0 | | | 646,868 | | | |
| Principal payments on securitized debt obligations | | (115,853) | | | (181,000) | | | |
| | | | | | |
| Proceeds from asset-specific financings | | 6,626 | | | 114,080 | | | |
| | | | | | |
| Proceeds from revolving credit facilities | | 38,361 | | | 164,598 | | | |
| Repayment of revolving credit facilities | | (80,369) | | | (239,598) | | | |
| Proceeds from senior secured term loan facilities | | 205,647 | | | 0 | | | |
| Proceeds from issuance of warrants to purchase common stock | | 4,541 | | | 0 | | | |
| | | | | | |
| Proceeds from issuance of common stock, net of offering costs | | 0 | | | 207,405 | | | |
| | | | | | |
| | | | | | |
| | | | | | |
| Dividends paid on preferred stock | | (75) | | | (75) | | | |
| Dividends paid on common stock | | (23,038) | | | (63,273) | | | |
| Net cash (used in) provided by financing activities | | (37,336) | | | 873,374 | | | |
| Net increase in cash, cash equivalents and restricted cash | | 199,241 | | | 182,740 | | | |
| Cash, cash equivalents and restricted cash at beginning of period | | 159,764 | | | 123,423 | | | |
| Cash, cash equivalents and restricted cash at end of period | | $ | 359,005 | | | $ | 306,163 | | | |
| Supplemental Disclosure of Cash Flow Information: | | | | | | |
| Cash paid for interest | | $ | 83,366 | | | $ | 95,847 | | | |
| | | | | | |
| Noncash Activities: | | | | | | |
| Transfers of loans held-for-investment to loans held-for-sale | | $ | 210,452 | | | $ | 0 | | | |
| Dividends declared but not paid at end of period | | $ | 11,065 | | | $ | 23,063 | | | |
| | | | | | | | | | | | | | |
| | Nine Months Ended |
| | September 30, |
| | 2021 | | 2020 | | |
| Cash Flows From Operating Activities: | | | | |
| Net income (loss) | | $ | 60,890 | | | $ | (63,590) | | | |
| Adjustments to reconcile net income (loss) to net cash provided by operating activities: | | | | | | |
| Accretion of discounts and net deferred fees on loans held-for-investment and deferred interest capitalized to loans held-for-investment | | (20,310) | | | (12,557) | | | |
| Amortization of deferred debt issuance costs on repurchase facilities, asset-specific financings, convertible senior notes, securitized debt obligations, senior secured term loan facilities and term financing facilities | | 9,692 | | | 4,646 | | | |
| (Benefit from) provision for credit losses | | (15,072) | | | 62,241 | | | |
| | | | | | |
| | | | | | |
| Realized losses on sales of loans held-for-sale | | — | | | 16,913 | | | |
| | | | | | |
| | | | | | |
| | | | | | |
| Amortization of equity-based compensation | | 5,558 | | | 3,994 | | | |
| Depreciation of fixed assets | | — | | | — | | | |
| Net change in assets and liabilities: | | | | | | |
| Decrease (increase) in accrued interest receivable | | 2,490 | | | (610) | | | |
| | | | | | |
| | | | | | |
| | | | | | |
| Increase in other assets | | (4,069) | | | (19,899) | | | |
| | | | | | |
| | | | | | |
| | | | | | |
| | | | | | |
| Increase in other liabilities | | 5,846 | | | 44,911 | | | |
| | | | | | |
| Net cash provided by operating activities | | 45,025 | | | 36,049 | | | |
| Cash Flows From Investing Activities: | | | | | | |
| Originations, acquisitions and additional fundings of loans held-for-investment, net of deferred fees | | (549,705) | | | (314,722) | | | |
| | | | | | |
| Proceeds from repayment of loans held-for-investment | | 815,054 | | | 290,838 | | | |
| | | | | | |
| | | | | | |
| | | | | | |
| Increase in other assets, due from servicer/trustee on repayments of loans held-for-investment | | (66,944) | | | — | | | |
| Principal payments on available-for-sale securities | | — | | | 12,798 | | | |
| | | | | | |
| | | | | | |
| Principal payments on held-to-maturity securities | | — | | | 18,076 | | | |
| | | | | | |
| Proceeds from sales of loans held-for-sale | | — | | | 193,538 | | | |
| | | | | | |
| | | | | | |
| Net cash provided by investing activities | | 198,405 | | | 200,528 | | | |
| | | | | | |
| Cash Flows From Financing Activities: | | | | | | |
| Proceeds from repurchase facilities | | 347,261 | | | 397,004 | | | |
| Principal payments on repurchase facilities | | (1,139,378) | | | (470,180) | | | |
| Proceeds from issuance of securitized debt obligations | | 685,766 | | | — | | | |
| Principal payments on securitized debt obligations | | (254,647) | | | (115,853) | | | |
| Proceeds from senior secured term loan facilities | | — | | | 205,647 | | | |
| Proceeds from asset-specific financings | | 2,785 | | | 6,626 | | | |
| Repayment of asset-specific financings | | (81,123) | | | — | | | |
| Proceeds from revolving credit facilities | | — | | | 38,361 | | | |
| Repayment of revolving credit facilities | | — | | | (80,369) | | | |
| Proceeds from term financing facility | | 349,291 | | | — | | | |
| Repayment of term financing facility | | (219,311) | | | — | | | |
| Payment of debt issuance costs | | (8,353) | | | — | | | |
| Proceeds from issuance of warrants to purchase common stock | | — | | | 4,541 | | | |
| Settlement of warrants to purchase common stock | | (7,478) | | | 0 | | |
| Contributions from non-controlling interests | | 125 | | | — | | | |
| Tax withholding on restricted stock | | (1,194) | | | — | | | |
| Repurchase of common stock | | (17,804) | | | — | | | |
| Dividends paid on preferred stock | | (75) | | | (75) | | | |
| Dividends paid on common stock | | (52,970) | | | (23,038) | | | |
| Net cash used in financing activities | | (397,105) | | | (37,336) | | | |
| Net (decrease) increase in cash, cash equivalents and restricted cash | | (153,675) | | | 199,241 | | | |
| Cash, cash equivalents and restricted cash at beginning of period | | 329,193 | | | 159,764 | | | |
| Cash, cash equivalents and restricted cash at end of period | | $ | 175,518 | | | $ | 359,005 | | | |
| Supplemental Disclosure of Cash Flow Information: | | | | | | |
| Cash paid for interest | | $ | 75,818 | | | $ | 83,366 | | | |
| Cash paid for taxes | | $ | 607 | | | $ | — | | | |
| Noncash Activities: | | | | | | |
| | | | | | |
| Transfers of loans held-for-investment to loans held-for-sale | | $ | — | | | $ | 210,452 | | | |
| Dividends declared but not paid at end of period | | $ | 13,713 | | | $ | 11,065 | | | |
The accompanying notes are an integral part of these condensed consolidated financial statements.
GRANITE POINT MORTGAGE TRUST INC.
Notes to the Condensed Consolidated Financial Statements (unaudited)
Note 1. Organization and Operations
Granite Point Mortgage Trust Inc., or the Company, is a Maryland corporationan internally managed real estate finance company that focuses primarily on directly originating, investing in and managing senior floating-rate commercial mortgage loans and other debt and debt-like commercial real estate investments. The Company’sThese investments are capitalized by accessing a variety of funding options, including borrowing under our bank credit facilities or other asset-specific financings, issuing commercial real estate collateralized loan obligations, or CRE CLOs, entering into term financing agreements, and issuing other forms of secured and unsecured debt and equity securities, depending on market conditions and our view of the most appropriate funding option available for our investments. Our investment objective is to preserve our stockholders’ capital while generating attractive risk-adjusted returns over the long term, primarily through dividends derived from current income produced by our investment portfolio. Our common stock is listed on the New York Stock Exchange, or NYSE, under the symbol “GPMT.”
Although“GPMT”. The Company operates its business in a manner that is intended to permit it to maintain its exclusion from registration under the Investment Company is currently externally managed by Pine River Capital Management L.P.,Act of 1940, as amended, or the Manager, subsequent to September 30, 2020, theInvestment Company entered into an internalization agreement with the Manager pursuant to which theAct. The Company will become an internally managed real estate investment trust, or REIT,operates its business as of 11:59 p.m.1 segment. The Company was incorporated in Maryland on December 31, 2020. See Note 21 – Subsequent Events for additional discussion of the Company’s internalization.April 7, 2017 and commenced operations as a publicly traded company on June 28, 2017.
The Company has elected to be treated as a real estate investment trust, or REIT, as defined under the Internal Revenue Code of 1986, as amended, or the Code, for U.S. federal income tax purposes. As long as the Company continues to comply with a number of requirements under federal tax law and maintains its qualification as a REIT, the Company generally will not be subject to U.S. federal income taxes to the extent that the Company distributes its taxable income to its stockholders on an annual basis and does not engage in prohibited transactions. However, certain activities that the Company may perform may cause it to earn income which will not be qualifying income for REIT purposes. The Company has designated one of its subsidiaries as a taxable REIT subsidiary, or TRS, as defined in the Code, to engage in such activities.
The Company was externally managed by Pine River Capital Management L.P., or the Former Manager, through December 31, 2020, at which time the Company internalized its management function, or the Internalization.
Note 2. Basis of Presentation and Significant Accounting Policies
Consolidation and Basis of Presentation
The interim unaudited condensed consolidated financial statements of the Company have been prepared in accordance with the rules and regulations of the Securities and Exchange Commission, or the SEC. Certain information and note disclosures normally included in financial statements prepared in accordance with U.S. generally accepted accounting principles, or GAAP, have been condensed or omitted according to such SEC rules and regulations. However, management believes that the disclosures included in these interim unaudited condensed consolidated financial statements are adequate to make the information presented not misleading. The accompanying interim unaudited condensed consolidated financial statements should be read in conjunction with the financial statements and notes thereto included in the Company’s Annual Report on Form 10-K for the year ended December 31, 2019.2020. In the opinion of management, all normal and recurring adjustments necessary to present fairly the financial condition of the Company at September 30, 20202021 and results of operations for all periods presented have been made. The results of operations for the three and nine months ended September 30, 20202021 should not be construed as indicative of the results to be expected for future periods or the full year.
The interim unaudited condensed consolidated financial statements of the Company include the accounts of all subsidiaries; inter-company accounts and transactions have been eliminated. Certain prior period amounts have been reclassified to conform to the current period presentation.
All entities in which the Company holds investments that are considered VIEs for financial reporting purposes were reviewed for consolidation under the applicable consolidation guidance. Whenever the Company has both the power to direct the activities of an entity that most significantly impact the entity’s performance, and the obligation to absorb losses or the right to receive benefits of the entity that could be significant, the Company consolidates the entity.
Use of Estimates
The preparation of financial statements in conformity with GAAP requires management to make a number of significant estimates. These include estimates of amount and timing of allowances for credit losses, fair value of certain assets and liabilities, and other estimates that affect the reported amounts of certain assets and liabilities as of the date of the condensed consolidated financial statements and the reported amounts of certain revenues and expenses during the reported period. It is likely that changes in these estimates (e.g.(e.g., valuation changes to the underlying collateral of loans due to changes in market capitalization rates, leasing, credit worthiness of major tenants, occupancy rates, availability of financing, exit plan, loan sponsorship, actions of other lenders, overall economic and capital markets conditions, the broader commercial real estate market, local geographic sub-markets or other factors) will occur in the near term. As of September 30, 2021, the COVID-19
GRANITE POINT MORTGAGE TRUST INC.
Notes to the Condensed Consolidated Financial Statements (unaudited)
pandemic remains ongoing. Since the beginning of 2020, the COVID-19 pandemic remains ongoing,has significantly impacted the global economy, created disruptions in the global supply chain, increased rates of unemployment and as a result, numerous countries, including the United States, have declared national emergencies. Such actions have resulted in significant macroeconomic disruptions and have adversely impacted many industries. Theindustries, including those related to the real estate collateral underlying certain of our loans. So far in 2021, the global and U.S. economic activity has, to varying degrees, begun to improve, as wider distribution of the COVID-19 vaccines has continued. As a result, macroeconomic forecasts have improved over the last few quarters, including expectations for unemployment rates and overall economic output. Nonetheless, the ongoing pandemic may continue to adversely impact the macroeconomic recovery, particularly with respect to the emergence of new variants of the COVID-19 virus, the continued distribution and acceptance of vaccines and the effectiveness of such vaccines against new variants of the COVID-19 virus. Accordingly, given the ongoing nature of the outbreak, at this time the Company cannot reasonably estimate the magnitude of the long-term impact that COVID-19 may have on the economic activity and real estate market conditions, resulting in a period of global economic slowdown. The rapidly evolvingas well as the Company’s business, financial performance and fluid nature of this situation precludes any prediction as to the ultimate adverse impact of COVID-19 on economic and market conditions.operating results. The Company believes the estimates and assumptions underlying its interim unaudited condensed consolidated financial statements are reasonable and supportable based on the information available as of September 30, 2020.2021. However, the significant degree of uncertainty over the ultimate impact the COVID-19 pandemic will have on the global economy generally, and the Company’s business in particular, makes any estimates and assumptions as of September 30, 20202021 inherently less certain than they would be absent the current and potential impacts of
GRANITE POINT MORTGAGE TRUST INC.
Notes to the Condensed Consolidated Financial Statements (unaudited)
COVID-19.COVID-19 pandemic. The Company’s actual results could ultimately differ from its estimates and such differences may be material.
Significant Accounting Policies
Included in Note 2 to the consolidated financial statementsConsolidated Financial Statements of the Company’s Annual Report on Form 10-K for the year ended December 31, 20192020 is a summary of the Company’s significant accounting policies. Provided below is a summary of additional accounting policies that are significant to the Company’s condensed consolidated financial condition and results of operations for the three and nine months ended September 30, 2020.2021.
Loans Held-for-SaleTerm Financing Facility
The Company classifiesfinances certain of its loans as held-for-sale based on management’s intent to sell or otherwise disposeheld-for-investment through the use of them. Loans held-for-sale are reported at the lower of amortized cost or fair value. Fair value is determineda term financing facility. Borrowings under the guidanceterm financing facility bear an interest rate of ASC 820. Interest income on loans held-for-sale is recognizeda specified margin over the one-month London Interbank Offered Rate, or LIBOR. The term financing facility financings are treated as collateralized financing transactions and are carried at the loan coupon rate and recorded on the consolidated statements of comprehensive income.
Restructuring Charges
Subsequent to September 30, 2020, the Company entered into an internalization agreement with the Manager pursuant to which the Company’s management agreement with the Manager, or the Management Agreement, will terminate effectivetheir contractual amounts, as of, 11:59 p.m. on December 31, 2020, and the Company will no longer pay base management fees or incentive fees with respect to any period thereafter. The termination of the Management Agreement will be a material changespecified in the management structure of the business, and is accounted for under ASC 420, Exit or disposal cost obligations. The one-time payment to be made to the Manager under the internalization agreement, and other associated costs incurred as part of the internalization of the Company’s management function, are recorded within restructuring charges with a corresponding liability recorded within other liabilities. See Note 17 – Restructuring Charges for additional discussion of the restructuring charges related to the Company’s internalization and Note 21 – Subsequent Events for additional discussion of the Company’s internalization.
Senior Secured Term Loan Facilities
The Company records senior secured term loan facilities as liabilities on the Company’s consolidated balance sheets. Where applicable, any issue discount or transaction expenses are deferred and amortized over the term of the loan using the effective interest method, and is included within interest expense in the Company’s consolidated statements of comprehensive (loss) income, while the unamortized balance is included as a reduction to the carrying amount on the Company’s consolidated balance sheets.respective agreements.
Recently Issued and/or Adopted Accounting Standards
Measurement of Credit Losses on Financial Instruments
On January 1, 2020, the Company adopted Accounting Standard Update, or ASU, 2016-13, Financial Instruments - Credit Losses (Topic 326): Measurement of Credit Losses on Financial Instruments, or ASU 2016-13. ASU 2016-13 significantly changes how entities measure credit losses for most financial assets and certain other instruments that are not measured at fair value through net income. ASU 2016-13 replaces the incurred loss model under existing guidance with a Current Expected Credit Loss, or CECL, model for instruments measured at amortized cost, and also require entities to record allowances for available-for-sale, or AFS, debt securities rather than reduce the amortized cost, as they did under the other-than-temporary impairment model. It also simplifies the accounting model for purchased credit-impaired debt securities and loans. In addition, the new model applies to off-balance sheet credit exposures, such as unfunded loan commitments. ASU 2016-13 was adopted by the Company through a cumulative-effect adjustment to cumulative earnings of $18.5 million as of January 1, 2020.
The allowance for credit losses required under ASU 2016-13 is a valuation account that is deducted from the amortized cost basis of related loans and debt securities on the Company’s condensed consolidated balance sheets, and which reduces the Company’s total stockholders’ equity. The initial allowance for credit losses recorded on January 1, 2020 is reflected as a direct charge to cumulative earnings; however, going forward, changes to the allowance for credit losses are recognized through net income on the Company’s condensed consolidated statements of comprehensive (loss) income. While ASU 2016-13 does not require any particular method for determining the allowance for credit losses, it does specify the allowance should be based on relevant information about past events, including historical loss experience, current portfolio, market conditions, and reasonable and supportable forecasts for the duration of each respective loan. In addition, other than a few narrow exceptions, ASU 2016-13 requires that all financial instruments subject to the CECL model have some amount of expected loss to reflect the GAAP principal underlying the CECL model that all loans, debt securities, and similar assets have some inherent risk of loss, regardless of credit quality, subordinate capital or other mitigating factors.
The Company’s loans typically include commitments to fund incremental proceeds to its borrowers over the life of the loan. Those future funding commitments are also subject to an allowance for credit losses. The allowance for credit losses related to future loan fundings is recorded as a component of other liabilities on the Company’s condensed consolidated balance sheets,
GRANITE POINT MORTGAGE TRUST INC.
Notes to the Condensed Consolidated Financial Statements (unaudited)
and not as an offset to the related loan balance. This allowance for credit losses is estimated using the same process outlined below for the Company’s outstanding loan balances, and changes in this component of the allowance for credit losses similarly flow through the Company’s condensed consolidated statements of comprehensive (loss) income.
The Company elected not to measure an allowance for credit losses on accrued interest receivable when the accrued interest is due within 90 days. The Company generally writes off accrued interest receivable balance when interest is 90 days or more past due unless the loan is both well secured and in the process of collection. Write-offs of accrued interest receivable are recognized within provision for credit losses in the condensed consolidated statements of comprehensive (loss) income. Accrued interest receivable includes deferred interest that may be collected at the loan maturity or past 90 days, and an allowance for credit losses has been included as part of the loan’s amortized cost. The Company did not write-off any accrued interest receivable during the three and nine months ended September 30, 2020.
The Company’s implementation process included a selection of a credit loss analytical model, completion and documentation of policies and procedures, changes to internal reporting processes and related internal controls and additional disclosures. A control framework for governance, data, forecast and model controls was developed to support the CECL process. The allowance for credit losses is estimated on a quarterly basis and represents management’s estimates of current expected credit losses in the Company’s investment portfolio. Pools of loans with similar risk characteristics are collectively evaluated while loans that no longer share risk characteristics with loan pools are evaluated individually. Estimating an allowance for credit losses is inherently subjective, as it requires management to exercise significant judgment in establishing appropriate factors used to determine the allowance and a variety of subjective assumptions, including (i) determination of relevant historical loan loss data sets, (ii) the expected timing and amount of future loan fundings and repayments, (iii) the current credit quality of loans and operating performance of loan collateral and the Company’s expectations of performance, (iv) selecting the forecast for macroeconomic conditions and (v) determining the reasonable and supportable forecast period.
Considering the lack of historical Company data related to any realized loan losses since its inception, the Company elected to estimate its allowance for credit losses by using a probability-weighted analytical model that considers the likelihood of default and loss-given-default for each individual loan. The analytical model incorporates a third-party licensed database with historical loan losses from 1998 to 2019 for over 100,000 commercial real estate loans. The Company’s allowance for credit losses reflects its estimates of the current and future economic conditions that impact the performance of the commercial real estate properties serving as collateral for the Company’s loan investments. These estimates include unemployment rates, interest rates, price indices for commercial property and other macroeconomic factors impacting the likelihood and magnitude of potential credit losses for the Company’s loans during their anticipated term. The Company licenses certain macroeconomic financial forecasts from a third-party to inform its view of the potential future impact that broader macroeconomic conditions may have on the performance of its loan portfolio. The forecasts are embedded in the licensed analytical model that the Company uses to estimate its allowance for credit losses. The Company may use one or more of these forecasts in the process of estimating its allowance for credit losses. Selection of these economic forecasts requires significant judgment about future events that, while based on the information available to the Company as of the balance sheet date, are ultimately unknowable with certainty, and the actual economic conditions impacting the Company’s portfolio could vary significantly from the estimates the Company made for the periods presented. At the time of adoption of ASU No. 2016-13, in determining its initial allowance for credit losses estimate, the Company employed a macroeconomic forecast that largely reflected management’s views at the time and projected a stable overall economic scenario over the reasonable projection period. Significant inputs to the Company’s estimate of the allowance for credit losses include the reasonable and supportable forecast period and loan specific factors such as debt service coverage ratio, or DSCR, loan-to-value, or LTV, remaining contractual loan term, property type and others. In addition, the Company also considers relevant loan-specific qualitative factors to estimate its allowance for credit losses. In certain instances, for loans with unique risk characteristics, the Company may instead elect to employ different methods to estimate loan losses that also conform to ASU 2016-13 and related guidance.
Upon adoption of ASU No. 2016-13 on January 1, 2020, based on the Company’s loan portfolio, pre-COVID-19 economic environment and management’s expectations for future economic and market conditions at the time, the Company recorded an initial allowance for credit losses, as a cumulative-effective adjustment to the cumulative earnings in its consolidated statements of stockholders’ equity, of approximately $18.5 million, or approximately $0.34 per share.
The following table illustrates the day-one financial statement impact of the adoption of ASU 2016-13 on January 1, 2020:
GRANITE POINT MORTGAGE TRUST INC.
Notes to the Condensed Consolidated Financial Statements (unaudited)
| | | | | | | | | | | | | | | | | |
| (in thousands) |
| ASSETS | Pre-ASU 2016-13 Adoption | | Cumulative Effect of Adoption | | As Reported Under ASU 2016-13 |
| Loans and securities | $ | 4,257,086 | | | $ | 0 | | | $ | 4,257,086 | |
| Allowance for credit losses | 0 | | | (16,692) | | | (16,692) | |
| Loans and securities, net | $ | 4,257,086 | | | $ | (16,692) | | | $ | 4,240,394 | |
| | | | | |
| LIABILITIES | | | | | |
Liability for off-balance sheet credit losses (1) | $ | 0 | | | $ | 1,780 | | | $ | 1,780 | |
| | | | | |
| STOCKHOLDERS’ EQUITY | | | | | |
| Cumulative earnings | $ | 162,076 | | | $ | (18,472) | | | $ | 143,604 | |
____________________
(1)Represents expected loss on unfunded commitments.
Facilitation of the Effects of Reference Rate Reform on Financial Reporting
In March 2020, the Financial Accounting Standards Board, or FASB, issued ASU No. 2020-04, Reference Rate Reform (Topic 848): Facilitation of the Effects of Reference Rate Reform on Financial Reporting,,or ASU No. 2020-04, which provides optional expedients and exceptions for applying GAAP to contracts, hedging relationshipsdebt instruments, derivatives, and other transactions affected by reference rate reform if certain criteria are met. The amendments apply only to contracts hedging relationships and other transactions that reference the London Interbank Offered Rate, or LIBOR or anotherother reference raterates expected to be discontinued becauseas a result of reference rate reform. ASU No. 2020-04This guidance is effective for all entities as of March 12, 2020optional and may be elected through December 31, 2022.2022 using a prospective application on all eligible contract modifications. The Company has loan agreements, and debt agreements that incorporate LIBOR as a referenced interest rate. It is currently evaluatingdifficult to predict what effect, if any, the impactphase-out of adopting this ASULIBOR and the use of alternative benchmarks may have on its consolidatedthe Company’s business or on the overall financial statements.markets. The Company has not adopted any of the optional expedients or exceptions through September 30, 2021, but will continue to evaluate the possible adoption of any such expedients or exceptions.
Accounting for Convertible Instruments and Contracts in an Entity’s Own Equity
In August 2020, the FASB issued ASU No. 2020-06, Debt – Debt with Conversion and Other Options (Subtopic 470-20) and Derivatives and Hedging – Contracts in an Entity’s Own Equity (Subtopic 815-40): Accounting for Convertible Instruments and Contracts in an Entity’s Own Equity,.or ASU No. 2020-06. The intention of ASU No. 2020-06 is to address the complexities in accounting for certain financial instruments with a debt and equity component. Under ASU No. 2020-06, the number of accounting models for convertible notes will be reduced and entities that issue convertible debt will be required to use the if-converted method for the computation of diluted "Earnings per share" under ASC 260. ASC 2020-06 is effective for fiscal years beginning after December 15, 2021 and may be adopted through either a modified retrospective method of transition or a fully retrospective method of transition. The Company is currently assessing the impact this guidance will have on its condensed consolidated financial statements.
Note 3. Variable Interest Entities
The Company finances pools of its commercial real estate loans through collateralized loan obligations, or CLOs, which are considered VIEs for financial reporting purposes and, thus, are reviewed for consolidation under the applicable consolidation guidance. The Company has both the power to direct the activities of the CLOs that most significantly impact the entities’ performance and the obligation to absorb losses or the right to receive benefits of the entities that could be significant, therefore, the Company consolidates the CLOs.
GRANITE POINT MORTGAGE TRUST INC.
Notes to the Condensed Consolidated Financial Statements (unaudited)
The following table presents a summary of the assets and liabilities of all VIEs consolidated on the Company’s condensed consolidated balance sheets as of September 30, 2020 and December 31, 2019:
| | | | | | | | | | | |
| (in thousands) | September 30,
2020 | | December 31,
2019 |
| Loans held-for-investment | $ | 1,262,619 | | | $ | 1,301,369 | |
| Allowance for credit losses | (19,677) | | | 0 | |
| Loans held-for-investment, net | 1,242,942 | | | 1,301,369 | |
| | | |
| Restricted cash | 1,921 | | | 76,093 | |
| | | |
| Other assets | 8,106 | | | 9,686 | |
| Total Assets | $ | 1,252,969 | | | $ | 1,387,148 | |
| Securitized debt obligations | $ | 928,623 | | | $ | 1,041,044 | |
| | | |
| Other liabilities | 1,443 | | | 1,078 | |
| Total Liabilities | $ | 930,066 | | | $ | 1,042,122 | |
The Company is not required to consolidate VIEs for which it has concluded it does not have both the power to direct the activities of the VIEs that most significantly impact the entities’ performance and the obligation to absorb losses or the right to receive benefits of the entities that could be significant. The Company’s investments in these unconsolidated VIEs include commercial mortgage-backed securities, or CMBS, which are classified within AFS securities, at fair value, and held-to-maturity, or HTM, securities on the condensed consolidated balance sheets. As of December 31, 2019, the carrying value, net of allowance for credit losses, which also represents the maximum exposure to loss, of all CMBS in unconsolidated VIEs was $30.9 million. The Company did 0t hold any CMBS as of September 30, 2020.
Note 4.3. Loans Held-for-Investment, Net of Allowance for Credit Losses
The Company originates and acquires commercial real estate debt and related instruments generally to be held as long-term investments. These assets are classified as “loans held-for-investment” on the condensed consolidated balance sheets. Loans held-for-investment are reported at cost, net of any unamortized acquisition premiums or discounts, loan fees, origination costs and allowance for credit losses, as applicable.
GRANITE POINT MORTGAGE TRUST INC.
Notes to the Condensed Consolidated Financial Statements (unaudited)
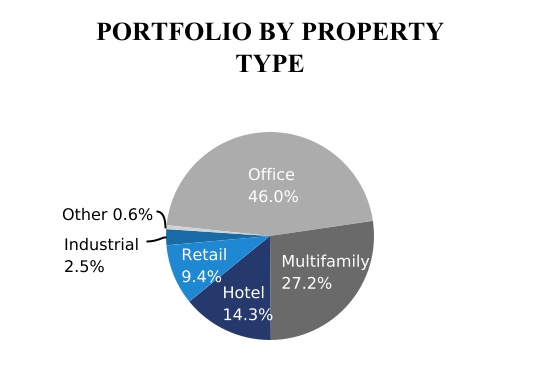
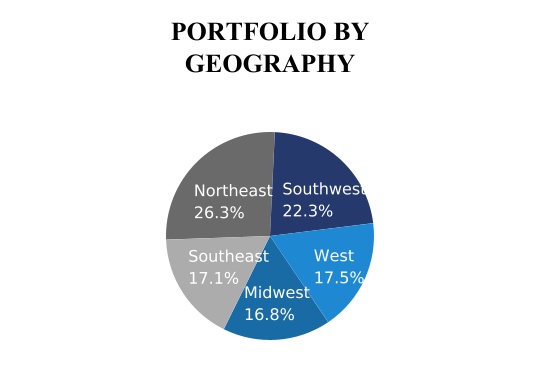
The following tables summarize the Company’s loans held-for-investment by asset type, property type and geographic location as of September 30, 20202021 and December 31, 2019:2020:
| | | September 30,
2020 | | September 30,
2021 |
| (dollars in thousands) | (dollars in thousands) | Senior Loans (1) | | Mezzanine Loans | | B-Notes | | Total | (dollars in thousands) | Senior Loans (1) | | Mezzanine Loans | | B-Notes | | Total |
| Unpaid principal balance | Unpaid principal balance | $ | 4,045,912 | | | $ | 12,586 | | | $ | 14,290 | | | $ | 4,072,788 | | Unpaid principal balance | $ | 3,657,401 | | | $ | 1,387 | | | $ | 14,065 | | | $ | 3,672,853 | |
| Unamortized (discount) premium | Unamortized (discount) premium | (72) | | | 0 | | | 0 | | | (72) | | Unamortized (discount) premium | (67) | | | — | | | — | | | (67) | |
| Unamortized net deferred origination fees | Unamortized net deferred origination fees | (20,543) | | | 28 | | | 0 | | | (20,515) | | Unamortized net deferred origination fees | (13,095) | | | — | | | — | | | (13,095) | |
| Allowance for credit losses | Allowance for credit losses | (71,632) | | | (1,421) | | | (286) | | | (73,339) | | Allowance for credit losses | (40,897) | | | (1,387) | | | (3,196) | | | (45,480) | |
| Carrying value | Carrying value | $ | 3,953,665 | | | $ | 11,193 | | | $ | 14,004 | | | $ | 3,978,862 | | Carrying value | $ | 3,603,342 | | | $ | — | | | $ | 10,869 | | | $ | 3,614,211 | |
| Unfunded commitments | Unfunded commitments | $ | 596,440 | | | $ | 0 | | | $ | 0 | | | $ | 596,440 | | Unfunded commitments | $ | 430,105 | | | $ | — | | | $ | — | | | $ | 430,105 | |
| Number of loans | Number of loans | 107 | | | 2 | | | 1 | | | 110 | | Number of loans | 98 | | | 1 | | | 1 | | | 100 | |
| Weighted average coupon | Weighted average coupon | 5.1 | % | | 10.4 | % | | 8.0 | % | | 5.1 | % | Weighted average coupon | 4.6 | % | | 13.0 | % | | 8.0 | % | | 4.6 | % |
Weighted average years to maturity (2) | Weighted average years to maturity (2) | 1.3 | | 1.2 | | 6.3 | | 1.3 | Weighted average years to maturity (2) | 1.0 | | 4.1 | | 5.3 | | 1.0 |
GRANITE POINT MORTGAGE TRUST INC.
Notes to the Condensed Consolidated Financial Statements (unaudited)
| | | December 31,
2019 | | December 31,
2020 |
| (dollars in thousands) | (dollars in thousands) | Senior Loans (1) | | Mezzanine Loans | | B-Notes | | Total | (dollars in thousands) | Senior Loans (1) | | Mezzanine Loans | | B-Notes | | Total |
| Unpaid principal balance | Unpaid principal balance | $ | 4,229,194 | | | $ | 13,503 | | | $ | 14,448 | | | $ | 4,257,145 | | Unpaid principal balance | $ | 3,915,833 | | | $ | 2,366 | | | $ | 14,235 | | | $ | 3,932,434 | |
| Unamortized (discount) premium | Unamortized (discount) premium | (124) | | | 0 | | | 0 | | | (124) | | Unamortized (discount) premium | (75) | | | — | | | — | | | (75) | |
| Unamortized net deferred origination fees | Unamortized net deferred origination fees | (30,788) | | | (21) | | | 0 | | | (30,809) | | Unamortized net deferred origination fees | (17,890) | | | — | | | — | | | (17,890) | |
| Allowance for credit losses | | Allowance for credit losses | (60,130) | | | (2,366) | | | (4,170) | | | (66,666) | |
| Carrying value | Carrying value | $ | 4,198,282 | | | $ | 13,482 | | | $ | 14,448 | | | $ | 4,226,212 | | Carrying value | $ | 3,837,738 | | | $ | — | | | $ | 10,065 | | | $ | 3,847,803 | |
| Unfunded commitments | Unfunded commitments | $ | 748,878 | | | $ | 0 | | | $ | 0 | | | $ | 748,878 | | Unfunded commitments | $ | 503,726 | | | $ | — | | | $ | — | | | $ | 503,726 | |
| Number of loans | Number of loans | 117 | | | 2 | | | 1 | | | 120 | | Number of loans | 101 | | | 1 | | | 1 | | | 103 | |
| Weighted average coupon | Weighted average coupon | 5.4 | % | | 11.7 | % | | 8.0 | % | | 5.4 | % | Weighted average coupon | 5.1 | % | | 13.0 | % | | 8.0 | % | | 5.1 | % |
Weighted average years to maturity (2) | Weighted average years to maturity (2) | 1.8 | | 2.0 | | 7.1 | | 1.8 | Weighted average years to maturity (2) | 1.1 | | 4.9 | | 6.1 | | 1.1 |
____________________
(1)Loans primarily secured by a first priority lien on commercial real property and related personal property and also includes, when applicable, any companion subordinate loans.
(2)Based on contractual maturity date. Certain loans are subject to contractual extension options with such conditions stipulated in the applicable loan documents. Actual maturities may differ from contractual maturities stated herein as certain borrowers may have the right to prepay with or without paying a prepayment fee. The Company may also extend contractual maturities in connection with certain loan modifications.
| | (dollars in thousands) | (dollars in thousands) | | September 30,
2020 | | December 31,
2019 | (dollars in thousands) | | September 30,
2021 | | December 31,
2020 |
| Property Type | Property Type | | Carrying Value | | % of Loan Portfolio | | Carrying Value | | % of Loan Portfolio | Property Type | | Carrying Value | | % of Loan Portfolio | | Carrying Value | | % of Loan Portfolio |
| Office | Office | | $ | 1,758,637 | | | 44.2 | % | | $ | 1,779,173 | | | 42.0 | % | Office | | $ | 1,663,478 | | | 46.0 | % | | $ | 1,720,705 | | | 44.7 | % |
| Multifamily | Multifamily | | 954,910 | | | 24.0 | % | | 1,058,708 | | | 25.1 | % | Multifamily | | 982,624 | | | 27.2 | % | | 910,557 | | | 23.7 | % |
| Hotel | Hotel | | 645,544 | | | 16.2 | % | | 640,503 | | | 15.2 | % | Hotel | | 517,028 | | | 14.3 | % | | 646,869 | | | 16.8 | % |
| Retail | Retail | | 336,064 | | | 8.4 | % | | 398,742 | | | 9.4 | % | Retail | | 340,265 | | | 9.4 | % | | 332,218�� | | | 8.6 | % |
| Industrial | Industrial | | 244,706 | | | 6.2 | % | | 312,637 | | | 7.4 | % | Industrial | | 89,456 | | | 2.5 | % | | 196,677 | | | 5.1 | % |
| Other | Other | | 39,001 | | | 1.0 | % | | 36,449 | | | 0.9 | % | Other | | 21,360 | | | 0.6 | % | | 40,777 | | | 1.1 | % |
| Total | Total | | $ | 3,978,862 | | | 100.0 | % | | $ | 4,226,212 | | | 100.0 | % | Total | | $ | 3,614,211 | | | 100.0 | % | | $ | 3,847,803 | | | 100.0 | % |
| | | | | | | | | | | | | | | | | | | | | | | | | | |
| (dollars in thousands) | | September 30,
2020 | | December 31,
2019 |
| Geographic Location | | Carrying Value | | % of Loan Portfolio | | Carrying Value | | % of Loan Portfolio |
| Northeast | | $ | 1,065,128 | | | 26.8 | % | | $ | 1,196,767 | | | 28.4 | % |
| Southwest | | 818,056 | | | 20.5 | % | | 923,519 | | | 21.8 | % |
| West | | 723,076 | | | 18.2 | % | | 735,416 | | | 17.4 | % |
| Midwest | | 714,628 | | | 18.0 | % | | 700,778 | | | 16.6 | % |
| Southeast | | 657,974 | | | 16.5 | % | | 669,732 | | | 15.8 | % |
| | | | | | | | |
| Total | | $ | 3,978,862 | | | 100.0 | % | | $ | 4,226,212 | | | 100.0 | % |
GRANITE POINT MORTGAGE TRUST INC.
Notes to the Condensed Consolidated Financial Statements (unaudited)
| | | | | | | | | | | | | | | | | | | | | | | | | | |
| (dollars in thousands) | | September 30,
2021 | | December 31,
2020 |
| Geographic Location | | Carrying Value | | % of Loan Portfolio | | Carrying Value | | % of Loan Portfolio |
| Northeast | | $ | 950,447 | | | 26.3 | % | | $ | 1,028,584 | | | 26.8 | % |
| Southwest | | 807,483 | | | 22.3 | % | | 802,233 | | | 20.8 | % |
| West | | 630,826 | | | 17.5 | % | | 682,236 | | | 17.7 | % |
| Midwest | | 608,102 | | | 16.8 | % | | 712,675 | | | 18.5 | % |
| Southeast | | 617,353 | | | 17.1 | % | | 622,075 | | | 16.2 | % |
| | | | | | | | |
| Total | | $ | 3,614,211 | | | 100.0 | % | | $ | 3,847,803 | | | 100.0 | % |
At September 30, 20202021 and December 31, 2019,2020, the Company pledged loans held-for-investment with a carrying value, net of allowance for credit losses, of $3.9$3.5 billion and $4.1$3.8 billion, respectively, as collateral forunder repurchase agreements,facilities, an asset-specific financing facility, a revolving creditterm financing facility and securitized debt obligations. See Note 94 - Collateralized BorrowingsVariable Interest Entities and Securitized Debt Obligations and Note 105 - Securitized Debt Obligations.Secured Financing Agreements.
GRANITE POINT MORTGAGE TRUST INC.
Notes to the Condensed Consolidated Financial Statements (unaudited)
The following table summarizes activity related to loans held-for-investment, net of allowance for credit losses, for the three and nine months ended September 30, 20202021 and 2019:2020:
| | | Three Months Ended
September 30, | | Nine Months Ended
September 30, | | | Three Months Ended September 30, | | Nine Months Ended September 30, |
| (in thousands) | (in thousands) | 2020 | | 2019 | | 2020 | | 2019 | | (in thousands) | 2021 | | 2020 | | 2021 | | 2020 | |
| Balance at beginning of period | Balance at beginning of period | $ | 4,290,047 | | | $ | 3,560,117 | | | $ | 4,226,212 | | | $ | 3,167,913 | | | Balance at beginning of period | $ | 3,577,644 | | | $ | 4,290,047 | | | $ | 3,847,803 | | | $ | 4,226,212 | | |
| Originations, acquisitions and additional fundings | 57,617 | | | 535,021 | | | 317,630 | | | 1,230,712 | | | |
| Originations, additional fundings and capitalized deferred interest | | Originations, additional fundings and capitalized deferred interest | 325,597 | | | 57,617 | | | 565,212 | | | 317,630 | | |
| | Repayments | Repayments | (184,723) | | | (164,797) | | | (290,838) | | | (468,534) | | | Repayments | (290,497) | | | (184,723) | | | (815,054) | | | (290,838) | | |
| Transfers to loans held-for-sale | Transfers to loans held-for-sale | (190,787) | | | 0 | | | (210,452) | | | 0 | | | Transfers to loans held-for-sale | — | | | (190,787) | | | — | | | (210,452) | | |
| Net discount accretion (premium amortization) | Net discount accretion (premium amortization) | 0 | | | 4 | | | 16 | | | 24 | | | Net discount accretion (premium amortization) | (2) | | | — | | | 9 | | | 16 | | |
| Increase in net deferred origination fees | 101 | | | (6,387) | | | (2,908) | | | (14,034) | | | |
| (Increase) decrease in net deferred origination fees | | (Increase) decrease in net deferred origination fees | (3,566) | | | 101 | | | (5,905) | | | (2,908) | | |
| Amortization of net deferred origination fees | Amortization of net deferred origination fees | 3,236 | | | 3,137 | | | 12,541 | | | 11,014 | | | Amortization of net deferred origination fees | 2,584 | | | 3,236 | | | 10,700 | | | 12,541 | | |
| | Allowance for credit losses | 3,371 | | | 0 | | | (73,339) | | | 0 | | | |
| Benefit from (provision for) credit losses | | Benefit from (provision for) credit losses | 2,451 | | | 3,371 | | | 11,446 | | | (73,339) | | |
| Balance at end of period | Balance at end of period | $ | 3,978,862 | | | $ | 3,927,095 | | | $ | 3,978,862 | | | $ | 3,927,095 | | | Balance at end of period | $ | 3,614,211 | | | $ | 3,978,862 | | | $ | 3,614,211 | | | $ | 3,978,862 | | |
Allowance for Credit Losses
Subsequent to the adoption of ASU 2016-13 on January 1, 2020, to estimate and recognize an allowance for credit losses on loans held-for-investment and their related unfunded commitments, the Company continues to use a third-party licensed probability-weighted analytical model. The Company employedemploys quarterly updated macroeconomic forecasts, which reflect the ongoing impact of the COVID-19 pandemic on the overall U.S. economy and commercial real estate markets generallygenerally. Driven by the general progress around the development and are not specific to any loans in its portfolio. These estimates may change in future periods based on available future macroeconomic data and might result in a material change in the Company’s future estimates of expected credit losses for its loan portfolio. Due to the COVID-19 pandemic and the dislocation it has caused to the national economy, the commercial real estate markets and the capital markets, the Company’s ability to estimate key inputs for estimating the allowance for credit losses has been materially and adversely impacted. Estimates made by management are necessarily subject to change due to the lack of observable inputs and uncertainty regarding the durationdistribution of the COVID-19 pandemicvaccines over the last few quarters, those macroeconomic forecasts have been improving, including expectations for unemployment rates, overall economic output and its aftereffects. See Note 2 - Usevalues of Estimates for further discussion of COVID-19.real estate properties. Significant inputs to the Company’s estimate of the allowance for credit losses include loan specific factors such as debt service coverage ratio, or DSCR, loan to value ratio, or LTV, remaining contractual loan term, property type and others. In certain instances, for loans with unique risk and credit characteristics, the Company may instead elect to employ different methods to estimate loanan allowance for credit losses that also conform to ASU 2016-13 and related guidance.
As of September 30, 2021, the Company recognized an allowance for credit losses related to its loans held-for-investment of $45.5 million, which reflected a write-off of $9.7 million on a loan held-for-investment and a benefit from provision for credit losses of $2.5 million for the three months ended September 30, 2021. The benefit from provision for credit losses reflects the continued general improvement in the overall performance of the investment portfolio and current expectations for further improvement in macroeconomic conditions.
The allowance for credit losses related to the Company’s loans held-for-investment is deducted from the amortized cost basis of related loans, while the allowance for credit losses related to off-balance sheet future fundingunfunded commitments on existing loans is recorded as a component of other liabilities on the Company’s condensed consolidated balance sheets. As of September 30, 2020,2021, the Company recognized $7.4$1.9 million in other liabilities related to the allowance for credit losses on unfunded
GRANITE POINT MORTGAGE TRUST INC.
Notes to the Condensed Consolidated Financial Statements (unaudited)
commitments. During the three months ended September 30, 2021, the Company recognized a benefit from provision for credit losses of $3.3 million mainly related to the release of a $3.2 million allowance for credit losses related to unfunded commitments on the office loan that had previously been deemed to be collateral-dependent and for which the unfunded commitments were deemed to be unlikely to be funded, given the loan’s delinquent status as of September 30, 2021. Changes in the provision for credit losses for both loans held-for-investment and their related unfunded commitments are recognized through net income (loss) on the Company’s condensed consolidated statements of comprehensive income (loss) income..
The following table presents the changes for the three and nine months ended September 30, 2021 and 2020 in the allowance for credit losses on loans held-for-investment:
| | | Three Months Ended
September 30, | | Nine Months Ended
September 30, | | Three Months Ended September 30, | | | Nine Months Ended September 30, |
| (in thousands) | (in thousands) | 2020 | | | 2020 | | (in thousands) | 2021 | | | 2021 | |
| Balance at beginning of period | Balance at beginning of period | $ | 76,710 | | | | $ | 16,692 | | | Balance at beginning of period | $ | 57,671 | | | | $ | 66,666 | | |
| Provision for credit losses | (3,371) | | | | 56,647 | | | |
| Writeoffs | 0 | | | | 0 | | | |
| (Benefit from) provision for credit losses | | (Benefit from) provision for credit losses | (2,451) | | | | (11,446) | | |
| Write-off | | Write-off | (9,740) | | | | (9,740) | | |
| Recoveries of amounts previously written off | Recoveries of amounts previously written off | 0 | | | | 0 | | | Recoveries of amounts previously written off | — | | | | — | | |
| Balance at end of period | Balance at end of period | $ | 73,339 | | | | $ | 73,339 | | | Balance at end of period | $ | 45,480 | | | | $ | 45,480 | | |
For the three months ended September 30, 2020, the Company’s estimate of expected credit losses decreased slightly primarily due to the changes in the composition of the Company’s investment portfolio as a result of loan sales and repayments. | | | | | | | | | | | | | | | | | |
| Three Months Ended September 30, | | | | Nine Months Ended September 30, |
| (in thousands) | 2020 | | | | 2020 | | | | |
| Balance at beginning of period | $ | 76,710 | | | | | $ | 16,692 | | | | | |
| (Benefit from) provision for credit losses | (3,371) | | | | | 56,647 | | | | | |
| Write-offs | — | | | | | — | | | | | |
| Recoveries of amounts previously written off | — | | | | | — | | | | | |
| Balance at end of period | $ | 73,339 | | | | | $ | 73,339 | | | | | |
Generally, loans held-for-investment are placed on nonaccrual status when delinquent for more than 90 days or earlier when determined not to be probable of full collection. Interest income recognition is suspended when loans are placed on nonaccrual status. No loan was placed on nonaccrual status during
During the ninethree months ended September 30, 20202021, the Company resolved the nonaccrual status of a senior loan secured by a mixed-use office and at December 31, 2019.retail property in New York City with an unpaid principal balance of $22.0 million. The Company received all interest that was previously due in the amount of approximately $1.6 million, which was recorded in interest income on the Company’s condensed consolidated statements of comprehensive income (loss). Given these facts and the Company’s expectations for the loan to be performing in accordance with the terms of the loan agreement, the loan was reinstated to accrual status.
During the three months ended September 30, 2021, the Company resolved a senior loan that had an outstanding unpaid principal balance of $68.1 million and had been on nonaccrual status. The resolution involved a coordinated sale of the collateral property, a Minneapolis, MN hotel, and the Company providing the new ownership group with a new $45.3 million senior floating rate loan. As a result of these transactions, the Company recognized a write-off of $9.7 million.
As of September 30, 2021, the Company had two senior loans with a total unpaid principal balance of $168.1 million and carrying value of $145.4 million that were held on nonaccrual status. Any reversal of accrued interest income is recorded in interest income on the Company’s condensed consolidated statements of comprehensive income (loss). No other loans were considered past due as of September 30, 2021.
GRANITE POINT MORTGAGE TRUST INC.
Notes to the Condensed Consolidated Financial Statements (unaudited)
WithThe following table presents the passagecarrying value of time and continuation of the COVID-19 pandemic, certain borrowers may become delinquent for more than 90 days which, among other factors, may result in certain loans being placedheld-for-investment on nonaccrual status duringfor the fourth quarter of 2020three and later periods.nine months ended September 30, 2021:
| | | | | | | | | | | | | | | | |
| Three Months Ended September 30, | Nine Months Ended September 30, | | | | |
| (in thousands) | 2021 | 2021 | | | | | | | | |
| Nonaccrual loan carrying value at beginning of period | $ | 225,115 | | $ | 17,835 | | | | | | | | | |
| Addition of nonaccrual loan carrying value | $ | — | | $ | 207,280 | | | | | | | | | |
| Removal of nonaccrual loan carrying value | $ | (79,765) | | $ | (79,765) | | | | | | | | | |
| Nonaccrual loan carrying value at end of period | $ | 145,350 | | $ | 145,350 | | | | | | | | | |
Loan Risk Ratings
The Company’s primary credit quality indicators are its risk rankings.ratings. The Company evaluates the credit quality of each loan at least quarterly by assessing the risk factors of each loan and assigning a risk rating based on a variety of factors. Risk factors include property type, geographic and local market dynamics, physical condition, leasing and tenant profile, projected cash flow, loan structure and exit plan, LTV, project sponsorship and other factors deemed necessary. Risk ratings are defined as follows:
1 –Lower Risk
2 –Average Risk
3 –Acceptable Risk
4 –Higher Risk: A loan that has exhibited material deterioration in cash flows and/or other credit factors, which, if negative trends continue, could be indicative of probability of default or principal loss.
5 –Loss Likely: A loan that has a significantly increased probability of default or principal loss.
The following table presents the number of loans, unpaid principal balance and carrying value by risk rating for loans held-for-investment as of September 30, 20202021 and December 31, 2019:2020:
| | (dollars in thousands) | (dollars in thousands) | | September 30,
2020 | | December 31,
2019 | (dollars in thousands) | | September 30,
2021 | | December 31,
2020 |
| Risk Rating | Risk Rating | | Number of Loans | | Unpaid Principal Balance | | Carrying Value | | Number of Loans | | Unpaid Principal Balance | | Carrying Value | Risk Rating | | Number of Loans | | Unpaid Principal Balance | | Carrying Value | | Number of Loans | | Unpaid Principal Balance | | Carrying Value |
| 1 | 1 | | 6 | | | $ | 143,082 | | | $ | 142,041 | | | 9 | | | $ | 293,191 | | | $ | 292,270 | | 1 | | 9 | | | $ | 281,201 | | | $ | 280,172 | | | 6 | | | $ | 183,369 | | | $ | 182,730 | |
| 2 | 2 | | 59 | | | 2,183,926 | | | 2,157,540 | | | 100 | | | 3,661,077 | | | 3,632,528 | | 2 | | 53 | | | 1,842,052 | | | 1,819,740 | | | 50 | | | 1,863,590 | | | 1,847,332 | |
| 3 | 3 | | 27 | | | 924,380 | | | 899,351 | | | 9 | | | 243,127 | | | 241,901 | | 3 | | 26 | | | 839,615 | | | 832,077 | | | 29 | | | 1,055,782 | | | 1,026,662 | |
| 4 | 4 | | 18 | | | 821,400 | | | 779,930 | | | 2 | | | 59,750 | | | 59,513 | | 4 | | 10 | | | 541,891 | | | 536,872 | | | 17 | | | 762,636 | | | 732,310 | |
| 5 | 5 | | 0 | | | 0 | | | 0 | | | 0 | | | 0 | | | 0 | | 5 | | 2 | | | 168,094 | | | 145,350 | | | 1 | | | 67,057 | | | 58,769 | |
| Total | Total | | 110 | | | $ | 4,072,788 | | | $ | 3,978,862 | | | 120 | | | $ | 4,257,145 | | | $ | 4,226,212 | | Total | | 100 | | | $ | 3,672,853 | | | $ | 3,614,211 | | | 103 | | | $ | 3,932,434 | | | $ | 3,847,803 | |
As of December 31, 2019 (prior to the adoption of ASU 2016-13), the Company had not identified any impaired loans and it had not recorded any allowances for losses as it was not deemed probable that the Company would not be able to collect all amounts due pursuant to the contractual terms of the loans.
The following table presents the carrying value of loans held-for-investment as of September 30, 2020 by risk rating and year of origination:
| | | | | | | | | | | | | | | | | | | | | | | | | | | | | | | | | | | | | | | | | | | | |
| | September 30, 2020 |
| (dollars in thousands) | | Origination Year | | |
| Risk Rating | | 2020 | | 2019 | | 2018 | | 2017 | | 2016 | | Prior | | Total |
| 1 (Low Risk) | | $ | 0 | | | $ | 18,269 | | | $ | 90,472 | | | $ | 0 | | | $ | 33,300 | | | $ | 0 | | | $ | 142,041 | |
| 2 (Average Risk) | | 74,375 | | | 1,050,044 | | | 591,444 | | | 284,263 | | | 103,336 | | | 54,078 | | | 2,157,540 | |
| 3 (Acceptable Risk) | | 11,827 | | | 359,028 | | | 259,642 | | | 257,661 | | | 0 | | | 11,193 | | | 899,351 | |
| 4 (Higher Risk) | | 40,931 | | | 166,125 | | | 250,302 | | | 180,968 | | | 0 | | | 141,604 | | | 779,930 | |
| 5 (Loss Likely) | | 0 | | | 0 | | | 0 | | | 0 | | | 0 | | | 0 | | | 0 | |
| Total | | $ | 127,133 | | | $ | 1,593,466 | | | $ | 1,191,860 | | | $ | 722,892 | | | $ | 136,636 | | | $ | 206,875 | | | $ | 3,978,862 | |
As of September 30, 2020 and December 31, 2019,2021, the Company had not identified any loans in nonaccrual status. Additionally, during the nine months ended September 30, 2020, the Company did not enter into any loan modifications which were classified as troubled debt restructuring.
GRANITE POINT MORTGAGE TRUST INC.
Notes to the Condensed Consolidated Financial Statements (unaudited)
Note 5. Available-for-Sale Securities
The following table presents the componentsweighted average risk rating of the carrying value of AFS securitiesCompany’s portfolio was 2.6, weighted by unpaid principal balance, versus 2.8 as of SeptemberJune 30, 20202021.The improvement in the portfolio’s average risk rating reflects the ongoing economic and December 31, 2019:
| | | | | | | | | | | |
| (in thousands) | September 30,
2020 | | December 31,
2019 |
| Face value | $ | 0 | | | $ | 12,798 | |
| Unamortized premium (discount) | 0 | | | 0 | |
| | | |
| | | |
| | | |
| | | |
| Allowance for credit losses | 0 | | | 0 | |
| Gross unrealized gains | 0 | | | 32 | |
| Gross unrealized losses | 0 | | | 0 | |
| Carrying value | $ | 0 | | | $ | 12,830 | |
At December 31, 2019,market recovery from the COVID-19 pandemic, the advancement of business plans for the collateral properties, and the resulting improvement in the performance of the properties securing the Company’s AFS securities wereloan portfolio, which resulted in an unrealized gain position andrisk rating upgrades in the Company pledged AFS securities with a carrying value of $12.8 million as collateral for repurchase agreements. See Note 9 - Collateralized Borrowings. Duringportfolio during the three months ended September 30, 2020, the Company’s AFS securities paid off in full.2021.
Note 6. Held-to-Maturity Securities
The following table presents the components of the carrying value of HTM securities as of September 30, 2020 and December 31, 2019:
| | | | | | | | | | | |
| (in thousands) | September 30,
2020 | | December 31,
2019 |
| Face value | $ | 0 | | | $ | 18,076 | |
| Unamortized premium (discount) | 0 | | | 0 | |
| Allowance for credit losses | 0 | | | 0 | |
| Carrying value | $ | 0 | | | $ | 18,076 | |
During three months ended September 30, 2020, the Company’s HTM securities paid off in full. At December 31, 2019, the Company pledged HTM securities with a carrying value of $18.1 million as collateral for repurchase agreements. See Note 9 - Collateralized Borrowings.
Note 7. Cash, Cash Equivalents and Restricted Cash
Cash and cash equivalents include cash held in bank accounts and cash held in money market funds on an overnight basis.
The Company is required to maintain certain cash balances in restricted accounts as collateral for the Company’s repurchase agreements and with counterparties to support investment activities. As of both September 30, 2020 and December 31, 2019, the Company had $3.4 million as collateral for repurchase agreements and by counterparties to support investment activities. In addition, as of September 30, 2020 and December 31, 2019, the Company held $1.9 million and $76.1 million, respectively, in restricted cash representing proceeds from principal paydowns of loans held in the CLOs.
The following table provides a reconciliation of cash, cash equivalents and restricted cash reported on the Company’s condensed consolidated balance sheets as of September 30, 2020 and December 31, 2019 that sum to the total of the same such amounts shown in the condensed consolidated statements of cash flows:
| | | | | | | | | | | |
| (in thousands) | September 30,
2020 | | December 31,
2019 |
| Cash and cash equivalents | $ | 353,679 | | | $ | 80,281 | |
| Restricted cash | 5,326 | | | 79,483 | |
| Total cash, cash equivalents and restricted cash | $ | 359,005 | | | $ | 159,764 | |
GRANITE POINT MORTGAGE TRUST INC.
Notes to the Condensed Consolidated Financial Statements (unaudited)
Note 8. Fair Value
Fair Value Measurements
ASC 820, Fair Value Measurements, or ASC 820, defines fair value as the price that would be received to sell an asset or paid to transfer a liability in an orderly transaction between market participants at the measurement date. ASC 820 clarifies that fair value should be based on the assumptions market participants would use when pricing an asset or liability and establishes a fair value hierarchy that prioritizes the information used to develop those assumptions. The fair value hierarchy gives the highest priority to quoted prices available in active markets (i.e., market-based or observable inputs) and the lowest priority to data lacking transparency (i.e., unobservable inputs) resulting in the use of management assumptions. Additionally, ASC 820 requires an entity to consider all aspects of nonperformance risk, including the entity’s own credit standing, when measuring fair value of a liability.
ASC 820 establishes a three-level hierarchy to be used when measuring and disclosing fair value. An instrument’s categorization within the fair value hierarchy is based on the lowest level of significant input to its valuation. Following is a description of the three levels:
Level 1Inputs are quoted prices in active markets for identical assets or liabilities as of the measurement date under current market conditions. Additionally, the entity must have the ability to access the active market and the quoted prices cannot be adjusted by the entity.
Level 2Inputs include quoted prices in active markets for similar assets or liabilities; quoted prices in inactive markets for identical or similar assets or liabilities; or inputs that are observable or can be corroborated by observable market data by correlation or other means for substantially the full-term of the assets or liabilities.
Level 3Unobservable inputs are supported by little or no market activity. The unobservable inputs represent the assumptions that market participants would use to price the assets and liabilities, including risk. Generally, Level 3 assets and liabilities are valued using pricing models, discounted cash flow methodologies or similar techniques that require significant judgment or estimation.
Following are descriptions of the valuation methodologies used to measure material assets and liabilities at fair value and details of the valuation models, key inputs to those models and significant assumptions utilized.
Available-for-sale securities. The Company has held AFS securities and those securities were carried at fair value on the condensed consolidated balance sheets and were comprised of CMBS. In determining the fair value of the Company’s CMBS AFS, management judgment may be used to arrive at fair value that considers prices obtained from third-party pricing providers or broker quotes received using the bid price, which are both deemed indicative of market activity and other applicable market data. The third-party pricing providers and brokers use pricing models that generally incorporate credit and cash flow factors including, but not limited to, required market yields for comparable investments, coupons, expected life of the security, property type, LTV and debt yield. If observable market prices are not available or insufficient to determine fair value due principally to illiquidity in the marketplace, then fair value is based upon internally developed models that are primarily based on observable market-based inputs but also include unobservable market data inputs (including prepayment speeds, delinquency levels and credit losses).
Recurring Fair Value
As of September 30, 2020, the Company held no assets or liabilities measured at fair value on a recurring basis. The following table displays the Company’s assets measured at fair value on a recurring basis as of December 31, 2019.
| | | | | | | | | | | | | | | | | | | | | | | |
| Recurring Fair Value Measurements |
| December 31, 2019 |
| (in thousands) | Level 1 | | Level 2 | | Level 3 | | Total |
| Assets | | | | | | | |
| Available-for-sale securities | $ | 0 | | | $ | 12,830 | | | $ | 0 | | | $ | 12,830 | |
| Total assets | $ | 0 | | | $ | 12,830 | | | $ | 0 | | | $ | 12,830 | |
GRANITE POINT MORTGAGE TRUST INC.
Notes to the Condensed Consolidated Financial Statements (unaudited)
Nonrecurring Fair Value
The Company may be required to measure certain assets or liabilities at fair value from time to time. These periodic fair value measures typically result from application of certain impairment measures under GAAP. These items would constitute nonrecurring fair value measures under ASC 820. As of September 30, 2020 and December 31, 2019, the Company did not have any assets or liabilities measured at fair value on a nonrecurring basis in the periods presented.
Fair Value of Financial Instruments
In accordance with ASC 820, the Company is required to disclose the fair value of financial instruments, both assets and liabilities recognized and not recognized in the condensed consolidated balance sheets, for which fair value can be estimated.
The following describes the Company’s methods for estimating the fair value for financial instruments:
•Loans held-for-investment are carried at cost, net of any unamortized acquisition premiums or discounts, loan fees, origination costs and allowance for credit losses, as applicable. The Company estimates the fair value of its loans held-for-investment by assessing any changes in market interest rates, credit spreads for loans of comparable risk as corroborated by inquiry of other market participants, shifts in credit profiles and actual operating results for mezzanine loans and senior loans, taking into consideration such factors as underlying property type, property competitive position within its market, market and submarket fundamentals, tenant mix, nature of business plan, sponsorship, extent of leverage and other loan terms. The Company categorizes the fair value measurement of these assets as Level 3.
•AFS securities are recurring fair value measurements; carrying value equals fair value. See discussion of valuation methods and assumptions within the Fair Value Measurements section of this footnote.
•HTM securities, which are comprised of CMBS, are carried at cost, net of any unamortized acquisition premiums or discounts and allowance for credit losses. In determining the fair value of the Company’s CMBS HTM, management judgment may be used to arrive at fair value that considers prices obtained from third-party pricing providers or broker quotes received using the bid price, which are both deemed indicative of market activity, and other applicable market data. The third-party pricing providers and brokers use pricing models that generally incorporate such factors as coupons, primary and secondary mortgage rates, rate reset period, issuer, prepayment speeds, credit enhancements and expected life of the security. The Company categorizes the fair value measurement of these assets as Level 2.
•Cash and cash equivalents and restricted cash have a carrying value which approximates fair value because of the short maturities of these instruments. The Company categorizes the fair value measurement of these assets as Level 1.
•The carrying value of repurchase agreements, asset-specific financings and revolving credit facilities that mature in less than one year generally approximates fair value due to the short maturities. The Company’s long-term repurchase agreements and asset-specific financings have floating rates based on an index plus a credit spread and the credit spread is typically consistent with those demanded in the market. Accordingly, the interest rates on these borrowings are at market and, thus, carrying value approximates fair value. The Company categorizes the fair value measurement of these liabilities as Level 2.
•Securitized debt obligations are recorded at outstanding principal, net of any unamortized deferred debt issuance costs. In determining the fair value of its securitized debt obligations, management judgment may be used to arrive at fair value that considers prices obtained from third-party pricing providers, broker quotes received and other applicable market data. If observable market prices are not available or insufficient to determine fair value due principally to illiquidity in the marketplace, then fair value is based upon internally developed models that are primarily based on observable market-based inputs but also include unobservable market data inputs (including prepayment speeds, delinquency levels and credit losses). The Company categorizes the fair value measurement of these liabilities as Level 2.
•Convertible senior notes are carried at their unpaid principal balance, net of any unamortized deferred issuance costs. The Company estimates the fair value of its convertible senior notes using the market transaction price nearest to September 30, 2020. The Company categorizes the fair value measurement of these assets as Level 2.
•Senior secured term loan facilities are carried at their unpaid principal balance, net of any unamortized deferred issuance costs. The Company estimates the fair value of its senior secured term facilities at their carrying value as of September 30, 2020.
GRANITE POINT MORTGAGE TRUST INC.
Notes to the Condensed Consolidated Financial Statements (unaudited)
The following table presents the carrying valuesvalue of loans held-for-investment as of September 30, 2021 and 2020 by risk rating and year of origination:
| | | | | | | | | | | | | | | | | | | | | | | | | | | | | | | | | | | | | | | | | | | | | | | | | | |
| | September 30, 2021 |
| (dollars in thousands) | | Origination Year | | |
| Risk Rating | | 2021 | | 2020 | | 2019 | | 2018 | | 2017 | | 2016 | | Prior | | Total |
| 1 | | $ | — | | | $ | — | | | $ | 171,163 | | | $ | 75,601 | | | $ | — | | | $ | 33,408 | | | $ | — | | | $ | 280,172 | |
| 2 | | $ | 402,170 | | | $ | 86,214 | | | $ | 841,954 | | | $ | 340,839 | | | $ | 59,246 | | | $ | 37,389 | | | $ | 51,928 | | | $ | 1,819,740 | |
| 3 | | $ | 44,488 | | | $ | 58,241 | | | $ | 238,699 | | | $ | 241,541 | | | $ | 156,008 | | | $ | 67,991 | | | $ | 25,109 | | | $ | 832,077 | |
| 4 | | $ | — | | | $ | — | | | $ | 166,549 | | | $ | 73,375 | | | $ | 177,333 | | | $ | — | | | $ | 119,615 | | | $ | 536,872 | |
| 5 | | $ | — | | | $ | — | | | $ | — | | | $ | 99,495 | | | $ | 45,855 | | | $ | — | | | $ | — | | | $ | 145,350 | |
| Total | | $ | 446,658 | | | $ | 144,455 | | | $ | 1,418,365 | | | $ | 830,851 | | | $ | 438,442 | | | $ | 138,788 | | | $ | 196,652 | | | $ | 3,614,211 | |
| | | | | | | | | | | | | | | | | | | | | | | | | | | | | | | | | | | | | | | | | | | | | |
| | September 30, 2020 | |
| (dollars in thousands) | | Origination Year | | | |
| Risk Rating | | 2020 | | 2019 | | 2018 | | 2017 | | 2016 | | Prior | | Total | |
| 1 | | $ | — | | | $ | 18,269 | | | $ | 90,472 | | | $ | — | | | $ | 33,300 | | | $ | — | | | $ | 142,041 | | |
| 2 | | 74,375 | | | 1,050,044 | | | 591,444 | | | 284,263 | | | 103,336 | | | 54,078 | | | 2,157,540 | | |
| 3 | | 11,827 | | | 359,028 | | | 259,642 | | | 257,661 | | | — | | | 11,193 | | | 899,351 | | |
| 4 | | 40,931 | | | 166,125 | | | 250,302 | | | 180,968 | | | — | | | 141,604 | | | 779,930 | | |
| 5 | | — | | | — | | | — | | | — | | | — | | | — | | | — | | |
| Total | | $ | 127,133 | | | $ | 1,593,466 | | | $ | 1,191,860 | | | $ | 722,892 | | | $ | 136,636 | | | $ | 206,875 | | | $ | 3,978,862 | | |
During the nine months ended September 30, 2021, the Company entered into a loan modification related to a retail asset located in Pasadena, CA, which is classified as troubled debt restructuring under GAAP. This modification included, among other changes, a partial deferral of the loan’s contractual interest payments due to the collateral property’s cash flows and operating performance being adversely affected by the ongoing effects of the COVID-19 pandemic. This loan had also been previously modified. At September 30, 2021, this first mortgage loan had an outstanding principal balance of $114.1 million and was assigned a risk rating of “5”. The Company determined that the recovery of the loan’s principal is collateral-dependent. Accordingly, this loan was assessed individually and the Company elected to apply a practical expedient in accordance with ASU 2016-13. At September 30, 2021, the Company recorded an allowance for credit loss of $14.1 million on this loan based on the Company’s estimate of fair value of the loan’s underlying collateral using the discounted cash flow method of valuation less the estimated cost to foreclose and sell the property. The estimation of the fair valuesvalue of the collateral property also involved using various Level 3 inputs, which were in part developed based on discussions with various market participants and management’s best estimates as of the valuation date, and required significant judgment. Additionally, during the nine months ended September 30, 2021, the Company placed this loan on nonaccrual status and reversed $0.3 million of interest income. This loan’s maturity date has passed without the loan being paid off. The Company is evaluating a variety of potential options with respect to the resolution of this loan, which, among others, may include a foreclosure, negotiated deed-in-lieu of foreclosure, a sale of the underlying collateral property or a sale of the loan.
During the nine months ended September 30, 2021, a first mortgage loan with a principal balance of $54.0 million collateralized by an office property located in Washington, D.C., was downgraded to a risk rating of “5” as a result of the collateral property’s operating performance being adversely affected by the ongoing office leasing market challenges related to the COVID-19 pandemic. During the nine months ended September 30, 2021, the Company entered into a loan modification related to this asset, which included, among other changes, a reallocation of certain reserves. This loan had also been modified previously. The Company determined that the recovery of the loan’s principal is collateral-dependent. Accordingly, this loan was assessed individually and the Company elected to apply a practical expedient in accordance with ASU 2016-13. At September 30, 2021, the Company recorded an allowance for credit loss of $8.0 million on this loan based on the Company’s estimate of fair value of the loan’s underlying collateral using the discounted cash flow method of valuation less the estimated cost to foreclose and sell the property. The estimation of the fair value of the collateral property also involved using various
GRANITE POINT MORTGAGE TRUST INC.
Notes to the Condensed Consolidated Financial Statements (unaudited)
Level 3 inputs, which were in part developed based on discussions with various market participants and management’s best estimates as of the valuation date, and required significant judgment. Additionally, during the nine months ended September 30, 2021, the Company placed this loan on nonaccrual status and reversed $0.8 million of interest income. This loan’s maturity date of October 9, 2021 has passed without the loan being paid off. The Company is evaluating a variety of potential options with respect to the resolution of this loan, which, among others, may include a foreclosure, a negotiated deed-in-lieu of foreclosure, a sale of the underlying collateral property or a sale of the loan.
Note 4. Variable Interest Entities and Securitized Debt Obligations
The Company finances pools of its commercial real estate loans through CRE CLOs, which are considered VIEs for financial reporting purposes, and, thus, are reviewed for consolidation under the applicable consolidation guidance. The Company has both the power to direct the activities of the CRE CLOs that most significantly impact the entities’ performance and the obligation to absorb losses or the right to receive benefits of the entities that could be significant; therefore, the Company consolidates the CRE CLOs.
The following table presents a summary of the assets and liabilities that are required to be recorded or disclosed at fair value atof all VIEs consolidated on the Company’s condensed consolidated balance sheets as of September 30, 20202021 and December 31, 2019:2020:
| | | | | | | | | | | | | | | | | | | | | | | |
| September 30, 2020 | | December 31, 2019 |
| (in thousands) | Carrying Value | | Fair Value | | Carrying Value | | Fair Value |
| Assets | | | | | | | |
| Loans held-for-investment, net of allowance for credit losses | $ | 3,978,862 | | | $ | 3,951,248 | | | $ | 4,226,212 | | | $ | 4,261,612 | |
| Available-for-sale securities | $ | 0 | | | $ | 0 | | | $ | 12,830 | | | $ | 12,830 | |
| Held-to-maturity securities | $ | 0 | | | $ | 0 | | | $ | 18,076 | | | $ | 18,076 | |
| Cash and cash equivalents | $ | 353,679 | | | $ | 353,679 | | | $ | 80,281 | | | $ | 80,281 | |
| Restricted cash | $ | 5,326 | | | $ | 5,326 | | | $ | 79,483 | | | $ | 79,483 | |
| Liabilities | | | | | | | |
| Repurchase agreements | $ | 1,850,845 | | | $ | 1,850,845 | | | $ | 1,924,021 | | | $ | 1,924,021 | |
| Securitized debt obligations | $ | 928,623 | | | $ | 912,190 | | | $ | 1,041,044 | | | $ | 1,050,912 | |
| Asset-specific financings | $ | 123,091 | | | $ | 123,091 | | | $ | 116,465 | | | $ | 116,465 | |
| Revolving credit facilities | $ | 0 | | | $ | 0 | | | $ | 42,008 | | | $ | 42,008 | |
| Convertible senior notes | $ | 270,847 | | | $ | 257,735 | | | $ | 269,634 | | | $ | 283,332 | |
| Senior secured term loan facilities | $ | 205,647 | | | $ | 205,647 | | | $ | 0 | | | $ | 0 | |
| | | | | | | | | | | |
| (in thousands) | September 30,
2021 | | December 31,
2020 |
| Loans held-for-investment | $ | 1,802,296 | | | $ | 1,200,479 | |
| Allowance for credit losses | (18,067) | | | (15,914) | |
| Loans held-for-investment, net | 1,784,229 | | | 1,184,565 | |
| Cash and cash equivalents | — | | | — | |
| Restricted cash | 20,000 | | | 62,804 | |
| | | |
| Other assets | 19,944 | | | 8,563 | |
| Total Assets | $ | 1,824,173 | | | $ | 1,255,932 | |
| Securitized debt obligations | $ | 1,356,429 | | | $ | 927,128 | |
| | | |
| Other liabilities | 1,246 | | | 1,092 | |
| Total Liabilities | $ | 1,357,675 | | | $ | 928,220 | |
GRANITE POINT MORTGAGE TRUST INC.
Notes to the Condensed Consolidated Financial Statements (unaudited)
The securitized debt obligations issued by the CRE CLOs are recorded at outstanding principal, net of any unamortized deferred debt issuance costs, on the Company’s condensed consolidated balance sheets.
The following table details our CRE CLO securitized debt obligations:
| | | | | | | | | | | | | | | | | | | | |
| (in thousands) | September 30,
2021 |
| Securitized Debt Obligations | | Principal Balance | | Carrying Value | | Wtd. Avg. Yield/Cost (1) |
| GPMT 2021-FL3 CRE CLO | | | | | | |
Collateral assets (2) | | $ | 768,796 | | | $ | 763,848 | | | L+3.8% |
| Financing provided | | 630,818 | | | 627,580 | | | L+1.7% |
| GPMT 2019-FL2 CRE CLO | | | | | | |
| Collateral assets | | 734,111 | | | 719,822 | | | L+4.0% |
| Financing provided | | 572,001 | | | 570,597 | | | L+1.7% |
| GPMT 2018-FL1 CRE CLO | | | | | | |
| Collateral assets | | 324,651 | | | 320,558 | | | L+5.1% |
| Financing provided | | 158,253 | | | 158,252 | | | L+2.3% |
| Total | | | | | | |
| Collateral assets | | $ | 1,827,558 | | | $ | 1,804,228 | | | L+4.1% |
| Financing provided | | $ | 1,361,072 | | | $ | 1,356,429 | | | L+1.8% |
____________________
(1)Calculations of all in yield on collateral assets at origination are based on a number of assumptions (some or all of which may not occur) and are expressed as monthly equivalent yields that include net origination fees and exit fees and exclude future fundings and any potential or completed loan amendments or modifications. Calculations of cost of funds is the weighted average coupon of the CRE CLO, exclusive of any CRE CLO issuance costs.
(2)Includes $20 million of restricted cash.
Note 9. Collateralized Borrowings5. Secured Financing Agreements
To finance its loans held-for-investment, the Company has entered into a variety of secured financing arrangements with several counterparties, including repurchase agreementsfacilities, an asset-specific financing facility and an asset-specifica term financing facility. The Company’s repurchase agreementsfacilities are collateralized by loans held-for-investment and certain cash balances. Although the transactions under repurchase agreementsfacilities represent committed borrowings until maturity, the respective lender retains the right to mark the underlying collateral to fair value. A reduction in the value of pledged assets due to collateral-specific credit events, or, with respect to a limited number of the Company’s repurchase agreements,facilities, capital market events, would require the Company to fund margin calls. The Company’s asset-specific financing facility is collateralized by loans held-for-investment. The Company does not typically retain similar rights for the Company to make margin calls on its underlying borrowers as a result of a determination by the Company and/or its financing counterparty that there has been a decrease in the market value of the underlying pledged collateral.
The following tables summarize detailsCompany’s asset-specific financing facility and term financing facility are also collateralized by loans held-for-investment. Neither facility contains mark-to-market provisions and both are generally term-matched to the underlying assets, not to exceed February 9, 2025 in the case of the Company’s collateralized borrowings outstanding as of September 30, 2020 and December 31, 2019:
| | | | | | | | | | | | | | | | | | | | | | | | | | | | | | | | | | | |
| September 30, 2020 |
| (in thousands) | Maturity Date (1) | | Amount Outstanding | | Unused Capacity | | Total Capacity | | Carrying Value of Collateral | | Weighted Average Borrowing Rate |
| Repurchase agreements: | | | | | | | | | | | |
| Morgan Stanley Bank | June 28, 2021 | | $ | 498,181 | | | $ | 101,819 | | | $ | 600,000 | | | $ | 703,898 | | | 2.3 | % |
| Goldman Sachs Bank | May 2, 2021 | | 405,971 | | | 94,029 | | | 500,000 | | | 582,376 | | | 2.5 | % |
| JPMorgan Chase Bank | June 28, 2022 | | 400,880 | | | 103,226 | | | 504,106 | | | 550,025 | | | 2.8 | % |
| Citibank | January 9, 2023 | | 390,767 | | | 9,233 | | | 400,000 | | | 492,830 | | | 1.8 | % |
Wells Fargo Bank (2) | June 28, 2021 | | 155,046 | | | 119,954 | | | 275,000 | | | 220,152 | | | 1.9 | % |
| | | | | | | | | | | |
| Total/Weighted Average | | | $ | 1,850,845 | | | $ | 428,261 | | | $ | 2,279,106 | | | $ | 2,549,281 | | | |
| Asset-specific financings: | | | | | | | | | | | |
| Canadian Imperial Bank of Commerce | Various | | $ | 123,091 | | | $ | 26,909 | | | $ | 150,000 | | | $ | 152,262 | | | 2.5 | % |
| | | | | | | | | | | |
| | | | | | | | | | | |
GRANITE POINT MORTGAGE TRUST INC.
Notes to the Condensed Consolidated Financial Statements (unaudited)
| | | | | | | | | | | | | | | | | | | | | | | | | | | | | | | | | | | |
| December 31, 2019 |
| (in thousands) | Maturity Date (1) | | Amount Outstanding | | Unused Capacity | | Total Capacity | | Carrying Value of Collateral | | Weighted Average Borrowing Rate |
| Repurchase agreements: | | | | | | | | | | | |
| Morgan Stanley Bank | June 28, 2021 | | $ | 556,887 | | | $ | 43,113 | | | $ | 600,000 | | | $ | 740,791 | | | 3.9 | % |
| Goldman Sachs Bank | May 2, 2020 | | 405,057 | | | 94,943 | | | 500,000 | | | 541,640 | | | 3.8 | % |
| JPMorgan Chase Bank | June 28, 2022 | | 408,819 | | | 41,181 | | | 450,000 | | | 553,020 | | | 3.7 | % |
| Citibank | July 15, 2022 | | 339,888 | | | 60,112 | | | 400,000 | | | 432,867 | | | 3.4 | % |
Wells Fargo Bank (2) | June 28, 2021 | | 194,113 | | | 80,887 | | | 275,000 | | | 286,672 | | | 3.5 | % |
| JPMorgan Chase Bank | February 10, 2020 | | 19,257 | | | NA | | NA | | 30,906 | | | 4.1 | % |
| Total/Weighted Average | | | $ | 1,924,021 | | | $ | 320,236 | | | $ | 2,225,000 | | | $ | 2,585,896 | | | |
| Asset-specific financings: | | | | | | | | | | | |
| Canadian Imperial Bank of Commerce | Various | | $ | 116,465 | | | $ | 33,535 | | | $ | 150,000 | | | $ | 144,322 | | | 3.5 | % |
| Revolving credit facilities: | | | | | | | | | | | |
| Citibank | July 26, 2021 | | $ | 42,008 | | | $ | 32,992 | | | $ | 75,000 | | | $ | 80,473 | | | 4.0 | % |
| | | | | | | | | | | | | | | | | | | | | | | | | | | | | | | | | | | |
| September 30, 2021 |
| (in thousands) | Maturity Date (1) | | Amount Outstanding | | Unused Capacity | | Total Capacity | | Carrying Value of Collateral | | Weighted Average Borrowing Rate |
| Repurchase facilities: | | | | | | | | | | | |
Morgan Stanley Bank (2) | June 28, 2022 | | $ | 277,534 | | | $ | 222,466 | | | $ | 500,000 | | | $ | 436,329 | | | 2.2 | % |
Goldman Sachs Bank USA (3) | July 13, 2023 | | — | | | 250,000 | | | 250,000 | | | 10,352 | | | — | % |
| JPMorgan Chase Bank | June 28, 2022 | | 155,214 | | | 294,786 | | | 450,000 | | | 244,233 | | | 2.2 | % |
| Citibank | January 9, 2023 | | 412,274 | | | 87,726 | | | 500,000 | | | 535,684 | | | 1.7 | % |
Wells Fargo Bank (4) | June 28, 2022 | | 71,736 | | | 28,264 | | | 100,000 | | | 109,865 | | | 2.1 | % |
| | | | | | | | | | | |
| Total/Weighted Average | | | $ | 916,758 | | | $ | 883,242 | | | $ | 1,800,000 | | | $ | 1,336,463 | | | |
| Asset-specific financings: | | | | | | | | | | | |
| CIBC Bank USA | Term Matched | | $ | 44,752 | | | $ | 105,248 | | | $ | 150,000 | | | $ | 55,829 | | | 1.8 | % |
| Term financing facility: | | | | | | | | | | | |
Goldman Sachs Bank USA (5) | February 14, 2025 | | $ | 127,867 | | | $ | — | | | $ | 127,867 | | | $ | 324,991 | | | 3.7 | % |
| | | | | | | | | | | | | | | | | | | | | | | | | | | | | | | | | | | |
| December 31, 2020 |
| (in thousands) | Maturity Date (1) | | Amount Outstanding | | Unused Capacity | | Total Capacity | | Carrying Value of Collateral | | Weighted Average Borrowing Rate |
| Repurchase facilities: | | | | | | | | | | | |
| Morgan Stanley Bank | June 28, 2021 | | $ | 435,719 | | | $ | 164,281 | | | $ | 600,000 | | | $ | 657,066 | | | 2.3 | % |
| Goldman Sachs Bank USA | May 2, 2021 | | 395,990 | | | 104,010 | | | 500,000 | | | 593,625 | | | 2.5 | % |
| JPMorgan Chase Bank | June 28, 2022 | | 361,797 | | | 88,203 | | | 450,000 | | | 536,758 | | | 2.5 | % |
| Citibank | January 9, 2023 | | 386,049 | | | 113,951 | | | 500,000 | | | 504,236 | | | 1.8 | % |
| Wells Fargo Bank | June 28, 2021 | | 129,320 | | | 145,680 | | | 275,000 | | | 185,282 | | | 2.1 | % |
| | | | | | | | | | | |
| Total/Weighted Average | | | $ | 1,708,875 | | | $ | 616,125 | | | $ | 2,325,000 | | | $ | 2,476,967 | | | |
| Asset-specific financings: | | | | | | | | | | | |
| CIBC Bank USA | Term Matched | | $ | 123,091 | | | $ | 26,909 | | | $ | 150,000 | | | $ | 152,929 | | | 2.5 | % |
| | | | | | | | | | | |
| | | | | | | | | | | |
____________________
(1)The facilities are set to mature on the stated maturity date, unless extended pursuant to their terms.
(2)As of September 30, 2020,2021, the Company retained an option to increase the maximum facility capacity amount up to $600 million, subject to customary terms and conditions.
(3)As of September 30, 2021, the Company retained options to increase the maximum facility capacity amount up to $350 million, subject to customary terms and conditions.
(4)As of September 30, 2021, the Company retained options to increase the maximum facility capacity amount up to $200 million, subject to customary terms and conditions.
(5)Amount outstanding includes unamortized debt issuance costs.
At September 30, 2020, the Company’s collateralized borrowings outstanding had the following remaining maturities:
| | | | | | | | | | | | | | | | | | | | | | | |
| September 30, 2020 |
| (dollars in thousands) | Repurchase Agreements | | Asset-Specific Financings | | Revolving Credit Facilities | | Total Amount Outstanding |
| Within one year | $ | 1,059,198 | | | $ | 0 | | | $ | 0 | | | $ | 1,059,198 | |
| One to three years | 791,647 | | | 123,091 | | | 0 | | | 914,738 | |
| Three to five years | 0 | | | 0 | | | 0 | | | 0 | |
| Five years and over | 0 | | | 0 | | | 0 | | | 0 | |
| Total | $ | 1,850,845 | | | $ | 123,091 | | | $ | 0 | | | $ | 1,973,936 | |
GRANITE POINT MORTGAGE TRUST INC.
Notes to the Condensed Consolidated Financial Statements (unaudited)
At September 30, 2021, the Company’s borrowings outstanding on its secured financing facilities had contractual maturities as follows:
| | | | | | | | | | | | | | | | | | | | | | | | | |
| September 30, 2021 |
| (dollars in thousands) | Repurchase Facilities | | Asset-Specific Financings | | Term Financing Facility (1) | | | | Total Amount Outstanding |
| 2021 | $ | — | | | 44,752 | | | $ | — | | | | | $ | 44,752 | |
| 2022 | 504,484 | | | — | | | — | | | | | 504,484 | |
| 2023 | 412,274 | | | — | | | — | | | | | 412,274 | |
| 2024 | — | | | — | | | — | | | | | — | |
| 2025 | — | | | — | | | 127,867 | | | | | 127,867 | |
| Thereafter | — | | | — | | | — | | | | | — | |
| Total | $ | 916,758 | | | $ | 44,752 | | | $ | 127,867 | | | | | $ | 1,089,377 | |
____________________(1)Amount outstanding includes unamortized debt issuance costs.
The following table summarizes certain characteristics of the Company’s repurchase agreementsfacilities and counterparty concentration at September 30, 20202021 and December 31, 2019:2020:
| | | September 30, 2020 | | December 31, 2019 | | September 30, 2021 | | December 31, 2020 |
| (dollars in thousands) | (dollars in thousands) | Amount Outstanding | | Net Counterparty Exposure (1) | | Percent of Equity | | Weighted Average Years to Maturity | | Amount Outstanding | | Net Counterparty Exposure (1) | | Percent of Equity | | Weighted Average Years to Maturity | (dollars in thousands) | Amount Outstanding | | Net Counterparty Exposure (1) | | Percent of Equity | | Weighted Average Years to Maturity | | Amount Outstanding | | Net Counterparty Exposure (1) | | Percent of Equity | | Weighted Average Years to Maturity |
| Morgan Stanley Bank | Morgan Stanley Bank | $ | 498,181 | | | $ | 213,187 | | | 23 | % | | 0.74 | | $ | 556,887 | | | $ | 185,022 | | | 18 | % | | 1.49 | Morgan Stanley Bank | $ | 277,534 | | | $ | 163,245 | | | 18 | % | | 0.74 | | $ | 435,719 | | | $ | 230,815 | | | 25 | % | | 0.49 |
| JPMorgan Chase Bank | JPMorgan Chase Bank | 400,880 | | | 157,689 | | | 17 | % | | 1.74 | | 428,076 | | | 156,764 | | | 15 | % | | 2.39 | JPMorgan Chase Bank | 155,214 | | | 94,929 | | | 10 | % | | 0.74 | | 361,797 | | | 187,282 | | | 20 | % | | 1.50 |
| Goldman Sachs Bank | 405,971 | | | 183,251 | | | 20 | % | | 0.59 | | 405,057 | | | 137,326 | | | 13 | % | | 0.34 | |
| Goldman Sachs Bank USA | | Goldman Sachs Bank USA | — | | | 6,103 | | | 1 | % | | 1.78 | | 395,990 | | | 203,297 | | | 22 | % | | 0.33 |
| Citibank | Citibank | 390,767 | | | 106,905 | | | 11 | % | | 2.28 | | 339,888 | | | 93,553 | | | 9 | % | | 2.54 | Citibank | 412,274 | | | 131,034 | | | 14 | % | | 1.28 | | 386,049 | | | 124,913 | | | 13 | % | | 2.02 |
| Wells Fargo Bank | Wells Fargo Bank | 155,046 | | | 67,075 | | | 7 | % | | 0.74 | | 194,113 | | | 93,004 | | | 9 | % | | 1.49 | Wells Fargo Bank | 71,736 | | | 39,112 | | | 4 | % | | 0.74 | | 129,320 | | | 57,483 | | | 6 | % | | 0.49 |
| Total | Total | $ | 1,850,845 | | | $ | 728,107 | | | $ | 1,924,021 | | | $ | 665,669 | | | Total | $ | 916,758 | | | $ | 434,423 | | | $ | 1,708,875 | | | $ | 803,790 | | |
____________________
(1)Represents the excess of the carrying amount or market value of the loans held-for-investment AFS securities and HTM securities pledged as collateral for repurchase agreements,facilities, including accrued interest plus any cash on deposit to secure the repurchase obligation, less the amount of the repurchase liability, including accrued interest. As of September 30, 2020, the Company no longer held AFS or HTM securities.
The Company does not anticipate any defaults by its financing counterparties, although there can be no assurance that one or more defaults will not occur.
Financial Covenants
Note 10. Securitized Debt Obligations
The Company finances poolsis subject to a variety of financial covenants under its commercial real estate loans through CLOs, which are consolidated onsecured financing agreements. The following represent the Company’s condensed consolidatedmost restrictive financial statements. See Note 3 - covenants across the agreements as of September 30, 2021:
•Variable Interest Entities for additional information regarding consolidationUnrestricted cash cannot be less than the greater of the CLOs. The securitized debt obligations issued by the CLOs are recorded at outstanding principal, net$30.0 million and 5.0% of any unamortized deferred debt issuance costs, on the Company’s condensed consolidated balance sheets.recourse indebtedness. As of September 30, 20202021, the Company’s unrestricted cash was $154.9 million, while 5.0% of the Company’s recourse indebtedness was $39.3 million.
•Tangible net worth must be greater than the sum of (i) 75.0% of the Company’s tangible net worth as of June 28, 2017 and (ii) 75.0% of net cash proceeds of the Company’s equity issuances after June 28, 2017, which calculates to $782.3 million. As of September 30, 2021, the Company’s tangible net worth was $979.6 million.
•Target asset leverage ratio cannot exceed 77.5% and total leverage ratio cannot exceed 80.0%. As of September 30, 2021, the Company’s target asset leverage ratio was 66.3% and the Company’s total leverage ratio was 75.2%.
•Minimum interest coverage must be greater than 1.5:1.0. As of September 30, 2021, the Company’s minimum interest coverage was 1.8:1.0.
GRANITE POINT MORTGAGE TRUST INC.
Notes to the Condensed Consolidated Financial Statements (unaudited)
The Company may also be subject to additional financial covenants in connection with various other agreements it enters into in the normal course of our business. The Company intends to continue to operate in a manner which complies with all of its financial covenants.
Note 6. Convertible Senior Notes
In December 2017, the Company closed a private placement of $125.0 million aggregate principal amount of convertible senior notes due 2022. In January 2018, an additional $18.8 million in notes were issued by the Company in connection with the exercise of the initial purchaser’s option. The net proceeds from the offering were approximately $139.5 million after deducting underwriting discounts and expenses. The notes are unsecured, pay interest semiannually at a rate of 5.625% per annum and are convertible at the option of the holder into shares of the Company’s common stock. The notes will mature in December 2022, unless earlier converted or repurchased in accordance with their terms. The Company does not have the right to redeem the notes prior to maturity, but may be required to repurchase the notes from holders under certain circumstances. As of September 30, 2021, the notes had a conversion rate of 51.9943 shares of common stock per $1,000 principal amount of the notes.
In October 2018, the Company closed an underwritten public offering of $131.6 million aggregate principal amount of convertible senior notes due 2023. The net proceeds from the offering were approximately $127.7 million after deducting underwriting discounts and expenses. The notes are unsecured, pay interest semiannually at a rate of 6.375% per annum and are convertible at the option of the holder into shares of the Company’s common stock. The notes will mature in October 2023, unless earlier converted or repurchased in accordance with their terms. The Company does not have the right to redeem the notes prior to maturity, but may be required to repurchase the notes from holders under certain circumstances. As of September 30, 2021, the notes had a conversion rate of 50.0894 shares of common stock per $1,000 principal amount of the notes.
The consolidated amount outstanding due on convertible senior notes as of September 30, 2021 and December 31, 2019, the outstanding amount due on securitized debt obligations2020 was $928.6$272.5 million and $1.0 billion,$271.3 million, respectively, net of deferred issuance costs, respectively, with a weighted averagecosts.
The following table details the interest rateexpense related to the Convertible Senior Notes:
| | | | | | | | | | | | | | | | | | | | | | | | | |
| Three Months Ended September 30, | | Nine Months Ended September 30, |
| (in thousands) | 2021 | | | | 2020 | | 2021 | | 2020 |
| Cash coupon | $ | 4,119 | | | | | $ | 4,119 | | | $ | 12,357 | | | $ | 12,357 | |
| Amortization of issuance costs | 437 | | | | | 410 | | | 1,261 | | | 1,213 | |
| Total interest expense | $ | 4,556 | | | | | $ | 4,529 | | | $ | 13,618 | | | $ | 13,570 | |
The following table details the carrying value of 1.69% and 3.32%, respectively.the Convertible Senior Notes:
December 2022 Convertible Senior Notes
| | | | | | | | | | | | | | | | | |
| September 30, | | December 31, |
| (in thousands) | 2021 | | | | 2020 | | | | |
| Principal outstanding | $ | 143,750 | | | | | $ | 143,750 | | | | | |
| Less: Unamortized issuance costs | (1,106) | | | | | (1,774) | | | | | |
| Net carrying value | $ | 142,644 | | | | | $ | 141,976 | | | | | |
October 2023 Convertible Senior Notes
| | | | | | | | | | | | | | | | | |
| September 30, | | December 31, |
| (in thousands) | 2021 | | | | 2020 | | | | |
| Principal outstanding | $ | 131,600 | | | | | $ | 131,600 | | | | | |
| Less: Unamortized issuance costs | (1,732) | | | | | (2,326) | | | | | |
| Net carrying value | $ | 129,868 | | | | | $ | 129,274 | | | | | |
GRANITE POINT MORTGAGE TRUST INC.
Notes to the Condensed Consolidated Financial Statements (unaudited)
Note 11. Convertible Senior Notes
In December 2017, the Company closed a private placement of $125.0 million aggregate principal amount of convertible senior notes due 2022. In January 2018, an additional $18.8 million in notes were issued by the Company in connection with the exercise of the initial purchaser’s option. The net proceeds from the offering were approximately $139.5 million after deducting underwriting discounts and expenses. The notes are unsecured, pay interest semiannually at a rate of 5.625% per annum and are convertible at the option of the holder into shares of the Company’s common stock. The notes will mature in December 2022, unless earlier converted or repurchased in accordance with their terms. The Company does not have the right to redeem the notes prior to maturity, but may be required to repurchase the notes from holders under certain circumstances. As of September 30, 2020, the notes had a conversion rate of 50.7073 shares of common stock per $1,000 principal amount of the notes.
In October 2018, the Company closed an underwritten public offering of $131.6 million aggregate principal amount of convertible senior notes due 2023. The net proceeds from the offering were approximately $127.7 million after deducting underwriting discounts and expenses. The notes are unsecured, pay interest semiannually at a rate of 6.375% per annum and are convertible at the option of the holder into shares of the Company’s common stock. The notes will mature in October 2023, unless earlier converted or repurchased in accordance with their terms. The Company does not have the right to redeem the notes prior to maturity, but may be required to repurchase the notes from holders under certain circumstances. As of September 30, 2020, the notes had a conversion rate of 48.8496 shares of common stock per $1,000 principal amount of the notes.
The consolidated amount outstanding due on convertible senior notes as of September 30, 2020 and December 31, 2019 was $270.8 million and $269.6 million, respectively, net of deferred issuance costs.
GRANITE POINT MORTGAGE TRUST INC.
Notes to the Condensed Consolidated Financial Statements (unaudited)
Note 12.7. Senior Secured Term Loan Facilities and Warrants to Purchase Shares of Common Stock
On September 25, 2020, the Company, as a guarantor, and certain subsidiaries of the Company, as borrowers, entered into a five-year senior secured term loan credit agreement with certain investment vehicles managed by Pacific Investment Management Company LLC, or PIMCO, providing for up to $300.0 million of new senior secured term loan facilities and warrants to purchase, in the aggregate, up to 6,065,820 shares of the Company’s common stock, $0.01 par value per share. The senior secured term loan credit agreement is guaranteed by the Company and certain of its subsidiaries and secured by certain of their unencumbered assets and pledges of certain equity interests held by the Company and its subsidiaries. The loans outstanding under the senior secured term loan facilities are non-amortizing and may be voluntarily repaid, in whole or in part, at any time subject to certain prepayment premiums if they are repaid prior to September 25, 2023.
On September 28, 2020, the Company borrowed $225.0 million under the initial senior secured term loan facility.facilities. The Company chose not to borrow the remaining $75.0 million of commitments under the term loan facilities, arewhich were available to the Company on a delayed draw basis during the sixth-month period afteruntil September 25, 2020, which period may be extended for an additional six months upon payment of an extension fee. A portion of the warrants exercisable for 1,516,455 shares of common stock are subject to (i) vesting on a pro rata basis as draws occur under the delayed draw term loan facility or (ii) forfeiture on a pro rata basis to the extent of commitments under the delayed draw term loan facility that are ultimately terminated or undrawn.2021. The net proceeds from the initialsenior secured term loan facilityfacilities were approximately $210.2 million after deducting discounts and expenses, which were capitalized as debt issuance costs. Interest on the outstanding loans under the senior secured term loan facilities is payable quarterly in arrears and accrues at the rate of (i) 8.00% per annum for any period for which accrued interest is paid in cash or (ii) 9.00% per annum for any period for which the borrowers elect to pay up to 50% of accrued interest in kind by adding such interest to the principal amount of the loans. The senior secured term loan facilities will mature on September 25, 2025.
The warrants issued in conjunction with entering into the term loan credit agreement are exercisable at the holder’s option at any time and from time to time on or afterOn September 25, 2021, in whole or inwarrantholders forfeited unvested warrants exercisable for 1,516,455 shares of common stock because the Company chose not to borrow the $75.0 million of delayed draw commitments available under the facilities.
On September 30, 2021, the Company settled part of the outstanding warrants to purchase approximately 1.06 million shares of common stock at an initial exercise price of $6.47 per share of common stock subjectfor a net cash amount of approximately $7.5 million. Subsequent to certain antidilution adjustments. Thequarter end, on October 4, 2021, the Company settled the remaining warrants will expire on September 25, 2026.
to purchase approximately 3.49 million shares of common stock at an exercise price of $6.47 per share of common stock for a net cash amount of approximately $24.7 million. The Company recordedcurrently has no warrants outstanding.
The Company retained third party valuation experts to assist with estimating the value of the term loan facilities and the warrants on a relative fair value basis. The estimated fair value of the warrants aton the dateissuance date. Based on the warrants’ fair value relative to the fair value of issuance wasthe senior secured term loan facilities, approximately $4.5 million andof the $225.0 million of gross proceeds was recognized as a discountallocated to the warrants, creating a corresponding senior secured term loan facilities. See Note 15 - Stockholders’ Equity and Note 19 - Earnings Per Share for further details.facilities discount in the same amount. The consolidatedCompany elected the accreted redemption value method whereby this discount will be accreted over five years using the effective interest method, resulting in an increase in the carrying value of the senior secured term loan facilities as of September 30, 2020 was $205.6 million, net of deferred issuance costs.facilities.
The table below summarizes the net carrying amount of the senior secured term loan facilities:
| | | September 30, | | December 31, | | September 30, | | December 31, |
| (in thousands) | (in thousands) | 2020 | | | 2019 | | (in thousands) | 2021 | | | 2020 | |
| Principal outstanding | Principal outstanding | $ | 225,000 | | | | $ | 0 | | | Principal outstanding | $ | 225,000 | | | | $ | 225,000 | | |
| Less: Unamortized debt discount and issuance costs | Less: Unamortized debt discount and issuance costs | 19,353 | | | | 0 | | | Less: Unamortized debt discount and issuance costs | (16,215) | | | | (18,552) | | |
| Net carrying value | Net carrying value | $ | 205,647 | | | | $ | 0 | | | Net carrying value | $ | 208,785 | | | | $ | 206,448 | | |
The senior secured term loan credit agreement contains various affirmative and negative covenants, which are applicable to the Company, the borrowers and their respective subsidiaries, including limitations (subject to exceptions) on their ability to: (i) incur indebtedness; (ii) incur liens on their assets; (iii) consummate certain fundamental changes; (iv) dispose of all or any part of their assets; (v) pay dividends or other distributions with respect to their equity interests; (vi) make investments; (vii) enter into transactions with their affiliates; (viii) modify the terms of the Company’s existing convertible notes, any refinancings thereof or any subordinated or junior lien indebtedness, or prepay any such indebtedness; and (ix) enter into certain burdensome agreements.
The senior secured term loan credit agreement also contains financial covenants that are substantially similar to the financial covenants under the Company’s repurchase agreementsfacilities, asset-specific financing facility and asset-specificterm financing facility. If the Company fails to meet or satisfy any of the covenants in accordance with the senior secured term loan credit agreement and is unable to obtain a waiver or other suitable relief from the lenders, the Company would be in default and the Company’s lenders could elect to declare outstanding amounts due and payable.
The Company was in compliance with all of its financial covenants as of September 30, 2020.2021.
GRANITE POINT MORTGAGE TRUST INC.
Notes to the Condensed Consolidated Financial Statements (unaudited)
Note 8. Cash, Cash Equivalents and Restricted Cash
Cash and cash equivalents include cash held in bank accounts and cash held in money market funds on an overnight basis.
The Company is required to maintain certain cash balances in restricted accounts as collateral for the Company’s repurchase facilities and with counterparties to support investment activities. As of September 30, 2021, the Company held $0.6 million in restricted cash in connection with its non-CRE CLO financing activities, compared to $5.0 million as of December 31, 2020. In addition, as of September 30, 2021, the Company held $20.0 million in restricted cash representing proceeds from principal paydowns of loans held in the CRE CLOs, compared to $62.8 million as of December 31, 2020.
The following table provides a reconciliation of cash, cash equivalents and restricted cash reported on the Company’s condensed consolidated balance sheets as of September 30, 2021 and December 31, 2020 that sum to the total of the same such amounts shown in the condensed consolidated statements of cash flows:
| | | | | | | | | | | |
| (in thousands) | September 30,
2021 | | December 31,
2020 |
| Cash and cash equivalents | $ | 154,916 | | | $ | 261,419 | |
| Restricted cash | 20,602 | | | 67,774 | |
| Total cash, cash equivalents and restricted cash | $ | 175,518 | | | $ | 329,193 | |
Note 9. Fair Value
Fair Value Measurements
ASC 820, Fair Value Measurements, or ASC 820, defines fair value as the price that would be received to sell an asset or paid to transfer a liability in an orderly transaction between market participants at the measurement date. ASC 820 clarifies that fair value should be based on the assumptions market participants would use when pricing an asset or liability and establishes a fair value hierarchy that prioritizes the information used to develop those assumptions. The fair value hierarchy gives the highest priority to quoted prices available in active markets (i.e., market-based or observable inputs) and the lowest priority to data lacking transparency (i.e., unobservable inputs) resulting in the use of management assumptions. Additionally, ASC 820 requires an entity to consider all aspects of nonperformance risk, including the entity’s own credit standing, when measuring fair value of a liability.
ASC 820 establishes a three-level hierarchy to be used when measuring and disclosing fair value. An instrument’s categorization within the fair value hierarchy is based on the lowest level of significant input to its valuation. Following is a description of the three levels:
Level 1Inputs are quoted prices in active markets for identical assets or liabilities as of the measurement date under current market conditions. Additionally, the entity must have the ability to access the active market and the quoted prices cannot be adjusted by the entity.
Level 2Inputs include quoted prices in active markets for similar assets or liabilities; quoted prices in inactive markets for identical or similar assets or liabilities; or inputs that are observable or can be corroborated by observable market data by correlation or other means for substantially the full-term of the assets or liabilities.
Level 3Unobservable inputs are supported by little or no market activity. The unobservable inputs represent the assumptions that market participants would use to price the assets and liabilities, including risk. Generally, Level 3 assets and liabilities are valued using pricing models, discounted cash flow methodologies or similar techniques that require significant judgment or estimation.
GRANITE POINT MORTGAGE TRUST INC.
Notes to the Condensed Consolidated Financial Statements (unaudited)
Following are descriptions of the valuation methodologies used to measure material assets and liabilities at fair value and details of the valuation models, key inputs to those models and significant assumptions utilized.
Recurring Fair Value
As of September 30, 2021 and December 31, 2020, the Company held no assets or liabilities measured at fair value on a recurring basis.
Nonrecurring Fair Value
The Company may be required to measure certain assets or liabilities at fair value from time to time. These periodic fair value measures typically result from the application of allowances for collateral-dependent assets under GAAP. These items would constitute nonrecurring fair value measures under ASC 820. For collateral-dependent loans that are identified as impaired, the Company measures allowance for credit losses by comparing its estimation of the fair value of the underlying collateral, less costs to sell, to the carrying value of the respective loan. To estimate the fair value of the underlying collateral the Company may (i) use certain valuation techniques, which, among others, may include a discounted cash flow method of valuation, or (ii) by obtaining a third-party independent assessment of value such as an appraisal or other opinion of value. These valuations require significant judgments, which include assumptions regarding capitalization rates, discount rates, leasing, creditworthiness of major tenants, occupancy rates, availability and cost of financing, exit plan, loan sponsorship, actions of other lenders, and other factors deemed relevant.
During the three months ended September 30, 2021, the Company assigned a risk rating of “5” to two of its loans held-for-investment during the quarterly risk rating process. As of September 30, 2021, these two loans have an aggregate outstanding principal balance of $168.1 million, and an aggregate carrying value of $145.3 million. The Company recorded a CECL reserve on these two assets based on its estimation of the fair value of each loan’s underlying collateral, less costs to sell, as of September 30, 2021. These loans held-for-investment are therefore measured at fair value on a nonrecurring basis using significant unobservable inputs, and are classified as Level 3 assets in the fair value hierarchy. The significant unobservable inputs used to estimate the fair value of these loans held-for-investment include the exit capitalization rate and discount rate assumptions used to forecast the future sale price of the underlying real estate collateral, which ranged from 5.50% to 7.00%, and from 7.00% to 9.50%, respectively. Refer to Note 3 - Loans Held-for-Investment, Net of Allowance for Credit Losses for further detail.
Fair Value of Financial Instruments
In accordance with ASC 820, the Company is required to disclose the fair value of financial instruments, both assets and liabilities recognized and not recognized in the condensed consolidated balance sheets, for which fair value can be estimated.
The following describes the Company’s methods for estimating the fair value for financial instruments:
•Loans held-for-investment are carried at cost, net of any unamortized acquisition premiums or discounts, loan fees, origination costs and allowance for credit losses, as applicable. The Company estimates the fair value of its loans held-for-investment by assessing any changes in market interest rates, credit spreads for loans of comparable risk as corroborated by inquiry of other market participants, shifts in credit profiles and actual operating results for mezzanine loans and senior loans, taking into consideration such factors as underlying property type, property competitive position within its market, market and submarket fundamentals, tenant mix, nature of business plan, sponsorship, extent of leverage and other loan terms. The Company categorizes the fair value measurement of these assets as Level 3.
•Cash and cash equivalents and restricted cash have a carrying value which approximates fair value because of the short maturities of these instruments. The Company categorizes the fair value measurement of these assets as Level 1.
•The carrying value of the underlying loans in the repurchase facilities, the asset-specific financing facility and the term financing facility that mature in less than one year generally approximates fair value due to the short maturities. The Company’s long-term repurchase facilities, asset-specific financing facility and term financing facility have floating rates based on an index plus a credit spread and the credit spread is typically consistent with those demanded in the market. Accordingly, the interest rates on these borrowings are at market and, thus, carrying value approximates fair value. The Company categorizes the fair value measurement of these liabilities as Level 2.
GRANITE POINT MORTGAGE TRUST INC.
Notes to the Condensed Consolidated Financial Statements (unaudited)
•Securitized debt obligations are recorded at outstanding principal, net of any unamortized deferred debt issuance costs. In determining the fair value of its securitized debt obligations, management’s judgment may be used to arrive at fair value that considers prices obtained from third-party pricing providers, broker quotes received and other applicable market data. If observable market prices are not available or insufficient to determine fair value due principally to illiquidity in the marketplace, then fair value is based upon internally developed models that are primarily based on observable market-based inputs but also include unobservable market data inputs (including prepayment speeds, delinquency levels and credit losses). The Company categorizes the fair value measurement of these liabilities as Level 2.
•Convertible senior notes are carried at their unpaid principal balance, net of any unamortized deferred issuance costs. The Company estimates the fair value of its convertible senior notes using the market transaction price nearest to September 30, 2021. The Company categorizes the fair value measurement of these assets as Level 2.
•Senior secured term loan facilities are carried at their unpaid principal balance, net of any unamortized deferred issuance costs. The Company estimates the fair value of its senior secured term loan facilities at the carrying value thereof as of September 30, 2021. The Company categorizes the fair value measurement of these assets as Level 2.
The following table presents the carrying values and estimated fair values of assets and liabilities that are required to be recorded or disclosed at fair value at September 30, 2021 and December 31, 2020:
| | | | | | | | | | | | | | | | | | | | | | | |
| September 30, 2021 | | December 31, 2020 |
| (in thousands) | Carrying Value | | Fair Value | | Carrying Value | | Fair Value |
| Assets | | | | | | | |
| Loans held-for-investment, net of allowance for credit losses | $ | 3,614,211 | | | $ | 3,648,115 | | | $ | 3,847,803 | | | $ | 3,867,286 | |
| | | | | | | |
| | | | | | | |
| Cash and cash equivalents | $ | 154,916 | | | $ | 154,916 | | | $ | 261,419 | | | $ | 261,419 | |
| Restricted cash | $ | 20,602 | | | $ | 20,602 | | | $ | 67,774 | | | $ | 67,774 | |
| Liabilities | | | | | | | |
| Repurchase facilities | $ | 916,758 | | | $ | 916,758 | | | $ | 1,708,875 | | | $ | 1,708,875 | |
| Securitized debt obligations | $ | 1,356,429 | | | $ | 1,360,354 | | | $ | 927,128 | | | $ | 916,701 | |
| Asset-specific financings | $ | 44,752 | | | $ | 44,752 | | | $ | 123,091 | | | $ | 123,091 | |
| Term financing facility | $ | 127,867 | | | $ | 127,867 | | | $ | — | | | $ | — | |
| Convertible senior notes | $ | 272,512 | | | $ | 275,141 | | | $ | 271,250 | | | $ | 257,411 | |
| Senior secured term loan facilities | $ | 208,785 | | | $ | 208,785 | | | $ | 206,448 | | | $ | 206,448 | |
Note 13.10. Commitments and Contingencies
The following represent the material commitments and contingencies of the Company as of September 30, 2020:2021:
Impact of COVID-19. Due to the current COVID-19 pandemic in the United States and globally, the Company’s borrowers and their tenants, property sponsors, the properties securing our investments and the overall economy have been, and will continue to be, adversely affected. The magnitude and duration of the COVID-19 pandemic and the full extent of its impact on the global economy generally, and the Company’s borrowers and their tenants, cash flows and future results of operations could be significant, and will largely depend on future developments, which are highly uncertain and unpredictable, including new information, which may emerge, concerning the severity of the COVID-19 pandemic, the success of actions taken to contain or treat the pandemic, and reactions by consumers, businesses, governments and capital markets. As of September 30, 2020, no contingencies have been recorded on the Company’s condensed consolidated balance sheets as a result of COVID-19. However, as the global pandemic continues and the economic implications worsen, it may have long-term impacts on the Company’s financial condition, results of operations and cash flows. See Note 2 - Use of Estimates for further discussion of COVID-19.
Management Agreement. Upon closing its initial public offering, or IPO, on June 28, 2017, the Company entered into a the Management Agreement. The Company currently pays the Manager a base management fee equal to 1.5% of the Company’s equity on an annualized basis, as defined in the Management Agreement. For purposes of calculating the management fee, equity means the sum of the net proceeds received by the Company from all issuances of its equity securities, plus its cumulative “core earnings” at the end of the most recently completed calendar quarter, less any distributions to stockholders, any amount that the Company has paid to repurchase its stock and any incentive fees earned by the Manager, but excluding the incentive fee earned in the current quarter. As a result, equity for purposes of calculating the management fee may differ from the amount of stockholders’ equity shown in the Company’s condensed consolidated financial statements.
Currently, incentive fees, if earned, are payable to the Manager, as defined in the Management Agreement. The incentive fee is the excess of (1) the product of (a) 20% and (b) the result of (i) the Company’s “core earnings” for the previous 12-month period, minus (ii) the product of (A) the Company’s equity in the previous 12-month period, and (B) 8% per annum, less (2) the sum of any incentive fees paid to the Manager with respect to the first three calendar quarters of such previous 12-month period; provided, however, that no incentive fees are payable with respect to any calendar quarter unless “core earnings” for the 12 most recently completed calendar quarters in the aggregate is greater than 0.
In addition, under the terms of an amendment to the Management Agreement entered into in the fourth quarter of 2018, the Manager agreed to reimburse the Company an amount related to the compensation payable to the sales agents under the Company’s equity distribution agreement by netting such amount from the base management fee payable to the Manager for the applicable quarterly period.
For purposes of calculating base management and incentive fees, “core earnings” means net income (loss) attributable to common stockholders, excluding non-cash equity compensation expense, incentive fees earned by the Manager, depreciation and amortization, any unrealized gains or losses or other similar non-cash items that are included in net income for the applicable period (regardless of whether such items are included in other comprehensive income or loss or in net income), and one-time events pursuant to changes in GAAP and certain material non-cash income or expense items, in each case after discussions between the Manager and the Company’s independent directors and approved by a majority of the Company’s independent directors.
Internalization. The initial term of the Management Agreement expired on June 28, 2020 and automatically renewed for a one-year term. Subsequent to September 30, 2020, the Company entered into an internalization agreement with the Manager pursuant to which the Management Agreement will terminate effective as of 11:59 p.m. on December 31, 2020, and the Company will no longer pay base management fees or incentive fees with respect to any period thereafter and will make a one-time cash payment of $44.5 million to the Manager. As of September 30, 2020, the Company’s condensed consolidated financial statements recognized a $44.5 million in other liabilities with respect to the internalization of the Company’s management function. See Note 21 – Subsequent Events for additional discussion of the Company’s internalization.
Employment contracts. The Company currently does not directly employ any personnel. Instead, the Company currently relies on the resources of the Manager and its affiliates to conduct the Company’s operations. As described in Note 21 – Subsequent Events, subsequent to September 30, 2020 the Company entered into employment agreements with the Company’s senior management team and, in accordance with the terms of the internalization agreement, the Company also intends to extend offers of employment to other employees of the Manager or its affiliates across a variety of functions who support the Company’s business. See Note 21 – Subsequent Events for additional discussion of the Company’s internalization.
GRANITE POINT MORTGAGE TRUST INC.
Notes to the Condensed Consolidated Financial Statements (unaudited)
Legal and regulatory. Regulatory
From time to time, the Company may be subject to liability under laws and government regulations and various claims and legal actions arising in the ordinary course of business. Liabilities are established for legal claims when payments associated with the claims become probable and the costs can be reasonably estimated. The actual costs of resolving legal claims may be substantially higher or lower than the amounts established for those claims. Based on information currently available, management is not aware of any legal or regulatory claims that would have a material effect on the Company’s condensed consolidated financial statements and, therefore, no accrual is required as of September 30, 2020.2021.
GRANITE POINT MORTGAGE TRUST INC.
Notes to the Condensed Consolidated Financial Statements (unaudited)
Unfunded commitmentsCommitments on loans held-for-investment.Loans Held-for-Investment
Certain of the Company’s commercial real estate loan agreements contain provisions and obligations to extend credit to its borrowers through its unfunded loan commitments over the contractual period of its loans. As of September 30, 20202021 and December 31, 2019,2020, the Company had unfunded loan commitments of $596.4$430.1 million and $748.9$503.7 million, respectively, on loans held-for-investment, which it expects to fund, subject to the satisfaction of any conditions precedent to such commitments, over the tenure of these loans, which have a weighted average future funding period of approximately threeone to two years. These commitments generally provide funding for lease-related or capital improvement expenditures, as well as interest and carry costs, all of which will vary depending on the progress of capital improvement projects, leasing and cash flows at the properties that serve as collateral for the Company’s loans. Therefore, the exact timing and amounts of such loan balance future fundings are generally uncertain and will depend on the current and future performance of the collateral properties. Due to the COVID-19 pandemic and its impact on the global and U.S. economies, generally, and the U.S. commercial real estate market, specifically, the pace of lease-related or capital improvement expenditures may be slower than otherwise expected, and the pace of associated future fundings relating to these capital needs accordingly may be similarly slower; however, the exact timing and amounts are uncertain. The Company typically finances the funding of its loan commitments on terms generally consistent with its overall financing facilities; however, most of its financing agreement counterparties are not obligated to fund their ratable portion of these loan commitments over time and have varying degrees of discretion over future loan funding obligations, including the advance rates on their fundings. The Company may be obligated to fund loan commitments with respect to a pledged asset even if the applicable financing counterparty will not fund their ratable portion of the loan commitment and/or has made margin calls with respect to such pledged asset. As a result of the COVID-19 pandemic and the increased degree of uncertainty it has created, the Company’s financing agreement counterparties may be less likely to finance its future loan funding commitments than they were prior to the COVID-19 pandemic.
As of September 30, 2021, the Company recognized $1.9 million in other liabilities related to the allowance for credit losses on unfunded loan commitments. See Note 3 - Loans Held-for-Investment, Net of Allowance for Credit Losses for further detail.
Note 14.11. Preferred Stock
The Company’s preferred stock ranks senior to the rights of holders of the Company’s common stock, but junior to all other classes or series of preferred stock that may be issued. The holders of the preferred stock are entitled to receive, when, as and if authorized and declared by the Company,Company’s board of directors, cumulative cash dividends at the rate of 10% per annum of the $1,000 liquidation preference per share of the preferred stock. Such dividends accrue on a daily basis and are cumulative from and including the initial issue date of the preferred stock.
The Company has the option at any time after five years from the initial issue date of June 28, 2017 to redeem the preferred stock at a redemption price of $1,000 per share, plus any accrued and unpaid dividends. At any time after six years from the initial issue date, the Company will, at the request of any preferred stockholder, repurchase the holder’s preferred stock at a price of $1,000 per share, plus any accrued and unpaid dividends.
During each of the three and nine months ended September 30, 2021 and 2020, the Company declared dividends to the preferred stockholder of $25,000 and $75,000, respectively. During the three and nine months ended September 30, 2019,
Issuance of Sub-REIT Preferred Stock
In January 2021, a subsidiary of the Company declared dividendsissued 625 shares of Series A preferred stock of which 500 shares were retained by the Company and 125 shares were sold to third party investors for proceeds of $0.1 million. The 500 preferred shares of Series A preferred stock retained by the Company are eliminated in the Company’s condensed consolidated statements of changes in equity and the 125 shares sold to third party investors are shown in the Company’s condensed consolidated statements of changes in equity as non-controlling interests.
GRANITE POINT MORTGAGE TRUST INC.
Notes to the preferred stockholder of $25,000 and $75,000, respectively.Condensed Consolidated Financial Statements (unaudited)
Note 15.12. Stockholders’ Equity
Common Stock
On February 5, 2019, the Company closed an underwritten public offering of 6,850,000 shares of its common stock. The Company received total proceeds from the offering of approximately $130.2 million. In addition, the Company granted the underwriters a thirty-day option to purchase up to an additional 1,027,500 shares of its common stock, which was exercised in full on March 6, 2019 resulting in proceeds of $19.5 million from exercise of the underwriters’ option. In connection with this offering, the Manager agreed to pay approximately $1.6 million of the underwriting fees and discounts.
GRANITE POINT MORTGAGE TRUST INC.
Notes to the Condensed Consolidated Financial Statements (unaudited)
As of September 30, 2020, the Company had 55,205,082 shares of common stock outstanding. The following table presents a reconciliation of the common shares outstanding for the nine months ended September 30, 2020 and 2019:
| | | | | |
| Number of common shares |
| |
| |
| |
| |
| |
| |
Common shares outstanding, December 31, 2018 | 43,621,174 | |
Issuance of common stock | 10,954,924 | |
Issuance of restricted stock (1)
| 277,107 | |
| |
Common shares outstanding, September 30, 2019 | 54,853,205 | |
| |
Common shares outstanding, December 31, 2019 | 54,853,205 | |
Issuance of common stock | 0 | |
Issuance of restricted stock (1)
| 351,877 | |
| |
Common shares outstanding, September 30, 2020 | 55,205,082 | |
____________________
(1)Represents shares of restricted stock granted under the Company’s 2017 Equity Incentive Plan, net of forfeitures. See Note 16 - Equity Incentive Plan for additional information.
Distributions to Stockholders
The following table presents cash dividends declared by the CompanyCompany’s board of directors on its common stock from December 31, 20182019 through September 30, 2020:2021:
| | | | | | | | | | | | | | | | | | | | |
| Declaration Date | | Record Date | | Payment Date | | Cash Dividend Per Share |
| | | | | | |
| | | | | | |
| September 15, 2021 | | October 1, 2021 | | October 19, 2021 | | $ | 0.25 | |
| June 15, 2021 | | July 1, 2021 | | July 19, 2021 | | $ | 0.25 | |
| March 18, 2021 | | April 1, 2021 | | April 19, 2021 | | $ | 0.25 | |
| December 18, 2020 | | December 31, 2020 | | January 22, 2021 | | $ | 0.25 | |
| December 18, 2020 | | December 31, 2020 | | January 22, 2021 | | $ | 0.20 | |
| September 28, 2020 | | October 8, 2020 | | October 19, 2020 | | $ | 0.20 | |
December 18, 2019 | | December 31, 2019 | | January 17, 2020 | | $ | 0.42 | |
September 18, 2019 | | October 3, 2019 | | October 18, 2019 | | $ | 0.42 | |
June 20, 2019 | | July 5, 2019 | | July 19, 2019 | | $ | 0.42 | |
March 20, 2019 | | April 1, 2019 | | April 18, 2019 | | $ | 0.42 | |
| | | | | | |
| | | | | | |
| | | | | | |
| | | | | | |
| | | | | | |
Share Repurchase ProgramRepurchases
The Company’s Share Repurchase Program allows for the repurchase of up to an aggregate of 2,000,000 shares of the Company’s common stock.stock and has no expiration date. The shares are expected to be repurchased from time to time through privately negotiated transactions or open market transactions, including pursuant to a trading plan in accordance with Rules 10b5-1 and 10b-18 under the Securities Exchange Act of 1934, as amended, or the Exchange Act, or by any combination of such methods. The manner, price, number and timing of share repurchases will be subject to a variety of factors, including market conditions and applicable SEC rules. TheDuring the three months ended September 30, 2021, the Company has not repurchased any1,000,721 shares of its common stock sinceat a weighted average price of $13.49 per share for an aggregate cost of $13.5 million. As of September 30, 2021, there remained 698,388 shares authorized for repurchase.
The Company has also authorized the program was authorized.repurchase of shares of restricted common stock granted to employees and directors for tax withholding purposes. During the nine months ended September 30, 2021, the Company repurchased from employees and directors 115,053 shares of its common stock for an aggregate cost of $1.2 million. No shares were repurchased for tax withholding purposes during the three months ended September 30, 2021 and three and nine months ended September 30, 2020.
At-the-Market Offering
The Company is party to an equity distribution agreement under which the Company may sell up to an aggregate of 8,000,000 shares of its common stock from time to time in any method permitted by law deemed to be an “at-the-market” offering as defined in Rule 415 under the Securities Act of 1933, as amended, or the Securities Act. As of September 30, 2020,2021, 3,242,364 shares of common stock had been sold under the equity distribution agreement for total accumulated net proceeds of approximately $61.2 million, of which 3,077,424 shares were sold for net proceeds of $58.1 million during the three and nine months ended September 30, 2019, respectively. Additionally, the Company received a base management fee reimbursement from the Manager of $0.1 million for stock sold under the equity distribution agreement during the three and nine months ended September 30, 2019. NaNmillion. No shares were sold during the three and nine months ended September 30, 2021 and 2020.
GRANITE POINT MORTGAGE TRUST INC.
Notes to the Condensed Consolidated Financial Statements (unaudited)
Warrants to Purchase Common Stock
TheSee Note 7 - Senior Secured Term Loan Facilities and Warrants to Purchase Shares of Common Stock for details on warrants issued in conjunction with the term loan credit agreement have an initial exercise price of $6.47 per share of common stock. The exercise priceto purchase shares of the warrants and shares ofCompany’s common stock issuable upon exercise of the warrants are subject to customary adjustments. The warrants are exercisable on a net settlement basis at any time, and from time to time, on or after September 25, 2021 until September 25, 2026. Payment of the exercise price will be made solely on a cashless basis by withholding shares issuable upon exercise. The Company may settle the exercise of the warrants in cash or by issuing shares of common stock, at its option. The warrants are classified as equity and were initially recorded at their estimated fair value of approximately $4.5 million with no subsequent remeasurement.
The Company retained third party valuation experts to assist with estimating the fair value of the warrants on the issuance date. Based on the warrants’ fair value relative to the fair value of the term loan facilities, approximately $4.5 million of the $225.0 million of gross proceeds was allocated to the warrants, creating a corresponding term loan facilities discount in the same amount. The Company elected the accreted redemption value method whereby this discount will be accreted over five years using the effective interest method, resulting in an increase in the carrying value of the term loan facilities.
Accumulated Other Comprehensive (Loss) Income
At September 30, 2020, the Company held no AFS securities. Accumulated other comprehensive income at December 31, 2019 was $0.03 million.
Reclassifications out of Accumulated Other Comprehensive (Loss) Income
The Company reclassifies unrealized gains and losses on AFS securities in accumulated other comprehensive (loss) income to net (loss) income upon the recognition of any provision for credit losses as the allowance for credit losses on individual AFS securities is increased or decreased. The Company did not record any reclassifications out of accumulated other comprehensive (loss) income for the three months ended September 30, 2020 and the three and nine months ended September 30, 2019. For the nine months ended September 30, 2020, the Company reclassified $0.5 million of unrealized losses on AFS securities out of accumulated other comprehensive (loss) income to provision for credit losses on the condensed consolidated statements of comprehensive (loss) income.stock.
Note 16.13. Equity Incentive Plan
The Company’s 2017 Equity Incentive Plan, or the Plan, provides incentive compensation to attract and retain qualified directors, officers, advisors, consultants and other personnel, including certain personnel ofpermits the Manager and its affiliates. The Plan is administered by the compensation committee of the Company’s board of directors. The compensation committee has the full authority to administer and interpret the Plan, to authorize the granting of awards, to determine the eligibility of directors, officers, advisors, consultants and other personnel, including personnel of the Manager and its affiliates, to receive an award, to determine the number of shares of common stock to be covered by each award (subject to the individual participant limitations provided in the Plan), to determine the terms, provisions and conditions of each award (which may not be inconsistent with the terms of the Plan), to prescribe the form of instruments evidencing awards and to take any other actions and make all other determinations that it deems necessary or appropriate in connection with the Plan or the administration or interpretation thereof. In connection with this authority, the compensation committee may, among other things, establish performance goals that must be met in order for awards to be granted or to vest, or for the restrictions on any such awards to lapse.
The Plan provides for grants of restricted common stock, phantom shares, or restricted stock units, both non-performance based, or RSUs, and performance-based, or PSUs, dividend equivalent rights and other equity-based awards subject to a ceilingemployees, directors, officers, advisors, consultants and other personnel. As of 3,242,306September 30, 2021, the Company had 2,228,088 shares of common stock available for future issuance under the Plan.
The Plan allowsCompany accounts for equity-based awards under ASC 718 - Compensation - Stock Compensation, which requires the Company’s boardCompany to expense the cost of directors to expandservices received in exchange for equity-based awards based on the typesgrant-date fair value of the awards. This expense is recognized ratably over the requisite service period following the date of grant. The fair value of awards available under the Plan to include long-term incentive plan units in the future. If an award granted under the Plan expires or terminates, the shares subject to any portion of the award that expires or terminates without having been exercised or paid, as the case may be, will again become available for the issuance of additional awards. Unless earlier terminated by the Company’s board of directors, no new award may be granted under the Plan after the tenth anniversary of the effective date of the Plan. No award may be granted under the Plan to any person who, assuming payment of all awards held by such person, would own or be deemed to own more than 9.8% of the outstanding shares of the Company’s common stock.
During the nine months ended September 30, 2020 and 2019, the Company granted 69,720 and 18,189 shares ofCompany's restricted common stock respectively, to its independent directors as compensation for their service on the Company’s board of directors, pursuantand RSUs is typically equivalent to the terms of the Plan. The estimated fair value of these awards was $5.02 and $19.24 per share, respectively,closing stock price on the grant date, based on the closing price of the Company’s common stock on the NYSE on such date. The shares underlying theseunrecognized compensation cost relating to such awards vest onis recognized as an expense over the first anniversary of the grant date, as long as the grantee complies with the terms and conditions of his or her applicable award agreement.awards’ remaining vesting periods.
GRANITE POINT MORTGAGE TRUST INC.
Notes to the Condensed Consolidated Financial Statements (unaudited)
Additionally, during the nine months endedAs of September 30, 2020 and 2019, the Company granted 297,769 and 258,918 shares2021, there was $1.2 million of total unrecognized compensation cost for awards of restricted common stock respectively, to key employeesthat will be recognized over the grants' remaining weighted average vesting period of the Manager and its affiliates pursuant to the terms of the Plan and the associated award agreements. The estimated fair value of these awards was $18.47 and $19.31 per share, respectively, on the grant date, based on the closing market price of the Company’s common stock on the NYSE on such date. The shares underlying these awards vest in three equal annual installments commencing on the first anniversary of the grant date, as long as the grantee complies with the terms and conditions of his or her applicable award agreement.
The following table summarizes the activity related to restricted common stock for the nine months ended September 30, 2020 and 2019:
| | | | | | | | | | | | | | | | | | | | | | | |
| Nine Months Ended September 30, |
| 2020 | | 2019 |
| Shares | | Weighted Average Grant Date Fair Market Value | | Shares | | Weighted Average Grant Date Fair Market Value |
| Outstanding at Beginning of Period | 461,371 | | | $ | 18.75 | | | 321,134 | | | $ | 18.04 | |
| Granted | 367,489 | | | 15.92 | | | 277,107 | | | 19.31 | |
| Vested | (243,713) | | | (18.74) | | | (136,870) | | | (18.20) | |
| Forfeited | (15,612) | | | (18.68) | | | 0 | | | 0 | |
| Outstanding at End of Period | 569,535 | | | $ | 16.93 | | | 461,371 | | | $ | 18.75 | |
1.6 years. For the three and nine months ended September 30, 2020,2021, the Company recognized $0.5 million and $1.8 million, respectively, of compensation relatedexpense associated with these awards, compared to restricted common stock of $1.3 million and $4.0 million, respectively.respectively, for the three and nine months ended September 30, 2020, within compensation and benefits expense on the condensed consolidated statements of income (loss).
As of September 30, 2021, there was $6.7 million of total unrecognized compensation cost for awards of RSUs that will be recognized over the grants' remaining weighted average vesting period of 2.6 years. For the three and nine months ended September 30, 2019,2021, the Company recognized $1.2 million and $3.1 million, respectively, of compensation relatedexpense associated with these awards within compensation and benefits expense on the condensed consolidated statements of income (loss). The Company did not recognize any compensation expense associated with grants of RSUs in any period prior to October 1, 2020.
Awards of PSUs have a three-year cliff vesting with the number of performance-based stock units vesting at the end of the three-year period based upon the Company’s absolute and relative “core” return on average equity, or Core ROAE, performance, as set in the applicable award agreements. More specifically, between 0% and 200% of the target number of units may vest at the end of the performance period based (i) 50% against the predetermined internal Company performance goal for Core ROAE and (ii) 50% against the Company's performance ranking for Core ROAE among a group of commercial mortgage REIT peer companies. The commercial mortgage REIT peer group includes publicly traded commercial mortgage REITs, which the Company believes derive the majority of their revenues from commercial real estate balance sheet lending activities and meet certain market capitalization criteria.
As of September 30, 2021, there was $4.3 million of total unrecognized compensation cost for awards of PSUs that will be recognized over the grants’ remaining weighted average vesting period of 2.4 years. For the three months and nine months ended September 30, 2021, the Company recognized $0.3 million and $0.6 million, respectively, of compensation expense associated with these awards within compensation and benefits expenses on the condensed consolidated statements of income (loss). The Company did not recognize any compensation expense associated with grants of PSUs in any period prior to January 1, 2021.
The following table summarizes the grants, vesting and forfeitures of restricted common stock of $1.2 million and $3.6 million, respectively.
Note 17. Restructuring Charges
Subsequent toRSUs for the nine months ended September 30, 2020, the Company entered into an internalization agreement with the Manager pursuant to which the Company will internalize its management function effective as of, and the Company will no longer pay base management fees or incentive fees with respect to any period after, 11:59 p.m. on December 31, 2020, and the Company will make a one-time cash payment of $44.5 million2021:
| | | | | | | | | | | | | | | | | | | | | | | |
| Restricted Stock | | RSUs | | PSUs | | Weighted Average Grant Date Fair Market Value |
| Outstanding at December 31, 2020 | 569,535 | | | 403,903 | | | — | | | $ | 14.93 | |
| Granted | — | | | 519,562 | | | — | | | 9.77 | |
| Vested | (137,728) | | | — | | | — | | | 18.46 | |
| Forfeited | (97,425) | | | — | | | — | | | 18.43 | |
| Outstanding at March 31, 2021 | 334,382 | | | 923,465 | | | — | | | $ | 11.32 | |
| Granted | — | | | 44,853 | | | — | | | 14.77 | |
| Vested | (52,092) | | | (1,048) | | | — | | | 5.12 | |
| Forfeited | (17,628) | | | (3,957) | | | — | | | 5.93 | |
| Outstanding at June 30, 2021 | 264,662 | | | 963,313 | | | — | | | $ | 11.95 | |
| Granted | — | | | — | | | 347,896 | | | 14.15 | |
| Vested | — | | | — | | | — | | | — | |
| Forfeited | — | | | — | | | — | | | — | |
| Outstanding at September 30, 2021 | 264,662 | | | 963,313 | | | 347,896 | | | 12.44 | |
GRANITE POINT MORTGAGE TRUST INC.
Notes to the Manager. See Note 21 – Subsequent Events for additional discussionCondensed Consolidated Financial Statements (unaudited)
Below is a summary of the Company’s internalization. The one-time payment of $44.5 million to the Manager is recorded in other liabilitiesrestricted stock and RSU vesting dates as of September 30, 2020.2021:
| | | | | | | | | | | | | | | | | | | | | | | |
| Vesting Year | Restricted Stock | | RSUs | | PSUs | | Total Awards |
| 2021 | — | | | 30,030 | | | — | | | 30,030 | |
| 2022 | 172,077 | | | 218,034 | | | — | | | 390,111 | |
| 2023 | 92,585 | | | 173,187 | | | 347,896 | | | 613,668 | |
| 2024 | — | | | 173,194 | | | — | | | 173,194 | |
| 2025 | — | | | 368,868 | | | — | | | 368,868 | |
| Total | 264,662 | | | 963,313 | | | 347,896 | | | 1,575,871 | |
Note 18.14. Income Taxes
The Company has elected to be taxed as a REIT under the Code for U.S. federal income tax purposes. As long as the Company qualifies as a REIT, the Company generally will not be subject to U.S. federal income taxes on that portion of its income that it distributes to its stockholders if it annually distributes at least 90% of its REIT taxable income, without regard to the deduction for dividends paid and excluding net capital gains, and does not engage in prohibited transactions. WhileFor the year ended December 31, 2020, the Company currently intendsdid not distribute the required minimum amount of taxable income pursuant to distributefederal excise tax requirements and, consequently, the Company accrued an excise tax of $0.6 million. As of September 30, 2021, the Company distributed 100% of its REIT taxable income for the taxable year endingended December 31, 2020, in part with dividends paid in 2021, and complyhas complied with all requirements to continue to qualify as a REIT, the Company will continue to evaluate its capital and liquidity needs in light of the significant uncertainties created by the COVID-19 pandemic, including the potential for a continued and prolonged adverse impact on economic and market conditions.REIT. The majority of states also recognize the Company’s REIT status. The Company’s TRS files a separate federal tax return and is fully taxed as a standalone U.S. C-corporation. It is assumed that the Company will retain its REIT status and will incur no REIT level taxation as it intends to comply with the REIT regulations and annual distribution requirements.
Based on the Company’s evaluation, it has been concluded that there are no significant uncertain tax positions requiring recognition in the Company’s condensed consolidated financial statements of a contingent tax liability for uncertain tax positions. Additionally, there were no amounts accrued for penalties or interest as of, or during, the periods presented in these condensed consolidated financial statements.
GRANITE POINT MORTGAGE TRUST INC.
Notes to the Condensed Consolidated Financial Statements (unaudited)
Note 19.15. Earnings Per Share
The following table presents a reconciliation of the earnings and shares used in calculating basic and diluted earnings per share for the three and nine months ended September 30, 20202021 and 2019:2020:
| | | | | | | | | | | | | | | | | | | | | | | | | |
| Three Months Ended | | Nine Months Ended | | |
| September 30, | | September 30, | | |
| (in thousands, except share data) | 2020 | | 2019 | | 2020 | | 2019 | | |
| Numerator: | | | | | | | | | |
| Net (loss) income attributable to common stockholders - basic | $ | (24,691) | | | $ | 17,368 | | | $ | (63,665) | | | $ | 52,464 | | | |
Interest expense attributable to convertible notes (1) | 0 | | | 0 | | | 0 | | | 0 | | | |
| Net (loss) income attributable to common stockholders - diluted | $ | (24,691) | | | $ | 17,368 | | | $ | (63,665) | | | $ | 52,464 | | | |
| Denominator: | | | | | | | | | |
| Weighted average common shares outstanding | 54,624,739 | | | 54,391,834 | | | 54,561,411 | | | 52,017,520 | | | |
| Weighted average restricted stock shares | 580,343 | | | 461,371 | | | 578,752 | | | 474,804 | | | |
| Basic weighted average shares outstanding | 55,205,082 | | | 54,853,205 | | | 55,140,163 | | | 52,492,324 | | | |
| Effect of dilutive shares issued in an assumed conversion of the convertible senior notes | 0 | | | 0 | | | 0 | | | 0 | | | |
| Effect of dilutive shares issued in an assumed exercise of warrants issued in conjunction with the term loan facilities | — | | | — | | | — | | | — | | | |
| Diluted weighted average shares outstanding | 55,205,082 | | | 54,853,205 | | | 55,140,163 | | | 52,492,324 | | | |
| (Loss) earnings per share | | | | | | | | | |
| Basic | $ | (0.45) | | | $ | 0.32 | | | $ | (1.15) | | | $ | 1.00 | | | |
| Diluted | $ | (0.45) | | | $ | 0.32 | | | $ | (1.15) | | | $ | 1.00 | | | |
____________________ | | | | | | | | | | | | | | | | | | | | | | | | | |
| Three Months Ended | | Nine Months Ended |
| September 30, | | September 30, |
| (in thousands, except share data) | 2021 | | 2020 | | 2021 | | 2020 | | |
| Numerator: | | | | | | | | | |
| Net income (loss) attributable to common stockholders - basic | $ | 18,605 | | | $ | (24,691) | | | $ | 60,815 | | | $ | (63,665) | | | |
| Interest expense attributable to convertible notes | — | | | — | | | 13,618 | | | — | | | |
| Net income (loss) attributable to common stockholders - diluted | $ | 18,605 | | | $ | (24,691) | | | $ | 74,433 | | | $ | (63,665) | | | |
| Denominator: | | | | | | | | | |
| Weighted average common shares outstanding | 54,188,884 | | | 54,624,739 | | | 54,537,196 | | | 54,561,411 | | | |
| Weighted average restricted stock shares | 264,662 | | | 580,343 | | | 327,260 | | | 578,752 | | | |
| Basic weighted average shares outstanding | 54,453,546 | | | 55,205,082 | | | 54,864,456 | | | 55,140,163 | | | |
| Effect of dilutive shares issued in an assumed conversion of the convertible senior notes | — | | | — | | | 14,065,946 | | | — | | | |
| Effect of dilutive shares issued in an assumed conversion of RSUs as additional shares | 435,430 | | | — | | | 245,890 | | | — | | | |
| | | | | | | | | |
| Effect of dilutive shares issued in an assumed exercise of warrants issued in conjunction with the senior secured term loan facilities | 1,846,302 | | | — | | | 1,726,453 | | | — | | | |
| Diluted weighted average shares outstanding | 56,735,278 | | | 55,205,082 | | | 70,902,745 | | | 55,140,163 | | | |
| Earnings (loss) per share | | | | | | | | | |
| Basic | $ | 0.34 | | | $ | (0.45) | | | $ | 1.11 | | | $ | (1.15) | | | |
| Diluted | $ | 0.33 | | | $ | (0.45) | | | $ | 1.05 | | | $ | (1.15) | | | |
(1)Includes a nondiscretionary adjustment for the assumed change in the management fee calculation.
For the three and nine months ended September 30, 2020 and three months ended September 30, 2021, excluded from the calculation of diluted earnings per share is the effect of adding back $4.5 million, $13.6 million and $13.6$4.6 million, respectively, of interest expense net of nondiscretionary adjustment for the assumed change in the management fee calculation, and 13,717,782, 13,717,782 and 13,717,782 weighted average common share equivalents,14,065,946, respectively, related to the assumed conversion of the Company’s convertible senior notes, as their inclusion would be antidilutive.
For the nine months ended September 30, 2019, excluded from the calculation of diluted earnings per share is the effect of adding back $13.5 million of interest expense, net of nondiscretionary adjustment for the assumed change in the management fee calculation, and 13,665,164 weighted average common share equivalents related to the assumed conversion of the Company’s convertible senior notes, as their inclusion would be antidilutive.
In conjunction with entering into the senior secured term loan credit agreement and the warrants described in Note 127 - Senior Secured Term Loan Facilities and Warrants to Purchase Shares of Common Stock, the Company elected the accreted redemption value method whereby the discount created based on the fair value of the warrants relative to the fair value of the senior secured term loan facilities and the related issuance costs will be accreted over five years using the effective interest method. Such adjustments are included in amortization of deferred debt issuance costs on the Company’s condensed consolidated statements of cash flows. For the three and nine months ended September 30, 2020,2021, these adjustments totaled $0.1 million.
The$0.3 million and $0.8 million, respectively. Additionally, the computation of diluted earnings per share is based on the incremental shares that would be outstanding assuming the exercise of warrants issued in conjunction with entering into the senior secured term loan credit agreement.agreement, to the extent such warrants remained outstanding as of September 30, 2021 (after giving effect to the settlement of a portion of such warrants on such date). The computation of diluted earnings per share is also based on the incremental shares that would be outstanding assuming the conversion of RSUs. The number of incremental shares is calculated by applying the treasury stock method. For the three and nine months ended September 30, 2020,2021, the additional 364,1821.8 million and 1.7 million shares, respectively attributable to the warrants were not included in the computation of diluted earnings per share. For the three and nine months ended September 30, 2021, the additional 435,430 and 245,890, respectively, weighted-average unvested RSUs were included in the dilutive earnings per share denominator. The Company did not have any RSUs outstanding as their impact would have been anti-dilutive.of September 30, 2020.
GRANITE POINT MORTGAGE TRUST INC.
Notes to the Condensed Consolidated Financial Statements (unaudited)
Note 20.16. Related Party Transactions
Currently,Prior to the Internalization, the Company does not have any employees and is externally managed bypaid the Manager under the terms of a Management Agreement. See Note 21 – Subsequent Events for further discussion regarding employment after the consummation of the Company’s internalization. Under the Management Agreement, the Manager and its affiliates provide the Company with the personnel and resources necessary to operate the Company’s business. In exchange, the Company currently pays theFormer Manager a base management fee that is equal to 1.5% of the Company’s equity, as defined in the management agreement with the Former Manager, or the Former Management Agreement, on an annualized basis. The Company incurred $4.0 million and $11.8 million, respectively, as ain management fee to the Managerfees for the three and nine months ended September 30, 2020, and $3.8 million and $11.0 million, respectively, as2020. The Company did not incur a management fee to the Manager for the three and nine months ended September 30, 2019.2021 because the Company was not managed by the Former Manager during the period as a result of the Internalization.
In addition, incentive fees, if earned, arewere payable to the Company’sFormer Manager, as defined in the Former Management Agreement. No incentive fees were incurred for the three and nine months ended September 30, 2020 or the three months ended September 30, 2019. The Company incurred $0.2 million as an incentive fee2021 and 2020.
Prior to the Manager forInternalization, the nine months ended September 30, 2019. See further discussion ofCompany reimbursed the base management fee and incentive fee calculations in Note 13 - Commitments and Contingencies and further discussion of base management fee reimbursements for common stock sold under the Company’s equity distribution agreement in Note 15 - Stockholder’s Equity.
The Company currently reimburses theFormer Manager for certain direct and allocated costs incurred by the Former Manager on behalf of the Company. During the three and nine months ended September 30, 2020, these direct and allocated costs totaled approximately $1.5 million and $10.8 million, respectively. During the three and nine months ended September 30, 2019,No direct and allocated costs totaled approximately $1.7 million and $10.0 million, respectively.
Subsequent to September 30, 2020, the Company entered into an internalization agreement with the Manager pursuant to which, as of 11:59 p.m. on December 31, 2020, the Management Agreement will terminate, the Company will no longer rely on the Manager and its affiliates to provide personnel and resources to operate the Company’s business and the Company will no longer be obligated to pay base management fees or incentive fees to the Manager or reimburse the Manager for costswere incurred by the Former Manager on behalf of the Company with respect to any period after such date. See Note 21 – Subsequent Events for additional discussion of the Company’s internalization.
In addition, during the nine months ended September 30, 2019, the Manager paid the underwriters an amount equal to $0.20 per share for each share issued in connection with the Company’s underwritten public offering of its common stock and the related option exercised by the underwriters to purchase additional shares of the Company’s common stock.
The Company has contractual relationships with a majority of its third-party vendors and pays those vendors directly. The Company will continue to have certain costs allocated to it by the Manager under the Management Agreement for compensation, data services, technology and certain office lease payments until the consummation of the Company’s internalization.
The Company recognized $1.3 million and $4.0 million of compensation during the three and nine months ended September 30, 2020, respectively, and $1.2 million and $3.6 million of compensation2021 because the Company was not managed by the Former Manager during the three and nine months ended September 30, 2019, respectively, related to restricted common stock issued to employeesperiod as a result of the Manager and the Company’s independent directors pursuant to the Plan. See Note 16 - Equity Incentive Plan for additional information.
The terms of these transactions may have been different had they been transacted with an unrelated third-party.Internalization.
Note 21.17. Subsequent Events
Events subsequent to September 30, 20202021 were evaluated through the date these condensed consolidated financial statements were issued and no other additional events were identified requiring further disclosure in these condensed consolidated financial statements exceptother than as set forth below:discussed below.
Internalization
On October 4, 2020,See Note 7 - Senior Secured Term Loan Facilities and Warrants to Purchase Shares of Common Stock for details on the Company entered into employment agreements with the Company’s senior management team, pursuantsettlement of warrants to which each will become directly employed by the Company upon consummation of the internalizationpurchase shares of the Company’s management function, or the Internalization.common stock.
On October 10, 2020,November 3, 2021, the Company entered intopriced GPMT 2021-FL4, a $621 million managed CRE CLO with an internalization agreement with the Manager, pursuant to which the Company will internalize its management function, effective asinitial advance rate of 11:59 p.m. on December 31, 2020. Prior to the Internalization, the Manager will continue to provide services to the Company pursuant to the Management Agreement. Upon consummation80.875% and a weighted average interest rate at issuance of the Internalization, among other things, (i) the Management Agreement will be terminated, (ii) the Company will no longer pay management or incentive fees to the Manager for any period following the Internalization and (iii) the Company will become an internally managed REIT. In connection with the Internalization, the Company will make a one-time cash payment of $44.5 million to the Manager. In accordance with the terms of the internalization agreement, the Company also
27LIBOR + 1.68%, before transaction costs.
GRANITE POINT MORTGAGE TRUST INC.
Notes to the Condensed Consolidated Financial Statements (unaudited)
intends to extend offers of employment to other employees of the Manager or its affiliates across a variety of functions who support the Company’s business.
Quarterly Dividend
On September 28, 2020, the Company declared a quarterly dividend of $0.20 per share of common stock for the quarter ended September 30, 2020. The dividend was paid on October 19, 2020 to common stockholders of record at the close of business on October 8, 2020.
Item 2. Management’s Discussion and Analysis of Financial Condition and Results of Operations
The following discussion and analysis should be read in conjunction with the interim unaudited condensed consolidated financial statements and accompanying notes included elsewhere in this Quarterly Report on Form 10-Q, as well as our Annual Report on Form 10-K for the year ended December 31, 2019.
Our Company
Granite Point Mortgage Trust Inc. is an internally managed real estate finance company that focuses primarily on directly originating, investing in and managing senior floating-rate commercial mortgage loans and other debt and debt-like commercial real estate investments. We are currently externally managedOur investment objective is to preserve our stockholders’ capital while generating attractive risk-adjusted returns over the long term, primarily through dividends derived from current income produced by Pine River Capital Management L.P., or our Manager.investment portfolio. We operate as a real estate investment trust, or REIT, as defined under the Internal Revenue Code of 1986, as amended, or the Code. We also operate our business in a manner that will permit us to maintain our exclusion from registration under the Investment Company Act of 1940, as amended, or the Investment Company Act. We operate our business as one segment.
The Internalization
Subsequent to September 30,We were externally managed by Pine River Capital Management L.P., or the Former Manager, through December 31, 2020, at which time we entered into an internalization agreement with our Manager, pursuant to which we will internalizeinternalized our management function, or the Internalization, effective as of 11:59 p.m. on December 31, 2020. Prior to the Internalization, our Manager will continue to provide services to us pursuant to our existing management agreement with our Manager, or the Management Agreement. Upon consummation of the Internalization, among other things, (i) the Management Agreement will be terminated, (ii) we will no longer pay management or incentive fees to our Manager for any period following the Internalization and (iii) we will become an internally managed REIT. In connection with the Internalization, we will make a one-time cash payment of $44.5 million to our Manager and we will incur expenses associated with becoming an internally managed REIT, including compensation expenses previously borne by our Manager.
Business Operations
As discussed above, following the consummation of the Internalization, we will become internally managed. Specifically, we will have employees and no longer rely on a third-party manager to operate our business. Subsequent to September 30, 2020, we also entered into employment agreements with our senior management team, pursuant to which our senior management team will become directly employed by us upon consummation of the Internalization. In accordance with the terms of the internalization agreement, we also intend to extend offers of employment to other employees of our Manager or its affiliates across a variety of functions who support our business. Further, we have moved certain functions, such as information technology infrastructure and others, to independent third-party providers and anticipate an orderly and timely transition of all other required functions, such that our business will continue its normal operations without interruption. We believe that the Internalization represents an important milestone for us and we anticipate that it will result in lower operating costs on an internalized basis compared to the externally managed model and will eliminate certain inherent conflicts particular to externally managed companies.
COVID-19 Pandemic
As of September 30, 2020,2021, the COVID-19 pandemic remains ongoing, and as a result, numerous countries, includingongoing. Since the United States, have declared national emergencies and have reacted by instituting quarantines, restrictions on travel and temporarily closing non-essential businesses, including offices and hotels. Many states and local jurisdictionsbeginning of 2020, the pandemic has significantly impacted the global economy, created disruptions in the U.S. instituted varying degreesglobal supply chain, increased rates of “shelter-in-place” guidelines or ordersunemployment and other measures designed to mitigate the impact of COVID-19. Such actions have resulted in significant macroeconomic disruptions and have adversely impacted many industries. In response,industries, including those related to the real estate collateral underlying certain of our loans. So far in 2021, the global and U.S. governmenteconomic activity has, implemented unprecedented actions, suchto varying degrees, begun to improve, as wider distribution of the COVID-19 vaccines has continued. As a result, macroeconomic forecasts have improved over the last few quarters, including expectations for unemployment rates and overall economic stimulus and interest rate cuts. However,output. Nonetheless, the ongoing pandemic may continue to adversely impact the macroeconomic recovery, particularly with respect to the emergence of new variants of the COVID-19 virus, the continued distribution and market conditions, resulting in a periodacceptance of global economic slowdown.the vaccines and the effectiveness of such vaccines against new variants of the COVID-19 virus. The rapidly evolving and fluid nature of this situation precludes any predictioncertainty as to the ultimate adverse impact of the COVID-19 pandemic on economic and market conditions, and, as a result, present material uncertainty and risk with respect to us and the performance of our investments.
We continue to monitor the COVID-19 pandemic and its impact on our operating partners, financing sources, borrowers and their tenants and the economy as a whole. The magnitude and duration of the COVID-19 pandemic, and its ultimate impact on our operations, liquidity and availability of financing, remain uncertain, as it continues to evolve. To the extent that our borrowers and their tenants, property sponsors and financing sources continue to be impacted by the COVID-19 pandemic, it could have a material adverse effect on our liquidity and capital resources.
The full extent of the impact and effects of COVID-19 will depend on future developments, including, among other factors, the duration, severity and spread of the outbreak, along with the related travel advisories, quarantines and restrictions, the recovery time of the disrupted supply chains and industries, the impact of labor market interruptions, the impact of government interventions and uncertainty with respect to the duration of the global economic slowdown. For additional discussion with respect to the potential impact of the COVID-19 pandemic on our liquidity and capital resources, see Liquidity and Capital Resourcesbelow.
Forward-Looking Statements
This Quarterly Report on Form 10-Q contains, or incorporates by reference, not only historical information, but also forward-looking statements within the meaning of Section 27A of the Securities Act of 1933, as amended, or the Securities Act, and Section 21E of the Exchange Act of 1934, as amended, or the Exchange Act, and that are subject to the safe harbors created by such sections. Forward-looking statements involve numerous risks and uncertainties. Our actual results may differ from our beliefs, expectations, estimates and projections and, consequently, you should not rely on these forward-looking statements as predictions of future events. Forward-looking statements are not historical in nature and can be identified by words such as “anticipate,” “estimate,” “will,” “should,” “expect,” “target,” “believe,” “intend,” “seek,” “plan,” “goals,” “future,” “likely,” “may” and similar expressions or their negative forms, or by references to strategy, plans or intentions. By their nature, forward-looking statements speak only as of the date they are made, are not statements of historical fact or guarantees of future performance and are subject to risks, uncertainties, assumptions or changes in circumstances that are difficult to predict or quantify, in particular those relating to the COVID-19 pandemic, including the ultimate impact of the COVID-19 pandemic on our business, financial performance and operating results. Our expectations, beliefs and estimates are expressed in good faith and we believe there is a reasonable basis for them. However, there can be no assurance that management's expectations, beliefs and estimates will resultprove to be correct or be achieved and actual results may vary materially from what is expressed in or indicated by the forward-looking statements.
These forward-looking statements are subject to risks and uncertainties, including, among other things, those described in this Quarterly Report on Form 10-Q and our Annual Report on Form 10-K for the year ended December 31, 2019,2020, under the caption “Risk Factors.” These risks may also be further heightened by the continued and evolving impact of the COVID-19 pandemic. Other risks, uncertainties and factors that could cause actual results to differ materially from those projected are described below and may be described from time to time in reports we file with the SEC, including our Quarterly Reports on Form 10-Q and Current Reports on Form 8-K. Forward-looking statements speak only as of the date they are made, and we undertake no obligation to update or revise any such forward-looking statements, whether as a result of new information, future events or otherwise. Important factors among others, that may affect our actual results include:
•our ability to successfully manage the pending transition to internalized management;include, among others:
•the severity and duration of the ongoing COVID-19 pandemic;
•potential risks and uncertainties relating to the ultimate geographic spread of COVID-19;COVID-19, including new variants;
•actions taken by governmental authorities and businesses to contain the COVID-19 outbreakpandemic or to mitigate its impact;
•the negative impacts of the COVID-19 pandemic on the U.S. and global economy,economies, including the sudden severe rise in unemployment rate, and the impacts of COVID-19 pandemic on our financial condition, business operations and value of our assets, as well as the financial condition and operations of our borrowers;
•the general political, economic and competitive conditions in the markets in which we invest;
•defaults by borrowers in paying debt service on outstanding indebtedness and borrowers'borrowers’ abilities to manage and stabilize properties;
•our ability to obtain or maintain financing arrangements on terms favorable to us or at all, particularly in light of the current disruption in the financial markets;all;
•the level and volatility of prevailing interest rates and credit spreads;
•reductions in the yield on our investments and increases in the cost of our financing;
•general volatility of the securities markets in which we participate and the potential need to post additional collateral on our financing arrangements;
•the return or impact of current or future investments;
•changes in our business, investment strategies or target investments;
•allocation of investment opportunities to us by our Manager;
•increased competition from entities investing in our target investments;
•effects of hedging instruments on our target investments;
•changes in governmental regulations, tax law and rates and similar matters;
•our ability to maintain our qualification as a REIT for U.S. federal income tax purposes and our exclusion from registration under the Investment Company Act;
•availability of desirable investment opportunities;
•availability of qualified personnel;
•our relationship with our Manager, until the consummation of the Internalization;
•estimates relating to our ability to make distributions to our stockholders in the future;
•acts of God, such as hurricanes, earthquakes and other natural disasters, acts of war and/or terrorism, pandemics, such as COVID-19, and other events that may cause unanticipated and uninsured performance declines and/or losses to us or the owners and operators of the real estate securing our investments;
•deterioration in the performance of the properties securing our investments that may cause deterioration in the performance of our investments and, potentially, principal losses to us, including the risk of impairmentcredit loss charges and any impact on our ability to satisfy the covenants and conditions in our debt agreements; and
•difficulty or delays in redeploying the proceeds from repayments of our existing investments.
This Quarterly Report on Form 10-Q may contain statistics and other data that, in some cases, have been obtained or compiled from information made available by mortgage loan servicers and other third-party service providers.
Third Quarter 2021 Activity
Operating Results:
•GAAP net income of $18.6 million, or $0.34 per basic share, reflecting a release of CECL reserves of $5.8 million.
•Distributable Earnings of $5.1 million, or $0.09 per basic share, which excludes the $5.8 million release of the CECL reserve, $2.0 million expense related to the amortization of non-cash equity compensation and includes the $9.7 million realized loss on a loan held-for-investment, as further described below.
•Book value per share of common stock of $17.33 inclusive of $(0.88) per share of common stock of total CECL reserve.
•Declared a regular quarterly common stock dividend of $13.7 million, or $0.25 per share of common stock.
Portfolio Activity:
•Originated eight loans with a total commitment of $311.7 million and a total principal balance of $289.3 million.
•Funded $35.2 million of principal balance on prior loan commitments.
•Received loan repayments and principal amortization of $290.5 million.
•Maintained a portfolio of 100 loan investments with a weighted-average stabilized loan to value ratio, or LTV, at origination of 63.3%, and a weighted-average all-in yield at origination of L+4.11%.
•Collected 100% of contractual interest payments during the third quarter of 2021, inclusive of loan modifications and two loans on nonaccrual status. Deferred, and added to the principal, $1.1 million of interest income related to certain loans that had been modified in prior periods.
Financing Activity:
•Repurchased through open market transactions 1,000,721 shares of common stock at a weighted average price of $13.49 per share for an aggregate cost of $13.5 million.
•Settled part of the outstanding warrants to purchase approximately 1.06 million shares of common stock at an exercise price of $6.47 per share of common stock for a net cash amount of approximately $7.5 million.
Key Financial Measures and Indicators
As a commercial real estate finance company, we believe the key financial measures and indicators for our business are earnings per share on a U.S. generally accepted accounting principles, or GAAP, basis, dividends declared, per share, CoreDistributable Earnings per common share and book value per share.share of common stock. For the three months ended September 30, 2020,2021, we recorded a net lossearnings per basic share of ($0.45),$0.34, declared a decrease of $0.42 per share from the three months ended June 30, 2020, primarily due to the restructuring costs associated with the internalization of our management function and a realized loss on the sale of certain loans partially offset by the reduction in allowance for credit losses in the third quarter of 2020. For the three months ended September 30, 2020, we declared aregular quarterly cash dividend of $0.20$0.25 per share of common stock which was paid on October 19, 2020. Coreand reported Distributable Earnings of $0.09 per common share was $0.27 for the three months endedbasic share. Our book value as of September 30, 2020, an increase2021 was $17.33 per share of $0.02 from the three months ended June 30, 2020. common stock, inclusive of $(0.88) of total Current Expected Credit Loss, or CECL, reserve.
As further described below, CoreDistributable Earnings is a measure that is not prepared in accordance with GAAP. We use CoreDistributable Earnings to evaluate our performance, excluding the effects of certain transactions and GAAP adjustments that we believe are not necessarily indicative of our current loan activityportfolio and operations.
Our book value per common share as of September 30, 2020 was $16.93, In addition, Distributable Earnings is a ($0.54) decrease fromperformance metric we consider, along with other measures, when declaring our book value per common share as of June 30, 2020, primarily due to the GAAP net loss resulting from the restructuring costs associated with the internalization of our management function, our declaration of the third quarter dividend of $0.20 per share of common stock and debt issuance costs incurred in connection with entering into our term loan facilities. Book value per share includes the issuance of $4.5 million of common stock warrants in connection with our borrowings under the term loan facilities as described in Note 12 - Senior Secured Term Loan Facilities and Warrants to Purchase Shares of Common Stock of the notes to our condensed consolidated financial statements included in this Quarterly Report on Form 10-Q.dividends.
Earnings Per Share and Dividends Declared Per Common Share
The following table sets forth the calculation of basic and diluted earnings per share and dividends declared per share:
| | | | | | | | | | | | | | | |
| Three Month Ended | | | | |
| September 30, | | June 30, |
| (in thousands) | 2020 | | | | 2020 | | | | |
| Net Loss | $ | (24,691) | | | | | $ | (1,758) | | | | | |
| Weighted average number of common shares outstanding | 55,205,082 | | | | | 55,158,283 | | | | | |
| Basic and Diluted Loss per Common Share | $ | (0.45) | | | | | $ | (0.03) | | | | | |
| Dividend Declared per Common Share | $ | 0.20 | | | | | $ | — | | | | | |
| | | | | | | | | | | | | | | | | | | | | | | |
| Three Months Ended | | Nine Months Ended |
| September 30, | | September 30, |
| (in thousands) | 2021 | | 2020 | | 2021 | | 2020 |
| Net income (loss) | $ | 18,630 | | | $ | (24,666) | | | $ | 60,890 | | | $ | (63,590) | |
| Weighted average number of common shares outstanding | 54,453,546 | | | 55,205,082 | | | 54,864,456 | | | 55,140,163 | |
| Basic earnings per basic common share | $ | 0.34 | | | $ | (0.45) | | | $ | 1.11 | | | $ | (1.15) | |
| Diluted earnings per basic common share | $ | 0.33 | | | $ | (0.45) | | | $ | 1.05 | | | $ | (1.15) | |
| Dividend declared per common share | $ | 0.25 | | | $ | 0.20 | | | $ | 0.75 | | | $ | 0.20 | |
Distributable Earnings
Beginning with our Annual Report on Form 10-K for the year ended December 31, 2020, and for all subsequent reporting periods ending on or after December 31, 2020, we have elected to present Distributable Earnings, a measure that is not prepared in accordance with GAAP, as a supplemental method of evaluating our operating performance. Distributable Earnings replaces our prior presentation of Core Earnings with no changes to the definition. In order to maintain our status as a REIT, we are required to distribute at least 90% of our taxable income as dividends. Distributable Earnings is intended to serve as a general proxy for our taxable income, though it is not a perfect substitute for it, and, as such, is considered a key indicator of our ability to generate sufficient income to pay our common dividends and in determining the amount of such dividends, which is the primary focus of income-oriented investors who comprise a meaningful segment of our stockholder base. We believe providing Distributable Earnings on a supplemental basis to our net income (loss) and cash flow from operating activities, as determined in accordance with GAAP, is helpful to stockholders in assessing the overall performance of our business.
We use CoreDistributable Earnings to evaluate our performance, excluding the effects of certain transactions and GAAP adjustments we believe are not necessarily indicative of our current loan activityportfolio and operations. Core Earnings is a measure that is not prepared in accordance with GAAP. For reporting purposes, we define CoreDistributable Earnings as net income (loss) attributable to our stockholders, computed in accordance with GAAP, excludingexcluding: (i) non-cash equity compensation expense,expenses; (ii) depreciation and amortization,amortization; (iii) any unrealized gains (losses) or other similar non-cash items that are included in net income for the applicable reporting period (regardless of whether such items are included in other comprehensive income or loss(loss) or in net income for such period); and (iv) certain non-cash items and
one-time expenses. CoreDistributable Earnings may also be adjusted from time to time for reporting purposes to exclude one-time events pursuant to changes in GAAP and certain other material non-cash income or expense items approved by a majority of our independent directors. The exclusion of depreciation and amortization from the calculation of CoreDistributable Earnings only applies to debt investments related to real estate to the extent we foreclose upon the property or properties underlying such debt investments.
We believe providing CoreWhile Distributable Earnings excludes the impact of the unrealized non-cash current provision for credit losses, we expect to only recognize such potential credit losses in Distributable Earnings if and when such amounts are deemed non-recoverable. This is generally at the time a loan is repaid, or in the case of foreclosure, when the underlying asset is sold, but non-recoverability may also be concluded if, in our determination, it is nearly certain that all amounts due will not be collected. The realized loss amount reflected in Distributable Earnings will equal the difference between the cash received, or expected to be received, and the carrying value of the asset, and is reflective of our economic experience as it relates to the ultimate realization of the loan. During the nine months ended September 30, 2021, we recorded a $15.1 million benefit from provision for credit losses, which has been excluded from Distributable Earnings consistent with other unrealized gains (losses) and other non-cash items pursuant to our existing policy for reporting Distributable Earnings referenced above. During the nine months ended September 30, 2021, we recorded a $9.7 million realized loss on a supplemental basisloan held-for-investment, which has been included in Distributable Earnings, consistent with not collecting all amounts due at the time a loan was repaid pursuant to our net income (loss) and cash flow from operating activities as determined in accordance with GAAP is helpful to stockholders in assessing the overall performance of ourexisting policy for reporting Distributable Earnings referenced above.
business. Although the Management Agreement requires us to calculate the incentive and base management fees due to our Manager using Core Earnings before our incentive fee expense, we report Core Earnings after our incentive fee expense because we believe the latter is a more meaningful presentation of the economic performance of our common stock.
CoreDistributable Earnings does not represent net income (loss) or cash flow from operating activities and should not be considered as an alternative to GAAP net income (loss), or an indication of our GAAP cash flows from operations, a measure of our liquidity, or an indication of funds available for our cash needs. In addition, our methodology for calculating CoreDistributable Earnings may differ from the methodologies employed by other companies to calculate the same or similar supplemental performance measures, and, accordingly, our reported CoreDistributable Earnings may not be comparable to the CoreDistributable Earnings reported by other companies.
The following tables providetable provides a reconciliation of GAAP net income (loss) income attributable to common stockholders to CoreDistributable Earnings (in thousands, except share and per share data):
| | | | | | | | | | | | | | | |
| Three Month Ended | | | | |
| September 30, | | June 30, |
| (in thousands) | 2020 | | | | 2020 | | | | |
| Net Loss Attributable to Common Stockholders | $ | (24,691) | | | | | $ | (1,758) | | | | | |
| Adjustments: | | | | | | | | | |
| Provision for credit losses | (5,300) | | | | | 14,205 | | | | | |
| Restructuring charges | 43,682 | | | | | — | | | | | |
| Non-cash equity compensation expense | 1,316 | | | | | 1,323 | | | | | |
| Core Earnings | $ | 15,007 | | | | | $ | 13,770 | | | | | |
| Weighted average shares outstanding basic and diluted | 55,205,082 | | | | | 55,158,283 | | | | | |
| Core Earnings per share, basic and diluted | $ | 0.27 | | | | | $ | 0.25 | | | | | |
| | | | | | | | | | | | | | | | | | | | |
| Three Months Ended | Nine Months Ended |
| September 30, | September 30, |
| (in thousands) | 2021 | | 2020 | 2021 | | 2020 |
| Reconciliation of GAAP net income to Distributable Earnings: | (unaudited) | (unaudited) |
| GAAP net income (loss) attributable to common stockholders | $ | 18,605 | | | $ | (24,691) | | $ | 60,815 | | | $ | (63,665) | |
| Adjustments for non-distributable earnings: | | | | | | |
| (Benefit from) provision for credit losses | (5,760) | | | (5,300) | | (15,072) | | | 62,240 | |
| Write-off of loan held-for-investment | (9,740) | | | — | | (9,740) | | | — | |
| Restructuring charges | — | | | 43,682 | | — | | | 43,682 | |
| Non-cash equity compensation | 2,032 | | | 1,316 | | 5,558 | | | 3,994 | |
| Distributable Earnings | $ | 5,137 | | | $ | 15,007 | | $ | 41,561 | | | $ | 46,251 | |
| Distributable Earnings per basic share of common stock | $ | 0.09 | | | $ | 0.27 | | $ | 0.76 | | | $ | 0.84 | |
| Basic weighted average common shares - Distributable Earnings | 54,453,546 | | | 55,205,082 | | 54,864,456 | | | 55,140,163 | |
The presentation for the comparative period has been reorganized to conform with the 2020 presentation of Distributable Earnings. This reorganization has no impact on Distributable Earnings.
Book Value Per Common Share
The following table provides the calculation of our book value per share:share of common stock:
| | | | | | | | | | | | | | | |
| Three Month Ended | | | | |
| September 30, | | June 30, |
| (in thousands) | 2020 | | | | 2020 | | | | |
| Stockholder's Equity | $ | 934,462 | | | | | $ | 964,336 | | | | | |
| Shares: | | | | | | | | | |
| Common Stock | 55,205,082 | | | | | 55,205,082 | | | | | |
| Deferred Stock Units | — | | | | | — | | | | | |
| Total Outstanding | 55,205,082 | | | | | 55,205,082 | | | | | |
| Book Value Per Share | $ | 16.93 | | | | | $ | 17.47 | | | | | |
| | | | | | | | | | | | | | |
| (in thousands) | | | | September 30, 2021 | | December 31, 2020 |
| Stockholders’ equity | | | | $ | 932,109 | | | $ | 934,846 | |
| Preferred stock | | | | (1,000) | | | (1,000) | |
| Common stockholders’ equity | | | | $ | 931,109 | | | $ | 933,846 | |
| Shares: | | | | | | |
| Common stock | | | | 53,254,803 | | | 54,635,547 | |
| Restricted stock | | | | 264,662 | | | 569,535 | |
| Total outstanding | | | | 53,789,465 | | | 55,205,082 | |
| Book value per share of common stock | | | | $ | 17.33 | | | $ | 16.92 | |
Book value per share as of September 30, 20202021 includes the impact of an estimated allowance for credit losses of $80.7$47.4 million, or $1.46$0.88 per common share. See Note 2 –Basis of Presentation and Significant Accounting Policiesof the notes to our condensed consolidated financial statements included in this Quarterly Report on Form 10-Q for a detailed discussion of allowance for credit losses.
Third Quarter 2020 Activity
Operating Results:Portfolio Overview
•Generated GAAP net lossOur business model is mainly focused on directly originating, investing in and managing senior floating-rate commercial mortgage loans and other debt and debt-like commercial real estate investments. As a result of ($24.7)this strategy, our operating performance is subject to overall market demand for commercial real estate loan products and other debt and debt-like commercial real estate investments. We place emphasis on diversifying our investment portfolio across geographical regions and local markets, property types, borrowers and loan structures. We do not limit our loan originations by geographical area or property type so that we may develop a well-diversified investment portfolio.
The Company’s interest-earning assets include its 100% loan investment portfolio. At September 30, 2021, our portfolio was comprised of 100 loans, of which 98 were senior first mortgage loans totaling $4.1 billion of commitments with an unpaid principal balance of $3.7 billion, and two were subordinated loans totaling $15.5 million in commitments and unpaid principal balance. During the three months ended September 30, 2021, we collected 100% of the contractual interest payments that were due under our loan agreements, after taking into consideration certain loans that have been modified mainly due to the impact of the COVID-19 pandemic and two loans on nonaccrual status. In connection with the loan modifications, the total amount of interest income that was deferred and added to the principal during the three months ended September 30, 2021 was $1.1 million, or ($0.45) per share2.3% of our interest income recognized during the period. The interest income deferred and added to the principal balance during the three months ended September 30, 2021 was related to loan modifications entered into in prior quarters. At September 30, 2021, the weighted average risk rating of our loan portfolio was 2.6, weighted by total unpaid principal balance, as compared to 2.8 at June 30, 2021.
During the three months ended September 30, 2021, we originated eight loans with a total unpaid principal balance of $289.3 million and total loan commitments of $311.7 million. Other loan fundings included $35.2 million of additional fundings made under existing loan commitments. Proceeds from loan repayments and principal amortization during the three months ended September 30, 2021 totaled $290.5 million. We generated interest income of $48.4 million and incurred interest expense of $26.3 million, which resulted in net interest income of $22.1 million. See Note 3 - Loans Held-for-Investment, Net of Allowance for Credit Losses to our condensed consolidated financial statements included in this Quarterly Report on Form 10-Q for details.
The following table details our loan activity by unpaid principal balance for the three months ended September 30, 2020, primarily driven by the one-time restructuring costs associated with the Internalization2021 and a realized loss on the sale of certain loans.2020: | | | | | | | | | | | |
| Three Months Ended |
| September 30, |
| (in thousands) | 2021 | | 2020 |
| Loan originations | $ | 289,345 | | | $ | — | |
Other loan fundings (1) | 35,175 | | | 54,464 | |
| Deferred interest capitalized | 1,077 | | | 3,153 | |
| | | |
| Loan repayments | (290,497) | | | (400,646) | |
| Loan write-offs | (9,740) | | | — | |
| | | |
| Total loan activity, net | $ | 25,360 | | | $ | (343,029) | |
___________________ •Core Earnings for the three months ended September 30, 2020 was $15.0 million, or $0.27 per share, compared to $13.8 million, or $0.25 per share for the three months ended June 30, 2020.
•Recorded a reduction in allowance for credit losses of $5.3 million driven by changes in the composition of our portfolio related to(1) Additional fundings made under existing loan repayments and select loan sales.
•Declared a common dividend of $11.1 million, or $0.20 per share of common stock.commitments.
The following table details overall statistics for our investment portfolio as of September 30, 2021:
| | | | | |
| Portfolio Summary |
| Number of loans | 100 | |
| Total loan commitments | $ | 4,102,958 | |
| Unpaid principal balance | $ | 3,672,853 | |
| Unfunded loan commitments | $ | 430,105 | |
| Carrying value | $ | 3,614,211 | |
| Weighted-average cash coupon | L+3.48% |
| Weighted-average all-in yield | L+4.11% |
| |
| Stabilized LTV at origination | 63.3 | % |
The following table provides detail of our portfolio as of September 30, 2021:
| | | | | | | | | | | | | | | | | | | | | | | | | | | | | | | | | | | | | | | | | | | | | | | | | | | | | | | | | | | | | | | | | | | | |
| (dollars in millions) | | | | | | | | | | | | | | | | | | | | |
Type (1) | | Origination/ Acquisition Date | | Maximum Loan Commitment | | Principal Balance | | Carrying Value | | Cash Coupon (2) | | All-in Yield at Origination (3) | | Original Term (Years) (4) | | State | | Property Type | | Initial LTV (5) | | Stabilized LTV (6) |
| Senior | | 12/15 | | $120.0 | | $120.0 | | $119.6 | | L+4.15% | | L+4.43% | | 4.0 | | LA | | Mixed-Use | | 65.5% | | 60.0% |
| Senior | | 10/19 | | 120.0 | | 93.0 | | 92.2 | | L+3.24% | | L+3.86% | | 3.0 | | CA | | Office | | 63.9% | | 61.1% |
| Senior | | 07/18 | | 114.1 | | 114.1 | | 99.5 | | L+3.34% | | L+4.27% | | 2.0 | | CA | | Retail | | 50.7% | | 55.9% |
| Senior | | 12/19 | | 101.6 | | 91.0 | | 90.1 | | L+2.75% | | L+3.23% | | 3.0 | | IL | | Multifamily | | 76.5% | | 73.0% |
| Senior | | 08/19 | | 100.3 | | 91.3 | | 90.4 | | L+2.80% | | L+3.26% | | 3.0 | | MN | | Office | | 73.1% | | 71.2% |
| Senior | | 12/18 | | 96.5 | | 74.6 | | 73.8 | | L+3.75% | | L+5.21% | | 3.0 | | NY | | Mixed-Use | | 26.2% | | 47.6% |
| Senior | | 07/19 | | 94.0 | | 80.2 | | 79.5 | | L+3.69% | | L+4.32% | | 3.0 | | IL | | Office | | 70.0% | | 64.4% |
| Senior | | 10/19 | | 87.8 | | 72.2 | | 71.4 | | L+2.55% | | L+3.05% | | 3.0 | | TN | | Office | | 70.2% | | 74.2% |
| Senior | | 01/20 | | 81.9 | | 59.7 | | 59.2 | | L+3.25% | | L+3.93% | | 3.0 | | CO | | Industrial | | 47.2% | | 47.5% |
| Senior | | 06/19 | | 81.7 | | 81.4 | | 80.6 | | L+2.69% | | L+3.05% | | 3.0 | | TX | | Mixed-Use | | 71.7% | | 72.2% |
| Senior | | 09/19 | | 77.0 | | 77.0 | | 76.8 | | L+3.07% | | L+3.58% | | 3.0 | | NY | | Multifamily | | 62.7% | | 67.1% |
| Senior | | 10/19 | | 76.9 | | 76.9 | | 76.2 | | L+3.36% | | L+3.73% | | 3.0 | | FL | | Mixed-Use | | 67.7% | | 62.9% |
| Senior | | 11/17 | | 75.3 | | 75.3 | | 75.0 | | L+4.45% | | L+5.20% | | 3.0 | | TX | | Hotel | | 68.2% | | 61.6% |
| Senior | | 10/17 | | 74.8 | | 54.0 | | 45.9 | | L+4.07% | | L+4.47% | | 4.0 | | DC | | Office | | 67.0% | | 66.0% |
| Senior | | 12/16 | | 71.8 | | 68.2 | | 68.0 | | L+3.75% | | L+4.87% | | 4.0 | | FL | | Office | | 73.3% | | 63.2% |
| Senior | | 12/19 | | 65.2 | | 50.2 | | 49.7 | | L+2.80% | | L+3.28% | | 3.0 | | NY | | Office | | 68.8% | | 59.3% |
| Senior | | 07/21 | | 63.3 | | 60.5 | | 59.6 | | L+3.00% | | L+3.39% | | 3.0 | | LA | | Multifamily | | 68.8% | | 68.6% |
| Senior | | 09/19 | | 60.2 | | 60.2 | | 60.1 | | L+3.00% | | L+3.63% | | 2.0 | | TX | | Office | | 64.7% | | 59.0% |
| Senior | | 12/18 | | 60.1 | | 55.9 | | 55.8 | | L+2.90% | | L+3.44% | | 3.0 | | TX | | Office | | 68.5% | | 66.7% |
| Senior | | 06/19 | | 54.1 | | 50.9 | | 50.7 | | L+3.30% | | L+3.70% | | 3.0 | | VA | | Office | | 49.3% | | 49.9% |
| Senior | | 06/21 | | 52.7 | | 46.6 | | 45.9 | | L+4.32% | | L+4.75% | | 3.0 | | GA | | Office | | 68.0% | | 69.4% |
| Senior | | 12/15 | | 52.0 | | 52.0 | | 51.9 | | L+3.73% | | L+4.87% | | 4.0 | | PA | | Office | | 74.5% | | 67.5% |
| Senior | | 09/21 | | 51.7 | | 45.3 | | 44.5 | | L+5.00% | | L+5.12% | | 3.0 | | MN | | Hotel | | 68.4% | | 57.8% |
| Senior | | 05/17 | | 51.4 | | 51.4 | | 48.4 | | L+4.70% | | L+5.50% | | 3.0 | | HI | | Hotel | | 60.8% | | 59.4% |
| Senior | | 02/20 | | 50.5 | | 44.7 | | 44.1 | | L+3.30% | | L+3.75% | | 3.0 | | TN | | Hotel | | 69.1% | | 54.2% |
| Senior | | 09/18 | | 50.1 | | 35.9 | | 35.7 | | L+3.25% | | L+4.13% | | 3.0 | | IL | | Office | | 47.9% | | 56.1% |
| Senior | | 08/19 | | 46.4 | | 41.8 | | 41.4 | | L+2.84% | | L+3.39% | | 3.0 | | GA | | Office | | 69.5% | | 68.3% |
| Senior | | 07/21 | | 46.4 | | 45.4 | | 44.7 | | L+3.69% | | L+4.19% | | 3.0 | | CT | | Office | | 68.3% | | 63.5% |
| Senior | | 07/16 | | 46.0 | | 37.4 | | 37.4 | | L+2.93% | | L+4.99% | | 4.0 | | VA | | Office | | 62.8% | | 61.5% |
| Senior | | 06/18 | | 46.0 | | 46.0 | | 45.8 | | L+3.60% | | L+4.06% | | 3.0 | | WY | | Hotel | | 67.4% | | 62.3% |
| Senior | | 08/21 | | 45.8 | | 45.4 | | 44.9 | | L+3.16% | | L+3.53% | | 3.0 | | TX | | Multifamily | | 77.8% | | 75.2% |
| Senior | | 08/18 | | 45.7 | | 44.9 | | 44.8 | | L+3.13% | | L+3.32% | | 3.0 | | TX | | Multifamily | | 68.9% | | 63.6% |
| Senior | | 09/21 | | 44.3 | | 37.4 | | 36.8 | | L+3.30% | | L+3.72% | | 3.0 | | CA | | Office | | 62.4% | | 66.1% |
| Senior | | 05/19 | | 44.1 | | 41.9 | | 41.5 | | L+3.20% | | L+3.60% | | 3.0 | | NY | | Mixed-Use | | 59.7% | | 55.1% |
| Senior | | 12/17 | | 42.9 | | 39.9 | | 39.9 | | L+4.38% | | L+5.26% | | 3.0 | | MA | | Mixed-Use | | 72.9% | | 62.0% |
| Senior | | 08/17 | | 41.9 | | 41.9 | | 41.5 | | L+4.24% | | L+4.40% | | 3.0 | | KY | | Multifamily | | 79.8% | | 73.1% |
| Senior | | 05/21 | | 38.9 | | 24.2 | | 23.7 | | L+3.28% | | L+3.83% | | 3.0 | | AL | | Multifamily | | 72.2% | | 64.8% |
| Senior | | 05/18 | | 38.8 | | 34.8 | | 34.7 | | L+3.18% | | L+3.95% | | 3.0 | | MA | | Office | | 47.0% | | 41.1% |
| Senior | | 07/19 | | 38.2 | | 36.2 | | 36.0 | | L+3.70% | | L+4.43% | | 3.0 | | NJ | | Hotel | | 47.8% | | 54.6% |
| Senior | | 11/18 | | 37.1 | | 34.4 | | 34.4 | | L+3.60% | | L+5.50% | | 3.0 | | CA | | Mixed-Use | | 69.9% | | 67.9% |
| Senior | | 10/18 | | 36.8 | | 30.3 | | 30.3 | | L+2.85% | | L+3.45% | | 3.0 | | NY | | Industrial | | 71.2% | | 70.8% |
| Senior | | 03/20 | | 34.9 | | 14.4 | | 14.2 | | L+3.42% | | L+4.66% | | 3.0 | | GA | | Office | | 63.2% | | 64.6% |
| | | | | | | | | | | | | | | | | | | | | | | | | | | | | | | | | | | | | | | | | | | | | | | | | | | | | | | | | | | | | | | | | | | | |
| Senior | | 05/17 | | 34.8 | | 31.1 | | 31.1 | | L+5.35% | | L+5.97% | | 3.0 | | TX | | Office | | 68.7% | | 65.1% |
| Senior | | 10/19 | | 34.4 | | 24.9 | | 24.8 | | L+2.75% | | L+3.28% | | 3.0 | | CA | | Office | | 70.6% | | 67.8% |
| Senior | | 12/18 | | 34.2 | | 30.8 | | 29.1 | | L+2.92% | | L+3.27% | | 4.0 | | IL | | Multifamily | | 70.8% | | 62.1% |
| Senior | | 05/17 | | 33.8 | | 29.8 | | 29.7 | | L+4.40% | | L+5.36% | | 3.0 | | AZ | | Office | | 69.5% | | 59.0% |
| Senior | | 10/19 | | 33.7 | | 26.0 | | 25.9 | | L+3.15% | | L+3.75% | | 3.0 | | CA | | Office | | 70.6% | | 64.2% |
| Senior | | 03/16 | | 33.6 | | 33.6 | | 33.4 | | 5.11% | | 5.26% | | 10.0 | | NJ | | Office | | 74.9% | | 74.9% |
| Senior | | 03/20 | | 33.5 | | 27.3 | | 27.0 | | L+2.80% | | L+3.27% | | 3.0 | | CA | | Office | | 63.6% | | 66.7% |
| Senior | | 08/19 | | 33.5 | | 28.4 | | 28.2 | | L+2.90% | | L+3.38% | | 3.0 | | TX | | Multifamily | | 79.3% | | 72.5% |
| Senior | | 06/18 | | 33.4 | | 28.7 | | 28.5 | | L+4.07% | | L+4.75% | | 3.0 | | OH | | Hotel | | 70.6% | | 57.4% |
| Senior | | 11/19 | | 33.2 | | 31.8 | | 31.6 | | L+2.70% | | L+3.14% | | 3.0 | | NC | | Multifamily | | 80.0% | | 72.8% |
| Senior | | 03/19 | | 32.1 | | 27.9 | | 27.8 | | L+2.97% | | L+3.42% | | 3.0 | | NY | | Office | | 53.8% | | 48.5% |
| Senior | | 08/19 | | 32.0 | | 20.1 | | 20.0 | | L+3.32% | | L+5.27% | | 3.0 | | MA | | Office | | 76.5% | | 54.1% |
| Senior | | 08/19 | | 31.7 | | 31.2 | | 31.0 | | L+2.80% | | L+3.53% | | 3.0 | | LA | | Multifamily | | 74.1% | | 72.4% |
| Senior | | 11/19 | | 31.3 | | 31.1 | | 31.1 | | L+2.75% | | L+3.27% | | 2.0 | | IL | | Multifamily | | 72.7% | | 72.7% |
| Senior | | 05/18 | | 31.0 | | 30.5 | | 30.4 | | L+4.07% | | L+4.63% | | 3.0 | | NY | | Mixed-Use | | 57.0% | | 51.1% |
| Senior | | 05/17 | | 30.9 | | 29.4 | | 29.0 | | L+4.00% | | L+5.19% | | 4.0 | | FL | | Office | | 69.3% | | 68.5% |
| Senior | | 06/21 | | 30.5 | | 29.6 | | 29.1 | | L+3.22% | | L+3.58% | | 3.0 | | GA | | Multifamily | | 73.0% | | 65.8% |
| Senior | | 11/19 | | 27.7 | | 18.5 | | 18.3 | | L+3.18% | | L+3.64% | | 3.0 | | CA | | Office | | 61.7% | | 62.8% |
| Senior | | 01/19 | | 27.5 | | 26.9 | | 26.8 | | L+2.97% | | L+3.38% | | 3.0 | | TX | | Multifamily | | 64.9% | | 64.9% |
| Senior | | 12/18 | | 27.5 | | 27.5 | | 26.0 | | L+3.90% | | L+4.42% | | 3.0 | | MN | | Hotel | | 64.7% | | 57.7% |
| Senior | | 07/17 | | 27.3 | | 27.3 | | 27.1 | | L+4.10% | | L+4.58% | | 3.0 | | NY | | Multifamily | | 76.5% | | 76.5% |
| Senior | | 01/19 | | 27.0 | | 24.4 | | 24.3 | | L+2.90% | | L+3.44% | | 3.0 | | MA | | Office | | 71.2% | | 70.1% |
| Senior | | 06/17 | | 27.0 | | 24.0 | | 24.0 | | L+3.83% | | L+5.24% | | 3.0 | | CA | | Hotel | | 54.7% | | 48.6% |
| Senior | | 08/19 | | 26.8 | | 26.3 | | 26.0 | | L+3.15% | | L+3.67% | | 3.0 | | SC | | Multifamily | | 67.0% | | 58.7% |
| Senior | | 12/18 | | 26.1 | | 22.5 | | 22.4 | | L+2.95% | | L+3.43% | | 3.0 | | FL | | Office | | 61.9% | | 65.5% |
| Senior | | 01/18 | | 26.0 | | 26.0 | | 25.9 | | L+5.13% | | L+5.58% | | 3.0 | | AZ | | Hotel | | 65.8% | | 61.3% |
| Senior | | 12/18 | | 25.9 | | 23.5 | | 23.5 | | L+4.00% | | L+5.56% | | 3.0 | | PA | | Multifamily | | 70.1% | | 67.0% |
| Senior | | 10/15 | | 25.3 | | 25.3 | | 25.1 | | L+4.07% | | L+5.76% | | 3.0 | | MO | | Hotel | | 73.2% | | 57.8% |
| Senior | | 09/18 | | 25.1 | | 22.0 | | 21.4 | | L+3.87% | | L+4.42% | | 3.0 | | NY | | Mixed-Use | | 60.2% | | 59.3% |
| Senior | | 08/19 | | 25.0 | | 23.9 | | 23.7 | | L+2.66% | | L+3.07% | | 2.0 | | OK | | Multifamily | | 79.9% | | 74.2% |
| Senior | | 09/17 | | 24.8 | | 21.8 | | 21.6 | | L+4.90% | | L+5.52% | | 3.0 | | MA | | Hotel | | 67.3% | | 63.9% |
| Senior | | 09/21 | | 24.4 | | 22.5 | | 22.1 | | L+3.18% | | L+3.61% | | 3.0 | | CA | | Multifamily | | 71.9% | | 57.8% |
| Senior | | 07/19 | | 24.0 | | 19.0 | | 18.9 | | L+3.00% | | L+3.60% | | 3.0 | | OH | | Office | | 63.1% | | 66.1% |
| Senior | | 10/18 | | 23.7 | | 23.5 | | 23.3 | | L+4.21% | | L+5.16% | | 3.0 | | CT | | Hotel | | 75.4% | | 66.9% |
| Senior | | 05/21 | | 23.3 | | 14.8 | | 14.6 | | L+3.50% | | L+4.09% | | 3.0 | | LA | | Multifamily | | 68.0% | | 69.6% |
| Senior | | 07/19 | | 23.3 | | 20.0 | | 19.9 | | L+2.95% | | L+3.51% | | 3.0 | | CA | | Office | | 62.3% | | 62.6% |
| Senior | | 03/18 | | 23.0 | | 23.0 | | 23.0 | | L+4.05% | | L+4.65% | | 2.0 | | FL | | Office | | 60.8% | | 60.8% |
| Senior | | 06/18 | | 22.8 | | 17.6 | | 17.3 | | L+4.21% | | L+4.73% | | 3.0 | | FL | | Retail | | 74.0% | | 69.4% |
| Senior | | 04/18 | | 22.2 | | 22.2 | | 22.2 | | L+4.05% | | L+4.46% | | 3.0 | | KS | | Multifamily | | 72.1% | | 67.4% |
| Senior | | 06/19 | | 21.5 | | 21.5 | | 21.4 | | L+4.50% | | L+5.05% | | 3.0 | | NY | | Other | | 39.6% | | 39.6% |
| Senior | | 10/18 | | 21.5 | | 19.3 | | 19.0 | | L+3.24% | | L+3.69% | | 3.0 | | TX | | Office | | 73.0% | | 69.9% |
| Senior | | 07/21 | | 21.4 | | 18.9 | | 18.6 | | L+3.25% | | L+3.63% | | 3.0 | | GA | | Multifamily | | 77.0% | | 68.7% |
| Senior | | 03/19 | | 21.1 | | 20.8 | | 20.6 | | L+2.93% | | L+3.40% | | 3.0 | | KY | | Multifamily | | 69.8% | | 69.9% |
| Senior | | 06/19 | | 21.0 | | 19.9 | | 19.8 | | L+2.90% | | L+4.24% | | 3.0 | | GA | | Mixed-Use | | 60.6% | | 67.4% |
| Senior | | 04/21 | | 21.0 | | 19.8 | | 19.5 | | L+3.24% | | L+3.56% | | 3.0 | | NJ | | Multifamily | | 77.5% | | 74.2% |
| Senior | | 05/21 | | 20.6 | | 15.9 | | 15.8 | | L+3.99% | | L+4.41% | | 3.0 | | FL | | Multifamily | | 69.8% | | 62.8% |
| Senior | | 01/18 | | 19.3 | | 17.6 | | 17.6 | | L+4.77% | | L+5.50% | | 3.0 | | PA | | Mixed-Use | | 66.8% | | 67.3% |
| Senior | | 11/18 | | 18.9 | | 16.5 | | 16.4 | | L+3.20% | | L+3.83% | | 3.0 | | CA | | Office | | 73.1% | | 64.5% |
| Senior | | 04/18 | | 18.7 | | 18.7 | | 18.7 | | L+4.29% | | L+4.65% | | 3.0 | | NV | | Multifamily | | 78.7% | | 66.1% |
| Senior | | 01/19 | | 18.2 | | 18.2 | | 18.2 | | L+3.40% | | L+4.14% | | 3.0 | | TX | | Multifamily | | 72.2% | | 68.2% |
| Senior | | 08/17 | | 17.5 | | 14.5 | | 14.4 | | L+4.77% | | L+5.49% | | 3.0 | | PA | | Office | | 66.7% | | 67.3% |
| Senior | | 06/21 | | 16.7 | | 13.5 | | 13.2 | | L+3.35% | | L+3.82% | | 4.0 | | IN | | Multifamily | | 67.0% | | 66.4% |
| Senior | | 07/18 | | 16.0 | | 11.5 | | 11.4 | | L+3.75% | | L+4.35% | | 3.0 | | CA | | Office | | 77.1% | | 63.5% |
| Senior | | 06/19 | | 15.2 | | 11.6 | | 11.5 | | L+3.96% | | L+4.69% | | 3.0 | | NY | | Office | | 40.7% | | 60.0% |
| Senior | | 08/21 | | 14.5 | | 14.0 | | 13.9 | | L+3.65% | | L+3.88% | | 3.0 | | CO | | Office | | 72.0% | | 63.7% |
| Mezzanine | | 01/17 | | 14.0 | | 14.0 | | 10.8 | | 8.00% | | 8.11% | | 10.0 | | HI | | Hotel | | 41.4% | | 36.2% |
| Senior | | 09/19 | | 12.0 | | 11.8 | | 11.7 | | L+2.99% | | L+3.50% | | 3.0 | | WI | | Multifamily | | 51.4% | | 75.0% |
| Mezzanine | | 11/15 | | 1.4 | | 1.4 | | — | | 13.00% | | 12.50% | | 10.0 | | NY | | Hotel | | 68.3% | | 58.0% |
| Total/Weighted Average | | $4,103.0 | | $3,672.9 | | $3,614.2 | | L+3.48% | | L+4.11% | | 3.1 | | | | | | 66.0% | | 63.3% |
____________________
(1)“Senior” means a loan primarily secured by a first priority lien on commercial real property and related personal property and also includes, when applicable, any companion subordinate loans.
(2)Cash coupon does not include origination or exit fees. Weighted average cash coupon excludes fixed rate loans.
(3)Yield includes net origination fees and exit fees, but does not include future fundings, and is expressed as a monthly equivalent. Weighted average yield excludes fixed rate
loans.
(4)Original term (years) is the initial maturity date at origination and does not include any extension options and has not been updated to reflect any subsequent extensions or modifications, if applicable.
(5)Initial loan-to-value ratio, or initial LTV, is calculated as the initial loan amount (plus any financing that is pari passu with or senior to such loan) divided by the as is appraised value (as determined in conformance with the Uniform Standards of Professional Appraisal Practice, or USPAP) as of the date of the loan was originated set forth in the original appraisal.
(6)Stabilized loan-to-value ratio, or stabilized LTV, is calculated as the fully funded loan amount (plus any financing that is pari passu with or senior to such loan), including all contractually provided for future fundings, divided by the as stabilized value (as determined in conformance with USPAP) set forth in the original appraisal. As stabilized value may be based on certain assumptions, such as future construction completion, projected re-tenanting, payment of tenant improvement or leasing commissions allowances or free or abated rent periods, or increased tenant occupancies.
Most of our loans are structured with an initial maturity term, typically three years, and one or more (typically two) one-year extension options, which can be exercised by the borrower subject to meeting various extension conditions in accordance with the terms of the loan agreement. As part of our overall asset management strategy, we have in the past entered into, and may in the future enter into, loan modifications with some of our borrowers. These amendments may include, among other things, modifying or waiving certain performance or extension conditions as part of the overall agreement.
The following charts illustrate the diversification and composition of our portfolio based on types of properties securing our loan investments, geographic distribution, interest rate and investment type, as of September 30, 2021:
Portfolio Activity:Management and Credit Quality
We actively manage each loan investment from closing and initial funding through final repayment, and assess the risk of credit deterioration by quarterly evaluating the performance of the underlying collateral properties. We also evaluate the macroeconomic environment, prevailing real estate fundamentals and local property market dynamics. Typically, our loan documents allow us, among other things, to receive regular property, borrower and guarantor financial statements; approve annual budgets and major tenant leases; and enforce loan covenants and remedies. In addition, we work with Trimont Real Estate Advisors LLC, one of the leading commercial real estate loan servicers, who provides us with a fully-dedicated and experienced team to increase efficiency and leverage our internal resources in servicing and asset managing our loan investments. Our internal team retains authority on all asset management decisions.
We maintain strong relationships and an active asset management dialogue with our borrowers. We have utilized these relationships to address the impacts of the COVID-19 pandemic on our loans secured by properties experiencing business interruptions and pressure on operating cash flows, most significantly hotel and retail properties. As a result of the ongoing negative effects the pandemic has had on the economy, generally, the real estate market as a whole and specific properties, some of our borrowers have indicated to us that they will be unable to execute their business plans on the original timeline, have had to temporarily close their properties by order of local authorities, have had tenants whose businesses were closed, or have experienced adverse business consequences, and have requested temporary interest forbearance (mainly deferrals and, to a lesser extent, waivers), or other modifications of their loans including extensions of term and modifications or waivers of
certain extension conditions. We have been working closely with our borrowers to provide them with short-term relief to help manage through these market dislocations and business interruptions at their properties.
Our loan modifications typically include temporary reductions in the amount of cash interest collected, permit accrual of a portion of the interest due during the modification period to be repaid at a later date, permit the use of existing cash loan reserves to pay debt service due on our loans and other property-level expenses and/or modify or waive certain performance tests or covenants related to term extensions. Our loan modifications are often coupled with additional equity or other forms of credit support from the sponsors. The total amount of interest income that was deferred and added to the principal during the three months ended September 30, 2021 was $1.1 million as a result of loan modifications that were entered into prior to the three months ended September 30, 2021.
We are generally encouraged by our borrowers’ overall response to the impact of the COVID-19 pandemic on their properties. We continue to work with them to address the circumstances caused by the pandemic while seeking to protect the credit attributes of our portfolio. However, these efforts may not be successful in all cases, and we may experience payment delinquencies, defaults, foreclosures or losses. While we believe the principal amounts of our loans are generally adequately protected by the underlying value of the collateral properties, there is a risk that we will not realize the entire principal amount of certain of our loan investments.
In addition to ongoing asset management, we review our entire portfolio quarterly, assess the performance of each loan and assign it a risk rating on a scale between “1” and “5,” from least risk to greatest risk, respectively.Sold six loansSee Note 3 - Loans Held-for-Investment, Net of Allowance for Credit Losses to our consolidated financial statements included in this Form 10-Q for a discussion regarding our risk rating methodology we use for our portfolio.
The following table allocates the unpaid principal balance and the carrying value balances based on our internal risk ratings:
| | | | | | | | | | | | | | | | | | | | | | | | | | | | | | | | | | | | | | |
| (dollars in thousands) | | September 30,
2021 | | December 31,
2020 |
| Risk Rating | | Number of Loans | | Unpaid Principal Balance | | Carrying Value | | Number of Loans | | Unpaid Principal Balance | | Carrying Value |
| 1 | | 9 | | | $ | 281,201 | | | $ | 280,172 | | | 6 | | | $ | 183,369 | | | $ | 182,730 | |
| 2 | | 53 | | | 1,842,052 | | | 1,819,740 | | | 50 | | | 1,863,590 | | | 1,847,332 | |
| 3 | | 26 | | | 839,615 | | | 832,077 | | | 29 | | | 1,055,782 | | | 1,026,662 | |
| 4 | | 10 | | | 541,891 | | | 536,872 | | | 17 | | | 762,636 | | | 732,310 | |
| 5 | | 2 | | | 168,094 | | | 145,350 | | | 1 | | | 67,057 | | | 58,769 | |
| Total | | 100 | | | $ | 3,672,853 | | | $ | 3,614,211 | | | 103 | | | $ | 3,932,434 | | | $ | 3,847,803 | |
Other Portfolio Developments
During the three months ended September 30, 2021, we recorded a decrease of $15.5 million in the allowance for credit losses, which resulted in the overall CECL reserve of $47.4 million at September 30, 2021. The decrease in the allowance for credit losses reflects a write-off of a prior credit reserve related to a resolution of a collateral-dependent loan and the release of a $3.2 million credit reserve on unfunded commitments on a collateral-dependent asset and moderately improved expectations of macroeconomic conditions.
During the three months ended September 30, 2021, we resolved the nonaccrual status of a senior loan secured by a mixed-use office and retail property in New York City with an outstanding unpaid principal balance of $191.4$22.0 million. We received all interest that was previously due in the amount of approximately $1.6 million and had the borrower establish and fund additional reserves for $180.7debt service and operating expenses. Given these facts and our expectations for the loan performing in accordance with the terms of the loan agreement, the loan was reinstated to accrual status.
During the three months ended September 30, 2021, we resolved a senior loan that had an outstanding unpaid principal balance of $68.1 million resulting inand had been nonaccrual status. The resolution involved a loss oncoordinated sale of $10.0the collateral property, a Minneapolis, MN hotel, and our providing the new ownership group with a new $45.3 million senior floating rate loan supported by capital invested in the property by the new sponsor. As a result of these transactions, we realized a write-off of approximately $9.7 million.
•Funded $54.5 million in loan balances in connection with existing loan funding commitments.
•Received $209.2 million from principal repayments and amortization on loans and securities.
•
Portfolio Financing
As of 110 investmentsSeptember 30, 2021, our portfolio financing consisted of repurchase facilities collateralized by loans held-for-investment, securitized debt obligations collateralized by pools of loans held-for-investment issued in commercial real estate collateralized loan obligations transactions, or CRE CLOs, an asset-specific financing facility collateralized by loans held-for-investment and a term financing facility collateralized by loans held-for-investment. Our non-mark-to-market financing sources accounted for approximately 62.5% of portfolio loan-level financing as of September 30, 2020, consisting2021.
The following table details our portfolio financing as of 100%September 30, 2021 and December 31, 2020:
| | | | | | | | | | | |
| (in thousands) | September 30,
2021 | | December 31,
2020 |
| CRE CLOs | $ | 1,356,429 | | | $ | 927,128 | |
| Term financing facility | 127,867 | | | — | |
| Asset-specific financing facility | 44,752 | | | 123,091 | |
| Total non-mark-to-market financing | 1,529,048 | | | 1,050,219 | |
| Secured repurchase agreements | 916,758 | | | 1,708,875 | |
| Total portfolio financing | $ | 2,445,806 | | | $ | 2,759,094 | |
The following table summarizes assets at carrying values that served as collateral for the future payment obligations of the repurchase facilities, the asset-specific financing facility, the term financing facility and the CRE CLOs as of September 30, 2021 and December 31, 2020:
| | | | | | | | | | | |
| (in thousands) | September 30,
2021 | | December 31,
2020 |
| Loans held-for-investment | $ | 3,501,513 | | | $ | 3,814,460 | |
| | | |
| | | |
| | | |
| | | |
| | | |
| Total | $ | 3,501,513 | | | $ | 3,814,460 | |
Secured Repurchase Agreements
As of September 30, 2021, we had repurchase facilities in place with five counterparties (lenders) with aggregate outstanding borrowings of $0.9 billion, which financed a portion of our loans with a stabilizedheld-for-investment. As of September 30, 2021, the weighted average loan-to-value ratio of 63.6%borrowing rate on our repurchase facilities was 2.0%, the weighted average advance rate was 66.7%, and the term to maturity ranged from 271 days to approximately 1.8 years, with a weighted average all-inremaining maturities of 1.0 year.
The table below details our secured repurchase facilities as of September 30, 2021:
| | | | | | | | | | | | | | | | | | | | | | | | | | | | | | | |
| September 30, 2021 | | |
| (in thousands) | Maturity Date (1) | | Committed | | Amount Outstanding | | Unused Capacity | | Total Capacity | | |
| Repurchase facilities: | | | | | | | | | | | |
Morgan Stanley Bank (2) | June 28, 2022 | | No | | $ | 277,534 | | | $ | 222,466 | | | $ | 500,000 | | | |
Goldman Sachs Bank USA (3) | July 13, 2023 | | No | | $ | — | | | $ | 250,000 | | | $ | 250,000 | | | |
| JPMorgan Chase Bank | June 28, 2022 | | No | | $ | 155,214 | | | $ | 294,786 | | | $ | 450,000 | | | |
| Citibank | January 9, 2023 | | No | | $ | 412,274 | | | $ | 87,726 | | | $ | 500,000 | | | |
Wells Fargo Bank (4) | June 28, 2022 | | No | | $ | 71,736 | | | $ | 28,264 | | | $ | 100,000 | | | |
| | | | | | | | | | | |
| | | | | | | | | | | |
| | | | | | | | | | | |
| | | | | | | | | | | |
(1)The facilities are set to mature on the stated maturity date, unless extended pursuant to their terms.
(2)As of September 30, 2021, we retained an option to increase the maximum facility capacity amount up to $600 million, subject to customary terms and conditions.
(3)As of September 30, 2021, we retained an option to increase the maximum facility capacity amount up to $350 million, subject to customary terms and conditions.
(4)As of September 30, 2021, we retained an option to increase the maximum facility capacity amount up to $200 million, subject to customary terms and conditions.
Under our repurchase facilities, our counterparties may make margin calls because of a perceived decline in the value of our assets collateralizing the given secured financing arrangement due to a credit event, or under a limited number of our repurchase facilities or market events. To cover a margin call, we may transfer cash to such counterparty. At maturity, any cash on deposit as collateral is generally applied against the repurchase facility balance, thereby reducing the amount borrowed. Should the value of our assets suddenly decrease, significant margin calls on our repurchase facilities could result, causing an adverse change in our liquidity position.
Collateralized Loan Obligations
We have financed certain pools of our loans through CRE CLOs. At September 30, 2021, we had three CRE CLOs outstanding, GPMT 2021-FL3, GPMT 2019-FL2 and GPMT 2018-FL1, totaling $1.4 billion of outstanding borrowings, financing 55 of our existing first mortgage loan investments with an aggregate principal balance of $1.8 billion. The CRE CLOs provide us with an attractive cost of funds and finance 49.2% of our loan portfolio on a term-matched, non-recourse and non-mark-to-market basis.
The following table details our CRE CLO securitized debt obligations:
| | | | | | | | | | | | | | | | | | | | |
| (in thousands) | September 30,
2021 |
| Securitized Debt Obligations | | Principal Balance | | Carrying Value | | Wtd. Avg. Yield/Cost (1) |
| GPMT 2021-FL3 CRE CLO | | | | | | |
Collateral assets (2) | | $ | 768,796 | | | $ | 763,848 | | | L+3.8% |
| Financing provided | | 630,818 | | | 627,580 | | | L+1.7% |
| GPMT 2019-FL2 CRE CLO | | | | | | |
| Collateral assets | | 734,111 | | | 719,822 | | | L+4.0% |
| Financing provided | | 572,001 | | | 570,597 | | | L+1.7% |
| GPMT 2018-FL1 CRE CLO | | | | | | |
| Collateral assets | | 324,651 | | | 320,558 | | | L+5.1% |
| Financing provided | | 158,253 | | | 158,252 | | | L+2.3% |
| Total | | | | | | |
| Collateral assets | | $ | 1,827,558 | | | $ | 1,804,228 | | | L+4.1% |
| Financing provided | | $ | 1,361,072 | | | $ | 1,356,429 | | | L+1.8% |
____________________
(1)Calculations of all in yield on collateral assets at origination are based on a number of assumptions (some or all of which may not occur) and are expressed as monthly equivalent yields that include net origination fees and exit fees and exclude future fundings and any potential or completed loan amendments or modifications. Calculations of all in weighted average yield at origination exclude fixed rate loans. Calculations of L+4.18%.cost of funds is the weighted average coupon of the CRE CLO, exclusive of any CRE CLO issuance costs.
(2)Includes $20 million of restricted cash.
Term Financing ActivityFacility
•EnteredIn February 2021, we entered into a five-yearterm financing facility with Goldman Sachs Bank USA providing us with $349 million of term-matched and non-mark-to-market financing to fund certain loans that were previously financed under the repurchase facility with Goldman Sachs Bank USA. The term financing facility is non-amortizing and may be voluntarily repaid, in whole, on any payment date, subject to a prepayment premium with certain exceptions if repaid prior to February 10, 2022. The term financing facility’s term is matched to that of the underlying commercial mortgage loans, not to exceed February 9, 2025. As of September 30, 2021, we had outstanding $127.9 million on the term financing facility with a weighted average borrowing rate of 3.68%.
The following table details the outstanding borrowings under our term financing facility as of September 30, 2021:
| | | | | | | | | | | | | | | | | | | | |
| (in thousands) | September 30,
2021 |
| Term Financing Facility | | Principal Balance | | Carrying Value | | Wtd. Avg. Yield/Cost (1) |
| GS Term Financing Facility | | | | | | |
| Collateral assets | | $ | 327,632 | | | $ | 324,991 | | | L+4.1% |
| Borrowings outstanding | | 129,980 | | | 127,867 | | | L+3.6% |
___________________(1) Calculations of all in yield on collateral assets at origination are based on a number of assumptions (some or all of which may not occur) and are expressed as monthly equivalent yields that include net origination fees and exit fees and exclude future fundings and any potential or completed loan amendments or modifications. Calculations of all in weighted average yield at origination exclude fixed rate loans. Calculations of cost of funds is the initial weighted average coupon of the term financing facility, exclusive of any term financing facility issuance costs.
Asset-Specific Financing
In April 2019, we entered into a $150 million loan financing facility with CIBC Bank USA to provide us with loan-based financing on a non-mark-to-market basis with a term matched to the underlying loan collateral and partial recourse to us.
The following table details the outstanding borrowings under our asset-specific financing facility as of September 30, 2021:
| | | | | | | | | | | | | | | | | | | | |
| (in thousands) | September 30,
2021 |
| Asset-Specific Financing Facility | | Principal Balance | | Carrying Value | | Wtd. Avg. Yield/Cost (1) |
| CIBC Asset-Specific Financing Facility | | | | | | |
| Collateral assets | | $ | 55,940 | | | $ | 55,829 | | | L+3.4% |
| Borrowings outstanding | | 44,752 | | | 44,752 | | | L+1.7% |
____________________
(1)Calculations of all in yield on collateral assets at origination are based on a number of assumptions (some or all of which may not occur) and are expressed as monthly equivalent yields that include net origination fees and exit fees and exclude future fundings and any potential or completed loan amendments or modifications. Calculations of all in weighted average yield at origination exclude fixed rate loans. Calculations of cost of funds is the initial weighted average coupon of the asset-specific financing facility, exclusive of any asset-specific financing facility issuance costs.
Corporate Financing
The following table details our outstanding corporate financing as of September 30, 2021:
| | | | | | | | |
| (in thousands) | | September 30,
2021 |
| Corporate Financing | | Principal Balance |
| Senior secured term loan facilities | | $ | 225,000 | |
| Convertible senior notes | | 275,350 | |
| Total Corporate Financing | | 500,350 | |
Senior Secured Term Loan Facilities
As of September 30, 2021, the total outstanding amount due on the senior secured term loan credit agreement with an initial draw offacilities was $225.0 million, generatingwith a carrying value of $208.8 million, net cash proceeds of $205.6 million after deducting deferred issuance costs, $75.0 millioncosts. Interest on the outstanding loans under the senior secured term loan facilities is payable quarterly in additional delayed draw commitmentsarrears and warrantsaccrues at the rate of (i) 8.00% per annum for any period for which accrued interest is paid in cash or (ii) 9.00% per annum for any period for which the borrowers elect to purchasepay up to 6,065,820 50% of accrued interest in kind by adding such interest to the principal amount of the loans. The senior secured term loan facilities will mature on September 25, 2025.
| | | | | | | | | | | | | | | | | | | | | | | | | | |
| (in thousands) | | September 30,
2021 |
| Senior Secured Term Loan Facilities | | Principal Balance | | Carrying Value | | All-in Cost (1) | | Maturity Date |
| PIMCO Senior Secured Term Loan Facilities | | $ | 225,000 | | | $ | 208,785 | | | 10.8 | % | | September 2025 |
____________________
(1)In addition to cash coupon, average yield includes the amortization of deferred financing costs and warrants.
Senior Convertible Notes
As of September 30, 2021, the total outstanding amount due on convertible senior notes was $272.5 million, net of deferred issuance costs. The notes are unsecured and pay interest semiannually at a rate of 5.625% per annum on the notes maturing in December 2022 and a rate of 6.375% per annum on the notes maturing in October 2023. As of September 30, 2021, these notes had a conversion rate of 51.9943 and 50.0894shares of our common stock.stock per $1,000 principal amount of the notes, respectively.
•Reinvested $21.1 million in GPMT 2019-FL2 involving five loans or participation interests therein.
•Voluntarily terminated our short-term secured revolving credit facility.
•
As of September 30, 2021, the following senior convertible notes were outstanding:
| | | | | | | | | | | | | | | | | | | | | | | | | | | | | | | | |
| (in thousands) | | September 30,
2021 |
| Convertible Senior Notes | | Principal Balance | | Carrying Value | | Interest Rate | | All-in Cost (1) | | Maturity Date |
| Senior Convertible Notes Maturing 2022 | | 143,750 | | | 142,644 | | | 5.6 | % | | 6.4 | % | | December 1, 2022 |
| Senior Convertible Notes Maturing 2023 | | 131,600 | | | 129,868 | | | 6.4 | % | | 7.2 | % | | October 1, 2023 |
____________________
(1)Amended certainIn addition to cash coupon, average yield includes the amortization of deferred financing costs.
The following table provides the quarterly average balances, the quarter-end balances and the maximum balances at any month-end within that quarterly period, of borrowings under our repurchase facilities, asset-specific financing facility, term financing facility, CRE CLOs, senior secured term loan facilities and convertible senior notes for the three months ended September 30, 2021, and the four immediately preceding quarters:
| | | | | | | | | | | | | | | | | | | |
| (in thousands) | Quarterly Average | | End of Period Balance | | Maximum Balance of Any Month-End | | |
| For the Three Months Ended September 30, 2021 | $ | 2,945,314 | | | $ | 2,927,103 | | | $ | 2,927,103 | | | |
| For the Three Months Ended June 30, 2021 | $ | 2,967,421 | | | $ | 2,868,936 | | | $ | 3,129,688 | | | |
| For the Three Months Ended March 31, 2021 | $ | 3,149,509 | | | $ | 3,112,629 | | | $ | 3,319,943 | | | |
| For the Three Months Ended December 31, 2020 | $ | 3,281,786 | | | $ | 3,236,792 | | | $ | 3,317,165 | | | |
| For the Three Months Ended September 30, 2020 | $ | 3,262,423 | | | $ | 3,379,053 | | | $ | 3,379,053 | | | |
Financial Covenants
Our financial covenants ofand guarantees for outstanding borrowings related to our repurchase agreements, term financing facility, asset specific financing and senior secured term loan facilities require the Company to maintain compliance with the following most restrictive covenants across the agreements:
| | | | | | | | |
| Financial Covenant | Description | Value as of September 30, 2021 |
| Cash Liquidity | Unrestricted cash liquidity of no less than the greater of $30.0 million and 5.0% of recourse indebtedness | Unrestricted cash of $154.9 million, while 5.0% of recourse indebtedness was $39.3 million |
| Tangible Net Worth | Tangible net worth greater than the sum of (i) 75.0% of tangible net worth as of June 28, 2017 and (ii) 75.0% of net cash proceeds of equity issuances after June 28, 2017, which calculates to $782.3 million. | Tangible net worth of $979.6 million |
| Leverage Ratios | Target asset leverage ratio cannot exceed 77.5% and total leverage ratio cannot exceed 80.0%. | Target asset leverage ratio of 66.3%; Total leverage ratio of 75.2% |
| Interest Coverage | Interest coverage ratio of no less than 1.5:1.0 | Interest coverage of 1.8:1.0 |
We were in compliance with all financial covenants as of September 30, 2021.
Leverage Ratios
As of September 30, 2021, the total debt-to-equity ratio with respect to our loans held-for-investment was 3.0:1.0, and our recourse leverage ratio was 1.4:1.0.
The following table represents the Company’s recourse leverage ratio and total leverage ratio as of September 30, 2021 and December 31, 2020:
| | | | | | | | |
| September 30, 2021 | December 31, 2020 |
Recourse leverage ratio (1) | 1.4 | 2.2 |
Total leverage ratio (2) | 3.0 | 3.2 |
(1) The debt-to-equity ratio with respect to our loans held-for-investment, defined as recourse debt, net of cash, divided by equity.(2) The total debt-to-equity ratio with respect to our loans held-for-investment, defined as total debt, net of cash, divided by equity.
Floating Rate Portfolio
Our business strategy seeks to minimize our exposure to changes in interest rates by matching benchmark indices, typically LIBOR or similar index, on our assets with those on our asset level borrowings. Accordingly, our business model is such that in general, rising interest rates will increase our net interest income, while declining interest rates will decrease our net interest income, subject to the impact of interest rate floors on our floating rate assets and certain liabilities. As of September 30, 2021, 99% of our loan investments earned a floating rate of interest and were financed with liabilities that pay interest on a floating rate basis, which resulted in an amount of net equity that is positively correlated to rising interest rates, subject to the impact of interest rate floors on certain of our floating rate loan investments. As of September 30, 2021, the remaining 1% of our investments that earned a fixed rate of interest were financed with liabilities that pay interest on a floating rate basis, which resulted in a negative correlation to rising interest rates on that amount of our financing.
The following table details our loan portfolio’s net floating rate exposure as of September 30, 2021: | | | | | |
| (in thousands) | Net Exposure |
Floating rate assets(1) | $ | 3,623,823 | |
Floating rate liabilities(1)(2) | 2,452,562 | |
| Net floating rate exposure | $ | 1,171,261 | |
(1) Floating rate loans and liabilities are currently indexed to the London Interbank Offered Rate, or LIBOR.
(2) Floating rate liabilities include our repurchase facilities, term financing facility, asset-specific financing facility to, among other things, excludeand CRE CLOs.
Interest-Earning Assets and Interest-Bearing Liabilities
The following tables present the impactcomponents of CECL reserves under Accounting Standards Update, or ASU, 2016-13 frominterest income and average annualized net asset yield earned by asset type, the calculationcomponents of such financial covenants.
Liquidity:
•Available liquidity atinterest expense and average annualized cost of funds on borrowings incurred by collateral type and net interest income and average annualized net interest rate spread for the three and nine months ended September 30, 2020 was comprised2021 and 2020: | | | | | | | | | | | | | | | | | | | | | | | | | | | | | | | | | | | |
| Three Months Ended September 30, 2021 | | Nine Months Ended September 30, 2021 |
| (dollars in thousands) | Average Balance | | Interest Income/Expense (1) | | Net Yield/Cost of Funds | | Average Balance | | Interest Income/Expense (1) | | Net Yield/Cost of Funds |
Interest-earning assets (2) | | | | | | | | | | | |
| Loans held-for-investment | | | | | | | | | | | |
Senior loans (3) | $ | 3,675,426 | | | $ | 47,934 | | | 5.2 | % | | $ | 3,740,623 | | | $ | 150,561 | | | 5.4 | % |
| Subordinated loans | 15,595 | | | 378 | | | 9.7 | % | | 15,980 | | | 1,140 | | | 9.5 | % |
| | | | | | | | | | | |
| | | | | | | | | | | |
| Other | — | | | 95 | | | — | | | — | | | 298 | | | — | |
| Total interest income/net asset yield | $ | 3,691,021 | | | $ | 48,407 | | | 5.2 | % | | $ | 3,756,603 | | | $ | 151,999 | | | 5.4 | % |
| Interest-bearing liabilities | | | | | | | | | | | |
| Borrowings collateralized by: | | | | | | | | | | | |
| Loans held-for-investment | | | | | | | | | | | |
Senior loans (3) | $ | 2,463,746 | | | $ | 16,028 | | | 2.6 | % | | $ | 2,517,363 | | | $ | 48,938 | | | 2.6 | % |
| Subordinated loans | 8,455 | | | 67 | | | 3.2 | % | | 8,491 | | | 201 | | | 3.2 | % |
| | | | | | | | | | | |
| | | | | | | | | | | |
| Other: | | | | | | | | | | | |
| Convertible senior notes | 272,364 | | | 4,556 | | | 6.7 | % | | 271,937 | | | 13,618 | | | 6.7 | % |
| Senior secured term loan facilities | 208,480 | | | 5,654 | | | 10.8 | % | | 207,662 | | | 16,587 | | | 10.6 | % |
| Total interest expense/cost of funds | $ | 2,953,045 | | | 26,305 | | | 3.6 | % | | $ | 3,005,453 | | | 79,344 | | | 3.5 | % |
| Net interest income/spread | | | $ | 22,102 | | | 1.6 | % | | | | $ | 72,655 | | | 1.9 | % |
| | | | | | | | | | | | | | | | | | | | | | | | | | | | | | | | | | | |
| Three Months Ended September 30, 2020 | | Nine Months Ended September 30, 2020 |
| (dollars in thousands) | Average Balance | | Interest Income/Expense (1) | | Net Yield/Cost of Funds | | Average Balance | | Interest Income/Expense (1) | | Net Yield/Cost of Funds |
Interest-earning assets (2) | | | | | | | | | | | |
| Loans held-for-investment | | | | | | | | | | | |
Senior loans (3) | $ | 4,115,011 | | | $ | 56,903 | | | 5.5 | % | | $ | 4,218,499 | | | $ | 179,216 | | | 5.7 | % |
| Subordinated loans | 27,025 | | | 654 | | | 9.7 | % | | 27,201 | | | 2,020 | | | 9.9 | % |
| Available-for-sale securities | 6,538 | | | 119 | | | 7.3 | % | | 9,668 | | | 646 | | | 8.9 | % |
| Held-to-maturity securities | 5,990 | | | 113 | | | 7.5 | % | | 8,870 | | | 659 | | | 9.9 | % |
| Other | — | | | 57 | | | — | | | — | | | 424 | | | — | |
| Total interest income/net asset yield | $ | 4,154,564 | | | $ | 57,846 | | | 5.6 | % | | $ | 4,264,238 | | | $ | 182,965 | | | 5.7 | % |
| Interest-bearing liabilities | | | | | | | | | | | |
| Borrowings collateralized by: | | | | | | | | | | | |
| Loans held-for-investment | | | | | | | | | | | |
Senior loans (3) | $ | 2,969,044 | | | $ | 19,189 | | | 2.6 | % | | $ | 3,059,632 | | | $ | 71,189 | | | 3.1 | % |
| Subordinated loans | 8,600 | | | 70 | | | 3.3 | % | | 8,616 | | | 253 | | | 3.9 | % |
| Available-for-sale securities | 4,334 | | | 43 | | | 4.0 | % | | 5,983 | | | 198 | | | 4.4 | % |
| Held-to-maturity securities | 3,030 | | | 38 | | | 5.0 | % | | 4,768 | | | 210 | | | 5.9 | % |
| Other: | | | | | | | | | | | |
| Convertible senior notes | 270,709 | | | 4,529 | | | 6.7 | % | | 270,505 | | | 13,570 | | | 6.7 | % |
| Senior secured term loan facilities | 6,706 | | | 145 | | | 8.6 | % | | 3,353 | | | 145 | | | 8.6 | % |
| Total interest expense/cost of funds | $ | 3,262,423 | | | 24,014 | | | 2.9 | % | | $ | 3,352,857 | | | 85,565 | | | 3.4 | % |
| Net interest income/spread | | | $ | 33,832 | | | 2.7 | % | | | | $ | 97,400 | | | 2.3 | % |
____________________
(1)Includes amortization of $359.0 milliondeferred debt issuance costs.
(2)Average balance represents average amortized cost on loans held-for-investment, AFS securities and HTM securities.
(3)Loans primarily secured by a first priority lien on commercial real property and related personal property and also includes, when applicable, any companion subordinate loans.
Factors Affecting ourOur Operating Results
The results of our operations are affected by a number of factors and primarily depend on, among other things, the level of our net interest income, the availability and cost of financing for us, the market value of our assets, the credit performance of our assets and the supply of, and demand for, commercial real estate loans, other commercial real estate debt instruments and other financial assets available for investment in the market and available as a source of refinancing of our assets. Our net interest income, which reflects the amortization of origination fees and direct costs, is recognized based on the contractual rate and the outstanding principal balance of the loans we originate. The objective of the interest method is to arrive at periodic interest income that yields a level rate of return over the loan term. Interest rates vary according to the type of loan or security, conditions in the financial markets, credit worthiness of our borrowers, competition and other factors, none of which can be predicted with any certainty. Our operating results may also be impacted by credit losses in excess of initial anticipations or unanticipated credit events experienced by our borrowers. We continue to monitor the effects on each of these factors in light of the COVID-19 pandemic and how they will affect the results of our operations.
Loan Originations
Our business model is mainly focused on directly originating, investing in and managing senior floating-rate commercial mortgage loans and other debt and debt-like commercial real estate investments. As a result of this strategy, our operating performance is subject to overall market demand for commercial real estate loan products and other debt and debt-like commercial real estate investments. We manage originations and acquisitions of our target investments by diversifying our investment portfolio across geographical regions and local markets, property types, borrower types, loan structures and types. We do not limit our investments to any number of geographical areas or property types for our originations and will continue to develop a well-diversified investment portfolio. Additionally, our team has extensive experience originating and acquiring commercial real estate loans and other debt and debt-like commercial real estate investments, through a network of long-standing relationships with borrowers, sponsors and industry brokers. The COVID-19 pandemic has resulted in significant disruptions in financial markets, uncertainty about the overall macroeconomic outlook and a dislocation in the commercial real estate sector, including reduced borrower demand, higher lending rates, increased capitalization rates on properties and significantly lower transaction volume. The dislocation in capital markets and decline in real estate sale transaction and refinancing activities have and will likely continue to negatively impact the volume of loan repayments and prepayments, which are a significant source of our liquidity and could make it more difficult for us to originate new loan investments.
Financing Availability
We are subject to availability and cost of financing to successfully execute on our business strategy and generate attractive risk-adjusted returns to our stockholders. Much of our financing is in the form of repurchase agreements, or other types of credit facilities, provided to us by our lender counterparties. We mitigate this counterparty risk by seeking to diversify our lending partners, focusing on establishing borrowing relationships with strong counterparties and continuously monitoring them through
a thoughtful approach to counterparty risk oversight. Additionally, as part of our broader risk management strategy, and to the extent available in the market, we finance our business through other means which may include, but not be limited to, securitizations, note sales and issuance of unsecured debt and equity instruments. We continue to actively explore additional types of funding facilities in order to further diversify our financing sources. The COVID-19 pandemic has resulted in significant disruptions in financial markets and uncertainty about the overall macroeconomic outlook. Impending declines in economic conditions could negatively impact real estate and real estate capital markets, which could make it more difficult for us to obtain or maintain financing.
We finance pools of our commercial real estate loans through collateralized loan obligations, or CLOs, retaining the subordinate securities in our investment portfolio. Our CLOs are accounted for as financings with the non-retained securitized debt obligations recognized on our condensed consolidated balance sheets.
Credit Risk
We are subject to varying degrees of credit risk in connection with our target investments. We try to mitigate this risk by seeking to originate or acquire assets of higher quality at appropriate rates of return given anticipated and unanticipated losses, by employing a comprehensive review and selection process and by proactively monitoring originated or acquired investments. Nevertheless, unanticipated credit losses, including as a result of the COVID-19 pandemic, could occur that could adversely impact our operating results.
We employ a long-term, fundamental value-oriented investment strategy and we aim to, on a loan-by-loan basis, construct an investment portfolio that is well-diversified across property types, geographies and sponsors. However, any potential negative impacts on our business as a result of the COVID-19 pandemic may be heightened by the fact that we are not required to observe specific diversification criteria, which means that our investments may be relatively concentrated in certain property types, geographical areas or loan categories that may be more adversely affected by the pandemic than others. For example, certain of our loans are secured by office, multifamily, hotel and retail properties. Federal and state mandates implemented to control the spread of the virus, including restrictions on freedom of movement and business operations such as travel bans, border closings, business closures, quarantines and shelter-in-place orders, have and are expected to continue to negatively impact the hotel and retail industries, which could adversely affect our assets secured by such properties. Also, changes in how certain types of commercial properties are operated to facilitate social distancing and other techniques intended to control the impact of the pandemic, have impacted and are likely to continue to impact, our investments secured by these properties.
Operating Expenses - Investment Management and Corporate Overhead
We incur significant general and administrative costs, including certain costs related to being a public company and costs incurred on our behalf by our Manager. Currently, we rely on our Manager to provide, or obtain on our behalf, the personnel and services necessary for us to conduct our business because we have no employees of our own. Currently, our Manager performs these services for us and provides us with a comprehensive suite of investment and portfolio management services.
Under the Management Agreement, we currently pay all costs and expenses of our Manager incurred on our behalf in order to operate our business, as well as all compensation costs for certain personnel providing services to us under the Management Agreement, other than personnel directly involved in supporting the investment function. We also currently pay our Manager a quarterly base management fee equal to 0.375% (a 1.50% annual rate) of our equity and an incentive fee, which is payable, if earned, as defined in the Management Agreement. See further discussion of the base management fee and incentive fee calculations in Note 13 - Commitments and Contingencies of our notes to the condensed consolidated financial statements included in this Quarterly Report on Form 10-Q.
Upon consummation of the Internalization, we will no longer rely on our Manager for services necessary for us to conduct our business, nor will we pay management or incentive fees to the Manager for any period following the Internalization. We will incur expenses associated with becoming an internally managed REIT, including compensation expenses previously borne by our Manager. See “The Internalization” above for additional discussion of the Internalization.
We continue to monitor the COVID-19 pandemic and its impact on our operating partners, financing sources, borrowers and their tenants, and the economy as a whole. The magnitude and duration of the COVID-19 pandemic, and its impact on our operations, liquidity and availability of financing, are uncertain and continue to evolve. To the extent that our borrowers and their tenants, property sponsors and financing sources continue to be impacted by the COVID-19 pandemic, it could have a material adverse effect on our liquidity and capital resources. Given the current highly uncertain environment, we may incur additional operating expenses for a period of time, which may be meaningful, related to actively managing our investment portfolio, our funding sources and exploring additional financing and capital sources to help us better manage through this period of economic uncertainty and market dislocation.
Market Conditions
Prior to the COVID-19 pandemic, the commercial real estate debt markets offered compelling investment opportunities, especially when approached fundamentally, with a focus on strong credit and cash flow characteristics and high-quality borrowers and sponsors. These investment opportunities were supported by active real estate transaction volumes, continuous need for refinancing of legacy loans and borrower and sponsor demand for debt capital to renovate, reposition or redevelop their properties. Additionally, the stricter regulatory environment after the financial crisis from 2007 to 2009 for traditional providers of financing in this market, such as banks and insurance companies, limited the capacity of available funding for certain types of commercial real estate loans which comprised a large part of our target investments. The COVID-19 pandemic has created a high degree of uncertainty with respect to the overall economic environment along with the negative impact it has had on many segments of the commercial real estate market, including a significant decline in real estate transaction volume combined with severe dislocations in the financing markets. We believe that, over time, as the markets return to more normalized levels of activity and the ultimate economic recovery takes place, U.S. commercial real estate will continue to be viewed as an attractive asset class and will provide us with the opportunities consistent with our investment strategy to invest our capital and generate attractive, risk-adjusted returns for our stockholders over the long-term. Certain segments of the commercial real estate market, such as lodging and retail, have been affected more significantly than others, resulting in multiple retail sector bankruptcies, for example, as more consumer demand has shifted to internet related purchases. This retail property stress has benefited the industrial sector, which has seen increased demand for “last-mile” distribution sites in certain markets. The lodging sector has also experienced significant dislocation and the general market expectation is that it will take a while for it to recover considering the social distancing and further shut-down recommendations by local and state officials in select locations. The multifamily sector has performed relatively well through this crisis though the future path may be dependent to a degree on additional federal government stimulus. Office properties have performed well, though there has been a noticeable slowdown in leasing activity, but the longer-term impact of the COVID-19 pandemic remains uncertain considering remote working and other potential operational changes by the tenants.
Due to the ongoing COVID-19 pandemic in the United States and globally, most of our borrowers, sponsors, their tenants, the properties serving as collateral on our loan investments and the economy as a whole have been, and will continue to be, adversely affected. The magnitude and duration of the COVID-19 pandemic and its impact on our borrowers and their tenants, cash flows and future results of operations could be significant and will largely depend on future developments, which remain highly uncertain and cannot be predicted, including new information which may emerge concerning the severity of the COVID-19 pandemic, the success of actions taken to contain or treat the pandemic and reactions by consumers, companies, governmental entities and capital markets. The prolonged duration and impact of the COVID-19 pandemic could materially disrupt our business operations and impact our financial condition and performance, and our liquidity and ability to pay dividends, including the dividend on our common stock, which was temporarily suspended in the first quarter of 2020 and reinstated in the third quarter of 2020.
The COVID-19 pandemic has resulted in significant disruptions in financial markets, business shutdowns and uncertainty about how the United States and global economy will perform over the near term. Possible future declines in rental rates and expectations of future rental concessions, including free rent to renew tenants early, to retain tenants who are up for renewal, to attract new tenants or rent abatements for tenants severely impacted by the COVID-19 pandemic may result in decreases in cash flows to our borrowers and potentially in defaults in paying debt service on outstanding indebtedness to us, which could adversely impact our results of operations and financial performance. Impending declines in economic conditions could negatively impact real estate and real estate capital markets and result in lower occupancy, lower rental rates and declining values in our portfolio, which could adversely impact the value of our investments, making it more difficult for us to pay dividends or meet our financing obligations in the future.
Allowance for Credit Losses
In June 2016, the Financial Accounting Standards Board issued ASU 2016-13, Financial Instruments - Credit Losses (Topic 326): Measurement of Credit Losses on Financial Instruments, or ASU 2016-13. ASU 2016-13 significantly changes how entities will measure credit losses for most financial assets and certain other instruments that are not measured at fair value through net income. ASU 2016-13 replaces the incurred loss model under existing guidance with a Current Expected Credit Loss, or CECL, model for instruments measured at amortized cost, and require entities to record allowances for AFS debt securities rather than reduce the amortized cost, as they did under the other-than-temporary impairment model. It also simplifies the accounting model for purchased credit-impaired debt securities and loans. In addition, the new model applies to off-balance sheet credit exposures, such as unfunded loan commitments. ASU 2016-13 was adopted through a cumulative-effect adjustment to cumulative earnings as of January 1, 2020.
The allowance for credit losses required under ASU 2016-13 is a valuation account that is deducted from the amortized cost basis of related loans and debt securities on our consolidated balance sheets, and which reduces our total stockholders’ equity. The initial allowance for credit losses recorded on January 1, 2020 was reflected as a direct charge to cumulative earnings; however, going forward, changes to the allowance for credit losses are recognized through net income on our consolidated statements of operations. While ASU 2016-13 does not require any particular method for determining the allowance for credit losses, it does specify the allowance should be based on relevant information about past events, including historical loss experience, current portfolio, market conditions and reasonable and supportable forecasts for the duration of each respective loan. In addition, other than a few narrow exceptions, ASU 2016-13 requires that all financial instruments subject to the CECL model have some amount of allowance for credit losses to reflect the GAAP principal underlying the CECL model that all loans, debt securities and similar assets have some inherent risk of loss, regardless of credit quality, subordinate capital or other mitigating factors.
Our loans typically include commitments to fund incremental proceeds to our borrowers over the life of the loan. Those future funding commitments are also subject to an allowance for credit losses. The allowance for credit losses related to future loan fundings is recorded as a component of other liabilities on our consolidated balance sheets and not as an offset to the related loan balance. This allowance for credit losses is estimated using the same process outlined below for our outstanding loan balances and changes in this component of the allowance for credit losses will similarly flow through our consolidated statement of operations.
Our implementation process included a selection of a credit loss analytical model, completion and documentation of policies and procedures, changes to internal reporting processes and related internal controls and additional disclosures. A control framework for governance, data, forecast and model controls was developed to support the CECL process. The allowance for credit losses is estimated on a quarterly basis and represents management’s estimates of current expected credit losses in our investment portfolio. Pools of loans with similar risk characteristics are collectively evaluated while loans that no longer share risk characteristics with loan pools are evaluated individually. Estimating an allowance for credit losses is inherently subjective, as it requires management to exercise significant judgment in establishing appropriate factors used to determine the allowance and a variety of subjective assumptions, including (i) determination of relevant historical loan loss data sets, (ii) projecting the expected timing and amount of future loan fundings and repayments, (iii) assessing the current credit quality of loans and operating performance of loan collateral, (iv) selecting the forecast for macroeconomic conditions and (v) determining the reasonable and supportable forecast period. The allowance for loan losses also includes qualitative adjustments to bring the allowance to the level management believes is appropriate based on factors that have not otherwise been fully accounted for, including adjustments for foresight risk, input imprecisions and model imperfections. Foresight risk reflects the inherent imprecision in forecasting economic variables, including determining the depth and duration of economic cycles and their impact on relevant economic variables. Input imperfection factors address the risk that certain model inputs may not reflect all available information such as changes in the level and quality of experience held by certain borrowers or limitations in data available for certain loan portfolios. Model imprecision considers known model limitations not yet fully reflected in the quantitative estimate. The determination of the appropriate qualitative adjustment is based on management's analysis of current and expected economic conditions and their impact to the portfolio, as well as a qualitative assessment of the lending environment, including underwriting standards. Management recognizes the sensitivity of various assumptions made in the quantitative modeling of expected losses and may adjust reserves depending upon the level of uncertainty that currently exists in one or more assumptions.
Considering the lack of historical Company data related to any realized loan losses since our inception, we elected to estimate our allowance for credit losses by using a probability-weighted analytical model that considers the likelihood of default and loss-given-default for each individual loan. The analytical model incorporates a third-party licensed database with historical loan losses from 1998 to 2019 for over 100,000 commercial real estate loans. Our allowance for credit losses reflects its estimates of the current and future economic conditions that impact the performance of the commercial real estate properties serving as collateral for our loan investments. These estimates include unemployment rates, interest rates, price indices for commercial property, and other macroeconomic factors impacting the likelihood and magnitude of potential credit losses for our loans during their anticipated term. We license certain macroeconomic financial forecasts from a third-party to inform our view of the potential future impact that broader macroeconomic conditions may have on the performance of our loan portfolio. The forecasts are embedded in the licensed analytical model that we use to estimate our allowance for credit losses. We may use one of more of these forecasts in the process of estimating our allowance for credit losses. Selection of these economic forecasts requires significant judgment about future events that, while based on the information available to us as of the balance sheet date, are ultimately unknowable with certainty, and the actual economic conditions impacting our portfolio could vary significantly from the estimates we made for the periods presented. At the time of adoption of ASU No. 2016-13, in determining our initial allowance for credit losses estimate, we employed a macroeconomic forecast that largely reflected our views at the time and projected stable economic conditions over the reasonable projection period. Significant inputs to our estimate of the allowance for credit losses include loan specific factors such as DSCR, LTV, remaining loan term, property type and others. In certain instances, for loans with unique risk characteristics, we may instead elect to employ different methods to estimate loan losses that also conform to ASU 2016-13 and related guidance.
Upon adoption of ASU No. 2016-13 on January 1, 2020, based on our loan portfolio, pre-COVID-19 economic environment and management’s expectations for future economic and market conditions at the time, we recorded, as a cumulative-effective adjustment to the cumulative earnings in our consolidated statement of equity, an initial allowance for credit losses of approximately $18.5 million, or approximately $0.34 per common share. In addition, we recorded an incremental allowance for credit losses for the nine months ended September 30, 2020 of approximately $62.2 million, or $1.13 per common share, resulting in a cumulative year-to-date CECL impact of $80.7 million or $1.46 per common share, largely reflecting the changed expectations for macroeconomic and commercial real estate market conditions as a result of the COVID-19 pandemic.
Changes in the Fair Value of Our Investments
We intend to hold our target investments for the long-term and, as such, they are carried at amortized cost on our condensed consolidated balance sheets. We evaluate our investments for impairment on a quarterly basis and impairments are recognized when it is probable that we will not be able to collect all amounts estimated to be collected at the time of origination of the investment. We evaluate impairment (both interest and principal) based on the present value of expected future cash flows, discounted at the investment’s effective interest rate or the fair value of the collateral, less estimated costs to sell.
Although we intend to hold our target investments for the long-term, we may occasionally classify some of our investments as AFS. Investments classified as AFS are carried at their fair value, with changes in fair value recorded through accumulated other comprehensive income, a component of stockholders’ equity, rather than through earnings. We do not intend to hold any of our investments for trading purposes.
Changes in Market Interest Rates
Although our strategy is to primarily originate, invest in and manage senior floating-rate commercial mortgage loans, from time-to-time we may acquire fixed-rate investments, which exposes our operating results to the risks posed by fluctuations in interest rates. To the extent that this applies to us, we may choose to actively manage this risk through the use of hedging strategies.
Summary of Results of Operations and Financial Condition
Our GAAP net lossincome (loss) attributable to common stockholders was $24.7$18.6 million and $63.7 million ($0.45 and $1.15(or $0.34 per dilutedbasic weighted average share, respectively)share) for the three and nine months ended September 30, 2020, respectively,2021, as compared to GAAP net income (loss) attributable to common stockholders of $17.4$(24.7) million and $52.5 million ($0.32 and $1.00(or $(0.45) per dilutedbasic weighted average share, respectively)share) for the three months ended September 30, 2020. The GAAP net income for the three months ended September 30, 2021 benefited from a partial reversal of the provision for credit losses, which was related to loan prepayments, somewhat improved macroeconomic forecast and overall market conditions. The GAAP net (loss) for the three months ended September 30, 2020 was primarily a result of one-time restructuring charges related to the internalization process, realized losses on sales of select loans held-for-sale, which were partially offset by a decrease in the provision for credit losses related to the moderate improvement in the forecasts of macroeconomic and market conditions.
Our GAAP net income (loss) attributable to common stockholders was $60.8 million (or $1.11 per basic weighted average share) for the nine months ended September 30, 2019, respectively.2021, as compared to GAAP net income (loss) attributable to common stockholders of $(63.7) million (or $(1.15) per basic weighted average share) for the nine months ended September 30, 2020. The GAAP net lossincome for the threenine months ended September 30, 2021 benefited from a partial reversal of the provision for credit losses, which was related to loan prepayments, somewhat improved macroeconomic forecast and overall market conditions and a decrease in other operating expenses. The GAAP net (loss) for the nine months ended September 30, 2020 was primarily a result of an increase in the provision for credit losses recognized in accordance with the new credit loss accounting standard adopted on January 1, 2020 and the one-time restructuring charges related to the Internalization. The increase in the provision for credit losses was magnified by the significant deterioration in the forecasts of macroeconomic conditions, during the first and second quarter of 2020, due to the economic andoverall market dislocation caused by the onset of the COVID-19 pandemic. The GAAP net loss forpandemic, one-time restructuring charges related to the threeinternalization process and nine months ended September 30, 2020 was also impacted by realized losses on salesthe sale of select loans.
The following table sets forth information regarding our condensed consolidated results of operations and certain loans held-for-sale completed duringkey operating metrics compared to both the secondsame period in the previous year and third quarters of 2020.the most recently reported period ($ in thousands):
The following table presents the components of our comprehensive (loss) income for the three and nine months ended September 30, 2020 and 2019:
| | | | | | | | | | | | | | | | | | | | | | | | | | | | |
| (in thousands, except share data) | | Three Months Ended | | Nine Months Ended |
| Income Statement Data: | | September 30, | | September 30, |
| | 2020 | | 2019 | | 2020 | | 2019 | | |
| Interest income: | | (unaudited) | | |
| Loans held-for-investment | | $ | 56,783 | | | $ | 61,796 | | | $ | 180,341 | | | $ | 176,594 | | | |
| Loans held-for-sale | | 774 | | | — | | | 895 | | | — | | | |
| Available-for-sale securities | | 119 | | | 308 | | | 646 | | | 927 | | | |
| Held-to-maturity securities | | 113 | | | 530 | | | 659 | | | 1,804 | | | |
| Cash and cash equivalents | | 57 | | | 810 | | | 424 | | | 2,228 | | | |
| Total interest income | | 57,846 | | | 63,444 | | | 182,965 | | | 181,553 | | | |
| Interest expense: | | | | | | | | | | |
| Repurchase agreements | | 12,791 | | | 17,951 | | | 46,742 | | | 48,469 | | | |
| Securitized debt obligations | | 5,431 | | | 12,467 | | | 21,367 | | | 35,880 | | | |
| Convertible senior notes | | 4,529 | | | 4,503 | | | 13,570 | | | 13,459 | | | |
| Asset-specific financings | | 901 | | | 1,119 | | | 2,962 | | | 1,717 | | | |
| Senior secured term loan facilities | | 145 | | | — | | | 145 | | | — | | | |
| Revolving credit facilities | | 217 | | | 322 | | | 779 | | | 1,182 | | | |
| | | | | | | | | | |
| Total interest expense | | 24,014 | | | 36,362 | | | 85,565 | | | 100,707 | | | |
| Net interest income | | 33,832 | | | 27,082 | | | 97,400 | | | 80,846 | | | |
| | | | | | | | | | |
| Other (loss) income: | | | | | | | | | | |
| Provision for credit losses | | 5,300 | | | — | | | (62,241) | | | — | | | |
| Realized losses on sales | | (10,019) | | | — | | | (16,913) | | | — | | | |
| Fee income | | 595 | | | — | | | 1,117 | | | 1,115 | | | |
| | | | | | | | | | |
| Total other (loss) income | | (4,124) | | | — | | | (78,037) | | | 1,115 | | | |
| Expenses: | | | | | | | | | | |
| Management fees | | 3,974 | | | 3,801 | | | 11,840 | | | 11,013 | | | |
| Incentive fees | | — | | | — | | | — | | | 244 | | | |
| Servicing expenses | | 914 | | | 1,013 | | | 3,025 | | | 2,671 | | | |
| Restructuring charges | | 43,682 | | | — | | | 43,682 | | | — | | | |
| Other operating expenses | | 5,808 | | | 4,877 | | | 24,421 | | | 15,499 | | | |
| Total expenses | | 54,378 | | | 9,691 | | | 82,968 | | | 29,427 | | | |
| (Loss) income before income taxes | | (24,670) | | | 17,391 | | | (63,605) | | | 52,534 | | | |
| Benefit from income taxes | | (4) | | | (1) | | | (15) | | | (4) | | | |
| Net (loss) income | | (24,666) | | | 17,392 | | | (63,590) | | | 52,538 | | | |
| Dividends on preferred stock | | 25 | | | 25 | | | 75 | | | 75 | | | |
| Net (loss) income attributable to common stockholders | | $ | (24,691) | | | $ | 17,367 | | | $ | (63,665) | | | $ | 52,463 | | | |
| Basic (loss) earnings per weighted average common share | | $ | (0.45) | | | $ | 0.32 | | | $ | (1.15) | | | $ | 1.00 | | | |
| Diluted (loss) earnings per weighted average common share | | $ | (0.45) | | | $ | 0.32 | | | $ | (1.15) | | | $ | 1.00 | | | |
| Dividends declared per common share | | $ | 0.20 | | | $ | 0.42 | | | $ | 0.20 | | | $ | 1.26 | | | |
| Weighted average number of shares of common stock outstanding: | | | | | | | | | | |
| Basic | | 55,205,082 | | | 54,853,205 | | | 55,140,163 | | | 52,492,324 | | | |
| Diluted | | 55,205,082 | | | 54,853,205 | | | 55,140,163 | | | 52,492,324 | | | |
| Comprehensive (loss) income: | | | | | | | | | | |
| Net (loss) income attributable to common stockholders | | $ | (24,691) | | | $ | 17,367 | | | $ | (63,665) | | | $ | 52,463 | | | |
| Other comprehensive income, net of tax: | | | | | | | | | | |
| Unrealized gain on available-for-sale securities | | — | | | — | | | — | | | 224 | | | |
| Other comprehensive income | | — | | | — | | | — | | | 224 | | | |
| Comprehensive (loss) income | | $ | (24,691) | | | $ | 17,367 | | | $ | (63,665) | | | $ | 52,687 | | | |
| | | | | | | | | | | | | | | | | | | | | | | | | | | | | | | | | | | | | | | | | | | |
| | | |
| (in thousands, except share data) | | Three Months Ended | | | | | Nine Months Ended |
| Income Statement Data: | | September 30, 2021 | | September 30, 2020 | | Q3’21 vs Q3’20 | | | | | September 30, 2021 | | September 30, 2020 | | Q3’21 vs Q3’20 | | |
| Interest income: | | (unaudited) | | | | | | | |
| Loans held-for-investment | | $ | 48,312 | | | $ | 56,783 | | | $ | (8,471) | | | | | | $ | 151,701 | | | $ | 180,341 | | | $ | (28,640) | | | |
| Loans held-for-sale | | — | | | 774 | | | (774) | | | | | | — | | | 895 | | | (895) | | | |
| Available-for-sale securities | | — | | | 119 | | | (119) | | | | | | — | | | 646 | | | (646) | | | |
| Held-to-maturity securities | | — | | | 113 | | | (113) | | | | | | — | | | 659 | | | (659) | | | |
| Cash and cash equivalents | | 95 | | | 57 | | | 38 | | | | | | 298 | | | 424 | | | (126) | | | |
| Total interest income | | 48,407 | | | 57,846 | | | (9,439) | | | | | | 151,999 | | | 182,965 | | | (30,966) | | | |
| Interest expense: | | | | | | | | | | | | | | | | | |
| Repurchase facilities | | 5,451 | | | 12,791 | | | (7,340) | | | | | | 20,449 | | | 46,742 | | | (26,293) | | | |
| Securitized debt obligations | | 8,777 | | | 5,431 | | | 3,346 | | | | | | 20,523 | | | 21,367 | | | (844) | | | |
| Convertible senior notes | | 4,556 | | | 4,529 | | | 27 | | | | | | 13,618 | | | 13,570 | | | 48 | | | |
| Term financing facility | | 1,453 | | | — | | | 1,453 | | | | | | 6,208 | | | — | | | 6,208 | | | |
| Asset-specific financings | | 414 | | | 901 | | | (487) | | | | | | 1,959 | | | 2,962 | | | (1,003) | | | |
| Revolving credit facilities | | — | | | 217 | | | (217) | | | | | | — | | | 779 | | | (779) | | | |
| Senior secured term loan facilities | | 5,654 | | | 145 | | | 5,509 | | | | | | 16,587 | | | 145 | | | 16,442 | | | |
| | | | | | | | | | | | | | | | | |
| Total interest expense | | 26,305 | | | 24,014 | | | 2,291 | | | | | | 79,344 | | | 85,565 | | | (6,221) | | | |
| Net interest income | | 22,102 | | | 33,832 | | | (11,730) | | | | | | 72,655 | | | 97,400 | | | (24,745) | | | |
| | | | | | | | | | | | | | | | | |
| Other income (loss): | | | | | | | | | | | | | | | | | |
| Benefit from (provision for) credit losses | | 5,760 | | | 5,300 | | | 460 | | | | | | 15,072 | | | (62,241) | | | 77,313 | | | |
| | | | | | | | | | | | | | | | | |
| Realized losses on sales of loans held-for-sale | | — | | | (10,019) | | | 10,019 | | | | | | — | | | (16,913) | | | 16,913 | | | |
| Fee income | | — | | | 595 | | | (595) | | | | | | — | | | 1,117 | | | (1,117) | | | |
| | | | | | | | | | | | | | | | | |
| Total other income (loss) | | 5,760 | | | (4,124) | | | 9,884 | | | | | | 15,072 | | | (78,037) | | | 93,109 | | | |
| Expenses: | | | | | | | | | | | | | | | | | |
| Base management fees | | — | | | 3,974 | | | (3,974) | | | | | | — | | | 11,840 | | | (11,840) | | | |
| Compensation and benefits | | 5,634 | | | — | | | 5,634 | | | | | | 16,111 | | | — | | | 16,111 | | | |
| Servicing expenses | | 1,323 | | | 914 | | | 409 | | | | | | 3,763 | | | 3,025 | | | 738 | | | |
| Restructuring charges | | — | | | 43,682 | | | (43,682) | | | | | | — | | | 43,682 | | | (43,682) | | | |
| Other operating expenses | | 2,276 | | | 5,808 | | | (3,532) | | | | | | 6,967 | | | 24,421 | | | (17,454) | | | |
| Total expenses | | 9,233 | | | 54,378 | | | (45,145) | | | | | | 26,841 | | | 82,968 | | | (56,127) | | | |
| Income (loss) before income taxes | | 18,629 | | | (24,670) | | | 43,299 | | | | | | 60,886 | | | (63,605) | | | 124,491 | | | |
| (Benefit from) provision for income taxes | | (1) | | | (4) | | | 3 | | | | | | (4) | | | (15) | | | 11 | | | |
| Net income (loss) | | 18,630 | | | (24,666) | | | 43,296 | | | | | | 60,890 | | | (63,590) | | | 124,480 | | | |
| Dividends on preferred stock | | 25 | | | 25 | | | — | | | | | | 75 | | | 75 | | | — | | | |
| Net income (loss) attributable to common stockholders | | $ | 18,605 | | | $ | (24,691) | | | $ | 43,296 | | | | | | $ | 60,815 | | | $ | (63,665) | | | $ | 124,480 | | | |
| Basic earnings (loss) per weighted average common share | | $ | 0.34 | | | $ | (0.45) | | | $ | 0.79 | | | | | | $ | 1.11 | | | $ | (1.15) | | | $ | 2.26 | | | |
| Diluted earnings (loss) per weighted average common share | | $ | 0.33 | | | $ | (0.45) | | | $ | 0.78 | | | | | | $ | 1.05 | | | $ | (1.15) | | | $ | 2.20 | | | |
| Dividends declared per common share | | $ | 0.25 | | | $ | 0.20 | | | $ | 0.05 | | | | | | $ | 0.75 | | | $ | 0.20 | | | $ | 0.55 | | | |
| Weighted average number of shares of common stock outstanding: | | | | | | | | | | | | | | | | | |
| Basic | | 54,453,546 | | | 55,205,082 | | | (751,536) | | | | | | 54,864,456 | | | 55,140,163 | | | (275,707) | | | |
| Diluted | | 56,735,278 | | | 55,205,082 | | | 1,530,196 | | | | | | 70,902,745 | | | 55,140,163 | | | 15,762,582 | | | |
| Comprehensive income (loss): | | | | | | | | | | | | | | | | | |
| Net income (loss) attributable to common stockholders | | $ | 18,605 | | | $ | (24,691) | | | $ | 43,296 | | | | | | $ | 60,815 | | | $ | (63,665) | | | $ | 124,480 | | | |
| | | | | | | | | | | | | | | | | |
| | | | | | | | | | | | | | | | | |
| | | | | | | | | | | | | | | | | |
| Comprehensive income (loss) | | $ | 18,605 | | | $ | (24,691) | | | $ | 43,296 | | | | | | $ | 60,815 | | | $ | (63,665) | | | $ | 124,480 | | | |
| | | | | | | | | | | | | | |
| (in thousands) | | September 30,
2020 | | December 31,
2019 |
| Balance Sheet Data: | | |
| | | | |
| Loans held-for-investment | | $ | 3,978,862 | | | $ | 4,226,212 | |
| Total assets | | $ | 4,402,852 | | | $ | 4,460,862 | |
| Repurchase agreements | | $ | 1,850,845 | | | $ | 1,924,021 | |
| Securitized debt obligations | | $ | 928,623 | | | $ | 1,041,044 | |
| Asset-specific financings | | $ | 123,091 | | | $ | 116,465 | |
| Revolving credit facilities | | $ | — | | | $ | 42,008 | |
| Senior secured term loan facilities | | $ | 205,647 | | | $ | — | |
| Convertible senior notes | | $ | 270,847 | | | $ | 269,634 | |
| Total stockholders’ equity | | $ | 934,462 | | | $ | 1,019,136 | |
The following table presents the primary components of our condensed consolidated balance sheets as of September 30, 2021 and December 31, 2020:
| | | | | | | | | | | | | | |
| (in thousands) | | September 30,
2021 | | December 31,
2020 |
| Balance Sheet Data: | | |
| | | | |
| Loans held-for-investment, net | | $ | 3,614,211 | | | $ | 3,847,803 | |
| Total assets | | $ | 3,899,190 | | | $ | 4,219,648 | |
| Repurchase facilities | | $ | 916,758 | | | $ | 1,708,875 | |
| Securitized debt obligations | | $ | 1,356,429 | | | $ | 927,128 | |
| Asset-specific financings | | $ | 44,752 | | | $ | 123,091 | |
| Term financing facility | | $ | 127,867 | | | $ | — | |
| Convertible senior notes | | $ | 272,512 | | | $ | 271,250 | |
| Senior secured term loan facilities | | $ | 208,785 | | | $ | 206,448 | |
| Total stockholders’ equity | | $ | 932,109 | | | $ | 933,846 | |
Results of Operations
The following analysis focuses on our financial results during the three and nine months ended September 30, 2020 and 2019.
Net Interest Income
InterestThe following table presents the components of interest income increased from $181.6 million to $183.0 million for the nine months ended September 30, 2019 and September 30, 2020, respectively, due to the origination of 15 commercial real estate loans with a principal balance of $641.5 million and additional fundings of $274.3 million provided on existing loan commitments, offset by repayments of $624.5 million as well as a significant decline in short-term interest rates during the period from September 30, 2019 to September 30, 2020. Interest income decreased from $63.4 million to $57.8 millionexpense for the three months ended September 30, 20192021 and SeptemberJune 30, 2020, respectively, due to2021, and the aforementioned decline in short term-interest rates.
Interest Expense
Interest expense decreased from $36.4 million and $100.7 million for the three and nine months ended September 30, 2019, respectively, to $24.0 million2021 and $85.6 million for the same periods in 2020, respectively, primarily due to a significant decline in short-term interest rates, offset by increased outstanding financing balances on the originations and additional fundings described above.2020:
Net Interest Income
The following tables present the components of interest income and average annualized net asset yield earned by asset type, the components of interest expense and average annualized cost of funds on borrowings incurred by collateral type and net interest income and average annualized net interest rate spread for the three and nine months ended September 30, 2020 and 2019:
| | | | | | | | | | | | | | | | | | | | | | | | | | | | | | | | | | | | | | | | | |
| Three Months Ended September 30, 2020 | | Nine Months Ended September 30, 2020 | | |
| (dollars in thousands) | Average Balance | | Interest Income/Expense (1) | | Net Yield/Cost of Funds | | Average Balance | | Interest Income/Expense (1) | | Net Yield/Cost of Funds | | | | | | |
Interest-earning assets (2) | | | | | | | | | | | | | | | | | |
| Loans held-for-investment/held-for-sale | | | | | | | | | | | | | | | | | |
Senior loans (3) | $ | 4,115,011 | | | $ | 56,903 | | | 5.5 | % | | $ | 4,218,499 | | | $ | 179,216 | | | 5.7 | % | | | | | | |
| Subordinated loans | 27,025 | | | 654 | | | 9.7 | % | | 27,201 | | | 2,020 | | | 9.9 | % | | | | | | |
| Available-for-sale securities | 6,538 | | | 119 | | | 7.3 | % | | 9,668 | | | 646 | | | 8.9 | % | | | | | | |
| Held-to-maturity securities | 5,990 | | | 113 | | | 7.5 | % | | 8,870 | | | 659 | | | 9.9 | % | | | | | | |
| Other | | | 57 | | | | | | | 424 | | | | | | | | | |
| Total interest income/net asset yield | $ | 4,154,564 | | | $ | 57,846 | | | 5.6 | % | | $ | 4,264,238 | | | $ | 182,965 | | | 5.7 | % | | | | | | |
| Interest-bearing liabilities | | | | | | | | | | | | | | | | | |
| Borrowings collateralized by: | | | | | | | | | | | | | | | | | |
| Loans held-for-investment/held-for sale | | | | | | | | | | | | | | | | | |
Senior loans (3) | $ | 2,969,044 | | | $ | 19,189 | | | 2.6 | % | | $ | 3,059,632 | | | $ | 71,189 | | | 3.1 | % | | | | | | |
| Subordinated loans | 8,600 | | | 70 | | | 3.3 | % | | 8,616 | | | 253 | | | 3.9 | % | | | | | | |
| Available-for-sale securities | 4,334 | | | 43 | | | 4.0 | % | | 5,983 | | | 198 | | | 4.4 | % | | | | | | |
| Held-to-maturity securities | 3,030 | | | 38 | | | 5.0 | % | | 4,768 | | | 210 | | | 5.9 | % | | | | | | |
| Other unsecured: | | | | | | | | | | | | | | | | | |
| Senior secured term loan facilities | 6,706 | | | 145 | | | 8.6 | % | | 3,353 | | | 145 | | | 8.6 | % | | | | | | |
| Convertible senior notes | 270,709 | | | 4,529 | | | 6.7 | % | | 270,505 | | | 13,570 | | | 6.7 | % | | | | | | |
| Total interest expense/cost of funds | $ | 3,262,423 | | | 24,014 | | | 2.9 | % | | $ | 3,352,857 | | | 85,565 | | | 3.4 | % | | | | | | |
| Net interest income/spread | | | $ | 33,832 | | | 2.7 | % | | | | $ | 97,400 | | | 2.3 | % | | | | | | |
| | | | | | | | | | | | | | | | | | | | | | | | | | | | | | | | | | | |
| Three Months Ended September 30, 2019 | | Nine Months Ended September 30, 2019 |
| (dollars in thousands) | Average Balance | | Interest Income/Expense (1) | | Net Yield/Cost of Funds | | Average Balance | | Interest Income/Expense (1) | | Net Yield/Cost of Funds |
Interest-earning assets (2) | | | | | | | | | | | |
| Loans held-for-investment | | | | | | | | | | | |
Senior loans (3) | $ | 3,733,792 | | | $ | 61,074 | | | 6.5 | % | | $ | 3,397,816 | | | $ | 174,227 | | | 6.8 | % |
| Subordinated loans | 28,433 | | | 722 | | | 10.2 | % | | 30,981 | | | 2,367 | | | 10.2 | % |
| Available-for-sale securities | 12,798 | | | 308 | | | 9.6 | % | | 12,798 | | | 927 | | | 9.7 | % |
| Held-to-maturity securities | 21,323 | | | 530 | | | 9.9 | % | | 24,088 | | | 1,804 | | | 10.0 | % |
| Other | | | 810 | | | | | | | 2,228 | | | |
| Total interest income/net asset yield | $ | 3,796,346 | | | $ | 63,444 | | | 6.7 | % | | $ | 3,465,683 | | | $ | 181,553 | | | 7.0 | % |
| Interest-bearing liabilities | | | | | | | | | | | |
| Borrowings collateralized by: | | | | | | | | | | | |
| Loans held-for-investment | | | | | | | | | | | |
Senior loans (3) | $ | 2,713,782 | | | $ | 31,459 | | | 4.6 | % | | $ | 2,367,468 | | | $ | 85,985 | | | 4.8 | % |
| Subordinated loans | 9,452 | | | 127 | | | 5.4 | % | | 9,485 | | | 389 | | | 5.5 | % |
| Available-for-sale securities | 8,451 | | | 94 | | | 4.4 | % | | 8,435 | | | 285 | | | 4.5 | % |
| Held-to-maturity securities | 14,357 | | | 179 | | | 5.0 | % | | 15,642 | | | 589 | | | 5.0 | % |
| Other unsecured: | | | | | | | | | | | |
| Convertible senior notes | 269,111 | | | 4,503 | | | 6.7 | % | | 268,737 | | | 13,459 | | | 6.7 | % |
| Total interest expense/cost of funds | $ | 3,015,153 | | | 36,362 | | | 4.8 | % | | $ | 2,669,767 | | | 100,707 | | | 5.0 | % |
| Net interest income/spread | | | $ | 27,082 | | | 1.9 | % | | | | $ | 80,846 | | | 2.0 | % |
____________________
(1)Includes amortization of deferred debt issuance costs.
(2)Average balance represents average amortized cost on loans held-for-investment/held-for-sale, AFS securities and HTM securities.
(3)Loans primarily secured by a first priority lien on commercial real property and related personal property and also includes, when applicable, any companion subordinate loans.
| | | | | | | | | | | | | | | | | | | | | | | | | | | | | | | | | | | | | | | | | | | | | | | | | | | | |
| | Three Months Ended | | | | | | Nine Months Ended |
| (dollars in thousands) | | September 30, 2021 | | June 30, 2021 | | Q3’21 vs Q2’21 | | | | | | | | | | | | | | September 30, 2021 | | September 30, 2020 | | YTD’21 vs YTD’20 |
| Interest-earning assets | | | | | | | | | | | | | | | | | | | | | | | | |
| Loans held-for-investment/held-for-sale | | | | | | | | | | | | | | | | | | | | | | | | |
| Senior loans | | $ | 47,934 | | | $ | 48,970 | | | $ | (1,036) | | | | | | | | | | | | | | | $ | 150,561 | | | $ | 179,216 | | | $ | (28,655) | |
| Subordinated loans | | 378 | | | 380 | | | (2) | | | | | | | | | | | | | | | 1,140 | | | 2,020 | | | (880) | |
| Available-for-sale securities | | — | | | — | | | — | | | | | | | | | | | | | | | — | | | 646 | | | (646) | |
| Held-to-maturity securities | | — | | | — | | | — | | | | | | | | | | | | | | | — | | | 659 | | | (659) | |
| Other | | 95 | | | 103 | | | (8) | | | | | | | | | | | | | | | 298 | | | 424 | | | (126) | |
| Total interest income | | $ | 48,407 | | | $ | 49,453 | | | $ | (1,046) | | | | | | | | | | | | | | | $ | 151,999 | | | $ | 182,965 | | | $ | (30,966) | |
| Interest-bearing liabilities | | | | | | | | | | | | | | | | | | | | | | | | |
| Borrowings collateralized by: | | | | | | | | | | | | | | | | | | | | | | | | |
| Loans held-for-investment/held-for sale | | | | | | | | | | | | | | | | | | | | | | | | |
| Senior loans | | $ | 16,028 | | | $ | 16,410 | | | $ | (382) | | | | | | | | | | | | | | | $ | 48,938 | | | $ | 71,189 | | | $ | (22,251) | |
| Subordinated loans | | 67 | | | 67 | | | — | | | | | | | | | | | | | | | 201 | | | 253 | | | (52) | |
| Available-for-sale securities | | — | | | — | | | — | | | | | | | | | | | | | | | — | | | 198 | | | (198) | |
| Held-to-maturity securities | | — | | | — | | | — | | | | | | | | | | | | | | | — | | | 210 | | | (210) | |
| Other: | | | | | | | | | | | | | | | | | | | | | | | | |
| Senior secured term loan facilities | | 5,654 | | | 5,653 | | | 1 | | | | | | | | | | | | | | | 16,587 | | | 145 | | | 16,442 | |
| Convertible senior notes | | 4,556 | | | 4,544 | | | 12 | | | | | | | | | | | | | | | 13,618 | | | 13,570 | | | 48 | |
| Total interest expense | | 26,305 | | | $ | 26,674 | | | (369) | | | | | | | | | | | | | | | $ | 79,344 | | | $ | 85,565 | | | (6,221) | |
| Net interest income | | $ | 22,102 | | | $ | 22,779 | | | $ | (677) | | | | | | | | | | | | | | | $ | 72,655 | | | $ | 97,400 | | | $ | (24,745) | |
The majority of our interest-earning assets and liabilities have floating rates based on an index (e.g., 1-month U.S. LIBOR) plus a credit spread. As a result, our asset yields and cost of funds are impacted by changes in market interest rates and credit spreads on investments and borrowings, as well as changes in the mix of our investment portfolio credit spreads due to new originations, amendments of existing investments, additional fundings, upsizings and repayments.
The overall decrease in yields on our investment portfolioInterest Income
Interest income decreased from $49.5 million to $48.4 million for the three and nine months ended June 30, 2021 and September 30, 2020, as compared2021, respectively. This decrease is mainly due to the same periods in 2019, was primarily driven by a significant decline in short-term interest rates and repayments of loans with higher spreads than those originated in 2019. The overall decrease in cost of funds on our secured borrowings for the three and nine months ended September 30, 2020, as compared to the same periods in 2019, was primarily driven by the decline in short-term interest rates.
Our convertible senior notes due 2022 and 2023 are unsecured and pay interest semiannually at a rate of 5.625% and 6.375%, respectively, per annum. The cost of funds associated with our convertible senior notes also includesaccelerated amortization of deferred debt issuance costs.
Our senior secured term loan facilities due 2025 pay interest quarterly in arrearsfees driven by higher volume of repayments and accrues at the rate of (i) 8.00% per annum for any period for which accrued interest is paid in cash or (ii) 9.00% per annum for any period for which the borrowers elect to pay up to 50% of accrued interest in kind by adding such interest to the principal amount of the loans. If any amount under the term loan facilities is not paid when due, then such overdue amount would thereafter bear interest at a rate that is 4.00% per annum in excess of the interest rate otherwise payable on the term loan facilities. The cost of funds associated with our senior secured term loan facilities also includes amortization of deferred debt issuance costs.
Provision for Credit Losses
Subsequent to the adoption of ASU 2016-13 on January 1, 2020, we use a probability-weighted analytical model to estimate and recognize an allowance for credit losses on loans held-for-investment and their related unfunded commitments. Additionally, in determining the allowance for credit losses estimate through September 30, 2020, we employed third-party licensed macroeconomic forecasts, over the reasonable projection period, that include the impact of the COVID-19 pandemic on the overall economy and commercial real estate markets generally, and is not specific to any loan losses or impairments in our portfolio. Significant inputs to our estimate of the allowance for credit losses include loan specific factors such as DSCR,
LTV, remaining loan term, property type and others. In certain instances, for loans with unique risk characteristics, we may instead elect to employ different methods to estimate loan losses that also conform to ASU 2016-13 and related guidance.
The allowance for credit losses related to our portfolio is deducted from the carrying value on the balance sheet, while the allowance for credit losses related to off-balance sheet future funding commitments is recorded as a component of other liabilities. Changes in the provision for credit losses for both the assets and their related unfunded commitments are recognized through net income on the condensed consolidated statements of comprehensive (loss) income. The following table presents the components of provision for credit losses for$422.5 million during the three and nine months ended SeptemberJune 30, 2020:
| | | | | | | | | | | | | | | | | |
| Three Months Ended
September 30, | | Nine Months Ended
September 30, |
| (in thousands) | 2020 | | | | 2020 | | | | |
| Provision for credit losses on: | | | | | | | | | |
| Loans held-for-investment | $ | 3,371 | | | | | $ | (56,647) | | | | | |
| Available-for-sale securities | 256 | | | | | — | | | | | |
| Held-to-maturity securities | 938 | | | | | — | | | | | |
| Other liabilities | 735 | | | | | (5,594) | | | | | |
| Total provision for credit losses | $ | 5,300 | | | | | $ | (62,241) | | | | | |
For2021 versus $290.5 million during the three months ended September 30, 2020, our estimate of expected credit losses2021.
Interest income decreased slightly primarily duefrom $183.0 million to the changes in the composition of our investment portfolio as a result of loan sales and loan repayments and the availability of more information regarding the recessionary macroeconomic forecast employed in our loss estimation model stemming from the ongoing impact of the COVID-19 pandemic.
Realized Losses on Sales
During the three months ended September 30, 2020, we sold loans for $181.4 million with an amortized cost of $191.4$152.0 million for realized losses of $10.0 million. During the nine months ended September 30, 2020 we sold loans for $193.6 million with an amortized cost of $210.5 million for realized losses of $16.9 million. We did not sell any loans during the three and nine months ended September 30, 2019.
Fee Income
During both the nine months ended September 30, 2019 and September 30, 2020, we recognized $1.1 million in fee income related to fees charged for early prepayments of loans held-for-investment. During the three months ended September 30, 2020, we recognized $0.6 million in fee income related to fees charged for early prepayments of loans held-for-investment. No fee income was earned during the three months ended September 30, 2019.
Expenses
2021, respectively. The following table presents the components of expenses, other than restructuring charges, for the three and nine months ended September 30, 2020 and 2019:
| | | | | | | | | | | | | | | | | | | | | | | |
| Three Months Ended | | Nine Months Ended |
| September 30, | | September 30, |
| (in thousands, except share data) | 2020 | | 2019 | | 2020 | | 2019 |
| Management fees | $ | 3,974 | | | $ | 3,801 | | | $ | 11,840 | | | $ | 11,013 | |
| Incentive fees | $ | — | | | $ | — | | | $ | — | | | $ | 244 | |
| Servicing expenses | $ | 914 | | | $ | 1,013 | | | $ | 3,025 | | | $ | 2,671 | |
| Other operating expenses: | | | | | | | |
Compensation paid to certain officers by our Manager and reimbursed by us (1) | $ | 284 | | | $ | 226 | | | $ | 2,265 | | | $ | 1,836 | |
| Other direct and allocated costs paid by our Manager and reimbursed by us | 1,179 | | | 1,519 | | | 8,498 | | | 8,162 | |
Amortization of executive officers’ restricted stock (2) | 762 | | | 708 | | | 2,388 | | | 2,268 | |
| All other operating expenses/changes in operating expense accruals | 3,583 | | | 2,424 | | | 11,270 | | | 3,233 | |
| Total other operating expenses | $ | 5,808 | | | $ | 4,877 | | | $ | 24,421 | | | $ | 15,499 | |
| Annualized other operating expense ratio | 2.4 | % | | 1.9 | % | | 5.1 | % | | 2.1 | % |
____________________
(1)Officers include our principal financial officer, chief operating officer and general counsel. We do not reimburse our Manager for any expenses related to the compensation of our chief executive officer or chief investment officer.
(2)Equity based compensation expense related to the amortization of restricted stock awarded to our executive officers in conjunction with the Plan (see discussion in Note 16 - Equity Incentive Plan of the notes to our condensed consolidated financial statements included in this Quarterly Report on Form 10-Q), including our chief executive officer, chief investment officer, chief operating officer, principal financial officer, secretary and general counsel.
Currently, we do not have any employees and are externally managed by our Manager under the terms of the Management Agreement. Under the Management Agreement, our Manager and its affiliates currently provide us with the personnel and resources necessary to operate our business in exchange for a management fee and, if applicable, an incentive fee. The management feedecrease is calculated based on our equity with certain adjustments outlined in the Management Agreement. The incentive fee is calculated based on historical “core earnings,” as defined in the Management Agreement, as well as our equity with certain adjustments outlined in the Management Agreement. See further discussion of the base management fee and incentive fee calculations in Note 13 - Commitments and Contingencies of the notes to our condensed consolidated financial statements included in this Quarterly Report on Form 10-Q.
Upon consummation of the Internalization, we will no longer pay management or incentive fees to the Manager for any period following the Internalization and we will incur expenses associated with becoming an internally managed REIT, including compensation expenses previously borne by our Manager. For further discussion of the Internalization, see “The Internalization” above.
We also incur servicing expenses related to the servicing of commercial real estate loans and other operating expenses. The increase in servicing expenses during the three and nine months ended September 30, 2020, as compared to the same periods in 2019, was driven by the growth of our investment portfolio, as described above. The increase in our operating expense ratio during the three and nine months ended September 30, 2020, as compared to the same periods in 2019, resulted primarily from an increase in expenses related to the personnel and infrastructure to support the operation and growth of our business (and certain advisory and other professional fees). Included in other operating expenses are direct and allocated costs incurred by our Manager on our behalf and reimbursed by us, including compensation paid to employees of our Manager serving as our principal financial officer, chief operating officer and general counsel. We reimburse our Manager for our allocable share of the compensation paid by our Manager to its personnel serving as our chief operating officer, principal financial officer and general counsel; we do not reimburse our Manager for any expenses related to the compensation of our chief executive officer or chief investment officer.
Portfolio Overview
We originate and acquire commercial real estate debt and related instruments generally to be held as long-term investments. These assets are classified as “loans held-for-investment” on the condensed consolidated balance sheets. Loans held-for-investment are reported at cost, net of any unamortized acquisition premiums or discounts, loan fees and origination costs as applicable.
The following tables provide a summary of our portfolio as of September 30, 2020:
| | | | | | | | | | | | | | | | | | | | | | | | | | | | | | | | | | | | | | | | | | | | | | | | | | |
| (dollars in thousands) | | | | | | | | | | | | | | |
| Type | | Maximum Loan Commitment | | Principal Balance | | Carrying Value | | Cash Coupon (2) | | All-in Yield at Origination(3) | | Original Term (Years) | | Initial LTV (4) | | Stabilized LTV (5) |
Senior loans (1) | | $ | 4,642,351 | | | $ | 4,045,912 | | | $ | 3,953,665 | | | L+3.50% | | L+4.16% | | 3.1 | | | 66.1 | % | | 63.7 | % |
| Subordinated loans | | 26,876 | | | 26,876 | | | 25,197 | | | L+9.50% | | L+9.84% | | 8.2 | | | 55.8 | % | | 49.8 | % |
| | | | | | | | | | | | | | | | |
| Total/Wtd. Avg. | | $ | 4,669,227 | | | $ | 4,072,788 | | | $ | 3,978,862 | | | L+3.51% | | L+4.18% | | 3.1 | | | 66.0 | % | | 63.6 | % |
| | | | | | | | | | | | | | | | | | | | | | | | | | | | | | | | | | | | | | | | | | | | | | | | | | | | | | | | | | | | | | | | | | | | |
| (dollars in millions) | | | | | | | | | | | | | | | | | | | | |
Type (1) | | Origination/ Acquisition Date | | Maximum Loan Commitment | | Principal Balance | | Carrying Value | | Cash Coupon (2) | | All-in Yield at Origination (3) | | Original Term (Years) | | State | | Property Type | | Initial LTV (4) | | Stabilized LTV (5) |
| Senior | | 07/18 | | $127.4 | | $110.8 | | $108.1 | | L+3.34% | | L+4.27% | | 2.0 | | CA | | Retail | | 50.7% | | 55.9% |
| Senior | | 12/15 | | 120.4 | | 120.4 | | 117.8 | | L+3.65% | | L+4.43% | | 4.0 | | LA | | Mixed-Use | | 65.5% | | 60.0% |
| Senior | | 10/19 | | 120.0 | | 88.8 | | 86.7 | | L+3.24% | | L+3.86% | | 3.0 | | CA | | Office | | 63.9% | | 61.1% |
| Senior | | 12/19 | | 101.6 | | 84.2 | | 82.7 | | L+2.75% | | L+3.23% | | 3.0 | | IL | | Multifamily | | 76.5% | | 73.0% |
| Senior | | 08/19 | | 100.3 | | 85.1 | | 83.9 | | L+2.80% | | L+3.26% | | 3.0 | | MN | | Office | | 73.1% | | 71.2% |
| Senior | | 07/19 | | 94.0 | | 72.6 | | 70.9 | | L+3.69% | | L+4.32% | | 3.0 | | IL | | Office | | 70.0% | | 64.4% |
| Senior | | 06/19 | | 92.7 | | 70.6 | | 68.1 | | L+3.45% | | L+3.88% | | 3.0 | | TX | | Hotel | | 56.1% | | 48.1% |
| Senior | | 12/18 | | 92.0 | | 59.7 | | 58.9 | | L+3.75% | | L+5.21% | | 3.0 | | NY | | Mixed-Use | | 26.2% | | 47.6% |
| Senior | | 10/19 | | 87.8 | | 66.2 | | 64.5 | | L+2.55% | | L+3.05% | | 3.0 | | TN | | Office | | 70.2% | | 74.2% |
| Senior | | 05/17 | | 86.8 | | 82.6 | | 82.0 | | L+3.50% | | L+4.82% | | 4.0 | | MA | | Office | | 71.3% | | 71.5% |
| Senior | | 01/20 | | 81.9 | | 50.5 | | 49.6 | | L+3.25% | | L+3.93% | | 3.0 | | CO | | Industrial | | 47.2% | | 47.5% |
| Senior | | 06/19 | | 80.8 | | 80.3 | | 79.4 | | L+2.69% | | L+3.05% | | 3.0 | | TX | | Mixed-Use | | 71.7% | | 72.2% |
| Senior | | 09/19 | | 75.6 | | 70.4 | | 69.7 | | L+3.07% | | L+3.58% | | 3.0 | | NY | | Multifamily | | 62.7% | | 67.1% |
| Senior | | 10/19 | | 75.4 | | 75.4 | | 71.2 | | L+3.36% | | L+3.73% | | 3.0 | | FL | | Mixed-Use | | 67.7% | | 62.9% |
| Senior | | 10/17 | | 74.8 | | 53.9 | | 52.4 | | L+4.07% | | L+4.47% | | 4.0 | | DC | | Office | | 67.0% | | 66.0% |
| Senior | | 11/17 | | 73.3 | | 68.8 | | 64.8 | | L+4.45% | | L+5.20% | | 3.0 | | TX | | Hotel | | 68.2% | | 61.6% |
| Senior | | 12/16 | | 71.8 | | 68.0 | | 67.4 | | L+3.75% | | L+4.87% | | 4.0 | | FL | | Office | | 73.3% | | 63.2% |
| Senior | | 11/17 | | 68.3 | | 65.0 | | 64.6 | | L+4.10% | | L+4.73% | | 3.0 | | CA | | Office | | 66.8% | | 67.0% |
| Senior | | 01/19 | | 66.1 | | 66.1 | | 61.7 | | L+3.85% | | L+4.38% | | 3.0 | | MN | | Hotel | | 67.2% | | 64.5% |
| Senior | | 12/19 | | 65.2 | | 50.2 | | 49.3 | | L+2.80% | | L+3.28% | | 3.0 | | NY | | Office | | 68.8% | | 59.3% |
| Senior | | 04/18 | | 64.0 | | 64.0 | | 60.5 | | L+3.78% | | L+4.23% | | 3.0 | | GA | | Hotel | | 68.8% | | 59.8% |
| Senior | | 09/19 | | 60.2 | | 59.0 | | 58.5 | | L+3.00% | | L+3.63% | | 2.0 | | TX | | Office | | 64.7% | | 59.0% |
| Senior | | 12/18 | | 60.1 | | 52.5 | | 51.9 | | L+2.90% | | L+3.44% | | 3.0 | | TX | | Office | | 68.5% | | 66.7% |
| Senior | | 01/17 | | 58.6 | | 47.3 | | 46.9 | | L+4.50% | | L+5.16% | | 3.0 | | CA | | Industrial | | 51.0% | | 60.4% |
| Senior | | 01/17 | | 55.9 | | 55.9 | | 55.6 | | L+4.75% | | L+5.24% | | 4.0 | | SC | | Office | | 67.6% | | 67.1% |
| Senior | | 12/15 | | 54.5 | | 54.5 | | 54.1 | | L+3.73% | | L+4.87% | | 4.0 | | PA | | Office | | 74.5% | | 67.5% |
| Senior | | 06/19 | | 54.1 | | 50.4 | | 50.0 | | L+3.30% | | L+3.70% | | 3.0 | | VA | | Office | | 49.3% | | 49.9% |
| Senior | | 12/19 | | 52.3 | | 43.5 | | 42.8 | | L+3.61% | | L+4.20% | | 3.0 | | NY | | Industrial | | 76.8% | | 72.4% |
| Senior | | 10/18 | | 52.2 | | 50.6 | | 50.2 | | L+2.70% | | L+3.10% | | 3.0 | | NJ | | Industrial | | 73.9% | | 68.8% |
| Senior | | 05/17 | | 51.9 | | 51.9 | | 50.6 | | L+4.70% | | L+5.50% | | 3.0 | | HI | | Hotel | | 60.8% | | 59.4% |
| Senior | | 12/18 | | 51.0 | | 51.0 | | 50.4 | | L+2.99% | | L+3.40% | | 3.0 | | IL | | Multifamily | | 78.6% | | 74.9% |
| Senior | | 02/20 | | 50.2 | | 43.0 | | 40.9 | | L+3.30% | | L+3.75% | | 3.0 | | TN | | Hotel | | 69.1% | | 54.2% |
| Senior | | 09/18 | | 50.1 | | 22.0 | | 21.9 | | L+3.25% | | L+4.13% | | 3.0 | | IL | | Office | | 47.9% | | 56.1% |
| Senior | | 05/18 | | 50.1 | | 50.1 | | 49.5 | | L+3.60% | | L+3.85% | | 3.0 | | TX | | Multifamily | | 71.1% | | 71.4% |
| Senior | | 10/18 | | 49.1 | | 45.9 | | 44.9 | | L+4.15% | | L+5.24% | | 3.0 | | IL | | Multifamily | | 60.7% | | 62.4% |
| Senior | | 12/17 | | 47.0 | | 42.0 | | 41.4 | | L+4.38% | | L+5.26% | | 3.0 | | MA | | Mixed-Use | | 72.9% | | 62.0% |
| Senior | | 05/18 | | 46.5 | | 32.1 | | 31.9 | | L+4.07% | | L+4.63% | | 3.0 | | NY | | Mixed-Use | | 57.0% | | 51.1% |
| Senior | | 08/19 | | 46.4 | | 40.8 | | 40.0 | | L+2.84% | | L+3.39% | | 3.0 | | GA | | Office | | 69.5% | | 68.3% |
| Senior | | 07/16 | | 46.0 | | 36.2 | | 36.0 | | L+2.93% | | L+4.99% | | 4.0 | | VA | | Office | | 62.8% | | 61.5% |
| Senior | | 06/18 | | 46.0 | | 46.0 | | 44.3 | | L+3.60% | | L+4.06% | | 3.0 | | WY | | Hotel | | 67.4% | | 62.3% |
| Senior | | 08/18 | | 44.8 | | 43.2 | | 42.8 | | L+2.93% | | L+3.32% | | 3.0 | | TX | | Multifamily | | 68.9% | | 63.6% |
| Senior | | 05/19 | | 44.1 | | 41.0 | | 40.5 | | L+3.20% | | L+3.60% | | 3.0 | | NY | | Mixed-Use | | 59.7% | | 55.1% |
| Senior | | 10/19 | | 42.9 | | 32.2 | | 31.7 | | L+2.75% | | L+3.28% | | 3.0 | | CA | | Office | | 70.6% | | 67.8% |
| Senior | | 08/17 | | 40.0 | | 40.0 | | 36.0 | | L+4.24% | | L+4.40% | | 3.0 | | KY | | Multifamily | | 79.8% | | 73.1% |
| Senior | | 05/18 | | 38.8 | | 33.3 | | 33.2 | | L+3.18% | | L+3.95% | | 3.0 | | MA | | Office | | 47.0% | | 41.1% |
| | | | | | | | | | | | | | | | | | | | | | | | | | | | | | | | | | | | | | | | | | | | | | | | | | | | | | | | | | | | | | | | | | | | |
| (dollars in millions) | | | | | | | | | | | | | | | | | | | | |
Type (1) | | Origination/ Acquisition Date | | Maximum Loan Commitment | | Principal Balance | | Carrying Value | | Cash Coupon (2) | | All-in Yield at Origination (3) | | Original Term (Years) | | State | | Property Type | | Initial LTV (4) | | Stabilized LTV (5) |
| Senior | | 07/19 | | 37.5 | | 35.5 | | 33.2 | | L+3.70% | | L+4.43% | | 3.0 | | NJ | | Hotel | | 47.8% | | 54.6% |
| Senior | | 12/17 | | 37.2 | | 35.4 | | 35.1 | | L+3.90% | | L+4.55% | | 3.0 | | CA | | Office | | 69.8% | | 66.4% |
| Senior | | 11/18 | | 37.1 | | 26.1 | | 25.2 | | L+3.60% | | L+5.50% | | 3.0 | | CA | | Mixed-Use | | 69.9% | | 67.9% |
| Senior | | 10/18 | | 36.8 | | 30.1 | | 29.7 | | L+2.85% | | L+3.45% | | 3.0 | | NY | | Industrial | | 71.2% | | 70.8% |
| Senior | | 05/17 | | 35.0 | | 31.2 | | 29.8 | | L+5.00% | | L+5.97% | | 3.0 | | TX | | Office | | 68.7% | | 65.1% |
| Senior | | 06/18 | | 34.9 | | 30.3 | | 28.3 | | L+4.07% | | L+4.75% | | 3.0 | | OH | | Hotel | | 70.6% | | 57.4% |
| Senior | | 03/20 | | 34.9 | | 12.2 | | 11.8 | | L+3.42% | | L+4.66% | | 3.0 | | GA | | Office | | 63.2% | | 64.6% |
| Senior | | 12/18 | | 34.2 | | 28.1 | | 27.8 | | L+2.92% | | L+3.27% | | 4.0 | | IL | | Multifamily | | 70.8% | | 62.1% |
| Senior | | 05/17 | | 33.8 | | 29.8 | | 28.4 | | L+4.40% | | L+5.36% | | 3.0 | | AZ | | Office | | 69.5% | | 59.0% |
| Senior | | 03/16 | | 33.8 | | 33.8 | | 33.3 | | 5.11% | | 5.26% | | 10.0 | | NJ | | Office | | 74.9% | | 74.9% |
| Senior | | 10/19 | | 33.7 | | 26.0 | | 25.7 | | L+3.15% | | L+3.75% | | 3.0 | | CA | | Office | | 70.6% | | 64.2% |
| Senior | | 03/20 | | 33.5 | | 25.2 | | 24.8 | | L+2.80% | | L+3.27% | | 3.0 | | CA | | Office | | 63.6% | | 66.7% |
| Senior | | 11/19 | | 33.2 | | 29.1 | | 28.6 | | L+2.70% | | L+3.14% | | 3.0 | | NC | | Multifamily | | 80.0% | | 72.8% |
| Senior | | 03/19 | | 32.1 | | 27.5 | | 27.3 | | L+2.97% | | L+3.42% | | 3.0 | | NY | | Office | | 53.8% | | 48.5% |
| Senior | | 08/19 | | 32.0 | | 16.6 | | 16.3 | | L+3.32% | | L+5.27% | | 3.0 | | MA | | Office | | 76.5% | | 54.1% |
| Senior | | 08/19 | | 31.7 | | 28.3 | | 27.9 | | L+2.80% | | L+3.53% | | 3.0 | | LA | | Multifamily | | 74.1% | | 72.4% |
| Senior | | 08/19 | | 31.4 | | 26.6 | | 26.2 | | L+2.90% | | L+3.38% | | 3.0 | | TX | | Multifamily | | 79.3% | | 72.5% |
| Senior | | 11/19 | | 31.3 | | 31.1 | | 30.8 | | L+2.75% | | L+3.27% | | 2.0 | | IL | | Multifamily | | 72.7% | | 72.7% |
| Senior | | 05/17 | | 30.9 | | 28.9 | | 28.6 | | L+3.50% | | L+5.19% | | 4.0 | | FL | | Office | | 69.3% | | 68.5% |
| Senior | | 06/18 | | 29.3 | | 27.7 | | 27.5 | | L+3.40% | | L+4.18% | | 3.0 | | CA | | Office | | 69.1% | | 64.3% |
| Senior | | 06/18 | | 29.0 | | 29.0 | | 28.3 | | L+3.55% | | L+3.96% | | 3.0 | | TX | | Multifamily | | 74.3% | | 68.2% |
| Senior | | 07/17 | | 28.8 | | 28.8 | | 28.5 | | L+4.10% | | L+4.58% | | 3.0 | | NY | | Multifamily | | 76.5% | | 76.5% |
| Senior | | 11/18 | | 28.6 | | 26.3 | | 26.1 | | L+3.50% | | L+4.12% | | 3.0 | | TN | | Office | | 61.8% | | 63.6% |
| Senior | | 11/19 | | 27.7 | | 18.5 | | 18.2 | | L+3.18% | | L+3.64% | | 3.0 | | CA | | Office | | 61.7% | | 62.8% |
| Senior | | 01/19 | | 27.6 | | 26.5 | | 26.3 | | L+2.97% | | L+3.38% | | 3.0 | | TX | | Multifamily | | 64.9% | | 64.9% |
| Senior | | 12/18 | | 27.5 | | 27.2 | | 25.5 | | L+3.90% | | L+4.42% | | 3.0 | | MN | | Hotel | | 64.7% | | 57.7% |
| Senior | | 06/17 | | 27.0 | | 24.0 | | 23.5 | | L+3.83% | | L+5.24% | | 3.0 | | CA | | Hotel | | 54.7% | | 48.6% |
| Senior | | 01/19 | | 27.0 | | 24.1 | | 23.8 | | L+2.90% | | L+3.44% | | 3.0 | | MA | | Office | | 71.2% | | 70.1% |
| Senior | | 08/19 | | 26.8 | | 25.5 | | 25.0 | | L+3.15% | | L+3.67% | | 3.0 | | SC | | Multifamily | | 67.0% | | 58.7% |
| Senior | | 09/17 | | 26.4 | | 23.4 | | 22.0 | | L+4.90% | | L+5.52% | | 3.0 | | MA | | Hotel | | 67.3% | | 63.9% |
| Senior | | 12/18 | | 26.1 | | 21.8 | | 21.6 | | L+2.95% | | L+3.43% | | 3.0 | | FL | | Office | | 61.9% | | 65.5% |
| Senior | | 01/18 | | 26.0 | | 26.0 | | 24.3 | | L+5.13% | | L+5.58% | | 3.0 | | AZ | | Hotel | | 65.8% | | 61.3% |
| Senior | | 06/18 | | 25.9 | | 25.9 | | 25.5 | | L+3.50% | | L+4.37% | | 3.0 | | PA | | Industrial | | 72.1% | | 66.1% |
| Senior | | 09/18 | | 25.5 | | 22.0 | | 21.0 | | L+3.87% | | L+4.42% | | 3.0 | | NY | | Mixed-Use | | 60.2% | | 59.3% |
| Senior | | 06/19 | | 25.5 | | 25.5 | | 23.8 | | L+4.50% | | L+5.05% | | 3.0 | | NY | | Other | | 39.6% | | 39.6% |
| Senior | | 10/15 | | 25.1 | | 25.1 | | 23.8 | | L+4.07% | | L+5.76% | | 3.0 | | MO | | Hotel | | 73.2% | | 57.8% |
| Senior | | 08/19 | | 25.0 | | 23.9 | | 23.6 | | L+2.66% | | L+3.07% | | 2.0 | | OK | | Multifamily | | 79.9% | | 74.2% |
| Senior | | 07/19 | | 24.0 | | 18.2 | | 18.0 | | L+3.00% | | L+3.60% | | 3.0 | | OH | | Office | | 63.1% | | 66.1% |
| Senior | | 10/18 | | 23.7 | | 23.5 | | 22.0 | | L+4.21% | | L+5.16% | | 3.0 | | CT | | Hotel | | 75.4% | | 66.9% |
| Senior | | 01/18 | | 23.4 | | 21.4 | | 21.1 | | L+4.77% | | L+5.50% | | 3.0 | | PA | | Mixed-Use | | 66.8% | | 67.3% |
| Senior | | 07/19 | | 23.3 | | 20.0 | | 19.8 | | L+2.95% | | L+3.51% | | 3.0 | | CA | | Office | | 62.3% | | 62.6% |
| Senior | | 03/18 | | 23.0 | | 23.0 | | 21.1 | | L+4.05% | | L+4.65% | | 2.0 | | FL | | Office | | 60.8% | | 60.8% |
| Senior | | 06/18 | | 22.8 | | 17.5 | | 17.0 | | L+4.21% | | L+4.73% | | 3.0 | | FL | | Retail | | 74.0% | | 69.4% |
| Senior | | 01/19 | | 22.7 | | 22.7 | | 22.5 | | L+2.99% | | L+3.40% | | 3.0 | | WI | | Multifamily | | 69.3% | | 73.5% |
| Senior | | 04/18 | | 22.2 | | 22.2 | | 22.2 | | L+4.05% | | L+4.46% | | 3.0 | | KS | | Multifamily | | 72.1% | | 67.4% |
| Senior | | 08/17 | | 21.9 | | 18.9 | | 18.8 | | L+4.77% | | L+5.49% | | 3.0 | | PA | | Office | | 66.7% | | 67.3% |
| Senior | | 12/18 | | 21.8 | | 13.7 | | 13.5 | | L+4.44% | | L+5.56% | | 3.0 | | PA | | Multifamily | | 70.1% | | 67.0% |
| Senior | | 10/18 | | 21.5 | | 18.4 | | 18.1 | | L+3.24% | | L+3.69% | | 3.0 | | TX | | Office | | 73.0% | | 69.9% |
| Senior | | 12/18 | | 21.2 | | 19.6 | | 19.6 | | L+3.42% | | L+3.88% | | 2.0 | | MN | | Multifamily | | 73.6% | | 73.7% |
| Senior | | 03/19 | | 21.0 | | 20.0 | | 19.7 | | L+2.93% | | L+3.40% | | 3.0 | | KY | | Multifamily | | 69.8% | | 69.9% |
| Senior | | 06/19 | | 21.0 | | 19.5 | | 19.3 | | L+2.90% | | L+4.24% | | 3.0 | | GA | | Mixed-Use | | 60.6% | | 67.4% |
| Senior | | 06/19 | | 20.9 | | 15.7 | | 15.2 | | 10.00% | | 14.17% | | 1.0 | | FL | | Other | | 39.7% | | 57.2% |
| Senior | | 11/18 | | 19.0 | | 16.0 | | 15.7 | | L+3.20% | | L+3.83% | | 3.0 | | CA | | Office | | 73.1% | | 64.5% |
| Senior | | 04/18 | | 18.7 | | 18.7 | | 18.6 | | L+4.29% | | L+4.65% | | 3.0 | | NV | | Multifamily | | 78.7% | | 66.1% |
| Senior | | 08/19 | | 18.4 | | 18.4 | | 18.3 | | L+2.97% | | L+3.45% | | 3.0 | | TN | | Multifamily | | 63.6% | | 62.1% |
| Senior | | 01/19 | | 18.2 | | 18.1 | | 17.8 | | L+3.40% | | L+4.14% | | 3.0 | | TX | | Multifamily | | 72.2% | | 68.2% |
| | | | | | | | | | | | | | | | | | | | | | | | | | | | | | | | | | | | | | | | | | | | | | | | | | | | | | | | | | | | | | | | | | | | |
| (dollars in millions) | | | | | | | | | | | | | | | | | | | | |
Type (1) | | Origination/ Acquisition Date | | Maximum Loan Commitment | | Principal Balance | | Carrying Value | | Cash Coupon (2) | | All-in Yield at Origination (3) | | Original Term (Years) | | State | | Property Type | | Initial LTV (4) | | Stabilized LTV (5) |
| Senior | | 07/18 | | 16.6 | | 11.5 | | 11.1 | | L+3.75% | | L+4.35% | | 3.0 | | CA | | Office | | 77.1% | | 63.5% |
| Senior | | 09/18 | | 16.5 | | 16.5 | | 16.5 | | L+2.85% | | L+3.06% | | 3.0 | | SC | | Multifamily | | 79.4% | | 72.2% |
| Senior | | 11/18 | | 16.2 | | 16.2 | | 16.0 | | L+3.15% | | L+3.65% | | 3.0 | | TX | | Multifamily | | 68.8% | | 68.7% |
| Senior | | 06/19 | | 15.2 | | 10.7 | | 10.4 | | L+3.96% | | L+4.69% | | 3.0 | | NY | | Office | | 40.7% | | 60.0% |
| Senior | | 04/19 | | 14.3 | | 12.7 | | 12.6 | | L+3.75% | | L+4.31% | | 3.0 | | OH | | Multifamily | | 62.6% | | 65.4% |
| Mezzanine | | 01/17 | | 14.3 | | 14.3 | | 14.0 | | 8.00% | | 8.11% | | 10.0 | | HI | | Hotel | | 41.4% | | 36.2% |
| Senior | | 09/19 | | 12.0 | | 11.8 | | 11.5 | | L+2.99% | | L+3.50% | | 3.0 | | WI | | Multifamily | | 51.4% | | 75.0% |
| Mezzanine | | 08/15 | | 9.9 | | 9.9 | | 8.8 | | L+9.50% | | L+9.84% | | 5.0 | | GA | | Office | | 73.3% | | 67.1% |
| Mezzanine | | 11/15 | | 2.7 | | 2.7 | | 2.4 | | 13.00% | | 12.50% | | 10.0 | | NY | | Hotel | | 68.3% | | 58.0% |
| Total/Weighted Average | | $4,669.2 | | $4,072.8 | | $3,978.9 | | L+3.51% | | L+4.18% | | 3.1 | | | | | | 66.0% | | 63.6% |
____________________
(1)“Senior” means a loan primarily secured by a first priority lien on commercial real property and related personal property and also includes, when applicable, any companion subordinate loans.
(2)Cash coupon does not include origination or exit fees. Weighted average cash coupon excludes fixed rate loans.
(3)Yield includes net origination fees and exit fees, but does not include future fundings, and is expressed as a monthly equivalent. Weighted average yield excludes fixed rate loans.
(4)Initial loan-to-value ratio, or initial LTV, is calculated as the initial loan amount (plus any financing that is pari passu with or senior to such loan) divided by the as is appraised value (as determined in conformance with the Uniform Standards of Professional Appraisal Practice, or USPAP) as of the date of the loan was originated set forth in the original appraisal.
(5)Stabilized loan-to-value ratio, or stabilized LTV, is calculated as the fully funded loan amount (plus any financing that is pari passu with or senior to such loan), including all contractually provided for future fundings, divided by the as stabilized value (as determined in conformance with USPAP) set forth in the original appraisal. As stabilized value may be based on certain assumptions, such as future construction completion, projected re-tenanting, payment of tenant improvement or leasing commissions allowances or free or abated rent periods, or increased tenant occupancies.
Portfolio Management
During the three months ended September 30, 2020, we collected 99% of the contractual interest payments that were due under our loan agreements, after taking into consideration certain loans that have been modified mainly due to the impact of the COVID-19 pandemic.
We maintain strong relationshipsa lower average portfolio balance and an active asset management dialogue with our borrowers. We have utilized these relationships to address the impacts of the COVID-19 pandemic on our loans secured by properties experiencing business interruptions and pressure on operating cash flows, most significantly hotel and retail properties. As a result of the ongoing negative effects the pandemic has had on the economy, the real estate market as a whole and specific properties, some of our borrowers have indicated to us that they will be unable to execute their business plans on the original timeline, have had to temporarily close their properties by order of local authorities, have had tenants whose businesses were closed, or have experienced adverse business consequences, and have requested temporary interest forbearance (including deferrals and waivers), or other modifications of their loans. We have been working closely with our borrowers to provide them with short-term relief to help manage through these market dislocations and business interruptions at their properties. During the three months ended June 30, 2020, we modified 33 loans with an aggregate principal balance of approximately $1.3 billion. During the three months ended September 30, 2020, we modified 12 loans representing an aggregate principal balance of approximately $319.6 million. None of these modifications trigger the requirements for accounting as troubled debt restructurings. The Company’s loan modifications typically include temporary reductionsdecrease in the amount of cash interest collected, permit accrual of a portion of the interest due during the modification period to be repaid at a later date, permit the use of existing cash loan reserves to pay debt service due on our loans and other property-level expenses, and/or waive term extensions and certain performance test or covenant. The loan modifications are typically coupled with additional equity or other forms of credit support from the sponsors. All of the modified loans were performing and none were on non-accrual status as of September 30, 2020. The total amount of interest income that was deferred and added to the principal during the three months ended June 30, 2020 and September 30, 2020 was $1.4 million and $3.1 million, respectively.
We are generally encouraged by our borrowers’ initial response to the COVID-19 impact on their properties. We continue to work with our borrowers to address the circumstances caused by the pandemic while seeking to protect the credit attributes of our portfolio. However, these efforts may not be successful in all cases, and we may experience payment delinquencies, defaults, foreclosures or losses. While we believe the principal amounts of our loans are generally adequately protected by the underlying value of the collateral properties, there is a risk that we will not realize the entire principal amount of certain of our loan investments.
Financial Condition
As of September 30, 2020, our borrowings consisted of repurchase agreements collateralized by loans held-for-investment, securitized debt obligations issued by CLOs and collateralized by pools of loans held-for-investment, asset-specific financings collateralized by loans held-for-investment, long-term senior secured term loan facilities and long-term unsecured convertible senior notes.
As of September 30, 2020, we had outstanding $1.9 billion of repurchase agreements, and the term to maturity ranged from 214 days to approximately 2.3 years. Repurchase agreements had a weighted average borrowing rate of 2.32% and weighted average remaining maturities of 1.3 years as of September 30, 2020.LIBOR.
Interest Expense
Interest expense moderately decreased from $26.7 million to $26.3 million for the three months ended June 30, 2021 and September 30, 2021, respectively. The change in interest expense between these two comparable periods is immaterial.
Interest expense decreased from $85.6 million to $79.3 million for the nine months ended September 30, 2020 we had outstanding $928.6 million of securitized debt obligations with a weighted average borrowing rate of 1.69% and weighted average remaining maturities of 0.9 years.
As of September 30, 2020, we had outstanding $123.1 million2021, respectively. The decrease is due to a lower average borrowings balance, offset by a decrease in average LIBOR and the addition of asset-specific financings with a weighted average borrowing rate of 2.5% and weighted average remaining maturities of 1.4 years.
As of September 30, 2020, the total outstanding amount due on the senior secured term loan facilities was $205.6 million, netfacilities.
Operating Expenses
We incur significant general and administrative costs, including costs related to employee compensation and benefits, expenses related to servicing of deferred issuance costs. Interest on the outstanding loans under the termour loan facilities is payable quarterly in arrearsportfolio, costs related to technology infrastructure, rent and accrues at the rate of (i) 8.00% per annum for any period for which accrued interest is paid in cash or (ii) 9.00% per annum for any period for which the borrowers electutilities, and certain costs related to pay up to 50% of accrued interest in kind by adding such interest to the principal amount of the loans. The term loan facilities will mature on September 25, 2025.
As of September 30, 2020, the total outstanding amount due on convertible senior notes was $270.8 million, net of deferred issuance costs. The notes are unsecured and pay interest semiannually atbeing a rate of 5.625% per annum on the notes maturing in December 2022 and a rate of 6.375% per annum on the notes maturing in October 2023. As of September 30, 2020, the notes had a conversion rate of 50.7073 and 48.8496shares of common stock per $1,000 principal amount of the notes, respectively.
As of September 30, 2020, the debt-to-equity ratio with respect to our loans held-for-investment, defined as total debt, net of cash, divided by equity, was 3.2:1.0.
public company. The following table providespresents the quarterly average balances, the quarter-end balances and the maximum balances at any month-end within that quarterly period,components of borrowings under repurchase agreements, asset-specific financings, revolving credit facilities, securitized debt obligations, the senior secured term loan facilities and convertible senior notesexpenses for the three months ended September 30, 2021 and June 30, 2021, and the nine months ended September 30, 2021 and 2020:
| | | | | | | | | | | | | | | | | | | | | | | | | | | | | | | | | | | | | | | | | | | | | |
| Three Months Ended | | | | Nine Months Ended | | |
| (in thousands, except share data) | September 30, 2021 | | June 30, 2021 | | Q3’21 vs. Q2’21 | | | | | | | | September 30, 2021 | | September 30, 2020 | | Q3’21 vs. Q3’20 | | | | |
| Base management fees | $ | — | | | $ | — | | | $ | — | | | | | | | | | $ | — | | | $ | 11,840 | | | $ | (11,840) | | | | | |
| Compensation and benefits | 5,634 | | | 5,017 | | | 617 | | | | | | | | | 16,111 | | | 11,673 | | | 4,438 | | | | | |
| Servicing expenses | 1,323 | | | 1,124 | | | 199 | | | | | | | | | 3,763 | | | 3,025 | | | 738 | | | | | |
| Restructuring charges | — | | | — | | | — | | | | | | | | | — | | | 43,682 | | | (43,682) | | | | | |
| | | | | | | | | | | | | | | | | | | | | |
| | | | | | | | | | | | | | | | | | | | | |
| | | | | | | | | | | | | | | | | | | | | |
| | | | | | | | | | | | | | | | | | | | | |
| | | | | | | | | | | | | | | | | | | | | |
| | | | | | | | | | | | | | | | | | | | | |
| Other operating expenses | 2,276 | | | 2,564 | | | (288) | | | | | | | | | 6,967 | | | 12,748 | | | (5,781) | | | | | |
| Annualized operating expense ratio | 3.9 | % | | 3.6 | % | | 0.3 | % | | | | | | | | 5.6 | % | | 5.1 | % | | 0.5 | % | | | | |
| Annualized operating expense ratio, excluding non-cash equity compensation and other one-time expenses | 3.0 | % | | 3.0 | % | | — | % | | | | | | | | 3.0 | % | | 4.2 | % | | (1.2) | % | | | | |
Prior to the Internalization, we paid the Former Manager a base management fee and, when applicable, an incentive fee. The base management fee was calculated based on our equity with certain adjustments outlined in the management agreement with the Former Manager, or the Former Management Agreement. The incentive fee was calculated based on historical “core earnings,” as defined in the Former Management Agreement, as well as our equity with certain adjustments outlined in the Former Management Agreement. Following the Internalization, we no longer incur management or incentive fees, but we incur expenses associated with being an internally managed REIT, including certain compensation expenses, which were previously borne by the Former Manager.
In connection with the Internalization, the Company extended offers of employment and hired 31 employees.The three months ended March 31, 2021 was the first period in which the Company began reporting expenses related to compensation and benefits related to its employees.For comparison purposes, the Company reallocated compensation related expenses, including amortization of non-cash equity compensation, from other operating expenses for the nine months ended September 30, 2020.The compensation and benefits expense line item on the Company’s income statement is comprised primarily of base salaries, cash bonuses, non-cash equity-based compensation and other employee benefits and employer payroll taxes.
Expenses modestly increased from $8.7 million for the three months ended June 30, 2021 to $9.2 million for the three months ended September 30, 2021. The increase was primarily driven by higher non-cash equity compensation expenses and servicing expenses, offset by a decrease in professional services fees.
Expenses decreased from $83.0 million to $26.8 million for the nine months ended September 30, 2020 and September 30, 2021, respectively. The decrease was primarily driven by management fees, restructuring charges, and higher professional service fees incurred during the four immediately preceding quarters:nine months ended September 30, 2020, partially offset by higher compensation costs in 2021.
| | | | | | | | | | | | | | | | | | | |
| (in thousands) | Quarterly Average | | End of Period Balance | | Maximum Balance of Any Month-End | | |
| For the Three Months Ended September 30, 2020 | $ | 3,262,423 | | | $ | 3,379,053 | | | $ | 3,379,053 | | | |
| For the Three Months Ended June 30, 2020 | $ | 3,443,291 | | | $ | 3,418,705 | | | $ | 3,446,516 | | | |
| For the Three Months Ended March 31, 2020 | $ | 3,422,580 | | | $ | 3,481,865 | | | $ | 3,481,865 | | | |
| For the Three Months Ended December 31, 2019 | $ | 3,299,023 | | | $ | 3,393,172 | | | $ | 3,393,172 | | | |
| For the Three Months Ended September 30, 2019 | $ | 3,015,152 | | | $ | 3,233,053 | | | $ | 3,233,053 | | | |
During the three months ended September 30, 2021, our provision for credit losses decreased by $5.8 million, which contributed to the decline in the overall allowance for credit losses to $47.4 million at September 30, 2021 from $62.9 million at June 30, 2021. The remaining decrease in allowance for credit losses was largely related to the $9.7 million write-off on a loan held-for-investment and a release of reserve of $3.2 million on unfunded commitments on a collateral-dependent loan, which were deemed unlikely to be funded given the loan’s delinquent status.
Liquidity and Capital Resources
Liquidity is a measure of our ability to meet potential cash requirements, including ongoing commitments to repay borrowings, fund and maintain our target investments and operations, make distributions to our stockholders and meet other general business needs. We use cash to acquire our target investments, satisfy our obligations under our unfunded loan commitments on existing assets, repay principal and interest on our borrowings, make distributions to our stockholders and fund our operations.
In light of the COVID-19 pandemic and its severe impact on the economy, real estate and financial markets, we have taken several steps to increase our cash balances, such as opportunistically selling certain loans and our borrowing of $225.0 million of loans under five-year senior secured term loan facilities, in order to maintain an adequate level of liquidity to meet future outflows. As the duration and severity of COVID-19 remain unknown, we will continue to closely monitor the pandemic and its impact on us, our borrowers, our sponsors and their properties serving as collateral on our loans, our financing sources and the overall economy. Because the severity, magnitude and duration of the COVID-19 pandemic and its economic consequences continue to be highly uncertain, changing and challenging to predict, the pandemic’s impact on our operations and liquidity remains uncertain and difficult to predict.
Capitalization
To date we have capitalized our business primarily through the issuance and sale of shares of our common stock, borrowings under our secured financing facilities, issuance of CRE CLOs, borrowings under our senior secured term loan facilities and the issuance and sale of convertible notes. As of September 30, 2021, our capitalization included $0.5 billion of corporate debt and $2.4 billion of loan-level financing. No portion of our corporate debt matures before December 2022 and our loan-level financing is generally term-matched or matures in 2022 or later. Our $2.4 billion of loan-level financing includes $916.8 million of secured repurchase agreements, $1.4 billion of CRE CLO securitizations, which are term-matched to the underlying assets, non-recourse and non-mark-to-market, $127.9 million of term financing facility and $44.8 million of asset-specific financing facility.
See Note 4 - Variable Interest Entities and Securitized Debt Obligations to our consolidated financial statements for additional details regarding our securitized debt obligations.
See Note 5 - Secured Financing Agreements to our consolidated financial statements for additional details regarding our secured repurchase facilities, asset-specific financing facility, and term financing facility.
See Note 6 - Convertible Senior Notes to our consolidated financial statements for additional details regarding our secured senior convertible notes.
See Note 7 - Senior Secured Term Loan Facilities to our consolidated financial statements for additional details regarding our senior secured term loan facilities.
Leverage
From June 30, 2021 to September 30, 2021, our debt-to-equity ratio, defined as total debt, net of cash, divided by equity, increased from 2.8:1.0 to 3.0:1.0. As part of our investment strategy, we plan to finance our target assets with a moderate amount of leverage, the level of which may vary based upon the particular characteristics of our portfolio and market conditions. To that end, subject to maintaining our qualification as a REIT and our exclusion from registration under the Investment Company Act, we intend to use borrowings to fund the origination or acquisition of our target investments. Given our focus on senior floating-rate mortgage loans, we currently expect that such leverage will be, on a total debt-to-equity ratio basis, within a range of 3.0:1.0 and 3.5:1.0; however, our leverage may vary and differ from our expectations depending on market conditions and any steps we may take to strengthen our balance sheet and enhance our liquidity position. The amount of leverage we deploy for our target investments depends upon our assessment of a variety of factors, which may include the anticipated liquidity and price volatility of the investments in our portfolio, the potential for losses in our portfolio, the gap between the duration of our assets and liabilities, the availability and cost of financing the investments, our opinion of the creditworthiness of our financing counterparties, the health of the U.S. economy and commercial real estate financing markets, our outlook for the level and volatility of interest rates, the slope of the yield curve, the credit quality of our investments, the collateral underlying our investments and our outlook for investment spreads relative to LIBOR.
Sources of Liquidity
Our primary sources of liquidity include cash consist ofon our condensed consolidated balance sheets, any approved but unused borrowing capacity under our financing facilities, the net proceeds of future public and private equity and debt offerings, payments of principal, including loan repayments and prepayments, loan sales, interest we receive on our portfolio of assets and cash generated from our operating results. We also have an option to draw up to an additional $75.0 million
The following table sets forth our sources of proceedsliquidity as of September 30, 2021:
| | | | | | | | |
| | Three Months Ended |
| (in thousands) | | September 30, 2021 |
| Cash and cash equivalents | | $ | 154,916 | |
| Approved but unused borrowing capacity on financing facilities | | — | |
| | |
| Total | | $ | 154,916 | |
Unused borrowing capacity on a delayed draw basis under the senior secured term loanour uncommitted financing facilities during the sixth-month period after September 25, 2020, which period may be extended for an additional six months upon paymenta potential source of an extension fee.
We continueliquidity to monitor the COVID-19 pandemicfinance unpledged commercial real estate loans held-for-investment and its impact on us, our borrowers, our sponsors and their properties serving as collateralunpledged funded loan commitments on our existing loans ourheld-for-investment that are pledged on such facilities. Given the uncommitted nature of such financing sources and the overall economy. Because the severity, magnitude and duration of the COVID-19 pandemic and its economic consequences continue to be highly uncertain, rapidly changing and challenging to predict, the pandemic’s impact on our operations and liquidity remains uncertain and difficult to predict.
Other than capital markets activities, loan repayments and prepayments typically comprise our largest source of incremental liquidity. Prior to the onset of the COVID-19 pandemic and given the seasoning and overall credit characteristics of our portfolio, we had anticipated to realize loan repayments of over $1 billion in 2020. As a result of the pandemic and its impact on the capital markets and overall economy, the pace of loan repayments and prepayments has slowed meaningfully, as compared to prior years. Loan repayments, as measured by principal amount repaid, were $778.5 million in 2019. For the nine months ended September 30, 2020, loan repayments totaled $317.2 million, and seven loans with an unpaid principal balance of $211.1 million were sold for $193.5 million. We currently anticipate the pace of loan repayments and prepayment to continue to be negatively affected by the ongoing effects of the pandemic.
We expect that the impact of the COVID-19 pandemic will likely continue to decrease our cash flow from operations as we seek to enter into loan modifications on certain of our loans permitting interest payments to be deferred and/or capitalized, andfacilities, obtaining
as we repay borrowings under
liquidity on such unpledged loans and unpledged funded loan commitments is to varying degrees at the discretion of our secured financing facilities. In addition, we are ablelending counterparties and may not be available to generate incremental liquidity through the reinvestment provisions of the CLO that we closed on in 2019, the FL2 CLO, which allows us to reinvest certain proceeds generated from repayments or prepayments of loans financed through the FL2 CLO by either increasing the principal amount of existing CLO collateral assets or acquiring additional qualified collateral assets to maintain the aggregate amount of collateral assets in the CLO and the related financing outstanding. Because of the COVID-19 pandemic, the pace of any suchwhen desired.
Other than capital markets activities, investment repayments and prepayments has also slowed meaningfully,typically comprise our largest source of incremental liquidity. For the nine months ended September 30, 2021, investment repayments and principal amortization totaled $815.1 million.
Depending on capital markets conditions, we currently anticipatehave access to liquidity through public and/or private offerings of debt and equity securities, including shares of preferred stock and convertible securities. We intend to maintain a shelf registration statement to facilitate the pacesale of debt and equity securities. At any given time and from time to continuetime we may be evaluating or pursuing one or more transactions to be negatively affected by the ongoing effects of the pandemic.
We remain focused on strengthening our balance sheet and enhancingimprove our liquidity positionor to best position usrefinance our debt or may otherwise seek transactions to weather near-term market uncertainty, satisfyreduce our loan future fundinginterest expense or leverage and financing obligations and to potentially make opportunistic new investments, which we expect will cause us to take, and in some instances has already caused us to take, some or all of the following actions: raise capital from offerings of equity and/orextend our debt securities, on a public or private basis, borrow additional capital, post additional capital, sell assets and/or change our dividend policy, which we will continue to evaluate in respect of future quarters based upon customary considerations, including market conditions and distribution requirements to maintain our REIT status.maturities.
In the future, we may also use other additional sources of financing to fund the origination or acquisition of our target investments, including other financing facilities and other secured and unsecured forms of borrowing. These financings may be collateralized or non-collateralized and may involve one or more lenders. We expect that these facilities will typically have maturities ranging from two to five years and may accrue interest at either fixed or floating rates. We may also finance our business through the non-recoursenonrecourse sale of senior loan interests. We may also increase our proportion of credit non-mark-to-market financing on our commercial real estate loan portfolio through additional CRE CLOs or other securitizations, if available. There can be no assurance that we will be able to consummate any such financing on a timely basis, or at all, or that theythe financing will be on commercially reasonable terms.
We may also seek to raise further equity capital and issue additional debt securities in order to fund our future investments. We may also seek to enhance the returnsremain focused on our commercial real estate loan portfolio through additional CLOs or other securitizations, if available.
We are party to an equity distribution agreement under which we may sell up to an aggregate of 8,000,000 shares of our common stock from time to time in any method permitted by law deemed to be an “at-the-market” offering as defined in Rule 415 under the Securities Act of 1933, as amended, or Securities Act. As of September 30, 2020, 3,242,364 shares of common stock had been sold under the equity distribution agreement for total accumulated net proceeds of approximately $61.2 million. No shares were sold during the nine months ended September 30, 2020.
As of September 30, 2020, we held $353.7 million in cash and cash equivalents available to support our operations; $4.0 billion of loans held-for-investment; and $3.4 billion of outstanding debt in the form of repurchase agreements, securitized debt obligations, asset-specific financings, long-term senior secured term loan facilities and long-term unsecured convertible senior notes. From June 30, 2020 to September 30, 2020, our debt-to-equity ratio, defined as total debt, net of cash, divided by equity,decreased from 3.5:1.0 to 3.2:1.0. To that end, subject to maintaining our qualification as a REIT and our exclusion from registration under the Investment Company Act, we intend to use borrowings to fund the origination or acquisition of our target investments. Given our focus on senior floating-rate mortgage loans, we currently expect that such leverage will be, on a debt-to-equity basis, within a range of 3.0:1.0 and 3.5:1.0 ratio on a company basis, however, our leverage may vary depending on market conditions and any steps we may take to strengthenactively managing our balance sheet and enhanceenhancing our liquidity position. The amount of leverageposition to best position us for the market environment, satisfy our loan future funding and financing obligations and to make new investments, which we deploy for our target investments depends upon our assessment of a variety of factors, which may include the anticipated liquidityexpect will cause us to take, and price volatilityin some instances has already caused us to take, some or all of the investments in our portfolio, the potential for losses in our portfolio, the gap between the durationfollowing actions: raise capital from offerings of our assets and liabilities, including hedges, the availability and cost of financing the investments, our opinion of the creditworthiness of our financing counterparties, the health of the U.S. economy and commercial real estate financing markets, our outlook for the level and volatility of interest rates, the slope of the yield curve, the credit quality of our investments, the collateral underlying our investments and our outlook for investment spreads relative to LIBOR.
Our primary sources of liquidity include cash and cash equivalents. As of September 30, 2020, we held approximately $353.7 million in cash and cash equivalents. A potential additional source of liquidity may be using unused borrowing capacity on our uncommitted financing facilities to finance unpledged commercial real estate loans held-for-investment and unpledged funded loan commitments on our existing loans held-for-investment that are pledged on such facilities. Given the uncommitted nature of such financing facilities, obtaining liquidity on such unpledged loans and unpledged funded loan commitments is at varying degrees of discretion of our lending counterparties and may not be available to us when desired. Generally, unused borrowing capacity may be the result of our election not to utilize certain financing, as well as delays in the timing in which funding is provided for a specific investment. We monitor and forecast our available, equity and/or excess, liquiditydebt securities, on a daily basis. If borrowing ratespublic or private basis; borrow additional capital; post additional collateral; sell assets; and/or collateral requirements change in the near term,our dividend policy, which we believe we are subject to less earnings volatility than a more leveraged organization.
During the nine months ended September 30, 2020, we did not experience any material restrictions to our funding sources, although we did voluntarily terminate our short-term secured revolving credit facility. We expect ongoing sources of financing to primarily consist of repurchase agreements, asset-specific financings, revolving credit facilities, securitizations, convertible notes, issuance of common stock, potential additional securitizations and similar financing arrangements. We will continue to explore other typesevaluate in respect of funding facilities to further diversify our financing sources. We plan to finance our assets with a moderate amount of leverage, the level of which may varyfuture quarters based upon the particular characteristics ofcustomary considerations, including market conditions and distribution requirements to maintain our portfolio and market conditions.
As of September 30, 2020, we had repurchase agreements in place with five counterparties (lenders) and an asset-specific financing facility with one counterparty to finance loans held-for-investment. We continue to evaluate additional counterparties to manage and reduce counterparty risk. Under our repurchase agreements, our counterparties may make margin calls because of a perceived decline in the value of our assets collateralizing the given secured financing arrangement due to a credit event, or under a limited number of our repurchase agreements, market events. To cover a margin call, we may transfer cash to such counterparty. At maturity, any cash on deposit as collateral is generally applied against the repurchase agreement balance, thereby reducing the amount borrowed. Should the value of our assets suddenly decrease, significant margin calls on our repurchase agreements could result, causing an adverse change in our liquidity position.
We are in frequent, constructive dialogue with our secured credit facilities counterparties regarding our management of their collateral assets in light of the impacts of the COVID-19 pandemic. We have reduced the advance rate on certain assets within these facilities by transferring cash and/or providing additional unencumbered assets to such counterparties, thereby reducing the amount we are able to borrow against such assets and mitigating risks associated with future margin calls. There can be no assurance that we have adequate capacity to satisfy any potential margin call or that we would be able to enter into amendments to our agreements that prevent a foreclosure on any margin call.
An overview of our facilities that provide short- and long-term financing for our loans held-for-investment is presented in the table below:
| | | | | | | | | | | | | | | | | | | | | | | | | | | | | | | |
| September 30, 2020 | | |
| (in thousands) | Maturity Date (1) | | Committed | | Amount Outstanding | | Unused Capacity | | Total Capacity | | |
| Repurchase facilities: | | | | | | | | | | | |
| Morgan Stanley Bank | June 28, 2021 | | No | | $ | 498,181 | | | $ | 101,819 | | | $ | 600,000 | | | |
| Goldman Sachs Bank | May 2, 2021 | | No | | $ | 405,971 | | | $ | 94,029 | | | $ | 500,000 | | | |
| JPMorgan Chase Bank | June 28, 2022 | | No | | $ | 400,880 | | | $ | 103,226 | | | $ | 504,106 | | | |
| Citibank | January 9, 2023 | | No | | $ | 390,767 | | | $ | 9,233 | | | $ | 400,000 | | | |
Wells Fargo Bank (2) | June 28, 2021 | | No | | $ | 155,046 | | | $ | 119,954 | | | $ | 275,000 | | | |
| Asset-specific financings: | | | | | | | | | | | |
| Canadian Imperial Bank of Commerce | Various | | No | | $ | 123,091 | | | $ | 26,909 | | | $ | 150,000 | | | |
| | | | | | | | | | | |
| | | | | | | | | | | |
____________________
(1)The facilities are set to mature on the stated maturity date, unless extended pursuant to their terms.
(2)We retain an option to increase the maximum facility capacity amount up to $350 million, subject to customary terms and conditions.
We are subject to a variety of financial covenants under our lending agreements. The following represent the most restrictive financial covenants across the agreements as of September 30, 2020:
•Unrestricted cash cannot be less than the greater of $30.0 million and 5.0% of recourse indebtedness. As of September 30, 2020, our unrestricted cash, as defined, was $353.7 million, while 5.0% of our recourse indebtedness, as defined, was $50.9 million.
•Tangible net worth must be greater than the sum of 75.0% of tangible net worth as of September 30, 2020 and 75.0% of net cash proceeds of additional equity issuances, which calculates to $782.3 million. As of September 30, 2020, our tangible net worth, as defined, was $0.9 billion.
•Target asset leverage ratio cannot exceed 77.5% and our total leverage ratio cannot exceed 80.0%. As of September 30, 2020, our target asset leverage ratio, as defined, was 71.6% and our total leverage ratio, as defined, was 77.3%.
•Minimum interest coverage must be greater than 1.5:1.0. As of September 30, 2020, our minimum interest coverage, as defined, was 2.4:1.0.
During the third quarter of 2020, we amended our repurchase facilities and our asset-specific financing facility to, among other things, exclude the impact of general CECL reserves under ASU 2016-13 from the calculation of the tangible net worth and leverage ratio financial covenants. The foregoing summary of the amendments is not complete and is qualified in its
entirety by reference to the full and complete text thereof, copies of which are attached as exhibits to this Quarterly Report on Form 10-Q.
We may also be subject to additional financial covenants in connection with various other agreements we enter into in the normal course of our business. We intend to continue to operate in a manner which complies with all of our financial covenants.
The following table summarizes assets at carrying values that were individually pledged or restricted as collateral for the future payment obligations of repurchase agreements, asset-specific financings, revolving credit facilities and securitized debt obligations as of September 30, 2020 and December 31, 2019:
| | | | | | | | | | | |
| (in thousands) | September 30,
2020 | | December 31,
2019 |
| Loans held-for-investment | $ | 3,944,486 | | | $ | 4,081,155 | |
| Available-for-sale securities, at fair value | — | | | 12,830 | |
| Held-to-maturity securities | — | | | 18,076 | |
| | | |
| | | |
| | | |
| Total | $ | 3,944,486 | | | $ | 4,112,061 | |
Although we generally intend to hold our target investments as long-term investments, we have opportunistically sold, and may again in the future sell, certain of our assets in order to manage our liquidity needs, to meet other operating objectives and to adapt to market conditions. Commercial real estate loansloan sales are subject to longer trade timelines than securities transactions and, as a result, market conditions could significantly and adversely affect the liquidity of our assets. Any illiquidity of our assets may make it difficult for us to sell such assets if the need or desire arises. Our ability to quickly sell certain assets may be limited by delays due to the time period needed for negotiating transaction documents and conducting diligence. Consequently, even if we identify a buyerbuyers for our commercial real estate loans, there is no assurance that we would be able to quickly sell such assets, if the need or desire arises. Additionally, we cannot assure youprovide any assurance that the recent economic and market impact of the COVID-19 pandemic would not make it more difficult to sell certain of our assets or that it would not have a material impact on the value of our assets.
In addition, if we are required to liquidate all or a portion of our portfolio quickly, we may realize significantly less than the value at which we previously recorded our assets. Assets that are illiquid are more difficult to finance, and to the extent that we use leverage to finance assets that become illiquid, we may lose that leverage or have it reduced. Assets tend to become less liquid during times of financial stress, which is often the time that liquidity is most needed. As a result, our ability to sell assets or vary our portfolio in response to changes in economic and other market conditions may be limited by liquidity constraints, which could adversely affect our results of operations and financial condition.
We cannot predict the timing and impact of future sales of our assets, if any. Since many of our assets are financed with repurchase agreements, asset-specific financings and revolving creditsecured financing facilities and/or CRE CLOs, a significant portion of the proceeds from sales of our assets, prepayments and scheduled amortization would be used to repay balances under these financing arrangements.
Liquidity Needs
In addition to our loan origination activities and general operating expenses, our primary liquidity needs include interest and principal payments under our $3.0 billion of outstanding borrowings under our repurchase facilities, our collateralized loan obligations, our term financing facility, our asset-specific financing facility, our senior secured term loan facilities, our convertible senior notes, $430.1 million of unfunded loan commitments and dividend distributions to our preferred and common stockholders.
Financing Availability
We are subject to the availability and cost of financing to successfully execute on our business strategy and generate attractive risk-adjusted returns to our stockholders. Much of our financing is in the form of repurchase facilities or other types of credit facilities provided to us by our lender counterparties. We mitigate this counterparty risk by seeking to diversify our lending partners, focusing on establishing borrowing relationships with strong counterparties and continuously monitoring them through a thoughtful approach to counterparty risk oversight. Additionally, as part of our broader risk management strategy, and to the extent available in the market, we finance our business through other means which may include, but not be limited to,
CRE CLOs, note sales and the issuance of unsecured debt and equity instruments. We continue to actively explore additional types of funding facilities in order to further diversify our financing sources. The COVID-19 pandemic has resulted in significant disruptions in financial markets and uncertainty about the overall macroeconomic outlook. Declines in economic conditions could negatively impact real estate and real estate capital markets, which could make it more difficult for us to obtain or maintain financing.
The following table provides the maturities of our repurchase agreements,facilities, asset-specific financings, revolving credit facilities,financing facility, term financing facility, securitized debt obligations, long-term senior secured term loan facilities and convertible senior notes, net of deferred debt issuance costs, as of September 30, 20202021 and December 31, 2019:2020:
| | (in thousands) | (in thousands) | September 30,
2020 | | December 31,
2019 | (in thousands) | September 30,
2021 | | December 31,
2020 |
| Within one year | Within one year | $ | 1,589,096 | | | $ | 709,363 | | Within one year | $ | 1,522,713 | | | $ | 1,763,359 | |
| One to three years | One to three years | 1,455,222 | | | 2,533,995 | | One to three years | 1,067,739 | | | 1,266,985 | |
| Three to five years | Three to five years | 334,735 | | | 149,814 | | Three to five years | 336,652 | | | 205,647 | |
| Five years and over | Five years and over | — | | | — | | Five years and over | — | | | — | |
| Total | Total | $ | 3,379,053 | | | $ | 3,393,172 | | Total | $ | 2,927,104 | | | $ | 3,235,991 | |
Cash Flows
From June 30, 2021 to September 30, 2021 and September 30, 2020 to September 30, 2020,2021, our restricted and unrestricted cash and cash equivalents balance increaseddecreased approximately $299.5$63.5 million and $153.7 million, respectively, to $359.0$175.5 million. The cash movements can be summarized by the following:
•Cash flows from operating activities. For the three and nine months ended September 30, 2020,2021, operating activities increased our cash balances by approximately $3.7$14.3 million and $45.0 million, respectively, primarily driven by our financial results for the quarter.results.
•Cash flows from investing activities. For the three months ended September 30, 2020,2021, investing activities decreased our cash balances by approximately $97.4 million, primarily driven by originations of loans held-for-investment, offset by repayments of loans held-for-investment. For the nine months ended September 30, 2021, investing activities increased our cash balances by approximately $332.3$198.4 million, primarily driven by repayments of loans held-for-investment, and sales of loans held-for-sale, partially offset by additional fundings provided on existing loan commitments.originations of loans held-for-investment.
•Cash flows from financing activities. For the three months ended September 30, 2020,2021, financing activities increased our cash balance by approximately $19.6 million, primarily driven by proceeds from repurchase facilities, offset by repayment of other debt facilities. For the nine months ended September 30, 2021, financing activities decreased our cash balancebalances by approximately $36.5$397.1 million, primarily driven by net repayments of repurchase agreements and revolving credit facilities, partially offset by proceeds from the senior secured term loan facilitiesissuance of securitized debt obligations.
Recent Market Conditions
Prior to the COVID-19 pandemic, the commercial real estate debt markets offered compelling investment opportunities, especially when approached fundamentally, with a focus on strong credit and cash flow characteristics and high-quality properties and sponsors. These investment opportunities were supported by active real estate transaction volumes, the continuous need for refinancing of legacy loans and borrower and sponsor demand for debt capital to renovate, reposition or redevelop their properties. Additionally, the stricter regulatory environment after the financial crisis from 2007 to 2009 for traditional providers of financing in this market, such as banks and insurance companies, limited the capacity of available funding for certain types of commercial real estate loans that comprise a large part of our target investments. Although the COVID-19 pandemic continues to generate an elevated degree of uncertainty with respect to the overall economic environment and many segments of the commercial real estate market, we believe that, over time, as the market activity continues to normalize, U.S. commercial real estate will continue to be viewed as an attractive asset class and will provide us with the opportunities consistent with our investment strategy to invest our capital and generate attractive, risk-adjusted returns for our stockholders over the long-term. Certain segments of the commercial real estate market, such as lodging and retail, have been affected more significantly than others, resulting in multiple retail sector bankruptcies, for example, as more consumer demand has shifted to internet related purchases. This retail property stress has benefited the industrial sector, which has seen increased demand for “last-mile” distribution sites in certain markets. The lodging sector has also experienced significant dislocation and the issuancegeneral market expectation is that it will take a while for it to completely recover; however, given the nature of warrantslodging, certain sub-sectors may experience recovery at a quicker pace of recovery than others. The multifamily sector has performed relatively well through this crisis, though the future path may be dependent to purchase common stock.a degree on interest rate levels and additional federal government stimulus. Office properties have performed well, though there has been a noticeable slowdown in leasing activity, but the longer-term impact of the COVID-19 pandemic remains uncertain considering remote working and other potential operational changes by the tenants.
Corporate Activities
Senior Secured Term Loan Facilities
The COVID-19 pandemic has resulted in significant disruptions in financial markets, uncertainty about the overall macroeconomic outlook and Warrantsa dislocation in the commercial real estate sector, including reduced borrower demand, higher lending rates, increased capitalization rates on properties and lower transaction volume. The dislocation in capital markets and decline in real estate sale transaction and refinancing activities have negatively impacted, and will likely continue to Purchase Sharesnegatively impact, the volume of Common Stockloan repayments and prepayments, which are a significant source of our liquidity and could make it more difficult for us to originate new loan investments.
On September 25 2020, we,Due to the ongoing COVID-19 pandemic in the United States and globally, most of our borrowers, sponsors, their tenants, the properties serving as collateral on our loan investments and the economy as a guarantor,whole have been, and certainwill continue to be, adversely affected. The magnitude and duration of the COVID-19 pandemic and its impact on our subsidiaries, as borrowers entered intoand their tenants, cash flows and future results of operations could be significant and will largely depend on future developments, including with respect to the distribution and acceptance of vaccines and their effectiveness with respect to new variants of the COVID-19 virus, which remain uncertain and cannot be predicted. Accordingly, given the ongoing nature of the outbreak, at this time we cannot reasonably estimate the magnitude of the ultimate impact that the COVID-19 pandemic will have on our business, financial performance and operating results. Given the current highly uncertain environment, we may incur additional operating expenses for a five-year senior secured term loan credit agreement with certainperiod of time, which may be material, related to actively managing our investment vehicles managed by Pacific Investment Management Company LLC, providing for upportfolio, our funding sources and exploring additional financing and capital sources to $300.0 millionhelp us to continue to manage through this period of new senior secured term loan facilitieseconomic uncertainty and warrantsmarket dislocation. The prolonged duration and impact of the COVID-19 pandemic could materially disrupt our business operations and impact our financial condition and performance, liquidity and ability to purchase up to 6.066 million shares ofpay dividends, including the dividend on our common stock, $0.01 par value per share. On September 28,which was temporarily suspended in the first quarter of 2020 we borrowed $225.0 million underand reinstated in the initial term loan facility. The remaining $75.0 millionthird quarter of commitments under the term loan facilities are available to us on a delayed draw basis during the sixth-month period after September 25, 2020, which period may be extended for an additional six months upon payment of an extension fee. A portion of the warrants exercisable for approximately 1.516 million shares of common stock are subject to (i) vesting on a pro rata basis as draws occur under the delayed draw term loan facility or (ii) forfeiture on a pro rata basis to the extent of commitments under the delayed draw term loan facility that are ultimately terminated or undrawn. Interest on the outstanding loans under the term loan facilities is payable quarterly in arrears and accrues at the rate of (i) 8.00% per annum for any period for which accrued interest is paid in cash or (ii) 9.00% per annum for any period for which the borrowers elect to pay up to 50% of accrued interest in kind by adding such interest to the principal amount of the loans. The term loan facilities will mature on September 25, 2025.
The loans outstanding under the term loan facilities are non-amortizing and may be voluntarily repaid, in whole or in part, at any time, subject to certain prepayment premiums if they are repaid prior to September 25, 2023.
The foregoing descriptions of the term loan credit agreement and the various components are not complete and are qualified in their entirety by reference to the full text of the Term Loan Credit Agreement, the Form of Warrant, the Investor Rights Agreement and the Amendments, which are attached as exhibits to this Quarterly Report on Form 10-Q.
None of the warrants have been exercised as of September 30, 2020.
See Note 12 - Senior Secured Term Loan FacilitiesCritical Accounting Policies and Warrants to Purchase SharesUse of Common Stock Estimates
Our discussion and analysis of the notestoour financial condition and results of operations is based upon our condensed consolidated financial statements, includedwhich have been prepared in this Quarterlyaccordance with GAAP. The preparation of these financial statements requires us to make estimates and assumptions that affect the reported amounts of assets, liabilities, revenue and expenses, and related disclosure of contingent assets and liabilities. Actual results could differ from these estimates.
Allowance for Credit Losses
We directly originate and acquire primarily senior floating-rate commercial mortgage loans and other debt and debt-like commercial real estate investments, generally to be held as long-term investments at amortized cost. We adopted ASU 2016-13, Financial Instruments - Credit Losses (Topic 326): Measurement of Credit Losses on Financial Instruments, or ASU 2016-13, which significantly changed how entities measure credit losses for most financial assets and replaced the incurred loss model with a CECL model for instruments measured at amortized cost. In addition, the new model applies to off-balance sheet credit exposures, such as our unfunded loan commitments. CECL amends the previous credit loss model to reflect our current estimate of our portfolio’s expected credit losses by incorporating reasonable and supportable forecasts including forward-looking information, in addition to historical experience and current market conditions.
ASU 2016-13 was adopted on January 1, 2020 and the initial allowance for credit losses was reflected as a direct charge to cumulative earnings. Subsequent changes to the allowance for credit losses have been and will continue to be recognized through net income (loss) on our condensed consolidated statements of operations. ASU 2016-13 specifies that the allowance should be based on relevant information about past events, including historical loss experience, current portfolio, market conditions and reasonable and supportable forecasts for the duration of each respective loan.
Considering the limited historical Company data related to any realized loan losses since our inception, to estimate our allowance for credit losses we use a probability-weighted analytical model that considers the likelihood of default and loss-given-default for each individual loan. The analytical model incorporates a third-party licensed database with historical loan losses from 1998 to 2020 for over 100,000 commercial real estate loans. Our allowance for credit losses reflects our estimates of the current and future economic conditions that impact the performance of the commercial real estate properties serving as collateral for our loan investments. These estimates include unemployment rates, interest rates, price indices for commercial property and other macroeconomic factors impacting the likelihood and magnitude of potential credit losses for our loans during their anticipated term. We license certain macroeconomic forecasts from a third-party to inform our view of the potential future impact that broader macroeconomic conditions may have on the performance of our loan portfolio. These forecasts are embedded in the licensed analytical model that we use to estimate our allowance for credit losses. We may use one or more of these forecasts in the process of estimating our allowance for credit losses. Selection of these economic forecasts requires significant judgment about future events that, while based on the information available to us as of the balance sheet date, are ultimately unknowable with certainty, and the actual economic conditions impacting our portfolio could vary significantly from the estimates we made for the periods presented. Significant inputs to our estimate of the allowance for credit losses include loan specific factors such as debt service coverage ratio, or DSCR, LTV, remaining loan term, property type and others.
In certain instances where we determine that a loan is no longer suited for our model-based approach due to its unique risk characteristics, or because we conclude that repayment of the loan’s principal is entirely collateral-dependent, we may instead elect to employ different methods to estimate loan losses that also conform to ASU 2016-13 and related guidance. If we determine that the recovery of that loan’s principal is entirely collateral-dependent, we may assess such an asset individually and elect to apply a practical expedient in accordance with ASU 2016-13. In such cases, the estimate of expected credit loss is measured as the difference between the loan’s amortized cost basis and the estimated fair value of the loan’s collateral. In order to estimate the allowance for credit loss associated with such a loan to reduce its carrying value, we may estimate the fair value of the collateral property, by using certain acceptable valuation techniques, which, among others, may include a discounted cash flow method of valuation less the estimated cost to foreclose and sell the property. The estimation of the fair value of the collateral property is also likely to involve using various Level 3 inputs, which may be in part developed based on discussions with various market participants and management’s best estimates as of the valuation date, and require significant judgment. Such inputs may include, among others, projections of property rents and cash flows over an assumed holding period; property operating expenses including real estate and income taxes; estimates of costs to acquire and sell the collateral property; assumed capitalization and discount rates; and overall market conditions.
The allowance for credit losses is estimated on a quarterly basis and represents management’s estimates of current expected credit losses in our investment portfolio, including unfunded loan commitments. Pools of loans with similar risk characteristics are collectively evaluated while loans that no longer share risk characteristics with loan pools are evaluated individually. Estimating an allowance for credit losses is inherently subjective, as it requires management to exercise significant judgment in establishing appropriate factors used to determine the allowance and a variety of subjective assumptions, including (i) determination of relevant historical loan loss data sets, (ii) projecting the expected timing and amount of future loan fundings and repayments, (iii) assessing the current credit quality of loans and operating performance of loan collateral, (iv) selecting the forecast for macroeconomic conditions and (v) determining the reasonable and supportable forecast period.
The allowance for loan losses also includes qualitative adjustments to bring the allowance to the level management believes is appropriate based on factors that have not otherwise been fully accounted for, including adjustments for foresight risk, input imprecisions and model imperfections. Foresight risk reflects the inherent imprecision in forecasting economic variables, including determining the depth and duration of economic cycles and their impact on relevant economic variables. Input imperfection factors address the risk that certain model inputs may not reflect all available information such as changes in the level and quality of experience held by certain borrowers or limitations in data available for certain loan portfolios. Model imprecision considers known model limitations not yet fully reflected in the quantitative estimate. The determination of the appropriate qualitative adjustment is based on management’s analysis of current and expected economic conditions and their impact on the portfolio, as well as a qualitative assessment of the lending environment, including underwriting standards. Management recognizes the sensitivity of various assumptions made in the quantitative modeling of expected losses and may adjust reserves depending upon the level of uncertainty that currently exists in one or more assumptions.
Refer to Note 2 to the Consolidated Financial Statements of the Company’s Annual Report on Form 10-Q10-K for additional details regardingthe year ended December 31, 2020 for a summary of the Company’s significant accounting policies.
Changes in the Fair Value of Our Investments
We intend to hold our target investments for the long-term and, as such, they are carried at an amortized cost on our condensed consolidated balance sheets.
Although we intend to hold our target investments for the long-term, we may occasionally classify some of our debt securities as available-for-sale, or AFS. Investments classified as AFS are carried at their fair value, with changes in fair value recorded through accumulated other comprehensive income (loss), a component of stockholders’ equity, rather than through earnings. We do not intend to hold any of our investments for trading purposes.
Changes in Market Interest Rates
Although our strategy is to primarily originate, invest in and manage senior floating-rate commercial mortgage loans, from time-to-time we may acquire fixed-rate investments, which exposes our operating results to the risks posed by fluctuations in interest rates. To the extent that this transaction.applies to us, we may choose to actively manage this risk through the use of hedging strategies.
Off-Balance Sheet Arrangements
We have not participated in transactions that create relationships with unconsolidated entities or financial partnerships which would have been established for the purpose of facilitating off-balance sheet arrangements. Further, we have not guaranteed any obligations of unconsolidated entities or entered into any commitment or intent to provide funding to any such entities. However, as of September 30, 2020,2021, we had unfunded commitments on commercial real estate loans held-for-investment of $596.4$430.1 million to be used for future fundings to borrowers, generally to finance lease-related or capital expenditures.
Dividends
In March 2020, we temporarily suspended the payment of dividendsWe generally intend to distribute substantially all of our common stock. We reinstatedtaxable income each year (which does not necessarily equal net income as calculated in accordance with GAAP) to our stockholders to comply with the dividend inREIT provisions of the third quarter of 2020, declaring a $0.20 dividend per share of common stock on September 28, 2020. We will continue to evaluateCode. In addition, our dividend policy in respectremains subject to future quarters, depending on overall market conditionsrevision at the discretion of our board of directors. All distributions will be made at the discretion of our board of directors and will depend upon, among other things, our actual results of operations and liquidity. These results, and our overallability to pay distributions, will be affected by various factors, including our taxable income, our financial condition, and performance. U.S. federal income tax law generally requires that aour maintenance of REIT annually distribute at least 90% of its REIT taxable income, without regard to the deduction for dividends paid and excluding net capital gains, and that it pay tax at regular corporate rates to the extent that it annually distributes less than 100% of its REIT taxable income, including capital gains. We intend to pay dividendsstatus, restrictions related to our stockholders in a manner intended to satisfy the REIT distribution requirements and to avoid both corporate income tax and excise tax. Before we pay any dividend, whether for U.S. federal income tax purposes or otherwise, we must first meet both our operating requirements and debt service on our secured fundingfinancing facilities, other lending facilities, repurchase agreementsapplicable law and other debt payable. Iffactors as our cash available for distribution is less than our required distribution for REIT qualification purposes, we could be required to sell investments or borrow funds to make cash distributions or we may make a portionboard of the required distribution in the form of a taxable stock distribution or distribution of debt securities.directors deems relevant.
Inflation
Virtually all of our assets and liabilities are interest rate sensitive in nature. As a result, interest rates and other factors influence our performance far more so than does inflation.inflation does. Changes in interest rates do not necessarily correlate with inflation rates or changes in inflation rates. Our condensed consolidated financial statements are prepared in accordance with GAAP and our distributions will be determined by our board of directors consistent with our obligation to distribute to our stockholders at least 90% of our REIT taxable income on an annual basis in order to maintain our REIT qualification; in each case, our activities and balance sheet are measured with reference to historical cost and/or fair market value without considering inflation.
Item 3. Quantitative and Qualitative Disclosures about Market Risk
We seek to manage our risks related to the credit quality of our investments, interest rates, liquidity and market value while, at the same time, seeking to generate attractive risk-adjusted returns to our stockholders. While we are exposed to certain types of market risk in our business, we seek to actively manage them using our risk management infrastructure and philosophy centered around quantifying and measuring various market risks on a continuous basis. We seek to be fairly compensated through the returns we earn on our investments for taking those risks and focus on maintaining liquidity and capital levels consistent with the risks to which we are exposed. However, many of those risks have been magnified by the continuing economic disruption and capital markets volatility resulting from the COVID-19 pandemic.
Recent Market Conditions
Due to the current COVID-19 pandemic in the United States and globally, most of our borrowers, sponsors, their tenants, the properties serving as collateral on our loan investments and the economy as a whole have been, and will likely continue to be, adversely affected. See “COVID-19 Pandemic” in Part I, Item 2 of this Quarterly Report on Form 10-Q for further discussion of the impact of the COVID-19 pandemic on market conditions.
Credit Risk
We are subject to varying degrees of credit risk in connection with holding a portfolio of our target investments. The performance and value of our investments depend upon the sponsors’ ability to operate the properties that serve as our collateral so that they produce cash flows adequate to pay interest and principal due to us. We seek to manage credit risk by performing deep fundamental credit analysis of our potential investments, as well as seeking to originate or acquire assets of higher quality at appropriate rates of return given anticipated and unanticipated losses, by employing a comprehensive review and selection process and by proactively monitoring our investments. Credit risk is also addressed through our on-goingongoing review, and our investment portfolio is monitored for variance from underwritten and expected defaults, severities, losses and cash flowresults on a monthly basis, with more intense analysis and oversight done on a quarterly basis. Nevertheless, unanticipated credit losses, including as a result of the COVID-19 pandemic, could occur that could adversely impact our operating results.
We employ a long-term, fundamental value-oriented investment strategy and we aim to, on a loan-by-loan basis, construct an investment portfolio that is well-diversified across property types, geographies and sponsors. However, any potential negative impacts on our business as a result of the COVID-19 pandemic may be heightened by the fact that we are not required to observe specific diversification criteria, which means that our investments may be relatively concentrated in certain property types, geographical areas or loan categories that may be more adversely affected by the pandemic than others. For example, certain of our loans are secured by office, industrial, multifamily, hotel and retail properties. Changes in how certain types of commercial properties are operated to facilitate social distancing and other measures intended to control the impact of the pandemic have impacted, and are likely to continue to impact, our investments secured by these properties.
The COVID-19 pandemic has significantly impacted the commercial real estate markets, causing reduced occupancy, requests from tenants for rent deferrals or abatement and delays in capital improvements on projects currently planned or underway. These negative conditions may persist into the future and impair our borrowers’ ability to pay principal and interest due to us under our loan agreements. We maintain an active dialogue and strong relationships with our borrowers as part of our overall asset management strategy. Through our asset management process, we focus on addressing potential impacts of the COVID-19 pandemic on our loans secured by properties experiencing cash flow strains. Certain of our borrowers have indicated that due to the impact of COVID-19 pandemic they will be unable to timely execute their business plans, have had to temporarily close their businesses or have experienced other business challenges. As a result, they have requested, and in certain instances we have granted, temporary deferrals of interest payments or forbearance, or other modifications of their loans. Discussions we have had with our borrowers have addressed potential near-term loan modifications including repurposing of funds in certain reserve accounts, temporary deferrals of interest or performance tests and certain covenant waivers on loans collateralized by properties impacted by the COVID-19 pandemic. While we generally believe that the principal amount of our loans is typically sufficiently protected by the underlying collateral value, there is a risk that we will not realize the entire principal amount of certain of our loan investments.
Interest Rate Risk
Generally,Our strategy is to primarily originate, invest in and manage a portfolio of senior floating-rate commercial mortgage loans. As a result, the composition of our investments in general is such that rising interest rates increase our net income, while declining interest rates will decrease net income, subject to the impact of contractual interest rate floors. From time to time we may originate or acquire fixed-rate investments, which may expose our operating results to the risks posed by fluctuations in interest rates, which we may choose to hedge, if we deem it prudent.
As of September 30, 2020,2021, approximately 98.4%98.8% of our portfolio by carrying value earned a floating rate of interest. The remaining approximately 1.6%1.2% of our portfolio earned a fixed rate of interest. If interest rates were to decline, the value of these fixed-rate investments may increase and if interest rates were to increase, the value of these fixed-rate investments may fall; however, the interest income generated by these investments would not be affected by fluctuations in market interest rate fluctuations.rates. The interest rates we pay under our current repurchase agreementsfacilities, asset-specific financing facility, term financing facility and securitized debt obligationsCRE CLOs are primarily floating rate, which generally, and with limited exceptions, are not subject to contractual interest rate floors. Accordingly, our interest expense generally increases as interest rates increase and decreases as interest rates decrease.
Our analysis of risks is based on our experience, estimates, models and assumptions. These analyses rely on models which utilize estimates of fair value and interest rate sensitivity. Actual economic conditions or our implementation of decisions may produce results that differ significantly from the estimates and assumptions used in our models.
The information presented in the following interest rate sensitivity table projects the potential impact of sudden parallel changes in interest rates on our financial results and financial condition over the next 12 months, based on our interest sensitive financial instruments at September 30, 2020.2021. All changes in value are measured as the change from our September 30, 20202021 financial position. All projected changes in annualized net interest income are measured as the change from our projected annualized net interest income based off current performance returns.
| | | Changes in Interest Rates | | Changes in Interest Rates (1) |
| (in thousands) | (in thousands) | -100 bps | | -50 bps | | +50 bps | | +100 bps | (in thousands) | -100 bps | | -50 bps | | +50 bps | | +100 bps |
| Change in value of financial position: | Change in value of financial position: | | | | | | | | Change in value of financial position: | | | | | | | |
| Loans held-for-investment | Loans held-for-investment | $ | 4 | | | $ | 4 | | | $ | (47) | | | $ | (144) | | Loans held-for-investment | $ | 2 | | | $ | 2 | | | $ | (117) | | | $ | (293) | |
| | Repurchase agreements | (89) | | | (89) | | | 386 | | | 771 | | |
| Repurchase facilities | | Repurchase facilities | (29) | | | (29) | | | 191 | | | 382 | |
| Securitized debt obligations | Securitized debt obligations | (61) | | | (61) | | | 194 | | | 388 | | Securitized debt obligations | (48) | | | (48) | | | 284 | | | 567 | |
| Asset-specific financings | Asset-specific financings | (5) | | | (5) | | | 17 | | | 34 | | Asset-specific financings | (1) | | | (1) | | | 9 | | | 19 | |
| | Term financing facility | | Term financing facility | (4) | | | (4) | | | 27 | | | 53 | |
| Convertible senior notes | Convertible senior notes | (5,756) | | | (2,854) | | | 2,808 | | | 5,569 | | Convertible senior notes | (3,806) | | | (1,890) | | | 1,864 | | | 3,702 | |
| Total net assets | Total net assets | $ | (5,907) | | | $ | (3,005) | | | $ | 3,358 | | | $ | 6,618 | | Total net assets | $ | (3,886) | | | $ | (1,970) | | | $ | 2,258 | | | $ | 4,430 | |
| | | -100 bps | | -50 bps | | +50 bps | | +100 bps | | -100 bps | | -50 bps | | +50 bps | | +100 bps |
| Change in annualized net interest income: | Change in annualized net interest income: | $ | 3,463 | | | $ | 3,463 | | | $ | (11,845) | | | $ | (23,259) | | Change in annualized net interest income: | $ | 1,874 | | | $ | 1,874 | | | $ | (8,858) | | | $ | (16,395) | |
____________________
(1)Changes in interest rates were limited to a decrease in rate to zero percent.
The interest rate sensitivity table quantifies the potential changes in annualized net interest income and portfolio value, should interest rates immediately change. The interest rate sensitivity table presents the estimated impact of interest rates instantaneously rising 50 and 100 basis points, and falling 50 and 100 basis points. The cash flows associated with the portfolio for each rate change are calculated based on assumptions, including yield on future originations and acquisitions, slope of the yield curve and size of the portfolio. Assumptions made on the interest rate sensitive liabilities include anticipated interest rates, collateral requirements as a percentage of borrowings and amount and term of borrowing.
Certain assumptions have been made in connection with the calculation of the information set forth in the foregoing interest rate sensitivity table and, as such, there can be no assurance that assumed events will occur or that other events will not occur that would affect the outcomes. The base interest rate scenario assumes interest rates at September 30, 2020.2021. The analysis utilizes assumptions and estimates based on management’s judgment and experience. Furthermore, while we generally expect to retain such assets and the associated interest rate risk to maturity, future originations, acquisitions and sales of assets could materially change our interest rate risk profile.
The information set forth in the interest rate sensitivity table above and all related disclosures constitutes forward-looking statements within the meaning of Section 27A of the Securities Act and Section 21E of the Exchange Act. Actual results could differ significantly from those estimated in the foregoing interest rate sensitivity table.
LIBOR Transition
It appears highly likely that LIBOR is expected towill be discontinued after 2021. December 31, 2021 or June 30, 2023, depending on the tenor. For example, on March 5, 2021, the ICE Benchmark Administration confirmed its intention to cease publication of (i) one week and two month U.S. Dollar LIBOR settings after December 31, 2021 and (ii) the remaining U.S. Dollar LIBOR settings after June 30, 2023. The United States Federal Reserve has also advised banks to cease entering into new contracts that use LIBOR as a reference rate. The Federal Reserve, in conjunction with the Alternative Reference Rate Committee, a committee convened by the Federal Reserve that includes major market participants, has identified the Secured Overnight Financing Rate, or SOFR, a new index calculated by short-term repurchase agreements, backed by United States Treasury securities, as its preferred alternative rate for LIBOR. At this time, it is not possible to predict how markets will respond to SOFR or other alternative reference rates as the transition away from the LIBOR benchmarks is anticipated in coming years. Accordingly, the outcome of these reforms is uncertain and any changes in the methods by which LIBOR is determined or regulatory activity related to LIBOR’s phaseout could cause LIBOR to perform differently than in the past.
As of September 30, 2020,2021, approximately 98.4%98.8% of our loans by principal balance/carrying valuebalance earned a floating rate of interest indexed to LIBOR, and 100.0% of our outstanding borrowings (excluding convertible notes)notes and senior secured financing facilities) bear interest indexed to LIBOR. AllSome of these arrangements provide procedures for determining anmay not include robust fallback language that would facilitate replacing LIBOR with a clearly defined alternative basereference rate in the event thatafter LIBOR’s discontinuation, and we may need to amend these before LIBOR is discontinued. Regardless, there can be no assurances as to what alternative base rates may be and whether such base rate will be more or less favorable than LIBOR and any other unforeseen impacts of the potential discontinuation of LIBOR. We intend to monitorare monitoring the developments with respect to the potential phasing out of LIBOR after 2021 and workare working with our lenders and borrowers to minimize the impact of any LIBOR transition on our financial condition and results of operations, but can provide no assurances regarding the impact of the discontinuation of LIBOR.
Market Value Risk
We intend to hold our target investments for the long-term and, as such, they are carried at an amortized cost on our condensed consolidated balance sheets. However, we may occasionally classify some of our investments as AFS. Investments classified as AFS are carried at their fair value, with changes in fair value recorded through accumulated other comprehensive income (loss), a component of stockholders’ equity, rather than through earnings. The estimated fair value of such investments may fluctuate primarily due to changes in interest rates, overall market environment and liquidity, and other factors. As market volatility increases or liquidity decreases, the market value of the investments may be adversely impacted. We do not intend to hold any of our investments for trading purposes.
Borrower Performance
In addition to the risks related to fluctuations in cash flows and investment values associated with movements in interest rates, there is also the risk of borrower non-performance on our floating-rate investments. If interest rates were to significantly rise, it is possible that the increased debt service costs may negatively impact operating cash flows on properties securing our commercial real estate loan investments, resulting in potential non-performance of our borrowers or, in severe cases, default. This risk is partially mitigated by various factsfactors we consider during our rigorous underwriting and loan structuring process, which in certain cases include a requirement for our borrower to purchase an interest rate cap contract. As of September 30, 2020, none of the commercial real estate loans in our portfolio were non-performing.
Capital Markets Risk
As a REIT, we are required to distribute a significant portion of our taxable income annually, which constrains our ability to accumulate significant operating cash flow and therefore requires us to utilize capital markets, both debt and equity, to finance our business. As a result, we are exposed to risks related to the equity capital markets and our related ability to raise capital
through the issuance of our common stock or other equity instruments. We are also exposed to risks related to the debt capital markets, and our related ability to finance our business through borrowings under credit facilities or other debt instruments, such as securitizations or unsecured debt. We seek to mitigate these risks by monitoring the debt and equity capital markets to inform our decisions on the amount, timing and terms of capital we raise.
Real Estate Risk
Our business strategy focuses on commercial real estate related debt investments. As a result, we will be exposed to the risks generally associated with the commercial real estate market, including occupancy rates, capitalization rates, absorption rates and other macroeconomic factors beyond our control, including, but not limited to, the impacts of the COVID-19 pandemic discussed above.
Additionally, commercial real estate debt investments may be affected by a number of factors, including, national, regional and local economic and real estate conditions, changes in business trends of specific industry segments, property construction characteristics, demographic factors and changes to building codes. Any combination of these factors may affect the value of real estate collateral for investments within our investment portfolio and the potential proceeds available to a borrower to repay the underlying loans, which could cause us to suffer losses. We seek to manage these risks through our rigorous and fundamentally driven underwriting and investment management processes.
Liquidity Risk
Our liquidity risk is principally associated with our financing of longer-maturity investments with shorter-term borrowings, in the form ofsuch as repurchase agreements,facilities and an asset-specific financings and revolving credit facilities.financing facility. Should the value of our investments pledgedserving as collateral onfor our repurchase agreementsfacilities significantly decrease, including, but not limited to, as a result of the impacts of the COVID-19 pandemic discussed above, our lenders may exercise their margin call rights, causing an adverse change in our liquidity position. If we fail to resolve such margin calls when due, the lenders may exercise their rights under such repurchase agreements,facilities, including requiring payment by us of our aggregate outstanding financing obligations and / and/or taking ownership of the loans securing such obligations, potentially ofon an unfinanced basis, thereby reducing our available liquidity. Additionally, if one or more of our repurchase agreement,facilities or asset-specific financing or revolving credit facility counterparties choseshould choose not to provide ongoing funding, including with respect to future funding obligations on existing loans financed with such counterparties, which such risks are increased as a result of the COVID-19 pandemic and its effects on the global and U.S. economies and commercial real estate markets, our ability to finance our investments and related future funding obligations would decline or exist at possibly less advantageous terms.
Extension Risk
We manage our assets based on a variety of assumptions and estimates, including among others, assumptions regarding the rate at which the borrowers will prepay our loans or extend. If prepayment rates decrease in a rising interest rate environment or extension options are exercised, the life of our loan investments could extend beyond the term of the secured financing agreements. The macroeconomic, commercial real estate and capital markets disruptions caused by the COVID-19 pandemic have resulted in, and will likely continue to result in, a decrease in prepayment rates and an increase in the number of our borrowers who exercise loan extension options. This could have a negative impact on our results of operations. In some situations, we may be forced to sell assets to maintain adequate liquidity, which could cause us to incur losses.
As part of our overall asset management strategy we have in the past entered into, and may in the future enter into, loan modifications with some of our borrowers. These amendments may include, among other things, modifying or waiving certain performance or extension conditions as part of the overall agreement, which are often coupled with additional equity or other forms of credit support from the sponsor. We work closely with our lending counterparties when negotiating and entering into loan modifications with our borrowers to ensure we maintain financing on modified assets. There can be no assurance that going forward we will be able to maintain financing on modified loans.
Risk Management
To the extent consistent with maintaining our REIT qualification, we seek to manage risk exposure by closely monitoring our portfolio and actively managing the financing, interest rate, credit and other risks associated with holding a portfolio of our target investments. Generally, with the guidance and experience of our Manager:we:
•we manage our portfolio with focus on diligent, investment-specific market review, enforcement of loan and security rights and timely execution of disposition strategies;
•we actively employ portfolio-wide and investment-specific risk measurement and management processes in our daily operations, including utilizing our Manager’s risk management tools; and
•we seek to manage credit risk through our rigorous underwriting due diligence process prior to origination or acquisition of our target investments and through the use of non-recoursenonrecourse financing, when and where available and appropriate.
Item 4. Controls and Procedures
A review and evaluation was performed by our management, including our Chief Executive Officer, or CEO, and Chief Financial Officer, or CFO, of the effectiveness of our disclosure controls and procedures (as such term is defined in Rule 13a-15(e) and 15d-15(e) under the Exchange Act) as of the end of the period covered by this Quarterly Report on Form 10-Q. Based on that review and evaluation, the CEO and CFO have concluded that our current disclosure controls and procedures, as designed and implemented, were effective as of the end of the period covered by this Quarterly Report on Form 10-Q. Although our CEO and CFO have determined our disclosure controls and procedures were effective at the end of the period covered by this Quarterly Report on Form 10-Q, a control system, no matter how well designed and operated, can provide only reasonable, not absolute, assurance that it will detect or uncover failures within the Company to disclose material information otherwise required to be set forth in the reports we submit under the Exchange Act.
There was no change in our internal control over financial reporting that occurred during the quarter ended September 30, 20202021 that has materially affected, or is reasonably likely to materially affect, our internal control over financial reporting.
PART II. OTHER INFORMATION
Item 1. Legal Proceedings
From time to time we may be involved in various legal claims and/or administrative proceedings that arise in the ordinary course of our business. The previously disclosed arbitration concluded on October 7, 2020, with the arbitral panel issuing an award setting the amount payable by us to our Manager at $44.5 million. See Note 13 – Commitments and Contingencies of the notes to our condensed consolidated financial statements included in this Quarterly Report on Form 10-Q. As of the date of this filing, we are not party to any litigation or other legal proceedings or, to the best of our knowledge, any threatened litigation or legal proceedings, which, in our opinion, individually or in the aggregate would have a material adverse effect on our results of operations or financial condition.
Item 1A. Risk Factors
For information regarding factors that could affect our results of operations, financial condition and liquidity, see the risk factors discussed in Part I, Item 1A. “Risk Factors” in our Annual Report on Form 10-K for the year ended December 31, 2019, or Annual Report as supplemented with the following risk factors, which should be read in conjunction with the risk factors contained in our Annual Report.
The ongoing COVID-19 pandemic has caused severe disruptions in the United States and global economy and to our business, and may continue to have an adverse impact on our performance and results of operations.
Since the first quarter of 2020, the global impact of the COVID-19 pandemic has been rapidly evolving, and many countries have reacted by instituting quarantines and restrictions on travel, closing financial markets and/or restricting trading and limiting operations of non-essential businesses. Such measures are disrupting global supply chains, significantly increasing rates of unemployment and adversely impacting many industries, including the commercial finance and real estate markets in which we compete. The outbreak could have a continued adverse impact on economic and market conditions and trigger a period of global economic slowdown.
The outbreak of COVID-19 has had, and may continue to have, an adverse impact on our financial condition, liquidity and results of operations and the market price of our common stock, among other things. We expect that these impacts are likely to continue to some extent as the outbreak persists and potentially even after the outbreak subsides. In particular, our ability to operate successfully could be adversely impacted due to the following:
•The COVID-19 pandemic has had a significant long-term impact on the broader economy and the commercial real estate market generally, which would negatively impact the value of the assets collateralizing our loans. Our portfolio includes loans collateralized by hotel, retail and other asset classes which have been significantly negatively impacted by the pandemic, particularly due to government-mandated closures and travel restrictions. While we currently believe the principal amount of our loans are generally adequately protected by the value of the underlying collateral, there can be no assurance that we will realize the entire principal value of certain investments.
•We are actively engaged in discussions with our borrowers, some of whom have indicated that, due to the impact of the COVID-19 pandemic, they have been unable to timely execute their business plans, have had to temporarily close their businesses or have experienced other negative business consequences. As a result, some borrowers have requested, and in certain instances we have agreed to, near-term loan modifications, including repurposing of funds in certain reserve accounts, temporary deferrals of interest or performance tests, certain covenant waivers on loans collateralized by properties impacted by the COVID-19 pandemic. Due to the continuing impact of the COVID-19 pandemic, we anticipate additional loan modifications requests from our borrowers and potentially instances of default or foreclosure on assets underlying our loans, which would adversely affect the credit profile of our assets and our results of operations and financial condition.
•We have repurchase agreements with numerous lenders and are actively engaged in discussions with them, particularly with respect to the effects of the COVID-19 pandemic, around the value of pledged assets as defined in such agreements, our ability to deleverage or finance our future loan funding commitments, the application of certain provisions of such agreements to these circumstances and other structural elements under the agreements. If we do not have sufficient liquidity to make required payments on a timely basis, we would likely experience defaults and potential loss of assets to the lenders unless we are able to raise the funds from alternative sources, including by selling or financing assets or raising capital, or liquidity sources, each of which we may be required to do under adverse market conditions or at an inopportune time or on unfavorable terms, or may be unable to do at all. A default under one agreement may trigger cross-defaults under other agreements. Continued market volatility may further limit our ability to access liquidity sources under favorable terms, or at all. Pledging additional collateral or otherwise paying down facilities to satisfy our lenders and avoid potential margin calls and loan defaults would reduce our cash available to meet subsequent margin calls and/or future funding requests, as well as to make other higher yielding investments, thereby decreasing our liquidity, return on equity, available cash, net income and ability to implement our investment strategy. We also have covenants in some of our debt agreements that require us to maintain a minimum amount of cash, which could impact our ability to satisfy margin calls. If we cannot meet lender requirements related
to margin calls or other terms of our credit agreements, the lender or counterparty could accelerate our indebtedness, increase the interest rate on advanced funds our limit our ability to borrow additional funds, which would materially and adversely affect our financial condition and ability to implement our investment strategy.
•Because of the impacts of the COVID-19 pandemic on global economies and U.S. commercial real estate, we likely will experience reduced availability of liquidity sources, but our requirements for liquidity, including future loan funding obligations and potential margin calls, likely will not be commensurately reduced. If we do not have funds available to meet our obligations, we would have to raise funds from alternative sources, which may be at unfavorable terms or may not be available to us. We expect that the financial impact of the COVID-19 pandemic will likely adversely affect our liquidity position and could limit our ability to grow our business and successfully execute our business strategy. In order to preserve and build our liquidity to weather near-term market uncertainty, satisfy our loan future funding and financing obligations and potentially make opportunistic new investments, we intend to take, and in some instances have taken, some or all of the following actions: raise capital from offerings of securities, borrow additional capital, sell assets and/or change our dividend practice. One or more of these conditions could increase our secured debt or be dilutive to our existing stockholders.
•Interest rates and credit spreads have been significantly impacted since the outbreak of COVID-19. This can increase the volatility of the fair value of our floating-rate loans and also the interest obligations on our floating-rate debt and fair value of our fixed-rate liabilities, which could increase our interest expense.
•An extended period of remote working by our personnel could strain our technology resources and introduce operational risks, including heightened cybersecurity risk. Remote working environments may be less secure and more susceptible to hacking attacks, including phishing and social engineering attempts that seek to exploit the COVID-19 pandemic.
In addition to the foregoing, we have experienced, and may continue to experience, other negative impacts to our business as a result of the COVID-19 pandemic that further heighten the impact of other risks described in our Annual Report on Form 10-K for the year ended December 31, 2019, including, but not limited to:
•lack of liquidity of our investments;
•the greater risk of loss to which we are exposed in connection with CMBS, CLOs, B-notes, mezzanine loans and other investments that are subordinated or otherwise junior in an issuer’s capital structure and that involve privately negotiated structures;
•risks associated with loans on properties in transition, renovation, restoration or construction;
•impairment of our investments and harm to our operations from a prolonged economic slowdown, a lengthy or severe recession or declining real estate values;
•the concentration of our loans and investments in terms of geography, asset types and sponsors;
•losses resulting from foreclosing on certain of the loans we originate or acquire;
•downgrades in credit ratings assigned to our investments;
•investments in non-investment grade rated commercial real estate loans or securities;
•the difficulty of estimating provisions for loan losses;
•our debt;
•risks associated with non-recourse securitizations which we use to finance our loans and investments;
•losses arising from current and future guarantees of debt and contingent obligations of our subsidiaries;
•borrower and counterparty risks;
•if the market value or income potential of our assets decline, we may need to increase our real estate assets and income or liquidate our non-qualifying assets in order to maintain our REIT qualification or exclusion from the Investment Company Act;
•operational impacts on ourselves and our third-party service providers, including loan servicers and other service providers, such as trustees, appraisers and other due diligence vendors and document custodians, related to our investments in commercial real estate debt investments, as well as for general operating purposes;
•the availability of key personnel of the Manager and our service providers as they face changed circumstances and potential illness during the pandemic; and
•other risks described in our Annual Report as they may be amended by this report and subsequent filings with the SEC.
The rapid development and fluidity of this situation precludes any prediction as to the ultimate adverse impact of COVID-19 on economic and market conditions, and, as a result, continues to present material uncertainty and risk with respect to us and the performance of our investments. The full extent of the impact of COVID-19 will depend on future developments, including,
among other factors, the duration, severity and spread of the outbreak, along with related travel advisories, quarantines and restrictions, the recovery time of the disrupted supply chains and industries, the impact of labor market interruptions, the impact of government interventions and uncertainty with respect to the duration of the global economic slowdown, including the resulting impact on the value of our assets. COVID-19 and the current financial, economic and capital markets environment, and future developments in these and other areas, present uncertainty and risk with respect to our performance, results of operations and ability to pay distributions.
We may not realize some or all of the targeted benefits of the Internalization.
As part of the Internalization, the Management Agreement will be terminated as of 11:59 p.m. on December 31, 2020. The failure to effectively complete the transition of certain services currently provided by our Manager to a fully internal basis or find adequate third-party replacements for these services could impede our ability to achieve the targeted cost savings of the Internalization and adversely affect our operations. In addition, complexities arising from the Internalization could increase our overhead costs and detract from management’s ability to focus on operating our business. We may not realize the expected cost savings of the Internalization.
We may not be able to attract and retain key management and other key employees in connection with the Internalization.
As part of the Internalization, we expect to become the employer of certain individuals who perform services on our behalf. Such employees, particularly our key management, are vital to our success and difficult to replace. We may be unable to retain them or to attract other highly qualified individuals, particularly if we do not offer employment terms competitive with the rest of the market. Failure to attract and retain highly qualified employees, or failure to develop and implement a viable succession plan, could result in inadequate depth of institutional knowledge or skill sets, adversely affecting our business.
Item 2. Unregistered Sales of Equity Securities and Use of Proceeds
None.Issuer Purchases of Equity Securities
The following table summarizes the repurchase of common stock for the three months ended September 30, 2021:
| | | | | | | | | | | | | | | | | | | | | | | |
| Period | Total number of shares purchased | | Average price paid per share | | Total number of shares purchased as part of publicly announced plans or programs | | Maximum number (or approximate dollar value) of shares that may yet be purchased under the plans or programs (1) |
| July 1-31, 2021 | 721 | | | $ | 14.49 | | | 721 | | | 1,698,388 | |
| August 1-31, 2021 | 542,488 | | | 13.43 | | | 542,488 | | | 1,155,900 | |
| September 1-30, 2021 | 457,512 | | | 13.56 | | | 457,512 | | | 698,388 | |
| Total | 1,000,721 | | | $ | 13.49 | | | 1,000,721 | | | 698,388 | |
____________________
Item 3. Defaults Upon Senior Securities
None.
Item 4. Mine Safety Disclosures
None.
Item 5. Other Information
None.
Item 6. Exhibits
(a) Exhibits
A list of exhibits to this Quarterly Report on Form 10-Q is set forth below.
| | | | | | | | |
| Exhibit Number | | Exhibit Index |
| 3.1 | | |
| 3.2 | | |
| 3.3 | | |
| 4.1 | | |
| 4.2 | | |
4.24.3 | | |
4.34.4 | | |
4.44.5 | | |
4.54.6 | | |
4.64.7 | | |
| 10.1* | | |
| 10.2* | | |
| 10.3* | | |
10.2 | | Term Loan Credit Agreement, dated as of September 25, 2020, among Granite Point Mortgage Trust Inc., as a guarantor, Granite Point Operating Company LLC, as a borrower, GP Commercial Investment Corp., as a borrower, GPMT CLO REIT LLC, as a borrower, the financial institutions party thereto, as lenders, and Wilmington Trust, National Association, as administrative agent (incorporated by reference to Exhibit 10.1 to the registrant’s Current Report on Form 8-K filed with the SEC on September 28, 2020). |
10.3 | | Seventh Amendment to Master Repurchase and Securities Contract Agreement and Second Amendment to Guaranty, dated as of September 25, 2020, among Morgan Stanley Bank, N.A., as buyer, Granite Point Mortgage Trust Inc., as guarantor, GP Commercial MS LLC, as seller (incorporated by reference to Exhibit 10.2 to the registrant’s Current Report on Form 8-K filed with the SEC on September 28, 2020). |
10.4 | | Amendment No. 6 to Master Repurchase Agreement and Amendment No. 3 to Amended and Restated Guarantee Agreement, dated as of September 25, 2020, among JPMorgan Chase Bank, National Association, as buyer, Granite Point Mortgage Trust Inc., as guarantor, and GP Commercial JPM LLC, as seller (incorporated by reference to Exhibit 10.3 to the registrant’s Current Report on Form 8-K filed with the SEC on September 28, 2020). |
10.5 | | |
10.6 | | Fourth Amendment to Master Repurchase Agreement and Second Amendment to Guaranty, dated as of September 25, 2020, among Citibank, N.A., as purchaser, Granite Point Mortgage Trust Inc., as guarantor, and GP Commercial CB LLC, as seller (incorporated by reference to Exhibit 10.5 to the registrant’s Current Report on Form 8-K filed with the SEC on September 28, 2020). |
10.7 | | Amendment Number Two to Amended and Restated Master Repurchase Agreement and Securities Contract and Second Amendment to Guarantee Agreement, dated as of September 25, 2020, among Wells Fargo Bank, National Association, as buyer, Granite Point Mortgage Trust Inc., as guarantor, and GP Commercial WF LLC, as seller (incorporated by reference to Exhibit 10.6 to the registrant’s Current Report on Form 8-K filed with the SEC on September 28, 2020). |
10.8 | | |
| | | | | | | | |
Exhibit Number | | Exhibit Index |
10.9 | | |
10.10 | | |
10.11 | | |
10.12 | | |
| 31.1 | | |
| 31.2 | | |
| 32.1 | | |
| 32.2 | | |
| | | | | | | | |
| Exhibit Number | | Exhibit Index |
| 101 | | Financial statements from the Quarterly Report on Form 10-Q of Granite Point Mortgage Trust Inc. for the three months ended September 30, 2020,2021, filed with the SEC on November 9, 2020,8, 2021, formatted in Inline XBRL: (i) the Condensed Consolidated Balance Sheets, (ii) the Condensed Consolidated Statements of Comprehensive Income (Loss), (iii) the Condensed Consolidated Statements of Stockholders’ Equity, (iv) the Condensed Consolidated Statements of Cash Flows, and (v) the Notes to the Condensed Consolidated Financial Statements. (filed herewith) |
| 104 | | Cover Page Interactive Data File (formatted as Inline XBRL and contained in Exhibit 101). (filed herewith) |
| | |
| | |
| | |
*Certain schedules and similar attachments have been omitted in reliance on Item 601(a)(5) of Regulation S-K. The Company will provide, on a supplemental basis, a copy of any omitted schedule or attachment to the SEC or its staff upon request.
SIGNATURES
Pursuant to the requirements of the Securities Exchange Act of 1934, the registrant has duly caused this report to be signed on its behalf by the undersigned thereunto duly authorized.
| | | | | | | | | | | |
| | | GRANITE POINT MORTGAGE TRUST INC. |
| Dated: | November 9, 20208, 2021 | By: | /s/ John A. Taylor |
| | | John A. Taylor
President, Chief Executive Officer and Director
(Principal Executive Officer) |
| Dated: | November 9, 20208, 2021 | By: | /s/ Marcin Urbaszek |
| | | Marcin Urbaszek
Chief Financial Officer
(Principal Accounting and Financial Officer) |
| | | |
| | | |