UNITED STATES
SECURITIES AND EXCHANGE COMMISSION
Washington, D.C. 20549
FORM 10-Q
| | | | | |
| ☒ | QUARTERLY REPORT PURSUANT TO SECTION 13 OR 15(d) OF THE SECURITIES EXCHANGE ACT OF 1934 |
For the quarterly period ended SeptemberJune 30, 20212022
or
| | | | | |
| ☐ | TRANSITION REPORT PURSUANT TO SECTION 13 OR 15(d) OF THE SECURITIES EXCHANGE ACT OF 1934 |
For the transition period from to
Commission File Number: 001-38124
GRANITE POINT MORTGAGE TRUST INC.
(Exact name of registrant as specified in its charter)
| | | | | | | | |
| Maryland | | 61-1843143 |
(State or other jurisdiction of
incorporation or organization) | | (I.R.S. Employer
Identification No.) |
| | | | | | | | | | | |
| 3 Bryant Park, Suite 2400A | | |
| New York, | New York | | 10036 |
| (Address of principal executive offices) | | (Zip Code) |
(212) 364-5500
(Registrant’s telephone number, including area code)
Securities registered pursuant to Section 12(b) of the Act:
| | | | | | | | | | | | | | |
| Title of each class | | Trading Symbol(s) | | Name of each exchange on which registered |
| Common Stock, par value $0.01 per share | | GPMT | | New YorkNYSE |
7.00% Series A Fixed-to-Floating Rate Cumulative Redeemable Preferred Stock, Exchangepar value $0.01 per share | | GPMTPrA | | NYSE |
Indicate by check mark whether the registrant (1) has filed all reports required to be filed by Section 13 or 15(d) of the Securities Exchange Act of 1934 during the preceding 12 months (or for such shorter period that the registrant was required to file such reports), and (2) has been subject to such filing requirements for the past 90 days. Yes ☒ No ☐
Indicate by check mark whether the registrant has submitted electronically every Interactive Data File required to be submitted pursuant to Rule 405 of Regulation S-T (§232.405 of this chapter) during the preceding 12 months (or for such shorter period that the registrant was required to submit such files). Yes ☒ No ☐
Indicate by check mark whether the registrant is a large accelerated filer, an accelerated filer, a non-accelerated filer, a smaller reporting company, or an emerging growth company. See the definitions of “large accelerated filer,” “accelerated filer,” “smaller reporting company,” and “emerging growth company” in Rule 12b-2 of the Exchange Act.
| | | | | | | | | | | | | | |
| Large accelerated filer | ☐☒ | | Accelerated filer | ☒☐ |
| Non-accelerated filer | ☐ | | Smaller reporting company | ☐ |
| | | Emerging growth company | ☐ |
If an emerging growth company, indicate by check mark if the registrant has elected not to use the extended transition period for complying with any new or revised financial accounting standards provided pursuant to Section 13(a) of the Exchange Act. ☐
Indicate by check mark whether the registrant is a shell company (as defined in Rule 12b-2 of the Exchange Act). Yes ☐ No ☒
Indicate the number of shares outstanding of each of the issuer’s classes of common stock, as of the latest practicable date.
As of NovemberAugust 4, 2021,2022, there were 53,789,46552,350,989 shares of outstanding common stock, par value $0.01 per share, issued and outstanding.
GRANITE POINT MORTGAGE TRUST INC.
INDEX
| | | | | | | | |
| | Page |
| PART I - FINANCIAL INFORMATION | |
| Item 1. | Financial Statements (unaudited) | |
| | |
| | |
| | |
| | |
| | |
| | |
| | |
| | |
| PART II - OTHER INFORMATION | |
| | |
| | |
| | |
| | |
| | |
| | |
| | |
| |
| |
PART I. FINANCIAL INFORMATION
Item 1. Financial Statements (unaudited)
GRANITE POINT MORTGAGE TRUST INC.
CONDENSED CONSOLIDATED BALANCE SHEETS
(in thousands, except share data)
| | | September 30,
2021 | | December 31,
2020 | | June 30,
2022 | | December 31,
2021 |
| ASSETS | ASSETS | | | | ASSETS | | | |
| Loans held-for-investment | Loans held-for-investment | $ | 3,659,691 | | | $ | 3,914,469 | | Loans held-for-investment | $ | 3,877,294 | | | $ | 3,782,205 | |
| Allowance for credit losses | Allowance for credit losses | (45,480) | | | (66,666) | | Allowance for credit losses | (47,280) | | | (40,897) | |
| Loans held-for-investment, net | Loans held-for-investment, net | 3,614,211 | | | 3,847,803 | | Loans held-for-investment, net | 3,830,014 | | | 3,741,308 | |
| | Cash and cash equivalents | Cash and cash equivalents | 154,916 | | | 261,419 | | Cash and cash equivalents | 150,192 | | | 191,931 | |
| Restricted cash | Restricted cash | 20,602 | | | 67,774 | | Restricted cash | 69,492 | | | 12,362 | |
| Accrued interest receivable | Accrued interest receivable | 9,898 | | | 12,388 | | Accrued interest receivable | 11,455 | | | 10,716 | |
| | Other assets | Other assets | 99,563 | | | 30,264 | | Other assets | 35,893 | | | 32,201 | |
Total Assets (1) | Total Assets (1) | $ | 3,899,190 | | | $ | 4,219,648 | | Total Assets (1) | $ | 4,097,046 | | | $ | 3,988,518 | |
| LIABILITIES AND STOCKHOLDERS’ EQUITY | LIABILITIES AND STOCKHOLDERS’ EQUITY | | | | LIABILITIES AND STOCKHOLDERS’ EQUITY | | | |
| Liabilities | Liabilities | | Liabilities | |
| Repurchase facilities | Repurchase facilities | $ | 916,758 | | | $ | 1,708,875 | | Repurchase facilities | $ | 1,271,659 | | | $ | 677,285 | |
| Securitized debt obligations | Securitized debt obligations | 1,356,429 | | | 927,128 | | Securitized debt obligations | 1,425,556 | | | 1,677,619 | |
| Asset-specific financings | Asset-specific financings | 44,752 | | | 123,091 | | Asset-specific financings | 43,622 | | | 43,622 | |
| Term financing facility | Term financing facility | 127,867 | | | — | | Term financing facility | — | | | 127,145 | |
| Convertible senior notes | Convertible senior notes | 272,512 | | | 271,250 | | Convertible senior notes | 273,822 | | | 272,942 | |
| | Senior secured term loan facilities | Senior secured term loan facilities | 208,785 | | | 206,448 | | Senior secured term loan facilities | — | | | 139,880 | |
| | Dividends payable | Dividends payable | 13,713 | | | 25,049 | | Dividends payable | 17,008 | | | 14,406 | |
| | Other liabilities | Other liabilities | 25,140 | | | 22,961 | | Other liabilities | 20,545 | | | 21,436 | |
Total Liabilities (1) | Total Liabilities (1) | 2,965,956 | | | 3,284,802 | | Total Liabilities (1) | 3,052,212 | | | 2,974,335 | |
| Commitments and Contingencies (see Note 10) | Commitments and Contingencies (see Note 10) | 0 | | 0 | Commitments and Contingencies (see Note 10) | 0 | | 0 |
| 10% cumulative redeemable preferred stock, par value $0.01 per share; 50,000,000 shares authorized and 1,000 shares issued and outstanding ($1,000,000 liquidation preference) | 1,000 | | | 1,000 | | |
| 10.00% cumulative redeemable preferred stock, par value $0.01 per share; 50,000,000 shares authorized, and 1,000 shares issued and outstanding ($1,000,000 liquidation preference) | | 10.00% cumulative redeemable preferred stock, par value $0.01 per share; 50,000,000 shares authorized, and 1,000 shares issued and outstanding ($1,000,000 liquidation preference) | 1,000 | | | 1,000 | |
| Stockholders’ Equity | Stockholders’ Equity | | Stockholders’ Equity | |
| Common stock, par value $0.01 per share; 450,000,000 shares authorized and 53,789,465 and 55,205,082 shares issued and outstanding, respectively | 538 | | | 552 | | |
| 7.00% Series A cumulative redeemable preferred stock, par value $0.01 per share; 8,280,000 shares authorized, and 8,229,500 and 4,596,500 shares issued and outstanding, respectively; liquidation preference $25.00 per share | | 7.00% Series A cumulative redeemable preferred stock, par value $0.01 per share; 8,280,000 shares authorized, and 8,229,500 and 4,596,500 shares issued and outstanding, respectively; liquidation preference $25.00 per share | 82 | | | 46 | |
| Common stock, par value $0.01 per share; 450,000,000 shares authorized, and 52,350,989 and 53,789,465 shares issued and outstanding, respectively | | Common stock, par value $0.01 per share; 450,000,000 shares authorized, and 52,350,989 and 53,789,465 shares issued and outstanding, respectively | 524 | | | 538 | |
| Additional paid-in capital | Additional paid-in capital | 1,037,395 | | | 1,058,298 | | Additional paid-in capital | 1,199,367 | | | 1,125,241 | |
| Cumulative earnings | Cumulative earnings | 164,055 | | | 103,165 | | Cumulative earnings | 162,423 | | | 171,518 | |
| Cumulative distributions to stockholders | Cumulative distributions to stockholders | (269,879) | | | (228,169) | | Cumulative distributions to stockholders | (318,687) | | | (284,285) | |
| Total Granite Point Mortgage Trust, Inc. Stockholders’ Equity | 932,109 | | | 933,846 | | |
| Total Granite Point Mortgage Trust Inc. Stockholders’ Equity | | Total Granite Point Mortgage Trust Inc. Stockholders’ Equity | 1,043,709 | | | 1,013,058 | |
| Non-controlling interests | Non-controlling interests | 125 | | | — | | Non-controlling interests | 125 | | | 125 | |
| Total Equity | Total Equity | $ | 932,234 | | | $ | 933,846 | | Total Equity | $ | 1,043,834 | | | $ | 1,013,183 | |
| Total Liabilities and Stockholders’ Equity | Total Liabilities and Stockholders’ Equity | $ | 3,899,190 | | | $ | 4,219,648 | | Total Liabilities and Stockholders’ Equity | $ | 4,097,046 | | | $ | 3,988,518 | |
____________________
(1)The condensed consolidated balance sheets include assets of consolidated variable interest entities, or VIEs, that can only be used to settle obligations of these VIEs, and liabilities of the consolidated VIEs for which creditors do not have recourse to Granite Point Mortgage Trust Inc. At SeptemberJune 30, 20212022, and December 31, 2020,2021, assets of the VIEs totaled $1,824,173$1,851,063 and $1,255,932,$2,266,044, respectively, and liabilities of the VIEs totaled $1,357,675$1,426,954 and $928,220,$1,679,435, respectively. See Note 4 - Variable Interest Entities and Securitized Debt Obligations for additional information.
The accompanying notes are an integral part of these condensed consolidated financial statements.
GRANITE POINT MORTGAGE TRUST INC.
CONDENSED CONSOLIDATED STATEMENTS OF COMPREHENSIVE (LOSS) INCOME (LOSS)
(in thousands, except share data)
| | | | | | | | | | | | | | | | | | | | | | | | | | |
| | Three Months Ended | | Nine Months Ended |
| | September 30, | | September 30, |
| | 2021 | | 2020 | | 2021 | | 2020 | | |
| Interest income: | | | | |
| Loans held-for-investment | | $ | 48,312 | | | $ | 56,783 | | | $ | 151,701 | | | $ | 180,341 | | | |
| Loans held-for-sale | | — | | | 774 | | | — | | | 895 | | | |
| Available-for-sale securities | | — | | | 119 | | | — | | | 646 | | | |
| Held-to-maturity securities | | — | | | 113 | | | — | | | 659 | | | |
| Cash and cash equivalents | | 95 | | | 57 | | | 298 | | | 424 | | | |
| Total interest income | | 48,407 | | | 57,846 | | | 151,999 | | | 182,965 | | | |
| Interest expense: | | | | | | | | | | |
| Repurchase facilities | | 5,451 | | | 12,791 | | | 20,449 | | | 46,742 | | | |
| Securitized debt obligations | | 8,777 | | | 5,431 | | | 20,523 | | | 21,367 | | | |
| Convertible senior notes | | 4,556 | | | 4,529 | | | 13,618 | | | 13,570 | | | |
| Term financing facility | | 1,453 | | | — | | | 6,208 | | | — | | | |
| Asset-specific financings | | 414 | | | 901 | | | 1,959 | | | 2,962 | | | |
| Revolving credit facilities | | — | | | 217 | | | — | | | 779 | | | |
| Senior secured term loan facilities | | 5,654 | | | 145 | | | 16,587 | | | 145 | | | |
| Total interest expense | | 26,305 | | | 24,014 | | | 79,344 | | | 85,565 | | | |
| Net interest income | | 22,102 | | | 33,832 | | | 72,655 | | | 97,400 | | | |
| | | | | | | | | | |
| | | | | | | | | | |
| | | | | | | | | | |
| | | | | | | | | | |
| Other income (loss): | | | | | | | | | | |
| Benefit from (provision for) credit losses | | 5,760 | | | 5,300 | | | 15,072 | | | (62,241) | | | |
| | | | | | | | | | |
| Realized losses on sales of loans held-for-sale | | — | | | (10,019) | | | — | | | (16,913) | | | |
| Fee income | | — | | | 595 | | | — | | | 1,117 | | | |
| | | | | | | | | | |
| Total other income (loss) | | 5,760 | | | (4,124) | | | 15,072 | | | (78,037) | | | |
| Expenses: | | | | | | | | | | |
| Base management fees | | — | | | 3,974 | | | — | | | 11,840 | | | |
| Compensation and benefits | | 5,634 | | | — | | | 16,111 | | | — | | | |
| Servicing expenses | | 1,323 | | | 914 | | | 3,763 | | | 3,025 | | | |
| Other operating expenses | | 2,276 | | | 5,808 | | | 6,967 | | | 24,421 | | | |
| Restructuring charges | | — | | | 43,682 | | | — | | | 43,682 | | | |
| Total expenses | | 9,233 | | | 54,378 | | | 26,841 | | | 82,968 | | | |
| Income (loss) before income taxes | | 18,629 | | | (24,670) | | | 60,886 | | | (63,605) | | | |
| Benefit from income taxes | | (1) | | | (4) | | | (4) | | | (15) | | | |
| Net income (loss) | | 18,630 | | | (24,666) | | | 60,890 | | | (63,590) | | | |
| Dividends on preferred stock | | 25 | | | 25 | | | 75 | | | 75 | | | |
| Net income (loss) attributable to common stockholders | | $ | 18,605 | | | $ | (24,691) | | | $ | 60,815 | | | $ | (63,665) | | | |
| Basic earnings (loss) per weighted average common share | | $ | 0.34 | | | $ | (0.45) | | | $ | 1.11 | | | $ | (1.15) | | | |
| Diluted earnings (loss) per weighted average common share | | $ | 0.33 | | | $ | (0.45) | | | $ | 1.05 | | | $ | (1.15) | | | |
| Dividends declared per common share | | $ | 0.25 | | | $ | 0.20 | | | $ | 0.75 | | | $ | 0.20 | | | |
| Weighted average number of shares of common stock outstanding: | | | | | | | | | | |
| Basic | | 54,453,546 | | | 55,205,082 | | | 54,864,456 | | | 55,140,163 | | | |
| Diluted | | 56,735,278 | | | 55,205,082 | | | 70,902,745 | | | 55,140,163 | | | |
| Comprehensive income (loss): | | | | | | | | | | |
| Net income (loss) attributable to common stockholders | | $ | 18,605 | | | $ | (24,691) | | | $ | 60,815 | | | $ | (63,665) | | | |
| Other comprehensive income (loss), net of tax: | | | | | | | | | | |
| | | | | | | | | | |
| | | | | | | | | | |
| Comprehensive income (loss) | | $ | 18,605 | | | $ | (24,691) | | | $ | 60,815 | | | $ | (63,665) | | | |
| | | | | | | | | | | | | | | | | | | | | | | | | | |
| | Three Months Ended | | Six Months Ended |
| | June 30, | | June 30, |
| | 2022 | | 2021 | | 2022 | | 2021 | | |
| Interest income: | | | |
| Loans held-for-investment | $ | 49,056 | | | $ | 49,350 | | | $ | 96,354 | | | $ | 103,389 | | | |
| | | | | | | | | | |
| | | | | | | | | | |
| | | | | | | | | | |
| Cash and cash equivalents | 223 | | | 103 | | | 246 | | | 203 | | | |
| Total interest income | 49,279 | | | 49,453 | | | 96,600 | | | 103,592 | | | |
| Interest expense: | | | | | | | | | |
| Repurchase facilities | 10,380 | | | 6,047 | | | 15,388 | | | 14,998 | | | |
| Securitized debt obligations | 10,844 | | | 7,129 | | | 20,576 | | | 11,746 | | | |
| Convertible senior notes | 4,572 | | | 4,544 | | | 9,118 | | | 9,062 | | | |
| Term financing facility | 340 | | | 2,633 | | | 1,713 | | | 4,755 | | | |
| Asset-specific financings | 322 | | | 668 | | | 604 | | | 1,545 | | | |
| | | | | | | | | | |
| Senior secured term loan facilities | 886 | | | 5,653 | | | 3,754 | | | 10,933 | | | |
| Total interest expense | 27,344 | | | 26,674 | | | 51,153 | | | 53,039 | | | |
| Net interest income | 21,935 | | | 22,779 | | | 45,447 | | | 50,553 | | | |
| | | | | | | | | | |
| | | | | | | | | | |
| | | | | | | | | | |
| | | | | | | | | | |
| Other (loss) income: | | | | | | | | | |
| (Provision for) benefit from credit losses | (13,627) | | | 193 | | | (17,315) | | | 9,312 | | | |
| Loss on extinguishment of debt | (13,032) | | | — | | | (18,823) | | | — | | | |
| | | | | | | | | | |
| Fee income | 461 | | | — | | | 954 | | | — | | | |
| | | | | | | | | | |
| Total other (loss) income | (26,198) | | | 193 | | | (35,184) | | | 9,312 | | | |
| Expenses: | | | | | | | | | |
| | | | | | | | | | |
| | | | | | | | | | |
| Compensation and benefits | 5,770 | | | 5,017 | | | 11,586 | | | 10,477 | | | |
| Servicing expenses | 1,500 | | | 1,124 | | | 2,961 | | | 2,440 | | | |
| Other operating expenses | 2,185 | | | 2,564 | | | 4,799 | | | 4,691 | | | |
| | | | | | | | | | |
| Total expenses | 9,455 | | | 8,705 | | | 19,346 | | | 17,608 | | | |
| (Loss) income before income taxes | (13,718) | | | 14,267 | | | (9,083) | | | 42,257 | | | |
| Provision for (benefit from) income taxes | 13 | | | (2) | | | 12 | | | (3) | | | |
| Net (loss) income | (13,731) | | | 14,269 | | | (9,095) | | | 42,260 | | | |
| Dividends on preferred stock | 3,625 | | | 25 | | | 7,250 | | | 50 | | | |
| Net (loss) income attributable to common stockholders | $ | (17,356) | | | $ | 14,244 | | | $ | (16,345) | | | $ | 42,210 | | | |
| Basic (loss) earnings per weighted average common share | $ | (0.32) | | | $ | 0.26 | | | $ | (0.30) | | | $ | 0.77 | | | |
| Diluted (loss) earnings per weighted average common share | $ | (0.32) | | | $ | 0.24 | | | $ | (0.30) | | | $ | 0.71 | | | |
| | | | | | | | | | |
| Weighted average number of shares of common stock outstanding: | | | | | | | | | |
| Basic | 53,512,005 | | | 55,009,732 | | | 53,683,575 | | | 55,073,317 | | | |
| Diluted | 53,512,005 | | | 58,526,985 | | | 53,683,575 | | | 72,564,914 | | | |
| | | | | | | | | | |
| | | | | | | | | | |
| | | | | | | | | | |
| | | | | | | | | | |
| | | | | | | | | | |
| Comprehensive (loss) income | $ | (17,356) | | | $ | 14,244 | | | $ | (16,345) | | | $ | 42,210 | | | |
The accompanying notes are an integral part of these condensed consolidated financial statements.
GRANITE POINT MORTGAGE TRUST INC
CONDENSED CONSOLIDATED STATEMENTS OF STOCKHOLDERS’ EQUITY
(in thousands, except share data)
| | | | | | | | | | | | | | | | | | | | | | | | | | | | | | | | | | | | | | | | | | | | | | | | | | | | | |
| Common Stock | | | | | | | | | | | | | | |
| Shares | | Amount | | Additional Paid-in Capital | | Accumulated Other Comprehensive Income (Loss) | | Cumulative Earnings | | Cumulative Distributions to Stockholders | | Total Stockholders’ Equity | | Non-controlling Interests | | Total Equity |
| | | | | | | | | | | | | | | | | |
| | | | | | | | | | | | | | | | | |
| | | | | | | | | | | | | | | | | |
| | | | | | | | | | | | | | | | | |
| | | | | | | | | | | | | | | | | |
| | | | | | | | | | | | | | | | | |
| | | | | | | | | | | | | | | | | |
| | | | | | | | | | | | | | | | | |
| | | | | | | | | | | | | | | | | |
| | | | | | | | | | | | | | | | | |
| | | | | | | | | | | | | | | | | |
| | | | | | | | | | | | | | | | | |
| | | | | | | | | | | | | | | | | |
| | | | | | | | | | | | | | | | | |
| | | | | | | | | | | | | | | | | |
| | | | | | | | | | | | | | | | | |
| | | | | | | | | | | | | | | | | |
| | | | | | | | | | | | | | | | | |
| | | | | | | | | | | | | | | | | |
| | | | | | | | | | | | | | | | | |
| | | | | | | | | | | | | | | | | |
| | | | | | | | | | | | | | | | | |
| | | | | | | | | | | | | | | | | |
| | | | | | | | | | | | | | | | | |
| | | | | | | | | | | | | | | | | |
| | | | | | | | | | | | | | | | | |
| | | | | | | | | | | | | | | | | |
| | | | | | | | | | | | | | | | | |
| | | | | | | | | | | | | | | | | |
| | | | | | | | | | | | | | | | | |
| | | | | | | | | | | | | | | | | |
| | | | | | | | | | | | | | | | | |
| | | | | | | | | | | | | | | | | |
| | | | | | | | | | | | | | | | | |
| | | | | | | | | | | | | | | | | |
| Balance, December 31, 2019 | 54,853,205 | | | 549 | | | 1,048,484 | | | 32 | | | 162,076 | | | (192,005) | | | 1,019,136 | | | — | | | 1,019,136 | |
| Cumulative effect of adoption of new accounting principle | — | | | — | | | — | | | — | | | (18,472) | | | — | | | (18,472) | | | — | | | (18,472) | |
| Adjusted balance, January 1, 2020 | 54,853,205 | | | 549 | | | 1,048,484 | | | 32 | | | 143,604 | | | (192,005) | | | 1,000,664 | | | — | | | 1,000,664 | |
| Net loss | — | | | — | | | — | | | — | | | (37,191) | | | — | | | (37,191) | | | — | | | (37,191) | |
| Other comprehensive loss before reclassifications | — | | | — | | | — | | | (4,511) | | | — | | | — | | | (4,511) | | | — | | | (4,511) | |
| Amounts reclassified from accumulated other comprehensive income | — | | | — | | | — | | | 767 | | | — | | | — | | | 767 | | | — | | | 767 | |
| Net other comprehensive loss | — | | | — | | | — | | | (3,744) | | | — | | | — | | | (3,744) | | | — | | | (3,744) | |
| | | | | | | | | | | | | | | | | |
| | | | | | | | | | | | | | | | | |
| | | | | | | | | | | | | | | | | |
| Preferred dividends declared, $25.00 per share | — | | | — | | | — | | | — | | | — | | | (25) | | | (25) | | | — | | | (25) | |
| | | | | | | | | | | | | | | | | |
| Non-cash equity award compensation | 283,680 | | | 3 | | | 1,352 | | | — | | | — | | | — | | | 1,355 | | | — | | | 1,355 | |
| Balance, March 31, 2020 | 55,136,885 | | | 552 | | | 1,049,836 | | | (3,712) | | | 106,413 | | | (192,030) | | | 961,059 | | | — | | | 961,059 | |
| Net loss | — | | | — | | | — | | | — | | | (1,733) | | | — | | | (1,733) | | | — | | | (1,733) | |
| Other comprehensive income before reclassifications | — | | | — | | | — | | | 4,223 | | | — | | | — | | | 4,223 | | | — | | | 4,223 | |
| Amounts reclassified from accumulated other comprehensive income | — | | | — | | | — | | | (511) | | | — | | | — | | | (511) | | | — | | | (511) | |
| Net other comprehensive income | — | | | — | | | — | | | 3,712 | | | — | | | — | | | 3,712 | | | — | | | 3,712 | |
| | | | | | | | | | | | | | | | | |
| | | | | | | | | | | | | | | | | |
| | | | | | | | | | | | | | | | | |
| Preferred dividends declared, $25.00 per share | — | | | — | | | — | | | — | | | — | | | (25) | | | (25) | | | — | | | (25) | |
| | | | | | | | | | | | | | | | | |
| Non-cash equity award compensation | 68,197 | | | — | | | 1,323 | | | — | | | — | | | — | | | 1,323 | | | — | | | 1,323 | |
| Balance, June 30, 2020 | 55,205,082 | | | 552 | | | 1,051,159 | | | — | | | 104,680 | | | (192,055) | | | 964,336 | | | — | | | 964,336 | |
| Net loss | — | | | — | | | — | | | — | | | (24,666) | | | — | | | (24,666) | | | — | | | (24,666) | |
| Issuance of warrants to purchase common stock | — | | | — | | | 4,541 | | | — | | | — | | | — | | | 4,541 | | | — | | | 4,541 | |
| Common dividends declared, $0.20 per share | — | | | $ | — | | | — | | | — | | | — | | | (11,040) | | | (11,040) | | | — | | | (11,040) | |
| Preferred dividends declared, $25.00 per share | — | | | $ | — | | | — | | | — | | | — | | | (25) | | | (25) | | | — | | | (25) | |
| Non-cash equity award compensation | — | | | $ | — | | | 1,316 | | | — | | | — | | | — | | | 1,316 | | | — | | | 1,316 | |
| Balance, September 30, 2020 | 55,205,082 | | | $ | 552 | | | $ | 1,057,016 | | | $ | — | | | $ | 80,014 | | | $ | (203,120) | | | $ | 934,462 | | | — | | | $ | 934,462 | |
| | | | | | | | | | | | | | | | | |
| | | | | | | | | | | | | | | | | | | | | | | | | | | | | | | | | | | | | | | | | | | | | | | | | | | | | | | | | | | | | |
| Common Stock | | Preferred Stock | | | | | | | | | | | | | | |
| Shares | | Amount | | Shares | | Amount | | Additional Paid-in Capital | | | | Cumulative Earnings | | Cumulative Distributions to Stockholders | | Total Stockholders’ Equity | | Non-controlling Interests | | Total Equity |
| | | | | | | | | | | | | | | | | | | | | |
| | | | | | | | | | | | | | | | | | | | | |
| | | | | | | | | | | | | | | | | | | | | |
| | | | | | | | | | | | | | | | | | | | | |
| | | | | | | | | | | | | | | | | | | | | |
| | | | | | | | | | | | | | | | | | | | | |
| | | | | | | | | | | | | | | | | | | | | |
| | | | | | | | | | | | | | | | | | | | | |
| | | | | | | | | | | | | | | | | | | | | |
| | | | | | | | | | | | | | | | | | | | | |
| | | | | | | | | | | | | | | | | | | | | |
| | | | | | | | | | | | | | | | | | | | | |
| | | | | | | | | | | | | | | | | | | | | |
| | | | | | | | | | | | | | | | | | | | | |
| | | | | | | | | | | | | | | | | | | | | |
| | | | | | | | | | | | | | | | | | | | | |
| | | | | | | | | | | | | | | | | | | | | |
| | | | | | | | | | | | | | | | | | | | | |
| | | | | | | | | | | | | | | | | | | | | |
| | | | | | | | | | | | | | | | | | | | | |
| | | | | | | | | | | | | | | | | | | | | |
| | | | | | | | | | | | | | | | | | | | | |
| | | | | | | | | | | | | | | | | | | | | |
| | | | | | | | | | | | | | | | | | | | | |
| | | | | | | | | | | | | | | | | | | | | |
| | | | | | | | | | | | | | | | | | | | | |
| | | | | | | | | | | | | | | | | | | | | |
| | | | | | | | | | | | | | | | | | | | | |
| | | | | | | | | | | | | | | | | | | | | |
| | | | | | | | | | | | | | | | | | | | | |
| | | | | | | | | | | | | | | | | | | | | |
| | | | | | | | | | | | | | | | | | | | | |
| | | | | | | | | | | | | | | | | | | | | |
| | | | | | | | | | | | | | | | | | | | | |
| | | | | | | | | | | | | | | | | | | | | |
| | | | | | | | | | | | | | | | | | | | | |
| | | | | | | | | | | | | | | | | | | | | |
| | | | | | | | | | | | | | | | | | | | | |
| | | | | | | | | | | | | | | | | | | | | |
| | | | | | | | | | | | | | | | | | | | | |
| | | | | | | | | | | | | | | | | | | | | |
| | | | | | | | | | | | | | | | | | | | | |
| | | | | | | | | | | | | | | | | | | | | |
| | | | | | | | | | | | | | | | | | | | | |
| | | | | | | | | | | | | | | | | | | | | |
| | | | | | | | | | | | | | | | | | | | | |
| | | | | | | | | | | | | | | | | | | | | |
| | | | | | | | | | | | | | | | | | | | | |
| | | | | | | | | | | | | | | | | | | | | |
| | | | | | | | | | | | | | | | | | | | | |
| | | | | | | | | | | | | | | | | | | | | |
| | | | | | | | | | | | | | | | | | | | | |
| | | | | | | | | | | | | | | | | | | | | |
| | | | | | | | | | | | | | | | | | | | | |
| | | | | | | | | | | | | | | | | | | | | |
| | | | | | | | | | | | | | | | | | | | | |
| | | | | | | | | | | | | | | | | | | | | |
| | | | | | | | | | | | | | | | | | | | | |
| | | | | | | | | | | | | | | | | | | | | |
| | | | | | | | | | | | | | | | | | | | | |
| | | | | | | | | | | | | | | | | | | | | |
| | | | | | | | | | | | | | | | | | | | | |
| | | | | | | | | | | | | | | | | | | | | |
| | | | | | | | | | | | | | | | | | | | | |
| | | | | | | | | | | | | | | | | | | | | |
| | | | | | | | | | | | | | | | | | | | | |
| | | | | | | | | | | | | | | | | | | | | |
| | | | | | | | | | | | | | | | | | | | | |
| | | | | | | | | | | | | | | | | | | | | |
| | | | | | | | | | | | | | | | | | | | | |
| | | | | | | | | | | | | | | | | | | | | |
| | | | | | | | | | | | | | | | | | | | | |
| | | | | | | | | | | | | | | | | | | | | |
| | | | | | | | | | | | | | | | | | | | | |
| | | | | | | | | | | | | | | | | | | | | |
| | | | | | | | | | | | | | | | | | | | | |
| | | | | | | | | | | | | | | | | | | | | |
| Balance, December 31, 2020 | 55,205,082 | | | 552 | | | — | | | — | | | 1,058,298 | | | | | 103,165 | | | (228,169) | | | 933,846 | | | — | | | 933,846 | |
| Net income | — | | | — | | | — | | | — | | | — | | | | | 27,991 | | | — | | | 27,991 | | | — | | | 27,991 | |
| | | | | | | | | | | | | | | | | | | | | |
| | | | | | | | | | | | | | | | | | | | | |
| Restricted stock forfeiture | (97,425) | | | (1) | | | — | | | — | | | (918) | | | | | — | | | — | | | (919) | | | — | | | (919) | |
| | | | | | | | | | | | | | | | | | | | | |
| Preferred dividends declared, $25.00 per share | — | | | — | | | — | | | — | | | — | | | | | — | | | (25) | | | (25) | | | — | | | (25) | |
| | | | | | | | | | | | | | | | | | | | | |
| Common dividends declared, $0.25 per share | — | | | — | | | — | | | — | | | — | | | | | — | | | (14,008) | | | (14,008) | | | — | | | (14,008) | |
| | | | | | | | | | | | | | | | | | | | | |
| Contributions from non-controlling interests | — | | | — | | | — | | | — | | | — | | | | | — | | | — | | | — | | | 125 | | | 125 | |
| Non-cash equity award compensation | — | | | — | | | — | | | — | | | 1,887 | | | | | — | | | — | | | 1,887 | | | — | | | 1,887 | |
| Balance, March 31, 2021 | 55,107,657 | | | 551 | | | — | | | — | | | 1,059,267 | | | | | 131,156 | | | (242,202) | | | 948,772 | | | 125 | | | 948,897 | |
| Net income | — | | | — | | | — | | | — | | | — | | | | | 14,269 | | | — | | | 14,269 | | | — | | | 14,269 | |
| Restricted stock forfeiture | (17,628) | | | — | | | — | | | — | | | (275) | | | | | — | | | — | | | (275) | | | — | | | (275) | |
| Repurchase of common stock | (300,891) | | | (3) | | | — | | | — | | | (4,267) | | | | | — | | | — | | | (4,270) | | | — | | | (4,270) | |
| Preferred dividends declared, $25.00 per share | — | | | — | | | — | | | — | | | — | | | | | — | | | (25) | | | (25) | | | — | | | (25) | |
| Common dividends declared, $0.25 per share | — | | | — | | | — | | | — | | | — | | | | | — | | | (13,939) | | | (13,939) | | | — | | | (13,939) | |
| | | | | | | | | | | | | | | | | | | | | |
| Non-cash equity award compensation | 1,048 | | | — | | | — | | | — | | | 1,639 | | | | | — | | | — | | | 1,639 | | | — | | | 1,639 | |
| Balance, June 30, 2021 | 54,790,186 | | | 548 | | | — | | | — | | | 1,056,364 | | | | | 145,425 | | | (256,166) | | | 946,171 | | | 125 | | | 946,296 | |
| | | | | | | | | | | | | | | | | | | | | |
GRANITE POINT MORTGAGE TRUST INC
CONDENSED CONSOLIDATED STATEMENTS OF STOCKHOLDERS’ EQUITY
(in thousands, except share data) (Continued)
| | Common Stock | | | |
| Shares | | Amount | | Additional Paid-in Capital | | Accumulated Other Comprehensive Income (Loss) | | Cumulative Earnings | | Cumulative Distributions to Stockholders | | Total Stockholders’ Equity | | Non-controlling Interests | | Total Equity | |
| Balance, December 31, 2020 | 55,205,082 | | | 552 | | | 1,058,298 | | | — | | | 103,165 | | | (228,169) | | | 933,846 | | | — | | | 933,846 | | |
| | Net income | — | | | — | | | — | | | — | | | 27,991 | | | — | | | 27,991 | | | — | | | |
| | Restricted stock forfeiture | (97,425) | | | (1) | | | (918) | | | — | | | — | | | — | | | (919) | | | — | | | (919) | | |
| Common dividends declared, $0.25 per share | — | | | — | | | — | | | — | | | — | | | (14,008) | | | (14,008) | | | — | | | (14,008) | | |
| Preferred dividends declared, $25.00 per share | — | | | — | | | — | | | — | | | — | | | (25) | | | (25) | | | — | | | (25) | | |
| Non-cash equity award compensation | — | | | — | | | 1,887 | | | — | | | — | | | — | | | 1,887 | | | — | | | 1,887 | | |
| Contributions from non-controlling interests | — | | | — | | | — | | | — | | | — | | | — | | | — | | | 125 | | | 125 | | |
| Balance, March 31, 2021 | 55,107,657 | | | 551 | | | 1,059,267 | | | — | | | 131,156 | | | (242,202) | | | 948,772 | | | 125 | | | 948,897 | | |
| Net income | — | | | — | | | — | | | — | | | 14,269 | | | — | | | 14,269 | | | — | | | 14,269 | | |
| | | | Common Stock | | Preferred Stock | | | |
| | | Shares | | Amount | | Shares | | Amount | | Additional Paid-in Capital | | | Cumulative Earnings | | Cumulative Distributions to Stockholders | | Total Stockholders’ Equity | | Non-controlling Interests | | Total Equity |
| | Balance, December 31, 2021 | | Balance, December 31, 2021 | 53,789,465 | | | 538 | | | 4,596,500 | | | 46 | | | 1,125,241 | | | | 171,518 | | | (284,285) | | | 1,013,058 | | | 125 | | | 1,013,183 | |
| Net income | | Net income | — | | | — | | | — | | | — | | | — | | | | 4,636 | | | — | | | 4,636 | | | — | | | 4,636 | |
| | Issuance of preferred stock, net of offering costs | | Issuance of preferred stock, net of offering costs | — | | | 3,633,000 | | | 36 | | | 87,485 | | | | — | | | — | | | 87,521 | | | — | | | 87,521 | |
| Restricted stock forfeiture | Restricted stock forfeiture | (17,628) | | | (275) | | | — | | | — | | | — | | | (275) | | | — | | | (275) | | Restricted stock forfeiture | (69,039) | | | — | | | — | | | — | | | (824) | | | | — | | | — | | | (824) | | | — | | | (824) | |
| Repurchase of common stock | (300,891) | | | (3) | | | (4,267) | | | — | | | — | | | — | | | (4,270) | | | — | | | (4,270) | | |
| Restricted Stock Unit (RSU) forfeiture | | Restricted Stock Unit (RSU) forfeiture | — | | | — | | | — | | | — | | | (798) | | | | — | | | — | | | (798) | | | — | | | (798) | |
| Preferred dividends declared, $25.00 per share | | Preferred dividends declared, $25.00 per share | — | | | — | | | — | | | — | | | — | | | | — | | | (25) | | | (25) | | | — | | | (25) | |
| Preferred dividends declared, $0.4375 per share | | Preferred dividends declared, $0.4375 per share | — | | | — | | | — | | | — | | | — | | | | — | | | (3,600) | | | (3,600) | | | — | | | (3,600) | |
| Common dividends declared, $0.25 per share | Common dividends declared, $0.25 per share | — | | | — | | | — | | | — | | | — | | | (13,939) | | | (13,939) | | | — | | | (13,939) | | Common dividends declared, $0.25 per share | — | | | — | | | — | | | — | | | — | | | | — | | | (13,770) | | | (13,770) | | | — | | | (13,770) | |
| Preferred dividends declared, $25.00 per share | — | | | — | | | — | | | — | | | — | | | (25) | | | (25) | | | — | | | (25) | | |
| | | Non-cash equity award compensation | Non-cash equity award compensation | 1,048 | | | — | | | 1,639 | | | — | | | — | | | — | | | 1,639 | | | — | | | 1,639 | | Non-cash equity award compensation | 135,151 | | | 1 | | | — | | | — | | | 2,170 | | | | — | | | — | | | 2,171 | | | — | | | 2,171 | |
| Balance, June 30, 2021 | 54,790,186 | | | 548 | | | 1,056,364 | | | — | | | 145,425 | | | (256,166) | | | 946,171 | | | 125 | | | 946,296 | | |
| Net income | — | | | — | | | — | | | — | | | 18,630 | | | — | | | 18,630 | | | — | | | 18,630 | | |
| Settlement of warrants to purchase common stock | — | | | — | | | (7,478) | | | — | | | — | | | — | | | (7,478) | | | — | | | (7,478) | | |
| Balance, March 31, 2022 | | Balance, March 31, 2022 | 53,855,577 | | | 539 | | | 8,229,500 | | | 82 | | | 1,213,274 | | | | 176,154 | | | (301,680) | | | 1,088,369 | | | 125 | | | 1,088,494 | |
| Net (loss) income | | Net (loss) income | — | | | — | | | — | | | — | | | — | | | | (13,731) | | | — | | | (13,731) | | | — | | | (13,731) | |
| | Repurchase of common stock | Repurchase of common stock | (1,000,721) | | | (10) | | | (13,523) | | | — | | | — | | | — | | | (13,533) | | | — | | | (13,533) | | Repurchase of common stock | (1,539,134) | | | (15) | | | — | | | — | | | (15,699) | | | | — | | | — | | | (15,714) | | | — | | | (15,714) | |
| Restricted Stock Unit (RSU) forfeiture | | Restricted Stock Unit (RSU) forfeiture | — | | | — | | | — | | | — | | | (114) | | | | — | | | — | | | (114) | | | — | | | (114) | |
| Preferred dividends declared, $25.00 per share | | Preferred dividends declared, $25.00 per share | — | | | — | | | — | | | — | | | — | | | | — | | | (25) | | | (25) | | | — | | | (25) | |
| Preferred dividends declared, $0.4375 per share | | Preferred dividends declared, $0.4375 per share | — | | | — | | | — | | | — | | | — | | | | — | | | (3,600) | | | (3,600) | | | — | | | (3,600) | |
| Common dividends declared, $0.25 per share | Common dividends declared, $0.25 per share | — | | | — | | | — | | | — | | | — | | | (13,688) | | | (13,688) | | | — | | | (13,688) | | Common dividends declared, $0.25 per share | — | | | — | | | — | | | — | | | — | | | | — | | | (13,382) | | | (13,382) | | | — | | | (13,382) | |
| Preferred dividends declared, $25.00 per share | — | | | — | | | — | | | — | | | — | | | (25) | | | (25) | | | — | | | (25) | | |
| Non-cash equity award compensation | Non-cash equity award compensation | — | | | — | | | 2,032 | | | — | | | — | | | — | | | 2,032 | | | — | | | 2,032 | | Non-cash equity award compensation | 34,546 | | | — | | | — | | | — | | | 1,906 | | | | — | | | — | | | 1,906 | | | — | | | 1,906 | |
| Balance, September 30, 2021 | 53,789,465 | | | $ | 538 | | | $ | 1,037,395 | | | $ | — | | | $ | 164,055 | | | $ | (269,879) | | | $ | 932,109 | | | $ | 125 | | | $ | 932,234 | | |
| Balance, June 30, 2022 | | Balance, June 30, 2022 | 52,350,989 | | | 524 | | | 8,229,500 | | | 82 | | | 1,199,367 | | | | 162,423 | | | (318,687) | | | 1,043,709 | | | 125 | | | 1,043,834 | |
The accompanying notes are an integral part of these condensed consolidated financial statements.
GRANITE POINT MORTGAGE TRUST INC.
CONDENSED CONSOLIDATED STATEMENTS OF CASH FLOWS (in thousands) | | | | | | | | | | | | | | |
| | Nine Months Ended |
| | September 30, |
| | 2021 | | 2020 | | |
| Cash Flows From Operating Activities: | | | | |
| Net income (loss) | | $ | 60,890 | | | $ | (63,590) | | | |
| Adjustments to reconcile net income (loss) to net cash provided by operating activities: | | | | | | |
| Accretion of discounts and net deferred fees on loans held-for-investment and deferred interest capitalized to loans held-for-investment | | (20,310) | | | (12,557) | | | |
| Amortization of deferred debt issuance costs on repurchase facilities, asset-specific financings, convertible senior notes, securitized debt obligations, senior secured term loan facilities and term financing facilities | | 9,692 | | | 4,646 | | | |
| (Benefit from) provision for credit losses | | (15,072) | | | 62,241 | | | |
| | | | | | |
| | | | | | |
| Realized losses on sales of loans held-for-sale | | — | | | 16,913 | | | |
| | | | | | |
| | | | | | |
| | | | | | |
| Amortization of equity-based compensation | | 5,558 | | | 3,994 | | | |
| Depreciation of fixed assets | | — | | | — | | | |
| Net change in assets and liabilities: | | | | | | |
| Decrease (increase) in accrued interest receivable | | 2,490 | | | (610) | | | |
| | | | | | |
| | | | | | |
| | | | | | |
| Increase in other assets | | (4,069) | | | (19,899) | | | |
| | | | | | |
| | | | | | |
| | | | | | |
| | | | | | |
| Increase in other liabilities | | 5,846 | | | 44,911 | | | |
| | | | | | |
| Net cash provided by operating activities | | 45,025 | | | 36,049 | | | |
| Cash Flows From Investing Activities: | | | | | | |
| Originations, acquisitions and additional fundings of loans held-for-investment, net of deferred fees | | (549,705) | | | (314,722) | | | |
| | | | | | |
| Proceeds from repayment of loans held-for-investment | | 815,054 | | | 290,838 | | | |
| | | | | | |
| | | | | | |
| | | | | | |
| Increase in other assets, due from servicer/trustee on repayments of loans held-for-investment | | (66,944) | | | — | | | |
| Principal payments on available-for-sale securities | | — | | | 12,798 | | | |
| | | | | | |
| | | | | | |
| Principal payments on held-to-maturity securities | | — | | | 18,076 | | | |
| | | | | | |
| Proceeds from sales of loans held-for-sale | | — | | | 193,538 | | | |
| | | | | | |
| | | | | | |
| Net cash provided by investing activities | | 198,405 | | | 200,528 | | | |
| | | | | | |
| Cash Flows From Financing Activities: | | | | | | |
| Proceeds from repurchase facilities | | 347,261 | | | 397,004 | | | |
| Principal payments on repurchase facilities | | (1,139,378) | | | (470,180) | | | |
| Proceeds from issuance of securitized debt obligations | | 685,766 | | | — | | | |
| Principal payments on securitized debt obligations | | (254,647) | | | (115,853) | | | |
| Proceeds from senior secured term loan facilities | | — | | | 205,647 | | | |
| Proceeds from asset-specific financings | | 2,785 | | | 6,626 | | | |
| Repayment of asset-specific financings | | (81,123) | | | — | | | |
| Proceeds from revolving credit facilities | | — | | | 38,361 | | | |
| Repayment of revolving credit facilities | | — | | | (80,369) | | | |
| Proceeds from term financing facility | | 349,291 | | | — | | | |
| Repayment of term financing facility | | (219,311) | | | — | | | |
| Payment of debt issuance costs | | (8,353) | | | — | | | |
| Proceeds from issuance of warrants to purchase common stock | | — | | | 4,541 | | | |
| Settlement of warrants to purchase common stock | | (7,478) | | | 0 | | |
| Contributions from non-controlling interests | | 125 | | | — | | | |
| Tax withholding on restricted stock | | (1,194) | | | — | | | |
| Repurchase of common stock | | (17,804) | | | — | | | |
| Dividends paid on preferred stock | | (75) | | | (75) | | | |
| Dividends paid on common stock | | (52,970) | | | (23,038) | | | |
| Net cash used in financing activities | | (397,105) | | | (37,336) | | | |
| Net (decrease) increase in cash, cash equivalents and restricted cash | | (153,675) | | | 199,241 | | | |
| Cash, cash equivalents and restricted cash at beginning of period | | 329,193 | | | 159,764 | | | |
| Cash, cash equivalents and restricted cash at end of period | | $ | 175,518 | | | $ | 359,005 | | | |
| Supplemental Disclosure of Cash Flow Information: | | | | | | |
| Cash paid for interest | | $ | 75,818 | | | $ | 83,366 | | | |
| Cash paid for taxes | | $ | 607 | | | $ | — | | | |
| Noncash Activities: | | | | | | |
| | | | | | |
| Transfers of loans held-for-investment to loans held-for-sale | | $ | — | | | $ | 210,452 | | | |
| Dividends declared but not paid at end of period | | $ | 13,713 | | | $ | 11,065 | | | |
| | | | | | | | | | | | | | |
| | Six Months Ended |
| | June 30, |
| | 2022 | | 2021 | | |
| Cash Flows From Operating Activities: | | | |
| Net (loss) income | $ | (9,095) | | | $ | 42,260 | | | |
| Adjustments to reconcile net (loss) income to net cash provided by operating activities: | | | | | |
| Accretion of discounts and net deferred fees on loans held-for-investment and deferred interest capitalized to loans held-for-investment | (7,907) | | | (16,652) | | | |
| Amortization of deferred debt issuance costs | 7,520 | | | 5,636 | | | |
| Provision for (benefit from) credit losses | 17,315 | | | (9,312) | | | |
| | | | | | |
| | | | | | |
| | | | | | |
| | | | | | |
| | | | | | |
| | | | | | |
| Loss on extinguishment of debt | 11,307 | | | — | | | |
| Amortization of equity-based compensation | 4,077 | | | 3,526 | | | |
| Proceeds received from deferred interest capitalized to loans held-for-investment | 2,407 | | | — | | | |
| Net change in assets and liabilities: | | | | | |
| (Increase) decrease in accrued interest receivable | (739) | | | 2,239 | | | |
| | | | | | |
| | | | | | |
| | | | | | |
| Decrease in other assets | 121 | | | 1,355 | | | |
| | | | | | |
| | | | | | |
| | | | | | |
| | | | | | |
| Increase (decrease) in other liabilities | (2,226) | | | 1,670 | | | |
| | | | | | |
| Net cash provided by operating activities | 22,780 | | | 30,722 | | | |
| Cash Flows From Investing Activities: | | | | | |
| Originations, acquisitions and additional fundings of loans held-for-investment, net of deferred fees | (379,493) | | | (228,750) | | | |
| Proceeds from loan sales | 43,714 | | | — | | | |
| Proceeds from repayment of loans held-for-investment | 236,594 | | | 524,557 | | | |
| | | | | | |
| | | | | | |
| | | | | | |
| | | | | | |
| Increase in other assets, due from servicer on repayments of loans held-for-investment | (689) | | | — | | | |
| | | | | | |
| | | | | | |
| | | | | | |
| | | | | | |
| | | | | | |
| | | | | | |
| | | | | | |
| | | | | | |
| Net cash (used in) provided by investing activities | (99,874) | | | 295,807 | | | |
| | | | | | |
| Cash Flows From Financing Activities: | | | | | |
| Proceeds from repurchase facilities | 677,175 | | | 82,931 | | | |
| Principal payments on repurchase facilities | (82,801) | | | (1,074,611) | | | |
| Proceeds from issuance of securitized debt obligations | — | | | 685,766 | | | |
| Principal payments on securitized debt obligations | (255,117) | | | (162,366) | | | |
| | | | | | |
| Repayment of senior secured term loan facilities | (150,000) | | | — | | | |
| | | | | | |
| Repayment of asset-specific financings | — | | | (40,323) | | | |
| | | | | | |
| | | | | | |
| Proceeds from term financing facility | — | | | 349,291 | | | |
| Repayment of term financing facility | (129,099) | | | (204,606) | | | |
| | | | | | |
| | | | | | |
| Payment of debt issuance costs | (5,943) | | | (8,353) | | | |
| | | | | | |
| Contributions from non-controlling interests | — | | | 125 | | | |
| | | | | | |
| Proceeds from issuance of preferred stock, net of offering costs | 87,521 | | | — | | | |
| | | | | | |
| | | | | | |
| | | | | | |
| Tax withholding on restricted stock and RSUs | (1,736) | | | (1,194) | | | |
| Repurchase of common stock | (15,714) | | | (4,270) | | | |
| Dividends paid on preferred stock | (4,343) | | | (50) | | | |
| Dividends paid on common stock | (27,458) | | | (39,032) | | | |
| Net cash provided by (used in) financing activities | 92,485 | | | (416,692) | | | |
| Net increase (decrease) in cash, cash equivalents and restricted cash | 15,391 | | | (90,163) | | | |
| Cash, cash equivalents, and restricted cash at beginning of period | 204,293 | | | 329,193 | | | |
| Cash, cash equivalents, and restricted cash at end of period | $ | 219,684 | | | $ | 239,030 | | | |
| Supplemental Disclosure of Cash Flow Information: | | | | | |
| Cash paid for interest | $ | 49,938 | | | $ | 53,505 | | | |
| Cash paid for taxes | $ | 420 | | | $ | 611 | | | |
| Noncash Activities: | | | | | |
| | | | | | |
| Dividends declared but not paid at end of period | $ | 17,007 | | | $ | 13,964 | | | |
The accompanying notes are an integral part of these condensed consolidated financial statements.
GRANITE POINT MORTGAGE TRUST INC.
Notes to the Condensed Consolidated Financial Statements (unaudited)
Note 1. Organization and Operations
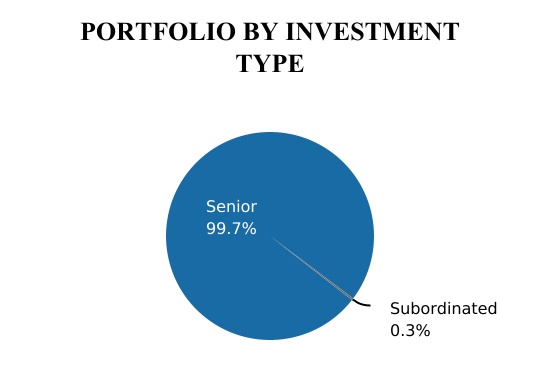
Granite Point Mortgage Trust Inc., or the Company, is an internally managed real estate finance company that focuses primarily on directly originating, investing in and managing senior floating-rate commercial mortgage loans and other debt and debt-like commercial real estate investments. These investments are capitalized by accessing a variety of funding options,sources, including borrowing under ourthe Company’s bank credit facilities or other asset-specific financings, issuing commercial real estate collateralized loan obligations, or CRE CLOs, entering into term financing agreements, and issuing other forms of secured and unsecured debt and equity securities, depending on market conditions and ourthe Company’s view of the most appropriate funding option available for ourthe Company’s investments. OurThe Company is not in the business of buying or trading securities, and the only securities it owns are the retained interests from its CRE CLOs. The Company’s investment objective is to preserve ourthe Company’s stockholders’ capital while generating attractive risk-adjusted returns over the long term, primarily through dividends derived from current income produced by ourthe Company’s investment portfolio. OurThe Company’s common stock is listed on the New York Stock Exchange, or NYSE, under the symbol “GPMT”. The Company operates its business in a manner that is intended to permit it to maintain its exclusion from registration under the Investment Company Act of 1940, as amended, or the Investment Company Act. The Company operates its business as 1 segment. The Company was incorporated in Maryland on April 7, 2017, and commenced operations as a publicly traded company on June 28, 2017.
The Company has elected to be treated as a real estate investment trust, or REIT, as defined under the Internal Revenue Code of 1986, as amended, or the Code, for U.S. federal income tax purposes. As long as the Company continues to comply with a number of requirements under federal tax law and maintains its qualification as a REIT, the Company generally will not be subject to U.S. federal income taxes to the extent that the Company distributes its taxable income to its stockholders on an annual basis and does not engage in prohibited transactions. However, certain activities that the Company may perform may cause it to earn income which will not be qualifying income for REIT purposes. The Company has designated one of its subsidiaries as a taxable REIT subsidiary, or TRS, as defined in the Code, to engage in such activities.
The Company was externally managed by Pine River Capital Management L.P., or the Former Manager, through December 31, 2020, at which time the Company internalized its management function, or the Internalization.
Note 2. Basis of Presentation and Significant Accounting Policies
Consolidation and Basis of Presentation
The interim unaudited condensed consolidated financial statements of the Company have been prepared in accordance with the rules and regulations of the Securities and Exchange Commission, or the SEC. Certain information and note disclosures normally included in financial statements prepared in accordance with U.S. generally accepted accounting principles, or GAAP, have been condensed or omitted according to such SEC rules and regulations. However, management believes that the disclosures included in these interim condensed consolidated financial statements are adequate to make the information presented not misleading. The accompanying unaudited condensed consolidated financial statements should be read in conjunction with the financial statements and notes thereto included in the Company’s Annual Report on Form 10-K for the year ended December 31, 2020.2021. In the opinion of management, all normal and recurring adjustments necessary to present fairly the financial condition of the Company at SeptemberJune 30, 20212022, and results of operations for all periods presented, have been made. The results of operations for the three and ninesix months ended SeptemberJune 30, 20212022, should not be construed as indicative of the results to be expected for future periods or the full year.
The unaudited condensed consolidated financial statements of the Company include the accounts of all subsidiaries; inter-company accounts and transactions have been eliminated. Certain prior period amounts have been reclassified to conform to the current period presentation.
All entities in which the Company holds investments that are considered VIEs for financial reporting purposes were reviewed for consolidation under the applicable consolidation guidance. Whenever the Company has both the power to direct the activities of an entity that most significantly impact the entity’s performance, and the obligation to absorb losses or the right to receive benefits of the entity that could be significant, the Company consolidates the entity.
Use of Estimates
The preparation of financial statements in conformity with GAAP requires management to make a number of significant estimates. These include estimates of amount and timing of allowances for credit losses, fair value of certain assets and liabilities, and other estimates that affect the reported amounts of certain assets and liabilities as of the date of the condensed consolidated financial statements and the reported amounts of certain revenues and expenses during the reported period. It is likely that changes in these estimates (e.g., valuation changes to the underlying collateral of loans due to changes in market interest and capitalization rates, leasing, credit worthiness of major tenants, occupancy rates, availability of financing, exit plan, loan sponsorship, actions of other lenders, overall economic and capital markets conditions, the broader commercial real estate market, local geographic sub-markets or other factors) will occur in the near term. As of September 30, 2021, the COVID-19
GRANITE POINT MORTGAGE TRUST INC.
Notes to the Condensed Consolidated Financial Statements (unaudited)
pandemic remains ongoing. SinceAs the beginning of 2020, thenovel coronavirus, or COVID-19, pandemic has significantly impacted theevolved from its emergence in early 2020, so has its global economy, created disruptionsimpact, including contributing to significant volatility in the global supply chain, increased rates of unemployment and adversely impactedfinancial markets. The longer-term macroeconomic effects continue to impact many industries, including those related to the real estate collateral underlying certain of ourthe Company’s loans. So farMoreover, with the potential for new strains of COVID-19 to emerge, governments and businesses may re-impose aggressive measures to help slow its spread in 2021, the global and U.S. economic activity has, to varying degrees, begun to improve,future. For this reason, among others, as wider distribution of the COVID-19 vaccinespandemic continues, the potential global impacts are uncertain and difficult to assess. In addition, the pandemic continues to disrupt global supply chains and cause labor shortages and has continued. As a result, macroeconomic forecasts have improved overadded to broad inflationary pressures, all of which could negatively impact the last few quarters, including expectations for unemploymentCompany’s borrowers’ ability to execute on the business plans on their properties and potentially affect their ability to perform under the terms of their loan agreements. In response to the inflationary pressures, the Federal Reserve has begun raising interest rates and overall economic output. Nonetheless, the ongoing pandemichas indicated it anticipates further interest rate increases. Such increases in interest rates may continue to adversely impact the macroeconomic recovery, particularly with respect to the emergence of new variants of the COVID-19 virus, the continued distribution and acceptance of vaccines and the effectiveness of such vaccines against new variants of the COVID-19 virus. Accordingly, given the ongoing nature of the outbreak, at this time the Company cannot reasonably estimate the magnitude of the long-term impact that COVID-19 may have on the economic activity and real estate market conditions, as well asincrease the Company’s business, financial performanceinterest expense, which may not be fully offset by any increases in interest income, and operating results. may also slow the pace of loan repayments and increase the number of borrowers who seek extension of term on their loans.
The Company believes the estimates and assumptions underlying its condensed consolidated financial statements are reasonable and supportable based on the information available as of SeptemberJune 30, 2021.2022. However, uncertainty over the ultimate impact the COVID-19, pandemicFederal Reserve actions and geopolitical uncertainty will have on the global economyand U.S. economies generally, and the Company’s business in particular, makes any estimates and assumptions as of SeptemberJune 30, 20212022, inherently less certain than they would be absent the current and potential impacts of the COVID-19 pandemic.these factors. The Company’s actual results could ultimately differ from its estimates and such differences may be material.
Significant Accounting Policies
Included in Note 2 to the Consolidated Financial Statements of the Company’s Annual Report on Form 10-K for the year ended December 31, 20202021, is a summary of the Company’s significant accounting policies. Provided below is a summary of additional accounting policies that are significant to the Company’s condensed consolidated financial condition and results of operations for the three and ninesix months ended SeptemberJune 30, 2021.
Term Financing Facility
The Company finances certain of its loans held-for-investment through the use of a term financing facility. Borrowings under the term financing facility bear an interest rate of a specified margin over the one-month London Interbank Offered Rate, or LIBOR. The term financing facility financings are treated as collateralized financing transactions and are carried at their contractual amounts, as specified in the respective agreements.2022.
Recently Issued and/or Adopted Accounting Standards
Financial Instruments-Credit Losses (Topic 326): Troubled Debt Restructurings and Vintage Disclosures
In March 2022, the Financial Accounting Standards Board, or FASB, issued ASU 2022-02, Financial Instruments – Credit Losses (Topic 326): Troubled Debt Restructurings and Vintage Disclosures, or ASU 2022-02. The intention of ASU 2022-02 is to simplify the guidance surrounding loan modifications and restructurings and to eliminate the accounting guidance related to troubled debt restructurings, or TDR. The new guidance deviates from TDR guidance as disclosures are now based on whether a modification or restructuring with a borrower experiencing financial difficulty results in principal forgiveness, an interest rate reduction, a significant payment delay or term extension as opposed to simply a concession. The new guidance requires disclosure by class of financing receivables, of the types of modifications, the financial effects of those modifications and the performance of those modified receivables in the last twelve months. As it relates to ASC 326-20 the Company is now allowed to use any acceptable method to determine credit losses as a result of modification or restructuring with a borrower experiencing financial difficulty. ASU 2022-02 also requires disclosure of gross write-offs recorded in the current period, on a year-to-date basis, by year of origination in the vintage disclosures. ASU 2022-02 is effective for fiscal years beginning after December 15, 2022. Entities are able to early adopt these amendments and have the ability to early adopt the TDR enhancements separately from the vintage disclosures. The Company has not yet adopted this ASU and will continue to evaluate the effects of adoption.
Facilitation of the Effects of Reference Rate Reform on Financial Reporting
In March 2020, the Financial Accounting Standards Board, or FASB issued ASU No. 2020-04, Reference Rate Reform (Topic 848): Facilitation of the Effects of Reference Rate Reform on Financial Reporting, or ASU No. 2020-04, which provides optional expedients and exceptions for applying GAAP to debt instruments, derivatives, and other contracts that reference the London Interbank Offered Rate, or LIBOR, or other reference rates expected to be discontinued as a result of reference rate reform. This guidance is optional and may be elected through December 31, 2022, using a prospective application on all eligible contract modifications. The Company has loan agreements and debt agreements that incorporate LIBOR as a referenced interest rate. It is difficult to predict what effect, if any, the phase-out of LIBOR and the use of alternative benchmarks may have on the Company’s business or on the overall financial markets. The Company has not adopted any of the optional expedients or exceptions through SeptemberJune 30, 2021,2022, but will continue to evaluate the possible adoption of any such expedients or exceptions.
Accounting for Convertible Instruments and Contracts in an Entity’s Own Equity7
In August 2020, FASB issued ASU No. 2020-06,
Debt – Debt with Conversion and Other Options (Subtopic 470-20) and Derivatives and Hedging – Contracts in an Entity’s Own Equity (Subtopic 815-40): Accounting for Convertible Instruments and Contracts in an Entity’s Own Equity,
or ASU No. 2020-06. The intention of ASU No. 2020-06 is
GRANITE POINT MORTGAGE TRUST INC.
Notes to address the complexities in accounting for certain financial instruments with a debt and equity component. Under ASU No. 2020-06, the number of accounting models for convertible notes will be reduced and entities that issue convertible debt will be required to use the if-converted method for the computation of diluted "Earnings per share" under ASC 260. ASC 2020-06 is effective for fiscal years beginning after December 15, 2021 and may be adopted through either a modified retrospective method of transition or a fully retrospective method of transition. The Company is currently assessing the impact this guidance will have on its condensed consolidated financial statements.Condensed Consolidated Financial Statements
Note 3. Loans Held-for-Investment, Net of Allowance for Credit Losses
The Company originates and acquires commercial real estate debt and related instruments generally to be held as long-term investments. These assets are classified as “loans held-for-investment” on the condensed consolidated balance sheets. Loans held-for-investment are reported at cost, net of any unamortized acquisition premiums or discounts, loan fees, origination costs and allowance for credit losses, as applicable.
GRANITE POINT MORTGAGE TRUST INC.
Notes to the Condensed Consolidated Financial Statements (unaudited)
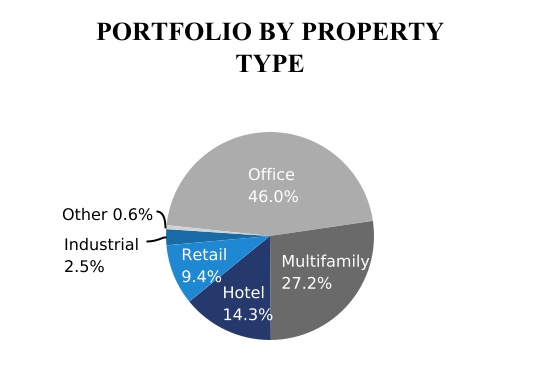
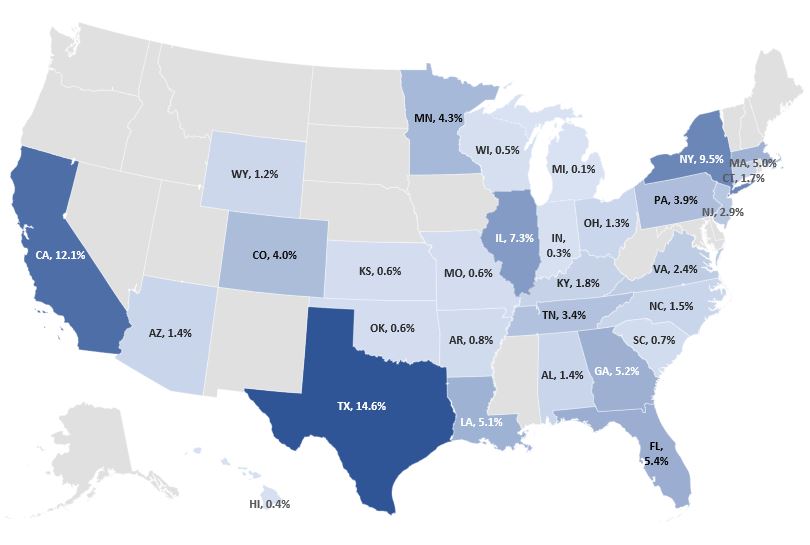
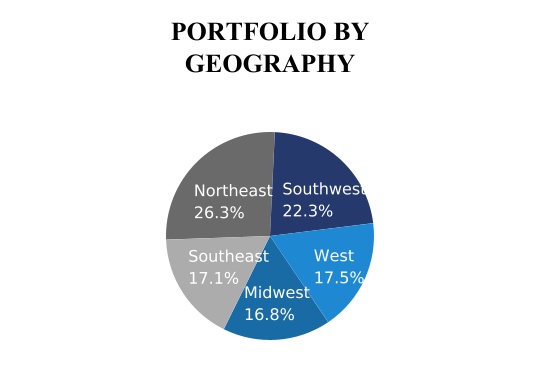
The following tables summarize the Company’s loans held-for-investment by asset type, property type and geographic location as of SeptemberJune 30, 20212022, and December 31, 2020:2021:
| | | September 30,
2021 | | June 30,
2022 |
| (dollars in thousands) | (dollars in thousands) | Senior Loans (1) | | Mezzanine Loans | | B-Notes | | Total | (dollars in thousands) | Senior Loans (1) | | Mezzanine Loans | | B-Notes | | Total |
| Unpaid principal balance | Unpaid principal balance | $ | 3,657,401 | | | $ | 1,387 | | | $ | 14,065 | | | $ | 3,672,853 | | Unpaid principal balance | $ | 3,875,237 | | | $ | 356 | | | $ | 13,886 | | | $ | 3,889,479 | |
| Unamortized (discount) premium | Unamortized (discount) premium | (67) | | | — | | | — | | | (67) | | Unamortized (discount) premium | (55) | | | — | | | — | | | (55) | |
| Unamortized net deferred origination fees | Unamortized net deferred origination fees | (13,095) | | | — | | | — | | | (13,095) | | Unamortized net deferred origination fees | (12,130) | | | — | | | — | | | (12,130) | |
| Allowance for credit losses | Allowance for credit losses | (40,897) | | | (1,387) | | | (3,196) | | | (45,480) | | Allowance for credit losses | (46,188) | | | (356) | | | (736) | | | (47,280) | |
| Carrying value | Carrying value | $ | 3,603,342 | | | $ | — | | | $ | 10,869 | | | $ | 3,614,211 | | Carrying value | $ | 3,816,864 | | | $ | — | | | $ | 13,150 | | | $ | 3,830,014 | |
| Unfunded commitments | Unfunded commitments | $ | 430,105 | | | $ | — | | | $ | — | | | $ | 430,105 | | Unfunded commitments | $ | 358,705 | | | $ | — | | | $ | — | | | $ | 358,705 | |
| Number of loans | Number of loans | 98 | | | 1 | | | 1 | | | 100 | | Number of loans | 102 | | | 1 | | | 1 | | | 104 | |
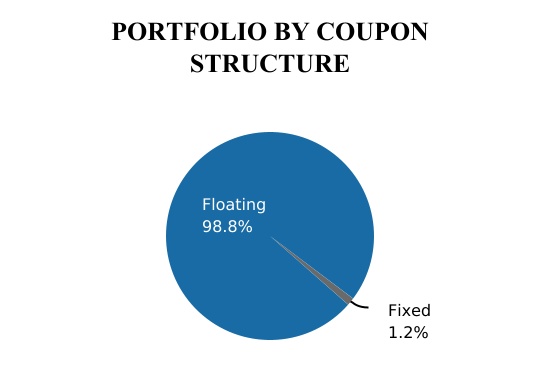
| Weighted average coupon | Weighted average coupon | 4.6 | % | | 13.0 | % | | 8.0 | % | | 4.6 | % | Weighted average coupon | 4.6 | % | | 13.0 | % | | 8.0 | % | | 4.6 | % |
Weighted average years to maturity (2) | Weighted average years to maturity (2) | 1.0 | | 4.1 | | 5.3 | | 1.0 | Weighted average years to maturity (2) | 1.0 | | 3.4 | | 4.6 | | 1.0 |
| | | December 31,
2020 | | December 31,
2021 |
| (dollars in thousands) | (dollars in thousands) | Senior Loans (1) | | Mezzanine Loans | | B-Notes | | Total | (dollars in thousands) | Senior Loans (1) | | Mezzanine Loans | | B-Notes | | Total |
| Unpaid principal balance | Unpaid principal balance | $ | 3,915,833 | | | $ | 2,366 | | | $ | 14,235 | | | $ | 3,932,434 | | Unpaid principal balance | $ | 3,781,771 | | | $ | 1,048 | | | $ | 14,006 | | | $ | 3,796,825 | |
| Unamortized (discount) premium | Unamortized (discount) premium | (75) | | | — | | | — | | | (75) | | Unamortized (discount) premium | (70) | | | — | | | — | | | (70) | |
| Unamortized net deferred origination fees | Unamortized net deferred origination fees | (17,890) | | | — | | | — | | | (17,890) | | Unamortized net deferred origination fees | (14,550) | | | — | | | — | | | (14,550) | |
| Allowance for credit losses | Allowance for credit losses | (60,130) | | | (2,366) | | | (4,170) | | | (66,666) | | Allowance for credit losses | (38,719) | | | (1,048) | | | (1,130) | | | (40,897) | |
| Carrying value | Carrying value | $ | 3,837,738 | | | $ | — | | | $ | 10,065 | | | $ | 3,847,803 | | Carrying value | $ | 3,728,432 | | | $ | — | | | $ | 12,876 | | | $ | 3,741,308 | |
| Unfunded commitments | Unfunded commitments | $ | 503,726 | | | $ | — | | | $ | — | | | $ | 503,726 | | Unfunded commitments | $ | 403,584 | | | $ | — | | | $ | — | | | $ | 403,584 | |
| Number of loans | Number of loans | 101 | | | 1 | | | 1 | | | 103 | | Number of loans | 103 | | | 1 | | | 1 | | | 105 | |
| Weighted average coupon | Weighted average coupon | 5.1 | % | | 13.0 | % | | 8.0 | % | | 5.1 | % | Weighted average coupon | 4.5 | % | | 13.0 | % | | 8.0 | % | | 4.5 | % |
Weighted average years to maturity (2) | Weighted average years to maturity (2) | 1.1 | | 4.9 | | 6.1 | | 1.1 | Weighted average years to maturity (2) | 1.1 | | 3.9 | | 5.1 | | 1.1 |
____________________
(1)Loans primarily secured by a first priority lien on commercial real property and related personal property and also includes, when applicable, any companion subordinate loans.
(2)Based on contractual maturity date. Certain loans are subject to contractual extension options with such conditions stipulated in the applicable loan documents. Actual maturities may differ from contractual maturities stated herein as certain borrowers may have the right to prepay with or without paying a prepayment fee. The Company may also extend contractual maturities in connection with certain loan modifications.
| | | | | | | | | | | | | | | | | | | | | | | | | | |
| (dollars in thousands) | | September 30,
2021 | | December 31,
2020 |
| Property Type | | Carrying Value | | % of Loan Portfolio | | Carrying Value | | % of Loan Portfolio |
| Office | | $ | 1,663,478 | | | 46.0 | % | | $ | 1,720,705 | | | 44.7 | % |
| Multifamily | | 982,624 | | | 27.2 | % | | 910,557 | | | 23.7 | % |
| Hotel | | 517,028 | | | 14.3 | % | | 646,869 | | | 16.8 | % |
| Retail | | 340,265 | | | 9.4 | % | | 332,218�� | | | 8.6 | % |
| Industrial | | 89,456 | | | 2.5 | % | | 196,677 | | | 5.1 | % |
| Other | | 21,360 | | | 0.6 | % | | 40,777 | | | 1.1 | % |
| Total | | $ | 3,614,211 | | | 100.0 | % | | $ | 3,847,803 | | | 100.0 | % |
GRANITE POINT MORTGAGE TRUST INC.
Notes to the Condensed Consolidated Financial Statements (unaudited)
| | | | | | | | | | | | | | | | | | | | | | | | | | |
| (dollars in thousands) | | September 30,
2021 | | December 31,
2020 |
| Geographic Location | | Carrying Value | | % of Loan Portfolio | | Carrying Value | | % of Loan Portfolio |
| Northeast | | $ | 950,447 | | | 26.3 | % | | $ | 1,028,584 | | | 26.8 | % |
| Southwest | | 807,483 | | | 22.3 | % | | 802,233 | | | 20.8 | % |
| West | | 630,826 | | | 17.5 | % | | 682,236 | | | 17.7 | % |
| Midwest | | 608,102 | | | 16.8 | % | | 712,675 | | | 18.5 | % |
| Southeast | | 617,353 | | | 17.1 | % | | 622,075 | | | 16.2 | % |
| | | | | | | | |
| Total | | $ | 3,614,211 | | | 100.0 | % | | $ | 3,847,803 | | | 100.0 | % |
| | | | | | | | | | | | | | | | | | | | | | | | | | |
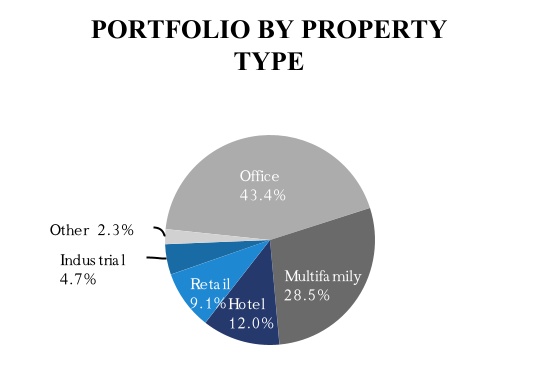
| (dollars in thousands) | | June 30,
2022 | | December 31,
2021 |
| Property Type | | Carrying Value | | % of Loan Portfolio | | Carrying Value | | % of Loan Portfolio |
| Office | | $ | 1,663,577 | | | 43.4 | % | | $ | 1,703,951 | | | 45.5 | % |
| Multifamily | | 1,090,106 | | | 28.5 | % | | 1,061,434 | | | 28.4 | % |
| Hotel | | 460,432 | | | 12.0 | % | | 464,816 | | | 12.4 | % |
| Retail | | 347,287 | | | 9.1 | % | | 341,834 | | | 9.1 | % |
| Industrial | | 181,871 | | | 4.7 | % | | 118,564 | | | 3.2 | % |
| Other | | 86,741 | | | 2.3 | % | | 50,709 | | | 1.4 | % |
| Total | | $ | 3,830,014 | | | 100.0 | % | | $ | 3,741,308 | | | 100.0 | % |
| | | | | | | | | | | | | | | | | | | | | | | | | | |
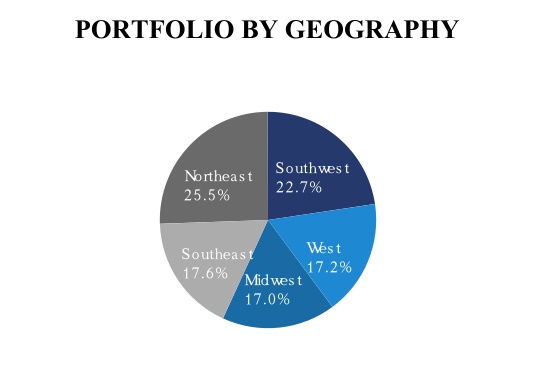
| (dollars in thousands) | | June 30,
2022 | | December 31,
2021 |
| Geographic Location | | Carrying Value | | % of Loan Portfolio | | Carrying Value | | % of Loan Portfolio |
| Northeast | | $ | 976,965 | | | 25.5 | % | | $ | 917,029 | | | 24.5 | % |
| Southwest | | 869,316 | | | 22.7 | % | | 836,955 | | | 22.4 | % |
| West | | 660,173 | | | 17.2 | % | | 658,429 | | | 17.6 | % |
| Midwest | | 649,233 | | | 17.0 | % | | 637,784 | | | 17.0 | % |
| Southeast | | 674,327 | | | 17.6 | % | | 691,111 | | | 18.5 | % |
| | | | | | | | |
| Total | | $ | 3,830,014 | | | 100.0 | % | | $ | 3,741,308 | | | 100.0 | % |
At SeptemberJune 30, 20212022, and December 31, 2020,2021, the Company pledged loans held-for-investment with a carrying value, net of allowance for credit losses, of $3.5$3.6 billion and $3.8$3.7 billion, respectively, as collateral under repurchase facilities, an asset-specifica term financing facility, a terman asset-specific financing facility and securitized debt obligations. See Note 4 - Variable Interest Entities and Securitized Debt Obligations and Note 5 - Secured Financing Agreements.
The following table summarizes activity related to loans held-for-investment, net of allowance for credit losses, for the three and ninesix months ended SeptemberJune 30, 20212022, and 2020:2021:
| | | Three Months Ended September 30, | | Nine Months Ended September 30, | | Three Months Ended June 30, | | Six Months Ended June 30, |
| (in thousands) | (in thousands) | 2021 | | 2020 | | 2021 | | 2020 | | (in thousands) | 2022 | | 2021 | | 2022 | | 2021 | |
| Balance at beginning of period | Balance at beginning of period | $ | 3,577,644 | | | $ | 4,290,047 | | | $ | 3,847,803 | | | $ | 4,226,212 | | | Balance at beginning of period | $ | 3,750,470 | | | $ | 3,799,836 | | | $ | 3,741,308 | | | $ | 3,847,803 | | |
| Originations, additional fundings and capitalized deferred interest | 325,597 | | | 57,617 | | | 565,212 | | | 317,630 | | | |
| Originations, additional fundings, upsizing of loans and capitalized deferred interest | | Originations, additional fundings, upsizing of loans and capitalized deferred interest | 212,245 | | | 197,838 | | | 385,110 | | | 239,615 | | |
| | Repayments | Repayments | (290,497) | | | (184,723) | | | (815,054) | | | (290,838) | | | Repayments | (120,107) | | | (422,969) | | | (238,490) | | | (524,557) | | |
| Transfers to loans held-for-sale | — | | | (190,787) | | | — | | | (210,452) | | | |
| Loan sales | | Loan sales | — | | | — | | | (43,714) | | | — | | |
| Net discount accretion (premium amortization) | Net discount accretion (premium amortization) | (2) | | | — | | | 9 | | | 16 | | | Net discount accretion (premium amortization) | 7 | | | 4 | | | 16 | | | 11 | | |
| (Increase) decrease in net deferred origination fees | (3,566) | | | 101 | | | (5,905) | | | (2,908) | | | |
| Increase in net deferred origination fees | | Increase in net deferred origination fees | (2,318) | | | (2,305) | | | (4,558) | | | (2,339) | | |
| Amortization of net deferred origination fees | Amortization of net deferred origination fees | 2,584 | | | 3,236 | | | 10,700 | | | 12,541 | | | Amortization of net deferred origination fees | 2,843 | | | 3,478 | | | 6,832 | | | 8,116 | | |
| | Benefit from (provision for) credit losses | 2,451 | | | 3,371 | | | 11,446 | | | (73,339) | | | |
| (Provision for) benefit from credit losses | | (Provision for) benefit from credit losses | (13,126) | | | 1,762 | | | (16,490) | | | 8,995 | | |
| Balance at end of period | Balance at end of period | $ | 3,614,211 | | | $ | 3,978,862 | | | $ | 3,614,211 | | | $ | 3,978,862 | | | Balance at end of period | $ | 3,830,014 | | | $ | 3,577,644 | | | $ | 3,830,014 | | | $ | 3,577,644 | | |
Allowance for Credit Losses
Subsequent to the adoption of ASU 2016-13 on January 1, 2020, to estimate and recognize an allowance for credit losses on loans held-for-investment and theirthe related unfunded commitments, the Company continues to use a third-party licensed probability-weighted analytical model. The Company employs quarterly updated macroeconomic forecasts, which reflect expectations for overall economic output, interest rates, values of real estate properties and other factors, including the ongoing impactimpacts of the COVID-19 pandemic, geopolitical instability and the Federal Reserve monetary policy on the overall U.S. economy and commercial real estate markets generally. Driven by the general progress around the development and distribution of the COVID-19 vaccines over the last few quarters, those macroeconomic forecasts have been improving, including expectations for unemployment rates, overall economic output and values of real estate properties. Significant inputs to the Company’s estimate of the allowance for credit
GRANITE POINT MORTGAGE TRUST INC.
Notes to the Condensed Consolidated Financial Statements
losses include loan specific factors such as debt service coverage ratio, or DSCR, loan to value ratio, or LTV, remaining contractual loan term, property type and others. As part of the quarterly review of the portfolio, the Company assesses the expected repayment date of each loan, which is used to determine the contractual term for purposes of computing the current expected credit loss, or CECL, reserve. In certain instances, for loans with unique risk and credit characteristics, the Company may instead elect to employ different methods to estimate an allowance for credit losses that also conform to ASU 2016-13 and related guidance.
As of SeptemberJune 30, 2021,2022, the Company recognized an allowance for credit losses related to its loans held-for-investment of $45.5$47.3 million, which reflectedreflects a write-off of $9.7 million on a loan held-for-investment and a benefit fromtotal increase in the provision for credit losses of $2.5$13.1 million for the three months ended SeptemberJune 30, 2021.2022. The benefit fromincrease of $13.1 million includes a $4.0 million increase in the allowance for credit losses related to an office loan with an unpaid balance of $93.8 million that was individually assessed in accordance with ASU 2016-13 during the three months ended June 30, 2022, as further discussed below. The other loan that was individually assessed during the three months ended June 30, 2022, had been previously reserved for and there was no change in the reserve during the three months ended June 30, 2022. The remaining increase in the Company’s provision for credit losses reflects the continued general improvementwas related to changes in the overall performanceportfolio mix and implementing in its analysis a more conservative macroeconomic forecast driven by an elevated uncertainty for the macroeconomic outlook due to inflationary pressures, continuing supply chain disruptions, interest rate volatility and other factors, moderately offset by a recovery of the investment portfolio and current expectations for further improvement in macroeconomic conditions.$0.5 million on amounts previously written off.
The allowance for credit losses related to the Company’s loans held-for-investment is deducted from the amortized cost basis of related loans, while the allowance for credit losses related to off-balance sheet unfunded commitments on existing loans is recorded as a component of other liabilities on the Company’s condensed consolidated balance sheets. As of SeptemberJune 30, 2021,2022, the Company recognized $1.9$2.8 million in other liabilities related to the allowance for credit losses on unfunded
GRANITE POINT MORTGAGE TRUST INC.
Notes to the Condensed Consolidated Financial Statements (unaudited)
commitments. During the three months ended September 30, 2021, the Company recognized commitments and recorded a benefit from provision for credit losses of $3.3$1.0 million mainly related tofor the release of a $3.2 million allowance for credit losses related to unfunded commitments on the office loan that had previously been deemed to be collateral-dependent and for which the unfunded commitments were deemed to be unlikely to be funded, given the loan’s delinquent status as of Septemberthree months ended June 30, 2021.2022. Changes in the provision for credit losses for both loans held-for-investment and their related unfunded commitments are recognized through net (loss) income (loss) on the Company’s condensed consolidated statements of comprehensive income (loss).income.
The following table presents the changes for the three and ninesix months ended SeptemberJune 30, 20212022, and 20202021 in the allowance for credit losses on loans held-for-investment:
| | | Three Months Ended September 30, | | | Nine Months Ended September 30, | | Three Months Ended June 30, | | Six Months Ended June 30, |
| (in thousands) | (in thousands) | 2021 | | | 2021 | | (in thousands) | 2022 | | 2021 | | 2022 | | 2021 | |
| Balance at beginning of period | Balance at beginning of period | $ | 57,671 | | | | $ | 66,666 | | | Balance at beginning of period | $ | 34,154 | | | $ | 59,433 | | | $ | 40,897 | | | $ | 66,666 | | |
| (Benefit from) provision for credit losses | (2,451) | | | | (11,446) | | | |
| Provision for (benefit from) credit losses | | Provision for (benefit from) credit losses | 13,638 | | | (1,762) | | | 17,002 | | | (8,995) | | |
| Write-off | Write-off | (9,740) | | | | (9,740) | | | Write-off | — | | | — | | | (10,107) | | | — | | |
| Recoveries of amounts previously written off | Recoveries of amounts previously written off | — | | | | — | | | Recoveries of amounts previously written off | (512) | | | — | | | (512) | | | — | | |
| Balance at end of period | Balance at end of period | $ | 45,480 | | | | $ | 45,480 | | | Balance at end of period | $ | 47,280 | | | $ | 57,671 | | | $ | 47,280 | | | $ | 57,671 | | |
| | | | | | | | | | | | | | | | | |
| Three Months Ended September 30, | | | | Nine Months Ended September 30, |
| (in thousands) | 2020 | | | | 2020 | | | | |
| Balance at beginning of period | $ | 76,710 | | | | | $ | 16,692 | | | | | |
| (Benefit from) provision for credit losses | (3,371) | | | | | 56,647 | | | | | |
| Write-offs | — | | | | | — | | | | | |
| Recoveries of amounts previously written off | — | | | | | — | | | | | |
| Balance at end of period | $ | 73,339 | | | | | $ | 73,339 | | | | | |
During the six months ended June 30, 2022, the Company resolved a senior loan that had an outstanding unpaid principal balance of $54.0 million. The loan had been previously placed on nonaccrual status. The Company recognized a write-off of $10.1 million on the sale of the loan.
Generally, loans held-for-investment are placed on nonaccrual status when delinquent for more than 90 days or earlier when determined not to be probable of full collection. Interest income recognition is suspended when loans are placed on nonaccrual status.
During the three months ended September As of June 30, 2021,2022, the Company resolved the nonaccrual status of a senior loan secured by a mixed-use office and retail property in New York City with an unpaid principal balance of $22.0 million. The Company received all interest that was previously due in the amount of approximately $1.6 million, which was recorded in interest income on the Company’s condensed consolidated statements of comprehensive income (loss). Given these facts and the Company’s expectations for the loan to be performing in accordance with the terms of the loan agreement, the loan was reinstated to accrual status.
During the three months ended September 30, 2021, the Company resolved a senior loan that had an outstanding unpaid principal balance of $68.1 million and had been on nonaccrual status. The resolution involved a coordinated sale of the collateral property, a Minneapolis, MN hotel, and the Company providing the new ownership group with a new $45.3 million senior floating rate loan. As a result of these transactions, the Company recognized a write-off of $9.7 million.
As of September 30, 2021, the Company had twohas 2 senior loans with a total unpaid principal balance of $168.1$207.9 million and carrying value of $145.4$188.8 million that wereare held on nonaccrual status. Any reversal of accrued interest income is recorded in interest income on the Company’s condensed consolidated statements of comprehensive income (loss). No other loans were considered past due, and no other loans were held on nonaccrual status as of SeptemberJune 30, 2021.2022.
GRANITE POINT MORTGAGE TRUST INC.
Notes to the Condensed Consolidated Financial Statements (unaudited)
The following table presents the carrying value of loans held-for-investment on nonaccrual status for the three and ninesix months ended SeptemberJune 30, 2022, and 2021:
| | | Three Months Ended September 30, | Nine Months Ended September 30, | | | Three Months Ended June 30, | | Six Months Ended June 30, |
| (in thousands) | (in thousands) | 2021 | | (in thousands) | 2022 | | 2021 | | 2022 | | 2021 | |
| Nonaccrual loan carrying value at beginning of period | Nonaccrual loan carrying value at beginning of period | $ | 225,115 | | $ | 17,835 | | | Nonaccrual loan carrying value at beginning of period | $ | 99,527 | | | $ | 19,264 | | | $ | 145,370 | | | $ | 17,835 | | |
| Addition of nonaccrual loan carrying value | Addition of nonaccrual loan carrying value | $ | — | | $ | 207,280 | | | Addition of nonaccrual loan carrying value | $ | 89,312 | | | $ | 205,851 | | | $ | 89,323 | | | $ | 207,280 | | |
| Removal of nonaccrual loan carrying value | Removal of nonaccrual loan carrying value | $ | (79,765) | | $ | (79,765) | | | Removal of nonaccrual loan carrying value | $ | — | | | $ | — | | | $ | (45,854) | | | $ | — | | |
| Nonaccrual loan carrying value at end of period | Nonaccrual loan carrying value at end of period | $ | 145,350 | | $ | 145,350 | | | Nonaccrual loan carrying value at end of period | $ | 188,839 | | | $ | 225,115 | | | $ | 188,839 | | | $ | 225,115 | | |
Loan Risk Ratings
The Company’s primary credit quality indicators are its risk ratings. The Company evaluates the credit quality of each loan at least quarterly by assessing the risk factors of each loan and assigning a risk rating based on a variety of factors. Risk factors include property type, geographic and local market dynamics, physical condition, leasing and tenant profile, projected cash flow, loan structure and exit plan, LTV, project sponsorship and other factors deemed necessary. Risk ratings are defined as follows:
1 –Lower Risk
2 –Average Risk
3 –Acceptable Risk
4 –Higher Risk: A loan that has exhibited material deterioration in cash flows and/or other credit factors, which, if negative trends continue, could be indicative of probability of principal loss.
5 –Loss Likely: A loan that has a significantly increased probability of principal loss.
The following table presents the number of loans, unpaid principal balance and carrying value by risk rating for loans held-for-investment as of SeptemberJune 30, 20212022, and December 31, 2020:2021:
| | (dollars in thousands) | (dollars in thousands) | | September 30,
2021 | | December 31,
2020 | (dollars in thousands) | | June 30,
2022 | | December 31,
2021 |
| Risk Rating | Risk Rating | | Number of Loans | | Unpaid Principal Balance | | Carrying Value | | Number of Loans | | Unpaid Principal Balance | | Carrying Value | Risk Rating | | Number of Loans | | Unpaid Principal Balance | | Carrying Value | | Number of Loans | | Unpaid Principal Balance | | Carrying Value |
| 1 | 1 | | 9 | | | $ | 281,201 | | | $ | 280,172 | | | 6 | | | $ | 183,369 | | | $ | 182,730 | | 1 | | 8 | | | $ | 292,285 | | | $ | 291,458 | | | 9 | | | $ | 245,939 | | | $ | 245,042 | |
| 2 | 2 | | 53 | | | 1,842,052 | | | 1,819,740 | | | 50 | | | 1,863,590 | | | 1,847,332 | | 2 | | 59 | | | 2,083,389 | | | 2,060,713 | | | 58 | | | 2,002,008 | | | 1,983,615 | |
| 3 | 3 | | 26 | | | 839,615 | | | 832,077 | | | 29 | | | 1,055,782 | | | 1,026,662 | | 3 | | 27 | | | 869,253 | | | 861,050 | | | 25 | | | 747,631 | | | 739,343 | |
| 4 | 4 | | 10 | | | 541,891 | | | 536,872 | | | 17 | | | 762,636 | | | 732,310 | | 4 | | 8 | | | 436,641 | | | 427,954 | | | 11 | | | 633,153 | | | 627,938 | |
| 5 | 5 | | 2 | | | 168,094 | | | 145,350 | | | 1 | | | 67,057 | | | 58,769 | | 5 | | 2 | | | 207,911 | | | 188,839 | | | 2 | | | 168,094 | | | 145,370 | |
| Total | Total | | 100 | | | $ | 3,672,853 | | | $ | 3,614,211 | | | 103 | | | $ | 3,932,434 | | | $ | 3,847,803 | | Total | | 104 | | | $ | 3,889,479 | | | $ | 3,830,014 | | | 105 | | | $ | 3,796,825 | | | $ | 3,741,308 | |
As of SeptemberJune 30, 2021,2022, the weighted average risk rating of the Company’s portfolio was 2.6,2.5, weighted by unpaid principal balance, versus 2.82.5 as of March 31, 2022, and 2.6 as of December 31, 2021. The portfolio risk rating was largely unchanged versus the period ended March 31, 2022, as changes in portfolio mix from new loan originations largely offset select ratings downgrades as of June 30, 2021.2022. The moderate improvement in the portfolio’s weighted average risk rating as of June 30, 2022, as compared to the period ended December 31, 2021, reflects the ongoing economicoriginations of new loans and market recovery from the COVID-19 pandemic, the advancement of business plans for the collateral properties, and the resulting improvement in the performance of the properties securing select loans within the Company’s loan portfolio, which resulted inwere partially offset by risk rating upgradesdowngrades of several loans experiencing delays in execution of business plan for the portfolio during the three months ended September 30, 2021.collateral properties.
GRANITE POINT MORTGAGE TRUST INC.
Notes to the Condensed Consolidated Financial Statements (unaudited)
The following table presents the carrying value of loans held-for-investment as of SeptemberJune 30, 20212022, and 2020December 31, 2021, by risk rating and year of origination:
| | | | | | | | | | | | | | | | | | | | | | | | | | | | | | | | | | | | | | | | | | | | | | | | | | |
| | September 30, 2021 |
| (dollars in thousands) | | Origination Year | | |
| Risk Rating | | 2021 | | 2020 | | 2019 | | 2018 | | 2017 | | 2016 | | Prior | | Total |
| 1 | | $ | — | | | $ | — | | | $ | 171,163 | | | $ | 75,601 | | | $ | — | | | $ | 33,408 | | | $ | — | | | $ | 280,172 | |
| 2 | | $ | 402,170 | | | $ | 86,214 | | | $ | 841,954 | | | $ | 340,839 | | | $ | 59,246 | | | $ | 37,389 | | | $ | 51,928 | | | $ | 1,819,740 | |
| 3 | | $ | 44,488 | | | $ | 58,241 | | | $ | 238,699 | | | $ | 241,541 | | | $ | 156,008 | | | $ | 67,991 | | | $ | 25,109 | | | $ | 832,077 | |
| 4 | | $ | — | | | $ | — | | | $ | 166,549 | | | $ | 73,375 | | | $ | 177,333 | | | $ | — | | | $ | 119,615 | | | $ | 536,872 | |
| 5 | | $ | — | | | $ | — | | | $ | — | | | $ | 99,495 | | | $ | 45,855 | | | $ | — | | | $ | — | | | $ | 145,350 | |
| Total | | $ | 446,658 | | | $ | 144,455 | | | $ | 1,418,365 | | | $ | 830,851 | | | $ | 438,442 | | | $ | 138,788 | | | $ | 196,652 | | | $ | 3,614,211 | |
| | | | | | | | | | | | | | | | | | | | | | | | | | | | | | | | | | | | | | | | | | | | | |
| | September 30, 2020 | |
| (dollars in thousands) | | Origination Year | | | |
| Risk Rating | | 2020 | | 2019 | | 2018 | | 2017 | | 2016 | | Prior | | Total | |
| 1 | | $ | — | | | $ | 18,269 | | | $ | 90,472 | | | $ | — | | | $ | 33,300 | | | $ | — | | | $ | 142,041 | | |
| 2 | | 74,375 | | | 1,050,044 | | | 591,444 | | | 284,263 | | | 103,336 | | | 54,078 | | | 2,157,540 | | |
| 3 | | 11,827 | | | 359,028 | | | 259,642 | | | 257,661 | | | — | | | 11,193 | | | 899,351 | | |
| 4 | | 40,931 | | | 166,125 | | | 250,302 | | | 180,968 | | | — | | | 141,604 | | | 779,930 | | |
| 5 | | — | | | — | | | — | | | — | | | — | | | — | | | — | | |
| Total | | $ | 127,133 | | | $ | 1,593,466 | | | $ | 1,191,860 | | | $ | 722,892 | | | $ | 136,636 | | | $ | 206,875 | | | $ | 3,978,862 | | |
| | | | | | | | | | | | | | | | | | | | | | | | | | | | | | | | | | | | | | | | | | | | | | | | | | |
| | June 30, 2022 |
| (in thousands) | | Origination Year | | |
| Risk Rating | | 2022 | | 2021 | | 2020 | | 2019 | | 2018 | | 2017 | | Prior | | Total |
| 1 | | $ | — | | | $ | — | | | $ | — | | | $ | 201,471 | | | $ | 56,873 | | | $ | — | | | $ | 33,114 | | | $ | 291,458 | |
| 2 | | $ | 296,422 | | | $ | 583,416 | | | $ | 136,674 | | | $ | 673,879 | | | $ | 269,359 | | | $ | 13,150 | | | $ | 87,813 | | | $ | 2,060,713 | |
| 3 | | $ | — | | | $ | 47,860 | | | $ | 18,250 | | | $ | 280,228 | | | $ | 270,320 | | | $ | 152,935 | | | $ | 91,457 | | | $ | 861,050 | |
| 4 | | $ | — | | | $ | — | | | $ | — | | | $ | 91,113 | | | $ | 53,083 | | | $ | 166,176 | | | $ | 117,582 | | | $ | 427,954 | |
| 5 | | $ | — | | | $ | — | | | $ | — | | | $ | 89,312 | | | $ | 99,527 | | | $ | — | | | $ | — | | | $ | 188,839 | |
| Total | | $ | 296,422 | | | $ | 631,276 | | | $ | 154,924 | | | $ | 1,336,003 | | | $ | 749,162 | | | $ | 332,261 | | | $ | 329,966 | | | $ | 3,830,014 | |
During the nine months ended September 30, 2021, the Company entered into a loan modification related to a retail asset located in Pasadena, CA, which is classified as troubled debt restructuring under GAAP. This modification included, among other changes, a partial deferral of the loan’s contractual interest payments due to the collateral property’s cash flows and operating performance being adversely affected by the ongoing effects of the COVID-19 pandemic. This loan had also been previously modified. At September 30, 2021, this first mortgage loan had an outstanding principal balance of $114.1 million and was assigned a risk rating of “5”. The Company determined that the recovery of the loan’s principal is collateral-dependent. Accordingly, this loan was assessed individually and the Company elected to apply a practical expedient in accordance with ASU 2016-13. At September 30, 2021, the Company recorded an allowance for credit loss of $14.1 million on this loan based on the Company’s estimate of fair value of the loan’s underlying collateral using the discounted cash flow method of valuation less the estimated cost to foreclose and sell the property. The estimation of the fair value of the collateral property also involved using various Level 3 inputs, which were in part developed based on discussions with various market participants and management’s best estimates as of the valuation date, and required significant judgment. Additionally, during the nine months ended September 30, 2021, the Company placed this loan on nonaccrual status and reversed $0.3 million of interest income. This loan’s maturity date has passed without the loan being paid off. The Company is evaluating a variety of potential options with respect to the resolution of this loan, which, among others, may include a foreclosure, negotiated deed-in-lieu of foreclosure, a sale of the underlying collateral property or a sale of the loan.
During the nine months ended September 30, 2021, a first mortgage loan with a principal balance of $54.0 million collateralized by an office property located in Washington, D.C., was downgraded to a risk rating of “5” as a result of the collateral property’s operating performance being adversely affected by the ongoing office leasing market challenges related to the COVID-19 pandemic. During the nine months ended September 30, 2021, the Company entered into a loan modification related to this asset, which included, among other changes, a reallocation of certain reserves. This loan had also been modified previously. The Company determined that the recovery of the loan’s principal is collateral-dependent. Accordingly, this loan was assessed individually and the Company elected to apply a practical expedient in accordance with ASU 2016-13. At September 30, 2021, the Company recorded an allowance for credit loss of $8.0 million on this loan based on the Company’s estimate of fair value of the loan’s underlying collateral using the discounted cash flow method of valuation less the estimated cost to foreclose and sell the property. The estimation of the fair value of the collateral property also involved using various
12 | | | | | | | | | | | | | | | | | | | | | | | | | | | | | | | | | | | | | | | | | | | | | | | | | | |
| | December 31, 2021 |
| (in thousands) | | Origination Year | | |
| Risk Rating | | 2021 | | 2020 | | 2019 | | 2018 | | 2017 | | 2016 | | Prior | | Total |
| 1 | | — | | | — | | | 136,138 | | | 75,592 | | | — | | | 33,312 | | | — | | | $ | 245,042 | |
| 2 | | 623,992 | | | 90,381 | | | 828,432 | | | 347,173 | | | 12,877 | | | 31,872 | | | 48,888 | | | $ | 1,983,615 | |
| 3 | | 45,062 | | | 59,186 | | | 147,214 | | | 242,662 | | | 153,732 | | | 68,012 | | | 23,475 | | | $ | 739,343 | |
| 4 | | — | | | — | | | 260,672 | | | 74,808 | | | 173,081 | | | — | | | 119,377 | | | $ | 627,938 | |
| 5 | | — | | | — | | | — | | | 99,515 | | | 45,855 | | | — | | | — | | | $ | 145,370 | |
| Total | | $ | 669,054 | | | $ | 149,567 | | | $ | 1,372,456 | | | $ | 839,750 | | | $ | 385,545 | | | $ | 133,196 | | | $ | 191,740 | | | $ | 3,741,308 | |
GRANITE POINT MORTGAGE TRUST INC.
Notes to the Condensed Consolidated Financial Statements (unaudited)
Level 3 inputs, which were in part developed based on discussions with various market participants and management’s best estimates as of the valuation date, and required significant judgment. Additionally, during the nine months ended September 30, 2021, the Company placed this loan on nonaccrual status and reversed $0.8 million of interest income. This loan’s maturity date of October 9, 2021 has passed without the loan being paid off. The Company is evaluating a variety of potential options with respect to the resolution of this loan, which, among others, may include a foreclosure, a negotiated deed-in-lieu of foreclosure, a sale of the underlying collateral property or a sale of the loan.
Note 4. Variable Interest Entities and Securitized Debt Obligations
The Company finances pools of its commercial real estate loans through CRE CLOs, which are considered VIEs for financial reporting purposes, and, thus, are reviewed for consolidation under the applicable consolidation guidance. The Company has both the power to direct the activities of the CRE CLOs that most significantly impact the entities’ performance and the obligation to absorb losses or the right to receive benefits of the entities that could be significant; therefore, the Company consolidates the CRE CLOs.
The following table presents a summary of the assets and liabilities of all VIEs consolidated on the Company’s condensed consolidated balance sheets as of SeptemberJune 30, 20212022, and December 31, 2020:2021:
| | (in thousands) | (in thousands) | September 30,
2021 | | December 31,
2020 | (in thousands) | June 30,
2022 | | December 31,
2021 |
| Loans held-for-investment | Loans held-for-investment | $ | 1,802,296 | | | $ | 1,200,479 | | Loans held-for-investment | $ | 1,782,992 | | | $ | 2,257,768 | |
| Allowance for credit losses | Allowance for credit losses | (18,067) | | | (15,914) | | Allowance for credit losses | (9,905) | | | (16,904) | |
| Loans held-for-investment, net | Loans held-for-investment, net | 1,784,229 | | | 1,184,565 | | Loans held-for-investment, net | 1,773,087 | | | 2,240,864 | |
| Cash and cash equivalents | — | | | — | | |
| | Restricted cash | Restricted cash | 20,000 | | | 62,804 | | Restricted cash | 68,404 | | | 10,377 | |
| | Other assets | Other assets | 19,944 | | | 8,563 | | Other assets | 9,572 | | | 14,803 | |
| Total Assets | Total Assets | $ | 1,824,173 | | | $ | 1,255,932 | | Total Assets | $ | 1,851,063 | | | $ | 2,266,044 | |
| Securitized debt obligations | Securitized debt obligations | $ | 1,356,429 | | | $ | 927,128 | | Securitized debt obligations | $ | 1,425,556 | | | $ | 1,677,619 | |
| | Other liabilities | Other liabilities | 1,246 | | | 1,092 | | Other liabilities | 1,398 | | | 1,816 | |
| Total Liabilities | Total Liabilities | $ | 1,357,675 | | | $ | 928,220 | | Total Liabilities | $ | 1,426,954 | | | $ | 1,679,435 | |
GRANITE POINT MORTGAGE TRUST INC.
Notes to the Condensed Consolidated Financial Statements (unaudited)
The securitized debt obligations issued by the CRE CLOs are recorded at outstanding principal, net of any unamortized deferred debt issuance costs, on the Company’s condensed consolidated balance sheets.
On April 22, 2022, the Company redeemed the GPMT 2018-FL1 CRE CLO, which at its redemption had $103.6 million of investment-grade bonds outstanding. The 8 loans or participation interests therein with an aggregate unpaid principal balance of $269.9 million held by the trust were refinanced in part by the expansion of one of the Company’s existing secured financing facilities.
The following table details ourthe Company’s CRE CLO securitized debt obligations:
| | (in thousands) | September 30,
2021 | |
| (dollars in thousands) | | (dollars in thousands) | June 30,
2022 | | December 31,
2021 |
| Securitized Debt Obligations | Securitized Debt Obligations | | Principal Balance | | Carrying Value | | Wtd. Avg. Yield/Cost (1) | Securitized Debt Obligations | Principal Balance | | Carrying Value | | Wtd. Avg. Yield/Cost (1) | | Principal Balance | | Carrying Value | | Wtd. Avg. Yield/Cost (1) |
| GPMT 2021-FL4 CRE CLO | | GPMT 2021-FL4 CRE CLO | | | | | | | | | | | |
Collateral assets (2) | | Collateral assets (2) | $ | 621,440 | | | $ | 613,325 | | | L+3.7% | | $ | 621,409 | | | $ | 613,504 | | | L+3.7% |
| Financing provided | | Financing provided | 502,564 | | | 498,677 | | | L+1.7% | | 502,564 | | | 498,117 | | | L+1.7% |
| GPMT 2021-FL3 CRE CLO | GPMT 2021-FL3 CRE CLO | | | | | | | GPMT 2021-FL3 CRE CLO | |
Collateral assets (2) | | $ | 768,796 | | | $ | 763,848 | | | L+3.8% | |
Collateral assets (3) | | Collateral assets (3) | 763,654 | | | 757,609 | | | L+3.9% | | 768,850 | | | 763,607 | | | L+3.9% |
| Financing provided | Financing provided | | 630,818 | | | 627,580 | | | L+1.7% | Financing provided | 625,772 | | | 625,698 | | | L+1.7% | | 630,818 | | | 629,049 | | | L+1.7% |
| GPMT 2019-FL2 CRE CLO | GPMT 2019-FL2 CRE CLO | | GPMT 2019-FL2 CRE CLO | |
| Collateral assets | Collateral assets | | 734,111 | | | 719,822 | | | L+4.0% | Collateral assets | 472,508 | | | 470,557 | | | L+4.0% | | 617,119 | | | 605,831 | | | L+ 4.1% |
| Financing provided | Financing provided | | 572,001 | | | 570,597 | | | L+1.7% | Financing provided | 301,310 | | | 301,181 | | | L+2.0% | | 446,849 | | | 445,920 | | | L+ 1.8% |
| GPMT 2018-FL1 CRE CLO | GPMT 2018-FL1 CRE CLO | | GPMT 2018-FL1 CRE CLO | |
| Collateral assets | | 324,651 | | | 320,558 | | | L+5.1% | |
Collateral assets (4) | | Collateral assets (4) | — | | | — | | | 270,722 | | | 268,322 | | | L+ 5.0% |
| Financing provided | Financing provided | | 158,253 | | | 158,252 | | | L+2.3% | Financing provided | — | | | — | | | 104,532 | | | 104,532 | | | L+ 2.8% |
| Total | Total | | Total | |
| Collateral assets | Collateral assets | | $ | 1,827,558 | | | $ | 1,804,228 | | | L+4.1% | Collateral assets | $ | 1,857,602 | | | $ | 1,841,491 | | | L+3.9% | | $ | 2,278,100 | | | $ | 2,251,264 | | | L+ 4.0% |
| Financing provided | Financing provided | | $ | 1,361,072 | | | $ | 1,356,429 | | | L+1.8% | Financing provided | $ | 1,429,646 | | | $ | 1,425,556 | | | L+1.7% | | $ | 1,684,763 | | | $ | 1,677,618 | | | L+ 1.8% |
|
____________________
(1)Calculations of all in yield on collateral assets at origination are based on a number of assumptions (some or all of which may not occur) and are expressed as monthly equivalent yields that include net origination fees and exit fees and exclude future fundings and any potential or completed loan amendments or modifications. Calculations of cost of funds is the weighted average coupon of the CRE CLO, exclusive of any CRE CLO issuance costs.
(2)Includes $20$29.6 million of restricted cash as of June 30, 2022. No restricted cash is included as of December 31, 2021. Yield on collateral assets is exclusive of restricted cash.
(3)Includes $38.8 million and $10.4 million of restricted cash as of June 30, 2022, and December 31, 2021, respectively. Yield on collateral assets is exclusive of restricted cash.
(4)During the three months ended June 30, 2022, the Company redeemed the GPMT 2018-FL1 CRE CLO. No restricted cash is included as of December 31, 2021.
Note 5. Secured Financing Agreements
To finance its loans held-for-investment, the Company has entered into a variety of secured financing arrangements with several counterparties, including repurchase facilities, an asset-specific financing facility and a term financing facility. The Company’s repurchase facilities are collateralized by loans held-for-investment and certain cash balances. Although the transactions under repurchase facilities represent committed borrowings until maturity, the respective lender retains the right to mark the underlying collateral to fair value. A reduction in the value of pledged assets due to collateral-specific credit events, or, with respect to a limited number of the Company’s repurchase facilities, capital market events, would require the Company to fund margin calls. The Company does not typically retain similar rights for the Company to make margin calls on its underlying borrowers as a result of a determination by the Company and/or its financing counterparty that there has been a decrease in the market value of the underlying pledged collateral.
The Company’s asset-specific financing facility and term financing facility areis also collateralized by loans held-for-investment. NeitherThe facility containsdoes not contain mark-to-market provisions and both areis generally term-matched to the underlying assets, not to exceed February 9, 2025 in the case of the term financing facility.assets.
GRANITE POINT MORTGAGE TRUST INC.
Notes to the Condensed Consolidated Financial Statements (unaudited)
During the three months ended June 30, 2022, the Company voluntarily repaid the term financing facility in whole without prepayment premium. In connection with this repayment, the Company incurred a charge on early extinguishment of debt of approximately $(1.7) million, or $(0.03) per basic share, related to unamortized transaction costs.
The following tables summarize details of the Company’s borrowings outstanding on its secured financing agreements as of SeptemberJune 30, 20212022, and December 31, 2020:2021:
| | | September 30, 2021 | | June 30, 2022 |
| (in thousands) | Maturity Date (1) | | Amount Outstanding | | Unused Capacity | | Total Capacity | | Carrying Value of Collateral | | Weighted Average Borrowing Rate | |
| (dollars in thousands) | | (dollars in thousands) | Maturity Date (1) | | Amount Outstanding | | Unused Capacity | | Total Capacity | | Carrying Value of Collateral | | Weighted Average Borrowing Rate |
| Repurchase facilities: | Repurchase facilities: | | | | | | | | | | | | Repurchase facilities: | | | | | | | | | | | |
Morgan Stanley Bank (2) | Morgan Stanley Bank (2) | June 28, 2022 | | $ | 277,534 | | | $ | 222,466 | | | $ | 500,000 | | | $ | 436,329 | | | 2.2 | % | Morgan Stanley Bank (2) | June 28, 2023 | | $ | 581,440 | | | $ | 18,560 | | | $ | 600,000 | | | $ | 802,912 | | | 3.8 | % |
Goldman Sachs Bank USA (3) | Goldman Sachs Bank USA (3) | July 13, 2023 | | — | | | 250,000 | | | 250,000 | | | 10,352 | | | — | % | Goldman Sachs Bank USA (3) | July 13, 2023 | | 127,725 | | | 122,275 | | | 250,000 | | | 204,600 | | | 4.0 | % |
JPMorgan Chase Bank | JPMorgan Chase Bank | June 28, 2022 | | 155,214 | | | 294,786 | | | 450,000 | | | 244,233 | | | 2.2 | % | JPMorgan Chase Bank | June 28, 2024 | | 177,228 | | | 172,772 | | | 350,000 | | | 276,366 | | | 3.7 | % |
Citibank | Citibank | January 9, 2023 | | 412,274 | | | 87,726 | | | 500,000 | | | 535,684 | | | 1.7 | % | Citibank | May 25, 2025 | | 285,266 | | | 214,734 | | | 500,000 | | | 378,217 | | | 3.2 | % |
Wells Fargo Bank (4)(6) | Wells Fargo Bank (4)(6) | June 28, 2022 | | 71,736 | | | 28,264 | | | 100,000 | | | 109,865 | | | 2.1 | % | Wells Fargo Bank (4)(6) | June 28, 2023 | | 100,000 | | | — | | | 100,000 | | | 151,265 | | | 3.4 | % |
| | Total/Weighted Average | Total/Weighted Average | | $ | 916,758 | | | $ | 883,242 | | | $ | 1,800,000 | | | $ | 1,336,463 | | | Total/Weighted Average | | $ | 1,271,659 | | | $ | 528,341 | | | $ | 1,800,000 | | | $ | 1,813,360 | | |
| Asset-specific financings: | Asset-specific financings: | | | | | | | | | | Asset-specific financings: | | | | | | | | | |
| CIBC Bank USA | CIBC Bank USA | Term Matched | | $ | 44,752 | | | $ | 105,248 | | | $ | 150,000 | | | $ | 55,829 | | | 1.8 | % | CIBC Bank USA | Term Matched | | $ | 43,622 | | | $ | 106,378 | | | $ | 150,000 | | | $ | 57,794 | | | 3.0 | % |
| Term financing facility: | | |
Goldman Sachs Bank USA (5) | February 14, 2025 | | $ | 127,867 | | | $ | — | | | $ | 127,867 | | | $ | 324,991 | | | 3.7 | % | |
|
| | | December 31, 2020 | | December 31, 2021 |
| (in thousands) | Maturity Date (1) | | Amount Outstanding | | Unused Capacity | | Total Capacity | | Carrying Value of Collateral | | Weighted Average Borrowing Rate | |
| (dollars in thousands) | | (dollars in thousands) | Maturity Date (1) | | Amount Outstanding | | Unused Capacity | | Total Capacity | | Carrying Value of Collateral | | Weighted Average Borrowing Rate |
| Repurchase facilities: | Repurchase facilities: | | | | | | | | | | Repurchase facilities: | | | | | | | | | |
| Morgan Stanley Bank | Morgan Stanley Bank | June 28, 2021 | | $ | 435,719 | | | $ | 164,281 | | | $ | 600,000 | | | $ | 657,066 | | | 2.3 | % | Morgan Stanley Bank | June 28, 2022 | | $ | 230,982 | | | $ | 269,018 | | | $ | 500,000 | | | $ | 382,017 | | | 2.2 | % |
| Goldman Sachs Bank USA | Goldman Sachs Bank USA | May 2, 2021 | | 395,990 | | | 104,010 | | | 500,000 | | | 593,625 | | | 2.5 | % | Goldman Sachs Bank USA | July 13, 2023 | | 81,227 | | | 168,773 | | | 250,000 | | | 111,811 | | | 2.6 | % |
| JPMorgan Chase Bank | JPMorgan Chase Bank | June 28, 2022 | | 361,797 | | | 88,203 | | | 450,000 | | | 536,758 | | | 2.5 | % | JPMorgan Chase Bank | June 28, 2022 | | 104,215 | | | 345,785 | | | 450,000 | | | 188,838 | | | 2.3 | % |
| Citibank | Citibank | January 9, 2023 | | 386,049 | | | 113,951 | | | 500,000 | | | 504,236 | | | 1.8 | % | Citibank | January 9, 2023 | | 202,944 | | | 297,056 | | | 500,000 | | | 285,767 | | | 1.8 | % |
| Wells Fargo Bank | Wells Fargo Bank | June 28, 2021 | | 129,320 | | | 145,680 | | | 275,000 | | | 185,282 | | | 2.1 | % | Wells Fargo Bank | June 28, 2022 | | 57,917 | | | 42,083 | | | 100,000 | | | 86,409 | | | 2.3 | % |
| | Total/Weighted Average | Total/Weighted Average | | $ | 1,708,875 | | | $ | 616,125 | | | $ | 2,325,000 | | | $ | 2,476,967 | | | Total/Weighted Average | | $ | 677,285 | | | $ | 1,122,715 | | | $ | 1,800,000 | | | $ | 1,054,842 | | |
| Asset-specific financings: | Asset-specific financings: | | | | | | | | | | Asset-specific financings: | | | | | | | | | |
| CIBC Bank USA | CIBC Bank USA | Term Matched | | $ | 123,091 | | | $ | 26,909 | | | $ | 150,000 | | | $ | 152,929 | | | 2.5 | % | CIBC Bank USA | Term Matched | | $ | 43,622 | | | $ | 106,378 | | | $ | 150,000 | | | $ | 56,129 | | | 1.8 | % |
| | Term financing facility: | | Term financing facility: | |
| Goldman Sachs Bank USA | | Goldman Sachs Bank USA | February 14, 2025 | | $ | 127,145 | | | $ | — | | | $ | 127,145 | | | $ | 329,256 | | | 3.7 | % |
____________________
(1)The facilities are set to mature on the stated maturity date, unless extended pursuant to their terms.
(2)As of SeptemberDuring the three months ended June 30, 2021,2022, the Company retained an optionextended the maturity date to increaseJune 28, 2023, and increased the maximum facilitytotal capacity amount up to $600 million, subject to customary terms and conditions.million.
(3)As of SeptemberJune 30, 2021,2022, the Company retained options to increase the maximum facility capacity amount up to $350 million, subject to customary terms and conditions.
(4)As of SeptemberDuring the three months ended June 30, 2021,2022, the Company retained optionsextended the maturity date to increaseJune 28, 2024, and decreased the maximum facilitytotal capacity amount up to $200 million, subject to customary terms and conditions.$350 million.
(5)Amount outstanding includes unamortized debt issuance costs.During the three months ended June 30, 2022, the Company extended the maturity date to May 25, 2025.
(6)During the three months ended June 30, 2022, the Company extended the maturity date to June 28, 2023.
GRANITE POINT MORTGAGE TRUST INC.
Notes to the Condensed Consolidated Financial Statements (unaudited)
At SeptemberJune 30, 2022, and December 31, 2021, the Company’s borrowings outstanding on its secured financing facilities had contractual maturities as follows:
| | | September 30, 2021 | | June 30, 2022 |
| (dollars in thousands) | Repurchase Facilities | | Asset-Specific Financings | | Term Financing Facility (1) | | | Total Amount Outstanding | |
| 2021 | $ | — | | | 44,752 | | | $ | — | | | | $ | 44,752 | | |
| (in thousands) | | (in thousands) | Repurchase Facilities | | Asset-Specific Financings (1) | | Term Financing Facility | | | Total Amount Outstanding |
| 2022 | 2022 | 504,484 | | | — | | | — | | | | 504,484 | | 2022 | $ | — | | | $ | 43,622 | | | $ | — | | | | $ | 43,622 | |
| 2023 | 2023 | 412,274 | | | — | | | — | | | | 412,274 | | 2023 | 809,165 | | | — | | | — | | | | 809,165 | |
| 2024 | 2024 | — | | | — | | | — | | | | — | | 2024 | 177,228 | | | — | | | — | | | | 177,228 | |
| 2025 | 2025 | — | | | — | | | 127,867 | | | | 127,867 | | 2025 | 285,266 | | | — | | | — | | | | 285,266 | |
| 2026 | | 2026 | — | | | — | | | — | | | | — | |
| Thereafter | Thereafter | — | | | — | | | — | | | | — | | Thereafter | — | | | — | | | — | | | | — | |
| Total | Total | $ | 916,758 | | | $ | 44,752 | | | $ | 127,867 | | | | $ | 1,089,377 | | Total | $ | 1,271,659 | | | $ | 43,622 | | | $ | — | | | | $ | 1,315,281 | |
____________________
| | | | | | | | | | | | | | | | | | | | | | | | | |
| December 31, 2021 |
| (in thousands) | Repurchase Facilities | | Asset-Specific Financings (1) | | Term Financing Facility (2) | | | | Total Amount Outstanding |
| 2022 | $ | 393,114 | | | 43,622 | | | $ | — | | | | | $ | 436,736 | |
| 2023 | 284,171 | | | — | | | — | | | | | 284,171 | |
| 2024 | — | | | — | | | — | | | | | — | |
| 2025 | — | | | — | | | 127,145 | | | | | 127,145 | |
| 2026 | — | | | — | | | — | | | | | — | |
| Thereafter | — | | | — | | | — | | | | | — | |
| Total | $ | 677,285 | | | $ | 43,622 | | | $ | 127,145 | | | | | $ | 848,052 | |
__________________(1)Maturity date is term matched to the corresponding loans.
(2)Amount outstanding includes unamortized debt issuance costs.
The following table summarizes certain characteristics of the Company’s repurchase facilities and counterparty concentration at SeptemberJune 30, 20212022, and December 31, 2020:2021:
| | | September 30, 2021 | | December 31, 2020 | | June 30, 2022 | | December 31, 2021 |
| (dollars in thousands) | (dollars in thousands) | Amount Outstanding | | Net Counterparty Exposure (1) | | Percent of Equity | | Weighted Average Years to Maturity | | Amount Outstanding | | Net Counterparty Exposure (1) | | Percent of Equity | | Weighted Average Years to Maturity | (dollars in thousands) | Amount Outstanding | | Net Counterparty Exposure (1) | | Percent of Equity | | Weighted Average Years to Maturity | | Amount Outstanding | | Net Counterparty Exposure (1) | | Percent of Equity | | Weighted Average Years to Maturity |
| Morgan Stanley Bank | Morgan Stanley Bank | $ | 277,534 | | | $ | 163,245 | | | 18 | % | | 0.74 | | $ | 435,719 | | | $ | 230,815 | | | 25 | % | | 0.49 | Morgan Stanley Bank | $ | 581,440 | | | $ | 226,689 | | | 22 | % | | 0.99 | | $ | 230,982 | | | $ | 155,446 | | | 15 | % | | 0.49 |
| JPMorgan Chase Bank | JPMorgan Chase Bank | 155,214 | | | 94,929 | | | 10 | % | | 0.74 | | 361,797 | | | 187,282 | | | 20 | % | | 1.50 | JPMorgan Chase Bank | 177,228 | | | 101,319 | | | 10 | % | | 2.00 | | 104,215 | | | 87,103 | | | 9 | % | | 0.49 |
| Goldman Sachs Bank USA | Goldman Sachs Bank USA | — | | | 6,103 | | | 1 | % | | 1.78 | | 395,990 | | | 203,297 | | | 22 | % | | 0.33 | Goldman Sachs Bank USA | 127,725 | | | 77,215 | | | 7 | % | | 1.04 | | 81,227 | | | 31,852 | | | 3 | % | | 1.53 |
| Citibank | Citibank | 412,274 | | | 131,034 | | | 14 | % | | 1.28 | | 386,049 | | | 124,913 | | | 13 | % | | 2.02 | Citibank | 285,266 | | | 95,105 | | | 9 | % | | 2.90 | | 202,944 | | | 85,631 | | | 8 | % | | 1.02 |
| Wells Fargo Bank | Wells Fargo Bank | 71,736 | | | 39,112 | | | 4 | % | | 0.74 | | 129,320 | | | 57,483 | | | 6 | % | | 0.49 | Wells Fargo Bank | 100,000 | | | 52,841 | | | 5 | % | | 0.99 | | 57,917 | | | 29,320 | | | 3 | % | | 0.49 |
| Total | Total | $ | 916,758 | | | $ | 434,423 | | | $ | 1,708,875 | | | $ | 803,790 | | | Total | $ | 1,271,659 | | | $ | 553,169 | | | $ | 677,285 | | | $ | 389,352 | | |
____________________
(1)Represents the excess of the carrying amount or market value of the loans held-for-investment pledged as collateral for repurchase facilities, including accrued interest plus any cash on deposit to secure the repurchase obligation, less the amount of the repurchase liability, including accrued interest.
The Company does not anticipate any defaults by its financing counterparties, although there can be no assurance that one or more defaults will not occur.
GRANITE POINT MORTGAGE TRUST INC.
Notes to the Condensed Consolidated Financial Statements
Financial Covenants
The Company is subject to a variety of financial covenants under its secured financing agreements. The following represent the most restrictive financial covenants across the agreements as of SeptemberJune 30, 2021:2022:
•Unrestricted cash cannot be less than the greater of $30.0 million and 5.0% of recourse indebtedness. As of SeptemberJune 30, 2021,2022, the Company’s unrestricted cash was $154.9$150.2 million, while 5.0% of the Company’s recourse indebtedness was $39.3$32.2 million.
•Tangible net worth must be greater than the sum of (i) 75.0% of the Company’s tangible net worth as of June 28, 2017, and (ii) 75.0% of net cash proceeds of the Company’s equity issuances after June 28, 2017, which calculates to $782.3$931.7 million. As of SeptemberJune 30, 2021,2022, the Company’s tangible net worth was $979.6 million.$1.1 billion
•Target asset leverage ratio cannot exceed 77.5% and total leverage ratio cannot exceed 80.0%. As of SeptemberJune 30, 2021,2022, the Company’s target asset leverage ratio was 66.3%68.9% and the Company’s total leverage ratio was 75.2%73.6%.
•Minimum interest coverage must be greater than 1.5:1.0. As of SeptemberJune 30, 2021,2022, the Company’s minimum interest coverage was 1.8:1.0.
GRANITE POINT MORTGAGE TRUST INC.
Notes to the Condensed Consolidated Financial Statements (unaudited)
The Company may also be subject to additional financial covenants in connection with various other agreements it enters into in the normal course of ourits business. The Company was in compliance with all of its financial covenants as of June 30, 2022, and December 31, 2021, and intends to continue to operate in a manner which complies with all of its financial covenants.
Note 6. Convertible Senior Notes
In December 2017, the Company closed a private placement of $125.0 million aggregate principal amount of convertible senior notes due 2022. In January 2018, an additional $18.8 million in notes were issued by the Company in connection with the exercise of the initial purchaser’s option. The net proceeds from the offering were approximately $139.5 million after deducting underwriting discounts and expenses. The notes are unsecured, pay interest semiannually at a rate of 5.625% per annum and are convertible at the option of the holder into shares of the Company’s common stock. The notes will mature in December 2022, unless earlier converted or repurchased in accordance with their terms. The Company does not have the right to redeem the notes prior to maturity, but may be required to repurchase the notes from holders under certain circumstances. As of SeptemberJune 30, 2021,2022, the notes had a conversion rate of 51.9943 shares of common stock per $1,000 principal amount of the notes.
In October 2018, the Company closed an underwritten public offering of $131.6 million aggregate principal amount of convertible senior notes due 2023. The net proceeds from the offering were approximately $127.7 million after deducting underwriting discounts and expenses. The notes are unsecured, pay interest semiannually at a rate of 6.375% per annum and are convertible at the option of the holder into shares of the Company’s common stock. The notes will mature in October 2023, unless earlier converted or repurchased in accordance with their terms. The Company does not have the right to redeem the notes prior to maturity, but may be required to repurchase the notes from holders under certain circumstances. As of SeptemberJune 30, 2021,2022, the notes had a conversion rate of 50.0894 shares of common stock per $1,000 principal amount of the notes.
The consolidated amount outstanding due on convertible senior notes as of SeptemberJune 30, 20212022, and December 31, 20202021, was $272.5$273.8 million and $271.3$272.9 million, respectively, net of deferred issuance costs.
The following table details the interest expense related to the Convertible Senior Notes:
| | | | | | | | | | | | | | | | | | | | | | | | | |
| Three Months Ended September 30, | | Nine Months Ended September 30, |
| (in thousands) | 2021 | | | | 2020 | | 2021 | | 2020 |
| Cash coupon | $ | 4,119 | | | | | $ | 4,119 | | | $ | 12,357 | | | $ | 12,357 | |
| Amortization of issuance costs | 437 | | | | | 410 | | | 1,261 | | | 1,213 | |
| Total interest expense | $ | 4,556 | | | | | $ | 4,529 | | | $ | 13,618 | | | $ | 13,570 | |
The following table details the carrying value of the Convertible Senior Notes: | | | | | | | | | | | | | | | | | | | | | | | | | |
| Three Months Ended June 30, | | Six Months Ended June 30, |
| (in thousands) | 2022 | | | | 2021 | | 2022 | | 2021 |
| Cash coupon | $ | 4,119 | | | | | $ | 4,119 | | | $ | 8,238 | | | $ | 8,238 | |
| Amortization of issuance costs | 453 | | | | | 425 | | | 880 | | | 824 | |
| Total interest expense | $ | 4,572 | | | | | $ | 4,544 | | | $ | 9,118 | | | $ | 9,062 | |
December 2022 Convertible Senior Notes
| | | | | | | | | | | | | | | | | |
| September 30, | | December 31, |
| (in thousands) | 2021 | | | | 2020 | | | | |
| Principal outstanding | $ | 143,750 | | | | | $ | 143,750 | | | | | |
| Less: Unamortized issuance costs | (1,106) | | | | | (1,774) | | | | | |
| Net carrying value | $ | 142,644 | | | | | $ | 141,976 | | | | | |
October 2023 Convertible Senior Notes
| | | | | | | | | | | | | | | | | |
| September 30, | | December 31, |
| (in thousands) | 2021 | | | | 2020 | | | | |
| Principal outstanding | $ | 131,600 | | | | | $ | 131,600 | | | | | |
| Less: Unamortized issuance costs | (1,732) | | | | | (2,326) | | | | | |
| Net carrying value | $ | 129,868 | | | | | $ | 129,274 | | | | | |
GRANITE POINT MORTGAGE TRUST INC.
Notes to the Condensed Consolidated Financial Statements (unaudited)
The following table details the carrying value of the Convertible Senior Notes:
December 2022 Convertible Senior Notes
| | | | | | | | | | | | | | | | | |
| (in thousands) | June 30,
2022 | | | | December 31,
2021 | | | | |
| Principal outstanding | $ | 143,750 | | | | | $ | 143,750 | | | | | |
| Less: Unamortized issuance costs | (413) | | | | | (875) | | | | | |
| Net carrying value | $ | 143,337 | | | | | $ | 142,875 | | | | | |
October 2023 Convertible Senior Notes
| | | | | | | | | | | | | | | | | |
| (in thousands) | June 30,
2022 | | | | December 31,
2021 | | | | |
| Principal outstanding | $ | 131,600 | | | | | $ | 131,600 | | | | | |
| Less: Unamortized issuance costs | (1,115) | | | | | (1,533) | | | | | |
| Net carrying value | $ | 130,485 | | | | | $ | 130,067 | | | | | |
Note 7. Senior Secured Term Loan Facilities and Warrants to Purchase Shares of Common Stock
Senior Secured Term Loan Facilities
On September 25, 2020, the Company, as a guarantor, and certain subsidiaries of the Company,its subsidiaries, as borrowers, entered into a five-year senior secured term loan credit agreement with certain investment vehicles managed by Pacific Investment Management Company LLC, or PIMCO, providing for up to $300.0 million of new senior secured term loan facilities and warrants to purchase, in the aggregate, up to 6,065,820 shares of the Company’s common stock, $0.01 par value per share. The senior secured term loan credit agreement is guaranteed by the Company and certain of its subsidiaries and secured by certain of their unencumbered assets and pledges of certain equity interests held by the Company and its subsidiaries. The loans outstanding under the senior secured term loan facilities are non-amortizing and may be voluntarily repaid, in whole or in part, at any time subject to certain prepayment premiums if they are repaid prior to September 25, 2023.
facilities. On September 28, 2020, the Company borrowed $225.0 million under the initial senior secured term loan facilities.facility. The Company chose not to borrow the remaining $75.0 million of commitments under the facilities, which were available to the Company on a delayed draw basis until September 25, 2021. The net proceeds from the senior secured term loan facilities were approximately $210.2had a maturity date of September 25, 2025.
On December 9, 2021, the Company prepaid $75.0 million after deducting discounts and expenses, which were capitalized as debt issuance costs. Interest on the outstanding loansof borrowings under the senior secured term loan facilities, is payable quarterlyresulting in arrears and accrues at the ratea total payment of (i) 8.00% per annum for any period for which accrued interest is paid in cash or (ii) 9.00% per annum for any period for which the borrowers elect to pay up to 50%approximately $79.9 million, inclusive of accrued interest in kind by adding such interest to the principal amount, prepayment penalty and accrued interest. As a result of this repayment, the Company realized a charge on early extinguishment of debt of approximately $(8.9) million, or $(0.17) per share, comprised of the loans.Theprepayment penalty and a pro-rata charge-off of unamortized discount including transaction costs.
On February 16, 2022, the Company prepaid an additional $50.0 million of borrowings under the senior secured term loan facilities, will matureresulting in a total payment of approximately $53.0 million, inclusive of the principal amount, prepayment penalty and accrued interest. As a result of this repayment, the Company realized a charge on early extinguishment of debt of approximately $(5.8) million, or $(0.11) per basic share, comprised of the prepayment penalty and a pro-rata charge-off of unamortized discount including transaction costs.
During the three months ended June 30, 2022, the Company fully prepaid the remaining $100.0 million of borrowings under the senior secured term loan facilities, resulting in a total payment of approximately $105.7 million, inclusive of the principal amount, prepayment penalty and accrued interest. As a result of this repayment, the Company realized a charge on early extinguishment of debt of approximately $(11.3) million, or $(0.21) per basic share, comprised of the prepayment penalty and a charge-off of unamortized discount including transaction costs.
Warrants to Purchase Shares of Common Stock
In connection with the senior secured term loan facilities, on September 25, 2025.2020, the Company issued warrants to purchase up to 6.066 million shares of the Company’s common stock, $0.01 par value per share, to certain investment vehicles managed by PIMCO.
On September 25, 2021, the warrantholders forfeited unvested warrants exercisable for 1,516,455 shares of common stock because the Company chose not to borrow the $75.0 million of delayed draw commitments available under the senior secured term loan facilities.
On September 30, 2021, the Company settled part of the outstanding warrants to purchase approximately 1.06 million shares of common stock at an exercise price of $6.47 per share of common stock for a net cash amount of approximately $7.5 million. Subsequent to quarter end, onOn October 4, 2021, the Company settled the remaining warrants to purchase approximately 3.49 million shares of common stock at an exercise price of $6.47 per share of common stock for a net cash amount of approximately $24.7 million. The Company currently has no warrants outstanding.
The Company retained third party valuation experts to assist with estimating the fair value of the warrants on the issuance date. Based on the warrants’ fair value relative
GRANITE POINT MORTGAGE TRUST INC.
Notes to the fair value of the senior secured term loan facilities, approximately $4.5 million of the $225.0 million of gross proceeds was allocated to the warrants, creating a corresponding senior secured term loan facilities discount in the same amount. The Company elected the accreted redemption value method whereby this discount will be accreted over five years using the effective interest method, resulting in an increase in the carrying value of the senior secured term loan facilities.Condensed Consolidated Financial Statements
The table below summarizes the net carrying amount of the senior secured term loan facilities:
| | | | | | | | | | | | | | | | | |
| September 30, | | December 31, |
| (in thousands) | 2021 | | | | 2020 | | | | |
| Principal outstanding | $ | 225,000 | | | | | $ | 225,000 | | | | | |
| Less: Unamortized debt discount and issuance costs | (16,215) | | | | | (18,552) | | | | | |
| Net carrying value | $ | 208,785 | | | | | $ | 206,448 | | | | | |
The senior secured term loan credit agreement contains various affirmative and negative covenants, which are applicable to the Company, the borrowers and their respective subsidiaries, including limitations (subject to exceptions) on their ability to: (i) incur indebtedness; (ii) incur liens on their assets; (iii) consummate certain fundamental changes; (iv) dispose of all or any part of their assets; (v) pay dividends or other distributions with respect to their equity interests; (vi) make investments; (vii) enter into transactions with their affiliates; (viii) modify the terms of the Company’s existing convertible notes, any refinancings thereof or any subordinated or junior lien indebtedness, or prepay any such indebtedness; and (ix) enter into certain burdensome agreements.
The senior secured term loan credit agreement also contains financial covenants that are substantially similar to the financial covenants under the Company’s repurchase facilities, asset-specific financing facility and term financing facility. If the Company fails to meet or satisfy any of the covenants in accordance with the senior secured term loan credit agreement and is unable to obtain a waiver or other suitable relief from the lenders, the Company would be in default and the Company’s lenders could elect to declare outstanding amounts due and payable. The Company was in compliance with all of its financial covenants as of September 30, 2021.
| | | | | | | | | | | | | | | | | |
| (in thousands) | June 30,
2022 | | | | December 31,
2021 | | | | |
| Principal outstanding | $ | — | | | | | $ | 150,000 | | | | | |
| Less: Unamortized debt discount and issuance costs | — | | | | | (10,120) | | | | | |
| Net carrying value | $ | — | | | | | $ | 139,880 | | | | | |
GRANITE POINT MORTGAGE TRUST INC.
Notes to the Condensed Consolidated Financial Statements (unaudited)
Note 8. Cash, Cash Equivalents and Restricted Cash
Cash and cash equivalents include cash held in bank accounts and cash held in money market funds on an overnight basis.
The Company is required to maintain certain cash balances in restricted accounts as collateral for the Company’s repurchase facilities and with counterparties to support investment activities. As of SeptemberJune 30, 2021,2022, the Company held $0.6$1.1 million in restricted cash in connection with its non-CRE CLO financing activities, compared to $5.0$2.0 million as of December 31, 2020.2021. In addition, as of SeptemberJune 30, 2021,2022, the Company held $20.0$68.4 million in restricted cash representing proceeds from principal paydowns of loans held in the CRE CLOs, compared to $62.8$10.4 million as of December 31, 2020.2021.
The following table provides a reconciliation of cash, cash equivalents and restricted cash reported on the Company’s condensed consolidated balance sheets as of SeptemberJune 30, 20212022, and December 31, 20202021, that sum to the total of the same such amounts shown in the condensed consolidated statements of cash flows:
| | (in thousands) | (in thousands) | September 30,
2021 | | December 31,
2020 | (in thousands) | June 30,
2022 | | December 31,
2021 |
| Cash and cash equivalents | Cash and cash equivalents | $ | 154,916 | | | $ | 261,419 | | Cash and cash equivalents | $ | 150,192 | | | $ | 191,931 | |
| Restricted cash | Restricted cash | 20,602 | | | 67,774 | | Restricted cash | 69,492 | | | 12,362 | |
| Total cash, cash equivalents and restricted cash | Total cash, cash equivalents and restricted cash | $ | 175,518 | | | $ | 329,193 | | Total cash, cash equivalents and restricted cash | $ | 219,684 | | | $ | 204,293 | |
Note 9. Fair Value
Fair Value Measurements
ASC 820, Fair Value Measurements, or ASC 820, defines fair value as the price that would be received to sell an asset or paid to transfer a liability in an orderly transaction between market participants at the measurement date. ASC 820 clarifies that fair value should be based on the assumptions market participants would use when pricing an asset or liability and establishes a fair value hierarchy that prioritizes the information used to develop those assumptions. The fair value hierarchy gives the highest priority to quoted prices available in active markets (i.e., market-based or observable inputs) and the lowest priority to data lacking transparency (i.e., unobservable inputs) resulting in the use of management assumptions. Additionally, ASC 820 requires an entity to consider all aspects of nonperformance risk, including the entity’s own credit standing, when measuring fair value of a liability.
ASC 820 establishes a three-level hierarchy to be used when measuring and disclosing fair value. An instrument’s categorization within the fair value hierarchy is based on the lowest level of significant input to its valuation. Following is a description of the three levels:
Level 1Inputs are quoted prices in active markets for identical assets or liabilities as of the measurement date under current market conditions. Additionally, the entity must have the ability to access the active market and the quoted prices cannot be adjusted by the entity.
Level 2Inputs include quoted prices in active markets for similar assets or liabilities; quoted prices in inactive markets for identical or similar assets or liabilities; or inputs that are observable or can be corroborated by observable market data by correlation or other means for substantially the full-term of the assets or liabilities.
Level 3Unobservable inputs are supported by little or no market activity. The unobservable inputs represent the assumptions that market participants would use to price the assets and liabilities, including risk. Generally, Level 3 assets and liabilities are valued using pricing models, discounted cash flow methodologies or similar techniques that require significant judgment or estimation.
GRANITE POINT MORTGAGE TRUST INC.
Notes to the Condensed Consolidated Financial Statements (unaudited)
Following are descriptions of the valuation methodologies used to measure material assets and liabilities at fair value and details of the valuation models, key inputs to those models and significant assumptions utilized.
GRANITE POINT MORTGAGE TRUST INC.
Notes to the Condensed Consolidated Financial Statements
Recurring Fair Value
As of SeptemberJune 30, 20212022, and December 31, 2020,2021, the Company held no assets or liabilities measured at fair value on a recurring basis.
Nonrecurring Fair Value
The Company may be required to measure certain assets or liabilities at fair value from time to time. These periodic fair value measures typically result from the application ofestablishing allowances for collateral-dependent assets under GAAP. These items would constitute nonrecurring fair value measures under ASC 820. For collateral-dependent loans that are identified as impaired, the Company measures allowance for credit losses by comparing its estimation of the fair value of the underlying collateral, less costs to sell, to the carrying value of the respective loan. To estimate the fair value of the underlying collateral the Company may (i) use certain valuation techniques which, among others, may include a discounted cash flow method of valuation, or (ii) by obtaining a third-party independent assessment of value such as an appraisal or other opinion of value. These valuations require significant judgments, which include assumptions regarding capitalization rates, discount rates, leasing, creditworthiness of major tenants, occupancy rates, availability and cost of financing, exit plan, loan sponsorship, actions of other lenders, and other factors deemed relevant.
During the three months ended SeptemberJune 30, 2021,2022, the Company maintained its risk rating of “5” on one, and assigned a risk rating of “5” to twoanother, of its loans held-for-investment during the quarterly risk rating process. As of SeptemberJune 30, 2021, these two loans have2022, the first loan had an aggregate outstanding principal balance of $168.1$114.1 million and an aggregate carrying value of $145.3$99.5 million, and the second loan had an aggregate outstanding principal balance of $93.8 million and an aggregate carrying value of $89.3 million. The Company recorded a CECL reserve on these two assetsthe second loan based on its estimation of the fair value of eachthe loan’s underlying property collateral, less costs to sell, as of SeptemberJune 30, 2021.2022. These loans held-for-investment are therefore measured at fair value on a nonrecurring basis using significant unobservable inputs and are classified as Level 3 assets in the fair value hierarchy. The significant unobservable inputs used to estimate the fair value on the loan with an aggregate outstanding principal balance of these loans held-for-investment$114.1 million and an aggregate carrying value of $99.5 million include the exit capitalization rate and discount rate assumptions used to forecast the future sale price of the underlying real estate collateral, which ranged from 5.50%6.50% to 7.00%, and from 7.00%9.00% to 9.50%, respectively. Refer to Note 3 - Loans Held-for-Investment, Net of Allowance for Credit Losses for further detail.
Fair Value of Financial Instruments
In accordance with ASC 820, the Company is required to disclose the fair value of financial instruments, both assets and liabilities recognized and not recognized in the condensed consolidated balance sheets, for which fair value can be estimated.
The following describes the Company’s methods for estimating the fair value for financial instruments:
•Loans held-for-investment are carried at cost, net of any unamortized acquisition premiums or discounts, loan fees, origination costs and allowance for credit losses, as applicable. The Company estimates the fair value of its loans held-for-investment by assessing any changes in market interest rates, credit spreads for loans of comparable risk as corroborated by inquiry of other market participants, shifts in credit profiles and actual operating results, for mezzanine loans and senior loans, taking into consideration such factors as underlying property type, property competitive position within its market, market and submarket fundamentals, tenant mix, nature of business plan, sponsorship, extent of leverage and other loan terms. The Company categorizes the fair value measurement of these assets as Level 3.
•Cash and cash equivalents and restricted cash have a carrying value which approximates fair value because of the short maturities of these instruments. The Company categorizes the fair value measurement of these assets as Level 1.
•The carrying value of the underlying loans in the repurchase facilities, the asset-specific financing facility and the term financing facility that mature in less than one year generally approximates fair value due to the short maturities. The Company’s long-term repurchase facilities, asset-specific financing facility and term financing facility have floating rates based on an index plus a credit spread and the credit spread is typically consistent with those demanded in the market. Accordingly, the interest rates on these borrowings are at market and, thus, carrying value approximates fair value. The Company categorizes the fair value measurement of these liabilities as Level 2.
GRANITE POINT MORTGAGE TRUST INC.
Notes to the Condensed Consolidated Financial Statements (unaudited)
•Securitized debt obligations are recorded at outstanding principal, net of any unamortized deferred debt issuance costs. In determining the fair value of its securitized debt obligations, management’s judgment may be used to arrive at fair value that considers prices obtained from third-party pricing providers, broker quotes received and other applicable market data. If observable market prices are not available or insufficient to determine fair value due principally to illiquidity in the marketplace, then fair value is based upon internally developed models that are primarily based on observable market-based inputs but also include unobservable market data inputs (including prepayment speeds, delinquency levels and credit losses). The Company categorizes the fair value measurement of these liabilities as Level 2.
GRANITE POINT MORTGAGE TRUST INC.
Notes to the Condensed Consolidated Financial Statements
•Convertible senior notes are carried at their unpaid principal balance, net of any unamortized deferred issuance costs. The Company estimates the fair value of its convertible senior notes using the market transaction price nearest to SeptemberJune 30, 2021.2022. The Company categorizes the fair value measurement of these assets as Level 2.
•Senior secured term loan facilities are carried at their unpaid principal balance, net of any unamortized deferred issuance costs. The Company estimates the fair value of its senior secured term loan facilities at the carrying value thereof as of September 30,December 31, 2021. The Company categorizes the fair value measurement of these assets as Level 2. The senior secured term loan facilities were paid off in full as of June 30, 2022.
The following table presents the carrying values and estimated fair values of assets and liabilities that are required to be recorded or disclosed at fair value at SeptemberJune 30, 20212022, and December 31, 2020:2021:
| | | September 30, 2021 | | December 31, 2020 | | June 30, 2022 | | December 31, 2021 |
| (in thousands) | (in thousands) | Carrying Value | | Fair Value | | Carrying Value | | Fair Value | (in thousands) | Carrying Value | | Fair Value | | Carrying Value | | Fair Value |
| Assets | Assets | | | | | | | | Assets | | | | | | | |
| Loans held-for-investment, net of allowance for credit losses | Loans held-for-investment, net of allowance for credit losses | $ | 3,614,211 | | | $ | 3,648,115 | | | $ | 3,847,803 | | | $ | 3,867,286 | | Loans held-for-investment, net of allowance for credit losses | $ | 3,830,014 | | | $ | 3,818,893 | | | $ | 3,741,308 | | | $ | 3,771,216 | |
| | Cash and cash equivalents | Cash and cash equivalents | $ | 154,916 | | | $ | 154,916 | | | $ | 261,419 | | | $ | 261,419 | | Cash and cash equivalents | $ | 150,192 | | | $ | 150,192 | | | $ | 191,931 | | | $ | 191,931 | |
| Restricted cash | Restricted cash | $ | 20,602 | | | $ | 20,602 | | | $ | 67,774 | | | $ | 67,774 | | Restricted cash | $ | 69,492 | | | $ | 69,492 | | | $ | 12,362 | | | $ | 12,362 | |
| Liabilities | Liabilities | | Liabilities | |
| Repurchase facilities | Repurchase facilities | $ | 916,758 | | | $ | 916,758 | | | $ | 1,708,875 | | | $ | 1,708,875 | | Repurchase facilities | $ | 1,271,659 | | | $ | 1,271,659 | | | $ | 677,285 | | | $ | 677,285 | |
| Securitized debt obligations | Securitized debt obligations | $ | 1,356,429 | | | $ | 1,360,354 | | | $ | 927,128 | | | $ | 916,701 | | Securitized debt obligations | $ | 1,425,556 | | | $ | 1,412,095 | | | $ | 1,677,619 | | | $ | 1,681,514 | |
| Asset-specific financings | Asset-specific financings | $ | 44,752 | | | $ | 44,752 | | | $ | 123,091 | | | $ | 123,091 | | Asset-specific financings | $ | 43,622 | | | $ | 43,622 | | | $ | 43,622 | | | $ | 43,622 | |
| Term financing facility | Term financing facility | $ | 127,867 | | | $ | 127,867 | | | $ | — | | | $ | — | | Term financing facility | $ | — | | | $ | — | | | $ | 127,145 | | | $ | 127,145 | |
| Convertible senior notes | Convertible senior notes | $ | 272,512 | | | $ | 275,141 | | | $ | 271,250 | | | $ | 257,411 | | Convertible senior notes | $ | 273,822 | | | $ | 270,374 | | | $ | 272,942 | | | $ | 278,554 | |
| Senior secured term loan facilities | Senior secured term loan facilities | $ | 208,785 | | | $ | 208,785 | | | $ | 206,448 | | | $ | 206,448 | | Senior secured term loan facilities | $ | — | | | $ | — | | | $ | 139,880 | | | $ | 139,880 | |
Note 10. Commitments and Contingencies
The following represent the material commitments and contingencies of the Company as of SeptemberJune 30, 2021:2022:
Legal and Regulatory
From time to time, the Company may be subject to liability under laws and government regulations and various claims and legal actions arising in the ordinary course of business. Liabilities are established for legal claims when payments associated with the claims become probable and the costs can be reasonably estimated. The actual costs of resolving legal claims may be substantially higher or lower than the amounts established for those claims. Based on information currently available, management is not aware of any legal or regulatory claims that would have a material effect on the Company’s condensed consolidated financial statements and, therefore, no accrual is required as of SeptemberJune 30, 2021.2022.
GRANITE POINT MORTGAGE TRUST INC.
Notes to the Condensed Consolidated Financial Statements (unaudited)
Unfunded Commitments on Loans Held-for-Investment
Certain of the Company’s commercial real estate loan agreements contain provisions and obligations to extend credit to its borrowers through its unfunded loan commitments over the contractual period of its loans. As of SeptemberJune 30, 20212022, and December 31, 2020,2021, the Company had unfunded loan commitments of $430.1$358.7 million and $503.7$403.6 million, respectively, on loans held-for-investment, which it expects to fund, subject to the satisfaction of any conditions precedent to such commitments, over the tenure of these loans, which have a weighted average future funding period of approximately one to two years.loans. These commitments generally provide funding for lease-related or capital improvement expenditures, as well as interest and carry costs, all of which will vary depending on the progress of capital improvement projects, leasing and cash flows at the properties that serve as collateral for the Company’s loans. Therefore, the exact timing and amounts of such loan balance future fundings are generally uncertain and will depend on the current and future performance of the collateral properties. Due to the COVID-19 pandemic and its impact on the global and U.S. economies, generally, and the U.S. commercial real estate market, specifically, the pace of lease-related or capital improvement expenditures may be slower than otherwise expected, and the pace of associated future fundings relating to these capital needs accordingly may be similarly slower; however, the exact timing and amounts are uncertain. The Company typically finances the funding of its loan commitments on terms generally consistent with its overall financing facilities; however, most of its financing agreement counterparties are not obligated to fund their ratable portion of these loan commitments over time and have varying degrees of discretion over future loan funding obligations, including the advance rates on their fundings. The Company may be obligated to fund loan commitments with respect to a pledged asset even if the applicable financing counterparty will not fund their ratable portion of the loan commitment and/or has made margin calls with respect to such pledged asset. As a result of the COVID-19 pandemic and the increased degree of uncertainty it has created, the Company’s financing agreement counterparties may be less likely to finance its future loan funding commitments than they were prior to the COVID-19 pandemic.
As of SeptemberJune 30, 2021,2022, the Company recognized $1.9$2.8 million in other liabilities related to the allowance for credit losses on unfunded loan commitments. See Note 3 - Loans Held-for-Investment, Net of Allowance for Credit Losses for further detail.
Note 11. Preferred Stock
Temporary Equity
The Company’s 10% cumulative redeemable preferred stock ranks, with respect to rights to the payment of dividends and the distribution of assets upon liquidation, dissolution or winding up of the Company, senior to the rights of holders of the Company’s common stock but junior to all other classes or series of preferred stock that may be issued.and on parity with the Company’s 7.00% Series A Fixed-to-Floating Rate Cumulative Redeemable Preferred Stock. The holders of the 10% cumulative redeemable preferred stock are entitled to receive, when, as and if authorized and declared by the Company’s board of directors, cumulative cash dividends at the rate of 10% per annum of the $1,000 liquidation preference per share of the 10% cumulative redeemable preferred stock. Such dividends accrue on a daily basis and are cumulative from and including the initial issue date of the 10% cumulative redeemable preferred stock.stock of June 28, 2017.
The Company currently has the option at any time after five years from the initial issue date of June 28, 2017 to redeem the 10% cumulative redeemable preferred stock at a redemption price of $1,000 per share, plus any accrued and unpaid dividends. At any time after six years from the initial issue date, the Company will, at the request of any 10% cumulative redeemable preferred stockholder, repurchase the holder’s 10% cumulative redeemable preferred stock at a price of $1,000 per share, plus any accrued and unpaid dividends.
During each of the three and ninesix months ended SeptemberJune 30, 2021 and 2020,2022, the Company declared dividends to the 10% cumulative redeemable preferred stockholder of $25,000 and $75,000,$50,000, respectively. During the three and six months ended June 30, 2021, the Company declared dividends to the 10% cumulative redeemable preferred stockholder of $25,000 and $50,000, respectively.
Issuance of Sub-REIT Preferred Stock
In January 2021, a subsidiary of the Company issued 625 shares of Series A preferred stock of which 500 shares were retained by the Company and 125 shares were sold to third party investors for proceeds of $0.1 million. The 500 preferred shares of Series A preferred stock retained by the Company are eliminated in the Company’s condensed consolidated statements of changes in equity and the 125 shares sold to third partythird-party investors are shown in the Company’s condensed consolidated statements of changes in equity as non-controlling interests.
Issuance of 7.00% Series A Fixed-to-Floating Rate Cumulative Redeemable Preferred Stock (Series A Preferred Stock)
On November 30, 2021, and December 10, 2021, the Company received total net proceeds of $110.5 million from the issuance of 4,596,500 shares of Series A Preferred Stock, or the Initial Series A Preferred Stock Shares, after deducting the underwriting discount of $3.6 million and issuance costs of $0.8 million. The Series A Preferred Stock is currently listed on the NYSE under the symbol “GPMT PrA”.
GRANITE POINT MORTGAGE TRUST INC.
Notes to the Condensed Consolidated Financial Statements (unaudited)
On January 18, 2022, and February 8, 2022, the Company received total net proceeds of $87.5 million from the issuance of 3,633,000 additional shares of Series A Preferred Stock, or the Additional Series A Preferred Stock Shares, after deducting the underwriting discount of $2.9 million and issuance costs of $0.4 million.
The Series A Preferred Stock ranks, with respect to rights to the payment of dividends and the distribution of assets upon liquidation, dissolution or winding up of the Company, senior to the rights of holders of the Company’s common stock and on parity with the Company’s 10% cumulative redeemable preferred stock. The Series A Preferred Stock has a liquidation preference of $25.00 per share. When, as, and if authorized by the Company’s board of directors and declared by the Company, dividends on Series A Preferred Stock are payable on the 15th of April, July, October and January of each year at a rate per annum equal to 7.00% per annum of the $25.00 per share liquidation preference. Dividends on the Series A Preferred Stock are cumulative.
The first dividend on the Initial Series A Preferred Stock Shares was payable on January 18, 2022, and covered the period from, and including, November 30, 2021, to, but not including, January 15, 2022, and was in the amount of $0.15069 per share. The first dividend on the Additional Series A Preferred Stock Shares was payable on April 15, 2022, and covered the period from, and including, January 15, 2022, to, but not including, April 15, 2022, and was in the amount of $0.4375 per share. During the three months ended June 30, 2022, on June 16, 2022, the Company declared a dividend in the amount of $0.4375 per share.
On and after November 30, 2026, the Company, at its option, upon not fewer than 30 days’ nor more than 60 days’ written notice, may redeem the Series A Preferred Stock, in whole, at any time, or in part, from time to time, for cash, at a redemption price of $25.00 per share, plus any accrued and unpaid dividends thereon to, but excluding, the date fixed for redemption.
Upon the occurrence of a Change of Control event (as defined in the Articles Supplementary designating the Series A Preferred Stock, or the Articles Supplementary), the Company may, at its option, upon not less than 30 nor more than 60 days’ written notice, redeem the Series A Preferred Stock, in whole or in part, within 120 days on or after the first date on which such Change of Control occurred, for cash at a redemption price of $25.00 per share, plus any accumulated and unpaid dividends thereon to, but excluding, the redemption date, without interest.
Holders of Series A Preferred Stock do not have any voting rights except as set forth in the Articles Supplementary.
Note 12. Stockholders’ Equity
Common Stock
Distributions to Stockholders
The following table presents cash dividends declared by the Company’s board of directors on its common stock from DecemberMarch 31, 20192020, through SeptemberJune 30, 2021:2022:
| | | | | | | | | | | | | | | | | | | | |
| Declaration Date | | Record Date | | Payment Date | | Cash Dividend Per Share |
| 2022 | | | | | | |
| June 16, 2022 | | July 1, 2022 | | July 15, 2022 | | $ | 0.25 | |
| March 17, 2022 | | April 1, 2022 | | April 15, 2022 | | $ | 0.25 | |
| | | | | | $ | 0.50 | |
| 2021 | | | | | | |
| December 16, 2021 | | December 31, 2021 | | January 18, 2022 | | $ | 0.25 | |
| September 15, 2021 | | October 1, 2021 | | October 19, 2021 | | $ | 0.25 | |
| June 15, 2021 | | July 1, 2021 | | July 19, 2021 | | $ | 0.25 | |
| March 18, 2021 | | April 1, 2021 | | April 19, 2021 | | $ | 0.25 | |
| | | | | | $ | 1.00 | |
| 2020 | | | | | | |
| December 18, 2020 | | December 31, 2020 | | January 22, 2021 | | $ | 0.25 | |
| December 18, 2020 | | December 31, 2020 | | January 22, 2021 | | $ | 0.20 | |
| September 28, 2020 | | October 8, 2020 | | October 19, 2020 | | $ | 0.20 | |
| | | | | | $ | 0.65 | |
| | | | | | |
| | | | | | |
| | | | | | |
| | | | | | |
| | | | | | |
| | | | | | |
GRANITE POINT MORTGAGE TRUST INC.
Notes to the Condensed Consolidated Financial Statements
Share Repurchases
TheOn December 16, 2021, the Company announced that its board of directors had increased the Company’s Share Repurchase Program allowsshare repurchase authorization to allow for the repurchase of up to an aggregate of 2,000,0004,000,000 shares of the Company’s common stock andstock. The Company’s share repurchase program has no expiration date. The shares are expected to be repurchased from time to time through privately negotiated transactions or open market transactions, including pursuant to a trading plan in accordance with Rules 10b5-1 and 10b-18 under the Securities Exchange Act of 1934, as amended, or the Exchange Act, or by any combination of such methods. The manner, price, number and timing of share repurchases will be subject to a variety of factors, including market conditions and applicable SEC rules. During the three and six months ended SeptemberJune 30, 2022, the Company repurchased 1,539,134 shares of its common stock for an aggregate cost of $15.7 million. During the three and six months ended June 30, 2021, the Company repurchased 1,000,721300,891 shares of its common stock at a weighted average price of $13.49 per share for an aggregate cost of $13.5$4.3 million. As of SeptemberJune 30, 2021,2022, there remained 698,3881,159,254 shares authorized for repurchase.
The Company has also authorized the repurchase of shares of restricted common stock granted to employees and directors for tax withholding purposes. During the ninesix months ended SeptemberJune 30, 2022, and 2021, the Company repurchased from employees and directors 69,039 and 115,053 shares of its common stock, respectively, for an aggregate cost of $0.8 million and $1.2 million, respectively. During the three months ended June 30, 2021, the Company repurchased from directors 17,628 shares of its common stock for an aggregate cost of $1.2$0.3 million. No shares were repurchased from employees or directors for tax withholding purposes during the three months ended SeptemberJune 30, 2021 and three and nine months ended September 30, 2020.2022.
At-the-Market Offering
The Company is party to an equity distribution agreement under which the Company may sell up to an aggregate of 8,000,000 shares of its common stock from time to time in any method permitted by law deemed to be an “at-the-market” offering as defined in Rule 415 under the Securities Act of 1933, as amended, or Securities Act. As of SeptemberJune 30, 2021,2022, 3,242,364 shares of common stock had been sold under the equity distribution agreement for total accumulated net proceeds of approximately $61.2 million. No shares were sold during the three and ninesix months ended SeptemberJune 30, 20212022, or the three and 2020.six months ended June 30, 2021.
Warrants to Purchase Common Stock
See Note 7 - SeniorSecured Term Loan Facilities and Warrants to Purchase Shares of Common Stock for details on warrants to purchase shares of the Company’s common stock.
Preferred Stock
Distributions to Stockholders
The following table presents cash dividends declared by the Company’s board of directors on its Series A preferred stock from June 30, 2020, through June 30, 2022:
| | | | | | | | | | | | | | | | | | | | |
| Declaration Date | | Record Date | | Payment Date | | Cash Dividend Per Share |
| June 16, 2022 | | July 1, 2022 | | July 15, 2022 | | $ | 0.43750 | |
| March 17, 2022 | | April 1, 2022 | | April 15, 2022 | | $ | 0.43750 | |
| December 16, 2021 | | December 31, 2021 | | January 18, 2022 | | $ | 0.15069 | |
Note 13. Equity Incentive PlanPlans
TheOn June 2, 2022, the Company’s 2017 Equitystockholders approved the adoption of the Granite Point 2022 Omnibus Incentive Plan, or the 2022 Plan. The 2022 Plan permits the granting of stock options, stock appreciation rights, restricted common stock, phantom shares, or restricted stock units both non-performance based,(both non-performance-based, or RSUs, and performance-based, or PSUs,PSUs), dividend equivalent rights, other stock-based awards and other equity-basedcash-based awards to employees, directors, officers, advisors,certain consultants of the Company and other personnel.members of the board of directors. As of SeptemberJune 30, 2021,2022, the Company had 2,228,0887,250,000 shares of common stock available for future issuance under the 2022 Plan.
With the adoption of the 2022 Plan, no new equity awards may be granted under the Company’s 2017 Equity Incentive Plan, or the 2017 Plan, but previously-granted restricted stock, RSUs and PSUs remain outstanding under the 2017 Plan. As of June 30, 2022, the Company had 1,977,927 shares of common stock available for future issuance under the 2017 Plan.
GRANITE POINT MORTGAGE TRUST INC.
Notes to the Condensed Consolidated Financial Statements
The Company accounts for equity-based awards under ASC 718 - Compensation - Stock Compensation, which requires the Company to expense the cost of services received in exchange for equity-based awards based on the grant-date fair value of the awards. This expense is recognized ratably over the requisite service period following the date of grant. The fair value of awards of the Company'sCompany’s restricted common stock and RSUs is typically equivalent to the closing stock price on the grant date. The unrecognized compensation cost relating to such awards is recognized as an expense over the awards’ remaining vesting periods.
GRANITE POINT MORTGAGE TRUST INC.
Notes to the Condensed Consolidated Financial Statements (unaudited)
As of SeptemberJune 30, 2021,2022, there was $1.2$0.3 million of total unrecognized compensation cost for awards of restricted common stock that will be recognized over the grants'grants’ remaining weighted average vesting period of 1.61.1 years. For the three and ninesix months ended SeptemberJune 30, 2021,2022, the Company recognized $0.5$0.1 million and $1.8$0.4 million respectively, of compensation expense associated with these awards, respectively, compared to $1.3$0.5 million and $4.0$1.4 million respectively, for the three and ninesix months ended SeptemberJune 30, 2020,2021, respectively, within compensation and benefits expense on the condensed consolidated statements of income (loss).income.
As of SeptemberJune 30, 2021,2022, there was $6.7$8.8 million of total unrecognized compensation cost for awards of RSUs that will be recognized over the grants'grants’ remaining weighted average vesting period of 2.62.0 years. For the three and ninesix months ended SeptemberJune 30, 2021,2022, the Company recognized $1.2$1.5 million and $3.1$2.8 million respectively, of compensation expense associated with these awards, respectively, compared to $1.1 million and $1.9 million for the three and six months ended June 30, 2021, repectively, within compensation and benefits expense on the condensed consolidated statements of income (loss). The Company did not recognize any compensation expense associated with grants of RSUs in any period prior to October 1, 2020.income.
Awards of PSUs have a three-yearthree-year cliff vesting with the number of performance-based stock units vesting at the end of the three-yearthree-year period based upon the Company’s absolute and relative “core” return on average equity, or Core ROAE, performance, as set in the applicable award agreements. More specifically, between 0% and 200% of the target number of units may vest at the end of the performance period based (i) 50% against the predetermined internal Company performance goal for Core ROAE and (ii) 50% against the Company'sCompany’s performance ranking for Core ROAE among a group of commercial mortgage REIT peer companies. The commercial mortgage REIT peer group includes publicly traded commercial mortgage REITs, which the Company believes derive the majority of their revenues from commercial real estate balance sheet lending activities and meet certain market capitalization criteria.
As of SeptemberJune 30, 2021,2022, there was $4.3$5.3 million of total unrecognized compensation cost for awards of PSUs that will be recognized over the grants’ remaining weighted average vesting period of 2.42.0 years. For the three months and ninesix months ended SeptemberJune 30, 2021,2022, the Company recognized $0.3$0.2 million and $0.6$0.9 million respectively, of compensation expense associated with these awards, respectively, compared to $0.3 million for the six months ended June 30, 2021, within compensation and benefits expenses on the condensed consolidated statements of income (loss). The Company did not recognize anyincome. No compensation expense associated with grants of PSUs in any period prior to January 1, 2021.
The following table summarizeswas recognized for PSU awards during the grants, vesting and forfeitures of restricted common stock and RSUs for the ninethree months ended SeptemberJune 30, 2021:
| | | | | | | | | | | | | | | | | | | | | | | |
| Restricted Stock | | RSUs | | PSUs | | Weighted Average Grant Date Fair Market Value |
| Outstanding at December 31, 2020 | 569,535 | | | 403,903 | | | — | | | $ | 14.93 | |
| Granted | — | | | 519,562 | | | — | | | 9.77 | |
| Vested | (137,728) | | | — | | | — | | | 18.46 | |
| Forfeited | (97,425) | | | — | | | — | | | 18.43 | |
| Outstanding at March 31, 2021 | 334,382 | | | 923,465 | | | — | | | $ | 11.32 | |
| Granted | — | | | 44,853 | | | — | | | 14.77 | |
| Vested | (52,092) | | | (1,048) | | | — | | | 5.12 | |
| Forfeited | (17,628) | | | (3,957) | | | — | | | 5.93 | |
| Outstanding at June 30, 2021 | 264,662 | | | 963,313 | | | — | | | $ | 11.95 | |
| Granted | — | | | — | | | 347,896 | | | 14.15 | |
| Vested | — | | | — | | | — | | | — | |
| Forfeited | — | | | — | | | — | | | — | |
| Outstanding at September 30, 2021 | 264,662 | | | 963,313 | | | 347,896 | | | 12.44 | |
GRANITE POINT MORTGAGE TRUST INC.
Notes to the Condensed Consolidated Financial Statements (unaudited)
The following table summarizes the grants, vesting and forfeitures of restricted stock, RSUs and PSUs for the three and six months ended June 30, 2022:
| | | | | | | | | | | | | | | | | | | | | | | |
| Restricted Stock | | RSUs | | PSUs | | Weighted Average Grant Date Fair Market Value |
| | | | | | | |
| | | | | | | |
| | | | | | | |
| | | | | | | |
| | | | | | | |
| | | | | | | |
| | | | | | | |
| | | | | | | |
| | | | | | | |
| | | | | | | |
| | | | | | | |
| | | | | | | |
| | | | | | | |
| | | | | | | |
| | | | | | | |
| | | | | | | |
| | | | | | | |
| Outstanding at December 31, 2021 | 264,662 | | | 933,283 | | | 347,896 | | | $ | 12.48 | |
| Granted | — | | | 463,292 | | | 312,538 | | | $ | 11.84 | |
| Vested | (103,038) | | | (173,181) | | | — | | | $ | 13.16 | |
| Forfeited | (69,039) | | | — | | | — | | | $ | 18.87 | |
| Outstanding at March 31, 2022 | 92,585 | | | 1,223,394 | | | 660,434 | | | $ | 11.92 | |
| Granted | — | | | 59,898 | | | — | | | $ | 11.06 | |
| Vested | — | | | (44,853) | | | — | | | $ | 14.77 | |
| Forfeited | — | | | — | | | — | | | $ | — | |
| Outstanding at June 30, 2022 | 92,585 | | | 1,238,439 | | | 660,434 | | | $ | 11.83 | |
Below is a summary of restricted stock, RSU and RSUPSU vesting dates as of SeptemberJune 30, 2021:2022:
| | | Vesting Year | Vesting Year | Restricted Stock | | RSUs | | PSUs | | Total Awards | Vesting Year | Restricted Stock | | RSUs | | PSUs | | Total Awards |
| 2021 | — | | | 30,030 | | | — | | | 30,030 | | |
| 2022 | 2022 | 172,077 | | | 218,034 | | | — | | | 390,111 | | 2022 | — | | | — | | | — | | | — | |
| 2023 | 2023 | 92,585 | | | 173,187 | | | 347,896 | | | 613,668 | | 2023 | 92,585 | | | 387,508 | | | 347,896 | | | 827,989 | |
| 2024 | 2024 | — | | | 173,194 | | | — | | | 173,194 | | 2024 | — | | | 327,625 | | | 312,538 | | | 640,163 | |
| 2025 | 2025 | — | | | 368,868 | | | — | | | 368,868 | | 2025 | — | | | 523,306 | | | — | | | 523,306 | |
| | Total | Total | 264,662 | | | 963,313 | | | 347,896 | | | 1,575,871 | | Total | 92,585 | | | 1,238,439 | | | 660,434 | | | 1,991,458 | |
Note 14. Income Taxes
The Company has elected to be taxed as a REIT under the Code for U.S. federal income tax purposes. As long as the Company qualifies as a REIT, the Company generally will not be subject to U.S. federal income taxes on that portion of its income that it distributes to its stockholders if it annually distributes at least 90% of its REIT taxable income, without regard to the deduction for dividends paid and excluding net capital gains, and does not engage in prohibited transactions. For the year ended December 31, 2020, the Company did not distribute the required minimum amount of taxable income pursuant to federal excise tax requirements and, consequently, the Company accrued an excise tax of $0.6 million. As of SeptemberJune 30, 2021,2022, the Company distributed 100% of its REIT taxable income for the taxable yearyears ended December 31, 2021, and 2020, in part with dividends paid in 2021,the subsequent year, and has complied with all requirements to continue to qualify as a REIT. The majority of states also recognize the Company’s REIT status. The Company’s TRS files a separate federal tax return and is fully taxed as a standalone U.S. C-corporation. It is assumed that the Company will retain its REIT status and will incur no REIT level taxation as it intends to comply with the REIT regulations and annual distribution requirements.
Based on the Company’s evaluation, it has been concluded that there are no significant uncertain tax positions requiring recognition in the Company’s condensed consolidated financial statements of a contingent tax liability for uncertain tax positions. Additionally, there were no amounts accrued for penalties or interest as of, or during, the periods presented in these condensed consolidated financial statements.
GRANITE POINT MORTGAGE TRUST INC.
Notes to the Condensed Consolidated Financial Statements (unaudited)
Note 15. Earnings Per Share
The following table presents a reconciliation of the earnings and shares used in calculating basic and diluted earnings per share for the three and ninesix months ended SeptemberJune 30, 20212022, and 2020:2021:
| | | Three Months Ended | | Nine Months Ended | | Three Months Ended | | Six Months Ended |
| | September 30, | | September 30, | | June 30, | | June 30, |
| (in thousands, except share data) | (in thousands, except share data) | 2021 | | 2020 | | 2021 | | 2020 | | (in thousands, except share data) | 2022 | | 2021 | | 2022 | | 2021 | |
| Numerator: | Numerator: | | | | | | | | | Numerator: | | | | | | | | |
| Net income (loss) attributable to common stockholders - basic | $ | 18,605 | | | $ | (24,691) | | | $ | 60,815 | | | $ | (63,665) | | | |
| Net (loss) income attributable to common stockholders - basic | | Net (loss) income attributable to common stockholders - basic | $ | (17,356) | | | $ | 14,244 | | | $ | (16,345) | | | $ | 42,210 | | |
| Interest expense attributable to convertible notes | Interest expense attributable to convertible notes | — | | | — | | | 13,618 | | | — | | | Interest expense attributable to convertible notes | — | | | — | | | — | | | 9,062 | | |
| Net income (loss) attributable to common stockholders - diluted | $ | 18,605 | | | $ | (24,691) | | | $ | 74,433 | | | $ | (63,665) | | | |
| Net (loss) income attributable to common stockholders - diluted | | Net (loss) income attributable to common stockholders - diluted | $ | (17,356) | | | $ | 14,244 | | | $ | (16,345) | | | $ | 51,272 | | |
| Denominator: | Denominator: | | | | | | | | | Denominator: | | | | | | | | |
| Weighted average common shares outstanding | Weighted average common shares outstanding | 54,188,884 | | | 54,624,739 | | | 54,537,196 | | | 54,561,411 | | | Weighted average common shares outstanding | 53,419,420 | | | 54,697,711 | | | 53,561,518 | | | 54,714,239 | | |
| Weighted average restricted stock shares | Weighted average restricted stock shares | 264,662 | | | 580,343 | | | 327,260 | | | 578,752 | | | Weighted average restricted stock shares | 92,585 | | | 312,021 | | | 122,057 | | | 359,078 | | |
| Basic weighted average shares outstanding | Basic weighted average shares outstanding | 54,453,546 | | | 55,205,082 | | | 54,864,456 | | | 55,140,163 | | | Basic weighted average shares outstanding | 53,512,005 | | | 55,009,732 | | | 53,683,575 | | | 55,073,317 | | |
| Effect of dilutive shares issued in an assumed conversion of the convertible senior notes | Effect of dilutive shares issued in an assumed conversion of the convertible senior notes | — | | | — | | | 14,065,946 | | | — | | | Effect of dilutive shares issued in an assumed conversion of the convertible senior notes | — | | | — | | | — | | | 14,065,946 | | |
| Effect of dilutive shares issued in an assumed conversion of RSUs as additional shares | Effect of dilutive shares issued in an assumed conversion of RSUs as additional shares | 435,430 | | | — | | | 245,890 | | | — | | | Effect of dilutive shares issued in an assumed conversion of RSUs as additional shares | — | | | 1,101,306 | | | — | | | 1,009,704 | | |
| | Effect of dilutive shares issued in an assumed exercise of warrants issued in conjunction with the senior secured term loan facilities | Effect of dilutive shares issued in an assumed exercise of warrants issued in conjunction with the senior secured term loan facilities | 1,846,302 | | | — | | | 1,726,453 | | | — | | | Effect of dilutive shares issued in an assumed exercise of warrants issued in conjunction with the senior secured term loan facilities | — | | | 2,415,947 | | | — | | | 2,415,947 | | |
| Diluted weighted average shares outstanding | Diluted weighted average shares outstanding | 56,735,278 | | | 55,205,082 | | | 70,902,745 | | | 55,140,163 | | | Diluted weighted average shares outstanding | 53,512,005 | | | 58,526,985 | | | 53,683,575 | | | 72,564,914 | | |
| Earnings (loss) per share | | | | | | | | | |
| (Loss) earnings per share | | (Loss) earnings per share | | | | | | | | |
| Basic | Basic | $ | 0.34 | | | $ | (0.45) | | | $ | 1.11 | | | $ | (1.15) | | | Basic | $ | (0.32) | | | $ | 0.26 | | | $ | (0.30) | | | $ | 0.77 | | |
| Diluted | Diluted | $ | 0.33 | | | $ | (0.45) | | | $ | 1.05 | | | $ | (1.15) | | | Diluted | $ | (0.32) | | | $ | 0.24 | | | $ | (0.30) | | | $ | 0.71 | | |
For the three and ninesix months ended SeptemberJune 30, 20202022, and three months ended SeptemberJune 30, 2021, excluded from the calculation of diluted earnings per share is the effect of adding back $4.5$4.6 million, $13.6$9.1 million and $4.6$4.5 million, respectively, of interest expense and 13,717,782, 13,717,782 and 14,065,946 respectively, of weighted average common share equivalents related to the assumed conversion of the Company’s convertible senior notes, as their inclusion would be antidilutive.
The computation of diluted earnings per share is also based on the incremental shares that would be outstanding assuming the conversion of RSUs. The number of incremental shares is calculated by applying the treasury stock method. For the three and six months ended June 30, 2021, an additional 1,101,306 and 1,009,704 weighted-average unvested RSUs, respectively, were included in the dilutive earnings per share denominator. For the three and six months ended June 30, 2022, excluded from the calculation of diluted earnings per share is 280,682 and 293,707 weighted-average unvested RSUs, respectively, as their inclusion would be antidilutive.
The computation of diluted earnings per share is also based on the incremental shares that would be outstanding assuming the conversion of PSUs. The number of incremental shares is calculated by applying the treasury stock method. For the three and six months ended June 30, 2022, no additional weighted-average unvested PSUs were included in the dilutive earnings per share denominator, as their inclusion would be antidilutive. The Company did not have any PSUs outstanding as of June 30, 2021.
GRANITE POINT MORTGAGE TRUST INC.
Notes to the Condensed Consolidated Financial Statements
In conjunction with entering into the senior secured term loan credit agreement and the warrants described in Note 7 - Senior Secured Term Loan Facilities and Warrants to Purchase Shares of Common Stock, the Company elected the accreted redemption value method whereby the discount created based on the fair value of the warrants relative to the fair value of the senior secured term loan facilities and the related issuance costs will be accreted over five years using the effective interest method. Such adjustments are included in amortization of deferred debt issuance costs on the Company’s condensed consolidated statements of cash flows. For the three and ninesix months ended SeptemberJune 30, 2021, these adjustments totaled $0.3 million and $0.8$0.5 million, respectively. Additionally, the computation of diluted earnings per share is based on the incremental shares that would be outstanding assuming the exercise of warrants issued in conjunction with entering into the senior secured term loan credit agreement, to the extent such warrants remained outstanding as of September 30, 2021 (after giving effect to the settlement of a portion of such warrants on such date). The computation of diluted earnings per share is also based on the incremental shares that would be outstanding assuming the conversion of RSUs.agreement. The number of incremental shares is calculated by applying the treasury stock method. For the three and ninesix months ended SeptemberJune 30, 2021, the additional 1.82.4 million and 1.7 million shares respectively attributable to the warrants were included in the computation of diluted earnings per share. For the three and nine months ended September 30, 2021, the additional 435,430 and 245,890, respectively, weighted-average unvested RSUs were included in the dilutive earnings per share denominator. The Company did not have any RSUswarrants outstanding as of SeptemberJune 30, 2020.2022.
GRANITE POINT MORTGAGE TRUST INC.
Notes to the Condensed Consolidated Financial Statements (unaudited)
Note 16. Related Party Transactions
Prior to the Internalization, the Company paid the Former Manager a base management fee equal to 1.5% of the Company’s equity, as defined in the management agreement with the Former Manager, or the Former Management Agreement, on an annualized basis. The Company incurred $4.0 million and $11.8 million, respectively, in management fees for the three and nine months ended September 30, 2020. The Company did not incur a management fee for the three and nine months ended September 30, 2021 because the Company was not managed by the Former Manager during the period as a result of the Internalization.
In addition, incentive fees, if earned, were payable to the Former Manager, as defined in the Former Management Agreement. No incentive fees were incurred for the three and nine months ended September 30, 2021 and 2020.
Prior to the Internalization, the Company reimbursed the Former Manager for certain direct and allocated costs incurred by the Former Manager on behalf of the Company. During the three and nine months ended September 30, 2020, these direct and allocated costs totaled approximately $1.5 million and $10.8 million, respectively. No direct and allocated costs were incurred by the Former Manager on behalf of the Company during the three and nine months ended September 30, 2021 because the Company was not managed by the Former Manager during the period as a result of the Internalization.
Note 17.16. Subsequent Events
Events subsequent to SeptemberJune 30, 20212022, were evaluated through the date these condensed consolidated financial statements were issued and no other additional events were identified requiring further disclosure in these condensed consolidated financial statements other than as discussed below.statements.
See Note 7 -
Senior Secured Term Loan Facilities and Warrants to Purchase Shares of Common Stock for details on the settlement of warrants to purchase shares of the Company’s common stock.
On November 3, 2021, the Company priced GPMT 2021-FL4, a $621 million managed CRE CLO with an initial advance rate of 80.875% and a weighted average interest rate at issuance of LIBOR + 1.68%, before transaction costs.
Item 2. Management’s Discussion and Analysis of Financial Condition and Results of Operations
The following discussion and analysis should be read in conjunction with the interim unaudited condensed consolidated financial statements and accompanying notes included elsewhere in this Quarterly Report on Form 10-Q, as well as our Annual Report on Form 10-K for the year ended December 31, 2020.2021.
Our Company
Granite Point Mortgage Trust Inc. is an internally managed real estate finance company that focuses primarily on directly originating, investing in and managing senior floating-rate commercial mortgage loans and other debt and debt-like commercial real estate investments. Our investment objective is to preserve our stockholders’ capital while generating attractive risk-adjusted returns over the long term, primarily through dividends derived from current income produced by our investment portfolio. We operate as a real estate investment trust, or REIT, as defined under the Internal Revenue Code of 1986, as amended, or the Code. We also operate our business in a manner that will permit usintended to maintain our exclusion from registration under the Investment Company Act of 1940, as amended, or the Investment Company Act. We operate our business as one segment.
We were externally managed by Pine River Capital Management L.P., or the Former Manager, through December 31, 2020, at which time we internalized our management function, or the Internalization.Recent Developments
COVID-19 Pandemic
As the novel coronavirus, or COVID-19, pandemic has evolved from its emergence in early 2020, so has its global impact, including contributing to significant volatility in financial markets. The longer-term macroeconomic effects of September 30, 2021, the COVID-19 pandemic remains ongoing. Since the beginning of 2020, the pandemic has significantly impacted the global economy, created disruptions in theon global supply chain, increased rates of unemploymentchains, inflation, labor shortages and adversely impactedwage increases, as well as any potential fiscal and monetary policy responses, may continue to impact many industries, including those related to the real estate collateral underlying certain of our loans. So farMoreover, with the potential for new strains of COVID-19 to emerge, governments and businesses may re-impose aggressive measures to help slow its spread in 2021, the global and U.S. economic activity has, to varying degrees, begun to improve,future. For this reason, among others, as wider distribution of the COVID-19 vaccines has continued. As a result, macroeconomic forecasts have improved over the last few quarters, including expectations for unemployment rates and overall economic output. Nonetheless, the ongoing pandemic may continue to adversely impact the macroeconomic recovery, particularly with respect to the emergence of new variants of the COVID-19 virus, the continued distribution and acceptance of the vaccines and the effectiveness of such vaccines against new variants of the COVID-19 virus. The fluid nature of this situation precludes any certainty as to the ultimate adverse impact of the COVID-19 pandemic continues, the potential global impacts are uncertain and difficult to assess. In addition, the pandemic continues to disrupt global supply chains and cause labor shortages and has added to broad inflationary pressures, all of which could negatively impact our borrowers’ ability to execute on economicthe business plans on their properties and potentially affect their ability to perform under the terms of their loan agreements. In response to the inflationary pressures, the Federal Reserve has begun raising interest rates and has indicated it anticipates further interest rate increases. Such increases in interest rates may increase our interest expense, which may not be fully offset by any increases in interest income, and may also slow the pace of loan repayments and increase the number of borrowers who seek extension of term on their loans.
Interest Rates
Until recently, interest rates have remained at relatively low levels and the Federal Reserve maintained the federal funds rate target range at 0.00% to 0.25% for much of 2020 and 2021. However, in response to the inflationary pressures, earlier in 2022 the Federal Reserve has begun raising its federal funds rate target range and indicated that, due to the persistent high rate of inflation, it anticipates further increases in interest rates throughout 2022 and into 2023. Additionally, driven by the shift in Federal Reserve interest rate policy, the general level of interest rates in the market conditions,has increased. Such increases in interest rates may increase our interest expense, which may not be fully offset by any increases in interest income, and may also slow the pace of loan repayments and increase the number of our borrowers who seek extension of term on their loans. The potential ultimate impact of higher market interest rates on the economy, real estate fundamentals in general and our business is uncertain and difficult to predict.
LIBOR Transition
On March 5, 2021, the Financial Conduct Authority of the U.K., or the FCA, which regulates LIBOR, announced that all LIBOR tenors relevant to us will cease to be published or will no longer be representative after June 30, 2023. The FCA announcement coincides with the March 5, 2021, announcement of LIBOR’s administrator, the ICE Benchmark Administration Limited, or the IBA, indicating that, as a result present material uncertainty and risk with respectof not having access to input data necessary to calculate LIBOR tenors relevant to us andon a representative basis after June 30, 2023, the performanceIBA would have to cease publication of our investments.
We continuesuch LIBOR tenors immediately after the last publication on June 30, 2023. The United States Federal Reserve has also advised banks to monitor the COVID-19 pandemic and its impact on our operating partners, financing sources, borrowers and their tenants and the economycease entering into new contracts that use U.S. dollar LIBOR as a whole.reference rate. The magnitude and duration ofFederal Reserve, in conjunction with the COVID-19 pandemic, and its ultimate impact on our operations, liquidity and availability of financing, remain uncertain, as it continues to evolve. ToAlternative Reference Rate Committee, or the extent that our borrowers and their tenants, property sponsors and financing sources continue to be impactedARRC, a committee convened by the COVID-19 pandemic, itFederal Reserve that includes major market participants, has identified the Secured Overnight Financing Rate, or SOFR, a new index calculated by short-term repurchase agreements, backed by Treasury securities, as its preferred alternative rate for LIBOR. There are significant differences between LIBOR and SOFR, such as LIBOR being an unsecured lending rate while SOFR is a secured lending rate, and SOFR is an overnight rate while LIBOR reflects term rates at different maturities. If our LIBOR-based borrowings are converted to SOFR, the differences between LIBOR and SOFR, and potential margin adjustments in connection with the transition, could result in higher interest costs for us, which could have a material adverse effect on our liquidity and capital resources.
The full extentoperating results. Although SOFR is the ARRC’s recommended replacement rate, it is also possible that lenders may instead choose alternative replacement rates that may differ from LIBOR in ways similar to SOFR or in other ways that would result in higher interest costs for us. We cannot predict the effect of the impactdecision not to sustain LIBOR, or the potential transition to SOFR or another alternative reference rate as LIBOR’s replacement.
As of June 30, 2022, 87.8% of our loans by carrying value earned a floating rate of interest indexed to LIBOR, and effects11.0% to SOFR. As of COVID-19June 30, 2022, 57.3% of our outstanding financing arrangements (excluding our convertible notes) bear interest indexed to LIBOR, and 42.7% to SOFR. All of these arrangements provide procedures for determining an alternative base rate when LIBOR is discontinued. As of June 30, 2022, the one-month SOFR was 1.69% and one-month US LIBOR was 1.79%. Regardless, there can be no assurances as to what alternative base rates may be and whether such base rate will depend on future developments, including, amongbe more or less favorable than LIBOR and any other factors, the duration, severity and spreadunforeseen impacts of the outbreak, along withdiscontinuation of LIBOR. We are monitoring the related travel advisories, quarantines and restrictions, the recovery time of the disrupted supply chains and industries, the impact of labor market interruptions, the impact of government interventions and uncertaintydevelopments with respect to the durationphasing out of the global economic slowdown. For additional discussionLIBOR and are working with respectour lenders and borrowers to minimize the potential impact of the COVID-19 pandemicLIBOR transition on our liquidityfinancial condition and capital resources, see Liquidity and Capital Resources below.results of operations, but can provide no assurances regarding the impact of the discontinuation of LIBOR.
Forward-Looking Statements
This Quarterly Report on Form 10-Q contains, or incorporates by reference, not only historical information, but also forward-looking statements within the meaning of Section 27A of the Securities Act of 1933, as amended, or the Securities Act, and Section 21E of the Exchange Act of 1934, as amended, or the Exchange Act, and that are subject to the safe harbors created by such sections. Forward-looking statements involve numerous risks and uncertainties. Our actual results may differ from our beliefs, expectations, estimates and projections and, consequently, you should not rely on these forward-looking statements as predictions of future events. Forward-looking statements are not historical in nature and can be identified by words such as “anticipate,” “estimate,” “will,” “should,” “expect,” “target,” “believe,” “intend,” “seek,” “plan,” “goals,” “future,” “likely,” “may” and similar expressions or their negative forms, or by references to strategy, plans or intentions. By their nature, forward-looking statements speak only as of the date they are made, are not statements of historical fact or guarantees of future performance and are subject to risks, uncertainties, assumptions or changes in circumstances that are difficult to predict or quantify, in particular those relating to the COVID-19 pandemic, including the ultimate impact of the COVID-19 pandemic on our business, financial performance and operating results.pandemic. Our expectations, beliefs and estimates are expressed in good faith, and we believe there is a reasonable basis for them. However, there can be no assurance that management's expectations, beliefs and estimates will prove to be correct or be achieved and actual results may vary materially from what is expressed in or indicated by the forward-looking statements.
These forward-looking statements are subject to risks and uncertainties, including, among other things, those described in our Annual Report on Form 10-K for the year ended December 31, 2020,2021, under the caption “Risk Factors.” These risks may also be further heightened by the continued and evolving impact of the COVID-19 pandemic. Other risks, uncertainties and factors that could cause actual results to differ materially from those projected are described below and may be described from time to time in reports we file with the SEC, including our Quarterly Reports on Form 10-Q and Current Reports on Form 8-K. Forward-looking statements speak only as of the date they are made, and we undertake no obligation to update or revise any such forward-looking statements, whether as a result of new information, future events or otherwise.
Important factors that may affect our actual results include, among others:
•the severity and duration of the ongoing COVID-19 pandemic;
•potential risks and uncertainties relating to the spread of COVID-19,pandemic, including new variants;
•actions taken by governmental authorities and businesses to contain the COVID-19 pandemic or to mitigate its impact;
•the negative impacts of therelated to COVID-19 pandemic on the U.S.global economy and global economies, including the unemployment rate, and the impacts of COVID-19 pandemic on our financial condition, business operations and our loan portfolio, including the value of our assets, as well as the financial condition and operations of our borrowers;
•the general political, economic and competitive conditions in the markets in which we invest;
•defaults by borrowers in paying debt service on outstanding indebtedness and borrowers’borrowers' abilities to manage and stabilize properties;
•our ability to obtain or maintain financing arrangements on terms favorable to us or at all;
•the level and volatility of prevailing interest rates and credit spreads;
•reductions in the yield on our investments and increases in the cost of our financing;
•general volatility of the securities markets in which we participate and the potential need to post additional collateral on our financing arrangements;
•the return or impact of current or future investments;
•changes in our business, investment strategies or target investments;
•increased competition from entities investing in our target investments;
•effects of hedging instruments on our target investments;
•changes in governmental regulations, tax law and rates and similar matters;
•our ability to maintain our qualification as a REIT for U.S. federal income tax purposes and our exclusion from registration under the Investment Company Act;
•availability of desirable investment opportunities;
•availability of qualified personnel;
•estimates relating to our ability to make distributions to our stockholders in the future;
•acts of God, such as hurricanes, earthquakes and other natural disasters, including climate change-related risks, acts of war and/or terrorism, pandemics or outbreaks of infectious disease, such as the COVID-19 pandemic, and other events that may cause unanticipated and uninsured performance declines and/or losses to us or the owners and operators of the real estate securing our investments;
•economic impact of escalating global trade tensions, including the conflict between Russian and Ukraine, and the adoption or expansion of economic sanctions or trade restrictions;
•accelerating inflationary trends, spurred by multiple factors including high commodity prices, a tight labor market and low residential vacancy rates, may result in further interest rate increases and lead to increased market volatility;
•deterioration in the performance of the properties securing our investments that may cause deterioration in the performance of our investments and, potentially, principal losses to us, including the risk of credit loss charges and any impact on our ability to satisfy the covenants and conditions in our debt agreements; and
•difficulty or delays in redeploying the proceeds from repayments of our existing investments.
This Quarterly Report on Form 10-Q may contain statistics and other data that, in some cases, have been obtained or compiled from information made available by loan servicers and other third-party service providers.
ThirdSecond Quarter 20212022 Activity
Operating Results:
•GAAP net incomeloss attributable to common stockholders of $18.6$(17.4) million, or $0.34$(0.32) per basic share, mainly reflecting a releaseloss on early extinguishment of debt of $(13.0) million and an increase in CECL reserves of $5.8$(13.6) million.
•Distributable Earnings of $5.1$11.7 million, or $0.09$0.22 per basic share, which excludes the $5.8$(13.6) million releaseincrease in CECL reserve net of the CECL reserve, $2.0$0.5 million expense related to the amortizationrecovery of amounts previously written off, $(1.9) million of non-cash equity compensation expense, and includes the $9.7$(13.0) million realized loss on a loan held-for-investment, as further described below.early extinguishment of debt.
•Book value per share of common stock of $17.33$16.01 inclusive of $(0.88)$(0.96) per share of common stock of total CECL reserve.
•Declared a regular quarterlyaggregate common stock dividenddividends of $13.7$13.4 million, or $0.25 per share of common stock.stock, and preferred dividends of $3.6 million, or $0.43750 per share of Series A Preferred Stock.
Investment Portfolio Activity:
•Originated eightfive loans with a total commitmentcommitments of $311.7$202.1 million and a total principal balance of $289.3$168.7 million.
•Funded $35.2$43.0 million of principal balance on prior loan commitments.
•ReceivedRealized loan repayments, principal paydowns and principal amortization of $290.5$120.1 million.
•Maintained a portfolio of 100104 loan investments with a weighted-averageweighted average stabilized loan to value ratio, or LTV, at origination of 63.3%63.1%, and a weighted-averageweighted average all-in yield at origination of L+4.11%/S+4.07%.
•Collected 100% of contractual interest payments during the third quarter of 2021,three months ended June 30, 2022, inclusive of loan modifications and two loans on nonaccrual status. Deferred, and added to the principal, $1.1$0.5 million of interest income related to certain loansa loan that had been modified in prior periods.modified.
Corporate Financing Activity:
•Repurchased through open market transactions 1,000,721 sharesRepaid the remaining $100.0 million of common stock at a weighted average price of $13.49 per share for an aggregate cost of $13.5 million.borrowings under the senior secured term loan facilities.
•Settled partRepaid the remaining $129.1 million of borrowings outstanding under the term financing facility with Goldman Sachs Bank USA.
•Redeemed the GPMT 2018-FL1 CRE CLO, which at its redemption had $103.6 million of investment-grade bonds outstanding.
•Entered into a modification on the Morgan Stanley Bank repurchase financing facility to increase the maximum facility capacity amount up to $600.0 million as well as extend the maturity date of the outstanding warrantsfacility to purchase approximately 1.06June 28, 2023.
•Extended maturities of the Wells Fargo, JPMorgan and Citibank repurchase financing facilities to June 28, 2023, June 28, 2024, and May 25, 2025, respectively.
•Accretively repurchased over 1.5 million shares of common stock at an exerciseaverage price of $6.47 per share of common stock$10.18 for a nettotal of $15.7 million.
Available Liquidity
•At June 30, 2022, we had unrestricted cash amount of approximately $7.5 million.$150.2 million, a portion of which is subject to certain liquidity covenants.
Key Financial Measures and Indicators
As a commercial real estate finance company, we believe the key financial measures and indicators for our business are earnings per share presented on a U.S. generally accepted accounting principles, or GAAP, basis, dividends declared on common stock, Distributable Earnings and book value per share of common stock. For the three months ended SeptemberJune 30, 2021, 2022,
we recorded earningsGAAP loss per basic share of $0.34,$(0.32), declared a regular quarterly cash dividend of $0.25 per share of common stock and reported Distributable Earnings of $0.09$0.22 per basic share. Our book value as of SeptemberJune 30, 20212022, was $17.33$16.01 per share of common stock, inclusive of $(0.88)$(0.96) of total Current Expected Credit Loss, or CECL, reserve.
As further described below, Distributable Earnings is a measure that is not prepared in accordance with GAAP. We use Distributable Earnings to evaluate our performance, excluding the effects of certain transactions and GAAP adjustments that we believe are not necessarily indicative of our current loan portfolio and operations. In addition, Distributable Earnings is a performance metric we consider, along with other measures, when declaring our common stock dividends.
Earnings Per Share and Dividends Declared Per Common Share
The following table sets forth the calculation of basic and diluted (loss) earnings per share and dividends declared per share:
| | | | | | | | | | | | | | | | | | | | | | | |
| Three Months Ended | | Nine Months Ended |
| September 30, | | September 30, |
| (in thousands) | 2021 | | 2020 | | 2021 | | 2020 |
| Net income (loss) | $ | 18,630 | | | $ | (24,666) | | | $ | 60,890 | | | $ | (63,590) | |
| Weighted average number of common shares outstanding | 54,453,546 | | | 55,205,082 | | | 54,864,456 | | | 55,140,163 | |
| Basic earnings per basic common share | $ | 0.34 | | | $ | (0.45) | | | $ | 1.11 | | | $ | (1.15) | |
| Diluted earnings per basic common share | $ | 0.33 | | | $ | (0.45) | | | $ | 1.05 | | | $ | (1.15) | |
| Dividend declared per common share | $ | 0.25 | | | $ | 0.20 | | | $ | 0.75 | | | $ | 0.20 | |
| | | | | | | | | | | | | | | | | | | | | | | |
| Three Months Ended | | Six Months Ended |
| June 30, | | June 30, |
| (in thousands, except share data) | 2022 | | 2021 | | 2022 | | 2021 |
| Net (loss) income attributable to common stockholders | $ | (13,731) | | | $ | 14,269 | | | $ | (16,345) | | | $ | 42,210 | |
| Weighted average number of common shares outstanding | 53,512,005 | | | 55,009,732 | | | 53,683,575 | | | 55,073,317 | |
| Weighted average number of diluted shares outstanding | 53,512,005 | | | 58,526,985 | | | 53,683,575 | | | 72,564,914 | |
| Basic (loss) earnings per basic common share | $ | (0.32) | | | $ | 0.26 | | | $ | (0.30) | | | $ | 0.77 | |
| Diluted (loss) earnings per basic common share | $ | (0.32) | | | $ | 0.24 | | | $ | (0.30) | | | $ | 0.71 | |
| Dividend declared per common share | $ | 0.25 | | | $ | 0.25 | | | $ | 0.50 | | | $ | 0.50 | |
Distributable Earnings
Beginning with our Annual Report on Form 10-K for the year ended December 31, 2020, and for all subsequent reporting periods ending on or after December 31, 2020, we have elected to present Distributable Earnings, a measure that is not prepared in accordance with GAAP, as a supplemental method of evaluating our operating performance. Distributable Earnings replaces our prior presentation of Core Earnings with no changes to the definition. In order to maintain our status as a REIT, we are required to distribute at least 90% of our taxable income as dividends. Distributable Earnings is intended to over time serve as a general, though imperfect, proxy for our taxable income, though it is not a perfect substitute for it, and, asincome. As such, Distributable Earnings is considered a key indicator of our ability to generate sufficient income to pay our common dividends and in determining the amount of such dividends, which is the primary focus of income-oriented investors who comprise a meaningful segment of our stockholder base. We believe providing Distributable Earnings on a supplemental basis to our net income (loss) and cash flow from operating activities, as determined in accordance with GAAP, is helpful to stockholders in assessing the overall run-rate operating performance of our business.
We use Distributable Earnings to evaluate our performance, excluding the effects of certain transactions and GAAP adjustments we believe are not necessarily indicative of our current loan portfolio and operations. For reporting purposes, we define Distributable Earnings as net income (loss) attributable to our stockholders, computed in accordance with GAAP, excluding: (i) non-cash equity compensation expenses; (ii) depreciation and amortization; (iii) any unrealized gains (losses) or other similar non-cash items that are included in net income for the applicable reporting period (regardless of whether such items are included in other comprehensive income (loss) or in net income for such period); and (iv) certain non-cash items and
one-time expenses. Distributable Earnings may also be adjusted from time to time for reporting purposes to exclude one-time events pursuant to changes in GAAP and certain other material non-cash income or expense items approved by a majority of our independent directors. The exclusion of depreciation and amortization from the calculation of Distributable Earnings only applies to debt investments related to real estate to the extent we foreclose upon the property or properties underlying such debt investments.
While Distributable Earnings excludes the impact of the unrealized non-cash current provision for credit losses, we expect to only recognize such potential credit losses in Distributable Earnings if and when such amounts are deemed non-recoverable. This is generally at the time a loan is repaid, or in the case of foreclosure, when the underlying asset is sold, but non-recoverability may also be concluded if, in our determination, it is nearly certain that all amounts due will not be collected. The realized loss amount reflected in Distributable Earnings will equal the difference between the cash received, or expected to be received, and the carrying value of the asset, and is reflective of our economic experience as it relates to the ultimate realization of the loan. During the ninethree and six months ended SeptemberJune 30, 2021,2022, we recorded a $15.1 million benefit from provision for credit losses of $(13.6) million and $(17.3) million, respectively, which has been excluded from Distributable Earnings consistent with other unrealized gains (losses) and other non-cash items pursuant to our existing policy for reporting Distributable Earnings referenced above. DuringPursuant to our existing policy for reporting Distributable Earnings referenced above, during the ninethree months ended SeptemberJune 30, 2021,2022, we recorded a $9.7$0.5 million realized lossrecovery of amounts previously written off in a prior period on a discounted payoff. Additionally, during the six months ended June 30, 2022, we recorded a $(10.1) million write-off on a loan held-for-investment,sale, which has beenwe included in Distributable Earnings consistent withbecause we did not collectingcollect all amounts due at the time athe loan was repaidsold. During the three and six months ended June 30, 2022, we recorded a $(13.0) million and $(18.8) million, respectively, loss on early extinguishment of debt, which has been excluded from Distributable Earnings consistent with certain one-time expenses pursuant to our existing policy for reporting Distributable Earnings referenced above.as a helpful indicator in assessing the overall run-rate operating performance of our business.
Distributable Earnings does not represent net income (loss) or cash flow from operating activities and should not be considered as an alternative to GAAP net income, (loss), or an indication of our GAAP cash flows from operations, a measure of our liquidity, or an indication of funds available for our cash needs. In addition, our methodology for calculating Distributable Earnings may differ from the methodologies employed by other companies to calculate the same or similar supplemental performance measures, and, accordingly, our reported Distributable Earnings may not be comparable to the Distributable Earnings reported by other companies.
The following table provides a reconciliation of GAAP net (loss) income (loss) attributable to common stockholders to Distributable Earnings (in thousands, except share and per share data):
| | | | | | | | | | | | | | | | | | | | |
| Three Months Ended | Nine Months Ended |
| September 30, | September 30, |
| (in thousands) | 2021 | | 2020 | 2021 | | 2020 |
| Reconciliation of GAAP net income to Distributable Earnings: | (unaudited) | (unaudited) |
| GAAP net income (loss) attributable to common stockholders | $ | 18,605 | | | $ | (24,691) | | $ | 60,815 | | | $ | (63,665) | |
| Adjustments for non-distributable earnings: | | | | | | |
| (Benefit from) provision for credit losses | (5,760) | | | (5,300) | | (15,072) | | | 62,240 | |
| Write-off of loan held-for-investment | (9,740) | | | — | | (9,740) | | | — | |
| Restructuring charges | — | | | 43,682 | | — | | | 43,682 | |
| Non-cash equity compensation | 2,032 | | | 1,316 | | 5,558 | | | 3,994 | |
| Distributable Earnings | $ | 5,137 | | | $ | 15,007 | | $ | 41,561 | | | $ | 46,251 | |
| Distributable Earnings per basic share of common stock | $ | 0.09 | | | $ | 0.27 | | $ | 0.76 | | | $ | 0.84 | |
| Basic weighted average common shares - Distributable Earnings | 54,453,546 | | | 55,205,082 | | 54,864,456 | | | 55,140,163 | |
The presentation for the comparative period has been reorganized to conform with the 2020 presentation of Distributable Earnings. This reorganization has no impact on Distributable Earnings.
| | | | | | | | | | | | | | | | | | | | | | | |
| Three Months Ended | | Six Months Ended |
| June 30, | | June 30, |
| (in thousands, except share data) | 2022 | | 2021 | | 2022 | | 2021 |
| Reconciliation of GAAP net (loss) income to Distributable Earnings: | | | |
| GAAP net (loss) income attributable to common stockholders | $ | (17,356) | | | $ | 14,244 | | | $ | (16,345) | | | $ | 42,210 | |
| Adjustments for non-distributable earnings: | | | | | | | |
| Provision for (benefit from) credit losses | 13,627 | | | (193) | | | 17,315 | | | (9,312) | |
| Write-off on loan sale | — | | | — | | | (10,107) | | | — | |
| Recovery of amounts previously written off | 512 | | | — | | | 512 | | | — | |
| Loss on extinguishment of debt | 13,032 | | | — | | | 18,823 | | | — | |
| | | | | | | |
| Non-cash equity compensation | 1,906 | | | 1,639 | | | 4,077 | | | 3,526 | |
| Distributable Earnings | $ | 11,721 | | | $ | 15,690 | | | $ | 14,275 | | | $ | 36,424 | |
| Distributable Earnings per basic share of common stock | $ | 0.22 | | | $ | 0.29 | | | $ | 0.27 | | | $ | 0.66 | |
| Basic weighted average common shares - Distributable Earnings | 53,512,005 | | | 55,009,732 | | | 53,683,575 | | | 55,073,317 | |
Book Value Per Common Share
The following table provides the calculation of our book value per share of common stock:
| | (in thousands) | | September 30, 2021 | | December 31, 2020 | |
| (in thousands, except share data) | | (in thousands, except share data) | | June 30, 2022 | | December 31, 2021 |
| Stockholders’ equity | Stockholders’ equity | | $ | 932,109 | | | $ | 934,846 | | Stockholders’ equity | | $ | 1,043,709 | | | $ | 1,013,058 | |
| Preferred stock | | (1,000) | | | (1,000) | | |
| 7.00% Series A cumulative redeemable preferred stock liquidation preference | | 7.00% Series A cumulative redeemable preferred stock liquidation preference | | (205,738) | | | (114,913) | |
| | Common stockholders’ equity | Common stockholders’ equity | | $ | 931,109 | | | $ | 933,846 | | Common stockholders’ equity | | $ | 837,971 | | | $ | 898,145 | |
| Shares: | Shares: | | | Shares: | | |
| Common stock | Common stock | | 53,254,803 | | | 54,635,547 | | Common stock | | 52,258,404 | | | 53,524,803 | |
| Restricted stock | Restricted stock | | 264,662 | | | 569,535 | | Restricted stock | | 92,585 | | | 264,662 | |
| Total outstanding | Total outstanding | | 53,789,465 | | | 55,205,082 | | Total outstanding | | 52,350,989 | | | 53,789,465 | |
| Book value per share of common stock | Book value per share of common stock | | $ | 17.33 | | | $ | 16.92 | | Book value per share of common stock | | $ | 16.01 | | | $ | 16.70 | |
Book value per share as of SeptemberJune 30, 20212022, includes the impact of an estimated allowance for credit losses of $47.4$(50.1) million, or $0.88$(0.96) per common share. See Note 23 – BasisLoans Held-for-Investment, Net of Presentation and Significant Accounting PoliciesAllowance for Credit Losses of the notes to our condensed consolidated financial statements included in this Quarterly Report on Form 10-Q for a detailed discussion of allowance for credit losses.
Portfolio Overview
Our business model is mainly focused on directly originating, investing in and managing senior floating-rate commercial mortgage loans and other debt and debt-like commercial real estate investments. As a result of this strategy, our operating performance is subject to overall market demand for commercial real estate loan products and other debt and debt-like commercial real estate investments. We place emphasis on diversifying our investment portfolio across geographical regions and local markets, property types, borrowers and loan structures. We do not limit our loan originations by geographical area or property type, so that we may develop a well-diversified investment portfolio.
The Company’s interest-earningInterest-earning assets include itsour 100% loan investment portfolio. At SeptemberJune 30, 2021,2022, our portfolio was comprised of 100104 loans, of which 98102 were senior first mortgage loans totaling $4.1$4.2 billion of commitments with an unpaid principal balance of $3.7$3.9 billion, and two were subordinated loans totaling $15.5$14.2 million in commitments and unpaid principal balance. During the three months ended SeptemberJune 30, 2021,2022, we collected 100% of the contractual interest payments that were due under our loan agreements, after taking into consideration certain loans that have been modified mainly due to the impact of the COVID-19 pandemic and two loans on nonaccrual status. In connection with the loan modifications, the total amount of interest income that was deferred and added to the principal during the three months ended SeptemberAt June 30, 2021 was $1.1 million, or 2.3% of our interest income recognized during the period. The interest income deferred and added to the principal balance during the three months ended September 30, 2021 was related to loan modifications entered into in prior quarters. At September 30, 2021,2022, the weighted average risk rating of our loan portfolio was 2.6,2.5, weighted by total unpaid principal balance, as compared to 2.82.5 at June 30,March 31, 2022, and 2.6 at December 31, 2021.
During the three months ended SeptemberJune 30, 2021,2022, we originated eightfive loans with a total unpaid principal balanceloan commitment amount of $289.3$202.1 million, and total loan commitments of $311.7 million.which $168.7 million was funded at origination. Other loan fundings included $35.2$43.0 million of additional fundings made under existing loan commitments. Proceeds from loan repayments and principal amortization during the three months ended September 30, 2021 totaled $290.5$120.1 million. We generated interest income of $48.4$49.3 million and incurred interest expense of $26.3$27.3 million, which resulted in net interest income of $22.1$21.9 million. See Note 3 - Loans Held-for-Investment, Net of Allowance for Credit Lossesto our condensed consolidated financial statementsCondensed Consolidated Financial Statements included in this Quarterly Report on Form 10-Q for details.
The following table details our loan activity by unpaid principal balance for the three months ended SeptemberJune 30, 20212022, and 2020:2021: | | | Three Months Ended | | | | | | | | | | | |
| | September 30, | | | Three Months Ended June 30, |
| (in thousands) | (in thousands) | 2021 | | 2020 | (in thousands) | | 2022 | | 2021 |
| Loan originations | Loan originations | $ | 289,345 | | | $ | — | | Loan originations | | $ | 168,741 | | | $ | 163,363 | |
Other loan fundings (1) | Other loan fundings (1) | 35,175 | | | 54,464 | | Other loan fundings (1) | | $ | 42,979 | | | $ | 30,434 | |
| Deferred interest capitalized | Deferred interest capitalized | 1,077 | | | 3,153 | | Deferred interest capitalized | | $ | 525 | | | $ | 4,041 | |
| | Loan repayments | (290,497) | | | (400,646) | | |
| Loan write-offs | (9,740) | | | — | | |
Loan repayments (2) | | Loan repayments (2) | | $ | (120,107) | | | $ | (422,969) | |
| | | Total loan activity, net | Total loan activity, net | $ | 25,360 | | | $ | (343,029) | | Total loan activity, net | | $ | 92,138 | | | $ | (225,131) | |
(1) Additional fundings made under existing loan commitments.commitments and upsizing of loans.
32(2) Includes repayment of deferred interest capitalized.
The following table details overall statistics for our investment portfolio as of June 30, 2022:
| | | | | |
| (dollars in thousands) | |
| Portfolio Summary |
| Number of loans | 104 | |
| Total loan commitments | $ | 4,248,184 | |
| Unpaid principal balance | $ | 3,889,479 | |
| Unfunded loan commitments | $ | 358,705 | |
| Carrying value | $ | 3,830,014 | |
| Weighted-average cash coupon | L+/S+3.51% |
| Weighted-average all-in yield | L+/S+4.07% |
| |
| Stabilized LTV at origination | 63.1 | % |
The following table details overall statistics for our investment portfolio as of September 30, 2021:
| | | | | |
Portfolio Summary |
Number of loans | 100 | |
Total loan commitments | $ | 4,102,958 | |
Unpaid principal balance | $ | 3,672,853 | |
Unfunded loan commitments | $ | 430,105 | |
Carrying value | $ | 3,614,211 | |
Weighted-average cash coupon | L+3.48% |
Weighted-average all-in yield | L+4.11% |
| |
Stabilized LTV at origination | 63.3 | % |
The following table provides detail of our portfolio as of September 30, 2021:
| | | | | | | | | | | | | | | | | | | | | | | | | | | | | | | | | | | | | | | | | | | | | | | | | | | | | | | | | | | | | | | | | | | | |
| (dollars in millions) | | | | | | | | | | | | | | | | | | | | |
Type (1) | | Origination/ Acquisition Date | | Maximum Loan Commitment | | Principal Balance | | Carrying Value | | Cash Coupon (2) | | All-in Yield at Origination (3) | | Original Term (Years) (4) | | State | | Property Type | | Initial LTV (5) | | Stabilized LTV (6) |
| Senior | | 12/15 | | $120.0 | | $120.0 | | $119.6 | | L+4.15% | | L+4.43% | | 4.0 | | LA | | Mixed-Use | | 65.5% | | 60.0% |
| Senior | | 10/19 | | 120.0 | | 93.0 | | 92.2 | | L+3.24% | | L+3.86% | | 3.0 | | CA | | Office | | 63.9% | | 61.1% |
| Senior | | 07/18 | | 114.1 | | 114.1 | | 99.5 | | L+3.34% | | L+4.27% | | 2.0 | | CA | | Retail | | 50.7% | | 55.9% |
| Senior | | 12/19 | | 101.6 | | 91.0 | | 90.1 | | L+2.75% | | L+3.23% | | 3.0 | | IL | | Multifamily | | 76.5% | | 73.0% |
| Senior | | 08/19 | | 100.3 | | 91.3 | | 90.4 | | L+2.80% | | L+3.26% | | 3.0 | | MN | | Office | | 73.1% | | 71.2% |
| Senior | | 12/18 | | 96.5 | | 74.6 | | 73.8 | | L+3.75% | | L+5.21% | | 3.0 | | NY | | Mixed-Use | | 26.2% | | 47.6% |
| Senior | | 07/19 | | 94.0 | | 80.2 | | 79.5 | | L+3.69% | | L+4.32% | | 3.0 | | IL | | Office | | 70.0% | | 64.4% |
| Senior | | 10/19 | | 87.8 | | 72.2 | | 71.4 | | L+2.55% | | L+3.05% | | 3.0 | | TN | | Office | | 70.2% | | 74.2% |
| Senior | | 01/20 | | 81.9 | | 59.7 | | 59.2 | | L+3.25% | | L+3.93% | | 3.0 | | CO | | Industrial | | 47.2% | | 47.5% |
| Senior | | 06/19 | | 81.7 | | 81.4 | | 80.6 | | L+2.69% | | L+3.05% | | 3.0 | | TX | | Mixed-Use | | 71.7% | | 72.2% |
| Senior | | 09/19 | | 77.0 | | 77.0 | | 76.8 | | L+3.07% | | L+3.58% | | 3.0 | | NY | | Multifamily | | 62.7% | | 67.1% |
| Senior | | 10/19 | | 76.9 | | 76.9 | | 76.2 | | L+3.36% | | L+3.73% | | 3.0 | | FL | | Mixed-Use | | 67.7% | | 62.9% |
| Senior | | 11/17 | | 75.3 | | 75.3 | | 75.0 | | L+4.45% | | L+5.20% | | 3.0 | | TX | | Hotel | | 68.2% | | 61.6% |
| Senior | | 10/17 | | 74.8 | | 54.0 | | 45.9 | | L+4.07% | | L+4.47% | | 4.0 | | DC | | Office | | 67.0% | | 66.0% |
| Senior | | 12/16 | | 71.8 | | 68.2 | | 68.0 | | L+3.75% | | L+4.87% | | 4.0 | | FL | | Office | | 73.3% | | 63.2% |
| Senior | | 12/19 | | 65.2 | | 50.2 | | 49.7 | | L+2.80% | | L+3.28% | | 3.0 | | NY | | Office | | 68.8% | | 59.3% |
| Senior | | 07/21 | | 63.3 | | 60.5 | | 59.6 | | L+3.00% | | L+3.39% | | 3.0 | | LA | | Multifamily | | 68.8% | | 68.6% |
| Senior | | 09/19 | | 60.2 | | 60.2 | | 60.1 | | L+3.00% | | L+3.63% | | 2.0 | | TX | | Office | | 64.7% | | 59.0% |
| Senior | | 12/18 | | 60.1 | | 55.9 | | 55.8 | | L+2.90% | | L+3.44% | | 3.0 | | TX | | Office | | 68.5% | | 66.7% |
| Senior | | 06/19 | | 54.1 | | 50.9 | | 50.7 | | L+3.30% | | L+3.70% | | 3.0 | | VA | | Office | | 49.3% | | 49.9% |
| Senior | | 06/21 | | 52.7 | | 46.6 | | 45.9 | | L+4.32% | | L+4.75% | | 3.0 | | GA | | Office | | 68.0% | | 69.4% |
| Senior | | 12/15 | | 52.0 | | 52.0 | | 51.9 | | L+3.73% | | L+4.87% | | 4.0 | | PA | | Office | | 74.5% | | 67.5% |
| Senior | | 09/21 | | 51.7 | | 45.3 | | 44.5 | | L+5.00% | | L+5.12% | | 3.0 | | MN | | Hotel | | 68.4% | | 57.8% |
| Senior | | 05/17 | | 51.4 | | 51.4 | | 48.4 | | L+4.70% | | L+5.50% | | 3.0 | | HI | | Hotel | | 60.8% | | 59.4% |
| Senior | | 02/20 | | 50.5 | | 44.7 | | 44.1 | | L+3.30% | | L+3.75% | | 3.0 | | TN | | Hotel | | 69.1% | | 54.2% |
| Senior | | 09/18 | | 50.1 | | 35.9 | | 35.7 | | L+3.25% | | L+4.13% | | 3.0 | | IL | | Office | | 47.9% | | 56.1% |
| Senior | | 08/19 | | 46.4 | | 41.8 | | 41.4 | | L+2.84% | | L+3.39% | | 3.0 | | GA | | Office | | 69.5% | | 68.3% |
| Senior | | 07/21 | | 46.4 | | 45.4 | | 44.7 | | L+3.69% | | L+4.19% | | 3.0 | | CT | | Office | | 68.3% | | 63.5% |
| Senior | | 07/16 | | 46.0 | | 37.4 | | 37.4 | | L+2.93% | | L+4.99% | | 4.0 | | VA | | Office | | 62.8% | | 61.5% |
| Senior | | 06/18 | | 46.0 | | 46.0 | | 45.8 | | L+3.60% | | L+4.06% | | 3.0 | | WY | | Hotel | | 67.4% | | 62.3% |
| Senior | | 08/21 | | 45.8 | | 45.4 | | 44.9 | | L+3.16% | | L+3.53% | | 3.0 | | TX | | Multifamily | | 77.8% | | 75.2% |
| Senior | | 08/18 | | 45.7 | | 44.9 | | 44.8 | | L+3.13% | | L+3.32% | | 3.0 | | TX | | Multifamily | | 68.9% | | 63.6% |
| Senior | | 09/21 | | 44.3 | | 37.4 | | 36.8 | | L+3.30% | | L+3.72% | | 3.0 | | CA | | Office | | 62.4% | | 66.1% |
| Senior | | 05/19 | | 44.1 | | 41.9 | | 41.5 | | L+3.20% | | L+3.60% | | 3.0 | | NY | | Mixed-Use | | 59.7% | | 55.1% |
| Senior | | 12/17 | | 42.9 | | 39.9 | | 39.9 | | L+4.38% | | L+5.26% | | 3.0 | | MA | | Mixed-Use | | 72.9% | | 62.0% |
| Senior | | 08/17 | | 41.9 | | 41.9 | | 41.5 | | L+4.24% | | L+4.40% | | 3.0 | | KY | | Multifamily | | 79.8% | | 73.1% |
| Senior | | 05/21 | | 38.9 | | 24.2 | | 23.7 | | L+3.28% | | L+3.83% | | 3.0 | | AL | | Multifamily | | 72.2% | | 64.8% |
| Senior | | 05/18 | | 38.8 | | 34.8 | | 34.7 | | L+3.18% | | L+3.95% | | 3.0 | | MA | | Office | | 47.0% | | 41.1% |
| Senior | | 07/19 | | 38.2 | | 36.2 | | 36.0 | | L+3.70% | | L+4.43% | | 3.0 | | NJ | | Hotel | | 47.8% | | 54.6% |
| Senior | | 11/18 | | 37.1 | | 34.4 | | 34.4 | | L+3.60% | | L+5.50% | | 3.0 | | CA | | Mixed-Use | | 69.9% | | 67.9% |
| Senior | | 10/18 | | 36.8 | | 30.3 | | 30.3 | | L+2.85% | | L+3.45% | | 3.0 | | NY | | Industrial | | 71.2% | | 70.8% |
| Senior | | 03/20 | | 34.9 | | 14.4 | | 14.2 | | L+3.42% | | L+4.66% | | 3.0 | | GA | | Office | | 63.2% | | 64.6% |
| | | | | | | | | | | | | | | | | | | | | | | | | | | | | | | | | | | | | | | | | | | | | | | | | | | | | | | | | | | | | | | | | | | | |
| Senior | | 05/17 | | 34.8 | | 31.1 | | 31.1 | | L+5.35% | | L+5.97% | | 3.0 | | TX | | Office | | 68.7% | | 65.1% |
| Senior | | 10/19 | | 34.4 | | 24.9 | | 24.8 | | L+2.75% | | L+3.28% | | 3.0 | | CA | | Office | | 70.6% | | 67.8% |
| Senior | | 12/18 | | 34.2 | | 30.8 | | 29.1 | | L+2.92% | | L+3.27% | | 4.0 | | IL | | Multifamily | | 70.8% | | 62.1% |
| Senior | | 05/17 | | 33.8 | | 29.8 | | 29.7 | | L+4.40% | | L+5.36% | | 3.0 | | AZ | | Office | | 69.5% | | 59.0% |
| Senior | | 10/19 | | 33.7 | | 26.0 | | 25.9 | | L+3.15% | | L+3.75% | | 3.0 | | CA | | Office | | 70.6% | | 64.2% |
| Senior | | 03/16 | | 33.6 | | 33.6 | | 33.4 | | 5.11% | | 5.26% | | 10.0 | | NJ | | Office | | 74.9% | | 74.9% |
| Senior | | 03/20 | | 33.5 | | 27.3 | | 27.0 | | L+2.80% | | L+3.27% | | 3.0 | | CA | | Office | | 63.6% | | 66.7% |
| Senior | | 08/19 | | 33.5 | | 28.4 | | 28.2 | | L+2.90% | | L+3.38% | | 3.0 | | TX | | Multifamily | | 79.3% | | 72.5% |
| Senior | | 06/18 | | 33.4 | | 28.7 | | 28.5 | | L+4.07% | | L+4.75% | | 3.0 | | OH | | Hotel | | 70.6% | | 57.4% |
| Senior | | 11/19 | | 33.2 | | 31.8 | | 31.6 | | L+2.70% | | L+3.14% | | 3.0 | | NC | | Multifamily | | 80.0% | | 72.8% |
| Senior | | 03/19 | | 32.1 | | 27.9 | | 27.8 | | L+2.97% | | L+3.42% | | 3.0 | | NY | | Office | | 53.8% | | 48.5% |
| Senior | | 08/19 | | 32.0 | | 20.1 | | 20.0 | | L+3.32% | | L+5.27% | | 3.0 | | MA | | Office | | 76.5% | | 54.1% |
| Senior | | 08/19 | | 31.7 | | 31.2 | | 31.0 | | L+2.80% | | L+3.53% | | 3.0 | | LA | | Multifamily | | 74.1% | | 72.4% |
| Senior | | 11/19 | | 31.3 | | 31.1 | | 31.1 | | L+2.75% | | L+3.27% | | 2.0 | | IL | | Multifamily | | 72.7% | | 72.7% |
| Senior | | 05/18 | | 31.0 | | 30.5 | | 30.4 | | L+4.07% | | L+4.63% | | 3.0 | | NY | | Mixed-Use | | 57.0% | | 51.1% |
| Senior | | 05/17 | | 30.9 | | 29.4 | | 29.0 | | L+4.00% | | L+5.19% | | 4.0 | | FL | | Office | | 69.3% | | 68.5% |
| Senior | | 06/21 | | 30.5 | | 29.6 | | 29.1 | | L+3.22% | | L+3.58% | | 3.0 | | GA | | Multifamily | | 73.0% | | 65.8% |
| Senior | | 11/19 | | 27.7 | | 18.5 | | 18.3 | | L+3.18% | | L+3.64% | | 3.0 | | CA | | Office | | 61.7% | | 62.8% |
| Senior | | 01/19 | | 27.5 | | 26.9 | | 26.8 | | L+2.97% | | L+3.38% | | 3.0 | | TX | | Multifamily | | 64.9% | | 64.9% |
| Senior | | 12/18 | | 27.5 | | 27.5 | | 26.0 | | L+3.90% | | L+4.42% | | 3.0 | | MN | | Hotel | | 64.7% | | 57.7% |
| Senior | | 07/17 | | 27.3 | | 27.3 | | 27.1 | | L+4.10% | | L+4.58% | | 3.0 | | NY | | Multifamily | | 76.5% | | 76.5% |
| Senior | | 01/19 | | 27.0 | | 24.4 | | 24.3 | | L+2.90% | | L+3.44% | | 3.0 | | MA | | Office | | 71.2% | | 70.1% |
| Senior | | 06/17 | | 27.0 | | 24.0 | | 24.0 | | L+3.83% | | L+5.24% | | 3.0 | | CA | | Hotel | | 54.7% | | 48.6% |
| Senior | | 08/19 | | 26.8 | | 26.3 | | 26.0 | | L+3.15% | | L+3.67% | | 3.0 | | SC | | Multifamily | | 67.0% | | 58.7% |
| Senior | | 12/18 | | 26.1 | | 22.5 | | 22.4 | | L+2.95% | | L+3.43% | | 3.0 | | FL | | Office | | 61.9% | | 65.5% |
| Senior | | 01/18 | | 26.0 | | 26.0 | | 25.9 | | L+5.13% | | L+5.58% | | 3.0 | | AZ | | Hotel | | 65.8% | | 61.3% |
| Senior | | 12/18 | | 25.9 | | 23.5 | | 23.5 | | L+4.00% | | L+5.56% | | 3.0 | | PA | | Multifamily | | 70.1% | | 67.0% |
| Senior | | 10/15 | | 25.3 | | 25.3 | | 25.1 | | L+4.07% | | L+5.76% | | 3.0 | | MO | | Hotel | | 73.2% | | 57.8% |
| Senior | | 09/18 | | 25.1 | | 22.0 | | 21.4 | | L+3.87% | | L+4.42% | | 3.0 | | NY | | Mixed-Use | | 60.2% | | 59.3% |
| Senior | | 08/19 | | 25.0 | | 23.9 | | 23.7 | | L+2.66% | | L+3.07% | | 2.0 | | OK | | Multifamily | | 79.9% | | 74.2% |
| Senior | | 09/17 | | 24.8 | | 21.8 | | 21.6 | | L+4.90% | | L+5.52% | | 3.0 | | MA | | Hotel | | 67.3% | | 63.9% |
| Senior | | 09/21 | | 24.4 | | 22.5 | | 22.1 | | L+3.18% | | L+3.61% | | 3.0 | | CA | | Multifamily | | 71.9% | | 57.8% |
| Senior | | 07/19 | | 24.0 | | 19.0 | | 18.9 | | L+3.00% | | L+3.60% | | 3.0 | | OH | | Office | | 63.1% | | 66.1% |
| Senior | | 10/18 | | 23.7 | | 23.5 | | 23.3 | | L+4.21% | | L+5.16% | | 3.0 | | CT | | Hotel | | 75.4% | | 66.9% |
| Senior | | 05/21 | | 23.3 | | 14.8 | | 14.6 | | L+3.50% | | L+4.09% | | 3.0 | | LA | | Multifamily | | 68.0% | | 69.6% |
| Senior | | 07/19 | | 23.3 | | 20.0 | | 19.9 | | L+2.95% | | L+3.51% | | 3.0 | | CA | | Office | | 62.3% | | 62.6% |
| Senior | | 03/18 | | 23.0 | | 23.0 | | 23.0 | | L+4.05% | | L+4.65% | | 2.0 | | FL | | Office | | 60.8% | | 60.8% |
| Senior | | 06/18 | | 22.8 | | 17.6 | | 17.3 | | L+4.21% | | L+4.73% | | 3.0 | | FL | | Retail | | 74.0% | | 69.4% |
| Senior | | 04/18 | | 22.2 | | 22.2 | | 22.2 | | L+4.05% | | L+4.46% | | 3.0 | | KS | | Multifamily | | 72.1% | | 67.4% |
| Senior | | 06/19 | | 21.5 | | 21.5 | | 21.4 | | L+4.50% | | L+5.05% | | 3.0 | | NY | | Other | | 39.6% | | 39.6% |
| Senior | | 10/18 | | 21.5 | | 19.3 | | 19.0 | | L+3.24% | | L+3.69% | | 3.0 | | TX | | Office | | 73.0% | | 69.9% |
| Senior | | 07/21 | | 21.4 | | 18.9 | | 18.6 | | L+3.25% | | L+3.63% | | 3.0 | | GA | | Multifamily | | 77.0% | | 68.7% |
| Senior | | 03/19 | | 21.1 | | 20.8 | | 20.6 | | L+2.93% | | L+3.40% | | 3.0 | | KY | | Multifamily | | 69.8% | | 69.9% |
| Senior | | 06/19 | | 21.0 | | 19.9 | | 19.8 | | L+2.90% | | L+4.24% | | 3.0 | | GA | | Mixed-Use | | 60.6% | | 67.4% |
| Senior | | 04/21 | | 21.0 | | 19.8 | | 19.5 | | L+3.24% | | L+3.56% | | 3.0 | | NJ | | Multifamily | | 77.5% | | 74.2% |
| Senior | | 05/21 | | 20.6 | | 15.9 | | 15.8 | | L+3.99% | | L+4.41% | | 3.0 | | FL | | Multifamily | | 69.8% | | 62.8% |
| Senior | | 01/18 | | 19.3 | | 17.6 | | 17.6 | | L+4.77% | | L+5.50% | | 3.0 | | PA | | Mixed-Use | | 66.8% | | 67.3% |
| Senior | | 11/18 | | 18.9 | | 16.5 | | 16.4 | | L+3.20% | | L+3.83% | | 3.0 | | CA | | Office | | 73.1% | | 64.5% |
| Senior | | 04/18 | | 18.7 | | 18.7 | | 18.7 | | L+4.29% | | L+4.65% | | 3.0 | | NV | | Multifamily | | 78.7% | | 66.1% |
| Senior | | 01/19 | | 18.2 | | 18.2 | | 18.2 | | L+3.40% | | L+4.14% | | 3.0 | | TX | | Multifamily | | 72.2% | | 68.2% |
| Senior | | 08/17 | | 17.5 | | 14.5 | | 14.4 | | L+4.77% | | L+5.49% | | 3.0 | | PA | | Office | | 66.7% | | 67.3% |
| Senior | | 06/21 | | 16.7 | | 13.5 | | 13.2 | | L+3.35% | | L+3.82% | | 4.0 | | IN | | Multifamily | | 67.0% | | 66.4% |
| Senior | | 07/18 | | 16.0 | | 11.5 | | 11.4 | | L+3.75% | | L+4.35% | | 3.0 | | CA | | Office | | 77.1% | | 63.5% |
| Senior | | 06/19 | | 15.2 | | 11.6 | | 11.5 | | L+3.96% | | L+4.69% | | 3.0 | | NY | | Office | | 40.7% | | 60.0% |
| Senior | | 08/21 | | 14.5 | | 14.0 | | 13.9 | | L+3.65% | | L+3.88% | | 3.0 | | CO | | Office | | 72.0% | | 63.7% |
| Mezzanine | | 01/17 | | 14.0 | | 14.0 | | 10.8 | | 8.00% | | 8.11% | | 10.0 | | HI | | Hotel | | 41.4% | | 36.2% |
| Senior | | 09/19 | | 12.0 | | 11.8 | | 11.7 | | L+2.99% | | L+3.50% | | 3.0 | | WI | | Multifamily | | 51.4% | | 75.0% |
| Mezzanine | | 11/15 | | 1.4 | | 1.4 | | — | | 13.00% | | 12.50% | | 10.0 | | NY | | Hotel | | 68.3% | | 58.0% |
| Total/Weighted Average | | $4,103.0 | | $3,672.9 | | $3,614.2 | | L+3.48% | | L+4.11% | | 3.1 | | | | | | 66.0% | | 63.3% |
| | | | | | | | | | | | | | | | | | | | | | | | | | | | | | | | | | | | | | | | | | | | | | | | | | | | | | | | | | | | | | | | | | | | |
| (dollars in millions) | | | | | | | | | | | | | | | | | | | | |
Type (1) | | Origination/ Acquisition Date | | Maximum Loan Commitment | | Principal Balance | | Carrying Value | | Cash Coupon (2) | | All-in Yield at Origination (3) | | Original Term (Years) (4) | | State | | Property Type | | Initial LTV (5) | | Stabilized LTV (6) |
| Senior | | 12/15 | | $120.0 | | $120.0 | | $117.6 | | L+4.15% | | L+4.43% | | 4.0 | | LA | | Mixed-Use | | 65.5% | | 60.0% |
| Senior | | 10/19 | | 120.0 | | 93.8 | | 89.3 | | L+3.24% | | L+3.86% | | 3.0 | | CA | | Office | | 63.9% | | 61.1% |
| Senior | | 07/18 | | 114.1 | | 114.1 | | 99.5 | | L+3.34% | | L+4.27% | | 2.0 | | CA | | Retail | | 50.7% | | 55.9% |
| Senior | | 12/19 | | 111.1 | | 102.4 | | 101.1 | | L+2.75% | | L+3.23% | | 3.0 | | IL | | Multifamily | | 76.5% | | 73.0% |
| Senior | | 08/19 | | 100.3 | | 92.7 | | 91.1 | | L+2.80% | | L+3.26% | | 3.0 | | MN | | Office | | 73.1% | | 71.2% |
| Senior | | 12/18 | | 96.5 | | 84.3 | | 82.3 | | L+3.75% | | L+5.21% | | 3.0 | | NY | | Mixed-Use | | 26.2% | | 47.6% |
| Senior | | 07/19 | | 94.0 | | 83.2 | | 82.9 | | L+3.69% | | L+4.32% | | 3.0 | | IL | | Office | | 70.0% | | 64.4% |
| Senior | | 10/19 | | 87.9 | | 86.5 | | 86.2 | | L+2.55% | | L+3.05% | | 3.0 | | TN | | Office | | 70.2% | | 74.2% |
| Senior | | 01/20 | | 81.9 | | 69.0 | | 68.7 | | L+3.25% | | L+3.93% | | 3.0 | | CO | | Industrial | | 47.2% | | 47.5% |
| Senior | | 06/19 | | 81.7 | | 81.4 | | 80.6 | | L+2.69% | | L+3.05% | | 3.0 | | TX | | Mixed-Use | | 71.7% | | 72.2% |
| Senior | | 10/19 | | 76.8 | | 76.8 | | 75.8 | | L+3.36% | | L+3.73% | | 3.0 | | FL | | Mixed-Use | | 67.7% | | 62.9% |
| Senior | | 12/16 | | 71.8 | | 68.6 | | 68.2 | | S+4.65% | | S+4.87% | | 4.0 | | FL | | Office | | 73.3% | | 63.2% |
| Senior | | 11/17 | | 65.7 | | 65.7 | | 64.7 | | L+4.45% | | L+5.20% | | 3.0 | | TX | | Hotel | | 68.2% | | 61.6% |
| Senior | | 12/19 | | 65.2 | | 57.9 | | 57.5 | | L+2.80% | | L+3.28% | | 3.0 | | NY | | Office | | 68.8% | | 59.3% |
| Senior | | 07/21 | | 63.3 | | 60.9 | | 60.4 | | L+3.00% | | L+3.39% | | 3.0 | | LA | | Multifamily | | 68.8% | | 68.6% |
| Senior | | 09/19 | | 60.2 | | 60.2 | | 60.2 | | L+3.00% | | L+3.63% | | 2.0 | | TX | | Office | | 64.7% | | 59.0% |
| Senior | | 12/18 | | 60.1 | | 58.0 | | 57.8 | | L+2.90% | | L+3.44% | | 3.0 | | TX | | Office | | 68.5% | | 66.7% |
| Senior | | 10/21 | | 55.5 | | 51.4 | | 50.3 | | L+3.15% | | L+3.42% | | 3.0 | | CO | | Multifamily | | 78.2% | | 74.7% |
| Senior | | 05/22 | | 55.5 | | 38.2 | | 37.5 | | S+3.29% | | S+3.70% | | 3.0 | | TX | | Multifamily | | 59.3% | | 62.9% |
| Senior | | 05/19 | | 55.4 | | 49.4 | | 49.2 | | L+3.20% | | L+3.60% | | 3.0 | | NY | | Mixed-Use | | 59.7% | | 55.1% |
| Senior | | 06/19 | | 54.1 | | 51.6 | | 51.5 | | L+3.30% | | L+3.70% | | 3.0 | | VA | | Office | | 49.3% | | 49.9% |
| Senior | | 11/21 | | 52.8 | | 46.6 | | 45.9 | | L+3.40% | | L+3.82% | | 3.0 | | PA | | Mixed-Use | | 62.0% | | 63.5% |
| Senior | | 06/21 | | 52.7 | | 46.7 | | 45.8 | | L+4.32% | | L+4.75% | | 3.0 | | GA | | Office | | 68.0% | | 69.4% |
| Senior | | 09/21 | | 51.7 | | 48.7 | | 47.9 | | L+5.00% | | L+5.12% | | 3.0 | | MN | | Hotel | | 68.4% | | 57.8% |
| Senior | | 02/20 | | 50.2 | | 45.8 | | 45.0 | | L+3.30% | | L+3.75% | | 3.0 | | TN | | Hotel | | 69.1% | | 54.2% |
| Senior | | 09/18 | | 50.1 | | 35.9 | | 35.7 | | L+3.25% | | L+4.13% | | 3.0 | | IL | | Office | | 47.9% | | 56.1% |
| Senior | | 03/22 | | 49.9 | | 46.9 | | 46.1 | | S+3.25% | | S+3.64% | | 3.0 | | MA | | Industrial | | 67.3% | | 60.8% |
| Senior | | 08/19 | | 48.2 | | 44.6 | | 43.5 | | L+3.70% | | L+3.39% | | 3.0 | | GA | | Office | | 69.5% | | 68.3% |
| Senior | | 12/15 | | 47.5 | | 47.5 | | 47.4 | | L+4.50% | | L+4.87% | | 4.0 | | PA | | Office | | 74.5% | | 67.5% |
| Senior | | 07/21 | | 46.4 | | 45.4 | | 45.0 | | L+3.69% | | L+4.19% | | 3.0 | | CT | | Office | | 68.3% | | 63.5% |
| Senior | | 04/22 | | 46.2 | | 43.0 | | 42.2 | | S+3.41% | | S+3.78% | | 3.0 | | TX | | Multifamily | | 74.4% | | 64.0% |
| Senior | | 06/18 | | 46.0 | | 46.0 | | 46.0 | | L+3.60% | | L+4.06% | | 3.0 | | WY | | Hotel | | 67.4% | | 62.3% |
| Senior | | 08/21 | | 45.8 | | 45.4 | | 45.0 | | L+3.16% | | L+3.53% | | 3.0 | | TX | | Multifamily | | 77.8% | | 75.2% |
| Senior | | 08/18 | | 45.7 | | 45.7 | | 45.7 | | L+3.33% | | L+3.32% | | 3.0 | | TX | | Multifamily | | 68.9% | | 63.6% |
| Senior | | 09/21 | | 44.3 | | 38.7 | | 38.2 | | L+3.30% | | L+3.72% | | 3.0 | | CA | | Office | | 62.4% | | 66.1% |
| Senior | | 08/17 | | 43.5 | | 43.5 | | 40.7 | | L+4.24% | | L+4.40% | | 3.0 | | KY | | Multifamily | | 79.8% | | 73.1% |
| Senior | | 02/22 | | 42.4 | | 42.4 | | 41.7 | | S+3.05% | | S+3.40% | | 3.0 | | NJ | | Industrial | | 75.0% | | 59.5% |
| Senior | | 12/17 | | 40.9 | | 38.5 | | 38.4 | | L+4.38% | | L+5.26% | | 3.0 | | MA | | Mixed-Use | | 72.9% | | 62.0% |
| Senior | | 07/16 | | 40.5 | | 40.5 | | 40.5 | | L+2.93% | | L+4.99% | | 4.0 | | VA | | Office | | 62.8% | | 61.5% |
| Senior | | 04/22 | | 40.2 | | 36.3 | | 35.9 | | S+4.65% | | S+4.87% | | 3.0 | | NY | | Other | | 66.7% | | 61.8% |
| Senior | | 05/21 | | 38.9 | | 26.6 | | 25.3 | | L+3.28% | | L+3.83% | | 3.0 | | AL | | Multifamily | | 72.2% | | 64.8% |
| Senior | | 05/18 | | 38.8 | | 34.8 | | 34.7 | | L+3.18% | | L+3.95% | | 3.0 | | MA | | Office | | 47.0% | | 41.1% |
| Senior | | 11/18 | | 37.1 | | 36.9 | | 36.8 | | L+3.60% | | L+5.50% | | 3.0 | | CA | | Mixed-Use | | 69.9% | | 67.9% |
| Senior | | 11/19 | | 36.5 | | 33.7 | | 33.4 | | L+3.28% | | L+3.14% | | 3.0 | | NC | | Multifamily | | 80.0% | | 72.8% |
| Senior | | 07/19 | | 36.2 | | 36.2 | | 36.1 | | L+3.70% | | L+4.43% | | 3.0 | | NJ | | Hotel | | 47.8% | | 54.6% |
| Senior | | 03/20 | | 34.9 | | 19.0 | | 18.3 | | L+3.42% | | L+4.66% | | 3.0 | | GA | | Office | | 63.2% | | 64.6% |
| Senior | | 05/17 | | 34.8 | | 31.4 | | 31.1 | | L+5.35% | | L+5.97% | | 3.0 | | TX | | Office | | 68.7% | | 65.1% |
| Senior | | 10/19 | | 34.4 | | 25.3 | | 25.3 | | L+2.75% | | L+3.28% | | 3.0 | | CA | | Office | | 70.6% | | 67.8% |
| Senior | | 12/18 | | 34.2 | | 32.9 | | 32.2 | | L+2.92% | | L+3.27% | | 4.0 | | IL | | Multifamily | | 70.8% | | 62.1% |
| Senior | | 05/17 | | 33.8 | | 29.8 | | 29.7 | | S+4.51% | | S+5.36% | | 3.0 | | AZ | | Office | | 69.5% | | 59.0% |
| Senior | | 10/19 | | 33.7 | | 26.1 | | 26.1 | | L+3.15% | | L+3.75% | | 3.0 | | CA | | Office | | 70.6% | | 64.2% |
| Senior | | 08/19 | | 33.5 | | 29.3 | | 29.2 | | L+2.90% | | L+3.38% | | 3.0 | | TX | | Multifamily | | 79.3% | | 72.5% |
| Senior | | 11/21 | | 33.4 | | 28.6 | | 27.8 | | L+3.18% | | L+3.52% | | 3.0 | | AL | | Multifamily | | 77.9% | | 68.1% |
| Senior | | 03/16 | | 33.2 | | 33.2 | | 33.1 | | 5.11% | | 5.26% | | 10.0 | | NJ | | Office | | 74.9% | | 74.9% |
| Senior | | 10/21 | | 32.2 | | 32.2 | | 32.0 | | L+3.15% | | L+3.43% | | 3.0 | | AR | | Multifamily | | 63.1% | | 63.1% |
| Senior | | 03/19 | | 32.1 | | 28.6 | | 28.5 | | L+2.97% | | L+3.42% | | 3.0 | | NY | | Office | | 53.8% | | 48.5% |
| Senior | | 08/19 | | 32.0 | | 29.9 | | 29.9 | | L+3.32% | | L+5.27% | | 3.0 | | MA | | Office | | 76.5% | | 54.1% |
| Senior | | 06/18 | | 32.0 | | 27.3 | | 27.2 | | L+4.07% | | L+4.75% | | 3.0 | | OH | | Hotel | | 70.6% | | 57.4% |
| | | | | | | | | | | | | | | | | | | | | | | | | | | | | | | | | | | | | | | | | | | | | | | | | | | | | | | | | | | | | | | | | | | | |
| Senior | | 04/22 | | 31.7 | | 26.5 | | 26.1 | | S+3.35% | | S+3.73% | | 3.0 | | GA | | Multifamily | | 75.1% | | 67.1% |
| Senior | | 11/19 | | 31.1 | | 31.1 | | 31.1 | | L+2.75% | | L+3.27% | | 2.0 | | IL | | Multifamily | | 72.7% | | 72.7% |
| Senior | | 05/18 | | 29.4 | | 29.4 | | 28.6 | | S+5.00% | | S+4.63% | | 3.0 | | NY | | Mixed-Use | | 57.0% | | 51.1% |
| Senior | | 05/17 | | 29.0 | | 27.8 | | 27.7 | | L+4.50% | | L+5.19% | | 4.0 | | FL | | Office | | 69.3% | | 68.5% |
| Senior | | 04/22 | | 28.5 | | 25.7 | | 25.3 | | S+3.22% | | S+3.55% | | 3.0 | | TX | | Multifamily | | 73.3% | | 63.9% |
| Senior | | 03/20 | | 28.0 | | 23.0 | | 22.9 | | L+2.80% | | L+3.27% | | 3.0 | | CA | | Office | | 63.6% | | 66.7% |
| Senior | | 11/19 | | 27.7 | | 20.3 | | 20.3 | | L+3.18% | | L+3.64% | | 3.0 | | CA | | Office | | 61.7% | | 62.8% |
| Senior | | 01/19 | | 27.6 | | 26.9 | | 26.8 | | L+2.97% | | L+3.38% | | 3.0 | | TX | | Multifamily | | 64.9% | | 64.9% |
| Senior | | 12/18 | | 27.5 | | 27.5 | | 27.2 | | L+3.90% | | L+4.42% | | 3.0 | | MN | | Hotel | | 64.7% | | 57.7% |
| Senior | | 07/17 | | 27.3 | | 27.3 | | 27.2 | | L+4.10% | | L+4.58% | | 3.0 | | NY | | Multifamily | | 76.5% | | 76.5% |
| Senior | | 03/22 | | 27.2 | | 22.9 | | 22.3 | | S+4.14% | | S+4.89% | | 3.0 | | NC | | Office | | 47.4% | | 53.5% |
| Senior | | 06/17 | | 27.0 | | 24.0 | | 24.0 | | L+3.83% | | L+5.24% | | 3.0 | | CA | | Hotel | | 54.7% | | 48.6% |
| Senior | | 01/19 | | 27.0 | | 24.6 | | 24.5 | | L+3.15% | | L+3.44% | | 3.0 | | MA | | Office | | 71.2% | | 70.1% |
| Senior | | 08/19 | | 26.8 | | 26.3 | | 26.1 | | L+3.15% | | L+3.67% | | 3.0 | | SC | | Multifamily | | 67.0% | | 58.7% |
| Senior | | 01/18 | | 26.0 | | 26.0 | | 25.9 | | L+5.13% | | L+5.58% | | 3.0 | | AZ | | Hotel | | 65.8% | | 61.3% |
| Senior | | 12/18 | | 25.9 | | 24.6 | | 24.1 | | L+4.00% | | L+5.56% | | 3.0 | | PA | | Multifamily | | 70.1% | | 67.0% |
| Senior | | 10/21 | | 25.7 | | 25.7 | | 25.3 | | L+3.15% | | L+3.43% | | 4.0 | | GA | | Industrial | | 67.5% | | 64.5% |
| Senior | | 09/18 | | 25.1 | | 22.0 | | 21.9 | | L+3.87% | | L+4.42% | | 3.0 | | NY | | Mixed-Use | | 60.2% | | 59.3% |
| Senior | | 08/19 | | 25.0 | | 23.9 | | 23.8 | | L+2.66% | | L+3.07% | | 2.0 | | OK | | Multifamily | | 79.9% | | 74.2% |
| Senior | | 12/21 | | 24.7 | | 16.7 | | 16.5 | | L+3.30% | | L+3.59% | | 3.0 | | CA | | Office | | 72.9% | | 68.3% |
| Senior | | 09/21 | | 24.4 | | 22.5 | | 22.3 | | L+3.18% | | L+3.61% | | 3.0 | | CA | | Multifamily | | 71.9% | | 57.8% |
| Senior | | 09/17 | | 24.4 | | 21.4 | | 21.3 | | L+4.90% | | L+5.52% | | 3.0 | | MA | | Hotel | | 67.3% | | 63.9% |
| Senior | | 12/21 | | 24.4 | | 20.4 | | 20.3 | | L+3.86% | | L+4.16% | | 3.0 | | Various | | Other | | 55.1% | | 64.3% |
| Senior | | 07/19 | | 24.0 | | 20.9 | | 20.8 | | L+3.00% | | L+3.60% | | 3.0 | | OH | | Office | | 63.1% | | 66.1% |
| Senior | | 10/15 | | 23.8 | | 23.8 | | 23.2 | | L+4.07% | | L+5.76% | | 3.0 | | MO | | Hotel | | 73.2% | | 57.8% |
| Senior | | 05/21 | | 23.3 | | 16.9 | | 16.7 | | L+3.50% | | L+4.09% | | 3.0 | | LA | | Multifamily | | 68.0% | | 69.6% |
| Senior | | 02/22 | | 22.9 | | 19.4 | | 19.2 | | S+3.90% | | S+4.29% | | 3.0 | | CO | | Office | | 64.4% | | 60.2% |
| Senior | | 06/18 | | 22.8 | | 18.4 | | 18.3 | | L+4.21% | | L+4.73% | | 3.0 | | FL | | Retail | | 74.0% | | 69.4% |
| Senior | | 04/18 | | 22.2 | | 22.2 | | 22.1 | | L+4.05% | | L+4.46% | | 3.0 | | KS | | Multifamily | | 72.1% | | 67.4% |
| Senior | | 06/19 | | 21.5 | | 21.5 | | 21.4 | | L+4.50% | | L+5.05% | | 3.0 | | NY | | Other | | 39.6% | | 39.6% |
| Senior | | 07/21 | | 21.4 | | 21.4 | | 21.1 | | L+3.25% | | L+3.63% | | 3.0 | | GA | | Multifamily | | 77.0% | | 68.7% |
| Senior | | 10/18 | | 21.4 | | 21.2 | | 20.9 | | L+4.21% | | L+5.16% | | 3.0 | | CT | | Hotel | | 75.4% | | 66.9% |
| Senior | | 03/19 | | 21.1 | | 20.8 | | 20.7 | | L+2.93% | | L+3.40% | | 3.0 | | KY | | Multifamily | | 69.8% | | 69.9% |
| Senior | | 06/19 | | 21.0 | | 19.9 | | 19.9 | | L+2.90% | | L+4.24% | | 3.0 | | GA | | Mixed-Use | | 60.6% | | 67.4% |
| Senior | | 05/21 | | 20.6 | | 18.5 | | 18.3 | | L+3.99% | | L+4.41% | | 3.0 | | FL | | Multifamily | | 69.8% | | 62.8% |
| Senior | | 01/18 | | 19.3 | | 17.6 | | 17.6 | | L+4.77% | | L+5.50% | | 3.0 | | PA | | Mixed-Use | | 66.8% | | 67.3% |
| Senior | | 10/18 | | 19.2 | | 17.0 | | 17.0 | | L+3.24% | | L+3.69% | | 3.0 | | TX | | Office | | 73.0% | | 69.9% |
| Senior | | 11/18 | | 19.0 | | 16.7 | | 16.6 | | L+3.20% | | L+3.83% | | 3.0 | | CA | | Office | | 73.1% | | 64.5% |
| Senior | | 08/17 | | 17.5 | | 14.5 | | 14.4 | | L+4.77% | | L+5.49% | | 3.0 | | PA | | Office | | 66.7% | | 67.3% |
| Senior | | 06/21 | | 16.7 | | 13.5 | | 13.3 | | L+3.35% | | L+3.82% | | 4.0 | | IN | | Multifamily | | 67.0% | | 66.4% |
| Senior | | 07/18 | | 15.4 | | 11.1 | | 11.0 | | L+3.75% | | L+4.35% | | 3.0 | | CA | | Office | | 77.1% | | 63.5% |
| Senior | | 06/19 | | 15.2 | | 11.6 | | 11.6 | | L+3.96% | | L+4.69% | | 3.0 | | NY | | Office | | 40.7% | | 60.0% |
| Senior | | 08/21 | | 14.4 | | 14.0 | | 13.9 | | L+3.65% | | L+3.88% | | 3.0 | | CO | | Office | | 72.0% | | 63.7% |
| Mezzanine | | 01/17 | | 13.9 | | 13.9 | | 13.1 | | 8.00% | | 8.11% | | 10.0 | | HI | | Hotel | | 41.4% | | 36.2% |
| Senior | | 09/19 | | 12.0 | | 11.8 | | 11.7 | | L+2.99% | | L+3.50% | | 3.0 | | WI | | Multifamily | | 51.4% | | 75.0% |
| Mezzanine | | 11/15 | | 0.4 | | 0.4 | | — | | 13.00% | | 12.50% | | 10.0 | | NY | | Hotel | | 68.3% | | 58.0% |
| | | | | | | | | | | | | | | | | | | | | | |
| | | | | | | | | | | | | | | | | | | | | | |
| Total/Weighted Average | | $4,248.2 | | $3,889.5 | | $3,830.0 | | L+/S+3.51% | | L+/S+4.07% | | 3.1 | | | | | | 66.1% | | 63.1% |
____________________
(1)“Senior” means a loan primarily secured by a first priority lien on commercial real property and related personal property and also includes, when applicable, any companion subordinate loans.
(2)Cash coupon does not include origination or exit fees. Weighted average cash coupon excludes fixed rate loans.
(3)Yield includes net origination fees and exit fees, but does not include future fundings, and is expressed as a monthly equivalent. Weighted average yield excludes fixed rate loans.
loans.
(4)Original term (years) is the initial maturity date at origination and does not include any extension options and has not been updated to reflect any subsequent extensions or modifications, if applicable.
(5)Initial loan-to-value ratio, or initial LTV, is calculated as the initial loan amount (plus any financing that is pari passu with or senior to such loan) divided by the as is appraised value (as determined in conformance with the Uniform Standards of Professional Appraisal Practice, or USPAP) as of the date of the loan was originated set forth in the original appraisal.
(6)Stabilized loan-to-value ratio, or stabilized LTV, is calculated as the fully funded loan amount (plus any financing that is pari passu with or senior to such loan), including all contractually provided for future fundings, divided by the as stabilized value (as determined in conformance with USPAP) set forth in the original appraisal. As stabilized value may be based on certain assumptions, such as future construction completion, projected re-tenanting, payment of tenant improvement or leasing commissions allowances or free or abated rent periods, or increased tenant occupancies.
Most of our loans are structured with an initial maturity term, typically three years, and one or more (typically two) one-year extension options, which can be exercised by the borrower subject to meeting various extension conditions in accordance with the terms of the loan agreement. As part of our overall asset management strategy, we have in the past entered into, and may in the future enter into, loan modifications with some of our borrowers. These amendments may include, among other things, modifying or waiving certain performance or extension conditions as part of the overall agreement.
The followingmap and charts below illustrate the diversificationgeographic distribution and composition of our portfolio based on types of properties securing our loan investments, geographic distribution, interest rate and investment type,portfolio as of SeptemberJune 30, 2021:2022:
Portfolio Management and Credit Quality
We actively manage each loan investment from closing and initial funding through final repayment and assess the risk of credit deterioration by quarterly evaluating the performance of the underlying collateral properties. We also evaluate the macroeconomic environment, prevailing real estate fundamentals and local property market dynamics. Typically, our loan documents allow us, among other things, to receive regular property, borrower and guarantor financial statements; approve
annual budgets and major tenant leases; and enforce loan covenants and remedies. In addition, we work with Trimont Real Estate Advisors LLC, one of the leading commercial real estate loan servicers, whowhich provides us with a fully-dedicated and experienced team to increase efficiency and leverage our internal resources in servicing and asset managing our loan investments. Our internal team retains authority on all asset management decisions.
We maintain strong relationships and an active asset management dialogue with our borrowers. We have utilized theseleveraged those strong relationships to addressminimize the negative impacts of the COVID-19 pandemic on our portfolio, particularly in respect of the properties securing loans secured by propertiesin our portfolio experiencing COVID-19-related business interruptions and pressure on operating cash flows, most significantly hotel and retail properties. As a result of the ongoing negative effects the pandemic has had on the economy,flows. While we generally the real estate market as a whole and specific properties, some of our borrowers have indicated to usbelieve that they will be unable to execute their business plans on the original timeline, have had to temporarily close their properties by order of local authorities, have had tenants whose businesses were closed, or have experienced adverse business consequences, and have requested temporary interest forbearance (mainly deferrals and, to a lesser extent, waivers), or other modifications of their loans including extensions of term and modifications or waivers of
certain extension conditions. We have been working closely with our borrowers to provide them with short-term relief to help manage through these market dislocations and business interruptions at their properties.
Our loan modifications typically include temporary reductions in the amount of cash interest collected, permit accrual of a portion of the interest due during the modification period to be repaid at a later date, permit the use of existing cash loan reserves to pay debt service due on our loans and other property-level expenses and/or modify or waive certain performance tests or covenants related to term extensions. Our loan modifications are often coupled with additional equity or other forms of credit support from the sponsors. The total amount of interest income that was deferred and added to the principal during the three months ended September 30, 2021 was $1.1 million as a result of loan modifications that were entered into prior to the three months ended September 30, 2021.
We are generally encouraged by our borrowers’ overall response to the impact of the COVID-19 pandemic on their properties. We continue to work with them to address the circumstances caused by the pandemic while seeking to protect the credit attributes of our portfolio. However, these efforts may not be successful in all cases, and we may experience payment delinquencies, defaults, foreclosures or losses. While we believe the principal amountsamount of our loans are generally adequatelyis sufficiently protected by the underlying value of the collateral properties,value, there is a risk that we will not realize the entire principal amount of certain of our loan investments.
In addition to ongoing asset management, we review our entire portfolio quarterly, assess the performance of each loan and assign it a risk rating on a scale between “1” and “5,” from least risk to greatest risk, respectively.See Note 3 - Loans Held-for-Investment, Net of Allowance for Credit Losses to our condensed consolidated financial statements included in this Quarterly Report on Form 10-Q for a discussion regarding ourthe risk rating methodology we use for our portfolio.
The following table allocates the unpaid principal balance and the carrying value balances based on our internal risk ratings:
| | (dollars in thousands) | (dollars in thousands) | | September 30,
2021 | | December 31,
2020 | (dollars in thousands) | | June 30,
2022 | | December 31,
2021 |
| Risk Rating | Risk Rating | | Number of Loans | | Unpaid Principal Balance | | Carrying Value | | Number of Loans | | Unpaid Principal Balance | | Carrying Value | Risk Rating | | Number of Loans | | Unpaid Principal Balance | | Carrying Value | | Number of Loans | | Unpaid Principal Balance | | Carrying Value |
| 1 | 1 | | 9 | | | $ | 281,201 | | | $ | 280,172 | | | 6 | | | $ | 183,369 | | | $ | 182,730 | | 1 | | 8 | | | $ | 292,285 | | | $ | 291,458 | | | 9 | | | $ | 245,939 | | | $ | 245,042 | |
| 2 | 2 | | 53 | | | 1,842,052 | | | 1,819,740 | | | 50 | | | 1,863,590 | | | 1,847,332 | | 2 | | 59 | | | 2,083,389 | | | 2,060,713 | | | 58 | | | 2,002,008 | | | 1,983,615 | |
| 3 | 3 | | 26 | | | 839,615 | | | 832,077 | | | 29 | | | 1,055,782 | | | 1,026,662 | | 3 | | 27 | | | 869,253 | | | 861,050 | | | 25 | | | 747,631 | | | 739,343 | |
| 4 | 4 | | 10 | | | 541,891 | | | 536,872 | | | 17 | | | 762,636 | | | 732,310 | | 4 | | 8 | | | 436,641 | | | 427,954 | | | 11 | | | 633,153 | | | 627,938 | |
| 5 | 5 | | 2 | | | 168,094 | | | 145,350 | | | 1 | | | 67,057 | | | 58,769 | | 5 | | 2 | | | 207,911 | | | 188,839 | | | 2 | | | 168,094 | | | 145,370 | |
| Total | Total | | 100 | | | $ | 3,672,853 | | | $ | 3,614,211 | | | 103 | | | $ | 3,932,434 | | | $ | 3,847,803 | | Total | | 104 | | | $ | 3,889,479 | | | $ | 3,830,014 | | | 105 | | | $ | 3,796,825 | | | $ | 3,741,308 | |
Other Portfolio Developments
During the three months ended SeptemberJune 30, 2021,2022, a first mortgage loan with a principal balance of $93.8 million collateralized by an office property located in San Diego, CA, was downgraded to a risk rating of “5” as a result of the collateral property’s operating performance being adversely affected by the ongoing office leasing market challenges related to the COVID-19 pandemic. We have determined that the recovery of the loan principal is collateral-dependent. Accordingly, this loan was assessed individually, and we have elected to apply a practical expedient in accordance with “Financial Instruments – Credit Losses - Measurement of Credit Losses on Financial Instruments (Topic 326),” or ASU 2016-13. At June 30, 2022, we recorded a decrease of $15.5 million in thean allowance for credit losses, which resulted inloss of $4.5 million on the overall CECL reserve of $47.4 million at September 30, 2021. The decrease in the allowance for credit losses reflects a write-off of a prior credit reserve related to a resolution of a collateral-dependent loan and the release of a $3.2 million credit reserve on unfunded commitments on a collateral-dependent asset and moderately improved expectations of macroeconomic conditions.
During the three months ended September 30, 2021, we resolved the nonaccrual status of a senior loan secured by a mixed-use office and retail property in New York City with an outstanding unpaid principal balance of $22.0 million. We received all interest that was previously due inthis loan based on our estimate of fair value using the amount of approximately $1.6 million and hadestimated proceeds available from the borrower establish and fund additional reserves for debt service and operating expenses. Given these facts and our expectations for the loan performing in accordance with the terms of the loan agreement, the loan was reinstated to accrual status.
During the three months ended September 30, 2021, we resolved a senior loan that had an outstanding unpaid principal balance of $68.1 million and had been nonaccrual status. The resolution involved a coordinatedborrower’s sale of the collateral property less the estimated cost to sell the property. Additionally, as of June 30, 2022, we placed this loan on nonaccrual status.
During 2021, we entered into a Minneapolis, MN hotel,loan modification related to a retail asset located in Pasadena, CA, which was classified as troubled debt restructuring under GAAP. This modification included, among other changes, a partial deferral of the loan’s contractual interest payments due to the collateral property’s cash flows and our providing the new ownership group with a new $45.3 million senior floating rate loan supported by capital invested in the propertyoperating performance being adversely affected by the new sponsor. Asongoing effects of the COVID-19 pandemic. This loan had also been previously modified. At June 30, 2022, this first mortgage loan had an outstanding principal balance of $114.1 million, and during the three and six months ended June 30, 2022, was maintained at a resultrisk rating of these transactions,“5”. We have determined that the recovery of the loan’s principal is collateral-dependent. Accordingly, this loan was assessed individually, and we realizedelected to apply a write-offpractical expedient in accordance with ASU 2016-13. At June 30, 2022, we recorded an allowance for credit loss of approximately $9.7 million.$14.1 million on this loan based on our estimate of fair value of the loan’s underlying collateral using the discounted cash flow method of valuation less the estimated cost to foreclose and sell the property. The estimation of the fair value of the collateral property also involved using various Level 3 inputs, which were in part developed based on discussions with various market participants and management’s best estimates as of the valuation date and required significant judgment. Additionally, during 2021, we placed this loan on nonaccrual status and reversed $0.3 million of interest income. This loan’s maturity date has passed without the loan being paid off. We are evaluating, and at any given time may be pursuing, a variety of potential options with respect to the resolution of this loan, which, among others, may include a foreclosure, negotiated deed-in-lieu of foreclosure, a sale of the underlying collateral property or a sale of the loan.
Portfolio Financing
As of SeptemberJune 30, 2021,2022, our portfolio financing consisted of repurchase facilities collateralized by loans held-for-investment, securitized debt obligations collateralized by pools of loans held-for-investment issued in commercial real estate collateralized loan obligations transactions, or CRE CLOs and an asset-specific financing facility collateralized by loans held-for-investment and a term financing facility collateralized by loans held-for-investment. Our non-mark-to-market financing sources accounted for approximately 62.5%53.6% of portfolio loan-level financing as of SeptemberJune 30, 2021.2022.
The following table details our portfolio loan-level financing as of SeptemberJune 30, 20212022, and December 31, 2020:2021:
| | (in thousands) | (in thousands) | September 30,
2021 | | December 31,
2020 | (in thousands) | June 30,
2022 | | December 31,
2021 |
| CRE CLOs | CRE CLOs | $ | 1,356,429 | | | $ | 927,128 | | CRE CLOs | $ | 1,425,556 | | | $ | 1,677,619 | |
| Term financing facility | Term financing facility | 127,867 | | | — | | Term financing facility | — | | | 127,145 | |
| Asset-specific financing facility | Asset-specific financing facility | 44,752 | | | 123,091 | | Asset-specific financing facility | 43,622 | | | 43,622 | |
| Total non-mark-to-market financing | Total non-mark-to-market financing | 1,529,048 | | | 1,050,219 | | Total non-mark-to-market financing | 1,469,178 | | | 1,848,386 | |
| Secured repurchase agreements | Secured repurchase agreements | 916,758 | | | 1,708,875 | | Secured repurchase agreements | 1,271,659 | | | 677,285 | |
| Total portfolio financing | Total portfolio financing | $ | 2,445,806 | | | $ | 2,759,094 | | Total portfolio financing | $ | 2,740,837 | | | $ | 2,525,671 | |
The following table summarizes assets at carrying values that served as collateral for the future payment obligations of the repurchase facilities, the asset-specific financing facility, the term financing facility and the CRE CLOs as of SeptemberJune 30, 20212022, and December 31, 2020:2021:
| | (in thousands) | (in thousands) | September 30,
2021 | | December 31,
2020 | (in thousands) | June 30,
2022 | | December 31,
2021 |
| Loans held-for-investment | Loans held-for-investment | $ | 3,501,513 | | | $ | 3,814,460 | | Loans held-for-investment | $ | 3,644,240 | | | $ | 3,681,089 | |
| | Restricted cash | | Restricted cash | 69,492 | | | 12,362 | |
| | Total | Total | $ | 3,501,513 | | | $ | 3,814,460 | | Total | $ | 3,713,732 | | | $ | 3,693,451 | |
Secured Repurchase Agreements
As of June 30, 2022, we had repurchase facilities in place with five counterparties (lenders) with aggregate outstanding borrowings of $1.3 billion, which financed a portion of our loans held-for-investment. As of June 30, 2022, the weighted average borrowing rate on our repurchase facilities was 3.7%, the weighted average advance rate was 70.4%, and the term to maturity ranged from 363 days to approximately 2.9 years, with a weighted average remaining maturity of 1.6 years.
Secured Repurchase Agreements
As of September 30, 2021, we had repurchase facilities in place with five counterparties (lenders) with aggregate outstanding borrowings of $0.9 billion, which financed a portion of our loans held-for-investment. As of September 30, 2021, the weighted average borrowing rate on our repurchase facilities was 2.0%, the weighted average advance rate was 66.7%, and the term to maturity ranged from 271 days to approximately 1.8 years, with a weighted average remaining maturities of 1.0 year.
The table below details our secured repurchase facilities as of SeptemberJune 30, 2021:2022:
| | | September 30, 2021 | | | June 30, 2022 | |
| (in thousands) | (in thousands) | Maturity Date (1) | | Committed | | Amount Outstanding | | Unused Capacity | | Total Capacity | | (in thousands) | Maturity Date (1) | | Committed | | Amount Outstanding | | Unused Capacity | | Total Capacity | |
| Repurchase facilities: | Repurchase facilities: | | | | | | | | | | | Repurchase facilities: | | | | | | | | | | |
Morgan Stanley Bank (2) | Morgan Stanley Bank (2) | June 28, 2022 | | No | | $ | 277,534 | | | $ | 222,466 | | | $ | 500,000 | | | Morgan Stanley Bank (2) | June 28, 2023 | | No | | $ | 581,440 | | | $ | 18,560 | | | $ | 600,000 | | |
Goldman Sachs Bank USA (3) | Goldman Sachs Bank USA (3) | July 13, 2023 | | No | | $ | — | | | $ | 250,000 | | | $ | 250,000 | | | Goldman Sachs Bank USA (3) | July 13, 2023 | | No | | $ | 127,725 | | | $ | 122,275 | | | $ | 250,000 | | |
JPMorgan Chase Bank | JPMorgan Chase Bank | June 28, 2022 | | No | | $ | 155,214 | | | $ | 294,786 | | | $ | 450,000 | | | JPMorgan Chase Bank | June 28, 2024 | | No | | $ | 177,228 | | | $ | 172,772 | | | $ | 350,000 | | |
Citibank | Citibank | January 9, 2023 | | No | | $ | 412,274 | | | $ | 87,726 | | | $ | 500,000 | | | Citibank | May 25, 2025 | | No | | $ | 285,266 | | | $ | 214,734 | | | $ | 500,000 | | |
Wells Fargo Bank (4)(6) | Wells Fargo Bank (4)(6) | June 28, 2022 | | No | | $ | 71,736 | | | $ | 28,264 | | | $ | 100,000 | | | Wells Fargo Bank (4)(6) | June 28, 2023 | | No | | $ | 100,000 | | | $ | — | | | $ | 100,000 | | |
|
(1)The facilities are set to mature on the stated maturity date, unless extended pursuant to their terms.
(2)As of SeptemberDuring the three months ended June 30, 2021, we retained an option2022, the Company extended the maturity date to increaseJune 28, 2023, and increased the maximum facilitytotal capacity amount up to $600 million, subject to customary terms and conditions.million.
(3)As of SeptemberJune 30, 2021, we2022, the Company retained an optionoptions to increase the maximum facility capacity amount up to $350 million, subject to customary terms and conditions.
(4)As of SeptemberDuring the three months ended June 30, 2021, we retained an option2022, the Company extended the maturity date to increaseJune 28, 2024, and decreased the maximum facilitytotal capacity amount up to $200 million, subject$350 million.
(5)During the three months ended June 30, 2022, the Company extended the maturity date to customary terms and conditions.May 25, 2025.
(6)During the three months ended June 30, 2022, the Company extended the maturity date to June 28, 2023.
Under our repurchase facilities, our counterparties may make margin calls because of a perceived decline in the value of our assets collateralizing the given secured financing arrangement due to a credit event or, under a limited number of our repurchase facilities, ordue to market events. To cover a margin call, we may transfer cash to such counterparty. At maturity, any cash on deposit as collateral is generally applied against the repurchase facility balance, thereby reducing the amount borrowed. Should the value of our assets suddenly decrease, significant margin calls on our repurchase facilities could result, causing an adverse change in our liquidity position.
Commercial Real Estate Collateralized Loan Obligations
We have financed certain pools of our loans through CRE CLOs. At SeptemberJune 30, 2021,2022, we had three CRE CLOs outstanding,outstanding: GPMT 2021-FL4, GPMT 2021-FL3 GPMT 2019-FL2 and GPMT 2018-FL1,2019-FL2, totaling $1.4 billion of outstanding borrowings, financing 55 of our existing first mortgage loan investments with an aggregate principal balance of $1.8$1.9 billion. On April 22, 2022, the Company redeemed the GPMT 2018-FL1 CRE CLO, which at its redemption had $103.6 million of outstanding borrowings. The CRE CLOs provide us with an attractive cost of funds and, finance 49.2%as of June 30, 2022, financed 46.0% of our total loan portfolio principal balance on a term-matched, non-recourse and non-mark-to-market basis.
The following table details our CRE CLO securitized debt obligations:
| | (in thousands) | September 30,
2021 | |
| (dollars in thousands) | | (dollars in thousands) | June 30,
2022 |
| Securitized Debt Obligations | Securitized Debt Obligations | | Principal Balance | | Carrying Value | | Wtd. Avg. Yield/Cost (1) | Securitized Debt Obligations | | Principal Balance | | Carrying Value | | Wtd. Avg. Yield/Cost (1) |
| GPMT 2021-FL4 CRE CLO | | GPMT 2021-FL4 CRE CLO | | | | | | |
Collateral assets (2) | | Collateral assets (2) | | $ | 621,440 | | | $ | 613,325 | | | L+ 3.7% |
| Financing provided | | Financing provided | | 502,564 | | | 498,677 | | | L+ 1.7% |
| GPMT 2021-FL3 CRE CLO | GPMT 2021-FL3 CRE CLO | | | | | | | GPMT 2021-FL3 CRE CLO | |
Collateral assets (2) | | $ | 768,796 | | | $ | 763,848 | | | L+3.8% | |
Collateral assets (3) | | Collateral assets (3) | | 763,654 | | | 757,609 | | | L+3.9% |
| Financing provided | Financing provided | | 630,818 | | | 627,580 | | | L+1.7% | Financing provided | | 625,772 | | | 625,698 | | | L+1.7% |
| GPMT 2019-FL2 CRE CLO | GPMT 2019-FL2 CRE CLO | | GPMT 2019-FL2 CRE CLO | |
| Collateral assets | Collateral assets | | 734,111 | | | 719,822 | | | L+4.0% | Collateral assets | | 472,508 | | | 470,557 | | | L+4.0% |
| Financing provided | Financing provided | | 572,001 | | | 570,597 | | | L+1.7% | Financing provided | | 301,310 | | | 301,181 | | | L+2.0% |
| GPMT 2018-FL1 CRE CLO | | |
| Collateral assets | | 324,651 | | | 320,558 | | | L+5.1% | |
| Financing provided | | 158,253 | | | 158,252 | | | L+2.3% | |
| | Total | Total | | Total | |
| Collateral assets | Collateral assets | | $ | 1,827,558 | | | $ | 1,804,228 | | | L+4.1% | Collateral assets | | $ | 1,857,602 | | | $ | 1,841,491 | | | L+3.9% |
| Financing provided | Financing provided | | $ | 1,361,072 | | | $ | 1,356,429 | | | L+1.8% | Financing provided | | $ | 1,429,646 | | | $ | 1,425,556 | | | L+1.7% |
____________________
(1)Calculations of all in yield on collateral assets at origination are based on a number of assumptions (some or all of which may not occur) and are expressed as monthly equivalent yields that include net origination fees and exit fees and exclude future fundings and any potential or completed loan amendments or modifications. Calculations of all in weighted average yield at origination exclude fixed rate loans. Calculations of cost of funds is the weighted average coupon of the CRE CLO, exclusive of any CRE CLO issuance costs.
(2)Includes $20$29.6 million of restricted cash as of June 30, 2022. No restricted cash is included as of December 31, 2021. Yield on collateral assets is exclusive of restricted cash.
Term Financing Facility
In February 2021, we entered into a term financing facility with Goldman Sachs Bank USA providing us with $349(3)No restricted cash is included as of June 30, 2022. Includes $10.4 million of term-matched and non-mark-to-market financing to fund certain loans that were previously financed under the repurchase facility with Goldman Sachs Bank USA. The term financing facility is non-amortizing and may be voluntarily repaid, in whole, on any payment date, subject to a prepayment premium with certain exceptions if repaid prior to February 10, 2022. The term financing facility’s term is matched to that of the underlying commercial mortgage loans, not to exceed February 9, 2025. As of September 30, 2021, we had outstanding $127.9 million on the term financing facility with a weighted average borrowing rate of 3.68%.
The following table details the outstanding borrowings under our term financing facilityrestricted cash as of September 30, 2021:
| | | | | | | | | | | | | | | | | | | | |
| (in thousands) | September 30,
2021 |
| Term Financing Facility | | Principal Balance | | Carrying Value | | Wtd. Avg. Yield/Cost (1) |
| GS Term Financing Facility | | | | | | |
| Collateral assets | | $ | 327,632 | | | $ | 324,991 | | | L+4.1% |
| Borrowings outstanding | | 129,980 | | | 127,867 | | | L+3.6% |
___________________(1) Calculations of all in yieldDecember 31, 2021. Yield on collateral assets at origination are based on a number of assumptions (some or all of which may not occur) and are expressed as monthly equivalent yields that include net origination fees and exit fees and exclude future fundings and any potential or completed loan amendments or modifications. Calculations of all in weighted average yield at origination exclude fixed rate loans. Calculations of cost of funds is the initial weighted average coupon of the term financing facility, exclusive of any term financing facility issuance costs.
Asset-Specific Financing
In April 2019, we entered into a $150 million loanasset-specific financing facility with CIBC Bank USA to provide us with loan-based financing on a non-mark-to-market basis with a term matched to the underlying loan collateral and partial recourse to us.
The following table details the outstanding borrowings under our asset-specific financing facility as of SeptemberJune 30, 2021:2022:
| | (in thousands) | September 30,
2021 | |
| (dollars in thousands) | | (dollars in thousands) | June 30,
2022 |
| Asset-Specific Financing Facility | Asset-Specific Financing Facility | | Principal Balance | | Carrying Value | | Wtd. Avg. Yield/Cost (1) | Asset-Specific Financing Facility | | Principal Balance | | Carrying Value | | Wtd. Avg. Yield/Cost (1) |
| CIBC Asset-Specific Financing Facility | CIBC Asset-Specific Financing Facility | | | | | | | CIBC Asset-Specific Financing Facility | | | | | | |
| Collateral assets | Collateral assets | | $ | 55,940 | | | $ | 55,829 | | | L+3.4% | Collateral assets | | $ | 57,954 | | | $ | 57,794 | | | L+3.4% |
| Borrowings outstanding | Borrowings outstanding | | 44,752 | | | 44,752 | | | L+1.7% | Borrowings outstanding | | 43,622 | | | 43,622 | | | L+1.7% |
____________________
(1)Calculations of all in yield on collateral assets at origination are based on a number of assumptions (some or all of which may not occur) and are expressed as monthly equivalent yields that include net origination fees and exit fees and exclude future fundings and any potential or completed loan amendments or modifications. Calculations of all in weighted average yield at origination exclude fixed rate loans. Calculations of cost of funds is the initial weighted average coupon of the asset-specific financing facility, exclusive of any asset-specific financing facility issuance costs.
Corporate Financing
The following table details our outstanding corporate financing as of September 30, 2021:
| | | | | | | | |
(in thousands) | | September 30,
2021 |
Corporate Financing | | Principal Balance |
Convertible Senior secured term loan facilities | | $ | 225,000 | |
Convertible senior notes | | 275,350 | |
Total Corporate Financing | | 500,350 | |
Senior Secured Term Loan Facilities
As of September 30, 2021, the total outstanding amount due on the senior secured term loan facilities was $225.0 million, with a carrying value of $208.8 million, net of deferred issuance costs. Interest on the outstanding loans under the senior secured term loan facilities is payable quarterly in arrears and accrues at the rate of (i) 8.00% per annum for any period for which accrued interest is paid in cash or (ii) 9.00% per annum for any period for which the borrowers elect to pay up to 50% of accrued interest in kind by adding such interest to the principal amount of the loans. The senior secured term loan facilities will mature on September 25, 2025.
| | | | | | | | | | | | | | | | | | | | | | | | | | |
| (in thousands) | | September 30,
2021 |
| Senior Secured Term Loan Facilities | | Principal Balance | | Carrying Value | | All-in Cost (1) | | Maturity Date |
| PIMCO Senior Secured Term Loan Facilities | | $ | 225,000 | | | $ | 208,785 | | | 10.8 | % | | September 2025 |
____________________
(1)In addition to cash coupon, average yield includes the amortization of deferred financing costs and warrants.
Senior Convertible Notes
As of SeptemberJune 30, 2021,2022, the total outstanding amount due on convertible senior notes was $272.5 million, net of deferred issuance costs.$275.4 million. The notes are unsecured and pay interest semiannually at a rate of 5.625% per annum on the notes maturing in December 2022, and a rate of 6.375% per annum on the notes maturing in October 2023. As of SeptemberJune 30, 2021,2022, these notes had a conversion rate of 51.9943 and 50.0894 shares of common stock per $1,000 principal amount of the notes, respectively.
As of SeptemberJune 30, 2021,2022, the following convertible senior convertible notes were outstanding:
| | | | | | | | | | | | | | | | | | | | | | | | | | | | | | | | |
| (in thousands) | | September 30,
2021 |
| Convertible Senior Notes | | Principal Balance | | Carrying Value | | Interest Rate | | All-in Cost (1) | | Maturity Date |
| Senior Convertible Notes Maturing 2022 | | 143,750 | | | 142,644 | | | 5.6 | % | | 6.4 | % | | December 1, 2022 |
| Senior Convertible Notes Maturing 2023 | | 131,600 | | | 129,868 | | | 6.4 | % | | 7.2 | % | | October 1, 2023 |
| | | | | | | | | | | | | | | | | | | | | | | | | | | | | | | | |
| (dollars in thousands) | | June 30,
2022 |
| Convertible Senior Notes | | Principal Balance | | Carrying Value | | Interest Rate | | All-in Cost (1) | | Maturity Date |
| Convertible Senior Notes Maturing 2022 | | 143,750 | | | 143,337 | | | 5.6 | % | | 6.4 | % | | December 1, 2022 |
| Convertible Senior Notes Maturing 2023 | | 131,600 | | | 130,485 | | | 6.4 | % | | 7.2 | % | | October 1, 2023 |
____________________
(1)In addition to cash coupon, average yield includes the amortization of deferred financing costs.
The following table provides the quarterly average balances, the quarter-end balances and the maximum balances at any month-end within that quarterly period, of borrowings under our repurchase facilities, asset-specific financing facility, term financing facility, CRE CLOs, senior secured term loan facilities and convertible senior notes for the three months ended SeptemberJune 30, 2021,2022, and the four immediately preceding quarters:
| | (in thousands) | (in thousands) | Quarterly Average | | End of Period Balance | | Maximum Balance of Any Month-End | | (in thousands) | Quarterly Average | | End of Period Balance | | Maximum Balance of Any Month-End | |
| For the Three Months Ended June 30, 2022 | | For the Three Months Ended June 30, 2022 | $ | 3,017,504 | | | $ | 3,014,659 | | | $ | 3,051,406 | | |
| For the Three Months Ended March 31, 2022 | | For the Three Months Ended March 31, 2022 | $ | 2,917,731 | | | $ | 2,918,429 | | | $ | 2,951,641 | | |
| For the Three Months Ended December 31, 2021 | | For the Three Months Ended December 31, 2021 | $ | 2,985,109 | | | $ | 2,938,493 | | | $ | 3,031,364 | | |
| For the Three Months Ended September 30, 2021 | For the Three Months Ended September 30, 2021 | $ | 2,945,314 | | | $ | 2,927,103 | | | $ | 2,927,103 | | | For the Three Months Ended September 30, 2021 | $ | 2,974,497 | | | $ | 2,927,103 | | | $ | 3,014,681 | | |
| For the Three Months Ended June 30, 2021 | For the Three Months Ended June 30, 2021 | $ | 2,967,421 | | | $ | 2,868,936 | | | $ | 3,129,688 | | | For the Three Months Ended June 30, 2021 | $ | 2,989,774 | | | $ | 2,868,936 | | | $ | 3,129,181 | | |
| For the Three Months Ended March 31, 2021 | $ | 3,149,509 | | | $ | 3,112,629 | | | $ | 3,319,943 | | | |
| For the Three Months Ended December 31, 2020 | $ | 3,281,786 | | | $ | 3,236,792 | | | $ | 3,317,165 | | | |
| For the Three Months Ended September 30, 2020 | $ | 3,262,423 | | | $ | 3,379,053 | | | $ | 3,379,053 | | | |
Financial Covenants
Our financial covenants and guarantees for outstanding borrowings related to our repurchase agreements, termand asset-specific financing facility, asset specific financing and senior secured term loan facilities generally require the Company to maintain compliance with the following most restrictive covenants across the agreements:
| | | | | | | | |
| Financial Covenant | Description | Value as of SeptemberJune 30, 20212022 |
| Cash Liquidity | Unrestricted cash liquidity of no less than the greater of $30.0 million and 5.0% of recourse indebtedness, which was $32.2 million. | Unrestricted cash of $154.9 million, while 5.0% of recourse indebtedness was $39.3$150.2 million |
| Tangible Net Worth | Tangible net worth greater than the sum of (i) 75.0% of tangible net worth as of June 28, 2017, and (ii) 75.0% of net cash proceeds of equity issuances after June 28, 2017, which calculates to $782.3$931.7 million. | Tangible net worth of $979.6 million$1.1 billion |
| Leverage Ratios | Target asset leverage ratio cannot exceed 77.5% and total leverage ratio cannot exceed 80.0%. | Target asset leverage ratio of 66.3%68.9%; Total leverage ratio of 75.2%73.6% |
| Interest Coverage | Interest coverage ratio of no less than 1.5:1.0 | Interest coverage of 1.8:1.0 |
We were in compliance with all financial covenants as of SeptemberJune 30, 2021.2022.
Leverage Ratios
As of SeptemberJune 30, 2021,2022, the total debt-to-equity ratio with respect to our loans held-for-investment was 3.0:2.7:1.0, and our recourse leverage ratio was 1.4:1.0.
The following table represents the Company’s recourse leverage ratio and total leverage ratio as of SeptemberJune 30, 20212022, and December 31, 2020:
| | | | | | | | |
| September 30, 2021 | December 31, 2020 |
Recourse leverage ratio (1) | 1.4 | 2.2 |
Total leverage ratio (2) | 3.0 | 3.2 |
(1) The debt-to-equity ratio with respect to our loans held-for-investment, defined as recourse debt, net of cash, divided by equity.(2) The total debt-to-equity ratio with respect to our loans held-for-investment, defined as total debt, net of cash, divided by equity.2021:
| | | | | | | | |
| June 30, 2022 | December 31, 2021 |
Recourse leverage ratio (1) | 1.4 | 0.9 |
Total leverage ratio (2) | 2.7 | 2.5 |
(1) The debt-to-equity ratio with respect to our loans held-for-investment, defined as recourse debt, net of cash, divided by total equity.(2) The total debt-to-equity ratio with respect to our loans held-for-investment, defined as total debt, net of cash, divided by total equity.
Floating Rate Portfolio
Our business strategy seeks to minimize our exposure to changes in interest rates by matching benchmark indices typically LIBOR or similar index, on our assets with those on our asset level borrowings. Accordingly, our business model is such that, in general, rising interest rates will increase our net interest income, while declining interest rates will decrease our net interest income, subject to the impact of interest rate floors on our floating rate assets and certain liabilities. As of SeptemberJune 30, 2021, 99%2022, 98.2% of our loan investments by carrying value earned a floating rate of interest and were financed with liabilities that pay interest on a floating rate basis, and 0.8% of our loan investments by carrying value earned a floating rate of interest and were unencumbered, which resulted in an amount of net equity that is positively correlated to rising interest rates, subject to the impact of interest rate floors on certain of our floating rate loan investments. As of SeptemberJune 30, 2021, the remaining 1%2022, 1.2% of our loan investments thatby carrying value earned a fixed rate of interest and were financed with liabilities that pay interest on a floating rate basis, which resulted in a negative correlation to rising interest rates on that amount of our financing.
The following table details our loan portfolio’s net floating rate exposure as of SeptemberJune 30, 2021:2022: | | | | | |
| (in thousands) | Net Exposure |
Floating rate assets(1) | $ | 3,623,8233,783,751 | |
Floating rate liabilities(1)(2) | 2,452,5622,740,837 | |
| Net floating rate exposure | $ | 1,171,2611,042,914 | |
(1) Floating rate loansassets and liabilities are currently indexed to the London Interbank Offered Rate (LIBOR) or LIBOR.the Secured Overnight Financing Rate (SOFR).
(2) Floating rate liabilities include our outstanding repurchase facilities, term financing facility, asset-specific financing facility and CRE CLOs.
Interest-Earning Assets and Interest-Bearing Liabilities
The following tables present the components of interest income and average annualized net asset yield earned by asset type, the components of interest expense and average annualized cost of funds on borrowings incurred by collateral type and net interest income and average annualized net interest rate spread for the three and ninesix months ended SeptemberJune 30, 20212022, and 2020:2021: | | | Three Months Ended September 30, 2021 | | Nine Months Ended September 30, 2021 | | Three Months Ended June 30, 2022 | | Six Months Ended June 30, 2022 |
| (dollars in thousands) | (dollars in thousands) | Average Balance | | Interest Income/Expense (1) | | Net Yield/Cost of Funds | | Average Balance | | Interest Income/Expense (1) | | Net Yield/Cost of Funds | (dollars in thousands) | Average Balance | | Interest Income/Expense (1) | | Net Yield/Cost of Funds | | Average Balance | | Interest Income/Expense (1) | | Net Yield/Cost of Funds |
Interest-earning assets (2) | Interest-earning assets (2) | | | | | | | | | | | | Interest-earning assets (2) | | | | | | | | | | | |
| Loans held-for-investment | Loans held-for-investment | | Loans held-for-investment | |
Senior loans (3) | Senior loans (3) | $ | 3,675,426 | | | $ | 47,934 | | | 5.2 | % | | $ | 3,740,623 | | | $ | 150,561 | | | 5.4 | % | Senior loans (3) | $ | 3,868,746 | | | $ | 48,700 | | | 5.0 | % | | $ | 3,828,245 | | | $ | 95,639 | | | 5.0 | % |
| Subordinated loans | Subordinated loans | 15,595 | | | 378 | | | 9.7 | % | | 15,980 | | | 1,140 | | | 9.5 | % | Subordinated loans | 14,394 | | | 356 | | | 9.9 | % | | 14,601 | | | 715 | | | 9.8 | % |
| | Other | Other | — | | | 95 | | | — | | | — | | | 298 | | | — | | Other | — | | | 223 | | | — | | | — | | | 246 | | |
| Total interest income/net asset yield | Total interest income/net asset yield | $ | 3,691,021 | | | $ | 48,407 | | | 5.2 | % | | $ | 3,756,603 | | | $ | 151,999 | | | 5.4 | % | Total interest income/net asset yield | $ | 3,883,140 | | | $ | 49,279 | | | 5.1 | % | | $ | 3,842,846 | | | $ | 96,600 | | | 5.0 | % |
| Interest-bearing liabilities | Interest-bearing liabilities | | Interest-bearing liabilities | |
| Borrowings collateralized by: | Borrowings collateralized by: | | Borrowings collateralized by: | |
| Loans held-for-investment | Loans held-for-investment | | Loans held-for-investment | |
Senior loans (3) | Senior loans (3) | $ | 2,463,746 | | | $ | 16,028 | | | 2.6 | % | | $ | 2,517,363 | | | $ | 48,938 | | | 2.6 | % | Senior loans (3) | $ | 2,644,499 | | | $ | 21,805 | | | 3.3 | % | | $ | 2,580,059 | | | $ | 38,133 | | | 3.0 | % |
| Subordinated loans | Subordinated loans | 8,455 | | | 67 | | | 3.2 | % | | 8,491 | | | 201 | | | 3.2 | % | Subordinated loans | 8,350 | | | 80 | | | 3.8 | % | | 8,369 | | | 147 | | | 3.5 | % |
| | Other: | Other: | | Other: | |
| Convertible senior notes | Convertible senior notes | 272,364 | | | 4,556 | | | 6.7 | % | | 271,937 | | | 13,618 | | | 6.7 | % | Convertible senior notes | 273,669 | | | 4,572 | | | 6.7 | % | | 273,448 | | | 9,118 | | | 6.7 | % |
| Senior secured term loan facilities | Senior secured term loan facilities | 208,480 | | | 5,654 | | | 10.8 | % | | 207,662 | | | 16,587 | | | 10.6 | % | Senior secured term loan facilities | 34,460 | | | 886 | | | 10.3 | % | | 72,006 | | | 3,754 | | | 10.4 | % |
| Total interest expense/cost of funds | Total interest expense/cost of funds | $ | 2,953,045 | | | 26,305 | | | 3.6 | % | | $ | 3,005,453 | | | 79,344 | | | 3.5 | % | Total interest expense/cost of funds | $ | 2,960,978 | | | 27,343 | | | 3.7 | % | | $ | 2,933,882 | | | 51,152 | | | 3.5 | % |
| Net interest income/spread | Net interest income/spread | | $ | 22,102 | | | 1.6 | % | | $ | 72,655 | | | 1.9 | % | Net interest income/spread | | $ | 21,936 | | | 1.4 | % | | $ | 45,448 | | | 1.5 | % |
| | | | | | | | | | | | | | | | | | | | | | | | | | | | | | | | | | | |
| Three Months Ended September 30, 2020 | | Nine Months Ended September 30, 2020 |
| (dollars in thousands) | Average Balance | | Interest Income/Expense (1) | | Net Yield/Cost of Funds | | Average Balance | | Interest Income/Expense (1) | | Net Yield/Cost of Funds |
Interest-earning assets (2) | | | | | | | | | | | |
| Loans held-for-investment | | | | | | | | | | | |
Senior loans (3) | $ | 4,115,011 | | | $ | 56,903 | | | 5.5 | % | | $ | 4,218,499 | | | $ | 179,216 | | | 5.7 | % |
| Subordinated loans | 27,025 | | | 654 | | | 9.7 | % | | 27,201 | | | 2,020 | | | 9.9 | % |
| Available-for-sale securities | 6,538 | | | 119 | | | 7.3 | % | | 9,668 | | | 646 | | | 8.9 | % |
| Held-to-maturity securities | 5,990 | | | 113 | | | 7.5 | % | | 8,870 | | | 659 | | | 9.9 | % |
| Other | — | | | 57 | | | — | | | — | | | 424 | | | — | |
| Total interest income/net asset yield | $ | 4,154,564 | | | $ | 57,846 | | | 5.6 | % | | $ | 4,264,238 | | | $ | 182,965 | | | 5.7 | % |
| Interest-bearing liabilities | | | | | | | | | | | |
| Borrowings collateralized by: | | | | | | | | | | | |
| Loans held-for-investment | | | | | | | | | | | |
Senior loans (3) | $ | 2,969,044 | | | $ | 19,189 | | | 2.6 | % | | $ | 3,059,632 | | | $ | 71,189 | | | 3.1 | % |
| Subordinated loans | 8,600 | | | 70 | | | 3.3 | % | | 8,616 | | | 253 | | | 3.9 | % |
| Available-for-sale securities | 4,334 | | | 43 | | | 4.0 | % | | 5,983 | | | 198 | | | 4.4 | % |
| Held-to-maturity securities | 3,030 | | | 38 | | | 5.0 | % | | 4,768 | | | 210 | | | 5.9 | % |
| Other: | | | | | | | | | | | |
| Convertible senior notes | 270,709 | | | 4,529 | | | 6.7 | % | | 270,505 | | | 13,570 | | | 6.7 | % |
| Senior secured term loan facilities | 6,706 | | | 145 | | | 8.6 | % | | 3,353 | | | 145 | | | 8.6 | % |
| Total interest expense/cost of funds | $ | 3,262,423 | | | 24,014 | | | 2.9 | % | | $ | 3,352,857 | | | 85,565 | | | 3.4 | % |
| Net interest income/spread | | | $ | 33,832 | | | 2.7 | % | | | | $ | 97,400 | | | 2.3 | % |
| | | | | | | | | | | | | | | | | | | | | | | | | | | | | | | | | | | |
| Three Months Ended June 30, 2021 | | Six Months Ended June 30, 2021 |
| (dollars in thousands) | Average Balance | | Interest Income/Expense (1) | | Net Yield/Cost of Funds | | Average Balance | | Interest Income/Expense (1) | | Net Yield/Cost of Funds |
Interest-earning assets (2) | | | | | | | | | | | |
| Loans held-for-investment | | | | | | | | | | | |
Senior loans (3) | $ | 3,689,170 | | | $ | 48,970 | | | 5.3 | % | | $ | 3,773,222 | | | $ | 102,627 | | | 5.4 | % |
| Subordinated loans | 15,977 | | | 380 | | | 9.5 | % | | 16,173 | | | 762 | | | 9.4 | % |
| | | | | | | | | | | |
| | | | | | | | | | | |
| Other | — | | | 103 | | | — | | | — | | | 203 | | | |
| Total interest income/net asset yield | $ | 3,705,147 | | | $ | 49,453 | | | 5.3 | % | | $ | 3,789,395 | | | $ | 103,592 | | | 5.5 | % |
| Interest-bearing liabilities | | | | | | | | | | | |
| Borrowings collateralized by: | | | | | | | | | | | |
| Loans held-for-investment | | | | | | | | | | | |
Senior loans (3) | $ | 2,479,380 | | | $ | 16,410 | | | 2.6 | % | | $ | 2,570,979 | | | $ | 32,910 | | | 2.6 | % |
| Subordinated loans | 8,489 | | | 67 | | | 3.2 | % | | 8,510 | | | 134 | | | 3.1 | % |
| | | | | | | | | | | |
| | | | | | | | | | | |
| Other: | | | | | | | | | | | |
| Senior secured term loan facilities | 207,621 | | | 5,653 | | | 10.9 | % | | 207,253 | | | 10,933 | | | 10.6 | % |
| Convertible senior notes | 271,930 | | | 4,544 | | | 6.7 | % | | 271,723 | | | 9,062 | | | 6.7 | % |
| | | | | | | | | | | |
| Total interest expense/cost of funds | $ | 2,967,420 | | | 26,674 | | | 3.6 | % | | $ | 3,058,465 | | | 53,039 | | | 3.5 | % |
| Net interest income/spread | | | $ | 22,779 | | | 1.7 | % | | | | $ | 50,553 | | | 2.0 | % |
____________________
(1)Includes amortization of deferred debt issuance costs.
(2)Average balance represents average amortized cost on loans held-for-investment, AFS securities and HTM securities.held-for-investment.
(3)Loans primarily secured by a first priority lien on commercial real property and related personal property and also includes, when applicable, any companion subordinate loans.
Factors Affecting Our Operating Results
The results of our operations are affected by a number of factors and primarily depend on, among other things, the level of our net interest income, the availability and cost of financing for us, the market value of our assets, the credit performance of our assets and the supply of, and demand for, commercial real estate loans, other commercial real estate debt instruments and other financial assets available for investment in the market and available as a source of refinancing of our assets. Our net interest income, which reflects the amortization of origination fees and direct costs, is recognized based on the contractual rate and the outstanding principal balance of the loans we originate. The objective of the interest method is to arrive at periodic interest income that yields a level rate of return over the loan term. Interest rates vary according to the type of loan or security, conditions in the financial markets, credit worthiness of our borrowers, competition and other factors, none of which can be predicted with any certainty. Our operating results may also be impacted by credit losses in excess of initial anticipations or unanticipated credit events experienced by our borrowers. We continue to monitor the effects on each of these factors in light of the COVID-19 pandemic and rising interest rates, and how they will affect the results of our operations.
Summary of Results of Operations and Financial ConditionLoan Originations
Our GAAP net income (loss) attributable to common stockholders was $18.6 million (or $0.34 per basic weighted average share) for the three months ended September 30, 2021, as compared to GAAP net income (loss) attributable to common stockholders of $(24.7) million (or $(0.45) per basic weighted average share) for the three months ended September 30, 2020. The GAAP net income for the three months ended September 30, 2021 benefited from a partial reversal of the provision for credit losses, which was related to loan prepayments, somewhat improved macroeconomic forecastbusiness model is mainly focused on directly originating, investing in and overall market conditions. The GAAP net (loss) for the three months ended September 30, 2020 was primarilymanaging senior floating-rate commercial mortgage loans and other debt and debt-like commercial real estate investments. As a result of one-time restructuring charges relatedthis strategy, our operating performance is subject to overall market demand for commercial real estate loan products and other debt and debt-like commercial real estate investments. We manage originations and acquisitions of our target investments by diversifying our investment portfolio across geographical regions, local markets, property types, borrower types and loan structures. We do not limit our investments to any number of geographical areas or property types for our originations so that we develop a well-diversified investment portfolio. Additionally, our team has extensive experience originating and acquiring commercial real estate loans and other debt and debt-like commercial real estate investments, through a network of long-standing relationships with borrowers, sponsors and industry brokers. The COVID-19 pandemic and rising market interest rates have resulted in significant disruptions in financial markets, uncertainty about the internalization process, realized losses on sales of select loans held-for-sale, which were partially offset byoverall macroeconomic outlook and a decreasedislocation in the provision forcommercial real estate sector, including reduced borrower demand, wider credit losses related to the moderate improvementspreads, higher lending rates, increased capitalization rates on properties and significantly lower transaction volume. The dislocation in the forecasts of macroeconomiccapital markets and market conditions.
Our GAAP net income (loss) attributable to common stockholders was $60.8 million (or $1.11 per basic weighted average share) for the nine months ended September 30, 2021, as compared to GAAP net income (loss) attributable to common stockholders of $(63.7) million (or $(1.15) per basic weighted average share) for the nine months ended September 30, 2020. The GAAP net income for the nine months ended September 30, 2021 benefited from a partial reversal of the provision for credit losses, which was related to loan prepayments, somewhat improved macroeconomic forecastdecline in real estate sale transaction and overall market conditions and a decrease in other operating expenses. The GAAP net (loss) for the nine months ended September 30, 2020 was primarily a result of an increase in the provision for credit losses related to the significant deterioration in the forecasts of macroeconomic conditions, overall market dislocationrefinancing activities caused by the onsetpandemic and higher interest rates have negatively impacted, and will likely continue to negatively impact, the volume of loan repayments and prepayments on select property types, which are a significant source of our overall liquidity and could make it more difficult for us to originate new loan investments.
Financing Availability
We are subject to availability and cost of financing to successfully execute on our business strategy and generate attractive risk-adjusted returns to our stockholders. Much of our financing is in the form of repurchase agreements or other types of credit facilities provided to us by our lender counterparties. We mitigate this counterparty risk by seeking to diversify our lending partners, focusing on establishing borrowing relationships with strong counterparties and continuously monitoring them through a thoughtful approach to counterparty risk oversight. Additionally, as part of our broader risk management strategy, and to the extent available in the market, we finance our business through other means which may include, but not be limited to, securitizations, note sales and issuance of unsecured debt and equity instruments. We continue to actively explore additional types of funding facilities in order to further diversify our financing sources. The COVID-19 pandemic and rising interest rates have resulted in significant disruptions in financial markets and uncertainty about the overall macroeconomic outlook. Declines in economic conditions could negatively impact real estate and real estate capital markets, which could make it more difficult for us to obtain or maintain financing.
We finance pools of our commercial real estate loans through collateralized loan obligations, or CRE CLOs, retaining subordinate securities in our investment portfolio. Our CRE CLOs are accounted for as financings with the non-retained securitized debt obligations recognized on our condensed consolidated balance sheets.
Credit Risk
We are subject to varying degrees of credit risk in connection with our target investments. The performance and value of our investments depend upon sponsors’ ability to operate the properties that serve as our collateral so that they produce cash flows adequate to pay interest and principal due to us. In addition, we are exposed to the risks generally associated with the commercial real estate market, including variances in occupancy rates, capitalization rates, absorption rates and other macroeconomic factors beyond our control. We try to mitigate this risk by seeking to originate or acquire assets of higher quality at appropriate rates of return given anticipated and unanticipated losses, by employing a comprehensive review and selection process and by proactively monitoring originated or acquired investments. Nevertheless, unanticipated credit losses, including as a result of the COVID-19 pandemic, one-time restructuring chargesrising interest rates and capital markets volatility, could occur that could adversely impact our operating results.
The Environmental, Social and Governance, or ESG, risks associated with our potential collateral and borrowers also pose credit risks to us. We try to mitigate these risks by incorporating diligence practices into our investment process to identify material ESG matters related to the internalization processa given investment. The nature and realized lossesscope of our ESG diligence will vary based on the saleinvestment but may include a review of, select loans.
The following table sets forth information regarding our condensed consolidated results of operationsamong other things, energy management, pollution and certain key operating metrics compared to both the same period in the previous year and the most recently reported period ($ in thousands):contamination, accounting
| | | | | | | | | | | | | | | | | | | | | | | | | | | | | | | | | | | | | | | | | | | |
| | | |
| (in thousands, except share data) | | Three Months Ended | | | | | Nine Months Ended |
| Income Statement Data: | | September 30, 2021 | | September 30, 2020 | | Q3’21 vs Q3’20 | | | | | September 30, 2021 | | September 30, 2020 | | Q3’21 vs Q3’20 | | |
| Interest income: | | (unaudited) | | | | | | | |
| Loans held-for-investment | | $ | 48,312 | | | $ | 56,783 | | | $ | (8,471) | | | | | | $ | 151,701 | | | $ | 180,341 | | | $ | (28,640) | | | |
| Loans held-for-sale | | — | | | 774 | | | (774) | | | | | | — | | | 895 | | | (895) | | | |
| Available-for-sale securities | | — | | | 119 | | | (119) | | | | | | — | | | 646 | | | (646) | | | |
| Held-to-maturity securities | | — | | | 113 | | | (113) | | | | | | — | | | 659 | | | (659) | | | |
| Cash and cash equivalents | | 95 | | | 57 | | | 38 | | | | | | 298 | | | 424 | | | (126) | | | |
| Total interest income | | 48,407 | | | 57,846 | | | (9,439) | | | | | | 151,999 | | | 182,965 | | | (30,966) | | | |
| Interest expense: | | | | | | | | | | | | | | | | | |
| Repurchase facilities | | 5,451 | | | 12,791 | | | (7,340) | | | | | | 20,449 | | | 46,742 | | | (26,293) | | | |
| Securitized debt obligations | | 8,777 | | | 5,431 | | | 3,346 | | | | | | 20,523 | | | 21,367 | | | (844) | | | |
| Convertible senior notes | | 4,556 | | | 4,529 | | | 27 | | | | | | 13,618 | | | 13,570 | | | 48 | | | |
| Term financing facility | | 1,453 | | | — | | | 1,453 | | | | | | 6,208 | | | — | | | 6,208 | | | |
| Asset-specific financings | | 414 | | | 901 | | | (487) | | | | | | 1,959 | | | 2,962 | | | (1,003) | | | |
| Revolving credit facilities | | — | | | 217 | | | (217) | | | | | | — | | | 779 | | | (779) | | | |
| Senior secured term loan facilities | | 5,654 | | | 145 | | | 5,509 | | | | | | 16,587 | | | 145 | | | 16,442 | | | |
| | | | | | | | | | | | | | | | | |
| Total interest expense | | 26,305 | | | 24,014 | | | 2,291 | | | | | | 79,344 | | | 85,565 | | | (6,221) | | | |
| Net interest income | | 22,102 | | | 33,832 | | | (11,730) | | | | | | 72,655 | | | 97,400 | | | (24,745) | | | |
| | | | | | | | | | | | | | | | | |
| Other income (loss): | | | | | | | | | | | | | | | | | |
| Benefit from (provision for) credit losses | | 5,760 | | | 5,300 | | | 460 | | | | | | 15,072 | | | (62,241) | | | 77,313 | | | |
| | | | | | | | | | | | | | | | | |
| Realized losses on sales of loans held-for-sale | | — | | | (10,019) | | | 10,019 | | | | | | — | | | (16,913) | | | 16,913 | | | |
| Fee income | | — | | | 595 | | | (595) | | | | | | — | | | 1,117 | | | (1,117) | | | |
| | | | | | | | | | | | | | | | | |
| Total other income (loss) | | 5,760 | | | (4,124) | | | 9,884 | | | | | | 15,072 | | | (78,037) | | | 93,109 | | | |
| Expenses: | | | | | | | | | | | | | | | | | |
| Base management fees | | — | | | 3,974 | | | (3,974) | | | | | | — | | | 11,840 | | | (11,840) | | | |
| Compensation and benefits | | 5,634 | | | — | | | 5,634 | | | | | | 16,111 | | | — | | | 16,111 | | | |
| Servicing expenses | | 1,323 | | | 914 | | | 409 | | | | | | 3,763 | | | 3,025 | | | 738 | | | |
| Restructuring charges | | — | | | 43,682 | | | (43,682) | | | | | | — | | | 43,682 | | | (43,682) | | | |
| Other operating expenses | | 2,276 | | | 5,808 | | | (3,532) | | | | | | 6,967 | | | 24,421 | | | (17,454) | | | |
| Total expenses | | 9,233 | | | 54,378 | | | (45,145) | | | | | | 26,841 | | | 82,968 | | | (56,127) | | | |
| Income (loss) before income taxes | | 18,629 | | | (24,670) | | | 43,299 | | | | | | 60,886 | | | (63,605) | | | 124,491 | | | |
| (Benefit from) provision for income taxes | | (1) | | | (4) | | | 3 | | | | | | (4) | | | (15) | | | 11 | | | |
| Net income (loss) | | 18,630 | | | (24,666) | | | 43,296 | | | | | | 60,890 | | | (63,590) | | | 124,480 | | | |
| Dividends on preferred stock | | 25 | | | 25 | | | — | | | | | | 75 | | | 75 | | | — | | | |
| Net income (loss) attributable to common stockholders | | $ | 18,605 | | | $ | (24,691) | | | $ | 43,296 | | | | | | $ | 60,815 | | | $ | (63,665) | | | $ | 124,480 | | | |
| Basic earnings (loss) per weighted average common share | | $ | 0.34 | | | $ | (0.45) | | | $ | 0.79 | | | | | | $ | 1.11 | | | $ | (1.15) | | | $ | 2.26 | | | |
| Diluted earnings (loss) per weighted average common share | | $ | 0.33 | | | $ | (0.45) | | | $ | 0.78 | | | | | | $ | 1.05 | | | $ | (1.15) | | | $ | 2.20 | | | |
| Dividends declared per common share | | $ | 0.25 | | | $ | 0.20 | | | $ | 0.05 | | | | | | $ | 0.75 | | | $ | 0.20 | | | $ | 0.55 | | | |
| Weighted average number of shares of common stock outstanding: | | | | | | | | | | | | | | | | | |
| Basic | | 54,453,546 | | | 55,205,082 | | | (751,536) | | | | | | 54,864,456 | | | 55,140,163 | | | (275,707) | | | |
| Diluted | | 56,735,278 | | | 55,205,082 | | | 1,530,196 | | | | | | 70,902,745 | | | 55,140,163 | | | 15,762,582 | | | |
| Comprehensive income (loss): | | | | | | | | | | | | | | | | | |
| Net income (loss) attributable to common stockholders | | $ | 18,605 | | | $ | (24,691) | | | $ | 43,296 | | | | | | $ | 60,815 | | | $ | (63,665) | | | $ | 124,480 | | | |
| | | | | | | | | | | | | | | | | |
| | | | | | | | | | | | | | | | | |
| | | | | | | | | | | | | | | | | |
| Comprehensive income (loss) | | $ | 18,605 | | | $ | (24,691) | | | $ | 43,296 | | | | | | $ | 60,815 | | | $ | (63,665) | | | $ | 124,480 | | | |
The COVID-19 pandemic significantly impacted the commercial real estate markets, causing reduced occupancy, requests from tenants for rent deferral or abatement and delays in construction and development projects currently planned or underway. While the economy has improved significantly, macroeconomic trends associated with the COVID-19 pandemic have persisted and could continue to persist and impair our borrowers’ ability to pay principal and interest due to us under our loan agreements.
Operating Expenses
Our operating expenses, such as compensation costs and expenses related to managing our investment portfolio, may vary over time and are subject to a variety of factors, including overall economic and market environment, competitive market forces driving employee-related costs, and other related factors.
Allowance for Credit Losses
Our operating results are also impacted by the allowance for credit loss we record for loans held-for-investment using the Current Expected Credit Loss, or CECL, model pursuant to ASU 2016-13.
Changes in the Fair Value of Our Investments
We intend to hold our target investments for the long-term and, as such, they are carried at an amortized cost on our condensed consolidated balance sheets.
Although we intend to hold our target investments for the long-term, we may occasionally classify some of our debt securities as AFS. Investments classified as AFS are carried at their fair value, with changes in fair value recorded through accumulated other comprehensive income, a component of stockholders’ equity, rather than through earnings. We do not intend to hold any of our investments for trading purposes.
Changes in Market Interest Rates
Our primary interest rate exposures relate to the yield on our loans and other investments and the financing cost of our borrowings. Changes in interest rates may affect our net interest income from loans and other investments. Interest rate fluctuations resulting in our interest and related expense exceeding interest and related income would result in operating losses for us. To the extent that our financing costs are determined by reference to floating rates, such as LIBOR, SOFR or a Treasury index, the amount of such costs will depend on the level and movement of interest rates. Until recently, interest rates remained at relatively low levels and the Federal Reserve maintained the federal funds rate target range at 0.00% to 0.25% for much of 2020 and 2021. However, in response to the inflationary pressures, earlier in 2022 the Federal Reserve began raising its federal funds rate target range and indicated that, due to the persistent high rate of inflation, it anticipates further increases in interest rates throughout 2022 and into 2023. Any such increases could adversely affect our results of operations and financial condition. In a period of rising interest rates, our interest expense on floating rate borrowings would increase, while any additional interest income we earn on our floating rate investments may be subject to caps and/or in-the-money floors that may limit the growth of our interest income until interest rates rise above such floors, or loans with such floors are repaid or refinanced, and may not compensate for such increase in interest expense. Any such scenario could adversely affect our results of operations, interest coverage ratio and financial condition.
Although our strategy is to primarily originate, invest in and manage senior floating-rate commercial mortgage loans, from time-to-time we may acquire fixed-rate investments, which exposes our operating results to the risks posed by fluctuations in interest rates. To the extent that this applies to us, we may choose to actively manage this risk through the use of hedging strategies.
Summary of Results of Operations and Financial Condition
Our GAAP net loss attributable to common stockholders was $(17.4) million (or $(0.32) per basic weighted average share) for the three months ended June 30, 2022, as compared to GAAP net income attributable to common stockholders of $1.0 million (or $0.02 per basic weighted average share) for the three months ended March 31, 2022. The decrease in GAAP results was primarily due to provision for credit losses of $(13.6) million and charge on early extinguishment of debt of $(13.0) million incurred during the three months ended June 30, 2022.
Comparison of the Three Months Ended June 30, 2022, and March 31, 2022
Net Interest Income
The following table presents the components of interest income and interest expense for the three months ended June 30, 2022, and the three months ended March 31, 2022:
| | | | | | | | | | | | | | | | | | | | | | | | | | | | | | | | |
| (in thousands) | | | | | | | | | | | | | | | | |
| Income Statement Data: | | | June 30, 2022 | | March 31, 2022 | | Q2’22 vs Q1’22 | | | | | | | | | | | | | |
| Interest income: | | | | | | | | | | | | | | | | | | |
| Loans held-for-investment | | | $ | 49,056 | | | $ | 47,298 | | | $ | 1,758 | | | | | | | | | | | | | | |
| | | | | | | | | | | | | | | | | | | | |
| | | | | | | | | | | | | | | | | | | | |
| | | | | | | | | | | | | | | | | | | | |
| Cash and cash equivalents | | | 223 | | | 23 | | | 200 | | | | | | | | | | | | | | |
| Total interest income | | | 49,279 | | | 47,321 | | | $ | 1,958 | | | | | | | | | | | | | | |
| Interest expense: | | | | | | | | | | | | | | | | | | | | |
| Repurchase facilities | | | 10,380 | | | 5,008 | | | 5,372 | | | | | | | | | | | | | | |
| Securitized debt obligations | | | 10,844 | | | 9,732 | | | 1,112 | | | | | | | | | | | | | | |
| Convertible senior notes | | | 4,572 | | | 4,546 | | | 26 | | | | | | | | | | | | | | |
| Term financing facility | | | 340 | | | 1,373 | | | (1,033) | | | | | | | | | | | | | | |
| Asset-specific financings | | | 322 | | | 282 | | | 40 | | | | | | | | | | | | | | |
| | | | | | | | | | | | | | | | | | | | |
| Senior secured term loan facilities | | | 886 | | | 2,868 | | | (1,982) | | | | | | | | | | | | | | |
| | | | | | | | | | | | | | | | | | | | |
| Total interest expense | | | 27,344 | | | 23,809 | | | 3,535 | | | | | | | | | | | | | | |
| Net interest income | | | 21,935 | | | 23,512 | | | (1,577) | | | | | | | | | | | | | | |
The majority of our interest-earning assets and liabilities have floating rates based on an index (e.g., one-month LIBOR/SOFR) plus a credit spread. As a result, our asset yields and cost of funds are impacted by changes in market interest rates and credit spreads on investments and borrowings, as well as changes in the mix of our investment portfolio credit spreads due to new originations, loan amendments, additional fundings, upsizings and repayments.
Interest Income
Interest income for the three months ended June 30, 2022, increased to $49.3 million from $47.3 million mainly due to a higher average balance of our interest-earning assets and an increase in interest rates.
Interest Expense
Interest expense for the three months ended June 30, 2022, increased to $27.3 million from $23.8 million mainly due to higher average borrowings on repurchase facilities and higher short-term interest rates, partially offset by a lower average balance on higher-cost senior secured term loan facilities and the term financing facility.
Provision for Credit Losses
Consistent with the methodology used during the adoption of ASU 2016-13 on January 1, 2020, we continue to use a probability-weighted analytical model to estimate and recognize an allowance for credit losses on loans held-for-investment and their related unfunded commitments. Additionally, in determining the allowance for credit losses estimate through June 30, 2022, we employed third party licensed macroeconomic forecasts, over the reasonable projection period. Significant inputs to our estimate of the allowance for credit losses include loan specific factors such as DSCR, LTV, remaining loan term, property type and others. As part of our quarterly review of our loan portfolio, we assess the repayment date of each loan, which is used to determine the contractual term for purposes of computing our CECL reserve. In certain instances, for loans with unique risk characteristics, we may instead elect to employ different methods to estimate loan losses that also conform to ASU 2016-13 and related guidance.
Allowance for credit losses related to off-balance sheet future funding commitments is recorded as a component of other liabilities. Changes in the provision for credit losses for both the assets and their related unfunded commitments are recognized through net (loss) income on the condensed consolidated statements of comprehensive (loss) income. The following table presents the primary components of (provision for) benefit from credit losses for the three months ended June 30, 2022, and March 31, 2022:
| | | | | | | | | | | | | | | | | |
| Three Months Ended June 30, | | | | Three Months Ended March 31, | | | | |
| (in thousands) | 2022 | | | | 2022 | | | | |
| (Provision for) benefit from credit losses on: | | | | | | | | | |
| Loans held-for-investment | $ | (13,126) | | | | | $ | (3,364) | | | | | |
| | | | | | | | | |
| | | | | | | | | |
| Other liabilities | (1,013) | | | | | (324) | | | | | |
| Recoveries of amounts previously written off | 512 | | | | | — | | | | | |
| Total (provision for) benefit from credit losses | $ | (13,627) | | | | | $ | (3,688) | | | | | |
During the three months ended June 30, 2022, we recorded a provision for credit losses of $(13.6) million, which included a recovery of amounts previously written off of $0.5 million. The increase in our condensed consolidated balance sheetsestimate of allowance for credit losses was primarily driven by implementing in our analysis a more conservative macroeconomic forecast due to an elevated uncertainty for macroeconomic outlook due to inflationary pressures, continuing supply chain disruptions, interest rate volatility and other factors and an increase of $(4.0) million in the provision on a collateral-dependent loan.
Loss on Extinguishment of Debt
Loss on extinguishment of debt for the three months ended June 30, 2022, increased to $(13.0) million from $(5.8) million mainly due to the payoff of the remaining $100.0 million of senior secured term loan facilities and full repayment of the term financing facility, compared to a partial repayment of $50.0 million of the senior secured term loan facilities during the three months ended March 31, 2022.
Expenses
The following table presents the components of expenses for the three months ended June 30, 2022, and March 31, 2022: | | | | | | | | | | | | | | | |
| | | Three Months Ended June 30, | | Three Months Ended March 31, |
| (dollars in thousands) | | | | | 2022 | | 2022 |
| | | | | | | |
| Compensation and benefits | | | | | $ | 5,770 | | | $ | 5,816 | |
| Servicing expenses | | | | | $ | 1,500 | | | $ | 1,461 | |
| | | | | | | |
| | | | | | | |
| | | | | | | |
| | | | | | | |
| | | | | | | |
| | | | | | | |
| | | | | | | |
| Other operating expenses | | | | | $ | 2,185 | | | $ | 2,614 | |
| Annualized total operating expense ratio | | | | | 3.5 | % | | 3.7 | % |
| Annualized core operating expense ratio (excluding non-cash equity compensation) | | | | | 2.8 | % | | 2.9 | % |
We incur compensation and benefits expenses, servicing expenses related to the servicing of commercial real estate loans and other operating expenses. Compensation and benefits and servicing expenses for the three months ended June 30, 2022, as compared to the three months ended March 31, 2022, were relatively stable quarter over quarter. The decrease in other operating expenses for the three months ended June 30, 2022, as compared to the three months ended March 31, 2022, was primarily due to decrease in certain professional service fees. Our operating expense ratio, during the three months ended June 30, 2022, as compared to the three months ended March 31, 2022, decreased modestly primarily due to lower other operating expenses.
Comparison of the Six Months Ended June 30, 2022, and June 30, 2021 and December 31, 2020:
| | | | | | | | | | | | | | |
| (in thousands) | | September 30,
2021 | | December 31,
2020 |
| Balance Sheet Data: | | |
| | | | |
| Loans held-for-investment, net | | $ | 3,614,211 | | | $ | 3,847,803 | |
| Total assets | | $ | 3,899,190 | | | $ | 4,219,648 | |
| Repurchase facilities | | $ | 916,758 | | | $ | 1,708,875 | |
| Securitized debt obligations | | $ | 1,356,429 | | | $ | 927,128 | |
| Asset-specific financings | | $ | 44,752 | | | $ | 123,091 | |
| Term financing facility | | $ | 127,867 | | | $ | — | |
| Convertible senior notes | | $ | 272,512 | | | $ | 271,250 | |
| Senior secured term loan facilities | | $ | 208,785 | | | $ | 206,448 | |
| Total stockholders’ equity | | $ | 932,109 | | | $ | 933,846 | |
Results of Operations
Net Interest Income
The following table presents the components of interest income and interest expense for the threesix months ended September 30, 2021 and June 30, 2021,2022, and the ninesix months ended SeptemberJune 30, 2021 and 2020:2021:
| | | | | | | | | | | | | | | | | | | | | | | | | | | | | | | | | | | | | | | | | | | | | | | | | | | | |
| | Three Months Ended | | | | | | Nine Months Ended |
| (dollars in thousands) | | September 30, 2021 | | June 30, 2021 | | Q3’21 vs Q2’21 | | | | | | | | | | | | | | September 30, 2021 | | September 30, 2020 | | YTD’21 vs YTD’20 |
| Interest-earning assets | | | | | | | | | | | | | | | | | | | | | | | | |
| Loans held-for-investment/held-for-sale | | | | | | | | | | | | | | | | | | | | | | | | |
| Senior loans | | $ | 47,934 | | | $ | 48,970 | | | $ | (1,036) | | | | | | | | | | | | | | | $ | 150,561 | | | $ | 179,216 | | | $ | (28,655) | |
| Subordinated loans | | 378 | | | 380 | | | (2) | | | | | | | | | | | | | | | 1,140 | | | 2,020 | | | (880) | |
| Available-for-sale securities | | — | | | — | | | — | | | | | | | | | | | | | | | — | | | 646 | | | (646) | |
| Held-to-maturity securities | | — | | | — | | | — | | | | | | | | | | | | | | | — | | | 659 | | | (659) | |
| Other | | 95 | | | 103 | | | (8) | | | | | | | | | | | | | | | 298 | | | 424 | | | (126) | |
| Total interest income | | $ | 48,407 | | | $ | 49,453 | | | $ | (1,046) | | | | | | | | | | | | | | | $ | 151,999 | | | $ | 182,965 | | | $ | (30,966) | |
| Interest-bearing liabilities | | | | | | | | | | | | | | | | | | | | | | | | |
| Borrowings collateralized by: | | | | | | | | | | | | | | | | | | | | | | | | |
| Loans held-for-investment/held-for sale | | | | | | | | | | | | | | | | | | | | | | | | |
| Senior loans | | $ | 16,028 | | | $ | 16,410 | | | $ | (382) | | | | | | | | | | | | | | | $ | 48,938 | | | $ | 71,189 | | | $ | (22,251) | |
| Subordinated loans | | 67 | | | 67 | | | — | | | | | | | | | | | | | | | 201 | | | 253 | | | (52) | |
| Available-for-sale securities | | — | | | — | | | — | | | | | | | | | | | | | | | — | | | 198 | | | (198) | |
| Held-to-maturity securities | | — | | | — | | | — | | | | | | | | | | | | | | | — | | | 210 | | | (210) | |
| Other: | | | | | | | | | | | | | | | | | | | | | | | | |
| Senior secured term loan facilities | | 5,654 | | | 5,653 | | | 1 | | | | | | | | | | | | | | | 16,587 | | | 145 | | | 16,442 | |
| Convertible senior notes | | 4,556 | | | 4,544 | | | 12 | | | | | | | | | | | | | | | 13,618 | | | 13,570 | | | 48 | |
| Total interest expense | | 26,305 | | | $ | 26,674 | | | (369) | | | | | | | | | | | | | | | $ | 79,344 | | | $ | 85,565 | | | (6,221) | |
| Net interest income | | $ | 22,102 | | | $ | 22,779 | | | $ | (677) | | | | | | | | | | | | | | | $ | 72,655 | | | $ | 97,400 | | | $ | (24,745) | |
| | | | | | | | | | | | | | | | | | | | | | | | | | | | | | | | |
| (in thousands) | | | | | | | | | | | | | | |
| Income Statement Data: | | | June 30, 2022 | | June 30, 2021 | | YTD’22 vs YTD’21 | | | | | | | | | | | | | |
| Interest income: | | | | | | | | | | | | | | | | | | |
| Loans held-for-investment | | | $ | 96,354 | | | $ | 103,389 | | | $ | (7,035) | | | | | | | | | | | | | | |
| | | | | | | | | | | | | | | | | | | | |
| | | | | | | | | | | | | | | | | | | | |
| | | | | | | | | | | | | | | | | | | | |
| Cash and cash equivalents | | | 246 | | | 203 | | | 43 | | | | | | | | | | | | | | |
| Total interest income | | | 96,600 | | | 103,592 | | | $ | (6,992) | | | | | | | | | | | | | | |
| Interest expense: | | | | | | | | | | | | | | | | | | | | |
| Repurchase facilities | | | 15,388 | | | 14,998 | | | 390 | | | | | | | | | | | | | | |
| Securitized debt obligations | | | 20,576 | | | 11,746 | | | 8,830 | | | | | | | | | | | | | | |
| Convertible senior notes | | | 9,118 | | | 9,062 | | | 56 | | | | | | | | | | | | | | |
| Term financing facility | | | 1,713 | | | 4,755 | | | (3,042) | | | | | | | | | | | | | | |
| Asset-specific financings | | | 604 | | | 1,545 | | | (941) | | | | | | | | | | | | | | |
| | | | | | | | | | | | | | | | | | | | |
| Senior secured term loan facilities | | | 3,754 | | | 10,933 | | | (7,179) | | | | | | | | | | | | | | |
| | | | | | | | | | | | | | | | | | | | |
| Total interest expense | | | 51,153 | | | 53,039 | | | (1,886) | | | | | | | | | | | | | | |
| Net interest income | | | 45,447 | | | 50,553 | | | (5,106) | | | | | | | | | | | | | | |
The majority of our interest-earning assets and liabilities have floating rates based on an index (e.g., 1-month LIBOR)one-month LIBOR/SOFR) plus a credit spread. As a result, our asset yields and cost of funds are impacted by changes in market interest rates and credit spreads on investments and borrowings, as well as changes in the mix of our investment portfolio credit spreads due to new originations, amendments of existing investments, additional fundings, upsizings and repayments.
Interest Income
Interest income decreased from $49.5 million to $48.4 million for the threesix months ended June 30, 2021 and September 30, 2021, respectively. This decrease is2022, decreased to $96.6 million from $103.6 million mainly due to the decline in accelerated amortization of loan fees driven by higher volume of repayments and principal amortization of loans held-for-investment of $422.5 million during the three months ended June 30, 2021 versus $290.5 million during the three months ended September 30, 2021.
Interest income decreased from $183.0 million to $152.0 million for the nine months ended September 30, 2020 and September 30, 2021, respectively. The decrease is due to a lower average portfolio balance of our interest-earning assets, excluding nonaccrual loans, partially offset by an increase in interest rates net of the impact of interest rate floors on our assets.
Interest Expense
Interest expense for the six months ended June 30, 2022, decreased to $51.2 million from $53.0 million mainly due to a lower average balance on senior secured term loan facilities, partially offset by an increase in interest rates.
Provision for Credit Losses
Allowance for credit losses related to off-balance sheet future funding commitments is recorded as a component of other liabilities. Changes in the provision for credit losses for both the assets and a decrease in average LIBOR.their related unfunded commitments are recognized through net (loss) income on the condensed consolidated statements of comprehensive (loss) income. The following table presents the components of (provision for) benefit from credit losses for the six months ended June 30, 2022, and June 30, 2021:
| | | | | | | | | | | | | | | | | |
| Six Months Ended June 30, | | | | Six Months Ended June 30, | | | | |
| (in thousands) | 2022 | | | | 2021 | | | | |
| (Provision for) benefit from credit losses on: | | | | | | | | | |
| Loans held-for-investment | $ | (16,490) | | | | | $ | 8,996 | | | | | |
| | | | | | | | | |
| | | | | | | | | |
| Other liabilities | (1,337) | | | | | 316 | | | | | |
| Recoveries of amounts previously written off | 512 | | | | | — | | | | | |
| Total (provision for) benefit from credit losses | $ | (17,315) | | | | | $ | 9,312 | | | | | |
Interest Expense
Interest expense moderately decreased from $26.7 million to $26.3 million forDuring the threesix months ended June 30, 20212022, we recorded a provision for credit losses of $(17.3) million. The increase in our estimate of allowance for credit losses was primarily driven by a write-off of $(10.1) million on the sale of a loan and September 30, 2021, respectively.an increase of $(4.0) million in the provision on a collateral-dependent loan. The changeremaining increase in our provision for credit losses was related to changes in the portfolio mix and implementing in our analysis a more conservative macroeconomic forecast due to an elevated uncertainty for macroeconomic outlook due to inflationary pressures, continuing supply chain disruptions, interest expense between these two comparable periods is immaterial.rate volatility and other factors, partially offset by a recovery of amounts previously written off of $0.5 million.
Interest expense decreased from $85.6 million to $79.3 million forLoss on Extinguishment of Debt
During the ninesix months ended SeptemberJune 30, 2020 and September2022, we recorded a loss on extinguishment of debt of $(18.8) million, compared to no repayments during the six months ended June 30, 2021, respectively.2021. The decreaseincrease is due to a lower average borrowings balance, offset by a decrease in average LIBOR and the additionpayoff of the remaining $150.0 million of senior secured term loan facilities.financing facilities and the full repayment of the term financing facility during the six months ended June 30, 2022.
Operating Expenses
We incur significant general and administrative costs, including costs related to employee compensation and benefits, expenses related to servicing of our loan portfolio, costs related to technology infrastructure, rent and utilities, and certain costs related to being a public company. The following table presents the components of expenses for the threesix months ended SeptemberJune 30, 20212022, and June 30, 2021,2021: | | | | | | | | | | | | | | | |
| | | Six Months Ended June 30, | | Six Months Ended June 30, |
| (dollars in thousands) | | | | | 2022 | | 2021 |
| | | | | | | |
| Compensation and benefits | | | | | $ | 11,586 | | | $ | 10,477 | |
| Servicing expenses | | | | | $ | 2,961 | | | $ | 2,440 | |
| | | | | | | |
| | | | | | | |
| | | | | | | |
| | | | | | | |
| | | | | | | |
| | | | | | | |
| | | | | | | |
| Other operating expenses | | | | | $ | 4,799 | | | $ | 4,691 | |
| Annualized total operating expense ratio | | | | | 3.6 | % | | 3.7 | % |
| Annualized core operating expense ratio (excluding non-cash equity compensation) | | | | | 2.8 | % | | 2.8 | % |
We incur compensation and the nine months ended September 30, 2021 and 2020:
| | | | | | | | | | | | | | | | | | | | | | | | | | | | | | | | | | | | | | | | | | | | | |
| Three Months Ended | | | | Nine Months Ended | | |
| (in thousands, except share data) | September 30, 2021 | | June 30, 2021 | | Q3’21 vs. Q2’21 | | | | | | | | September 30, 2021 | | September 30, 2020 | | Q3’21 vs. Q3’20 | | | | |
| Base management fees | $ | — | | | $ | — | | | $ | — | | | | | | | | | $ | — | | | $ | 11,840 | | | $ | (11,840) | | | | | |
| Compensation and benefits | 5,634 | | | 5,017 | | | 617 | | | | | | | | | 16,111 | | | 11,673 | | | 4,438 | | | | | |
| Servicing expenses | 1,323 | | | 1,124 | | | 199 | | | | | | | | | 3,763 | | | 3,025 | | | 738 | | | | | |
| Restructuring charges | — | | | — | | | — | | | | | | | | | — | | | 43,682 | | | (43,682) | | | | | |
| | | | | | | | | | | | | | | | | | | | | |
| | | | | | | | | | | | | | | | | | | | | |
| | | | | | | | | | | | | | | | | | | | | |
| | | | | | | | | | | | | | | | | | | | | |
| | | | | | | | | | | | | | | | | | | | | |
| | | | | | | | | | | | | | | | | | | | | |
| Other operating expenses | 2,276 | | | 2,564 | | | (288) | | | | | | | | | 6,967 | | | 12,748 | | | (5,781) | | | | | |
| Annualized operating expense ratio | 3.9 | % | | 3.6 | % | | 0.3 | % | | | | | | | | 5.6 | % | | 5.1 | % | | 0.5 | % | | | | |
| Annualized operating expense ratio, excluding non-cash equity compensation and other one-time expenses | 3.0 | % | | 3.0 | % | | — | % | | | | | | | | 3.0 | % | | 4.2 | % | | (1.2) | % | | | | |
Prior to the Internalization, we paid the Former Manager a base management fee and, when applicable, an incentive fee. The base management fee was calculated based on our equity with certain adjustments outlined in the management agreement with the Former Manager, or the Former Management Agreement. The incentive fee was calculated based on historical “core earnings,” as defined in the Former Management Agreement, as well as our equity with certain adjustments outlined in the Former Management Agreement. Following the Internalization, we no longer incur management or incentive fees, but we incurbenefits expenses, associated with being an internally managed REIT, including certain compensation expenses, which were previously borne by the Former Manager.
In connection with the Internalization, the Company extended offers of employment and hired 31 employees.The three months ended March 31, 2021 was the first period in which the Company began reportingservicing expenses related to compensationthe servicing of commercial real estate loans and other operating expenses. Compensation and benefits relatedexpenses for the six months ended June 30, 2022, as compared to its employees.For comparison purposes, the Company reallocatedsix months ended June 30, 2021, increased primarily due to an increase in compensation relatedagreements in early 2022. Servicing expenses including amortization of non-cash equity compensation, fromfor the six months ended June 30, 2022, as compared to the six months ended June 30, 2021, increased primarily due to an increase in billings under our servicing agreements. The increase in other operating expenses for the ninesix months ended SeptemberJune 30, 2020.The compensation and benefits expense line item on2022, as compared to the Company’s income statement is comprised primarily of base salaries, cash bonuses, non-cash equity-based compensation and other employee benefits and employer payroll taxes.
Expenses modestly increased from $8.7 million for the threesix months ended June 30, 2021, was primarily due to $9.2 million forincreased professional service fees. Our operating expense ratio during the threesix months ended SeptemberJune 30, 2021. The increase was primarily driven by higher non-cash equity compensation expenses and servicing expenses, offset by a decrease in professional services fees.
Expenses decreased from $83.0 million2022, as compared to $26.8 million for the ninesix months ended September 30, 2020 and SeptemberJune 30, 2021, respectively. The decrease was primarily driven by management fees, restructuring charges, and higher professional service fees incurred during the nine months ended September 30, 2020, partially offset by higher compensation costs in 2021.
Benefit from (Provision for) Credit Losses
During the three months ended September 30, 2021, our provision for credit losses decreased by $5.8 million, which contributed to the decline in the overall allowance for credit losses to $47.4 million at September 30, 2021 from $62.9 million at June 30, 2021. The remaining decrease in allowance for credit losses was largely related to the $9.7 million write-off on a loan held-for-investment and a release of reserve of $3.2 million on unfunded commitments on a collateral-dependent loan, which were deemed unlikely to be funded given the loan’s delinquent status.
Refer to Note 2 - Summary of Significant Accounting Policies and Note 3 - Loans Held-for-Investment, Net of Allowance for Credit Losses for additional information related to our General CECL allowance.remained relatively stable year over year.
Liquidity and Capital Resources
Liquidity is a measure of our ability to meet potential cash requirements, including ongoing commitments to repay borrowings, fund and maintain our target investments and operations, make distributions to our stockholders and meet other general business needs. We use cash to acquire our target investments, satisfy our obligations under our unfunded loan commitments on existing assets, repay principal and interest on our borrowings, make distributions to our stockholders and fund our operations.
In light of the COVID-19 pandemic and its severe impact on the economy, real estate and financial markets, we have taken several steps to increase our cash balances, such as opportunistically selling certain loans and our borrowing of $225.0 million of loans under five-year senior secured term loan facilities, in order to maintain an adequate level of liquidity to meet future outflows. As the duration and severity of COVID-19 remain unknown, we will continue to closely monitor the pandemic and its impact on us, our borrowers, our sponsors and their properties serving as collateral on our loans, our financing sources and the overall economy. Because the severity, magnitude and duration of the COVID-19 pandemic and its economic consequences continue to be highly uncertain, changing and challenging to predict, the pandemic’s impact on our operations and liquidity remains uncertain and difficult to predict.
Capitalization
To date we have capitalized our business primarily through the issuance and sale of shares of our common and preferred stock, borrowings under our secured financing facilities, issuance of CRE CLOs, borrowings under our senior secured term loan facilities and the issuance and sale of convertible notes. As of SeptemberJune 30, 2021,2022, our capitalization included $0.5$0.3 billion of corporate debt and $2.4$2.7 billion of loan-level financing. No portion of our corporate debt as of June 30, 2022, matures before December 2022, and our loan-level financing as of June 30, 2022, is generally term-matched or matures in 2022 or later. Our $2.4$2.7 billion of loan-level financing as of June 30, 2022, includes $916.8 million$1.3 billion of secured repurchase agreements, $1.4 billion of CRE CLO securitizations, which are term-matched to the underlying assets, non-recourse and non-mark-to-market $127.9 million of term financing facility and $44.8$43.6 million of asset-specific financing facility.
See Note 4 - Variable Interest Entities and Securitized Debt Obligations to our consolidated financial statements for additional details regarding our securitized debt obligations.
See, Note 5 - Secured Financing Agreements to our consolidated financial statements for additional details regarding our secured repurchase facilities, asset-specific financing facility, and term financing facility.
See, Note 6 - Convertible Senior Notes to our consolidated financial statements for additional details regarding our secured senior convertible notes.
Seeand Note 7 - Senior Secured Term Loan Facilities to our consolidated financial statementsCondensed Consolidated Financial Statements included in this Quarterly Report on Form 10-Q for additional details regarding our securitized debt obligations; our secured financing facilities; our secured convertible senior notes; and our senior secured term loan facilities.facilities, respectively.
Leverage
From March 31, 2022, to June 30, 2021 to September 30, 2021,2022, our debt-to-equity ratio, defined as total debt, net of cash, divided by total equity, increased from 2.8:2.5:1.0 to 3.0:1.0.2.7:1.0, mainly driven by a modest increase in loan-level financing and common share repurchases. As part of our investment strategy, we plan to finance our target assets with a moderate amount of leverage, the level of which may vary based upon the particular characteristics of our portfolio and market conditions. To that end, subject to maintaining our qualification as a REIT and our exclusion from registration under the Investment Company Act, we intend to use borrowings to fund the origination or acquisition of our target investments. Given our focus on senior floating-rate mortgage loans, we currently expect that such leverage will be, on a total debt-to-equity ratio basis, within a range of 3.0:1.0 and 3.5:1.0; however, our leverage may vary and differ from our expectations depending on market conditions and any steps we may take to strengthen our balance sheet and enhance our liquidity position. The amount of leverage we deploy for our target investments
depends upon our assessment of a variety of factors, which may include the anticipated liquidity and price volatilityany changes in value of the investments in our portfolio, the potential for losses in our portfolio, the gap between the durationmaturities of our assets and liabilities, the availability and cost of financing theour investments, our opinion of the creditworthiness of our financing counterparties, the health of the U.S. economy and commercial real estate financing markets, our outlook for the level and volatility of interest rates, the slope of the yield curve, the credit quality of our investments, the collateral underlying our investments and our outlook for investment credit spreads relative to LIBOR.LIBOR and/or SOFR.
Sources of Liquidity
Our primary sources of liquidity include cash and cash equivalents on our condensed consolidated balance sheets, any approved but unused borrowing capacity under our financing facilities, the net proceeds of future public and private equity and debt offerings, payments of principal, including loan repayments and prepayments, loan sales, interest we receive on our portfolio of assets and cash generated from our operating results.
The following table sets forth our sources of liquidity as of SeptemberJune 30, 2021:2022:
| | | | | | | | |
| | ThreeSix Months Ended |
| (in thousands) | | SeptemberJune 30, 20212022 |
| Cash and cash equivalents | | $ | 154,916150,192 | |
| Approved but unused borrowing capacity on financing facilities | | — | |
| | |
| Total | | $ | 154,916150,192 | |
Unused borrowing capacity on our uncommitted financing facilities may be a potential source of liquidity to finance unpledged commercial real estate loans held-for-investment and unpledged funded loan commitments on our existing loans held-for-investment that are pledged on such facilities. Given the uncommitted nature of such financing facilities, obtaining
liquidity on such unpledged loans and unpledged funded loan commitments is to varying degrees at the discretion of our lending counterparties and may not be available to us when desired.
Other than capital markets activities, investment repayments and prepayments typically comprise our largest source of incremental liquidity. For the nine months ended September 30, 2021, investment repayments and principal amortization totaled $815.1 million.
Depending on capital markets conditions, weWe have access to liquidity through public and/or private offerings of debt and equity securities, including shares of preferred stock and convertible securities. We intendsubject to maintainmarket conditions. To facilitate such offerings, in August 2021, we filed a shelf registration statement with the SEC that is effective for a term of three years and expires in August 2024. The amount of securities to facilitatebe issued pursuant to this shelf registration statement was not specified when it was filed and there is no specific dollar limit on the saleamount of securities we may issue. The securities covered by this registration statement include: (i) common stock, (ii) preferred stock, (iii) depositary shares representing preferred stock and (iv) debt and equity securities. AtThe specifics of any givenfuture offerings, along with the use of proceeds of any securities offered, will be described in detail in a prospectus supplement, or other offering materials, at the time andof any offering.
We may also access liquidity through our at-the-market stock offering program, pursuant to which we may sell, from time to time, up to 4,757,636 additional shares of our common stock as of June 30, 2022. See Note 12 – Stockholders’ Equity to our Condensed Consolidated Financial Statements included in this Quarterly Report on Form 10-Q for additional details.
Although we may be evaluating or pursuing one or more transactionsgenerally intend to improve our liquidity or to refinance our debt or may otherwise seek transactions to reduce our interest expense or leverage and extend our debt maturities.
In the future, we may use other sources of financing to fund the origination or acquisition ofhold our target investments includingas long-term investments, we have opportunistically sold, and may again in the future sell, certain of our assets in order to manage our liquidity needs, to meet other operating objectives and to adapt to market conditions. We cannot predict the timing and impact of future sales of our assets, if any. Since many of our assets are financed with secured financing facilities and other secured and unsecured forms of borrowing. These financings may be collateralized and/or non-collateralized and may involve one or more lenders. We expect that these facilities will typically have maturities ranging from two to five years and may accrue interest at either fixed or floating rates. We may also finance our business through the nonrecourse sale of senior loan interests. We may also increase our proportion of credit non-mark-to-market financing on our commercial real estate loan portfolio through additional CRE CLOs, or other securitizations, if available. There cana significant portion of the proceeds from sales of our assets, prepayments and scheduled amortization would be no assurance that we will be ableused to consummate any suchrepay balances under these financing on a timely basis, or at all, or that the financing will be on commercially reasonable terms.arrangements.
We remain focused on actively managing our balance sheet and enhancing our liquidity position to best position us for the market environment, satisfy our loan future funding and financing obligations and to make new investments, which we expect will cause us to take, and in some instances has already caused us to take, some or all of the following actions: raise capital from offerings of equity and/or debt securities, on a public or private basis; borrow additional capital; post additional collateral; sell assets; and/or change our dividend policy, which we will continue to evaluate in respect of future quarters based upon customary considerations, including market conditions and distribution requirements to maintain our REIT status.
Although At any given time and from time to time we generally intendmay be evaluating or pursuing one or more transactions, including loan sales, capital markets activities and other sources of funding, to hold our target investments as long-term investments, we have opportunistically sold, and may again in the future sell, certain of our assets in order to manageimprove our liquidity needs,or to meet other operating objectivesrefinance our debt or may otherwise seek transactions to reduce our interest expense or leverage and to adapt to market conditions. Commercial real estate loan sales are subject to longer timelines than securitiesextend our debt maturities, which transactions, and, as a result,depending on market conditions could significantly and adversely affect the liquidity of our assets. Any illiquidity of our assets may make it difficult for us to sell such assets if the need or desire arises. Our ability to quickly sell certain assets may be limited by delays due to the time period needed for negotiating transaction documents and conducting diligence. Consequently, even if we identify buyers for our commercial real estate loans, there is no assurance that we would be able to quickly sell such assets, if the need or desire arises. Additionally, we cannot provide any assurance that the economic and market impact of the COVID-19 pandemic would not make it more difficult to sell certain of our assets or that it would not have a material impact on the value of our assets.
In addition, if we are required to liquidate all or a portion of our portfolio quickly, we may realize significantly less than the value at which we previously recorded our assets. Assets that are illiquid are more difficult to finance, and to the extent that we use leverage to finance assets that become illiquid, we may lose that leverage or have it reduced. Assets tend to become less liquid during times of financial stress, which is often the time that liquidity is most needed. As a result, our ability to sell assets or vary our portfolio in response to changes in economic and other market conditions may be limited by liquidity constraints, whichfactors, could adversely affectresult in actual losses and/or otherwise negatively impact our results of operations and financial condition.
We cannot predict the timing and impact of future sales of our assets, if any. Since many of our assets are financed with secured financing facilities and/in one or CRE CLOs, a significant portion of the proceeds from sales of our assets, prepayments and scheduled amortization would be used to repay balances under these financing arrangements.more periods.
Liquidity Needs
In addition to our loan origination activities and general operating expenses, our primary liquidity needs include interest and principal payments under our $3.0 billion of outstanding borrowings under our repurchase facilities, our collateralized loan obligations, our term financing facility, our asset-specific financing facility our senior secured term loan facilities, ourand convertible senior notes, $430.1notes; $358.7 million of unfunded loan commitmentscommitments; and dividend distributions to our preferred and common stockholders.
Financing Availability
We are subject to the availability and cost of financing to successfully execute on our business strategy and generate attractive risk-adjusted returns to our stockholders. Much of our financing is in the form of repurchase facilities or other types of credit facilities provided to us by our lender counterparties. We mitigate this counterparty risk by seeking to diversify our lending partners, focusing on establishing borrowing relationships with strong counterparties and continuously monitoring them through a thoughtful approach to counterparty risk oversight. Additionally, as part of our broader risk management strategy, and to the extent available in the market, we finance our business through other means which may include, but not be limited to, CRE CLOs, note sales and the issuance of unsecured debt and equity instruments. We continue to actively explore additional
CRE CLOs, note sales and the issuance of unsecured debt and equity instruments. We continue to actively explore additional types of funding facilities in order to further diversify our financing sources. The COVID-19 pandemic hasand sharp increases in interest rates have resulted in significant disruptions in financial markets and uncertainty about the overall macroeconomic outlook. Declines in economic conditions could negatively impact real estate and real estate capital markets, which could make it more difficult for us to obtain or maintain financing.
The following table provides the maturities of our repurchase facilities, asset-specific financing facility, term financing facility, securitized debt obligations, long-term senior secured term loan facilities and convertible senior notes, net of deferred debt issuance costs, as of SeptemberJune 30, 20212022, and December 31, 2020:2021:
| | (in thousands) | (in thousands) | September 30,
2021 | | December 31,
2020 | (in thousands) | June 30,
2022 | | December 31,
2021 |
| Within one year | Within one year | $ | 1,522,713 | | | $ | 1,763,359 | | Within one year | $ | 1,888,990 | | | $ | 1,530,671 | |
| One to three years | One to three years | 1,067,739 | | | 1,266,985 | | One to three years | 1,104,070 | | | 1,096,112 | |
| Three to five years | Three to five years | 336,652 | | | 205,647 | | Three to five years | 21,599 | | | 311,710 | |
| Five years and over | Five years and over | — | | | — | | Five years and over | — | | | — | |
| Total | Total | $ | 2,927,104 | | | $ | 3,235,991 | | Total | $ | 3,014,659 | | | $ | 2,938,493 | |
Cash Flows
FromFor the three months ended June 30, 2021 to September 30, 2021 and September 30, 2020 to September 30, 2021,2022, our restricted and unrestricted cash and cash equivalents balance decreased approximately $63.5$34.4 million, and $153.7 million, respectively, to $175.5$219.7 million. The cash movements can be summarized by the following:
•Cash flows from operating activities. For the three and nine months ended SeptemberJune 30, 2021,2022, operating activities increased our cash balances by approximately $14.3$9.6 million, and $45.0 million, respectively, primarily driven by our financial results.
•Cash flows from investing activities. For the three months ended SeptemberJune 30, 2021,2022, investing activities decreased our cash balances by approximately $97.4$91.0 million, primarily driven by originations of loans held-for-investment, offset by repayments of loans held-for-investment. For the nine months ended September 30, 2021, investing activities increased our cash balances by approximately $198.4 million, primarily driven by repayments of loans held-for-investment partially offset by originations of loans held-for-investment.and proceeds from loan sales.
•Cash flows from financing activities. For the three months ended SeptemberJune 30, 2021,2022, financing activities increased our cash balancebalances by approximately $19.6$47.0 million, primarily driven by proceeds from repurchase facilities and issuance of preferred stock, offset by principal payments on repurchase facilities, principal payments on securitized debt obligations, repayment of other debt facilities. Forsenior secured term loan facilities, the nineterm financing facility and share repurchases.
Corporate Activities
Senior Secured Term Loan Facilities Payoff
During the three months ended SeptemberJune 30, 2021, financing activities decreased our cash balances by approximately $397.12022, we prepaid the remaining $100.0 million primarily driven by repayments of repurchase facilities, partially offset by proceeds from the issuance of securitized debt obligations.
Recent Market Conditions
Prior to the COVID-19 pandemic, the commercial real estate debt markets offered compelling investment opportunities, especially when approached fundamentally, with a focus on strong credit and cash flow characteristics and high-quality properties and sponsors. These investment opportunities were supported by active real estate transaction volumes, the continuous need for refinancing of legacy loans and borrower and sponsor demand for debt capital to renovate, reposition or redevelop their properties. Additionally, the stricter regulatory environment after the financial crisis from 2007 to 2009 for traditional providers of financing in this market, such as banks and insurance companies, limited the capacity of available funding for certain types of commercial real estate loans that comprise a large part of our target investments. Although the COVID-19 pandemic continues to generate an elevated degree of uncertainty with respect to the overall economic environment and many segments of the commercial real estate market,$225.0 million we believe that, over time, as the market activity continues to normalize, U.S. commercial real estate will continue to be viewed as an attractive asset class and will provide us with the opportunities consistent withborrowed under our investment strategy to invest our capital and generate attractive, risk-adjusted returns for our stockholders over the long-term. Certain segmentssenior secured term loan facilities, resulting in a total payment of approximately $105.7 million, inclusive of the commercial real estate market, such as lodgingprincipal amount, prepayment penalty and retail, have been affected more significantly than others, resulting in multiple retail sector bankruptcies, for example, as more consumer demand has shifted to internet related purchases. This retail property stress has benefited the industrial sector, which has seen increased demand for “last-mile” distribution sites in certain markets. The lodging sector has also experienced significant dislocation and the general market expectation is that it will takeaccrued interest. As a while for it to completely recover; however, given the natureresult of lodging, certain sub-sectors may experience recovery atthis repayment, we realized a quicker pacecharge on early extinguishment of recovery than others. The multifamily sector has performed relatively well through this crisis, though the future path may be dependent to a degree on interest rate levels and additional federal government stimulus. Office properties have performed well, though there has been a noticeable slowdown in leasing activity, but the longer-term impactdebt of approximately $(11.3) million, or $(0.21) per basic share, comprised of the COVID-19 pandemic remains uncertain considering remote working and other potential operational changes by the tenants.
The COVID-19 pandemic has resulted in significant disruptions in financial markets, uncertainty about the overall macroeconomic outlookprepayment penalty and a dislocation in the commercial real estate sector,charge-off of unamortized discount including reduced borrower demand, higher lending rates, increased capitalization rates on properties and lower transaction volume. The dislocation in capital markets and decline in real estate sale transaction and refinancing activities have negatively impacted, and will likely continue to negatively impact, the volume of loan repayments and prepayments, which are a significant source of our liquidity and could make it more difficult for us to originate new loan investments.costs.
Due to the ongoing COVID-19 pandemic in the United States and globally, most of our borrowers, sponsors, their tenants, the properties serving as collateral on our loan investments and the economy as a whole have been, and will continue to be, adversely affected. The magnitude and duration of the COVID-19 pandemic and its impact on our borrowers and their tenants, cash flows and future results of operations could be significant and will largely depend on future developments, including with respect to the distribution and acceptance of vaccines and their effectiveness with respect to new variants of the COVID-19 virus, which remain uncertain and cannot be predicted. Accordingly, given the ongoing nature of the outbreak, at this time we cannot reasonably estimate the magnitude of the ultimate impact that the COVID-19 pandemic will have on our business, financial performance and operating results. Given the current highly uncertain environment, we may incur additional operating expenses for a period of time, which may be material, related to actively managing our investment portfolio, our funding sources and exploring additional financing and capital sources to help us to continue to manage through this period of economic uncertainty and market dislocation. The prolonged duration and impact of the COVID-19 pandemic could materially disrupt our business operations and impact our financial condition and performance, liquidity and ability to pay dividends, including the dividend on our common stock, which was temporarily suspended in the first quarter of 2020 and reinstated in the third quarter of 2020.
Critical Accounting Policies and Use of Estimates
Our discussion and analysis of our financial condition and results of operations is based upon our condensed consolidated financial statements, which have been prepared in accordance with GAAP. The preparation of these financial statements requires us to make estimates and assumptions that affect the reported amounts of assets, liabilities, revenue and expenses, and related disclosure of contingent assets and liabilities. Actual results could differ from these estimates.
Allowance for Credit Losses
We directly originate and acquire primarily senior floating-rate commercial mortgage loans and other debt and debt-like commercial real estate investments, generally to be held as long-term investments at amortized cost. We adopted ASU 2016-13, Financial Instruments - Credit Losses (Topic 326): Measurement of Credit Losses on Financial Instruments, or ASU 2016-13, which significantly changed how entities measure credit losses for most financial assets and replaced the incurred loss model with a CECL model for instruments measured at amortized cost. In addition, the new model applies to off-balance sheet credit exposures, such as our unfunded loan commitments. CECL amends the previous credit loss model to reflect our current estimate of our portfolio’s expected credit losses by incorporating reasonable and supportable forecasts including forward-looking information, in addition to historical experience and current market conditions.
ASU 2016-13 was adopted on January 1, 2020 and the initial allowance for credit losses was reflected as a direct charge to cumulative earnings. Subsequent changes to the allowance for credit losses have been and will continue to be recognized through net income (loss) on our condensed consolidated statements of operations. ASU 2016-13 specifies that the allowance should be based on relevant information about past events, including historical loss experience, current portfolio, market conditions and reasonable and supportable forecasts for the duration of each respective loan.
Considering the limited historical Company data related to any realized loan losses since our inception, to estimate our allowance for credit losses we use a probability-weighted analytical model that considers the likelihood of default and loss-given-default for each individual loan. The analytical model incorporates a third-party licensed database with historical loan losses from 1998 to 2020 for over 100,000 commercial real estate loans. Our allowance for credit losses reflects our estimates of the current and future economic conditions that impact the performance of the commercial real estate properties serving as collateral for our loan investments. These estimates include unemployment rates, interest rates, price indices for commercial property and other macroeconomic factors impacting the likelihood and magnitude of potential credit losses for our loans during their anticipated term. We license certain macroeconomic forecasts from a third-party to inform our view of the potential future impact that broader macroeconomic conditions may have on the performance of our loan portfolio. These forecasts are embedded in the licensed analytical model that we use to estimate our allowance for credit losses. We may use one or more of these forecasts in the process of estimating our allowance for credit losses. Selection of these economic forecasts requires significant judgment about future events that, while based on the information available to us as of the balance sheet date, are ultimately unknowable with certainty, and the actual economic conditions impacting our portfolio could vary significantly from the estimates we made for the periods presented. Significant inputs to our estimate of the allowance for credit losses include loan specific factors such as debt service coverage ratio, or DSCR, LTV, remaining loan term, property type and others.
In certain instances where we determine that a loan is no longer suited for our model-based approach due to its unique risk characteristics, or because we conclude that repayment of the loan’s principal is entirely collateral-dependent, we may instead elect to employ different methods to estimate loan losses that also conform to ASU 2016-13 and related guidance. If we determine that the recovery of that loan’s principal is entirely collateral-dependent, we may assess such an asset individually and elect to apply a practical expedient in accordance with ASU 2016-13. In such cases, the estimate of expected credit loss is measured as the difference between the loan’s amortized cost basis and the estimated fair value of the loan’s collateral. In order to estimate the allowance for credit loss associated with such a loan to reduce its carrying value, we may estimate the fair value of the collateral property, by using certain acceptable valuation techniques, which, among others, may include a discounted cash flow method of valuation less the estimated cost to foreclose and sell the property. The estimation of the fair value of the collateral property is also likely to involve using various Level 3 inputs, which may be in part developed based on discussions with various market participants and management’s best estimates as of the valuation date, and require significant judgment. Such inputs may include, among others, projections of property rents and cash flows over an assumed holding period; property operating expenses including real estate and income taxes; estimates of costs to acquire and sell the collateral property; assumed capitalization and discount rates; and overall market conditions.
The allowance for credit losses is estimated on a quarterly basis and represents management’s estimates of current expected credit losses in our investment portfolio, including unfunded loan commitments. Pools of loans with similar risk characteristics are collectively evaluated while loans that no longer share risk characteristics with loan pools are evaluated individually. Estimating an allowance for credit losses is inherently subjective, as it requires management to exercise significant judgment in establishing appropriate factors used to determine the allowance and a variety of subjective assumptions, including (i) determination of relevant historical loan loss data sets, (ii) projecting the expected timing and amount of future loan fundings and repayments, (iii) assessing the current credit quality of loans and operating performance of loan collateral, (iv) selecting the forecast for macroeconomic conditions and (v) determining the reasonable and supportable forecast period.
The allowance for loan losses also includes qualitative adjustments to bring the allowance to the level management believes is appropriate based on factors that have not otherwise been fully accounted for, including adjustments for foresight risk, input imprecisions and model imperfections. Foresight risk reflects the inherent imprecision in forecasting economic variables, including determining the depth and duration of economic cycles and their impact on relevant economic variables. Input imperfection factors address the risk that certain model inputs may not reflect all available information such as changes in the level and quality of experience held by certain borrowers or limitations in data available for certain loan portfolios. Model imprecision considers known model limitations not yet fully reflected in the quantitative estimate. The determination of the appropriate qualitative adjustment is based on management’s analysis of current and expected economic conditions and their impact on the portfolio, as well as a qualitative assessment of the lending environment, including underwriting standards. Management recognizes the sensitivity of various assumptions made in the quantitative modeling of expected losses and may adjust reserves depending upon the level of uncertainty that currently exists in one or more assumptions.
Refer to Note 2 to the Consolidated Financial Statements of the Company’s Annual Report on Form 10-K for the year ended December 31, 2020 for a summary of the Company’s significant accounting policies.
Changes in the Fair Value of Our Investments
We intend to hold our target investments for the long-term and, as such, they are carried at an amortized cost on our condensed consolidated balance sheets.
Although we intend to hold our target investments for the long-term, we may occasionally classify some of our debt securities as available-for-sale, or AFS. Investments classified as AFS are carried at their fair value, with changes in fair value recorded through accumulated other comprehensive income (loss), a component of stockholders’ equity, rather than through earnings. We do not intend to hold any of our investments for trading purposes.
Changes in Market Interest Rates
Although our strategy is to primarily originate, invest in and manage senior floating-rate commercial mortgage loans, from time-to-time we may acquire fixed-rate investments, which exposes our operating results to the risks posed by fluctuations in interest rates. To the extent that this applies to us, we may choose to actively manage this risk through the use of hedging strategies.
Off-Balance Sheet Arrangements
We have not participated in transactions that create relationships with unconsolidated entities or financial partnerships which would have been established for the purpose of facilitating off-balance sheet arrangements. Further, we have not guaranteed any obligations of unconsolidated entities or entered into any commitment or intent to provide funding to any such entities. However, as of September 30, 2021, we had unfunded commitments on commercial real estate loans held-for-investment of $430.1 million to be used for future fundings to borrowers, generally to finance lease-related or capital expenditures.
Dividends
We generally intend to distribute substantially all of our taxable income each year (which does not necessarily equal net income as calculated in accordance with GAAP) to our stockholders to comply with the REIT provisions of the Code. In addition, our dividend policy remains subject to revision at the discretion of our board of directors. All distributions will be made at the discretion of our board of directors and will depend upon, among other things, our actual results of operations and liquidity. These results, and our ability to pay distributions, will be affected by various factors, including our taxable income, our financial condition, our maintenance of REIT status, restrictions related to our financing facilities, applicable law and other factors as our board of directors deems relevant.
Inflation
Virtually all of our assets and liabilities are interest rate sensitive in nature. As a result, interest rates and other factors typically influence our performance far more than inflation does. ChangesHowever, changes in interest rates do not necessarilymay correlate with inflation rates or changes in inflation rates. Recently, the Federal Reserve approved increases to its federal funds rate target range and has indicated that, in light of the high rate of inflation, it foresees further increases in interest rates throughout the year and into 2023 and 2024. Our condensed consolidated financial statements are prepared in accordance with GAAP and our distributions will be determined by our board of directors consistent with our obligation to distribute to our stockholders at least 90% of our REIT taxable income on an annual basis in order to maintain our REIT qualification; in each case, our activities and balance sheet are measured with reference to historical cost and/or fair market value without considering inflation.
Item 3. Quantitative and Qualitative Disclosures about Market Risk
We seek to manage our risks related to the credit quality of our investments, interest rates, liquidity and market value while, at the same time, seeking to generate attractive risk-adjusted returns to our stockholders. While we are exposed to certain types of market risk in our business, we seek to actively manage them using our risk management infrastructure and philosophy centered around quantifying and measuring various market risks on a continuous basis. We seek to be fairly compensated through the returns we earn on our investments for taking those risks and focus on maintaining liquidity and capital levels consistent with the risks to which we are exposed. However, many of those risks have been magnified by the continuing economic disruption and capital markets volatility resulting from the COVID-19 pandemic.
Recent Market Conditions
Due to the current COVID-19 pandemic and its ongoing impacts, most of our borrowers, sponsors, their tenants, the properties serving as collateral for our loan investments and the economy as a whole have been, and will likely continue to be, adversely affected. See “COVID-19 Pandemic” in Part II, Item 2 of this Quarterly Report on Form 10-Q for further discussion of the impact of the COVID-19 pandemic on market conditions.
Credit Risk
We are subject to varying degrees of credit risk in connection with holding a portfolio of our target investments. The performance and value of our investments depend upon the sponsors’ ability to operate the properties that serve as our collateral so that they produce cash flows adequate to pay interest and principal due to us. We seek to manage credit risk by performing deep fundamental credit analysis of our potential investments, as well as seeking to originate or acquire assets of higher quality at appropriate rates of return given anticipated and unanticipated losses, by employing a comprehensive review and selection process and by proactively monitoring our investments. Credit risk is also addressed through our ongoing review, and our investment portfolio is monitored for variance from underwritten and expected results on a monthly basis, with more intense analysis and oversight done on a quarterly basis. Nevertheless, unanticipated credit losses, including as a result of the COVID-19 pandemic, could occur that could adversely impact our operating results.
We employ a long-term, fundamental value-oriented investment strategy and we aim to, on a loan-by-loan basis, construct an investment portfolio that is well-diversified across property types, geographies and sponsors. However, any potential negative impacts on our business as a result of the COVID-19 pandemic may be heightened by the fact that we are not required to observe specific diversification criteria, which means that our investments may be relatively concentrated in certain property types, geographical areas or loan categories that may be more adversely affected by the pandemic than others. For example, certain of our loans are secured by office, industrial, multifamily, hotel and retail properties. Changes in how certain types of commercial properties are operated to facilitate social distancing and other measures intended to control the impact of the pandemic have impacted, and are likely to continue to impact, our investments secured by these properties.
The COVID-19 pandemic has significantly impacted the commercial real estate markets, causing reduced occupancy, requests from tenants for rent deferrals or abatement and delays in capital improvements on projects currently planned or underway. These negative conditions may persist into the future and impair our borrowers’ ability to pay principal and interest due to us under our loan agreements. We maintain an active dialogue and strong relationships with our borrowers as part of our overall asset management strategy. Through our asset management process, we focus on addressing potential impacts of the COVID-19 pandemic on our loans secured by properties experiencing cash flow strains. Certain of our borrowers have indicated that due to the impact of COVID-19 pandemic they will be unable to timely execute their business plans, have had to temporarily close their businesses or have experienced other business challenges. As a result, they have requested, and in certain instances we have granted, temporary deferrals of interest payments or forbearance, or other modifications of their loans. Discussions we have had with our borrowers have addressed potential near-term loan modifications including repurposing of funds in certain reserve accounts, temporary deferrals of interest or performance tests and certain covenant waivers on loans collateralized by properties impacted by the COVID-19 pandemic. While we generally believe that the principal amount of our loans is typically sufficiently protected by the underlying collateral value, there is a risk that we will not realize the entire principal amount of certain of our loan investments.
Interest Rate Risk
Our strategy is to primarily originate, invest in and manage a portfolio of senior floating-rate commercial mortgage loans. As a result, the composition of our investments in general is such that rising interest rates increase our net income, while declining interest rates will decrease our net income, subject to the impact of contractual interest rate floors. From time to time, we may originate or acquire fixed-rate investments, which may expose our operating results to the risks posed by fluctuations in interest rates, which we may choose to hedge, if we deem it prudent.
Until recently, interest rates have remained at relatively low levels and the Federal Reserve maintained the federal funds target range at 0.00% to 0.25% for much of 2021. However, in response to the inflationary pressures, earlier in 2022, the Federal Reserve has begun raising its federal funds target range and has indicated that, in light of the persistent high rate of inflation, it anticipates further increases in interest rates throughout 2022 and into 2023. Such increases in interest rates may increase our interest expense, which may not be fully offset by any increases in interest income, and may also slow the pace of loan repayments and increase the number of our borrowers who seek extension of term on their loans. The potential ultimate impact of higher market interest rates on the economy, real estate fundamentals in general and our business is uncertain and difficult to predict.
As of SeptemberJune 30, 2021,2022, approximately 98.8% of our portfolio by carrying value earned a floating rate of interest. The remaining approximately 1.2% of our portfolio earned a fixed rate of interest. If interest rates were to decline, the value of these fixed-rate investments may increase, and if interest rates were to increase, the value of these fixed-rate investments may fall; however, the interest income generated by these investments would not be affected by fluctuations in market interest rates. The interest rates we pay under our current repurchase facilities, asset-specific financing facility term financing facility and CRE CLOs are primarily floating rate, which generally, and with limited exceptions, are not subject to contractual interest rate floors. Accordingly, our interest expense generally increases as interest rates increase and decreases as interest rates decrease.
Our analysis of risks is based on our experience, estimates models and assumptions. These analyses rely on models which utilize estimates of fair value and interest rate sensitivity. Actual economic conditions or our implementation of decisions may produce results that differ significantly from the estimates and assumptions used in our models.
The information presented in the following interest rate sensitivity table projects the potential impact of sudden parallel changes in interest rates on our financial results and financial condition over the next 12 months, based on our interest sensitive financial instruments at SeptemberJune 30, 2021.2022. All changes in value are measured as the change from our SeptemberJune 30, 20212022, financial position. All projected changes in annualized net interest income are measured as the change from our projected annualized net interest income based off current performance returns. Actual results of changes in annualized net interest income may differ from the information presented in the sensitivity table below due to differences between the dates of actual interest rate resets in our loan investments and our floating rate interest-bearing liabilities, and the dates as of which the analysis was performed.
| | | Changes in Interest Rates (1) | | Changes in Interest Rates (1) |
| (in thousands) | (in thousands) | -100 bps | | -50 bps | | +50 bps | | +100 bps | (in thousands) | -100 bps | | -50 bps | | +50 bps | | +100 bps |
| Change in value of financial position: | Change in value of financial position: | | | | | | | | Change in value of financial position: | | | | | | | |
| Loans held-for-investment | Loans held-for-investment | $ | 2 | | | $ | 2 | | | $ | (117) | | | $ | (293) | | Loans held-for-investment | $ | 805 | | | $ | 479 | | | $ | (709) | | | $ | (1,477) | |
| | Repurchase facilities | Repurchase facilities | (29) | | | (29) | | | 191 | | | 382 | | Repurchase facilities | (530) | | | (265) | | | 265 | | | 530 | |
| Securitized debt obligations | Securitized debt obligations | (48) | | | (48) | | | 284 | | | 567 | | Securitized debt obligations | (596) | | | (298) | | | 298 | | | 596 | |
| Asset-specific financings | Asset-specific financings | (1) | | | (1) | | | 9 | | | 19 | | Asset-specific financings | (18) | | | (9) | | | 9 | | | 18 | |
| Term financing facility | (4) | | | (4) | | | 27 | | | 53 | | |
| | Convertible senior notes | Convertible senior notes | (3,806) | | | (1,890) | | | 1,864 | | | 3,702 | | Convertible senior notes | (1,688) | | | (841) | | | 835 | | | 1,663 | |
| Total net assets | Total net assets | $ | (3,886) | | | $ | (1,970) | | | $ | 2,258 | | | $ | 4,430 | | Total net assets | $ | (2,027) | | | $ | (934) | | | $ | 698 | | | $ | 1,330 | |
| | | -100 bps | | -50 bps | | +50 bps | | +100 bps | | -100 bps | | -50 bps | | +50 bps | | +100 bps |
| Change in annualized net interest income: | Change in annualized net interest income: | $ | 1,874 | | | $ | 1,874 | | | $ | (8,858) | | | $ | (16,395) | | Change in annualized net interest income: | $ | 7,537 | | | $ | 1,981 | | | $ | 2,851 | | | $ | 7,081 | |
____________________
(1)Changes in interest rates were limited to a decrease in rate to zero percent.
The interest rate sensitivity table quantifies the potential changes in annualized net interest income and portfolio value, should interest rates immediately change. The interest rate sensitivity table presents the estimated impact of interest rates instantaneously rising 50 and 100 basis points, and falling 50 and 100 basis points. The cash flows associated with the portfolio for each rate change are calculated based on assumptions, including yield on future originations and acquisitions, slope of the yield curve and size of the portfolio. Assumptions made on the interest rate sensitive liabilities include anticipated interest rates, collateral requirements as a percentage of borrowings and amount and term of borrowing.
Certain assumptions have been made in connection with the calculation of the information set forth in the foregoing interest rate sensitivity table and, as such, there can be no assurance that assumed events will occur or that other events will not occur that would affect the outcomes. The base interest rate scenario assumes interest rates at SeptemberJune 30, 2021.2022. The analysis utilizes assumptions and estimates based on management’s judgment and experience. Furthermore, while we generally expect to retain such assets and the associated interest rate risk to maturity, future originations, acquisitions and sales of assets could materially change our interest rate risk profile.
The information set forth in the interest rate sensitivity table above and all related disclosures constitutes forward-looking statements within the meaning of Section 27A of the Securities Act and Section 21E of the Exchange Act. Actual results could differ significantly from those estimated in the foregoing interest rate sensitivity table.
LIBOR Transition
It appears highly likely that LIBOR will be discontinued after December 31, 2021 or June 30, 2023, depending on the tenor. For example, on March 5, 2021, the ICE Benchmark Administration confirmed its intention to cease publication of (i) one week and two month U.S. Dollar LIBOR settings after December 31, 2021 and (ii) the remaining U.S. Dollar LIBOR settings after June 30, 2023. The United States Federal Reserve has also advised banks to cease entering into new contracts that use LIBOR as a reference rate. The Federal Reserve, in conjunction with the Alternative Reference Rate Committee, a committee convened by the Federal Reserve that includes major market participants, has identified the Secured Overnight Financing Rate, or SOFR, a new index calculated by short-term repurchase agreements, backed by United States Treasury securities, as its preferred alternative rate for LIBOR. At this time, it is not possible to predict how markets will respond to SOFR or other alternative reference rates as the transition away from the LIBOR benchmarks is anticipated in coming years. Accordingly, the outcome of these reforms is uncertain and any changes in the methods by which LIBOR is determined or regulatory activity related to LIBOR’s phaseout could cause LIBOR to perform differently than in the past.
As of September 30, 2021, approximately 98.8% of our loans by principal balance earned a floating rate of interest indexed to LIBOR, and 100.0% of our outstanding borrowings (excluding convertible notes and senior secured financing facilities) bear interest indexed to LIBOR. Some of these arrangements may not include robust fallback language that would facilitate replacing LIBOR with a clearly defined alternative reference rate after LIBOR’s discontinuation, and we may need to amend these before LIBOR is discontinued. Regardless, there can be no assurances as to what alternative base rates may be and whether such base rate will be more or less favorable than LIBOR and any other unforeseen impacts of the potential discontinuation of LIBOR. We are monitoring the developments with respect to the potential phasing out of LIBOR and are working with our lenders and borrowers to minimize the impact of any LIBOR transition on our financial condition and results of operations, but can provide no assurances regarding the impact of the discontinuation of LIBOR.
Market Value Risk
We intend to hold our target investments for the long-term and, as such, they are carried at an amortized cost on our condensed consolidated balance sheets. However, we may occasionally classify some of our investments as AFS. Investments classified as AFS are carried at their fair value, with changes in fair value recorded through accumulated other comprehensive income, (loss), a component of stockholders’ equity, rather than through earnings. The estimated fair value of such investments may fluctuate primarily due to changes in interest rates, overall market environment and liquidity and other factors. As market volatility increases or liquidity decreases, the market value of the investments may be adversely impacted. We do not intend to hold any of our investments for trading purposes.
Borrower Performance
In addition to the risks related to fluctuations in cash flows and investment values associated with movements in interest rates, there is also the risk of borrower non-performance on our floating-rate investments. If interest rates were to significantly rise, it is possible that the increased debt service costs may negatively impact operating cash flows on properties securing our commercial real estate loan investments, resulting in potential non-performance of our borrowers or, in severe cases, default. This risk is partially mitigated by various factors we consider during our rigorous underwriting and loan structuring process, which in certain cases include a requirement for our borrower to purchase an interest rate cap contract.
Capital Markets Risk
As a REIT, we are required to distribute a significant portion of our taxable income annually, which constrains our ability to accumulate significant operating cash flow and therefore requires us to utilize capital markets, both debt and equity, to finance our business. As a result, we are exposed to risks related to the equity capital markets and our related ability to raise capital through the issuance of our common stock or other equity instruments. We are also exposed to risks related to the debt capital markets, and our related ability to finance our business through borrowings under credit facilities or other debt instruments, such as securitizations or unsecured debt. We seek to mitigate these risks by monitoring the debt and equity capital markets to inform our decisions on the amount, timing and terms of capital we raise.
The COVID-19 pandemic and its ongoing impacts continue to cause disruptions in the U.S and global economies, and capital markets resulting in volatility, widening credit spreads and liquidity availability. Other factors, such as rising interest rates, high inflation, supply chain disruptions, growing geopolitical tensions and increased volatility in public equity and fixed income markets have led to increased cost and availability of capital, which may adversely impact the ability of commercial property owners to service their debt obligations and refinance their loans as they mature.
Real Estate Risk
Our business strategy focuses on commercial real estate related debt investments. As a result, we will be exposed to the risks generally associated with the commercial real estate market, including occupancy rates, capitalization rates, absorption rates and other macroeconomic factors beyond our control, including, but not limited to, the impacts of the COVID-19 pandemic discussed above.
Additionally, commercial real estate debt investments may be affected by a number of factors, including national, regional and local economic and real estate conditions, changes in business trends of specific industry segments, property construction characteristics, demographic factors and changes to building codes.laws and regulations, including additional restrictions or requirements on the development of commercial real estate intended to reduce greenhouse gas emissions and climate change. Any combination of these factors may affect the value of real estate collateral for investments within our investment portfolio and the potential proceeds available to a borrower to repay the underlying loans, which could cause us to suffer losses. We seek to manage these risks through our rigorous and fundamentally driven underwriting and investment management processes.
Liquidity Risk
Our liquidity risk is principally associated with our financing of longer-maturity investments with shorter-term borrowings, such as repurchase facilities and an asset-specific financing facility.facilities. Should the value of our investments serving as collateral for our repurchase facilities significantly decrease, including, but not limited to, as a result of the impacts of the COVID-19 pandemic discussed above, our lenders may exercise their margin call rights, causing an adverse change in our liquidity position. If we fail to resolve such margin calls when due, the lenders may exercise their rights under such repurchase facilities, including requiring payment by us of our aggregate outstanding financing obligations and/or taking ownership of the loans securing such obligations, potentially on an unfinanced basis, thereby reducing our available liquidity. Additionally, if one or more of our repurchase facilities or asset-specific financing facility counterparties should choose not to provide ongoing funding, including with respect to future funding obligations on existing loans financed with such counterparties, which such risks are increased as a result of the COVID-19 pandemic and its effects on the global and U.S. economies and commercial real estate markets, our ability to finance our investments and related future funding obligations would decline or exist at possibly less advantageous terms.
Extension Risk
We manage our assets based on a variety of assumptions and estimates, including among others, assumptions regarding the rate at which the borrowers will prepay our loans or extend. If prepayment rates decrease in a rising interest rate environment or extension options are exercised, the life of our loan investments could extend beyond the term of the secured financing agreements. The macroeconomic, commercial real estate and capital markets disruptions caused by the COVID-19 pandemic have resulted in, and will likely continue to result in, a decrease in prepayment rates and an increase in the number of our borrowers who exercise loan extension options. In addition, higher interest rates imposed by the Federal Reserve to address the high rate of inflation have led to, and may continue to lead to, a decrease in prepayment speeds and an increase in the number of our borrowers who exercise loan extension options. This could have a negative impact on our results of operations. In some situations, we may be forced to sell assets to maintain adequate liquidity, which could cause us to incur losses.
As part of our overall asset management strategy, we have in the past entered into, and may in the future enter into, loan modifications with some of our borrowers. These amendments may include, among other things, modifying or waiving certain performance or extension conditions as part of the overall agreement, which are often coupled with additional equity or other forms of credit support from the sponsor. We work closely with our lending counterparties when negotiating and entering into loan modifications with our borrowers to ensure we maintain financing on modified assets. There can be no assurance that going forward we will be able to maintain financing on modified loans.
Risk Management
To the extent consistent with maintaining our REIT qualification, we seek to manage risk exposure by closely monitoring our portfolio and actively managing the financing, interest rate, credit and other risks associated with holding a portfolio of our target investments. Generally, we:
•manage our portfolio with focus on diligent, investment-specific market review, enforcement of loan and security rights and timely execution of disposition strategies;
•actively employ portfolio-wide and investment-specific risk measurement and management processes in our daily operations, including utilizing risk management tools; and
•seek to manage credit risk through our rigorous underwriting due diligence process prior to origination or acquisition of our target investments, and through the use of nonrecourse financing when and where available and appropriate.
Item 4. Controls and Procedures
A review and evaluation was performed by our management, including our Chief Executive Officer, or CEO, and Chief Financial Officer, or CFO, of the effectiveness of our disclosure controls and procedures (as such term is defined in Rule 13a-15(e) and 15d-15(e) under the Exchange Act) as of the end of the period covered by this Quarterly Report on Form 10-Q. Based on that review and evaluation, the CEO and CFO have concluded that our current disclosure controls and procedures, as designed and implemented, were effective as of the end of the period covered by this Quarterly Report on Form 10-Q. Although our CEO and CFO have determined our disclosure controls and procedures were effective at the end of the period covered by this Quarterly Report on Form 10-Q, a control system, no matter how well designed and operated, can provide only reasonable, not absolute, assurance that it will detect or uncover failures within the Company to disclose material information otherwise required to be set forth in the reports we submit under the Exchange Act.
There was no change in our internal control over financial reporting that occurred during the quarter ended SeptemberJune 30, 20212022, that has materially affected, or is reasonably likely to materially affect, our internal control over financial reporting.
PART II. OTHER INFORMATION
Item 1. Legal Proceedings
From time to time we may be involved in various legal claims and/or administrative proceedings that arise in the ordinary course of our business. As of the date of this filing, we are not party to any litigation or other legal proceedings or, to the best of our knowledge, any threatened litigation or legal proceedings, which, in our opinion, individually or in the aggregate would have a material adverse effect on our results of operations or financial condition.
Item 1A. Risk Factors
For information regarding factors that could affect our results of operations, financial condition and liquidity, see the risk factors discussed in Part I, Item 1A. “Risk Factors” in our Annual Report on Form 10-K for the year ended December 31, 2020.2021.
Item 2. Unregistered Sales of Equity Securities and Use of Proceeds
Issuer Purchases of Equity Securities
The following table summarizes the repurchase of common stock for the three months ended SeptemberJune 30, 2021:2022:
| | | | | | | | | | | | | | | | | | | | | | | |
| Period | Total number of shares purchased | | Average price paid per share | | Total number of shares purchased as part of publicly announced plans or programs | | Maximum number (or approximate dollar value) of shares that may yet be purchased under the plans or programs (1) |
| July 1-31, 2021 | 721 | | | $ | 14.49 | | | 721 | | | 1,698,388 | |
| August 1-31, 2021 | 542,488 | | | 13.43 | | | 542,488 | | | 1,155,900 | |
| September 1-30, 2021 | 457,512 | | | 13.56 | | | 457,512 | | | 698,388 | |
| Total | 1,000,721 | | | $ | 13.49 | | | 1,000,721 | | | 698,388 | |
| | | | | | | | | | | | | | | | | | | | | | | |
| Period | Total number of shares purchased | | Average price paid per share | | Total number of shares purchased as part of publicly announced plans or programs | | Maximum number (or approximate dollar value) of shares that may yet be purchased under the plans or programs (1) |
| April 1-30, 2022 | — | | | $ | — | | | — | | | — | |
| May 1-31, 2022 | 341,739 | | | 10.19 | | | 341,739 | | | 2,356,649 | |
| June 1-30, 2022 | 1,197,395 | | | 10.18 | | | 1,197,395 | | | 1,159,254 | |
| Total | 1,539,134 | | | $ | 10.18 | | | 1,539,134 | | | 1,159,254 | |
____________________
(1)On November 21, 2018,December 16, 2021, the Company’sCompany announced that its board of directors authorizedhad increased the Company’s share repurchase program to allow for the repurchase of up to an aggregate of 2,000,0004,000,000 shares of the Company’s common stock with no expiration date.stock.
Item 3. Defaults Upon Senior Securities
None.
Item 4. Mine Safety Disclosures
None.
Item 5. Other Information
None.
Item 6. Exhibits
(a) Exhibits
A list of exhibits to this Quarterly Report on Form 10-Q is set forth below.
| | | | | | | | |
| Exhibit Number | | Exhibit Index |
| 3.1 | | |
| 3.2 | | |
| 3.3 | | |
| 3.4 | | |
| 3.5 | | |
| 4.1 | | |
| 4.2 | | |
| 4.3 | | |
| 4.4 | | |
| 4.5 | | |
| 4.6 | | |
| 4.7 | | |
10.1*4.8 | | |
| 10.1 | | |
| 10.2* | | |
| 10.3 | | |
| 10.4 | | |
| 10.5 | | |
| | | | | | | | |
| Exhibit Number | | Exhibit Index |
| 10.6 | | |
| 10.7 | | |
| 10.8* | | |
10.2* | | |
10.3* | | |
| 31.1 | | |
| 31.2 | | |
| 32.1 | | |
| 32.2 | | |
| | | | | | | | |
Exhibit Number | | Exhibit Index |
| 101 | | Financial statements from the Quarterly Report on Form 10-Q of Granite Point Mortgage Trust Inc. for the three months ended SeptemberJune 30, 2021,2022, filed with the SEC on NovemberAugust 8, 2021,2022, formatted in Inline XBRL: (i) the Condensed Consolidated Balance Sheets, (ii) the Condensed Consolidated Statements of Comprehensive Income, (Loss), (iii) the Condensed Consolidated Statements of Stockholders’ Equity, (iv) the Condensed Consolidated Statements of Cash Flows, and (v) the Notes to the Condensed Consolidated Financial Statements. (filed herewith) |
| 104 | | Cover Page Interactive Data File (formatted as Inline XBRL and contained in Exhibit 101). (filed herewith) |
| | |
| | |
| | |
*Certain schedules and similar attachments have been omitted in reliance on Item 601(a)(5) of Regulation S-K. The Company will provide, on a supplemental basis, a copy of any omitted schedule or attachment to the SEC or its staff upon request.
SIGNATURES
Pursuant to the requirements of the Securities Exchange Act of 1934, the registrant has duly caused this report to be signed on its behalf by the undersigned thereunto duly authorized.
| | | | | | | | | | | |
| | | GRANITE POINT MORTGAGE TRUST INC. |
| Dated: | NovemberAugust 8, 20212022 | By: | /s/ John A. Taylor |
| | | John A. Taylor
President, Chief Executive Officer and Director
(Principal Executive Officer) |
| Dated: | NovemberAugust 8, 20212022 | By: | /s/ Marcin Urbaszek |
| | | Marcin Urbaszek
Chief Financial Officer
(Principal Accounting and Financial Officer) |
| | | |
| | | |