UNITED STATES
SECURITIES AND EXCHANGE COMMISSION
Washington, D.C. 20549
FORM 10-Q
x QUARTERLY REPORT PURSUANT TO SECTION 13 OR 15(d) OF THE SECURITIES EXCHANGE ACT OF 1934
For the quarterly period ended JuneSeptember 30, 2019
OR
☐ TRANSITION REPORT PURSUANT TO SECTION 13 OR 15(d) OF THE SECURITIES EXCHANGE ACT OF 1934
For the transition period from _________to__________
Commission File Number 1-38315
CURO GROUP HOLDINGS CORP.
(Exact name of registrant as specified in its charter)
|
| | |
| Delaware | | 90-0934597 |
(State or other jurisdiction Of incorporation or organization) | | (I.R.S. Employer Identification No.) |
| | | |
| 3527 North Ridge Road, Wichita, KS | | 67205 |
| (Address of principal executive offices) | | (Zip Code) |
Registrant’s telephone number, including area code: (316) 772-3801
Former name, former address and former fiscal year, if changed since last report: No Changes
Securities registered pursuant to Section 12(b) of the Act:
|
| | |
| Title of each class | Trading Symbol(s) | Name of each exchange on which registered |
| Common stock, $0.001 par value per share | CURO | New York Stock Exchange |
Indicate by check mark whether the registrant (1) has filed all reports required to be filed by Section 13 or 15(d) of the Securities Exchange Act of 1934 during the preceding 12 months (or for such shorter period that the registrant was required to file such reports), and (2) has been subject to such filing requirements for the past 90 days. Yes ☒ No ☐
Indicate by check mark whether the registrant has submitted electronically every Interactive Data File required to be submitted pursuant to Rule 405 of Regulation S-T (§232.405 of this chapter) during the preceding 12 months (or for such shorter period that the registrant was required to submit such files). Yes ☒ No ☐
Indicate by check mark whether the registrant is a large accelerated filer, an accelerated filer, a non-accelerated filer, a smaller reporting company, or an emerging growth company. See the definitions of “large accelerated filer,” “accelerated filer,” “smaller reporting company,” and “emerging growth company” in Rule 12b-2 of the Exchange Act.
|
| | | | |
| Large accelerated filer | ☐ | | Accelerated filer | ☒ |
| Non-accelerated filer | ☐ | | | |
| Smaller reporting company | ☒ | | Emerging growth company | ☐ |
If an emerging growth company, indicate by check mark if the registrant has elected not to use the extended transition period for complying with any new or revised financial accounting standards provided pursuant to Section 13(a) of the Exchange Act. ☐
Indicate by check mark whether the registrant is a shell company (as defined in Rule 12b-2 of the Act). Yes ☐ No ☒
At August 2,November 1, 2019 there were 45,267,76241,486,965 shares of the registrant’s Common Stock, $0.001 par value per share, outstanding.
CURO GROUP HOLDINGS CORP. AND SUBSIDIARIES
FORM 10-Q
SECONDTHIRD QUARTER ENDED JUNESEPTEMBER 30, 2019
INDEX
|
| | | | | | | |
| | | | | | | | Page |
|
| |
| Item 1. | Financial Statements (unaudited) |
| | | |
| | JuneSeptember 30, 2019 and December 31, 2018 | |
| | | |
| | Three and sixnine months ended JuneSeptember 30, 2019 and 2018 | |
| | | |
| | Three and sixnine months ended JuneSeptember 30, 2019 and 2018 | |
| | | |
| | SixNine months ended JuneSeptember 30, 2019 and 2018 | |
| | | |
| Item 2. | | |
| Item 3. | | |
| Item 4. | | |
| | | | | | | |
| |
| | |
| Item 1. | | |
| Item 1A. | | |
| Item 2. | | |
| Item 3. | | |
| Item 4. | | |
| Item 5. | | |
| Item 6. | | |
| | | | | | | |
| | | | | | |
PART I. FINANCIAL INFORMATION
ITEM 1. FINANCIAL STATEMENTS
CURO GROUP HOLDINGS CORP. AND SUBSIDIARIES
CONDENSED CONSOLIDATED BALANCE SHEETS
(in thousands, except share data)
| | | | June 30, 2019 | | December 31,
2018 | September 30, 2019 | | December 31,
2018 |
| | (unaudited) | | (unaudited) | |
ASSETS | | Cash | $ | 92,297 |
| | $ | 61,175 |
| $ | 62,207 |
| | $ | 61,175 |
|
| Restricted cash (includes restricted cash of consolidated VIEs of $14,819 and $12,840 as of June 30, 2019 and December 31, 2018, respectively) | 33,712 |
| | 25,439 |
| |
| Gross loans receivable (includes loans of consolidated VIEs of $215,309 and $148,876 as of June 30, 2019 and December 31, 2018, respectively) | 609,593 |
| | 571,531 |
| |
| Less: allowance for loan losses (includes allowance for losses of consolidated VIEs of $25,188 and $12,688 as of June 30, 2019 and December 31, 2018, respectively) | (101,877 | ) | | (73,997 | ) | |
| Restricted cash (includes restricted cash of consolidated VIEs of $21,897 and $12,840 as of September 30, 2019 and December 31, 2018, respectively) | | 38,754 |
| | 25,439 |
|
| Gross loans receivable (includes loans of consolidated VIEs of $231,533 and $148,876 as of September 30, 2019 and December 31, 2018, respectively) | | 657,615 |
| | 571,531 |
|
| Less: allowance for loan losses (includes allowance for losses of consolidated VIEs of $25,375 and $12,688 as of September 30, 2019 and December 31, 2018, respectively) | | (108,385 | ) | | (73,997 | ) |
| Loans receivable, net | 507,716 |
| | 497,534 |
| 549,230 |
| | 497,534 |
|
| Right of use asset - operating leases (Note 1) | 140,982 |
| | — |
| 118,260 |
| | — |
|
| Deferred income taxes | 2,637 |
| | 1,534 |
| 1,846 |
| | 1,534 |
|
| Income taxes receivable | 37,579 |
| | 16,741 |
| 23,966 |
| | 16,741 |
|
| Prepaid expenses and other | 30,241 |
| | 43,588 |
| 32,228 |
| | 43,588 |
|
| Property and equipment, net | 72,993 |
| | 76,750 |
| 70,381 |
| | 76,750 |
|
| Goodwill | 120,450 |
| | 119,281 |
| 120,110 |
| | 119,281 |
|
| Other intangibles, net of accumulated amortization | 30,657 |
| | 29,784 |
| 32,666 |
| | 29,784 |
|
| Other | 16,091 |
| | 12,930 |
| 18,484 |
| | 12,930 |
|
| Assets from discontinued operations (Note 15) | — |
| | 34,861 |
| — |
| | 34,861 |
|
| Total Assets | $ | 1,085,355 |
| | $ | 919,617 |
| $ | 1,068,132 |
| | $ | 919,617 |
|
LIABILITIES AND STOCKHOLDERS' EQUITY | | Accounts payable and accrued liabilities | $ | 59,274 |
| | $ | 49,146 |
| |
| Accounts payable and accrued liabilities (includes accounts payable and accrued liabilities of consolidated VIEs of $7,259 and $4,980 as of September 30, 2019 and December 31, 2018, respectively) | | $ | 63,685 |
| | $ | 49,146 |
|
| Deferred revenue | 8,712 |
| | 9,483 |
| 9,052 |
| | 9,483 |
|
| Lease liability - operating leases (Note 1) | 148,843 |
| | — |
| 126,048 |
| | — |
|
| Income taxes payable | — |
| | 1,579 |
| — |
| | 1,579 |
|
| Accrued interest (includes accrued interest of consolidated VIEs of $713 and $831 as of June 30, 2019 and December 31, 2018, respectively) | 19,690 |
| | 20,904 |
| |
| Accrued interest (includes accrued interest of consolidated VIEs of $777 and $831 as of September 30, 2019 and December 31, 2018, respectively) | | 5,625 |
| | 20,904 |
|
| Liability for losses on CSO lender-owned consumer loans | 9,504 |
| | 12,007 |
| 10,249 |
| | 12,007 |
|
| Deferred rent | — |
| | 10,851 |
| — |
| | 10,851 |
|
| Long-term debt (includes long-term debt and issuance costs of consolidated VIEs of $94,565 and $3,588 as of June 30, 2019 and $111,335 and $3,856 as of December 31, 2018, respectively) | 768,512 |
| | 804,140 |
| |
| Debt (includes debt and issuance costs of consolidated VIEs of $105,742 and $3,259 as of September 30, 2019 and $111,335 and $3,856 as of December 31, 2018, respectively) | | 805,407 |
| | 804,140 |
|
| Subordinated stockholder debt | — |
| | 2,196 |
| — |
| | 2,196 |
|
| Other long-term liabilities | 8,594 |
| | 5,800 |
| 8,594 |
| | 5,800 |
|
| Deferred tax liabilities | 4,848 |
| | 13,730 |
| 4,427 |
| | 13,730 |
|
| Liabilities from discontinued operations (Note 15) | — |
| | 8,882 |
| — |
| | 8,882 |
|
| Total Liabilities | 1,027,977 |
| | 938,718 |
| 1,033,087 |
| | 938,718 |
|
| Commitments and contingencies (Note 13) |
|
| |
|
|
|
| |
|
|
| Stockholders' Equity |
|
| |
|
|
|
| |
|
|
| Preferred stock - $0.001 par value, 25,000,000 shares authorized; no shares were issued at either period end | — |
| | — |
| — |
| | — |
|
| Common stock - $0.001 par value; 225,000,000 shares authorized; 46,499,482 and 46,412,231 shares issued as of June 30, 2019 and December 31, 2018, respectively; and 46,255,282 and 46,412,231 shares outstanding as of June 30, 2019 and December 31, 2018, respectively | 9 |
| | 9 |
| |
| Treasury stock, at cost - 244,200 shares as of June 30, 2019 | (2,507 | ) | | — |
| |
| Common stock - $0.001 par value; 225,000,000 shares authorized; 46,503,406 and 46,412,231 shares issued as of September 30, 2019 and December 31, 2018, respectively; and 42,347,165 and 46,412,231 shares outstanding as of September 30, 2019 and December 31, 2018, respectively | | 9 |
| | 9 |
|
| Treasury stock, at cost - 4,156,241 as of September 30, 2019 | | (53,064 | ) | | — |
|
| Paid-in capital | 64,790 |
| | 60,015 |
| 67,579 |
| | 60,015 |
|
| Retained earnings (accumulated deficit) | 35,816 |
| | (18,065 | ) | 63,205 |
| | (18,065 | ) |
| Accumulated other comprehensive loss | (40,730 | ) | | (61,060 | ) | (42,684 | ) | | (61,060 | ) |
| Total Stockholders' Equity | 57,378 |
| | (19,101 | ) | 35,045 |
| | (19,101 | ) |
| Total Liabilities and Stockholders' Equity | $ | 1,085,355 |
| | $ | 919,617 |
| $ | 1,068,132 |
| | $ | 919,617 |
|
See accompanying Notes to Unauditedunaudited Condensed Consolidated Financial Statements.
CURO GROUP HOLDINGS CORP. AND SUBSIDIARIES
CONDENSED CONSOLIDATED STATEMENTS OF OPERATIONS
(in thousands, except per share data)
| | | | Three Months Ended
June 30, | | Six Months Ended
June 30, | Three Months Ended
September 30, | | Nine Months Ended
September 30, |
| | 2019 | | 2018 | | 2019 | | 2018 | 2019 | | 2018 | | 2019 | | 2018 |
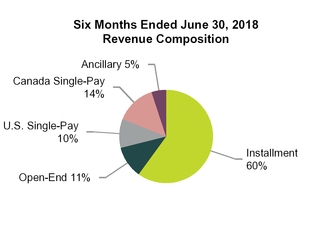
| Revenue | $ | 264,300 |
| | $ | 237,169 |
| | $ | 542,239 |
| | $ | 488,012 |
| $ | 297,264 |
| | $ | 269,482 |
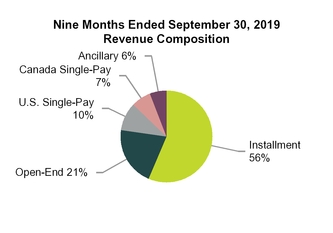
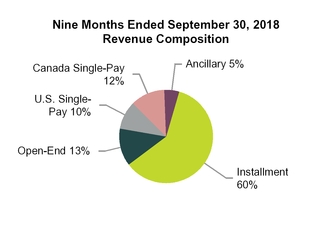
| | $ | 839,503 |
| | $ | 757,494 |
|
| Provision for losses | 112,010 |
| | 86,347 |
| | 214,395 |
| | 163,230 |
| 123,867 |
| | 127,692 |
| | 338,262 |
| | 290,922 |
|
| Net revenue | 152,290 |
| | 150,822 |
| | 327,844 |
| | 324,782 |
| 173,397 |
| | 141,790 |
| | 501,241 |
| | 466,572 |
|
| | | | | | | | | | | | | | | |
| Cost of providing services | | | | | | | | | | | | | | |
| Salaries and benefits | 26,086 |
| | 26,908 |
| | 54,787 |
| | 53,826 |
| 27,462 |
| | 26,515 |
| | 82,249 |
| | 80,341 |
|
| Occupancy | 13,932 |
| | 13,320 |
| | 28,169 |
| | 26,747 |
| 14,036 |
| | 13,522 |
| | 42,205 |
| | 40,269 |
|
| Office | 5,457 |
| | 5,532 |
| | 10,570 |
| | 11,985 |
| 5,993 |
| | 7,326 |
| | 16,563 |
| | 19,311 |
|
| Other costs of providing services | 12,854 |
| | 12,601 |
| | 27,074 |
| | 26,032 |
| 12,843 |
| | 12,484 |
| | 39,917 |
| | 38,516 |
|
| Advertising | 12,780 |
| | 15,113 |
| | 20,566 |
| | 22,998 |
| 16,424 |
| | 21,349 |
| | 36,990 |
| | 44,347 |
|
| Total cost of providing services | 71,109 |
| | 73,474 |
| | 141,166 |
| | 141,588 |
| 76,758 |
| | 81,196 |
| | 217,924 |
| | 222,784 |
|
| Gross margin | 81,181 |
| | 77,348 |
| | 186,678 |
| | 183,194 |
| 96,639 |
| | 60,594 |
| | 283,317 |
| | 243,788 |
|
| | | | | | | | | | | | | | | |
| Operating expense | | | | | | | | | | | | | | |
| Corporate, district and other expenses | 39,038 |
| | 32,980 |
| | 88,126 |
| | 68,409 |
| 38,665 |
| | 27,495 |
| | 123,043 |
| | 95,904 |
|
| Interest expense | 17,023 |
| | 20,472 |
| | 34,713 |
| | 42,826 |
| 17,364 |
| | 23,403 |
| | 52,077 |
| | 66,229 |
|
| Loss on extinguishment of debt | — |
| | — |
| | — |
| | 11,683 |
| — |
| | 69,200 |
| | — |
| | 80,883 |
|
| Loss from equity method investment | | 1,384 |
| | — |
| | 5,132 |
| | — |
|
| Total operating expense | 56,061 |
| | 53,452 |
| | 122,839 |
| | 122,918 |
| 57,413 |
| | 120,098 |
| | 180,252 |
| | 243,016 |
|
| Income from continuing operations before income taxes | 25,120 |
| | 23,896 |
| | 63,839 |
| | 60,276 |
| |
| Provision for income taxes | 7,453 |
| | 5,178 |
| | 17,499 |
| | 16,645 |
| |
| Net income from continuing operations | 17,667 |
|
| 18,718 |
| | 46,340 |
| | 43,631 |
| |
| Net (loss) income from discontinued operations, net of tax | (834 | ) | | (2,743 | ) | | 7,541 |
| | (4,364 | ) | |
| Net income | $ | 16,833 |
|
| $ | 15,975 |
| | $ | 53,881 |
| | $ | 39,267 |
| |
| Income (loss) from continuing operations before income taxes | | 39,226 |
| | (59,504 | ) | | 103,065 |
| | 772 |
|
| Provision (benefit) for income taxes | | 11,239 |
| | (16,914 | ) | | 28,738 |
| | (269 | ) |
| Net income (loss) from continuing operations | | 27,987 |
|
| (42,590 | ) | | 74,327 |
| | 1,041 |
|
| Net loss from discontinued operations, before income tax | | — |
| | (4,293 | ) | | (39,048 | ) | | (8,518 | ) |
Income tax expense (benefit) related to disposition
| | $ | 598 |
| | $ | 139 |
| | $ | (45,991 | ) | | $ | 278 |
|
| Net (loss) income from discontinued operations | | $ | (598 | ) | | $ | (4,432 | ) | | $ | 6,943 |
| | $ | (8,796 | ) |
| Net income (loss) | | $ | 27,389 |
|
| $ | (47,022 | ) | | $ | 81,270 |
| | $ | (7,755 | ) |
| | | | | | | | | |
| Basic earnings (loss) per share: | | | | | | | | |
| Continuing operations | | $ | 0.63 |
| | $ | (0.93 | ) | | $ | 1.63 |
| | $ | 0.02 |
|
| Discontinued operations | | (0.01 | ) | | (0.10 | ) | | 0.15 |
| | (0.19 | ) |
| Basic earnings per share | | $ | 0.62 |
| | $ | (1.03 | ) | | $ | 1.78 |
| | $ | (0.17 | ) |
| | | | | | | | | |
| Diluted earnings (loss) per share: | | | | | | | | |
| Continuing operations | | $ | 0.61 |
| | $ | (0.93 | ) | | $ | 1.59 |
| | $ | 0.03 |
|
| Discontinued operations | | (0.01 | ) | | (0.10 | ) | | 0.15 |
| | (0.19 | ) |
Diluted earnings per share (1) | | $ | 0.60 |
| | $ | (1.03 | ) | | $ | 1.74 |
| | $ | (0.16 | ) |
| | | | | | | | | | | | | | | |
| Weighted average common shares outstanding: | | | | | | | | | | | | | | |
| Basic | 46,451 |
| | 45,650 |
| | 46,438 |
| | 45,578 |
| 44,422 |
| | 45,853 |
| | 45,759 |
| | 45,674 |
|
| Diluted | 47,107 |
| | 47,996 |
| | 47,335 |
| | 47,757 |
| |
| | | | | | | | | |
| Basic income (loss) per share: | | | | | | | | |
| Continuing operations | $ | 0.38 |
| | $ | 0.41 |
| | $ | 1.00 |
| | $ | 0.96 |
| |
| Discontinued operations | (0.02 | ) | | (0.06 | ) | | 0.16 |
| | (0.10 | ) | |
| Basic income per share | $ | 0.36 |
| | $ | 0.35 |
| | $ | 1.16 |
| | $ | 0.86 |
| |
| | | | | | | | | |
| Diluted income (loss) per share: | | | | | | | | |
| Continuing operations | $ | 0.38 |
| | $ | 0.39 |
| | $ | 0.98 |
| | $ | 0.92 |
| |
| Discontinued operations | (0.02 | ) | | (0.06 | ) | | 0.16 |
| | (0.10 | ) | |
| Diluted income per share | $ | 0.36 |
| | $ | 0.33 |
| | $ | 1.14 |
| | $ | 0.82 |
| |
Diluted (1) | | 46,010 |
| | 45,853 |
| | 46,887 |
| | 48,061 |
|
| (1) As of December 31, 2018, the Company made certain insignificant adjustments to previously-reported Earnings Per Share ("EPS") to correctly reflect the effect of anti-dilutive shares on diluted EPS calculations in accordance with ASC 260. These changes were immaterial to the overall EPS calculation. Diluted loss per share for the three months ended September 30, 2018 of $0.97 was corrected to $1.03. | | (1) As of December 31, 2018, the Company made certain insignificant adjustments to previously-reported Earnings Per Share ("EPS") to correctly reflect the effect of anti-dilutive shares on diluted EPS calculations in accordance with ASC 260. These changes were immaterial to the overall EPS calculation. Diluted loss per share for the three months ended September 30, 2018 of $0.97 was corrected to $1.03. |
See accompanying Notes to Unauditedunaudited Condensed Consolidated Financial Statements.
Statements.
CURO GROUP HOLDINGS CORP. AND SUBSIDIARIES
CONDENSED CONSOLIDATED STATEMENTS OF COMPREHENSIVE INCOME (LOSS)
(in thousands)
(unaudited)
|
| | | | | | | | | | | | | | | |
| | Three Months Ended
June 30, | | Six Months Ended
June 30, |
| | 2019 | | 2018 | | 2019 | | 2018 |
| Net income | $ | 16,833 |
| | $ | 15,975 |
| | $ | 53,881 |
| | $ | 39,267 |
|
| Other comprehensive income (loss): |
| |
| |
| |
|
| Cash flow hedges, net of $0 tax in both periods | — |
| | (439 | ) | | — |
| | (385 | ) |
| Foreign currency translation adjustment, net of $0 tax in both periods | 3,635 |
| | (6,752 | ) | | 20,330 |
| | (9,663 | ) |
| Other comprehensive income (loss) | 3,635 |
| | (7,191 | ) | | 20,330 |
| | (10,048 | ) |
| Comprehensive income | $ | 20,468 |
| | $ | 8,784 |
| | $ | 74,211 |
| | $ | 29,219 |
|
|
| | | | | | | | | | | | | | | |
| | Three Months Ended
September 30, | | Nine Months Ended
September 30, |
| | 2019 | | 2018 | | 2019 | | 2018 |
| Net income (loss) | $ | 27,389 |
| | $ | (47,022 | ) | | $ | 81,270 |
| | $ | (7,755 | ) |
| Other comprehensive (loss) income: |
| |
| |
| |
|
| Cash flow hedges, net of $0 tax in both periods | — |
| | (187 | ) | | — |
| | (572 | ) |
| Foreign currency translation adjustment, net of $0 tax in both periods | (1,954 | ) | | 2,649 |
| | 18,376 |
| | (7,015 | ) |
| Other comprehensive (loss) income | (1,954 | ) | | 2,462 |
| | 18,376 |
| | (7,587 | ) |
| Comprehensive income (loss) | $ | 25,435 |
| | $ | (44,560 | ) | | $ | 99,646 |
| | $ | (15,342 | ) |
See accompanying Notes to Unauditedunaudited Condensed Consolidated Financial Statements.
CURO GROUP HOLDINGS CORP. AND SUBSIDIARIES
CONDENSED CONSOLIDATED STATEMENT OF CASH FLOWS
(dollars in thousands, unaudited)
| | | | Six Months Ended June 30, | Nine Months Ended September 30, |
| | 2019 | | 2018 | 2019 | | 2018 |
| Cash flows from operating activities | | | | | | |
| Net income from continuing operations | $ | 46,340 |
| | $ | 43,631 |
| $ | 74,327 |
| | $ | 1,041 |
|
| Adjustments to reconcile net income to net cash provided by continuing operating activities: | | | | | | |
| Depreciation and amortization | 9,571 |
| | 9,005 |
| 14,180 |
| | 13,628 |
|
| Provision for loan losses | 214,395 |
| | 163,230 |
| 338,262 |
| | 290,922 |
|
| Amortization of debt issuance costs and bond (premium)/discount | 1,568 |
| | 2,117 |
| |
| Amortization of debt issuance costs and bond discount | | 2,273 |
| | 2,923 |
|
| Deferred income tax (benefit) expense | (3,596 | ) | | 3,199 |
| (3,147 | ) | | 3,005 |
|
| Loss on disposal of property and equipment | 1,834 |
| | 517 |
| 47 |
| | 640 |
|
| Loss on extinguishment of debt | — |
| | 11,683 |
| — |
| | 80,883 |
|
| Increase in cash surrender value of life insurance | (991 | ) | | (2,223 | ) | |
| Share-based compensation expense | 4,816 |
| | 4,023 |
| |
| Loss from equity method investment | | 5,132 |
| | — |
|
| Share-based compensation | | 7,587 |
| | 6,112 |
|
| Changes in operating assets and liabilities: | | | | | | |
| Accrued fees and service charges on loans receivable | (1,171 | ) | | 2,928 |
| |
| Accrued interest on loans receivable | | (11,446 | ) | | (5,986 | ) |
| Prepaid expenses and other assets | 16,344 |
| | 5,853 |
| 14,275 |
| | 2,695 |
|
| Other assets | (3,790 | ) | | — |
| (8,439 | ) | | (2,458 | ) |
| Accounts payable and accrued liabilities | 9,527 |
| | (2,080 | ) | 13,596 |
| | (4,862 | ) |
| Deferred revenue | (915 | ) | | (1,193 | ) | (533 | ) | | (1,984 | ) |
| Income taxes payable | 25,123 |
| | 26,727 |
| 25,117 |
| | 326 |
|
| Income taxes receivable | (8,253 | ) | | (18,436 | ) | 5,598 |
| | (12,908 | ) |
| Deferred rent | — |
| | 127 |
| |
| Accrued Interest | (1,247 | ) | | (3,284 | ) | |
| Accrued interest | | (15,303 | ) | | (18,060 | ) |
| Other liabilities | 2,764 |
| | 909 |
| 2,767 |
| | 1,162 |
|
| Net cash provided by continuing operating activities | 312,319 |
| | 246,733 |
| 464,293 |
| | 357,079 |
|
| Net cash (used in) provided by discontinued operating activities | (504 | ) | | 5,458 |
| (504 | ) | | 5,562 |
|
| Net cash provided by operating activities | 311,815 |
| | 252,191 |
| 463,789 |
| | 362,641 |
|
| Cash flows from investing activities | | | | | | |
| Purchase of property, equipment and software | (6,164 | ) | | (2,957 | ) | (8,667 | ) | | (8,030 | ) |
| Loans receivable originated or acquired | (879,081 | ) | | (1,063,072 | ) | (1,369,644 | ) | | (1,624,881 | ) |
| Loans receivable repaid | 661,882 |
| | 868,436 |
| 995,291 |
| | 1,212,446 |
|
| Investments in Cognical Holdings | (4,368 | ) | | (958 | ) | |
| Investments in Cognical Holdings, Inc. ("Zibby") | | (8,168 | ) | | (958 | ) |
| Net cash used in continuing investing activities | (227,731 | ) | | (198,551 | ) | (391,188 | ) | | (421,423 | ) |
| Net cash used in discontinued investing activities | (14,213 | ) | | (14,349 | ) | (14,213 | ) | | (24,481 | ) |
| Net cash used in investing activities | (241,944 | ) | | (212,900 | ) | (405,401 | ) | | (445,904 | ) |
| Cash flows from financing activities | | | | | | |
| Net proceeds from issuance of common stock | — |
| | 12,431 |
| — |
| | 11,549 |
|
| Proceeds from Non-Recourse U.S. SPV facility | — |
| | 13,000 |
| — |
| | 17,000 |
|
| Payments on Non-Recourse U.S. SPV facility | — |
| | (19,163 | ) | — |
| | (61,590 | ) |
| Proceeds from Non-Recourse Canada SPV facility | 3,750 |
| | — |
| 15,992 |
| | 89,949 |
|
| Payments on Non-Recourse Canada SPV facility | (24,752 | ) | | — |
| (24,835 | ) | | — |
|
| Payments on 12.00% Senior Secured Notes | — |
| | (77,500 | ) | — |
| | (605,000 | ) |
| Proceeds from 8.25% Senior Secured Notes | | — |
| | 690,000 |
|
| Debt issuance costs paid | (198 | ) | | (168 | ) | (198 | ) | | (17,517 | ) |
| Proceeds from credit facilities | 68,002 |
| | 18,798 |
| 179,811 |
| | 65,169 |
|
| Payments on credit facilities | (88,002 | ) | | (18,798 | ) | (174,811 | ) | | (36,169 | ) |
| Payments on subordinated stockholder debt | (2,245 | ) | | — |
| (2,252 | ) | | — |
|
| Payments of call premiums from early debt extinguishments | — |
| | (9,300 | ) | — |
| | (63,350 | ) |
| Proceeds from exercise of stock options | 27 |
| | 39 |
| 87 |
| | 408 |
|
| Payments to net share settle restricted stock units vesting | | (110 | ) | | — |
|
| Repurchase of common stock | (1,762 | ) | | — |
| (52,172 | ) | | — |
|
Net cash used in financing activities (1) | (45,180 | ) | | (80,661 | ) | |
CURO GROUP HOLDINGS CORP. AND SUBSIDIARIES
CONDENSED CONSOLIDATED STATEMENT OF CASH FLOWS
(dollars in thousands, unaudited)
|
| | | | | | | |
| Effect of exchange rate changes on cash and restricted cash | 1,461 |
| | (4,189 | ) |
| Net increase (decrease) in cash and restricted cash | 26,152 |
| | (45,559 | ) |
| Cash and restricted cash at beginning of period | 99,857 |
| | 174,491 |
|
| Cash and restricted cash at end of period | 126,009 |
| | 128,932 |
|
| Less: Cash and restricted cash of discontinued operations at end of period | — |
| | 12,460 |
|
| Cash and restricted cash of continuing operations at end of period | $ | 126,009 |
| | $ | 116,472 |
|
| (1) Financing activities include continuing operations only, and were not impacted by discontinued operations |
|
| | | | | | | |
Net cash (used in) provided by financing activities (1) | (58,488 | ) | | 90,449 |
|
| Effect of exchange rate changes on cash and restricted cash | 1,204 |
| | (4,080 | ) |
| Net increase in cash and restricted cash | 1,104 |
| | 3,106 |
|
| Cash and restricted cash at beginning of period | 99,857 |
| | 174,491 |
|
| Cash and restricted cash at end of period | 100,961 |
| | 177,597 |
|
| Less: Cash and restricted cash of discontinued operations at end of period | — |
| | 11,303 |
|
| Cash and restricted cash of continuing operations at end of period | $ | 100,961 |
| | $ | 166,294 |
|
| (1) Financing activities include continuing operations only, and were not impacted by discontinued operations |
See accompanying Notes to Unauditedunaudited Condensed Consolidated Financial Statements.
CURO GROUP HOLDINGS CORP. AND SUBSIDIARIES
NOTES TO CONDENSED CONSOLIDATED FINANCIAL STATEMENTS
(unaudited)
NOTE 1 – SUMMARY OF SIGNIFICANT ACCOUNTING POLICIES AND NATURE OF OPERATIONS
Basis of Presentation
The terms “CURO" and the “Company” refer to CURO Group Holdings Corp. and its directly and indirectly owned subsidiaries as a combined entity, except where otherwise stated. The term "CFTC" refers to CURO Financial Technologies Corp., a wholly-owned subsidiary, and its directly and indirectly owned subsidiaries as a consolidated entity, except where otherwise stated.
The Company has prepared the accompanying unaudited Condensed Consolidated Financial Statements ("Condensed Consolidated Financial Statements") in accordance with accounting principles generally accepted in the United States of America (“US GAAP”), and with the accounting policies described in its Annual Report on Form 10-K for the year ended December 31, 2018 filed with the Securities and Exchange Commission (the "SEC") on March 18, 2019 ("2018 Form 10-K"). Certain information and note disclosures normally included in annual financial statements prepared in accordance with US GAAP have been condensed or omitted, although the Company believes that the disclosures are adequate to enable a reasonable understanding of the information presented. Additionally, in September 2018, and subsequently expanded in June 2019, the SEC changed the definition of a smaller reporting company ("SRC"). The change in definition of an SRC would allow more registrants to qualify to report under scaled disclosure requirements. Under these rules, CURO meets the definition of an SRC as of June 30, 2019.
The Condensed Consolidated Financial Statements and the accompanying notes reflect all adjustments, which are, in the opinion of management, necessary to present fairly the Company's results of operations, financial position and cash flows for the periods presented. On February 25, 2019, the Company's United Kingdom ("U.K.") operations were placed into administration, which resulted in treatment of the segment as discontinued operations for all periods presented. Throughout this Quarterly Report on Form 10-Q ("Form 10-Q"), current and prior period financial information is presented as if the U.K. segment was excluded from continuing operations. For further information about the placement of the segment into administration, refer to "--Nature of Operations" below.
The Condensed Consolidated Financial Statements should be read in conjunction with the Consolidated Financial Statements and related Notes included in the 2018 Form 10-K. Interim results of operations are not necessarily indicative of results that may be expected for future interim periods or for the year ending December 31, 2019.
Principles of Consolidation
The Condensed Consolidated Financial Statements include the accounts of CURO and its wholly-owned subsidiaries. Intercompany transactions and balances have been eliminated in consolidation.
Equity Investment in Unconsolidated Entity
In April 2019, as part of a broader capital structure reorganization by the investee company, the Company made an additional $2.8 million cash investment in Cognical Holdings, which operates under the Zibby brand. See Note 8 - "Financial Instruments" for additional detail on the adjustment to fair value for the quarter ended June 30, 2019.
Use of Estimates
The preparation of Condensed Consolidated Financial Statements in conformity with US GAAP requires management to make estimates and assumptions that affect the reported amounts of assets and liabilities and the disclosure of contingent assets and liabilities at the date of the financial statements. Estimates also affect the reported amounts of revenues and expenses during the periods reported. Some of the significant estimates that the Company made in the accompanying Condensed Consolidated Financial Statements include allowances for loan losses, certain assumptions related to goodwill and intangibles, accruals related to self-insurance, credit services organization ("CSO") liability for losses and estimated tax liabilities. Actual results may differ from those estimates.
Nature of Operations
CURO is a growth-oriented, technology-enabled, highly-diversified consumer finance company serving a wide range of underbanked consumers in the United States ("U.S."), Canada and, through February 25, 2019, the U.K.
CURO GROUP HOLDINGS CORP. AND SUBSIDIARIES
NOTES TO CONDENSED CONSOLIDATED FINANCIAL STATEMENTS (continued)
(unaudited)
U.K. Segment Placed into Administration
On February 25, 2019, the Company announced that a proposed Scheme of Arrangement ("SOA"), as described in the Company's Current Report on Form 8-K filed January 31, 2019, would not be implemented. In accordance with the provisions of the U.K. Insolvency Act 1986 and as approved by the boards of directors of the Company’s U.K. subsidiaries, Curo Transatlantic Limited and SRC Transatlantic Limited (collectively, “the U.K. Subsidiaries”), insolvency practitioners from KPMG were appointed as administrators (“Administrators”) for the U.K. Subsidiaries. The effect of the U.K. Subsidiaries’ entry into administration was to place their management, affairs, business and property under the direct control of the Administrators. Accordingly, the Company deconsolidated the U.K. Subsidiaries as of February 25, 2019 and presented the U.K. Subsidiaries as Discontinued Operations for all periods presented in this Form 10-Q.
Basis of Presentation
The terms “CURO" and the “Company” refer to CURO Group Holdings Corp. and its directly and indirectly owned subsidiaries as a consolidated entity, except where otherwise stated. The term "CFTC" refers to CURO Financial Technologies Corp., a wholly-owned subsidiary of the Company, and its directly and indirectly owned subsidiaries as a consolidated entity, except where otherwise stated.
The Company has prepared the accompanying unaudited Condensed Consolidated Financial Statements ("Condensed Consolidated Financial Statements") in accordance with accounting principles generally accepted in the United States of America (“US GAAP”), and with the accounting policies described in its Annual Report on Form 10-K for the year ended December 31, 2018 filed with the Securities and Exchange Commission (the "SEC") on March 18, 2019 ("2018 Form 10-K"). Operating results for the three and nine month periods ended September 30, 2019 are not necessarily indicative of the results that might be expected for any other interim period or the fiscal year ending December 31, 2019.
Certain information and note disclosures normally included in annual financial statements prepared in accordance with US GAAP have been condensed or omitted, although the Company believes that the disclosures are adequate to enable a reasonable understanding of the information presented. Additionally, in September 2018, and subsequently expanded in June 2019, the SEC changed the definition of a smaller reporting company ("SRC"). The change in definition of an SRC allows more registrants to qualify to report under scaled disclosure requirements. Under these rules, CURO met the definition of an SRC as of June 30, 2019. Refer to "--FASB Definition of an SRC as related to the CECL standard and evaluation of the impact of the CECL standard" for information regarding the impact on the Company of meeting the definition of an SRC.
The Condensed Consolidated Financial Statements and the accompanying notes reflect all adjustments (consisting only of adjustments of a normal and recurring nature) which are, in the opinion of management, necessary to present fairly the Company's results of operations, financial position and cash flows for the periods presented. On February 25, 2019, the Company's United Kingdom ("U.K.") segment, as defined by ASC 280, was placed into administration, resulting in the treatment of it as discontinued operations per ASC 205-20. Throughout this Quarterly Report on Form 10-Q ("Form 10-Q"), current and prior-period financial information presents the U.K. segment as discontinued operations as required. For further information about the placement of the segment into administration, refer to "--Nature of Operations" below.
The Condensed Consolidated Financial Statements should be read in conjunction with the Consolidated Financial Statements and related Notes included in the 2018 Form 10-K. Interim results of operations are not necessarily indicative of results that may be expected for future interim periods or for the year ending December 31, 2019.
Principles of Consolidation
The Condensed Consolidated Financial Statements include the accounts of CURO and its wholly-owned subsidiaries. Intercompany transactions and balances have been eliminated in consolidation.
CURO GROUP HOLDINGS CORP. AND SUBSIDIARIES
NOTES TO CONDENSED CONSOLIDATED FINANCIAL STATEMENTS (continued)
(unaudited)
Equity Investment in Unconsolidated Entity
During the nine months ended September 30, 2019, the Company invested an additional $6.6 million in Cognical Holdings, Inc. ("Zibby"), offset by a $3.7 million carrying value adjustment as a result of the additional investment. As of September 30, 2019, the Company owned 42.3% of Zibby. See Note 8 - "Fair Value Measurements" for additional detail on Zibby's fair value considerations for the nine months ended September 30, 2019.
Use of Estimates
The preparation of Condensed Consolidated Financial Statements in conformity with US GAAP requires management to make estimates and assumptions that affect the reported amounts of assets and liabilities and the disclosure of contingent assets and liabilities at the date of the financial statements. Estimates also affect the reported amounts of revenues and expenses during the periods reported. Some of the significant estimates that the Company made in the accompanying Condensed Consolidated Financial Statements include allowances for loan losses, certain assumptions related to equity investments, goodwill and intangibles, accruals related to self-insurance, credit services organization ("CSO") liability for losses, and estimated tax liabilities. Actual results may differ from those estimates.
Open-End Loss Recognition
Effective January 1, 2019, the Company modified the timeframe for which it charges-off Open-End loans and made related refinements to its loss provisioning methodology. Prior to January 1, 2019, the Company deemed Open-End loans uncollectible and charged-off when a customer missed a scheduled payment and the loan was considered past due.past-due. Because of the continuingcontinued shift to Open-End loans in Canada and analysis of payment patterns on early-stage versus late-stage delinquencies, the Company revised its estimates and now considers Open-End loans uncollectible when the loan has been contractually past-due for 90 consecutive days. Consequently, past duepast-due Open-End loans and related accrued interest now remain in loans receivable for 90 days before being charged-off against the allowance for loan losses. All recoveries on charged-off loans are credited to the allowance for loan losses. TheQuarterly, the Company evaluates the adequacy of the allowance for loan losses compared to the related gross loans receivable balances that include accrued interest.
The aforementioned change was treated as a change in accounting estimate for accounting purposes and applied prospectively effective January 1, 2019.
The change affects comparability towith prior periods as follows:
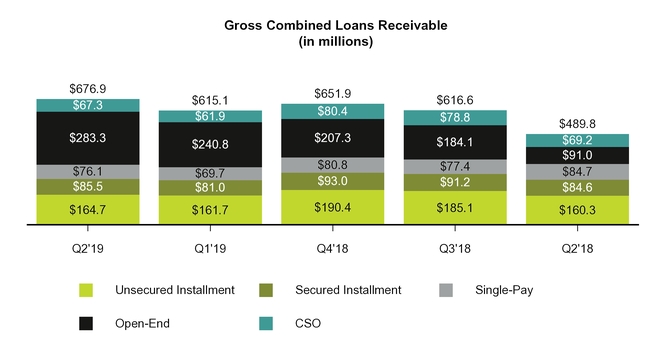
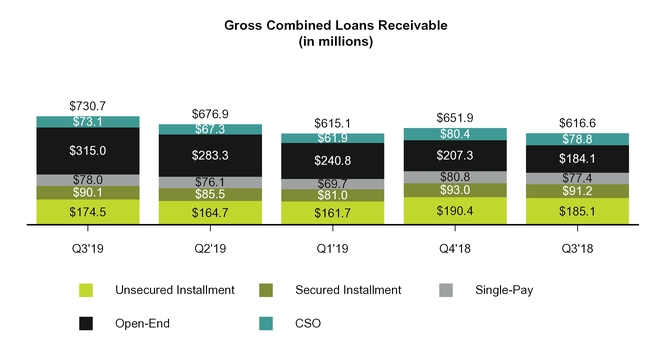
Gross combined loans receivable: balances as of JuneSeptember 30, 2019 include $35.4$46.1 million of Open-End loans that are up to 90 days past-due with related accrued interest, while such balances for periods prior to March 31, 2019 do not include any past duepast-due loans.
Revenues: for the three and sixnine months ended JuneSeptember 30, 2019, gross revenues include interest earned on past-due loan balances of approximately $12$15 million and $21$35 million, respectively, while revenues in prior-year periods do not include comparable amounts.
Provision for Losses: prospectively, from January 1, 2019, past-due, unpaid balances plus related accrued interest charge-off on day 91. Provision expense is affected by total charge-offs less total recoveries ("NCOs") plus changes to the Allowance for loan losses. Because NCOs prospectively include unpaid principal and up to 90 days of related accrued interest, NCO amounts and rates are higher and the Open-End Allowance for loan losses as a percentage of Open-End gross loans receivable is higher. The Open-End Allowance for loan losses as a percentage of Open-End gross loans receivable increased to 18.3%17.2% at JuneSeptember 30, 2019, compared to 10.7%9.8% in the samecomparable prior-year period.
Correction of Immaterial Errors in Previously-Issued Financial Statements
During the year ended December 31, 2018, the Company corrected immaterial errors toin its prior presentation of cash flows for loan originations and collections on principal. The Company determined that the historical presentation was in error by not conforming to US GAAP because it included outflows for loan originations and receipts on collections in Cash provided by operating activities rather than in Cash used in investing activities. Accordingly, the Company corrected previously filed financial statements by reclassifying cash outflows for loan originations and receipts on collections of principal of $48.2$412.4 million from net Cash provided by operating activities to net Cash used in investing activities for the sixnine months ended JuneSeptember 30, 2018. Total cash flows for each period presented did not change. The Company concluded that the errors were immaterial to the unaudited Condensed Consolidated Financial Statements included in the Company’s Quarterly Report on Form 10-Q for the three and sixnine months ended June 30, 2018. The Company has revised its Condensed Consolidated Financial Statements for the six months ended June 30, 2018 presented in this Form 10-Q. A summary of the correction follows:
CURO GROUP HOLDINGS CORP. AND SUBSIDIARIES
NOTES TO CONDENSED CONSOLIDATED FINANCIAL STATEMENTS (continued)
(unaudited)
ended September 30, 2018. The Company has revised its Condensed Consolidated Financial Statements for the nine months ended September 30, 2018 presented in this Form 10-Q. A summary of the correction follows (in thousands):
| | | (dollars in thousands) | | Six Months Ended June 30, 2018 | |
| | | | Nine Months Ended September 30, 2018 |
As Reported:(1) | | | | |
| Net cash provided by continuing operating activities | | $ | 52,097 |
| |
| Net cash used in continuing operating activities | | | $ | (55,356 | ) |
| Net cash used in continuing investing activities | | (3,915 | ) | | (8,988 | ) |
| | | | | |
| As Corrected: | | | | |
| Net cash provided by continuing operating activities | | 246,733 |
| | 357,079 |
|
| Net cash used in continuing investing activities | | (198,551 | ) | | (421,423 | ) |
(1) "As reported" balances include amounts from continuing operations historically presented within these captions. |
Recently Adopted Accounting Pronouncements
ASU 2016-02
In February 2016, the Financial Accounting Standards Board ("FASB") issuedestablished Topic 842, Leases, by issuing ASU No. 2016-02, which requires lessees to recognize leases on the balance sheet and disclose key information about leasing arrangements. The Company adopted ASU 2016-02the standard as of January 1, 2019 using the alternative modified retrospective approach,method, also known as the transition relief method, permitted under ASU 2018-11, which provides a method for recording existing leases at adoption and inallows companies to not recast comparative periods that approximatesin the resultsperiod of a full retrospective approach.adoption. The Company elected the package of practical expedients permitted under the transition guidance which, among other things, permits companies to not reassess prior conclusions on lease identification, lease classification and initial direct costs. The Company also elected to combine lease and non-lease components and to exclude short-term leases, defined as having an initial term of 12 months or less, from the Condensed Consolidated Balance Sheets. The Company did not elect the hindsight practical expedient.
Due to
As of September 30, 2019, the adoption of the new standard, theCompany held right of use assets ("ROU assets") and additional operating lease liabilities ("lease liabilities") as of June 30, 2019 were $141.0$118.3 million and $148.8$126.0 million, respectively. Prepaid rent of $2.7 million and deferred liabilityliabilities of $10.9 million were included in ROU assets and lease liabilities, respectively.respectively, at the time of adoption. During the three months ended September 30, 2019, the Company reduced initial opening balances for ROU assets and lease liabilities recorded on January 1, 2019 by $18.0 million as a result of a previous misapplication of certain provisions of Topic 842. The standard did not materially impact of this misapplication on the Company's consolidated net earnings. financial position, results of operations, and cash flows was not material.
ASU 2018-122018-02
In February 2018, the FASB issued ASU 2018-02, Income Statement - Reporting Comprehensive Income (Topic 220): Reclassification of Certain Tax Effects from Accumulated Other Comprehensive income ("ASU 2018-02"), which permits the reclassification to retained earnings of disproportionate tax effects in accumulated other comprehensive income (loss) caused by the Tax Cuts and Jobs Act of 2017 ("2017 Tax Act"). The Company adopted ASU 2018-02 as of January 1, 2019, which did not have a material impact on the Condensed Consolidated Financial Statements.
Recently Issued Accounting Pronouncements Not Yet Adopted
Accounting Pronouncements Related to the Current Expected Credit Loss ("CECL") Standard
ASU 2016-13
In June 2016, the FASB issued ASU 2016-13, “Financial Instruments - Credit Losses (Topic 326): Measurement of Credit Losses on Financial Instruments,” and subsequent amendments to the guidance: ASU 2018-19 in November 2018, ASU 2019-04 in April 2019 and ASU 2019-05 in May 2019. The standard, as amended, changes how entities will measure credit losses for most financial assets and certain other instruments that are not measured at fair value through net income. The standard will replace the current “incurred loss” approach with an “expected loss” model for instruments measured at amortized cost. For available-for-sale debt securities, entities will be required to record allowances rather than reduce the carrying amount, as they currently do under the
CURO GROUP HOLDINGS CORP. AND SUBSIDIARIES
NOTES TO CONDENSED CONSOLIDATED FINANCIAL STATEMENTS (continued)
(unaudited)
other-than-temporary impairment model. The standard also simplifies the accounting model for purchased credit-impaired debt securities and loans. The amendment will affect loans, debt securities, trade receivables, net investments in leases, off-balance sheet credit exposures, reinsurance receivables, and any other financial assets not excluded from the scope that have the contractual right to receive cash. ASU 2019-04 clarifies that equity instruments without readily determinable fair values for which an entity has elected the measurement alternative should be remeasured to fair value as of the date that an observable transaction occurred. ASU 2019-05 provides an option to irrevocably elect to measure certain individual financial assets at fair value instead of amortized cost. The amendments should be applied on either a prospective transition or modified-retrospective approach depending on the subtopic. As issued, this ASU 2016-13 is effective for annual periods beginning after December 15, 2019, and interim periods therein. Early adoption is permitted for annual periods beginning after December 15, 2018, and interim periods therein. The Company is evaluating its alternatives with respect to the available accounting methods under ASU 2016‑13, including the fair value option. If the fair value option is not utilized, adoption of ASU 2016-13 will increase the allowance for credit losses with a resulting negative adjustment to retained earnings on the date of adoption. Additionally, as disclosed below in "--FASB Definition of an SRC as related to the Company is evaluatingCECL standard and evaluation of the impact of the FASB's definition of a SRCCECL standard", the Company expects to defer the adoption of ASU 2016-13.
CURO GROUP HOLDINGS CORP. AND SUBSIDIARIES
NOTES TO CONDENSED CONSOLIDATED FINANCIAL STATEMENTS (continued)
(unaudited)
2016-13 until at least January 1, 2021.
ASU 2019-05
In May 2019, the FASB issued ASU 2019-05,Financial Instruments - Credit Losses (Topic 326), which amends ASU 2016-13 to allow companies to irrevocably elect, upon adoption of ASU 2016-13, the fair value option on financial instruments that (i) were previously recorded at amortized cost and (ii) are within the scope of ASC 326-203326-20 if the instruments are eligible for the fair value option under ASC 825-10. The fair value option election does not apply to held-to-maturity debt securities. Entities are required to make this election on an instrument-by-instrument basis. ASU 2019-05’s amendments should be applied on a modified-retrospective basis by means of a cumulative-effect adjustment to the opening balance of retained earnings in the statement of financial position as of the date that an entity adopted the amendments in ASU 2016-13. For entities that have adopted ASU 2016-13, the amendments in ASU 2019-05 are effective for fiscal years beginning after December 15, 2019, including interim periods therein. An entity may early adopt the ASU in any interim period after its issuance if the entity has adopted ASU 2016-13. For all other entities, the effective date will be the same as the effective date for ASU 2016-13. We areThe Company expects to elect the option to defer adoption to a later effective date, as further described below in "--FASB Definition of an SRC as related to the CECL standard and evaluation of the impact of the CECL standard." The Company is currently evaluating the methods and impact of adopting this new standard on the Condensed Consolidated Financial Statements.
ASU 2019-04
In May 2019, the FASB issued ASU 2019-04,Codification Improvements to Topic 326, Financial Instruments - Credit Losses, Topic 815, Derivatives and Hedging, and Topic 825, Financial Instruments, which clarifies certain aspects of accounting for credit losses, hedging activities, and financial instruments. The ASU’s amendments apply to all entities within the scope of the affected guidance. Accrued interest - Amortized cost basis is defined in ASU 2016-13 as "the amount at which a financing receivable or investment is originated or acquired, adjusted for applicable accrued interest, accretion or amortization of premium, discount, and net deferred fees or costs, collection of cash, write-offs, foreign exchange, and fair value hedge accounting adjustments".adjustments." To address stakeholders’ concerns that the inclusion of accrued interest in the definition of amortized cost basis could make application of the credit loss guidance operationally burdensome, ASU 2019-04 provides certain alternatives for the measurement of the allowance for credit losses (ALL)("ALL") on accrued interest receivable (AIR)("AIR"). These measurement alternatives include (1)(i) measuring an ALL on AIR separately, (2)(ii) electing to provide separate disclosure of the AIR component of amortized cost as a practical expedient, and (3)(iii) making accounting policy elections to simplify certain aspects of the presentation and measurement of such AIR. As issued, for entities that have adopted ASU 2016-13, the amendments in ASU 2019-04 related to ASU 2016-13 are effective for fiscal years beginning after December 15, 2019, and interim periods therein. ASU 2019-04’s amendments should be applied "on a modified-retrospective basis by means of a cumulative-effect adjustment to the opening retained earnings balance in the statement of financial position as of the date an entity adopted the amendments in ASU 2016-13." Certain disclosures are also required. For all other entities,Due to the effective date will beFASB's decision to allow a deferment option for SRCs applying ASU 2016-13, the same as the effective date inCompany expects to defer adoption of both ASU 2016-13.2016-13 and ASU 2019-04.
CURO GROUP HOLDINGS CORP. AND SUBSIDIARIES
NOTES TO CONDENSED CONSOLIDATED FINANCIAL STATEMENTS (continued)
(unaudited)
FASB Definition of a Smaller Reporting Company ("SRC")an SRC as related to the CECL standard and evaluation of the impact of the CECL standard
On July 17,October 16, 2019, the FASB issued forapproved a 30-day comment period a draft proposal that would reconsider its philosophy for establishing effective dates for major projects for certain classes of companies, including SRCs. Under current SEC definitions, CURO meets the definition of an SRC as of June 30, 2019. The proposed standard wouldto defer required adoption of the CECL standard for SRCs until fiscal periods beginning after December 15, 2022. Under current SEC definitions, CURO met the definition of an SRC as of June 30, 2019. The FASB further confirmed that for CECL, a company makes an evaluation of SRC status in accordance with SEC rules at the time of standard effectiveness (i.e., as of June 30, 2019) and that status is effective for purposes of adopting the CECL standard regardless of future changes in SRC status. The FASB is expected to codify the approved proposal with issuance of a new ASU during the fourth quarter of 2019. The Company will continue to monitor the standard settingstandard-setting activities of the FASB and evaluate their potential impact on theexpects to elect to defer adoption of accounting standards such as ASU 2016-13 and ASU 2019-04. We arethe CECL standard. The Company is currently evaluating the methods and impact of adopting the CECL standard on the Condensed Consolidated Financial Statements.
SEC Disclosure Update
In August 2018, the SEC adopted final rules under SEC Release No. 33-10532, Disclosure Update and Simplification, amending certain disclosure requirements that had become redundant, duplicative, overlapping, outdated or superseded. Other than the amendment's expanded disclosure requirement for interim financial statements to disclose both current and comparative quarter and year-to-date reconciliations of changes in stockholders' equity, it did not have a material impact on the Company's Condensed Consolidated Financial Statements or Notes thereto for the three and sixnine months ended JuneSeptember 30, 2019, nor is it expected to have a material impact on the Company's annual disclosuresConsolidated Financial Statements or financial statements.Notes thereto.
NOTE 2 - VARIABLE INTEREST ENTITIES
In August 2018, the Company closed the Non-Recourse Canada SPV facility, whereby certain loan receivables were sold to wholly-owned, bankruptcy-remote special purpose subsidiaries ("VIEs") to collateralize debt incurred under the facility.
As the Company is the primary beneficiary of the VIEs, it includes the assets and liabilities related to the VIEs in its Condensed Consolidated Financial Statements. As required, the Company parenthetically discloses on the Condensed Consolidated Balance Sheets the
CURO GROUP HOLDINGS CORP. AND SUBSIDIARIES
NOTES TO CONDENSED CONSOLIDATED FINANCIAL STATEMENTS (continued)
(unaudited)
VIEs’ assets that can only be used to settle the VIEs' obligations and liabilities if the VIEs’ creditors have no recourse against the Company's general credit.
The carrying amounts of consolidated VIEs' assets and liabilities associated with the VIE subsidiaries were as follows:follows (in thousands):
| | | (in thousands) | June 30, 2019 | | December 31, 2018 | |
| | | | September 30, 2019 | | December 31, 2018 |
| Assets | | | | | | | |
| Restricted cash | $ | 14,819 |
| | $ | 12,840 |
| | $ | 21,897 |
| | $ | 12,840 |
|
| Gross loans receivable less allowance for loan losses | 190,121 |
| | 136,187 |
| | 206,158 |
| | 136,187 |
|
| Total Assets | $ | 204,940 |
| | $ | 149,027 |
| | $ | 228,055 |
| | $ | 149,027 |
|
| Liabilities | | | | | | | |
| Accounts payable and accrued liabilities | $ | 15,020 |
| | $ | 4,980 |
| | $ | 7,259 |
| | $ | 4,980 |
|
| Deferred revenue | 45 |
| | 40 |
| | 44 |
| | 40 |
|
| Accrued interest | 713 |
| | 831 |
| | 777 |
| | 831 |
|
| Intercompany payable | | | 93,671 |
| | 44,330 |
|
| Long-term debt | 90,977 |
| | 107,479 |
| | 102,483 |
| | 107,479 |
|
| Total Liabilities | $ | 106,755 |
| | $ | 113,330 |
| | $ | 204,234 |
| | $ | 157,660 |
|
CURO GROUP HOLDINGS CORP. AND SUBSIDIARIES
NOTES TO CONDENSED CONSOLIDATED FINANCIAL STATEMENTS (continued)
(unaudited)
NOTE 3 – LOANS RECEIVABLE AND REVENUE
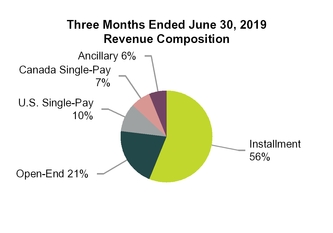
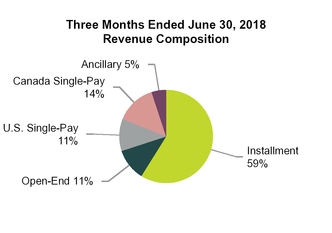
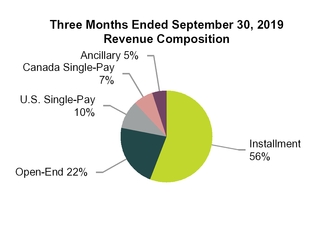
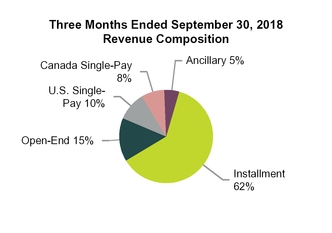
The following table summarizes revenue by product for the periods indicated:indicated (in thousands):
| | | | Three Months Ended June 30, | | Six Months Ended June 30, | | Three Months Ended September 30, | | Nine Months Ended September 30, |
| (in thousands) | 2019 | 2018 | | 2019 | | 2018 | |
| | | | 2019 | | 2018 | | 2019 | | 2018 |
| Unsecured Installment | $ | 122,112 |
| $ | 114,936 |
| | $ | 257,890 |
| | $ | 240,315 |
| | $ | 137,233 |
| | $ | 137,660 |
| | $ | 395,119 |
| | $ | 377,976 |
|
| Secured Installment | 26,076 |
| 25,777 |
| | 53,553 |
| | 52,633 |
| | 28,270 |
| | 28,562 |
| | 81,823 |
| | 81,195 |
|
| Open-End | 54,972 |
| 27,222 |
| | 107,841 |
| | 54,445 |
| | 66,120 |
| | 40,290 |
| | 173,961 |
| | 94,735 |
|
| Single-Pay | 45,528 |
| 58,325 |
| | 92,289 |
| | 118,682 |
| | 49,312 |
| | 50,614 |
| | 141,605 |
| | 169,296 |
|
| Ancillary | 15,612 |
| 10,909 |
| | 30,666 |
| | 21,937 |
| | 16,329 |
| | 12,356 |
| | 46,995 |
| | 34,292 |
|
| Total revenue | $ | 264,300 |
| $ | 237,169 |
| | $ | 542,239 |
| | $ | 488,012 |
| | $ | 297,264 |
| | $ | 269,482 |
| | $ | 839,503 |
| | $ | 757,494 |
|
The following tables summarize Loans receivable by product and the related delinquent loans receivable at JuneSeptember 30, 2019:2019 (in thousands):
| | | | | June 30, 2019 | | September 30, 2019 |
| (in thousands) | | Single-Pay | Unsecured Installment | Secured Installment | Open-End | Total | |
| | | | Single-Pay | Unsecured Installment | Secured Installment | Open-End | Total |
| Current loans receivable | | $ | 76,126 |
| $ | 126,685 |
| $ | 71,218 |
| $ | 247,915 |
| $ | 521,944 |
| | $ | 78,039 |
| $ | 127,952 |
| $ | 72,866 |
| $ | 268,918 |
| $ | 547,775 |
|
| Delinquent loans receivable | | — |
| 38,037 |
| 14,216 |
| 35,396 |
| 87,649 |
| | — |
| 46,537 |
| 17,250 |
| 46,053 |
| 109,840 |
|
| Total loans receivable | | 76,126 |
| 164,722 |
| 85,434 |
| 283,311 |
| 609,593 |
| | 78,039 |
| 174,489 |
| 90,116 |
| 314,971 |
| 657,615 |
|
| Less: allowance for losses | | (4,941 | ) | (35,223 | ) | (9,996 | ) | (51,717 | ) | (101,877 | ) | | (5,662 | ) | (38,127 | ) | (10,363 | ) | (54,233 | ) | (108,385 | ) |
| Loans receivable, net | | $ | 71,185 |
| $ | 129,499 |
| $ | 75,438 |
| $ | 231,594 |
| $ | 507,716 |
| | $ | 72,377 |
| $ | 136,362 |
| $ | 79,753 |
| $ | 260,738 |
| $ | 549,230 |
|
| | | | | June 30, 2019 | | September 30, 2019 |
| (in thousands) | | Unsecured Installment | Secured Installment | Open-End | Total | |
| | | | Unsecured Installment | Secured Installment | Open-End | Total |
| Delinquent loans receivable | | | | | | |
| 0-30 days past due | | $ | 14,995 |
| $ | 7,096 |
| $ | 14,997 |
| $ | 37,088 |
| | $ | 17,187 |
| $ | 7,456 |
| $ | 18,734 |
| $ | 43,377 |
|
| 31-60 days past due | | 11,176 |
| 3,358 |
| 9,455 |
| 23,989 |
| | 13,890 |
| 4,711 |
| 13,283 |
| 31,884 |
|
| 61-90 days past due | | 11,866 |
| 3,762 |
| 10,944 |
| 26,572 |
| |
| 61 + days past due | | | 15,460 |
| 5,083 |
| 14,036 |
| 34,579 |
|
| Total delinquent loans receivable | | $ | 38,037 |
| $ | 14,216 |
| $ | 35,396 |
| $ | 87,649 |
| | $ | 46,537 |
| $ | 17,250 |
| $ | 46,053 |
| $ | 109,840 |
|
The following tables summarize Loans receivable by product and the related delinquent loans receivable at December 31, 2018 (in thousands):
|
| | | | | | | | | | | | | | | | |
| | | December 31, 2018 |
| | | Single-Pay | Unsecured Installment | Secured Installment | Open-End | Total |
| Current loans receivable | | $ | 80,823 |
| $ | 141,316 |
| $ | 75,583 |
| $ | 207,333 |
| $ | 505,055 |
|
| Delinquent loans receivable | | — |
| 49,087 |
| 17,389 |
| — |
| 66,476 |
|
| Total loans receivable | | 80,823 |
| 190,403 |
| 92,972 |
| 207,333 |
| 571,531 |
|
| Less: allowance for losses | | (4,189 | ) | (37,716 | ) | (12,191 | ) | (19,901 | ) | (73,997 | ) |
| Loans receivable, net | | $ | 76,634 |
| $ | 152,687 |
| $ | 80,781 |
| $ | 187,432 |
| $ | 497,534 |
|
CURO GROUP HOLDINGS CORP. AND SUBSIDIARIES
NOTES TO CONDENSED CONSOLIDATED FINANCIAL STATEMENTS (continued)
(unaudited)
The following tables summarize Loans receivable by product and the related delinquent loans receivable at December 31, 2018:
|
| | | | | | | | | | | | | | | | |
| | | December 31, 2018 |
| (in thousands) | | Single-Pay | Unsecured Installment | Secured Installment | Open-End | Total |
| Current loans receivable | | $ | 80,823 |
| $ | 141,316 |
| $ | 75,583 |
| $ | 207,333 |
| $ | 505,055 |
|
| Delinquent loans receivable | | — |
| 49,087 |
| 17,389 |
| — |
| 66,476 |
|
| Total loans receivable | | 80,823 |
| 190,403 |
| 92,972 |
| 207,333 |
| 571,531 |
|
| Less: allowance for losses | | (4,189 | ) | (37,716 | ) | (12,191 | ) | (19,901 | ) | (73,997 | ) |
| Loans receivable, net | | $ | 76,634 |
| $ | 152,687 |
| $ | 80,781 |
| $ | 187,432 |
| $ | 497,534 |
|
| | | | | December 31, 2018 | | December 31, 2018 |
| (in thousands) | | Unsecured Installment | Secured Installment | Total | |
| | | | Unsecured Installment | Secured Installment | Total |
| Delinquent loans receivable | | |
|
| | |
|
|
| 0-30 days past due | | $ | 17,850 |
| $ | 7,870 |
| $ | 25,720 |
| | $ | 17,850 |
| $ | 7,870 |
| $ | 25,720 |
|
| 31-60 days past due | | 14,705 |
| 4,725 |
| 19,430 |
| | 14,705 |
| 4,725 |
| 19,430 |
|
| 61-90 days past due | | 16,532 |
| 4,794 |
| 21,326 |
| |
| 61 + days past due | | | 16,532 |
| 4,794 |
| 21,326 |
|
| Total delinquent loans receivable | | $ | 49,087 |
| $ | 17,389 |
| $ | 66,476 |
| | $ | 49,087 |
| $ | 17,389 |
| $ | 66,476 |
|
The following tables summarize loans guaranteed by the Company under CSO programs and the related delinquent receivables at JuneSeptember 30, 2019:2019 (in thousands):
| | | | | June 30, 2019 | | September 30, 2019 |
| (in thousands) | | Unsecured Installment | Secured Installment | Total | |
| | | | Unsecured Installment | Secured Installment | Total |
| Current loans receivable guaranteed by the Company | | $ | 54,968 |
| $ | 1,930 |
| $ | 56,898 |
| | $ | 58,862 |
| $ | 1,966 |
| $ | 60,828 |
|
| Delinquent loans receivable guaranteed by the Company | | 10,087 |
| 354 |
| 10,441 |
| | 11,842 |
| 396 |
| 12,238 |
|
| Total loans receivable guaranteed by the Company | | 65,055 |
| 2,284 |
| 67,339 |
| | 70,704 |
| 2,362 |
| 73,066 |
|
| Less: Liability for losses on CSO lender-owned consumer loans | | (9,433 | ) | (71 | ) | (9,504 | ) | | (10,181 | ) | (68 | ) | (10,249 | ) |
| Loans receivable guaranteed by the Company, net | | $ | 55,622 |
| $ | 2,213 |
| $ | 57,835 |
| | $ | 60,523 |
| $ | 2,294 |
| $ | 62,817 |
|
| | | | | June 30, 2019 | | September 30, 2019 |
| (in thousands) | | Unsecured Installment | Secured Installment | Total | |
| | | | Unsecured Installment | Secured Installment | Total |
| Delinquent loans receivable | | |
|
| | |
|
|
| 0-30 days past due | | $ | 8,511 |
| $ | 299 |
| $ | 8,810 |
| | $ | 9,859 |
| $ | 330 |
| $ | 10,189 |
|
| 31-60 days past due | | 1,052 |
| 37 |
| 1,089 |
| | 1,229 |
| 41 |
| 1,270 |
|
| 61-90 days past due | | 524 |
| 18 |
| 542 |
| |
| 61+ days past due | | | 754 |
| 25 |
| 779 |
|
| Total delinquent loans receivable | | $ | 10,087 |
| $ | 354 |
| $ | 10,441 |
| | $ | 11,842 |
| $ | 396 |
| $ | 12,238 |
|
The following tables summarize loans guaranteed by the Company under CSO programs and the related delinquent receivables at December 31, 2018 (in thousands):
|
| | | | | | | | | | |
| | | December 31, 2018 |
| | | Unsecured Installment | Secured Installment | Total |
| Current loans receivable guaranteed by the Company | | $ | 65,743 |
| $ | 2,504 |
| $ | 68,247 |
|
| Delinquent loans receivable guaranteed by the Company | | 11,708 |
| 446 |
| 12,154 |
|
| Total loans receivable guaranteed by the Company | | 77,451 |
| 2,950 |
| 80,401 |
|
| Less: Liability for losses on CSO lender-owned consumer loans | | (11,582 | ) | (425 | ) | (12,007 | ) |
| Loans receivable guaranteed by the Company, net | | $ | 65,869 |
| $ | 2,525 |
| $ | 68,394 |
|
CURO GROUP HOLDINGS CORP. AND SUBSIDIARIES
NOTES TO CONDENSED CONSOLIDATED FINANCIAL STATEMENTS (continued)
(unaudited)
The following tables summarize loans guaranteed by the Company under CSO programs and the related delinquent receivables at December 31, 2018:
|
| | | | | | | | | | |
| | | December 31, 2018 |
| (in thousands) | | Unsecured Installment | Secured Installment | Total |
| Current loans receivable guaranteed by the Company | | $ | 65,743 |
| $ | 2,504 |
| $ | 68,247 |
|
| Delinquent loans receivable guaranteed by the Company | | 11,708 |
| 446 |
| 12,154 |
|
| Total loans receivable guaranteed by the Company | | 77,451 |
| 2,950 |
| 80,401 |
|
| Less: Liability for losses on CSO lender-owned consumer loans | | (11,582 | ) | (425 | ) | (12,007 | ) |
| Loans receivable guaranteed by the Company, net | | $ | 65,869 |
| $ | 2,525 |
| $ | 68,394 |
|
|
| | | | | | | | | | |
| | | December 31, 2018 |
| | | Unsecured Installment | Secured Installment | Total |
| Delinquent loans receivable | | | | |
| 0-30 days past due | | $ | 9,684 |
| $ | 369 |
| $ | 10,053 |
|
| 31-60 days past due | | 1,255 |
| 48 |
| 1,303 |
|
| 61 + days past due | | 769 |
| 29 |
| 798 |
|
| Total delinquent loans receivable | | $ | 11,708 |
| $ | 446 |
| $ | 12,154 |
|
|
| | | | | | | | | | |
| | | December 31, 2018 |
| (in thousands) | | Unsecured Installment | Secured Installment | Total |
| Delinquent loans receivable | | | | |
| 0-30 days past due | | $ | 9,684 |
| $ | 369 |
| $ | 10,053 |
|
| 31-60 days past due | | 1,255 |
| 48 |
| 1,303 |
|
| 61-90 days past due | | 769 |
| 29 |
| 798 |
|
| Total delinquent loans receivable | | $ | 11,708 |
| $ | 446 |
| $ | 12,154 |
|
The following table summarizes activity in the allowance for loan losses during the three months ended JuneSeptember 30, 2019:2019 (in thousands):
| | | | Three Months Ended June 30, 2019 | Three Months Ended September 30, 2019 |
| (in thousands) | Single-Pay | Unsecured Installment | Secured Installment | Open-End | Other | Total | |
| | | Single-Pay | Unsecured Installment | Secured Installment | Open-End | Other | Total |
| Balance, beginning of period | $ | 3,897 |
| $ | 33,666 |
| $ | 9,796 |
| $ | 46,963 |
| $ | — |
| $ | 94,322 |
| $ | 4,941 |
| $ | 35,223 |
| $ | 9,996 |
| $ | 51,717 |
| $ | — |
| $ | 101,877 |
|
| Charge-offs | (35,759 | ) | (37,336 | ) | (10,295 | ) | (30,688 | ) | (1,342 | ) | (115,420 | ) | (40,512 | ) | (34,252 | ) | (10,592 | ) | (31,993 | ) | (1,382 | ) | (118,731 | ) |
| Recoveries | 24,301 |
| 5,366 |
| 2,693 |
| 5,537 |
| 822 |
| 38,719 |
| 26,599 |
| 5,279 |
| 2,445 |
| 3,791 |
| 845 |
| 38,959 |
|
| Net charge-offs | (11,458 | ) | (31,970 | ) | (7,602 | ) | (25,151 | ) | (520 | ) | (76,701 | ) | (13,913 | ) | (28,973 | ) | (8,147 | ) | (28,202 | ) | (537 | ) | (79,772 | ) |
| Provision for losses | 12,446 |
| 33,514 |
| 7,802 |
| 29,373 |
| 520 |
| 83,655 |
| 14,736 |
| 31,891 |
| 8,514 |
| 31,220 |
| 537 |
| 86,898 |
|
| Effect of foreign currency translation | 56 |
| 13 |
| — |
| 532 |
| — |
| 601 |
| (102 | ) | (14 | ) | — |
| (502 | ) | — |
| (618 | ) |
| Balance, end of period | $ | 4,941 |
| $ | 35,223 |
| $ | 9,996 |
| $ | 51,717 |
| $ | — |
| $ | 101,877 |
| $ | 5,662 |
| $ | 38,127 |
| $ | 10,363 |
| $ | 54,233 |
| $ | — |
| $ | 108,385 |
|
| Allowance for loan losses as a percentage of gross loan receivables | 6.5 | % | 21.4 | % | 11.7 | % | 18.3 | % | N/A |
| 16.7 | % | 7.3 | % | 21.9 | % | 11.5 | % | 17.2 | % | N/A |
| 16.5 | % |
The following table summarizes activity in the liability for losses on CSO lender-owned consumer loans during the three months ended JuneSeptember 30, 2019:2019 (in thousands):
| | | | Three Months Ended
June 30, 2019 | Three Months Ended September 30, 2019 |
| (in thousands) | Unsecured Installment | Secured Installment | Total | |
| | | Unsecured Installment | Secured Installment | Total |
| Balance, beginning of period | $ | 8,583 |
| $ | 78 |
| $ | 8,661 |
| $ | 9,433 |
| $ | 71 |
| $ | 9,504 |
|
| Charge-offs | (34,564 | ) | (683 | ) | (35,247 | ) | (43,072 | ) | (888 | ) | (43,960 | ) |
| Recoveries | 7,078 |
| 657 |
| 7,735 |
| 7,156 |
| 580 |
| 7,736 |
|
| Net charge-offs | (27,486 | ) | (26 | ) | (27,512 | ) | (35,916 | ) | (308 | ) | (36,224 | ) |
| Provision for losses | 28,336 |
| 19 |
| 28,355 |
| 36,664 |
| 305 |
| 36,969 |
|
| Balance, end of period | $ | 9,433 |
| $ | 71 |
| $ | 9,504 |
| $ | 10,181 |
| $ | 68 |
| $ | 10,249 |
|
The following table summarizes activity in the allowance for loan losses and the liability for losses on CSO lender-owned consumer loans, in total, during the three months ended September 30, 2019 (in thousands):
CURO GROUP HOLDINGS CORP. AND SUBSIDIARIES
NOTES TO CONDENSED CONSOLIDATED FINANCIAL STATEMENTS (continued)
(unaudited)
|
| | | | | | | | | | | | | | | | | | |
| | Three Months Ended September 30, 2019 |
| | Single-Pay | Unsecured Installment | Secured Installment | Open-End | Other | Total |
| Balance, beginning of period | $ | 4,941 |
| $ | 44,656 |
| $ | 10,067 |
| $ | 51,717 |
| $ | — |
| $ | 111,381 |
|
| Charge-offs | (40,512 | ) | (77,324 | ) | (11,480 | ) | (31,993 | ) | (1,382 | ) | (162,691 | ) |
| Recoveries | 26,599 |
| 12,435 |
| 3,025 |
| 3,791 |
| 845 |
| 46,695 |
|
| Net charge-offs | (13,913 | ) | (64,889 | ) | (8,455 | ) | (28,202 | ) | (537 | ) | (115,996 | ) |
| Provision for losses | 14,736 |
| 68,555 |
| 8,819 |
| 31,220 |
| 537 |
| 123,867 |
|
| Effect of foreign currency translation | (102 | ) | (14 | ) | — |
| (502 | ) | — |
| (618 | ) |
| Balance, end of period | $ | 5,662 |
| $ | 48,308 |
| $ | 10,431 |
| $ | 54,233 |
| $ | — |
| $ | 118,634 |
|
The following table summarizes activity in the allowance for loan losses during the three months ended September 30, 2018 (in thousands):
|
| | | | | | | | | | | | | | | | | | |
| | Three Months Ended September 30, 2018 |
| | Single-Pay | Unsecured Installment | Secured Installment | Open-End | Other | Total |
| Balance, beginning of period | $ | 3,604 |
| $ | 30,291 |
| $ | 10,386 |
| $ | 9,717 |
| $ | — |
| $ | 53,998 |
|
| Charge-offs | (40,753 | ) | (32,115 | ) | (11,188 | ) | (32,770 | ) | (1,494 | ) | (118,320 | ) |
| Recoveries | 27,861 |
| 4,807 |
| 2,325 |
| 9,191 |
| 931 |
| 45,115 |
|
| Net charge-offs | (12,892 | ) | (27,308 | ) | (8,863 | ) | (23,579 | ) | (563 | ) | (73,205 | ) |
| Provision for losses | 12,757 |
| 32,946 |
| 9,698 |
| 31,686 |
| 563 |
| 87,650 |
|
| Effect of foreign currency translation | (179 | ) | 231 |
| — |
| 189 |
| — |
| 241 |
|
| Balance, end of period | $ | 3,290 |
| $ | 36,160 |
| $ | 11,221 |
| $ | 18,013 |
| $ | — |
| $ | 68,684 |
|
| Allowance for loan losses as a percentage of gross loan receivables | 4.3 | % | 19.5 | % | 12.3 | % | 9.8 | % | N/A |
| 12.8 | % |
The following table summarizes activity in the liability for losses on CSO lender-owned consumer loans during the three months ended September 30, 2018 (in thousands):
|
| | | | | | | | | |
| | Three Months Ended September 30, 2018 |
| | Unsecured Installment | Secured Installment | Total |
| Balance, beginning of period | $ | 11,193 |
| $ | 426 |
| $ | 11,619 |
|
| Charge-offs | (44,896 | ) | (1,088 | ) | (45,984 | ) |
| Recoveries | 6,901 |
| 665 |
| 7,566 |
|
| Net charge-offs | (37,995 | ) | (423 | ) | (38,418 | ) |
| Provision for losses | 39,552 |
| 490 |
| 40,042 |
|
| Balance, end of period | $ | 12,750 |
| $ | 493 |
| $ | 13,243 |
|
CURO GROUP HOLDINGS CORP. AND SUBSIDIARIES
NOTES TO CONDENSED CONSOLIDATED FINANCIAL STATEMENTS (continued)
(unaudited)
The following table summarizes activity in the allowance for loan losses and the liability for losses on CSO lender-owned consumer loans, in total, during the three months ended JuneSeptember 30, 2019:2018 (in thousands):
| | | | Three Months Ended June 30, 2019 | Three Months Ended September 30, 2018 |
| (in thousands) | Single-Pay | Unsecured Installment | Secured Installment | Open-End | Other | Total | |
| | | Single-Pay | Unsecured Installment | Secured Installment | Open-End | Other | Total |
| Balance, beginning of period | $ | 3,897 |
| $ | 42,249 |
| $ | 9,874 |
| $ | 46,963 |
| $ | — |
| $ | 102,983 |
| $ | 3,604 |
| $ | 41,484 |
| $ | 10,812 |
| $ | 9,717 |
| $ | — |
| $ | 65,617 |
|
| Charge-offs | (35,759 | ) | (71,900 | ) | (10,978 | ) | (30,688 | ) | (1,342 | ) | (150,667 | ) | (40,753 | ) | (77,011 | ) | (12,276 | ) | (32,770 | ) | (1,494 | ) | (164,304 | ) |
| Recoveries | 24,301 |
| 12,444 |
| 3,350 |
| 5,537 |
| 822 |
| 46,454 |
| 27,861 |
| 11,708 |
| 2,990 |
| 9,191 |
| 931 |
| 52,681 |
|
| Net charge-offs | (11,458 | ) | (59,456 | ) | (7,628 | ) | (25,151 | ) | (520 | ) | (104,213 | ) | (12,892 | ) | (65,303 | ) | (9,286 | ) | (23,579 | ) | (563 | ) | (111,623 | ) |
| Provision for losses | 12,446 |
| 61,850 |
| 7,821 |
| 29,373 |
| 520 |
| 112,010 |
| 12,757 |
| 72,498 |
| 10,188 |
| 31,686 |
| 563 |
| 127,692 |
|
| Effect of foreign currency translation | 56 |
| 13 |
| — |
| 532 |
| — |
| 601 |
| (179 | ) | 231 |
| — |
| 189 |
| — |
| 241 |
|
| Balance, end of period | $ | 4,941 |
| $ | 44,656 |
| $ | 10,067 |
| $ | 51,717 |
| $ | — |
| $ | 111,381 |
| $ | 3,290 |
| $ | 48,910 |
| $ | 11,714 |
| $ | 18,013 |
| $ | — |
| $ | 81,927 |
|
The following table summarizes activity in the allowance for loan losses during the threenine months ended JuneSeptember 30, 2018:2019 (in thousands):
| | | | Three Months Ended June 30, 2018 | Nine Months Ended September 30, 2019 |
| (in thousands) | Single-Pay | Unsecured Installment | Secured Installment | Open-End | Other | Total | |
| | | Single-Pay | Unsecured Installment | Secured Installment | Open-End | Other | Total |
| Balance, beginning of period | $ | 3,514 |
| $ | 33,638 |
| $ | 11,639 |
| $ | 6,846 |
| $ | — |
| $ | 55,637 |
| $ | 4,189 |
| $ | 37,716 |
| $ | 12,191 |
| $ | 19,901 |
| $ | — |
| $ | 73,997 |
|
| Charge-offs | (41,242 | ) | (31,612 | ) | (11,082 | ) | (23,807 | ) | (593 | ) | (108,336 | ) | (112,792 | ) | (115,825 | ) | (33,558 | ) | (66,319 | ) | (4,075 | ) | (332,569 | ) |
| Recoveries | 28,266 |
| 5,085 |
| 2,296 |
| 11,883 |
| 38 |
| 47,568 |
| 78,811 |
| 16,963 |
| 8,261 |
| 14,487 |
| 2,565 |
| 121,087 |
|
| Net charge-offs | (12,976 | ) | (26,527 | ) | (8,786 | ) | (11,924 | ) | (555 | ) | (60,768 | ) | (33,981 | ) | (98,862 | ) | (25,297 | ) | (51,832 | ) | (1,510 | ) | (211,482 | ) |
| Provision for losses | 13,101 |
| 23,219 |
| 7,533 |
| 14,848 |
| 555 |
| 59,256 |
| 35,450 |
| 99,250 |
| 23,469 |
| 85,910 |
| 1,510 |
| 245,589 |
|
| Effect of foreign currency translation | (35 | ) | (39 | ) | — |
| (53 | ) | — |
| (127 | ) | 4 |
| 23 |
| — |
| 254 |
| — |
| 281 |
|
| Balance, end of period | $ | 3,604 |
| $ | 30,291 |
| $ | 10,386 |
| $ | 9,717 |
| $ | — |
| $ | 53,998 |
| $ | 5,662 |
| $ | 38,127 |
| $ | 10,363 |
| $ | 54,233 |
| $ | — |
| $ | 108,385 |
|
| Allowance for loan losses as a percentage of gross loan receivables | 4.3 | % | 18.9 | % | 12.3 | % | 10.7 | % | N/A |
| 12.8 | % | 7.3 | % | 21.9 | % | 11.5 | % | 17.2 | % | N/A |
| 16.5 | % |
The following table summarizes activity in the liability for losses on CSO lender-owned consumer loans during the threenine months ended JuneSeptember 30, 2018:2019 (in thousands):
| | | | Three Months Ended June 30, 2018 | Nine Months Ended September 30, 2019 |
| (in thousands) | Unsecured Installment | Secured Installment | Total | |
| | | Unsecured Installment | Secured Installment | Total |
| Balance, beginning of period | $ | 9,886 |
| $ | 526 |
| $ | 10,412 |
| $ | 11,582 |
| $ | 425 |
| $ | 12,007 |
|
| Charge-offs | (33,017 | ) | (993 | ) | (34,010 | ) | (118,617 | ) | (2,647 | ) | (121,264 | ) |
| Recoveries | 7,350 |
| 776 |
| 8,126 |
| 24,794 |
| 2,039 |
| 26,833 |
|
| Net charge-offs | (25,667 | ) | (217 | ) | (25,884 | ) | (93,823 | ) | (608 | ) | (94,431 | ) |
| Provision for losses | 26,974 |
| 117 |
| 27,091 |
| 92,422 |
| 251 |
| 92,673 |
|
| Balance, end of period | $ | 11,193 |
| $ | 426 |
| $ | 11,619 |
| $ | 10,181 |
| $ | 68 |
| $ | 10,249 |
|
CURO GROUP HOLDINGS CORP. AND SUBSIDIARIES
NOTES TO CONDENSED CONSOLIDATED FINANCIAL STATEMENTS (continued)
(unaudited)
The following table summarizes activity in the allowance for loan losses and the liability for losses on CSO lender-owned consumer loans, in total, during the threenine months ended JuneSeptember 30, 2018:2019 (in thousands):
| | | | Three Months Ended June 30, 2018 | Nine Months Ended September 30, 2019 |
| (in thousands) | Single-Pay | Unsecured Installment | Secured Installment | Open-End | Other | Total | |
| | | Single-Pay | Unsecured Installment | Secured Installment | Open-End | Other | Total |
| Balance, beginning of period | $ | 3,514 |
| $ | 43,524 |
| $ | 12,165 |
| $ | 6,846 |
| $ | — |
| $ | 66,049 |
| $ | 4,189 |
| $ | 49,298 |
| $ | 12,616 |
| $ | 19,901 |
| $ | — |
| $ | 86,004 |
|
| Charge-offs | (41,242 | ) | (64,629 | ) | (12,075 | ) | (23,807 | ) | (593 | ) | (142,346 | ) | (112,792 | ) | (234,442 | ) | (36,205 | ) | (66,319 | ) | (4,075 | ) | (453,833 | ) |
| Recoveries | 28,266 |
| 12,435 |
| 3,072 |
| 11,883 |
| 38 |
| 55,694 |
| 78,811 |
| 41,757 |
| 10,300 |
| 14,487 |
| 2,565 |
| 147,920 |
|
| Net charge-offs | (12,976 | ) | (52,194 | ) | (9,003 | ) | (11,924 | ) | (555 | ) | (86,652 | ) | (33,981 | ) | (192,685 | ) | (25,905 | ) | (51,832 | ) | (1,510 | ) | (305,913 | ) |
| Provision for losses | 13,101 |
| 50,193 |
| 7,650 |
| 14,848 |
| 555 |
| 86,347 |
| 35,450 |
| 191,672 |
| 23,720 |
| 85,910 |
| 1,510 |
| 338,262 |
|
| Effect of foreign currency translation | (35 | ) | (39 | ) | — |
| (53 | ) | — |
| (127 | ) | 4 |
| 23 |
| — |
| 254 |
| — |
| 281 |
|
| Balance, end of period | $ | 3,604 |
| $ | 41,484 |
| $ | 10,812 |
| $ | 9,717 |
| $ | — |
| $ | 65,617 |
| $ | 5,662 |
| $ | 48,308 |
| $ | 10,431 |
| $ | 54,233 |
| $ | — |
| $ | 118,634 |
|
The following table summarizes activity in the allowance for loan losses during the sixnine months ended JuneSeptember 30, 2019:2018 (in thousands):
| | | | Six Months Ended June 30, 2019 | Nine Months Ended September 30, 2018 |
| (in thousands) | Single-Pay | Unsecured Installment | Secured Installment | Open-End | Other | Total | |
| | | Single-Pay | Unsecured Installment | Secured Installment | Open-End | Other | Total |
| Balance, beginning of period | $ | 4,189 |
| $ | 37,716 |
| $ | 12,191 |
| $ | 19,901 |
| $ | — |
| $ | 73,997 |
| $ | 5,204 |
| $ | 38,977 |
| $ | 13,472 |
| $ | 6,426 |
| $ | — |
| $ | 64,079 |
|
| Charge-offs | (72,280 | ) | (81,573 | ) | (22,966 | ) | (34,326 | ) | (2,693 | ) | (213,838 | ) | (126,328 | ) | (98,946 | ) | (33,755 | ) | (76,926 | ) | (4,474 | ) | (340,429 | ) |
| Recoveries | 52,212 |
| 11,684 |
| 5,816 |
| 10,696 |
| 1,721 |
| 82,129 |
| 88,945 |
| 15,110 |
| 7,487 |
| 30,451 |
| 2,728 |
| 144,721 |
|
| Net charge-offs | (20,068 | ) | (69,889 | ) | (17,150 | ) | (23,630 | ) | (972 | ) | (131,709 | ) | (37,383 | ) | (83,836 | ) | (26,268 | ) | (46,475 | ) | (1,746 | ) | (195,708 | ) |
| Provision for losses | 20,714 |
| 67,359 |
| 14,955 |
| 54,690 |
| 972 |
| 158,690 |
| 35,750 |
| 80,904 |
| 24,017 |
| 57,962 |
| 1,746 |
| 200,379 |
|
| Effect of foreign currency translation | 106 |
| 37 |
| — |
| 756 |
| — |
| 899 |
| (281 | ) | 115 |
| — |
| 100 |
| — |
| (66 | ) |
| Balance, end of period | $ | 4,941 |
| $ | 35,223 |
| $ | 9,996 |
| $ | 51,717 |
| $ | — |
| $ | 101,877 |
| $ | 3,290 |
| $ | 36,160 |
| $ | 11,221 |
| $ | 18,013 |
| $ | — |
| $ | 68,684 |
|
| Allowance for loan losses as a percentage of gross loan receivables | 6.5 | % | 21.4 | % | 11.7 | % | 18.3 | % | N/A |
| 16.7 | % | 4.3 | % | 19.5 | % | 12.3 | % | 9.8 | % | N/A |
| 12.8 | % |
The following table summarizes activity in the liability for losses on CSO lender-owned consumer loans during the sixnine months ended JuneSeptember 30, 2019:2018 (in thousands):
| | | | Six Months Ended
June 30, 2019 | Nine Months Ended September 30, 2018 |
| (in thousands) | Unsecured Installment | Secured Installment | Total | |
| | | Unsecured Installment | Secured Installment | Total |
| Balance, beginning of period | $ | 11,582 |
| $ | 425 |
| $ | 12,007 |
| $ | 17,073 |
| $ | 722 |
| $ | 17,795 |
|
| Charge-offs | (75,545 | ) | (1,760 | ) | (77,305 | ) | (119,632 | ) | (3,300 | ) | (122,932 | ) |
| Recoveries | 17,638 |
| 1,459 |
| 19,097 |
| 25,227 |
| 2,610 |
| 27,837 |
|
| Net charge-offs | (57,907 | ) | (301 | ) | (58,208 | ) | (94,405 | ) | (690 | ) | (95,095 | ) |
| Provision for losses | 55,758 |
| (53 | ) | 55,705 |
| 90,082 |
| 461 |
| 90,543 |
|
| Balance, end of period | $ | 9,433 |
| $ | 71 |
| $ | 9,504 |
| $ | 12,750 |
| $ | 493 |
| $ | 13,243 |
|
CURO GROUP HOLDINGS CORP. AND SUBSIDIARIES
NOTES TO CONDENSED CONSOLIDATED FINANCIAL STATEMENTS (continued)
(unaudited)
The following table summarizes activity in the allowance for loan losses and the liability for losses on CSO lender-owned consumer loans, in total, during the sixnine months ended JuneSeptember 30, 2019:2018 (in thousands):
| | | | Six Months Ended June 30, 2019 | Nine Months Ended September 30, 2018 |
| (in thousands) | Single-Pay | Unsecured Installment | Secured Installment | Open-End | Other | Total | |
| | | Single-Pay | Unsecured Installment | Secured Installment | Open-End | Other | Total |
| Balance, beginning of period | $ | 4,189 |
| $ | 49,298 |
| $ | 12,616 |
| $ | 19,901 |
| $ | — |
| $ | 86,004 |
| $ | 5,204 |
| $ | 56,050 |
| $ | 14,194 |
| $ | 6,426 |
| $ | — |
| $ | 81,874 |
|
| Charge-offs | (72,280 | ) | (157,118 | ) | (24,726 | ) | (34,326 | ) | (2,693 | ) | (291,143 | ) | (126,328 | ) | (218,578 | ) | (37,055 | ) | (76,926 | ) | (4,474 | ) | (463,361 | ) |
| Recoveries | 52,212 |
| 29,322 |
| 7,275 |
| 10,696 |
| 1,721 |
| 101,226 |
| 88,945 |
| 40,337 |
| 10,097 |
| 30,451 |
| 2,728 |
| 172,558 |
|
| Net charge-offs | (20,068 | ) | (127,796 | ) | (17,451 | ) | (23,630 | ) | (972 | ) | (189,917 | ) | (37,383 | ) | (178,241 | ) | (26,958 | ) | (46,475 | ) | (1,746 | ) | (290,803 | ) |
| Provision for losses | 20,714 |
| 123,117 |
| 14,902 |
| 54,690 |
| 972 |
| 214,395 |
| 35,750 |
| 170,986 |
| 24,478 |
| 57,962 |
| 1,746 |
| 290,922 |
|
| Effect of foreign currency translation | 106 |
| 37 |
| — |
| 756 |
| — |
| 899 |
| (281 | ) | 115 |
| — |
| 100 |
| — |
| (66 | ) |
| Balance, end of period | $ | 4,941 |
| $ | 44,656 |
| $ | 10,067 |
| $ | 51,717 |
| $ | — |
| $ | 111,381 |
| $ | 3,290 |
| $ | 48,910 |
| $ | 11,714 |
| $ | 18,013 |
| $ | — |
| $ | 81,927 |
|
The following table summarizes activity in the allowance for loan losses during the six months ended June 30, 2018: |
| | | | | | | | | | | | | | | | | | |
| | Six Months Ended June 30, 2018 |
| (in thousands) | Single-Pay | Unsecured Installment | Secured Installment | Open-End | Other | Total |
| Balance, beginning of period | $ | 5,204 |
| $ | 38,977 |
| $ | 13,472 |
| $ | 6,426 |
| $ | — |
| $ | 64,079 |
|
| Charge-offs | (85,578 | ) | (66,831 | ) | (22,567 | ) | (44,156 | ) | (1,268 | ) | (220,400 | ) |
| Recoveries | 61,084 |
| 10,303 |
| 5,162 |
| 21,260 |
| 85 |
| 97,894 |
|
| Net charge-offs | (24,494 | ) | (56,528 | ) | (17,405 | ) | (22,896 | ) | (1,183 | ) | (122,506 | ) |
| Provision for losses | 22,993 |
| 47,958 |
| 14,319 |
| 26,276 |
| 1,183 |
| 112,729 |
|
| Effect of foreign currency translation | (99 | ) | (116 | ) | — |
| (89 | ) | — |
| (304 | ) |
| Balance, end of period | $ | 3,604 |
| $ | 30,291 |
| $ | 10,386 |
| $ | 9,717 |
| $ | — |
| $ | 53,998 |
|
| Allowance for loan losses as a percentage of gross loan receivables | 4.3 | % | 18.9 | % | 12.3 | % | 10.7 | % | N/A |
| 12.8 | % |
The following table summarizes activity in the liability for losses on CSO lender-owned consumer loans during the six months ended June 30, 2018:
|
| | | | | | | | | |
| | Six Months Ended
June 30, 2018 |
| (in thousands) | Unsecured Installment | Secured Installment | Total |
| Balance, beginning of period | $ | 17,073 |
| $ | 722 |
| $ | 17,795 |
|
| Charge-offs | (74,736 | ) | (2,212 | ) | (76,948 | ) |
| Recoveries | 18,326 |
| 1,945 |
| 20,271 |
|
| Net charge-offs | (56,410 | ) | (267 | ) | (56,677 | ) |
| Provision for losses | 50,530 |
| (29 | ) | 50,501 |
|
| Balance, end of period | $ | 11,193 |
| $ | 426 |
| $ | 11,619 |
|
CURO GROUP HOLDINGS CORP. AND SUBSIDIARIES
NOTES TO CONDENSED CONSOLIDATED FINANCIAL STATEMENTS (continued)
(unaudited)
The following table summarizes activity in the allowance for loan losses and the liability for losses on CSO lender-owned consumer loans, in total, during the six months ended June 30, 2018:
|
| | | | | | | | | | | | | | | | | | |
| | Six Months Ended June 30, 2018 |
| (in thousands) | Single-Pay | Unsecured Installment | Secured Installment | Open-End | Other | Total |
| Balance, beginning of period | $ | 5,204 |
| $ | 56,050 |
| $ | 14,194 |
| $ | 6,426 |
| $ | — |
| $ | 81,874 |
|
| Charge-offs | (85,578 | ) | (141,567 | ) | (24,779 | ) | (44,156 | ) | (1,268 | ) | (297,348 | ) |
| Recoveries | 61,084 |
| 28,629 |
| 7,107 |
| 21,260 |
| 85 |
| 118,165 |
|
| Net charge-offs | (24,494 | ) | (112,938 | ) | (17,672 | ) | (22,896 | ) | (1,183 | ) | (179,183 | ) |
| Provision for losses | 22,993 |
| 98,488 |
| 14,290 |
| 26,276 |
| 1,183 |
| 163,230 |
|
| Effect of foreign currency translation | (99 | ) | (116 | ) | — |
| (89 | ) | — |
| (304 | ) |
| Balance, end of period | $ | 3,604 |
| $ | 41,484 |
| $ | 10,812 |
| $ | 9,717 |
| $ | — |
| $ | 65,617 |
|
NOTE 4 – CREDIT SERVICES ORGANIZATION
The CSO fee receivable amountsreceivables under CSO programs were $12.0$13.4 million and $14.3 million at JuneSeptember 30, 2019 and December 31, 2018, respectively. The Company bears the risk of loss through its guarantee to purchase specific customer loans that are in default with the lenders. The terms of these loans range fromup to six to 18 months. See the 2018 Form 10-K for further details of the Company's accounting policy. As of JuneSeptember 30, 2019 and December 31, 2018, the maximum amount payable under all such guarantees was $56.0$60.4 million and $66.9 million, respectively. If the Company is required to pay any portion of the total amount of the loans it has guaranteed, it will attempt to recover some or the entire amount from the applicable customers. The Company holds no collateral in respect of the guarantees. The Company estimates a liability for losses associated with the guaranty provided to the CSO lenders using assumptions and methodologies similar to the Allowance for loan losses, which it recognizes for its consumer loans. Liability for incurred losses on CSO loans Guaranteed by the Company was $9.5$10.2 million and $12.0 million at JuneSeptember 30, 2019 and December 31, 2018, respectively.
The Company placed $5.8$5.9 million and $17.2 million in collateral accounts for the benefit of lenders at JuneSeptember 30, 2019 and December 31, 2018, respectively, which is reflected in "Prepaid expenses and other" in the Condensed Consolidated Balance Sheets. The balances required to be maintained in these collateral accounts vary by lender, typically based on a percentage of the outstanding loan balances held by the lender. The percentage of outstanding loan balances required for collateral is negotiated between the Company and each such lender.
NOTE 5 – LONG-TERM DEBT
Long-term debtDebt consisted of the following:following (in thousands):
| | | (in thousands) | | June 30, 2019 | | December 31, 2018 | |
| | | | September 30, 2019 | | December 31, 2018 |
| 8.25% Senior Secured Notes (due 2025) | | $ | 677,535 |
| | $ | 676,661 |
| | $ | 677,924 |
| | $ | 676,661 |
|
| Non-Recourse Canada SPV Facility | | 90,977 |
| | 107,479 |
| | 102,483 |
| | 107,479 |
|
| Senior Revolver | | — |
| | 20,000 |
| | 25,000 |
| | 20,000 |
|
| Long-term debt | | $ | 768,512 |
| | $ | 804,140 |
| |
| Debt | | | $ | 805,407 |
| | $ | 804,140 |
|
8.25% Senior Secured Notes
In August 2018, the Company issued $690.0 million of 8.25% Senior Secured Notes which mature on September 1, 2025 ("8.25% Senior Secured Notes"). Interest on the notes is payable semiannually, in arrears, on March 1 and September 1. In connection with the 8.25% Senior Secured Notes, the balance of capitalized financing costs of approximately $12.8$12.1 million, net of amortization, is included in the Condensed Consolidated Balance Sheets as a component of "Long-term debt."Debt." These costs are amortized over the term of the 8.25% Senior Secured Notes as a component of interest expense.
The proceeds of this issuance were used (i) to redeem the outstanding 12.00% Senior Secured Notes of CFTC, (ii) to repay a portion of the outstanding indebtedness under the five-year revolving credit facility of CURO Receivables Finance I, LLC, a wholly-ownedwholly-
CURO GROUP HOLDINGS CORP. AND SUBSIDIARIES
NOTES TO CONDENSED CONSOLIDATED FINANCIAL STATEMENTS (continued)
(unaudited)
owned subsidiary, ("CURO Receivables"), which consisted of a term loan and revolving borrowing capacity, (iii) for general corporate purposes and (iv) to pay fees, expenses, premiums and accrued interest in connection therewith.
CURO GROUP HOLDINGS CORP. AND SUBSIDIARIES
NOTES TO CONDENSED CONSOLIDATED FINANCIAL STATEMENTS (continued)
(unaudited)
As of June 30, 2019 and December 31, 2018, the Company was in full compliance with the covenants and other provisions of the 8.25% Senior Secured Notes.
12.00% Senior Secured Notes
In February and November 2017, CFTC issued $470.0 million and $135.0 million, respectively, of 12.00% Senior Secured Notes due March 1, 2022. In connection with these 12.00% Senior Secured Notes, the Company capitalized financing costs of approximately $18.3 million. These costs were being amortized over the term of the 12.00% Senior Secured Notes as a component of interest expense.
On March 7, 2018, CFTC redeemed $77.5 million of its 12.00% Senior Secured Notes using a portion of the proceeds from the Company's initial public offering, as required by the underlying indenture (the transaction whereby the 12.00% Senior Secured Notes were partially redeemed, the “Redemption”), at a price equal to 112.00% of the principal amount of the 12.00% Senior Secured Notes redeemed, plus accrued and unpaid interest paid thereon, to the date of Redemption. The Redemption price and the amortization of a corresponding portion of the capitalized financing costs resulted in a loss on Redemption of $11.7 million for the three months ended March 31, 2018. Following the Redemption, $527.5 million of the original outstanding principal amount of the 12.00% Senior Secured Notes remained outstanding. The Redemption was conducted pursuant to the Indenture governing the 12.00% Senior Secured Notes (the “Indenture”), dated as of February 15, 2017, by and among CFTC, the guarantors party thereto and TMI Trust Company, as trustee and collateral agent.
The remainder of the 12.00% Senior Secured Notes were extinguished effective September 7, 2018 using proceeds from the 8.25% Senior Secured Notes as described above. The early extinguishment of the 12.00% Senior Secured Notes resulted in a pretax loss of $69.2 million during the year ended December 31, 2018.
Non-Recourse Canada SPV Facility
On August 2, 2018, CURO Canada Receivables Limited Partnership, a newly created, bankruptcy-remote special purpose vehicle (the "Canada SPV Borrower") and a wholly-owned subsidiary, entered into a four-year revolving credit facility with Waterfall Asset Management, LLC that provided for C$175.0 million of initial borrowing capacity and the ability to expand such capacity up to C$250.0 million ("Non-Recourse Canada SPV Facility"). The loans bear interest at an annual rate of 6.75% plus the three-month CDOR. The Canada SPV Borrower also pays a 0.50% per annum commitment fee on the unused portion of the commitments. In April 2019, the facility's maturity date was extended one year, to 2023. As of June 30, 2019, the Canada SPV Borrower was in full compliance with the covenants and other provisions of the Non-Recourse Canada SPV Facility.
As of JuneSeptember 30, 2019, outstanding borrowings under the Non-Recourse Canada SPV Facility were $91.0$102.5 million, net of deferred financing costs of $3.6$3.3 million. For further information on the Non-Recourse Canada SPV, refer to Note 2, "Variable Interest Entities."
Non-Recourse U.S. SPV Facility
In November 2016, CURO Receivables and a wholly-owned subsidiary entered into a five-year revolving credit facility with Victory Park Management, LLC and certain other lenders that provided for an $80.0 million term loan and $70.0 million revolving borrowing capacity that could expand over time (collectively, “Non-Recourse U.S. SPV Facility”). Borrowings under this facility bore interest at an annual rate of up to 12.00% plus the greater of (i) 1.0% per annum and (ii) the three-month LIBOR. The SPV Borrower also paid a 0.50% per annum fee on the unused portion of the commitments. In connection with this facility, the capitalized financing costs at the time of extinguishment, as discussed below, were approximately $5.3 million, net of amortization. These capitalized financing costs were included in the Condensed Consolidated Balance Sheet as a component of "Long-term debt" and were amortized over the term of the Non-Recourse U.S. SPV Facility.
On September 30, 2018, a portion of the proceeds from the 8.25% Senior Secured Notes were used to extinguish the revolver's balance of $42.4 million. In October 2018, the Company extinguished the remaining term loan balance of $80.0 million and made the final termination payment of $2.7 million, resulting in a loss on the extinguishment of debt of $9.7 million during the year ended December 31, 2018.
CURO GROUP HOLDINGS CORP. AND SUBSIDIARIES
NOTES TO CONDENSED CONSOLIDATED FINANCIAL STATEMENTS (continued)
(unaudited)
Senior Revolver
On September 1, 2017, the Company entered into a $25.0 million Senior Secured Revolving Loan Facility (the “Senior Revolver”). The terms of the Senior Revolver generally conform to the related provisions in the Indenture dated February 15, 2017 for the 12.00% Senior Secured Notes and complements the Company's other financing sources, while providing seasonal short-term liquidity. In February 2018, the Senior Revolver capacity was increased to $29.0 million as permitted by the Indenture to the 12.00% Senior Secured Notes, based upon consolidated tangible assets. Additionally, in November 2018, the Senior Revolver capacity was increased to $50.0 million, as permitted by the Indenture to the 8.25% Senior Secured Notes. The Senior Revolver is now syndicated with participation by four banks.
Under the Senior Revolver, there is $50.0 million maximum availability, including up to $5.0 million of standby letters of credit, for a one-year term, renewable for successive terms following annual review. The current term expires June 30, 2020. The Senior Revolver accrues interest at one-month LIBOR plus 5.00% (subject to a 5% overall minimum) and is repayable on demand.
The terms of the Senior Revolver require that its outstanding balance be zero for at least 30 consecutive days in each calendar year. The Senior Revolver is guaranteed by all subsidiaries that guarantee the 8.25% Senior Secured Notes and is secured by a lien on substantially all assets of CURO and the guarantor subsidiaries that is senior to the lien securing the 8.25% Senior Secured Notes. Additionally, the negative covenants of the Senior Revolver generally conform to the related provisions in the Indenture for the 8.25% Senior Secured Notes. The revolver was undrawnhad an outstanding balance of $25.0 million at JuneSeptember 30, 2019.
The Senior Revolver contains various conditions to borrowing and affirmative, negative and financial maintenance covenants. Certain of the more significant covenants are (i) minimum eligible collateral value, (ii) consolidated interest coverage ratio and (iii) consolidated leverage ratio. The Senior Revolver also contains various events of default, the occurrence of which could result in termination of the lenders’ commitments to lend and the acceleration of all obligations under the Senior Revolver. As of June 30, 2019, the Company was in full compliance with the covenants and other provisions of the Senior Revolver.
CURO GROUP HOLDINGS CORP. AND SUBSIDIARIES
NOTES TO CONDENSED CONSOLIDATED FINANCIAL STATEMENTS (continued)
(unaudited)
Cash Money Revolving Credit Facility
Cash Money Cheque Cashing, Inc., a Canadian subsidiary ("Cash Money"), maintains a C$10.0 million revolving credit facility with Royal Bank of Canada (the "Cash Money Revolving Credit Facility"), which provides short-term liquidity required to meet the working capital needs of the Company's Canadian operations. Aggregate draws under the revolving credit facility are limited to the lesser of: (i) the borrowing base, which is defined as a percentage of cash, deposits in transit and accounts receivable, and (ii) C$10.0 million. As of JuneSeptember 30, 2019, the borrowing capacity under the Cash Money Revolving Credit Facility, which was C$9.7 million, was reduced bynet of C$0.3 million forin outstanding stand-by-letters of credit.
The Cash Money Revolving Credit Facility is collateralized by substantially all of Cash Money’s assets and contains various covenants that require, among other things, that the aggregate borrowings outstanding under the facility not exceed the borrowing base, as well as restrictions on the encumbrance of assets and the creation of indebtedness. Borrowings under the Cash Money Revolving Credit Facility bear interest per annum at the prime rate of a Canadian chartered bank plus 1.95%.
The Cash Money Revolving Credit Facility was undrawn at JuneSeptember 30, 2019 and December 31, 2018.
Subordinated Stockholder Debt
As part of the acquisition of Cash Money in 2011, the Company received indemnification for certain claims through issuance of an escrow note to the seller. This note bearsseller, bearing interest at 10.0% per annum andwith quarterly interest payments are due untilpayments. This note matured and was paid during the note matures.second quarter of 2019.
Non-Recourse U.S. SPV Facility
In November 2016, CURO Receivables Finance I, LLC and a wholly-owned subsidiary entered into a five-year revolving credit facility with Victory Park Management, LLC and certain other lenders that provided for an $80.0 million term loan and $70.0 million revolving borrowing capacity that could expand over time (collectively, “Non-Recourse U.S. SPV Facility”). Borrowings under this facility bore interest at an annual rate of up to 12.00% plus the greater of (i) 1.0% per annum and (ii) the three-month LIBOR. The SPV Borrower also paid a 0.50% per annum fee on the unused portion of the commitments. In connection with this facility, the capitalized financing costs at the time of extinguishment, as discussed below, were $5.3 million, net of amortization. These capitalized financing costs were included in the Condensed Consolidated Balance Sheet as a component of "Debt" and were amortized over the term of the Non-Recourse U.S. SPV Facility.
On September 30, 2018, a portion of the proceeds from the 8.25% Senior Secured Notes were used to extinguish the revolver's balance of this note was repaid$42.4 million. In October 2018, the Company extinguished the remaining term loan balance of $80.0 million and made the final termination payment of $2.7 million, resulting in full asa loss on the extinguishment of June 30, 2019.debt of $9.7 million during the year ended December 31, 2018.
NOTE 6 – SHARE-BASED COMPENSATION
The Company's stockholder-approved 2017 Incentive Plan provides for the issuance of up to 5.0 million shares, subject to certain adjustment provisions, which may be issued in the form of stock options, restricted stock awards, restricted stock units (“RSUs”), stock appreciation rights, performance awards and other awards that may be settled in or based uponon common stock. Awards may be granted to officers, employees, consultants and directors. The 2017 Incentive Plan provides that shares of common stock subject to awards granted become available for re-issuance if such awards expire, terminate, are canceled for any reason or are forfeited by the recipient.
CURO GROUP HOLDINGS CORP. AND SUBSIDIARIES
NOTES TO CONDENSED CONSOLIDATED FINANCIAL STATEMENTS (continued)
(unaudited)
Restricted Stock Units
Grants of time-based RSUs are valued at the date of grant based on the value of our common stock and are expensed using the straight-line method over the service period. These RSUs are subject to time-based vesting and typically vest over a three-year period.
Grants of market-based RSUs are valued using the Monte Carlo simulation pricing model. In March 2019, the Company awarded market-based RSUs designed to drive the performance of the management team toward achievement of key corporate objectives. The market-based RSUs vest after three years depending upon the Company's total stockholder return over the three-year performance period relative to other companies in its selected peer group. These awards are valued using the Monte Carlo simulation pricing model. Expense recognition for the market-based awards occurs over the service period using the straight-line method.
CURO GROUP HOLDINGS CORP. AND SUBSIDIARIES
NOTES TO CONDENSED CONSOLIDATED FINANCIAL STATEMENTS (continued)
(unaudited)
Grants of RSUs do not confer full stockholder rights such as voting rights and cash dividends, but provide for additional dividend equivalent RSU awards in lieu of cash dividends. Unvested shares of RSUs may be forfeited upon termination of employment depending on the circumstances of the termination, or failure to achieve the required performance condition, if applicable.
A summary of the status of time-based and market-based RSUs as of JuneSeptember 30, 2019 and changes during the sixnine months ended JuneSeptember 30, 2019 are presented in the following table:
| | | | Number of RSUs | | | Number of RSUs | | |
| | Time-Based | Market-Based | | Weighted Average Grant Date Fair Value per Share | Time-Based | Market-Based | | Weighted Average Grant Date Fair Value per Share |
| December 31, 2018 | 1,060,350 |
| — |
| | $ | 14.29 |
| 1,060,350 |
| — |
| | $ | 14.29 |
|
| Granted | 579,540 |
| 394,755 |
| | 10.07 |
| 598,114 |
| 397,752 |
| | 10.08 |
|
| Vested | (83,481 | ) | — |
| | 15.59 |
| (83,481 | ) | — |
| | 15.59 |
|
| Forfeited | (68,778 | ) | — |
| | 14.05 |
| (68,778 | ) | — |
| | 14.05 |
|
| June 30, 2019 | 1,487,631 |
| 394,755 |
| | $ | 12.06 |
| |
| September 30, 2019 | | 1,506,205 |
| 397,752 |
| | $ | 12.04 |
|
Share-based compensation expense for the three months ended JuneSeptember 30, 2019 and 2018, which includes compensation costs from stock options and RSUs, was $2.6$2.8 million and $2.2$2.1 million, respectively, and during the sixnine months ended JuneSeptember 30, 2019 and 2018 was $4.8$7.6 million and $4.0$6.1 million, respectively, and is included in the Condensed Consolidated Statements of Operations as a component of "Corporate, district and other expenses."
As of JuneSeptember 30, 2019, there was $18.5$16.0 million of total unrecognized compensation cost related to stock options and RSUs, of which $15.4$12.9 million related to stock options and time-based RSUs and $3.1$2.8 million related to market-based RSUs. Total unrecognized compensation costs will be recognized over a weighted-average period of 2.01.7 years.
NOTE 7 – INCOME TAXES
The Company's effective income tax rate from continuing operations was 27.4%27.9% and 27.6%(34.8)% for the sixnine months ended JuneSeptember 30, 2019 and 2018, respectively.
On December 22, 2017, the 2017 Tax Act became law, which reduced the statutory U.S. Federal corporate income tax rate from 35% to 21%, enacted a one-time “deemed repatriation” tax on unremitted earnings accumulated in non-U.S. jurisdictions and imposed a new minimum tax on global intangible low-taxed income ("GILTI"). The Company provided an estimate of the deemed repatriation tax as of December 31, 2017, and pursuant to further IRS guidance, the Company recorded an additional accrual of $1.2 million during the sixnine months ended JuneSeptember 30, 2018. The Company recorded an estimated GILTI tax of $0.5 million and $0.6 million during the sixnine months ended JuneSeptember 30, 2019 and 2018, respectively.
The Company intends to reinvest Canada earnings indefinitely in its Canadian operations and therefore has not provided for any non-U.S. withholding tax that would be assessed on dividend distributions. If the earnings of $159.3$153.6 million were distributed to the U.S., the Company would be subject to Canadian withholding taxes of an estimated $8.0$7.7 million. In the event the earnings were distributed to the U.S., the Company would adjust the income tax provision for the applicable period and would determine the amount of foreign tax credit that would be available.
CURO GROUP HOLDINGS CORP. AND SUBSIDIARIES
NOTES TO CONDENSED CONSOLIDATED FINANCIAL STATEMENTS (continued)
(unaudited)
NOTE 8 – FINANCIAL INSTRUMENTSFAIR VALUE MEASUREMENTS
Fair value is defined as the price that would be received to sell an asset or paid to transfer a liability in an orderly transaction between market participants. The Company is required to use valuation techniques that are consistent with the market approach, income approach and/or cost approach. Inputs to valuation techniques refer to the assumptions that market participants would use in pricing the asset or liability based on observable market data obtained from independent sources, or unobservable, meaning those that reflect the Company's own estimate about the assumptions market participants would use in pricing the asset or liability based on the best information available in the circumstances. Accounting standards establish a three-level fair value hierarchy based upon the assumptions (inputs) used to price assets or liabilities. The hierarchy requires the Company to maximize the use of observable inputs and minimize the use of unobservable inputs.
The three levels of inputs used to measure fair value are listed below.
CURO GROUP HOLDINGS CORP. AND SUBSIDIARIES
NOTES TO CONDENSED CONSOLIDATED FINANCIAL STATEMENTS (continued)
(unaudited)
Level 1 – Inputs are unadjusted quoted prices in active markets for identical assets or liabilities that the Company has access to at the measurement date.
Level 2 – Inputs include quoted market prices for similar assets or liabilities in active markets, quoted prices for identical or similar assets or liabilities in markets that are not active, inputs other than quoted prices that are observable for the asset or liability and inputs that are derived principally from or corroborated by observable market data by correlation or other means (market corroborated inputs).
Level 3 – Unobservable inputs reflecting the Company's own judgments about the assumptions market participants would use in pricing the asset or liability since limited market data exists. The Company develops these inputs based on the best information available, including its own data.
Financial Assets and Liabilities Carried at Fair Value
The table below presents the assets and liabilities that were carried at fair value on the Condensed Consolidated Balance Sheets at September 30, 2019 (in thousands):
|
| | | | | | | | | | | | | | | |
| | | Estimated Fair Value |
| | Carrying Value September 30,
2019 | Level 1 | Level 2 | Level 3 | Total |
| Financial assets: | | | | | |
| Cash Surrender Value of Life Insurance | $ | 5,799 |
| $ | 5,799 |
| $ | — |
| $ | — |
| $ | 5,799 |
|
| Financial liabilities: | | | | | |
| Non-qualified deferred compensation plan | $ | 4,333 |
| $ | 4,333 |
| $ | — |
| $ | — |
| $ | 4,333 |
|
The table below presents the assets and liabilities that were carried at fair value on the Condensed Consolidated Balance Sheets at December 31, 2018 (in thousands):
|
| | | | | | | | | | | | | | | |
| | | Estimated Fair Value |
| | Carrying Value December 31,
2018 | Level 1 | Level 2 | Level 3 | Total |
Financial assets: (1) | | | | | |
| Cash Surrender Value of Life Insurance | $ | 4,790 |
| $ | 4,790 |
| $ | — |
| $ | — |
| $ | 4,790 |
|
| Financial liabilities: | | | | | |
| Non-qualified deferred compensation plan | $ | 3,639 |
| $ | 3,639 |
| $ | — |
| $ | — |
| $ | 3,639 |
|
| (1) Zibby was not included as of 12/31/18 as it was accounted for under the cost method. |
CURO GROUP HOLDINGS CORP. AND SUBSIDIARIES
NOTES TO CONDENSED CONSOLIDATED FINANCIAL STATEMENTS (continued)
(unaudited)
Financial Assets and Liabilities Not Carried at Fair Value
The table below presents the assets and liabilities that were not carried at fair value on the Condensed Consolidated Balance Sheets at JuneSeptember 30, 2019:2019 (in thousands):
|
| | | | | | | | | | | | | | | |
| | | Estimated Fair Value |
| (in thousands) | Carrying Value June 30,
2019 | Level 1 | Level 2 | Level 3 | Total |
| Financial assets: | | | | | |
| Cash | $ | 92,297 |
| $ | 92,297 |
| $ | — |
| $ | — |
| $ | 92,297 |
|
| Restricted cash | 33,712 |
| 33,712 |
| — |
| — |
| 33,712 |
|
| Loans receivable, net | 507,716 |
| — |
| — |
| 507,716 |
| 507,716 |
|
| Investment in Cognical | 7,178 |
| — |
| — |
| 7,178 |
| 7,178 |
|
| Financial liabilities: | | | | | |
| Liability for losses on CSO lender-owned consumer loans | $ | 9,504 |
| $ | — |
| $ | — |
| $ | 9,504 |
| $ | 9,504 |
|
| 8.25% Senior Secured Notes | 677,535 |
| — |
| — |
| 574,211 |
| 574,211 |
|
| Non-Recourse Canada SPV facility | 90,977 |
| — |
| — |
| 94,565 |
| 94,565 |
|
CURO GROUP HOLDINGS CORP. AND SUBSIDIARIES
NOTES TO CONDENSED CONSOLIDATED FINANCIAL STATEMENTS (continued)
(unaudited)
|
| | | | | | | | | | | | | | | |
| | | Estimated Fair Value |
| | Carrying Value September 30,
2019 | Level 1 | Level 2 | Level 3 | Total |
| Financial assets: | | | | | |
| Cash | $ | 62,207 |
| $ | 62,207 |
| $ | — |
| $ | — |
| $ | 62,207 |
|
| Restricted cash | 38,754 |
| 38,754 |
| — |
| — |
| 38,754 |
|
| Loans receivable, net | 549,230 |
| — |
| — |
| 549,230 |
| 549,230 |
|
| Investment in Zibby | 11,231 |
| — |
| — |
| 11,231 |
| 11,231 |
|
| Financial liabilities: | | | | | |
| Liability for losses on CSO lender-owned consumer loans | $ | 10,249 |
| $ | — |
| $ | — |
| $ | 10,249 |
| $ | 10,249 |
|
| 8.25% Senior Secured Notes | 677,924 |
| — |
| 591,489 |
| — |
| 591,489 |
|
| Non-Recourse Canada SPV facility | 102,483 |
| — |
| — |
| 105,742 |
| 105,742 |
|
| Senior Revolver | 25,000 |
| — |
| — |
| 25,000 |
| 25,000 |
|
The table below presents the assets and liabilities that were not carried at fair value on the Condensed Consolidated Balance Sheets at December 31, 2018:2018 (in thousands):
| | | | | Estimated Fair Value | | Estimated Fair Value |
| (in thousands) | Carrying Value December 31,
2018 | Level 1 | Level 2 | Level 3 | Total | |
| | | Carrying Value December 31,
2018 | Level 1 | Level 2 | Level 3 | Total |
| Financial assets: | | | | | | |
| Cash | $ | 61,175 |
| $ | 61,175 |
| $ | — |
| $ | — |
| $ | 61,175 |
| $ | 61,175 |
| $ | 61,175 |
| $ | — |
| $ | — |
| $ | 61,175 |
|
| Restricted cash | 25,439 |
| 25,439 |
| — |
| — |
| 25,439 |
| 25,439 |
| 25,439 |
| — |
| — |
| 25,439 |
|
| Loans receivable, net | 497,534 |
| — |
| — |
| 497,534 |
| 497,534 |
| 497,534 |
| — |
| — |
| 497,534 |
| 497,534 |
|
| Investment in Cognical | 6,558 |
| — |
| — |
| 6,558 |
| 6,558 |
| |
| Investment in Zibby | | 6,558 |
| — |
| — |
| 6,558 |
| 6,558 |
|
| Financial liabilities: | | |
| Liability for losses on CSO lender-owned consumer loans | $ | 12,007 |
| $ | — |
| $ | — |
| $ | 12,007 |
| $ | 12,007 |
| $ | 12,007 |
| $ | — |
| $ | — |
| $ | 12,007 |
| $ | 12,007 |
|
| 8.25% Senior Secured notes | 676,661 |
| — |
| — |
| 531,179 |
| 531,179 |
| 676,661 |
| — |
| 531,179 |
| — |
| 531,179 |
|
| Non-Recourse Canada SPV facility | 107,479 |
| — |
| — |
| 111,335 |
| 111,335 |
| 107,479 |
| — |
| — |
| 111,335 |
| 111,335 |
|
| Senior Revolver | 20,000 |
| — |
| — |
| 20,000 |
| 20,000 |
| 20,000 |
| — |
| — |
| 20,000 |
| 20,000 |
|
Loans receivable are carried on the Condensed Consolidated Balance Sheets net of the Allowance for estimated loan losses. The unobservable inputs used to calculate the carrying values include quantitative factors, such as default trends. Also considered in evaluating the accuracy of the models are changes to the loan portfolio mix, the impact of new loan products, changes to underwriting criteria or lending policies, new store development or entrance into new markets, changes in jurisdictional regulations or laws, recent credit trends and general economic conditions. The carrying value of loans receivable approximates their fair value.
In connection with CSO programs, the Company guarantees consumer loan payment obligations to unrelated third-party lenders for loans that the Company arranges for consumers on the third-party lenders’ behalf. The Company is required to purchase from the lender defaulted loans that it has guaranteed.
During the second quarterand third quarters of 2019, Zibby completed an equity raising round atthrough which the Company increased its investment in Zibby to 42.3%, on a value per share less thanfully diluted basis, resulting in the value per share raised in prior raises.accounting of the investment under the equity method as of September 30, 2019. This round included additional investments from existing shareholders and investments by new investors and is considered indicativeinvestors. As a result of the fair value of shares in Zibby. Accordingly, weadditional investment, the Company recognized a $3.7 million impairment in our investment in Zibbyloss to adjust it to market value. Asthe Company's carrying value of June 30, 2019, we owned approximately 30% of the outstanding shares of Zibby on a fully diluted basis. See Zibby.
CURO GROUP HOLDINGS CORP. AND SUBSIDIARIES
NOTES TO CONDENSED CONSOLIDATED FINANCIAL STATEMENTS (continued)
The faircarrying value was further adjusted by the Company's pro rata share of Zibby's losses during the period in which the Company held a greater than 20% investment, typically considered the threshold for equity method accounting. During the three months ended September 30, 2019, this carrying value adjustment was $1.4 million.
The 8.25% Senior Secured Notes fair value disclosure was based on broker quotations.transferred from Level 3, as previously reported, to Level 2 for September 30, 2019 and December 31, 2018. Upon management's review of the inputs, the Level 2 disclosure is appropriate given the limited trading activity in this public (observable) market. The fair values of the Non-Recourse Canada SPV facility and the Senior Revolver were based on the cash needed for their respective final settlements.
CURO GROUP HOLDINGS CORP. AND SUBSIDIARIES
NOTES TO CONDENSED CONSOLIDATED FINANCIAL STATEMENTS (continued)
(unaudited)
NOTE 9 – STOCKHOLDERS' EQUITY
In connection with the Company's initial public offering in December 2017, the underwriters had a 30-day option to purchase up to an additional 1.0 million shares of the Company's common stock at the initial public offering price, less the underwriting discount for over-allotments, if any. The underwriters exercised this option and purchased 1.0 million shares on January 5, 2018. The exercise of this option provided additional proceeds of $13.1 million.
CURO GROUP HOLDINGS CORP. AND SUBSIDIARIES
NOTES TO CONDENSED CONSOLIDATED FINANCIAL STATEMENTS (continued)
(unaudited)
The following table summarizes the changes in stockholders' equity for the three and sixnine months ended JuneSeptember 30, 2018 and 2019:2019 (in thousands):
| | | | Common Stock | | Paid-in capital | | Retained Earnings (Deficit) | | AOCI (1) | | Total Stockholders' Equity | Common Stock | | Paid-in capital | | Retained Earnings (Deficit) | | AOCI (1) | | Total Stockholders' Equity |
| (dollars in thousands) | Shares Outstanding | | Par Value | | |
| | | Shares Outstanding | | Par Value | | Paid-in capital | | Retained Earnings (Deficit) | | AOCI (1) | | Total Stockholders' Equity |
| Balances at December 31, 2017 | 44,561,419 |
| | $ | 8 |
| | $ | 46,079 |
| | $ | 3,988 |
| | $ | (42,939 | ) | | $ | 7,136 |
| 44,561,419 |
| | $ | 8 |
| |
| Net income from continuing operations | — |
| | — |
| | — |
| | 24,913 |
| | — |
| | 24,913 |
| — |
| | — |
| | — |
| | 24,913 |
| | — |
| | 24,913 |
|
| Net loss from discontinued operations | — |
| | — |
| | — |
| | (1,621 | ) | | — |
| | (1,621 | ) | — |
| | — |
| | — |
| | (1,621 | ) | | — |
| | (1,621 | ) |
| Foreign currency translation adjustment | — |
| | — |
| | — |
| | — |
| | (2,910 | ) | | (2,910 | ) | — |
| | — |
| | — |
| | — |
| | (2,910 | ) | | (2,910 | ) |
| Cash flow hedge expiration | — |
| | — |
| | — |
| | — |
| | 54 |
| | 54 |
| — |
| | — |
| | — |
| | — |
| | 54 |
| | 54 |
|
| Share based compensation expense | — |
| | — |
| | 1,842 |
| | — |
| | — |
| | 1,842 |
| — |
| | — |
| | 1,842 |
| | — |
| | — |
| | 1,842 |
|
| Initial Public Offering, Net Proceeds (underwriter shares) | 1,000,000 |
| | 1 |
| | 13,135 |
| | — |
| | — |
| | 13,136 |
| |
Initial Public Offering, Net Proceeds (2) (underwriter shares) | | 1,000,000 |
| | 1 |
| | 13,135 |
| | — |
| | — |
| | 13,136 |
|
| Balances at March 31, 2018 | 45,561,419 |
| | $ | 9 |
| | $ | 61,056 |
| | $ | 27,280 |
| | $ | (45,795 | ) | | $ | 42,550 |
| 45,561,419 |
| | $ | 9 |
| | $ | 61,056 |
| | $ | 27,280 |
| | $ | (45,795 | ) | | $ | 42,550 |
|
| Net income from continuing operations | — |
| | — |
| | — |
| | 18,718 |
| | — |
| | 18,718 |
| — |
| | — |
| | — |
| | 18,718 |
| | — |
| | 18,718 |
|
| Net loss from discontinued operations | — |
| | — |
| | — |
| | (2,743 | ) | | — |
| | (2,743 | ) | — |
| | — |
| | — |
| | (2,743 | ) | | — |
| | (2,743 | ) |
| Foreign currency translation adjustment | — |
| | — |
| | — |
| | — |
| | (6,754 | ) | | (6,754 | ) | — |
| | — |
| | — |
| | — |
| | (6,754 | ) | | (6,754 | ) |
Cash flow hedge expiration
| — |
| | — |
| | — |
| | — |
| | (439 | ) | | (439 | ) | — |
| | — |
| | — |
| | — |
| | (439 | ) | | (439 | ) |
| Share based compensation expense | — |
| | — |
| | 1,478 |
| | — |
| | — |
| | 1,478 |
| — |
| | — |
| | 1,478 |
| | — |
| | — |
| | 1,478 |
|
| Proceeds from exercise of stock options | 209,132 |
| | — |
| | 39 |
| | — |
| | — |
| | 39 |
| 209,132 |
| | — |
| | 39 |
| | — |
| | — |
| | 39 |
|
| Common stock issued for RSU's vesting | 49,994 |
| | — |
| | — |
| | — |
| | — |
| | — |
| 49,994 |
| | — |
| | — |
| | — |
| | — |
| | — |
|
| Balances at June 30, 2018 | 45,820,545 |
| | $ | 9 |
| | $ | 62,573 |
| | $ | 43,255 |
| | $ | (52,988 | ) | | $ | 52,849 |
| 45,820,545 |
| | $ | 9 |
| | $ | 62,573 |
| | $ | 43,255 |
| | $ | (52,988 | ) | | $ | 52,849 |
|
| Net loss from continuing operations | | — |
| | — |
| | — |
| | (42,590 | ) | | — |
| | (42,590 | ) |
| Net loss from discontinued operations | | — |
| | — |
| | — |
| | (4,432 | ) | | — |
| | (4,432 | ) |
| Foreign currency translation adjustment | | — |
| | — |
| | — |
| | — |
| | 2,649 |
| | 2,649 |
|
Cash flow hedge expiration
| | — |
| | — |
| | — |
| | — |
| | (187 | ) | | (187 | ) |
| Share based compensation expense | | — |
| | — |
| | 2,792 |
| | — |
| | — |
| | 2,792 |
|
| Proceeds from exercise of stock options | | 222,432 |
| | — |
| | 369 |
| | — |
| | — |
| | 369 |
|
| Initial Public Offering, Net Proceeds (underwriter shares) | | — |
| | — |
| | (1,586 | ) | | — |
| | — |
| | (1,586 | ) |
| Balance at September 30, 2018 | | 46,042,977 |
| | $ | 9 |
| | $ | 64,148 |
| | $ | (3,767 | ) | | $ | (50,526 | ) | | $ | 9,864 |
|
(1) Accumulated other comprehensive income (loss)
| (1) Accumulated other comprehensive income (loss)
| (1) Accumulated other comprehensive income (loss)
|
(2) In connection with the Company's initial public offering in December 2017, the underwriters had a 30-day option to purchase up to an additional 1.0 million shares of the Company's common stock at the initial public offering price, less the underwriting discount for over-allotments, if any. The underwriters exercised this option and purchased 1.0 million shares on January 5, 2018. The exercise of this option provided additional proceeds of $13.1 million. | | (2) In connection with the Company's initial public offering in December 2017, the underwriters had a 30-day option to purchase up to an additional 1.0 million shares of the Company's common stock at the initial public offering price, less the underwriting discount for over-allotments, if any. The underwriters exercised this option and purchased 1.0 million shares on January 5, 2018. The exercise of this option provided additional proceeds of $13.1 million. |
CURO GROUP HOLDINGS CORP. AND SUBSIDIARIES
NOTES TO CONDENSED CONSOLIDATED FINANCIAL STATEMENTS (continued)
(unaudited)
| | | | Common Stock | | Paid-in capital | | Treasury Stock | | Retained Earnings (Deficit) | | AOCI (1) | | Total Stockholders' Equity | Common Stock | | Paid-in capital | | Treasury Stock | | Retained Earnings (Deficit) | | AOCI (1) | | Total Stockholders' Equity |
| (dollars in thousands) | Shares Outstanding | | Par Value | | |
| | | Shares Outstanding | | Par Value | | Paid-in capital | | Treasury Stock | | Retained Earnings (Deficit) | | AOCI (1) | | Total Stockholders' Equity |
| Balances at December 31, 2018 | 46,412,231 |
| | $ | 9 |
| | $ | 60,015 |
| | $ | — |
| | $ | (18,065 | ) | | $ | (61,060 | ) | | $ | (19,101 | ) | 46,412,231 |
| | $ | 9 |
| |
| Net income from continuing operations | — |
| | — |
| | — |
| | — |
| | 28,673 |
| | — |
| | 28,673 |
| — |
| | — |
| | — |
| | — |
| | 28,673 |
| | — |
| | 28,673 |
|
| Net income from discontinued operations | — |
| | — |
| | — |
| | — |
| | 8,375 |
| | — |
| | 8,375 |
| — |
| | — |
| | — |
| | — |
| | 8,375 |
| | — |
| | 8,375 |
|
| Foreign currency translation adjustment | — |
| | — |
| | — |
| | — |
| | — |
| | 16,695 |
| | 16,695 |
| — |
| | — |
| | — |
| | — |
| | — |
| | 16,695 |
| | 16,695 |
|
| Share based compensation expense | — |
| | — |
| | 2,172 |
| | — |
| | — |
| | — |
| | 2,172 |
| — |
| | — |
| | 2,172 |
| | — |
| | — |
| | — |
| | 2,172 |
|
| Proceeds from exercise of stock options | 7,888 |
| | — |
| | 40 |
| | — |
| | — |
| | — |
| | 40 |
| 7,888 |
| | — |
| | 40 |
| | — |
| | — |
| | — |
| | 40 |
|
| Common stock issued for RSU's vesting, net of shares withheld and withholding paid for employee taxes | 11,170 |
| | — |
| | (110 | ) | | — |
| | — |
| | — |
| | (110 | ) | 11,170 |
| | — |
| | (110 | ) | | — |
| | — |
| | — |
| | (110 | ) |
| Balances at March 31, 2019 | 46,431,289 |
| | $ | 9 |
| | $ | 62,117 |
| | $ | — |
| | $ | 18,983 |
| | $ | (44,365 | ) | | $ | 36,744 |
| 46,431,289 |
| | $ | 9 |
| | $ | 62,117 |
| | $ | — |
| | $ | 18,983 |
| | $ | (44,365 | ) | | $ | 36,744 |
|
| Net income from continuing operations | — |
| | — |
| | — |
| | — |
| | 17,667 |
| | — |
| | 17,667 |
| — |
| | — |
| | — |
| | — |
| | 17,667 |
| | — |
| | 17,667 |
|
| Net income from discontinued operations | — |
| | — |
| | — |
| | — |
| | (834 | ) | | — |
| | (834 | ) | |
| Net loss from discontinued operations | | — |
| | — |
| | — |
| | — |
| | (834 | ) | | — |
| | (834 | ) |
| Foreign currency translation adjustment | — |
| | — |
| | — |
| | — |
| | — |
| | 3,635 |
| | 3,635 |
| — |
| | — |
| | — |
| | — |
| | — |
| | 3,635 |
| | 3,635 |
|
| Share based compensation expense | — |
| | — |
| | 2,644 |
| | — |
| | — |
| | — |
| | 2,644 |
| — |
| | — |
| | 2,644 |
| | — |
| | — |
| | — |
| | 2,644 |
|
| Proceeds from exercise of stock options | 4,908 |
| | — |
| | 29 |
| | — |
| | — |
| | — |
| | 29 |
| 4,908 |
| | — |
| | 29 |
| | — |
| | — |
| | — |
| | 29 |
|
| Purchase of shares under the stock repurchase program | (244,200 | ) | | — |
| | — |
| | (2,507 | ) | | — |
| | — |
| | (2,507 | ) | |
| Repurchase of common stock | | (244,200 | ) | | — |
| | — |
| | (2,507 | ) | | — |
| | — |
| | (2,507 | ) |
| Common stock issued for RSU's vesting, net of shares withheld and withholding paid for employee taxes | 63,285 |
| | — |
| | — |
| | — |
| | — |
| | — |
| | — |
| 63,285 |
| | — |
| | — |
| | — |
| | — |
| | — |
| | — |
|
| Balances at June 30, 2019 | 46,255,282 |
| | $ | 9 |
| | $ | 64,790 |
| | $ | (2,507 | ) | | $ | 35,816 |
| | $ | (40,730 | ) | | $ | 57,378 |
| 46,255,282 |
| | $ | 9 |
| | $ | 64,790 |
| | $ | (2,507 | ) | | $ | 35,816 |
| | $ | (40,730 | ) | | $ | 57,378 |
|
| Net income from continuing operations | | — |
| | — |
| | — |
| | — |
| | 27,987 |
| | — |
| | 27,987 |
|
| Net loss from discontinued operations | | — |
| | — |
| | — |
| | — |
| | (598 | ) | | — |
| | (598 | ) |
| Foreign currency translation adjustment | | — |
| | — |
| | — |
| | — |
| | — |
| | (1,954 | ) | | (1,954 | ) |
| Share based compensation expense | | — |
| | — |
| | 2,771 |
| | — |
| | — |
| | — |
| | 2,771 |
|
| Proceeds from exercise of stock options | | 3,924 |
| | — |
| | 18 |
| | — |
| | — |
| | — |
| | 18 |
|
Repurchase of common stock (2) | | (3,912,041 | ) | | — |
| | — |
| | (50,557 | ) | | — |
| | — |
| | (50,557 | ) |
| Balances at September 30, 2019 | | 42,347,165 |
| | $ | 9 |
| | $ | 67,579 |
| | $ | (53,064 | ) | | $ | 63,205 |
| | $ | (42,684 | ) | | $ | 35,045 |
|
(1) Accumulated other comprehensive income (loss)
| (1) Accumulated other comprehensive income (loss)
| (1) Accumulated other comprehensive income (loss) |
(2) Includes the repurchase of 2,000,000 shares of common stock from FFL for $13.55 per share. See Note 17 - "Share Repurchase Program" for additional information. | | (2) Includes the repurchase of 2,000,000 shares of common stock from FFL for $13.55 per share. See Note 17 - "Share Repurchase Program" for additional information. |
CURO GROUP HOLDINGS CORP. AND SUBSIDIARIES
NOTES TO CONDENSED CONSOLIDATED FINANCIAL STATEMENTS (continued)
(unaudited)
NOTE 10 – EARNINGS PER SHARE
The following table presents the computation of basic and diluted earnings per share (in thousands, except per share amounts):
| | | | Three Months Ended
June 30, | | Six Months Ended
June 30, | Three Months Ended
September 30, | | Nine Months Ended
September 30, |
| | 2019 | | 2018 | | 2019 | | 2018 | 2019 | | 2018(1) | | 2019 | | 2018 |
Net income from continuing operations
| $ | 17,667 |
| | $ | 18,718 |
| | $ | 46,340 |
| | $ | 43,631 |
| |
Net income (loss) from discontinued operations, net of tax
| (834 | ) | | (2,743 | ) | | $ | 7,541 |
| | $ | (4,364 | ) | |
| Net income | $ | 16,833 |
| | $ | 15,975 |
| | $ | 53,881 |
| | $ | 39,267 |
| |
| Net income (loss) from continuing operations | | $ | 27,987 |
| | $ | (42,590 | ) | | $ | 74,327 |
| | $ | 1,041 |
|
| Net (loss) income from discontinued operations, net of tax | | (598 | ) | | (4,432 | ) | | $ | 6,943 |
| | $ | (8,796 | ) |
| Net income (loss) | | $ | 27,389 |
| | $ | (47,022 | ) | | $ | 81,270 |
| | $ | (7,755 | ) |
| | | | | | | | | | | | | | | |
| Weighted average common shares - basic | 46,451 |
| | 45,650 |
| | 46,438 |
| | 45,578 |
| 44,422 |
| | 45,853 |
| | 45,759 |
| | 45,674 |
|
| Dilutive effect of stock options and restricted stock units | 656 |
| | 2,346 |
| | 897 |
| | 2,179 |
| 1,588 |
| | — |
| | 1,128 |
| | 2,387 |
|
| Weighted average common shares - diluted | 47,107 |
| | 47,996 |
| | 47,335 |
| | 47,757 |
| 46,010 |
| | 45,853 |
| | 46,887 |
| | 48,061 |
|
| | | | | | | | | | | | | | | |
| Basic income (loss) per share: | | | | | | | | |
| Basic earnings (loss) per share: | | | | | | | | |
| Continuing operations | $ | 0.38 |
| | $ | 0.41 |
| | $ | 1.00 |
| | $ | 0.96 |
| $ | 0.63 |
| | $ | (0.93 | ) | | $ | 1.63 |
| | $ | 0.02 |
|
| Discontinued operations | (0.02 | ) | | (0.06 | ) | | 0.16 |
| | (0.10 | ) | (0.01 | ) | | (0.10 | ) | | 0.15 |
| | (0.19 | ) |
| Basic income per share | $ | 0.36 |
|
| $ | 0.35 |
|
| $ | 1.16 |
| | $ | 0.86 |
| |
| Basic earnings per share | | $ | 0.62 |
|
| $ | (1.03 | ) |
| $ | 1.78 |
| | $ | (0.17 | ) |
| | | | | | | | | | | | | | | |
| Diluted income (loss) per share: | | | | | | | | |
| Diluted earnings (loss) per share: | | | | | | | | |
| Continuing operations | $ | 0.38 |
| | $ | 0.39 |
| | $ | 0.98 |
| | $ | 0.92 |
| $ | 0.61 |
| | $ | (0.93 | ) | | $ | 1.59 |
| | $ | 0.03 |
|
| Discontinued operations | (0.02 | ) | | (0.06 | ) | | 0.16 |
| | (0.10 | ) | (0.01 | ) | | (0.10 | ) | | 0.15 |
| | (0.19 | ) |
| Diluted income per share | $ | 0.36 |
| | $ | 0.33 |
| | $ | 1.14 |
| | $ | 0.82 |
| |
| Diluted earnings per share | | $ | 0.60 |
| | $ | (1.03 | ) | | $ | 1.74 |
| | $ | (0.16 | ) |
(1) As of December 31, 2018, the Company made certain insignificant adjustments to previously-reported Earnings Per Share ("EPS") to correctly reflect the effect of anti-dilutive shares on diluted EPS calculations in accordance with ASC 260. These changes were immaterial to the overall EPS calculation. Diluted loss per share for the three months ended September 30, 2018 of $0.97 was corrected to $1.03. | | (1) As of December 31, 2018, the Company made certain insignificant adjustments to previously-reported Earnings Per Share ("EPS") to correctly reflect the effect of anti-dilutive shares on diluted EPS calculations in accordance with ASC 260. These changes were immaterial to the overall EPS calculation. Diluted loss per share for the three months ended September 30, 2018 of $0.97 was corrected to $1.03. |
Potential shares of common stock that would have the effect of increasing diluted earnings per share or decreasing diluted loss per share are considered to be anti-dilutive and as such, these shares are not included in calculating "Diluted earnings per share." For the three and sixnine months ended JuneSeptember 30, 2019, there were 1.30.1 million and 1.20.3 million, respectively, of potential shares of common stock excluded from the calculation of dilutedDiluted earnings per share because their effect was anti-dilutive. For the three months ended September 30, 2018, there were 2.5 million potential shares of common stock excluded from the calculation of Diluted earnings per share because their effect was anti-dilutive. There was no effect for the three and sixnine months ended JuneSeptember 30, 2018.
The Company utilizes the "control number" concept in the computation of Diluted earnings per share to determine whether potential common stock instruments are dilutive. The control number used is income from continuing operations. The control number concept requires that the same number of potentially dilutive securities applied in computing dilutedDiluted earnings per share from continuing operations be applied to all other categories of income or loss, regardless of their anti-dilutive effect on such categories.
CURO GROUP HOLDINGS CORP. AND SUBSIDIARIES
NOTES TO CONDENSED CONSOLIDATED FINANCIAL STATEMENTS (continued)
(unaudited)
NOTE 11 – SUPPLEMENTAL CASH FLOW INFORMATION
The following table provides supplemental cash flow information:information (in thousands):
| | | | Six Months Ended
June 30, | Nine Months Ended
September 30, |
| (dollars in thousands) | 2019 | | 2018 | |
| | | 2019 | | 2018 |
| Cash paid for: | | | | | | |
| Interest | $ | 34,678 |
| | $ | 44,250 |
| $ | 65,627 |
| | $ | 80,748 |
|
| Income taxes | 4,231 |
| | 11,621 |
| |
| Income taxes, net of refunds | | 2,029 |
| | 15,868 |
|
| Non-cash investing activities: | | | | | | |
| Property and equipment accrued in accounts payable | $ | 105 |
| | $ | 595 |
| $ | 604 |
| | $ | 1,240 |
|
CURO GROUP HOLDINGS CORP. AND SUBSIDIARIES
NOTES TO CONDENSED CONSOLIDATED FINANCIAL STATEMENTS (continued)
(unaudited)
NOTE 12 – SEGMENT REPORTING
Segment information is prepared on the same basis that the Company's Chief Operating Decision Maker ("CODM") reviews financial information for operational decision making purposes. During the first quarter of 2019, the U.K. Subsidiaries met discontinued operations criteria, resulting in two remaining reportable operating segments: the U.S. and Canada.
Management’s evaluation of performance utilizes gross margin and operating profit before the allocation of interest expense and professional services. The following reporting segment results reflect this basis for evaluation and were determined in accordance with the same accounting principles used in the Condensed Consolidated Financial Statements.
The following table illustrates summarized financial information concerning reportable segments.segments (in thousands):
| | | | Three Months Ended
June 30, | | Six Months Ended
June 30, | | Three Months Ended
September 30, | | Nine Months Ended
September 30, |
| (dollars in thousands) | 2019 | | 2018 | | 2019 | | 2018 | |
| | | | 2019 | | 2018 | | 2019 | | 2018 |
| Revenues by segment: | | | | | | | | | | | | | | | |
| U.S. | $ | 210,046 |
| | $ | 190,126 |
| | $ | 436,165 |
| | $ | 394,719 |
| | $ | 237,069 |
| | $ | 223,273 |
| | $ | 673,234 |
| | $ | 617,992 |
|
| Canada | 54,254 |
| | 47,043 |
| | 106,074 |
| | 93,293 |
| | 60,195 |
| | 46,209 |
| | 166,269 |
| | 139,502 |
|
| Consolidated revenue | $ | 264,300 |
| | $ | 237,169 |
| | $ | 542,239 |
| | $ | 488,012 |
| | $ | 297,264 |
| | $ | 269,482 |
| | $ | 839,503 |
| | $ | 757,494 |
|
| Gross margin by segment: | | | | | | | | | | | | | | | |
| U.S. | $ | 65,067 |
| | $ | 64,048 |
| | $ | 154,870 |
| | $ | 155,392 |
| | $ | 77,250 |
| | $ | 60,105 |
| | $ | 232,120 |
| | $ | 215,497 |
|
| Canada | 16,114 |
| | 13,300 |
| | 31,808 |
| | 27,802 |
| | 19,389 |
| | 489 |
| | 51,197 |
| | 28,291 |
|
| Consolidated gross margin | $ | 81,181 |
| | $ | 77,348 |
| | $ | 186,678 |
| | $ | 183,194 |
| | $ | 96,639 |
| | $ | 60,594 |
| | $ | 283,317 |
| | $ | 243,788 |
|
| Segment operating income: | | | | | | | | |
| Segment operating income (loss): | | | | | | | | | |
| U.S. | $ | 17,029 |
| | $ | 15,362 |
| | $ | 48,224 |
| | $ | 42,194 |
| | $ | 28,092 |
| | $ | (53,624 | ) | | $ | 76,316 |
| | $ | (11,430 | ) |
| Canada | 8,091 |
| | 8,534 |
| | 15,615 |
| | 18,082 |
| | 11,134 |
| | (5,880 | ) | | 26,749 |
| | 12,202 |
|
| Consolidated operating profit | $ | 25,120 |
| | $ | 23,896 |
| | $ | 63,839 |
| | $ | 60,276 |
| | $ | 39,226 |
| | $ | (59,504 | ) | | $ | 103,065 |
| | $ | 772 |
|
| Expenditures for long-lived assets by segment: | | | | | | | | | | | | | | | |
| U.S. | $ | 2,568 |
| | $ | 1,195 |
| | $ | 4,998 |
| | $ | 1,983 |
| | $ | 2,890 |
| | $ | 4,483 |
| | $ | 7,888 |
| | $ | 6,466 |
|
| Canada | 477 |
| | 220 |
| | 1,166 |
| | 974 |
| | 216 |
| | 590 |
| | 1,382 |
| | 1,564 |
|
| Consolidated expenditures for long-lived assets | $ | 3,045 |
| | $ | 1,415 |
| | $ | 6,164 |
| | $ | 2,957 |
| | $ | 3,106 |
| | $ | 5,073 |
| | $ | 9,270 |
| | $ | 8,030 |
|
CURO GROUP HOLDINGS CORP. AND SUBSIDIARIES
NOTES TO CONDENSED CONSOLIDATED FINANCIAL STATEMENTS (continued)
(unaudited)
The following table provides gross loans receivable by segment:segment (in thousands):
| | | (dollars in thousands) | June 30,
2019 | | December 31,
2018 | |
| | | | September 30,
2019 | | December 31,
2018 |
| U.S. | $ | 340,968 |
| | $ | 361,473 |
| | $ | 370,967 |
| | $ | 361,473 |
|
| Canada | 268,625 |
| | 210,058 |
| | 286,648 |
| | 210,058 |
|
| Total gross loans receivable | $ | 609,593 |
| | $ | 571,531 |
| | $ | 657,615 |
| | $ | 571,531 |
|
The following table provides net long-lived assets, comprised of property and equipment, by segment. These amounts are aggregated on a legal entity basis and do not necessarily reflect where the asset is physically located:located (in thousands):
| | | (dollars in thousands) | June 30, 2019 | | December 31, 2018 | |
| | | | September 30, 2019 | | December 31, 2018 |
| U.S. | $ | 44,209 |
| | $ | 47,918 |
| | $ | 42,937 |
| | $ | 47,918 |
|
| Canada | 28,784 |
| | 28,832 |
| | 27,444 |
| | 28,832 |
|
| Total net long-lived assets | $ | 72,993 |
| | $ | 76,750 |
| | $ | 70,381 |
| | $ | 76,750 |
|
The Company's CODM does not review total assets by segment for purposes of allocating resources or decision-making purposes; therefore, total assets by segment are not disclosed.
CURO GROUP HOLDINGS CORP. AND SUBSIDIARIES
NOTES TO CONDENSED CONSOLIDATED FINANCIAL STATEMENTS (continued)
(unaudited)
NOTE 13 – CONTINGENT LIABILITIES
Securities Litigation
On December 5, 2018, a putative securities fraud class action lawsuit was filed against the Company and its chief executive officer, chief financial officer and chief operating officer in the United States District Court for the District of Kansas, captioned Yellowdog Partners, LP v. CURO Group Holdings Corp., Donald F. Gayhardt, William Baker and Roger W. Dean, Civil Action No. 18-2662. On May 31, 2019, plaintiffs filed a consolidated complaint naming Doug Rippel, Chad Faulkner, Mike McKnight, Friedman Fleischer & Lowe Capital Partners II, L.P., FFL Executive Partners II, L.P., and FFL Parallel Fund II, L.P. as additional defendants. The complaint alleges that the Company and the individual defendants violated Section 10(b) of the Securities Exchange Act of 1934, as amended (the "Exchange Act") and that certain defendants also violated Section 20(a) of the Exchange Act as "control persons" of CURO. Plaintiffs purport to bring these claims on behalf of a class of investors who purchased Company common stock between April 27, 2018 and October 24, 2018.
Plaintiffs allege generally that, during the putative class period, the Company made misleading statements and omitted material information regarding its efforts to transition the Canadian inventory of products from Single-Pay loans to Open-End loans. Plaintiffs assert that the Company and the individual defendants made these misstatements and omissions to keep the stock price high. Plaintiffs seek unspecified damages and other relief. The Company filed a motion to dismiss the lawsuit on August 15, 2019.
While the Company is vigorously contesting this lawsuit, it cannot determine the final resolution or when it might be resolved. In addition to the expenses incurred in defending this litigation and any damages that may be awarded in the event of an adverse ruling, management’s efforts and attention may be diverted from the ordinary business operations to address these claims. Regardless of the outcome, this litigation may have a material adverse impact on results because of defense costs, including costs related to indemnification obligations, diversion of resources and other factors.
TheDuring the first quarter of 2019, the Company has also received an inquiry from the SEC regarding the Company's public disclosures surrounding its efforts to transition the Canadian inventory of products from Single-Pay loans to Open-End loans.
City of Austin
The Company was cited in July 2016 by the City of Austin, Texas for alleged violations of the Austin ordinance addressing products offered by CSOs. The Austin ordinance regulates aspects of products offered under the Company's credit access bureau ("CAB") program, including loan sizes and repayment terms. The Company believes that: (i) the Austin ordinance (similar to its counterparts elsewhere in Texas) conflicts with Texas state law and (ii) in any event, the Company's product complies with the ordinance, when the ordinance is properly construed. The Austin Municipal Court agreed with the Company's position that the ordinance conflicts with Texas law and, accordingly, did not address the second argument. In September 2017, the Travis County Court reversed the Municipal Court’s decision and remanded the case for further proceedings. To date, a hearing and trial on the merits have not been scheduled. The Company does not anticipate having a final determination of the lawfulness of its CAB program under the Austin ordinance (and similar ordinances in other Texas cities) in the near future. A final adverse decision could potentially
CURO GROUP HOLDINGS CORP. AND SUBSIDIARIES
NOTES TO CONDENSED CONSOLIDATED FINANCIAL STATEMENTS (continued)
(unaudited)
result in material monetary liability in Austin and elsewhere in Texas, and would force the Company to restructure the loans it originates in Austin and elsewhere in Texas.
Other Legal Matters
The Company is a defendant in certain litigation matters encountered in the ordinary course of business. Certain of these matters may be covered to an extent by insurance. In the opinion of management, based upon the advice of legal counsel, the likelihood is remote that the impact of any of these pending litigation matters, either individually or in the aggregate, would have a material adverse effect on the Company's consolidated financial condition, results of operations or cash flows.
NOTE 14 – LEASES
The Company entered into operating leases for the buildings in which it operates that expire at various times through 2040.2033. The Company determines if an arrangement is a lease at inception. Operating leases are included in "Right of use asset - operating leases" and "Lease liability - operating leases" in the Condensed Consolidated Balance Sheets. The Company currently has finance leases which in the aggregate are immaterial and not presented in the Condensed Consolidated Balance Sheets.
ROU assets and lease liabilities are recognized based on the present value of lease payments over the lease term at commencement date. As most of the Company’s leases do not provide an implicit rate of return, the Company uses its incremental borrowing rate based on the information available at commencement date in determining the present value of lease payments.
CURO GROUP HOLDINGS CORP. AND SUBSIDIARIES
NOTES TO CONDENSED CONSOLIDATED FINANCIAL STATEMENTS (continued)
(unaudited)
The incremental borrowing rate is determined using a portfolio approach based on the rate of interest the Company would pay to borrow an amount equal to the lease payments on a collateralized basis over a similar term. The Company uses quoted interest rates obtained from financial institutions as an input, adjusted for Company specific factors, to derive the incremental borrowing rate as the discount rate for the lease.
The majority of the leases have an original term of five years with two five-year renewal options. For purposes of calculating operating lease liabilities, lease terms may be deemed to include options to extend or terminate the lease when it is reasonably certain that the Company will exercise that option. Most of the leases have escalation clauses and severalcertain leases also require payment of certain period costs, including maintenance, insurance and property taxes. Some of the leases are with related parties and have terms similar to the non-related party leases. The Company's lease agreements do not contain any material residual value guarantees or material restrictive covenants.
The Company hadfollowing table summarizes the operating lease costs of approximately $17.0 million for the period ended June 30, 2019. Some of the leases are with related parties and have terms similar to the non-related party leases previously described. Operating lease costs for unrelated third-party leases were $15.3 million and for related party leases were $1.7 million for the three and nine months ended JuneSeptember 30, 2019.2019 (in thousands):
|
| | | | | | | |
| | Three Months Ended
September 30, | | Nine Months Ended
September 30, |
| | 2019 | | 2019 |
| Operating lease costs: | | | |
| Third-Party | $ | 7,687 |
| | $ | 23,000 |
|
| Related-Party | 865 |
| | 2,595 |
|
| Total | $ | 8,552 |
| | $ | 25,595 |
|
During the sixnine months ended JuneSeptember 30, 2019, cash paid for amounts included in the measurement of the liabilities and the operating cash flows were $17.4$26.0 million. ROU assets obtained in exchange for lease liabilities were $11.1 million.
CURO GROUP HOLDINGS CORP. AND SUBSIDIARIES
NOTES TO CONDENSED CONSOLIDATED FINANCIAL STATEMENTS (continued)
(unaudited)
The following table summarizes the future minimumaggregate operating lease paymentsmaturities that the Company is contractually obligated to make under operating leases as of JuneSeptember 30, 2019:2019 (in thousands):
| | | (in thousands) | Third-Party | | Related-Party | | Total | |
| 2019 | $ | 15,517 |
| | $ | 1,840 |
| | $ | 17,357 |
| |
| | | | Third-Party | | Related-Party | | Total |
| Remainder of 2019 | | | $ | 7,698 |
| | $ | 922 |
| | $ | 8,620 |
|
| 2020 | 30,735 |
| | 3,752 |
| | 34,487 |
| | 29,596 |
| | 3,752 |
| | 33,348 |
|
| 2021 | 30,344 |
| | 3,852 |
| | 34,196 |
| | 26,450 |
| | 3,772 |
| | 30,222 |
|
| 2022 | 29,353 |
| | 3,909 |
| | 33,262 |
| | 23,387 |
| | 3,669 |
| | 27,056 |
|
| 2023 | 25,280 |
| | 3,616 |
| | 28,896 |
| | 18,674 |
| | 1,313 |
| | 19,987 |
|
| 2024 | | | 14,088 |
| | 963 |
| | 15,051 |
|
| Thereafter | 44,277 |
| | 10,883 |
| | 55,160 |
| | 35,697 |
| | 3,414 |
| | 39,111 |
|
| Total | 175,506 |
| | 27,852 |
| | 203,358 |
| | 155,590 |
| | 17,805 |
| | 173,395 |
|
| Less: Imputed interest | (45,852 | ) | | (8,663 | ) | | (54,515 | ) | | (42,920 | ) | | (4,427 | ) | | (47,347 | ) |
| Operating lease liabilities | $ | 129,654 |
| | $ | 19,189 |
| | $ | 148,843 |
| | $ | 112,670 |
| | $ | 13,378 |
| | $ | 126,048 |
|
In accordance with the prior guidance, ASC 840, Leases, the future minimum lease payments by fiscal year as determined prior to the adoption of ASC 842, Leases, as disclosed in our Annual Report on Form 10-K for the fiscal year ended December 31, 2018, were as follows (in thousands):
|
| | | | | | | | | | | | |
| | | Third Party | | Related Party | | Total |
| 2019 | | $ | 24,211 |
| | $ | 3,330 |
| | $ | 27,541 |
|
| 2020 | | 20,547 |
| | 3,285 |
| | 23,832 |
|
| 2021 | | 17,301 |
| | 3,324 |
| | 20,625 |
|
| 2022 | | 14,558 |
| | 3,322 |
| | 17,880 |
|
| 2023 | | 10,269 |
| | 705 |
| | 10,974 |
|
| Thereafter | | 13,446 |
| | 730 |
| | 14,176 |
|
Total (1) | | $ | 100,332 |
| | $ | 14,696 |
| | $ | 115,028 |
|
| (1) Future minimum lease payments exclude the U.K. as all U.K. subsidiaries were placed into administration effective February 25, 2019. |
As of JuneSeptember 30, 2019, the weighted average remaining lease term was 6.3 years, and the weighted average operating discount rate used to determine the operating lease liability wasremained 10.3%.
CURO GROUP HOLDINGS CORP. AND SUBSIDIARIES
NOTES TO CONDENSED CONSOLIDATED FINANCIAL STATEMENTS (continued)
(unaudited)
NOTE 15 – DISCONTINUED OPERATIONS
On February 25, 2019, in accordance with the provisions of the U.K. Insolvency Act 1986 and as approved by the boards of directors of the U.K. Subsidiaries, insolvency practitioners from KPMG were appointed as Administrators for the U.K. Subsidiaries. The effect of the U.K. Subsidiaries’ entry into administration was to place their management, affairs, business and property of the U.K. Subsidiaries under the direct control of the Administrators. Accordingly, the Company deconsolidated the U.K. Subsidiaries, which comprised the U.K. reportable operating segment, as of February 25, 2019 and classified them as Discontinued Operations for all periods presented.
Revenue and expenses related to discontinued operations included activity prior to the deconsolidation of the U.K. Subsidiaries effective February 25, 2019. For the sixnine months ended JuneSeptember 30, 2019, "Loss on disposition" of $39.4 million included the non-cash effect of eliminating assets and liabilities of the U.K. Subsidiaries as of the date of deconsolidation, as well as the effect of cumulative currency exchange rate differences on the U.S. investment in the U.K.
In connection with the disposition of the U.K. Subsidiaries, the U.S. entity that owned the Company's interests in the U.K. Subsidiaries recognized a loss on investment. This loss resulted in an estimated U.S. federal and state income tax benefit of $46.6$46.0 million, which will be available to offset the Company's future U.S. federal and state income tax obligations. InDuring the second quarter ofthree months ended September 30, 2019, the Company revised the estimate of the tax basis in the U.K. Subsidiaries, resulting in a $0.8$0.6 million reduction in the income tax benefit initially recorded in the first quarter of 2019.
The following table presents financial results of the U.K. Subsidiaries, which meet the criteria of Discontinued Operations and, therefore, are excluded from the Company's results of continuing operations:operations (in thousands):
| | | | Three Months Ended
June 30, | | Six Months Ended June 30, | | Three Months Ended
September 30, | | Nine Months Ended September 30, 2019 |
| (in thousands) | 2019 | | 2018 | | 2019(1) | | 2018 | |
| | | | 2019 | | 2018 | | 2019(1) | | 2018 |
| Revenue | $ | — |
| | $ | 11,814 |
| | $ | 6,957 |
| | $ | 22,729 |
| | $ | — |
| | $ | 13,522 |
| | $ | 6,957 |
| | $ | 36,251 |
|
| Provision for losses | — |
| | 5,639 |
| | 1,703 |
| | 9,787 |
| | — |
| | 6,831 |
| | 1,703 |
| | 16,618 |
|
| Net revenue | — |
| | 6,175 |
| | 5,254 |
| | 12,942 |
| | — |
| | 6,691 |
| | 5,254 |
| | 19,633 |
|
| | | | | | | | | | | | | | | | |
| Cost of providing services | | | | | | | | | | | | | | | |
| Office | — |
| | 545 |
| | 246 |
| | 1,073 |
| | — |
| | 416 |
| | 246 |
| | 1,490 |
|
| Other costs of providing services | — |
| | 125 |
| | 61 |
| | 1,094 |
| | — |
| | 120 |
| | 61 |
| | 1,213 |
|
| Advertising | — |
| | 2,441 |
| | 775 |
| | 4,312 |
| | — |
| | 2,765 |
| | 775 |
| | 7,077 |
|
| Total cost of providing services | — |
| | 3,111 |
| | 1,082 |
| | 6,479 |
| | — |
| | 3,301 |
| | 1,082 |
| | 9,780 |
|
| Gross margin | — |
| | 3,064 |
| | 4,172 |
| | 6,463 |
| | — |
| | 3,390 |
| | 4,172 |
| | 9,853 |
|
| Operating expense (income) | | | | | | | | | | | | | | | |
| Corporate, district and other expenses | — |
| | 5,675 |
| | 3,810 |
| | 10,700 |
| | — |
| | 7,690 |
| | 3,810 |
| | 18,390 |
|
| Interest income | — |
| | (7 | ) | | (4 | ) | | (12 | ) | | — |
| | (7 | ) | | (4 | ) | | (19 | ) |
| Loss on disposition | — |
| | — |
| | 39,414 |
| | — |
| | — |
| | — |
| | 39,414 |
| | — |
|
| Total operating expense | — |
| | 5,668 |
| | 43,220 |
| | 10,688 |
| | — |
| | 7,683 |
| | 43,220 |
| | 18,371 |
|
| Pre-tax (loss) income from operations of discontinued operations | — |
| | (2,604 | ) | | (39,048 | ) | | (4,225 | ) | |
| Pre-tax loss from operations of discontinued operations | | | — |
| | (4,293 | ) | | (39,048 | ) | | (8,518 | ) |
| Income tax expense (benefit) related to disposition | 834 |
| | 139 |
| | (46,589 | ) | | 139 |
| | 598 |
| | 139 |
| | (45,991 | ) | | 278 |
|
| Net income (loss) from discontinued operations | $ | (834 | ) | | $ | (2,743 | ) | | $ | 7,541 |
| | $ | (4,364 | ) | |
| Net (loss) income from discontinued operations | | | $ | (598 | ) | | $ | (4,432 | ) | �� | $ | 6,943 |
| | $ | (8,796 | ) |
| (1) Includes U.K. Subsidiaries financial results from January 1, 2019 to February 25, 2019. | | | | | | | | (1) Includes U.K. Subsidiaries financial results from January 1, 2019 to February 25, 2019. |
CURO GROUP HOLDINGS CORP. AND SUBSIDIARIES
NOTES TO CONDENSED CONSOLIDATED FINANCIAL STATEMENTS (continued)
(unaudited)
The following table presents the aggregate carrying amounts of the assets and liabilities of the U.K. Subsidiaries:Subsidiaries (in thousands):
| | | (in thousands) | June 30,
2019 | December 31,
2018 | |
| | | September 30,
2019 | December 31,
2018 |
ASSETS | | Cash | $ | — |
| $ | 9,859 |
| $ | — |
| $ | 9,859 |
|
| Restricted cash | — |
| 3,384 |
| — |
| 3,384 |
|
| Gross loans receivable | — |
| 25,256 |
| — |
| 25,256 |
|
| Less: allowance for loan losses | — |
| (5,387 | ) | — |
| (5,387 | ) |
| Loans receivable, net | — |
| 19,869 |
| — |
| 19,869 |
|
| Prepaid expenses and other | — |
| 1,482 |
| — |
| 1,482 |
|
| Other | — |
| 267 |
| — |
| 267 |
|
| Total assets classified as discontinued operations in the Condensed Consolidated Balance Sheets | $ | — |
| $ | 34,861 |
| $ | — |
| $ | 34,861 |
|
LIABILITIES | | Accounts payable and accrued liabilities | $ | — |
| $ | 8,136 |
| $ | — |
| $ | 8,136 |
|
| Deferred revenue | — |
| 180 |
| — |
| 180 |
|
| Accrued interest | — |
| (5 | ) | — |
| (5 | ) |
| Deferred rent | — |
| 149 |
| — |
| 149 |
|
| Other long-term liabilities | — |
| 422 |
| — |
| 422 |
|
| Total liabilities classified as discontinued operations in the Condensed Consolidated Balance Sheets | $ | — |
| $ | 8,882 |
| $ | — |
| $ | 8,882 |
|
The following table presents cash flows of the U.K. Subsidiaries:Subsidiaries (in thousands):
| | | | Six Months Ended June 30, | Nine Months Ended September 30, |
| (in thousands) | 2019(1) | | 2018 | |
| Net cash (used in) / provided by discontinued operating activities | $ | (504 | ) | | $ | 5,458 |
| |
| | | 2019(1) | | 2018 |
| Net cash (used in) provided by discontinued operating activities | | $ | (504 | ) | | $ | 5,562 |
|
| Net cash used in discontinued investing activities | (14,213 | ) | | (14,349 | ) | (14,213 | ) | | (24,481 | ) |
| Net cash used in discontinued financing activities | — |
| | — |
| — |
| | — |
|
| (1) Includes U.K. Subsidiaries financial results from January 1, 2019 to February 25, 2019. | | | | (1) Includes U.K. Subsidiaries financial results from January 1, 2019 to February 25, 2019. | | |
NOTE 16 – CONDENSED CONSOLIDATING FINANCIAL INFORMATION
In August 2018, CGHC issued $690.0 million of 8.25% Senior Secured Notes due September 1, 2025. The proceeds from issuance of the 8.25% Senior Secured Notes were used to extinguish the February and November 2017 12.00% Senior Secured Notes due March 1, 2022. The redemption was conducted pursuant to the indenture governing the 8.25% Senior Secured Notes. See Note 5, "Long-Term Debt," for additional details.
In August 2018, CURO Canada Receivables Limited Partnership, a newly created, bankruptcy-remote special purpose vehicle (the "Canada SPV Borrower") and a wholly-owned subsidiary, entered into a four-year revolving credit facility with Waterfall Asset Management, LLC that provided for C$175.0 million of initial borrowing capacity and the ability to expand such capacity up to C$250.0 million ("Non-Recourse Canada SPV Facility"). See Note 5. "Long-Term Debt" for additional details.
In March 2018, CFTC redeemed $77.5 million of the 12.00% Senior Secured Notes at a price equal to 112.00% of the principal amount plus accrued and unpaid interest to the date of redemption. The redemption was conducted pursuant to the indenture governing the 12.00% Senior Secured Notes, dated as of February 15, 2017, by and among CFTC, the guarantors party thereto and TMI Trust Company, as trustee and collateral agent. Consistent with the terms of the Indenture, CFTC used a portion of the cash proceeds from the Company's initial public offering, to redeem the 12.00% Senior Secured Notes.
In November 2017, CFTC issued $135.0 million aggregate principal amount of additional 12.00% Senior Secured Notes in a private offering exempt from the registration requirements of the Securities Act (the "Additional Notes Offering"). CFTC used the proceeds from the Additional Notes Offering, together with available cash, to (i) pay a cash dividend, in an amount of $140.0 million to the Company, CFTC’s sole stockholder, and ultimately the Company's stockholders and (ii) pay fees, expenses, premiums and accrued interest in connection with the Additional Notes Offering. CFTC received the consent of the holders of a majority of
CURO GROUP HOLDINGS CORP. AND SUBSIDIARIES
NOTES TO CONDENSED CONSOLIDATED FINANCIAL STATEMENTS (continued)
(unaudited)
the outstanding principal amount of the current Senior Secured Notes to a one-time waiver with respect to the restrictions contained in Section 5.07(a) of the indenture governing the 12.00% Senior Secured Notes to permit the dividend.
In February 2017, CFTC issued $470.0 million aggregate principal amount 12.00% Senior Secured Notes, the proceeds of which were used together with available cash, to (i) redeem the outstanding 10.75% Senior Secured Notes due 2018 of CURO Intermediate, (ii) redeem the outstanding 12.00% Senior Cash Pay Notes due 2017 and (iii) pay fees, expenses, premiums and accrued interest in connection with the offering. CFTC sold the Senior Secured Notes to qualified institutional buyers under Rule 144A of the Securities Act of 1933, as amended (the “Securities Act”) or outside the U.S. to non-U.S. persons in compliance with Regulation S of the Securities Act.
The following condensed consolidating financingfinancial information which has been prepared in accordance with the requirements for presentation of Rule 3-10(d) of Regulation S-X promulgated under the Securities Act, presents the condensed consolidating financial informationis presented separately for:
| |
| (i) | CURO as the issuer of the 8.25% Senior Secured Notes; |
| |
(ii) | The Company's subsidiary guarantors, which are comprised of its domestic subsidiaries, including CFTC as the issuer of the 12.00% Senior Secured Notes that were redeemed in August 2018, CURO Intermediate, and U.S. SPV as the issuer of the Non-Recourse U.S. SPV Facility that was extinguished in October 2018, and excluding Canada SPV (the “Subsidiary Guarantors”), on a consolidated basis, which are 100% owned by CURO, and which are guarantors of the 8.25% Senior Secured Notes issued in August 2018; |
| |
(iii)(ii) | The Company's other subsidiaries on a consolidated basis, which are not guarantors of the 8.25% Senior Secured Notes (the “Subsidiary Non-Guarantors”); |
| |
| (iii) | The Non-recourse Canada SPV facility, a wholly-owned, bankruptcy-remote special purpose subsidiary; |
| |
| (iv) | CURO as the issuer of the 8.25% Senior Secured Notes; |
| |
| (v) | Consolidating and eliminating entries representing adjustments to: |
| |
| a. | eliminate intercompany transactions between or among us, the Subsidiary Guarantors and the Subsidiary Non-Guarantors; and |
| |
| b. | eliminate the investments in subsidiaries; |
| |
(v)(vi) | The Company and its subsidiaries on a consolidated basis. |
CURO GROUP HOLDINGS CORP. AND SUBSIDIARIES
NOTES TO CONDENSED CONSOLIDATED FINANCIAL STATEMENTS (continued)
(unaudited)
Condensed Consolidating Balance Sheets
| | | | June 30, 2019 | September 30, 2019 |
| (dollars in thousands) | Subsidiary Guarantors | Subsidiary Non-Guarantors | Canada SPV | CURO | Eliminations | CURO
Consolidated | Subsidiary Guarantors | Subsidiary Non-Guarantors | Canada SPV | CURO | Eliminations | CURO
Consolidated |
| Assets: | | |
| Cash | $ | 68,354 |
| $ | 23,943 |
| $ | — |
| $ | — |
| $ | — |
| $ | 92,297 |
| $ | 40,683 |
| $ | 21,524 |
| $ | — |
| $ | — |
| $ | — |
| $ | 62,207 |
|
| Restricted cash | 16,198 |
| 2,695 |
| 14,819 |
| — |
| — |
| 33,712 |
| 13,773 |
| 3,084 |
| 21,897 |
| — |
| — |
| 38,754 |
|
| Loans receivable, net | 269,298 |
| 48,297 |
| 190,121 |
| — |
| — |
| 507,716 |
| 293,711 |
| 49,362 |
| 206,157 |
| — |
| — |
| 549,230 |
|
| Right of use asset - operating leases | 79,000 |
| 61,982 |
| — |
| — |
| — |
| 140,982 |
| 76,165 |
| 42,095 |
| — |
| — |
| — |
| 118,260 |
|
| Deferred income taxes | (7,848 | ) | — |
| — |
| 10,485 |
| — |
| 2,637 |
| (9,086 | ) | — |
| — |
| 10,932 |
| — |
| 1,846 |
|
| Income taxes receivable | (470 | ) | 6,395 |
| — |
| 31,654 |
| — |
| 37,579 |
| (960 | ) | 3,974 |
| — |
| 20,952 |
| — |
| 23,966 |
|
| Prepaid expenses and other | 23,038 |
| 7,203 |
| — |
| — |
| — |
| 30,241 |
| 24,148 |
| 8,083 |
| (3 | ) | — |
| — |
| 32,228 |
|
| Property and equipment, net | 44,209 |
| 28,784 |
| — |
| — |
| — |
| 72,993 |
| 42,937 |
| 27,444 |
| — |
| — |
| — |
| 70,381 |
|
| Goodwill | 91,131 |
| 29,319 |
| — |
| — |
| — |
| 120,450 |
| 91,131 |
| 28,979 |
| — |
| — |
| — |
| 120,110 |
|
| Other intangibles, net | 8,420 |
| 22,237 |
| — |
| — |
| — |
| 30,657 |
| 10,687 |
| 21,979 |
| — |
| — |
| — |
| 32,666 |
|
| Intercompany receivable | 107,251 |
| — |
| — |
| — |
| (107,251 | ) | — |
| 112,413 |
| — |
| — |
| — |
| (112,413 | ) | — |
|
| Investment in subsidiaries | — |
| — |
| — |
| (1,515 | ) | 1,515 |
| — |
| — |
| — |
| — |
| 37,131 |
| (37,131 | ) | — |
|
| Other | 15,401 |
| 690 |
| — |
| — |
| — |
| 16,091 |
| 17,805 |
| 679 |
| — |
| — |
| — |
| 18,484 |
|
| Total assets | $ | 713,982 |
| $ | 231,545 |
| $ | 204,940 |
| $ | 40,624 |
| $ | (105,736 | ) | $ | 1,085,355 |
| $ | 713,407 |
| $ | 207,203 |
| $ | 228,051 |
| $ | 69,015 |
| $ | (149,544 | ) | $ | 1,068,132 |
|
| Liabilities and Stockholders' equity: | | |
| Accounts payable and accrued liabilities | $ | 44,667 |
| $ | (1,166 | ) | $ | 15,020 |
| $ | 753 |
| $ | — |
| $ | 59,274 |
| $ | 48,657 |
| $ | 6,773 |
| $ | 7,259 |
| $ | 996 |
| $ | — |
| $ | 63,685 |
|
| Deferred revenue | 5,237 |
| 3,430 |
| 45 |
| — |
| — |
| 8,712 |
| 5,639 |
| 3,369 |
| 44 |
| — |
| — |
| 9,052 |
|
| Lease liability - operating leases | 86,685 |
| 62,158 |
| — |
| — |
| — |
| 148,843 |
| 83,891 |
| 42,157 |
| — |
| — |
| — |
| 126,048 |
|
| Income taxes payable | (18,731 | ) | — |
| — |
| 18,731 |
| — |
| — |
| (4,030 | ) | — |
| — |
| 4,030 |
| — |
| — |
|
| Accrued interest | 2 |
| — |
| 713 |
| 18,975 |
| — |
| 19,690 |
| 104 |
| — |
| 777 |
| 4,744 |
| — |
| 5,625 |
|
| Payable to CURO Holdings Corp. | 736,920 |
| — |
| — |
| (736,920 | ) | — |
| — |
| 657,895 |
| — |
| — |
| (657,895 | ) | — |
| — |
|
| CSO liability for losses | 9,504 |
| — |
| — |
| — |
| — |
| 9,504 |
| 10,249 |
| — |
| — |
| — |
| — |
| 10,249 |
|
| Long-term debt | — |
| — |
| 90,976 |
| 677,536 |
| — |
| 768,512 |
| |
| Debt | | 25,000 |
| — |
| 102,483 |
| 677,924 |
| — |
| 805,407 |
|
| Intercompany payable | — |
| 20,002 |
| 87,249 |
| — |
| (107,251 | ) | — |
| — |
| 18,742 |
| 93,671 |
| — |
| (112,413 | ) | — |
|
| Other liabilities | 7,999 |
| 595 |
| — |
| — |
| — |
| 8,594 |
| 8,114 |
| 480 |
| — |
| — |
| — |
| 8,594 |
|
| Deferred tax liabilities | (4,171 | ) | 4,848 |
| — |
| 4,171 |
| — |
| 4,848 |
| (4,171 | ) | 4,427 |
| — |
| 4,171 |
| — |
| 4,427 |
|
| Total liabilities | 868,112 |
| 89,867 |
| 194,003 |
| (16,754 | ) | (107,251 | ) | 1,027,977 |
| 831,348 |
| 75,948 |
| 204,234 |
| 33,970 |
| (112,413 | ) | 1,033,087 |
|
| Stockholder’s equity | (154,130 | ) | 141,678 |
| 10,937 |
| 57,378 |
| 1,515 |
| 57,378 |
| |
| Total liabilities and stockholder’s equity | $ | 713,982 |
| $ | 231,545 |
| $ | 204,940 |
| $ | 40,624 |
| $ | (105,736 | ) | $ | 1,085,355 |
| |
| Stockholders' equity | | (117,941 | ) | 131,255 |
| 23,817 |
| 35,045 |
| (37,131 | ) | 35,045 |
|
| Total liabilities and stockholders' equity | | $ | 713,407 |
| $ | 207,203 |
| $ | 228,051 |
| $ | 69,015 |
| $ | (149,544 | ) | $ | 1,068,132 |
|
CURO GROUP HOLDINGS CORP. AND SUBSIDIARIES
NOTES TO CONDENSED CONSOLIDATED FINANCIAL STATEMENTS (continued)
(unaudited)
| | | | December 31, 2018 | December 31, 2018 |
| (dollars in thousands) | Subsidiary
Guarantors | Subsidiary
Non-Guarantors | Canada SPV | CURO | Eliminations | CURO
Consolidated | Subsidiary
Guarantors | Subsidiary
Non-Guarantors | Canada SPV | CURO | Eliminations | CURO
Consolidated |
| Assets: | | |
| Cash | $ | 42,403 |
| $ | 18,772 |
| $ | — |
| $ | — |
| $ | — |
| $ | 61,175 |
| $ | 42,403 |
| $ | 18,772 |
| $ | — |
| $ | — |
| $ | — |
| $ | 61,175 |
|
| Restricted cash | 9,993 |
| 2,606 |
| 12,840 |
| — |
| — |
| 25,439 |
| 9,993 |
| 2,606 |
| 12,840 |
| — |
| — |
| 25,439 |
|
| Loans receivable, net | 304,542 |
| 56,805 |
| 136,187 |
| — |
| — |
| 497,534 |
| 304,542 |
| 56,805 |
| 136,187 |
| — |
| — |
| 497,534 |
|
| Deferred income taxes | — |
| 1,534 |
| — |
| — |
| — |
| 1,534 |
| — |
| 1,534 |
| — |
| — |
| — |
| 1,534 |
|
| Income taxes receivable | 7,190 |
| — |
| — |
| 9,551 |
| — |
| 16,741 |
| 7,190 |
| — |
| — |
| 9,551 |
| — |
| 16,741 |
|
| Prepaid expenses and other | 37,866 |
| 5,722 |
| — |
| — |
| — |
| 43,588 |
| 37,866 |
| 5,722 |
| — |
| — |
| — |
| 43,588 |
|
| Property and equipment, net | 47,918 |
| 28,832 |
| — |
| — |
| — |
| 76,750 |
| 47,918 |
| 28,832 |
| — |
| — |
| — |
| 76,750 |
|
| Goodwill | 91,131 |
| 28,150 |
| — |
| — |
| — |
| 119,281 |
| 91,131 |
| 28,150 |
| — |
| — |
| — |
| 119,281 |
|
| Other intangibles, net | 8,418 |
| 21,366 |
| — |
| — |
| — |
| 29,784 |
| 8,418 |
| 21,366 |
| — |
| — |
| — |
| 29,784 |
|
| Intercompany receivable | 77,009 |
| — |
| — |
| — |
| (77,009 | ) | — |
| 77,009 |
| — |
| — |
| — |
| (77,009 | ) | — |
|
| Investment in subsidiaries | — |
| — |
| — |
| (101,665 | ) | 101,665 |
| — |
| — |
| — |
| — |
| (101,665 | ) | 101,665 |
| — |
|
| Other | 12,253 |
| 677 |
| — |
| — |
| — |
| 12,930 |
| 12,253 |
| 677 |
| — |
| — |
| — |
| 12,930 |
|
| Assets from discontinued operations | — |
| 2,406 |
| — |
| — |
| 32,455 |
| 34,861 |
| — |
| 2,406 |
| — |
| — |
| 32,455 |
| 34,861 |
|
| Total assets | $ | 638,723 |
| $ | 166,870 |
| $ | 149,027 |
| $ | (92,114 | ) | $ | 57,111 |
| $ | 919,617 |
| $ | 638,723 |
| $ | 166,870 |
| $ | 149,027 |
| $ | (92,114 | ) | $ | 57,111 |
| $ | 919,617 |
|
| Liabilities and Stockholder's equity: | | |
| Accounts payable and accrued liabilities | $ | 38,240 |
| $ | 5,734 |
| $ | 4,980 |
| $ | 192 |
| $ | — |
| $ | 49,146 |
| $ | 38,240 |
| $ | 5,734 |
| $ | 4,980 |
| $ | 192 |
| $ | — |
| $ | 49,146 |
|
| Deferred revenue | 5,981 |
| 3,462 |
| 40 |
| — |
| — |
| 9,483 |
| 5,981 |
| 3,462 |
| 40 |
| — |
| — |
| 9,483 |
|
| Income taxes payable | — |
| 1,579 |
| — |
| — |
| — |
| 1,579 |
| — |
| 1,579 |
| — |
| — |
| — |
| 1,579 |
|
| Accrued interest | 149 |
| — |
| 831 |
| 19,924 |
| — |
| 20,904 |
| 149 |
| — |
| 831 |
| 19,924 |
| — |
| 20,904 |
|
| Payable to CURO Holdings Corp. | 768,345 |
| — |
| — |
| (768,345 | ) | — |
| — |
| 768,345 |
| — |
| — |
| (768,345 | ) | — |
| — |
|
| CSO liability for losses | 12,007 |
| — |
| — |
| — |
| — |
| 12,007 |
| 12,007 |
| — |
| — |
| — |
| — |
| 12,007 |
|
| Deferred rent | 9,559 |
| 1,292 |
| — |
| — |
| — |
| 10,851 |
| 9,559 |
| 1,292 |
| — |
| — |
| — |
| 10,851 |
|
| Long-term debt | 20,000 |
| — |
| 107,479 |
| 676,661 |
| — |
| 804,140 |
| |
| Debt | | 20,000 |
| — |
| 107,479 |
| 676,661 |
| — |
| 804,140 |
|
| Subordinated shareholder debt | — |
| 2,196 |
| — |
| — |
| — |
| 2,196 |
| — |
| 2,196 |
| — |
| — |
| — |
| 2,196 |
|
| Intercompany payable | — |
| 224 |
| 44,330 |
| — |
| (44,554 | ) | — |
| — |
| 224 |
| 44,330 |
| — |
| (44,554 | ) | — |
|
| Other liabilities | 4,967 |
| 833 |
| — |
| — |
| — |
| 5,800 |
| 4,967 |
| 833 |
| — |
| — |
| — |
| 5,800 |
|
| Deferred tax liabilities | 15,175 |
| — |
| — |
| (1,445 | ) | — |
| 13,730 |
| 15,175 |
| — |
| — |
| (1,445 | ) | — |
| 13,730 |
|
| Liabilities from discontinued operations | — |
| 8,882 |
| — |
| — |
| — |
| 8,882 |
| — |
| 8,882 |
| — |
| — |
| — |
| 8,882 |
|
| Total liabilities | 874,423 |
| 24,202 |
| 157,660 |
| (73,013 | ) | (44,554 | ) | 938,718 |
| 874,423 |
| 24,202 |
| 157,660 |
| (73,013 | ) | (44,554 | ) | 938,718 |
|
| Stockholder’s equity | (235,700 | ) | 142,668 |
| (8,633 | ) | (19,101 | ) | 101,665 |
| (19,101 | ) | |
| Total liabilities and stockholder’s equity | $ | 638,723 |
| $ | 166,870 |
| $ | 149,027 |
| $ | (92,114 | ) | $ | 57,111 |
| $ | 919,617 |
| |
| Stockholders' equity | | (235,700 | ) | 142,668 |
| (8,633 | ) | (19,101 | ) | 101,665 |
| (19,101 | ) |
| Total liabilities and stockholders' equity | | $ | 638,723 |
| $ | 166,870 |
| $ | 149,027 |
| $ | (92,114 | ) | $ | 57,111 |
| $ | 919,617 |
|
CURO GROUP HOLDINGS CORP. AND SUBSIDIARIES
NOTES TO CONDENSED CONSOLIDATED FINANCIAL STATEMENTS (continued)
(unaudited)
Condensed Consolidating Statements of Operations | | | | Three Months Ended June 30, 2019 | Three Months Ended September 30, 2019 |
| (dollars in thousands) | Subsidiary
Guarantors | Subsidiary
Non-Guarantors | Canada SPV | CURO | Eliminations | CURO
Consolidated | Subsidiary
Guarantors | Subsidiary
Non-Guarantors | Canada SPV | CURO | Eliminations | CURO
Consolidated |
| Revenue | $ | 210,046 |
| $ | 28,162 |
| $ | 26,092 |
| $ | — |
| $ | — |
| $ | 264,300 |
| $ | 237,069 |
| $ | 29,984 |
| $ | 30,211 |
| $ | — |
| $ | — |
| $ | 297,264 |
|
| Provision for losses | 92,552 |
| 6,344 |
| 13,114 |
| — |
| — |
| 112,010 |
| 102,997 |
| 7,191 |
| 13,679 |
| — |
| — |
| 123,867 |
|
| Net revenue | 117,494 |
| 21,818 |
| 12,978 |
| — |
| — |
| 152,290 |
| 134,072 |
| 22,793 |
| 16,532 |
| — |
| — |
| 173,397 |
|
| Cost of providing services: | |
|
| |
|
|
| Salaries and benefits | 17,422 |
| 8,664 |
| — |
| — |
| — |
| 26,086 |
| 18,301 |
| 9,161 |
| — |
| — |
| — |
| 27,462 |
|
| Occupancy | 8,033 |
| 5,899 |
| — |
| — |
| — |
| 13,932 |
| 8,249 |
| 5,787 |
| — |
| — |
| — |
| 14,036 |
|
| Office | 4,004 |
| 1,453 |
| — |
| — |
| — |
| 5,457 |
| 4,611 |
| 1,382 |
| — |
| — |
| — |
| 5,993 |
|
| Other costs of providing services | 11,789 |
| 1,065 |
| — |
| — |
| — |
| 12,854 |
| 11,475 |
| 1,368 |
| — |
| — |
| — |
| 12,843 |
|
| Advertising | 11,179 |
| 1,601 |
| — |
| — |
| — |
| 12,780 |
| 14,186 |
| 2,238 |
| — |
| — |
| — |
| 16,424 |
|
| Total cost of providing services | 52,427 |
| 18,682 |
| — |
| — |
| — |
| 71,109 |
| 56,822 |
| 19,936 |
| — |
| — |
| — |
| 76,758 |
|
| Gross margin | 65,067 |
| 3,136 |
| 12,978 |
| — |
| — |
| 81,181 |
| 77,250 |
| 2,857 |
| 16,532 |
| — |
| — |
| 96,639 |
|
| Operating (income) expense: | |
|
| |
| Operating expense (income) : | | |
|
|
| Corporate, district and other expenses | 30,766 |
| 6,422 |
| (781 | ) | 2,631 |
| — |
| 39,038 |
| 29,930 |
| 5,296 |
| 472 |
| 2,967 |
| — |
| 38,665 |
|
| Intercompany management fee | (3,237 | ) | 3,229 |
| 8 |
| — |
| — |
| — |
| (3,276 | ) | 3,268 |
| 8 |
| — |
| — |
| — |
|
| Interest expense | 27 |
| 7 |
| 2,375 |
| 14,614 |
| — |
| 17,023 |
| 258 |
| 24 |
| 2,463 |
| 14,619 |
| — |
| 17,364 |
|
| Loss from equity method investment | | 1,384 |
| — |
| — |
| — |
| — |
| 1,384 |
|
| Intercompany interest (income) expense | (1,513 | ) | 890 |
| 623 |
| — |
| — |
| — |
| (1,462 | ) | 893 |
| 569 |
| — |
| — |
| — |
|
| Total operating expense | 26,043 |
| 10,548 |
| 2,225 |
| 17,245 |
| — |
| 56,061 |
| 26,834 |
| 9,481 |
| 3,512 |
| 17,586 |
| — |
| 57,413 |
|
| Income (loss) from continuing operations before income taxes | 39,024 |
| (7,412 | ) | 10,753 |
| (17,245 | ) | — |
| 25,120 |
| 50,416 |
| (6,624 | ) | 13,020 |
| (17,586 | ) | — |
| 39,226 |
|
| Provision (benefit) for income tax expense | 9,591 |
| 1,094 |
| — |
| (3,232 | ) | — |
| 7,453 |
| 13,700 |
| 1,986 |
| — |
| (4,447 | ) | — |
| 11,239 |
|
| Net income (loss) from continuing operations | 29,433 |
| (8,506 | ) | 10,753 |
| (14,013 | ) | — |
| 17,667 |
| 36,716 |
| (8,610 | ) | 13,020 |
| (13,139 | ) | ��� |
| 27,987 |
|
| Net loss on discontinued operations | — |
| (834 | ) | — |
| — |
| — |
| (834 | ) | — |
| (598 | ) | — |
| — |
| — |
| (598 | ) |
| Net (loss) income | 29,433 |
| (9,340 | ) | 10,753 |
| (14,013 | ) | — |
| 16,833 |
| 36,716 |
| (9,208 | ) | 13,020 |
| (13,139 | ) | — |
| 27,389 |
|
| Equity in net income (loss) of subsidiaries: | | |
| CFTC | — |
| — |
| — |
| 30,846 |
| (30,846 | ) | — |
| — |
| — |
| — |
| 40,528 |
| (40,528 | ) | — |
|
| Guarantor Subsidiaries | 29,433 |
| — |
| — |
| — |
| (29,433 | ) | — |
| 36,716 |
| — |
| — |
| — |
| (36,716 | ) | — |
|
| Non-Guarantor Subsidiaries | (9,340 | ) | — |
| — |
| — |
| 9,340 |
| — |
| (9,208 | ) | — |
| — |
| — |
| 9,208 |
| — |
|
| SPV Subs | 10,753 |
| — |
| — |
| — |
| (10,753 | ) | — |
| 13,020 |
| — |
| — |
| — |
| (13,020 | ) | — |
|
| Net income (loss) attributable to CURO | $ | 60,279 |
| $ | (9,340 | ) | $ | 10,753 |
| $ | 16,833 |
| $ | (61,692 | ) | $ | 16,833 |
| $ | 77,244 |
| $ | (9,208 | ) | $ | 13,020 |
| $ | 27,389 |
| $ | (81,056 | ) | $ | 27,389 |
|
CURO GROUP HOLDINGS CORP. AND SUBSIDIARIES
NOTES TO CONDENSED CONSOLIDATED FINANCIAL STATEMENTS (continued)
(unaudited)
| | | | Three Months Ended June 30, 2018 | Three Months Ended September 30, 2018 |
| (dollars in thousands) | CFTC | CURO Intermediate | Subsidiary Guarantors | Subsidiary Non-Guarantors | SPV Subs | Eliminations | CFTC Consolidated | CURO | Eliminations | CURO Consolidated | CFTC | CURO Intermediate | Subsidiary Guarantors | Subsidiary Non-Guarantors | SPV Subs | Eliminations | CFTC Consolidated | CURO | Eliminations | CURO Consolidated |
| Revenue | $ | — |
| $ | — |
| $ | 118,034 |
| $ | 47,043 |
| $ | 72,092 |
| $ | — |
| $ | 237,169 |
| $ | — |
| $ | — |
| $ | 237,169 |
| $ | — |
| $ | — |
| $ | 141,385 |
| $ | 39,814 |
| $ | 88,283 |
| $ | — |
| $ | 269,482 |
| $ | — |
| $ | — |
| $ | 269,482 |
|
| Provision for losses | — |
| — |
| 46,320 |
| 14,360 |
| 25,667 |
| — |
| 86,347 |
| — |
| — |
| 86,347 |
| — |
| — |
| 58,514 |
| 5,860 |
| 63,318 |
| — |
| 127,692 |
| — |
| — |
| 127,692 |
|
| Net revenue | — |
| — |
| 71,714 |
| 32,683 |
| 46,425 |
| — |
| 150,822 |
| — |
| — |
| 150,822 |
| — |
| — |
| 82,871 |
| 33,954 |
| 24,965 |
| — |
| 141,790 |
| — |
| — |
| 141,790 |
|
| Cost of providing services: | |
|
| |
|
|
| Salaries and benefits | — |
| — |
| 18,070 |
| 8,838 |
| — |
| — |
| 26,908 |
| — |
| — |
| 26,908 |
| — |
| — |
| 17,579 |
| 8,936 |
| — |
| — |
| 26,515 |
| — |
| — |
| 26,515 |
|
| Occupancy | — |
| — |
| 7,643 |
| 5,677 |
| — |
| — |
| 13,320 |
| — |
| — |
| 13,320 |
| — |
| — |
| 7,875 |
| 5,647 |
| — |
| — |
| 13,522 |
| — |
| — |
| 13,522 |
|
| Office | — |
| — |
| 4,247 |
| 1,285 |
| — |
| — |
| 5,532 |
| — |
| — |
| 5,532 |
| — |
| — |
| 5,586 |
| 1,740 |
| — |
| — |
| 7,326 |
| — |
| — |
| 7,326 |
|
| Other store operating expenses | — |
| — |
| 11,254 |
| 881 |
| 466 |
| — |
| 12,601 |
| — |
| — |
| 12,601 |
| — |
| — |
| 10,650 |
| 1,244 |
| 590 |
| — |
| 12,484 |
| — |
| — |
| 12,484 |
|
| Advertising | — |
| — |
| 12,409 |
| 2,704 |
| — |
| — |
| 15,113 |
| — |
| — |
| 15,113 |
| — |
| — |
| 17,632 |
| 3,717 |
| — |
| — |
| 21,349 |
| — |
| — |
| 21,349 |
|
| Total cost of providing services | — |
| — |
| 53,623 |
| 19,385 |
| 466 |
| — |
| 73,474 |
| — |
| — |
| 73,474 |
| — |
| — |
| 59,322 |
| 21,284 |
| 590 |
| — |
| 81,196 |
| — |
| — |
| 81,196 |
|
| Gross Margin | — |
| — |
| 18,091 |
| 13,298 |
| 45,959 |
| — |
| 77,348 |
| — |
| — |
| 77,348 |
| — |
| — |
| 23,549 |
| 12,670 |
| 24,375 |
| — |
| 60,594 |
| — |
| — |
| 60,594 |
|
| Operating (income) expense: | |
|
| |
|
|
| Corporate, district and other expenses | 458 |
| 18 |
| 25,383 |
| 4,759 |
| 46 |
| — |
| 30,664 |
| 2,316 |
| — |
| 32,980 |
| (886 | ) | 48 |
| 20,663 |
| 5,134 |
| 60 |
| — |
| 25,019 |
| 2,476 |
| — |
| 27,495 |
|
| Intercompany management fee | — |
| — |
| (6,920 | ) | 3,281 |
| 3,639 |
| — |
| — |
| — |
| — |
| — |
| — |
| — |
| (6,761 | ) | 2,516 |
| 4,245 |
| — |
| — |
| — |
| — |
| — |
|
| Interest expense | 16,585 |
| — |
| (60 | ) | 7 |
| 3,940 |
| — |
| 20,472 |
| — |
| — |
| 20,472 |
| 12,503 |
| — |
| (149 | ) | (38 | ) | 5,276 |
| — |
| 17,592 |
| 5,811 |
| — |
| 23,403 |
|
| Intercompany interest (income) expense | — |
| (904 | ) | (180 | ) | 1,084 |
| — |
| — |
| — |
| — |
| — |
| — |
| — |
| (916 | ) | (455 | ) | 1,371 |
| — |
| — |
| — |
| — |
| — |
| — |
|
| Loss on extinguishment of debt | — |
| — |
| — |
| — |
| — |
| — |
| — |
| — |
| — |
| — |
| 69,200 |
| — |
| — |
| — |
| — |
| — |
| 69,200 |
| — |
| — |
| 69,200 |
|
| Total operating expense | 17,043 |
| (886 | ) | 18,223 |
| 9,131 |
| 7,625 |
| — |
| 51,136 |
| 2,316 |
| — |
| 53,452 |
| 80,817 |
| (868 | ) | 13,298 |
| 8,983 |
| 9,581 |
| — |
| 111,811 |
| 8,287 |
| — |
| 120,098 |
|
| (Loss) income from continuing operations before income taxes | (17,043 | ) | 886 |
| (132 | ) | 4,167 |
| 38,334 |
| — |
| 26,212 |
| (2,316 | ) | — |
| 23,896 |
| (80,817 | ) | 868 |
| 10,251 |
| 3,687 |
| 14,794 |
| — |
| (51,217 | ) | (8,287 | ) | — |
| (59,504 | ) |
| (Benefit) provision for income tax expense | (5,418 | ) | 13,668 |
| (4,458 | ) | 1,962 |
| — |
| — |
| 5,754 |
| (576 | ) | — |
| 5,178 |
| (17,930 | ) | 6,803 |
| (2,177 | ) | (1,508 | ) | — |
| — |
| (14,812 | ) | (2,102 | ) | — |
| (16,914 | ) |
| Net (loss) income from continuing operations | (11,625 | ) | (12,782 | ) | 4,326 |
| 2,205 |
| 38,334 |
| — |
| 20,458 |
| (1,740 | ) | — |
| 18,718 |
| (62,887 | ) | (5,935 | ) | 12,428 |
| 5,195 |
| 14,794 |
| — |
| (36,405 | ) | (6,185 | ) | — |
| (42,590 | ) |
| Net loss from discontinued operations | — |
| — |
| — |
| (2,743 | ) | — |
| — |
| (2,743 | ) | — |
| — |
| (2,743 | ) | — |
| — |
| — |
| (4,432 | ) | — |
| — |
| (4,432 | ) | — |
| — |
| (4,432 | ) |
| Net (loss) income | (11,625 | ) | (12,782 | ) | 4,326 |
| (538 | ) | 38,334 |
| — |
| 17,715 |
| (1,740 | ) | — |
| 15,975 |
| (62,887 | ) | (5,935 | ) | 12,428 |
| 763 |
| 14,794 |
| — |
| (40,837 | ) | (6,185 | ) | — |
| (47,022 | ) |
| Equity in net income (loss) of subsidiaries: | |
|
| |
|
|
| CFTC | — |
| — |
| — |
| — |
| — |
| — |
| — |
| 20,458 |
| (20,458 | ) | — |
| — |
| — |
| — |
| — |
| — |
| — |
| — |
| (40,837 | ) | 40,837 |
| — |
|
| CURO Intermediate | (12,782 | ) | — |
| — |
| — |
| — |
| 12,782 |
| — |
| — |
| — |
| — |
| (5,935 | ) | — |
| — |
| — |
| — |
| 5,935 |
| — |
| — |
| — |
| — |
|
| Guarantor Subsidiaries | 4,326 |
| — |
| — |
| — |
| — |
| (4,326 | ) | — |
| — |
| — |
| — |
| 12,428 |
| — |
| — |
| — |
| — |
| (12,428 | ) | — |
| — |
| — |
| — |
|
| Non-Guarantor Subsidiaries | 2,205 |
| — |
| — |
| — |
| — |
| (2,205 | ) | — |
| — |
| — |
| — |
| 763 |
| — |
| — |
| — |
| — |
| (763 | ) | — |
| — |
| — |
| — |
|
| SPV Subs | 38,334 |
| — |
| — |
| — |
| — |
| (38,334 | ) | — |
| — |
| — |
| — |
| 14,794 |
| — |
| — |
| — |
| — |
| (14,794 | ) | — |
| — |
| — |
| — |
|
| Net income (loss) attributable to CURO | $ | 20,458 |
| $ | (12,782 | ) | $ | 4,326 |
| $ | (538 | ) | $ | 38,334 |
| $ | (32,083 | ) | $ | 17,715 |
| $ | 18,718 |
| $ | (20,458 | ) | $ | 15,975 |
| |
| Net (loss) income attributable to CURO | | $ | (40,837 | ) | $ | (5,935 | ) | $ | 12,428 |
| $ | 763 |
| $ | 14,794 |
| $ | (22,050 | ) | $ | (40,837 | ) | $ | (47,022 | ) | $ | 40,837 |
| $ | (47,022 | ) |
CURO GROUP HOLDINGS CORP. AND SUBSIDIARIES
NOTES TO CONDENSED CONSOLIDATED FINANCIAL STATEMENTS (continued)
(unaudited)
| | | | Six Months Ended June 30, 2019 | Nine Months Ended September 30, 2019 |
| (dollars in thousands) | Subsidiary
Guarantors | Subsidiary
Non-Guarantors | Canada SPV | CURO | Eliminations | CURO
Consolidated | Subsidiary
Guarantors | Subsidiary
Non-Guarantors | Canada SPV | CURO | Eliminations | CURO
Consolidated |
| Revenue | $ | 436,165 |
| $ | 54,936 |
| $ | 51,138 |
| $ | — |
| $ | — |
| $ | 542,239 |
| $ | 673,234 |
| $ | 84,920 |
| $ | 81,349 |
| $ | — |
| $ | — |
| $ | 839,503 |
|
| Provision for losses | 177,532 |
| 10,443 |
| 26,420 |
| — |
| — |
| 214,395 |
| 280,529 |
| 17,634 |
| 40,099 |
| — |
| — |
| 338,262 |
|
| Net revenue | 258,633 |
| 44,493 |
| 24,718 |
| — |
| — |
| 327,844 |
| 392,705 |
| 67,286 |
| 41,250 |
| — |
| — |
| 501,241 |
|
| Cost of providing services: | | |
| Salaries and benefits | 37,373 |
| 17,414 |
| — |
| — |
| — |
| 54,787 |
| 55,675 |
| 26,574 |
| — |
| — |
| — |
| 82,249 |
|
| Occupancy | 16,043 |
| 12,126 |
| — |
| — |
| — |
| 28,169 |
| 24,292 |
| 17,913 |
| — |
| — |
| — |
| 42,205 |
|
| Office | 7,893 |
| 2,677 |
| — |
| — |
| — |
| 10,570 |
| 12,504 |
| 4,059 |
| — |
| — |
| — |
| 16,563 |
|
| Other costs of providing services | 24,921 |
| 2,153 |
| — |
| — |
| — |
| 27,074 |
| 36,395 |
| 3,522 |
| — |
| — |
| — |
| 39,917 |
|
| Advertising | 17,533 |
| 3,033 |
| — |
| — |
| — |
| 20,566 |
| 31,719 |
| 5,271 |
| — |
| — |
| — |
| 36,990 |
|
| Total cost of providing services | 103,763 |
| 37,403 |
| — |
| — |
| — |
| 141,166 |
| 160,585 |
| 57,339 |
| — |
| — |
| — |
| 217,924 |
|
| Gross margin | 154,870 |
| 7,090 |
| 24,718 |
| — |
| — |
| 186,678 |
| 232,120 |
| 9,947 |
| 41,250 |
| — |
| — |
| 283,317 |
|
| Operating (income) expense: | | |
| Operating expense (income): | | |
| Corporate, district and other expenses | 72,304 |
| 11,604 |
| (755 | ) | 4,973 |
| — |
| 88,126 |
| 98,486 |
| 16,900 |
| (283 | ) | 7,940 |
| — |
| 123,043 |
|
| Intercompany management fee | (6,300 | ) | 6,284 |
| 16 |
| — |
| — |
| — |
| (9,576 | ) | 9,553 |
| 23 |
| — |
| — |
| — |
|
| Interest expense | 317 |
| 79 |
| 5,265 |
| 29,052 |
| — |
| 34,713 |
| 575 |
| 103 |
| 7,728 |
| 43,671 |
| — |
| 52,077 |
|
| Loss from equity method investment | | 5,132 |
| — |
| — |
| — |
| — |
| 5,132 |
|
| Intercompany interest (income) expense | (2,393 | ) | 1,770 |
| 623 |
| — |
| — |
| — |
| (3,855 | ) | 2,663 |
| 1,192 |
| — |
| — |
| — |
|
| Total operating expense | 63,928 |
| 19,737 |
| 5,149 |
| 34,025 |
| — |
| 122,839 |
| 90,762 |
| 29,219 |
| 8,660 |
| 51,611 |
| — |
| 180,252 |
|
| Income (loss) from continuing operations before income taxes | 90,942 |
| (12,647 | ) | 19,569 |
| (34,025 | ) | — |
| 63,839 |
| 141,358 |
| (19,272 | ) | 32,590 |
| (51,611 | ) | — |
| 103,065 |
|
| Provision (benefit) for income tax expense | 23,610 |
| 2,129 |
| — |
| (8,240 | ) | — |
| 17,499 |
| 37,309 |
| 4,115 |
| — |
| (12,686 | ) | — |
| 28,738 |
|
| Net income (loss) from continuing operations | 67,332 |
| (14,776 | ) | 19,569 |
| (25,785 | ) | — |
| 46,340 |
| 104,049 |
| (23,387 | ) | 32,590 |
| (38,925 | ) | — |
| 74,327 |
|
| Net loss on discontinued operations | — |
| 7,541 |
| — |
| — |
| — |
| 7,541 |
| — |
| 6,943 |
| — |
| — |
| — |
| 6,943 |
|
| Net (loss) income | 67,332 |
| (7,235 | ) | 19,569 |
| (25,785 | ) | — |
| 53,881 |
| |
| Net income (loss) | | 104,049 |
| (16,444 | ) | 32,590 |
| (38,925 | ) | — |
| 81,270 |
|
| Equity in net income (loss) of subsidiaries: | | |
| CFTC | — |
| — |
| — |
| 79,666 |
| (79,666 | ) | — |
| — |
| — |
| — |
| 120,195 |
| (120,195 | ) | — |
|
| Guarantor Subsidiaries | 67,332 |
| — |
| — |
| — |
| (67,332 | ) | — |
| 104,049 |
| — |
| — |
| — |
| (104,049 | ) | — |
|
| Non-Guarantor Subsidiaries | (7,235 | ) | — |
| — |
| — |
| 7,235 |
| — |
| (16,444 | ) | — |
| — |
| — |
| 16,444 |
| — |
|
| SPV Subs | 19,569 |
| — |
| — |
| — |
| (19,569 | ) | — |
| 32,590 |
| — |
| — |
| — |
| (32,590 | ) | — |
|
| Net income (loss) attributable to CURO | $ | 146,998 |
| $ | (7,235 | ) | $ | 19,569 |
| $ | 53,881 |
| $ | (159,332 | ) | $ | 53,881 |
| $ | 224,244 |
| $ | (16,444 | ) | $ | 32,590 |
| $ | 81,270 |
| $ | (240,390 | ) | $ | 81,270 |
|
CURO GROUP HOLDINGS CORP. AND SUBSIDIARIES
NOTES TO CONDENSED CONSOLIDATED FINANCIAL STATEMENTS (continued)
(unaudited)
| | | | Six Months Ended June 30, 2018 | Nine Months Ended September 30, 2018 |
| (dollars in thousands) | CFTC | CURO Intermediate | Subsidiary Guarantors | Subsidiary Non-Guarantors | SPV Subs | Eliminations | CFTC Consolidated | CURO | Eliminations | CURO Consolidated | CFTC | CURO Intermediate | Subsidiary Guarantors | Subsidiary Non-Guarantors | SPV Subs | Eliminations | CFTC Consolidated | CURO | Eliminations | CURO Consolidated |
| Revenue | $ | — |
| $ | — |
| $ | 246,442 |
| $ | 93,293 |
| $ | 148,277 |
| $ | — |
| $ | 488,012 |
| $ | — |
| $ | — |
| $ | 488,012 |
| $ | — |
| $ | — |
| $ | 387,827 |
| $ | 133,107 |
| $ | 236,560 |
| $ | — |
| $ | 757,494 |
| $ | — |
| $ | — |
| $ | 757,494 |
|
| Provision for losses | — |
| — |
| 82,089 |
| 26,910 |
| 54,231 |
| — |
| 163,230 |
| — |
| — |
| 163,230 |
| — |
| — |
| 140,603 |
| 32,770 |
| 117,549 |
| — |
| 290,922 |
| — |
| — |
| 290,922 |
|
| Net revenue | — |
| — |
| 164,353 |
| 66,383 |
| 94,046 |
| — |
| 324,782 |
| — |
| — |
| 324,782 |
| — |
| — |
| 247,224 |
| 100,337 |
| 119,011 |
| — |
| 466,572 |
| — |
| — |
| 466,572 |
|
| Cost of providing services: | | |
| Salaries and benefits | — |
| — |
| 36,089 |
| 17,737 |
| — |
| — |
| 53,826 |
| — |
| — |
| 53,826 |
| — |
| — |
| 53,667 |
| 26,674 |
| — |
| — |
| 80,341 |
| — |
| — |
| 80,341 |
|
| Occupancy | — |
| — |
| 15,289 |
| 11,458 |
| — |
| — |
| 26,747 |
| — |
| — |
| 26,747 |
| — |
| — |
| 23,164 |
| 17,105 |
| — |
| — |
| 40,269 |
| — |
| — |
| 40,269 |
|
| Office | — |
| — |
| 9,830 |
| 2,155 |
| — |
| — |
| 11,985 |
| — |
| — |
| 11,985 |
| — |
| — |
| 15,416 |
| 3,895 |
| — |
| — |
| 19,311 |
| — |
| — |
| 19,311 |
|
| Other store operating expenses | — |
| — |
| 23,284 |
| 1,801 |
| 947 |
| — |
| 26,032 |
| — |
| — |
| 26,032 |
| — |
| — |
| 33,934 |
| 3,045 |
| 1,537 |
| — |
| 38,516 |
| — |
| — |
| 38,516 |
|
| Advertising | — |
| — |
| 17,568 |
| 5,430 |
| — |
| — |
| 22,998 |
| — |
| — |
| 22,998 |
| — |
| — |
| 35,200 |
| 9,147 |
| — |
| — |
| 44,347 |
| — |
| — |
| 44,347 |
|
| Total cost of providing services | — |
| — |
| 102,060 |
| 38,581 |
| 947 |
| — |
| 141,588 |
| — |
| — |
| 141,588 |
| — |
| — |
| 161,381 |
| 59,866 |
| 1,537 |
| — |
| 222,784 |
| — |
| — |
| 222,784 |
|
| Gross Margin | — |
| — |
| 62,293 |
| 27,802 |
| 93,099 |
| — |
| 183,194 |
| — |
| — |
| 183,194 |
| — |
| — |
| 85,843 |
| 40,471 |
| 117,474 |
| — |
| 243,788 |
| — |
| — |
| 243,788 |
|
| Operating (income) expense: | | |
| Operating expense (income): | | |
| Corporate, district and other expenses | 906 |
| 25 |
| 53,375 |
| 9,656 |
| 76 |
| — |
| 64,038 |
| 4,371 |
| — |
| 68,409 |
| 20 |
| 73 |
| 74,038 |
| 14,789 |
| 137 |
| — |
| 89,057 |
| 6,847 |
| — |
| 95,904 |
|
| Intercompany management fee | — |
| — |
| (13,822 | ) | 6,775 |
| 7,047 |
| — |
| — |
| — |
| — |
| — |
| — |
| — |
| (19,718 | ) | 8,425 |
| 11,293 |
| — |
| — |
| — |
| — |
| — |
|
| Interest expense | 34,907 |
| — |
| (172 | ) | 64 |
| 8,027 |
| — |
| 42,826 |
| — |
| — |
| 42,826 |
| 47,410 |
| — |
| (321 | ) | 26 |
| 13,303 |
| — |
| 60,418 |
| 5,811 |
| — |
| 66,229 |
|
| Intercompany interest (income) expense | — |
| (1,784 | ) | (259 | ) | 2,043 |
| — |
| — |
| — |
| — |
| — |
| — |
| — |
| (2,700 | ) | (526 | ) | 3,226 |
| — |
| — |
| — |
| — |
| — |
| — |
|
| Loss on extinguishment of debt | 11,683 |
| — |
| — |
| — |
| — |
| — |
| 11,683 |
| — |
| — |
| 11,683 |
| 80,883 |
| — |
| — |
| — |
| — |
| — |
| 80,883 |
| — |
| — |
| 80,883 |
|
| Total operating expense | 47,496 |
| (1,759 | ) | 39,122 |
| 18,538 |
| 15,150 |
| — |
| 118,547 |
| 4,371 |
| — |
| 122,918 |
| 128,313 |
| (2,627 | ) | 53,473 |
| 26,466 |
| 24,733 |
| — |
| 230,358 |
| 12,658 |
| — |
| 243,016 |
|
| (Loss) income from continuing operations before income taxes | (47,496 | ) | 1,759 |
| 23,171 |
| 9,264 |
| 77,949 |
| — |
| 64,647 |
| (4,371 | ) | — |
| 60,276 |
| (128,313 | ) | 2,627 |
| 32,370 |
| 14,005 |
| 92,741 |
| — |
| 13,430 |
| (12,658 | ) | — |
| 772 |
|
| (Benefit) provision for income tax expense | (12,259 | ) | 32,165 |
| (6,043 | ) | 3,891 |
| — |
| — |
| 17,754 |
| (1,109 | ) | — |
| 16,645 |
| (30,189 | ) | 38,830 |
| (8,220 | ) | 2,521 |
| — |
| — |
| 2,942 |
| (3,211 | ) | — |
| (269 | ) |
| Net (loss) income from continuing operations | (35,237 | ) | (30,406 | ) | 29,214 |
| 5,373 |
| 77,949 |
| — |
| 46,893 |
| (3,262 | ) | — |
| 43,631 |
| (98,124 | ) | (36,203 | ) | 40,590 |
| 11,484 |
| 92,741 |
| — |
| 10,488 |
| (9,447 | ) | — |
| 1,041 |
|
| Net loss from discontinued operations | — |
| — |
| — |
| (4,364 | ) | — |
| — |
| (4,364 | ) | — |
| — |
| (4,364 | ) | — |
| — |
| — |
| (8,796 | ) | — |
| — |
| (8,796 | ) | — |
| — |
| (8,796 | ) |
| Net (loss) income | (35,237 | ) | (30,406 | ) | 29,214 |
| 1,009 |
| 77,949 |
| — |
| 42,529 |
| (3,262 | ) | — |
| 39,267 |
| (98,124 | ) | (36,203 | ) | 40,590 |
| 2,688 |
| 92,741 |
| — |
| 1,692 |
| (9,447 | ) | — |
| (7,755 | ) |
| Equity in net income (loss) of subsidiaries: | | |
| Equity in net (loss) income of subsidiaries: | | |
| CFTC | — |
| — |
| — |
| — |
| — |
| — |
| — |
| 42,529 |
| (42,529 | ) | — |
| — |
| — |
| — |
| — |
| — |
| — |
| — |
| 1,692 |
| (1,692 | ) | — |
|
| CURO Intermediate | (30,406 | ) | — |
| — |
| — |
| — |
| 30,406 |
| — |
| — |
| — |
| — |
| (36,203 | ) | — |
| — |
| — |
| — |
| 36,203 |
| — |
| — |
| — |
| — |
|
| Guarantor Subsidiaries | 29,214 |
| — |
| — |
| — |
| — |
| (29,214 | ) | — |
| — |
| — |
| — |
| 40,590 |
| — |
| — |
| — |
| — |
| (40,590 | ) | — |
| — |
| — |
| — |
|
| Non-Guarantor Subsidiaries | 1,009 |
| — |
| — |
| — |
| — |
| (1,009 | ) | — |
| — |
| — |
| — |
| 2,688 |
| — |
| — |
| — |
| — |
| (2,688 | ) | — |
| — |
| — |
| — |
|
| SPV Subs | 77,949 |
| — |
| — |
| — |
| — |
| (77,949 | ) | — |
| — |
| — |
| — |
| 92,741 |
| — |
| — |
| — |
| — |
| (92,741 | ) | — |
| — |
| — |
| — |
|
| Net income (loss) attributable to CURO | $ | 42,529 |
| $ | (30,406 | ) | $ | 29,214 |
| $ | 1,009 |
| $ | 77,949 |
| $ | (77,766 | ) | $ | 42,529 |
| $ | 39,267 |
| $ | (42,529 | ) | $ | 39,267 |
| $ | 1,692 |
| $ | (36,203 | ) | $ | 40,590 |
| $ | 2,688 |
| $ | 92,741 |
| $ | (99,816 | ) | $ | 1,692 |
| $ | (7,755 | ) | $ | (1,692 | ) | $ | (7,755 | ) |
CURO GROUP HOLDINGS CORP. AND SUBSIDIARIES
NOTES TO CONDENSED CONSOLIDATED FINANCIAL STATEMENTS (continued)
(unaudited)
Condensed Consolidating Statements of Cash Flows
| |
| Six Months Ended June 30, 2019 | Nine Months Ended September 30, 2019 |
| (dollars in thousands) | Subsidiary Guarantors | Subsidiary Non-Guarantors | Canada SPV | CURO | Eliminations | CURO Consolidated | Subsidiary Guarantors | Subsidiary Non-Guarantors | Canada SPV | CURO | Eliminations | CURO Consolidated |
| Cash flows from operating activities |
|
|
|
|
|
| | |
| Net cash provided by (used in) continuing operating activities | $ | 204,323 |
| $ | 10,929 |
| $ | 93,690 |
| $ | 1,833 |
| $ | 1,544 |
| $ | 312,319 |
| |
| Cash flows from operating activities: | |
|
|
|
|
|
| |
| Net cash provided by continuing operating activities | | $ | 273,564 |
| $ | 17,201 |
| $ | 119,898 |
| $ | 52,311 |
| $ | 1,319 |
| $ | 464,293 |
|
| Net cash used in discontinued operating activities | — |
| (504 | ) | — |
| — |
| — |
| (504 | ) | — |
| (504 | ) | — |
| — |
| — |
| (504 | ) |
| Cash flows from investing activities: |
|
|
|
|
|
| |
|
|
|
|
|
|
|
| |
|
|
| Purchase of property, equipment and software | (4,998 | ) | (1,166 | ) | — |
| — |
| — |
| (6,164 | ) | (7,351 | ) | (1,316 | ) | — |
| — |
| — |
| (8,667 | ) |
| Investment in Cognical Holdings | (4,368 | ) | — |
| — |
| — |
| — |
| (4,368 | ) | |
| Originations of loans, net | (142,871 | ) | (3,227 | ) | (71,101 | ) | — |
| — |
| (217,199 | ) | (261,073 | ) | (11,042 | ) | (102,238 | ) | — |
| — |
| (374,353 | ) |
| Net cash (used in) provided by continuing investing activities | (152,237 | ) | (4,393 | ) | (71,101 | ) | — |
| — |
| (227,731 | ) | |
| Investment in Zibby | | (8,168 | ) | — |
| — |
| — |
| — |
| (8,168 | ) |
| Net cash used in continuing investing activities | | (276,592 | ) | (12,358 | ) | (102,238 | ) | — |
| — |
| (391,188 | ) |
| Net cash used in discontinued investing activities | — |
| (14,213 | ) | — |
| — |
| — |
| (14,213 | ) | — |
| (14,213 | ) | — |
| — |
| — |
| (14,213 | ) |
| Cash flows from financing activities: |
|
|
|
|
|
| |
|
|
|
|
|
|
|
| |
|
|
| Proceeds from Non-Recourse U.S. SPV facility | — |
| — |
| — |
| — |
| — |
| — |
| |
| Payments on Non-Recourse U.S. SPV facility | — |
| — |
| — |
| — |
| — |
| — |
| |
| Proceeds from Non-Recourse Canada SPV facility | — |
| — |
| 3,750 |
| — |
| — |
| 3,750 |
| — |
| — |
| 15,992 |
| — |
| — |
| 15,992 |
|
| Payments on Non-Recourse Canada SPV facility | — |
| — |
| (24,752 | ) | — |
| — |
| (24,752 | ) | — |
| — |
| (24,835 | ) | — |
| — |
| (24,835 | ) |
| Proceeds from revolving credit facilities | 30,000 |
| 38,002 |
| — |
| — |
| — |
| 68,002 |
| |
| Payments on revolving credit facilities | (50,000 | ) | (38,002 | ) | — |
| — |
| — |
| (88,002 | ) | |
| Proceeds from credit facilities | | 120,000 |
| 59,811 |
| — |
| — |
| — |
| 179,811 |
|
| Payments on credit facilities | | (115,000 | ) | (59,811 | ) | — |
| — |
| — |
| (174,811 | ) |
| Payments on subordinated stockholder debt | — |
| (2,245 | ) | — |
| — |
| — |
| (2,245 | ) | — |
| (2,252 | ) | — |
| — |
| — |
| (2,252 | ) |
| Payments to net share settle RSUs | | — |
| — |
| — |
| (110 | ) | — |
| (110 | ) |
| Proceeds from exercise of stock options | 69 |
| — |
| — |
| (42 | ) | — |
| 27 |
| 87 |
| — |
| — |
| — |
| — |
| 87 |
|
| Debt issuance costs paid | — |
| — |
| (169 | ) | (29 | ) | — |
| (198 | ) | — |
| — |
| (169 | ) | (29 | ) | — |
| (198 | ) |
| Repurchase of common stock | — |
| — |
| — |
| (1,762 | ) | — |
| (1,762 | ) | — |
| — |
| — |
| (52,172 | ) | — |
| (52,172 | ) |
Net cash used in provided by financing activities (1) | (19,931 | ) | (2,245 | ) | (21,171 | ) | (1,833 | ) | — |
| (45,180 | ) | 5,087 |
| (2,252 | ) | (9,012 | ) | (52,311 | ) | — |
| (58,488 | ) |
| | | |
| Effect of exchange rate changes on cash and restricted cash | — |
| 2,444 |
| 561 |
| — |
| (1,544 | ) | 1,461 |
| — |
| 2,114 |
| 409 |
| — |
| (1,319 | ) | 1,204 |
|
| Net increase (decrease) in cash and restricted cash | 32,155 |
| (7,982 | ) | 1,979 |
| — |
| — |
| 26,152 |
| 2,059 |
| (10,012 | ) | 9,057 |
| — |
| — |
| 1,104 |
|
| Cash and restricted cash at beginning of period | 52,397 |
| 34,620 |
| 12,840 |
| — |
| — |
| 99,857 |
| 52,397 |
| 34,620 |
| 12,840 |
| — |
| — |
| 99,857 |
|
| Cash at end of period | $ | 84,552 |
| $ | 26,638 |
| $ | 14,819 |
| $ | — |
| $ | — |
| $ | 126,009 |
| $ | 54,456 |
| $ | 24,608 |
| $ | 21,897 |
| $ | — |
| $ | — |
| $ | 100,961 |
|
(1) Financing activities include continuing operations only and were not impacted by discontinued operations |
CURO GROUP HOLDINGS CORP. AND SUBSIDIARIES
NOTES TO CONDENSED CONSOLIDATED FINANCIAL STATEMENTS (continued)
(unaudited)
| | | | Six Months Ended June 30, 2018 | | Nine Months Ended September 30, 2018 |
| (dollars in thousands) | CFTC | CURO Intermediate | Subsidiary Guarantors | Subsidiary Non-Guarantors | SPV Subs | Eliminations | CFTC Consolidated | CURO | CURO
Consolidated | CFTC | Subsidiary Guarantors | Subsidiary Non-Guarantors | SPV Subs | Eliminations | CFTC Consolidated | CURO | CURO
Consolidated |
| Cash flows from operating activities: | | |
| Net cash provided (used) in continuing operating activities | $ | 87,848 |
| $ | — |
| $ | 38,259 |
| $ | 53,104 |
| $ | 67,767 |
| $ | 12,305 |
| $ | 259,283 |
| $ | (12,550 | ) | $ | 246,733 |
| |
| Net cash provided by (used in) continuing operating activities | | $ | 628,468 |
| $ | 167,265 |
| $ | (5,013 | ) | $ | 221,222 |
| $ | 22,344 |
| $ | 1,034,286 |
| $ | (677,207 | ) | $ | 357,079 |
|
| Net cash provided by (used in) discontinued operating activities | — |
| — |
| — |
| 14,225 |
| — |
| (8,767 | ) | 5,458 |
| — |
| 5,458 |
| — |
| — |
| 23,737 |
| — |
| (18,175 | ) | 5,562 |
| — |
| 5,562 |
|
| Net cash provided by (used in) operating activities | 87,848 |
| — |
| 38,259 |
| 67,329 |
| 67,767 |
| 3,538 |
| 264,741 |
| (12,550 | ) | 252,191 |
| 628,468 |
| 167,265 |
| 18,724 |
| 221,222 |
| 4,169 |
| 1,039,848 |
| (677,207 | ) | 362,641 |
|
| Cash flows from investing activities: | | |
| Purchase of property, equipment and software | — |
| — |
| (1,983 | ) | (974 | ) | — |
| — |
| (2,957 | ) | — |
| (2,957 | ) | — |
| (6,466 | ) | (1,564 | ) | — |
| — |
| (8,030 | ) | — |
| (8,030 | ) |
| Originations of loans, net | — |
| — |
| (84,640 | ) | (48,795 | ) | (61,201 | ) | — |
| (194,636 | ) | — |
| (194,636 | ) | — |
| (162,031 | ) | (558 | ) | (249,846 | ) | — |
| (412,435 | ) | — |
| (412,435 | ) |
| Investment in Cognical Holdings | (958 | ) | — |
| — |
| — |
| — |
| — |
| (958 | ) | — |
| (958 | ) | |
| Net cash (used in) provided by continuing investing activities | (958 | ) | — |
| (86,623 | ) | (49,769 | ) | (61,201 | ) | — |
| (198,551 | ) | — |
| (198,551 | ) | |
| Net cash provided by (used in) discontinued investing activities | — |
| — |
| — |
| (14,349 | ) | — |
| — |
| (14,349 | ) | — |
| (14,349 | ) | |
| Net cash provided by (used in) investing activities | (958 | ) | — |
| (86,623 | ) | (64,118 | ) | (61,201 | ) | — |
| (212,900 | ) | — |
| (212,900 | ) | |
| Investment in Zibby | | (958 | ) | — |
| — |
| — |
| — |
| (958 | ) | — |
| (958 | ) |
| Net cash used in continuing investing activities | | (958 | ) | (168,497 | ) | (2,122 | ) | (249,846 | ) | — |
| (421,423 | ) | — |
| (421,423 | ) |
| Net cash used in discontinued investing activities | | — |
| — |
| (24,481 | ) | — |
| — |
| (24,481 | ) | — |
| (24,481 | ) |
| Net cash used in investing activities | | (958 | ) | (168,497 | ) | (26,603 | ) | (249,846 | ) | — |
| (445,904 | ) | — |
| (445,904 | ) |
| Cash flows from financing activities: | | |
| Proceeds from Non-Recourse U.S. SPV facility | — |
| — |
| — |
| — |
| 13,000 |
| — |
| 13,000 |
| — |
| 13,000 |
| |
| Payments on Non-Recourse U.S. SPV facility | — |
| — |
| — |
| — |
| (19,163 | ) | — |
| (19,163 | ) | — |
| (19,163 | ) | |
| Proceeds from revolving credit facilities | 10,000 |
| — |
| — |
| 8,798 |
| — |
| — |
| 18,798 |
| — |
| 18,798 |
| |
| Payments on revolving credit facilities | (10,000 | ) | — |
| — |
| (8,798 | ) | — |
| — |
| (18,798 | ) | — |
| (18,798 | ) | |
| Proceeds from Non-Recourse U.S. and Canada SPV facilities | | — |
| — |
| — |
| 106,949 |
| — |
| 106,949 |
| — |
| 106,949 |
|
| Payments on Non-Recourse U.S. and Canada SPV facilities | | — |
| — |
| — |
| (61,590 | ) | — |
| (61,590 | ) | — |
| (61,590 | ) |
| Proceeds from credit facilities | | 39,000 |
| — |
| 26,169 |
| — |
| — |
| 65,169 |
| — |
| 65,169 |
|
| Payments on credit facilities | | (10,000 | ) | — |
| (26,169 | ) | — |
| — |
| (36,169 | ) | — |
| (36,169 | ) |
| Net proceeds from issuance of common stock | — |
| — |
| — |
| — |
| — |
| — |
| — |
| 12,431 |
| 12,431 |
| 11,549 |
| — |
| — |
| — |
| — |
| 11,549 |
| — |
| 11,549 |
|
| Proceeds from exercise of stock options | — |
| — |
| — |
| — |
| — |
| — |
| — |
| 39 |
| 39 |
| 408 |
| — |
| — |
| — |
| — |
| 408 |
| — |
| 408 |
|
| Payments on 12.00% Senior Secured Notes | (77,500 | ) | — |
| — |
| — |
| — |
| — |
| (77,500 | ) | — |
| (77,500 | ) | (605,000 | ) | — |
| — |
| — |
| — |
| (605,000 | ) | — |
| (605,000 | ) |
| Payments of call premiums from early debt extinguishments | (9,300 | ) | — |
| — |
| — |
| — |
| — |
| (9,300 | ) | — |
| (9,300 | ) | (63,350 | ) | — |
| — |
| — |
| — |
| (63,350 | ) | — |
| (63,350 | ) |
| Debt issuance costs paid | (90 | ) | — |
| — |
| (78 | ) | — |
| — |
| (168 | ) | — |
| (168 | ) | (117 | ) | — |
| — |
| (4,527 | ) | — |
| (4,644 | ) | (12,873 | ) | (17,517 | ) |
Net cash (used in) provided by financing activities (1) | (86,890 | ) | — |
| — |
| (78 | ) | (6,163 | ) | — |
| (93,131 | ) | 12,470 |
| (80,661 | ) | (627,510 | ) | — |
| — |
| 40,832 |
| — |
| (586,678 | ) | 677,127 |
| 90,449 |
|
| | | |
| Effect of exchange rate changes on cash | — |
| — |
| — |
| (651 | ) | — |
| (3,538 | ) | (4,189 | ) | — |
| (4,189 | ) | — |
| — |
| 61 |
| 28 |
| (4,169 | ) | (4,080 | ) | — |
| (4,080 | ) |
| Net (decrease) increase in cash and restricted cash | — |
| — |
| (48,364 | ) | 2,482 |
| 403 |
| — |
| (45,479 | ) | (80 | ) | (45,559 | ) | — |
| (1,232 | ) | (7,818 | ) | 12,236 |
| — |
| 3,186 |
| (80 | ) | 3,106 |
|
| Cash and restricted cash at beginning of period | — |
| — |
| 119,056 |
| 48,484 |
| 6,871 |
| — |
| 174,411 |
| 80 |
| 174,491 |
| — |
| 119,056 |
| 48,484 |
| 6,871 |
| — |
| 174,411 |
| 80 |
| 174,491 |
|
| Cash and restricted cash at end of period | — |
| — |
| 70,692 |
| 50,966 |
| 7,274 |
| — |
| 128,932 |
| — |
| 128,932 |
| — |
| 117,824 |
| 40,666 |
| 19,107 |
| — |
| 177,597 |
| — |
| 177,597 |
|
| Less: Cash and restricted cash at end of period of Discontinued Operations | — |
| — |
| — |
| 12,460 |
| — |
| — |
| 12,460 |
| — |
| 12,460 |
| — |
| — |
| 11,303 |
| — |
| — |
| 11,303 |
| — |
| 11,303 |
|
| Cash and restricted cash at end of period of Continuing Operations | $ | — |
| $ | — |
| $ | 70,692 |
| $ | 38,506 |
| $ | 7,274 |
| $ | — |
| $ | 116,472 |
| $ | — |
| $ | 116,472 |
| $ | — |
| $ | 117,824 |
| $ | 29,363 |
| $ | 19,107 |
| $ | — |
| $ | 166,294 |
| $ | — |
| $ | 166,294 |
|
| | |
| (1) Financing activities include continuing operations only and were not impacted by discontinued operations. | | (1) Financing activities include continuing operations only and were not impacted by discontinued operations. |
CURO GROUP HOLDINGS CORP. AND SUBSIDIARIES
NOTES TO CONDENSED CONSOLIDATED FINANCIAL STATEMENTS (continued)
(unaudited)
NOTE 17 – SHARE REPURCHASE PROGRAM
In April 2019, the Company's Board of Directors authorized a share repurchase program providing for the repurchase of up to $50.0 million of its common stock. The repurchase program, which commenced June 2019, will continue until completed or terminated. CURO expects the purchases to be made from time-to-time in the open market, in privately negotiated transactions, or both, at the Company's discretion and subject to market conditions and other factors. Any repurchased shares will be available for use in connection with equity plans or other corporate purposes.
Under this program, the Company has repurchased 244,2002,156,241 shares of common stock through JuneSeptember 30, 2019. The table below summarizes share repurchase activity during the three and sixnine months ended JuneSeptember 30, 2019:2019 (in thousands, except for per share amounts and number of share amounts):
| | | | | Six Months Ended June 30, | | Three Months Ended September 30, 2019 | Nine Months Ended September 30, 2019 |
| (in thousands, except per share amounts and number of share amounts) | | 2019 | |
| Total number of shares repurchased | | 244,200 |
| | 1,912,041 |
| 2,156,241 |
|
| Average price paid per share | | $ | 10.26 |
| | $ | 12.27 |
| $ | 12.04 |
|
| Total value of shares repurchased | | $ | 2,507 |
| | $ | 23,455 |
| $ | 25,962 |
|
| | | | | | |
| Total authorized repurchase amount | | $ | 50,000 |
| |
| Total authorized repurchase amount for the period presented | | | $ | 47,493 |
| $ | 50,000 |
|
| Total value of shares repurchased | | 2,507 |
| | 23,455 |
| 25,962 |
|
| Total remaining authorized repurchase amount | | $ | 47,493 |
| | $ | 24,038 |
| $ | 24,038 |
|
Separately, in August 2019, the Company entered into a Share Repurchase Agreement (the “Share Repurchase Agreement”) with Friedman Fleischer & Lowe Capital Partners II, L.P. and its affiliated investment funds (“FFL”), a related party to the Company. Pursuant to the Share Repurchase Agreement, the Company repurchased 2,000,000 shares of its common stock, par value $0.001 per share, owned by FFL, in a private transaction at a purchase price equal to $13.55 per share of Common Stock. The purchase price was determined by using the Company's closing common stock price on August 29, 2019 of $13.97, less a discount of 3.0%. This transaction occurred outside of the share repurchase program authorized in April 2019.
NOTE 18 – SUBSEQUENT EVENTS
Cognical Investment
Share Repurchase Program
The Company repurchased 989,500868,100 shares from JulyOctober 1, 2019 through August 2, 2019:
November 1, 2019 (in thousands, except per share amounts and number of share amounts):
| | | | | July 1 - August 2 | | October 1 - November 1 |
(in thousands, except per share amounts and number of share amounts)
| | 2019 | |
| | | | 2019 |
| Total number of shares repurchased | | 989,500 |
| | 868,100 |
|
| Average price paid per share | | $ | 10.85 |
| | $ | 13.03 |
|
| Total value of shares repurchased | | $ | 10,731 |
| | $ | 11,311 |
|
ITEM 2. MANAGEMENT'S DISCUSSION AND ANALYSIS OF FINANCIAL CONDITION AND RESULTS OF OPERATIONS
Forward-Looking Statements
The following discussion of financial condition, results of operations, liquidity and capital resources and certain factors that may affect future results, including company-specific, economic and industry-wide factors, should be read in conjunction with our Condensed Consolidated Financial Statements and accompanying notes included herein. This Management’s Discussion and Analysis of Financial Condition and Results of Operations contains forward-looking statements. The matters discussed in these forward-looking statements are subject to risk, uncertainties and other factors that could cause actual results to differ materially from those made, projected or implied in the forward-looking statements. Except as required by applicable law and regulations, we undertake no obligation to update any forward-looking statements or other statements we may make in the following discussion or elsewhere in this document even though these statements may be affected by events or circumstances occurring after the forward-looking statements or other statements were made. Please see “Risk Factors” in our Annual Report on Form 10-K for
the year ended December 31, 2018 filed with the Securities and Exchange Commissions (the "SEC") on March 18, 2019 ("the "2018 Form 10-K") for a discussion of the uncertainties, risks and assumptions associated with these statements.
Overview
We are a growth-oriented, technology-enabled, highly-diversified, multi-channel and multi-product consumer finance company serving a wide range of underbanked consumers in the United States ("U.S."), Canada and, through February 25, 2019, the United Kingdom ("U.K.").
History
CURO was founded in 1997 to meet the growing needs of underbanked consumers looking for access to credit. With more than 20 years of experience, we seek to offer a variety of convenient, easily-accessible financial and loan services in all of our markets.
CURO Financial Technologies Corp., previously known as Speedy Cash Holdings Corp. ("CFTC"), was incorporated in Delaware in July 2008. CURO Group Holdings Corp., previously known as Speedy Group Holdings Corp., was incorporated in Delaware in 2013 as the parent company of CFTC. The terms “CURO," "we,” “our,” “us” and the “Company” refer to CURO Group Holdings Corp. and its directly and indirectly owned subsidiaries as a combined entity, except where otherwise stated. The term "CFTC" refers to CURO Financial Technologies Corp., our wholly-owned subsidiary, and its directly and indirectly owned subsidiaries as a consolidated entity, except where otherwise stated.
Our growth has been fueled by acquisitions in the U.S. and Canada, as well as organically, including the launch of new brands. Recent brand launches include the March 2016 launch of LendDirect, a primarily online Installment and Open-End brand in Alberta, Canada, the June 2017 launch of Avio Credit, an online Installment and Open-End Loan brand in the U.S. market that is currently available in 11 states, and the February 2019 launch of Revolve Finance, discussed immediately below.
Recent Developments
Revolve Finance. In February 2019, we launched Revolve Finance, sponsored by Republic Bank of Chicago, which is being introduced across the Company's U.S. stores. This product provides customers a checking account solution, with FDIC-insured deposits, that combines a Visa-branded debit card, a number of technology-enabled tools and optional overdraft protection.
Share Repurchase Program. Our Board of Directors authorized a share repurchase program in April 2019 providing for the repurchase of up to $50.0 million of our common stock. The repurchase program, which commenced June 2019, will continue until completed or terminated. We expect the purchases to be made from time-to-time in the open market and/or in privately negotiated transactions at our discretion, subject to market conditions and other factors. Any repurchased shares will be available for use in connection with equity plans and for other corporate purposes. Under this program, the Company has repurchased 244,2002,156,241 shares of common stock for total consideration of $26.0 million through JuneSeptember 30, 2019.
FFL Repurchase. In August 2019, the Company entered into a Share Repurchase Agreement (the “Share Repurchase Agreement”) with Friedman Fleischer & Lowe Capital Partners II, L.P. and its affiliated investment funds (“FFL”), a related party. Pursuant to the Share Repurchase Agreement, the Company repurchased 2,000,000 shares of its common stock, par value $0.001 per share, owned by FFL, in a private transaction at a purchase price equal to $13.55 per share of Common Stock. This transaction occurred outside of the share repurchase program authorized in April 2019.
Revolve Finance. In February 2019, we launched Revolve Finance, sponsored by Republic Bank of Chicago, which is being introduced across the Company's U.S. stores. This product provides customers a checking account solution, with FDIC-insured deposits, that combines a Visa-branded debit card, a number of technology-enabled tools and optional overdraft protection.
Bank Partnerships. In September 2019, we terminated the previously disclosed agreement with MetaBank, a wholly-owned subsidiary of Meta Financial Group, Inc.
California Assembly Bill 539: On September 13, 2019, the California legislature passed Assembly Bill 539 which imposes an interest rate cap on all consumer loans between $2,500 and $10,000 of 36%, plus the Federal Funds Rate. On October 10, 2019, Governor Newsom signed the bill into law and it is scheduled to become effective on January 1, 2020. Revenue from California Unsecured and Secured Installment loans amounted to 13.0% of total revenue from continuing operations for the trailing 12 months ended September 30, 2019. See "Regulatory Environment and Compliance" for additional details.
Credit facilitiesFacilities. For recent developments related to our Senior Secured Notes, SPV facilities and other capital resources, see “Management’s Discussion and Analysis of Financial Condition and Results of Operations—Liquidity and Capital Resources.”
U.K. Developments. On February 25, 2019, we announced that a proposed Scheme of Arrangement ("SOA"), as described in our Current Report on Form 8-K filed with the SEC on January 31, 2019, related to Curo Transatlantic Limited and SRC Transatlantic Limited (collectively the "U.K. Subsidiaries"), would not be implemented. We also announced that effective February 25, 2019, in accordance with the provisions of the U.K. Insolvency Act 1986 and as approved by the boards of directors of our U.K. Subsidiaries, insolvency practitioners from KPMG were appointed as administrators ("Administrators") for the U.K. Subsidiaries. The effect of the U.K. Subsidiaries’ entry into administration was to place the management, affairs, business and property of the U.K. Subsidiaries under the direct control of the Administrators. As a result, we deconsolidated the U.K. Subsidiaries as of February 25, 2019 and presented the U.K. Subsidiaries as Discontinued Operations in this Quarterly Report on Form 10-Q ("Form 10-Q").
In our Current Report on Form 8-K filed with the SEC on January 31, 2019, our results of operations included a $30.3 million expense comprised of (i) a proposed $23.6 million fund to settle historical redress claims and (ii) $6.7 million in advisory and other costs that would be required to execute the SOA. We subsequently concluded that pursuant to ASC 450, Contingencies, the SOA did not represent an estimate of loss for the redress loss contingency but instead was offered in ongoing negotiation of a potential compromised settlement with creditors. Therefore, the settlement offered through the SOA did not meet the recognition threshold pursuant to ASC 450 and should not have been accrued as a contingent liability for customer redress claims as of December 31, 2018. Our Current Report on Form 8-K filed with the SEC on March 1, 2019 appropriately included $4.6 million of fourth quarter 2018 redress costs and related charges which represented known claims as of December 31, 2018. See "Controls and Procedures" in our 2018 Form 10-K for further discussion.
Refer to the “Regulatory Environment and Compliance” below for additional information regarding recent regulatory developments that may impact our business.
Discussion of Revenue by Product and Segment and Related Loan Portfolio Performance
Revenue by Product
Year-over-year comparisons for Open-End were affected by the Q1 2019 Open-End Loss Recognition Change. ThroughoutAdditionally, throughout this Form 10-Q,release, we do not include informationremoved financial results of our former U.K. operations for our U.K. Subsidiariesall periods presented, as they wereit was discontinued for accounting and reporting purposes in February 2019. See “Results of Discontinued Operations” within this release for additional information.
The following tables summarize revenue by product, including fees for credit services organization ("CSO"), fees, for the periods indicated.indicated (in thousands, unaudited):
| | | | | For the Three Months Ended | | For the Three Months Ended |
| | | June 30, 2019 | | June 30, 2018 | | September 30, 2019 | | September 30, 2018 |
| (in thousands, unaudited) | | U.S. | Canada | Total | | U.S. | Canada | Total | |
| | | | U.S. | Canada | Total | | U.S. | Canada | Total |
| Unsecured Installment | | $ | 120,482 |
| $ | 1,630 |
| $ | 122,112 |
| | $ | 111,244 |
| $ | 3,692 |
| $ | 114,936 |
| | $ | 135,541 |
| $ | 1,692 |
| $ | 137,233 |
| | $ | 135,028 |
| $ | 2,632 |
| $ | 137,660 |
|
| Secured Installment | | 26,076 |
| — |
| 26,076 |
| | 25,777 |
| — |
| 25,777 |
| | 28,270 |
| — |
| 28,270 |
| | 28,562 |
| — |
| 28,562 |
|
| Open-End | | 32,318 |
| 22,654 |
| 54,972 |
| | 23,261 |
| 3,961 |
| 27,222 |
| | 39,605 |
| 26,515 |
| 66,120 |
| | 27,554 |
| 12,736 |
| 40,290 |
|
| Single-Pay | | 26,425 |
| 19,103 |
| 45,528 |
| | 24,978 |
| 33,347 |
| 58,325 |
| | 29,140 |
| 20,172 |
| 49,312 |
| | 27,792 |
| 22,822 |
| 50,614 |
|
| Ancillary | | 4,745 |
| 10,867 |
| 15,612 |
| | 4,866 |
| 6,043 |
| 10,909 |
| | 4,513 |
| 11,816 |
| 16,329 |
| | 4,337 |
| 8,019 |
| 12,356 |
|
| Total revenue | | $ | 210,046 |
| $ | 54,254 |
| $ | 264,300 |
| | $ | 190,126 |
| $ | 47,043 |
| $ | 237,169 |
| | $ | 237,069 |
| $ | 60,195 |
| $ | 297,264 |
| | $ | 223,273 |
| $ | 46,209 |
| $ | 269,482 |
|
During the three months ended JuneSeptember 30, 2019, total revenue grew $27.1$27.8 million, or 11.4%10.3%, to $264.3$297.3 million, compared to the prior-year period, predominantly driven by growth in Unsecured Installment loans in the U.S. and Open-End loans in both countries. Geographically, total revenue in the U.S. and Canada grew 10.5%6.2% and 15.3%30.3%, respectively. From a product perspective, Unsecured Installment revenues rose 6.2%0.4% in the U.S., drivenoffset by related loan growth whilea decrease in Canada of 35.7% due to the continued transition to Open-End loans. Secured Installment revenues and related receivables were consistent year-over-year. Year-over-year CanadianSingle-Pay loan balances stabilized in Canada sequentially but year-over-year Single-Pay usage and product profitability were impacted negatively impacted by regulatory changes in Ontario effective July 1, 2018, and theour strategic transition of qualifying customers to Open-End loans. Open-End revenues rose 101.9% on organic growth in legacy states and the newer Virginia market in the U.S. Open-End loan growth in Canada was driven primarily by the introduction of Open-End loans in Ontario during the third quarter of 2018. Open-End loans in Canada grew $35.1$18.1 million, or 19.1%8.3%, sequentially (defined within this Form 10-Q as the change from the firstsecond quarter of 2019 to the secondthird quarter of 2019, or comparable periods for 2018 sequential metrics). Single-Pay loan balances stabilizedOpen-End loans in Canada sequentially.grew $98.6 million, or 71.1%, from September 30, 2018, resulting in year-over-year revenue growth of $13.8 million, or 108.2%. U.S. Open-End revenue rose 43.7% on related loan growth of 71.2%. Ancillary revenues increased 43.1%32.2% versus the same quarter a year ago, primarily due to the sale of insurance products to Installment and Open-End loan customers in Canada.
| | | | | For the Six Months Ended | | For the Nine Months Ended |
| | | June 30, 2019 | | June 30, 2018 | | September 30, 2019 | | September 30, 2018 |
| (in thousands, unaudited) | | U.S. | Canada | Total | | U.S. | Canada | Total | |
| | | | U.S. | Canada | Total | | U.S. | Canada | Total |
| Unsecured Installment | | $ | 254,485 |
| $ | 3,405 |
| $ | 257,890 |
| | $ | 231,720 |
| $ | 8,595 |
| $ | 240,315 |
| | $ | 390,026 |
| $ | 5,093 |
| $ | 395,119 |
| | $ | 366,749 |
| $ | 11,227 |
| $ | 377,976 |
|
| Secured Installment | | 53,553 |
| — |
| 53,553 |
| | 52,633 |
| — |
| 52,633 |
| | 81,823 |
| — |
| 81,823 |
| | 81,195 |
| — |
| 81,195 |
|
| Open-End | | 64,911 |
| 42,930 |
| 107,841 |
| | 49,095 |
| 5,350 |
| 54,445 |
| | 104,516 |
| 69,445 |
| 173,961 |
| | 76,649 |
| 18,086 |
| 94,735 |
|
| Single-Pay | | 53,593 |
| 38,696 |
| 92,289 |
| | 51,043 |
| 67,639 |
| 118,682 |
| | 82,733 |
| 58,872 |
| 141,605 |
| | 78,835 |
| 90,461 |
| 169,296 |
|
| Ancillary | | 9,623 |
| 21,043 |
| 30,666 |
| | 10,228 |
| 11,709 |
| 21,937 |
| | 14,136 |
| 32,859 |
| 46,995 |
| | 14,565 |
| 19,727 |
| 34,292 |
|
| Total revenue | | $ | 436,165 |
| $ | 106,074 |
| $ | 542,239 |
| | $ | 394,719 |
| $ | 93,293 |
| $ | 488,012 |
| | $ | 673,234 |
| $ | 166,269 |
| $ | 839,503 |
| | $ | 617,993 |
| $ | 139,501 |
| $ | 757,494 |
|
For the sixnine months ended JuneSeptember 30, 2019, total revenue grew $54.2$82.0 million, or 11.1%10.8%, to $542.2$839.5 million, compared to the prior-year period, predominantly driven by growth in Unsecured Installment loans in the U.S. and Open-End loans in both countries. Geographically, total revenue in the U.S. and Canada grew 10.5%8.9% and 13.7%19.2%, respectively. From a product perspective, Unsecured Installment revenues rose 7.3%6.3% in the U.S., drivenoffset by related loan growth whilea decrease in Canada of 54.6% due to the continued transition to Open-End loans. Secured Installment revenues and related receivables wereremained consistent year-over-year. Year-over-year Canadian Single-Pay usage and product profitability were impacted negatively impactedyear-over-year by regulatory changes in Ontario effective July 1, 2018, and the strategic transition of qualifying customers to Open-End loans. Open-End revenues rose 98.1%83.6% on organic growth in legacy states and the newer Virginia market in the U.S. Open-Endrelated loan growth in Canada was driven primarily by the introduction of Open-End loans in Ontario during the third quarter of 2018.both countries. Ancillary revenues
increased 39.8%37.0% versus the same quarter a year ago, primarily due to the sale of insurance to Installment and Open-End loan customers in Canada.
The following charts present revenue composition, including CSO fees, of the products and services that we currently offer for the periods indicated:
For the three months ended JuneSeptember 30, 2019 and 2018, revenue generated through our online channel was 44%46% and 40%44%, respectively, of consolidated revenue.
For the sixnine months ended JuneSeptember 30, 2019 and 2018, revenue generated through our online channel was 45% and 41%42%, respectively, of consolidated revenue.
Loan Volume and Portfolio Performance Analysis
Unsecured Installment Loans
Unsecured Installment revenue and gross combined loans receivable increaseddecreased from the comparable prior-year quarter due to growththe continued mix shift to Open-End loans in the U.S., primarilyCanada and portfolio optimization in California and Texas.to manage upcoming January 1, 2020 regulatory changes. Unsecured Installment gross combined loans receivable grew $3.1decreased $15.7 million, or 1.4%6.0%, compared to JuneSeptember 30, 2018, despite a decline in Canada of $9.1 million due to mix shift to Open-End loans. In the U.S., Unsecured Installment gross combined loans receivable increased 6.0% year-over-year.2018. Unsecured Installment loans Guaranteed by the Company declined $1.3$5.1 million year-over-year due to a
regulatory change in Ohio, which became effective in April 2019, and the subsequent conversion of Ohio CSO volume to Company-Owned loans, partially offset by growth in Texas.
The net charge-off ("NCO")NCO rate for Company Owned Unsecured Installment gross loans receivables in the secondthird quarter of 2019 increased approximately 281125 bps from the secondthird quarter of 2018 due to geographic mix shift from Canada to the U.S., and increases in U.S. NCO rates due to product and credit policy decisions. Canada Unsecured Installment balances declined
$9.1 million compared to the prior year due to shifting customer preferences from Unsecured Installment to Open-End, while U.S. balances grew $13.5 million due to customer demand. As a result, the U.S. percentage mix of total Company Owned Unsecured Installment gross loans receivable rose from 85.4% last year to 91.3% this year. NCO rates in the U.S. are higher than Canada, so the relative growth in the U.S. balances resulted in an overall increase in the consolidated NCO rate for Company Owned Unsecured Installment loans. In addition, theThe NCO rate in the U.S. rose from 18.6%16.8% in the secondthird quarter of 2018 to 21.3%18.5% in the secondthird quarter of 2019, primarily due primarily to credit-linecredit limit increases. While credit limit increases and expansiongenerally result in modestly higher NCO rates in the related loan vintages, historically the growth in net revenue over the life of such vintages has more than covered the Avio brand. As an immature portfolio, Avio has higher relative NCO rates.
The Unsecured Installment Allowance for loan losses as a percentage of Company Owned Unsecured Installment gross loans receivable ("allowance coverage") increased sequentiallyyear-over-year from 20.8%19.5% as of March 31, 2019,September 30, 2018 to 21.4%21.9% as of JuneSeptember 30, 2019, primarily as a result of related higher NCO ratesrates. Past due receivables as the past due rate rose only 60 bps versusa percentage of total Gross Receivables remained consistent with the same quarter a year ago. Sequentially, the allowance coverage increased slightly, from 21.4% to 21.9% as of September 30, 2019.
NCO rates for Unsecured Installment loans Guaranteed by the Company increased 150improved nearly 60 bps compared to the same quarter in 2018 because of credit-line increases and wind down of the Ohio portfolio.a year ago. The CSO liability for losses remained consistent sequentially from 14.5% to 14.4% last quarter to 14.5% duringfor the secondthird quarter of 2019, as the past-due rate was flat versus the second quarter of last year.2019.
| | | | 2019 | | 2018 | 2019 | | 2018 |
| (dollars in thousands, unaudited) | Second Quarter | First
Quarter | | Fourth
Quarter | Third
Quarter | Second
Quarter | Third Quarter | Second Quarter | First
Quarter | | Fourth
Quarter | Third
Quarter |
| Unsecured Installment loans: | | | | | | |
| Revenue - Company Owned | $ | 59,814 |
| $ | 65,542 |
| | $ | 69,748 |
| $ | 64,146 |
| $ | 54,868 |
| $ | 65,809 |
| $ | 59,814 |
| $ | 65,542 |
| | $ | 69,748 |
| $ | 64,146 |
|
| Provision for losses - Company Owned | 33,514 |
| 33,845 |
| | 39,565 |
| 32,946 |
| 23,219 |
| 31,891 |
| 33,514 |
| 33,845 |
| | 39,565 |
| 32,946 |
|
| Net revenue - Company Owned | $ | 26,300 |
| $ | 31,697 |
| | $ | 30,183 |
| $ | 31,200 |
| $ | 31,649 |
| $ | 33,918 |
| $ | 26,300 |
| $ | 31,697 |
| | $ | 30,183 |
| $ | 31,200 |
|
| Net charge-offs - Company Owned | $ | 31,970 |
| $ | 37,919 |
| | $ | 37,951 |
| $ | 27,308 |
| $ | 26,527 |
| $ | 28,973 |
| $ | 31,970 |
| $ | 37,919 |
| | $ | 37,951 |
| $ | 27,308 |
|
| Revenue - Guaranteed by the Company | $ | 62,298 |
| $ | 70,236 |
| | $ | 75,559 |
| $ | 73,514 |
| $ | 60,069 |
| $ | 71,424 |
| $ | 62,298 |
| $ | 70,236 |
| | $ | 75,559 |
| $ | 73,514 |
|
| Provision for losses - Guaranteed by the Company | 28,336 |
| 27,422 |
| | 37,352 |
| 39,552 |
| 26,974 |
| 36,664 |
| 28,336 |
| 27,422 |
| | 37,352 |
| 39,552 |
|
| Net revenue - Guaranteed by the Company | $ | 33,962 |
| $ | 42,814 |
| | $ | 38,207 |
| $ | 33,962 |
| $ | 33,095 |
| $ | 34,760 |
| $ | 33,962 |
| $ | 42,814 |
| | $ | 38,207 |
| $ | 33,962 |
|
| Net charge-offs - Guaranteed by the Company | $ | 27,486 |
| $ | 30,421 |
| | $ | 38,522 |
| $ | 37,995 |
| $ | 25,667 |
| $ | 35,916 |
| $ | 27,486 |
| $ | 30,421 |
| | $ | 38,522 |
| $ | 37,995 |
|
| Unsecured Installment gross combined loans receivable: | | | | | | |
| Company Owned | $ | 164,722 |
| $ | 161,716 |
| | $ | 190,403 |
| $ | 185,130 |
| $ | 160,285 |
| $ | 174,489 |
| $ | 164,722 |
| $ | 161,716 |
| | $ | 190,403 |
| $ | 185,130 |
|
Guaranteed by the Company (1)(2) | 65,055 |
| 59,740 |
| | 77,451 |
| 75,807 |
| 66,351 |
| 70,704 |
| 65,055 |
| 59,740 |
| | 77,451 |
| 75,807 |
|
Unsecured Installment gross combined loans receivable (1)(2) | $ | 229,777 |
| $ | 221,456 |
| | $ | 267,854 |
| $ | 260,937 |
| $ | 226,636 |
| $ | 245,193 |
| $ | 229,777 |
| $ | 221,456 |
| | $ | 267,854 |
| $ | 260,937 |
|
| Average gross loans receivable: | | | | | | |
Average Unsecured Installment gross loans receivable - Company Owned | $ | 163,219 |
| $ | 176,060 |
| | $ | 187,767 |
| $ | 172,708 |
| $ | 158,121 |
| $ | 169,606 |
| $ | 163,219 |
| $ | 176,060 |
| | $ | 187,767 |
| $ | 172,708 |
|
Average Unsecured Installment gross loans receivable - Guaranteed by the Company | $ | 62,398 |
| $ | 68,596 |
| | $ | 76,629 |
| $ | 71,079 |
| $ | 60,342 |
| $ | 67,880 |
| $ | 62,398 |
| $ | 68,596 |
| | $ | 76,629 |
| $ | 71,079 |
|
| Allowance for loan losses and CSO liability for losses: | | | | | | |
Unsecured Installment Allowance for loan losses (3) | $ | 35,223 |
| $ | 33,666 |
| | $ | 37,716 |
| $ | 36,160 |
| $ | 30,291 |
| $ | 38,127 |
| $ | 35,223 |
| $ | 33,666 |
| | $ | 37,716 |
| $ | 36,160 |
|
Unsecured Installment CSO liability for losses (3) | $ | 9,433 |
| $ | 8,584 |
| | $ | 11,582 |
| $ | 12,750 |
| $ | 11,193 |
| $ | 10,181 |
| $ | 9,433 |
| $ | 8,584 |
| | $ | 11,582 |
| $ | 12,750 |
|
| Unsecured Installment Allowance for loan losses as a percentage of Unsecured Installment gross loans receivable | 21.4 | % | 20.8 | % | | 19.8 | % | 19.5 | % | 18.9 | % | 21.9 | % | 21.4 | % | 20.8 | % | | 19.8 | % | 19.5 | % |
| Unsecured Installment CSO liability for losses as a percentage of Unsecured Installment gross loans guaranteed by the Company | 14.5 | % | 14.4 | % | | 15.0 | % | 16.8 | % | 16.9 | % | 14.4 | % | 14.5 | % | 14.4 | % | | 15.0 | % | 16.8 | % |
| Unsecured Installment past-due balances: | | | | | | |
| Unsecured Installment gross loans receivable | $ | 38,037 |
| $ | 40,801 |
| | $ | 49,087 |
| $ | 49,637 |
| $ | 36,125 |
| $ | 46,537 |
| $ | 38,037 |
| $ | 40,801 |
| | $ | 49,087 |
| $ | 49,637 |
|
| Unsecured Installment gross loans guaranteed by the Company | $ | 10,087 |
| $ | 7,967 |
| | $ | 11,708 |
| $ | 12,120 |
| $ | 10,319 |
| $ | 11,842 |
| $ | 10,087 |
| $ | 7,967 |
| | $ | 11,708 |
| $ | 12,120 |
|
Past-due Unsecured Installment gross loans receivable -- percentage (2) | 23.1 | % | 25.2 | % | | 25.8 | % | 26.8 | % | 22.5 | % | 26.7 | % | 23.1 | % | 25.2 | % | | 25.8 | % | 26.8 | % |
Past-due Unsecured Installment gross loans guaranteed by the Company -- percentage (2) | 15.5 | % | 13.3 | % | | 15.1 | % | 16.0 | % | 15.6 | % | 16.7 | % | 15.5 | % | 13.3 | % | | 15.1 | % | 16.0 | % |
| Unsecured Installment other information: | | | | | | |
| Originations - Company Owned | $ | 102,792 |
| $ | 78,515 |
| | $ | 114,182 |
| $ | 121,415 |
| $ | 114,038 |
| $ | 107,275 |
| $ | 102,792 |
| $ | 78,515 |
| | $ | 114,182 |
| $ | 121,415 |
|
Originations - Guaranteed by the Company (1) | $ | 80,445 |
| $ | 68,899 |
| | $ | 89,319 |
| $ | 91,828 |
| $ | 84,082 |
| $ | 89,644 |
| $ | 80,445 |
| $ | 68,899 |
| | $ | 89,319 |
| $ | 91,828 |
|
| Unsecured Installment ratios: | | | | | | |
| Provision as a percentage of gross loans receivable - Company Owned | 20.3 | % | 20.9 | % | | 20.8 | % | 17.8 | % | 14.5 | % | 18.3 | % | 20.3 | % | 20.9 | % | | 20.8 | % | 17.8 | % |
| Provision as a percentage of gross loans receivable - Guaranteed by the Company | 43.6 | % | 45.9 | % | | 48.2 | % | 52.2 | % | 40.7 | % | 51.9 | % | 43.6 | % | 45.9 | % | | 48.2 | % | 52.2 | % |
(1) Includes loans originated by third-party lenders through CSO programs, which are not included in the Condensed Consolidated Financial Statements. | (1) Includes loans originated by third-party lenders through CSO programs, which are not included in the Condensed Consolidated Financial Statements. | (1) Includes loans originated by third-party lenders through CSO programs, which are not included in the Condensed Consolidated Financial Statements. |
| (2) Non-GAAP measure - Refer to "Non-GAAP Financial Measures" for further details. | |
| (3) Allowance for loan losses is reported as a contra-asset reducing gross loans receivable while the CSO liability for losses is reported as a liability on the Condensed Consolidated Balance Sheets. | |
| (2) Non-GAAP measure. For a description of each non-GAAP metric, see "Non-GAAP Financial Measures." | | (2) Non-GAAP measure. For a description of each non-GAAP metric, see "Non-GAAP Financial Measures." |
| (3) Average gross loans receivable calculated as average of beginning of quarter and end of quarter gross loans receivable. | | (3) Average gross loans receivable calculated as average of beginning of quarter and end of quarter gross loans receivable. |
| (4) Allowance for loan losses is reported as a contra-asset reducing gross loans receivable while the CSO liability for losses is reported as a liability on the Condensed Consolidated Balance Sheets. | | (4) Allowance for loan losses is reported as a contra-asset reducing gross loans receivable while the CSO liability for losses is reported as a liability on the Condensed Consolidated Balance Sheets. |
Secured Installment Loans
Secured Installment revenue and the related gross combined loans receivable balancesbalance as of JuneSeptember 30, 2019 remained consistent year-over-year. Both the NCO and past-due rates decreased modestly year-over-year. Secured Installment Allowance for loan losses and CSO liability for losses as a percentage of Secured Installment gross combined loans receivable decreased sequentiallyyear-over-year from 11.9% last quarter12.4% to 11.5% during11.3% for the secondthird quarter of 2019 basedand decreased sequentially from 11.5% to 11.3% during the third quarter of 2019, primarily onas a result of an 80 bps improvement in the NCO rate improvement.rate.
| | | | 2019 | | 2018 | 2019 | | 2018 |
| (dollars in thousands, unaudited) | Second Quarter | First
Quarter | | Fourth
Quarter | Third
Quarter | Second
Quarter | Third Quarter | Second Quarter | First
Quarter | | Fourth
Quarter | Third
Quarter |
| Secured Installment loans: | | | | | | | |
| Revenue | $ | 26,076 |
| $ | 27,477 |
| | $ | 29,482 |
| $ | 28,562 |
| $ | 25,777 |
| $ | 28,270 |
| $ | 26,076 |
| $ | 27,477 |
| | $ | 29,482 |
| $ | 28,562 |
|
| Provision for losses | 7,821 |
| 7,080 |
| | 12,035 |
| 10,188 |
| 7,650 |
| 8,819 |
| 7,821 |
| 7,080 |
| | 12,035 |
| 10,188 |
|
| Net revenue | $ | 18,255 |
| $ | 20,397 |
| | $ | 17,447 |
| $ | 18,374 |
| $ | 18,127 |
| $ | 19,451 |
| $ | 18,255 |
| $ | 20,397 |
| | $ | 17,447 |
| $ | 18,374 |
|
| Net charge-offs | $ | 7,630 |
| $ | 9,822 |
| | $ | 11,132 |
| $ | 9,285 |
| $ | 9,003 |
| $ | 8,455 |
| $ | 7,630 |
| $ | 9,822 |
| | $ | 11,132 |
| $ | 9,285 |
|
| Secured Installment gross combined loan balances: | | | | | | |
Secured Installment gross combined loans receivable (1)(2) | $ | 87,718 |
| $ | 83,087 |
| | $ | 95,922 |
| $ | 94,194 |
| $ | 87,434 |
| $ | 92,478 |
| $ | 87,718 |
| $ | 83,087 |
| | $ | 95,922 |
| $ | 94,194 |
|
Average Secured Installment gross combined loans receivable | $ | 85,403 |
| $ | 89,505 |
| | $ | 95,058 |
| $ | 90,814 |
| $ | 84,984 |
| $ | 90,098 |
| $ | 85,403 |
| $ | 89,505 |
| | $ | 95,058 |
| $ | 90,814 |
|
Secured Installment Allowance for loan losses and CSO liability for losses (2) | $ | 10,067 |
| $ | 9,874 |
| | $ | 12,616 |
| $ | 11,714 |
| $ | 10,812 |
| $ | 10,431 |
| $ | 10,067 |
| $ | 9,874 |
| | $ | 12,616 |
| $ | 11,714 |
|
| Secured Installment Allowance for loan losses and CSO liability for losses as a percentage of Secured Installment gross combined loans receivable | 11.5 | % | 11.9 | % | | 13.2 | % | 12.4 | % | 12.4 | % | 11.3 | % | 11.5 | % | 11.9 | % | | 13.2 | % | 12.4 | % |
| Secured Installment past-due balances: | | | | | | |
| Secured Installment past-due gross loans receivable and gross loans guaranteed by the Company | $ | 14,570 |
| $ | 13,866 |
| | $ | 17,835 |
| $ | 17,754 |
| $ | 15,246 |
| $ | 17,645 |
| $ | 14,570 |
| $ | 13,866 |
| | $ | 17,835 |
| $ | 17,754 |
|
Past-due Secured Installment gross loans receivable and gross loans guaranteed by the Company -- percentage (1) | 16.6 | % | 16.7 | % | | 18.6 | % | 18.8 | % | 17.4 | % | 19.1 | % | 16.6 | % | 16.7 | % | | 18.6 | % | 18.8 | % |
| Secured Installment other information: | | | | | | |
Originations (3)(4) | $ | 49,051 |
| $ | 33,490 |
| | $ | 49,217 |
| $ | 51,742 |
| $ | 53,597 |
| $ | 45,990 |
| $ | 49,051 |
| $ | 33,490 |
| | $ | 49,217 |
| $ | 51,742 |
|
| Secured Installment ratios: | | | | | | |
| Provision as a percentage of gross combined loans receivable | 8.9 | % | 8.5 | % | | 12.5 | % | 10.8 | % | 8.7 | % | 9.5 | % | 8.9 | % | 8.5 | % | | 12.5 | % | 10.8 | % |
| (1) Non-GAAP measure - Refer to "Non-GAAP Financial Measures" for further details. | |
| (1) Non-GAAP measure. For a description of each non-GAAP metric, see "Non-GAAP Financial Measures." | | (1) Non-GAAP measure. For a description of each non-GAAP metric, see "Non-GAAP Financial Measures." |
(2) Allowance for loan losses is reported as a contra-asset reducing gross loans receivable while the CSO liability for losses is reported as a liability on the Condensed Consolidated Balance Sheets. | | (3) Includes loans originated by third-party lenders through CSO programs, which are not included in the Condensed Consolidated Financial Statements. | |
| (3) Average gross loans receivable calculated as beginning of quarter and end of quarter gross loans receivable. | | (3) Average gross loans receivable calculated as beginning of quarter and end of quarter gross loans receivable. |
| (4) Includes loans originated by third-party lenders through CSO programs, which are not included in the Condensed Consolidated Financial Statements. | | (4) Includes loans originated by third-party lenders through CSO programs, which are not included in the Condensed Consolidated Financial Statements. |
Open-End Loans
Open-End loan balances as of JuneSeptember 30, 2019 increased by $192.3$130.9 million when compared to JuneSeptember 30, 2018, primarily due to the launch of Open-End loanscontinued growth in Canada in late 2017, which accounted for $167.9 million of the year-over-year growth. Also, theCanada. The Q1 2019 Open-End Loss Recognition Change, affecteddiscussed further below, impacted comparability with the inclusion of $35.4as Canada included $19.2 million of past-due Open-End loans as of JuneSeptember 30, 2019.2019 that would have been charged off under the former policy. Sequentially, Open-End balances in Canada grew $35.1$18.1 million sequentially from the first quarter of 2019 ($30.820.9 million on a constant currency basis) due to organic growth of the product.product and the introduction of Open-End loans in British Columbia during the third quarter of 2019. Remaining year-over-year loan growth was driven by the organic growth in seasoned U.S. markets, such as Tennessee and Kansas, and the relatively newnewer Virginia market. Similar to Canada, the Q1 2019 Open-End Loss Recognition Change affected comparability in the U.S., with the inclusion of $26.8 million of past-due Open-End loans as of September 30, 2019 that would have been charged off under the former policy.
The Open-End NCO rate during the secondthird quarter of 2019 was 9.6%9.4%, compared to 16.7%17.1% in the same quarter in the prior year, as a result of a modest improvement in the U.S. and overall mix shift to Canada. NCO rates are lower inseasoning of the Canada and Open-End loans in Canada comprised 77.4% of total Open-End loans as of June 30, 2019, compared to 56.4% as of June 30, 2018.portfolio. Sequentially, on a non-GAAP pro forma basis, as described below, NCO rates improved 170130 bps, primarily on portfolio improvements in Canada.
Q1 2019 Open-End Loss Recognition Change
Effective January 1, 2019, we modified the timeframe in which we charge-off Open-End loans and made related refinements to our loss provisioning methodology. Prior to January 1, 2019, we deemed Open-End loans uncollectible and charged-off when a customer missed a scheduled payment and the loan was considered past due.past-due. Because of our continuing shift to Open-End loans in Canada and our analysis of payment patterns on early-stage versus late-stage delinquencies, we revised our estimates and now consider Open-End loans uncollectible when the loan has been contractually past-due for 90 consecutive days. Consequently, past-due Open-End loans and related accrued interest now remain in loans receivable for 90 days before being charged off against the allowance for loan losses. All recoveries on charged-off loans are credited to the allowance for loan losses. We evaluate the adequacy of the allowance for loan losses compared to the related gross loans receivable balances that include accrued interest.
The aforementioned change was treated as a change in accounting estimate for accounting purposes and applied prospectively beginning January 1, 2019.
The change affects comparability to prior periods as follows:
Gross combined loans receivable:receivable: balances as of JuneSeptember 30, 2019 include $35.4$46.1 million of Open-End loans that are up to 90 days past-due with related accrued interest, while such balances for periods prior to March 31, 2019 do not include any past-due loans.
Revenues:Revenues: for the quarterthree and nine months ended JuneSeptember 30, 2019, gross revenues include interest earned on past-due loan balances of approximately $12$15 million and $35 million, respectively, while revenues in prior-year periods do not include comparable amounts. Gross revenue for the six-month ended June 30, 2019 included interest earned on past-due loan balances of approximately $21 million.
Provision for Losses: prospectively from January 1, 2019, past-due, unpaid balances plus related accrued interest charge-off on day 91. Provision expense is affected by NCOs (total charge-offs less total recoveries) plus changes to the Allowance for loan losses. Because NCOs prospectively include unpaid principal and up to 90 days of related accrued interest, NCO amounts and rates are higher and the Open-End Allowance for loan losses as a percentage of Open-End gross loans receivable is higher. The Open-End Allowance for loan losses as a percentage of Open-End gross loans receivable increased to 18.3%17.2% at JuneSeptember 30, 2019, compared to 10.7%9.8% in the samecomparable prior-year period.
The following table reports 2019 Open-End loan performance including the effect of the Q1 2019 Open-End Loss Recognition Change:
| | | | 2019 | | 2018 | 2019 | | 2018 |
| (dollars in thousands, unaudited) | Second Quarter | First
Quarter | | Fourth
Quarter | Third
Quarter | Second
Quarter | Third Quarter | Second Quarter | First
Quarter | | Fourth
Quarter | Third
Quarter |
| Open-End loans: | | | | | | |
| Revenue | $ | 54,972 |
| $ | 52,869 |
| | $ | 47,228 |
| $ | 40,290 |
| $ | 27,222 |
| $ | 66,120 |
| $ | 54,972 |
| $ | 52,869 |
| | $ | 47,228 |
| $ | 40,290 |
|
| Provision for losses | 29,373 |
| 25,317 |
| | 28,337 |
| 31,686 |
| 14,848 |
| 31,220 |
| 29,373 |
| 25,317 |
| | 28,337 |
| 31,686 |
|
| Net revenue | $ | 25,599 |
| $ | 27,552 |
| | $ | 18,891 |
| $ | 8,604 |
| $ | 12,374 |
| $ | 34,900 |
| $ | 25,599 |
| $ | 27,552 |
| | $ | 18,891 |
| $ | 8,604 |
|
Net charge-offs (1) | $ | 25,151 |
| $ | (1,521 | ) | | $ | 25,218 |
| $ | 23,579 |
| $ | 11,924 |
| $ | 28,202 |
| $ | 25,151 |
| $ | (1,521 | ) | | $ | 25,218 |
| $ | 23,579 |
|
| Open-End gross loan balances: | | | | | | |
| Open-End gross loans receivable | $ | 283,311 |
| $ | 240,790 |
| | $ | 207,333 |
| $ | 184,067 |
| $ | 91,033 |
| $ | 314,971 |
| $ | 283,311 |
| $ | 240,790 |
| | $ | 207,333 |
| $ | 184,067 |
|
Average Open-End gross loans receivable | $ | 262,051 |
| $ | 224,062 |
| | $ | 195,700 |
| $ | 137,550 |
| $ | 71,299 |
| $ | 299,141 |
| $ | 262,051 |
| $ | 224,062 |
| | $ | 195,700 |
| $ | 137,550 |
|
| Open-End allowance for loan losses: | | | | | | |
| Allowance for loan losses | $ | 51,717 |
| $ | 46,963 |
| | $ | 19,901 |
| $ | 18,013 |
| $ | 9,717 |
| $ | 54,233 |
| $ | 51,717 |
| $ | 46,963 |
| | $ | 19,901 |
| $ | 18,013 |
|
| Open-End Allowance for loan losses as a percentage of Open-End gross loans receivable | 18.3 | % | 19.5 | % | | 9.6 | % | 9.8 | % | 10.7 | % | 17.2 | % | 18.3 | % | 19.5 | % | | 9.6 | % | 9.8 | % |
| Open-End past-due balances: | | | | | | |
| Open-End past-due gross loans receivable | $ | 35,395 |
| $ | 32,444 |
| | $ | — |
| $ | — |
| $ | — |
| $ | 46,053 |
| $ | 35,395 |
| $ | 32,444 |
| | $ | — |
| $ | — |
|
| Past-due Open-End gross loans receivable - percentage | 12.5 | % | 13.5 | % | | — | % | — | % | — | % | 14.6 | % | 12.5 | % | 13.5 | % | | — | % | — | % |
(1) Excluding the impact of the Q1 2019 Open-End Loss Recognition Change, NCOs for the first quarter 2019 were $31,788. | |
(1) Average gross loans receivable calculated as average of beginning of quarter and end of quarter gross loans receivable. | | (1) Average gross loans receivable calculated as average of beginning of quarter and end of quarter gross loans receivable. |
In addition, the following table illustrates, on a non-GAAP pro forma basis, the first and second quarter of 2019 quarterly results as if the Q1 2019 Open-End Loss Recognition Change had been applied to our outstanding Open-End loan portfolio as of December 31, 2018. This table is illustrative of retrospective application to determine the NCOs that would have been incurred in the first and second quarterseach quarter of 2019 from the December 31, 2018 loan book. The primary purpose of this pro forma illustration is to provide a representative level of NCO rates from applying the Q1 2019 Open-End Loss Recognition Change.
| | | Pro Forma | | 2019 | | 2019 |
| (dollars in thousands, unaudited) | | Second Quarter | First Quarter | | Third Quarter | Second Quarter | First Quarter |
| Open-End loans: | | | | |
| Revenue | | $ | 54,972 |
| $ | 52,869 |
| | $ | 66,120 |
| $ | 54,972 |
| $ | 52,869 |
|
| Provision for losses | | 29,373 |
| 25,317 |
| | 31,220 |
| 29,373 |
| 25,317 |
|
| Net revenue | | $ | 25,599 |
| $ | 27,552 |
| | $ | 34,900 |
| $ | 25,599 |
| $ | 27,552 |
|
| Net charge-offs | | $ | 29,648 |
| $ | 31,788 |
| | $ | 29,762 |
| $ | 29,648 |
| $ | 31,788 |
|
| Open-End gross loan balances: | | | | |
| Open-End gross loans receivable | | $ | 283,311 |
| $ | 240,790 |
| | $ | 314,971 |
| $ | 283,311 |
| $ | 240,790 |
|
Average Open-End gross loans receivable | | $ | 262,051 |
| $ | 245,096 |
| | $ | 299,141 |
| $ | 262,051 |
| $ | 245,096 |
|
| Net-charge offs as a percentage of average gross loans receivable | | 11.3 | % | 13.0 | % | | 9.9 | % | 11.3 | % | 13.0 | % |
| Open-End allowance for loan losses: | | | | |
| Allowance for loan losses | | $ | 51,717 |
| $ | 46,963 |
| | $ | 54,233 |
| $ | 51,717 |
| $ | 46,963 |
|
| Open-End Allowance for loan losses as a percentage of Open-End gross loans receivable | | 18.3 | % | 19.5 | % | | 17.2 | % | 18.3 | % | 19.5 | % |
| Open-End past-due balances: | | | | |
| Open-End past-due gross loans receivable | | $ | 35,395 |
| $ | 32,444 |
| | $ | 46,053 |
| $ | 35,395 |
| $ | 32,444 |
|
| Past-due Open-End gross loans receivable - percentage | | 12.5 | % | 13.5 | % | | 14.6 | % | 12.5 | % | 13.5 | % |
(1) Average gross loans receivable calculated as average of beginning of quarter and end of quarter gross loans receivable.
| | (1) Average gross loans receivable calculated as average of beginning of quarter and end of quarter gross loans receivable.
|
Single-Pay
Single-Pay revenue and related loans receivable during the three months ended JuneSeptember 30, 2019 declined year-over-yeardecreased compared to the three months ended JuneSeptember 30, 2018, primarily due to regulatory changes in Canada (rate and product changes in Ontario and British Columbia) that accelerated the shift to Open-End loans. The aforementioned Open-End growthproducts. U.S. Single-Pay receivables increased $1.7 million, or 4.1%, offset by a decrease in Canada ($167.9
receivables of $1.0 million, year-over-year), in part, contributed toor 2.8%. Canada Single-Pay balances were stable sequentially from the decrease in Single-Pay loan balances, which shrank year-over-year by $12.2 million.second quarter of 2019. The Single-Pay Allowance for loan losses as a percentage of Single-Pay gross loans receivable increased sequentially from 6.5% to 7.3%, and the NCO rate remained consistent year-over-year.increased 215 bps year-over-year, as a result of mandated extended payment options for certain Canada Single-Pay loans.
| | | | 2019 | | 2018 | 2019 | | 2018 |
| (dollars in thousands, unaudited) | Second Quarter | First
Quarter | | Fourth
Quarter | Third
Quarter | Second
Quarter | Third Quarter | Second Quarter | First
Quarter | | Fourth
Quarter | Third
Quarter |
| Single-pay loans: | | | | | | |
| Revenue | $ | 45,528 |
| $ | 46,761 |
| | $ | 49,696 |
| $ | 50,614 |
| $ | 58,325 |
| $ | 49,312 |
| $ | 45,528 |
| $ | 46,761 |
| | $ | 49,696 |
| $ | 50,614 |
|
| Provision for losses | 12,446 |
| 8,268 |
| | 12,825 |
| 12,757 |
| 13,101 |
| 14,736 |
| 12,446 |
| 8,268 |
| | 12,825 |
| 12,757 |
|
| Net revenue | $ | 33,082 |
| $ | 38,493 |
| | $ | 36,871 |
| $ | 37,857 |
| $ | 45,224 |
| $ | 34,576 |
| $ | 33,082 |
| $ | 38,493 |
| | $ | 36,871 |
| $ | 37,857 |
|
| Net charge-offs | $ | 11,458 |
| $ | 8,610 |
| | $ | 11,838 |
| $ | 12,892 |
| $ | 12,976 |
| $ | 13,913 |
| $ | 11,458 |
| $ | 8,610 |
| | $ | 11,838 |
| $ | 12,892 |
|
| Single-Pay gross loan balances: | | | | | | |
| Single-Pay gross loans receivable | $ | 76,126 |
| $ | 69,753 |
| | $ | 80,823 |
| $ | 77,390 |
| $ | 84,665 |
| $ | 78,039 |
| $ | 76,126 |
| $ | 69,753 |
| | $ | 80,823 |
| $ | 77,390 |
|
Average Single-Pay gross loans receivable | $ | 72,940 |
| $ | 75,288 |
| | $ | 79,107 |
| $ | 81,028 |
| $ | 83,353 |
| $ | 77,083 |
| $ | 72,940 |
| $ | 75,288 |
| | $ | 79,107 |
| $ | 81,028 |
|
| Single-Pay Allowance for loan losses | $ | 4,941 |
| $ | 3,897 |
| | $ | 4,189 |
| $ | 3,293 |
| $ | 3,604 |
| $ | 5,662 |
| $ | 4,941 |
| $ | 3,897 |
| | $ | 4,189 |
| $ | 3,293 |
|
| Single-Pay Allowance for loan losses as a percentage of Single-Pay gross loans receivable | 6.5 | % | 5.6 | % | | 5.2 | % | 4.3 | % | 4.3 | % | 7.3 | % | 6.5 | % | 5.6 | % | | 5.2 | % | 4.3 | % |
(1) Average gross loans receivable calculated as average of beginning of quarter and end of quarter gross loans receivable. | | (1) Average gross loans receivable calculated as average of beginning of quarter and end of quarter gross loans receivable. |
Gross Combined Loans Receivable
The following table summarizesreconciles Company Owned gross loans receivable, a GAAP-basis balance sheet measure, and reconciles it to grossGross combined loans receivable, a non-GAAP measure(1), including. Gross combined loans receivables include loans originated by third-party lenders through CSO programs, which are not included in our Condensed Consolidated Financial Statements but from which we earn revenue and for which we provideby providing a guarantee to the unaffiliated lender:lender (in millions, unaudited):
| | | | As of | As of |
| (in millions, unaudited) | June 30, 2019 | March 31, 2019 | December 31, 2018 | September 30, 2018 | June 30, 2018 | |
| | | September 30, 2019 | June 30, 2019 | March 31, 2019 | December 31, 2018 | September 30, 2018 |
| Company Owned gross loans receivable | $ | 609.6 |
| $ | 553.2 |
| $ | 571.5 |
| $ | 537.8 |
| $ | 420.6 |
| $ | 657.6 |
| $ | 609.6 |
| $ | 553.2 |
| $ | 571.5 |
| $ | 537.8 |
|
| Gross loans receivable Guaranteed by the Company | 67.3 |
| 61.9 |
| 80.4 |
| 78.8 |
| 69.2 |
| 73.1 |
| 67.3 |
| 61.9 |
| 80.4 |
| 78.8 |
|
Gross combined loans receivable (1) | $ | 676.9 |
| $ | 615.1 |
| $ | 651.9 |
| $ | 616.6 |
| $ | 489.8 |
| $ | 730.7 |
| $ | 676.9 |
| $ | 615.1 |
| $ | 651.9 |
| $ | 616.6 |
|
(1) See "Non-GAAP Financial Measures" below for definition and additional information. |
Gross combined loans receivable by product are presented below (year-over-year sequential comparisons for Open-End are affected by the Q1 2019 Open-End Loss Recognition Change):
Gross combined loans receivable increased $187.1$114.1 million, or 38.1%18.5%, to $676.9$730.7 million as of JuneSeptember 30, 2019 from $489.8$616.6 million as of JuneSeptember 30, 2018. Geographically, gross combined loans receivable grew 11.0%5.0% and 120.1%48.1%, respectively, in the U.S. and Canada, explained further by product in the following sections.
Results of Operations - CURO Group Consolidated Operations
Condensed Consolidated Statements of Operations
(in thousands, unaudited)
| | | (in thousands, unaudited) | Three Months Ended June 30, | | Six Months Ended June 30, | |
| 2019 | 2018 | Change $ | Change % | | 2019 | 2018 | Change $ | Change % | |
| | | Three Months Ended September 30, | | Nine Months Ended September 30, |
| 2019 | 2018 | Change $ | Change % | | 2019 | 2018 | Change $ | Change % |
| Revenue | $ | 264,300 |
| $ | 237,169 |
| $ | 27,131 |
| 11.4 | % | | $ | 542,239 |
| $ | 488,012 |
| $ | 54,227 |
| 11.1 | % | $ | 297,264 |
| $ | 269,482 |
| $ | 27,782 |
| 10.3 | % | | $ | 839,503 |
| $ | 757,494 |
| $ | 82,009 |
| 10.8 | % |
| Provision for losses | 112,010 |
| 86,347 |
| 25,663 |
| 29.7 | % | | 214,395 |
| 163,230 |
| 51,165 |
| 31.3 | % | 123,867 |
| 127,692 |
| (3,825 | ) | (3.0 | )% | | 338,262 |
| 290,922 |
| 47,340 |
| 16.3 | % |
| Net revenue | 152,290 |
| 150,822 |
| 1,468 |
| 1.0 | % | | 327,844 |
| 324,782 |
| 3,062 |
| 0.9 | % | 173,397 |
| 141,790 |
| 31,607 |
| 22.3 | % | | 501,241 |
| 466,572 |
| 34,669 |
| 7.4 | % |
| Advertising costs | 12,780 |
| 15,113 |
| (2,333 | ) | (15.4 | )% | | 20,566 |
| 22,998 |
| (2,432 | ) | (10.6 | )% | 16,424 |
| 21,349 |
| (4,925 | ) | (23.1 | )% | | 36,990 |
| 44,347 |
| (7,357 | ) | (16.6 | )% |
| Non-advertising costs of providing services | 58,329 |
| 58,361 |
| (32 | ) | (0.1 | )% | | 120,600 |
| 118,590 |
| 2,010 |
| 1.7 | % | 60,334 |
| 59,847 |
| 487 |
| 0.8 | % | | 180,934 |
| 178,437 |
| 2,497 |
| 1.4 | % |
| Total cost of providing services | 71,109 |
| 73,474 |
| (2,365 | ) | (3.2 | )% | | 141,166 |
| 141,588 |
| (422 | ) | (0.3 | )% | 76,758 |
| 81,196 |
| (4,438 | ) | (5.5 | )% | | 217,924 |
| 222,784 |
| (4,860 | ) | (2.2 | )% |
| Gross margin | 81,181 |
| 77,348 |
| 3,833 |
| 5.0 | % | | 186,678 |
| 183,194 |
| 3,484 |
| 1.9 | % | 96,639 |
| 60,594 |
| 36,045 |
| 59.5 | % | | 283,317 |
| 243,788 |
| 39,529 |
| 16.2 | % |
| | | | | | | | | | | |
| Operating expense | | | | | | | | | | |
| Corporate, district and other expenses | 39,038 |
| 32,980 |
| 6,058 |
| 18.4 | % | | 88,126 |
| 68,409 |
| 19,717 |
| 28.8 | % | 38,665 |
| 27,495 |
| 11,170 |
| 40.6 | % | | 123,043 |
| 95,904 |
| 27,139 |
| 28.3 | % |
| Interest expense | 17,023 |
| 20,472 |
| (3,449 | ) | (16.8 | )% | | 34,713 |
| 42,826 |
| (8,113 | ) | (18.9 | )% | 17,364 |
| 23,403 |
| (6,039 | ) | (25.8 | )% | | 52,077 |
| 66,229 |
| (14,152 | ) | (21.4 | )% |
| Loss on extinguishment of debt | — |
| — |
| — |
| # |
| | — |
| 11,683 |
| (11,683 | ) | # |
| — |
| 69,200 |
| (69,200 | ) | # |
| | — |
| 80,883 |
| (80,883 | ) | # |
|
| Loss from equity method investment | | 1,384 |
| — |
| 1,384 |
| # |
| | 5,132 |
| — |
| 5,132 |
| # |
|
| Total operating expense | 56,061 |
| 53,452 |
| 2,609 |
| 4.9 | % | | 122,839 |
| 122,918 |
| (79 | ) | (0.1 | )% | 57,413 |
| 120,098 |
| (62,685 | ) | (52.2 | )% | | 180,252 |
| 243,016 |
| (62,764 | ) | (25.8 | )% |
| Income from continuing operations before income taxes | 25,120 |
| 23,896 |
| 1,224 |
| 5.1 | % | | 63,839 |
| 60,276 |
| 3,563 |
| 5.9 | % | |
| Provision for income taxes | 7,453 |
| 5,178 |
| 2,275 |
| 43.9 | % | | 17,499 |
| 16,645 |
| 854 |
| 5.1 | % | |
| Net income from continuing operations | 17,667 |
| 18,718 |
| (1,051 | ) | (5.6 | )% | | 46,340 |
| 43,631 |
| 2,709 |
| 6.2 | % | |
| Net income (loss) from discontinued operations, net of tax | (834 | ) | (2,743 | ) | 1,909 |
| (69.6 | )% | | 7,541 |
| (4,364 | ) | 11,905 |
| # |
| |
| Net income | $ | 16,833 |
| $ | 15,975 |
| $ | 858 |
| 5.4 | % | | $ | 53,881 |
| $ | 39,267 |
| $ | 14,614 |
| 37.2 | % | |
| Net income (loss) from continuing operations before income taxes | | 39,226 |
| (59,504 | ) | 98,730 |
| # |
| | 103,065 |
| 772 |
| 102,293 |
| # |
|
| Provision (benefit) for income taxes | | 11,239 |
| (16,914 | ) | 28,153 |
| # |
| | 28,738 |
| (269 | ) | 29,007 |
| # |
|
| Net income (loss) from continuing operations | | 27,987 |
| (42,590 | ) | 70,577 |
| # |
| | 74,327 |
| 1,041 |
| 73,286 |
| # |
|
| Net (loss) income from discontinued operations, net of tax | | (598 | ) | (4,432 | ) | 3,834 |
| (86.5 | )% | | 6,943 |
| (8,796 | ) | 15,739 |
| # |
|
| Net income (loss) | | $ | 27,389 |
| $ | (47,022 | ) | $ | 74,411 |
| # |
| | $ | 81,270 |
| $ | (7,755 | ) | $ | 89,025 |
| # |
|
| # - Variance greater than 100% or not meaningful | | # - Variance greater than 100% or not meaningful |
For the three months ended JuneSeptember 30, 2019 and 2018
Revenue and Net Revenue
Revenue increased $27.1$27.8 million, or 11.4%10.3%, to $264.3$297.3 million for the three months ended JuneSeptember 30, 2019, from $237.2$269.5 million for the three months ended JuneSeptember 30, 2018. Revenue for the three months ended JuneSeptember 30, 2019 included interest earned on past-due Open-End loan balances of approximately $12$15 million from the Q1 2019 Open-End Loss Recognition Change, offset by a higher provision rate and the higher allowance discussed further below.Change. U.S. revenue increased 10.5%6.2%, driven by volume growth. Canadian revenue increased 15.3% (19.5%30.3% (31.6% on a constant currency basis), as volume growth offset yield compression from negative regulatory impacts on Single-Pay loan rates and the significant product mix-shift to Open-End loans.
Provision for losses increased $25.7decreased $3.8 million, or 29.7%3.0%, to $112.0$123.9 million for the three months ended JuneSeptember 30, 2019, from $86.3$127.7 million for the three months ended JuneSeptember 30, 2018, primarily due to changes in2018. This decrease included incremental provision expense from the allowance coverage inQ1 2019 Open-End Loss Recognition Change, consistent with the second quarter of 2018. The second quarter of 2018 included $11.0 million of provision benefit from changes in allowance coverage rates whereas the second quarter of 2019 included $1.6 million of benefit.incremental revenue impact. Excluding the impact of the allowance coverage change, provision for losses increased $16.3 million, or 16.7%, because of the Q1 2019 Open-End Loss Recognition Change, and increased earning asset volumeprovision expense declined year-over-year, as further describedprimarily due to lower sequential loan growth than in "Segment Analysis" below.the prior-year's quarter. For the three months ended September 30, 2019, gross combined loans receivable grew sequentially by $53.7 million, or 7.9%, compared to sequential growth of $126.8 million, or 25.9% for the three months ended September 30, 2018.
Cost of Providing Services
The total cost of providing services decreased $2.4$4.4 million, or 3.2%5.5%, to $71.1$76.8 million in the three months ended JuneSeptember 30, 2019, compared to $73.5$81.2 million in the three months ended JuneSeptember 30, 2018, primarily because of lower advertising costs. The decline in advertising costs analyzed furtherwas primarily the result of repositioning our California Installment loan portfolio in "Segment Analysis" below.advance of regulatory changes and mix-shift, and stability in our Canadian portfolio following the Ontario deployment of Open-End loans in the third quarter of 2018.
Operating Expenses
Corporate,Excluding share-based compensation of $2.8 million, legal and related costs of $0.9 million and U.K. related costs of $0.3 million, corporate, district and other expenses increased $6.1$8.1 million, or 18.4%30.4%, primarily as a result of a $3.7 million non-cash impairment charge relateddue to higher variable compensation tied to our financial performance.
Our investment in Cognical Holdings, Inc. ("Zibby") and higher performance-based variable compensation. Duringis accounted for under the second quarterequity method. We record our pro rata share of 2019, Zibby conducted an equity capital raise that closed on July 11, 2019, primarily with existing equity holders. We invested cash of $2.8 millionZibby's income or losses in the second quarterincome statement with a corresponding adjustment to the carrying value of 2019 and an additional $4.0 million of cashour investment in July 2019, which"Other" on the Condensed Consolidated Balance Sheet. Estimated losses recorded in aggregate, increased our fully-diluted ownership to 42.3%. Because the offering was at a valuation below previous rounds, the non-cash impairment charge was required. Excluding the Zibby impairment charge, share-based compensation costs in both periods presented and U.K. related costs, operating expenses increased by $1.2 million.
Provision for Income Taxes
The effective income tax rate from continuing operations for the three months ended JuneSeptember 30, 2019 was 29.7%, compared to 21.7.0%$1.4 million and represents our share of losses during the period in which we held a greater than 20% investment, typically considered the threshold for the three months ended June 30, 2018. Excluding the non-tax-deductible impairment of our investment in Zibby, our effective income tax rate from continuing operations for the three months ended June 30, 2019 was 25.8%.equity method accounting.
For the six months ended June 30, 2019 and 2018
Revenue and Net Revenue
Revenue increased $54.2 million, or 11.1%, to $542.2 million for the six months ended June 30, 2019 from $488.0 million for the six months ended June 30, 2018. Revenue for the six months ended June 30, 2019 included interest earned on past-due Open-End loan balances of approximately $21 million from the Q1 2019 Open-End Loss Recognition Change, offset by a higher provision rate and the higher allowance discussed further below. U.S. revenue increased 10.5%, driven by volume growth. Canadian revenue increased 13.7% (18.7% on a constant currency basis), as volume growth offset yield compression from negative regulatory impacts on Single-Pay loan rates and the significant product mix-shift to Open-End loans.Interest Expense
Provision for losses increased $51.2 million, or 31.3%, to $214.4 million for the six months ended June 30, 2019, from $163.2 million for the six months ended June 30, 2018, primarily due to changes in the allowance coverage in the second quarter of 2018. The first half of 2018 included $14.7 million of provision benefit from changes which included allowance coverage rates whereas the first half of 2019 included $1.0 million of benefit. Excluding the impact of the allowance coverage change, provision for losses increased $37.5 million, or 21.1%, because of the Q1 2019 Open-End Loss Recognition Change and increased earning asset volume year-over-year as further described in "Segment Analysis" below.
Cost of Providing Services
The total cost of providing services decreased $0.4 million, or 0.3%, to $141.2 million in the six months ended June 30, 2019, compared to $141.6 million in the six months ended June 30, 2018, primarily because of lower advertising costs, offset by increased loan servicing costs on higher volume.
Operating Expenses
Corporate, district and other expenses increased $19.7 million, or 28.8%, primarily as a result of $8.5 million for obtaining the consent of our holders of the 8.25% Senior Secured Notes and our bondholders associated with discontinuing our U.K. operations and other related U.K. separation costs, $1.8 million of restructuring costs from our reduction-in-force implemented in January 2019, higher professional fees associated with our first year-end for full compliance with Sarbanes-Oxley, and a $3.7 million impairment charge related to our investment in Zibby. Excluding the Zibby impairment charge, share-based compensation costs in both periods presented and U.K. related costs, operating expenses increased by $6.7 million.
Provision for Income Taxes
The effective income tax rate from continuing operations for the six months ended June 30, 2019 was 27.4%, compared to 29.9% for the six months ended June 30, 2018. Excluding the non-tax-deductible impairment of our investment in Zibby, our effective income tax rate from continuing operations for the six months ended June 30, 2019 was 25.9%
Segment Analysis
We report financial results for two reportable segments: the U.S. and Canada. Following is a summary of results of operations for the segment and period indicated:
|
| | | | | | | | | | | | | | | | | | | | | | | |
| U.S. Segment Results | Three Months Ended June 30, | | Six Months Ended June 30, |
| (dollars in thousands, unaudited) | 2019 | 2018 | Change $ | Change % | | 2019 | 2018 | Change $ | Change % |
| Revenue | $ | 210,046 |
| $ | 190,126 |
| $ | 19,920 |
| 10.5 | % | | $ | 436,165 |
| $ | 394,719 |
| $ | 41,446 |
| 10.5 | % |
| Provision for losses | 92,552 |
| 71,987 |
| 20,565 |
| 28.6 | % | | 177,532 |
| 136,320 |
| 41,212 |
| 30.2 | % |
| Net revenue | 117,494 |
| 118,139 |
| (645 | ) | (0.5 | )% | | 258,633 |
| 258,399 |
| 234 |
| 0.1 | % |
| Advertising costs | 11,179 |
| 12,409 |
| (1,230 | ) | (9.9 | )% | | 17,533 |
| 17,568 |
| (35 | ) | (0.2 | )% |
| Non-advertising costs of providing services | 41,248 |
| 41,682 |
| (434 | ) | (1.0 | )% | | 86,230 |
| 85,439 |
| 791 |
| 0.9 | % |
| Total cost of providing services | 52,427 |
| 54,091 |
| (1,664 | ) | (3.1 | )% | | 103,763 |
| 103,007 |
| 756 |
| 0.7 | % |
| Gross margin | 65,067 |
| 64,048 |
| 1,019 |
| 1.6 | % | | 154,870 |
| 155,392 |
| (522 | ) | (0.3 | )% |
| Corporate, district and other expenses | 33,397 |
| 28,221 |
| 5,176 |
| 18.3 | % | | 77,277 |
| 58,753 |
| 18,524 |
| 31.5 | % |
| Interest expense | 14,641 |
| 20,465 |
| (5,824 | ) | (28.5 | )% | | 29,369 |
| 42,762 |
| (13,393 | ) | (31.3 | )% |
| Loss on extinguishment of debt | — |
| — |
| — |
| # |
| | — |
| 11,683 |
| (11,683 | ) | # |
|
| Total operating expense | 48,038 |
| 48,686 |
| (648 | ) | (1.3 | )% | | 106,646 |
| 113,198 |
| (6,552 | ) | (5.8 | )% |
| Segment operating income | 17,029 |
| 15,362 |
| 1,667 |
| 10.9 | % | | 48,224 |
| 42,194 |
| 6,030 |
| 14.3 | % |
| Interest expense | 14,641 |
| 20,465 |
| (5,824 | ) | (28.5 | )% | | 29,369 |
| 42,762 |
| (13,393 | ) | (31.3 | )% |
| Depreciation and amortization | 3,437 |
| 3,379 |
| 58 |
| 1.7 | % | | 7,163 |
| 6,786 |
| 377 |
| 5.6 | % |
| EBITDA | 35,107 |
| 39,206 |
| (4,099 | ) | (10.5 | )% | | 84,756 |
| 91,742 |
| (6,986 | ) | (7.6 | )% |
| Loss on extinguishment of debt | — |
| — |
| — |
| | | — |
| 11,683 |
| (11,683 | ) | |
| Restructuring costs | — |
| — |
| — |
| | | 1,617 |
| — |
| 1,617 |
| |
| Other adjustments | (143 | ) | (66 | ) | (77 | ) | | | (248 | ) | (125 | ) | (123 | ) | |
| U.K. related costs | 679 |
| — |
| 679 |
| | | 8,496 |
| — |
| 8,496 |
| |
| Share-based cash and non-cash compensation | 2,644 |
| 2,181 |
| 463 |
| | | 4,816 |
| 4,023 |
| 793 |
| |
| Impairment of equity method | 3,748 |
| — |
| 3,748 |
| | | 3,748 |
| | 3,748 |
| |
| Adjusted EBITDA | $ | 42,035 |
| $ | 41,321 |
| $ | 714 |
| 1.7 | % | | $ | 103,185 |
| $ | 107,323 |
| $ | (4,138 | ) | (3.9 | )% |
| # - Change greater than 100% or not meaningful. | | | | | |
U.S. Segment Results - For the three months ended June 30, 2019 and 2018
Second quarter 2019 U.S. revenues increased by $19.9 million, or 10.5%, to $210.0 million, compared to the comparable prior-year period. U.S. revenue growth was driven by a $40.6 million, or 11.0%, increase in gross combined loans receivable to $408.3 million at June 30, 2019, compared to $367.7 million at June 30, 2018. Additionally, U.S. revenue for the three months ended June 30, 2019 included interest earned on past-due Open-End loan balances of approximately $10 million from the Q1 2019 Open-End Loss Recognition Change, offset by a related higher provision for losses. Unsecured Installment combined receivables increased year-over-year by $12.2 million, or 6.0%. Open-End receivables increased $24.4 million, or 61.4%, year-over-year led by growth in Virginia, Tennessee and Kansas and inclusion of past-due receivables as a result of the Q1 2019 Open-End Loss Recognition Change. Secured Installment gross combined receivables remained flat compared to the prior-year period, while Single-Pay receivables grew $3.7 million, or 9.9%.
The provision for losses' increase of $20.6 million, or 28.6%, was primarily due to changes in allowance coverage in the second quarter of 2018. The second quarter of 2018 included $9.9 million of provision benefit from changes in the allowance coverage rates, whereas the second quarter of 2019 included $0.3 million of incremental expense. Excluding the impact of the allowance coverage change, provision for losses increased $10.3 million, or 12.6%, because of the Q1 2019 Open-End Loss Recognition Change and increased earning asset volume year-over-year.
U.S. cost of providing services for the three months ended June 30, 2019 was $52.4 million, a decrease of $1.7 million, or 3.1%, compared to $54.1 million for the three months ended June 30, 2018, primarily due to lower advertising costs.
Corporate, district and other operating expenses increased $5.2 million, or 18.3%, compared to the same period in the prior year, primarily due to a $3.7 million impairment charge related to our investment in Zibby, $0.7 million of U.K. disposition-related costs and $1.0 million higher performance-based variable compensation costs. Excluding the Zibby impairment charge, share-based compensation costs in both periods presented and U.K. related costs, operating expenses increased by $0.3 million.
U.S. interestInterest expense for the secondthird quarter of 2019 decreased by $5.8$6.0 million compared to the prior-year period, primarily due to our refinancing activities in 2018. During the third quarter of 2018, we issued $690.0 million of 8.25% Senior Secured Notes and used the proceeds from the issuance to extinguish our $527.5 million 12.00% Senior Secured Notes.Notes and our Non-Recourse U.S. SPV Facility. In addition, we entered
into a Non-Recourse Canada SPV Facility in the third quarter of 2018 with a lower interest rate than our previous Non-Recourse U.S. SPV facility, which we fully repaid with the proceeds from the 8.25% Senior Secured Notes.Facility.
Provision for Income Taxes
The effective income tax rate for the three months ended September 30, 2019 was 28.7%, compared to 28.4% for the three months ended September 30, 2018. The third quarter 2019 effective income tax rate included unfavorable impacts from the non-tax deductible loss on our equity method investment and changes in state income apportionment and a mix shift in taxable income between the U.S. Segment Results - and Canada. Excluding the impact of the loss on equity method investment, the effective tax rate for the three months ended September 30, 2019 was 27.7%.
For the sixnine months ended JuneSeptember 30, 2019 and 2018
For
Revenue and Net Revenue
Revenue increased $82.0 million, or 10.8%, to $839.5 million for the sixnine months ended JuneSeptember 30, 2019 U.S. revenues increased by $41.4from $757.5 million or 10.5%, to $436.2 million. U.S. revenue growth was driven by a $40.6 million, or 11.0%, increase in gross combined loans receivable, to $408.3 million at June 30, 2019, compared to $367.7 million at Junefor the nine months ended September 30, 2018. Additionally, U.S. revenueRevenue for the sixnine months ended JuneSeptember 30, 2019 included interest earned on past-due Open-End loan balances of approximately $18$35 million from the Q1 2019 Open-End Loss Recognition Change, offset by relateda higher provision rate and the higher provisionallowance discussed further below. U.S. revenue increased 8.9%, driven by volume growth. Canadian revenue increased 19.2% (23.1% on a constant currency basis), as volume growth more than offset yield compression from negative regulatory impacts on Single-Pay loan rates and the significant product mix-shift to Open-End loans.
Provision for losses. Unsecured Installment receivableslosses increased year-over-year $12.2$47.3 million, or 6.0%. Open-End receivables increased $24.416.3%, to $338.3 million or 61.4%, year-over-year, led by growth in Virginia, Tennessee and Kansas. Secured Installment gross combined receivables increasedfor the nine months ended September 30, 2019, from $290.9 million for the prior-year period by $0.3 million, or 0.3%, while Single-Pay receivables grew $3.7 million, or 9.9%.
The provision for losses' increase of $41.2 million, or 30.2%, wasnine months ended September 30, 2018, primarily due to changes in allowance coverage in the first half of 2018.Q1 2019 Open-End Loss Recognition Change. The first half ofnine months ended September 30, 2018 included $12.6$14.6 million of provision benefit from changes inwhich included allowance coverage rates whereas the first half ofnine months ended 2019 included $0.8$5.1 million of incremental expense.benefit. Excluding the impact of the allowance coverage change, provision for losses increased $27.7$37.9 million, or 18.6%12.4%, because of the Q1 2019 Open-End Loss Recognition Change and increased earning asset volume year-over-year.year-over-year as further described in "Segment Analysis" below.
U.S.Cost of Providing Services
The total cost of providing services fordecreased $4.9 million, or 2.2%, to $217.9 million in the sixnine months ended JuneSeptember 30, 2019, was $103.8 million, an increase of $0.8 million, or 0.7%, compared to $103.0$222.8 million forin the sixnine months ended JuneSeptember 30, 2018, primarily because of lower advertising costs, offset by increased loan servicing costs on higher volume. The decline in advertising costs was primarily the result of repositioning our California Installment loan portfolio in advance of regulatory changes and mix-shift, and stability in our Canadian portfolio following the Ontario deployment of Open-End loans in the third quarter of 2018.
Operating Expenses
Corporate, district and other operating expenses increased $18.5$27.1 million, or 31.5%28.3%, compared toprimarily as a result of $8.8 million for obtaining the same period inconsent of our holders of the prior year, primarily due to $8.58.25% Senior Secured Notes and our bondholders associated with discontinuing our U.K. operations and other related U.K. separation costs, $2.0 million of U.K. disposition-relatedlegal and related costs a $3.7 million impairment charge related to our investment in Zibby, $3.2 million higher performance-based variable compensation costs, $1.6as described above, $1.8 million of restructuring costs from our reduction-in-force implemented in January 2019 and $0.5$1.5 million higher professional fees.of additional share-based compensation. Excluding the Zibby impairment charge, share-based compensationthese aforementioned costs, in both periods presentedcorporate, district and U.K. related costs, operatingother expenses increased by $5.5 million.$13.0 million, or 14.3%, primarily due to higher professional fees associated with our second year-end for full compliance with Sarbanes-Oxley and higher variable compensation tied to our financial performance.
U.S. interest expense
Our investment in Zibby is accounted for under the equity method. We record our pro rata share of Zibby's income or losses in the income statement with a corresponding adjustment to the carrying value of our investment in "Other" on the Condensed Consolidated Balance Sheet. Our share of estimated losses for the first sixnine months ended September 30, 2019 was $5.1 million, which includes a $3.7 million loss to adjust the Company's carrying value of 2019Zibby. The carrying value was further adjusted by the Company's pro rata share of Zibby's losses during the period in which the Company held a greater than 20% investment, typically considered the threshold for equity method accounting.
Interest Expense
Interest expense decreased by $13.4$14.2 million compared to the prior-year period, primarily due to our refinancing activities in 2018. During the third quarter of 2018, we issued $690.0 million of 8.25% Senior Secured Notes and used the proceeds from the issuance to extinguish our $527.5 million 12.00% Senior Secured Notes.Notes and our Non-Recourse U.S. SPV Facility. In addition, we entered into a Non-Recourse Canada SPV Facility in the third quarter of 2018 with a lower interest rate than our previous Non-Recourse U.S. SPV facility, whichFacility.
Provision for Income Taxes
The effective income tax rate for the nine months ended September 30, 2019 was 27.9%, compared to (34.8%) for the nine months ended September 30, 2018. Excluding the non-tax-deductible loss from our equity method investment, the effective income tax rate from continuing operations for the nine months ended September 30, 2019 was 26.6%. Excluding non-GAAP adjustments to Net income related to the 2017 Tax Act as presented in the reconciliation of Net Income to Adjusted Net Income, the effective income tax rate from continuing operations for the nine months ended September 30, 2018 was 24.1%.
Segment Analysis
We report financial results for two reportable segments: the U.S. and Canada. Following is a summary of results of operations for the segment and period indicated (in thousands, unaudited):
|
| | | | | | | | | | | | | | | | | | | | | | | |
| U.S. Segment Results | Three Months Ended September 30, | | Nine Months Ended September 30, |
| | 2019 | 2018 | Change $ | Change % | | 2019 | 2018 | Change $ | Change % |
| Revenue | $ | 237,069 |
| $ | 223,273 |
| $ | 13,796 |
| 6.2 | % | | $ | 673,234 |
| $ | 617,992 |
| $ | 55,242 |
| 8.9 | % |
| Provision for losses | 102,997 |
| 103,256 |
| (259 | ) | (0.3 | )% | | 280,529 |
| 239,576 |
| 40,953 |
| 17.1 | % |
| Net revenue | 134,072 |
| 120,017 |
| 14,055 |
| 11.7 | % | | 392,705 |
| 378,416 |
| 14,289 |
| 3.8 | % |
| Advertising costs | 14,186 |
| 17,632 |
| (3,446 | ) | (19.5 | )% | | 31,719 |
| 35,200 |
| (3,481 | ) | (9.9 | )% |
| Non-advertising costs of providing services | 42,636 |
| 42,280 |
| 356 |
| 0.8 | % | | 128,866 |
| 127,719 |
| 1,147 |
| 0.9 | % |
| Total cost of providing services | 56,822 |
| 59,912 |
| (3,090 | ) | (5.2 | )% | | 160,585 |
| 162,919 |
| (2,334 | ) | (1.4 | )% |
| Gross margin | 77,250 |
| 60,105 |
| 17,145 |
| 28.5 | % | | 232,120 |
| 215,497 |
| 16,623 |
| 7.7 | % |
| Corporate, district and other expenses | 32,897 |
| 22,360 |
| 10,537 |
| 47.1 | % | | 106,426 |
| 81,113 |
| 25,313 |
| 31.2 | % |
| Interest expense | 14,877 |
| 22,169 |
| (7,292 | ) | (32.9 | )% | | 44,246 |
| 64,931 |
| (20,685 | ) | (31.9 | )% |
| Loss on extinguishment of debt | — |
| 69,200 |
| (69,200 | ) | # |
| | — |
| 80,883 |
| (80,883 | ) | # |
|
| Loss from equity method investment | 1,384 |
| — |
| 1,384 |
| # |
| | 5,132 |
| — |
| 5,132 |
| # |
|
| Total operating expense | 49,158 |
| 113,729 |
| (64,571 | ) | (56.8 | )% | | 155,804 |
| 226,927 |
| (71,123 | ) | (31.3 | )% |
| Segment operating income (loss) | 28,092 |
| (53,624 | ) | 81,716 |
| # |
| | 76,316 |
| (11,430 | ) | 87,746 |
| # |
|
| Interest expense | 14,877 |
| 22,169 |
| (7,292 | ) | (32.9 | )% | | 44,246 |
| 64,931 |
| (20,685 | ) | (31.9 | )% |
| Depreciation and amortization | 3,390 |
| 3,536 |
| (146 | ) | (4.1 | )% | | 10,553 |
| 10,322 |
| 231 |
| 2.2 | % |
| EBITDA | 46,359 |
| (27,919 | ) | 74,278 |
| # |
| | 131,115 |
| 63,823 |
| 67,292 |
| # |
|
| Loss on extinguishment of debt | — |
| 69,200 |
| (69,200 | ) | | | — |
| 80,883 |
| (80,883 | ) | |
| Restructuring costs | — |
| — |
| — |
| | | 1,617 |
| — |
| 1,617 |
| |
| Legal and related costs | 870 |
| (1,297 | ) | 2,167 |
| | | 870 |
| (1,297 | ) | 2,167 |
| |
| Other adjustments | 42 |
| (99 | ) | 141 |
| | | (206 | ) | (224 | ) | 18 |
| |
| U.K. related costs | 348 |
| — |
| 348 |
| | | 8,844 |
| — |
| 8,844 |
| |
| Share-based compensation | 2,771 |
| 2,089 |
| 682 |
| | | 7,587 |
| 6,112 |
| 1,475 |
| |
| Loss from equity method investment | 1,384 |
| — |
| 1,384 |
| | | 5,132 |
| — |
| 5,132 |
| |
| Adjusted EBITDA | $ | 51,774 |
| $ | 41,974 |
| $ | 9,800 |
| 23.3 | % | | $ | 154,959 |
| $ | 149,297 |
| $ | 5,662 |
| 3.8 | % |
| # - Variance greater than 100% or not meaningful. | | | | | |
U.S. Segment Results - For the three months ended September 30, 2019 and 2018
Third quarter 2019 U.S. revenues increased by $13.8 million, or 6.2%, to $237.1 million, compared to the prior-year period. U.S. revenue growth was driven by a $21.0 million, or 5.0%, increase in gross combined loans receivable to $444.0 million at
September 30, 2019, compared to $423.0 million at September 30, 2018. Additionally, U.S. revenue for the three months ended September 30, 2019 included interest earned on past-due Open-End loan balances of approximately $13 million from the Q1 2019 Open-End Loss Recognition Change.
The provision for losses was consistent year-over-year despite the increase in loan receivables. The year-over-year provision change included incremental provision expense from the Q1 2019 Open-End Loss Recognition Change, consistent with the incremental revenue impact. Excluding the impact of the Q1 2019 Open-End Loss Recognition Change, provision expense declined year-over-year due to lower sequential growth in gross loans receivable compared to the prior year, offset by the aforementioned NCO rate increases. U.S. gross combined loans receivable grew $35.7 million, or 8.7%, sequentially during the third quarter of 2019, compared to sequential growth of $55.3 million, or 15.0%, during the prior-year period.
U.S. cost of providing services for the three months ended September 30, 2019 was $56.8 million, a decrease of $3.1 million, or 5.2%, compared to $59.9 million for the three months ended September 30, 2018, primarily due to lower advertising costs associated with repositioning our California Installment loan portfolio in advance of regulatory changes.
Corporate, district and other operating expenses increased $10.5 million, or 47.1%, compared to the same period in the prior year, primarily due to $5.3 million of higher performance-based variable compensation costs, $0.9 million related to certain litigation matters and $0.7 million of additional share-based compensation.
U.S. interest expense for the third quarter of 2019 decreased by $7.3 million compared to the prior-year period, primarily due to our refinancing activities in 2018. During the third quarter of 2018, we fully repaid withissued $690.0 million of 8.25% Senior Secured Notes and used the proceeds from the issuance to extinguish our $527.5 million 12.00% Senior Secured Notes and U.S. SPV facility.
U.S. Segment Results - For the nine months ended September 30, 2019 and 2018
For the nine months ended September 30, 2019, U.S. revenues increased by $55.2 million, or 8.9%, to $673.2 million. U.S. revenue growth was driven by a $21.0 million, or 5.0%, increase in gross combined loans receivable, to $444.0 million at September 30, 2019, compared to $423.0 million at September 30, 2018. Additionally, U.S. revenue for the nine months ended September 30, 2019 included interest earned on past-due Open-End loan balances of approximately $30 million from the Q1 2019 Open-End Loss Recognition Change, offset by related higher provision rate and higher provision for losses.
The provision for losses' increase of $41.0 million, or 17.1%, was primarily due to changes in allowance coverage in the prior year. The nine months ended September 30, 2018 included $12.5 million of provision benefit from changes in allowance coverage rates, whereas the nine months ended September 30, 2019 included $1.7 million of incremental expense. Excluding the impact of the allowance coverage change, provision for losses increased $30.1 million, or 12.0%, because of the Q1 2019 Open-End Loss Recognition Change.
U.S. cost of providing services for the nine months ended September 30, 2019 was $160.6 million, a decrease of $2.3 million, or 1.4%, compared to $162.9 million for the nine months ended September 30, 2018, primarily due to lower advertising costs associated with repositioning our California Installment loan portfolio in advance of regulatory changes.
Corporate, district and other operating expenses increased $25.3 million, or 31.2%, compared to the same period in the prior year, primarily due to $8.8 million of U.K. disposition-related costs, $7.7 million higher performance-based variable compensation costs, $3.1 million higher professional fees and $1.6 million of restructuring costs.
U.S. interest expense for the first nine months of 2019 decreased by $20.7 million compared to the prior-year period, primarily due to our refinancing activities in 2018. During the third quarter of 2018, we issued $690.0 million of 8.25% Senior Secured Notes.Notes and used the proceeds from the issuance to extinguish our $527.5 million 12.00% Senior Secured Notes and our U.S. SPV facility.
| | | Canada Segment Results | Three Months Ended June 30, | | Six Months Ended June 30, | Three Months Ended September 30, | | Nine Months Ended September 30, |
| (dollars in thousands, unaudited) | 2019 | 2018 | Change $ | Change % | | 2019 | 2018 | Change $ | Change % | |
| | | 2019 | 2018 | Change $ | Change % | | 2019 | 2018 | Change $ | Change % |
| Revenue | $ | 54,254 |
| $ | 47,043 |
| $ | 7,211 |
| 15.3 | % | | $ | 106,074 |
| $ | 93,293 |
| $ | 12,781 |
| 13.7 | % | $ | 60,195 |
| $ | 46,209 |
| $ | 13,986 |
| 30.3 | % | | $ | 166,269 |
| $ | 139,502 |
| $ | 26,767 |
| 19.2 | % |
| Provision for losses | 19,458 |
| 14,360 |
| 5,098 |
| 35.5 | % | | 36,863 |
| 26,910 |
| 9,953 |
| 37.0 | % | 20,870 |
| 24,436 |
| (3,566 | ) | (14.6 | )% | | 57,733 |
| 51,346 |
| 6,387 |
| 12.4 | % |
| Net revenue | 34,796 |
| 32,683 |
| 2,113 |
| 6.5 | % | | 69,211 |
| 66,383 |
| 2,828 |
| 4.3 | % | 39,325 |
| 21,773 |
| 17,552 |
| 80.6 | % | | 108,536 |
| 88,156 |
| 20,380 |
| 23.1 | % |
| Advertising costs | 1,601 |
| 2,704 |
| (1,103 | ) | (40.8 | )% | | 3,033 |
| 5,430 |
| (2,397 | ) | (44.1 | )% | 2,238 |
| 3,717 |
| (1,479 | ) | (39.8 | )% | | 5,271 |
| 9,147 |
| (3,876 | ) | (42.4 | )% |
| Non-advertising costs of providing services | 17,081 |
| 16,679 |
| 402 |
| 2.4 | % | | 34,370 |
| 33,151 |
| 1,219 |
| 3.7 | % | 17,698 |
| 17,567 |
| 131 |
| 0.7 | % | | 52,068 |
| 50,718 |
| 1,350 |
| 2.7 | % |
| Total cost of providing services | 18,682 |
| 19,383 |
| (701 | ) | (3.6 | )% | | 37,403 |
| 38,581 |
| (1,178 | ) | (3.1 | )% | 19,936 |
| 21,284 |
| (1,348 | ) | (6.3 | )% | | 57,339 |
| 59,865 |
| (2,526 | ) | (4.2 | )% |
| Gross margin | 16,114 |
| 13,300 |
| 2,814 |
| 21.2 | % | | 31,808 |
| 27,802 |
| 4,006 |
| 14.4 | % | 19,389 |
| 489 |
| 18,900 |
| # |
| | 51,197 |
| 28,291 |
| 22,906 |
| 81.0 | % |
| Corporate, district and other expenses | 5,641 |
| 4,759 |
| 882 |
| 18.5 | % | | 10,849 |
| 9,656 |
| 1,193 |
| 12.4 | % | 5,768 |
| 5,135 |
| 633 |
| 12.3 | % | | 16,617 |
| 14,791 |
| 1,826 |
| 12.3 | % |
| Interest expense | 2,382 |
| 7 |
| 2,375 |
| # |
| | 5,344 |
| 64 |
| 5,280 |
| # |
| 2,487 |
| 1,234 |
| 1,253 |
| # |
| | 7,831 |
| 1,298 |
| 6,533 |
| # |
|
| Total operating expense | 8,023 |
| 4,766 |
| 3,257 |
| 68.3 | % | | 16,193 |
| 9,720 |
| 6,473 |
| 66.6 | % | 8,255 |
| 6,369 |
| 1,886 |
| 29.6 | % | | 24,448 |
| 16,089 |
| 8,359 |
| 52.0 | % |
| Segment operating income | 8,091 |
| 8,534 |
| (443 | ) | (5.2 | )% | | 15,615 |
| 18,082 |
| (2,467 | ) | (13.6 | )% | |
| Segment operating income (loss) | | 11,134 |
| (5,880 | ) | 17,014 |
| # |
| | 26,749 |
| 12,202 |
| 14,547 |
| # |
|
| Interest expense | 2,382 |
| 7 |
| 2,375 |
| # |
| | 5,344 |
| 64 |
| 5,280 |
| # |
| 2,487 |
| 1,234 |
| 1,253 |
| # |
| | 7,831 |
| 1,298 |
| 6,533 |
| # |
|
| Depreciation and amortization | 1,214 |
| 1,091 |
| 123 |
| 11.3 | % | | 2,408 |
| 2,219 |
| 189 |
| 8.5 | % | 1,219 |
| 1,087 |
| 132 |
| 12.1 | % | | 3,627 |
| 3,306 |
| 321 |
| 9.7 | % |
| EBITDA | 11,687 |
| 9,632 |
| 2,055 |
| 21.3 | % | | 23,367 |
| 20,365 |
| 3,002 |
| 14.7 | % | 14,840 |
| (3,559 | ) | 18,399 |
| # |
| | 38,207 |
| 16,806 |
| 21,401 |
| # |
|
| Restructuring costs | — |
| — |
| — |
|
|
| | 135 |
| — |
| 135 |
| | — |
| — |
| — |
|
|
| | 135 |
| — |
| 135 |
| |
| Legal and related costs | | — |
| 119 |
| (119 | ) |
|
| | — |
| 119 |
| (119 | ) |
|
|
| Other adjustments | (33 | ) | 157 |
| (190 | ) | | | (144 | ) | 173 |
| (317 | ) | | 441 |
| 50 |
| 391 |
| | | 297 |
| 223 |
| 74 |
| |
| Adjusted EBITDA | $ | 11,654 |
| $ | 9,789 |
| $ | 1,865 |
| 19.1 | % | | $ | 23,358 |
| $ | 20,538 |
| $ | 2,820 |
| 13.7 | % | $ | 15,281 |
| $ | (3,390 | ) | $ | 18,671 |
| # |
| | $ | 38,639 |
| $ | 17,148 |
| $ | 21,491 |
| # |
|
| # - Change greater than 100% or not meaningful. | # - Change greater than 100% or not meaningful. | | | | | | # - Change greater than 100% or not meaningful. | | | | | |
Canada Segment Results - For the three months ended JuneSeptember 30, 2019 and 2018
Canada revenue increased $7.2$14.0 million, or 15.3%30.3%, to $54.3$60.2 million for the three months ended JuneSeptember 30, 2019, from $47.0$46.2 million in the prior-year period. On a constant currency basis, revenue increased $9.2$14.6 million, or 19.5%31.6%. Revenue growth in Canada was impacted favorably by the significant asset growth and the product transition from Single-Pay and Unsecured Installment loans to Open-End loans. Additionally, Canada revenue for the three months ended JuneSeptember 30, 2019 included interest earned on past-due Open-End loan balances of approximately $2 million from the Q1 2019 Open-End Loss Recognition Change, offset by a higher provision rate and higher provision for losses. Single-Pay yields were negatively affected by regulatory rate changes in Ontario and British Columbia.Change.
Single-Pay revenue decreased $14.2$2.7 million, or 42.7%11.6%, to $19.1$20.2 million for the three months ended JuneSeptember 30, 2019, and Single-Pay receivables decreased $12.2$1.0 million, or 25.8%2.8%, to $35.1 million from $47.3$36.1 million in the prior year. The decreases in Single-Pay revenue and receivables were due to the continued product mix shift in Canada from Single-Pay loans to Open-End loans and by regulatory changes effective January and July 2018 that lowered Single Pay pricing year-over-year.
Canada non-Single-Pay revenue increased $21.5$16.6 million, or 156.7%71.1%, to $35.2$40.0 million compared to $13.7$23.4 million the same quarter a year ago, on $158.8growth of $94.1 million, or 212.5%59.8%, growth in related loan balances. The increase was primarily related to the launcheslaunch of Open-End products in Alberta and Ontario in the fourth quarter of 2017, and significant expansion of the Open-End product in Ontario in late 2018. Additionally, as a result of the increase in Open-End loans, ancillary revenue increased $4.8$3.8 million versus the same quarter a year ago, primarily driven by an increase in sales of insurance to Open-End loan customers.
The provision for losses increased $5.1decreased $3.6 million, or 35.5%14.6%, to $19.5$20.9 million for the three months ended JuneSeptember 30, 2019, compared to $14.4$24.4 million in the prior-year period,period. This decrease included incremental provision expense from the Q1 2019 Open-End Loss Recognition Change, consistent with the incremental revenue impact. Excluding the impact of the Q1 2019 Open-End Loss Recognition Change, provision expense declined year-over-year because of mix shift from Single-Pay loans to Unsecured Installmentlower sequential gross receivable growth and seasoning of the Open-End loans and corresponding higher allowance and therefore provision expense level.loans. Total Open-End and Installment loans grew by $35.2$18.0 million sequentially during the secondthird quarter of 2019, compared to sequential growth of $20.9$82.7 million induring the second quartersame prior-year period. Total Canada NCO rates improved 425 bps year-over-year due to the seasoning of 2018.Open-End loans. On a constant currency basis, provision for losses increaseddecreased by $5.8$3.4 million, or 40.5%13.8%, compared to the prior-year period.
The totalCanada cost of providing services in Canada declined modestly for the three months ended JuneSeptember 30, 2019 was $19.9 million, a decrease of $1.3 million, or 6.3%, compared to $21.3 million for the prior-year period. Advertisingthree months ended September 30, 2019, primarily due to lower advertising costs were lower by $1.1 million, or 40.8%, partially offset by an increasefrom mix-shift and stability in non-advertising costour Canadian portfolio following the Ontario deployment of providing servicesOpen-End loans in the third quarter of $0.4 million.2018. There was no material impact on the cost of providing services from exchange rate changes.
Canada operating expenses increased $3.3$1.9 million, or 68.3%29.6%, to $8.0$8.3 million in the three months ended JuneSeptember 30, 2019 from $4.8$6.4 million in the prior-year period, primarily due to interest expense on the Non-Recourse Canada SPV Facility that began in August 2018.
Canada Segment Results - For the sixnine months ended JuneSeptember 30, 2019 and 2018
Canada revenue increased $12.8$26.8 million, or 13.7%19.2%, to $106.1$166.3 million for the sixnine months ended JuneSeptember 30, 2019 from $93.3$139.5 million in the prior-year period. On a constant currency basis, revenue increased $17.5$32.2 million, or 18.7%23.1%. Revenue growth in Canada was impacted favorably by the significant asset growth and product transition from Single-Pay and Unsecured Installment loans to Open-End loans that have a lower yield. Additionally, Canada revenues for the sixnine months ended JuneSeptember 30, 2019 included interest earned on past-due Open-End loan balances of approximately $3$5 million from the Q1 2019 Open-End Loss Recognition Change, offset by higher provision rate and higher provision for losses. Single-Pay yields were negatively affected by regulatory rate changes in Ontario and British Columbia.
Single-Pay revenue decreased $28.9$31.6 million, or 42.8%34.9%, to $38.7$58.9 million for the sixnine months ended JuneSeptember 30, 2019, and Single-Pay receivables decreased $12.2$1.0 million, or 25.8%2.8%, to $35.1 million from $47.3$36.1 million in the prior year. The decreases in Single-Pay revenue and receivables were due to the continued product mix shift in Canada from Single-Pay loans to Open-End loans and by regulatory changes effective January and July 2018 that lowered Single Pay pricing year-over-year.
CanadianCanada non-Single-Pay revenue increased $41.7$58.4 million, or 162.6%119.0%, to $67.4$107.4 million compared to $25.7$49.0 million for the sameprior-year period, a year ago, on $158.8$94.1 million, or 212.5%59.8%, growth in related loan balances. The increase was primarily related to the launch of Open-End products in Alberta and Ontario in the fourth quarter of 2017, and significant expansion of the Open-End product in Ontario in late 2018. As a result of the increase in Open-End loans, ancillary revenue increased $9.3$13.1 million versus the same period a year ago, primarily driven by an increase in sales of insurance to Open-End loan customers.
The provision for losses increased $10.0$6.4 million, or 37.0%12.4%, to $36.9$57.7 million for the sixnine months ended JuneSeptember 30, 2019 compared to $26.9$51.3 million in the prior-year period primarily due to provisioning on Open-End loans and mix shift from Single-Pay loans and Unsecured Installment to Open-End loans. Total Open-End and Installment loans grew by $35.2$18.1 million sequentially during the secondthird quarter of 2019, compared to sequential growth of $20.9$87.4 million in the secondthird quarter of 2018. On a constant currency basis, provision for losses increased by $11.6$8.3 million, or 43.0%16.1%, compared to the prior-year period.
The total cost of providing services in Canada declined modestlydecreased $2.5 million, or 4.2%, to $57.3 million for the sixnine months ended JuneSeptember 30, 2019 compared to $59.9 million in the prior-year period. Advertising costs decreased by $2.4$3.9 million, or 44.1%42.4%, primarily from mix-shift and stability in our Canadian portfolio following the Ontario deployment of Open-End loans in the third quarter of 2018, partially offset by an increase in non-advertising cost of providing services of $1.2$1.4 million. There was no material impact on the cost of providing services from exchange rate changes.
Canada operating expenses increased $6.5$8.4 million, or 66.6%52.0%, to $16.2$24.4 million in the sixnine months ended JuneSeptember 30, 2019 from $9.7$16.1 million in the prior yearprior-year period primarily due to interest expense on the Non-Recourse Canada SPV Facility that began in August 2018.
Supplemental Non-GAAP Financial Information
Non-GAAP Financial Measures
In addition to the financial information prepared in conformity with U.S. GAAP, we provide certain “non-GAAP financial measures,” including:
Adjusted Net Income and Adjusted Earnings Per Share, or the Adjusted Earnings Measures (net income from continuing operations plus or minus gain (loss) on extinguishment of debt, restructuring and other costs, impairment ofcertain legal and related costs, loss from equity method investment, goodwill and intangible asset impairments, certain costs related to the disposition of U.K., transaction-related costs, share-based compensation, intangible asset amortization and cumulative tax effect of adjustments, on a total and per share basis);
EBITDA (earnings before interest, income taxes, depreciation and amortization);
Adjusted EBITDA (EBITDA plus or minus certain non-cash and other adjusting items); and
Gross Combined Loans Receivable (includes loans originated by third-party lenders through CSO programs which are not included in our Condensed Consolidated Financial Statements).
We believe that presentation of non-GAAP financial information is meaningful and useful in understanding the activities and business metrics of the Company's operations. We believe that these non-GAAP financial measures offer another way to view aspects of our business that, when viewed with our GAAP results, provide a more complete understanding of factors and trends affecting our business.
We believe that investors regularly rely on non-GAAP financial measures, such as Adjusted Net Income, Adjusted Earnings per Share, EBITDA and Adjusted EBITDA, to assess operating performance and that such measures may highlight trends in the business that may not otherwise be apparent when relying on financial measures calculated in accordance with U.S. GAAP. In addition, we believe that the adjustments shown below are useful to investors in order to allow them to compare our financial results during the periods shown without the effect of each of these income or expense items. In addition, we believe that Adjusted Net Income, Adjusted Earnings per Share, EBITDA and Adjusted EBITDA are frequently used by securities analysts, investors
and other interested parties in the evaluation of public companies in our industry, many of which present Adjusted Net Income, Adjusted Earnings per Share, EBITDA and/or Adjusted EBITDA when reporting their results.
In addition to reporting loans receivable information in accordance with U.S. GAAP, we provide Gross Combined Loans Receivable consisting of owned loans receivable plus loans originated by third-party lenders through the CSO programs, which we guarantee but do not include in the Condensed Consolidated Financial Statements. Management believes this analysis provides investors with important information needed to evaluate overall lending performance.
We provide non-GAAP financial information for informational purposes and to enhance understanding of our U.S. GAAP Condensed Consolidated Financial Statements. Adjusted Net Income, Adjusted Earnings per Share, EBITDA, Adjusted EBITDA and Gross Combined Loans Receivable should not be considered as alternatives to income from continuing operations, segment operating income or any other performance measure derived in accordance with U.S. GAAP, or as an alternative to cash flows from operating activities or any other liquidity measure derived in accordance with U.S. GAAP. Readers should consider the information in addition to, but not instead of or superior to, the financial statements prepared in accordance with U.S. GAAP. This non-GAAP financial information may be determined or calculated differently by other companies, limiting the usefulness of those measures for comparative purposes.
Description and Reconciliations of Non-GAAP Financial Measures
Adjusted Net Income, Adjusted Earnings per Share, EBITDA and Adjusted EBITDA measures have limitations as analytical tools, and you should not consider these measures in isolation or as a substitute for analysis of our income or cash flows as reported under U.S. GAAP. Some of these limitations are:
they do not include cash expenditures or future requirements for capital expenditures or contractual commitments;
they do not include changes in, or cash requirements for, working capital needs;
they do not include the interest expense, or the cash requirements necessary to service interest or principal payments on debt;
depreciation and amortization are non-cash expense items reported in the statements of cash flows; and
other companies in our industry may calculate these measures differently, limiting their usefulness as comparative measures.
We calculate Adjusted Earnings per Share utilizing diluted shares outstanding at year-end. If we record a loss from continuing operations under U.S.US GAAP, shares outstanding utilized to calculate Diluted Earnings per Share from continuing operations are equivalent to basic shares outstanding. Shares outstanding utilized to calculate Adjusted Earnings per Share from continuing operations reflect the number of diluted shares we would have reported if reporting net income from continuing operations under U.S.US GAAP.
As noted above, Gross Combined Loans Receivable includes loans originated by third-party lenders through CSO programs which are not included in the Condensed Consolidated Financial Statements but from which we earn revenue and for which we provide a guarantee to the lender. Management believes this analysis provides investors with important information needed to evaluate overall lending performance.
We evaluate our stores based on revenue per store, provision for losses at each store and store-level EBITDA, with consideration given to the length of time a store has been open and its geographic location. We monitor newer stores for their progress to profitability and their rate of revenue growth.
We believe Adjusted Net Income, Adjusted Earnings per Share, EBITDA and Adjusted EBITDA are used by investors to analyze operating performance and evaluate our ability to incur and service debt and the capacity for making capital expenditures. Adjusted EBITDA is also useful to investors to help assess our estimated enterprise value. The computation of Adjusted EBITDA as presented in this Form 10-Q may differ from the computation of similarly-titled measures provided by other companies.
Reconciliation of Net income from continuing operations and Diluted Earnings per Share to Adjusted Net income and Adjusted Diluted Earnings per Share, non-GAAP measures
(in thousands, except per share data, unaudited) | | | | Three Months Ended June 30, | | Six Months Ended June 30, | Three Months Ended September 30, | | Nine Months Ended September 30, |
| (in thousands except per share data, unaudited) | 2019 | 2018 | Change $ | Change % | | 2019 | 2018 | Change $ | Change % | |
| Net income from continuing operations | $ | 17,667 |
| $ | 18,718 |
| $ | (1,051 | ) | (5.6 | )% | | $ | 46,340 |
| $ | 43,631 |
| $ | 2,709 |
| 6.2 | % | |
| | | 2019 | 2018 | Change $ | Change % | | 2019 | 2018 | Change $ | Change % |
| Net income (loss) from continuing operations | | $ | 27,987 |
| $ | (42,590 | ) | $ | 70,577 |
| # | | $ | 74,327 |
| $ | 1,041 |
| $ | 73,286 |
| # |
|
| Adjustments: | | | | | | |
| | |
|
|
Loss on extinguishment of debt (1) | — |
| — |
| | | | — |
| 11,683 |
| | | — |
| 72,165 |
| |
| | — |
| 83,848 |
| |
|
|
Restructuring costs (2) | — |
| — |
| | | | 1,752 |
| — |
| | | — |
| — |
| |
| | 1,752 |
| — |
| |
|
|
U.K. related costs (3) | 679 |
| — |
| | | | 8,496 |
| — |
| | | |
Impairment of equity method investment (4) | 3,748 |
| — |
| | | | 3,748 |
| — |
| | | |
Share-based cash and non-cash compensation (5) | 2,644 |
| 2,181 |
| | | | 4,816 |
| 4,023 |
| | | |
Legal and related costs (3) | | 870 |
| (1,178 | ) | |
| | 870 |
| (1,178 | ) | |
|
|
U.K. related costs (4) | | 348 |
| — |
| |
| | 8,844 |
| — |
| |
|
|
Loss from equity method investment (5) | | 1,384 |
| — |
| |
| | 5,132 |
| — |
| |
|
|
Share-based compensation (6) | | 2,771 |
| 2,089 |
| |
| | 7,587 |
| 6,112 |
| |
|
|
| Intangible asset amortization | 761 |
| 640 |
| | | | 1,557 |
| 1,303 |
| | | 751 |
| 714 |
| |
| | 2,308 |
| 2,017 |
| |
|
|
Impact of tax law changes (6) | — |
| — |
| | | | — |
| 1,800 |
| | | |
Impact of tax law changes (7) | | — |
| (600 | ) | |
| | — |
| 1,200 |
| |
|
|
| Cumulative tax effect of adjustments | (1,062 | ) | (705 | ) | | | | (4,322 | ) | (4,394 | ) | | | (1,232 | ) | (19,185 | ) | |
| | (5,554 | ) | (23,579 | ) | |
|
|
| Adjusted Net Income | $ | 24,437 |
| $ | 20,834 |
| $ | 3,603 |
| 17.3 | % | | $ | 62,387 |
| $ | 58,046 |
| $ | 4,341 |
| 7.5 | % | $ | 32,879 |
| $ | 11,415 |
| $ | 21,464 |
| # | | $ | 95,266 |
| $ | 69,461 |
| $ | 25,805 |
| 37.2 | % |
| | | | | | | |
| | |
|
|
| Net income from continuing operations | $ | 17,667 |
| $ | 18,718 |
| | | | $ | 46,340 |
| $ | 43,631 |
| | | |
| Net income (loss) from continuing operations | | $ | 27,987 |
| $ | (42,590 | ) | |
| | $ | 74,327 |
| $ | 1,041 |
| |
|
|
Diluted Weighted Average Shares Outstanding | 47,107 |
| 47,996 |
| | | | 47,335 |
| 47,757 |
| | | 46,010 |
| 45,853 |
| |
| | 46,887 |
| 48,061 |
| |
|
|
| Adjusted Diluted Average Shares Outstanding | | 46,010 |
| 48,352 |
| |
| | 46,887 |
| 48,061 |
| |
|
|
| Diluted Earnings per Share from continuing operations | $ | 0.38 |
| $ | 0.39 |
| $ | (0.01 | ) | (2.6 | )% | | $ | 0.98 |
| $ | 0.92 |
| $ | 0.06 |
| 6.5 | % | $ | 0.61 |
| $ | (0.93 | ) | $ | 1.54 |
| # | | $ | 1.59 |
| $ | 0.03 |
| $ | 1.56 |
| # |
|
| Per Share impact of adjustments to Net Income | 0.14 |
| 0.04 |
| | | | 0.34 |
| 0.29 |
| | | 0.10 |
| 1.17 |
| |
| | 0.44 |
| 1.42 |
| |
|
|
| Adjusted Diluted Earnings per Share | $ | 0.52 |
| $ | 0.43 |
| $ | 0.09 |
| 20.9 | % | | $ | 1.32 |
| $ | 1.21 |
| $ | 0.11 |
| 9.1 | % | $ | 0.71 |
| $ | 0.24 |
| $ | 0.47 |
| # | | $ | 2.03 |
| $ | 1.45 |
| $ | 0.58 |
| 40.0 | % |
Reconciliation of Net income (loss) from continuing operations to EBITDA and Adjusted EBITDA, non-GAAP measures (in thousands, except per share data, unaudited)
| |
| Three Months Ended June 30, | | Six Months Ended June 30, | Three Months Ended September 30, | | Nine Months Ended September 30, |
| (in thousands, except per share data, unaudited) | 2019 | 2018 | Change $ | Change % | | 2019 | 2018 | Change $ | Change % | |
| Net income from continuing operations | $ | 17,667 |
| $ | 18,718 |
| $ | (1,051 | ) | (5.6 | )% | | $ | 46,340 |
| $ | 43,631 |
| $ | 2,709 |
| # |
| |
| | | 2019 | 2018 | Change $ | Change % | | 2019 | 2018 | Change $ | Change % |
| Net income (loss) from continuing operations | | $ | 27,987 |
| $ | (42,590 | ) | $ | 70,577 |
| # |
| | $ | 74,327 |
| $ | 1,041 |
| $ | 73,286 |
| # |
|
| Provision for income taxes | 7,453 |
| 5,178 |
| 2,275 |
| 43.9 | % | | 17,499 |
| 16,645 |
| 854 |
| 5.1 | % | 11,239 |
| (16,914 | ) | 28,153 |
| # |
| | 28,738 |
| (269 | ) | 29,007 |
| # |
|
| Interest expense | 17,023 |
| 20,472 |
| (3,449 | ) | (16.8 | )% | | 34,713 |
| 42,826 |
| (8,113 | ) | (18.9 | )% | 17,364 |
| 23,403 |
| (6,039 | ) | (25.8 | )% | | 52,077 |
| 66,229 |
| (14,152 | ) | (21.4 | )% |
| Depreciation and amortization | 4,651 |
| 4,470 |
| 181 |
| 4.0 | % | | 9,571 |
| 9,005 |
| 566 |
| 6.3 | % | 4,609 |
| 4,623 |
| (14 | ) | (0.3 | )% | | 14,180 |
| 13,628 |
| 552 |
| 4.1 | % |
| EBITDA | 46,794 |
| 48,838 |
| (2,044 | ) | (4.2 | )% | | 108,123 |
| 112,107 |
| (3,984 | ) | (3.6 | )% | 61,199 |
| (31,478 | ) | 92,677 |
| # |
| | 169,322 |
| 80,629 |
| 88,693 |
| # |
|
Loss on extinguishment of debt (1) | — |
| — |
| | | | — |
| 11,683 |
| | | — |
| 69,200 |
| |
|
| | — |
| 80,883 |
| |
|
|
Restructuring costs (2) | — |
| — |
| | | | 1,752 |
| — |
| | | — |
| — |
| |
|
| | 1,752 |
| — |
| |
|
|
U.K. related costs (3) | 679 |
| — |
| | | | 8,496 |
| — |
| | | |
Impairment of equity method investment (4) | 3,748 |
| — |
| | | | 3,748 |
| — |
| | | |
Share-based cash and non-cash compensation (5) | 2,644 |
| 2,181 |
| | | | 4,816 |
| 4,023 |
| | | |
Other adjustments (7) | (176 | ) | 91 |
| | | | (392 | ) | 48 |
| | | |
Legal and related costs (3) | | 870 |
| (1,178 | ) | |
|
| | 870 |
| (1,178 | ) | |
|
|
U.K. related costs (4) | | 348 |
| — |
| |
|
| | 8,844 |
| — |
| |
|
|
Loss from equity method investment (5) | | 1,384 |
| — |
| |
|
| | 5,132 |
| — |
| |
|
|
Share-based compensation (6) | | 2,771 |
| 2,089 |
| |
|
| | 7,587 |
| 6,112 |
| |
|
|
Other adjustments (8) | | 483 |
| (49 | ) | |
|
| | 91 |
| (1 | ) | |
|
|
| Adjusted EBITDA | $ | 53,689 |
| $ | 51,110 |
| $ | 2,579 |
| 5.0 | % | | $ | 126,543 |
| $ | 127,861 |
| $ | (1,318 | ) | (1.0 | )% | $ | 67,055 |
| $ | 38,584 |
| $ | 28,471 |
| 73.8 | % | | $ | 193,598 |
| $ | 166,445 |
| $ | 27,153 |
| 16.3 | % |
| Adjusted EBITDA Margin | 20.3 | % | 21.6 | % | | | | 23.3 | % | 26.2 | % | | | 22.6 | % | 14.3 | % | | | | 23.1 | % | 22.0 | % | | |
|
| |
| (1) | For the sixnine months ended JuneSeptember 30, 2018, the $11.7$80.9 million of loss on extinguishment of debt wasis comprised of (i) $11.7 million incurred in the first quarter of 2018 for the redemption of $77.5 million of the CURO Financial Technologies Corp.'s ("CFTC") 12.00% Senior Secured Notes due 2022.2022 and (ii) $69.2 million incurred in the third quarter of 2018 for the redemption of the remaining $525.7 million of these notes. The $69.2 million of third quarter loss on extinguishment of debt is comprised of $54.0 million make whole premium and $15.2 million of deferred financing costs, net of premium/discounts. An additional $3.0 million is included in related costs for the three and nine months ended September 30, 2018 for duplicative interest paid through September 30, 2018 prior to repayment of the remaining 12.00% Senior Secured Notes and the Non-Recourse U.S. SPV Facility.
|
| (2) | Restructuring costs of $1.8 million for the sixnine months ended JuneSeptember 30, 2019 were due to eliminating 121 positions in North America. The store employee reductions help better align store staffing with in-store customer traffic and volume patterns, as more of our growth comes from online channels and as store customers require less time in stores as they conduct more of the follow-up activities online. The elimination of certain corporate positions relate to efficiency initiatives and has allowed the Company to reallocate investment to strategic growth activities. |
| (3) | Legal and related costs for the three and nine months ended September 30, 2019 include costs related to certain securities litigation and related matters of $0.6 million and legal and advisory costs of $0.3 million related to the repurchase of shares from FFL. Legal and related costs for the three and nine months ended September 30, 2018 includes (i) a $1.8 million reduction of the liability related to our offer to reimburse certain bank overdraft or non-sufficient funds fees because of possible borrower confusion about certain electronic payments we initiated on their loans and (ii) settlement of certain matters in California and Canada. For more information, see Note 18 - "Contingent Liabilities" of the Notes to Consolidated Financial Statements included in our Form 10-K filed with the SEC on March 18, 2019. |
| (4) | U.K. related costs of $8.5$8.8 million for the sixnine months ended JuneSeptember 30, 2019 relate to placing the U.K. subsidiaries into administration on February 25, 2019, which included $7.6 million to obtain consent from the holders of the 8.25% Senior Secured Notes to deconsolidate the U.K. Segment and $0.9$1.2 million for other costs.
|
(4)(5) | DuringThe Loss from equity method investment for the nine months ended September 30, 2019 of $5.1 million includes (i) our share of the estimated GAAP net loss of Zibby and (ii) a $3.7 million loss recognized during the second quarter of 2019. From April through July of 2019, Cognical Holdings (“Zibby”)Zibby completed an equity raising round at a value per share less than the value per share raised in prior raises. This round included additional investments from existing shareholders and investments by new investors and is considered indicative of the fair value of shares in Zibby. Accordingly, we recognized a $3.7 million impairment in our investment in Zibby to adjust it to market value. As of JuneSeptember 30, 2019, we owned approximately 30%42.3% of the outstanding shares of Zibby on a fully diluted basis.
|
(5)(6) | We approved the adoption of share-based compensation plans during 2010 and 2017 for key members of senior management. The estimated fair value of share-based awards is recognized as non-cash compensation expense on a straight-line basis over the vesting period.
|
(6)(7) | As a result of the Tax Cuts and Jobs Act of 2017 ("2017 Tax Act"), which became law on December 22, 2017, we provided an estimate of the new repatriation tax as of December 31, 2017. Subsequent to further guidance published in the first quarter of 2018, we booked additional tax expense of $1.2 million for the 2017 repatriation tax. Additionally, the 2017 Tax Act provided for a new GILTI ("Global Intangible Low-Taxed Income")Income tax starting in 2018 and we estimated and provided tax expense of $0.6 million asin the first quarter of June 30, 2018.
2018.We revised this expense in the third quarter of 2018 based on changes in our geographic mix of income. |
(7)(8) | Other adjustments include deferred rent and the intercompany foreign exchange impact. Deferred rent represents the non-cash component of rent expense. |
Currency Information
We operate in the U.S. and Canada and our consolidated results are reported in U.S. dollars.
Changes in our reported revenues and net income include the effect of changes in currency exchange rates. We translate all balance sheet accounts into U.S. dollars at the currency exchange rate in effect at the end of each period. We translate the statement of operations at the average rates of exchange for the period. We record currency translation adjustments as a component of Accumulated Other Comprehensive Income in Stockholders’ Equity.
Constant Currency Analysis
We have operations in the U.S. and Canada. In the three months ended JuneSeptember 30, 2019 and 2018, approximately 20.5%20.2% and 19.8%17.1%, respectively, of our revenues from continuing operations were originated in Canadian Dollars. As a result, changes in our reported results include the impacts of changes in foreign currency exchange rates for the Canadian Dollar.
Three Months Ended JuneSeptember 30, 2019 and 2018
|
| | | | | | | | | | | | |
| | Average Exchange Rates | | |
| | Three Months Ended June 30, | | Change |
| | 2019 | 2018 | | $ | % |
| Canadian Dollar | $ | 0.7477 |
| $ | 0.7749 |
| |
| ($0.0272 | ) | (3.5 | )% |
|
| | | | | | | | | | | | |
| | Average Exchange Rates | | |
| | Three Months Ended September 30, | | Change |
| | 2019 | 2018 | | $ | % |
| Canadian Dollar | $ | 0.7576 |
| $ | 0.7652 |
| |
| ($0.0076 | ) | (1.0 | )% |
SixNine Months Ended JuneSeptember 30, 2019 and 2018
|
| | | | | | | | | | | | |
| | Average Exchange Rates | | |
| | Six Months Ended June 30, | | Change |
| | 2019 | 2018 | | $ | % |
| Canadian Dollar | $ | 0.7501 |
| $ | 0.7831 |
| |
| ($0.0330 | ) | (4.2 | )% |
|
| | | | | | | | | | | | |
| | Average Exchange Rates | | |
| | Nine Months Ended September 30, | | Change |
| | 2019 | 2018 | | $ | % |
| Canadian Dollar | $ | 0.7526 |
| $ | 0.7771 |
| |
| ($0.0245 | ) | (3.2 | )% |
The following constant currency analysis removes the impact of the fluctuation in foreign exchange rates and utilizes constant currency results in our analysis of segment performance. Our constant currency assessment assumes foreign exchange rates in the current fiscal periods remained the same as in the prior fiscal periods. All conversion rates below are based on the U.S. Dollar equivalent to the Canadian Dollar. We believe that the constant currency assessment below is a useful measure in assessing the comparable growth and profitability of our operations.
The revenues and gross margin below during the three months ended JuneSeptember 30, 2019 were calculated using the actual average exchange rate during the three months ended JuneSeptember 30, 2018.2018 (in thousands, unaudited).
| | | | | Three Months Ended June 30, | | Change | | Three Months Ended September 30, | | Change |
| (dollars in thousands, unaudited) | | 2019 | | 2018 | | $ | | % | | |
| | | | 2019 | | 2018 | | $ | | % |
| Canada – constant currency basis: | | | | | | | | | | | | | | | | | |
| Revenues | | $ | 56,224 |
| | $ | 47,043 |
| | $ | 9,181 |
| | 19.5 | % | | | $ | 60,805 |
| | $ | 46,209 |
| | $ | 14,596 |
| | 31.6 | % |
| Gross Margin | | 16,691 |
| | 13,300 |
| | 3,391 |
| | 25.5 | % | | | 19,597 |
| | 489 |
| | 19,108 |
| | # |
|
| # - variance greater than 100% or not meaningful | | # - variance greater than 100% or not meaningful |
The revenues and gross margin below during the sixnine months ended JuneSeptember 30, 2019 were calculated using the actual average exchange rate during the sixnine months ended JuneSeptember 30, 2018.2018 (in thousands, unaudited).
| | | | | Six Months Ended June 30, | | Change | | Nine Months Ended September 30, | | Change |
| (dollars in thousands, unaudited) | | 2019 | | 2018 | | $ | | % | | |
| | | | 2019 | | 2018 | | $ | | % | |
| Canada – constant currency basis: | | | | | | | | | | | | | | | | | | |
| Revenues | | $ | 110,754 |
| | $ | 93,293 |
| | $ | 17,461 |
| | 18.7 | % | | | $ | 171,664 |
| | $ | 139,502 |
| | $ | 32,162 |
| | 23.1 | % | |
| Gross Margin | | 33,211 |
| | 27,802 |
| | 5,409 |
| | 19.5 | % | | | 52,861 |
| | 28,291 |
| | 24,570 |
| | 86.8 | % | |
LIQUIDITY AND CAPITAL RESOURCES
Our principal sources of liquidity to fund the loans we make to our customers are cash provided by operations, our Senior Revolver, our Cash Money Revolving Credit Facility, funds from third-party lenders under our CSO programs, and our Non-Recourse Canada SPV Facility (defined below). During August 2018, we issued $690.0 million 8.25% Senior Secured Notes due September 2025 ("8.25% Senior Secured Notes") (i) to (i) redeem the outstanding 12.00% Senior Secured Notes due 2022 of CFTC, (ii) to repay a portion of the outstanding indebtedness under the five-year revolving credit facility of CURO Receivables Finance I, LLC, our wholly-owned subsidiary, which consists of a term loan and revolving borrowing capacity, (iii) for general corporate purposes and (iv) to pay fees, expenses, premiums and accrued interest in connection with the foregoing.
As of JuneSeptember 30, 2019, we were in compliance with all financial ratios, covenants and other requirements set forth in our debt agreements. We anticipate that our primary use of cash will be to fund growth in our working capital, finance capital expenditures, meet our debt obligations, and fund our share repurchase program. Our level of cash flow provided by operating activities typically experiences some seasonal fluctuation related to our levels of net income and changes in working capital levels, particularly loans receivable.
Unexpected changes in our financial condition or other unforeseen factors may result in our inability to obtain third-party financing or could increase our borrowing costs in the future. We have the ability to adjust our volume of lending to consumers which would reduce cash outflow requirements while increasing cash inflows through loan repayments to the extent we experience any short-term or long-term funding shortfalls. We may also sell or securitize our assets, draw on our available revolving credit facility or line of credit, enter into additional refinancing agreements and reduce our capital spending in order to generate additional liquidity. We believe our cash on hand and available borrowings provide us with sufficient liquidity for at least the next 12 months.
Borrowings
Our long-term debt consisted of the following as of JuneSeptember 30, 2019 and December 31, 2018 (net of deferred financing costs) (in thousands):
| | | | June 30, | December 31, | September 30, | December 31, |
| (dollars in thousands) | 2019 | 2018 | |
| | | 2019 | 2018 |
| 8.25% Senior Secured Notes (due 2025) | $ | 677,535 |
| $ | 676,661 |
| $ | 677,924 |
| $ | 676,661 |
|
| Non-Recourse Canada SPV Facility | 90,977 |
| 107,479 |
| 102,483 |
| 107,479 |
|
| Senior Revolver | — |
| 20,000 |
| 25,000 |
| 20,000 |
|
| Long-term debt | $ | 768,512 |
| $ | 804,140 |
| |
| Debt | | $ | 805,407 |
| $ | 804,140 |
|
Available Credit Facilities and Other Resources
8.25% Senior Secured Notes
As noted above, we issued our 8.25% Senior Secured Notes in August 2018. Interest on the notes is payable semiannually, in arrears, on March 1 and September 1 of each year. In connection with the 8.25% Senior Secured Notes, we capitalized financing costs of approximately $12.9 million, the balance of which is included in the Condensed Consolidated Balance Sheets as a component of Long-Term Debt, and is being amortized over the term of the 8.25% Senior Secured Notes and included as a component of interest expense.
12.00% Senior Secured Notes
In February and November 2017, CFTC issued $470.0 million and $135.0 million, respectively, of 12.00% Senior Secured Notes ("12.00% Senior Secured Notes"). Interest on the 12.00% Senior Secured Notes is payable semiannually, in arrears, on March 1 and September 1 of each year, beginning on September 1, 2017. The February 2017 issuance refinanced similar notes that were nearing maturity. The extinguishment of the existing notes resulted in a pretax loss of $11.7$80.9 million during September 2018. In connection with these 2017 debt issuances we capitalized financing costs of approximately $18.3 million, the balance of which is included in the Condensed Consolidated Balance Sheets as a component of Long-Term Debt, and is being amortized over the term of the 12.00% Senior Secured Notes as a component of interest expense.
On March 7, 2018, CFTC redeemed $77.5 million of its 12.00% Senior Secured Notes using a portion of the proceeds from our initial public offering as required by the underlying indentures (the transaction whereby the 12.00% Senior Secured Notes were partially redeemed, the “Redemption”) at a price equal to 112.00% of the principal amount of the 12.00% Senior Secured Notes redeemed, plus accrued and unpaid interest paid thereon to the date of Redemption. Following the Redemption, $527.5 million of the original outstanding principal amount of the 12.00% Senior Secured Notes remain outstanding. The Redemption was conducted pursuant to the Indenture governing the 12.00% Senior Secured Notes (the “Indenture”), dated as of February 15, 2017, by and among CFTC, the guarantors party thereto and TMI Trust Company, as trustee and collateral agent.
The remainder of the 12.00% Senior Secured Notes were extinguished effective September 7, 2018 as a result of the issuance of the 8.25% Senior Secured Notes as described above.
Non-Recourse U.S. SPV Facility
In November 2016, CURO Receivables Finance I, LLC, a Delaware limited liability company (the “SPV Borrower”) and a wholly-owned subsidiary, entered into a five-year revolving credit facility with Victory Park Management, LLC and certain other lenders that provided for an $80.0 million term loan and $70.0 million of revolving borrowing capacity that could expand over time (“Non-Recourse U.S. SPV Facility”). The loans bore interest at an annual rate of up to 12.00% plus the greater of (i) 1.0% per annum and (ii) three-month LIBOR. The SPV Borrower also pays a 0.50% per annum fee on the unused portion of the commitments. In connection with this facility, the capitalized financing costs at the time of extinguishment, as discussed below, were approximately $5.3 million, net of amortization. These capitalized financing costs were included in the Condensed Consolidated Balance Sheet as a component of "Long-term debt""Debt" and were amortized over the term of the Non-Recourse U.S. SPV Facility. During September 2018, a portion of the proceeds from the 8.25% Senior Secured Notes were used to extinguish the revolver's balance of $42.4 million.
On October 11, 2018, we extinguished the remaining term loan balance of $80.0 million. We made the final termination payment of $2.7 million on October 26, 2018, resulting in a loss on the extinguishment of debt of $9.7 million for the quarter ended December 31, 2018.
Non-Recourse Canada SPV Facility
On August 2, 2018, CURO Canada Receivables Limited Partnership, a newly created, bankruptcy-remote special purpose vehicle (the “Canada SPV Borrower”) and a wholly-owned subsidiary, entered into a four-year revolving credit facility with Waterfall Asset Management, LLC that provides for C$175.0 million of initial borrowing capacity and the ability to expand such capacity up to C$250.0 million (“Non-Recourse Canada SPV Facility”). The loans bear interest at an annual rate of 6.75% plus the three-month CDOR. As of JuneSeptember 30, 2019, outstanding borrowings under the Non-Recourse Canada SPV Facility were $91.0$102.5 million, net of deferred financing costs of $3.6 million, and after a reduction of net balances drawn of $20.9 million during the quarter.$3.3 million.
Senior Revolver
On September 1, 2017, we closed on a $25.0 million Senior Secured Revolving Loan Facility (the "Senior Revolver"). In February 2018, the Senior Revolver capacity was increased to $29.0 million. In November 2018, the Senior Revolver capacity was increased to $50.0 million as permitted by the Indenture to the Senior Secured Notes. The Senior Revolver is now syndicated with participation by four banks. The negative covenants of the Senior Revolver generally conform to the related provisions in the Indenture for our 8.25% Senior Secured Notes. We believe this facility complements our other financing sources, while providing seasonal short-term liquidity. Under the Senior Revolver, there is $50.0 million maximum availability, including up to $5.0 million of standby letters of credit, for a one-year term, renewable for successive terms following annual review. The Senior Revolver accrues interest at the one-month LIBOR (which may not be negative) plus 5% per annum and is repayable on demand. The terms of the Senior Revolver require that the outstanding balance be zero for at least 30 consecutive days in each calendar year. The Senior Revolver is guaranteed by all of our subsidiaries that guarantee our 8.25% Senior Secured Notes and is secured by a lien on substantially all of our assets and the guarantor subsidiaries that is senior to the lien securing our 8.25% Senior Secured Notes. The Senior Revolver was undrawnhad an outstanding balance of $25.0 million at JuneSeptember 30, 2019.
In connection with this facility we capitalized financing costs of approximately $0.1 million, the balance of which we included in the Condensed Consolidated Balance Sheets as a component of “Other assets,” and are being amortized over the term of the facility and included as a component of interest expense.
Cash Money Revolving Credit Facility
Cash Money Cheque Cashing, Inc., one of our Canadian subsidiaries, maintains a C$10 million revolving credit facility with Royal Bank of Canada. The Cash Money Revolving Credit Facility provides short-term liquidity required to meet the working capital needs of our Canadian operations. Aggregate draws under the revolving credit facility are limited to the lesser of: (i) the borrowing base, which is defined as a percentage of cash, deposits in transit and accounts receivable, and (ii) C$10 million. As of JuneSeptember 30, 2019 and December 31, 2018, the borrowing capacity under our revolving credit facility was reduced by C$0.3 million in stand-by-letters of credit.
The Cash Money Revolving Credit Facility is collateralized by substantially all of Cash Money’s assets and contains various covenants that include, among other things, that the aggregate borrowings outstanding under the facility not exceed the borrowing base, restrictions on the encumbrance of assets and the creation of indebtedness. Borrowings under the Cash Money Revolving Credit Facility bear interest (per annum) at the prime rate of a Canadian chartered bank plus 1.95%.
The Cash Money Revolving Credit Facility was undrawn at JuneSeptember 30, 2019 and December 31, 2018.
Cash Flows
The following highlights our cash flow activity and the sources and uses of funding during the periods indicated:indicated (in thousands):
| | | | | Six Months Ended June 30, | | Nine Months Ended September 30, |
| (dollars in thousands) | | 2019 | | 2018 | |
| | | | 2019 | | 2018 |
| Net cash provided by continuing operating activities | | $ | 312,319 |
| | $ | 246,733 |
| | $ | 464,293 |
| | $ | 357,079 |
|
| Net cash used in continuing investing activities | | (227,731 | ) | | (198,551 | ) | | (391,188 | ) | | (421,423 | ) |
| Net cash used in continuing financing activities | | (45,180 | ) | | (80,661 | ) | |
| Net cash (used in) provided by continuing financing activities | | | (58,488 | ) | | 90,449 |
|
Continuing Operating Activities
Net cash provided by continuing operating activities for the sixnine months ended JuneSeptember 30, 2019 was $312.3$464.3 million, primarily attributable to net income from continuing operations of $46.3$74.3 million, the effect of non-cash reconciling items of $227.6$364.3 million, which includes provision for loan losses of $214.4$338.3 million, and changes in our operating assets and liabilities which provided $38.4$25.6 million.
Net cash provided by continuing operating activities for the sixnine months ended JuneSeptember 30, 2018 was $246.7 million, primarily attributable$357.1 million. Contributing to current year net income fromcash provided by continuing operations of $43.6 million, the effect ofoperating activities non-cash reconciling items, such as depreciation and amortization, and the provision for loan losses and loss on extinguishment of debt for a total of $191.6 million, and$398.1 million. Contributions from non-cash reconciling items were offset by changes in our operating assets and liabilities
of $11.6$42.1 million. Fees and service charges on our loans receivable change represented $2.9 million of the total change in operating assets and liabilities.
Continuing Investing Activities
Net cash used in continuing investing activities for the sixnine months ended JuneSeptember 30, 2019 was $227.7$391.2 million, primarily reflecting the net origination of loans of $217.2$374.4 million. In addition, we used cash to purchase approximately $6.2$8.7 million of property and equipment, including software licenses and $4.4$8.2 million of additional investment in Zibby.
Net cash used in continuing investing activities for the sixnine months ended JuneSeptember 30, 2018 was $198.6$421.4 million, primarily reflecting the net origination of loans of $194.6$412.4 million. In addition, we used cash to purchase approximately $3.0$8.0 million of property and equipment, including software licenses, and to purchase $1.0 million of Zibby preferred shares.
Origination of loans will fluctuate from period-to-period, depending on the timing of loan issuances and collections. A seasonal decline in consumer loans receivable typically occurs during the first quarter of the year and is driven by income tax refunds in the U.S. Typically, customers will use the proceeds from income tax refunds to pay outstanding loan balances, resulting in an increase in our net cash balances and a decrease in our consumer loans receivable balances. Consumer loans receivable balances typically reflect growth during the remainder of the year.
Continuing Financing Activities
Net cash used in continuing financing activities for the sixnine months ended JuneSeptember 30, 2019 was $45.2$58.5 million, primarily due to (i) $27.1 million of cash used to repurchase 2,000,000 shares of our common stock, at a price of $13.55 per share, owned by FFL and (ii) $25.1 million of cash used to repurchase 2,089,644 shares of our common stock under the share repurchase program which began during the second quarter of 2019.
Net cash provided by continuing financing activities for the nine months ended September 30, 2018 was $90.4 million. During the quarter, we made a $20.0 million payment on the Senior Revolver to reduce the outstanding balance to zero and made net repayments of $21.0 million on the Non-Recourse Canada SPV Facility.
Net cash used in continuing financing activities for the six months ended June 30, 2018 was $80.7 million. We redeemed $77.5extinguished $527.5 million of our 12.00% Senior Secured Notes for $86.8 million (which included $9.3from the issuance of our 8.25% Senior Secured Notes of $690.0 million. As part of the extinguishment, we paid $63.4 million of call premium). The underwriters of our 2017 initial public offering exercised their over-allotment option on January 5, 2018 and acquired one million shares of our common stock, providing net proceeds to us of $12.4 million.premium. We also hadentered into a Non-Recourse Canada SPV facility during the quarter, which provided $89.9 million of proceeds and was offset by net borrowings of $6.2 million frompayments on our U.S. SPV Facilityfacility of $44.6 million. Net proceeds from the issuance of common stock and our ABL Facility duringproceeds from the six months Juneexercise of stock options were $12.0 million as of September 30, 2018.
Contractual Obligations
There have been no significant developments with respect to our contractual obligations since December 31, 2018, as described in our 2018 Form 10-K.
Regulatory Environment and Compliance
There have been no significant developments with respect to our regulatory environment and compliance since December 31, 2018, as described in our 2018 Form 10-K except for the following:
California Assembly Bill 539
On June 26,September 13, 2019, the California Senate Banking and Financial Institutions Committeeslegislature passed Assembly Bill 539 which imposes an interest rate cap on all consumer loans between $2,500 and $10,000 of 36%, plus the Federal Funds Rate. On July 9,October 10, 2019, the California Senate Judiciary Committee also passed Assembly Bill 539 andGovernor Newsom signed the bill was referred to the Senate Appropriations Committee. The deadline for Assembly Bill 539 to pass both houses is September 13, 2019, and the deadline to be signed by the Governor and passed into law and it is October 13th, 2019.scheduled to become effective on January 1, 2020. Revenue from California Unsecured and Secured Installment loans amounted to 13.3%11.8% and 13.0% of total revenue from continuing operations for the trailing three and 12 months ended, Junerespectively, September 30, 2019. As of JuneSeptember 30, 2019, California Unsecured and Secured Installment gross loans receivable were $86.5$86.4 million and $42.3$41.4 million, respectively. WeWhile we continue to optimize our installment loan portfolio in California as a result of this bill, we continue to evaluate the effect on our results of operations and financial condition as a result of this bill and alternatives available to service customers in the California market. Refer to “Risk Factors” in Item 1A. of Part II of this Form 10-Q for additional information regarding the impact of this bill to our business.
California Consumer Privacy Act
In 2018, the California Consumer Privacy Act (“CCPA”) was passed into law, effective January 1, 2020. CCPA broadens consumer rights with respect to their personal information, imposing expanded obligations to disclose the categories and uses of personal information a business collects, providing consumers a right to access that information, a right to opt out of the sale of personal information and the right to request that a business delete personal information about the consumer subject to certain exemptions. CCPA provides for civil penalties for violations, as well as a private right of action for data breaches, which may increase the costs of data breach litigation. CCPA containshas been subject to a numberhandful of ambiguities, was previously amendedamendments, of which AB25 is most impactful to us. Although AB25 sunsets January 2021, it narrows the definition of who constitutes a consumer, thereby excluding employees from CCPA rights other than notice and a private right of action for data breach. The State Attorney General has proposed regulations to help interpret the CCPA; final adoption is expected in February 2020. A potential ballot initiative may have additional impact should it make it to the polls in November 2020. Despite amendments and regulations, the CCPA remains ambiguous in many regards, and we anticipate further amendments before its effective date.both for CCPA and specifically addressing employee data next year. Other states and possibly the federal government may adopt laws similar to the CCPA. While it is too early to know its full impact, these developments could ultimately result in the imposition of requirements on CURO and other consumer financial service providers that could increases costs or otherwise adversely affect our business.
British Columbia Business Practices and Consumer Amendment Act
Effective January 1, 2017, the British Columbia Ministry of Public Safety and Solicitor General (the "Ministry") reduced the total cost of borrowing from C$23 per C$100 lent to C$17 per C$100 lent. A further reduction to C$15 per C$100 lent came into effect on September 1, 2018. On February 26, 2019, the Minister of Public Safety and Solicitor General introduced in Parliament Bill 7 titled “Business Practices and Consumer Amendment Act." This bill received Royal Assent on May 16, 2019 and became law. There are no material changes to our current operations as a result of this legislation. The bill primarily allows the Ministry to i)(i) define a high cost credit product and ii)(ii) require licensing and consumer protection oversight. It also authorizes the Ministry to prescribe regulations regarding high cost credit products including a cooling off period between loans, cost/optional services disclosure requirements, and prohibition of concurrent loan products. It is too early to predict the outcome of the regulations setting process and its impact on our operations.
CFPB Rulemaking Update
In February 2019, the CFPB issued two notices of proposed rulemaking proposing (i) to delay the August 19, 2019 compliance date for the so-called "Mandatory Underwriting Provisions" of the 2017 Final Payday, Vehicle Title, and Certain High-Cost Installment Loans (the "2017 Final Rule") Rule to November 19, 2020 and (ii) to rescind such Mandatory Underwriting Provisions (the “2019 Proposed Rule”). The CFPB issued a final rule on June 6, 2019 delaying the compliance date for the Mandatory Underwriting Provisions of the 2017 Final Rule to November 19, 2020. The Mandatory Underwriting Provisions which the 2019 Proposed Rule would rescind, which are still under consideration include: (i) providea provision that it is an unfair and abusive practice for a lender to make a covered short-term or longer-term balloon-payment loan, including our payday and vehicle title loans with a term of 45 days or less, without reasonably determining that consumers have the ability to repay those loans according to their terms; (ii) prescribea provision that prescribes mandatory underwriting requirements for making this ability-to-repay determination; (iii) exempta provision that exempts certain loans from the mandatory underwriting requirements; and (iv) establisha provision that establishes related definitions, reporting, and recordkeeping requirements. The 2017 Final Rule is stayed, however, based on an order entered August 6, 2019 by the Western District of Texas, Austin Division (the "Court Order"). The parties in the litigation are required to file a Joint Status Report with the court no later than December 6, 2019.
The compliance date for the "Payment Provision" of the 2017 Final Rule remainswas August 19, 2019, but is also currently stayed pursuant to the Western District of Texas, Austin Division's Ruling ("Court Order") on May 30, 2019.Order. Under these provisions:the proposed "Payment Provisions":
If two consecutive attempts to collect money from a particular account of the borrower, made through any channel (e.g., paper check, ACH, prepaid card) are returned for insufficient funds, the lender cannot make any further attempts to collect from such account unless the borrower has provided a new and specific authorization for additional payment transfers. The 2017 Final CFPB Rule contains specific requirements and conditions for the authorization. While the CFPB has explained that these provisions are designed to limit bank penalty fees to which consumers may be subject, and while banks do not charge penalty fees on debit card authorization requests, the 2017 Final CFPB Rule nevertheless treats card authorization requests as payment attempts subject to these limitations.
A lender generally must give the consumer at least three business days advance notice before attempting to collect payment by accessing a consumer’s checking, savings, or prepaid account. The notice must include information such as the date of the payment request, payment channel and payment amount (broken down by principal, interest, fees, and other charges), as well as additional information for “unusual attempts,” such as when the payment is for a different amount than the regular payment, initiated on a date other than the date of a regularly scheduled payment or initiated in a different channel that the immediately preceding payment attempt. A lender must also provide the borrower with a "consumer rights notice" in a prescribed form after two consecutive failed payment attempts.
The CFPB has indicated it has received a formal request to revisit the treatment of debtdebit cards under the Payment Provisions and intends to examine the Payment Provisions further. If the CFPB determines that further action is warranted, it may commence a separate rulemaking initiative.
CFPB Supervision and Examination: The CFPB has supervisory powers over many providers of consumer financial products and services, including explicit authority to examine (and require registration) of payday lenders. The CFPB released its Supervision and Examination Manual, which includes a section on Short-Term, Small-Dollar Lending Procedures, and began field examinations of industry participants in 2012. The CFPB commenced its first supervisory examination of us in October 2014. The scope of the CFPB’s examination included a review of our Compliance Management System, our Short-Term Small Dollar lending procedures, and our compliance with Federal consumer financial protection laws. The 2014 examination had no material impact on our financial condition or results of operations, and we received the final CFPB Examination Report in September 2015.
The CFPB commenced its second examination of us in February 2017 and completed the related field work in June 2017. The scope of the 2017 examination included a review of our Compliance Management System, our substantive compliance with applicable federal laws, and matters requiring attention. The 2017 examination had no material impact on our financial condition or results of operations, and we received the final CFPB Examination Report in February 2018.
The CFPB commenced its third examination of us on October 7, 2019. This examination is a limited scope review to ensure continued compliance. While we do not expect that matters arising from this examination will have a material impact on us, we have made in recent years and are continuing to make, at least in part to meet CFPB expectations, certain enhancements to our compliance procedures and consumer disclosures.
ITEM 3. QUANTITATIVE AND QUALITATIVE DISCLOSURES ABOUT MARKET RISK
For quantitative and qualitative disclosures about our market risks, see "Quantitative and Qualitative Disclosures about Market Risk" in our 2018 Form 10-K for the year ended December 31, 2018. There have been no material changes to the amounts presented therein.
LIBOR is used as a reference rate for certain of our financial instruments, such as our revolving credit facilities. LIBOR is set to be phased out at the end of 2021. We are currently reviewing how the LIBOR phase-out will affect the Company, but we do not expect the impact to be material.
ITEM 4. CONTROLS AND PROCEDURES
Disclosure controls and procedures
We maintain disclosure controls and procedures designed to ensure that information required to be disclosed in the reports we file or submit under the Securities Exchange Act of 1934 (the “Exchange Act”) is recorded, processed, summarized and reported within the time periods specified in the SEC’s rules and forms, including without limitation, controls and procedures designed to ensure that information required to be disclosed in reports we file under the Exchange Act is accumulated and communicated to our management, including the Chief Executive Officer and Chief Financial Officer, as appropriate to allow timely decisions regarding required disclosure.
Based on an evaluation of our disclosure controls and procedures as disclosed in Item 9A of our 2018 Form 10-K, for the year ended December 31, 2018, our management concluded that our internal control over financial reporting was not effective at December 31, 2018 because of the identification of a material weakness. A material weakness is a deficiency, or a combination of deficiencies, in internal control over financial reporting, such that there is a reasonable possibility that a material misstatement of the Company’s annual or interim financial statements will not be prevented or detected on a timely basis.
Remediation and changes in internal control over financial reporting
We are taking actions to improve our internal control over financial reporting, including implementing plans as identified in Item 9A of our 2018 Form 10-K, filed with the SEC on March 18, 2019, to address our material weakness. The material weakness will not be considered remediated until the applicable remedial controls operate for a sufficient period of time and management has concluded, through testing, that these controls are operating effectively. We expect that the remediation of this material weakness will be completed in 2019.
Except as noted above, there were no changes in our internal control over financial reporting (as defined in Rules 13a-15(e) and 15d-15(e) under the Exchange Act) during the three months ended JuneSeptember 30, 2019, that have materially affected, or are reasonably likely to materially affect, our internal control over financial reporting.
Limitation on the effectiveness of controls
Our management, including our Chief Executive Officer and Chief Financial Officer, does not expect that our disclosure controls or our internal control over financial reporting will prevent or detect all errors and all fraud. Any controls and procedures, no matter how well designed and operated, can provide only reasonable assurance of achieving the desired control objective and management necessarily applies its judgment in evaluating the cost-benefit relationship of possible controls and procedures. A
control system also can be circumvented by collusion or improper management override. Because of such limitations, disclosure controls and internal control over financial reporting cannot prevent or detect all misstatements, whether unintentional errors or fraud. However, these inherent limitations are known features of the financial reporting process, therefore, it is possible to design into the process safeguards to reduce, though not eliminate, this risk.
PART 2.II. OTHER INFORMATION
ITEMItem 1. LEGAL PROCEEDINGSLegal Proceedings
The information required by this item is included in Note 13 - "Contingent Liabilities" of the Notes to the Condensed Consolidated Financial Statements in this Form 10-Q and is incorporated herein by reference.
ITEMItem 1A. RISK FACTORSRisk Factors
There were no material changes to our risk factors as described in our 2018 Form 10-K for the year ended December 31, 2018, except for the following:
Our industry is strictly regulated everywhere we operate, and these regulations could have a material adverse effect on our business and results of operations.
We are subject to substantial regulation everywhere we operate. In the U.S. and Canada, our business is subject to a variety of statutes and regulations enacted by government entities at the federal, state or provincial, and municipal levels. These regulations affect our business in many ways, and include regulations relating to:
the amount we may charge in interest rates and fees;
the terms of our loans (such as maximum and minimum durations), repayment requirements and limitations, number and frequency of loans, maximum loan amounts, renewals and extensions, required repayment plans and reporting and use of state-wide databases;
underwriting requirements;
collection and servicing activity, including initiation of payments from consumer accounts;
the establishment and operation of CSOs or CABs;
licensing, reporting and document retention;
unfair, deceptive and abusive acts and practices;
discrimination;
disclosures, notices, advertising and marketing;
loans to members of the military and their dependents;
requirements governing electronic payments, transactions, signatures and disclosures;
check cashing;
money transmission;
currency and suspicious activity recording and reporting;
privacy and use of personally identifiable information and consumer data, including credit reports;
anti-money laundering and counter-terrorist financing requirements, including currency and suspicious transaction recording and reporting;
posting of fees and charges; and
repossession practices in certain jurisdictions where we operate as a title lender, including requirements regarding notices and prompt remittance of excess proceeds for the sale of repossessed automobiles.
For a more detailed description of the regulations to which we are subject and the regulatory environment in the jurisdictions in which we operate see “Regulatory Environment and Compliance” in our 2018 Form 10-K and in this Form 10-Q.
These regulations, outside of our control, affect our business in many ways, including affecting the loans and other products we can offer, the prices we can charge, the other terms of our loans and other products, the customers to whom we are allowed to lend, how we obtain our customers, how we communicate with our customers, how we pursue repayment of our loans and many others. Consequently, these restrictions adversely affect our loan volume, revenues, delinquencies and other aspects of our business, including our results of operations.
For example, in June 2018, we discontinued the use of secondary payment cards for affected borrowers who do not explicitly reauthorize the use of secondary payment cards. For these borrowers, in the event we cannot obtain payment through the bank account or payment card listed on the borrower’s application and as authorized by the borrower, we must rely exclusively on other collection methods, such as delinquency notices and/or collection calls. The discontinuation for affected borrowers of our current use of secondary cards which have not been reauthorized by the borrower will increase collections costs and reduce collections effectiveness. Even in advance of the effective date of the 2017 Final CFPB Rule (and even if the 2017 Final CFPB Rule does not become effective), it is possible that we will make further changes to our payment practices in a manner that will increase costs and/or reduce revenues.
In addition, on June 26,September 13, 2019, the California Senate Banking and Financial Institutions Committeeslegislature passed Assembly Bill 539 which imposes an interest rate cap on all consumer loans between $2,500 and $10,000 of 36% plus the Federal Funds Rate. On July 9,October 10, 2019, the California Senate Judiciary Committee also passed Assembly Bill 539 andGovernor Newsom
signed the bill was referred to the Senate Appropriations Committee. The deadline for Assembly Bill 539 to pass both houses is September 13, 2019, and the deadline to be signed by the Governor and passed into law and it is October 13th, 2019.scheduled to become effective on January 1, 2020. Revenue from California Unsecured and Secured Installment loans amounted to 13.3%11.8% and 13.0% of total revenue from continuing operations for the trailing twelvethree and 12 months, respectively, for the period ended JuneSeptember 30, 2019. As of JuneSeptember 30, 2019, California Unsecured and Secured Installment gross loans receivable were $86.5$86.4 million and $42.3$41.4 million, respectively. We continue to evaluate the effect on our results of operations and financial condition as a result of this bill and alternatives available to service customers in the California market. If we are unsuccessful in managing the transition of our California business and operations from affected installment loans to existing and alternative products, Assembly Bill 539 could have a material adverse effect on our business and results of operations.
Further, during 2018, the California Consumer Privacy Act (“CCPA”) was passed into law, effective January 1, 2020. CCPA broadens consumer rights with respect to their personal information, imposing expanded obligations to disclose the categories and uses of personal information a business collects, providing consumers a right to access that information, a right to opt out of the sale of personal information and the right to request that a business delete personal information about the consumer subject to certain exemptions. CCPA provides for civil penalties for violations, as well as a private right of action for data breaches, which may increase the costs of data breach litigation. CCPA containshas been subject to a numberhandful of ambiguities, was previously amendedamendments, of whichAB25 is the most impactful to us. Although AB25 sunsets January 2021, it narrows the definition of who constitutes a consumer, thereby excluding employees from CCPA rights other than notice and a private right of action for data breach. The State Attorney General has proposed regulations to help interpret the CCPA; final adoption is expected in February 2020. A potential ballot initiative may have additional impact should it make it to the polls in November 2020. Despite amendments and regulations, the CCPA remains ambiguous in many regards, and we anticipate further amendments before its effective date.both for CCPA and specifically addressing employee data next year. Other states and possibly the federal government may adopt laws similar to the CCPA. While it is too early to know its full impact, these developments could ultimately result in the imposition of requirements on CURO and other consumer financial service providers that could increases costs or otherwise adversely affect our business.
ITEMItem 2. UNREGISTERED SALES OF EQUITY SECURITIES AND USE OF PROCEEDSUnregistered Sales of Equity Securities and Use of Proceeds
The 2017 Incentive Plan permits the netting of common stock upon vesting of restricted stock units to satisfy individual tax withholding requirements. During the quarter ended JuneSeptember 30, 2019, we reacquired 2,790did not reacquire any shares of common stock with a weighted average fair market value of $12.14 as a result ofrelated to such tax withholdings.
In April 2019, the Company'sour Board of Directors authorized a share repurchase program providing for the repurchase of up to $50.0 million of itsour common stock. The repurchase program, which commencedbegan June 2019, will continue until completed or terminated. CURO expectsWe expect the purchases to be made from time-to-time in the open market, in privately negotiated transactions, or both, at the Company'sour discretion and subject to market conditions and other factors. Any repurchased shares will be available for use in connection with equity plans or other corporate purposes.
Separately, in August 2019, the Company entered into a Share Repurchase Agreement (the “Share Repurchase Agreement”) with FFL, a related party to the Company. Pursuant to the Share Repurchase Agreement, the Company repurchased 2,000,000 shares of its common stock, par value $0.001 per share, owned by FFL, in a private transaction at a purchase price equal to $13.55 per share of Common Stock. The purchase price was determined by using the Company's closing common stock price on August 29, 2019 of $13.97, less a discount of 3.0%. This transaction occurred outside of the share repurchase program authorized in April 2019.
The following table provides information with respect to purchases we made of our common stock during the quarter ended JuneSeptember 30, 2019.
|
| | | | | | | | | | |
| Period | Total Number of Shares Purchased(1) | Average Price Paid Per Share | Total Number of Shares Purchased as Part of Publicly Announced Plans or Programs | Dollar Value of Shares that may yet be Purchased under the Plans or Programs(2) (In milions)
|
| April 2019 | 2,790 |
| $ | 12.14 |
| — |
| $ | — |
|
| May 2019 | — |
| — |
| — |
| |
| June 2019 | — |
| — |
| 244,200 |
| 47.5 |
|
| Total | 2,790 |
| $ | 12.14 |
| 244,200 |
| $ | 47.5 |
|
(1) Represents shares withheld from employees as tax payments for shares issued under our stock-based compensation plans. See Note 11, "Share-Based Compensation" of the Notes to Consolidated Financial Statements for additional details on our stock-based compensation plans. |
| (2) As of the end of the period. |
|
| | | | | | | | | | |
| Period | Total Number of Shares Purchased | Average Price Paid Per Share | Total Number of Shares Purchased as Part of Publicly Announced Plans or Programs | Dollar Value of Shares that may yet be Purchased under the Plans or Programs(1)
(In millions)
|
| July 2019 | 907,500 |
| $ | 10.68 |
| 907,500 |
| $ | 37.8 |
|
| August 2019 | 611,694 |
| 13.33 |
| 611,694 |
| 29.6 |
|
| September 2019 | 392,847 |
| 14.28 |
| 392,847 |
| 24.0 |
|
| Total | 1,912,041 |
| $ | 12.27 |
| 1,912,041 |
| $ | 24.0 |
|
| (1) As of the end of the period. |
ITEMItem 3. DEFAULTS UPON SENIOR SECURITIESDefaults Upon Senior Securities
None.
ITEMItem 4. MINE SAFETY DISCLOSURESMine Safety Disclosures
None.
ITEMItem 5. OTHER INFORMATIONOther Information
(a) Disclosure of Unreported 8-K Information
None.
(b) Material Changes to Director Nominee Procedures
None.
ITEMItem 6. EXHIBITSExhibits
|
| | |
| Exhibit no. | | Exhibit Description |
| 3.1 | | |
| 3.2 | | |
| 10.1 | | |
| 10.2 | | |
| 10.3 | | |
| 10.4 | | |
| 10.5 | | |
| 10.6 | | |
| 31.1 | | |
| 31.2 | | |
| 32.1 | | |
| 101 | | The following unaudited financial information from the Company's Quarterly Report on Form 10-Q for the period ended JuneSeptember 30, 2019, filed with the SEC on August 5,November 4, 2019, formatted in Extensible Business Reporting Language (“XBRL”) includes: (i) Condensed Consolidated Balance Sheets at JuneSeptember 30, 2019 and December 31, 2018, (ii) Condensed Consolidated Statements of Operations for the quarter ended JuneSeptember 30, 2019 and 2018, (iii) Condensed Consolidated Statements of Comprehensive Income for the quarter ended JuneSeptember 30, 2019 and 2018, (iv) Condensed Consolidated Statements of Cash Flows for the quarter ended JuneSeptember 30, 2019 and 2018, and (v) Notes to Condensed Consolidated Financial Statements* |
* Filed herewith.
+ Indicates management contract or compensatory plan, contract or arrangement.
SIGNATURESignature
Pursuant to the requirements of Section 13 or 15(d) of the Securities Exchange Act of 1934, the Company has duly caused this report to be signed on its behalf by the undersigned, thereunto duly authorized.
Dated: August 5,November 4, 2019 CURO Group Holdings Corp.
|
| | | |
| | By: | /s/ Roger Dean | |
| | | Roger Dean | |
| | | Executive Vice-President and Chief Financial Officer |