8
| Nine Months Ended September 30, | |||||||
| 2019 | 2018 | ||||||
| Cash flows from operating activities | |||||||
| Net income from continuing operations | $ | 74,327 | $ | 1,041 | |||
| Adjustments to reconcile net income to net cash provided by continuing operating activities: | |||||||
| Depreciation and amortization | 14,180 | 13,628 | |||||
| Provision for loan losses | 338,262 | 290,922 | |||||
| Amortization of debt issuance costs and bond discount | 2,273 | 2,923 | |||||
| Deferred income tax (benefit) expense | (3,147 | ) | 3,005 | ||||
| Loss on disposal of property and equipment | 47 | 640 | |||||
| Loss on extinguishment of debt | — | 80,883 | |||||
| Loss from equity method investment | 5,132 | — | |||||
| Share-based compensation | 7,587 | 6,112 | |||||
| Changes in operating assets and liabilities: | |||||||
| Accrued interest on loans receivable | (11,446 | ) | (5,986 | ) | |||
| Prepaid expenses and other assets | 14,275 | 2,695 | |||||
| Other assets | (8,439 | ) | (2,458 | ) | |||
| Accounts payable and accrued liabilities | 13,596 | (4,862 | ) | ||||
| Deferred revenue | (533 | ) | (1,984 | ) | |||
| Income taxes payable | 25,117 | 326 | |||||
| Income taxes receivable | 5,598 | (12,908 | ) | ||||
| Accrued interest | (15,303 | ) | (18,060 | ) | |||
| Other liabilities | 2,767 | 1,162 | |||||
| Net cash provided by continuing operating activities | 464,293 | 357,079 | |||||
| Net cash (used in) provided by discontinued operating activities | (504 | ) | 5,562 | ||||
| Net cash provided by operating activities | 463,789 | 362,641 | |||||
| Cash flows from investing activities | |||||||
| Purchase of property, equipment and software | (8,667 | ) | (8,030 | ) | |||
| Loans receivable originated or acquired | (1,369,644 | ) | (1,624,881 | ) | |||
| Loans receivable repaid | 995,291 | 1,212,446 | |||||
| Investments in Cognical Holdings, Inc. ("Zibby") | (8,168 | ) | (958 | ) | |||
| Net cash used in continuing investing activities | (391,188 | ) | (421,423 | ) | |||
| Net cash used in discontinued investing activities | (14,213 | ) | (24,481 | ) | |||
| Net cash used in investing activities | (405,401 | ) | (445,904 | ) | |||
| Cash flows from financing activities | |||||||
| Net proceeds from issuance of common stock | — | 11,549 | |||||
| Proceeds from Non-Recourse U.S. SPV facility | — | 17,000 | |||||
| Payments on Non-Recourse U.S. SPV facility | — | (61,590 | ) | ||||
| Proceeds from Non-Recourse Canada SPV facility | 15,992 | 89,949 | |||||
| Payments on Non-Recourse Canada SPV facility | (24,835 | ) | — | ||||
| Payments on 12.00% Senior Secured Notes | — | (605,000 | ) | ||||
| Proceeds from 8.25% Senior Secured Notes | — | 690,000 | |||||
| Debt issuance costs paid | (198 | ) | (17,517 | ) | |||
| Proceeds from credit facilities | 179,811 | 65,169 | |||||
| Payments on credit facilities | (174,811 | ) | (36,169 | ) | |||
| Payments on subordinated stockholder debt | (2,252 | ) | — | ||||
| Payments of call premiums from early debt extinguishments | — | (63,350 | ) | ||||
| Proceeds from exercise of stock options | 87 | 408 | |||||
| Payments to net share settle restricted stock units vesting | (110 | ) | — | ||||
| Repurchase of common stock | (52,172 | ) | — | ||||
CURO GROUP HOLDINGS CORP. AND SUBSIDIARIES
CONDENSED CONSOLIDATED STATEMENT OF CASH FLOWS
(dollars in thousands, unaudited)
The following table provides a reconciliation of cash, cash equivalents and restricted cash reported within the unaudited Condensed Consolidated Balance Sheets as of September 30, 2020 and 2019 to the cash, cash equivalents and restricted cash used in the Statement of Cash Flows:
Net cash (used in) provided by financing activities (1) | (58,488 | ) | 90,449 | ||||
| Effect of exchange rate changes on cash and restricted cash | 1,204 | (4,080 | ) | ||||
| Net increase in cash and restricted cash | 1,104 | 3,106 | |||||
| Cash and restricted cash at beginning of period | 99,857 | 174,491 | |||||
| Cash and restricted cash at end of period | 100,961 | 177,597 | |||||
| Less: Cash and restricted cash of discontinued operations at end of period | — | 11,303 | |||||
| Cash and restricted cash of continuing operations at end of period | $ | 100,961 | $ | 166,294 | |||
| (1) Financing activities include continuing operations only, and were not impacted by discontinued operations | |||||||
| September 30, | ||||||||||||||
| 2020 | 2019 | |||||||||||||
| Cash and cash equivalents | $ | 207,071 | $ | 62,207 | ||||||||||
| Restricted cash (includes restricted cash of consolidated VIEs of $33,696 and $21,897 as of September 30, 2020 and September 30, 2019, respectively) | 62,527 | 38,754 | ||||||||||||
| Total cash, cash equivalents and restricted cash used in the Statement of Cash Flows | $ | 269,598 | $ | 100,961 | ||||||||||
See accompanying Notes to unaudited Condensed Consolidated Financial Statements.
9
CURO GROUP HOLDINGS CORP. AND SUBSIDIARIES
NOTES TO UNAUDITED CONDENSED CONSOLIDATED FINANCIAL STATEMENTS
NOTE 1 – SUMMARY OF SIGNIFICANT ACCOUNTING POLICIES AND NATURE OF OPERATIONS
Nature of Operations and Basis of Presentation
The terms “CURO" and the “Company” refer to CURO Group Holdings Corp. and its wholly-owned subsidiaries as a consolidated entity, except where otherwise stated.
CURO is a growth-oriented, technology-enabled, highly-diversified consumer finance company serving a wide range of underbankednon-prime consumers in the United States ("U.S."), Canada and, through February 25, 2019, the U.K.United Kingdom.
The Company has prepared the accompanying unaudited Condensed Consolidated Financial Statements ("Condensed Consolidated Financial Statements") in accordance with accounting principles generally accepted in the United States of America (“US GAAP”),U.S. GAAP, and with the accounting policies described in its Annual Report on2019 Form 10-K for the year ended December 31, 2018 filed with the Securities and Exchange Commission (the "SEC") on March 18, 2019 ("2018 Form 10-K"). Operating10-K. Interim results for the three and nine month periods ended September 30, 2019of operations are not necessarily indicative of the results that might be expected for any otherfuture interim periodperiods or for the fiscal year ending December 31, 2019.2020.
Certain information and note disclosures normally included in annual financial statements prepared in accordance with USU.S. GAAP have been condensed or omitted, although the Company believes that the disclosures are adequate to enable a reasonable understanding of the information presented. Additionally, in September 2018, and subsequently expanded in June 2019, the SEC changed the definition of a smaller reporting company ("SRC"). The change in definition ofCompany qualifies as an SRC, which allows more registrants to qualifyit to report information under scaledreduced SEC disclosure requirements. SRC status is determined on an annual basis as of the last business day of the most recently completed second fiscal quarter. Under these rules, CUROthe Company met the definition of an SRC as of June 30, 2019. Refer to "--FASB Definition2020, and it will reevaluate its status as of an SRC as related to the CECL standard and evaluation of the impact of the CECL standard" for information regarding the impact on the Company of meeting the definition of an SRC.June 30, 2021.
The unaudited Condensed Consolidated Financial Statements and the accompanying notes reflect all adjustments (consisting only of adjustments of a normal and recurring nature) which are, in the opinion of management, necessary to present fairly the Company's results of operations, financial position and cash flows for the periods presented. On February 25,
COVID-19
The COVID-19 pandemic, which surfaced in late 2019 and spread worldwide, including to the U.S. and Canada, continues to cause global uncertainty. Macroeconomic conditions, in general, and the Company's United Kingdom ("U.K.") segment,operations have been significantly affected by COVID-19 and there continues to be no reliable estimates of how long the pandemic will last or the scope or magnitude of its near-term or long-term impacts. Resurgences of the pandemic in various states and provinces in which the Company operates also adds uncertainty as definedjurisdictions establish or re-institute protocols to lessen the burden of these cases, as described further below. In recent months, efforts to produce a vaccine and more effective treatments for those that have been infected by ASC 280, was placed into administration, resultingCOVID-19 have progressed rapidly. However, it is not possible to predict if a viable vaccine will in fact be developed, the timing of any such vaccine, and the timing and ability to scale such a vaccine for the general population.
Federal, state/provincial, and local governments continue to monitor COVID-19 cases and resurgences. Decrees were issued by regional governmental entities prohibiting certain businesses from continuing to operate and certain classes of workers from reporting to work during the height of the pandemic or in cases of resurgences. Although CURO's operations are considered essential financial service under federal guidelines and most local regulations in both the U.S. and Canada, the Company experienced a decline in product demand as a result of the macroeconomic conditions, particularly in the treatmentsecond quarter of it as discontinued operations per ASC 205-20. Throughout this Quarterly Report on Form 10-Q ("Form 10-Q"), current and prior-period financial information presents2020, which reflected the U.K. segment as discontinued operations as required. For further information about the placementfirst full quarter of the segment into administration, referpandemic's impact in both countries. During the quarter ended September 30, 2020, CURO experienced a modest sequential increase in demand for its loan products as the effect of government stimulus programs in both countries subsided. The extent of the impact of COVID-19 on the Company's business is highly uncertain and difficult to "--Naturepredict, as information is rapidly evolving with respect to the duration and severity of Operations" below.
As a provider of an essential service, the Company remains focused on protecting the health and well-being of its employees, customers and the communities in which it operates, as well as assuring the continuity of its business operations. While CURO continues serving its customers through both store and online channels, store hours are reduced, enhanced cleaning protocols for all facilities are in place, and social distancing guidelines are in effect to aid in combating the spread of the pandemic.
10
CURO GROUP HOLDINGS CORP. AND SUBSIDIARIES
NOTES TO UNAUDITED CONDENSED CONSOLIDATED FINANCIAL STATEMENTS (continued)
U.S. Response to COVID-19
On March 27, 2020, the president of the United States signed the CARES Act into law. The CARES Act was intended to respond to the COVID-19 pandemic and its impact on the economy, public health, state and local governments, individuals, and businesses. The CARES Act also provides supplemental appropriations for federal agencies to respond to the COVID-19 pandemic.
The CARES Act modified the limitation on business interest expense and net operating loss provisions, and provided a payment delay of employer payroll taxes incurred after the date of enactment. The Company expects to delay payment of the Company's portion of the employees' Social Security payroll taxes, otherwise due in 2020 with 50% due by December 31, 2021 and the remaining 50% due by December 31, 2022.
The CARES Act also included two provisions that directly impacted the demand for the Company's loan products as well as its customers’ ability to make payments on their existing loans. The CARES Act included one-time payments of up to $1,200 per adult for individuals whose income was less than $99,000 (or $198,000 for tax joint filers), $500 per child under 17 years old, and up to $3,400 for a family of four if certain eligibility criteria were met. The CARES Act also provided unemployment benefit expansion, including (i) an additional $600 federal stimulus payment automatically added to each week of state benefits received between March 29 and July 25, 2020; (ii) expanded pandemic unemployment assistance coverage to self-employed workers, independent contractors, people with limited employment history and people who had used all of their regular unemployment insurance benefits; and (iii) pandemic emergency unemployment compensation, which extends unemployment insurance benefits from 26 weeks to 39 weeks within a 12-month benefit year.
With the expiration of the $600 federal stimulus payment on July 25, 2020, the president signed an executive order to extend unemployment benefits with an additional $300 per week from the federal government, which is subject to state-by-state implementation efforts. Although the $300 benefit was expected to remain through the end of 2020, most states exhausted the available funds under this plan by October 2020. However, four states in which CURO operates, (Nevada, Kansas, Virginia and Wisconsin), have yet to distribute additional funds under this executive order.
Canada Response to COVID-19
On March 18, 2020, the Canadian government announced a set of pandemic measures as part of the Government of Canada’s COVID-19 Economic Response Plan. This plan included several provisions that directly impacted the demand for the Company's products as well as its customers’ ability to make payments on their existing loans, including (i) the Canada Emergency Response Benefit, which provides a $2,000 benefit every four weeks for 24 weeks to eligible workers who become unemployed or under-employed as a result of COVID-19; (ii) a $300 per child Canada Child Benefit paid on May 20, 2020; (iii) a one-time special payment through Canada’s Goods and Services Tax credit for low and modest-income families that averages $400 for individuals and $600 for couples; and (iv) temporary wage increases for low-income essential workers funded at the federal level but disbursed at the provincial level. The Canada Emergency Response Benefit plan expired on September 26, 2020.
Under the Economic Response Plan, the Canadian government also expanded its Employment Insurance Program ("EI Program"), which provides up to $500 per week of temporary income support to unemployed workers while looking for employment by extending the period of time to determine if sufficient hours were worked to be eligible for this program. The expanded program remains active.
The Economic Response Plan also includes the Canada Recovery Benefit program, which provides $500 per week for up to 26 weeks for workers who have stopped working or had their income reduced by at least 50% due to COVID-19, and who are not necessarily indicative of results that may be expected for future interim periods oreligible for the year ending December 31, 2019.EI Program. This program remains active. Canadian citizens may apply for up to a total of 13 eligibility periods (26 weeks) between September 27, 2020 and September 25, 2021.
Principles of Consolidation
The unaudited Condensed Consolidated Financial Statements include the accounts of CURO and its wholly-owned subsidiaries. Intercompany transactions and balances have been eliminated in consolidation.
11
CURO GROUP HOLDINGS CORP. AND SUBSIDIARIES
NOTES TO UNAUDITED CONDENSED CONSOLIDATED FINANCIAL STATEMENTS (continued)
Ad Astra Acquisition
On January 3, 2020, the Company acquired 100% of the outstanding stock of Ad Astra, a related party, for $14.4 million, net of cash received. Prior to the acquisition, Ad Astra was the Company's exclusive provider of third-party collection services for owned and managed loans in the U.S. that are in later-stage delinquency. Ad Astra, now a wholly-owned subsidiary, is included in the unaudited Condensed Consolidated Financial Statements. Prior to the acquisition, all costs related to Ad Astra were included in "Other costs of providing services." Following the acquisition, operating costs for Ad Astra are included within "Corporate, district and other expenses," consistent with presentation of other internal collection costs. See Note 17, "Acquisition" for further information.
U.K. Segment Placed into Administration
On February 25, 2019, the Company placed its U.K. segment into administration, which resulted in the treatment of the U.K. segment as discontinued operations for all periods presented. Throughout this Form 10-Q, current and prior period financial information is presented on a continuing operations basis, excluding the results and positions of the U.K. segment. See Note 15, "Discontinued Operations" for additional information.
Equity InvestmentSecurity Investments in Unconsolidated EntityKatapult
Katapult is a privately-owned lease-to-own platform for online, brick and mortar and omni-channel retailers. Katapult provides the retailers' customers with payment options in store or via the Katapult link on a retailer's website.
During the ninethree months ended September 30, 2019, the Company invested an additional $6.6 million in Cognical Holdings, Inc. ("Zibby"), offset by a $3.7 million carrying value adjustment2020, as a result of additional investments, the additional investment.Company had a change in accounting methodology for its investments in preferred stock of Katapult from the equity method to the measurement alternative under ASC 321 for investments without a readily determinable fair value. As a result, these investments were reclassified from the equity method to investment at cost minus impairment. Other investments are considered in-substance common stock and continue to be accounted for under the equity method of accounting as of September 30, 2019,2020. The Company recognized 42.5% of Katapult's earnings for the quarter ended September 30, 2020 under the equity method of accounting, which is the Company's proportionate share recognized on a two-month lag. The Company owned 42.3% of Zibby.records both the equity method investment and the investment at cost minus impairment in "Investments" on the unaudited Condensed Consolidated Balance Sheets. See Note 8 - "Fair, "Fair Value Measurements"Measurements" for additional detail on Zibby's fair value considerations forregarding the nine months ended September 30, 2019.Company's investment in Katapult.
Use of Estimates
The preparation of the unaudited Condensed Consolidated Financial Statements in conformity with USU.S. GAAP requires management to make estimates and assumptions, including those impacted by COVID-19, that affect the reported amounts of assets and liabilities and the disclosure of contingent assets and liabilities at the date of the financial statements. EstimatesSome estimates may also affect the reported amounts of revenues and expenses during the periods reported. Some of the significantpresented. Significant estimates that the Company made in the accompanying unaudited Condensed Consolidated Financial Statements include allowances for loan losses, certain assumptions related to equity investments, goodwill and intangibles, accruals related to self-insurance, credit services organization ("CSO")CSO liability for losses and estimated tax liabilities. Actual results may differ from those estimates.
The Company records its allowance for loan losses comparedrelated to TDRs by discounting the estimated cash flows associated with the respective TDR at the effective interest rate immediately after the loan modification and records any difference between the discounted cash flows and the carrying value as an allowance adjustment. A loan that has been classified as a TDR remains so classified until the loan is paid off or charged off. A TDR is charged off consistent with the Company's policies for the related gross loans receivable balances that include accrued interest.
loan product. For additional information on the Company's loss recognition policy, see the Company's 2019 Form 10-K.
12
CURO GROUP HOLDINGS CORP. AND SUBSIDIARIES
NOTES TO UNAUDITED CONDENSED CONSOLIDATED FINANCIAL STATEMENTS (continued)
Loans Receivable on a Non-Accrual Basis
The Company has revisedmay place loans receivable on nonaccrual status due to statutory requirements or at management’s judgment if the timely collection of principal and interest becomes uncertain. After a loan is placed on nonaccrual status, no further interest is accrued. Loans are not typically returned to accrual status and thus remain on nonaccrual status until they are paid or charged off. Payments are applied initially to any outstanding past due loan balances prior to current loan balances. The Company's policy for determining past due status is consistent with that of the Company's accrual loans, depending on the product.
Goodwill
The annual impairment review for goodwill, performed annually as of October 1, consists of performing a qualitative assessment to determine whether it is more likely than not that a reporting unit’s fair value is less than its Condensed Consolidated Financial Statementscarrying amount, as a basis in turn for determining whether or not further testing is required. If the Company determines, on the basis of qualitative factors, that it is more likely than not that the fair value of the reporting unit is less than the carrying amount, the Company will then apply a two-step process of (i) determining the fair value of the reporting unit and (ii) comparing it to the carrying value of the net assets allocated to the reporting unit. When performing the two-step process, if the fair value of the reporting unit exceeds its carrying value, no further analysis or write-down of goodwill is required. In the event the estimated fair value of a reporting unit is less than the carrying value, the Company would recognize an impairment loss equal to such excess, which could significantly and adversely impact reported results of operations and stockholders’ equity. The Company may elect to bypass the qualitative assessment and proceed directly to the two-step process, for any reporting unit, in any period. The Company can resume the qualitative assessment for any reporting unit in any subsequent period.
During the fourth quarter of 2019, the Company performed a quantitative assessment for the U.S. and Canada reporting units. Management concluded that the estimated fair values of these 2 reporting units were greater than their respective carrying values. During the three and nine months ended September 30, 2018 presented in this Form 10-Q. A summary2020, the Company did 0t record an impairment related to goodwill. The Company has not yet completed its annual impairment review for goodwill, performed as of the correction follows (in thousands):October 1.
| Nine Months Ended September 30, 2018 | ||||
As Reported:(1) | ||||
| Net cash used in continuing operating activities | $ | (55,356 | ) | |
| Net cash used in continuing investing activities | (8,988 | ) | ||
| As Corrected: | ||||
| Net cash provided by continuing operating activities | 357,079 | |||
| Net cash used in continuing investing activities | (421,423 | ) | ||
| (1) "As reported" balances include amounts from continuing operations historically presented within these captions. | ||||
Recently Adopted Accounting Pronouncements
ASU 2016-022018-15
In February 2016, the Financial Accounting Standards Board ("FASB") established Topic 842, Leases, by issuing ASU No. 2016-02, which requires lessees to recognize leases on the balance sheet and disclose key information about leasing arrangements. The Company adopted the standard as of January 1, 2019 using the alternative modified retrospective method, also known as the transition relief method, permitted under ASU 2018-11, which allows companies to not recast comparative periods in the period of adoption. The Company elected the package of practical expedients permitted under the transition guidance which, among other things, permits companies to not reassess prior conclusions on lease identification, lease classification and initial direct costs. The Company also elected to combine lease and non-lease components and to exclude short-term leases, defined as having an initial term of 12 months or less, from the Condensed Consolidated Balance Sheets. The Company did not elect the hindsight practical expedient.
ASU 2018-13
In August 2018, the FASB issued ASU 2018-13, Disclosure Framework - Changes to the Disclosure Requirements for Fair Value Measurement (“ASU 2018-13”), which amends ASC 820, Fair Value Measurement. ASU 2018-13 modifies the disclosure requirements for fair value measurements by removing, modifying or adding certain disclosures. The Company adopted ASU 2018-13 as of January 1, 2020, which did not have a material impact on the unaudited Condensed Consolidated Financial Statements.
Recently Issued Accounting Pronouncements Not Yet Adopted
ASU 2016-13
In June 2016, the FASB issued ASU 2016-13, “Financial Instruments - Credit Losses (Topic 326): Measurement of Credit Losses on Financial Instruments,” and subsequent amendments to the guidance: ASU 2018-19 in November 2018, ASU 2019-04 in April 2019, and ASU 2019-05 in May 2019.2019, ASU 2019-10 and -11 in November 2019, and ASU 2020-02 in February
13
CURO GROUP HOLDINGS CORP. AND SUBSIDIARIES
NOTES TO UNAUDITED CONDENSED CONSOLIDATED FINANCIAL STATEMENTS (continued)
2020. The amended standard as amended, changes how entities will measure credit losses for most financial assets and certain other instruments that are not measured at fair value through net income. The standard will replace the current “incurred loss” approach with an “expected loss” model for instruments measured at amortized cost. For available-for-sale debt securities, entities will be required to record allowances rather than reduce the carrying amount, as they currently do under the
other-than-temporary impairment model. The standard also simplifies the accounting model for purchased credit-impaired debt securities and loans. The amendment will affect loans, debt securities, trade receivables, net investments in leases, off-balance sheet credit exposures, reinsurance receivables, and any other financial assets not excluded from the scope that have the contractual right to receive cash. ASU 2019-04 clarifies that equity instruments without readily determinable fair values for which an entity has elected the measurement alternative should be remeasured to fair value as of the date that an observable transaction occurred. ASU 2019-05 provides an option to irrevocably elect to measure certain individual financial assets at fair value instead of amortized cost. ASU 2019-10 amends the mandatory effective date for ASU 2016-13. The amendments are effective for fiscal years beginning after December 15, 2022 for entities that qualify as an SRC, for which the Company currently qualifies. ASU 2019-11 provides clarity and improves the codification to ASU 2016-13. The amendments should be applied on either a prospective transition or modified-retrospective approach depending on the subtopic. As issued, ASU 2016-13 is effective for annual periods beginning after December 15, 2019, and interim periods therein. Early adoption is permitted for annual periods beginning after December 15, 2018, and interim periods therein.permitted. The Company is evaluating its alternatives with respect to the available accounting methods under ASU 2016‑13,2016-13, including the fair value option. If the fair value option is not utilized, adoption of ASU 2016-13 will increase the allowance for credit losses, with a resulting negative adjustment to retained earnings on the date of adoption. Additionally, as disclosed below in "--FASB Definition of an SRC as related to the CECL standard and evaluation of the impact of the CECL standard", theThe Company expects to deferdeferred the adoption of ASU 2016-13 until at least January 1, 2021.as permitted under ASU 2019-10. The Company is currently assessing the impact that adoption of ASU 2016-13 will have on its unaudited Condensed Consolidated Financial Statements.
ASU 2019-052020-01
In MayJanuary 2020, the FASB issued ASU 2020-01, Investments-Equity Securities (Topic 321), Investments-Equity Method and Joint Ventures (Topic 323), and Derivatives and Hedging (Topic 815) (ASU 2020-01). ASU 2020-01 clarifies the interaction of the accounting for equity securities under Topic 321, the accounting for equity method investments in Topic 323, and the accounting for certain forward contracts and purchased options in Topic 815. ASU 2020-01 is effective for fiscal years beginning after December 15, 2020, and interim periods within those fiscal years. The Company is currently assessing the impact that adoption of ASU 2020-01 will have on its unaudited Condensed Consolidated Financial Statements.
ASU 2020-04
In March 2020, the FASB issued ASU 2020-04, “Reference Rate Reform - Facilitation of the Effects of Reference Rate Reform on Financial Reporting.” This ASU provides temporary optional expedients and exceptions to U.S. GAAP guidance on contract modifications and hedge accounting to ease the financial reporting burdens of the expected market transition from LIBOR and other interbank offered rates to alternative reference rates, such as the Secured Overnight Financing Rate. Entities can elect not to apply certain modification accounting requirements to contracts affected by this reference rate reform, if certain criteria are met. An entity that makes this election would not have to remeasure the contracts at the modification date or reassess a previous accounting determination. Entities also can elect various optional expedients that would allow them to continue applying hedge accounting for hedging relationships affected by reference rate reform, if certain criteria are met. The guidance is effective upon issuance and generally can be applied through December 31, 2022. The Company is currently assessing the impact that adoption of ASU 2020-04 will have on its unaudited Condensed Consolidated Financial Statements.
ASU 2019-12
In December 2019, the FASB issued ASU 2019-05, Financial Instruments - Credit Losses2019-12, “Income Taxes (Topic 326), which amends740): Simplifying the Accounting for Income Taxes” (Topic 740). The ASU 2016-13intends to allow companiessimplify various aspects related to irrevocably elect, upon adoption of ASU 2016-13, the fair value option on financial instruments that (i) were previously recorded at amortized costaccounting for income taxes and (ii) are within the scope of ASC 326-20 if the instruments are eligible for the fair value option under ASC 825-10. The fair value option election does not apply to held-to-maturity debt securities. Entities are required to make this election on an instrument-by-instrument basis. ASU 2019-05’s amendments should be applied on a modified-retrospective basis by means of a cumulative-effect adjustmentremoves certain exceptions to the opening balancegeneral principles in Topic 740. Additionally, the ASU clarifies and amends existing guidance to improve consistent application of retained earnings in the statement of financial position asits requirements. The amendments of the date that an entity adopted the amendments in ASU 2016-13. For entities that have adopted ASU 2016-13, the amendments in ASU 2019-05 are effective for fiscal years beginning after December 15, 2019, including2020, and interim periods therein. An entity may early adoptwithin those fiscal years. Early adoption is permitted. The adoption of ASU 2019-12 is not expected to have a material impact on the ASU in any interim period after its issuance if the entity has adopted ASU 2016-13. For all other entities, the effective date will be the same as the effective date for ASU 2016-13. The Company expects to elect the option to defer adoption to a later effective date, as further described below in "--FASB Definition of an SRC as related to the CECL standard and evaluation of the impact of the CECL standard." The Company is currently evaluating the methods and impact of adopting this new standard on theCompany's unaudited Condensed Consolidated Financial Statements.
14
CURO GROUP HOLDINGS CORP. AND SUBSIDIARIES
NOTES TO UNAUDITED CONDENSED CONSOLIDATED FINANCIAL STATEMENTS (continued)
NOTE 2 - VARIABLE INTEREST ENTITIES
The carrying amounts of consolidated VIEs' assets and liabilities associated with the VIE subsidiaries were as follows (in thousands):
| September 30, 2020 | December 31, 2019 | |||||||||||||
| Assets | ||||||||||||||
| Restricted cash | $ | 33,696 | $ | 17,427 | ||||||||||
| Loans receivable less allowance for loan losses | 274,059 | 220,067 | ||||||||||||
| Prepaid expenses and other | 1,165 | 0 | ||||||||||||
| Deferred tax assets | 100 | 0 | ||||||||||||
| Total Assets | $ | 309,020 | $ | 237,494 | ||||||||||
| Liabilities | ||||||||||||||
| Accounts payable and accrued liabilities | $ | 26,665 | $ | 13,462 | ||||||||||
| Deferred revenue | 137 | 46 | ||||||||||||
| Accrued interest | 983 | 871 | ||||||||||||
| Intercompany payable | 35,181 | 69,639 | ||||||||||||
| Debt | 119,894 | 112,221 | ||||||||||||
| Total Liabilities | $ | 182,860 | $ | 196,239 | ||||||||||
NOTE 3 – LOANS RECEIVABLE AND REVENUE
| September 30, 2019 | December 31, 2018 | |||||||
| Assets | ||||||||
| Restricted cash | $ | 21,897 | $ | 12,840 | ||||
| Gross loans receivable less allowance for loan losses | 206,158 | 136,187 | ||||||
| Total Assets | $ | 228,055 | $ | 149,027 | ||||
| Liabilities | ||||||||
| Accounts payable and accrued liabilities | $ | 7,259 | $ | 4,980 | ||||
| Deferred revenue | 44 | 40 | ||||||
| Accrued interest | 777 | 831 | ||||||
| Intercompany payable | 93,671 | 44,330 | ||||||
| Long-term debt | 102,483 | 107,479 | ||||||
| Total Liabilities | $ | 204,234 | $ | 157,660 | ||||
CURO's customers and overall credit performance have been impacted in 2020 as a result of COVID-19. During the third quarter of 2020, consumer demand gradually increased as stay-at-home and self-quarantine orders were lifted in some jurisdictions in response to lower COVID-19 infection rates and the expiration of governmental stimulus programs. Ongoing impacts from and risks related to COVID-19 have caused continued uncertainty regarding the performance of NCOs over the loss-development period as of September 30, 2020. The Company has maintained its historical allowance approach, but has adjusted estimates for changes in past-due gross loans receivable due to market conditions leading up to and at September 30, 2020 caused by COVID-19. The estimates and assumptions used to determine an appropriate allowance for loan losses and liability for losses on CSO lender-owned consumer loans are those that are available through the filing of this Form 10-Q and which are indicative of conditions as of September 30, 2020.
As a result of COVID-19, the Company enhanced its Customer Care Program and began modifying loans for borrowers that experienced financial distress, as discussed in more detail in Note 1, "Summary of Significant Accounting Policies and Nature of Operations" and the "TDR Loans Receivable" tables below.
15
CURO GROUP HOLDINGS CORP. AND SUBSIDIARIES
NOTES TO UNAUDITED CONDENSED CONSOLIDATED FINANCIAL STATEMENTS (continued)
The following table summarizes revenue by product for the periods indicated (in thousands):
| Three Months Ended September 30, | Nine Months Ended September 30, | |||||||||||||||||||||||||
| 2020 | 2019 | 2020 | 2019 | |||||||||||||||||||||||
| Unsecured Installment | $ | 67,408 | $ | 137,233 | $ | 260,328 | $ | 395,119 | ||||||||||||||||||
| Secured Installment | 16,692 | 28,270 | 62,379 | 81,823 | ||||||||||||||||||||||
| Open-End | 58,711 | 66,120 | 186,429 | 173,961 | ||||||||||||||||||||||
| Single-Pay | 25,084 | 49,312 | 92,973 | 141,605 | ||||||||||||||||||||||
| Ancillary | 14,108 | 16,329 | 43,209 | 46,995 | ||||||||||||||||||||||
Total revenue(1) | $ | 182,003 | $ | 297,264 | $ | 645,318 | $ | 839,503 | ||||||||||||||||||
| (1) Includes revenue from CSO programs of $36.7 million and $72.8 million for the three months ended September 30, 2020 and 2019, respectively, and $142.5 million and $199.9 million for the nine months ended September 30, 2020 and 2019, respectively. | ||||||||||||||||||||||||||
| Three Months Ended September 30, | Nine Months Ended September 30, | |||||||||||||||
| 2019 | 2018 | 2019 | 2018 | |||||||||||||
| Unsecured Installment | $ | 137,233 | $ | 137,660 | $ | 395,119 | $ | 377,976 | ||||||||
| Secured Installment | 28,270 | 28,562 | 81,823 | 81,195 | ||||||||||||
| Open-End | 66,120 | 40,290 | 173,961 | 94,735 | ||||||||||||
| Single-Pay | 49,312 | 50,614 | 141,605 | 169,296 | ||||||||||||
| Ancillary | 16,329 | 12,356 | 46,995 | 34,292 | ||||||||||||
| Total revenue | $ | 297,264 | $ | 269,482 | $ | 839,503 | $ | 757,494 | ||||||||
The following tables summarize Loansloans receivable by product and the related delinquent loans receivable at September 30, 2019 (in thousands):
| September 30, 2020 | ||||||||||||||||||||
Single-Pay(1) | Unsecured Installment | Secured Installment | Open-End | Total | ||||||||||||||||
| Current loans receivable | $ | 41,274 | $ | 67,017 | $ | 41,433 | $ | 290,427 | $ | 440,151 | ||||||||||
| Delinquent loans receivable | 0 | 17,942 | 7,542 | 31,807 | 57,291 | |||||||||||||||
| Total loans receivable | 41,274 | 84,959 | 48,975 | 322,234 | 497,442 | |||||||||||||||
| Less: allowance for losses | (3,197) | (18,859) | (7,109) | (51,417) | (80,582) | |||||||||||||||
| Loans receivable, net | $ | 38,077 | $ | 66,100 | $ | 41,866 | $ | 270,817 | $ | 416,860 | ||||||||||
| (1) Of the $41.3 million of Single-Pay receivables, $10.1 million relate to mandated extended payment options for certain Canada Single-Pay loans. | ||||||||||||||||||||
| September 30, 2019 | ||||||||||||||||
| Single-Pay | Unsecured Installment | Secured Installment | Open-End | Total | ||||||||||||
| Current loans receivable | $ | 78,039 | $ | 127,952 | $ | 72,866 | $ | 268,918 | $ | 547,775 | ||||||
| Delinquent loans receivable | — | 46,537 | 17,250 | 46,053 | 109,840 | |||||||||||
| Total loans receivable | 78,039 | 174,489 | 90,116 | 314,971 | 657,615 | |||||||||||
| Less: allowance for losses | (5,662 | ) | (38,127 | ) | (10,363 | ) | (54,233 | ) | (108,385 | ) | ||||||
| Loans receivable, net | $ | 72,377 | $ | 136,362 | $ | 79,753 | $ | 260,738 | $ | 549,230 | ||||||
| September 30, 2020 | |||||||||||||||||
| Unsecured Installment | Secured Installment | Open-End | Total | ||||||||||||||
| Delinquent loans receivable | |||||||||||||||||
| 0-30 days past due | $ | 7,098 | $ | 3,576 | $ | 14,988 | $ | 25,662 | |||||||||
| 31-60 days past due | 4,758 | 1,883 | 7,505 | 14,146 | |||||||||||||
| 61 + days past due | 6,086 | 2,083 | 9,314 | 17,483 | |||||||||||||
| Total delinquent loans receivable | $ | 17,942 | $ | 7,542 | $ | 31,807 | $ | 57,291 | |||||||||
| December 31, 2019 | ||||||||||||||||||||
Single-Pay(1) | Unsecured Installment | Secured Installment | Open-End | Total | ||||||||||||||||
| Current loans receivable | $ | 81,447 | $ | 117,682 | $ | 70,565 | $ | 285,452 | $ | 555,146 | ||||||||||
| Delinquent loans receivable | 0 | 43,100 | 17,510 | 50,072 | 110,682 | |||||||||||||||
| Total loans receivable | 81,447 | 160,782 | 88,075 | 335,524 | 665,828 | |||||||||||||||
| Less: allowance for losses | (5,869) | (35,587) | (10,305) | (55,074) | (106,835) | |||||||||||||||
| Loans receivable, net | $ | 75,578 | $ | 125,195 | $ | 77,770 | $ | 280,450 | $ | 558,993 | ||||||||||
| (1) Of the $81.4 million of Single-Pay receivables, $22.4 million relate to mandated extended payment options for certain Canada Single-Pay loans. | ||||||||||||||||||||
16
| September 30, 2019 | |||||||||||||
| Unsecured Installment | Secured Installment | Open-End | Total | ||||||||||
| Delinquent loans receivable | |||||||||||||
| 0-30 days past due | $ | 17,187 | $ | 7,456 | $ | 18,734 | $ | 43,377 | |||||
| 31-60 days past due | 13,890 | 4,711 | 13,283 | 31,884 | |||||||||
| 61 + days past due | 15,460 | 5,083 | 14,036 | 34,579 | |||||||||
| Total delinquent loans receivable | $ | 46,537 | $ | 17,250 | $ | 46,053 | $ | 109,840 | |||||
| December 31, 2018 | ||||||||||||||||
| Single-Pay | Unsecured Installment | Secured Installment | Open-End | Total | ||||||||||||
| Current loans receivable | $ | 80,823 | $ | 141,316 | $ | 75,583 | $ | 207,333 | $ | 505,055 | ||||||
| Delinquent loans receivable | — | 49,087 | 17,389 | — | 66,476 | |||||||||||
| Total loans receivable | 80,823 | 190,403 | 92,972 | 207,333 | 571,531 | |||||||||||
| Less: allowance for losses | (4,189 | ) | (37,716 | ) | (12,191 | ) | (19,901 | ) | (73,997 | ) | ||||||
| Loans receivable, net | $ | 76,634 | $ | 152,687 | $ | 80,781 | $ | 187,432 | $ | 497,534 | ||||||
CURO GROUP HOLDINGS CORP. AND SUBSIDIARIES
NOTES TO UNAUDITED CONDENSED CONSOLIDATED FINANCIAL STATEMENTS (continued)
| December 31, 2019 | |||||||||||||||||
| Unsecured Installment | Secured Installment | Open-End | Total | ||||||||||||||
| Delinquent loans receivable | |||||||||||||||||
| 0-30 days past due | $ | 15,369 | $ | 8,039 | $ | 21,823 | $ | 45,231 | |||||||||
| 31-60 days past due | 12,403 | 4,885 | 13,191 | 30,479 | |||||||||||||
| 61 + days past due | 15,328 | 4,586 | 15,058 | 34,972 | |||||||||||||
| Total delinquent loans receivable | $ | 43,100 | $ | 17,510 | $ | 50,072 | $ | 110,682 | |||||||||
| December 31, 2018 | ||||||||||
| Unsecured Installment | Secured Installment | Total | ||||||||
| Delinquent loans receivable | ||||||||||
| 0-30 days past due | $ | 17,850 | $ | 7,870 | $ | 25,720 | ||||
| 31-60 days past due | 14,705 | 4,725 | 19,430 | |||||||
| 61 + days past due | 16,532 | 4,794 | 21,326 | |||||||
| Total delinquent loans receivable | $ | 49,087 | $ | 17,389 | $ | 66,476 | ||||
The following tables summarize loans guaranteedGuaranteed by the Company under CSO programs and the related delinquent receivables at September 30, 2019 (in thousands):
| September 30, 2020 | ||||||||||||||||||||
| Unsecured Installment | Secured Installment | Total | ||||||||||||||||||
| Current loans receivable Guaranteed by the Company | $ | 32,869 | $ | 786 | $ | 33,655 | ||||||||||||||
| Delinquent loans receivable Guaranteed by the Company | 5,953 | 160 | 6,113 | |||||||||||||||||
| Total loans receivable Guaranteed by the Company | 38,822 | 946 | 39,768 | |||||||||||||||||
| Less: Liability for losses on CSO lender-owned consumer loans | (6,130) | (68) | (6,198) | |||||||||||||||||
| Loans receivable Guaranteed by the Company, net | $ | 32,692 | $ | 878 | $ | 33,570 | ||||||||||||||
| September 30, 2019 | ||||||||||
| Unsecured Installment | Secured Installment | Total | ||||||||
| Current loans receivable guaranteed by the Company | $ | 58,862 | $ | 1,966 | $ | 60,828 | ||||
| Delinquent loans receivable guaranteed by the Company | 11,842 | 396 | 12,238 | |||||||
| Total loans receivable guaranteed by the Company | 70,704 | 2,362 | 73,066 | |||||||
| Less: Liability for losses on CSO lender-owned consumer loans | (10,181 | ) | (68 | ) | (10,249 | ) | ||||
| Loans receivable guaranteed by the Company, net | $ | 60,523 | $ | 2,294 | $ | 62,817 | ||||
| September 30, 2020 | ||||||||||||||
| Unsecured Installment | Secured Installment | Total | ||||||||||||
| Delinquent loans receivable | ||||||||||||||
| 0-30 days past due | $ | 5,404 | $ | 111 | $ | 5,515 | ||||||||
| 31-60 days past due | 433 | 9 | 442 | |||||||||||
| 61+ days past due | 116 | 40 | 156 | |||||||||||
| Total delinquent loans receivable | $ | 5,953 | $ | 160 | $ | 6,113 | ||||||||
| December 31, 2019 | ||||||||||||||||||||
| Unsecured Installment | Secured Installment | Total | ||||||||||||||||||
| Current loans receivable Guaranteed by the Company | $ | 61,840 | $ | 1,944 | $ | 63,784 | ||||||||||||||
| Delinquent loans receivable Guaranteed by the Company | 12,477 | 392 | 12,869 | |||||||||||||||||
| Total loans receivable Guaranteed by the Company | 74,317 | 2,336 | 76,653 | |||||||||||||||||
| Less: Liability for losses on CSO lender-owned consumer loans | (10,553) | (70) | (10,623) | |||||||||||||||||
| Loans receivable Guaranteed by the Company, net | $ | 63,764 | $ | 2,266 | $ | 66,030 | ||||||||||||||
| December 31, 2019 | ||||||||||||||
| Unsecured Installment | Secured Installment | Total | ||||||||||||
| Delinquent loans receivable | ||||||||||||||
| 0-30 days past due | $ | 10,392 | $ | 326 | $ | 10,718 | ||||||||
| 31-60 days past due | 1,256 | 40 | 1,296 | |||||||||||
| 61 + days past due | 829 | 26 | 855 | |||||||||||
| Total delinquent loans receivable | $ | 12,477 | $ | 392 | $ | 12,869 | ||||||||
17
| September 30, 2019 | ||||||||||
| Unsecured Installment | Secured Installment | Total | ||||||||
| Delinquent loans receivable | ||||||||||
| 0-30 days past due | $ | 9,859 | $ | 330 | $ | 10,189 | ||||
| 31-60 days past due | 1,229 | 41 | 1,270 | |||||||
| 61+ days past due | 754 | 25 | 779 | |||||||
| Total delinquent loans receivable | $ | 11,842 | $ | 396 | $ | 12,238 | ||||
| December 31, 2018 | ||||||||||
| Unsecured Installment | Secured Installment | Total | ||||||||
| Current loans receivable guaranteed by the Company | $ | 65,743 | $ | 2,504 | $ | 68,247 | ||||
| Delinquent loans receivable guaranteed by the Company | 11,708 | 446 | 12,154 | |||||||
| Total loans receivable guaranteed by the Company | 77,451 | 2,950 | 80,401 | |||||||
| Less: Liability for losses on CSO lender-owned consumer loans | (11,582 | ) | (425 | ) | (12,007 | ) | ||||
| Loans receivable guaranteed by the Company, net | $ | 65,869 | $ | 2,525 | $ | 68,394 | ||||
CURO GROUP HOLDINGS CORP. AND SUBSIDIARIES
NOTES TO UNAUDITED CONDENSED CONSOLIDATED FINANCIAL STATEMENTS (continued)
| December 31, 2018 | ||||||||||
| Unsecured Installment | Secured Installment | Total | ||||||||
| Delinquent loans receivable | ||||||||||
| 0-30 days past due | $ | 9,684 | $ | 369 | $ | 10,053 | ||||
| 31-60 days past due | 1,255 | 48 | 1,303 | |||||||
| 61 + days past due | 769 | 29 | 798 | |||||||
| Total delinquent loans receivable | $ | 11,708 | $ | 446 | $ | 12,154 | ||||
The following table summarizes activity in the allowance for loan losses during the three months ended September 30, 2019 (in thousands):
| Three Months Ended September 30, 2019 | ||||||||||||||||||
| Single-Pay | Unsecured Installment | Secured Installment | Open-End | Other | Total | |||||||||||||
| Balance, beginning of period | $ | 4,941 | $ | 35,223 | $ | 9,996 | $ | 51,717 | $ | — | $ | 101,877 | ||||||
| Charge-offs | (40,512 | ) | (34,252 | ) | (10,592 | ) | (31,993 | ) | (1,382 | ) | (118,731 | ) | ||||||
| Recoveries | 26,599 | 5,279 | 2,445 | 3,791 | 845 | 38,959 | ||||||||||||
| Net charge-offs | (13,913 | ) | (28,973 | ) | (8,147 | ) | (28,202 | ) | (537 | ) | (79,772 | ) | ||||||
| Provision for losses | 14,736 | 31,891 | 8,514 | 31,220 | 537 | 86,898 | ||||||||||||
| Effect of foreign currency translation | (102 | ) | (14 | ) | — | (502 | ) | — | (618 | ) | ||||||||
| Balance, end of period | $ | 5,662 | $ | 38,127 | $ | 10,363 | $ | 54,233 | $ | — | $ | 108,385 | ||||||
| Allowance for loan losses as a percentage of gross loan receivables | 7.3 | % | 21.9 | % | 11.5 | % | 17.2 | % | N/A | 16.5 | % | |||||||
| Three Months Ended September 30, 2019 | |||||||||
| Unsecured Installment | Secured Installment | Total | |||||||
| Balance, beginning of period | $ | 9,433 | $ | 71 | $ | 9,504 | |||
| Charge-offs | (43,072 | ) | (888 | ) | (43,960 | ) | |||
| Recoveries | 7,156 | 580 | 7,736 | ||||||
| Net charge-offs | (35,916 | ) | (308 | ) | (36,224 | ) | |||
| Provision for losses | 36,664 | 305 | 36,969 | ||||||
| Balance, end of period | $ | 10,181 | $ | 68 | $ | 10,249 | |||
| Three Months Ended September 30, 2020 | ||||||||||||||||||||
| Single-Pay | Unsecured Installment | Secured Installment | Open-End | Other | Total | |||||||||||||||
| Allowance for loan losses: | ||||||||||||||||||||
| Balance, beginning of period | $ | 2,802 | $ | 18,798 | $ | 7,883 | $ | 47,319 | $ | 0 | $ | 76,802 | ||||||||
| Charge-offs | (21,473) | (14,781) | (6,648) | (22,781) | (972) | (66,655) | ||||||||||||||
| Recoveries | 17,034 | 5,186 | 2,635 | 4,618 | 498 | 29,971 | ||||||||||||||
| Net charge-offs | (4,439) | (9,595) | (4,013) | (18,163) | (474) | (36,684) | ||||||||||||||
| Provision for losses | 4,799 | 9,647 | 3,239 | 21,655 | 474 | 39,814 | ||||||||||||||
| Effect of foreign currency translation | 35 | 9 | 0 | 606 | 0 | 650 | ||||||||||||||
| Balance, end of period | $ | 3,197 | $ | 18,859 | $ | 7,109 | $ | 51,417 | $ | 0 | $ | 80,582 | ||||||||
| Liability for losses on CSO lender-owned consumer loans: | ||||||||||||||||||||
| Balance, beginning of period | $ | 0 | $ | 5,128 | $ | 36 | $ | 0 | $ | 0 | $ | 5,164 | ||||||||
| Increase in liability | 0 | (1,002) | (32) | 0 | 0 | (1,034) | ||||||||||||||
| Balance, end of period | $ | — | $ | 6,130 | $ | 68 | $ | 0 | $ | 0 | $ | 6,198 | ||||||||
| Three Months Ended September 30, 2019 | ||||||||||||||||||||
| Single-Pay | Unsecured Installment | Secured Installment | Open-End | Other | Total | |||||||||||||||
| Allowance for loan losses: | ||||||||||||||||||||
| Balance, beginning of period | $ | 4,941 | $ | 35,223 | $ | 9,996 | $ | 51,717 | $ | 0 | $ | 101,877 | ||||||||
| Charge-offs | (40,512) | (34,252) | (10,592) | (31,993) | (1,382) | (118,731) | ||||||||||||||
| Recoveries | 26,599 | 5,279 | 2,445 | 3,791 | 845 | 38,959 | ||||||||||||||
| Net charge-offs | (13,913) | (28,973) | (8,147) | (28,202) | (537) | (79,772) | ||||||||||||||
| Provision for losses | 14,736 | 31,891 | 8,514 | 31,220 | 537 | 86,898 | ||||||||||||||
| Effect of foreign currency translation | (102) | (14) | 0 | (502) | 0 | (618) | ||||||||||||||
| Balance, end of period | $ | 5,662 | $ | 38,127 | $ | 10,363 | $ | 54,233 | $ | 0 | $ | 108,385 | ||||||||
| Liability for losses on CSO lender-owned consumer loans: | ||||||||||||||||||||
| Balance, beginning of period | $ | 0 | $ | 9,433 | $ | 71 | $ | 0 | $ | 0 | $ | 9,504 | ||||||||
| (Increase) / decrease in liability | 0 | (748) | 3 | 0 | 0 | (745) | ||||||||||||||
| Balance, end of period | $ | 0 | $ | 10,181 | $ | 68 | $ | 0 | $ | 0 | $ | 10,249 | ||||||||
18
CURO GROUP HOLDINGS CORP. AND SUBSIDIARIES
NOTES TO UNAUDITED CONDENSED CONSOLIDATED FINANCIAL STATEMENTS (continued)
| Nine Months Ended September 30, 2020 | ||||||||||||||||||||
| Single-Pay | Unsecured Installment | Secured Installment | Open-End | Other | Total | |||||||||||||||
| Allowance for loan losses: | ||||||||||||||||||||
| Balance, beginning of period | $ | 5,869 | $ | 35,587 | $ | 10,305 | $ | 55,074 | $ | 0 | $ | 106,835 | ||||||||
| Charge-offs | (83,162) | (83,468) | (31,505) | (104,074) | (3,000) | (305,209) | ||||||||||||||
| Recoveries | 68,804 | 17,982 | 8,505 | 17,129 | 1,475 | 113,895 | ||||||||||||||
| Net charge-offs | (14,358) | (65,486) | (23,000) | (86,945) | (1,525) | (191,314) | ||||||||||||||
| Provision for losses | 11,850 | 48,766 | 19,804 | 83,987 | 1,525 | 165,932 | ||||||||||||||
| Effect of foreign currency translation | (164) | (8) | 0 | (699) | 0 | (871) | ||||||||||||||
| Balance, end of period | $ | 3,197 | $ | 18,859 | $ | 7,109 | $ | 51,417 | $ | 0 | $ | 80,582 | ||||||||
| Liability for losses on CSO lender-owned consumer loans: | ||||||||||||||||||||
| Balance, beginning of period | $ | 0 | $ | 10,553 | $ | 70 | $ | 0 | $ | 0 | $ | 10,623 | ||||||||
| Decrease in liability | 0 | 4,423 | 2 | 0 | 0 | 4,425 | ||||||||||||||
| Balance, end of period | $ | 0 | $ | 6,130 | $ | 68 | $ | 0 | $ | 0 | $ | 6,198 | ||||||||
| Nine Months Ended September 30, 2019 | ||||||||||||||||||||
| Single-Pay | Unsecured Installment | Secured Installment | Open-End | Other | Total | |||||||||||||||
| Allowance for loan losses: | ||||||||||||||||||||
| Balance, beginning of period | $ | 4,189 | $ | 37,716 | $ | 12,191 | $ | 19,901 | $ | 0 | $ | 73,997 | ||||||||
| Charge-offs | (112,792) | (115,825) | (33,558) | (66,319) | (4,075) | (332,569) | ||||||||||||||
| Recoveries | 78,811 | 16,963 | 8,261 | 14,487 | 2,565 | 121,087 | ||||||||||||||
| Net charge-offs | (33,981) | (98,862) | (25,297) | (51,832) | (1,510) | (211,482) | ||||||||||||||
| Provision for losses | 35,450 | 99,250 | 23,469 | 85,910 | 1,510 | 245,589 | ||||||||||||||
| Effect of foreign currency translation | 4 | 23 | 0 | 254 | 0 | 281 | ||||||||||||||
| Balance, end of period | $ | 5,662 | $ | 38,127 | $ | 10,363 | $ | 54,233 | $ | 0 | $ | 108,385 | ||||||||
| Liability for losses on CSO lender-owned consumer loans: | ||||||||||||||||||||
| Balance, beginning of period | $ | 0 | $ | 11,582 | $ | 425 | $ | 0 | $ | 0 | $ | 12,007 | ||||||||
| Decrease in liability | 0 | 1,401 | 357 | 0 | 0 | 1,758 | ||||||||||||||
| Balance, end of period | $ | 0 | $ | 10,181 | $ | 68 | $ | 0 | $ | 0 | $ | 10,249 | ||||||||
As of September 30, 2020, Installment and Open-End loans classified as nonaccrual were $5.4 million and $4.1 million, respectively. As of December 31, 2019, Installment and Open-End loans classified as nonaccrual were $16.6 million and $7.9 million, respectively. The Company's loans receivable inherently considers nonaccrual loans in its estimate of the allowance for loan losses as delinquencies are a primary input into the Company's roll rate-based model.
19
CURO GROUP HOLDINGS CORP. AND SUBSIDIARIES
NOTES TO UNAUDITED CONDENSED CONSOLIDATED FINANCIAL STATEMENTS (continued)
| Three Months Ended September 30, 2019 | ||||||||||||||||||
| Single-Pay | Unsecured Installment | Secured Installment | Open-End | Other | Total | |||||||||||||
| Balance, beginning of period | $ | 4,941 | $ | 44,656 | $ | 10,067 | $ | 51,717 | $ | — | $ | 111,381 | ||||||
| Charge-offs | (40,512 | ) | (77,324 | ) | (11,480 | ) | (31,993 | ) | (1,382 | ) | (162,691 | ) | ||||||
| Recoveries | 26,599 | 12,435 | 3,025 | 3,791 | 845 | 46,695 | ||||||||||||
| Net charge-offs | (13,913 | ) | (64,889 | ) | (8,455 | ) | (28,202 | ) | (537 | ) | (115,996 | ) | ||||||
| Provision for losses | 14,736 | 68,555 | 8,819 | 31,220 | 537 | 123,867 | ||||||||||||
| Effect of foreign currency translation | (102 | ) | (14 | ) | — | (502 | ) | — | (618 | ) | ||||||||
| Balance, end of period | $ | 5,662 | $ | 48,308 | $ | 10,431 | $ | 54,233 | $ | — | $ | 118,634 | ||||||
The following table summarizes activitybelow presents TDRs included in gross loans receivable and the impairment included in the allowance for loan losses (in thousands):
As of September 30, 2020 | ||||||||||||||||||||
| Current TDR gross receivables | $ | 14,085 | ||||||||||||||||||
| Delinquent TDR gross receivables | 6,547 | |||||||||||||||||||
| Total TDR gross receivables | 20,632 | |||||||||||||||||||
| Less: Impairment included in the allowance for loan losses | (6,622) | |||||||||||||||||||
| Less: Additional allowance | (2,086) | |||||||||||||||||||
| Outstanding TDR receivables, net of impairment | $ | 11,924 | ||||||||||||||||||
There were 0 TDR's as of December 31, 2019.
The tables below reflect new loans modified and classified as TDRs during the periods presented (in thousands):
| Three Months Ended September 30, 2020 | Nine Months Ended September 30, 2020 | |||||||||||||||||||||||||
| Pre-modification TDR loans receivable | $ | 9,007 | $ | 37,948 | ||||||||||||||||||||||
| Post-modification TDR loans receivable | 8,186 | 34,195 | ||||||||||||||||||||||||
| Total concessions included in gross charge-offs | $ | 821 | $ | 3,753 | ||||||||||||||||||||||
There were $5.1 million and $6.0 million of loans classified as TDRs that were charged off and included as a reduction in the allowance for loan losses during the three months ended September 30, 2018 (in thousands):
| Three Months Ended September 30, 2018 | ||||||||||||||||||
| Single-Pay | Unsecured Installment | Secured Installment | Open-End | Other | Total | |||||||||||||
| Balance, beginning of period | $ | 3,604 | $ | 30,291 | $ | 10,386 | $ | 9,717 | $ | — | $ | 53,998 | ||||||
| Charge-offs | (40,753 | ) | (32,115 | ) | (11,188 | ) | (32,770 | ) | (1,494 | ) | (118,320 | ) | ||||||
| Recoveries | 27,861 | 4,807 | 2,325 | 9,191 | 931 | 45,115 | ||||||||||||
| Net charge-offs | (12,892 | ) | (27,308 | ) | (8,863 | ) | (23,579 | ) | (563 | ) | (73,205 | ) | ||||||
| Provision for losses | 12,757 | 32,946 | 9,698 | 31,686 | 563 | 87,650 | ||||||||||||
| Effect of foreign currency translation | (179 | ) | 231 | — | 189 | — | 241 | |||||||||||
| Balance, end of period | $ | 3,290 | $ | 36,160 | $ | 11,221 | $ | 18,013 | $ | — | $ | 68,684 | ||||||
| Allowance for loan losses as a percentage of gross loan receivables | 4.3 | % | 19.5 | % | 12.3 | % | 9.8 | % | N/A | 12.8 | % | |||||||
| Three Months Ended September 30, 2018 | |||||||||
| Unsecured Installment | Secured Installment | Total | |||||||
| Balance, beginning of period | $ | 11,193 | $ | 426 | $ | 11,619 | |||
| Charge-offs | (44,896 | ) | (1,088 | ) | (45,984 | ) | |||
| Recoveries | 6,901 | 665 | 7,566 | ||||||
| Net charge-offs | (37,995 | ) | (423 | ) | (38,418 | ) | |||
| Provision for losses | 39,552 | 490 | 40,042 | ||||||
| Balance, end of period | $ | 12,750 | $ | 493 | $ | 13,243 | |||
| Three Months Ended September 30, 2018 | ||||||||||||||||||
| Single-Pay | Unsecured Installment | Secured Installment | Open-End | Other | Total | |||||||||||||
| Balance, beginning of period | $ | 3,604 | $ | 41,484 | $ | 10,812 | $ | 9,717 | $ | — | $ | 65,617 | ||||||
| Charge-offs | (40,753 | ) | (77,011 | ) | (12,276 | ) | (32,770 | ) | (1,494 | ) | (164,304 | ) | ||||||
| Recoveries | 27,861 | 11,708 | 2,990 | 9,191 | 931 | 52,681 | ||||||||||||
| Net charge-offs | (12,892 | ) | (65,303 | ) | (9,286 | ) | (23,579 | ) | (563 | ) | (111,623 | ) | ||||||
| Provision for losses | 12,757 | 72,498 | 10,188 | 31,686 | 563 | 127,692 | ||||||||||||
| Effect of foreign currency translation | (179 | ) | 231 | — | 189 | — | 241 | |||||||||||
| Balance, end of period | $ | 3,290 | $ | 48,910 | $ | 11,714 | $ | 18,013 | $ | — | $ | 81,927 | ||||||
| Nine Months Ended September 30, 2019 | ||||||||||||||||||
| Single-Pay | Unsecured Installment | Secured Installment | Open-End | Other | Total | |||||||||||||
| Balance, beginning of period | $ | 4,189 | $ | 37,716 | $ | 12,191 | $ | 19,901 | $ | — | $ | 73,997 | ||||||
| Charge-offs | (112,792 | ) | (115,825 | ) | (33,558 | ) | (66,319 | ) | (4,075 | ) | (332,569 | ) | ||||||
| Recoveries | 78,811 | 16,963 | 8,261 | 14,487 | 2,565 | 121,087 | ||||||||||||
| Net charge-offs | (33,981 | ) | (98,862 | ) | (25,297 | ) | (51,832 | ) | (1,510 | ) | (211,482 | ) | ||||||
| Provision for losses | 35,450 | 99,250 | 23,469 | 85,910 | 1,510 | 245,589 | ||||||||||||
| Effect of foreign currency translation | 4 | 23 | — | 254 | — | 281 | ||||||||||||
| Balance, end of period | $ | 5,662 | $ | 38,127 | $ | 10,363 | $ | 54,233 | $ | — | $ | 108,385 | ||||||
| Allowance for loan losses as a percentage of gross loan receivables | 7.3 | % | 21.9 | % | 11.5 | % | 17.2 | % | N/A | 16.5 | % | |||||||
The following table summarizes activity inbelow presents the liabilityCompany's average outstanding TDR loans receivable, interest income recognized on TDR loans and number of TDR loans for losses on CSO lender-owned consumer loans during the three and nine months ended September 30, 2019 (in2020 (dollars in thousands):
| Nine Months Ended September 30, 2019 | |||||||||
| Unsecured Installment | Secured Installment | Total | |||||||
| Balance, beginning of period | $ | 11,582 | $ | 425 | $ | 12,007 | |||
| Charge-offs | (118,617 | ) | (2,647 | ) | (121,264 | ) | |||
| Recoveries | 24,794 | 2,039 | 26,833 | ||||||
| Net charge-offs | (93,823 | ) | (608 | ) | (94,431 | ) | |||
| Provision for losses | 92,422 | 251 | 92,673 | ||||||
| Balance, end of period | $ | 10,181 | $ | 68 | $ | 10,249 | |||
| Three Months Ended September 30, 2020 | Nine Months Ended September 30, 2020 | |||||||||||||||||||||||||
Average outstanding TDR loans receivable (1) | $ | 20,484 | $ | 21,011 | ||||||||||||||||||||||
| Interest income recognized | 6,510 | 10,907 | ||||||||||||||||||||||||
| Number of TDR loans | 5,361 | 22,190 | ||||||||||||||||||||||||
| (1) For the three months ended September 30, 2020, the average is calculated using a simple average of the ending TDR balance as of June 30, 2020 and September 30, 2020. For the nine months ended September 30, 2020, the average is calculated based on the amount immediately after the loan was classified as a TDR and the ending TDR balance as of September 30, 2020 as there were 0 TDRs prior to April 1, 2020. | ||||||||||||||||||||||||||
| Nine Months Ended September 30, 2019 | ||||||||||||||||||
| Single-Pay | Unsecured Installment | Secured Installment | Open-End | Other | Total | |||||||||||||
| Balance, beginning of period | $ | 4,189 | $ | 49,298 | $ | 12,616 | $ | 19,901 | $ | — | $ | 86,004 | ||||||
| Charge-offs | (112,792 | ) | (234,442 | ) | (36,205 | ) | (66,319 | ) | (4,075 | ) | (453,833 | ) | ||||||
| Recoveries | 78,811 | 41,757 | 10,300 | 14,487 | 2,565 | 147,920 | ||||||||||||
| Net charge-offs | (33,981 | ) | (192,685 | ) | (25,905 | ) | (51,832 | ) | (1,510 | ) | (305,913 | ) | ||||||
| Provision for losses | 35,450 | 191,672 | 23,720 | 85,910 | 1,510 | 338,262 | ||||||||||||
| Effect of foreign currency translation | 4 | 23 | — | 254 | — | 281 | ||||||||||||
| Balance, end of period | $ | 5,662 | $ | 48,308 | $ | 10,431 | $ | 54,233 | $ | — | $ | 118,634 | ||||||
| Nine Months Ended September 30, 2018 | ||||||||||||||||||
| Single-Pay | Unsecured Installment | Secured Installment | Open-End | Other | Total | |||||||||||||
| Balance, beginning of period | $ | 5,204 | $ | 38,977 | $ | 13,472 | $ | 6,426 | $ | — | $ | 64,079 | ||||||
| Charge-offs | (126,328 | ) | (98,946 | ) | (33,755 | ) | (76,926 | ) | (4,474 | ) | (340,429 | ) | ||||||
| Recoveries | 88,945 | 15,110 | 7,487 | 30,451 | 2,728 | 144,721 | ||||||||||||
| Net charge-offs | (37,383 | ) | (83,836 | ) | (26,268 | ) | (46,475 | ) | (1,746 | ) | (195,708 | ) | ||||||
| Provision for losses | 35,750 | 80,904 | 24,017 | 57,962 | 1,746 | 200,379 | ||||||||||||
| Effect of foreign currency translation | (281 | ) | 115 | — | 100 | — | (66 | ) | ||||||||||
| Balance, end of period | $ | 3,290 | $ | 36,160 | $ | 11,221 | $ | 18,013 | $ | — | $ | 68,684 | ||||||
| Allowance for loan losses as a percentage of gross loan receivables | 4.3 | % | 19.5 | % | 12.3 | % | 9.8 | % | N/A | 12.8 | % | |||||||
| Nine Months Ended September 30, 2018 | |||||||||
| Unsecured Installment | Secured Installment | Total | |||||||
| Balance, beginning of period | $ | 17,073 | $ | 722 | $ | 17,795 | |||
| Charge-offs | (119,632 | ) | (3,300 | ) | (122,932 | ) | |||
| Recoveries | 25,227 | 2,610 | 27,837 | ||||||
| Net charge-offs | (94,405 | ) | (690 | ) | (95,095 | ) | |||
| Provision for losses | 90,082 | 461 | 90,543 | ||||||
| Balance, end of period | $ | 12,750 | $ | 493 | $ | 13,243 | |||
| Nine Months Ended September 30, 2018 | ||||||||||||||||||
| Single-Pay | Unsecured Installment | Secured Installment | Open-End | Other | Total | |||||||||||||
| Balance, beginning of period | $ | 5,204 | $ | 56,050 | $ | 14,194 | $ | 6,426 | $ | — | $ | 81,874 | ||||||
| Charge-offs | (126,328 | ) | (218,578 | ) | (37,055 | ) | (76,926 | ) | (4,474 | ) | (463,361 | ) | ||||||
| Recoveries | 88,945 | 40,337 | 10,097 | 30,451 | 2,728 | 172,558 | ||||||||||||
| Net charge-offs | (37,383 | ) | (178,241 | ) | (26,958 | ) | (46,475 | ) | (1,746 | ) | (290,803 | ) | ||||||
| Provision for losses | 35,750 | 170,986 | 24,478 | 57,962 | 1,746 | 290,922 | ||||||||||||
| Effect of foreign currency translation | (281 | ) | 115 | — | 100 | — | (66 | ) | ||||||||||
| Balance, end of period | $ | 3,290 | $ | 48,910 | $ | 11,714 | $ | 18,013 | $ | — | $ | 81,927 | ||||||
NOTE 4 – CREDIT SERVICES ORGANIZATION
The CSO fee receivables under CSO programs were $13.4$4.6 million and $14.3$14.7 million at September 30, 20192020 and December 31, 2018, respectively.2019, respectively, and are reflected in "Prepaid expenses and other" in the unaudited Condensed Consolidated Balance Sheets. The Company bears the risk of loss through its guarantee to purchase specific customer loans that are in default with the lenders. The terms of these loans range up to six months. See Note 1, "Summary of Significant Accounting Policies and Nature of Operations" of the 20182019 Form 10-K for further details of the Company's accounting policy.
As of September 30, 20192020 and December 31, 2018,2019, the incremental maximum amount payable under all such guarantees was $60.4$32.8 million and $66.9$62.7 million, respectively. If the Company is required to pay any portion of the total amount of the loans it has guaranteed, it will attempt to recover some or the entire amount or a portion from the applicable customers. The Company holds no collateral in respect of the guarantees. The Company estimates a liability for losses associated with the guaranty provided to the CSO lenders, using assumptions and methodologies similar to the Allowance for loan losses, which it recognizes for its consumer loans. Liability for incurred losses on CSO loans Guaranteed by the Company was $10.2$6.2 million and $12.0$10.6 million at September 30, 20192020 and December 31, 2018,2019, respectively.
20
CURO GROUP HOLDINGS CORP. AND SUBSIDIARIES
NOTES TO UNAUDITED CONDENSED CONSOLIDATED FINANCIAL STATEMENTS (continued)
The Company placed $5.9$4.9 million and $17.2$6.2 million in collateral accounts for the benefit of lenders at September 30, 20192020 and December 31, 2018,2019, respectively, which is reflected in "Prepaid expenses and other" in the unaudited Condensed Consolidated Balance Sheets. The balances required to be maintained in these collateral accounts vary by lender, typically based on a percentage of the outstanding loan balances held by the lender. The percentage of outstanding loan balances required for collateral is negotiated between the Company and each such lender.
Deferred revenue associated with the CSO program was immaterial as of September 30, 2020 and December 31, 2019 and there were no costs to obtain, or costs to fulfill, capitalized under the program. See Note 3, "Loans Receivable and Revenue" for additional information related to loan balances and the revenue recognized under the program.
NOTE 5 – DEBT
Debt consisted of the following (in thousands):
| September 30, 2020 | December 31, 2019 | |||||||||||||
| 8.25% Senior Secured Notes | $ | 679,566 | $ | 678,323 | ||||||||||
| Non-Recourse U.S. SPV Facility | 28,884 | 0 | ||||||||||||
| Non-Recourse Canada SPV Facility | 91,010 | 112,221 | ||||||||||||
| Debt | $ | 799,460 | $ | 790,544 | ||||||||||
| September 30, 2019 | December 31, 2018 | |||||||
| 8.25% Senior Secured Notes (due 2025) | $ | 677,924 | $ | 676,661 | ||||
| Non-Recourse Canada SPV Facility | 102,483 | 107,479 | ||||||
| Senior Revolver | 25,000 | 20,000 | ||||||
| Debt | $ | 805,407 | $ | 804,140 | ||||
8.25% Senior Secured Notes
In August 2018, the Company issued $690.0 million of 8.25% Senior Secured Notes which mature on September 1, 2025 ("8.25% Senior Secured Notes").2025. Interest on the notes is payable semiannually, in arrears, on March 1 and September 1. In connection with the 8.25% Senior Secured Notes, the remaining balance of capitalized financing costs of $12.1$10.4 million, net of amortization, is included in the unaudited Condensed Consolidated Balance Sheets as a component of "Debt." These costs are amortized over the term of the 8.25% Senior Secured Notes as a component of interest expense.
Non-Recourse U.S. SPV Facility
In April 2020, Curo Receivables Finance II, LLC, a bankruptcy-remote special purpose vehicle (the “U.S. SPV Borrower”) and an indirect wholly-owned subsidiary of the Company, entered into the Non-Recourse U.S. SPV Facility with Midtown Madison Management LLC, as administrative agent, and Atalaya Asset Income Fund VI LP, as the initial lender. As of September 30, 2020, the Non-Recourse U.S. SPV Facility provided for $200.0 million of borrowing capacity, which was increased from $100.0 million on July 31, 2020 after obtaining additional commitments.
The proceedsNon-Recourse U.S. SPV Facility is secured by a first lien against all assets of this issuance were usedthe U.S. SPV Borrower. The lenders will make advances against the principal balance of the eligible Installment, Open-End and bank partner loans sold to the U.S. SPV Borrower. Interest accrues at an annual rate of one-month LIBOR (with a floor of 1.65%) plus the lesser of (a) 6.95% and (b) the sum of (i) 6.25% on balances up to redeem$145.5 million, and (ii) 9.75% on balances greater than $145.5 million. The U.S. SPV Borrower will pay the outstanding 12.00% Senior Secured Noteslenders additional interest if it does not borrow minimum specified percentages of CFTC, (ii) to repaythe available commitments and a monthly 0.50% per annum commitment fee on the unused portion of the commitments. The Non-Recourse U.S. SPV Facility may not be prepaid prior to April 8, 2021. Prepayments incur a fee equal to (a) prior to September 8, 2021, 3.0% of the aggregate commitments, (b) thereafter, until March 8, 2022, 2.0% of the aggregate commitments, and (c) thereafter, 0. The Company is currently evaluating the impact of the expected transition from LIBOR to alternative reference rates.
As of September 30, 2020, outstanding indebtednessborrowers under the five-year revolving credit facilityNon-Recourse U.S. SPV Facility were $28.9 million, net of CURO Receivables Finance I, LLC, a wholly-deferred financing costs of $6.3 million. For further information on the Non-Recourse U.S. SPV Facility, refer to Note 2, "Variable Interest Entities."
21
CURO GROUP HOLDINGS CORP. AND SUBSIDIARIES
NOTES TO UNAUDITED CONDENSED CONSOLIDATED FINANCIAL STATEMENTS (continued)
Non-Recourse Canada SPV Facility
On August 2, 2018, CURO Canada Receivables Limited Partnership, a newly created, bankruptcy-remote special purpose vehicle (the "Canada SPV Borrower") and a wholly-owned subsidiary, entered into a four-year revolving credit facilitythe Non-Recourse Canada SPV Facility with Waterfall Asset Management, LLC that provided for C$175.0 million of initial borrowing capacity and the ability to expand such capacity up to C$250.0 million ("Non-Recourse Canada SPV Facility").million. The loans bear interest at an annual rate of 6.75% plus the three-month CDOR. The Canada SPV Borrower also pays a 0.50% per annum commitment fee on the unused portion of the commitments. In April 2019, the facility's maturity date was extended one year, to September 2, 2023.
As of September 30, 2019,2020, outstanding borrowings under the Non-Recourse Canada SPV Facility were $102.5$91.0 million, net of deferred financing costs of $3.3$2.1 million. For further information on the Non-Recourse Canada SPV, refer to Note 2, "Variable Interest Entities."
Senior Revolver
The terms of the Senior Revolver require that its outstanding balance be zero0 for at least 30 consecutive days in each calendar year. The Senior Revolver is guaranteed by all subsidiaries that guarantee the 8.25% Senior Secured Notes and is secured by a lien on substantially all assets of CURO and the guarantor subsidiaries that is senior to the lien securing the 8.25% Senior Secured Notes. Additionally, the negative covenants of the Senior Revolver generally conform to the related provisions in the Indenture for the 8.25% Senior Secured Notes. The revolver had an outstanding balance of $25.0 million at September 30, 2019.
The Senior Revolver contains various conditions to borrowing and affirmative, negative and financial maintenance covenants. Certain of the more significant covenants are (i) minimum eligible collateral value, (ii) consolidated interest coverage ratio and (iii) consolidated leverage ratio. The Senior Revolver also contains various events of default, the occurrence of which could result in termination of the lenders’ commitments to lend and the acceleration of all obligations under the Senior Revolver.
Cash Money Revolving Credit Facility
Cash Money Cheque Cashing, Inc., a Canadian subsidiary ("maintains the Cash Money"), maintainsMoney Revolving Credit Facility, a C$10.0 million revolving credit facility with Royal Bank of Canada, (the "Cash Money Revolving Credit Facility"), which provides short-term liquidity required to meet the working capital needs of the Company's Canadian operations. Aggregate draws under the revolving credit facility are limited to the lesser of: (i) the borrowing base, which is defined as athe percentage of cash, deposits in transit and accounts receivable, and (ii) C$10.0 million. As of September 30, 2019,2020, the borrowing capacity under the Cash Money Revolving Credit Facility which was C$9.79.9 million, net of C$0.30.1 million in outstanding stand-by-letters of credit.
The Cash Money Revolving Credit Facility is collateralized by substantially all of Cash Money’s assets and contains various covenants that require, among other things, that the aggregate borrowings outstanding under the facility not exceed the borrowing base, as well as restrictions on the encumbrance of assets and the creation of indebtedness. Borrowings under the Cash Money Revolving Credit Facility bear interest per annum at the prime rate of a Canadian chartered bank plus 1.95%.
The Cash Money Revolving Credit Facility was undrawn at September 30, 2019 and December 31, 2018.2020.
NOTE 6 – SHARE-BASED COMPENSATION
The Company's stockholder-approved 2017 Incentive Plan provides for the issuance of up to 5.0 million shares, subject to certain adjustment provisions,adjustments, which may be issued in the form of stock options, restricted stock awards, restricted stock units (“RSUs”),RSUs, stock appreciation rights, performance awards and other awards that may be settled in or based on common stock. Awards may be granted to officers, employees, consultants and directors. The 2017 Incentive Plan provides that shares of common stock subject to awards granted become available for re-issuance if such awards expire, terminate, are canceled for any reason or are forfeited by the recipient.
22
CURO GROUP HOLDINGS CORP. AND SUBSIDIARIES
NOTES TO UNAUDITED CONDENSED CONSOLIDATED FINANCIAL STATEMENTS (continued)
Restricted Stock Units
Grants of time-based RSUs are valued at the date of grant based on the valueclosing market price of common stock and are expensed using the straight-line method over the service period. TheseTime-based RSUs are subject to time-based vesting and typically vest over a three-year period.
Grants of market-based RSUs are valued using the Monte Carlo simulation pricing model. In March 2019, the Company awardedThe market-based RSUs designedgranted to drive the performance of the management team toward achievement of key corporate objectives. The market-based RSUsdate vest after three years depending uponif the Company's total stockholder return over the three-year performance period meets a specified target relative to other companies in its selected peer group. Expense recognition for the market-based awardsRSUs occurs over the service period using the straight-line method.
A summary of the statusactivity of time-based and market-based unvested RSUs as of September 30, 20192020 and changes during the nine months ended September 30, 20192020 are presented in the following table:
| Number of RSUs | ||||||||||||||
| Time-Based | Market-Based | Weighted Average Grant Date Fair Value per Share | ||||||||||||
| December 31, 2019 | 1,061,753 | 394,861 | $ | 11.47 | ||||||||||
| Granted | 679,413 | 368,539 | 10.42 | |||||||||||
| Vested | (308,140) | 0 | 11.34 | |||||||||||
| Forfeited | (24,025) | (4,687) | 11.99 | |||||||||||
| September 30, 2020 | 1,409,001 | 758,713 | $ | 10.97 | ||||||||||
| Number of RSUs | ||||||||
| Time-Based | Market-Based | Weighted Average Grant Date Fair Value per Share | ||||||
| December 31, 2018 | 1,060,350 | — | $ | 14.29 | ||||
| Granted | 598,114 | 397,752 | 10.08 | |||||
| Vested | (83,481 | ) | — | 15.59 | ||||
| Forfeited | (68,778 | ) | — | 14.05 | ||||
| September 30, 2019 | 1,506,205 | 397,752 | $ | 12.04 | ||||
Share-based compensation expense for the three months ended September 30, 20192020 and 2018,2019, which includes compensation costs from stock options and RSUs, was $2.8$3.4 million and $2.1$2.8 million, respectively, and during the nine months ended September 30, 2020 and 2019 was $9.9 million and 2018 was $7.6 million, and $6.1 million, respectively, andrespectively. Share-based compensation expense is included in the unaudited Condensed Consolidated Statements of Operations as a component of "Corporate, district and other expenses."
As of September 30, 2019,2020, there was $16.0$13.8 million of total unrecognized compensation cost related to stock options and RSUs, of which $12.9$9.3 million related to time-based RSUs and $2.8$4.4 million related to market-based RSUs. Total unrecognized compensation costs will be recognized over a weighted-average period of 1.71.8 years.
NOTE 7 – INCOME TAXES
The Company's effective income tax rate was 27.9%3.0% and (34.8)%27.9% for the nine months ended September 30, 2020 and 2019, and 2018, respectively.
The Company intends to reinvest Canada earnings indefinitely in its Canadian operations and therefore has not provided for any non-U.S. withholding tax that would be assessed on dividend distributions. If the earnings in Canada of $153.6$187.1 million were distributed to the U.S., legal entities, the Company would be subject to Canadian withholding taxes of an estimated $7.7$9.4 million. In the event the earnings were distributed to the U.S., legal entities, the Company would adjust the income tax provision for the applicable period and would determine the amount of foreign tax credit that would be available.
CURO GROUP HOLDINGS CORP. AND SUBSIDIARIES
NOTES TO UNAUDITED CONDENSED CONSOLIDATED FINANCIAL STATEMENTS (continued)
NOTE 8 – FAIR VALUE MEASUREMENTS
Fair value is defined as the price that would be received to sell an asset or paid to transfer a liability in an orderly transaction between market participants. The Company is required to use valuation techniques that are consistent with the market approach, income approach and/or cost approach. Inputs to valuation techniques refer to the assumptions that market participants would use in pricing the asset or liability based on observable market data obtained from independent sources, or unobservable, meaning those that reflect the Company's own estimate about the assumptions market participants would use in pricing the asset or liability based on the best information available in the circumstances. Accounting standards establish a three-level fair value hierarchy based upon the assumptions (inputs) used to price assets or liabilities. The hierarchy requires the Company to maximize the use of observable inputs and minimize the use of unobservable inputs.
The three levels of inputs used to measure fair value are listed below.
Level 1 – Inputs are unadjusted quoted prices in active markets for identical assets or liabilities that the Company has access to at the measurement date.
Level 2 – Inputs include quoted market prices for similar assets or liabilities in active markets, quoted prices for identical or similar assets or liabilities in markets that are not active, inputs other than quoted prices that are observable for the asset or liability and inputs that are derived principally from or corroborated by observable market data by correlation or other means (market corroborated inputs).
Level 3 – Unobservable inputs reflecting the Company's own judgments about the assumptions market participants would use in pricing the asset or liability since limited market data exists. The Company develops these inputs based on the best information available, including its own data.
Financial Assets and Liabilities Carried at Fair Value
The table below presents the assets and liabilities that were carried at fair value on the unaudited Condensed Consolidated Balance Sheets at September 30, 20192020 (in thousands):
| Estimated Fair Value | |||||||||||||||||
| Carrying Value September 30, 2020 | Level 1 | Level 2 | Level 3 | Total | |||||||||||||
| Financial assets: | |||||||||||||||||
| Cash Surrender Value of Life Insurance | $ | 6,757 | $ | 6,757 | $ | 0 | $ | 0 | $ | 6,757 | |||||||
| Financial liabilities: | |||||||||||||||||
| Non-qualified deferred compensation plan | $ | 4,474 | $ | 4,474 | $ | 0 | $ | 0 | $ | 4,474 | |||||||
| Estimated Fair Value | |||||||||||||||
| Carrying Value September 30, 2019 | Level 1 | Level 2 | Level 3 | Total | |||||||||||
| Financial assets: | |||||||||||||||
| Cash Surrender Value of Life Insurance | $ | 5,799 | $ | 5,799 | $ | — | $ | — | $ | 5,799 | |||||
| Financial liabilities: | |||||||||||||||
| Non-qualified deferred compensation plan | $ | 4,333 | $ | 4,333 | $ | — | $ | — | $ | 4,333 | |||||
The table below presents the assets and liabilities that were carried at fair value on the unaudited Condensed Consolidated Balance Sheets at December 31, 20182019 (in thousands):
| Estimated Fair Value | |||||||||||||||||
| Carrying Value December 31, 2019 | Level 1 | Level 2 | Level 3 | Total | |||||||||||||
| Financial assets: | |||||||||||||||||
| Cash Surrender Value of Life Insurance | $ | 6,171 | $ | 6,171 | $ | 0 | $ | 0 | $ | 6,171 | |||||||
| Financial liabilities: | |||||||||||||||||
| Non-qualified deferred compensation plan | $ | 4,666 | $ | 4,666 | $ | 0 | $ | 0 | $ | 4,666 | |||||||
24
| Estimated Fair Value | |||||||||||||||
| Carrying Value December 31, 2018 | Level 1 | Level 2 | Level 3 | Total | |||||||||||
Financial assets: (1) | |||||||||||||||
| Cash Surrender Value of Life Insurance | $ | 4,790 | $ | 4,790 | $ | — | $ | — | $ | 4,790 | |||||
| Financial liabilities: | |||||||||||||||
| Non-qualified deferred compensation plan | $ | 3,639 | $ | 3,639 | $ | — | $ | — | $ | 3,639 | |||||
| (1) Zibby was not included as of 12/31/18 as it was accounted for under the cost method. | |||||||||||||||
CURO GROUP HOLDINGS CORP. AND SUBSIDIARIES
NOTES TO UNAUDITED CONDENSED CONSOLIDATED FINANCIAL STATEMENTS (continued)
Financial Assets and Liabilities Not Carried at Fair Value
The table below presents the assets and liabilities that were not carried at fair value on the unaudited Condensed Consolidated Balance Sheets at September 30, 20192020 (in thousands):
| Estimated Fair Value | |||||||||||||||||
| Carrying Value September 30, 2020 | Level 1 | Level 2 | Level 3 | Total | |||||||||||||
| Financial assets: | |||||||||||||||||
| Cash and cash equivalents | $ | 207,071 | $ | 207,071 | $ | 0 | $ | 0 | $ | 207,071 | |||||||
| Restricted cash | 62,527 | 62,527 | 0 | 0 | 62,527 | ||||||||||||
| Loans receivable, net | 416,860 | 0 | 0 | 416,860 | 416,860 | ||||||||||||
| Financial liabilities: | |||||||||||||||||
| Liability for losses on CSO lender-owned consumer loans | $ | 6,198 | $ | 0 | $ | 0 | $ | 6,198 | $ | 6,198 | |||||||
| 8.25% Senior Secured Notes | 679,566 | 0 | 569,137 | 0 | 569,137 | ||||||||||||
| Non-Recourse U.S. SPV facility | 28,884 | 0 | 0 | 35,206 | 35,206 | ||||||||||||
| Non-Recourse Canada SPV facility | 91,010 | 0 | 0 | 93,096 | 93,096 | ||||||||||||
| Estimated Fair Value | |||||||||||||||
| Carrying Value September 30, 2019 | Level 1 | Level 2 | Level 3 | Total | |||||||||||
| Financial assets: | |||||||||||||||
| Cash | $ | 62,207 | $ | 62,207 | $ | — | $ | — | $ | 62,207 | |||||
| Restricted cash | 38,754 | 38,754 | — | — | 38,754 | ||||||||||
| Loans receivable, net | 549,230 | — | — | 549,230 | 549,230 | ||||||||||
| Investment in Zibby | 11,231 | — | — | 11,231 | 11,231 | ||||||||||
| Financial liabilities: | |||||||||||||||
| Liability for losses on CSO lender-owned consumer loans | $ | 10,249 | $ | — | $ | — | $ | 10,249 | $ | 10,249 | |||||
| 8.25% Senior Secured Notes | 677,924 | — | 591,489 | — | 591,489 | ||||||||||
| Non-Recourse Canada SPV facility | 102,483 | — | — | 105,742 | 105,742 | ||||||||||
| Senior Revolver | 25,000 | — | — | 25,000 | 25,000 | ||||||||||
The table below presents the assets and liabilities that were not carried at fair value on the unaudited Condensed Consolidated Balance Sheets at December 31, 20182019 (in thousands):
| Estimated Fair Value | |||||||||||||||||
| Carrying Value December 31, 2019 | Level 1 | Level 2 | Level 3 | Total | |||||||||||||
| Financial assets: | |||||||||||||||||
| Cash and cash equivalents | $ | 75,242 | $ | 75,242 | $ | 0 | $ | 0 | $ | 75,242 | |||||||
| Restricted cash | 34,779 | 34,779 | 0 | 0 | 34,779 | ||||||||||||
| Loans receivable, net | 558,993 | 0 | 0 | 558,993 | 558,993 | ||||||||||||
| Financial liabilities: | |||||||||||||||||
| Liability for losses on CSO lender-owned consumer loans | $ | 10,623 | $ | 0 | $ | 0 | $ | 10,623 | $ | 10,623 | |||||||
| 8.25% Senior Secured Notes | 678,323 | 0 | 596,924 | 0 | 596,924 | ||||||||||||
| Non-Recourse Canada SPV facility | 112,221 | 0 | 0 | 115,243 | 115,243 | ||||||||||||
| Estimated Fair Value | |||||||||||||||
| Carrying Value December 31, 2018 | Level 1 | Level 2 | Level 3 | Total | |||||||||||
| Financial assets: | |||||||||||||||
| Cash | $ | 61,175 | $ | 61,175 | $ | — | $ | — | $ | 61,175 | |||||
| Restricted cash | 25,439 | 25,439 | — | — | 25,439 | ||||||||||
| Loans receivable, net | 497,534 | — | — | 497,534 | 497,534 | ||||||||||
| Investment in Zibby | 6,558 | — | — | 6,558 | 6,558 | ||||||||||
| Financial liabilities: | |||||||||||||||
| Liability for losses on CSO lender-owned consumer loans | $ | 12,007 | $ | — | $ | — | $ | 12,007 | $ | 12,007 | |||||
| 8.25% Senior Secured notes | 676,661 | — | 531,179 | — | 531,179 | ||||||||||
| Non-Recourse Canada SPV facility | 107,479 | — | — | 111,335 | 111,335 | ||||||||||
| Senior Revolver | 20,000 | — | — | 20,000 | 20,000 | ||||||||||
Loans Receivable
Loans receivable are carried on the unaudited Condensed Consolidated Balance Sheets net of the Allowance for estimated loan losses. The unobservable inputs used to calculate the carrying values include quantitative factors, such as current default trends. Also considered in evaluating the accuracy of the models are changes to the loan portfolio mix, the impact of new loan products, changes to underwriting criteria or lending policies, new store development or entrance into new markets, changes in jurisdictional regulations or laws, recent credit trends and general economic conditions. The carrying value of loans receivable approximates their fair value. Refer to Note 3, "Loans Receivable and Revenue" for additional information.
CSO Program
In connection with CSO programs, the Company guarantees consumer loan payment obligations to unrelated third-party lenders for loans that the Company arranges for consumers on the third-party lenders’ behalf. The Company is required to purchase from the lender defaultedcharged-off loans that it has guaranteed. Refer to Note 3, "Loans Receivable and Revenue" and Note 4, Credit Services Organization" for additional information.
25
CURO GROUP HOLDINGS CORP. AND SUBSIDIARIES
NOTES TO UNAUDITED CONDENSED CONSOLIDATED FINANCIAL STATEMENTS (continued)
8.25% Senior Secured Notes and Non-Recourse U.S. and Canada SPV Facilities
The 8.25% Senior Secured Notes fair value disclosure was transferred from Level 3, as previously reported, to Level 2 for September 30, 2019 and December 31, 2018. Upon management's review of the inputs, the Level 2 disclosure is appropriate given the limited trading activity in this public (observable) market.based on broker quotations. The fair values of the Non-Recourse U.S. SPV Facility and Non-Recourse Canada SPV facility and the Senior RevolverFacility were based on the cash needed for their respective final settlements.
Investment in Katapult
The table below represents the Company's investment in Katapult (in thousands):
| Equity Method Investment | Measurement Alternative (1) | |||||||||||||
| Balance at December 31, 2019 | $ | 10,068 | $ | — | ||||||||||
| Equity method (loss) - Q1 2020 | (1,618) | — | ||||||||||||
| Balance at March 31, 2020 | 8,450 | — | ||||||||||||
| Equity method income - Q2 2020 | 741 | |||||||||||||
| Balance at June 30, 2020 | 9,191 | 0 | ||||||||||||
| Equity method income - Q3 2020 | 3,530 | 0 | ||||||||||||
| Accounting policy change for certain securities from equity method investment to cost less impairment | (12,452) | 12,452 | ||||||||||||
| Purchases of common stock warrants and preferred shares | 4,030 | 7,157 | ||||||||||||
| Balance at September 30, 2020 | $ | 4,299 | $ | 19,609 | ||||||||||
| Classification as of December 31, 2019 | Level 3, not carried at fair value | N/A | ||||||||||||
| Classification as of September 30, 2020 | Level 3, not carried at fair value | Level 3, carried at fair value | ||||||||||||
| (1) The Company elected to measure this equity security without a readily determinable fair value that does not qualify for the practical expedient to estimate fair value at its cost minus impairment. If the Company identifies an observable price changes in orderly transactions for the identical or a similar investment of the same issuer, it will measure the equity security at fair value as of the date that the observable transaction occurred. | ||||||||||||||
Prior to September 2020, the Company owned 42.5% of the outstanding shares (excluding unexercised options) of Katapult comprised of multiple classes of equity, including preferred stock and certain common stock warrants. All met the accounting criteria for in-substance common stock at the time of acquisition. This financial asset was not carried at fair value.
The Company accounted for this investment under the equity method, and recognized a proportionate share of Katapult’s income on a two-month lag. The Company’s share of Katapult’s periodic income was $3.5 million for the three months ended September 30, 2020 and $2.7 million for the nine months ended September 30, 2020. The Company recorded losses on its equity method investments in Katapult for the three and nine months ended September 30, 2019 of $1.2 million and $5.1 million, respectively. During 2019, Katapult completed an incremental equity issuance round at a value per share less than the value per share raised in prior raises. This round included investments from both existing and new shareholders and was considered indicative of the fair value of shares in Katapult. Accordingly, the Company recognized a $3.7 million loss on its investment to adjust it to market value during the nine months ended September 30, 2019, which is included in the above $5.1 million loss.
In September 2020, the Company acquired common stock warrants and preferred shares of Katapult from existing shareholders for $11.2 million. This transaction resulted in the reevaluation of the accounting for all of the Company’s holdings in Katapult. The Company determined that its holdings of certain common stock warrants qualified as in-substance common stock required to be accounted for using the equity method. The Company’s holdings in preferred stock and certain other common stock warrants did not meet the criteria for in-substance common stock and therefore are carried at cost less impairment instead of applying the equity method. As a result, Company (i) reclassified $12.5 million from an equity method investment to cost minus impairment, (ii) recorded a purchase of common stock warrants for $4.0 million determined to be in-substance common stock within its equity method investment and (iii) recorded a purchase of preferred shares for $7.2 million that was determined to not be in-substance common stock and thus held at cost less impairment.
26
CURO GROUP HOLDINGS CORP. AND SUBSIDIARIES
NOTES TO UNAUDITED CONDENSED CONSOLIDATED FINANCIAL STATEMENTS (continued)
Both the equity method investment and the investment measured at cost minus impairment are presented within "Investments" on the unaudited Condensed Consolidated Balance Sheet. The Company elected the practical expedient available under ASC 321-10-35-2 to only remeasure the investment in Katapult at fair value upon an indication of impairment or upon the existence of an observable price change in an orderly transaction for the identical or similar security. There were no such transactions with respect to the securities that would indicate the fair value of the Investment in Katapult through September 30, 2020.
On a fully diluted basis, which includes common stock warrants held in Katapult accounted for under the equity method and preferred shares accounted for at cost less impairment under the measurement alternative, the Company's total ownership of Katapult's shares, excluding unexercised options, was 46.6% as of September 30, 2020.
27
CURO GROUP HOLDINGS CORP. AND SUBSIDIARIES
NOTES TO UNAUDITED CONDENSED CONSOLIDATED FINANCIAL STATEMENTS (continued)
NOTE 9 – STOCKHOLDERS' EQUITY
The following table summarizes the changes in stockholders' equity for the three and nine months ended September 30, 20182020 and 2019 (in thousands):
| Common Stock | Paid-in capital | Retained Earnings (Deficit) | AOCI (1) | Total Stockholders' Equity | ||||||||||||||||||
| Shares Outstanding | Par Value | |||||||||||||||||||||
| Balances at December 31, 2017 | 44,561,419 | $ | 8 | $ | 46,079 | $ | 3,988 | $ | (42,939 | ) | $ | 7,136 | ||||||||||
| Net income from continuing operations | — | — | — | 24,913 | — | 24,913 | ||||||||||||||||
| Net loss from discontinued operations | — | — | — | (1,621 | ) | — | (1,621 | ) | ||||||||||||||
| Foreign currency translation adjustment | — | — | — | — | (2,910 | ) | (2,910 | ) | ||||||||||||||
| Cash flow hedge expiration | — | — | — | — | 54 | 54 | ||||||||||||||||
| Share based compensation expense | — | — | 1,842 | — | — | 1,842 | ||||||||||||||||
Initial Public Offering, Net Proceeds (2) (underwriter shares) | 1,000,000 | 1 | 13,135 | — | — | 13,136 | ||||||||||||||||
| Balances at March 31, 2018 | 45,561,419 | $ | 9 | $ | 61,056 | $ | 27,280 | $ | (45,795 | ) | $ | 42,550 | ||||||||||
| Net income from continuing operations | — | — | — | 18,718 | — | 18,718 | ||||||||||||||||
| Net loss from discontinued operations | — | — | — | (2,743 | ) | — | (2,743 | ) | ||||||||||||||
| Foreign currency translation adjustment | — | — | — | — | (6,754 | ) | (6,754 | ) | ||||||||||||||
Cash flow hedge expiration | — | — | — | — | (439 | ) | (439 | ) | ||||||||||||||
| Share based compensation expense | — | — | 1,478 | — | — | 1,478 | ||||||||||||||||
| Proceeds from exercise of stock options | 209,132 | — | 39 | — | — | 39 | ||||||||||||||||
| Common stock issued for RSU's vesting | 49,994 | — | — | — | — | — | ||||||||||||||||
| Balances at June 30, 2018 | 45,820,545 | $ | 9 | $ | 62,573 | $ | 43,255 | $ | (52,988 | ) | $ | 52,849 | ||||||||||
| Net loss from continuing operations | — | — | — | (42,590 | ) | — | (42,590 | ) | ||||||||||||||
| Net loss from discontinued operations | — | — | — | (4,432 | ) | — | (4,432 | ) | ||||||||||||||
| Foreign currency translation adjustment | — | — | — | — | 2,649 | 2,649 | ||||||||||||||||
| Cash flow hedge expiration | — | — | — | — | (187 | ) | (187 | ) | ||||||||||||||
| Share based compensation expense | — | — | 2,792 | — | — | 2,792 | ||||||||||||||||
| Proceeds from exercise of stock options | 222,432 | — | 369 | — | — | 369 | ||||||||||||||||
| Initial Public Offering, Net Proceeds (underwriter shares) | — | — | (1,586 | ) | — | — | (1,586 | ) | ||||||||||||||
| Balance at September 30, 2018 | 46,042,977 | $ | 9 | $ | 64,148 | $ | (3,767 | ) | $ | (50,526 | ) | $ | 9,864 | |||||||||
(1) Accumulated other comprehensive income (loss) | ||||||||||||||||||||||
(2) In connection with the Company's initial public offering in December 2017, the underwriters had a 30-day option to purchase up to an additional 1.0 million shares of the Company's common stock at the initial public offering price, less the underwriting discount for over-allotments, if any. The underwriters exercised this option and purchased 1.0 million shares on January 5, 2018. The exercise of this option provided additional proceeds of $13.1 million. | ||||||||||||||||||||||
| Common Stock | Treasury Stock, at cost | Paid-in capital | Retained Earnings (Deficit) | AOCI (1) | Total Stockholders' Equity | ||||||||||||||||||||||||||||||||||||
| Shares Outstanding | Par Value | ||||||||||||||||||||||||||||||||||||||||
| Balances at December 31, 2019 | 41,156,224 | $ | 9 | $ | (72,343) | $ | 68,087 | $ | 93,423 | $ | (38,663) | $ | 50,513 | ||||||||||||||||||||||||||||
| Net income from continuing operations | — | — | — | — | 36,013 | — | 36,013 | ||||||||||||||||||||||||||||||||||
| Net income from discontinued operations | — | — | — | — | 292 | — | 292 | ||||||||||||||||||||||||||||||||||
| Foreign currency translation adjustment | — | — | — | — | — | (22,193) | (22,193) | ||||||||||||||||||||||||||||||||||
| Dividends | — | — | — | — | (2,256) | — | — | (2,256) | |||||||||||||||||||||||||||||||||
| Share based compensation expense | — | — | — | 3,194 | — | — | 3,194 | ||||||||||||||||||||||||||||||||||
| Proceeds from exercise of stock options | 42,094 | — | — | 126 | — | — | 126 | ||||||||||||||||||||||||||||||||||
| Repurchase of common stock | (540,762) | — | (5,509) | — | — | — | (5,509) | ||||||||||||||||||||||||||||||||||
| Common stock issued for RSUs vesting, net of shares withheld and withholding paid for employee taxes | 121,891 | — | — | (609) | — | — | (609) | ||||||||||||||||||||||||||||||||||
| Balances at March 31, 2020 | 40,779,447 | $ | 9 | $ | (77,852) | $ | 70,798 | $ | 127,472 | $ | (60,856) | $ | 59,571 | ||||||||||||||||||||||||||||
| Net income from continuing operations | — | — | — | — | 21,080 | — | 21,080 | ||||||||||||||||||||||||||||||||||
| Net income from discontinued operations | — | — | — | — | 993 | — | 993 | ||||||||||||||||||||||||||||||||||
| Foreign currency translation adjustment | — | — | — | — | — | 10,261 | 10,261 | ||||||||||||||||||||||||||||||||||
| Dividends | — | — | — | — | (2,244) | — | (2,244) | ||||||||||||||||||||||||||||||||||
| Share based compensation expense | — | — | — | 3,310 | — | — | 3,310 | ||||||||||||||||||||||||||||||||||
| Common stock issued for RSUs vesting, net of shares withheld and withholding paid for employee taxes | 105,098 | — | — | (29) | — | — | (29) | ||||||||||||||||||||||||||||||||||
| Balances at June 30, 2020 | 40,884,545 | $ | 9 | $ | (77,852) | $ | 74,079 | $ | 147,301 | $ | (50,595) | $ | 92,942 | ||||||||||||||||||||||||||||
| Net income from continuing operations | — | — | — | — | 12,881 | — | 12,881 | ||||||||||||||||||||||||||||||||||
| Foreign currency translation adjustment | — | — | — | — | — | 5,591 | 5,591 | ||||||||||||||||||||||||||||||||||
| Dividends | — | — | — | — | (2,250) | — | (2,250) | ||||||||||||||||||||||||||||||||||
| Share based compensation expense | — | — | — | 3,392 | — | — | 3,392 | ||||||||||||||||||||||||||||||||||
| Common stock issued for RSUs vesting, net of shares withheld and withholding paid for employee taxes | 568 | — | — | (3) | — | — | (3) | ||||||||||||||||||||||||||||||||||
| Balance at September 30, 2020 | 40,885,113 | $ | 9 | $ | (77,852) | $ | 77,468 | $ | 157,932 | $ | (45,004) | $ | 112,553 | ||||||||||||||||||||||||||||
(1) Accumulated other comprehensive income (loss) | |||||||||||||||||||||||||||||||||||||||||
28
CURO GROUP HOLDINGS CORP. AND SUBSIDIARIES
NOTES TO UNAUDITED CONDENSED CONSOLIDATED FINANCIAL STATEMENTS (continued)
| Common Stock | Treasury Stock, at cost | Paid-in capital | Retained Earnings (Deficit) | AOCI (1) | Total Stockholders' Equity (Deficit) | ||||||||||||||||||||||||||||||||||||
| Shares Outstanding | Par Value | ||||||||||||||||||||||||||||||||||||||||
| Balances at December 31, 2018 | 46,412,231 | $ | 9 | $ | 0 | $ | 60,015 | $ | (18,065) | $ | (61,060) | $ | (19,101) | ||||||||||||||||||||||||||||
| Net income from continuing operations | — | — | — | — | 28,673 | — | 28,673 | ||||||||||||||||||||||||||||||||||
| Net income from discontinued operations | — | — | — | — | 8,375 | — | 8,375 | ||||||||||||||||||||||||||||||||||
| Foreign currency translation adjustment | — | — | — | — | — | 16,695 | 16,695 | ||||||||||||||||||||||||||||||||||
| Share based compensation expense | — | — | — | 2,172 | — | — | 2,172 | ||||||||||||||||||||||||||||||||||
| Proceeds from exercise of stock options | 7,888 | — | — | 40 | — | — | 40 | ||||||||||||||||||||||||||||||||||
| Common stock issued for RSUs vesting, net of shares withheld and withholding paid for employee taxes | 11,170 | — | — | (110) | — | — | (110) | ||||||||||||||||||||||||||||||||||
| Balances at March 31, 2019 | 46,431,289 | $ | 9 | $ | 0 | $ | 62,117 | $ | 18,983 | $ | (44,365) | $ | 36,744 | ||||||||||||||||||||||||||||
| Net income from continuing operations | — | — | — | — | 17,667 | — | 17,667 | ||||||||||||||||||||||||||||||||||
| Net loss from discontinued operations | — | — | — | — | (834) | — | (834) | ||||||||||||||||||||||||||||||||||
| Foreign currency translation adjustment | — | — | — | — | — | 3,635 | 3,635 | ||||||||||||||||||||||||||||||||||
| Share based compensation expense | — | — | — | 2,644 | — | — | 2,644 | ||||||||||||||||||||||||||||||||||
| Proceeds from exercise of stock options | 4,908 | — | — | 29 | — | — | 29 | ||||||||||||||||||||||||||||||||||
| Repurchase of common stock | (244,200) | — | (2,507) | — | — | — | (2,507) | ||||||||||||||||||||||||||||||||||
| Common stock issued for RSUs vesting, net of shares withheld and withholding paid for employee taxes | 63,285 | — | — | — | — | — | 0 | ||||||||||||||||||||||||||||||||||
| Balances at June 30, 2019 | 46,255,282 | $ | 9 | $ | (2,507) | $ | 64,790 | $ | 35,816 | $ | (40,730) | $ | 57,378 | ||||||||||||||||||||||||||||
| Net income from continuing operations | — | — | — | — | 27,987 | — | 27,987 | ||||||||||||||||||||||||||||||||||
| Net loss from discontinued operations | — | — | — | — | (598) | — | (598) | ||||||||||||||||||||||||||||||||||
| Foreign currency translation adjustment | — | — | — | — | — | (1,954) | (1,954) | ||||||||||||||||||||||||||||||||||
| Share based compensation expense | — | — | — | 2,771 | — | — | 2,771 | ||||||||||||||||||||||||||||||||||
| Proceeds from exercise of stock options | 3,924 | — | — | 18 | — | — | 18 | ||||||||||||||||||||||||||||||||||
Repurchase of common stock (2) | (3,912,041) | — | (50,557) | — | — | — | (50,557) | ||||||||||||||||||||||||||||||||||
| Balances at September 30, 2019 | 42,347,165 | $ | 9 | $ | (53,064) | $ | 67,579 | $ | 63,205 | $ | (42,684) | $ | 35,045 | ||||||||||||||||||||||||||||
(1) Accumulated other comprehensive income (loss) | |||||||||||||||||||||||||||||||||||||||||
(2) Includes the repurchase of 2.0 million shares of common stock from FFL for $13.55 per share. See Note 18, "Share Repurchase Program" for additional information. | |||||||||||||||||||||||||||||||||||||||||
29
| Common Stock | Paid-in capital | Treasury Stock | Retained Earnings (Deficit) | AOCI (1) | Total Stockholders' Equity | |||||||||||||||||||||
| Shares Outstanding | Par Value | |||||||||||||||||||||||||
| Balances at December 31, 2018 | 46,412,231 | $ | 9 | $ | 60,015 | $ | — | $ | (18,065 | ) | $ | (61,060 | ) | $ | (19,101 | ) | ||||||||||
| Net income from continuing operations | — | — | — | — | 28,673 | — | 28,673 | |||||||||||||||||||
| Net income from discontinued operations | — | — | — | — | 8,375 | — | 8,375 | |||||||||||||||||||
| Foreign currency translation adjustment | — | — | — | — | — | 16,695 | 16,695 | |||||||||||||||||||
| Share based compensation expense | — | — | 2,172 | — | — | — | 2,172 | |||||||||||||||||||
| Proceeds from exercise of stock options | 7,888 | — | 40 | — | — | — | 40 | |||||||||||||||||||
| Common stock issued for RSU's vesting, net of shares withheld and withholding paid for employee taxes | 11,170 | — | (110 | ) | — | — | — | (110 | ) | |||||||||||||||||
| Balances at March 31, 2019 | 46,431,289 | $ | 9 | $ | 62,117 | $ | — | $ | 18,983 | $ | (44,365 | ) | $ | 36,744 | ||||||||||||
| Net income from continuing operations | — | — | — | — | 17,667 | — | 17,667 | |||||||||||||||||||
| Net loss from discontinued operations | — | — | — | — | (834 | ) | — | (834 | ) | |||||||||||||||||
| Foreign currency translation adjustment | — | — | — | — | — | 3,635 | 3,635 | |||||||||||||||||||
| Share based compensation expense | — | — | 2,644 | — | — | — | 2,644 | |||||||||||||||||||
| Proceeds from exercise of stock options | 4,908 | — | 29 | — | — | — | 29 | |||||||||||||||||||
| Repurchase of common stock | (244,200 | ) | — | — | (2,507 | ) | — | — | (2,507 | ) | ||||||||||||||||
| Common stock issued for RSU's vesting, net of shares withheld and withholding paid for employee taxes | 63,285 | — | — | — | — | — | — | |||||||||||||||||||
| Balances at June 30, 2019 | 46,255,282 | $ | 9 | $ | 64,790 | $ | (2,507 | ) | $ | 35,816 | $ | (40,730 | ) | $ | 57,378 | |||||||||||
| Net income from continuing operations | — | — | — | — | 27,987 | — | 27,987 | |||||||||||||||||||
| Net loss from discontinued operations | — | — | — | — | (598 | ) | — | (598 | ) | |||||||||||||||||
| Foreign currency translation adjustment | — | — | — | — | — | (1,954 | ) | (1,954 | ) | |||||||||||||||||
| Share based compensation expense | — | — | 2,771 | — | — | — | 2,771 | |||||||||||||||||||
| Proceeds from exercise of stock options | 3,924 | — | 18 | — | — | — | 18 | |||||||||||||||||||
Repurchase of common stock (2) | (3,912,041 | ) | — | — | (50,557 | ) | — | — | (50,557 | ) | ||||||||||||||||
| Balances at September 30, 2019 | 42,347,165 | $ | 9 | $ | 67,579 | $ | (53,064 | ) | $ | 63,205 | $ | (42,684 | ) | $ | 35,045 | |||||||||||
(1) Accumulated other comprehensive income (loss) | ||||||||||||||||||||||||||
(2) Includes the repurchase of 2,000,000 shares of common stock from FFL for $13.55 per share. See Note 17 - "Share Repurchase Program" for additional information. | ||||||||||||||||||||||||||
CURO GROUP HOLDINGS CORP. AND SUBSIDIARIES
NOTES TO UNAUDITED CONDENSED CONSOLIDATED FINANCIAL STATEMENTS (continued)
Dividends
The table below summarizes the Company's quarterly dividends since the dividend policy was instituted during the first quarter of 2020.
| Dividends Paid | |||||||||||||||||
| Date of declaration | Stockholders of record | Date paid | Dividend per share | (in thousands) | |||||||||||||
| Q1 2020 | February 5, 2020 | February 18, 2020 | March 2, 2020 | $ | 0.055 | $ | 2,247 | ||||||||||
| Q2 2020 | April 30, 2020 | May 13, 2020 | May 27, 2020 | $ | 0.055 | $ | 2,243 | ||||||||||
| Q3 2020 | August 3, 2020 | August 13, 2020 | August 24, 2020 | $ | 0.055 | $ | 2,249 | ||||||||||
On October 29, 2020, the Company's Board of Directors declared its fourth dividend under the program of $0.055 per share. See Note 19, "Subsequent Events" for additional information.
NOTE 10 – EARNINGS PER SHARE
The following table presents the computation of basic and diluted earnings per share (in thousands, except per share amounts):
| Three Months Ended September 30, | Nine Months Ended September 30, | ||||||||||||||||||||||
| 2020 | 2019 | 2020 | 2019 | ||||||||||||||||||||
| Net income from continuing operations | $ | 12,881 | $ | 27,987 | $ | 69,974 | $ | 74,327 | |||||||||||||||
| Net income (loss) from discontinued operations, net of tax | 0 | (598) | 1,285 | 6,943 | |||||||||||||||||||
| Net income | $ | 12,881 | $ | 27,389 | $ | 71,259 | $ | 81,270 | |||||||||||||||
| Weighted average common shares - basic | 40,885 | 44,422 | 40,838 | 45,759 | |||||||||||||||||||
| Dilutive effect of stock options and restricted stock units | 890 | 1,588 | 822 | 1,128 | |||||||||||||||||||
| Weighted average common shares - diluted | 41,775 | 46,010 | 41,660 | 46,887 | |||||||||||||||||||
| Basic earnings (loss) per share: | |||||||||||||||||||||||
| Continuing operations | $ | 0.32 | $ | 0.63 | $ | 1.71 | $ | 1.63 | |||||||||||||||
| Discontinued operations | 0 | (0.01) | 0.03 | 0.15 | |||||||||||||||||||
| Basic earnings per share | $ | 0.32 | $ | 0.62 | $ | 1.74 | $ | 1.78 | |||||||||||||||
| Diluted earnings (loss) per share: | |||||||||||||||||||||||
| Continuing operations | $ | 0.31 | $ | 0.61 | $ | 1.68 | $ | 1.59 | |||||||||||||||
| Discontinued operations | 0 | (0.01) | 0.03 | 0.15 | |||||||||||||||||||
| Diluted earnings per share | $ | 0.31 | $ | 0.60 | $ | 1.71 | $ | 1.74 | |||||||||||||||
| Three Months Ended September 30, | Nine Months Ended September 30, | ||||||||||||||
| 2019 | 2018(1) | 2019 | 2018 | ||||||||||||
| Net income (loss) from continuing operations | $ | 27,987 | $ | (42,590 | ) | $ | 74,327 | $ | 1,041 | ||||||
| Net (loss) income from discontinued operations, net of tax | (598 | ) | (4,432 | ) | $ | 6,943 | $ | (8,796 | ) | ||||||
| Net income (loss) | $ | 27,389 | $ | (47,022 | ) | $ | 81,270 | $ | (7,755 | ) | |||||
| Weighted average common shares - basic | 44,422 | 45,853 | 45,759 | 45,674 | |||||||||||
| Dilutive effect of stock options and restricted stock units | 1,588 | — | 1,128 | 2,387 | |||||||||||
| Weighted average common shares - diluted | 46,010 | 45,853 | 46,887 | 48,061 | |||||||||||
| Basic earnings (loss) per share: | |||||||||||||||
| Continuing operations | $ | 0.63 | $ | (0.93 | ) | $ | 1.63 | $ | 0.02 | ||||||
| Discontinued operations | (0.01 | ) | (0.10 | ) | 0.15 | (0.19 | ) | ||||||||
| Basic earnings per share | $ | 0.62 | $ | (1.03 | ) | $ | 1.78 | $ | (0.17 | ) | |||||
| Diluted earnings (loss) per share: | |||||||||||||||
| Continuing operations | $ | 0.61 | $ | (0.93 | ) | $ | 1.59 | $ | 0.03 | ||||||
| Discontinued operations | (0.01 | ) | (0.10 | ) | 0.15 | (0.19 | ) | ||||||||
| Diluted earnings per share | $ | 0.60 | $ | (1.03 | ) | $ | 1.74 | $ | (0.16 | ) | |||||
(1) As of December 31, 2018, the Company made certain insignificant adjustments to previously-reported Earnings Per Share ("EPS") to correctly reflect the effect of anti-dilutive shares on diluted EPS calculations in accordance with ASC 260. These changes were immaterial to the overall EPS calculation. Diluted loss per share for the three months ended September 30, 2018 of $0.97 was corrected to $1.03. | |||||||||||||||
Potential shares of common stock that would have the effect of increasing diluted earnings per share or decreasing diluted loss per share are considered to be anti-dilutive and as such, these shares are not included in calculating "Diluteddiluted earnings per share." For the three and nine months ended September 30, 20192020, there were 1.7 million and 1.3 million, respectively, and for the three and nine months ended September 30, 2019, there were 0.1 million and 0.3 million, respectively, of potential shares of common stock excluded from the calculation of Diluteddiluted earnings per share because their effect was anti-dilutive. For the three months ended September 30, 2018, there were 2.5 million potential shares of common stock excluded from the calculation of Diluted earnings per share because their effect was anti-dilutive. There was no effect for the nine months ended September 30, 2018.
The Company utilizes the "control number" concept in the computation of Diluteddiluted earnings per share to determine whether potential common stock instruments are dilutive. The control number used is income from continuing operations. The control number concept requires that the same number of potentially dilutive securities applied in computing Diluteddiluted earnings per share from continuing operations be applied to all other categories of income or loss, regardless of their anti-dilutive effect on such categories.
30
CURO GROUP HOLDINGS CORP. AND SUBSIDIARIES
NOTES TO UNAUDITED CONDENSED CONSOLIDATED FINANCIAL STATEMENTS (continued)
NOTE 11 – SUPPLEMENTAL CASH FLOW INFORMATION
The following table provides supplemental cash flow information (in thousands):
| Nine Months Ended September 30, | |||||||||||
| 2020 | 2019 | ||||||||||
| Cash paid for: | |||||||||||
| Interest | $ | 65,807 | $ | 65,627 | |||||||
| Income taxes, net of refunds | 13,034 | 2,029 | |||||||||
| Non-cash investing activities: | |||||||||||
| Property and equipment accrued in accounts payable and accrued liabilities | $ | 466 | $ | 604 | |||||||
| Nine Months Ended September 30, | |||||||
| 2019 | 2018 | ||||||
| Cash paid for: | |||||||
| Interest | $ | 65,627 | $ | 80,748 | |||
| Income taxes, net of refunds | 2,029 | 15,868 | |||||
| Non-cash investing activities: | |||||||
| Property and equipment accrued in accounts payable | $ | 604 | $ | 1,240 | |||
NOTE 12 – SEGMENT REPORTING
Segment information is prepared on the same basis that the Company's Chief Operating Decision Maker ("CODM")CODM reviews financial information for operational decision making purposes. Duringpurposes, including revenues, net revenue, gross margin, segment operating income and other items.
U.S.As of September 30, 2020, the first quarterCompany operated a total of 2019, the U.K. Subsidiaries met discontinued operations criteria, resulting210 U.S. retail locations and had an online presence in two remaining reportable operating segments:33 states. The Company provides Single-Pay loans, Installment loans and Open-End loans, vehicle title loans, check cashing, money transfer services, reloadable prepaid debit cards and a number of other ancillary financial products and services to its customers in the U.S. As disclosed in Note 17, "Acquisition," the acquisition of Ad Astra closed in January 2020. The results of Ad Astra are included within the U.S. reporting segment.
Canada. As of September 30, 2020, the Company operated a total of 204 stores across 7 Canadian provinces and territories and had an online presence in 5 provinces. The Company provides Single-Pay loans, Installment loans and Open-End loans, insurance products to Open-End and Installment loan customers, check cashing, money transfer services, foreign currency exchange, reloadable prepaid debit cards and a number of other ancillary financial products and services to its customers in Canada.
31
CURO GROUP HOLDINGS CORP. AND SUBSIDIARIES
NOTES TO UNAUDITED CONDENSED CONSOLIDATED FINANCIAL STATEMENTS (continued)
The following table illustrates summarized financial information concerning reportable segments (in thousands):
| Three Months Ended September 30, | Nine Months Ended September 30, | |||||||||||||||
| 2019 | 2018 | 2019 | 2018 | |||||||||||||
| Revenues by segment: | ||||||||||||||||
| U.S. | $ | 237,069 | $ | 223,273 | $ | 673,234 | $ | 617,992 | ||||||||
| Canada | 60,195 | 46,209 | 166,269 | 139,502 | ||||||||||||
| Consolidated revenue | $ | 297,264 | $ | 269,482 | $ | 839,503 | $ | 757,494 | ||||||||
| Gross margin by segment: | ||||||||||||||||
| U.S. | $ | 77,250 | $ | 60,105 | $ | 232,120 | $ | 215,497 | ||||||||
| Canada | 19,389 | 489 | 51,197 | 28,291 | ||||||||||||
| Consolidated gross margin | $ | 96,639 | $ | 60,594 | $ | 283,317 | $ | 243,788 | ||||||||
| Segment operating income (loss): | ||||||||||||||||
| U.S. | $ | 28,092 | $ | (53,624 | ) | $ | 76,316 | $ | (11,430 | ) | ||||||
| Canada | 11,134 | (5,880 | ) | 26,749 | 12,202 | |||||||||||
| Consolidated operating profit | $ | 39,226 | $ | (59,504 | ) | $ | 103,065 | $ | 772 | |||||||
| Expenditures for long-lived assets by segment: | ||||||||||||||||
| U.S. | $ | 2,890 | $ | 4,483 | $ | 7,888 | $ | 6,466 | ||||||||
| Canada | 216 | 590 | 1,382 | 1,564 | ||||||||||||
| Consolidated expenditures for long-lived assets | $ | 3,106 | $ | 5,073 | $ | 9,270 | $ | 8,030 | ||||||||
| Three Months Ended September 30, | Nine Months Ended September 30, | |||||||||||||||||||||||||
| 2020 | 2019 | 2020 | 2019 | |||||||||||||||||||||||
Revenues by segment: (1) | ||||||||||||||||||||||||||
| U.S. | $ | 132,848 | $ | 237,069 | $ | 491,936 | $ | 673,234 | ||||||||||||||||||
| Canada | 49,155 | 60,195 | 153,382 | 166,269 | ||||||||||||||||||||||
| Consolidated revenue | $ | 182,003 | $ | 297,264 | $ | 645,318 | $ | 839,503 | ||||||||||||||||||
| Net revenues by segment: | ||||||||||||||||||||||||||
| U.S. | $ | 89,363 | $ | 134,072 | $ | 320,880 | $ | 392,705 | ||||||||||||||||||
| Canada | 37,890 | 39,325 | $ | 105,459 | 108,536 | |||||||||||||||||||||
| Consolidated net revenue | $ | 127,253 | $ | 173,397 | $ | 426,339 | $ | 501,241 | ||||||||||||||||||
| Gross margin by segment: | ||||||||||||||||||||||||||
| U.S. | $ | 43,384 | $ | 77,250 | $ | 187,784 | $ | 232,120 | ||||||||||||||||||
| Canada | 20,186 | 19,389 | 51,984 | 51,197 | ||||||||||||||||||||||
| Consolidated gross margin | $ | 63,570 | $ | 96,639 | $ | 239,768 | $ | 283,317 | ||||||||||||||||||
| Segment operating (loss) income: | ||||||||||||||||||||||||||
| U.S. | $ | (696) | $ | 28,092 | $ | 44,587 | $ | 76,316 | ||||||||||||||||||
| Canada | 12,755 | 11,134 | 27,570 | 26,749 | ||||||||||||||||||||||
| Consolidated operating income | $ | 12,059 | $ | 39,226 | $ | 72,157 | $ | 103,065 | ||||||||||||||||||
| Expenditures for long-lived assets by segment: | ||||||||||||||||||||||||||
| U.S. | $ | 2,273 | $ | 2,890 | $ | 6,801 | $ | 7,888 | ||||||||||||||||||
| Canada | 67 | 216 | 764 | 1,382 | ||||||||||||||||||||||
| Consolidated expenditures for long-lived assets | $ | 2,340 | $ | 3,106 | $ | 7,565 | $ | 9,270 | ||||||||||||||||||
(1) For revenue by product, see Note 3, "Loans Receivable and Revenue." | ||||||||||||||||||||||||||
The following table provides the proportion of gross loans receivable by segment (in thousands):
| September 30, 2020 | December 31, 2019 | |||||||||||||
| U.S. | $ | 205,296 | $ | 363,453 | ||||||||||
| Canada | 292,146 | 302,375 | ||||||||||||
| Total gross loans receivable | $ | 497,442 | $ | 665,828 | ||||||||||
| September 30, 2019 | December 31, 2018 | |||||||
| U.S. | $ | 370,967 | $ | 361,473 | ||||
| Canada | 286,648 | 210,058 | ||||||
| Total gross loans receivable | $ | 657,615 | $ | 571,531 | ||||
The following table providesrepresents the Company's net long-lived assets, comprised of property and equipment, by segment. These amounts are aggregated on a legal entity basis and do not necessarily reflect where the asset is physically located (in thousands):
| September 30, 2020 | December 31, 2019 | |||||||||||||
| U.S. | $ | 38,047 | $ | 43,618 | ||||||||||
| Canada | 23,634 | 27,193 | ||||||||||||
| Total net long-lived assets | $ | 61,681 | $ | 70,811 | ||||||||||
| September 30, 2019 | December 31, 2018 | |||||||
| U.S. | $ | 42,937 | $ | 47,918 | ||||
| Canada | 27,444 | 28,832 | ||||||
| Total net long-lived assets | $ | 70,381 | $ | 76,750 | ||||
The Company's CODM does not review total assets by segment for purposes of allocating resources or decision-making purposes; therefore, total assets by segment are not disclosed.
NOTE 13 – CONTINGENT LIABILITIESCOMMITMENTS AND CONTINGENCIES
Securities Litigation and Enforcement
On December 5, 2018, a putative securities fraud class action lawsuit was filed against the Company and its chief executive officer, chief financial officer and chief operating officer in the United States District Court for the District of Kansas, captioned
32
CURO GROUP HOLDINGS CORP. AND SUBSIDIARIES
NOTES TO UNAUDITED CONDENSED CONSOLIDATED FINANCIAL STATEMENTS (continued)
Yellowdog Partners, LP v. CURO Group Holdings Corp., Donald F. Gayhardt, William Baker and Roger W. Dean, Civil Action No. 18-2662.18-2662 (the "Yellowdog Action"). On May 31, 2019, plaintiffsplaintiff filed a consolidated complaint naming Doug Rippel, Chad Faulkner, Mike McKnight, Friedman Fleischer & Lowe Capital Partners II, L.P., FFL Executive Partners II, L.P., and FFL Parallel Fund II, L.P. (collectively, the "FFL Defendants") as additional defendants. The complaint alleges that the Company and the individual defendants violated Section 10(b) of the Securities Exchange Act of 1934, as amended (the "Exchange Act") and that certain defendants also violated Section 20(a) of the Exchange Act as "control persons" of CURO. Plaintiffs purportPlaintiff purports to bring these claims on behalf of a class of investors who purchased Company common stock between April 27, 2018 and October 24, 2018.
On May 27, 2020, the parties accepted a mediator’s proposal to settle the action for $9.0 million.On September 4, 2020, the Court granted preliminary approval of the settlement and scheduled the final settlement approval hearing for December 18, 2020. The Company's directors' and officers' insurance carriers will pay the amount in excess of the $2.5 million retention under the policy and, as such, the Company recorded $2.5 million in expense in 2019. As of September 30, 2020, the entire $9.0 million settlement was paid with $1.3 million of it paid by the Company. As a result, the Company has a remaining $1.3 million receivable in "Other assets," which will be collected from the insurance carrier, and no remaining liability related to the settlement. No expense was incurred for the three months ended September 30, 2020 related to the settlement.
On June 25, 2020, July 2, 2020 and July 16, 2020, 3 shareholder derivative lawsuits were filed a motion to dismissin the lawsuit on August 15, 2019.United States District Court for the District of Delaware against certain directors and officers of the Company, the Company, and in 2 of the 3 lawsuits, the FFL Defendants. Plaintiffs generally allege the same underlying facts of the Yellowdog Action.
While the Company is vigorously contesting this lawsuit,these lawsuits, it cannot determine the final resolution or when itthey might be resolved. In addition to the expenses incurred in defending this litigationthese litigations and any damages in excess of insurance coverages that may be awarded in the event of anany adverse ruling,rulings, management’s efforts and attention may be diverted from the ordinary business operations to address these claims. Regardless of the outcome, this litigationoutcomes, these legal matters may have a material adverse impact on results becauseof operations or financial condition as a result of defense costs, including costs related to indemnification obligations, diversion of resources and other factors.
During the first quarter of 2019, the Company received an inquiry from the SEC regarding the Company's public disclosures surrounding its efforts to transition the Canadian inventory of products from Single-Pay loans to Open-End loans. During the second and third quarters of 2020, the SEC requested information from the Company concerning information cited in plaintiff's complaint in the Yellowdog Action, and the mediation process described above.
City of Austin
The Company was cited in July 2016 by the City of Austin, Texas for alleged violations of the Austin ordinance addressing products offered by CSOs. The Austin ordinance regulates aspects of products offered under the Company's credit access bureau ("CAB")CAB program, including loan sizes and repayment terms. The Company believes that: (i) the Austin ordinance (similar to its counterparts elsewhere in Texas) conflicts with Texas state law and (ii) in any event, the Company's product complies with the ordinance, when the ordinance is properly construed. The Austin Municipal Court agreed with the Company's position that the ordinance conflicts with Texas law and, accordingly, did not address the second argument. In September 2017, the Travis County Court reversed the Municipal Court’s decision and remanded the case for further proceedings. To date, a hearing and trial on the merits have not been scheduled.
On May 15, 2020, the City of Austin proposed an ordinance in direct response to a recent Texas Attorney General’s opinion which would arguably allow CSO’s to provide signature loans outside the regulatory authority of the OCCC and the City of Austin. The proposed ordinance was effective June 1, 2020. The City not only implemented restrictions on CSO transactions, but also revised certain definitions found in the ordinance. These revisions potentially affect the foundation upon which the Company's previous arguments in municipal court were based.
On June 8, 2020, another company within CURO's industry filed a Petition for Declaratory Relief, Application for Temporary Restraining Order, and Application for Temporary and Permanent Injunction against the City. The Temporary Restraining Order was granted and is still currently in place. During the pendency of the Temporary Restraining Order, the revised ordinance is stayed as to its effectiveness for all impacted companies, including the Company.
33
CURO GROUP HOLDINGS CORP. AND SUBSIDIARIES
NOTES TO UNAUDITED CONDENSED CONSOLIDATED FINANCIAL STATEMENTS (continued)
The Company does not anticipate having a final determination of the lawfulness of its CAB program under the Austin ordinanceordinances (and similar ordinances in other Texas cities) in the near future. A final adverse decision could potentially
result in material monetary liability in Austin and elsewhere in Texas, and wouldcould force the Company to restructure the loans it originates in Austin and elsewhere in Texas.
Other Legal Matters
The Company is a defendant in certain litigation matters encountered from time-to-time in the ordinary course of business. Certain of these matters may be covered to an extent by insurance. InWhile it is difficult to predict the opinionoutcome of management, based uponany particular proceeding, the advice of legal counsel,Company does not believe the likelihood is remote that the impactresult of any of these pending litigation matters either individually or in the aggregate, wouldwill have a material adverse effect on the Company's consolidated financial condition,business, results of operations or cash flows.financial condition.
NOTE 14 – LEASES
Typically, a contract constitutes a lease if it conveys the right to control the use of an identified property, plant or equipment (an identified asset) for a period of time in exchange for consideration. To determine whether a contract conveys the right to control the use of an identified asset for a period of time, the Company must assess whether, throughout the period of use, the customer has both (i) the right to obtain substantially all of the economic benefits from use of the identified asset and (ii) the right to direct the use of the identified asset. If the customer has the right to control the use of an identified asset for only a portion of the term of the contract, the contract contains a lease for that portion of the term.
The Company recognizes ROU assets and lease liabilities are recognized based on the present value of lease payments over the lease term at commencement date. The rate implicit in the Company's leases typically are not readily determinable. As most of the Company’s leases do not provide an implicit rate of return,a result, the Company uses its estimated incremental borrowing rate, based on the information available at commencement dateas allowed by ASC 842, Leases, in determining the present value of lease payments. The incremental borrowing rate is based on internal and external information available at the lease commencement date and is determined using a portfolio approach based on(i.e., using the weighted average terms of all leases in the Company's portfolio). This rate of interestis the theoretical rate the Company would pay to borrow an amount equal to the lease payments on a collateralized basis over a similar term. term as that of the portfolio.
The Company uses quoted interest rates obtained from financial institutions as an input, adjusted for Company specificCompany-specific factors, to derive the incremental borrowing rate as the discount rate for the lease.leases. As new leases are added each period, the Company evaluates whether the incremental borrowing rate has changed. If the incremental borrowing rate has changed, the Company will apply the rate to new leases if not doing so would result in a material difference to the ROU asset and lease liability presented on the balance sheet.
The majority of the leases have an original term of five years with twoplus 2 five-year renewal options. ForThe Consumer Price Index is used in determining future lease payments and for purposes of calculating operating lease liabilities, leaseliabilities. Lease terms may be deemed to include options to extend or terminate the lease when it is reasonably certain that the Company will exercise that option. Most of the leases have escalation clauses and certain leases also require payment of period costs, including maintenance, insurance and property taxes. Some of the leases are with related parties and have terms similar to the non-related party leases. The Company's lease agreements do not contain any material residual value guarantees or material restrictive covenants.
34
| Three Months Ended September 30, | Nine Months Ended September 30, | ||||||
| 2019 | 2019 | ||||||
| Operating lease costs: | |||||||
| Third-Party | $ | 7,687 | $ | 23,000 | |||
| Related-Party | 865 | 2,595 | |||||
| Total | $ | 8,552 | $ | 25,595 | |||
CURO GROUP HOLDINGS CORP. AND SUBSIDIARIES
NOTES TO CONDENSED CONSOLIDATED FINANCIAL STATEMENTS (continued)
(unaudited)
The following table summarizes the operating lease costs and other information for the three and nine months ended September 30, 2020 and September 30,2019 (in thousands):
| Three Months Ended September 30, | Nine Months Ended September 30, | ||||||||||||||||
| 2020 | 2019 | 2020 | 2019 | ||||||||||||||
| Operating lease costs: | |||||||||||||||||
| Third-Party | $ | 8,567 | $ | 7,687 | $ | 22,947 | $ | 23,000 | |||||||||
| Related-Party | 6 | 865 | 2,538 | 2,595 | |||||||||||||
| Total operating lease costs | $ | 8,573 | $ | 8,552 | $ | 25,485 | $ | 25,595 | |||||||||
| Operating cash flow - Operating leases | $ | 25,329 | $ | 26,001 | |||||||||||||
| New ROU assets - Operating leases | $ | 10,885 | $ | 11,088 | |||||||||||||
| Weighted average remaining lease term - Operating leases | 6.0 years | 6.3 years | |||||||||||||||
| Weighted average discount rate - Operating leases | 10.1 | % | 10.3 | % | |||||||||||||
The following table summarizes the aggregate operating lease maturitiespayments that the Company is contractually obligated to make under operating leases as of September 30, 20192020 (in thousands):
| Third-Party | Related-Party | Total | ||||||||||||||||||
| Remainder of 2020 | $ | 7,795 | $ | 926 | $ | 8,721 | ||||||||||||||
| 2021 | 29,593 | 3,768 | 33,361 | |||||||||||||||||
| 2022 | 26,682 | 3,665 | 30,347 | |||||||||||||||||
| 2023 | 21,803 | 1,320 | 23,123 | |||||||||||||||||
| 2024 | 16,799 | 965 | 17,764 | |||||||||||||||||
| 2025 | 12,227 | 865 | 13,092 | |||||||||||||||||
| Thereafter | 31,155 | 2,665 | 33,820 | |||||||||||||||||
| Total | 146,054 | 14,174 | 160,228 | |||||||||||||||||
| Less: Imputed interest | (38,189) | (3,208) | (41,397) | |||||||||||||||||
| Operating lease liabilities | $ | 107,865 | $ | 10,966 | $ | 118,831 | ||||||||||||||
| Third-Party | Related-Party | Total | ||||||||||
| Remainder of 2019 | $ | 7,698 | $ | 922 | $ | 8,620 | ||||||
| 2020 | 29,596 | 3,752 | 33,348 | |||||||||
| 2021 | 26,450 | 3,772 | 30,222 | |||||||||
| 2022 | 23,387 | 3,669 | 27,056 | |||||||||
| 2023 | 18,674 | 1,313 | 19,987 | |||||||||
| 2024 | 14,088 | 963 | 15,051 | |||||||||
| Thereafter | 35,697 | 3,414 | 39,111 | |||||||||
| Total | 155,590 | 17,805 | 173,395 | |||||||||
| Less: Imputed interest | (42,920 | ) | (4,427 | ) | (47,347 | ) | ||||||
| Operating lease liabilities | $ | 112,670 | $ | 13,378 | $ | 126,048 | ||||||
| Third Party | Related Party | Total | ||||||||||
| 2019 | $ | 24,211 | $ | 3,330 | $ | 27,541 | ||||||
| 2020 | 20,547 | 3,285 | 23,832 | |||||||||
| 2021 | 17,301 | 3,324 | 20,625 | |||||||||
| 2022 | 14,558 | 3,322 | 17,880 | |||||||||
| 2023 | 10,269 | 705 | 10,974 | |||||||||
| Thereafter | 13,446 | 730 | 14,176 | |||||||||
Total (1) | $ | 100,332 | $ | 14,696 | $ | 115,028 | ||||||
| (1) Future minimum lease payments exclude the U.K. as all U.K. subsidiaries were placed into administration effective February 25, 2019. | ||||||||||||
NOTE 15 – DISCONTINUED OPERATIONS
On February 25, 2019, in accordance with the provisions of the U.K. Insolvency Act 1986 and as approved by the boardsBoards of directorsDirectors of the U.K. Subsidiaries, insolvency practitioners from KPMG were appointed as Administrators for the U.K. Subsidiaries.subsidiaries. The effect of the U.K. Subsidiaries’ entry into administration was to place their management, affairs, business and property of the U.K. Subsidiaries under the direct control of the Administrators. Accordingly, the Company deconsolidated the U.K. Subsidiaries, which comprised the U.K. reportable operating segment, as of February 25, 2019 and classified them as Discontinued Operations for all periods presented.
35
CURO GROUP HOLDINGS CORP. AND SUBSIDIARIES
NOTES TO CONDENSED CONSOLIDATED FINANCIAL STATEMENTS (continued)
(unaudited)
The following table presents the results of operations of the U.K. Subsidiaries, which meet the criteria of Discontinued Operations and, therefore, are excluded from the Company's results of continuing operations (in thousands):
| Three Months Ended September 30, | Nine Months Ended September 30, | |||||||||||||||||||||||||
| 2020 | 2019 | 2020 | 2019(1) | |||||||||||||||||||||||
| Revenue | $ | 0 | $ | 0 | $ | 0 | $ | 6,957 | ||||||||||||||||||
| Provision for losses | 0 | 0 | 0 | 1,703 | ||||||||||||||||||||||
| Net revenue | 0 | 0 | 0 | 5,254 | ||||||||||||||||||||||
| Total cost of providing services | 0 | 0 | 0 | 1,082 | ||||||||||||||||||||||
| Gross margin | 0 | 0 | 0 | 4,172 | ||||||||||||||||||||||
| Operating (income) expense | ||||||||||||||||||||||||||
| Corporate, district and other expenses | 0 | 0 | 0 | 3,806 | ||||||||||||||||||||||
| (Gain) loss on disposition | 0 | 0 | (1,714) | 39,414 | ||||||||||||||||||||||
| Total operating (income) expense | 0 | 0 | (1,714) | 43,220 | ||||||||||||||||||||||
| Pre-tax income (loss) from operations of discontinued operations | 0 | 0 | 1,714 | (39,048) | ||||||||||||||||||||||
| Income tax expense (benefit) related to disposition | 0 | 598 | 429 | (45,991) | ||||||||||||||||||||||
| Net income (loss) from discontinued operations | $ | 0 | $ | (598) | $ | 1,285 | $ | 6,943 | ||||||||||||||||||
| (1) Includes U.K. Subsidiaries financial results from January 1, 2019 to February 25, 2019. | ||||||||||||||||||||||||||
Revenue and expenses related to discontinued operations included activity prior to the deconsolidation of the U.K. Subsidiariessubsidiaries effective February 25, 2019. For the nine months ended September 30, 2019, "Loss"(Gain) loss on disposition" of $39.4 million included the non-cash effect of eliminating assets and liabilities of the U.K. Subsidiaries as of the date of deconsolidation, as well as the effect of cumulative currency exchange rate differences on the U.S. investment in the U.K.
In connection with the disposition of the U.K. Subsidiaries, the U.S. entity that owned the Company's interests in the U.K. Subsidiaries recognized a loss on investment. This loss resulted in an estimated U.S. federalFederal and state income tax benefit of $46.0 million, whichwas will be available to offset the Company's future U.S. federal and state income tax obligations. During the three months ended September 30,Subsequently, in 2019, the Company revised the estimate of theestimated tax basis in the U.K. Subsidiaries, resulting in a $0.6 million reduction in the income tax benefit initially recorded inas of September 30, 2019.
During the nine months ended September 30, 2020, the Company received its final distributions from the Administrators related to the wind-down of the U.K. Subsidiaries.
As of September 30, 2020 and December 31, 2019, the unaudited Condensed Consolidated Balance Sheets were not impacted by the U.K. Subsidiaries, as all balances were written off when the U.K. segment entered into administration during the first quarter of 2019.
The following table presents financial resultscash flows of the U.K. Subsidiaries which meet the criteria of Discontinued Operations and, therefore, are excluded from the Company's results of continuing operations (in thousands):
| Nine Months Ended September 30, | |||||||||||
| 2020 | 2019(1) | ||||||||||
| Net cash provided by (used in) discontinued operating activities | $ | 1,714 | $ | (504) | |||||||
| Net cash used in discontinued investing activities | 0 | (14,213) | |||||||||
| Net cash used in discontinued financing activities | 0 | 0 | |||||||||
| (1) Includes U.K. Subsidiaries financial results from January 1, 2019 to February 25, 2019. | |||||||||||
36
| Three Months Ended September 30, | Nine Months Ended September 30, 2019 | |||||||||||||||
| 2019 | 2018 | 2019(1) | 2018 | |||||||||||||
| Revenue | $ | — | $ | 13,522 | $ | 6,957 | $ | 36,251 | ||||||||
| Provision for losses | — | 6,831 | 1,703 | 16,618 | ||||||||||||
| Net revenue | — | 6,691 | 5,254 | 19,633 | ||||||||||||
| Cost of providing services | ||||||||||||||||
| Office | — | 416 | 246 | 1,490 | ||||||||||||
| Other costs of providing services | — | 120 | 61 | 1,213 | ||||||||||||
| Advertising | — | 2,765 | 775 | 7,077 | ||||||||||||
| Total cost of providing services | — | 3,301 | 1,082 | 9,780 | ||||||||||||
| Gross margin | — | 3,390 | 4,172 | 9,853 | ||||||||||||
| Operating expense (income) | ||||||||||||||||
| Corporate, district and other expenses | — | 7,690 | 3,810 | 18,390 | ||||||||||||
| Interest income | — | (7 | ) | (4 | ) | (19 | ) | |||||||||
| Loss on disposition | — | — | 39,414 | — | ||||||||||||
| Total operating expense | — | 7,683 | 43,220 | 18,371 | ||||||||||||
| Pre-tax loss from operations of discontinued operations | — | (4,293 | ) | (39,048 | ) | (8,518 | ) | |||||||||
| Income tax expense (benefit) related to disposition | 598 | 139 | (45,991 | ) | 278 | |||||||||||
| Net (loss) income from discontinued operations | $ | (598 | ) | $ | (4,432 | ) | �� | $ | 6,943 | $ | (8,796 | ) | ||||
| (1) Includes U.K. Subsidiaries financial results from January 1, 2019 to February 25, 2019. | ||||||||||||||||
CURO GROUP HOLDINGS CORP. AND SUBSIDIARIES
NOTES TO UNAUDITED CONDENSED CONSOLIDATED FINANCIAL STATEMENTS (continued)
NOTE 16 – GOODWILL
The change in the carrying amount of goodwill by operating segment for the nine months ended September 30, 2020 was as follows (in thousands):
| U.S. | Canada | Total | |||||||||||||||
| Goodwill at December 31, 2019 | $ | 91,131 | $ | 29,478 | $ | 120,609 | |||||||||||
| Acquisition (Note 17) | 14,791 | 0 | 14,791 | ||||||||||||||
| Foreign currency translation | 0 | (811) | (811) | ||||||||||||||
| Goodwill at September 30, 2020 | $ | 105,922 | $ | 28,667 | $ | 134,589 | |||||||||||
The Company tests goodwill at least annually for potential impairment as of October 1 and more frequently if indicators are present or changes in circumstances suggest that impairment may exist. The indicators include, among others, declines in sales, earning or cash flows or the development of a material adverse change in business climate. The Company assesses goodwill for impairment at the reporting unit level, which is defined as an operating segment or one level below an operating segment, referred to as a reporting unit. See Note 1, "Summary of Significant Accounting Policies and Nature of Operations" of the 2019 Form 10-K for additional information on the Company's policy for assessing goodwill for impairment.
In the third quarter of 2020, the Company performed an interim review of triggering events for both reporting units, which would indicate whether a quantitative or qualitative assessment of goodwill impairment is necessary. As a result of the interim triggering event review, the Company concluded an additional assessment was not necessary and did 0t record an impairment loss during the three months ended September 30, 2020. Similarly, no impairment losses were recorded in the first and second quarters of 2020.
Ad Astra Acquisition
The Company completed the acquisition of Ad Astra on January 3, 2020. Goodwill of $14.8 million was recorded in the U.S. reporting unit during the nine months ended September 30, 2020, based on the excess of the purchase price of the business combination over the fair value of the acquired net assets. See Note 17, "Acquisition" for more information related to the business combination.
NOTE 17 – ACQUISITION
On January 3, 2020, the Company acquired 100% of the outstanding stock of Ad Astra, a related party, for $14.4 million, net of cash received. Prior to the acquisition, Ad Astra had been the Company's exclusive provider of third-party collection services for owned and managed loans in the U.S. that are in later-stage delinquency.
The Company began consolidating the financial results of this acquisition in the unaudited Condensed Consolidated Financial Statements on January 3, 2020. For the nine months ended September 30, 2019, prior to the acquisition, $11.9 million of costs related to Ad Astra were included in "Other costs of providing services." Subsequent to the acquisition, operating costs for Ad Astra are included within "Corporate, district and other expenses," consistent with presentation of other internal collection costs. Ad Astra incurred $7.3 million of operating expense during the nine months ended September 30, 2020.
The transaction was accounted for using the acquisition method of accounting, which requires that assets acquired and liabilities assumed be recognized at their fair values as of the acquisition date. The Company was the acquirer for purposes of accounting for the business combination. The values assigned to the assets acquired and liabilities assumed were based on their estimates of fair value available. The Company completed the determination of the fair values of the acquired identifiable assets and liabilities based on the information available in March 2020.
37
CURO GROUP HOLDINGS CORP. AND SUBSIDIARIES
NOTES TO CONDENSED CONSOLIDATED FINANCIAL STATEMENTS (continued)
(unaudited)
The following table presentssummarizes the aggregate carrying amountsallocation of the estimated fair values of the assets acquired and liabilities assumed at the date of the U.K. Subsidiaries (in thousands):acquisition:
| September 30, 2019 | December 31, 2018 | |||||
| ASSETS | ||||||
| Cash | $ | — | $ | 9,859 | ||
| Restricted cash | — | 3,384 | ||||
| Gross loans receivable | — | 25,256 | ||||
| Less: allowance for loan losses | — | (5,387 | ) | |||
| Loans receivable, net | — | 19,869 | ||||
| Prepaid expenses and other | — | 1,482 | ||||
| Other | — | 267 | ||||
| Total assets classified as discontinued operations in the Condensed Consolidated Balance Sheets | $ | — | $ | 34,861 | ||
| LIABILITIES | ||||||
| Accounts payable and accrued liabilities | $ | — | $ | 8,136 | ||
| Deferred revenue | — | 180 | ||||
| Accrued interest | — | (5 | ) | |||
| Deferred rent | — | 149 | ||||
| Other long-term liabilities | — | 422 | ||||
| Total liabilities classified as discontinued operations in the Condensed Consolidated Balance Sheets | $ | — | $ | 8,882 | ||
Nine Months Ended September 30, | |||||||
2019(1) | 2018 | ||||||
| Net cash (used in) provided by discontinued operating activities | $ | (504 | ) | $ | 5,562 | ||
| Net cash used in discontinued investing activities | (14,213 | ) | (24,481 | ) | |||
| Net cash used in discontinued financing activities | — | — | |||||
| (1) Includes U.K. Subsidiaries financial results from January 1, 2019 to February 25, 2019. | |||||||
| (in thousands) | Amounts acquired on January 3, 2020 | ||||
| Cash consideration transferred: | $ | 17,811 | |||
| 3,360 | ||||
| 465 | ||||
| 358 | ||||
| 1,101 | ||||
| 14,791 | ||||
| 235 | ||||
| (2,264) | |||||
| Total | $ | 17,811 | |||
| September 30, 2019 | ||||||||||||||||||
| (dollars in thousands) | Subsidiary Guarantors | Subsidiary Non-Guarantors | Canada SPV | CURO | Eliminations | CURO Consolidated | ||||||||||||
| Assets: | ||||||||||||||||||
| Cash | $ | 40,683 | $ | 21,524 | $ | — | $ | — | $ | — | $ | 62,207 | ||||||
| Restricted cash | 13,773 | 3,084 | 21,897 | — | — | 38,754 | ||||||||||||
| Loans receivable, net | 293,711 | 49,362 | 206,157 | — | — | 549,230 | ||||||||||||
| Right of use asset - operating leases | 76,165 | 42,095 | — | — | — | 118,260 | ||||||||||||
| Deferred income taxes | (9,086 | ) | — | — | 10,932 | — | 1,846 | |||||||||||
| Income taxes receivable | (960 | ) | 3,974 | — | 20,952 | — | 23,966 | |||||||||||
| Prepaid expenses and other | 24,148 | 8,083 | (3 | ) | — | — | 32,228 | |||||||||||
| Property and equipment, net | 42,937 | 27,444 | — | — | — | 70,381 | ||||||||||||
| Goodwill | 91,131 | 28,979 | — | — | — | 120,110 | ||||||||||||
| Other intangibles, net | 10,687 | 21,979 | — | — | — | 32,666 | ||||||||||||
| Intercompany receivable | 112,413 | — | — | — | (112,413 | ) | — | |||||||||||
| Investment in subsidiaries | — | — | — | 37,131 | (37,131 | ) | — | |||||||||||
| Other | 17,805 | 679 | — | — | — | 18,484 | ||||||||||||
| Total assets | $ | 713,407 | $ | 207,203 | $ | 228,051 | $ | 69,015 | $ | (149,544 | ) | $ | 1,068,132 | |||||
| Liabilities and Stockholders' equity: | ||||||||||||||||||
| Accounts payable and accrued liabilities | $ | 48,657 | $ | 6,773 | $ | 7,259 | $ | 996 | $ | — | $ | 63,685 | ||||||
| Deferred revenue | 5,639 | 3,369 | 44 | — | — | 9,052 | ||||||||||||
| Lease liability - operating leases | 83,891 | 42,157 | — | — | — | 126,048 | ||||||||||||
| Income taxes payable | (4,030 | ) | — | — | 4,030 | — | — | |||||||||||
| Accrued interest | 104 | — | 777 | 4,744 | — | 5,625 | ||||||||||||
| Payable to CURO Holdings Corp. | 657,895 | — | — | (657,895 | ) | — | — | |||||||||||
| CSO liability for losses | 10,249 | — | — | — | — | 10,249 | ||||||||||||
| Debt | 25,000 | — | 102,483 | 677,924 | — | 805,407 | ||||||||||||
| Intercompany payable | — | 18,742 | 93,671 | — | (112,413 | ) | — | |||||||||||
| Other liabilities | 8,114 | 480 | — | — | — | 8,594 | ||||||||||||
| Deferred tax liabilities | (4,171 | ) | 4,427 | — | 4,171 | — | 4,427 | |||||||||||
| Total liabilities | 831,348 | 75,948 | 204,234 | 33,970 | (112,413 | ) | 1,033,087 | |||||||||||
| Stockholders' equity | (117,941 | ) | 131,255 | 23,817 | 35,045 | (37,131 | ) | 35,045 | ||||||||||
| Total liabilities and stockholders' equity | $ | 713,407 | $ | 207,203 | $ | 228,051 | $ | 69,015 | $ | (149,544 | ) | $ | 1,068,132 | |||||
| December 31, 2018 | ||||||||||||||||||
| (dollars in thousands) | Subsidiary Guarantors | Subsidiary Non-Guarantors | Canada SPV | CURO | Eliminations | CURO Consolidated | ||||||||||||
| Assets: | ||||||||||||||||||
| Cash | $ | 42,403 | $ | 18,772 | $ | — | $ | — | $ | — | $ | 61,175 | ||||||
| Restricted cash | 9,993 | 2,606 | 12,840 | — | — | 25,439 | ||||||||||||
| Loans receivable, net | 304,542 | 56,805 | 136,187 | — | — | 497,534 | ||||||||||||
| Deferred income taxes | — | 1,534 | — | — | — | 1,534 | ||||||||||||
| Income taxes receivable | 7,190 | — | — | 9,551 | — | 16,741 | ||||||||||||
| Prepaid expenses and other | 37,866 | 5,722 | — | — | — | 43,588 | ||||||||||||
| Property and equipment, net | 47,918 | 28,832 | — | — | — | 76,750 | ||||||||||||
| Goodwill | 91,131 | 28,150 | — | — | — | 119,281 | ||||||||||||
| Other intangibles, net | 8,418 | 21,366 | — | — | — | 29,784 | ||||||||||||
| Intercompany receivable | 77,009 | — | — | — | (77,009 | ) | — | |||||||||||
| Investment in subsidiaries | — | — | — | (101,665 | ) | 101,665 | — | |||||||||||
| Other | 12,253 | 677 | — | — | — | 12,930 | ||||||||||||
| Assets from discontinued operations | — | 2,406 | — | — | 32,455 | 34,861 | ||||||||||||
| Total assets | $ | 638,723 | $ | 166,870 | $ | 149,027 | $ | (92,114 | ) | $ | 57,111 | $ | 919,617 | |||||
| Liabilities and Stockholder's equity: | ||||||||||||||||||
| Accounts payable and accrued liabilities | $ | 38,240 | $ | 5,734 | $ | 4,980 | $ | 192 | $ | — | $ | 49,146 | ||||||
| Deferred revenue | 5,981 | 3,462 | 40 | — | — | 9,483 | ||||||||||||
| Income taxes payable | — | 1,579 | — | — | — | 1,579 | ||||||||||||
| Accrued interest | 149 | — | 831 | 19,924 | — | 20,904 | ||||||||||||
| Payable to CURO Holdings Corp. | 768,345 | — | — | (768,345 | ) | — | — | |||||||||||
| CSO liability for losses | 12,007 | — | — | — | — | 12,007 | ||||||||||||
| Deferred rent | 9,559 | 1,292 | — | — | — | 10,851 | ||||||||||||
| Debt | 20,000 | — | 107,479 | 676,661 | — | 804,140 | ||||||||||||
| Subordinated shareholder debt | — | 2,196 | — | — | — | 2,196 | ||||||||||||
| Intercompany payable | — | 224 | 44,330 | — | (44,554 | ) | — | |||||||||||
| Other liabilities | 4,967 | 833 | — | — | — | 5,800 | ||||||||||||
| Deferred tax liabilities | 15,175 | — | — | (1,445 | ) | — | 13,730 | |||||||||||
| Liabilities from discontinued operations | — | 8,882 | — | — | — | 8,882 | ||||||||||||
| Total liabilities | 874,423 | 24,202 | 157,660 | (73,013 | ) | (44,554 | ) | 938,718 | ||||||||||
| Stockholders' equity | (235,700 | ) | 142,668 | (8,633 | ) | (19,101 | ) | 101,665 | (19,101 | ) | ||||||||
| Total liabilities and stockholders' equity | $ | 638,723 | $ | 166,870 | $ | 149,027 | $ | (92,114 | ) | $ | 57,111 | $ | 919,617 | |||||
| Three Months Ended September 30, 2019 | ||||||||||||||||||
| (dollars in thousands) | Subsidiary Guarantors | Subsidiary Non-Guarantors | Canada SPV | CURO | Eliminations | CURO Consolidated | ||||||||||||
| Revenue | $ | 237,069 | $ | 29,984 | $ | 30,211 | $ | — | $ | — | $ | 297,264 | ||||||
| Provision for losses | 102,997 | 7,191 | 13,679 | — | — | 123,867 | ||||||||||||
| Net revenue | 134,072 | 22,793 | 16,532 | — | — | 173,397 | ||||||||||||
| Cost of providing services: | ||||||||||||||||||
| Salaries and benefits | 18,301 | 9,161 | — | — | — | 27,462 | ||||||||||||
| Occupancy | 8,249 | 5,787 | — | — | — | 14,036 | ||||||||||||
| Office | 4,611 | 1,382 | — | — | — | 5,993 | ||||||||||||
| Other costs of providing services | 11,475 | 1,368 | — | — | — | 12,843 | ||||||||||||
| Advertising | 14,186 | 2,238 | — | — | — | 16,424 | ||||||||||||
| Total cost of providing services | 56,822 | 19,936 | — | — | — | 76,758 | ||||||||||||
| Gross margin | 77,250 | 2,857 | 16,532 | — | — | 96,639 | ||||||||||||
| Operating expense (income) : | ||||||||||||||||||
| Corporate, district and other expenses | 29,930 | 5,296 | 472 | 2,967 | — | 38,665 | ||||||||||||
| Intercompany management fee | (3,276 | ) | 3,268 | 8 | — | — | — | |||||||||||
| Interest expense | 258 | 24 | 2,463 | 14,619 | — | 17,364 | ||||||||||||
| Loss from equity method investment | 1,384 | — | — | — | — | 1,384 | ||||||||||||
| Intercompany interest (income) expense | (1,462 | ) | 893 | 569 | — | — | — | |||||||||||
| Total operating expense | 26,834 | 9,481 | 3,512 | 17,586 | — | 57,413 | ||||||||||||
| Income (loss) from continuing operations before income taxes | 50,416 | (6,624 | ) | 13,020 | (17,586 | ) | — | 39,226 | ||||||||||
| Provision (benefit) for income tax expense | 13,700 | 1,986 | — | (4,447 | ) | — | 11,239 | |||||||||||
| Net income (loss) from continuing operations | 36,716 | (8,610 | ) | 13,020 | (13,139 | ) | ��� | 27,987 | ||||||||||
| Net loss on discontinued operations | — | (598 | ) | — | — | — | (598 | ) | ||||||||||
| Net (loss) income | 36,716 | (9,208 | ) | 13,020 | (13,139 | ) | — | 27,389 | ||||||||||
| Equity in net income (loss) of subsidiaries: | ||||||||||||||||||
| CFTC | — | — | — | 40,528 | (40,528 | ) | — | |||||||||||
| Guarantor Subsidiaries | 36,716 | — | — | — | (36,716 | ) | — | |||||||||||
| Non-Guarantor Subsidiaries | (9,208 | ) | — | — | — | 9,208 | — | |||||||||||
| SPV Subs | 13,020 | — | — | — | (13,020 | ) | — | |||||||||||
| Net income (loss) attributable to CURO | $ | 77,244 | $ | (9,208 | ) | $ | 13,020 | $ | 27,389 | $ | (81,056 | ) | $ | 27,389 | ||||
| Three Months Ended September 30, 2018 | ||||||||||||||||||||||||||||||
| (dollars in thousands) | CFTC | CURO Intermediate | Subsidiary Guarantors | Subsidiary Non-Guarantors | SPV Subs | Eliminations | CFTC Consolidated | CURO | Eliminations | CURO Consolidated | ||||||||||||||||||||
| Revenue | $ | — | $ | — | $ | 141,385 | $ | 39,814 | $ | 88,283 | $ | — | $ | 269,482 | $ | — | $ | — | $ | 269,482 | ||||||||||
| Provision for losses | — | — | 58,514 | 5,860 | 63,318 | — | 127,692 | — | — | 127,692 | ||||||||||||||||||||
| Net revenue | — | — | 82,871 | 33,954 | 24,965 | — | 141,790 | — | — | 141,790 | ||||||||||||||||||||
| Cost of providing services: | ||||||||||||||||||||||||||||||
| Salaries and benefits | — | — | 17,579 | 8,936 | — | — | 26,515 | — | — | 26,515 | ||||||||||||||||||||
| Occupancy | — | — | 7,875 | 5,647 | — | — | 13,522 | — | — | 13,522 | ||||||||||||||||||||
| Office | — | — | 5,586 | 1,740 | — | — | 7,326 | — | — | 7,326 | ||||||||||||||||||||
| Other store operating expenses | — | — | 10,650 | 1,244 | 590 | — | 12,484 | — | — | 12,484 | ||||||||||||||||||||
| Advertising | — | — | 17,632 | 3,717 | — | — | 21,349 | — | — | 21,349 | ||||||||||||||||||||
| Total cost of providing services | — | — | 59,322 | 21,284 | 590 | — | 81,196 | — | — | 81,196 | ||||||||||||||||||||
| Gross Margin | — | — | 23,549 | 12,670 | 24,375 | — | 60,594 | — | — | 60,594 | ||||||||||||||||||||
| Operating (income) expense: | ||||||||||||||||||||||||||||||
| Corporate, district and other expenses | (886 | ) | 48 | 20,663 | 5,134 | 60 | — | 25,019 | 2,476 | — | 27,495 | |||||||||||||||||||
| Intercompany management fee | — | — | (6,761 | ) | 2,516 | 4,245 | — | — | — | — | — | |||||||||||||||||||
| Interest expense | 12,503 | — | (149 | ) | (38 | ) | 5,276 | — | 17,592 | 5,811 | — | 23,403 | ||||||||||||||||||
| Intercompany interest (income) expense | — | (916 | ) | (455 | ) | 1,371 | — | — | — | — | — | — | ||||||||||||||||||
| Loss on extinguishment of debt | 69,200 | — | — | — | — | — | 69,200 | — | — | 69,200 | ||||||||||||||||||||
| Total operating expense | 80,817 | (868 | ) | 13,298 | 8,983 | 9,581 | — | 111,811 | 8,287 | — | 120,098 | |||||||||||||||||||
| (Loss) income from continuing operations before income taxes | (80,817 | ) | 868 | 10,251 | 3,687 | 14,794 | — | (51,217 | ) | (8,287 | ) | — | (59,504 | ) | ||||||||||||||||
| (Benefit) provision for income tax expense | (17,930 | ) | 6,803 | (2,177 | ) | (1,508 | ) | — | — | (14,812 | ) | (2,102 | ) | — | (16,914 | ) | ||||||||||||||
| Net (loss) income from continuing operations | (62,887 | ) | (5,935 | ) | 12,428 | 5,195 | 14,794 | — | (36,405 | ) | (6,185 | ) | — | (42,590 | ) | |||||||||||||||
| Net loss from discontinued operations | — | — | — | (4,432 | ) | — | — | (4,432 | ) | — | — | (4,432 | ) | |||||||||||||||||
| Net (loss) income | (62,887 | ) | (5,935 | ) | 12,428 | 763 | 14,794 | — | (40,837 | ) | (6,185 | ) | — | (47,022 | ) | |||||||||||||||
| Equity in net income (loss) of subsidiaries: | ||||||||||||||||||||||||||||||
| CFTC | — | — | — | — | — | — | — | (40,837 | ) | 40,837 | — | |||||||||||||||||||
| CURO Intermediate | (5,935 | ) | — | — | — | — | 5,935 | — | — | — | — | |||||||||||||||||||
| Guarantor Subsidiaries | 12,428 | — | — | — | — | (12,428 | ) | — | — | — | — | |||||||||||||||||||
| Non-Guarantor Subsidiaries | 763 | — | — | — | — | (763 | ) | — | — | — | — | |||||||||||||||||||
| SPV Subs | 14,794 | — | — | — | — | (14,794 | ) | — | — | — | — | |||||||||||||||||||
| Net (loss) income attributable to CURO | $ | (40,837 | ) | $ | (5,935 | ) | $ | 12,428 | $ | 763 | $ | 14,794 | $ | (22,050 | ) | $ | (40,837 | ) | $ | (47,022 | ) | $ | 40,837 | $ | (47,022 | ) | ||||
| Nine Months Ended September 30, 2019 | ||||||||||||||||||
| (dollars in thousands) | Subsidiary Guarantors | Subsidiary Non-Guarantors | Canada SPV | CURO | Eliminations | CURO Consolidated | ||||||||||||
| Revenue | $ | 673,234 | $ | 84,920 | $ | 81,349 | $ | — | $ | — | $ | 839,503 | ||||||
| Provision for losses | 280,529 | 17,634 | 40,099 | — | — | 338,262 | ||||||||||||
| Net revenue | 392,705 | 67,286 | 41,250 | — | — | 501,241 | ||||||||||||
| Cost of providing services: | ||||||||||||||||||
| Salaries and benefits | 55,675 | 26,574 | — | — | — | 82,249 | ||||||||||||
| Occupancy | 24,292 | 17,913 | — | — | — | 42,205 | ||||||||||||
| Office | 12,504 | 4,059 | — | — | — | 16,563 | ||||||||||||
| Other costs of providing services | 36,395 | 3,522 | — | — | — | 39,917 | ||||||||||||
| Advertising | 31,719 | 5,271 | — | — | — | 36,990 | ||||||||||||
| Total cost of providing services | 160,585 | 57,339 | — | — | — | 217,924 | ||||||||||||
| Gross margin | 232,120 | 9,947 | 41,250 | — | — | 283,317 | ||||||||||||
| Operating expense (income): | ||||||||||||||||||
| Corporate, district and other expenses | 98,486 | 16,900 | (283 | ) | 7,940 | — | 123,043 | |||||||||||
| Intercompany management fee | (9,576 | ) | 9,553 | 23 | — | — | — | |||||||||||
| Interest expense | 575 | 103 | 7,728 | 43,671 | — | 52,077 | ||||||||||||
| Loss from equity method investment | 5,132 | — | — | — | — | 5,132 | ||||||||||||
| Intercompany interest (income) expense | (3,855 | ) | 2,663 | 1,192 | — | — | — | |||||||||||
| Total operating expense | 90,762 | 29,219 | 8,660 | 51,611 | — | 180,252 | ||||||||||||
| Income (loss) from continuing operations before income taxes | 141,358 | (19,272 | ) | 32,590 | (51,611 | ) | — | 103,065 | ||||||||||
| Provision (benefit) for income tax expense | 37,309 | 4,115 | — | (12,686 | ) | — | 28,738 | |||||||||||
| Net income (loss) from continuing operations | 104,049 | (23,387 | ) | 32,590 | (38,925 | ) | — | 74,327 | ||||||||||
| Net loss on discontinued operations | — | 6,943 | — | — | — | 6,943 | ||||||||||||
| Net income (loss) | 104,049 | (16,444 | ) | 32,590 | (38,925 | ) | — | 81,270 | ||||||||||
| Equity in net income (loss) of subsidiaries: | ||||||||||||||||||
| CFTC | — | — | — | 120,195 | (120,195 | ) | — | |||||||||||
| Guarantor Subsidiaries | 104,049 | — | — | — | (104,049 | ) | — | |||||||||||
| Non-Guarantor Subsidiaries | (16,444 | ) | — | — | — | 16,444 | — | |||||||||||
| SPV Subs | 32,590 | — | — | — | (32,590 | ) | — | |||||||||||
| Net income (loss) attributable to CURO | $ | 224,244 | $ | (16,444 | ) | $ | 32,590 | $ | 81,270 | $ | (240,390 | ) | $ | 81,270 | ||||
| Nine Months Ended September 30, 2018 | ||||||||||||||||||||||||||||||
| (dollars in thousands) | CFTC | CURO Intermediate | Subsidiary Guarantors | Subsidiary Non-Guarantors | SPV Subs | Eliminations | CFTC Consolidated | CURO | Eliminations | CURO Consolidated | ||||||||||||||||||||
| Revenue | $ | — | $ | — | $ | 387,827 | $ | 133,107 | $ | 236,560 | $ | — | $ | 757,494 | $ | — | $ | — | $ | 757,494 | ||||||||||
| Provision for losses | — | — | 140,603 | 32,770 | 117,549 | — | 290,922 | — | — | 290,922 | ||||||||||||||||||||
| Net revenue | — | — | 247,224 | 100,337 | 119,011 | — | 466,572 | — | — | 466,572 | ||||||||||||||||||||
| Cost of providing services: | ||||||||||||||||||||||||||||||
| Salaries and benefits | — | — | 53,667 | 26,674 | — | — | 80,341 | — | — | 80,341 | ||||||||||||||||||||
| Occupancy | — | — | 23,164 | 17,105 | — | — | 40,269 | — | — | 40,269 | ||||||||||||||||||||
| Office | — | — | 15,416 | 3,895 | — | — | 19,311 | — | — | 19,311 | ||||||||||||||||||||
| Other store operating expenses | — | — | 33,934 | 3,045 | 1,537 | — | 38,516 | — | — | 38,516 | ||||||||||||||||||||
| Advertising | — | — | 35,200 | 9,147 | — | — | 44,347 | — | — | 44,347 | ||||||||||||||||||||
| Total cost of providing services | — | — | 161,381 | 59,866 | 1,537 | — | 222,784 | — | — | 222,784 | ||||||||||||||||||||
| Gross Margin | — | — | 85,843 | 40,471 | 117,474 | — | 243,788 | — | — | 243,788 | ||||||||||||||||||||
| Operating expense (income): | ||||||||||||||||||||||||||||||
| Corporate, district and other expenses | 20 | 73 | 74,038 | 14,789 | 137 | — | 89,057 | 6,847 | — | 95,904 | ||||||||||||||||||||
| Intercompany management fee | — | — | (19,718 | ) | 8,425 | 11,293 | — | — | — | — | — | |||||||||||||||||||
| Interest expense | 47,410 | — | (321 | ) | 26 | 13,303 | — | 60,418 | 5,811 | — | 66,229 | |||||||||||||||||||
| Intercompany interest (income) expense | — | (2,700 | ) | (526 | ) | 3,226 | — | — | — | — | — | — | ||||||||||||||||||
| Loss on extinguishment of debt | 80,883 | — | — | — | — | — | 80,883 | — | — | 80,883 | ||||||||||||||||||||
| Total operating expense | 128,313 | (2,627 | ) | 53,473 | 26,466 | 24,733 | — | 230,358 | 12,658 | — | 243,016 | |||||||||||||||||||
| (Loss) income from continuing operations before income taxes | (128,313 | ) | 2,627 | 32,370 | 14,005 | 92,741 | — | 13,430 | (12,658 | ) | — | 772 | ||||||||||||||||||
| (Benefit) provision for income tax expense | (30,189 | ) | 38,830 | (8,220 | ) | 2,521 | — | — | 2,942 | (3,211 | ) | — | (269 | ) | ||||||||||||||||
| Net (loss) income from continuing operations | (98,124 | ) | (36,203 | ) | 40,590 | 11,484 | 92,741 | — | 10,488 | (9,447 | ) | — | 1,041 | |||||||||||||||||
| Net loss from discontinued operations | — | — | — | (8,796 | ) | — | — | (8,796 | ) | — | — | (8,796 | ) | |||||||||||||||||
| Net (loss) income | (98,124 | ) | (36,203 | ) | 40,590 | 2,688 | 92,741 | — | 1,692 | (9,447 | ) | — | (7,755 | ) | ||||||||||||||||
| Equity in net (loss) income of subsidiaries: | ||||||||||||||||||||||||||||||
| CFTC | — | — | — | — | — | — | — | 1,692 | (1,692 | ) | — | |||||||||||||||||||
| CURO Intermediate | (36,203 | ) | — | — | — | — | 36,203 | — | — | — | — | |||||||||||||||||||
| Guarantor Subsidiaries | 40,590 | — | — | — | — | (40,590 | ) | — | — | — | — | |||||||||||||||||||
| Non-Guarantor Subsidiaries | 2,688 | — | — | — | — | (2,688 | ) | — | — | — | — | |||||||||||||||||||
| SPV Subs | 92,741 | — | — | — | — | (92,741 | ) | — | — | — | — | |||||||||||||||||||
| Net income (loss) attributable to CURO | $ | 1,692 | $ | (36,203 | ) | $ | 40,590 | $ | 2,688 | $ | 92,741 | $ | (99,816 | ) | $ | 1,692 | $ | (7,755 | ) | $ | (1,692 | ) | $ | (7,755 | ) | |||||
| Nine Months Ended September 30, 2019 | ||||||||||||||||||
| (dollars in thousands) | Subsidiary Guarantors | Subsidiary Non-Guarantors | Canada SPV | CURO | Eliminations | CURO Consolidated | ||||||||||||
| Cash flows from operating activities: | ||||||||||||||||||
| Net cash provided by continuing operating activities | $ | 273,564 | $ | 17,201 | $ | 119,898 | $ | 52,311 | $ | 1,319 | $ | 464,293 | ||||||
| Net cash used in discontinued operating activities | — | (504 | ) | — | — | — | (504 | ) | ||||||||||
| Cash flows from investing activities: | ||||||||||||||||||
| Purchase of property, equipment and software | (7,351 | ) | (1,316 | ) | — | — | — | (8,667 | ) | |||||||||
| Originations of loans, net | (261,073 | ) | (11,042 | ) | (102,238 | ) | — | — | (374,353 | ) | ||||||||
| Investment in Zibby | (8,168 | ) | — | — | — | — | (8,168 | ) | ||||||||||
| Net cash used in continuing investing activities | (276,592 | ) | (12,358 | ) | (102,238 | ) | — | — | (391,188 | ) | ||||||||
| Net cash used in discontinued investing activities | — | (14,213 | ) | — | — | — | (14,213 | ) | ||||||||||
| Cash flows from financing activities: | ||||||||||||||||||
| Proceeds from Non-Recourse Canada SPV facility | — | — | 15,992 | — | — | 15,992 | ||||||||||||
| Payments on Non-Recourse Canada SPV facility | — | — | (24,835 | ) | — | — | (24,835 | ) | ||||||||||
| Proceeds from credit facilities | 120,000 | 59,811 | — | — | — | 179,811 | ||||||||||||
| Payments on credit facilities | (115,000 | ) | (59,811 | ) | — | — | — | (174,811 | ) | |||||||||
| Payments on subordinated stockholder debt | — | (2,252 | ) | — | — | — | (2,252 | ) | ||||||||||
| Payments to net share settle RSUs | — | — | — | (110 | ) | — | (110 | ) | ||||||||||
| Proceeds from exercise of stock options | 87 | — | — | — | — | 87 | ||||||||||||
| Debt issuance costs paid | — | — | (169 | ) | (29 | ) | — | (198 | ) | |||||||||
| Repurchase of common stock | — | — | — | (52,172 | ) | — | (52,172 | ) | ||||||||||
Net cash used in provided by financing activities (1) | 5,087 | (2,252 | ) | (9,012 | ) | (52,311 | ) | — | (58,488 | ) | ||||||||
| Effect of exchange rate changes on cash and restricted cash | — | 2,114 | 409 | — | (1,319 | ) | 1,204 | |||||||||||
| Net increase (decrease) in cash and restricted cash | 2,059 | (10,012 | ) | 9,057 | — | — | 1,104 | |||||||||||
| Cash and restricted cash at beginning of period | 52,397 | 34,620 | 12,840 | — | — | 99,857 | ||||||||||||
| Cash at end of period | $ | 54,456 | $ | 24,608 | $ | 21,897 | $ | — | $ | — | $ | 100,961 | ||||||
| (1) Financing activities include continuing operations only and were not impacted by discontinued operations | ||||||||||||||||||
| Nine Months Ended September 30, 2018 | ||||||||||||||||||||||||
| (dollars in thousands) | CFTC | Subsidiary Guarantors | Subsidiary Non-Guarantors | SPV Subs | Eliminations | CFTC Consolidated | CURO | CURO Consolidated | ||||||||||||||||
| Cash flows from operating activities: | ||||||||||||||||||||||||
| Net cash provided by (used in) continuing operating activities | $ | 628,468 | $ | 167,265 | $ | (5,013 | ) | $ | 221,222 | $ | 22,344 | $ | 1,034,286 | $ | (677,207 | ) | $ | 357,079 | ||||||
| Net cash provided by (used in) discontinued operating activities | — | — | 23,737 | — | (18,175 | ) | 5,562 | — | 5,562 | |||||||||||||||
| Net cash provided by (used in) operating activities | 628,468 | 167,265 | 18,724 | 221,222 | 4,169 | 1,039,848 | (677,207 | ) | 362,641 | |||||||||||||||
| Cash flows from investing activities: | ||||||||||||||||||||||||
| Purchase of property, equipment and software | — | (6,466 | ) | (1,564 | ) | — | — | (8,030 | ) | — | (8,030 | ) | ||||||||||||
| Originations of loans, net | — | (162,031 | ) | (558 | ) | (249,846 | ) | — | (412,435 | ) | — | (412,435 | ) | |||||||||||
| Investment in Zibby | (958 | ) | — | — | — | — | (958 | ) | — | (958 | ) | |||||||||||||
| Net cash used in continuing investing activities | (958 | ) | (168,497 | ) | (2,122 | ) | (249,846 | ) | — | (421,423 | ) | — | (421,423 | ) | ||||||||||
| Net cash used in discontinued investing activities | — | — | (24,481 | ) | — | — | (24,481 | ) | — | (24,481 | ) | |||||||||||||
| Net cash used in investing activities | (958 | ) | (168,497 | ) | (26,603 | ) | (249,846 | ) | — | (445,904 | ) | — | (445,904 | ) | ||||||||||
| Cash flows from financing activities: | ||||||||||||||||||||||||
| Proceeds from Non-Recourse U.S. and Canada SPV facilities | — | — | — | 106,949 | — | 106,949 | — | 106,949 | ||||||||||||||||
| Payments on Non-Recourse U.S. and Canada SPV facilities | — | — | — | (61,590 | ) | — | (61,590 | ) | — | (61,590 | ) | |||||||||||||
| Proceeds from credit facilities | 39,000 | — | 26,169 | — | — | 65,169 | — | 65,169 | ||||||||||||||||
| Payments on credit facilities | (10,000 | ) | — | (26,169 | ) | — | — | (36,169 | ) | — | (36,169 | ) | ||||||||||||
| Net proceeds from issuance of common stock | 11,549 | — | — | — | — | 11,549 | — | 11,549 | ||||||||||||||||
| Proceeds from exercise of stock options | 408 | — | — | — | — | 408 | — | 408 | ||||||||||||||||
| Payments on 12.00% Senior Secured Notes | (605,000 | ) | — | — | — | — | (605,000 | ) | — | (605,000 | ) | |||||||||||||
| Payments of call premiums from early debt extinguishments | (63,350 | ) | — | — | — | — | (63,350 | ) | — | (63,350 | ) | |||||||||||||
| Debt issuance costs paid | (117 | ) | — | — | (4,527 | ) | — | (4,644 | ) | (12,873 | ) | (17,517 | ) | |||||||||||
Net cash (used in) provided by financing activities (1) | (627,510 | ) | — | — | 40,832 | — | (586,678 | ) | 677,127 | 90,449 | ||||||||||||||
| Effect of exchange rate changes on cash | — | — | 61 | 28 | (4,169 | ) | (4,080 | ) | — | (4,080 | ) | |||||||||||||
| Net (decrease) increase in cash and restricted cash | — | (1,232 | ) | (7,818 | ) | 12,236 | — | 3,186 | (80 | ) | 3,106 | |||||||||||||
| Cash and restricted cash at beginning of period | — | 119,056 | 48,484 | 6,871 | — | 174,411 | 80 | 174,491 | ||||||||||||||||
| Cash and restricted cash at end of period | — | 117,824 | 40,666 | 19,107 | — | 177,597 | — | 177,597 | ||||||||||||||||
| Less: Cash and restricted cash at end of period of Discontinued Operations | — | — | 11,303 | — | — | 11,303 | — | 11,303 | ||||||||||||||||
| Cash and restricted cash at end of period of Continuing Operations | $ | — | $ | 117,824 | $ | 29,363 | $ | 19,107 | $ | — | $ | 166,294 | $ | — | $ | 166,294 | ||||||||
| (1) Financing activities include continuing operations only and were not impacted by discontinued operations. | ||||||||||||||||||||||||
NOTE 1718 – SHARE REPURCHASE PROGRAM
In February 2020, the Company's Board of Directors authorized a new share repurchase program for up to $25.0 million of its common stock. Due to uncertainty caused by COVID-19, the Board suspended the program on March 15, 2020. There were no material purchases under the program during the nine months ended September 30, 2020.
In April 2019, the Company's Board of Directors authorized a share repurchase program providing for the repurchase of up to $50.0 million of its common stock. The repurchase program, which commenced June 2019, will continue untilwas completed or terminated. CURO expectsin February 2020. Under this program, the purchases to beCompany repurchased 455,255 shares of its common stock at an average price of $10.45 per share for total consideration of $4.8 million during the nine months ended September 30, 2020. Purchases under the program were made from time-to-time in the open market, in privately negotiated transactions, or both, at the Company's discretion and subject to market conditions and other factors. Any repurchased shares will beare available for use in connection with equity plans or other corporate purposes.
| Three Months Ended September 30, 2019 | Nine Months Ended September 30, 2019 | ||||||
| Total number of shares repurchased | 1,912,041 | 2,156,241 | |||||
| Average price paid per share | $ | 12.27 | $ | 12.04 | |||
| Total value of shares repurchased | $ | 23,455 | $ | 25,962 | |||
| Total authorized repurchase amount for the period presented | $ | 47,493 | $ | 50,000 | |||
| Total value of shares repurchased | 23,455 | 25,962 | |||||
| Total remaining authorized repurchase amount | $ | 24,038 | $ | 24,038 | |||
Separately, in August 2019, the Company entered into a Share Repurchase Agreement (the “Share Repurchase Agreement”) with Friedman Fleischer & Lowe Capital Partners II, L.P. and its affiliated investment funds (“FFL”),FFL, a related party to the Company.party. Pursuant to the Share Repurchase Agreement, the Company repurchased 2,000,000 shares of its common stock, par value $0.001 per share, owned by FFL, in a private transaction at a purchase price equal to $13.55 per share of Common Stock. The purchase price was determined by using the Company's closing common stock price on August 29, 2019 of $13.97, less a discount of 3.0%. This transaction occurred outside of the share repurchase program authorized in April 2019.
NOTE 1819 – SUBSEQUENT EVENTS
38
| October 1 - November 1 | ||||
| 2019 | ||||
| Total number of shares repurchased | 868,100 | |||
| Average price paid per share | $ | 13.03 | ||
| Total value of shares repurchased | $ | 11,311 | ||
ITEM 2. MANAGEMENT'S DISCUSSION AND ANALYSIS OF FINANCIAL CONDITION AND RESULTS OF OPERATIONS
Forward-Looking Statements
The following discussion of financial condition, results of operations, liquidity and capital resources and certain factors that may affect future results, including company-specific, economic and industry-wide factors, should be read in conjunction with our unaudited Condensed Consolidated Financial Statements and accompanying notes included herein. This Management’s Discussion and Analysis of Financial Condition and Results of Operations contains forward-looking statements. The matters discussed in these forward-looking statements are subject to risk, uncertainties and other factors that could cause actual results to differ materially from those made, projected or implied in the forward-looking statements. Except as required by applicable law and regulations, we undertake no obligation to update any forward-looking statements or other statements we may make in the following discussion or elsewhere in this document even though these statements may be affected by events or circumstances occurring after the forward-looking statements or other statements were made. Please see “Risk Factors” in our Annual2019 Form 10-K, Quarterly Report on Form 10-K10-Q for the yearquarter ended DecemberMarch 31, 20182020, Current Report on Form 8-K, filed with the SecuritiesSEC on April 8, 2020, and Exchange Commissions (the "SEC")Quarterly Report on March 18, 2019 ("Form 10-Q for the "2018 Form 10-K")quarter ended June 30, 2020 for a discussion of the uncertainties, risks and assumptions associated with these statements.
Overview
We are a growth-oriented, technology-enabled, highly-diversified, multi-channel and multi-product consumer finance company serving a wide range of underbanked consumers in the United States ("U.S."), Canada and through February 25, 2019, the United Kingdom ("U.K.").Canada.
History
CURO was founded in 1997 to meet the growing needs of underbanked consumers looking for alternative access to credit. With more than 20nearly 25 years of experience, we seek to offer a variety of convenient, easily-accessible financial and loan services in all of our markets.
CURO Financial Technologies Corp., previously known as Speedy Cash Holdings Corp. ("CFTC"), was incorporated in Delaware in July 2008. CURO Group Holdings Corp., previously known as Speedy Group Holdings Corp., was incorporated in Delaware in 2013 as the parent company of CFTC. The terms “CURO," "we,” “our,” “us” and the “Company” refer to CURO Group Holdings Corp. and its directly and indirectly owned subsidiaries as a combined entity, except where otherwise stated. The term "CFTC" refers to CURO Financial Technologies Corp.
In the U.S., our wholly-owned subsidiary,stores operate under "Speedy Cash" and its directly and indirectly owned subsidiaries as a consolidated entity, except where otherwise stated.
In the fourth quarter of 2019, we terminatedpartnered with Stride Bank to launch a bank-sponsored Unsecured Installment loan product, Verge Credit, originated by Stride Bank, which are included in "Gross loans receivable" on the unaudited Condensed Consolidated Balance Sheets. We market and service loans on behalf of Stride Bank, and the bank licenses our proprietary credit decisioning for its loan scoring and approval. As of September 30, 2020, Verge Credit loans are offered in 14 states.
Recent Developments
COVID-19. As the COVID-19 pandemic continues to affect economies worldwide, we remain focused on protecting the health and well-being of our employees, customers, and the communities in which we operate, while assuring the continuity of our business operations. We are considered an essential financial service under federal guidelines, in both the U.S. and Canada, and under local regulations, and as such, remain open to facilitate the needs of our customers during local government lock down orders. While resurgences of the pandemic have occurred and could continue to occur in both our U.S. and Canadian
39
jurisdictions, with local governmental bodies issuing guidelines on reopening procedures depending on the severity of resurgences, we have established processes and procedures during the crisis to help ensure we can continue to operate safely for both our employees and customers.
As previously disclosed, agreementwe have taken the following steps to ensure our financial stability while maintaining the health and well-being of our employees and customers:
•cancellation of the 2020 Short-Term Incentive Plan;
•suspension of our $25 million share repurchase program that was approved in February 2020;
•establishment of an enhanced Customer Care Program, as described further below;
•adjustment of our credit underwriting models to tighten approval rates and enhance our employment and income verification practices for both store and on-line lending platforms; and
•implementation of work-from-home for virtually all 1,100 of the Company’s contact center and corporate support personnel in Wichita, Toronto and Chicago.
For our communities, we committed $500,000 to support local healthcare workers battling COVID-19. To date, in addition to providing financial support to Frontline Foods chapters as previously disclosed, our CURO volunteers have personally coordinated more than 25,000 meals to area hospitals in Wichita, KS and Toronto, ON.
Refer to Note 1, "Summary of Significant Accounting Policies and Nature of Operations" for a description of the U.S. and Canadian government responses to the COVID-19 pandemic, the impact to our customers, and the potential impact on our unaudited Condensed Consolidated Financial Statements.
Customer Care Program. To better serve our customers during the COVID-19 pandemic as they face unprecedented economic challenges and uncertainties, we established an enhanced Customer Care Program. The program enables our team members to provide relief to customers in various ways, ranging from due date extensions, interest or fee forgiveness, payment waivers or extended payment plans, depending on a customer’s individual circumstances. As of September 30, 2020, we had granted concessions on more than 55,000 loans, or 11% of our active loans, and waived over $5.0 million in payments and fees. We also temporarily suspended all returned item fees. Approximately 22,000 of the loans on which we granted concessions for qualified as a TDR as of September 30, 2020. See Note 3, "Loans Receivable and Revenue" of the Notes to the unaudited Condensed Consolidated Financial Statements for additional information.
Katapult Investment. Katapult is a private lease-to-own platform for online, brick and mortar and omni-channel retailers. Katapult provides the retailers' customers with MetaBank,payment options in store or via the Katapult link on a wholly-owned subsidiaryretailer's website. Since our initial acquisition of Meta Financial Group, Inc.certain equity securities in Katapult in April 2017, we have continued to increase our investment opportunistically. After additional investments in September 2020, we owned 46.6% of Katapult on a fully diluted basis. See Note 8, "Fair Value Measurements" for additional details about our investment in Katapult and fair value considerations.
Ad Astra Acquisition. On January 3, 2020, we acquired Ad Astra, previously our exclusive provider of third-party collection services for the U.S. business. The acquisition brings all U.S. servicing and recovery in-house, drives operational and financial synergies to ensure all aspects of the recovery portfolio are coordinated, reduces operational redundancy and increases peak volume management, improve compliance synergies, and facilitates integrated and personalized CRM strategies and campaign management across the servicing and recovery lifecycle. See "Regulatory Environment and Compliance"Note 17, "Acquisition" of the Notes to the unaudited Condensed Consolidated Financial Statements for additional details.information.
Credit Facilities. On April 8, 2020, we entered into the Non-Recourse U.S. SPV Facility to provide financing for U.S. Installment and Open-End receivables, including those generated under our technology, marketing and servicing relationship with Stride Bank. The credit facility, which was initially entered into with a borrowing capacity of $100.0 million, was expanded in August 2020 to $200.0 million and is dependent upon the borrowing base of eligible collateral and certain other conditions, as described in Note 5, "Debt."For recent developments related to our Senior Secured Notes, Non-Recourse Canada SPV facilitiesfacility and other capital resources, see “Management’s Discussion and Analysis of Financial Condition and Results of Operations—Liquidity and Capital Resources.”
40
three and nine months ended September 30, 2020, respectively, compared to 11.8% and 12.8% for the three and nine months ended September 30, 2019, respectively. See "Regulatory Environment and Compliance" in our Current Report2019 10-K for additional details.
CFPB Rule on Form 8-K filed withSmall Dollar Lending. On July 7, 2020, the SECCFPB issued its decision on January 31,the 2019 related to Curo Transatlantic LimitedProposed Rule and SRC Transatlantic Limited (collectivelyrescinded the "U.K. Subsidiaries"), would not be implemented. We also announced that effective February 25, 2019, in accordance with themandatory underwriting provisions of the U.K. Insolvency Act 1986 and as approved by2017 Final CFPB Rule. However, the boards of directors of our U.K. Subsidiaries, insolvency practitioners from KPMG were appointed as administrators ("Administrators") forCFPB did not rescind or alter the U.K. Subsidiaries. The effectpayment provisions of the U.K. Subsidiaries’ entry into administration was to place2017 Final CFPB Rule. We cannot predict when the management, affairs, business and propertypayment provisions of the U.K. Subsidiaries under2017 Final CFPB Rule will come into effect, given that the direct control of the Administrators. Asrule is currently stayed as a result we deconsolidated the U.K. Subsidiaries as of February 25, 2019 and presented the U.K. Subsidiaries as Discontinued Operations in this Quarterly Report on Form 10-Q ("Form 10-Q").
Revenue by Product and Segment and Related Loan Portfolio Performance
Revenue by Product
The following tables summarizetable summarizes revenue by product, including credit services organization ("CSO")CSO fees, for the periodsperiod indicated (in thousands, unaudited):
| For the Three Months Ended | ||||||||||||||||||||||||||
| September 30, 2020 | September 30, 2019 | |||||||||||||||||||||||||
| U.S. | Canada | Total | U.S. | Canada | Total | |||||||||||||||||||||
| Unsecured Installment | $ | 66,204 | $ | 1,204 | $ | 67,408 | $ | 135,541 | $ | 1,692 | $ | 137,233 | ||||||||||||||
| Secured Installment | 16,692 | — | 16,692 | 28,270 | — | 28,270 | ||||||||||||||||||||
| Open-End | 30,431 | 28,280 | 58,711 | 39,605 | 26,515 | 66,120 | ||||||||||||||||||||
| Single-Pay | 16,050 | 9,034 | 25,084 | 29,140 | 20,172 | 49,312 | ||||||||||||||||||||
| Ancillary | 3,471 | 10,637 | 14,108 | 4,513 | 11,816 | 16,329 | ||||||||||||||||||||
| Total revenue | $ | 132,848 | $ | 49,155 | $ | 182,003 | $ | 237,069 | $ | 60,195 | $ | 297,264 | ||||||||||||||
| For the Three Months Ended | ||||||||||||||||||||
| September 30, 2019 | September 30, 2018 | |||||||||||||||||||
| U.S. | Canada | Total | U.S. | Canada | Total | |||||||||||||||
| Unsecured Installment | $ | 135,541 | $ | 1,692 | $ | 137,233 | $ | 135,028 | $ | 2,632 | $ | 137,660 | ||||||||
| Secured Installment | 28,270 | — | 28,270 | 28,562 | — | 28,562 | ||||||||||||||
| Open-End | 39,605 | 26,515 | 66,120 | 27,554 | 12,736 | 40,290 | ||||||||||||||
| Single-Pay | 29,140 | 20,172 | 49,312 | 27,792 | 22,822 | 50,614 | ||||||||||||||
| Ancillary | 4,513 | 11,816 | 16,329 | 4,337 | 8,019 | 12,356 | ||||||||||||||
| Total revenue | $ | 237,069 | $ | 60,195 | $ | 297,264 | $ | 223,273 | $ | 46,209 | $ | 269,482 | ||||||||
During the three months ended September 30, 2019,2020, total revenue grew $27.8declined $115.3 million, or 10.3%38.8%, to $297.3$182.0 million, compared to the prior-year period, predominantly driven by growth in Open-End loans in both countries.period. Geographically, total revenue in the U.S. and Canada grew 6.2%revenues declined 44.0% and 30.3%18.3%, respectively.
From a product perspective, Unsecured Installment and Secured Installment revenues rose 0.4%decreased $69.8 million, or 50.9%, and $11.6 million, or 41.0%, respectively, because of COVID-19 Impacts and regulatory changes in California that were effective January 1, 2020. Excluding California, Unsecured Installment and Secured Installment revenues decreased $53.7 million, or 48.1%, and $6.4 million, or 33.9%, respectively.
Single-Pay revenue declined $24.2 million, or 49.1%, for the three months ended September 30, 2020, compared to the prior-year period, primarily due to COVID-19 impacts on loan volumes and balances, which declined $36.8 million, or 47.1%, year over year. Single-Pay loan volumes were particularly affected by the broad reduction in storefront usage by customers during the period of self-quarantine and stay-at-home orders, as well as by increased payments as a result of government stimulus programs. Demand remained low in both the U.S. and Canada through the third quarter of 2020 as compared to historical levels. However, for the three months ended September 30, 2020, Single-Pay revenues increased sequentially $2.4 million, or 10.3%, on related loan growth of $5.1 million, or 14.2%, as quarantine and stay-at-home restrictions eased in certain jurisdictions during the third quarter.
For the three months ended September 30, 2020, Open-End revenues increased sequentially $2.0 million, or 3.5%, on related loan growth of $37.1 million, or 13.0%. Open-End loan balances in Canada grew $28.2 million, or 11.9%, from September 30, 2019, with related revenue growth of $1.8 million, or 6.7%. Open-End growth in Canada was partially offset by a decrease in CanadaU.S. Open-End loans of 35.7% due to the continued transition to$20.9 million, or 27.0%, with a related revenue decrease of $9.2 million, or 23.2%. Open-End loans. Secured Installment revenues and related receivables were consistent year-over-year. Single-Pay loan balances stabilized in Canada sequentially but year-over-year Single-Pay usageboth countries were also affected by COVID-19 Impacts; namely, our decision to initially tighten credit, continued reduced application volumes and product profitability were impacted negatively by regulatory changes in Ontario effective July 1, 2018, and our strategic transitionlower utilization of qualifying customers to Open-End loans during the third quarter of 2018. Open-End loans in Canada grew $18.1 million, or 8.3%, sequentially (defined within this Form 10-Q as the change from the second quarter of 2019 to the third quarter of 2019, or comparable periods for 2018 sequential metrics). Open-End loans in Canada grew $98.6 million, or 71.1%, from September 30, 2018, resulting in year-over-year revenue growth of $13.8 million, or 108.2%. U.S. Open-End revenue rose 43.7% on related loan growth of 71.2%. approved credit lines.
Ancillary revenues, increased 32.2% versus the same quarter a year ago, primarily due towhich include the sale of insurance products to InstallmentOpen-End and Open-EndInstallment loan customers in Canada.
Canada, decreased $2.2 million, or 13.6%, versus the prior-year period, stemming primarily from lower check cashing fees and additional insurance claims for consumers impacted by COVID-19 during the third quarter of 2020. Sequentially, ancillary
41
| For the Nine Months Ended | ||||||||||||||||||||
| September 30, 2019 | September 30, 2018 | |||||||||||||||||||
| U.S. | Canada | Total | U.S. | Canada | Total | |||||||||||||||
| Unsecured Installment | $ | 390,026 | $ | 5,093 | $ | 395,119 | $ | 366,749 | $ | 11,227 | $ | 377,976 | ||||||||
| Secured Installment | 81,823 | — | 81,823 | 81,195 | — | 81,195 | ||||||||||||||
| Open-End | 104,516 | 69,445 | 173,961 | 76,649 | 18,086 | 94,735 | ||||||||||||||
| Single-Pay | 82,733 | 58,872 | 141,605 | 78,835 | 90,461 | 169,296 | ||||||||||||||
| Ancillary | 14,136 | 32,859 | 46,995 | 14,565 | 19,727 | 34,292 | ||||||||||||||
| Total revenue | $ | 673,234 | $ | 166,269 | $ | 839,503 | $ | 617,993 | $ | 139,501 | $ | 757,494 | ||||||||
The following table summarizes revenue by product, including CSO fees, for the period indicated (in thousands, unaudited):
| For the Nine Months Ended | ||||||||||||||||||||||||||
| September 30, 2020 | September 30, 2019 | |||||||||||||||||||||||||
| U.S. | Canada | Total | U.S. | Canada | Total | |||||||||||||||||||||
| Unsecured Installment | $ | 256,258 | $ | 4,070 | $ | 260,328 | $ | 390,026 | $ | 5,093 | $ | 395,119 | ||||||||||||||
| Secured Installment | 62,379 | — | 62,379 | 81,823 | — | 81,823 | ||||||||||||||||||||
| Open-End | 103,338 | 83,091 | 186,429 | 104,516 | 69,445 | 173,961 | ||||||||||||||||||||
| Single-Pay | 58,521 | 34,452 | 92,973 | 82,733 | 58,872 | 141,605 | ||||||||||||||||||||
| Ancillary | 11,440 | 31,769 | 43,209 | 14,136 | 32,859 | 46,995 | ||||||||||||||||||||
| Total revenue | $ | 491,936 | $ | 153,382 | $ | 645,318 | $ | 673,234 | $ | 166,269 | $ | 839,503 | ||||||||||||||
Year-over-year comparisons for the nine-month periods were also influenced by COVID-19 Impacts. During the nine months ended September 30, 2019,2020, total revenue grew $82.0declined $194.2 million, or 10.8%23.1%, to $839.5$645.3 million, compared to the prior-year period, predominantly driven by growth in Open-End loans in both countries.period. Geographically, total revenue in the U.S. and Canada grew 8.9%revenues declined 26.9% and 19.2%7.8%, respectively.
From a product perspective, Unsecured Installment and Secured Installment revenues rose 6.3%decreased 34.1% and 23.8%, respectively, because of COVID-19 Impacts, regulatory changes in California that were effective January 1, 2020 and regulatory changes for CSOs in Ohio that were effective May 1, 2019.
Single-Pay revenue declined $48.6 million, or 34.3%, for the nine months ended September 30, 2020, compared to the prior-year period, primarily due to COVID-19 impacts on loan volume and balances, which declined $36.8 million, or 47.1%, year over year. Single-Pay loan volumes were particularly affected by the broad reduction in storefront usage by customers during the period of self-quarantine and stay-at-home orders, as well as government stimulus programs.
Open-End revenues grew $12.5 million, or 7.2%, compared to the prior-year period, primarily due to $28.2 million, or 11.9%, of Open-End loan growth in Canada, partially offset by a $20.9 million, or 27.0%, decline in the U.S., offset by a decrease in Canada of 54.6% due to the continued transition to Additionally, Open-End loans. Secured Installment revenues and related receivables remained consistent year-over-year. Canadian Single-Pay usage and product profitability were impacted negatively year-over-year by regulatory changes in Ontario effective July 1, 2018, and the strategic transition of qualifying customers to Open-End loans. Open-End revenues rose 83.6% on related loan growthbalances in both countries. countries were affected by COVID-19 Impacts.
Ancillary revenues, increased 37.0% versus the same quarter a year ago, primarily due towhich included the sale of insurance products to InstallmentOpen-End and Open-EndInstallment loan customers in Canada.Canada, decreased $3.8 million, or 8.1%, versus the prior-year period, primarily stemming from lower check cashing fees during the nine months ended September 30, 2020.
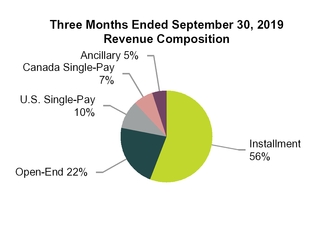
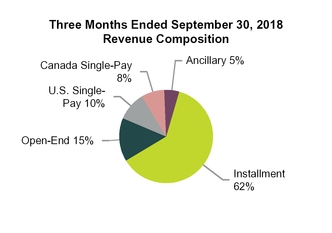
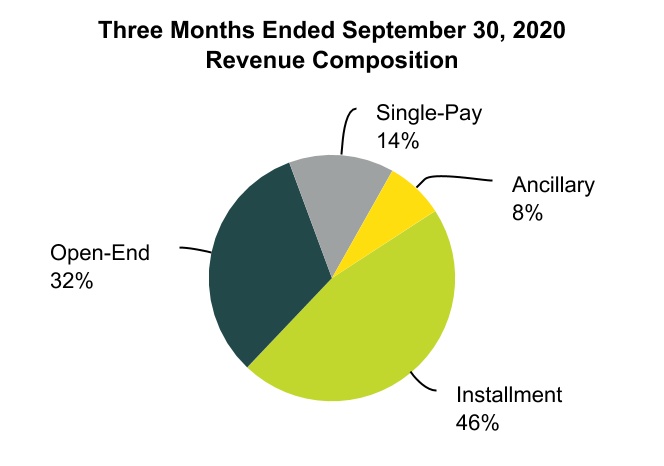
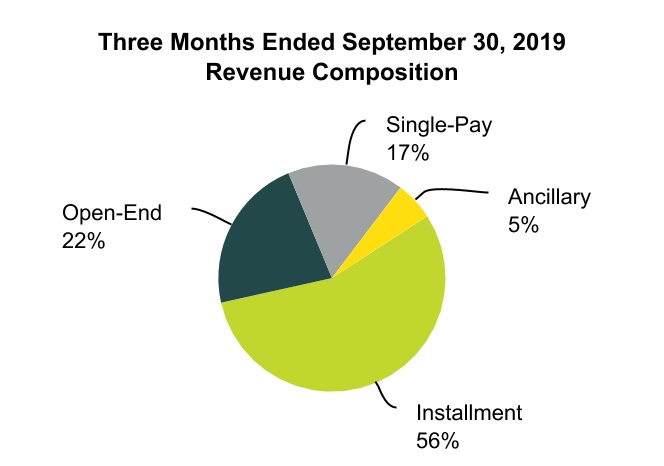
42
Online revenue as a percentage of consolidated revenue increased during the three and nine months ended September 30, 2020, from COVID-19 Impacts and the resulting transition of customers using our online channel which provides customers a safe and contactless option. For the three months ended September 30, 20192020 and 2018,2019, revenue generated through our online channel was 46%49% and 44%46%, respectively, of consolidated revenue. For the three months ended September 30, 2020, online transactions accounted for 57% of our total loan transactions, compared to 46% for the prior-year period.
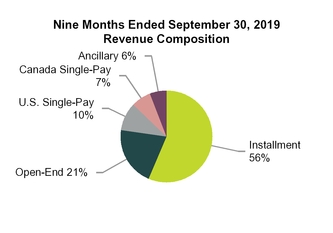
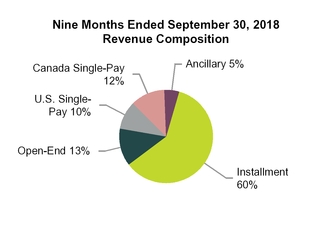
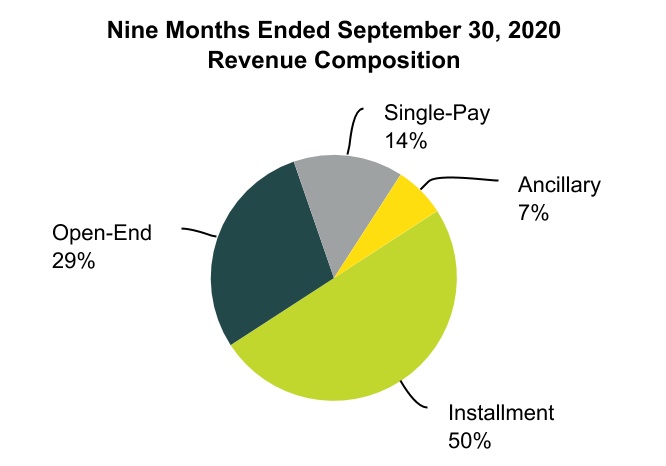
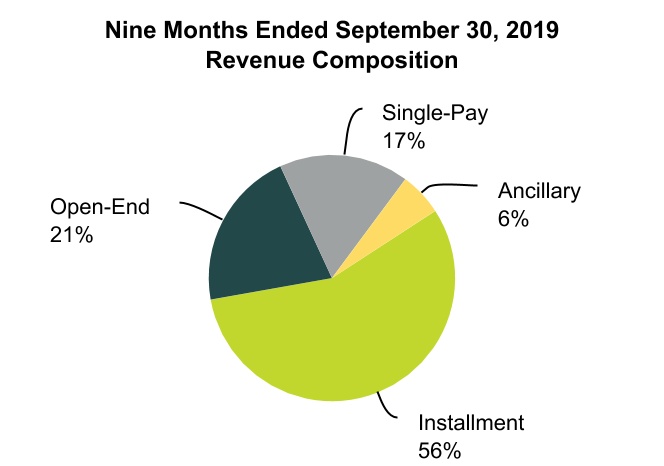
For the nine months ended September 30, 20192020 and 2018,2019, revenue generated through our online channel was 45%48% and 42%45%, respectively, of consolidated revenue. For the nine months ended September 30, 2020, online transactions accounted for 53% of our total loan transactions, compared to 45% for the prior-year period.
Gross Combined Loans Receivable
The following table reconciles Company Owned gross loans receivable, a GAAP-basis balance sheet measure, to Gross combined loans receivable, a non-GAAP measure(1). Gross combined loans receivables includes loans originated by third-party lenders through CSO programs, which are not included in our unaudited Condensed Consolidated Financial Statements but from which we earn revenue by providing a guarantee to the unaffiliated lender (in millions, unaudited):
| As of | |||||||||||||||||||||||||||||||||||||||||||||||||||||||||||
| September 30, 2020 | June 30, 2020 | March 31, 2020 | December 31, 2019 | September 30, 2019 | |||||||||||||||||||||||||||||||||||||||||||||||||||||||
| Company Owned gross loans receivable | $ | 497.4 | $ | 456.5 | $ | 564.4 | $ | 665.8 | $ | 657.6 | |||||||||||||||||||||||||||||||||||||||||||||||||
| Gross loans receivable Guaranteed by the Company | 39.8 | 34.1 | 55.9 | 76.7 | 73.1 | ||||||||||||||||||||||||||||||||||||||||||||||||||||||
Gross combined loans receivable (1) | $ | 537.2 | $ | 490.6 | $ | 620.3 | $ | 742.5 | $ | 730.7 | |||||||||||||||||||||||||||||||||||||||||||||||||
| (1) See "Non-GAAP Financial Measures" below for definition and additional information. | |||||||||||||||||||||||||||||||||||||||||||||||||||||||||||
43
Gross combined loans receivable by product is presented below:
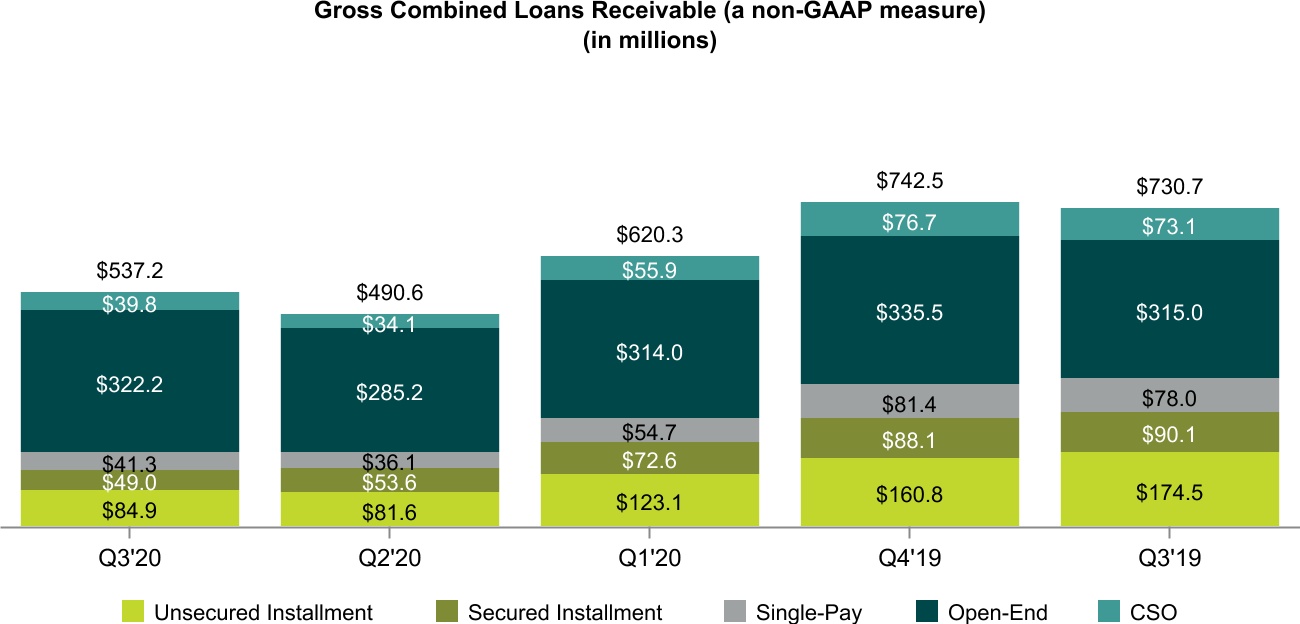
Gross combined loans receivable decreased $193.5 million, or 26.5%, to $537.2 million as of September 30, 2020, from $730.7 million as of September 30, 2019. The decrease was driven by COVID-19 Impacts and, for Installment loans, the impact of regulatory changes in California that were effective January 1, 2020. Sequentially, gross combined loans receivable increased $46.6 million, or 9.5%, as demand increased during the third quarter.
Gross combined loans receivable performance by product is explained further in the following sections.
44
Loan Volume and Portfolio Performance Analysis
Unsecured Installment Loans - Company Owned
Company Owned Unsecured Installment revenue for the three months ended September 30, 2020 and related gross loans receivable decreased $34.6 million, or 52.6%, and $89.5 million, or 51.3%, respectively, from the prior-year period, due to COVID-19 Impacts and regulatory changes in California that were effective January 1, 2020, partially offset by growth in Verge Credit loans.
Unsecured Installment revenue and gross combinedloans in California were $27.4 million, or 32.2%, of total Company Owned Unsecured Installment loans as of September 30, 2020, a decrease of $59.0 million, or 68.3%, from September 30, 2019. Sequentially, California Unsecured Installment loans decreased $9.6 million. Excluding California, Company Owned Unsecured Installment loans receivable decreased $30.5 million, or 34.6%, from the comparable prior-year quarter due toperiod, while revenues for the continued mix shift to Open-End loans in Canada and portfolio optimization in California to manage upcoming January 1,three months ended September 30, 2020 regulatory changes. Unsecured Installment gross combined loans receivable decreased $15.7$18.5 million, or 6.0%46.2%, compared to the prior-year period, due to COVID-19 Impacts. Sequentially, excluding California and Verge Credit loans, Company Owned Unsecured Installment loans receivable increased $5.4 million, or 12.1%, from June 30, 2020, while revenue decreased $0.2 million, or 0.8%. The receivable increase was due to normal seasonality and reduced quarantine and stay-at-home orders during the third quarter.
The Unsecured Installment quarterly NCO rate improved approximately 560 bps year over year, as a result of COVID-19 Impacts. Sequentially, the quarterly NCO rate decreased from 22.6% in the second quarter to 11.5% in the third quarter of 2020.
The Unsecured Installment allowance coverage increased year over year, from 21.9% as of September 30, 2018. 2019, to 22.2% as of September 30, 2020, as a result of certain loan modifications under the Customer Care Program, which were classified as TDRs. Loans classified as TDRs are included within Company Owned gross loans receivable. Amounts waived on these loans are immediately charged-off and the impairment for these loans is included within the Allowance for loan losses. Determination of the impairment for TDRs includes an estimate of their lifetime losses, which is greater than estimated incurred losses at a point in time. TDRs increased our total Unsecured Installment allowance coverage by nearly 160 bps from the allowance coverage that would have otherwise been required. Sequentially, the allowance coverage decreased from 22.6% to 22.2%, as a result of improvement in past-due balances from 21.8% to 21.1%, as well as the aforementioned decline in the NCO rate.
Unsecured Installment Loans - Guaranteed by the Company
Unsecured Installment loans Guaranteed by the Company declined $5.1$31.9 million year-over-year due to
NCO rates for Unsecured Installment loans Guaranteed by the Company improved nearly 60 bps comparedyear over year from 52.9% to 38.6%. Sequentially, the same quarter a year ago.NCO rate increased from 35.4% to 38.6%, as demand and new customer volume improved. The CSO liability for losses remained consistent sequentiallyas a percentage of loans Guaranteed by the Company increased year over year from 14.5%14.4% to 14.4%15.8% as of September 30, 2020. Sequentially, past-due balances as a percent of gross loans receivable increased from 12.1% to 15.3% and the CSO liability for losses increased from 15.5% to 15.8% during the third quarter of 2019.
three months ended September 30, 2020.
45
| 2019 | 2018 | 2020 | 2019 | |||||||||||||||||||||||||||||||||||||||||||||||||||||||||||||||||||||
| (dollars in thousands, unaudited) | Third Quarter | Second Quarter | First Quarter | Fourth Quarter | Third Quarter | (dollars in thousands, unaudited) | Third Quarter | Second Quarter | First Quarter | Fourth Quarter | Third Quarter | |||||||||||||||||||||||||||||||||||||||||||||||||||||||||||||
| Unsecured Installment loans: | Unsecured Installment loans: | |||||||||||||||||||||||||||||||||||||||||||||||||||||||||||||||||||||||
| Revenue - Company Owned | $ | 65,809 | $ | 59,814 | $ | 65,542 | $ | 69,748 | $ | 64,146 | Revenue - Company Owned | $ | 31,168 | $ | 33,405 | $ | 55,569 | $ | 63,428 | $ | 65,809 | |||||||||||||||||||||||||||||||||||||||||||||||||||
| Provision for losses - Company Owned | 31,891 | 33,514 | 33,845 | 39,565 | 32,946 | Provision for losses - Company Owned | 9,647 | 12,932 | 26,182 | 33,183 | 31,891 | |||||||||||||||||||||||||||||||||||||||||||||||||||||||||||||
| Net revenue - Company Owned | $ | 33,918 | $ | 26,300 | $ | 31,697 | $ | 30,183 | $ | 31,200 | Net revenue - Company Owned | $ | 21,521 | $ | 20,473 | $ | 29,387 | $ | 30,245 | $ | 33,918 | |||||||||||||||||||||||||||||||||||||||||||||||||||
| Net charge-offs - Company Owned | $ | 28,973 | $ | 31,970 | $ | 37,919 | $ | 37,951 | $ | 27,308 | Net charge-offs - Company Owned | $ | 9,595 | $ | 23,110 | $ | 32,775 | $ | 35,729 | $ | 28,973 | |||||||||||||||||||||||||||||||||||||||||||||||||||
| Revenue - Guaranteed by the Company | $ | 71,424 | $ | 62,298 | $ | 70,236 | $ | 75,559 | $ | 73,514 | $ | 36,240 | $ | 37,024 | $ | 66,840 | $ | 72,183 | $ | 71,424 | ||||||||||||||||||||||||||||||||||||||||||||||||||||
| Provision for losses - Guaranteed by the Company | 36,664 | 28,336 | 27,422 | 37,352 | 39,552 | 14,884 | 11,418 | 26,338 | 34,858 | 36,664 | ||||||||||||||||||||||||||||||||||||||||||||||||||||||||||||||
| Net revenue - Guaranteed by the Company | $ | 34,760 | $ | 33,962 | $ | 42,814 | $ | 38,207 | $ | 33,962 | $ | 21,356 | $ | 25,606 | $ | 40,502 | $ | 37,325 | $ | 34,760 | ||||||||||||||||||||||||||||||||||||||||||||||||||||
| Net charge-offs - Guaranteed by the Company | $ | 35,916 | $ | 27,486 | $ | 30,421 | $ | 38,522 | $ | 37,995 | $ | 13,882 | $ | 15,432 | $ | 27,749 | $ | 34,486 | $ | 35,916 | ||||||||||||||||||||||||||||||||||||||||||||||||||||
| Unsecured Installment gross combined loans receivable: | Unsecured Installment gross combined loans receivable: | |||||||||||||||||||||||||||||||||||||||||||||||||||||||||||||||||||||||
| Company Owned | $ | 174,489 | $ | 164,722 | $ | 161,716 | $ | 190,403 | $ | 185,130 | Company Owned | $ | 84,959 | $ | 81,601 | $ | 123,118 | $ | 160,782 | $ | 174,489 | |||||||||||||||||||||||||||||||||||||||||||||||||||
Guaranteed by the Company | 70,704 | 65,055 | 59,740 | 77,451 | 75,807 | 38,822 | 33,082 | 54,097 | 74,317 | 70,704 | ||||||||||||||||||||||||||||||||||||||||||||||||||||||||||||||
Unsecured Installment gross combined loans receivable (1)(2) | $ | 245,193 | $ | 229,777 | $ | 221,456 | $ | 267,854 | $ | 260,937 | Unsecured Installment gross combined loans receivable (1)(2) | $ | 123,781 | $ | 114,683 | $ | 177,215 | $ | 235,099 | $ | 245,193 | |||||||||||||||||||||||||||||||||||||||||||||||||||
| Average gross loans receivable: | Average gross loans receivable: | |||||||||||||||||||||||||||||||||||||||||||||||||||||||||||||||||||||||
Average Unsecured Installment gross loans receivable - Company Owned (3) | $ | 169,606 | $ | 163,219 | $ | 176,060 | $ | 187,767 | $ | 172,708 | Average Unsecured Installment gross loans receivable - Company Owned (3) | $ | 83,280 | $ | 102,360 | $ | 141,950 | $ | 167,636 | $ | 169,606 | |||||||||||||||||||||||||||||||||||||||||||||||||||
Average Unsecured Installment gross loans receivable - Guaranteed by the Company (3) | $ | 67,880 | $ | 62,398 | $ | 68,596 | $ | 76,629 | $ | 71,079 | ||||||||||||||||||||||||||||||||||||||||||||||||||||||||||||||
Average Unsecured Installment gross loans receivable - Guaranteed by the Company (1)(3) | Average Unsecured Installment gross loans receivable - Guaranteed by the Company (1)(3) | $ | 35,952 | $ | 43,590 | $ | 64,207 | $ | 72,511 | $ | 67,880 | |||||||||||||||||||||||||||||||||||||||||||||||||||||||||||||
| Allowance for loan losses and CSO liability for losses: | Allowance for loan losses and CSO liability for losses: | |||||||||||||||||||||||||||||||||||||||||||||||||||||||||||||||||||||||
Unsecured Installment Allowance for loan losses | $ | 38,127 | $ | 35,223 | $ | 33,666 | $ | 37,716 | $ | 36,160 | $ | 18,859 | $ | 18,451 | $ | 28,965 | $ | 35,587 | $ | 38,127 | ||||||||||||||||||||||||||||||||||||||||||||||||||||
Unsecured Installment CSO liability for losses | $ | 10,181 | $ | 9,433 | $ | 8,584 | $ | 11,582 | $ | 12,750 | $ | 6,130 | $ | 5,128 | $ | 9,142 | $ | 10,553 | $ | 10,181 | ||||||||||||||||||||||||||||||||||||||||||||||||||||
| Unsecured Installment Allowance for loan losses as a percentage of Unsecured Installment gross loans receivable | 21.9 | % | 21.4 | % | 20.8 | % | 19.8 | % | 19.5 | % | Unsecured Installment Allowance for loan losses as a percentage of Unsecured Installment gross loans receivable | 22.2 | % | 22.6 | % | 23.5 | % | 22.1 | % | 21.9 | % | |||||||||||||||||||||||||||||||||||||||||||||||||||
| Unsecured Installment CSO liability for losses as a percentage of Unsecured Installment gross loans guaranteed by the Company | 14.4 | % | 14.5 | % | 14.4 | % | 15.0 | % | 16.8 | % | ||||||||||||||||||||||||||||||||||||||||||||||||||||||||||||||
Unsecured Installment CSO liability for losses as a percentage of Unsecured Installment gross loans Guaranteed by the Company (1) | Unsecured Installment CSO liability for losses as a percentage of Unsecured Installment gross loans Guaranteed by the Company (1) | 15.8 | % | 15.5 | % | 16.9 | % | 14.2 | % | 14.4 | % | |||||||||||||||||||||||||||||||||||||||||||||||||||||||||||||
| Unsecured Installment past-due balances: | Unsecured Installment past-due balances: | |||||||||||||||||||||||||||||||||||||||||||||||||||||||||||||||||||||||
| Unsecured Installment gross loans receivable | $ | 46,537 | $ | 38,037 | $ | 40,801 | $ | 49,087 | $ | 49,637 | ||||||||||||||||||||||||||||||||||||||||||||||||||||||||||||||
| Unsecured Installment gross loans guaranteed by the Company | $ | 11,842 | $ | 10,087 | $ | 7,967 | $ | 11,708 | $ | 12,120 | ||||||||||||||||||||||||||||||||||||||||||||||||||||||||||||||
Past-due Unsecured Installment gross loans receivable -- percentage (2) | 26.7 | % | 23.1 | % | 25.2 | % | 25.8 | % | 26.8 | % | ||||||||||||||||||||||||||||||||||||||||||||||||||||||||||||||
Past-due Unsecured Installment gross loans guaranteed by the Company -- percentage (2) | 16.7 | % | 15.5 | % | 13.3 | % | 15.1 | % | 16.0 | % | ||||||||||||||||||||||||||||||||||||||||||||||||||||||||||||||
| Unsecured Installment gross loans receivable - Company Owned | Unsecured Installment gross loans receivable - Company Owned | $ | 17,942 | $ | 17,766 | $ | 34,966 | $ | 43,100 | $ | 46,537 | |||||||||||||||||||||||||||||||||||||||||||||||||||||||||||||
Unsecured Installment gross loans - Guaranteed by the Company (1) | Unsecured Installment gross loans - Guaranteed by the Company (1) | $ | 5,953 | $ | 4,019 | $ | 9,232 | $ | 12,477 | $ | 11,842 | |||||||||||||||||||||||||||||||||||||||||||||||||||||||||||||
| Past-due Unsecured Installment Company Owned gross loans receivable -- percentage | Past-due Unsecured Installment Company Owned gross loans receivable -- percentage | 21.1 | % | 21.8 | % | 28.4 | % | 26.8 | % | 26.7 | % | |||||||||||||||||||||||||||||||||||||||||||||||||||||||||||||
Past-due Unsecured Installment gross loans Guaranteed by the Company -- percentage (1) | Past-due Unsecured Installment gross loans Guaranteed by the Company -- percentage (1) | 15.3 | % | 12.1 | % | 17.1 | % | 16.8 | % | 16.7 | % | |||||||||||||||||||||||||||||||||||||||||||||||||||||||||||||
| Unsecured Installment other information: | Unsecured Installment other information: | |||||||||||||||||||||||||||||||||||||||||||||||||||||||||||||||||||||||
| Originations - Company Owned | $ | 107,275 | $ | 102,792 | $ | 78,515 | $ | 114,182 | $ | 121,415 | Originations - Company Owned | $ | 49,833 | $ | 24,444 | $ | 55,941 | $ | 87,080 | $ | 107,275 | |||||||||||||||||||||||||||||||||||||||||||||||||||
Originations - Guaranteed by the Company (1) | $ | 89,644 | $ | 80,445 | $ | 68,899 | $ | 89,319 | $ | 91,828 | Originations - Guaranteed by the Company (1) | $ | 51,433 | $ | 33,700 | $ | 64,836 | $ | 91,004 | $ | 89,644 | |||||||||||||||||||||||||||||||||||||||||||||||||||
| Unsecured Installment ratios: | Unsecured Installment ratios: | |||||||||||||||||||||||||||||||||||||||||||||||||||||||||||||||||||||||
| Provision as a percentage of gross loans receivable - Company Owned | 18.3 | % | 20.3 | % | 20.9 | % | 20.8 | % | 17.8 | % | ||||||||||||||||||||||||||||||||||||||||||||||||||||||||||||||
| Provision as a percentage of gross loans receivable - Guaranteed by the Company | 51.9 | % | 43.6 | % | 45.9 | % | 48.2 | % | 52.2 | % | ||||||||||||||||||||||||||||||||||||||||||||||||||||||||||||||
(1) Includes loans originated by third-party lenders through CSO programs, which are not included in the Condensed Consolidated Financial Statements. | ||||||||||||||||||||||||||||||||||||||||||||||||||||||||||||||||||||||||
NCO rate - Company Owned (5) | NCO rate - Company Owned (5) | 11.5 | % | 22.6 | % | 23.1 | % | 21.3 | % | 17.1 | % | |||||||||||||||||||||||||||||||||||||||||||||||||||||||||||||
NCO rate - Guaranteed by the Company (1)(5) | NCO rate - Guaranteed by the Company (1)(5) | 38.6 | % | 35.4 | % | 43.2 | % | 47.6 | % | 52.9 | % | |||||||||||||||||||||||||||||||||||||||||||||||||||||||||||||
| (1) Includes loans originated by third-party lenders through CSO programs, which are not included in our unaudited Condensed Consolidated Financial Statements. | (1) Includes loans originated by third-party lenders through CSO programs, which are not included in our unaudited Condensed Consolidated Financial Statements. | |||||||||||||||||||||||||||||||||||||||||||||||||||||||||||||||||||||||
| (2) Non-GAAP measure. For a description of each non-GAAP metric, see "Non-GAAP Financial Measures." | (2) Non-GAAP measure. For a description of each non-GAAP metric, see "Non-GAAP Financial Measures." | (2) Non-GAAP measure. For a description of each non-GAAP metric, see "Non-GAAP Financial Measures." | ||||||||||||||||||||||||||||||||||||||||||||||||||||||||||||||||||||||
| (3) Average gross loans receivable calculated as average of beginning of quarter and end of quarter gross loans receivable. | ||||||||||||||||||||||||||||||||||||||||||||||||||||||||||||||||||||||||
| (4) Allowance for loan losses is reported as a contra-asset reducing gross loans receivable while the CSO liability for losses is reported as a liability on the Condensed Consolidated Balance Sheets. | ||||||||||||||||||||||||||||||||||||||||||||||||||||||||||||||||||||||||
| (3) We calculate Average gross loans receivable, which we utilize to calculate product yield and NCO rates, as average of beginning of quarter and end of quarter gross loans receivable. | (3) We calculate Average gross loans receivable, which we utilize to calculate product yield and NCO rates, as average of beginning of quarter and end of quarter gross loans receivable. | |||||||||||||||||||||||||||||||||||||||||||||||||||||||||||||||||||||||
| (4) We report Allowance for loan losses as a contra-asset reducing gross loans receivable and the CSO liability for losses as a liability on our unaudited Condensed Consolidated Balance Sheets. | (4) We report Allowance for loan losses as a contra-asset reducing gross loans receivable and the CSO liability for losses as a liability on our unaudited Condensed Consolidated Balance Sheets. | |||||||||||||||||||||||||||||||||||||||||||||||||||||||||||||||||||||||
| (5) We calculate NCO rate as NCOs divided by Average gross loans receivables. | (5) We calculate NCO rate as NCOs divided by Average gross loans receivables. | |||||||||||||||||||||||||||||||||||||||||||||||||||||||||||||||||||||||
46
Secured Installment Loans
Secured Installment revenue and the related gross combined loans receivable balancefor the three months ended September 30, 2020 decreased 41.0% and 46.0%, respectively, compared to the prior-year period. The decreases were due to COVID-19 Impacts and regulatory changes in California that were effective January 1, 2020. California accounted for $16.9 million, or 33.8%, of total Secured Installment gross combined loans receivable as of September 30, 2020, as compared to $41.4 million, or 44.8%, as of September 30, 2019, remained consistent year-over-year.a decrease of $24.5 million year over year. Excluding California, Secured Installment loans receivable decreased $18.0 million, or 35.3%, from the prior-year period, while revenues decreased $6.4 million, or 33.9%, year over year, due to COVID-19 Impacts.
The Secured Installment NCO rate improved 170 bps compared to the prior-year period. Secured Installment Allowance for loan losses and CSO liability for losses as a percentage of Secured Installment gross combined loans receivable decreased year-over-yearincreased to 14.4% as of September 30, 2020 from 12.4%11.3% in the corresponding period in 2019. The increase was primarily attributable to 11.3%the classification of certain loan modifications under the Customer Care Program as TDRs, partially offset by the impact of lower past-due receivables as of September 30, 2020. TDRs increased our total Secured Installment allowance coverage by over 280 bps from the allowance coverage that would otherwise have been required. Sequentially, the Secured Installment Allowance for the third quarter of 2019loan losses and decreased sequentially from 11.5% to 11.3% during the third quarter of 2019, primarilyCSO liability for losses as a resultpercentage of an 80 bps improvement in the NCO rate.Secured Installment gross combined loans receivable was unchanged.
| 2020 | 2019 | ||||||||||||||||||||||||||||||||||||||||||||||||||||||||||
| (dollars in thousands, unaudited) | Third Quarter | Second Quarter | First Quarter | Fourth Quarter | Third Quarter | ||||||||||||||||||||||||||||||||||||||||||||||||||||||
| Secured Installment loans: | |||||||||||||||||||||||||||||||||||||||||||||||||||||||||||
| Revenue | $ | 16,692 | $ | 19,401 | $ | 26,286 | $ | 28,690 | $ | 28,270 | |||||||||||||||||||||||||||||||||||||||||||||||||
| Provision for losses | 3,291 | 7,238 | 9,682 | 11,492 | 8,819 | ||||||||||||||||||||||||||||||||||||||||||||||||||||||
| Net revenue | $ | 13,401 | $ | 12,163 | $ | 16,604 | $ | 17,198 | $ | 19,451 | |||||||||||||||||||||||||||||||||||||||||||||||||
| Net charge-offs | $ | 4,033 | $ | 9,092 | $ | 10,284 | $ | 11,548 | $ | 8,455 | |||||||||||||||||||||||||||||||||||||||||||||||||
| Secured Installment gross combined loan balances: | |||||||||||||||||||||||||||||||||||||||||||||||||||||||||||
Secured Installment gross combined loans receivable (1)(2) | $ | 49,921 | $ | 54,635 | $ | 74,405 | $ | 90,411 | $ | 92,478 | |||||||||||||||||||||||||||||||||||||||||||||||||
| Average Secured Installment gross combined loans receivable (3) | $ | 52,278 | $ | 64,520 | $ | 82,408 | $ | 91,445 | $ | 90,098 | |||||||||||||||||||||||||||||||||||||||||||||||||
Secured Installment Allowance for loan losses and CSO liability for losses (4) | $ | 7,177 | $ | 7,919 | $ | 9,773 | $ | 10,375 | $ | 10,431 | |||||||||||||||||||||||||||||||||||||||||||||||||
Secured Installment Allowance for loan losses and CSO liability for losses as a percentage of Secured Installment gross combined loans receivable (1) | 14.4 | % | 14.5 | % | 13.1 | % | 11.5 | % | 11.3 | % | |||||||||||||||||||||||||||||||||||||||||||||||||
| Secured Installment past-due balances: | |||||||||||||||||||||||||||||||||||||||||||||||||||||||||||
Secured Installment past-due gross combined loans receivable (1)(2) | $ | 7,703 | $ | 9,072 | $ | 15,612 | $ | 17,902 | $ | 17,645 | |||||||||||||||||||||||||||||||||||||||||||||||||
Past-due Secured Installment gross combined loans receivable -- percentage (1) | 15.4 | % | 16.6 | % | 21.0 | % | 19.8 | % | 19.1 | % | |||||||||||||||||||||||||||||||||||||||||||||||||
| Secured Installment other information: | |||||||||||||||||||||||||||||||||||||||||||||||||||||||||||
Originations (2) | $ | 19,216 | $ | 11,242 | $ | 20,990 | $ | 40,961 | $ | 45,990 | |||||||||||||||||||||||||||||||||||||||||||||||||
| Secured Installment ratios: | |||||||||||||||||||||||||||||||||||||||||||||||||||||||||||
NCO Rate (5) | 7.7 | % | 14.1 | % | 12.5 | % | 12.6 | % | 9.4 | % | |||||||||||||||||||||||||||||||||||||||||||||||||
| (1) Non-GAAP measure. For a description of each non-GAAP metric, see "Non-GAAP Financial Measures." | |||||||||||||||||||||||||||||||||||||||||||||||||||||||||||
| (2) Includes loans originated by third-party lenders through CSO programs, which are not included in our unaudited Condensed Consolidated Financial Statements. | |||||||||||||||||||||||||||||||||||||||||||||||||||||||||||
| (3) We calculate Average gross loans receivable, which we utilize to calculate product yield and NCO rates, as beginning of quarter and end of quarter gross loans receivable. | |||||||||||||||||||||||||||||||||||||||||||||||||||||||||||
| (4) We report Allowance for loan losses as a contra-asset reducing gross loans receivable and the CSO liability for losses as a liability on our unaudited Condensed Consolidated Balance Sheets. | |||||||||||||||||||||||||||||||||||||||||||||||||||||||||||
| (5) We calculate NCO rate as NCOs divided by Average gross loans receivables. | |||||||||||||||||||||||||||||||||||||||||||||||||||||||||||
47
| 2019 | 2018 | |||||||||||||||
| (dollars in thousands, unaudited) | Third Quarter | Second Quarter | First Quarter | Fourth Quarter | Third Quarter | |||||||||||
| Secured Installment loans: | ||||||||||||||||
| Revenue | $ | 28,270 | $ | 26,076 | $ | 27,477 | $ | 29,482 | $ | 28,562 | ||||||
| Provision for losses | 8,819 | 7,821 | 7,080 | 12,035 | 10,188 | |||||||||||
| Net revenue | $ | 19,451 | $ | 18,255 | $ | 20,397 | $ | 17,447 | $ | 18,374 | ||||||
| Net charge-offs | $ | 8,455 | $ | 7,630 | $ | 9,822 | $ | 11,132 | $ | 9,285 | ||||||
| Secured Installment gross combined loan balances: | ||||||||||||||||
Secured Installment gross combined loans receivable (1)(2) | $ | 92,478 | $ | 87,718 | $ | 83,087 | $ | 95,922 | $ | 94,194 | ||||||
Average Secured Installment gross combined loans receivable (3) | $ | 90,098 | $ | 85,403 | $ | 89,505 | $ | 95,058 | $ | 90,814 | ||||||
Secured Installment Allowance for loan losses and CSO liability for losses (2) | $ | 10,431 | $ | 10,067 | $ | 9,874 | $ | 12,616 | $ | 11,714 | ||||||
| Secured Installment Allowance for loan losses and CSO liability for losses as a percentage of Secured Installment gross combined loans receivable | 11.3 | % | 11.5 | % | 11.9 | % | 13.2 | % | 12.4 | % | ||||||
| Secured Installment past-due balances: | ||||||||||||||||
| Secured Installment past-due gross loans receivable and gross loans guaranteed by the Company | $ | 17,645 | $ | 14,570 | $ | 13,866 | $ | 17,835 | $ | 17,754 | ||||||
Past-due Secured Installment gross loans receivable and gross loans guaranteed by the Company -- percentage (1) | 19.1 | % | 16.6 | % | 16.7 | % | 18.6 | % | 18.8 | % | ||||||
| Secured Installment other information: | ||||||||||||||||
Originations (4) | $ | 45,990 | $ | 49,051 | $ | 33,490 | $ | 49,217 | $ | 51,742 | ||||||
| Secured Installment ratios: | ||||||||||||||||
| Provision as a percentage of gross combined loans receivable | 9.5 | % | 8.9 | % | 8.5 | % | 12.5 | % | 10.8 | % | ||||||
| (1) Non-GAAP measure. For a description of each non-GAAP metric, see "Non-GAAP Financial Measures." | ||||||||||||||||
| (2) Allowance for loan losses is reported as a contra-asset reducing gross loans receivable while the CSO liability for losses is reported as a liability on the Condensed Consolidated Balance Sheets. | ||||||||||||||||
| (3) Average gross loans receivable calculated as beginning of quarter and end of quarter gross loans receivable. | ||||||||||||||||
| (4) Includes loans originated by third-party lenders through CSO programs, which are not included in the Condensed Consolidated Financial Statements. | ||||||||||||||||
Open-End Loans
Open-End loan balances as of September 30, 20192020 increased by $130.9$7.3 million, whenor 2.3% ($10.2 million, or 3.2%, on a constant-currency basis), compared to September 30, 2018, primarily due to the continued2019, on 11.9% (13.1% on a constant-currency basis) growth in Canada. The Q1 2019Canada, offset by a decline in the U.S. of $20.9 million, or 27.0%. Open-End Loss Recognition Change, discussed further below, impacted comparability as Canada included $19.2 million of past-due Open-End loansloan balances as of September 30, 2019 that would have been charged off under the former policy. Sequentially, Open-End balances2020 increased $37.1 million, or 13.0% ($43.1 million, or 15.1%, on a constant-currency basis), sequentially due to normal seasonality and faster reopening of our markets in Canada grew $18.1than in the U.S. Sequentially, U.S. and Canada Open-End loan receivables increased $3.5 million, ($20.9or 6.6%, and $33.6 million, onor 14.5%, respectively.
The Open-End Allowance for loan losses as a constant currency basis) due to organic growth of the product and the introductionpercentage of Open-End gross loans in British Columbia during the third quarter of 2019. Remaining year-over-year loan growth was driven by the organic growth in seasoned U.S. markets, such as Tennessee and Kansas, and the relatively newer Virginia market. Similarreceivable decreased sequentially from 16.6% to Canada, the Q1 2019 Open-End Loss Recognition Change affected comparability in the U.S., with the inclusion of $26.8 million of past-due Open-End loans16.0% as of September 30, 20192020. The decrease was due to a shift in the geographic mix of receivables from the U.S. to Canada, the sequential decline in past-due balances as a percentage of gross loans receivable from 10.9% to 9.9% and a 460 bps sequential improvement in Open-End NCO rates. Similar to our other products, Open-End allowance coverage was impacted by TDRs under the Customer Care Program and increased our total Open-End allowance coverage by 86 bps from the allowance coverage that would otherwise have been charged off under the former policy.
Q1 2019 Open-End Loss Recognition Change
Effective January 1, 2019, we modified the timeframe inover which we charge-off Open-End loans and made related refinements to our loss provisioning methodology. Prior to January 1, 2019, we deemed Open-End loans uncollectible and charged-off when a customer missed a scheduled payment and the loan was considered past-due. Because of our continuing shift to Open-End loans in Canada and our analysis of payment patterns on early-stage versus late-stage delinquencies, we revised our estimates and now consider Open-End loans uncollectible when the loan has been contractually past-due for 90 consecutive days. Consequently, past-due Open-End loans and related accrued interest now remain in loans receivable for 90 days before being charged off against the allowance for loan losses. All recoveries on charged-off loans are credited to the allowance for loan losses. We evaluate the adequacy of the allowance for loan losses compared to the related gross loans receivable balances that include accrued interest.
Prospectively from January 1, 2019, past-due, unpaid balances plus related accrued interest charge-off on day 91.
This change was treated as a change in accounting estimate for accounting purposes and applied prospectively beginning January 1, 2019.
48
| 2020 | 2019 | ||||||||||||||||||||||||||||||||||||||||||||||||||||
| (dollars in thousands, unaudited) | Third Quarter | Second Quarter | First Quarter | Fourth Quarter | Third Quarter | ||||||||||||||||||||||||||||||||||||||||||||||||
| Open-End loans: | |||||||||||||||||||||||||||||||||||||||||||||||||||||
| Revenue | $ | 58,711 | $ | 56,736 | $ | 70,982 | $ | 71,295 | $ | 66,120 | |||||||||||||||||||||||||||||||||||||||||||
| Provision for losses | 21,655 | 21,341 | 40,991 | 37,816 | 31,220 | ||||||||||||||||||||||||||||||||||||||||||||||||
| Net revenue | $ | 37,056 | $ | 35,395 | $ | 29,991 | $ | 33,479 | $ | 34,900 | |||||||||||||||||||||||||||||||||||||||||||
| Net charge-offs | $ | 18,163 | $ | 31,684 | $ | 37,098 | $ | 37,426 | $ | 28,202 | |||||||||||||||||||||||||||||||||||||||||||
| Open-End gross loan balances: | |||||||||||||||||||||||||||||||||||||||||||||||||||||
| Open-End gross loans receivable | $ | 322,234 | $ | 285,156 | $ | 314,006 | $ | 335,524 | $ | 314,971 | |||||||||||||||||||||||||||||||||||||||||||
Average Open-End gross loans receivable (1) | $ | 303,695 | $ | 299,581 | $ | 324,765 | $ | 325,248 | $ | 299,141 | |||||||||||||||||||||||||||||||||||||||||||
| Open-End allowance for loan losses: | |||||||||||||||||||||||||||||||||||||||||||||||||||||
| Allowance for loan losses | $ | 51,417 | $ | 47,319 | $ | 56,458 | $ | 55,074 | $ | 54,233 | |||||||||||||||||||||||||||||||||||||||||||
| Open-End Allowance for loan losses as a percentage of Open-End gross loans receivable | 16.0 | % | 16.6 | % | 18.0 | % | 16.4 | % | 17.2 | % | |||||||||||||||||||||||||||||||||||||||||||
| Open-End past-due balances: | |||||||||||||||||||||||||||||||||||||||||||||||||||||
| Open-End past-due gross loans receivable | $ | 31,807 | $ | 31,208 | $ | 49,987 | $ | 50,072 | $ | 46,053 | |||||||||||||||||||||||||||||||||||||||||||
| Past-due Open-End gross loans receivable - percentage | 9.9 | % | 10.9 | % | 15.9 | % | 14.9 | % | 14.6 | % | |||||||||||||||||||||||||||||||||||||||||||
| Open-End ratios: | |||||||||||||||||||||||||||||||||||||||||||||||||||||
NCO rate (2) | 6.0 | % | 10.6 | % | 11.4 | % | 11.5 | % | 9.4 | % | |||||||||||||||||||||||||||||||||||||||||||
(1) We calculate Average gross loans receivable, which we utilize to calculate product yield and NCO rates, as average of beginning of quarter and end of quarter gross loans receivable. | |||||||||||||||||||||||||||||||||||||||||||||||||||||
| (2) We calculate NCO rate as NCOs divided by Average gross loans receivables. | |||||||||||||||||||||||||||||||||||||||||||||||||||||
| 2019 | 2018 | |||||||||||||||
| (dollars in thousands, unaudited) | Third Quarter | Second Quarter | First Quarter | Fourth Quarter | Third Quarter | |||||||||||
| Open-End loans: | ||||||||||||||||
| Revenue | $ | 66,120 | $ | 54,972 | $ | 52,869 | $ | 47,228 | $ | 40,290 | ||||||
| Provision for losses | 31,220 | 29,373 | 25,317 | 28,337 | 31,686 | |||||||||||
| Net revenue | $ | 34,900 | $ | 25,599 | $ | 27,552 | $ | 18,891 | $ | 8,604 | ||||||
Net charge-offs (1) | $ | 28,202 | $ | 25,151 | $ | (1,521 | ) | $ | 25,218 | $ | 23,579 | |||||
| Open-End gross loan balances: | ||||||||||||||||
| Open-End gross loans receivable | $ | 314,971 | $ | 283,311 | $ | 240,790 | $ | 207,333 | $ | 184,067 | ||||||
Average Open-End gross loans receivable (1) | $ | 299,141 | $ | 262,051 | $ | 224,062 | $ | 195,700 | $ | 137,550 | ||||||
| Open-End allowance for loan losses: | ||||||||||||||||
| Allowance for loan losses | $ | 54,233 | $ | 51,717 | $ | 46,963 | $ | 19,901 | $ | 18,013 | ||||||
| Open-End Allowance for loan losses as a percentage of Open-End gross loans receivable | 17.2 | % | 18.3 | % | 19.5 | % | 9.6 | % | 9.8 | % | ||||||
| Open-End past-due balances: | ||||||||||||||||
| Open-End past-due gross loans receivable | $ | 46,053 | $ | 35,395 | $ | 32,444 | $ | — | $ | — | ||||||
| Past-due Open-End gross loans receivable - percentage | 14.6 | % | 12.5 | % | 13.5 | % | — | % | — | % | ||||||
(1) Average gross loans receivable calculated as average of beginning of quarter and end of quarter gross loans receivable. | ||||||||||||||||
In addition, the following table illustrates, on a non-GAAP pro forma basis, the 2019 quarterly results as if the Q1 2019 Open-End Loss Recognition Change had been applied to our outstanding Open-End loan portfolio as of December 31, 2018. This table is illustrative of retrospective application to determine the NCOs that would have been incurred in each quarter of 2019 from the December 31, 2018 loan book. The primary purpose of this pro forma illustration is to provide a representative level of NCO rates from applying the Q1 2019 Open-End Loss Recognition Change.
| Pro Forma | 2019 | ||||||||||||||||
| (dollars in thousands, unaudited) | Fourth Quarter | Third Quarter | Second Quarter | First Quarter | |||||||||||||
| Open-End loans: | |||||||||||||||||
| Pro Forma NCOs | $ | 38,748 | $ | 29,762 | $ | 29,648 | $ | 31,788 | |||||||||
| Open-End gross loan balances: | |||||||||||||||||
| Open-End gross loans receivable | $ | 335,524 | $ | 314,971 | $ | 283,311 | $ | 240,790 | |||||||||
Pro Forma Average Open-End gross loans receivable (1) | $ | 325,248 | $ | 299,141 | $ | 262,051 | $ | 245,096 | |||||||||
Pro Forma NCO rate (2) | 11.9 | % | 9.9 | % | 11.3 | % | 13.0 | % | |||||||||
| (1) We calculate Average gross loans receivable, which we utilize to calculate product yield and NCO rates, as average of beginning of quarter and end of quarter gross loans receivable. | |||||||||||||||||
| (2) We calculate NCO rate as NCOs divided by Average gross loans receivables. | |||||||||||||||||
49
| Pro Forma | 2019 | |||||||||
| (dollars in thousands, unaudited) | Third Quarter | Second Quarter | First Quarter | |||||||
| Open-End loans: | ||||||||||
| Revenue | $ | 66,120 | $ | 54,972 | $ | 52,869 | ||||
| Provision for losses | 31,220 | 29,373 | 25,317 | |||||||
| Net revenue | $ | 34,900 | $ | 25,599 | $ | 27,552 | ||||
| Net charge-offs | $ | 29,762 | $ | 29,648 | $ | 31,788 | ||||
| Open-End gross loan balances: | ||||||||||
| Open-End gross loans receivable | $ | 314,971 | $ | 283,311 | $ | 240,790 | ||||
Average Open-End gross loans receivable (1) | $ | 299,141 | $ | 262,051 | $ | 245,096 | ||||
| Net-charge offs as a percentage of average gross loans receivable | 9.9 | % | 11.3 | % | 13.0 | % | ||||
| Open-End allowance for loan losses: | ||||||||||
| Allowance for loan losses | $ | 54,233 | $ | 51,717 | $ | 46,963 | ||||
| Open-End Allowance for loan losses as a percentage of Open-End gross loans receivable | 17.2 | % | 18.3 | % | 19.5 | % | ||||
| Open-End past-due balances: | ||||||||||
| Open-End past-due gross loans receivable | $ | 46,053 | $ | 35,395 | $ | 32,444 | ||||
| Past-due Open-End gross loans receivable - percentage | 14.6 | % | 12.5 | % | 13.5 | % | ||||
(1) Average gross loans receivable calculated as average of beginning of quarter and end of quarter gross loans receivable. | ||||||||||
Single-Pay
Single-Pay revenue duringdeclined $24.2 million, or 49.1%, year over year, while related receivables declined $36.8 million, or 47.1%, for the three months ended September 30, 2019 decreased compared to the three months ended September 30, 2018,2020, primarily due to regulatory changesCOVID-19 Impacts. Single-Pay loan volume was particularly affected by the reduction in Canada (ratestore traffic as customers self-quarantined and product changes in Ontario and British Columbia) that accelerated the shift to Open-End products. U.S.increased repayments from government stimulus programs. Sequentially, Single-Pay receivablesrevenues increased $1.7$2.4 million, or 4.1%10.3%, offset by a decrease in Canada receivableson related loan growth of $1.0$5.1 million, or 2.8%. Canada Single-Pay balances were stable sequentially from14.2%, due to normal seasonality and reduced quarantine and stay-at-home orders during the second quarter of 2019.third quarter. The Single-Pay Allowance for loan losses as a percentage of Single-Pay gross loans receivable increased sequentially from 6.5% to 7.3%, and the NCO rate increased 215 bps year-over-year, as a result of mandated extended payment options for certain Canada Single-Pay loans.remained consistent sequentially.
| 2020 | 2019 | ||||||||||||||||||||||||||||||||||||||||||||||||||||
| (dollars in thousands, unaudited) | Third Quarter | Second Quarter | First Quarter | Fourth Quarter | Third Quarter | ||||||||||||||||||||||||||||||||||||||||||||||||
| Single-pay loans: | |||||||||||||||||||||||||||||||||||||||||||||||||||||
| Revenue | $ | 25,084 | $ | 22,732 | $ | 45,157 | $ | 49,844 | $ | 49,312 | |||||||||||||||||||||||||||||||||||||||||||
| Provision for losses | 4,799 | (2,588) | 9,639 | 12,289 | 14,736 | ||||||||||||||||||||||||||||||||||||||||||||||||
| Net revenue | $ | 20,285 | $ | 25,320 | $ | 35,518 | $ | 37,555 | $ | 34,576 | |||||||||||||||||||||||||||||||||||||||||||
| Net charge-offs | $ | 4,439 | $ | (598) | $ | 10,517 | $ | 12,145 | $ | 13,913 | |||||||||||||||||||||||||||||||||||||||||||
| Single-Pay gross loan balances: | |||||||||||||||||||||||||||||||||||||||||||||||||||||
| Single-Pay gross loans receivable | $ | 41,274 | $ | 36,130 | $ | 54,728 | $ | 81,447 | $ | 78,039 | |||||||||||||||||||||||||||||||||||||||||||
Average Single-Pay gross loans receivable (1) | $ | 38,702 | $ | 45,429 | $ | 68,088 | $ | 78,787 | $ | 77,083 | |||||||||||||||||||||||||||||||||||||||||||
| Single-Pay Allowance for loan losses | $ | 3,197 | $ | 2,802 | $ | 4,693 | $ | 5,869 | $ | 5,662 | |||||||||||||||||||||||||||||||||||||||||||
| Single-Pay Allowance for loan losses as a percentage of Single-Pay gross loans receivable | 7.7 | % | 7.8 | % | 8.6 | % | 7.2 | % | 7.3 | % | |||||||||||||||||||||||||||||||||||||||||||
NCO rate (2) | 11.5 | % | (1.3) | % | 15.4 | % | 15.4 | % | 18.0 | % | |||||||||||||||||||||||||||||||||||||||||||
(1) We calculate Average gross loans receivable, which we utilize to calculate product yield and NCO rates, as average of beginning of quarter and end of quarter gross loans receivable. | |||||||||||||||||||||||||||||||||||||||||||||||||||||
| (2) We calculate NCO rate as NCOs divided by Average gross loans receivables. | |||||||||||||||||||||||||||||||||||||||||||||||||||||
50
| 2019 | 2018 | |||||||||||||||
| (dollars in thousands, unaudited) | Third Quarter | Second Quarter | First Quarter | Fourth Quarter | Third Quarter | |||||||||||
| Single-pay loans: | ||||||||||||||||
| Revenue | $ | 49,312 | $ | 45,528 | $ | 46,761 | $ | 49,696 | $ | 50,614 | ||||||
| Provision for losses | 14,736 | 12,446 | 8,268 | 12,825 | 12,757 | |||||||||||
| Net revenue | $ | 34,576 | $ | 33,082 | $ | 38,493 | $ | 36,871 | $ | 37,857 | ||||||
| Net charge-offs | $ | 13,913 | $ | 11,458 | $ | 8,610 | $ | 11,838 | $ | 12,892 | ||||||
| Single-Pay gross loan balances: | ||||||||||||||||
| Single-Pay gross loans receivable | $ | 78,039 | $ | 76,126 | $ | 69,753 | $ | 80,823 | $ | 77,390 | ||||||
Average Single-Pay gross loans receivable (1) | $ | 77,083 | $ | 72,940 | $ | 75,288 | $ | 79,107 | $ | 81,028 | ||||||
| Single-Pay Allowance for loan losses | $ | 5,662 | $ | 4,941 | $ | 3,897 | $ | 4,189 | $ | 3,293 | ||||||
| Single-Pay Allowance for loan losses as a percentage of Single-Pay gross loans receivable | 7.3 | % | 6.5 | % | 5.6 | % | 5.2 | % | 4.3 | % | ||||||
(1) Average gross loans receivable calculated as average of beginning of quarter and end of quarter gross loans receivable. | ||||||||||||||||
| As of | |||||||||||||||
| September 30, 2019 | June 30, 2019 | March 31, 2019 | December 31, 2018 | September 30, 2018 | |||||||||||
| Company Owned gross loans receivable | $ | 657.6 | $ | 609.6 | $ | 553.2 | $ | 571.5 | $ | 537.8 | |||||
| Gross loans receivable Guaranteed by the Company | 73.1 | 67.3 | 61.9 | 80.4 | 78.8 | ||||||||||
Gross combined loans receivable (1) | $ | 730.7 | $ | 676.9 | $ | 615.1 | $ | 651.9 | $ | 616.6 | |||||
| (1) See "Non-GAAP Financial Measures" below for definition and additional information. | |||||||||||||||
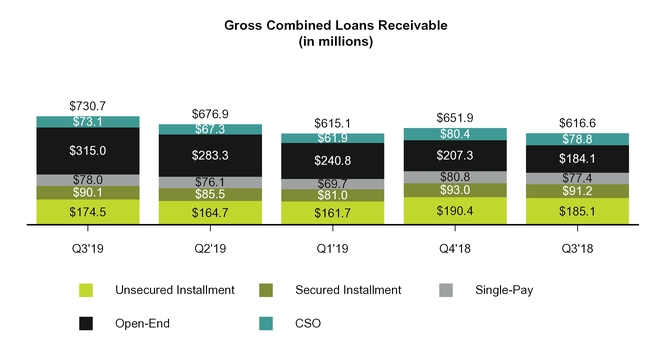
Consolidated Results of Operations - CURO Group Consolidated Operations
Condensed Consolidated Statements of Operations
(in thousands, unaudited)
| Three Months Ended September 30, | Nine Months Ended September 30, | ||||||||||||||||||||||||||||
| 2020 | 2019 | Change $ | Change % | 2020 | 2019 | Change $ | Change % | ||||||||||||||||||||||
| Revenue | $ | 182,003 | $ | 297,264 | $ | (115,261) | (38.8) | % | $ | 645,318 | $ | 839,503 | $ | (194,185) | (23.1) | % | |||||||||||||
| Provision for losses | 54,750 | 123,867 | (69,117) | (55.8) | % | 218,979 | 338,262 | (119,283) | (35.3) | % | |||||||||||||||||||
| Net revenue | 127,253 | 173,397 | (46,144) | (26.6) | % | 426,339 | 501,241 | (74,902) | (14.9) | % | |||||||||||||||||||
| Advertising | 14,425 | 16,424 | (1,999) | (12.2) | % | 32,394 | 36,990 | (4,596) | (12.4) | % | |||||||||||||||||||
| Non-advertising costs of providing services | 49,258 | 60,334 | (11,076) | (18.4) | % | 154,177 | 180,934 | (26,757) | (14.8) | % | |||||||||||||||||||
| Total cost of providing services | 63,683 | 76,758 | (13,075) | (17.0) | % | 186,571 | 217,924 | (31,353) | (14.4) | % | |||||||||||||||||||
| Gross margin | 63,570 | 96,639 | (33,069) | (34.2) | % | 239,768 | 283,317 | (43,549) | (15.4) | % | |||||||||||||||||||
| Operating expense | |||||||||||||||||||||||||||||
| Corporate, district and other expenses | 36,658 | 38,665 | (2,007) | (5.2) | % | 116,246 | 123,043 | (6,797) | (5.5) | % | |||||||||||||||||||
| Interest expense | 18,383 | 17,364 | 1,019 | 5.9 | % | 54,018 | 52,077 | 1,941 | 3.7 | % | |||||||||||||||||||
| (Income) loss from equity method investment | (3,530) | 1,384 | (4,914) | # | (2,653) | 5,132 | (7,785) | # | |||||||||||||||||||||
| Total operating expense | 51,511 | 57,413 | (5,902) | (10.3) | % | 167,611 | 180,252 | (12,641) | (7.0) | % | |||||||||||||||||||
| Income from continuing operations before income taxes | 12,059 | 39,226 | (27,167) | (69.3) | % | 72,157 | 103,065 | (30,908) | (30.0) | % | |||||||||||||||||||
| (Benefit) provision for income taxes | (822) | 11,239 | (12,061) | # | 2,183 | 28,738 | (26,555) | (92.4) | % | ||||||||||||||||||||
| Net income from continuing operations | 12,881 | 27,987 | (15,106) | (54.0) | % | 69,974 | 74,327 | (4,353) | (5.9) | % | |||||||||||||||||||
| Net income (loss) from discontinued operations, net of tax | — | (598) | 598 | # | 1,285 | 6,943 | (5,658) | (81.5) | % | ||||||||||||||||||||
| Net income | $ | 12,881 | $ | 27,389 | $ | (14,508) | (53.0) | % | $ | 71,259 | $ | 81,270 | $ | (10,011) | (12.3) | % | |||||||||||||
| # - Variance greater than 100% or not meaningful | |||||||||||||||||||||||||||||
| Three Months Ended September 30, | Nine Months Ended September 30, | ||||||||||||||||||||||
| 2019 | 2018 | Change $ | Change % | 2019 | 2018 | Change $ | Change % | ||||||||||||||||
| Revenue | $ | 297,264 | $ | 269,482 | $ | 27,782 | 10.3 | % | $ | 839,503 | $ | 757,494 | $ | 82,009 | 10.8 | % | |||||||
| Provision for losses | 123,867 | 127,692 | (3,825 | ) | (3.0 | )% | 338,262 | 290,922 | 47,340 | 16.3 | % | ||||||||||||
| Net revenue | 173,397 | 141,790 | 31,607 | 22.3 | % | 501,241 | 466,572 | 34,669 | 7.4 | % | |||||||||||||
| Advertising costs | 16,424 | 21,349 | (4,925 | ) | (23.1 | )% | 36,990 | 44,347 | (7,357 | ) | (16.6 | )% | |||||||||||
| Non-advertising costs of providing services | 60,334 | 59,847 | 487 | 0.8 | % | 180,934 | 178,437 | 2,497 | 1.4 | % | |||||||||||||
| Total cost of providing services | 76,758 | 81,196 | (4,438 | ) | (5.5 | )% | 217,924 | 222,784 | (4,860 | ) | (2.2 | )% | |||||||||||
| Gross margin | 96,639 | 60,594 | 36,045 | 59.5 | % | 283,317 | 243,788 | 39,529 | 16.2 | % | |||||||||||||
| Operating expense | |||||||||||||||||||||||
| Corporate, district and other expenses | 38,665 | 27,495 | 11,170 | 40.6 | % | 123,043 | 95,904 | 27,139 | 28.3 | % | |||||||||||||
| Interest expense | 17,364 | 23,403 | (6,039 | ) | (25.8 | )% | 52,077 | 66,229 | (14,152 | ) | (21.4 | )% | |||||||||||
| Loss on extinguishment of debt | — | 69,200 | (69,200 | ) | # | — | 80,883 | (80,883 | ) | # | |||||||||||||
| Loss from equity method investment | 1,384 | — | 1,384 | # | 5,132 | — | 5,132 | # | |||||||||||||||
| Total operating expense | 57,413 | 120,098 | (62,685 | ) | (52.2 | )% | 180,252 | 243,016 | (62,764 | ) | (25.8 | )% | |||||||||||
| Net income (loss) from continuing operations before income taxes | 39,226 | (59,504 | ) | 98,730 | # | 103,065 | 772 | 102,293 | # | ||||||||||||||
| Provision (benefit) for income taxes | 11,239 | (16,914 | ) | 28,153 | # | 28,738 | (269 | ) | 29,007 | # | |||||||||||||
| Net income (loss) from continuing operations | 27,987 | (42,590 | ) | 70,577 | # | 74,327 | 1,041 | 73,286 | # | ||||||||||||||
| Net (loss) income from discontinued operations, net of tax | (598 | ) | (4,432 | ) | 3,834 | (86.5 | )% | 6,943 | (8,796 | ) | 15,739 | # | |||||||||||
| Net income (loss) | $ | 27,389 | $ | (47,022 | ) | $ | 74,411 | # | $ | 81,270 | $ | (7,755 | ) | $ | 89,025 | # | |||||||
| # - Variance greater than 100% or not meaningful | |||||||||||||||||||||||
For the Three Months Ended September 30, 2020 and 2019
Revenue and Net Revenue
Revenue decreased $115.3 million, or 38.8%, to $182.0 million for the three months ended September 30, 2019 and 2018
Provision for losses decreased by $69.1 million, or 55.8%, for the three months ended September 30, 2020 compared to the prior-year period. The decrease in provision for loan losses was due to lower sequential quarterly loan growth in 2020 compared to 2019 and significantly improved NCO rates year over year as discussed in more detail in the "Loan Volume and Portfolio Performance Analysis" and "Segment Analysis" sections.
Cost of Providing Services
Non-advertising costs of providing services decreased $11.1 million, or 18.4%, to $49.3 million in the three months ended September 30, 2020, compared to $60.3 million in the three months ended September 30, 2019. Of the $11.1 million decrease, $3.6 million was related to third-party collection costs incurred in 2019 related to Ad Astra, which were included in Non-advertising costs of providing services. Subsequent to our acquisition of Ad Astra, which became our wholly owned subsidiary as of January 3, 2020, its operating costs are included within "Corporate, district and other expenses," consistent with presentation of our other internal collection costs. The remaining decrease year over year in Non-advertising costs of providing services was due to (i) lower underwriting and other variable costs as a result of lower demand, (ii) lower collection costs after stimulus-related pay-downs and (iii) lower discretionary variable compensation.
Advertising costs decreased $2.0 million, or 12.2%, year over year because of COVID-19 Impacts.
51
Corporate, District and Other Expenses
Corporate, district and other expenses were $36.7 million for the three months ended September 30, 2018. Revenue for2020, a decrease of $2.0 million, or 5.2%, compared to the three months ended September 30, 2019 included interest earned on past-due Open-End loan balances of approximately $15 million from the Q1 2019 Open-End Loss Recognition Change. U.S. revenue increased 6.2%, driven by volume growth. Canadian revenue increased 30.3% (31.6% on a constant currency basis), as volume growth offset yield compression from negative regulatory impacts on Single-Pay loan rates2019. Corporate, district and the significant product mix-shift to Open-End loans.
Excluding Ad Astra costs, share-based compensation expense and other costs described above, comparable corporate, district and other expenses decreased $4.6 million year over year, primarily due to the timing and extent of variable compensation and other cost reductions, such as work-from-home initiatives to manage COVID-19 Impacts.
Equity Method Investment
Refer to the "Katapult Update for the Three and Nine Months Ended September 30, 2020 and 2019" below for details.
Interest Expense
Interest expense for the three months ended September 30, 2018.
Provision for Income Taxes
The effective income tax rate for the three months ended September 30, 20192020 was 28.7%6.8%, compared to 28.4%the effective income tax rate of 28.7% for the three months ended September 30, 2018.2019. The third quarter 2019decrease in the effective income tax rate included unfavorable impactswas the result of an adjustment as a result of changes in IRS guidance to an estimated tax benefit recorded in the first quarter of 2020 from the non-tax deductible loss onCARES Act, which allows NOLs incurred in 2018, 2019, and 2020 to be carried back to each of the five preceding taxable years and to generate a refund of previously paid taxes at a statutory rate of 35%. In the first quarter of 2020, we recorded an income tax benefit of $9.1 million related to the carry-back of NOLs from tax years 2018 and 2019. In the third quarter of 2020, we increased this benefit by $2.1 million after finalizing the calculation of the 2019 taxable loss. In addition, we recognized income from our equity method investment and changes in state income apportionment and a mix shift in taxable income between the U.S. and Canada.Katapult, which was entirely offset by prior accumulated losses. Excluding the impact of the loss on equity methodNOL benefit in the U.S. and our investment thein Katapult, our adjusted effective income tax rate for the three months ended September 30, 20192020 was 27.7%18.1%.
For the Nine Months Ended September 30, 2020 and 2019
Revenue and Net Revenue
Revenue decreased $194.2 million, or 23.1%, to $645.3 million for the nine months ended September 30, 2019 and 2018
Provision for losses decreased by $119.3 million, or 35.3%, for the nine months ended September 30, 2020 compared to the prior-year period. The decrease in provision for loan losses was primarily due to lower loan volume and lower NCOs as a result of COVID-19 Impacts as discussed in more detail in the "Loan Volume and Portfolio Performance Analysis" and "Segment Analysis" sections.
52
Cost of Providing Services
Non-advertising costs of providing services decreased $26.8 million, or 14.8%, to $154.2 million in the nine months ended September 30, 2020, compared to $180.9 million in the nine months ended September 30, 2019. Of the $26.8 million decrease, $11.9 million was related to third-party collection costs incurred in 2019 related to Ad Astra, which were included in Non-advertising costs of providing services prior to the acquisition. Subsequent to our acquisition of Ad Astra, we include its operating costs within "Corporate, district and other expenses," consistent with the presentation of our other internal collection costs. The remaining decrease year over year in Non-advertising costs of providing services was due to (i) lower underwriting and other variable costs as a result of lower demand, (ii) lower collection costs after governmental stimulus-related pay-downs and (iii) lower discretionary variable compensation.
Advertising costs decreased $4.6 million, or 12.4%, year over year because of COVID-19 Impacts.
Corporate, District and Other Expenses
Corporate, district and other expenses were $116.2 million for the nine months ended September 30, 2018. Revenue2020, a decrease of $6.8 million, or 5.5%, compared to the nine months ended September 30, 2019. Corporate, district and other expenses in the nine months ended September 30, 2020 included $7.3 million of collection costs related to Ad Astra, which prior to our acquisition of it in January 2020 were included in Non-advertising costs of providing services. For the nine months ended September 30, 2020, corporate, district and other expenses also included (i) $9.9 million of share-based compensation costs, (ii) $2.2 million of Canadian GST described in our reconciliation to Adjusted Net Income above and (iii) $3.5 million of legal and other costs described in our reconciliation to Adjusted Net Income above. For the nine months ended September 30, 2019, corporate district and other costs included (i) U.K.-related costs of $8.8 million, (ii) $7.6 million of share-based compensation and (iii) $2.6 million of legal and other costs as described in our reconciliation to Adjusted Net Income above. Share-based compensation costs increased primarily as a result of awards granted in the first quarter of 2020.
Excluding Ad Astra costs, share-based compensation expense and other costs described above, comparable corporate, district and other expenses decreased $10.6 million year over year, primarily due to the timing and extent of variable compensation and other cost reductions, including work-from-home initiatives to manage COVID-19 Impacts.
Equity Method Investment
Refer to the "Katapult Update for the Three and Nine Months Ended September 30, 2020 and 2019" below for details.
Interest Expense
Interest expense for the nine months ended September 30, 2019 included interest earned on past-due Open-End loan balances of approximately $35 million from the Q1 2019 Open-End Loss Recognition Change, offset by a higher provision rate and the higher allowance discussed further below. U.S. revenue increased 8.9%, driven by volume growth. Canadian revenue increased 19.2% (23.1% on a constant currency basis), as volume growth more than offset yield compression from negative regulatory impacts on Single-Pay loan rates and the significant product mix-shift to Open-End loans.
Provision for Income Taxes
The effective income tax rate for the nine months ended September 30, 20192020 was 27.9%3.0%, compared to (34.8%)the effective income tax rate of 27.9% for the nine months ended September 30, 2018. Excluding the non-tax-deductible loss from our equity method investment,2019. The decrease in the effective income tax rate was the result of two discrete, one-time developments related to usage of NOLs. First, given the CARES Act impact on treatment of NOLs as described above, we recorded an income tax benefit of $11.3 million related to the carry-back of NOLs from continuing operationstax years 2018 and 2019, which offsets our tax liability for years prior to tax reform and will generate a refund of previously paid taxes at a 35% statutory rate. Second, we recorded a tax benefit of $4.6 million related to the release of a valuation allowance previously recorded against NOLs for certain entities in Canada. In addition, we released a valuation allowance of $1.0 million against the losses from our investment in Katapult. These benefits were partially offset by uncertain tax position reserve adjustments in the U.S. of $1.1 million. Excluding the impact of the CARES Act, the valuation allowance release benefit in Canada, the uncertain tax position reserve adjustment and our investment in Katapult, our adjusted effective income tax rate for the nine months ended September 30, 20192020 was 26.6%24.3%. Excluding non-GAAP adjustments to Net
53
Katapult Update for the Three and Nine Months Ended September 30, 2020 and 2019
We recognize our share of Katapult’s income relatedor loss on a two-month lag using the equity method of accounting, with a corresponding adjustment to the 2017 Tax Actcarrying value of the investment included in "Investments" on the unaudited Condensed Consolidated Balance Sheet. Our investment in Katapult through July 31, 2020 was accounted for using the equity method and, as presented ina result, we recognized 42.5% of Katapult's income or loss through that date. We recorded income of $3.5 million for the reconciliationthird quarter of Net Income to Adjusted Net Income,2020 and $2.7 million for the effective income tax rate from continuing operationsfirst three quarters of 2020, as compared with losses of $1.4 million and $5.1 million for the three and nine months ended September 30, 2019, respectively.
Through the nine months ended September 30, 20182020, Katapult's originations increased by over 160% compared to the same period in 2019.
In September 2020, we acquired additional shares of Katapult from certain existing owners. As a result of these acquisitions, a portion of our Katapult ownership will continue to be recognized under the equity method of accounting and a portion has been reclassified and will be measured at cost less impairment. As of September 30, 2020, our total ownership of Katapult, excluding unexercised stock options, was 24.1%46.6%.
Segment Analysis
We report financial results for two reportable segments: the U.S. and Canada. Following is a summary of results of operations for the segment and period indicated (in thousands, unaudited):
| U.S. Segment Results | Three Months Ended September 30, | Nine Months Ended September 30, | |||||||||||||||||||||||||||
| 2020 | 2019 | Change $ | Change % | 2020 | 2019 | Change $ | Change % | ||||||||||||||||||||||
| Revenue | $ | 132,848 | $ | 237,069 | $ | (104,221) | (44.0) | % | $ | 491,936 | $ | 673,234 | $ | (181,298) | (26.9) | % | |||||||||||||
| Provision for losses | 43,485 | 102,997 | (59,512) | (57.8) | % | 171,056 | 280,529 | (109,473) | (39.0) | % | |||||||||||||||||||
| Net revenue | 89,363 | 134,072 | (44,709) | (33.3) | % | 320,880 | 392,705 | (71,825) | (18.3) | % | |||||||||||||||||||
| Advertising | 13,405 | 14,186 | (781) | (5.5) | % | 29,619 | 31,719 | (2,100) | (6.6) | % | |||||||||||||||||||
| Non-advertising costs of providing services | 32,574 | 42,636 | (10,062) | (23.6) | % | 103,477 | 128,866 | (25,389) | (19.7) | % | |||||||||||||||||||
| Total cost of providing services | 45,979 | 56,822 | (10,843) | (19.1) | % | 133,096 | 160,585 | (27,489) | (17.1) | % | |||||||||||||||||||
| Gross margin | 43,384 | 77,250 | (33,866) | (43.8) | % | 187,784 | 232,120 | (44,336) | (19.1) | % | |||||||||||||||||||
| Corporate, district and other expenses | 31,503 | 32,897 | (1,394) | (4.2) | % | 98,784 | 106,426 | (7,642) | (7.2) | % | |||||||||||||||||||
| Interest expense | 16,107 | 14,877 | 1,230 | 8.3 | % | 47,066 | 44,246 | 2,820 | 6.4 | % | |||||||||||||||||||
| (Income) loss from equity method investment | (3,530) | 1,384 | (4,914) | # | (2,653) | 5,132 | (7,785) | # | |||||||||||||||||||||
| Total operating expense | 44,080 | 49,158 | (5,078) | (10.3) | % | 143,197 | 155,804 | (12,607) | (8.1) | % | |||||||||||||||||||
| Segment operating (loss) income | (696) | 28,092 | (28,788) | # | 44,587 | 76,316 | (31,729) | (41.6) | |||||||||||||||||||||
| Interest expense | 16,107 | 14,877 | 1,230 | 8.3 | % | 47,066 | 44,246 | 2,820 | 6.4 | % | |||||||||||||||||||
| Depreciation and amortization | 3,228 | 3,390 | (162) | (4.8) | % | 9,914 | 10,553 | (639) | (6.1) | % | |||||||||||||||||||
EBITDA(1) | 18,639 | 46,359 | (27,720) | (59.8) | % | 101,567 | 131,115 | (29,548) | (22.5) | ||||||||||||||||||||
| Legal and related costs | 1,415 | 870 | 545 | 3,502 | 2,487 | 1,015 | |||||||||||||||||||||||
| Other adjustments | (105) | 42 | (147) | 59 | (206) | 265 | |||||||||||||||||||||||
| U.K. related costs | — | 348 | (348) | — | 8,844 | (8,844) | |||||||||||||||||||||||
| Share-based compensation | 3,392 | 2,771 | 621 | 9,896 | 7,587 | 2,309 | |||||||||||||||||||||||
| (Income) loss from equity method investment | (3,530) | 1,384 | (4,914) | (2,653) | 5,132 | (7,785) | |||||||||||||||||||||||
Adjusted EBITDA(1) | $ | 19,811 | $ | 51,774 | $ | (31,963) | (61.7) | % | $ | 112,371 | $ | 154,959 | $ | (42,588) | (27.5) | % | |||||||||||||
| (1) These are non-GAAP metrics. For a description and reconciliation of each Non-GAAP metric, see "Supplemental Non-GAAP Financial Information." | |||||||||||||||||||||||||||||
| # - Variance greater than 100% or not meaningful. | |||||||||||||||||||||||||||||
54
| U.S. Segment Results | Three Months Ended September 30, | Nine Months Ended September 30, | |||||||||||||||||||||
| 2019 | 2018 | Change $ | Change % | 2019 | 2018 | Change $ | Change % | ||||||||||||||||
| Revenue | $ | 237,069 | $ | 223,273 | $ | 13,796 | 6.2 | % | $ | 673,234 | $ | 617,992 | $ | 55,242 | 8.9 | % | |||||||
| Provision for losses | 102,997 | 103,256 | (259 | ) | (0.3 | )% | 280,529 | 239,576 | 40,953 | 17.1 | % | ||||||||||||
| Net revenue | 134,072 | 120,017 | 14,055 | 11.7 | % | 392,705 | 378,416 | 14,289 | 3.8 | % | |||||||||||||
| Advertising costs | 14,186 | 17,632 | (3,446 | ) | (19.5 | )% | 31,719 | 35,200 | (3,481 | ) | (9.9 | )% | |||||||||||
| Non-advertising costs of providing services | 42,636 | 42,280 | 356 | 0.8 | % | 128,866 | 127,719 | 1,147 | 0.9 | % | |||||||||||||
| Total cost of providing services | 56,822 | 59,912 | (3,090 | ) | (5.2 | )% | 160,585 | 162,919 | (2,334 | ) | (1.4 | )% | |||||||||||
| Gross margin | 77,250 | 60,105 | 17,145 | 28.5 | % | 232,120 | 215,497 | 16,623 | 7.7 | % | |||||||||||||
| Corporate, district and other expenses | 32,897 | 22,360 | 10,537 | 47.1 | % | 106,426 | 81,113 | 25,313 | 31.2 | % | |||||||||||||
| Interest expense | 14,877 | 22,169 | (7,292 | ) | (32.9 | )% | 44,246 | 64,931 | (20,685 | ) | (31.9 | )% | |||||||||||
| Loss on extinguishment of debt | — | 69,200 | (69,200 | ) | # | — | 80,883 | (80,883 | ) | # | |||||||||||||
| Loss from equity method investment | 1,384 | — | 1,384 | # | 5,132 | — | 5,132 | # | |||||||||||||||
| Total operating expense | 49,158 | 113,729 | (64,571 | ) | (56.8 | )% | 155,804 | 226,927 | (71,123 | ) | (31.3 | )% | |||||||||||
| Segment operating income (loss) | 28,092 | (53,624 | ) | 81,716 | # | 76,316 | (11,430 | ) | 87,746 | # | |||||||||||||
| Interest expense | 14,877 | 22,169 | (7,292 | ) | (32.9 | )% | 44,246 | 64,931 | (20,685 | ) | (31.9 | )% | |||||||||||
| Depreciation and amortization | 3,390 | 3,536 | (146 | ) | (4.1 | )% | 10,553 | 10,322 | 231 | 2.2 | % | ||||||||||||
| EBITDA | 46,359 | (27,919 | ) | 74,278 | # | 131,115 | 63,823 | 67,292 | # | ||||||||||||||
| Loss on extinguishment of debt | — | 69,200 | (69,200 | ) | — | 80,883 | (80,883 | ) | |||||||||||||||
| Restructuring costs | — | — | — | 1,617 | — | 1,617 | |||||||||||||||||
| Legal and related costs | 870 | (1,297 | ) | 2,167 | 870 | (1,297 | ) | 2,167 | |||||||||||||||
| Other adjustments | 42 | (99 | ) | 141 | (206 | ) | (224 | ) | 18 | ||||||||||||||
| U.K. related costs | 348 | — | 348 | 8,844 | — | 8,844 | |||||||||||||||||
| Share-based compensation | 2,771 | 2,089 | 682 | 7,587 | 6,112 | 1,475 | |||||||||||||||||
| Loss from equity method investment | 1,384 | — | 1,384 | 5,132 | — | 5,132 | |||||||||||||||||
| Adjusted EBITDA | $ | 51,774 | $ | 41,974 | $ | 9,800 | 23.3 | % | $ | 154,959 | $ | 149,297 | $ | 5,662 | 3.8 | % | |||||||
| # - Variance greater than 100% or not meaningful. | |||||||||||||||||||||||
U.S. Segment Results - For the Three Months Ended September 30, 2020 and 2019
U.S. revenues decreased by $104.2 million, or 44.0%, to $132.8 million, compared to the prior-year period for the three months ended September 30, 2020, as a result of the declines in combined gross loans receivable discussed above. Excluding the impact of California Installment loan runoff stemming from regulatory changes that were effective January 1, 2020, U.S. revenues decreased $82.9 million, or 41.1%. Sequentially, U.S. revenues decreased $4.5 million, or 3.3%. Excluding California, U.S. revenues decreased $1.1 million, or 1.0%, sequentially.
The provision for losses decreased $59.5 million, or 57.8%, primarily as a result of lower loan volume and lower NCOs, as previously discussed. U.S. NCOs decreased by $55.1 million, or 57.2% year over year and the U.S. NCO rate improved by 540 bps to 17.2% for the three months ended September 30, 2020 from 22.6% in the prior-year period.
Non-advertising costs of providing services for the three months ended September 30, 2020 of $32.6 million, decreased $10.1 million, or 23.6%, compared to $42.6 million for the three months ended September 30, 2019. The decrease was primarily driven by Ad Astra costs of $3.6 million, which prior to its acquisition by us were included in Non-advertising costs of providing services. The remaining decrease year over year in Non-advertising costs of providing services was due to (i) lower underwriting and other variable costs as a result of lower demand, (ii) lower collection costs after governmental stimulus-related pay-downs and (iii) lower discretionary variable compensation.
Advertising costs decreased $0.8 million, or 5.5%, year over year because of COVID-19 Impacts.
Corporate, district and other expenses of $31.5 million for the three months ended September 30, 2020, decreased $1.4 million, or 4.2%, compared to the prior-year period. Corporate, district and other expenses for the three months ended September 30, 2020 included $1.7 million of collection costs related to Ad Astra, which were historically included in Non-advertising costs of providing services. For the three months ended September 30, 2020, corporate, district and other costs included (i) $1.4 million of legal and other costs described in our reconciliation to Adjusted Net Income above and (ii) $3.4 million of share-based compensation costs. For the three months ended September 30, 2019, corporate, district and 2018other expenses included (i) U.K.-related costs of $0.3 million as described in our reconciliation to Adjusted Net Income above, (ii) $0.9 million of legal and related costs, also described in our reconciliation to Adjusted Net Income above and (ii) share-based compensation costs of $2.8 million. Share-based compensation costs increased primarily as a result of awards granted in the first quarter of 2020.
U.S. revenue growth was driven by a $21.0 million, or 5.0%, increase in gross combined loans receivable to $444.0 million at
As described above, we recognize our share of Katapult’s income on a two-month lag and recorded income of $3.5 million for the three months ended September 30, 2020.
U.S. Segment Results - For the Nine Months Ended September 30, 2020 and 2019
U.S. revenues decreased by $181.3 million, or 26.9%, to $491.9 million for the nine months ended September 30, 2020 compared to the prior-year period as a result of decreases in combined gross loans receivable. Excluding the aforementioned impact of California Installment loan balances of approximately $13runoff, U.S. revenues decreased by $130.1 million, from the Q1 2019 Open-End Loss Recognition Change.or 23.0%.
The provision for losses decreased $109.5 million, or 39.0%, for the nine months ended September 30, 2020, compared to the prior-year period, primarily as a result of lower loan volume and lower NCOs. Year-over-year U.S. NCOs decreased $82.4 million, or 28.8%.
Non-advertising costs of providing services for the nine months ended September 30, 2020 of $103.5 million, decreased $25.4 million, or 19.7%, compared to $128.9 million for the nine months ended September 30, 2019. The decrease was consistent year-over-year despiteprimarily driven by Ad Astra costs of $11.9 million, which prior to its acquisition by us were included in Non-advertising costs of providing services. The remaining decrease year over year in Non-advertising costs of providing services was due to (i) lower underwriting and other variable costs as a result of lower demand, (ii) lower collection costs after stimulus-related pay-downs and (iii) lower discretionary variable compensation.
Advertising costs decreased $2.1 million, or 6.6%, year over year because of COVID-19 Impacts.
55
Corporate, district and other expenses were $98.8 million for the increasenine months ended September 30, 2020, a decrease of $7.6 million, or 7.2%, compared to the nine months ended September 30, 2019. Corporate, district and other expenses for the nine months ended September 30, 2020 included $7.3 million of collection costs related to Ad Astra, which were historically included in loan receivables. The year-over-year provision changeNon-advertising costs of providing services. For the nine months ended September 30, 2020, corporate, district and other costs included incremental provision(i) $3.5 million of legal and related costs described in our reconciliation to Adjusted Net Income above and (ii) $9.9 million of share-based compensation costs. For the nine months ended September 30, 2019, corporate, district and other expenses included (i) U.K. related costs of $8.8 million as described in our reconciliation to Adjusted Net Income above, (ii) $2.5 million of legal and related costs also described in our reconciliation to Adjusted Net Income above and (iii) share-based compensation costs of $7.6 million. Share-based compensation costs increased primarily as a result of awards granted in the first quarter of 2020.
Excluding these items, comparable corporate, district and other expenses decreased $9.4 million year over year, primarily due to the timing and extent of variable compensation and certain cost reductions, including work-from-home initiatives, to manage COVID-19 Impacts for the nine months ended September 30, 2020.
As described above, and given the two-month lag, we recorded equity income from our investment in Katapult of $2.7 million for the nine months ended September 30, 2020.
U.S. interest expense for the nine months ended September 30, 2020 increased $2.8 million, or 6.4%, primarily related to the new Non-Recourse U.S. SPV Facility, on which we drew $35.2 million when it closed in April 2020.
| Canada Segment Results | Three Months Ended September 30, | Nine Months Ended September 30, | |||||||||||||||||||||||||||
| 2020 | 2019 | Change $ | Change % | 2020 | 2019 | Change $ | Change % | ||||||||||||||||||||||
| Revenue | $ | 49,155 | $ | 60,195 | $ | (11,040) | (18.3) | % | $ | 153,382 | $ | 166,269 | $ | (12,887) | (7.8) | % | |||||||||||||
| Provision for losses | 11,265 | 20,870 | (9,605) | (46.0) | % | 47,923 | 57,733 | (9,810) | (17.0) | % | |||||||||||||||||||
| Net revenue | 37,890 | 39,325 | (1,435) | (3.6) | % | 105,459 | 108,536 | (3,077) | (2.8) | % | |||||||||||||||||||
| Advertising | 1,020 | 2,238 | (1,218) | (54.4) | % | 2,775 | 5,271 | (2,496) | (47.4) | % | |||||||||||||||||||
| Non-advertising costs of providing services | 16,684 | 17,698 | (1,014) | (5.7) | % | 50,700 | 52,068 | (1,368) | (2.6) | % | |||||||||||||||||||
| Total cost of providing services | 17,704 | 19,936 | (2,232) | (11.2) | % | 53,475 | 57,339 | (3,864) | (6.7) | % | |||||||||||||||||||
| Gross margin | 20,186 | 19,389 | 797 | 4.1 | % | 51,984 | 51,197 | 787 | 1.5 | % | |||||||||||||||||||
| Corporate, district and other expenses | 5,155 | 5,768 | (613) | (10.6) | % | 17,462 | 16,617 | 845 | 5.1 | % | |||||||||||||||||||
| Interest expense | 2,276 | 2,487 | (211) | (8.5) | % | 6,952 | 7,831 | (879) | (11.2) | % | |||||||||||||||||||
| Total operating expense | 7,431 | 8,255 | (824) | (10.0) | % | 24,414 | 24,448 | (34) | (0.1) | % | |||||||||||||||||||
| Segment operating income | 12,755 | 11,134 | 1,621 | 14.6 | % | 27,570 | 26,749 | 821 | 3.1 | % | |||||||||||||||||||
| Interest expense | 2,276 | 2,487 | (211) | (8.5) | % | 6,952 | 7,831 | (879) | (11.2) | % | |||||||||||||||||||
| Depreciation and amortization | 1,130 | 1,219 | (89) | (7.3) | % | 3,398 | 3,627 | (229) | (6.3) | % | |||||||||||||||||||
EBITDA(1) | 16,161 | 14,840 | 1,321 | 8.9 | % | 37,920 | 38,207 | (287) | (0.8) | % | |||||||||||||||||||
| Legal and related costs | — | — | — | — | 135 | (135) | |||||||||||||||||||||||
| Canada GST adjustment | — | — | — | 2,160 | — | 2,160 | |||||||||||||||||||||||
| Other adjustments | 143 | 441 | (298) | 580 | 297 | 283 | |||||||||||||||||||||||
Adjusted EBITDA(1) | $ | 16,304 | $ | 15,281 | $ | 1,023 | 6.7 | % | $ | 40,660 | $ | 38,639 | $ | 2,021 | 5.2 | % | |||||||||||||
| (1) These are non-GAAP metrics. For a description and reconciliation of each Non-GAAP metric, see "Supplemental Non-GAAP Financial Information." | |||||||||||||||||||||||||||||
56
Canada Segment Results - For the Three Months Ended September 30, 2020 and 2019
Canada revenue decreased $11.0 million, or 18.3% ($10.6 million, or 17.6%, on a constant-currency basis), to $49.2 million for the three months ended September 30, 2020, from $60.2 million in the Q1 2019 Open-End Loss Recognition Change, consistent with the incremental revenue impact. Excluding the impactprior-year period, as a result of the Q1 2019 Open-End Loss Recognition Change, provision expense declined year-over-year due to lower sequential growthdeclines in gross loans receivable discussed previously. Sequentially, Canada revenue increased $4.0 million, or 8.8%, driven by increases in Open-End, Single-Pay and ancillary revenue.
Canada non-Single-Pay revenue increased $0.1 million, or 0.2% ($0.5 million, or 1.2%, on a constant-currency basis), to $40.1 million, compared to $40.0 million in the prior year, offset by the aforementioned NCO rate increases. U.S. gross combined loans receivable grew $35.7prior-year period, on growth of $23.9 million, or 9.5% ($26.9 million, or 8.7%10.7%, sequentiallyon a constant-currency basis), in related loan balances. The increase was driven by continued growth of Open-End loans despite COVID-19 Impacts. Ancillary revenue, which includes sales of insurance to Open-End loan customers, decreased $1.2 million, or 10.0% ($1.1 million, or 9.1% on a constant-currency basis). The decrease was driven by additional insurance claims from consumers impacted by COVID-19 during the third quarter of 2019,2020.
Single-Pay revenue decreased $11.1 million, or 55.2% ($11.1 million, or 54.8%, on a constant-currency basis), to $9.0 million for the three months ended September 30, 2020, and Single-Pay receivables decreased $18.4 million, or 52.5% ($18.3 million, or 52.0% on a constant-currency basis), to $16.7 million, from $35.1 million, in the prior-year period. The decreases in Single-Pay revenue and receivables were due to a continued shift to Open-End loans from Single-Pay, as well as a significant decline in demand attributable to COVID-19 Impacts.
The provision for losses decreased $9.6 million, or 46.0% ($9.5 million, or 45.5%, on a constant-currency basis), to $11.3 million for the three months ended September 30, 2020, compared to sequential growth of $55.3$20.9 million or 15.0%, duringin the prior-year period. The decrease in provision for loan losses was primarily a result of lower loan volume and lower NCOs as a result of COVID-19 Impacts as discussed previously. On a quarterly basis, loss rates improved approximately 380 bps, or 53.8%, year over year due to government stimulus-related pay-downs and overall portfolio maturation.
| Canada Segment Results | Three Months Ended September 30, | Nine Months Ended September 30, | |||||||||||||||||||||
| 2019 | 2018 | Change $ | Change % | 2019 | 2018 | Change $ | Change % | ||||||||||||||||
| Revenue | $ | 60,195 | $ | 46,209 | $ | 13,986 | 30.3 | % | $ | 166,269 | $ | 139,502 | $ | 26,767 | 19.2 | % | |||||||
| Provision for losses | 20,870 | 24,436 | (3,566 | ) | (14.6 | )% | 57,733 | 51,346 | 6,387 | 12.4 | % | ||||||||||||
| Net revenue | 39,325 | 21,773 | 17,552 | 80.6 | % | 108,536 | 88,156 | 20,380 | 23.1 | % | |||||||||||||
| Advertising costs | 2,238 | 3,717 | (1,479 | ) | (39.8 | )% | 5,271 | 9,147 | (3,876 | ) | (42.4 | )% | |||||||||||
| Non-advertising costs of providing services | 17,698 | 17,567 | 131 | 0.7 | % | 52,068 | 50,718 | 1,350 | 2.7 | % | |||||||||||||
| Total cost of providing services | 19,936 | 21,284 | (1,348 | ) | (6.3 | )% | 57,339 | 59,865 | (2,526 | ) | (4.2 | )% | |||||||||||
| Gross margin | 19,389 | 489 | 18,900 | # | 51,197 | 28,291 | 22,906 | 81.0 | % | ||||||||||||||
| Corporate, district and other expenses | 5,768 | 5,135 | 633 | 12.3 | % | 16,617 | 14,791 | 1,826 | 12.3 | % | |||||||||||||
| Interest expense | 2,487 | 1,234 | 1,253 | # | 7,831 | 1,298 | 6,533 | # | |||||||||||||||
| Total operating expense | 8,255 | 6,369 | 1,886 | 29.6 | % | 24,448 | 16,089 | 8,359 | 52.0 | % | |||||||||||||
| Segment operating income (loss) | 11,134 | (5,880 | ) | 17,014 | # | 26,749 | 12,202 | 14,547 | # | ||||||||||||||
| Interest expense | 2,487 | 1,234 | 1,253 | # | 7,831 | 1,298 | 6,533 | # | |||||||||||||||
| Depreciation and amortization | 1,219 | 1,087 | 132 | 12.1 | % | 3,627 | 3,306 | 321 | 9.7 | % | |||||||||||||
| EBITDA | 14,840 | (3,559 | ) | 18,399 | # | 38,207 | 16,806 | 21,401 | # | ||||||||||||||
| Restructuring costs | — | — | — | 135 | — | 135 | |||||||||||||||||
| Legal and related costs | — | 119 | (119 | ) | — | 119 | (119 | ) | |||||||||||||||
| Other adjustments | 441 | 50 | 391 | 297 | 223 | 74 | |||||||||||||||||
| Adjusted EBITDA | $ | 15,281 | $ | (3,390 | ) | $ | 18,671 | # | $ | 38,639 | $ | 17,148 | $ | 21,491 | # | ||||||||
| # - Change greater than 100% or not meaningful. | |||||||||||||||||||||||
Canada was impacted favorably by the significant asset growth and the product transition from Single-Pay and Unsecured Installment loans to Open-End loans. Additionally, Canada revenueoperating expenses for the three months ended September 30, 2019 included interest earned2020 were $7.4 million, a decrease of $0.8 million, or 10.0% ($0.8 million, or 9.2%, on past-duea constant-currency basis), compared to $8.3 million in the prior-year period, primarily as a result of certain cost reductions to manage COVID-19 Impacts.
Canada Segment Results - For the Nine Months Ended September 30, 2020 and 2019
Canada revenue decreased $12.9 million, or 7.8% (increased $10.2 million, or 6.2%, on a constant-currency basis), to $153.4 million for the nine months ended September 30, 2020, from $166.3 million in the prior year, as a result of the declines in gross loans receivable.
Canada non-Single-Pay revenue increased $11.5 million, or 10.7% ($13.7 million, or 12.7%, on a constant-currency basis), to $118.9 million, compared to $107.4 million in the prior-year period, on growth of $23.9 million, or 9.5% ($26.9 million, or 10.7%, on a constant-currency basis), in related loan balances. The increase was driven by continued growth of Open-End loan balancesdespite COVID-19 related impacts. Ancillary revenue, which includes sales of approximately $2 millioninsurance to Open-End loan customers, remained flat year over year due to increased insurance claims from consumers impacted by COVID-19 during the Q1 2019 Open-End Loss Recognition Change.nine months ended September 30, 2020.
Single-Pay revenue decreased $2.7$24.4 million, or 11.6%41.5% ($23.9 million, or 40.6%, on a constant-currency basis), to $20.2$34.5 million for the threenine months ended September 30, 2019,2020, and Single-Pay receivables decreased $1.0$18.4 million, or 2.8%52.5% ($18.3 million, or 52.0% on a constant-currency basis), to $35.1$16.7 million from $36.1$35.1 million, in the prior year. The decreases in Single-Pay revenue and receivables were due to the continued product mix shift in Canada from Single-Pay loans to Open-End loans, and by regulatory changes effective January and July 2018 that lowered Single Pay pricing year-over-year.as well as significant declines in demand attributable to COVID-19 Impacts.
The provision for losses decreased $3.6$9.8 million, or 14.6%17.0% ($9.0 million, or 15.5%, on a constant-currency basis), to $20.9$47.9 million for the threenine months ended September 30, 2019,2020, compared to $24.4$57.7 million in the prior-year period. ThisThe decrease included incrementalin provision expense from the Q1 2019 Open-End Loss Recognition Change, consistent with the incremental revenue impact. Excluding the impact of the Q1 2019 Open-End Loss Recognition Change, provision expense declined year-over-year becausefor loan losses was primarily a result of lower sequential gross receivable growthNCOs and seasoningfavorable loan performance as a result of the Open-End loans. Total Open-End and Installment loans grew $18.0 million sequentially during the third quarter of 2019, compared to sequential growth of $82.7 million during the same prior-year period. TotalCOVID-19 Impacts as discussed previously. Year-over-year Canada NCO rates improved 425 bps year-over-year due to the seasoning of Open-End loans. On a constant currency basis, provision for lossesNCOs decreased by $3.4$17.2 million, or 13.8%, compared to the prior-year period.28.4%.
57
Canada cost of providing services for the three months ended September 30, 2019 was $19.9 million, a decrease of $1.3 million, or 6.3%, compared to $21.3 million for the three months ended September 30, 2019, primarily due to lower advertising costs from mix-shift and stability in our Canadian portfolio following the Ontario deployment of Open-End loans in the third quarter of 2018. There was no material impact on the cost of providing services from exchange rate changes.
Canada operating expenses increased $8.4 million, or 52.0%, to $24.4 million infor the nine months ended September 30, 20192020 were $24.4 million, unchanged from $16.1 million in the prior-year period primarily due to interest expense on the Non-Recourse Canada SPV Facility that began in August 2018.period.
Supplemental Non-GAAP Financial Information
Non-GAAP Financial Measures
In addition to the financial information prepared in conformity with U.S. GAAP, we provide certain “non-GAAP financial measures,” including:
•Adjusted Net Income and Adjusted Earnings Per Share, or the Adjusted Earnings Measures (net income from continuing operations plus or minus gain (loss) on extinguishment of debt, restructuring and other costs, certain legal and related costs, income or loss from equity method investment, goodwill and intangible asset impairments, certain costs related to the disposition of U.K., transaction-related costs, share-based compensation, intangible asset amortization, certain tax adjustments and impacts from tax law changes and cumulative tax effect of applicable adjustments, on a total and per share basis);
•EBITDA (earnings before interest, income taxes, depreciation and amortization);
•Adjusted EBITDA (EBITDA plus or minus certain non-cash and other adjusting items);
•Adjusted effective income tax rate (effective tax rate plus or minus certain non-cash and other adjusting items); and
•Gross Combined Loans Receivable (includes loans originated by third-party lenders through CSO programs which are not included in our unaudited Condensed Consolidated Financial Statements).
We believe that presentation of non-GAAP financial information is meaningful and useful in understanding the activities and business metrics of the Company's operations. We believe that these non-GAAP financial measures offer another way to view aspects of our business that, when viewed with our U.S. GAAP results, provide a more complete understanding of factors and trends affecting our business.
We believe that investors regularly rely on non-GAAP financial measures, such as Adjusted Net Income, Adjusted Earnings per Share, EBITDA and Adjusted EBITDA, to assess operating performance and that such measures may highlight trends in the business that may not otherwise be apparent when relying on financial measures calculated in accordance with U.S. GAAP. In addition, we believe that the adjustments shown below are useful to investors in order to allow them to compare our financial results during the periods shown without the effect of each of these income or expense items. In addition, we believe that Adjusted Net Income, Adjusted Earnings per Share, EBITDA and Adjusted EBITDA are frequently used by securities analysts, investors
and other interested parties in the evaluation of public companies in our industry, many of which present Adjusted Net Income, Adjusted Earnings per Share, EBITDA and/or Adjusted EBITDA when reporting their results.
In addition to reporting loans receivable information in accordance with U.S. GAAP, we provide Gross Combined Loans Receivable consisting of ownedCompany-Owned loans receivable plus loans originated by third-party lenders through the CSO programs, which we guarantee but do not include in the unaudited Condensed Consolidated Financial Statements. We refer to these as "Guaranteed by the Company." Management believes this analysis provides investors with important information needed to evaluate overall lending performance.
We provide non-GAAP financial information for informational purposes and to enhance understanding of our U.S. GAAP unaudited Condensed Consolidated Financial Statements. Adjusted Net Income, Adjusted Earnings per Share, EBITDA, Adjusted EBITDA and Gross Combined Loans Receivable should not be considered as alternatives to income from continuing operations, segment operating income or any other performance measure derived in accordance with U.S. GAAP, or as an alternative to cash flows from operating activities or any other liquidity measure derived in accordance with U.S. GAAP. Readers should consider the information in addition to, but not instead of or superior to, the financial statements prepared in accordance with U.S. GAAP. This non-GAAP financial information may be determined or calculated differently by other companies, limiting the usefulness of those measures for comparative purposes.
58
Description and Reconciliations of Non-GAAP Financial Measures
Adjusted Net Income, Adjusted Earnings per Share, EBITDA and Adjusted EBITDA measures have limitations as analytical tools, and you should not consider these measures in isolation or as a substitute for analysis of our income or cash flows as reported under U.S. GAAP. Some of these limitations are:
•they do not include cash expenditures or future requirements for capital expenditures or contractual commitments;
•they do not include changes in, or cash requirements for, working capital needs;
•they do not include the interest expense, or the cash requirements necessary to service interest or principal payments on debt;
•depreciation and amortization are non-cash expense items reported in the statements of cash flows; and
•other companies in our industry may calculate these measures differently, limiting their usefulness as comparative measures.
We calculate Adjusted Earnings per Share utilizing diluted shares outstanding at year-end. If we record a loss from continuing operations under USU.S. GAAP, shares outstanding utilized to calculate Diluted Earnings per Share from continuing operations are equivalent to basic shares outstanding. Shares outstanding utilized to calculate Adjusted Earnings per Share from continuing operations reflect the number of diluted shares we would have reported if reporting net income from continuing operations under USU.S. GAAP.
As noted above, Gross Combined Loans Receivable includes loans originated by third-party lenders through CSO programs which are not included in the unaudited Condensed Consolidated Financial Statements but from which we earn revenue and for which we provide a guarantee to the lender. Management believes this analysis provides investors with important information needed to evaluate overall lending performance.
We believe Adjusted Net Income, Adjusted Earnings per Share, EBITDA and Adjusted EBITDA are used by investors to analyze operating performance and evaluate our ability to incur and service debt and the capacity for making capital expenditures. Adjusted EBITDA is also useful to investors to help assess our estimated enterprise value. The computation of Adjusted EBITDA as presented in this Form 10-Q may differ from the computation of similarly-titled measures provided by other companies.
59
Reconciliation of Net incomeIncome from continuing operationsContinuing Operations and Diluted Earnings per Share to Adjusted Net incomeIncome and Adjusted Diluted Earnings per Share, non-GAAP measures (in thousands, except per share data, unaudited)
| Three Months Ended September 30, | Nine Months Ended September 30, | ||||||||||||||||||||||||||||
| 2020 | 2019 | Change $ | Change % | 2020 | 2019 | Change $ | Change % | ||||||||||||||||||||||
| Net income from continuing operations | $ | 12,881 | $ | 27,987 | $ | (15,106) | (54.0) | % | $ | 69,974 | $ | 74,327 | $ | (4,353) | (5.9) | ||||||||||||||
| Adjustments: | |||||||||||||||||||||||||||||
Legal and related costs (1) | 1,415 | 870 | 3,502 | 2,622 | |||||||||||||||||||||||||
U.K. related costs (2) | — | 348 | — | 8,844 | |||||||||||||||||||||||||
(Income) loss from equity method investment (3) | (3,530) | 1,384 | (2,653) | 5,132 | |||||||||||||||||||||||||
Share-based compensation (4) | 3,392 | 2,771 | 9,896 | 7,587 | |||||||||||||||||||||||||
| Intangible asset amortization | 750 | 751 | 2,246 | 2,308 | |||||||||||||||||||||||||
Canada GST adjustment (5) | — | — | 2,160 | — | |||||||||||||||||||||||||
Income tax valuations (6) | — | — | (3,472) | — | |||||||||||||||||||||||||
Impact of tax law changes (7) | (2,137) | — | (11,251) | — | |||||||||||||||||||||||||
Cumulative tax effect of adjustments (8) | (1,445) | (1,232) | (4,630) | (5,554) | |||||||||||||||||||||||||
| Adjusted Net Income | $ | 11,326 | $ | 32,879 | $ | (21,553) | (65.6) | % | $ | 65,772 | $ | 95,266 | $ | (29,494) | (31.0) | % | |||||||||||||
| Net income from continuing operations | $ | 12,881 | $ | 27,987 | $ | 69,974 | $ | 74,327 | |||||||||||||||||||||
Diluted Weighted Average Shares Outstanding | 41,775 | 46,010 | 41,660 | 46,887 | |||||||||||||||||||||||||
| Diluted Earnings per Share from continuing operations | $ | 0.31 | $ | 0.61 | $ | (0.30) | (49.2) | % | $ | 1.68 | $ | 1.59 | $ | 0.09 | 5.7 | ||||||||||||||
| Per Share impact of adjustments to Net income | (0.04) | 0.10 | (0.10) | 0.44 | |||||||||||||||||||||||||
| Adjusted Diluted Earnings per Share | $ | 0.27 | $ | 0.71 | $ | (0.44) | (62.0) | % | $ | 1.58 | $ | 2.03 | $ | (0.45) | (22.2) | % | |||||||||||||
| Note: Footnotes follow Reconciliation of Adjusted EBITDA table immediately below. | |||||||||||||||||||||||||||||
60
| Three Months Ended September 30, | Nine Months Ended September 30, | |||||||||||||||||||||
| 2019 | 2018 | Change $ | Change % | 2019 | 2018 | Change $ | Change % | |||||||||||||||
| Net income (loss) from continuing operations | $ | 27,987 | $ | (42,590 | ) | $ | 70,577 | # | $ | 74,327 | $ | 1,041 | $ | 73,286 | # | |||||||
| Adjustments: | ||||||||||||||||||||||
Loss on extinguishment of debt (1) | — | 72,165 | — | 83,848 | ||||||||||||||||||
Restructuring costs (2) | — | — | 1,752 | — | ||||||||||||||||||
Legal and related costs (3) | 870 | (1,178 | ) | 870 | (1,178 | ) | ||||||||||||||||
U.K. related costs (4) | 348 | — | 8,844 | — | ||||||||||||||||||
Loss from equity method investment (5) | 1,384 | — | 5,132 | — | ||||||||||||||||||
Share-based compensation (6) | 2,771 | 2,089 | 7,587 | 6,112 | ||||||||||||||||||
| Intangible asset amortization | 751 | 714 | 2,308 | 2,017 | ||||||||||||||||||
Impact of tax law changes (7) | — | (600 | ) | — | 1,200 | |||||||||||||||||
| Cumulative tax effect of adjustments | (1,232 | ) | (19,185 | ) | (5,554 | ) | (23,579 | ) | ||||||||||||||
| Adjusted Net Income | $ | 32,879 | $ | 11,415 | $ | 21,464 | # | $ | 95,266 | $ | 69,461 | $ | 25,805 | 37.2 | % | |||||||
| Net income (loss) from continuing operations | $ | 27,987 | $ | (42,590 | ) | $ | 74,327 | $ | 1,041 | |||||||||||||
Diluted Weighted Average Shares Outstanding | 46,010 | 45,853 | 46,887 | 48,061 | ||||||||||||||||||
| Adjusted Diluted Average Shares Outstanding | 46,010 | 48,352 | 46,887 | 48,061 | ||||||||||||||||||
| Diluted Earnings per Share from continuing operations | $ | 0.61 | $ | (0.93 | ) | $ | 1.54 | # | $ | 1.59 | $ | 0.03 | $ | 1.56 | # | |||||||
| Per Share impact of adjustments to Net Income | 0.10 | 1.17 | 0.44 | 1.42 | ||||||||||||||||||
| Adjusted Diluted Earnings per Share | $ | 0.71 | $ | 0.24 | $ | 0.47 | # | $ | 2.03 | $ | 1.45 | $ | 0.58 | 40.0 | % | |||||||
Reconciliation of Net income (loss)Income from continuing operationsContinuing Operations to EBITDA and Adjusted EBITDA, non-GAAP measures (in thousands, except per share data, unaudited)
| Three Months Ended September 30, | Nine Months Ended September 30, | ||||||||||||||||||||||||||||
| 2020 | 2019 | Change $ | Change % | 2020 | 2019 | Change $ | Change % | ||||||||||||||||||||||
| Net income from continuing operations | $ | 12,881 | $ | 27,987 | $ | (15,106) | (54.0) | % | $ | 69,974 | $ | 74,327 | $ | (4,353) | (5.9) | ||||||||||||||
| (Benefit) provision for income taxes | (822) | 11,239 | (12,061) | # | 2,183 | 28,738 | (26,555) | (92.4) | |||||||||||||||||||||
| Interest expense | 18,383 | 17,364 | 1,019 | 5.9 | % | 54,018 | 52,077 | 1,941 | 3.7 | ||||||||||||||||||||
| Depreciation and amortization | 4,358 | 4,609 | (251) | (5.4) | % | 13,312 | 14,180 | (868) | (6.1) | % | |||||||||||||||||||
| EBITDA | 34,800 | 61,199 | (26,399) | (43.1) | % | 139,487 | 169,322 | (29,835) | (17.6) | ||||||||||||||||||||
Legal and related costs (1) | 1,415 | 870 | 3,502 | 2,622 | |||||||||||||||||||||||||
U.K. related costs (2) | — | 348 | — | 8,844 | |||||||||||||||||||||||||
(Income) loss from equity method investment (3) | (3,530) | 1,384 | (2,653) | 5,132 | |||||||||||||||||||||||||
Share-based compensation (4) | 3,392 | 2,771 | 9,896 | 7,587 | |||||||||||||||||||||||||
Canada GST adjustment (5) | — | — | 2,160 | — | |||||||||||||||||||||||||
Other adjustments (9) | 38 | 483 | 639 | 91 | |||||||||||||||||||||||||
| Adjusted EBITDA | $ | 36,115 | $ | 67,055 | $ | (30,940) | (46.1) | % | $ | 153,031 | $ | 193,598 | $ | (40,567) | (21.0) | % | |||||||||||||
| Adjusted EBITDA Margin | 19.8 | % | 22.6 | % | 23.7 | 23.1 | % | ||||||||||||||||||||||
| Three Months Ended September 30, | Nine Months Ended September 30, | ||||||||||||||||||||||
| 2019 | 2018 | Change $ | Change % | 2019 | 2018 | Change $ | Change % | ||||||||||||||||
| Net income (loss) from continuing operations | $ | 27,987 | $ | (42,590 | ) | $ | 70,577 | # | $ | 74,327 | $ | 1,041 | $ | 73,286 | # | ||||||||
| Provision for income taxes | 11,239 | (16,914 | ) | 28,153 | # | 28,738 | (269 | ) | 29,007 | # | |||||||||||||
| Interest expense | 17,364 | 23,403 | (6,039 | ) | (25.8 | )% | 52,077 | 66,229 | (14,152 | ) | (21.4 | )% | |||||||||||
| Depreciation and amortization | 4,609 | 4,623 | (14 | ) | (0.3 | )% | 14,180 | 13,628 | 552 | 4.1 | % | ||||||||||||
| EBITDA | 61,199 | (31,478 | ) | 92,677 | # | 169,322 | 80,629 | 88,693 | # | ||||||||||||||
Loss on extinguishment of debt (1) | — | 69,200 | — | 80,883 | |||||||||||||||||||
Restructuring costs (2) | — | — | 1,752 | — | |||||||||||||||||||
Legal and related costs (3) | 870 | (1,178 | ) | 870 | (1,178 | ) | |||||||||||||||||
U.K. related costs (4) | 348 | — | 8,844 | — | |||||||||||||||||||
Loss from equity method investment (5) | 1,384 | — | 5,132 | — | |||||||||||||||||||
Share-based compensation (6) | 2,771 | 2,089 | 7,587 | 6,112 | |||||||||||||||||||
Other adjustments (8) | 483 | (49 | ) | 91 | (1 | ) | |||||||||||||||||
| Adjusted EBITDA | $ | 67,055 | $ | 38,584 | $ | 28,471 | 73.8 | % | $ | 193,598 | $ | 166,445 | $ | 27,153 | 16.3 | % | |||||||
| Adjusted EBITDA Margin | 22.6 | % | 14.3 | % | 23.1 | % | 22.0 | % | |||||||||||||||
| (1) | Legal and | ||||
| (2) | U.K. related costs of $8.8 million for the nine months ended September 30, 2019 relate to placing the U.K. subsidiaries into administration on February 25, 2019, which included $7.6 million to obtain consent from the holders of the 8.25% Senior Secured Notes to deconsolidate the U.K. | ||||
| (3) | The The loss from equity method investment for the nine months ended September 30, 2019 of $5.1 million includes (i) our share of the estimated U.S. GAAP net loss of | ||||
| (5) | We received a | ||||
| (6) | During the nine months ended September 30, 2020, a Texas court ruling related to the apportionment of income to the state for another company resulted in a change in estimate regarding the realization of a tax benefit previously taken. Accordingly, we recorded a $1.1 million liability for our estimated exposure related to this position. Also in the nine months ended September 30, 2020, we released a $4.6 million valuation allowance related to NOLs for certain entities in Canada. | ||||
| (7) | For the nine months ended September 30, 2020, we recorded an income tax benefit of $11.3 million related to the carryback of NOL from tax years 2018 and 2019 due to the provisions of the | ||||
| (8) | Cumulative tax effect of adjustments included in Reconciliation of Net income from continuing operations to EBITDA and Adjusted EBITDA table is calculated using the estimated incremental tax rate by country. | ||||
| (9) | Other adjustments primarily include | ||||
Currency Information
We operate in the U.S. and Canada and our consolidated results are reported in U.S. dollars.
Changes in our reported revenues and net income include the effect of changes in currency exchange rates. We translate all balance sheet accounts into U.S. dollars at the currency exchange rate in effect at the end of each period. We translate the statement of operations at the average rates of exchange for the period. We record currency translation adjustments as a component of Accumulated Other Comprehensive Income in Stockholders’ Equity.
61
Constant Currency Analysis
We have operations in the U.S. and Canada. In the three months ended September 30, 2020 and 2019, 27.0% and 2018, 20.2%, respectively, of our revenues from continuing operations were originated in Canadian Dollars. In the nine months ended September 30, 2020 and 17.1%2019, 23.8% and 19.8%, respectively, of our revenues from continuing operations were originated in Canadian Dollars. As a result, changes in our reported results include the impacts of changes in foreign currency exchange rates for the Canadian Dollar.
Income Statement
| Three Months Ended September 30, | Nine Months Ended September 30, | ||||||||||||||||||||||||||||||||||
| 2020 | 2019 | $ Change | % Change | 2020 | 2019 | $ Change | % Change | ||||||||||||||||||||||||||||
| Average Exchange Rates for the Canadian Dollar | $ | 0.7504 | $ | 0.7576 | ($0.0072) | (1.0) | % | $ | 0.7391 | $ | 0.7526 | ($0.0135) | (1.8) | % | |||||||||||||||||||||
Balance Sheet - Exchange Rate as of September 30, 20192020 and 2018December 31, 2019
| September 30, | December 31, | Change | |||||||||||||||
| 2020 | 2019 | $ | % | ||||||||||||||
| Exchange Rate for the Canadian Dollar | $ | 0.7472 | $ | 0.7683 | ($0.0211) | (2.7) | % | ||||||||||
| Average Exchange Rates | ||||||||||||
| Three Months Ended September 30, | Change | |||||||||||
| 2019 | 2018 | $ | % | |||||||||
| Canadian Dollar | $ | 0.7576 | $ | 0.7652 | ($0.0076 | ) | (1.0 | )% | ||||
| Average Exchange Rates | ||||||||||||
| Nine Months Ended September 30, | Change | |||||||||||
| 2019 | 2018 | $ | % | |||||||||
| Canadian Dollar | $ | 0.7526 | $ | 0.7771 | ($0.0245 | ) | (3.2 | )% | ||||
The following constant currency analysis removes the impact of the fluctuation in foreign exchange rates and utilizes constant currency results in our analysis of segment performance. Our constant currency assessment assumes foreign exchange rates in the current fiscal periods remained the same as in the prior fiscal periods. All conversion rates below are based on the U.S. Dollar equivalent to the Canadian Dollar. We believe that the constant currency assessment below is a useful measure in assessing the comparable growth and profitability of our operations.
| Three Months Ended September 30, | Change | ||||||||||||||
| 2019 | 2018 | $ | % | ||||||||||||
| Canada – constant currency basis: | |||||||||||||||
| Revenues | $ | 60,805 | $ | 46,209 | $ | 14,596 | 31.6 | % | |||||||
| Gross Margin | 19,597 | 489 | 19,108 | # | |||||||||||
| # - variance greater than 100% or not meaningful | |||||||||||||||
| Three Months Ended September 30, | Nine Months Ended September 30, | |||||||||||||||||||||||||||||||||||||
| 2020 | 2019 | $ Change | % Change | 2020 | 2019 | $ Change | % Change | |||||||||||||||||||||||||||||||
| Canada – constant currency basis: | ||||||||||||||||||||||||||||||||||||||
| Revenues | $ | 49,618 | $ | 60,195 | $ | (10,577) | (17.6) | % | $ | 156,026 | $ | 166,269 | $ | (10,243) | (6.2) | % | ||||||||||||||||||||||
| Gross Margin | 20,365 | 19,389 | 976 | 5.0 | % | 52,861 | 51,197 | 1,664 | 3.3 | % | ||||||||||||||||||||||||||||
| Nine Months Ended September 30, | Change | |||||||||||||||
| 2019 | 2018 | $ | % | |||||||||||||
| Canada – constant currency basis: | ||||||||||||||||
| Revenues | $ | 171,664 | $ | 139,502 | $ | 32,162 | 23.1 | % | ||||||||
| Gross Margin | 52,861 | 28,291 | 24,570 | 86.8 | % | |||||||||||
We calculated gross loans receivable below as of September 30, 2020 using the actual exchange rate as of December 31, 2019 (in thousands, unaudited).
| September 30, | December 31, | Change | |||||||||||||||||||||
| 2020 | 2019 | $ | % | ||||||||||||||||||||
| Canada – constant currency basis: | |||||||||||||||||||||||
| Gross loans receivable | $ | 300,409 | $ | 302,375 | $ | (1,966) | (0.7) | % | |||||||||||||||
LIQUIDITY AND CAPITAL RESOURCES
Our principal sources of liquidity to fund the loans we make to our customers are cash provided by operations,operations; our Senior Revolver, our Cash Money Revolving Credit Facility, Non-Recourse U.S. SPV Facility, Non-Recourse Canada SPV Facility, and funds from third-party lenders under our CSO programs, and our Non-Recourse Canada SPV Facility (defined below). Duringprograms. Additionally, in August 2018, we issued $690.0 million 8.25% Senior Secured Notes due September 2025 ("8.25% Senior Secured Notes") (i) to redeem the outstanding 12.00% Senior Secured Notes due 2022 of CFTC, (ii) to repay a portion of the outstanding indebtedness under the five-year revolving credit facility of CURO Receivables Finance I, LLC, our wholly-owned subsidiary, which consists of a term loan and revolving borrowing capacity, (iii) for general corporate purposes and (iv) to pay fees, expenses, premiums and accrued interest in connection with the foregoing.2025.
As of September 30, 2019,2020, we were in compliance with all financial ratios, covenants and other requirements set forth in our debt agreements. We anticipate that our primary use of cash will be to fund growth in our working capital, finance capital expenditures, and meet our debt obligations, and fundobligations. As we did for our share repurchase program. programs announced in April 2019 and February 2020 (the latter of which was suspended in March 2020, as previously disclosed), we may also use cash to fund a
62
return on capital for our stockholders through share repurchase programs, or as we previously announced in the form of dividends.
Our level of cash flow provided by operating activities typically experiences some seasonal fluctuation related to our levels of net income and changes in working capital levels, particularly loans receivable.
Unexpected changes in our financial condition or other unforeseen factors may result in our inability to obtain third-party financing or could increase our borrowing costs in the future. We have the ability to adjust our volume of lending to consumers which would reduce cash outflow requirements while increasing cash inflows through loan repayments to the extent we experience any short-term or long-term funding shortfalls.shortfalls, such as tightening our credit approval practices (as we have done during the COVID-19 pandemic), which has the effect of reducing cash outflow requirements while increasing cash inflows through loan repayments. We may also sell or securitize our assets, draw on our available revolving credit facility or line of credit, enter into additional refinancing agreements andor reduce our capital spending in order to generate additional liquidity. Although consumer demand increased sequentially during the third quarter of 2020, our cash on hand and total liquidity remains at elevated levels due to a combination of factors, including (i) a sharp decrease in demand immediately following the onset of the COVID-19 pandemic, (ii) increased or accelerated repayments as customers benefited from government stimulus programs, (iii) our decision to tighten credit and the resulting favorable credit performance, and (iv) the runoff of California Installment loans following that state's regulatory changes effective January 1, 2020. These factors resulted in our available cash on hand of $207.1 million and our total liquidity of $302.1 million as of September 30, 2020. We believe our cash on hand and available borrowings provide us with sufficient liquidity for at least the next 12 months.
Borrowings
Our debt consisted of the following as of September 30, 2019 and December 31, 2018 (net2020, net of deferred financing costs)costs (in thousands):
| Capacity | Interest Rate | Maturity | Counter-parties | Balance as of September 30, 2020 | ||||||||||||||||
Non-Recourse Canada SPV Facility (1) | C$175.0 million | 3-Mo CDOR + 6.75% | September 2, 2023 | Waterfall Asset Management | $ | 91,010 | ||||||||||||||
| Senior Secured Revolving Credit Facility | $50.0 million | 1-Mo LIBOR + 5.00% | June 30, 2021 | BayCoast Bank; Stride Bank; Hancock-Whitney Bank; Metropolitan Commercial Bank | — | |||||||||||||||
| Non-Recourse U.S. SPV Facility | $200.0 million | 1-Mo LIBOR + 6.25(2) | April 8, 2024 | Atalaya Capital Management | 28,884 | |||||||||||||||
Cash Money Revolving Credit Facility (1) | C$10.0 million | Canada Prime Rate +1.95% | On-demand | Royal Bank of Canada | — | |||||||||||||||
| 8.25% Senior Secured Notes (due 2025) | $690.0 million | 8.25% | September 1, 2025 | 679,566 | ||||||||||||||||
| (1) Capacity amounts are denominated in Canadian dollars, while outstanding balances as of September 30, 2020 are denominated in U.S. dollars. | ||||||||||||||||||||
| (2) The Non-Recourse U.S. SPV Facility initially provided for $100.0 million of borrowing capacity and, on July 31, 2020, additional commitments were obtained increasing capacity to $200.0 million. As a result of the increase in commitments, interest now accrues at an annual rate of one-month LIBOR (with a floor of 1.65%) plus the lesser of (a) 6.95% and (b) the sum of (i) 6.25% on balances up to $145.5 million and (ii) 9.75% on balances greater than $145.5 million. | ||||||||||||||||||||
63
| September 30, | December 31, | |||||
| 2019 | 2018 | |||||
| 8.25% Senior Secured Notes (due 2025) | $ | 677,924 | $ | 676,661 | ||
| Non-Recourse Canada SPV Facility | 102,483 | 107,479 | ||||
| Senior Revolver | 25,000 | 20,000 | ||||
| Debt | $ | 805,407 | $ | 804,140 | ||
(ii)The Company's subsidiary guarantors, which are comprised of certain of its domestic subsidiaries, including (x) CFTC, as the issuer of the 12.00% Senior Secured Notes we capitalized financing costs of $12.9 million,that were redeemed in August 2018, (y) CURO Intermediate Holdings Corp., but excluding the balance ofU.S. SPV and Canada SPV (the “Subsidiary Guarantors”), on a consolidated basis, which is included in the Condensed Consolidated Balance Sheets as a component of Debt,are 100% owned by CURO, and is being amortized over the termwhich are guarantors of the 8.25% Senior Secured Notes and included asissued in August 2018;
(iii)The Non-Recourse U.S. SPV facility, a component of interest expense.wholly-owned, bankruptcy-remote special purpose subsidiary, created in April 2020;
(iv)The Non-Recourse Canada SPV facility, a wholly-owned, bankruptcy-remote special purpose subsidiary;
(vi)Consolidating and eliminating entries representing adjustments to:
2.eliminate the investments in subsidiaries; and
For additional details, see Note 5, "Debt."
64
Condensed Consolidating Balance Sheets
| September 30, 2020 | |||||||||||||||||||||||
| (dollars in thousands) | CURO | Subsidiary Guarantors | U.S. SPV | Canada SPV | Subsidiary Non-Guarantors | Eliminations | CURO Consolidated | ||||||||||||||||
| Assets: | |||||||||||||||||||||||
| Cash and cash equivalents | $ | — | $ | 148,530 | $ | — | $ | — | $ | 58,541 | $ | — | $ | 207,071 | |||||||||
| Restricted cash | — | 25,797 | 9,179 | 24,517 | 3,034 | — | 62,527 | ||||||||||||||||
| Loans receivable, net | — | 102,858 | 55,376 | 218,683 | 39,943 | — | 416,860 | ||||||||||||||||
| Income taxes receivable | 57,303 | (24,444) | — | — | 2,355 | — | 35,214 | ||||||||||||||||
| Prepaid expenses and other | — | 20,028 | 455 | 710 | 7,066 | — | 28,259 | ||||||||||||||||
| Property and equipment, net | — | 38,047 | — | — | 23,634 | — | 61,681 | ||||||||||||||||
| Investments | — | 23,908 | — | — | — | — | 23,908 | ||||||||||||||||
| Right of use asset - operating leases | — | 71,632 | — | — | 39,423 | — | 111,055 | ||||||||||||||||
| Deferred tax assets | 18,245 | (18,245) | — | — | — | — | — | ||||||||||||||||
| Goodwill | — | 105,922 | — | — | 28,667 | — | 134,589 | ||||||||||||||||
| Other intangibles, net | — | 15,477 | — | — | 21,742 | — | 37,219 | ||||||||||||||||
| Intercompany receivable | — | 154,020 | — | — | — | (154,020) | — | ||||||||||||||||
| Investment in subsidiaries | 160,797 | — | — | — | — | (160,797) | — | ||||||||||||||||
| Other assets | — | 7,488 | — | — | 663 | — | 8,151 | ||||||||||||||||
| Total assets | $ | 236,345 | $ | 671,018 | $ | 65,010 | $ | 243,910 | $ | 225,068 | $ | (314,817) | $ | 1,126,534 | |||||||||
| Liabilities and Stockholders' equity (deficit): | |||||||||||||||||||||||
| Accounts payable and accrued liabilities | $ | (52) | $ | 40,921 | $ | — | $ | 26,665 | $ | (15,787) | $ | — | $ | 51,747 | |||||||||
| Deferred revenue | — | 3,367 | 105 | 32 | 1,716 | — | 5,220 | ||||||||||||||||
| Lease liability - operating leases | — | 79,439 | — | — | 39,392 | — | 118,831 | ||||||||||||||||
| Income taxes payable | (8,164) | 8,164 | — | — | — | — | — | ||||||||||||||||
| Accrued interest | 4,745 | — | 300 | 683 | — | — | 5,728 | ||||||||||||||||
| Liability for losses on CSO lender-owned consumer loans | — | 6,198 | — | — | — | — | 6,198 | ||||||||||||||||
| Debt | 679,566 | — | 28,884 | 91,010 | — | — | 799,460 | ||||||||||||||||
| Intercompany payable | — | 2,330 | (2,330) | 37,511 | 116,509 | (154,020) | — | ||||||||||||||||
| Payable to CURO Holdings Corp. | (565,230) | 565,230 | — | — | — | — | — | ||||||||||||||||
| Other long-term liabilities | — | 13,311 | — | — | 65 | — | 13,376 | ||||||||||||||||
| Deferred tax liabilities | 12,927 | — | — | (100) | 594 | — | 13,421 | ||||||||||||||||
| Total liabilities | 123,792 | 718,960 | 26,959 | 155,801 | 142,489 | (154,020) | 1,013,981 | ||||||||||||||||
| Stockholders' equity (deficit) | 112,553 | (47,942) | 38,051 | 88,109 | 82,579 | (160,797) | 112,553 | ||||||||||||||||
| Total liabilities and stockholders' equity (deficit) | $ | 236,345 | $ | 671,018 | $ | 65,010 | $ | 243,910 | $ | 225,068 | $ | (314,817) | $ | 1,126,534 | |||||||||
65
| December 31, 2019 | |||||||||||||||||||||||
| (dollars in thousands) | CURO | Subsidiary Guarantors | Canada SPV | Subsidiary Non-Guarantors | Eliminations | CURO Consolidated | |||||||||||||||||
| Assets: | |||||||||||||||||||||||
| Cash and cash equivalents | $ | — | $ | 44,727 | $ | — | $ | 30,515 | $ | — | $ | 75,242 | |||||||||||
| Restricted cash | — | 14,958 | 17,427 | 2,394 | — | 34,779 | |||||||||||||||||
| Loans receivable, net | — | 286,881 | 220,067 | 52,045 | — | 558,993 | |||||||||||||||||
| Income taxes receivable | 19,690 | (8,987) | — | 723 | — | 11,426 | |||||||||||||||||
| Prepaid expenses and other | — | 26,623 | — | 9,267 | — | 35,890 | |||||||||||||||||
| Property and equipment, net | — | 43,618 | — | 27,193 | — | 70,811 | |||||||||||||||||
| Investments | — | 10,068 | — | — | — | 10,068 | |||||||||||||||||
| Right of use asset - operating leases | — | 74,845 | — | 42,608 | — | 117,453 | |||||||||||||||||
| Deferred tax asset | 8,561 | (3,506) | — | — | — | 5,055 | |||||||||||||||||
| Goodwill | — | 91,131 | — | 29,478 | — | 120,609 | |||||||||||||||||
| Other intangibles, net | — | 11,569 | — | 22,358 | — | 33,927 | |||||||||||||||||
| Intercompany receivable | — | 113,599 | — | — | (113,599) | — | |||||||||||||||||
| Investment in subsidiaries | 84,514 | — | — | — | (84,514) | — | |||||||||||||||||
| Other assets | — | 6,938 | — | 704 | — | 7,642 | |||||||||||||||||
| Total assets | $ | 112,765 | $ | 712,464 | $ | 237,494 | $ | 217,285 | $ | (198,113) | $ | 1,081,895 | |||||||||||
| Liabilities and Stockholder's equity (deficit): | |||||||||||||||||||||||
| Accounts payable and accrued liabilities | $ | 465 | $ | 48,333 | $ | 13,462 | $ | (2,177) | $ | — | $ | 60,083 | |||||||||||
| Deferred revenue | — | 6,828 | 46 | 3,296 | — | 10,170 | |||||||||||||||||
| Lease liability - operating leases | — | 82,593 | — | 42,406 | — | 124,999 | |||||||||||||||||
| Accrued interest | 18,975 | 1 | 871 | — | — | 19,847 | |||||||||||||||||
| Payable to CURO Holdings Corp. | (635,511) | 635,511 | — | — | — | — | |||||||||||||||||
| Liability for losses on CSO lender-owned consumer loans | — | 10,623 | — | — | — | 10,623 | |||||||||||||||||
| Debt | 678,323 | — | 112,221 | — | — | 790,544 | |||||||||||||||||
| Intercompany payable | — | — | 69,639 | 43,960 | (113,599) | — | |||||||||||||||||
| Other liabilities | — | 10,285 | — | 379 | — | 10,664 | |||||||||||||||||
| Liabilities from discontinued operations | — | — | — | 4,452 | — | 4,452 | |||||||||||||||||
| Total liabilities | 62,252 | 794,174 | 196,239 | 92,316 | (113,599) | 1,031,382 | |||||||||||||||||
| Stockholders' equity (deficit) | 50,513 | (81,710) | 41,255 | 124,969 | (84,514) | 50,513 | |||||||||||||||||
| Total liabilities and stockholders' equity (deficit) | $ | 112,765 | $ | 712,464 | $ | 237,494 | $ | 217,285 | $ | (198,113) | $ | 1,081,895 | |||||||||||
66
Condensed Consolidating Statements of the Senior Revolver generally conform to the related provisions in the Indenture for our 8.25% Senior Secured Notes. We believe this facility complements our other financing sources, while providing seasonal short-term liquidity. Under the Senior Revolver, there is $50.0 million maximum availability, including up to $5.0 million of standby letters of credit, for a one-year term, renewable for successive terms following annual review. The Senior Revolver accrues interest at the one-month LIBOR (which may not be negative) plus 5% per annum and is repayable on demand. The terms of the Senior Revolver require that the outstanding balance be zero for at least 30 consecutive days in each calendar year. The Senior Revolver is guaranteed by all of our subsidiaries that guarantee our 8.25% Senior Secured Notes and is secured by a lien on substantially all of our assets and the guarantor subsidiaries that is senior to the lien securing our 8.25% Senior Secured Notes. The Senior Revolver had an outstanding balance of $25.0 million at September 30, 2019.Operations
| Three Months Ended September 30, 2020 | |||||||||||||||||||||||
| (dollars in thousands) | CURO | Subsidiary Guarantors | U.S. SPV | Canada SPV | Subsidiary Non-Guarantors | Eliminations | CURO Consolidated | ||||||||||||||||
| Revenue | $ | — | $ | 89,212 | $ | 43,636 | $ | 32,936 | $ | 16,219 | $ | — | $ | 182,003 | |||||||||
| Provision for losses | — | 24,016 | 19,469 | 9,191 | 2,074 | — | 54,750 | ||||||||||||||||
| Net revenue | — | 65,196 | 24,167 | 23,745 | 14,145 | — | 127,253 | ||||||||||||||||
| Cost of providing services: | |||||||||||||||||||||||
| Salaries and benefits | — | 16,075 | — | — | 8,171 | — | 24,246 | ||||||||||||||||
| Occupancy | — | 7,896 | — | — | 5,982 | — | 13,878 | ||||||||||||||||
| Office | — | 3,858 | — | — | 1,200 | — | 5,058 | ||||||||||||||||
| Other costs of providing services | — | 4,745 | — | — | 1,331 | — | 6,076 | ||||||||||||||||
| Advertising | — | 13,405 | — | — | 1,020 | — | 14,425 | ||||||||||||||||
| Total cost of providing services | — | 45,979 | — | — | 17,704 | — | 63,683 | ||||||||||||||||
| Gross margin | — | 19,217 | 24,167 | 23,745 | (3,559) | — | 63,570 | ||||||||||||||||
| Operating expense (income): | |||||||||||||||||||||||
| Corporate, district and other expenses | 3,558 | 27,836 | 109 | 139 | 5,016 | — | 36,658 | ||||||||||||||||
| Intercompany management fee | — | (3,995) | — | 1,209 | 2,786 | — | — | ||||||||||||||||
| Interest expense (income) | 14,653 | 29 | 1,425 | 2,356 | (80) | — | 18,383 | ||||||||||||||||
| Income from equity method investment | — | (3,530) | — | — | — | — | (3,530) | ||||||||||||||||
| Intercompany interest (income) expense | — | (5,090) | — | 560 | 4,530 | — | — | ||||||||||||||||
| Total operating expense | 18,211 | 15,250 | 1,534 | 4,264 | 12,252 | — | 51,511 | ||||||||||||||||
| (Loss) income from continuing operations before income taxes | (18,211) | 3,967 | 22,633 | 19,481 | (15,811) | — | 12,059 | ||||||||||||||||
| (Benefit) provision for income taxes | (10,189) | 8,346 | — | (101) | 1,122 | — | (822) | ||||||||||||||||
| Net (loss) income from continuing operations | (8,022) | (4,379) | 22,633 | 19,582 | (16,933) | — | 12,881 | ||||||||||||||||
| Net income on discontinued operations | — | — | — | — | — | — | — | ||||||||||||||||
| Net (loss) income | (8,022) | (4,379) | 22,633 | 19,582 | (16,933) | — | 12,881 | ||||||||||||||||
| Equity in net income (loss) of subsidiaries: | |||||||||||||||||||||||
| CFTC | 20,903 | — | — | — | — | (20,903) | — | ||||||||||||||||
| Guarantor Subsidiaries | — | (4,379) | — | — | — | 4,379 | — | ||||||||||||||||
| Non-Guarantor Subsidiaries | — | (16,933) | — | — | — | 16,933 | — | ||||||||||||||||
| U.S. SPV | — | 22,633 | — | — | — | (22,633) | — | ||||||||||||||||
| Canada SPV | — | 19,582 | — | — | — | (19,582) | — | ||||||||||||||||
| Net income (loss) attributable to CURO | $ | 12,881 | $ | 16,524 | $ | 22,633 | $ | 19,582 | $ | (16,933) | $ | (41,806) | $ | 12,881 | |||||||||
67
| Three Months Ended September 30, 2019 | ||||||||||||||||||||
| (dollars in thousands) | CURO | Subsidiary Guarantors | Canada SPV | Subsidiary Non-Guarantors | Eliminations | CURO Consolidated | ||||||||||||||
| Revenue | $ | — | $ | 237,069 | $ | 30,211 | $ | 29,984 | $ | — | $ | 297,264 | ||||||||
| Provision for losses | — | 102,997 | 13,679 | 7,191 | — | 123,867 | ||||||||||||||
| Net revenue | — | 134,072 | 16,532 | 22,793 | — | 173,397 | ||||||||||||||
| Cost of providing services: | ||||||||||||||||||||
| Salaries and benefits | — | 18,301 | — | 9,161 | — | 27,462 | ||||||||||||||
| Occupancy | — | 8,249 | — | 5,787 | — | 14,036 | ||||||||||||||
| Office | — | 4,611 | — | 1,382 | — | 5,993 | ||||||||||||||
| Other costs of providing services | — | 11,475 | — | 1,368 | — | 12,843 | ||||||||||||||
| Advertising | — | 14,186 | — | 2,238 | — | 16,424 | ||||||||||||||
| Total cost of providing services | — | 56,822 | — | 19,936 | — | 76,758 | ||||||||||||||
| Gross margin | — | 77,250 | 16,532 | 2,857 | — | 96,639 | ||||||||||||||
| Operating (income) expense: | ||||||||||||||||||||
| Corporate, district and other expenses | 2,967 | 29,930 | 472 | 5,296 | — | 38,665 | ||||||||||||||
| Intercompany management fee | — | (3,276) | 8 | 3,268 | — | — | ||||||||||||||
| Interest expense | 14,619 | 258 | 2,463 | 24 | — | 17,364 | ||||||||||||||
| Loss from equity method investment | — | 1,384 | — | — | — | 1,384 | ||||||||||||||
| Intercompany interest (income) expense | — | (1,462) | 569 | 893 | — | — | ||||||||||||||
| Total operating expense | 17,586 | 26,834 | 3,512 | 9,481 | — | 57,413 | ||||||||||||||
| Income (loss) from continuing operations before income taxes | (17,586) | 50,416 | 13,020 | (6,624) | — | 39,226 | ||||||||||||||
| (Benefit) provision for income taxes | (4,447) | 13,700 | — | 1,986 | — | 11,239 | ||||||||||||||
| Net (loss) income from continuing operations | (13,139) | 36,716 | 13,020 | (8,610) | — | 27,987 | ||||||||||||||
| Net loss on discontinued operations | — | — | — | (598) | — | (598) | ||||||||||||||
| Net (loss) income | (13,139) | 36,716 | 13,020 | (9,208) | — | 27,389 | ||||||||||||||
| Equity in net income (loss) of subsidiaries: | ||||||||||||||||||||
| CFTC | 40,528 | — | — | — | (40,528) | — | ||||||||||||||
| Guarantor Subsidiaries | — | 36,716 | — | — | (36,716) | — | ||||||||||||||
| Non-Guarantor Subsidiaries | — | (9,208) | — | — | 9,208 | — | ||||||||||||||
| Canada SPV | — | 13,020 | — | (13,020) | — | |||||||||||||||
| Net income (loss) attributable to CURO | $ | 27,389 | $ | 77,244 | $ | 13,020 | $ | (9,208) | $ | (81,056) | $ | 27,389 | ||||||||
68
| Nine Months Ended September 30, 2020 | |||||||||||||||||||||||
| (dollars in thousands) | CURO | Subsidiary Guarantors | U.S. SPV | Canada SPV | Subsidiary Non-Guarantors | Eliminations | CURO Consolidated | ||||||||||||||||
| Revenue | $ | — | $ | 408,465 | $ | 83,471 | $ | 97,334 | $ | 56,048 | $ | — | $ | 645,318 | |||||||||
| Provision for losses | — | 128,409 | 42,647 | 38,167 | 9,756 | — | 218,979 | ||||||||||||||||
| Net revenue | — | 280,056 | 40,824 | 59,167 | 46,292 | — | 426,339 | ||||||||||||||||
| Cost of providing services: | |||||||||||||||||||||||
| Salaries and benefits | — | 49,650 | — | — | 25,326 | — | 74,976 | ||||||||||||||||
| Occupancy | — | 23,307 | — | — | 17,630 | — | 40,937 | ||||||||||||||||
| Office | — | 10,935 | — | — | 3,597 | — | 14,532 | ||||||||||||||||
| Other costs of providing services | — | 19,585 | — | — | 4,147 | — | 23,732 | ||||||||||||||||
| Advertising | — | 29,619 | — | — | 2,775 | — | 32,394 | ||||||||||||||||
| Total cost of providing services | — | 133,096 | — | — | 53,475 | — | 186,571 | ||||||||||||||||
| Gross margin | — | 146,960 | 40,824 | 59,167 | (7,183) | — | 239,768 | ||||||||||||||||
| Operating expense (income): | |||||||||||||||||||||||
| Corporate, district and other expenses | 10,350 | 88,289 | 145 | 416 | 17,046 | — | 116,246 | ||||||||||||||||
| Intercompany management fee | — | (11,139) | — | 2,584 | 8,555 | — | — | ||||||||||||||||
| Interest expense | 43,937 | 496 | 2,633 | 7,089 | (137) | — | 54,018 | ||||||||||||||||
| Income from equity method investment | — | (2,653) | — | — | — | — | (2,653) | ||||||||||||||||
| Intercompany interest (income) expense | — | (7,973) | — | 1,643 | 6,330 | — | — | ||||||||||||||||
| Total operating expense | 54,287 | 67,020 | 2,778 | 11,732 | 31,794 | — | 167,611 | ||||||||||||||||
| Income (loss) from continuing operations before income taxes | (54,287) | 79,940 | 38,046 | 47,435 | (38,977) | — | 72,157 | ||||||||||||||||
| (Benefit) provision for income taxes | (36,308) | 40,848 | — | (101) | (2,256) | — | 2,183 | ||||||||||||||||
| Net income (loss) from continuing operations | (17,979) | 39,092 | 38,046 | 47,536 | (36,721) | — | 69,974 | ||||||||||||||||
| Net income on discontinued operations | — | — | — | — | 1,285 | — | 1,285 | ||||||||||||||||
| Net income (loss) | (17,979) | 39,092 | 38,046 | 47,536 | (35,436) | — | 71,259 | ||||||||||||||||
| Equity in net income (loss) of subsidiaries: | |||||||||||||||||||||||
| CFTC | 89,238 | — | — | — | — | (89,238) | — | ||||||||||||||||
| Guarantor Subsidiaries | — | 39,092 | — | — | — | (39,092) | — | ||||||||||||||||
| Non-Guarantor Subsidiaries | — | (35,436) | — | — | — | 35,436 | — | ||||||||||||||||
| U.S. SPV | — | 38,046 | — | — | — | (38,046) | — | ||||||||||||||||
| Canada SPV | — | 47,536 | — | — | — | (47,536) | — | ||||||||||||||||
| Net income (loss) attributable to CURO | $ | 71,259 | $ | 128,330 | $ | 38,046 | $ | 47,536 | $ | (35,436) | $ | (178,476) | $ | 71,259 | |||||||||
69
| Nine Months Ended September 30, 2019 | ||||||||||||||||||||
| (dollars in thousands) | CURO | Subsidiary Guarantors | Canada SPV | Subsidiary Non-Guarantors | Eliminations | CURO Consolidated | ||||||||||||||
| Revenue | $ | — | $ | 673,234 | $ | 81,349 | $ | 84,920 | $ | — | $ | 839,503 | ||||||||
| Provision for losses | — | 280,529 | 40,099 | 17,634 | — | 338,262 | ||||||||||||||
| Net revenue | — | 392,705 | 41,250 | 67,286 | — | 501,241 | ||||||||||||||
| Cost of providing services: | ||||||||||||||||||||
| Salaries and benefits | — | 55,675 | — | 26,574 | — | 82,249 | ||||||||||||||
| Occupancy | — | 24,292 | — | 17,913 | — | 42,205 | ||||||||||||||
| Office | — | 12,504 | — | 4,059 | — | 16,563 | ||||||||||||||
| Other costs of providing services | — | 36,395 | — | 3,522 | — | 39,917 | ||||||||||||||
| Advertising | — | 31,719 | — | 5,271 | — | 36,990 | ||||||||||||||
| Total cost of providing services | — | 160,585 | — | 57,339 | — | 217,924 | ||||||||||||||
| Gross margin | — | 232,120 | 41,250 | 9,947 | — | 283,317 | ||||||||||||||
| Operating expense (income): | ||||||||||||||||||||
| Corporate, district and other expenses | 7,940 | 98,486 | (283) | 16,900 | — | 123,043 | ||||||||||||||
| Intercompany management fee | — | (9,576) | 23 | 9,553 | — | — | ||||||||||||||
| Interest expense | 43,671 | 575 | 7,728 | 103 | — | 52,077 | ||||||||||||||
| Loss from equity method investment | — | 5,132 | — | — | — | 5,132 | ||||||||||||||
| Intercompany interest (income) expense | — | (3,855) | 1,192 | 2,663 | — | — | ||||||||||||||
| Total operating expense | 51,611 | 90,762 | 8,660 | 29,219 | — | 180,252 | ||||||||||||||
| Income (loss) from continuing operations before income taxes | (51,611) | 141,358 | 32,590 | (19,272) | — | 103,065 | ||||||||||||||
| (Benefit) provision for income taxes | (12,686) | 37,309 | — | 4,115 | — | 28,738 | ||||||||||||||
| Net (loss) income from continuing operations | (38,925) | 104,049 | 32,590 | (23,387) | — | 74,327 | ||||||||||||||
| Net income on discontinued operations | — | — | — | 6,943 | — | 6,943 | ||||||||||||||
| Net (loss) income | (38,925) | 104,049 | 32,590 | (16,444) | — | 81,270 | ||||||||||||||
| Equity in net income (loss) of subsidiaries: | ||||||||||||||||||||
| CFTC | 120,195 | — | — | — | (120,195) | — | ||||||||||||||
| Guarantor Subsidiaries | — | 104,049 | — | — | (104,049) | — | ||||||||||||||
| Non-Guarantor Subsidiaries | — | (16,444) | — | — | 16,444 | — | ||||||||||||||
| Canada SPV | 32,590 | — | — | (32,590) | — | |||||||||||||||
| Net income (loss) attributable to CURO | $ | 81,270 | $ | 224,244 | $ | 32,590 | $ | (16,444) | $ | (240,390) | $ | 81,270 | ||||||||
70
Condensed Consolidated Balance Sheets as a component of “Other assets,” and are being amortized over the term of the facility and included as a component of interest expense.
| Nine Months Ended September 30, 2020 | |||||||||||||||||||||||
| (dollars in thousands) | CURO | Subsidiary Guarantors | U.S. SPV | Canada SPV | Subsidiary Non-Guarantors | Eliminations | CURO Consolidated | ||||||||||||||||
| Cash flows from operating activities: | |||||||||||||||||||||||
| Net cash provided by continuing operating activities | $ | 6,549 | $ | 143,190 | $ | 62,286 | $ | 69,115 | $ | 29,333 | $ | (727) | $ | 309,746 | |||||||||
| Net cash used in discontinued operating activities | — | — | — | — | 1,714 | — | 1,714 | ||||||||||||||||
| Cash flows from investing activities: | |||||||||||||||||||||||
| Purchase of property and equipment | — | (6,875) | — | — | (526) | — | (7,401) | ||||||||||||||||
| Originations of loans, net | — | 10,556 | (81,322) | (42,854) | (1,268) | — | (114,888) | ||||||||||||||||
| Investments in Katapult | — | (11,187) | — | — | — | — | (11,187) | ||||||||||||||||
| Acquisition of Ad Astra, net of acquiree's cash received | — | (14,418) | — | — | — | — | (14,418) | ||||||||||||||||
| Net cash provided by (used in) continuing investing activities | — | (21,924) | (81,322) | (42,854) | (1,794) | — | (147,894) | ||||||||||||||||
| Cash flows from financing activities: | |||||||||||||||||||||||
| Proceeds from Non-Recourse Canada SPV facility | — | — | — | 23,357 | — | — | 23,357 | ||||||||||||||||
| Payments on Non-Recourse Canada SPV facility | — | — | — | (42,131) | — | — | (42,131) | ||||||||||||||||
| Proceeds from Non-Recourse U.S. SPV facility | — | — | 35,206 | — | — | — | 35,206 | ||||||||||||||||
| Proceeds from credit facilities | — | 60,000 | — | — | 9,853 | — | 69,853 | ||||||||||||||||
| Payments on credit facilities | — | (60,000) | — | — | (9,853) | — | (69,853) | ||||||||||||||||
| Payments to net share settle RSUs | (641) | — | — | — | — | — | (641) | ||||||||||||||||
| Proceeds from exercise of stock options | — | 126 | — | — | — | — | 126 | ||||||||||||||||
| Debt issuance costs paid | — | — | (6,991) | — | — | — | (6,991) | ||||||||||||||||
| Repurchase of common stock | (5,908) | — | — | — | — | — | (5,908) | ||||||||||||||||
| Dividends paid to CURO Group Holdings Corp. | 6,750 | (6,750) | — | — | — | — | — | ||||||||||||||||
| Dividends paid to stockholders | (6,750) | — | — | — | — | — | (6,750) | ||||||||||||||||
Net cash (used in) provided by financing activities (1) | (6,549) | (6,624) | 28,215 | (18,774) | — | — | (3,732) | ||||||||||||||||
| Effect of exchange rate changes on cash, cash equivalents and restricted cash | — | — | — | (397) | (587) | 727 | (257) | ||||||||||||||||
| Net increase in cash, cash equivalents and restricted cash | — | 114,642 | 9,179 | 7,090 | 28,666 | — | 159,577 | ||||||||||||||||
| Cash, cash equivalents and restricted cash at beginning of period | — | 59,685 | — | 17,427 | 32,909 | — | 110,021 | ||||||||||||||||
| Cash, cash equivalents and restricted cash at end of period | $ | — | $ | 174,327 | $ | 9,179 | $ | 24,517 | $ | 61,575 | $ | — | $ | 269,598 | |||||||||
| Nine Months Ended September 30, 2019 | ||||||||||||||||||||
| (dollars in thousands) | CURO | Subsidiary Guarantors | Canada SPV | Subsidiary Non-Guarantors | Eliminations | CURO Consolidated | ||||||||||||||
| Cash flows from operating activities: | ||||||||||||||||||||
| Net cash provided by continuing operating activities | $ | 52,311 | $ | 273,564 | $ | 119,898 | $ | 17,201 | $ | 1,319 | $ | 464,293 | ||||||||
| Net cash used in discontinued operating activities | — | — | — | (504) | — | (504) | ||||||||||||||
| Cash flows from investing activities: | ||||||||||||||||||||
| Purchase of property and equipment | — | (7,351) | — | (1,316) | — | (8,667) | ||||||||||||||
| Originations of loans, net | — | (261,073) | (102,238) | (11,042) | — | (374,353) | ||||||||||||||
| Investments in Katapult | — | (8,168) | — | — | — | (8,168) | ||||||||||||||
| Net cash used in continuing investing activities | — | (276,592) | (102,238) | (12,358) | — | (391,188) | ||||||||||||||
| Net cash used in discontinued investing activities | — | — | — | (14,213) | — | (14,213) | ||||||||||||||
| Cash flows from financing activities: | ||||||||||||||||||||
| Proceeds from Non-Recourse Canada SPV facility | — | — | 15,992 | — | — | 15,992 | ||||||||||||||
| Payments on Non-Recourse Canada SPV facility | — | — | (24,835) | — | — | (24,835) | ||||||||||||||
| Proceeds from credit facilities | — | 120,000 | — | 59,811 | — | 179,811 | ||||||||||||||
| Payments on credit facilities | — | (115,000) | — | (59,811) | — | (174,811) | ||||||||||||||
| Payments on subordinated stockholder debt | — | — | — | (2,252) | — | (2,252) | ||||||||||||||
| Proceeds from exercise of stock options | — | 87 | — | — | — | 87 | ||||||||||||||
| Payments to net share settle RSUs | (110) | — | — | — | — | (110) | ||||||||||||||
| Debt issuance costs paid | (29) | — | (169) | — | — | (198) | ||||||||||||||
| Repurchase of common stock | (52,172) | — | — | — | — | (52,172) | ||||||||||||||
Net cash used in provided by financing activities (1) | (52,311) | 5,087 | (9,012) | (2,252) | — | (58,488) | ||||||||||||||
| Effect of exchange rate changes on cash, cash equivalents and restricted cash | — | — | 409 | 2,114 | (1,319) | 1,204 | ||||||||||||||
| Net increase (decrease) in cash, cash equivalents and restricted cash | — | 2,059 | 9,057 | (10,012) | — | 1,104 | ||||||||||||||
| Cash, cash equivalents and restricted cash at beginning of period | — | 52,397 | 12,840 | 34,620 | — | 99,857 | ||||||||||||||
| Cash, cash equivalents and restricted cash at end of period | $ | — | $ | 54,456 | $ | 21,897 | $ | 24,608 | $ | — | $ | 100,961 | ||||||||
| (1) Financing activities include continuing operations only and were not impacted by discontinued operations. | ||||||||||||||||||||
72
Cash Flows
The following highlights our cash flow activity and the sources and uses of funding during the periods indicated (in thousands):
| Nine Months Ended September 30, | ||||||||||||||
| 2020 | 2019 | |||||||||||||
| Net cash provided by operating activities from continuing operations | $ | 309,746 | $ | 464,293 | ||||||||||
| Net cash used in investing activities from continuing operations | (147,894) | (391,188) | ||||||||||||
| Net cash used in financing activities from continuing operations | (3,732) | (58,488) | ||||||||||||
| Nine Months Ended September 30, | ||||||||
| 2019 | 2018 | |||||||
| Net cash provided by continuing operating activities | $ | 464,293 | $ | 357,079 | ||||
| Net cash used in continuing investing activities | (391,188 | ) | (421,423 | ) | ||||
| Net cash (used in) provided by continuing financing activities | (58,488 | ) | 90,449 | |||||
Net cash provided by continuing operating activities from continuing operations for the nine months ended September 30, 2020 was $309.7 million, primarily attributable to net income from continuing operations of $70.0 million the effect of non-cash reconciling items of $256.2 million, partially offset by changes in our operating assets and liabilities of $16.4 million. Our non-cash reconciling items of $256.2 million included (i) provision for loan losses of $219.0 million, (ii) changes in deferred income tax of $14.2 million and (iii) $13.3 million of depreciation and amortization. Our changes in operating assets and liabilities of $16.4 million related to a higher income tax receivable of $23.8 million and $14.1 million of lower accrued interest on our 8.25% Senior Secured Notes, partially offset by a $26.6 million decline in accrued interest on our gross loans receivable due to overall volume decline, as previously discussed.
Net cash provided by operating activities from continuing operations for the nine months ended September 30, 2019 was $464.3 million, primarily attributable to net income from continuing operations of $74.3 million, the effect of non-cash reconciling items of $364.3 million, which includes provision for loan losses of $338.3 million, and changes in our operating assets and liabilities which provided $25.6 million.
Investing Activities from Continuing Operations
Net cash provided byused in investing activities from continuing operating activitiesoperations for the nine months ended September 30, 20182020 was $357.1 million. Contributing$147.9 million, primarily reflecting (i) the net origination of loans of $114.9 million, (ii) the acquisition of Ad Astra for $14.4 million, net of cash received, and (iii) $11.2 million of additional equity interests in Katapult. In addition, we used cash to current year net cash provided by continuing operating activities non-cash reconciling items, such as depreciationpurchase $7.4 million of property and amortization, provision for loan losses and loss on extinguishment of debt for a total of $398.1 million. Contributions from non-cash reconciling items were offset by changes in our operating assets and liabilities of $42.1 million.equipment.
Net cash used in continuing investing activities from continuing operations for the nine months ended September 30, 2019 was $391.2 million, primarily reflecting the net origination of loans of $374.4 million. In addition, we used cash to purchase approximately $8.7 million of property and equipment, including software licenses and $8.2 million of additional investmentequity interests in Zibby.Katapult.
Origination of loans will fluctuate from period-to-period, depending on the timing of loan issuances and collections. A seasonal decline in consumer loans receivable typically occurs during the first quarter of the year and is driven by income tax refunds in the U.S. Typically, customers will use the proceeds from income tax refunds to pay outstanding loan balances, resulting in an increase in our net cash balances and a decrease in our consumer loans receivable balances. ConsumerYear-over-year comparisons were impacted by factors related to COVID-19, including lower consumer demand, increased or accelerated repayments as customers benefited from government stimulus programs and our decision to tighten credit which resulted in lower originations, as well as the runoff of California Installment loans receivable balances typically reflect growth during the remainder of the year.from regulatory changes effective January 1, 2020.
Net cash used in continuing financing activities from continuing operations for the nine months ended September 30, 2020 was $3.7 million, primarily due to $35.2 million of proceeds on our Non-Recourse U.S. SPV Facility, partially offset by a net pay-down on our Non-Recourse Canada SPV Facility of $18.8 million, common stock repurchases of $5.9 million, cash dividends of $6.8 million and debt issuance costs of $7.0 million related to the Non-Recourse U.S. SPV Facility.
Net cash used in financing activities from continuing operations for the nine months ended September 30, 2019 was $58.5 million, primarily due to (i) $27.1 million of cash used to repurchase 2,000,000 shares of our common stock, at a price of $13.55 per share, owned by FFL and (ii) $25.1 million of cash used to repurchase 2,089,644 shares of our common stock under the share repurchase program which began during the second quarter of 2019.
73
Contractual Obligations
There have been no significant developments with respect to our contractual obligations since December 31, 2018,2019, as described in our 20182019 Form 10-K, except for the Non-Recourse U.S. SPV Facility in April 2020. Refer to Note 5, "Debt" of the Notes to the unaudited Condensed Consolidated Financial Statements for additional details.
Critical Accounting Policies and Estimates
Certain accounting policies that involve a higher degree of judgement and complexity are discussed further in Part II - Item 7, Management's Discussion and Analysis of Financial Condition and Results of Operations—Critical Accounting Policies and Estimates, in our 2019 Form 10-K.
Goodwill. We exercise judgment in evaluating assets for impairment. Goodwill is tested for impairment annually, or when circumstances arise which could more likely than not reduce the fair value of a reporting unit below its carrying value. These tests require comparing carrying values to estimated fair values of the reporting unit under review.
The U.S. and Canada operations are our two reporting units, as defined by FASB’s ASC 280, Segment Reporting, for which we assess goodwill for impairment. As of the most recent annual goodwill impairment testing date (October 1, 2019), both reporting units' estimated fair values exceeded their carrying value. As described in our 2019 Form 10-K, an impairment would occur if the carrying amount of a reporting unit exceeded the fair value of that reporting unit. Events or circumstances that could indicate an impairment include a significant change in the business climate, a change in strategic direction, legal factors, operating performance indicators, a change in the competitive environment, the sale or disposition of a significant portion of a reporting unit or economic outlook. These and other macroeconomic factors were considered when performing the annual test as of October 1, 2019.
For the three months ended September 30, 2020, we reviewed goodwill for triggering events that would indicate a need for an interim quantitative or qualitative assessment of goodwill impairment. As a result of the review, no additional assessment was deemed necessary, and thus there was no goodwill impairment for either reporting unit.
There continues to be uncertainty surrounding macroeconomic factors that could impact the U.S. and Canada reporting units. Changes in the expected length of the current economic downturn, timing of recovery, or long-term revenue growth or profitability for these reporting units could increase the likelihood of a future goodwill impairment. Additionally, changes in market participant assumptions such as an increased discount rate or further share price reductions could increase the likelihood of a future impairment.
The following table summarizes the segment allocation of recorded goodwill on our unaudited Condensed Consolidated Balance Sheets as of September 30, 2020:
| (in thousands) | September 30, 2020 | Percent of Total | December 31, 2019 | Percent of Total | |||||||||||||
| U.S. | $ | 105,922 | 78.7 | % | $ | 91,131 | 75.6 | % | |||||||||
| Canada | 28,667 | 21.3 | % | 29,478 | 24.4 | % | |||||||||||
| Total Goodwill | $ | 134,589 | $ | 120,609 | |||||||||||||
Regulatory Environment and Compliance
There have been no significant developments with respect to our regulatory environment and compliance since December 31, 2018,2019, as described in our 20182019 Form 10-K and our Quarterly Report on Form 10-Q filed with the SEC on August 5, 2020, except for the following:
CFPB Rulemaking Update
74
pending industry legal challenge. The parties infinal filing date set by the litigation are requiredCourt is December 18, 2020, when the CFPB is scheduled to file a Joint Status Report withits reply in support of its cross-motion for summary judgment. In light of the court no later than December 6, 2019.
Additionally, in 2016, the CFPB issued an outline of proposals intended to increase consumer protection pertaining to third-party debt collectors and others covered by the Fair Debt Collection Practices Act (“FDCPA”). These proposals would apply to the Court Order. Under the proposed "Payment Provisions":
California Consumer Privacy Act
In 2018, the 2017 Final Rule nevertheless treats card authorization requestsCalifornia Consumer Privacy Act was passed into law, effective January 1, 2020, and the California Attorney General has enforcement authority as payment attempts subject to these limitations.of July 1, 2020.
A lender generally must give the consumer at least three business days advance notice before attempting to collect paymentstate ballot initiative, which would have additional impact, will be decided by accessing a consumer’s checking, savings, or prepaid account. The notice must include information such as the date of the payment request, payment channel and payment amount (broken down by principal, interest, fees, and other charges), as well as additional information for “unusual attempts,” such as when the payment is for a different amount than the regular payment, initiated on a date other than the date of a regularly scheduled payment or initiatedvote in a different channel that the immediately preceding payment attempt. A lender must also provide the borrower with a "consumer rights notice" in a prescribed form after two consecutive failed payment attempts.November 2020.
ITEM 3. QUANTITATIVE AND QUALITATIVE DISCLOSURES ABOUT MARKET RISK
For quantitative and qualitative disclosures about our market risks, see "Quantitative and Qualitative Disclosures about Market Risk" in our 20182019 Form 10-K and our Quarterly Report on Form 10-Q for the yearquarter ended December 31, 2018.June 30, 2020. There have been no material changes to the amountsquantitative and qualitative information presented therein.
ITEM 4. CONTROLS AND PROCEDURES
Disclosure controls and procedures
We maintain disclosure controls and procedures designed to ensure that information required to be disclosed in the reports we file or submit under the Securities Exchange Act of 1934 (the “Exchange Act”) is recorded, processed, summarized and reported within the time periods specified in the SEC’s rules and forms, including without limitation, controls and procedures designed to ensure that information required to be disclosed in reports we file under the Exchange Act is accumulated and communicated to our management, including the Chief Executive Officer and Chief Financial Officer, as appropriate to allow timely decisions regarding required disclosure.
Any controls and procedures, no matter how well designed and operated, can provide only reasonable assurance of achieving the desired control objective and management necessarily applies its judgment in evaluating the cost-benefit relationship of possible controls and procedures. Based on an evaluation of our disclosure controls and procedures as disclosed in Item 9A of our 2018 Form 10-K,the end of the period covered by this report conducted by our management, concluded that our internal control over financial reporting was not effective at December 31, 2018 becausewith the participation of the identification of a material weakness. A material weakness is a deficiency, or a combination of deficiencies, in internal control over financial reporting, such that there is a reasonable possibility that a material misstatement ofChief Executive Officer and Chief Financial Officer, the Company’s annual or interim financial statements will not be prevented or detected on a timely basis.
Limitation on the effectiveness of controls
Our management, including our Chief Executive Officer and Chief Financial Officer, does not expect that our disclosure controls or our internal control over financial reporting will prevent or detect all errors and all fraud. Any controls and procedures, no matter how well designed and operated, can provide only reasonable assurance of achieving the desired control objective and management necessarily applies its judgment in evaluating the cost-benefit relationship of possible controls and procedures. A
control system also can be circumvented by collusion or improper management override. Because of such limitations, disclosure controls and internal control over financial reporting cannot prevent or detect all misstatements, whether unintentional errors or fraud. However, these inherent limitations are known features of the financial reporting process, therefore, it is possible to design into the process safeguards to reduce, though not eliminate, this risk.
Internal control over financial reporting
There were no changes in our internal control over financial reporting (as defined in Rules 13a-15(e) and 15d-15(e) under the Exchange Act) during the three months ended September 30, 2020, that have materially affected, or are reasonably likely to materially affect, our internal control over financial reporting.
75
PART II. OTHER INFORMATION
Item 1. Legal Proceedings
The information required by this item is included in Note 13 - "Contingent Liabilities"13, "Commitments and Contingencies" of the Notes to the unaudited Condensed Consolidated Financial Statements in this Form 10-Q and is incorporated herein by reference.
Item 1A. Risk Factors
The failure to comply with debt collection regulations, or the failure of our third-party collection agencies to comply with debt collection regulations, could subject us to fines and other liabilities, which could harm our reputation and business.
In January 2020, we acquired Ad Astra, our exclusive provider of third-party collection services for our U.S. operations. The FDCPA regulates persons who regularly collect or attempt to collect, directly or indirectly, consumer debts owed or asserted to be owed to another person. Many states impose additional requirements on debt collection communications, and some of those requirements may be more stringent than the federal requirements. Moreover, regulations governing debt collection are subject to changing interpretations that differ from jurisdiction to jurisdiction. We have used in the past, and may continue to use in the future, third-party collections agencies to collect on debts incurred by consumers of our credit products. Regulatory changes could make it more difficult for us and collections agencies to effectively collect on the loans we originate.
In 2016, the CFPB issued the 2016 CFPB Outline intended to increase consumer protection pertaining to third-party debt collectors and others covered by the FDCPA. The 2016 CFPB Outline would apply to the attempts of our third-party collection agenc(ies) to collect debt originated by other lenders, including under our CSO programs. The proposals would not apply to our risk factorsattempts to collect debt that we originate; however, the CFPB has announced that it plans to address consumer protection issues involving first-party debt collectors and creditors separately. The final rule addressing third-party debt collections and others covered by the FDCPA was released on October 30, 2020. Given that these final rules were released on the same date as described in our 2018this Form 10-K for10-Q, we are still reviewing the year ended December 31, 2018, except forfinal rules. As such, we have not yet determined what effect the following:
A change in the United States' presidential administration and/or composition of Congress in the upcoming 2020 election could result in new legislation, rules and financial conditionregulatory and enforcement policies with an adverse impact on our business.
On June 29, 2020, in Seila Law LLC v. CFPB, the U.S. Supreme Court ruled that the single-director structure of the CFPB is unconstitutional. The Court noted the agency's structure vests too much power in the hands of one person, and that a president has broad constitutional authority to appoint and remove agency heads (with or without cause). In the event a president appoints a director who has a negative view of our business and/or industry, the Seila ruling could have far-reaching implications to our business. Similarly, changes in the presidential administration and/or composition of Congress more generally as a result of this bill and alternatives available to service customers in the California market. If we are unsuccessful in managing the transition of our California business and operations from affected installment loans to existing and alternative products, Assembly Bill 539November 2020 U.S. elections could have a material adverse effect on our business and results of operations.
Item 2. Unregistered Sales of Equity Securities and Use of Proceeds
| Period | Total Number of Shares Purchased | Average Price Paid Per Share | Total Number of Shares Purchased as Part of Publicly Announced Plans or Programs | Dollar Value of Shares that may yet be Purchased under the Plans or Programs(1) (In millions) | ||||||
| July 2019 | 907,500 | $ | 10.68 | 907,500 | $ | 37.8 | ||||
| August 2019 | 611,694 | 13.33 | 611,694 | 29.6 | ||||||
| September 2019 | 392,847 | 14.28 | 392,847 | 24.0 | ||||||
| Total | 1,912,041 | $ | 12.27 | 1,912,041 | $ | 24.0 | ||||
| (1) As of the end of the period. | ||||||||||
Item 3. Defaults Upon Senior Securities
None.
Item 4. Mine Safety Disclosures
None.
Item 5. Other Information
(a) Disclosure of Unreported 8-K Information
(b) Material Changes to Director Nominee Procedures
None.
Item 6. Exhibits
| Exhibit no. | Exhibit Description | Filed/Incorporated by Reference from Form | Incorporated by Reference from Exhibit Number | Filing Date | |||||||||||||
| 3.1 | 10-Q | 10.1 | 8/5/2020 | ||||||||||||||
| 3.2 | 8-K | 3.2 | 12/11/17 | ||||||||||||||
| 4.1 | S-1 | 4.1 | 11/28/17 | ||||||||||||||
| 4.2 | S-1 | 4.2 | 11/28/17 | ||||||||||||||
| 4.3 | S-1 | 4.3 | 10/24/17 | ||||||||||||||
| 4.4 | 10-K | 4.4 | 3/9/20 | ||||||||||||||
| 31.1 | Filed herewith | ||||||||||||||||
| 31.2 | Filed herewith | ||||||||||||||||
| 32.1 | Filed herewith | ||||||||||||||||
| 101 | The following unaudited financial information from the Company's Quarterly Report on Form 10-Q for the period ended September 30, 2020, filed with the SEC on November 4, 2020, formatted in Extensible Business Reporting Language (“XBRL”) includes: (i) Condensed Consolidated Balance Sheets at September 30, 2020 and December 31, 2019, (ii) Condensed Consolidated Statements of Operations for the three and nine months ended September 30, 2020 and 2019, (iii) Condensed Consolidated Statements of Comprehensive Income for the three and nine months ended September 30, 2020 and 2019, (iv) Condensed Consolidated Statements of Cash Flows for the nine months ended September 30, 2020 and 2019, and (v) Notes to Condensed Consolidated Financial Statements* | Filed herewith | |||||||||||||||
78
Signature
Pursuant to the requirements of Section 13 or 15(d) of the Securities Exchange Act of 1934, the Company has duly caused this report to be signed on its behalf by the undersigned, thereunto duly authorized.
Dated: November 4, 2019October 30, 2020 CURO Group Holdings Corp.
| By: | /s/ Roger Dean | ||||||||||
| Roger Dean | |||||||||||
| Executive | |||||||||||
79