P1YP1YP1YP1YP1YP6MP6MP1YP1YP1Y171300000P3Y6M515false--12-31Q2201900017175471798000208300027130004556000000.1450.1450.1450.1450.1450.1450.290.440.150.440.440.0145000000905000000044399444834103760128545190443994448341037601285451900.01160.01160.01280.01100.020.01650.01900.01910.02240.02500.02950.02150.02500.040.03000.03330.0225P7YP1MP1MP2Y58560000034154800088000000000300000101000000.010.0150000000000P48YP8YP15YP7YP2YP1Y1103000000
UNITED STATES
SECURITIES AND EXCHANGE COMMISSION
Washington, D.C. 20549
FORM 10-Q
|
| |
ý☒ | QUARTERLY REPORT PURSUANT TO SECTION 13 OR 15(d) OF THE SECURITIES EXCHANGE ACT OF 1934 |
For the quarterly period ended June 30, 20182019
OR
|
| |
o☐ | TRANSITION REPORT PURSUANT TO SECTION 13 OR 15(d) OF THE SECURITIES EXCHANGE ACT OF 1934 |
Commission File Number: 001-38377
|
| | | | |
| | COLONY CREDIT REAL ESTATE, INC. | |
| (Exact Name of Registrant as Specified in Its Charter) | |
| | | | | |
| | Maryland | | 38-4046290 | |
| | (State or Other Jurisdiction of Incorporation or Organization) | | (I.R.S. Employer Identification No.) | |
515 S. Flower Street, 44th Floor
Los Angeles, CA90071
(Address of Principal Executive Offices, Including Zip Code)
(310) (310) 282-8820
(Registrant’s Telephone Number, Including Area Code)
Securities registered pursuant to Section 12(b) of the Act:
|
| | | | |
| Title of each class | | Trading Symbol(s) | | Name of each exchange on which registered |
| Class A common stock, par value $0.01 per share | CLNC | New York Stock Exchange |
Indicate by check mark whether the registrant (1) has filed all reports required to be filed by Section 13 or 15(d) of the Securities Exchange Act of 1934 during the preceding 12 months (or for such shorter period that the registrant was required to file such reports), and (2) has been subject to such filing requirements for the past 90 days. Yes ý☒ No o☐
Indicate by check mark whether the registrant has submitted electronically and posted on its corporate Web site, if any, every Interactive Data File required to be submitted and posted pursuant to Rule 405 of Regulation S-T (§232.405 of this chapter) during the preceding 12 months (or for such shorter period that the registrant was required to submit and post such files). Yes ý☒ No o☐
Indicate by check mark whether the registrant is a large accelerated filer, an accelerated filer, a non-accelerated filer, smaller reporting company, or an emerging growth company. See the definitions of “large accelerated filer,” “accelerated filer,” “smaller reporting company,” and “emerging growth company” in Rule 12b-2 of the Exchange Act. (Check one): |
| | | | | | | |
Large accelerated filero | ☒ | Accelerated filer | ☐ | Non-accelerated filer | ☐ | Smaller reporting company | ☐ |
| | Accelerated filer o
| | Non-accelerated filer ý
(Do not check if a
smaller reporting company)
| | Smaller reporting company o
Emerging growth companyý | ☐ |
If an emerging growth company, indicate by check mark if the registrant has elected not to use the extended transition period for complying with any new or revised financial accounting standards provided pursuant to Section 13(a) of the Exchange Act. o☐
Indicate by check mark whether the registrant is a shell company (as defined in Rule 12b-2 of the Exchange Act). Yes o☐ No ý☐
Indicate the number of shares outstanding of each of the registrant’s classes of common stock, as of the latest practicable date:
As of August 8, 2018,7, 2019, Colony Credit Real Estate, Inc. had 83,487,352128,540,053 shares of Class A common stock, par value $0.01 per share, and 44,399,444 shares of Class B-3 common stock, par value $0.01 per share, outstanding.
EXPLANATORY NOTE
This Quarterly Report on Form 10-Q of Colony Credit Real Estate, Inc., a Maryland corporation (the “Company”), includes the financial statements and other financial information of (i) the Company and (ii) the Company’s accounting predecessor, which are investment entities in which Colony Capital Operating Company, LLC (“CLNY OP”) or its subsidiaries owned interests ranging from approximately 38% to 100% and that were contributed to the Company on January 31, 2018 in connection with the closing of the Combination (as defined below) and certain intercompany balances between those entities and CLNY OP or its subsidiaries (the “CLNY Investment Entities”).
On January 31, 2018, the Company completed the transactions contemplated by that certain Master Combination Agreement, dated as of August 25, 2017, as amended and restated on November 20, 2017 (the “Combination Agreement”), by and among (i) the Company, (ii) Credit RE Operating Company, LLC, a Delaware limited liability company and wholly-owned subsidiary of the Company (the “OP”), (iii) CLNY OP, a Delaware limited liability company and the operating company of Colony Capital, Inc., formerly Colony NorthStar, Inc. (“Colony Capital”), a Maryland corporation, (iv) NRF RED REIT Corp., a Maryland corporation and indirect subsidiary of CLNY OP (“RED REIT”), (v) NorthStar Real Estate Income Trust, Inc., a Maryland corporation (“NorthStar I”), (vi) NorthStar Real Estate Income Trust Operating Partnership, LP, a Delaware limited partnership and the operating partnership of NorthStar I (“NorthStar I OP”), (vii) NorthStar Real Estate Income II, Inc., a Maryland corporation (“NorthStar II”), and (viii) NorthStar Real Estate Income Operating Partnership II, LP, a Delaware limited partnership and the operating partnership of NorthStar II (“NorthStar II OP”).
Pursuant to the Combination Agreement, (i) CLNY OP contributed and conveyed to the Company a select portfolio of assets and liabilities (the “CLNY Contributed Portfolio”) of CLNY OP (the “CLNY OP Contribution”), (ii) RED REIT contributed and conveyed to the OP a select portfolio of assets and liabilities of RED REIT (the “RED REIT Contribution” and, together with the CLNY OP Contribution, the “CLNY Contributions”), (iii) NorthStar I merged with and into the Company, with the Company surviving the merger (the “NorthStar I Merger”), (iv) NorthStar II merged with and into the Company, with the Company surviving the merger (the “NorthStar II Merger” and, together with the NorthStar I Merger, the “Mergers”), and (v) immediately following the Mergers, the Company contributed and conveyed to the OP the CLNY Contributed Portfolio and the equity interests of each of NorthStar I OP and NorthStar II OP then-owned by the Company in exchange for units of membership interest in the OP (the “Company Contribution” and, collectively with the Mergers and the CLNY Contributions, the “Combination”). To satisfy the condition to completion of the Combination that the Company’s Class A common stock, par value $0.01 per share (the “Class A common stock”), be approved for listing on a national securities exchange in connection with either an initial public offering or a listing, the Class A common stock was approved for listing by the New York Stock Exchange and began trading under the ticker “CLNC” on February 1, 2018.
The CLNY Contributions were accounted for as a reorganization of entities under common control, since both the Company and CLNY Investment Entities were under common control of Colony Capital at the time the contributions were made. Accordingly, the Company’s financial statements for prior periods were recast to reflect the consolidation of the CLNY Investment Entities as if the contribution had occurred on the date of the earliest period presented.
As used throughout this document, the terms the “Company,” “we,” “our” and “us” mean:
Colony Credit Real Estate, Inc. and the consolidated CLNY Investment Entities for periods on or prior to the closing of the Combination on January 31, 2018; and
The combined operations of Colony Credit Real Estate, Inc., NorthStar I and NorthStar II beginning February 1, 2018, following the closing of the Combination.
Accordingly, comparisons of the period to period financial information of the Company as set forth herein may not be meaningful because the CLNY Investment Entities represents only a portion of the assets and liabilities Colony Credit Real Estate, Inc. acquired in the Combination and does not reflect any potential benefits that may result from realization of future cost savings from operating efficiencies, or other incremental synergies expected to result from the Combination.
In addition to the financial statements contained herein, you should read and consider the audited financial statements and accompanying notes thereto of the Company and the CLNY Investment Entities for the year ended December 31, 20172018 included in our Form 10-K filed with the U.S. Securities and Exchange Commission (the “SEC”) on March 23, 2018 and the audited financial statements and accompanying notesFebruary 28, 2019.
COLONY CREDIT REAL ESTATE, INC.
FORM 10-Q
TABLE OF CONTENTS
Special Note Regarding Forward-Looking Statements
This Quarterly Report on Form 10-Q may contain forward-looking statements within the meaning of the federal securities laws. Forward-looking statements relate to expectations, beliefs, projections, future plans and strategies, anticipated events or trends and similar expressions concerning matters that are not historical facts. In some cases, you can identify forward-looking statements by the use of forward-looking terminology such as “may,” “will,” “should,” “expects,” “intends,” “plans,” “anticipates,” “believes,” “estimates,” “predicts,” or “potential” or the negative of these words and phrases or similar words or phrases which are predictions of or indicate future events or trends and which do not relate solely to historical matters. Forward-looking statements involve known and unknown risks, uncertainties, assumptions and contingencies, many of which are beyond our control, and may cause actual results to differ significantly from those expressed in any forward-looking statement. Among others, the following uncertainties and other factors could cause actual results to differ from those set forth in the forward-looking statements:
operating costs and business disruption may be greater than expected;
the fair value of our investments may be subject to uncertainties;
changes in market and economic conditions may adversely impact the commercial real estate sector and our investments;
our use of leverage could hinder itsour ability to make distributions and may significantly impact our liquidity position;
given our dependence on our external manager, an affiliate of Colony Capital, any adverse changes in the financial health or otherwise of our manager or Colony Capital could hinder our operating performance and return on stockholder’s investment;
our external manager may not be successful in locating or allocating suitable investments;
our external manager may be unable to retain or hire key investment professionals;
we may be unable to realize substantial efficiencies as well as anticipated strategic and financial benefits from the Combination;
we may be unable to maintain our qualification as a real estate investment trust for U.S. income tax purposes;
we may be unable to maintain our exemption from registration as an investment company under the Investment Company Act of 1940, as amended; and
changes in laws or regulations governing our operations may impose additional costs on us or increase competition.
The foregoing list of factors is not exhaustive. We urge you to carefully review the disclosures we make concerning risks in the sections entitled “Risk Factors” in our Annual Report on Form 10-K for the year ended December 31, 20172018, the section entitled “Risk Factors” in this Form 10-Q for the quarter ended June 30, 2019 and “Management’s Discussion and Analysis of Financial Condition and Results of Operations” herein.
We caution investors not to unduly rely on any forward-looking statements. The forward-looking statements speak only as of the date of this Quarterly Report on Form 10-Q. The Company is under no duty to update any of these forward-looking statements after the date of this Quarterly Report on Form 10-Q, nor to conform prior statements to actual results or revised expectations, and the Company does not intend to do so.
PART I. Financial Information
Item 1. Financial Statements
COLONY CREDIT REAL ESTATE, INC.
CONSOLIDATED BALANCE SHEETS
(in Thousands, Except Share and Per Share Data)
|
| | | | | | | |
| | June 30, 2019 (Unaudited) | | December 31, 2018 |
| Assets | | | |
| Cash and cash equivalents | $ | 59,838 |
| | $ | 77,317 |
|
| Restricted cash | 114,127 |
| | 110,146 |
|
| Loans and preferred equity held for investment, net | 2,398,191 |
| | 2,020,497 |
|
| Real estate securities, available for sale, at fair value | 249,100 |
| | 228,185 |
|
| Real estate, net | 1,898,299 |
| | 1,959,690 |
|
| Investments in unconsolidated ventures ($53,893 and $160,851 at fair value, respectively) | 719,307 |
| | 903,037 |
|
| Receivables, net | 47,229 |
| | 48,806 |
|
| Deferred leasing costs and intangible assets, net | 143,521 |
| | 134,068 |
|
| Assets held for sale | 147,707 |
| | — |
|
| Other assets | 87,209 |
| | 62,006 |
|
| Mortgage loans held in securitization trusts, at fair value | 3,175,950 |
| | 3,116,978 |
|
| Total assets | $ | 9,040,478 |
| | $ | 8,660,730 |
|
| Liabilities | | | |
| Securitization bonds payable, net | $ | 23,377 |
| | $ | 81,372 |
|
| Mortgage and other notes payable, net | 1,257,915 |
| | 1,173,019 |
|
| Credit facilities | 1,808,790 |
| | 1,365,918 |
|
| Due to related party (Note 11) | 13,844 |
| | 15,019 |
|
| Accrued and other liabilities | 133,551 |
| | 106,187 |
|
| Intangible liabilities, net | 31,367 |
| | 15,096 |
|
| Escrow deposits payable | 63,146 |
| | 65,995 |
|
| Dividends payable | 19,088 |
| | 18,986 |
|
| Mortgage obligations issued by securitization trusts, at fair value | 3,026,282 |
| | 2,973,936 |
|
| Total liabilities | 6,377,360 |
| | 5,815,528 |
|
| Commitments and contingencies (Note 17) |
| |
|
| Equity | | | |
| Stockholders’ equity | | | |
| Preferred stock, $0.01 par value, 50,000,000 shares authorized, no shares issued and outstanding as of June 30, 2019 and December 31, 2018, respectively | — |
| | — |
|
| Common stock, $0.01 par value per share | | | |
| Class A, 950,000,000 and 905,000,000 shares authorized, 128,545,190 and 83,410,376 shares issued and outstanding as of June 30, 2019 and December 31, 2018, respectively | 1,285 |
| | 834 |
|
| Class B-3, no shares authorized, issued and outstanding as of June 30, 2019 and 45,000,000 shares authorized and 44,399,444 shares issued and outstanding as of December 31, 2018 | — |
| | 444 |
|
| Additional paid-in capital | 2,903,126 |
| | 2,899,353 |
|
| Accumulated deficit | (397,398 | ) | | (193,327 | ) |
| Accumulated other comprehensive income (loss) | 25,547 |
| | (399 | ) |
| Total stockholders’ equity | 2,532,560 |
| | 2,706,905 |
|
| Noncontrolling interests in investment entities | 69,948 |
| | 72,683 |
|
| Noncontrolling interests in the Operating Partnership | 60,610 |
| | 65,614 |
|
| Total equity | 2,663,118 |
| | 2,845,202 |
|
| Total liabilities and equity | $ | 9,040,478 |
| | $ | 8,660,730 |
|
|
| | | | | | | |
| | June 30, 2018 (Unaudited) | | December 31, 2017 |
| Assets | | | |
| Cash and cash equivalents | $ | 155,377 |
| | $ | 25,204 |
|
| Restricted cash | 116,466 |
| | 41,901 |
|
| Loans and preferred equity held for investment, net | 2,079,134 |
| | 1,300,784 |
|
| Real estate securities, available for sale, at fair value | 198,151 |
| | — |
|
| Real estate, net | 1,485,557 |
| | 219,740 |
|
| Investments in unconsolidated ventures ($241,453 and $24,417 at fair value, respectively) | 731,642 |
| | 203,720 |
|
| Receivables, net | 35,861 |
| | 35,512 |
|
| Deferred leasing costs and intangible assets, net | 102,426 |
| | 11,014 |
|
| Other assets | 95,215 |
| | 1,527 |
|
| Mortgage loans held in securitization trusts, at fair value | 3,154,112 |
| | — |
|
| Total assets | $ | 8,153,941 |
| | $ | 1,839,402 |
|
| Liabilities | | | |
| Securitization bonds payable, net | $ | 126,256 |
| | $ | 108,679 |
|
| Mortgage and other notes payable, net | 884,729 |
| | 280,982 |
|
| Credit facilities | 800,545 |
| | — |
|
| Due to related party (Note 11) | 14,513 |
| | — |
|
| Accrued and other liabilities | 46,814 |
| | 5,175 |
|
| Intangible liabilities, net | 17,789 |
| | 36 |
|
| Escrow deposits payable | 71,529 |
| | 36,960 |
|
| Dividends payable | 18,993 |
| | — |
|
| Mortgage obligations issued by securitization trusts, at fair value | 3,010,636 |
| | — |
|
| Total liabilities | 4,991,804 |
| | 431,832 |
|
| Commitments and contingencies |
| |
|
| Equity | | | |
| Stockholders’ equity | | | |
| Preferred stock, $0.01 par value, 50,000,000 shares authorized, no shares issued and outstanding as of June 30, 2018 and December 31, 2017 | — |
| | — |
|
| Common stock, $0.01 par value per share | | | |
| Class A, 905,000,000 shares authorized, 83,487,352 and 100 shares issued and outstanding as of June 30, 2018 and December 31, 2017, respectively | 835 |
| | — |
|
| Class B-3, 45,000,000 shares authorized, 44,399,444 and no shares issued and outstanding as of June 30, 2018 and December 31, 2017, respectively | 444 |
| | — |
|
| Additional paid-in capital | 2,896,695 |
| | 821,031 |
|
| Retained earnings | 97,715 |
| | 258,777 |
|
| Accumulated other comprehensive loss | (2,778 | ) | | — |
|
| Total stockholders’ equity | 2,992,911 |
| | 1,079,808 |
|
| Noncontrolling interests in investment entities | 96,953 |
| | 327,762 |
|
| Noncontrolling interests in the Operating Partnership | 72,273 |
| | — |
|
| Total equity | 3,162,137 |
| | 1,407,570 |
|
| Total liabilities and equity | $ | 8,153,941 |
| | $ | 1,839,402 |
|
The accompanying notes are an integral part of these consolidated financial statements.
COLONY CREDIT REAL ESTATE, INC.
CONSOLIDATED BALANCE SHEETS
(in Thousands)
The following table presents assets and liabilities of securitization trusts and certain real estate properties that have noncontrolling interests as variable interest entities for which the Company is determined to be the primary beneficiary.
| | | | June 30, 2018 (Unaudited) | | December 31, 2017 | June 30, 2019 (Unaudited) | | December 31, 2018 |
| Assets | | | | | | |
| Cash and cash equivalents | $ | 13,500 |
| | $ | 1,320 |
| $ | 13,154 |
| | $ | 12,561 |
|
| Restricted cash | 21,190 |
| | 24,928 |
| 19,160 |
| | 18,464 |
|
| Loans and preferred equity held for investment, net | 187,666 |
| | 379,305 |
| 31,430 |
| | 167,219 |
|
| Real estate, net | 730,087 |
| | 8,073 |
| 572,160 |
| | 547,444 |
|
| Receivables, net | 18,497 |
| | 11,994 |
| 21,567 |
| | 17,811 |
|
| Deferred leasing costs and intangible assets, net | 61,773 |
| | — |
| 55,015 |
| | 38,681 |
|
| Assets held for sale | | 76,076 |
| | — |
|
| Other assets | 2,826 |
| | 38 |
| 28,260 |
| | 1,698 |
|
| Mortgage loans held in securitization trusts, at fair value | 3,154,112 |
| | — |
| 3,175,950 |
| | 3,116,978 |
|
| Total assets | $ | 4,189,651 |
| | $ | 425,658 |
| $ | 3,992,772 |
| | $ | 3,920,856 |
|
| Liabilities | | | | | | |
| Securitization bonds payable, net | $ | 45,439 |
| | $ | 108,679 |
| $ | 23,377 |
| | $ | 43,870 |
|
| Mortgage and other notes payable, net | 423,945 |
| | — |
| 343,495 |
| | 325,187 |
|
| Credit facilities | | 28,722 |
| | — |
|
| Accrued and other liabilities | 29,306 |
| | 3,764 |
| 32,600 |
| | 32,452 |
|
| Intangible liabilities, net | 14,037 |
| | — |
| 28,904 |
| | 11,993 |
|
| Escrow deposits payable | 10,307 |
| | 24,928 |
| 7,016 |
| | 9,603 |
|
| Mortgage obligations issued by securitization trusts, at fair value | 3,010,636 |
| | — |
| 3,026,282 |
| | 2,973,936 |
|
| Total liabilities | $ | 3,533,670 |
| | $ | 137,371 |
| $ | 3,490,396 |
| | $ | 3,397,041 |
|
The accompanying notes are an integral part of these consolidated financial statements.
COLONY CREDIT REAL ESTATE, INC.
CONSOLIDATED STATEMENTS OF OPERATIONS
(in Thousands, Except Per Share Data)
(Unaudited)
| | | | | Three Months Ended June 30, | | Six Months Ended June 30, | | Three Months Ended June 30, | | Six Months Ended June 30, |
| | | 2018 | | 2017 | | 2018 | | 2017 | | 2019 | | 2018 | | 2019 | | 2018 |
| Net interest income | | | | | | | | | | | | | | | | |
| Interest income | | $ | 36,795 |
| | $ | 36,904 |
| | $ | 72,934 |
| | $ | 72,055 |
| | $ | 42,073 |
| | $ | 36,795 |
| | $ | 80,482 |
| | $ | 72,934 |
|
| Interest expense | | (9,703 | ) | | (5,647 | ) | | (17,118 | ) | | (11,751 | ) | | (21,046 | ) | | (9,703 | ) | | (40,338 | ) | | (17,118 | ) |
| Interest income on mortgage loans held in securitization trusts | | 39,496 |
| | — |
| | 65,361 |
| | — |
| | 38,656 |
| | 39,496 |
| | 77,132 |
| | 65,361 |
|
| Interest expense on mortgage obligations issued by securitization trusts | | (36,459 | ) | | — |
| | (60,737 | ) | | — |
| | (35,756 | ) | | (36,459 | ) | | (71,391 | ) | | (60,737 | ) |
| Net interest income | | 30,129 |
| | 31,257 |
| | 60,440 |
| | 60,304 |
| | 23,927 |
| | 30,129 |
| | 45,885 |
| | 60,440 |
|
| | | | | | | | | | | | | | | | | |
| Property and other income | | | | | | | | | | | | | | | | |
| Property operating income | | 39,477 |
| | 5,762 |
| | 68,022 |
| | 10,901 |
| | 64,767 |
| | 39,477 |
| | 127,901 |
| | 68,022 |
|
| Other income | | 899 |
| | 390 |
| | 1,416 |
| | 551 |
| | 434 |
| | 899 |
| | 611 |
| | 1,416 |
|
| Total property and other income | | 40,376 |
| | 6,152 |
| | 69,438 |
| | 11,452 |
| | 65,201 |
| | 40,376 |
| | 128,512 |
| | 69,438 |
|
| | | | | | | | | | | | | | | | | |
| Expenses | | | | | | | | | | | | | | | | |
| Management fee expense | | 11,791 |
| | — |
| | 19,791 |
| | — |
| | 11,357 |
| | 11,791 |
| | 22,715 |
| | 19,791 |
|
| Property operating expense | | 16,256 |
| | 1,857 |
| | 27,969 |
| | 3,468 |
| | 28,140 |
| | 16,256 |
| | 56,320 |
| | 27,969 |
|
| Transaction, investment and servicing expense | | 3,497 |
| | 709 |
| | 34,581 |
| | 1,410 |
| | 1,051 |
| | 3,497 |
| | 1,580 |
| | 34,581 |
|
| Interest expense on real estate | | 9,850 |
| | 1,066 |
| | 16,106 |
| | 2,042 |
| | 13,898 |
| | 9,850 |
| | 27,505 |
| | 16,106 |
|
| Depreciation and amortization | | 23,359 |
| | 2,745 |
| | 42,151 |
| | 5,030 |
| | 29,257 |
| | 23,359 |
| | 56,919 |
| | 42,151 |
|
| Administrative expense (including $1,798, $0, $2,083 and $0 of equity-based compensation expense, respectively) | | 6,884 |
| | 3,729 |
| | 10,112 |
| | 6,741 |
| |
| Provision for loan losses | | | 110,258 |
| | — |
| | 110,258 |
| | — |
|
| Impairment of operating real estate | | | 10,124 |
| | — |
| | 10,124 |
| | — |
|
| Administrative expense (including $2,713, $1,798, $4,556 and $2,083 of equity-based compensation expense, respectively) | | | 8,010 |
| | 6,884 |
| | 14,663 |
| | 10,112 |
|
| Total expenses | | 71,637 |
| | 10,106 |
| | 150,710 |
| | 18,691 |
| | 212,095 |
| | 71,637 |
| | 300,084 |
| | 150,710 |
|
| | | | | | | | | | | | | | | | | |
| Other income (loss) | | | | | | | | | | | | | | | | |
| Unrealized gain on mortgage loans and obligations held in securitization trusts, net | | 3,696 |
| | — |
| | 4,193 |
| | — |
| | 5,549 |
| | 3,696 |
| | 6,578 |
| | 4,193 |
|
| Realized loss on mortgage loans and obligations held in securitization trusts, net | | (2,203 | ) | | — |
| | (2,203 | ) | | — |
| |
| Other gain (loss) on investments, net | | 10 |
| | (313 | ) | | 475 |
| | (313 | ) | |
| Realized gain (loss) on mortgage loans and obligations held in securitization trusts, net | | | — |
| | (2,203 | ) | | 48 |
| | (2,203 | ) |
| Other gain (loss), net | | | (6,062 | ) | | 10 |
| | (11,141 | ) | | 475 |
|
| Income (loss) before equity in earnings of unconsolidated ventures and income taxes | | 371 |
| | 26,990 |
| | (18,367 | ) | | 52,752 |
| | (123,480 | ) | | 371 |
| | (130,202 | ) | | (18,367 | ) |
| Equity in earnings of unconsolidated ventures | | 15,661 |
| | 6,219 |
| | 31,449 |
| | 12,257 |
| | 12,557 |
| | 15,661 |
| | 33,867 |
| | 31,449 |
|
| Income tax benefit (expense) | | (158 | ) | | (885 | ) | | 391 |
| | (662 | ) | | 133 |
| | (158 | ) | | 502 |
| | 391 |
|
| Net income | | 15,874 |
| | 32,324 |
| | 13,473 |
| | 64,347 |
| |
| Net income (loss) | | | (110,790 | ) | | 15,874 |
| | (95,833 | ) | | 13,473 |
|
| Net (income) loss attributable to noncontrolling interests: | | | | | | | | | | | | | | | | |
| Investment entities | | 470 |
| | (9,375 | ) | | (1,900 | ) | | (18,512 | ) | | 880 |
| | 470 |
| | 1,178 |
| | (1,900 | ) |
| Operating Partnership | | (336 | ) | | — |
| | (279 | ) | | — |
| | 2,569 |
| | (336 | ) | | 2,222 |
| | (279 | ) |
| Net income attributable to Colony Credit Real Estate, Inc. common stockholders | | $ | 16,008 |
| | $ | 22,949 |
| | $ | 11,294 |
| | $ | 45,835 |
| |
| Net income (loss) attributable to Colony Credit Real Estate, Inc. common stockholders | | | $ | (107,341 | ) | | $ | 16,008 |
| | $ | (92,433 | ) | | $ | 11,294 |
|
| | | | | | | | | | | | | | | | | |
Net income per common share - basic and diluted (Note 17) | | $ | 0.12 |
| | $ | 0.48 |
| | $ | 0.09 |
| | $ | 0.97 |
| |
Net income (loss) per common share - basic and diluted (Note 19) | | | $ | (0.84 | ) | | $ | 0.12 |
| | $ | (0.73 | ) | | $ | 0.09 |
|
| | | | | | | | | | | | | | | | |
Weighted average shares of common stock outstanding, basic and diluted (Note 17) | | 127,887 |
| | 44,399 |
| | 113,355 |
| | 44,399 |
| |
| | | | | | | | | | |
| Dividends declared per share of common stock | | $ | 0.44 |
| | $ | — |
| | $ | 0.73 |
| | $ | — |
| |
Weighted average shares of common stock outstanding - basic and diluted (Note 19) | | | 128,534 |
| | 127,887 |
| | 128,240 |
| | 113,355 |
|
The accompanying notes are an integral part of these consolidated financial statements.
COLONY CREDIT REAL ESTATE, INC.
CONSOLIDATED STATEMENTS OF COMPREHENSIVE INCOME (LOSS)
(in Thousands)
(Unaudited)
|
| | | | | | | | | | | | | | | | |
| | | Three Months Ended June 30, | | Six Months Ended June 30, |
| | | 2018 | | 2017 | | 2018 | | 2017 |
| Net income | | $ | 15,874 |
| | $ | 32,324 |
| | $ | 13,473 |
| | $ | 64,347 |
|
| Other comprehensive loss | | | | | | | | |
| Unrealized loss on real estate securities, available for sale | | (997 | ) | | — |
| | (2,845 | ) | | — |
|
| Total other comprehensive loss | | (997 | ) | | — |
| | (2,845 | ) | | — |
|
| Comprehensive income | | 14,877 |
| | 32,324 |
| | 10,628 |
| | 64,347 |
|
| Comprehensive (income) loss attributable to noncontrolling interests: | | | | | | | | |
| Investment entities | | 470 |
| | (9,375 | ) | | (1,900 | ) | | (18,512 | ) |
| Operating Partnership | | (269 | ) | | — |
| | (212 | ) | | — |
|
| Comprehensive income attributable to common stockholders | | $ | 15,078 |
| | $ | 22,949 |
| | $ | 8,516 |
| | $ | 45,835 |
|
|
| | | | | | | | | | | | | | | | |
| | | Three Months Ended June 30, | | Six Months Ended June 30, |
| | | 2019 | | 2018 | | 2019 | | 2018 |
| Net income (loss) | | $ | (110,790 | ) | | $ | 15,874 |
| | $ | (95,833 | ) | | $ | 13,473 |
|
| Other comprehensive income (loss) | | | | | | | | |
| Unrealized gain (loss) on real estate securities, available for sale | | 7,863 |
| | (997 | ) | | 17,621 |
| | (2,845 | ) |
| Change in fair value of net investment hedges | | 938 |
| | — |
| | 8,333 |
| | — |
|
| Foreign currency translation gain | | 3,923 |
| | — |
| | 613 |
| | — |
|
| Total other comprehensive income (loss) | | 12,724 |
| | (997 | ) | | 26,567 |
| | (2,845 | ) |
| Comprehensive income (loss) | | (98,066 | ) | | 14,877 |
| | (69,266 | ) | | 10,628 |
|
| Comprehensive (income) loss attributable to noncontrolling interests: | | | | | | | | |
| Investment entities | | 880 |
| | 470 |
| | 1,178 |
| | (1,900 | ) |
| Operating Partnership | | 2,272 |
| | (269 | ) | | 1,601 |
| | (212 | ) |
| Comprehensive income (loss) attributable to common stockholders | | $ | (94,914 | ) | | $ | 15,078 |
| | $ | (66,487 | ) | | $ | 8,516 |
|
The accompanying notes are an integral part of these consolidated financial statements.
COLONY CREDIT REAL ESTATE, INC.
CONSOLIDATED STATEMENTS OF EQUITY
(in Thousands)
(Unaudited)
| | | | Common Stock | | Additional Paid-in Capital | | Retained Earnings (Accumulated Deficit) | | Accumulated Other Comprehensive Loss | | Total
Stockholders’
Equity | | Noncontrolling Interests in Investment Entities | | Noncontrolling Interests in the Operating Partnership | | Total Equity | Common Stock | | Additional Paid-in Capital | | Retained Earnings (Accumulated Deficit) | | Accumulated Other Comprehensive Income (Loss) | | Total
Stockholders’
Equity | | | Noncontrolling Interests in Investment Entities | | Noncontrolling Interests in the Operating Partnership | | Total Equity | |
| | Class A | | Class B-3 | | Class A | | Class B-3 | |
| | Shares | | Amount | | Shares | | Amount | | Shares | | Amount | | Shares | | Amount | |
| Balance as of December 31, 2016 | — |
| | $ | — |
| | — |
| | $ | — |
| | $ | 714,443 |
| | $ | 170,273 |
| | $ | — |
| | $ | 884,716 |
| | $ | 350,848 |
| | $ | — |
| | $ | 1,235,564 |
| |
| Contributions | — |
| | — |
| | — |
| | — |
| | 378,617 |
| | — |
| | — |
| | 378,617 |
| | 28,110 |
| | — |
| | 406,727 |
| |
| Balance at December 31, 2017 | | — |
| | $ | — |
| | — |
| | $ | — |
| | $ | 821,031 |
| | $ | 258,777 |
| | $ | — |
| | $ | 1,079,808 |
| | | $ | 327,762 |
| | $ | — |
| | $ | 1,407,570 |
| |
| Distributions | — |
| | — |
| | — |
| | — |
| | (52,011 | ) | | — |
| | — |
| | (52,011 | ) | | (40,500 | ) | | — |
| | (92,511 | ) | — |
| | — |
| | — |
| | — |
| | — |
| | — |
| | — |
| | — |
| | | (1,003 | ) | | — |
| | (1,003 | ) | |
| Net income | — |
| | — |
| | — |
| | — |
| | — |
| | 45,835 |
| | — |
| | 45,835 |
| | 18,512 |
| | — |
| | 64,347 |
| |
| Balance as of June 30, 2017 (Unaudited) | — |
| | $ | — |
| | — |
| | $ | — |
| | $ | 1,041,049 |
| | $ | 216,108 |
| | $ | — |
| | $ | 1,257,157 |
| | $ | 356,970 |
| | $ | — |
| | $ | 1,614,127 |
| |
| | | | | | | | | | | | | | | | | | | | | | | |
| Balance as of December 31, 2017 | — |
| | $ | — |
| | — |
| | $ | — |
| | $ | 821,031 |
| | $ | 258,777 |
| | $ | — |
| | $ | 1,079,808 |
| | $ | 327,762 |
| | $ | — |
| | $ | 1,407,570 |
| |
| Adjustments related to the Combination | | 82,484 |
| | 825 |
| | 44,399 |
| | 444 |
| | 2,073,186 |
| | (79,774 | ) | | — |
| | 1,994,681 |
| | | (230,818 | ) | | 73,626 |
| | 1,837,489 |
| |
| Issuance and amortization of equity-based compensation | | 1,004 |
| | 10 |
| | — |
| | — |
| | 275 |
| | — |
| | — |
| | 285 |
| | | — |
| | — |
| | 285 |
| |
| Other comprehensive loss | | — |
| | — |
| | — |
| | — |
| | — |
| | — |
| | (1,848 | ) | | (1,848 | ) | | | — |
| | — |
| | (1,848 | ) | |
| Dividends and distributions declared ($0.29 per share) | | — |
| | — |
| | — |
| | — |
| | — |
| | (37,843 | ) | | — |
| | (37,843 | ) | | | — |
| | — |
| | (37,843 | ) | |
| Net income (loss) | | — |
| | — |
| | — |
| | — |
| | — |
| | (4,714 | ) | | — |
| | (4,714 | ) | | | 2,370 |
| | (57 | ) | | (2,401 | ) | |
| Balance at March 31, 2018 | | 83,488 |
| | $ | 835 |
| | 44,399 |
| | $ | 444 |
| | $ | 2,894,492 |
| | $ | 136,446 |
| | $ | (1,848 | ) | | $ | 3,030,369 |
| | | $ | 98,311 |
| | $ | 73,569 |
| | $ | 3,202,249 |
| |
| Contributions | — |
| | — |
| | — |
| | — |
| | — |
| | — |
| | — |
| | — |
| | 87 |
| | — |
| | 87 |
| — |
| | — |
| | — |
| | — |
| | — |
| | — |
| | — |
| | — |
| | | 87 |
| | — |
| | 87 |
| |
| Distributions | — |
| | — |
| | — |
| | — |
| | — |
| | — |
| | — |
| | — |
| | (1,931 | ) | | — |
| | (1,931 | ) | — |
| | — |
| | — |
| | — |
| | — |
| | — |
| | — |
| | — |
| | | (928 | ) | | — |
| | (928 | ) | |
| Adjustments related to the Combination | 82,484 |
| | 825 |
| | 44,399 |
| | 444 |
| | 2,074,256 |
| | (79,774 | ) | | — |
| | 1,995,751 |
| | (230,865 | ) | | 73,626 |
| | 1,838,512 |
| — |
| | — |
| | — |
| | — |
| | 1,070 |
| | — |
| | — |
| | 1,070 |
| | | (47 | ) | | — |
| | 1,023 |
| |
| Issuance and amortization of equity-based compensation | 1,004 |
| | 10 |
| | — |
| | — |
| | 2,073 |
| | — |
| | — |
| | 2,083 |
| | — |
| | — |
| | 2,083 |
| — |
| | — |
| | — |
| | — |
| | 1,798 |
| | — |
| | — |
| | 1,798 |
| | | — |
| | — |
| | 1,798 |
| |
| Other comprehensive loss | — |
| | — |
| | — |
| | — |
| | — |
| | — |
| | (2,778 | ) | | (2,778 | ) | | — |
| | (67 | ) | | (2,845 | ) | — |
| | — |
| | — |
| | — |
| | — |
| | — |
| | (930 | ) | | (930 | ) | | | — |
| | (67 | ) | | (997 | ) | |
| Dividends and distributions declared | — |
| | — |
| | — |
| | — |
| | — |
| | (92,582 | ) | | — |
| | (92,582 | ) | | — |
| | (2,230 | ) | | (94,812 | ) | |
| Dividends and distributions declared ($0.44 per share) | | — |
| | — |
| | — |
| | — |
| | — |
| | (54,739 | ) | | — |
| | (54,739 | ) | | | — |
| | (2,230 | ) | | (56,969 | ) | |
| Reallocation of equity | — |
| | — |
| | — |
| | — |
| | (665 | ) | | — |
| | — |
| | (665 | ) | | — |
| | 665 |
| | — |
| — |
| | — |
| | — |
| | — |
| | (665 | ) | | — |
| | — |
| | (665 | ) | | | — |
| | 665 |
| | — |
| |
| Net income | — |
| | — |
| | — |
| | — |
| | — |
| | 11,294 |
| | — |
| | 11,294 |
| | 1,900 |
| | 279 |
| | 13,473 |
| |
| Balance as of June 30, 2018 (Unaudited) | 83,488 |
| | $ | 835 |
| | 44,399 |
| | $ | 444 |
| | $ | 2,896,695 |
| | $ | 97,715 |
| | $ | (2,778 | ) | | $ | 2,992,911 |
| | $ | 96,953 |
| | $ | 72,273 |
| | $ | 3,162,137 |
| |
| Net income (loss) | | — |
| | — |
| | — |
| | — |
| | — |
| | 16,008 |
| | — |
| | 16,008 |
| | | (470 | ) | | 336 |
| | 15,874 |
| |
| Balance at June 30, 2018 | | 83,488 |
| | $ | 835 |
| | 44,399 |
| | $ | 444 |
| | $ | 2,896,695 |
| | $ | 97,715 |
| | $ | (2,778 | ) | | $ | 2,992,911 |
| | | $ | 96,953 |
| | $ | 72,273 |
| | $ | 3,162,137 |
| |
The accompanying notes are an integral part of these consolidated financial statements.
COLONY CREDIT REAL ESTATE, INC.
CONSOLIDATED STATEMENTS OF EQUITY (Continued)
(in Thousands)
(Unaudited)
|
| | | | | | | | | | | | | | | | | | | | | | | | | | | | | | | | | | | | | | | | | | | |
| | Common Stock | | Additional
Paid-in
Capital | | Retained
Earnings
(Accumulated
Deficit) | | Accumulated
Other
Comprehensive
Income (Loss) | | Total
Stockholders’
Equity | | | Noncontrolling Interests in Investment Entities | | Noncontrolling Interests in the Operating Partnership | | Total
Equity | |
| | Class A | | Class B-3 | |
| | Shares | | Amount | | Shares | | Amount | |
| Balance at December 31, 2018 | 83,410 |
| | $ | 834 |
| | 44,399 |
| | $ | 444 |
| | $ | 2,899,353 |
| | $ | (193,327 | ) | | $ | (399 | ) | | $ | 2,706,905 |
| | | $ | 72,683 |
| | $ | 65,614 |
| | $ | 2,845,202 |
| |
| Contributions | — |
| | — |
| | — |
| | — |
| | — |
| | — |
| | — |
| | — |
| | | 24 |
| | — |
| | 24 |
| |
| Distributions | — |
| | — |
| | — |
| | — |
| | — |
| | — |
| | — |
| | — |
| | | (394 | ) | | — |
| | (394 | ) | |
| Conversion of Class B-3 common stock | 44,399 |
| | 444 |
| | (44,399 | ) | | (444 | ) | | — |
| | — |
| | — |
| | — |
| | | — |
| | — |
| | — |
| |
| Issuance and amortization of equity-based compensation | 800 |
| | 8 |
| | — |
| | — |
| | 1,835 |
| | — |
| | — |
| | 1,843 |
| | | — |
| | — |
| | 1,843 |
| |
| Other comprehensive income | — |
| | — |
| | — |
| | — |
| | — |
| | — |
| | 13,519 |
| | 13,519 |
| | | — |
| | 324 |
| | 13,843 |
| |
| Dividends and distributions declared ($0.44 per Class A share and $0.15 per Class B-3 share) | — |
| | — |
| | — |
| | — |
| | — |
| | (55,726 | ) | | — |
| | (55,726 | ) | | | — |
| | (1,340 | ) | | (57,066 | ) | |
| Shares canceled for tax withholding on vested stock awards | (96 | ) | | (1 | ) | | — |
| | — |
| | (1,496 | ) | | — |
| | — |
| | (1,497 | ) | | | — |
| | — |
| | (1,497 | ) | |
| Reallocation of equity | — |
| | — |
| | — |
| | — |
| | (23 | ) | | — |
| | — |
| | (23 | ) | | | — |
| | 23 |
| | — |
| |
| Net income (loss) | — |
| | — |
| | — |
| | — |
| | — |
| | 14,908 |
| | — |
| | 14,908 |
| | | (298 | ) | | 347 |
| | 14,957 |
| |
| Balance at March 31, 2019 | 128,513 |
| | $ | 1,285 |
| | — |
| | $ | — |
| | $ | 2,899,669 |
| | $ | (234,145 | ) | | $ | 13,120 |
| | $ | 2,679,929 |
| | | $ | 72,015 |
| | $ | 64,968 |
| | $ | 2,816,912 |
| |
| Contributions | — |
| | — |
| | — |
| | — |
| | — |
| | — |
| | — |
| | — |
| | | 11 |
| | — |
| | 11 |
| |
| Distributions | — |
| | — |
| | — |
| | — |
| | — |
| | — |
| | — |
| | — |
| | | (1,198 | ) | | — |
| | (1,198 | ) | |
| Issuance and amortization of equity-based compensation | 32 |
| | — |
| | — |
| | — |
| | 2,713 |
| | — |
| | — |
| | 2,713 |
| | | — |
| | — |
| | 2,713 |
| |
| Other comprehensive income | — |
| | — |
| | — |
| | — |
| | — |
| | — |
| | 12,427 |
| | 12,427 |
| | | — |
| | 297 |
| | 12,724 |
| |
| Dividends and distributions declared ($0.44 per share) | — |
| | — |
| | — |
| | — |
| | — |
| | (55,912 | ) | | — |
| | (55,912 | ) | | | — |
| | (1,342 | ) | | (57,254 | ) | |
| Shares canceled for tax withholding on vested stock awards | — |
| | — |
| | — |
| | — |
| | — |
| | — |
| | — |
| | — |
| | | — |
| | — |
| | — |
| |
| Reallocation of equity | — |
| | — |
| | — |
| | — |
| | 744 |
| | — |
| | — |
| | 744 |
| | | — |
| | (744 | ) | | — |
| |
| Net income (loss) | — |
| | — |
| | — |
| | — |
| | — |
| | (107,341 | ) | | — |
| | (107,341 | ) | | | (880 | ) | | (2,569 | ) | | (110,790 | ) | |
| Balance at June 30, 2019 | 128,545 |
| | $ | 1,285 |
| | — |
| | $ | — |
| | $ | 2,903,126 |
| | $ | (397,398 | ) | | $ | 25,547 |
| | $ | 2,532,560 |
| | | $ | 69,948 |
| | $ | 60,610 |
| | $ | 2,663,118 |
| |
The accompanying notes are an integral part of these consolidated financial statements.
COLONY CREDIT REAL ESTATE, INC.
CONSOLIDATED STATEMENTS OF CASH FLOWS
(in Thousands)
(Unaudited)
| | | | Six Months Ended
June 30, | Six Months Ended June 30, |
| | 2018 | | 2017 | 2019 | | 2018 |
| Cash flows from operating activities: | | | | | | |
| Net income | $ | 13,473 |
| | $ | 64,347 |
| |
| Adjustments to reconcile net income to net cash provided by (used in) operating activities: | | | | |
| Net income (loss) | | $ | (95,833 | ) | | $ | 13,473 |
|
| Adjustments to reconcile net income (loss) to net cash provided by operating activities: | | | | |
| Equity in earnings of unconsolidated ventures | (31,449 | ) | | (12,257 | ) | (33,867 | ) | | (31,449 | ) |
| Depreciation and amortization | 42,151 |
| | 5,030 |
| 56,919 |
| | 42,151 |
|
| Straight-line rental income | (2,348 | ) | | — |
| (3,552 | ) | | (2,348 | ) |
| Amortization of above/below market lease values, net | 222 |
| | — |
| (1,737 | ) | | 222 |
|
| Amortization of premium/accretion of discount and fees on investments and borrowings, net | (3,688 | ) | | (3,810 | ) | (5,701 | ) | | (3,688 | ) |
| Amortization of deferred financing costs | 1,564 |
| | 1,866 |
| 4,252 |
| | 1,564 |
|
| Paid-in-kind interest | (1,234 | ) | | (4,072 | ) | |
| Amortization of right-of-use lease assets and operating lease liabilities | | 48 |
| | — |
|
| Paid-in-kind interest added to loan principal, net of interest received | | (3,738 | ) | | (1,234 | ) |
| Distributions of cumulative earnings from unconsolidated ventures | 27,400 |
| | 3,488 |
| 30,879 |
| | 27,400 |
|
| Unrealized gain on mortgage loans and obligations held in securitization trusts, net | (4,193 | ) | | — |
| (6,578 | ) | | (4,193 | ) |
| Realized loss on mortgage loans and obligations held in securitization trusts, net | 2,203 |
| | — |
| |
| Realized (gain) loss on mortgage loans and obligations held in securitization trusts, net | | (48 | ) | | 2,203 |
|
| Provision for loan loss | | 110,258 |
| | — |
|
| Recovery of allowance for loan loss | (517 | ) | | — |
| — |
| | (517 | ) |
| Impairment of operating real estate | | 10,124 |
| | — |
|
| Amortization of equity-based compensation | 2,083 |
| | — |
| 4,556 |
| | 2,083 |
|
| Mortgage notes above/below market value amortization | (307 | ) | | — |
| 164 |
| | (307 | ) |
| Deferred income tax benefit | (1,480 | ) | | — |
| (3,589 | ) | | (1,480 | ) |
| Changes in assets and liabilities: | | | | | | |
| Restricted cash | (6,567 | ) | | (948 | ) | |
| Receivables, net | 14,607 |
| | — |
| (8,113 | ) | | 14,607 |
|
| Deferred costs and other assets | (33,204 | ) | | 3,097 |
| 5,890 |
| | (33,204 | ) |
| Due to related party | 5,204 |
| | — |
| (2,672 | ) | | 5,204 |
|
| Other liabilities | (1,571 | ) | | (9,571 | ) | 5,483 |
| | (1,571 | ) |
| Net cash provided by operating activities | 22,349 |
| | 47,170 |
| 63,145 |
| | 28,916 |
|
| Cash flows from investing activities: | | | | | | |
| Acquisition, origination and funding of loans and preferred equity held for investment, net | (392,278 | ) | | (106,070 | ) | (886,397 | ) | | (392,278 | ) |
| Repayment on loans and preferred equity held for investment | 272,636 |
| | 153,474 |
| 287,437 |
| | 272,636 |
|
| Proceeds from sale of loans and preferred equity held for investment | — |
| | 17,509 |
| |
| Cash received in the Combination | 225,169 |
| | 913 |
| |
| Proceeds from sale of real estate | — |
| | 8,938 |
| |
| Improvements of real estate | (5,661 | ) | | (312 | ) | |
| Cash and restricted cash received in the Combination | | — |
| | 302,342 |
|
| Acquisition of and additions to real estate, related intangibles and leasing commissions | | (9,281 | ) | | (5,661 | ) |
| Investments in unconsolidated ventures | (5,486 | ) | | (8,975 | ) | (7,801 | ) | | (5,486 | ) |
| Proceeds from sale of investments in unconsolidated ventures | | 76,861 |
| | — |
|
| Distributions in excess of cumulative earnings from unconsolidated ventures | 49,438 |
| | 15,739 |
| 119,472 |
| | 49,438 |
|
| Acquisition of real estate securities, available for sale | (33,281 | ) | | — |
| — |
| | (33,281 | ) |
| Cash received in excess of accretion on purchased credit impaired loans | — |
| | 20,316 |
| |
| Net receipts on settlement of derivative instruments | | 1,638 |
| | — |
|
| Deposit on investments | (15,700 | ) | | — |
| (372 | ) | | (15,700 | ) |
| Change in restricted cash | 9,092 |
| | — |
| |
| Net cash provided by investing activities | 103,929 |
| | 101,532 |
| |
| Change in escrow deposits | | (2,848 | ) | | (83 | ) |
| Net cash provided by (used in) investing activities | | (421,291 | ) | | 171,927 |
|
| Cash flows from financing activities: | | | | | | |
| Distributions paid on common stock | (73,589 | ) | | — |
| (111,536 | ) | | (73,589 | ) |
| Distributions paid on common stock to noncontrolling interests | (2,230 | ) | | — |
| (2,682 | ) | | (2,230 | ) |
| Borrowings from mortgage notes | 43,782 |
| | 35,348 |
| 85,481 |
| | 43,782 |
|
| Repayment of mortgage notes | (42,088 | ) | | (147,758 | ) | (2,948 | ) | | (42,088 | ) |
| Borrowings from credit facilities | 326,820 |
| | — |
| 1,420,569 |
| | 326,820 |
|
| Repayment of credit facilities | (175,143 | ) | | (115 | ) | (977,697 | ) | | (175,143 | ) |
| Repayment of securitization bonds | (63,354 | ) | | — |
| (57,995 | ) | | (63,354 | ) |
| Payment of deferred financing costs | (8,459 | ) | | — |
| (6,972 | ) | | (8,459 | ) |
| Contributions from noncontrolling interests | 87 |
| | 73,927 |
| 35 |
| | 87 |
|
| Distributions to noncontrolling interests | (1,931 | ) | | (92,511 | ) | (1,592 | ) | | (1,931 | ) |
| Net cash provided by (used in) financing activities | 3,895 |
| | (131,109 | ) | |
| Net increase in cash and cash equivalents | 130,173 |
| | 17,593 |
| |
| Cash and cash equivalents - beginning of period | 25,204 |
| | 13,982 |
| |
| Cash and cash equivalents - end of period | $ | 155,377 |
| | $ | 31,575 |
| |
| Net cash provided by financing activities | | 344,663 |
| | 3,895 |
|
| Effect of exchange rates on cash, cash equivalents and restricted cash | | (15 | ) | | — |
|
| Net increase (decrease) in cash, cash equivalents and restricted cash | | (13,498 | ) | | 204,738 |
|
| Cash, cash equivalents and restricted cash - beginning of period | | 187,463 |
| | 67,105 |
|
| Cash, cash equivalents and restricted cash - end of period | | $ | 173,965 |
| | $ | 271,843 |
|
The accompanying notes are an integral part of these consolidated financial statements.
COLONY CREDIT REAL ESTATE, INC.
CONSOLIDATED STATEMENTS OF CASH FLOWS (Continued)
(in Thousands)
(Unaudited)
|
| | | | | | | |
| | Six Months Ended
June 30, |
| | 2018 | | 2017 |
| Supplemental disclosure of non-cash investing and financing activities: | | | |
| Assets acquired in the Combination (Note 3) | $ | 6,916,046 |
| | $ | — |
|
| Liabilities assumed in the Combination (Note 3) | 4,812,353 |
| | — |
|
| Noncontrolling interests assumed in the Combination (Note 3) | 82,320 |
| | — |
|
| Common stock issued for acquisition of NorthStar I and NorthStar II (Note 3) | 2,021,373 |
| | — |
|
| Deconsolidation of certain CLNY Contributed Portfolio investments (Note 2) | 313,133 |
| | — |
|
| Secured Financing (Note 4) | 50,314 |
| | — |
|
| Other Payables to Manager adjustment (Note 11) | 2,934 |
| | — |
|
| Noncontrolling interests in the Operating Partnership | 73,626 |
| | — |
|
| Consolidation of securitization trust (VIE asset / liability) | 175,078 |
| | — |
|
| Escrow deposits payable related to loans and preferred equity held for investment | 7,628 |
| | 63,168 |
|
| Accrual of distribution payable | 18,993 |
| | — |
|
| Non-cash distributions related to unconsolidated ventures | — |
| | 932 |
|
| Foreclosure of loans and preferred equity held for investment | — |
| | 8,789 |
|
| Assets acquired through the CLNY Merger (Note 2) | — |
| | 493,881 |
|
| Liabilities assumed through the CLNY Merger (Note 2) | — |
| | 161,081 |
|
|
| | | | | | | |
| | Six Months Ended June 30, |
| | 2019 | | 2018 |
| Reconciliation of cash, cash equivalents, and restricted cash to consolidated balance sheets | | | |
| Beginning of the period | | | |
| Cash and cash equivalents | $ | 77,317 |
| | $ | 25,204 |
|
| Restricted cash | 110,146 |
| | 41,901 |
|
| Total cash, cash equivalents and restricted cash, beginning of period | $ | 187,463 |
| | $ | 67,105 |
|
| | | | |
| End of the period | | | |
| Cash and cash equivalents | $ | 59,838 |
| | $ | 155,377 |
|
| Restricted cash | 114,127 |
| | 116,466 |
|
| Total cash, cash equivalents and restricted cash, end of period | $ | 173,965 |
| | $ | 271,843 |
|
|
| | | | | | | |
| | Six Months Ended June 30, |
| | 2019 | | 2018 |
| Supplemental disclosure of non-cash investing and financing activities: | | | |
| Assets acquired in the Combination | $ | — |
| | $ | 6,916,046 |
|
| Liabilities assumed in the Combination | — |
| | 4,812,353 |
|
| Noncontrolling interests assumed in the Combination | — |
| | 82,320 |
|
| Common stock issued for acquisition of NorthStar I and NorthStar II (Note 3) | — |
| | 2,021,373 |
|
| Deconsolidation of certain CLNY Contributed Portfolio investments (Note 2) | — |
| | 313,133 |
|
| Secured Financing | — |
| | 50,314 |
|
| Other Payables to Manager adjustment (refer to Note 11) | — |
| | 2,934 |
|
| Noncontrolling interests in the Operating Partnership | — |
| | 73,626 |
|
| Consolidation of securitization trust (VIE asset / liability) | 52,346 |
| | 175,078 |
|
| Accrual of distribution payable | 19,088 |
| | 18,993 |
|
| Foreclosure of loans held for investment, net of provision for loan loss | 127,356 |
| | — |
|
| Right-of-use lease assets and operating lease liabilities | 26,348 |
| | — |
|
| Assets transferred to held for sale (Note 7) | 147,707 |
| | — |
|
| Conversion of Class B-3 common stock to Class A common stock | 444 |
| | — |
|
The accompanying notes are an integral part of these consolidated financial statements.
COLONY CREDIT REAL ESTATE, INC.
NOTES TO CONSOLIDATED FINANCIAL STATEMENTS
(Unaudited)
| |
| 1. | Business and Organization |
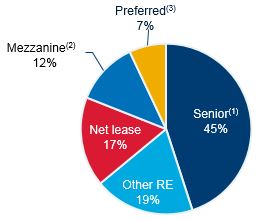
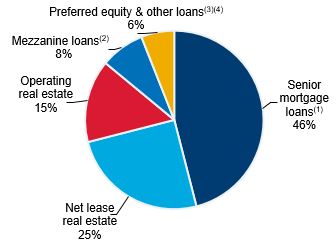
Colony Credit Real Estate, Inc. (the(together with its consolidated subsidiaries, the “Company”) is a commercial real estate (“CRE”) credit real estate investment trust (“REIT”) focused on originating, acquiring, financing and managing a diversified portfolio consisting primarily of CRE senior mortgage loans, mezzanine loans, preferred equity, debt securities and net leased properties predominantly in the United States. CRE debt investments include senior mortgage loans, mezzanine loans, preferred equity, and participations in such loans and preferred equity interests. CRE debt securities consist of commercial mortgage-backed securities (“CMBS”) (including “B-pieces” of a CMBS securitization pool). Net leased properties consist of CRE properties with long-term leases to tenants on a net-lease basis, where such tenants generally will be responsible for property operating expenses such as insurance, utilities, maintenance capital expenditures and real estate taxes.
The Company was organized in the state of Maryland on August 23, 2017. On September 15, 2017, Colony Capital, Inc., formerly Colony NorthStar, Inc. (“Colony Capital”), a publicly traded REIT listed on the New York Stock Exchange (“NYSE”) under the ticker symbol “CLNY,” made an initial capital contribution of $1,000 to the Company. On January 31, 2018, the Company completed the transactions contemplated by that certain Master Combination Agreement, dated as of August 25, 2017, as amended and restated on November 20, 2017 (the “Combination Agreement,” as further discussed below). The Company intends to qualify as a REIT under the Internal Revenue Code of 1986, as amended (the “Code”), beginning with its taxable year endingended December 31, 2018. Effective June 25, 2018, the Company changed its name from Colony NorthStar Credit Real Estate, Inc. to Colony Credit Real Estate, Inc. Also on June 25, 2018, Colony NorthStar, Inc. changed its name to Colony Capital, Inc. The Company conducts all of its activities and holds substantially all of its assets and liabilities through its operating subsidiary, Credit RE Operating Company, LLC (the “Operating Partnership” or “OP”). At June 30, 2018,2019, the Company owned 97.6%97.7% of the OP, as its sole managing member. The remaining 2.4%2.3% is owned by an affiliate of the Company as noncontrolling interests.
The Company is externally managed and has no employees. The Company is managed by CLNC Manager, LLC (the “Manager”), a Delaware limited liability company and a wholly-owned and indirect subsidiary of Colony Capital Operating Company, LLC (“CLNY OP”), a Delaware limited liability company and the operating company of Colony Capital. Colony Capital manages capital on behalf of its stockholders, as well as institutional and retail investors in private funds, non-traded and traded REITs and registered investment companies.
The Combination
Pursuant to the Combination Agreement, (i) CLNY OP contributed and conveyed to the Company a select portfolio of assets and liabilities (the “CLNY OP Contributed Portfolio”) of CLNY OP (the “CLNY OP Contribution”), (ii) NRF RED REIT Corp., a Maryland corporation and indirect subsidiary of CLNY OP (“RED REIT”) contributed and conveyed to the OP a select portfolio of assets and liabilities (the “RED REIT Contributed Portfolio” and, together with the CLNY OP Contributed Portfolio, the “CLNY Contributed Portfolio”) of RED REIT (the “RED REIT Contribution” and, together with the CLNY OP Contribution, the “CLNY Contributions”), (iii) NorthStar Real Estate Income Trust, Inc. (“NorthStar I”), a publicly registered non-traded REIT sponsored and managed by a subsidiary of Colony Capital, merged with and into the Company, with the Company surviving the merger (the “NorthStar I Merger”), (iv) NorthStar Real Estate Income II, Inc. (“NorthStar II”), a publicly registered non-traded REIT sponsored and managed by a subsidiary of Colony Capital, merged with and into the Company, with the Company surviving the merger (the “NorthStar II Merger” and, together with the NorthStar I Merger, the “Mergers”), and (v) immediately following the Mergers, the Company contributed and conveyed to the OP the CLNY OP Contributed Portfolio and the equity interests of each of NorthStar Real Estate Income Trust Operating Partnership, LP, a Delaware limited partnership and the operating partnership of NorthStar I, and NorthStar Real Estate Income Operating Partnership II, LP, a Delaware limited partnership and the operating partnership of NorthStar II, then-owned by the Company in exchange for units of membership interest in the OP (the “Company Contribution” and, collectively with the Mergers and the CLNY Contributions, the “Combination”).
On January 18, 2018, the Combination was approved by the stockholders of NorthStar I and NorthStar II. The Combination closed on January 31, 2018 (the “Closing Date”) and the Company’s Class A common stock, par value $0.01 per share (the “Class A common stock”), began trading on the NYSE on February 1, 2018 under the symbol “CLNC.”
The Combination is accounted for under the acquisition method for business combinations pursuant to Accounting Standards Codification (“ASC”) Topic 805, Business Combinations, with the Company as the accounting acquirer.
Details of the Combination are described more fully in Note 3, “Business Combinations”Combination” and the accounting treatment thereof in Note 2, “Summary of Significant Accounting Policies.”
COLONY CREDIT REAL ESTATE, INC.
NOTES TO CONSOLIDATED FINANCIAL STATEMENTS (Continued)
(Unaudited)
| |
| 2. | Summary of Significant Accounting Policies |
The significant accounting policies of the Company are described below. The accounting policies of the Company’s unconsolidated ventures are substantially similar to those of the Company.
Basis of Presentation
The accompanying unaudited interim financial statements have been prepared in accordance with the instructions to Form 10-Q and Article 10 of Regulation S-X. Accordingly, they do not include all information and footnotes required by accounting principles generally accepted in the United States of America (“U.S. GAAP”) for complete financial statements. These statements reflect all normal and recurring adjustments which, in the opinion of management, are necessary to present fairly the financial position, results of operations and cash flows of the Company for the interim periods presented. However, the results of operations for the interim period presented are not necessarily indicative of the results that may be expected for the year ending December 31, 2018,2019, or for any other future period. These interim financial statements should be read in conjunction with the audited consolidated financial statements of the ownership interests in certain investment entities contributed by CLNY (the “CLNY Investment Entities”), NorthStar I and NorthStar II and notes thereto included in, or presented as exhibits to, the Company’s Annual Report on Form 10-K for the fiscal year ended December 31, 2017.2018.
The consolidated financial statements include the results of operations of Colony Credit Real Estate, Inc. and thecertain consolidated CLNYinvestment entities contributed by Colony Capital (the “CLNY Investment EntitiesEntities”) for periods on or prior to the closing of the Combination on January 31, 2018 and the combined operations of Colony Credit Real Estate, Inc., NorthStar I and NorthStar II beginning February 1, 2018, following the closing of the Combination.
The assets and liabilities contributed by CLNYColony Capital to the Company consisted of its ownership interests in the CLNY Investment Entities, ranging from 38% to 100%. The remaining interests in the CLNY Investment Entities are owned by investment vehicles sponsored by Colony Capital or third parties and were not contributed to the Company.
The CLNY Contributions were accounted for as a reorganization of entities under common control, since both the Company and the CLNY Investment Entities were under common control of Colony Capital at the time the contributions were made. Accordingly, the contributed assets and liabilities were recorded at carryover basis and the Company’s financial statements for prior periods were recast to reflect the consolidation of the CLNY Investment Entities as if the contribution had occurred on the date of the earliest period presented. The assets, liabilities and noncontrolling interests of the CLNY Investment Entities in the consolidated financial statements for periods prior to the Combination were carved out of the books and records of Colony Capital at their historical carrying amounts. Accordingly, the historical consolidationconsolidated financial statements were prepared giving consideration to the rules and regulations of the U.S. Securities and Exchange Commission (“SEC”) and related guidance provided by the SEC Staff with respect to carve-out financial statements and reflect allocations of certain corporate costs from Colony Capital. These charges were based on either specifically identifiable costs incurred on behalf of the CLNY Investment Entities or an allocation of costs estimated to be applicable to the CLNY Investment Entities, primarily based on the relative assets under management of the CLNY Investment Entities to Colony Capital’s total assets under management. Such costs do not necessarily reflect what the actual costs would have been if the Company had been operating as a separate stand-alone public entity for periods prior to the Combination.
Following the Combination, the Company reconsidered whether it was the primary beneficiary of certain variable interest entities (“VIEs”), which resulted in the deconsolidation of certain of the CLNY Investment Entities and the consolidation of certain securitization trusts in which NorthStar I or NorthStar II held an interest, as more fully described below. Accordingly, comparisons of financial information for periods prior to the Combination with subsequent periods may not be meaningful.
The Combination
The Combination is accounted for under the acquisition method for business combinations pursuant to ASC Topic 805, Business Combinations. In the Combination, the Company was considered to be the accounting acquirer so all of its assets and liabilities immediately prior to the closing of the Combination are reflected at their historical carrying values. The consideration transferred by the Company established a new accounting basis for the assets acquired, liabilities assumed and noncontrolling interests of NorthStar I and NorthStar II, which were measured at their respective fair values on the Closing Date.
Formation of Colony Capital
Colony Capital was formed through a tri-party merger (the “CLNY Merger”) among Colony Capital, NorthStar Asset Management Group Inc. and NorthStar Realty Finance Corp. (“NRF”), which closed on January 10, 2017 (the “CLNY Merger Closing Date”). Colony Capital was determined to be the accounting acquirer in the CLNY Merger. Accordingly, the combined financial information of the CLNY Investment Entities included herein as of any date or for any periods on or prior to the CLNY Merger Closing Date
COLONY CREDIT REAL ESTATE, INC.
NOTES TO CONSOLIDATED FINANCIAL STATEMENTS (Continued)
(Unaudited)
represent the CLNY Investment Entities from Colony Capital. On the CLNY Merger Closing Date, the CLNY Investment Entities were reflected by Colony Capital at their pre-CLNY Merger carrying values, while the CLNY Investment Entities from NRF were
COLONY CREDIT REAL ESTATE, INC.
NOTES TO CONSOLIDATED FINANCIAL STATEMENTS (Continued)
(Unaudited)
reflected by Colony Capital at their CLNY Merger fair values. The results of operations of the CLNY Investment Entities from NRF are included in these pre-Combination financial statements effective from January 11, 2017.
Use of Estimates
The preparation of consolidated financial statements in conformity with U.S. GAAP requires management to make estimates and assumptions that affect the amounts reported in the consolidated financial statements and accompanying notes. Actual results could differ from those estimates and assumptions.
Principles of Consolidation
The accompanying combinedconsolidated financial statements include the accounts of the Company and its controlled subsidiaries and consolidated VIEs.subsidiaries. The portions of the equity, net income and other comprehensive income of consolidated subsidiaries that are not attributable to the parent are presented separately as amounts attributable to noncontrolling interests in the consolidated financial statements.
The Company consolidates entities in which they haveit has a controlling financial interest by first considering if an entity meets the definition of a VIE for which the Company is deemed to be the primary beneficiary, or if the Company has the power to control an entity through a majority of voting interest or through other arrangements.
Variable Interest Entities
Variable Interest Entities—A VIE is an entity that either (i) lacks one or more of the characteristics of a voting interest entity. A VIE is defined as an entity in which equity investors do not have the characteristics of a controlling financial interest or do not have sufficient equity at risk for the entity to finance its activities without additional subordinated financial support from other parties. The determinationparties; (ii) whose equity holders lack the characteristics of whether an entitya controlling financial interest; or (iii) is a VIE includes both a qualitative and quantitative analysis. The Company bases its qualitative analysis on its review of the design of the entity, its organizational structure including decision-making ability and relevant financial agreements and the quantitative analysis on the forecasted cash flow of the entity. The Company reassesses its initial evaluation of an entity as a VIE upon the occurrence of certain reconsideration events.
established with non-substantive voting rights. A VIE must beis consolidated only by its primary beneficiary, which is defined as the party who along with its affiliates and agents has both the: (i)a controlling financial interest in the VIE through (a) power to direct the activities of the VIE that most significantly impactaffect the VIE’s economic performance;performance, and (ii)(b) obligation to absorb the losses or right to receive benefits of the VIE or the right to receive the benefits from the VIE, whichthat could be significant to the VIE. The Company determinesalso considers interests held by its related parties, including de facto agents. The Company assesses whether it is the primary beneficiarya member of a VIE by consideringrelated party group that collectively meets the power and benefits criteria and, if so, whether the Company is most closely associated with the VIE. In performing the related party analysis, the Company considers both qualitative and quantitative factors, including, but not limited to: which activities most significantly impact the VIE’s economic performance and which party controls such activities; the amount and characteristics of its investment;investment relative to the related party; the Company’s and the related party’s ability to control or significantly influence key decisions of the VIE including consideration of involvement by de facto agents; the obligation or likelihood for the Company or other intereststhe related party to provide financial support tofund operating losses of the VIE; considerationand the similarity and significance of the VIE’s purpose and design, including the risks the VIE was designedbusiness activities to create and pass through to its variable interest holders and the similarity with and significance to the business activitiesthose of the Company and the other interests.related party. The Company reassesses its determination of whether itan entity is a VIE, and whether the Company is the primary beneficiary, may involve significant judgment, including the determination of a VIE each reporting period. Significant judgments related to these determinations includewhich activities most significantly affect the entities’ performance, and estimates about the current and future fair valuevalues and performance of investmentsassets held by thesethe VIE.
Voting Interest Entities—Unlike VIEs, voting interest entities have sufficient equity to finance their activities and general market conditions.
equity investors exhibit the characteristics of a controlling financial interest through their voting rights. The Company evaluates its investmentsconsolidates such entities when it has the power to control these entities through ownership of a majority of the entities’ voting interests or through other arrangements.
At each reporting period, the Company reassesses whether changes in facts and financings, including investmentscircumstances cause a change in unconsolidated venturesthe status of an entity as a VIE or voting interest entity, and/or a change in the Company’s consolidation assessment.
Changes in consolidation status are applied prospectively. An entity may be consolidated as a result of this reassessment, in which case, the assets, liabilities and securitization financing transactions,noncontrolling interest in the entity are recorded at fair value upon initial consolidation. Any existing equity interest held by the Company in the entity prior to the Company obtaining control will be remeasured at fair value, which may result in a gain or loss recognized upon initial consolidation. However, if the consolidation represents an asset acquisition of a voting interest entity, the Company’s existing interest in the acquired assets, if any, is not remeasured to determine whether each investment or financing is a VIE.fair value but continues to be carried at historical cost. The Company analyzes new investments and financings,may also deconsolidate a subsidiary as well as reconsideration events for existing investments and financings,a result of this reassessment, which varymay result in a gain or loss recognized upon deconsolidation depending on typethe carrying values of investment or financing.deconsolidated assets and liabilities compared to the fair value of any interests retained.
As of June 30, 2018,2019, the Company has identified certain consolidated and unconsolidated VIEs. Assets of each of the VIEs, other than the OP, may only be used to settle obligations of the respective VIE. Creditors of each of the VIEs have no recourse to the general credit of the Company.
COLONY CREDIT REAL ESTATE, INC.
NOTES TO CONSOLIDATED FINANCIAL STATEMENTS (Continued)
(Unaudited)
Consolidated VIEs
The Company’s operating subsidiary, the OP, is a limited liability company that has governing provisions that are the functional equivalent of a limited partnership. The Company holds the majority of membership interest in the OP, is the managing member of the OP and exercises full responsibility, discretion and control over the day-to-day management of the OP. The noncontrolling interests in the OP do not have substantive liquidation rights, or substantive kick-out rights without cause, or substantive participating rights that could be exercised by a simple majority of noncontrolling interest members (including by such a member unilaterally). The absence of such rights, which represent voting rights in a limited partnership equivalent structure, would render the OP to be a VIE. The Company, as managing member, has the power to direct the core activities of the OP that most significantly affect the OP’s performance, and through its majority interest in the OP, has both the right to receive benefits from and the obligation to absorb losses of the OP. Accordingly, the Company is the primary beneficiary of the OP and consolidates the OP. As the Company conducts its business and holds its assets and liabilities through the OP, the total assets and liabilities of the OP represent substantially all of the total consolidated assets and liabilities of the Company.
COLONY CREDIT REAL ESTATE, INC.
NOTES TO CONSOLIDATED FINANCIAL STATEMENTS (Continued)
(Unaudited)
Other consolidated VIEs include the Investing VIEs (as defined and discussed below) and certain operating real estate properties that have noncontrolling interests. The noncontrolling interests in the operating real estate properties represent third party joint venture partners with ownership ranging from 3.5% to 20.0%. These noncontrolling interests do not have substantive kick-out ornor participating rights.
Investing VIEs
The Company’s investments in securitization financing entities (“Investing VIEs”) include subordinate first-loss tranches of securitization trusts, which represent interests in such VIEs. Investing VIEs are structured as pass through entities that receive principal and interest payments from the underlying debt collateral assets and distribute those payments to the securitization trust’s certificate holders, including the most subordinate tranches of the securitization trust. Generally, a securitization trust designates the most junior subordinate tranche outstanding as the controlling class, which entitles the holder of the controlling class to unilaterally appoint and remove the special servicer for the trust, and as such may qualify as the primary beneficiary of the trust.
If it is determined that the Company is the primary beneficiary of an Investing VIE as a result of acquiring the subordinate first-loss tranches of the securitization trust, the Company would consolidate the assets, liabilities, income and expenses of the entire Investing VIE. The assets held by an Investing VIE are restricted and can only be used to fulfill its own obligations. The obligations of an Investing VIE have neither any recourse to the general credit of the Company as the consolidatorconsolidating parent entity of an Investing VIE, nor to any of the Company’s other consolidated entities.
As of June 30, 2018,2019, the Company held subordinate tranches of securitization trusts in three Investing VIEs for which the Company has determined it is the primary beneficiary because it has the power to direct the activities that most significantly impact the economic performance of the securitization trusts. The Company’s subordinate tranches of the securitization trusts, which represent the retained interest and related interest income, are eliminated in consolidation. In accordance with the Financial Accounting Standards Board (“FASB”) ASC 810, Consolidation,As a result, all of the assets, liabilities (obligations to the certificate holders of the securitization trusts, less the Company’s retained interest from the subordinate tranches of the securitization trusts), income and expenses of the Investing VIEs are presented in the consolidated financial statements of the Company. As a result,Company although the Company legally owns the subordinate tranches of the securitization trusts only, U.S. GAAP requires the Company to present the assets, liabilities, income and expenses of the entire securitization trust on its consolidated financial statements.only. Regardless of the presentation, the Company’s consolidated financial statements of operations ultimately reflect the net income attributable to its retained interest in the subordinate tranches of the securitization trusts. Refer to Note 6, “Real Estate Securities, Available for Sale” for further discussion.
The Company elected the fair value option for the initial recognition of the assets and liabilities of its consolidated Investing VIEs. Interest income and interest expense associated with the Investing VIEs will be recordedare presented separately on the consolidated statements of operations. The Company will separately presentoperations, and the assets and liabilities of its consolidatedthe Investing VIEs are separately presented as “Mortgage loans held in securitization trusts, at fair value” and “Mortgage obligations issued by securitization trusts, at fair value,” respectively, on itsthe consolidated balance sheets. Refer to Note 15, “Fair Value” for further discussion.
The Company has adopted guidance issued by the FASB,Financial Accounting Standards Board (“FASB”), allowing the Company to measure both the financial assets and liabilities of a qualifying collateralized financing entity (“CFE”), such as its Investing VIEs, using the fair value of either the CFE’s financial assets or financial liabilities, whichever is more observable. A CFE is a VIE that holds financial assets, issues beneficial interests in those assets and has no more than nominal equity, and the beneficial interests have contractual recourse only to the related assets of the CFE. As the liabilities of the Company’s Investing VIEs are marketable securities with observable trade data, their fair value is more observable and is referenced to determine the fair value forof the assets of its Investing VIEs. Refer to Note 15, “Fair Value” for further discussion.
COLONY CREDIT REAL ESTATE, INC.
NOTES TO CONSOLIDATED FINANCIAL STATEMENTS (Continued)
(Unaudited)
Unconsolidated VIEsUse of Estimates
AsThe preparation of June 30, 2018,consolidated financial statements in conformity with U.S. GAAP requires management to make estimates and assumptions that affect the amounts reported in the consolidated financial statements and accompanying notes. Actual results could differ from those estimates and assumptions.
Principles of Consolidation
The accompanying consolidated financial statements include the accounts of the Company identified unconsolidated VIEs relatedand its controlled subsidiaries. The portions of the equity, net income and other comprehensive income of consolidated subsidiaries that are not attributable to its securities investments, indirectthe parent are presented separately as amounts attributable to noncontrolling interests in real estate through real estate private equity funds (“PE Investments”) and CRE debt investments. Assets of each of the VIEs may only be used to settle obligations of the respective VIE. Creditors of each of the VIEs have no recourse to the general credit of the Company.
COLONY CREDIT REAL ESTATE, INC.
NOTES TO CONSOLIDATED FINANCIAL STATEMENTS (Continued)
(Unaudited)
consolidated financial statements.
The following table presentsCompany consolidates entities in which it has a controlling financial interest by first considering if an entity meets the Company’s classification, carrying value and maximum exposuredefinition of unconsolidated VIEs as of June 30, 2018 (dollars in thousands):
|
| | | | | | | | |
| | | Carrying Value | | Maximum Exposure to Loss |
| Real estate securities, available for sale | | $ | 198,151 |
| | $ | 198,151 |
|
| Investments in unconsolidated ventures | | 359,711 |
| | 359,711 |
|
| Loans and preferred equity held for investment, net | | 288,885 |
| | 290,056 |
|
| Total assets | | $ | 846,747 |
| | $ | 847,918 |
|
Based on management’s analysis,a VIE for which the Company determined that it is notdeemed to be the primary beneficiary, or if the Company has the power to control an entity through a majority of the above VIEs. Accordingly, the VIEs are not consolidated in the Company’s financial statements as of June 30, 2018. The Company did not providevoting interest or through other arrangements.
Variable Interest Entities
Variable Interest Entities—A VIE is an entity that either (i) lacks sufficient equity to finance its activities without additional subordinated financial support tofrom other parties; (ii) whose equity holders lack the unconsolidated VIEs duringcharacteristics of a controlling financial interest; or (iii) is established with non-substantive voting rights. A VIE is consolidated by its primary beneficiary, which is defined as the six months ended June 30, 2018. As of June 30, 2018, there were no explicit arrangements or implicit variable interests that could require the Company to provide financial support to the unconsolidated VIEs.
Deconsolidation of the CLNY Investment Entities
Certain CLNY Investment Entities were joint ventures between Colony Capital and private funds or other investment vehicles managed by Colony Capital (the “Co-Investment Funds”). Colony Capital consolidated such CLNY Investment Entities as it was deemed to haveparty who has a controlling financial interest in these CLNY Investment Entities. After assuming Colony Capital’s ownershipthe VIE through (a) power to direct the activities of the VIE that most significantly affect the VIE’s economic performance, and (b) obligation to absorb losses or right to receive benefits of the VIE that could be significant to the VIE. The Company also considers interests in these CLNY Investment Entitiesheld by its related parties, including de facto agents. The Company assesses whether it is a member of a related party group that collectively meets the power and upon the merger with NorthStar Ibenefits criteria and, NorthStar II,if so, whether the Company doesis most closely associated with the VIE. In performing the related party analysis, the Company considers both qualitative and quantitative factors, including, but not have a controlling financial interest in these CLNY Investment Entities. The Company does not havelimited to: the amount and characteristics of its investment relative to the related party; the Company’s and the related party’s ability to directcontrol or significantly influence key decisions madeof the VIE including consideration of involvement by de facto agents; the directorsobligation or likelihood for the Company or the related party to fund operating losses of these entities northe VIE; and the similarity and significance of the VIE’s business activities to those of the Company and the related party. The determination of whether an entity is ita VIE, and whether the Company is the primary beneficiary, may involve significant judgment, including the determination of these entities as Colony Capital continues to bewhich activities most significantly affect the investment managerentities’ performance, and estimates about the current and future fair values and performance of assets held by the Co-Investment Funds and the directors and officers of these entities continue to be employees of Colony Capital. The Company itself is managed by a subsidiary of Colony Capital and does not have any employees of its own. Therefore, upon closing of the Combination, the Company deconsolidated the CLNY Investment Entities that are joint ventures with Co-Investment Funds.VIE.
The deconsolidation of these CLNY Investment Entities did not result in any gain or loss to the Company. The following table presents the deconsolidation of the assets and liabilities of certain of the CLNY Investment Entities, and accounting for the Company’s interests in these CLNY Investment Entities as equity method investments as of the Closing Date (dollars in thousands):
|
| | | |
| | As of the Closing Date |
| Assets | |
| Cash and cash equivalents | $ | (11,408 | ) |
| Restricted cash | (14,704 | ) |
| Loans and preferred equity held for investment, net | (553,678 | ) |
| Investments in unconsolidated ventures | 127,062 |
|
| Receivables, net | (4,344 | ) |
| Other assets | (114 | ) |
| Total assets | $ | (457,186 | ) |
| Liabilities | |
| Mortgage and other notes payable, net | $ | (128,709 | ) |
| Accrued and other liabilities | (640 | ) |
| Escrow deposits payable | (14,704 | ) |
| Total liabilities | (144,053 | ) |
| | |
| Stockholders’ equity | (313,133 | ) |
| Total liabilities and equity | $ | (457,186 | ) |
Voting Interest Entities
Entities—Unlike VIEs, voting interest entities have sufficient equity to finance their activities and equity investors exhibit the characteristics of a controlling financial interest through their voting rights. The Company consolidates such entities when it has the power to control these entities through ownership of a majority of the entities’ voting interests or through other arrangements.
COLONY CREDIT REAL ESTATE, INC.
NOTES TO CONSOLIDATED FINANCIAL STATEMENTS (Continued)
(Unaudited)
At each reporting period, the Company reassesses whether changes in facts and circumstances cause a change in the status of an entity as a VIE or voting interest entity, and/or a change in the Company’s consolidation assessment.
Changes in consolidation status are applied prospectively. An entity may be consolidated as a result of this reassessment, in which case, the assets, liabilities and noncontrolling interest in the entity are recorded at fair value upon initial consolidation. Any existing equity interest held by the Company in the entity prior to the Company obtaining control will be remeasured at fair value, which may result in a gain or loss recognized upon initial consolidation. However, if the consolidation represents an asset acquisition of a voting interest entity, the Company’s existing interest in the acquired assets, if any, is not remeasured to fair value but continues to be carried at historical cost. The Company may also deconsolidate a subsidiary as a result of this reassessment, which may result in a gain or loss recognized upon deconsolidation depending on the carrying values of deconsolidated assets and liabilities compared to the fair value of any interests retained.
Noncontrolling InterestsAs of June 30, 2019, the Company has identified certain consolidated and unconsolidated VIEs. Assets of each of the VIEs, other than the OP, may only be used to settle obligations of the respective VIE. Creditors of each of the VIEs have no recourse to the general credit of the Company.
Noncontrolling Interests
COLONY CREDIT REAL ESTATE, INC.
NOTES TO CONSOLIDATED FINANCIAL STATEMENTS (Continued)
(Unaudited)
Consolidated VIEs
The Company’s operating subsidiary, the OP, is a limited liability company that has governing provisions that are the functional equivalent of a limited partnership. The Company holds the majority of membership interest in Investment Entities—This representsthe OP, is the managing member of the OP and exercises full responsibility, discretion and control over the day-to-day management of the OP. The noncontrolling interests in the OP do not have substantive liquidation rights, substantive kick-out rights without cause, or substantive participating rights that could be exercised by a simple majority of noncontrolling interest members (including by such a member unilaterally). The absence of such rights, which represent voting rights in a limited partnership equivalent structure, would render the OP to be a VIE. The Company, as managing member, has the power to direct the core activities of the OP that most significantly affect the OP’s performance, and through its majority interest in the OP, has both the right to receive benefits from and the obligation to absorb losses of the OP. Accordingly, the Company is the primary beneficiary of the OP and consolidates the OP. As the Company conducts its business and holds its assets and liabilities through the OP, the total assets and liabilities of the OP represent substantially all of the total consolidated investment entities held byassets and liabilities of the Company.
Other consolidated VIEs include the Investing VIEs (as defined and discussed below) and certain operating real estate properties that have noncontrolling interests. The noncontrolling interests in the operating real estate properties represent third party joint venture partners with ownership ranging from 3.5% to 20.0%. These noncontrolling interests do not have substantive kick-out nor participating rights.
Investing VIEs
The Company’s investments in securitization financing entities (“Investing VIEs”) include subordinate first-loss tranches of securitization trusts, which represent interests in such VIEs. Investing VIEs are structured as pass through entities that receive principal and priorinterest payments from the underlying debt collateral assets and distribute those payments to the closingsecuritization trust’s certificate holders, including the most subordinate tranches of the Combination,securitization trust. Generally, a securitization trust designates the most junior subordinate tranche outstanding as the controlling class, which entitles the holder of the controlling class to unilaterally appoint and remove the special servicer for the trust, and as such interestsmay qualify as the primary beneficiary of the trust.
If it is determined that the Company is the primary beneficiary of an Investing VIE as a result of acquiring the subordinate first-loss tranches of the securitization trust, the Company would consolidate the assets, liabilities, income and expenses of the entire Investing VIE. The assets held by private funds managed by Colony Capital. Allocationan Investing VIE are restricted and can only be used to fulfill its own obligations. The obligations of an Investing VIE have neither any recourse to the general credit of the Company as the consolidating parent entity of an Investing VIE, nor to any of the Company’s other consolidated entities.
As of June 30, 2019, the Company held subordinate tranches of securitization trusts in three Investing VIEs for which the Company has determined it is the primary beneficiary because it has the power to direct the activities that most significantly impact the economic performance of the securitization trusts. The Company’s subordinate tranches of the securitization trusts, which represent the retained interest and related interest income, are eliminated in consolidation. As a result, all of the assets, liabilities (obligations to the certificate holders of the securitization trusts, less the Company’s retained interest from the subordinate tranches of the securitization trusts), income and expenses of the Investing VIEs are presented in the consolidated financial statements of the Company although the Company legally owns the subordinate tranches of the securitization trusts only. Regardless of the presentation, the Company’s consolidated financial statements of operations ultimately reflect the net income or loss is generally based upon relative ownership interests held by equity owners in each investment entity, or based upon contractual arrangements that may provide for disproportionate allocation of economic returns among equity interests, including using a hypothetical liquidation at book value basis, where applicable and substantive.
Noncontrolling Interests in the Operating Partnership—This represents membership interests in the OP held by RED REIT. Noncontrolling interests in the OP are allocated a share of net income or loss in the OP based on their weighted average ownershipattributable to its retained interest in the OP during the period. Noncontrolling interests in the OP have the right to require the OP to redeem part or allsubordinate tranches of the membership units in the OP for cash based on the market value of an equivalent number of shares of Class A common stock at the time of redemption, or at the Company’s election as managing member of the OP, through the issuance of shares of Class A common stock on a one-for-one basis.securitization trusts. Refer to Note 3, “Business Combinations,”6, “Real Estate Securities, Available for Sale” for further discussiondiscussion.
The Company elected the fair value option for the initial recognition of OP membership units. At the endassets and liabilities of each reporting period, noncontrollingits consolidated Investing VIEs. Interest income and interest expense associated with the Investing VIEs are presented separately on the consolidated statements of operations, and the assets and liabilities of the Investing VIEs are separately presented as “Mortgage loans held in securitization trusts, at fair value” and “Mortgage obligations issued by securitization trusts, at fair value,” respectively, on the consolidated balance sheets. Refer to Note 15, “Fair Value” for further discussion.
The Company has adopted guidance issued by the Financial Accounting Standards Board (“FASB”), allowing the Company to measure both the financial assets and liabilities of a qualifying collateralized financing entity (“CFE”), such as its Investing VIEs, using the fair value of either the CFE’s financial assets or financial liabilities, whichever is more observable. A CFE is a VIE that holds financial assets, issues beneficial interests in those assets and has no more than nominal equity, and the OP is adjustedbeneficial interests have contractual recourse only to reflect their ownership percentage in the OP at the endrelated assets of the period, through a reallocation between controllingCFE. As the liabilities of the Company’s Investing VIEs are marketable securities with observable trade data, their fair value is more observable and noncontrolling interests inis referenced to determine fair value of the OP, as applicable.assets of its Investing VIEs. Refer to Note 15, “Fair Value” for further discussion.
COLONY CREDIT REAL ESTATE, INC.
NOTES TO CONSOLIDATED FINANCIAL STATEMENTS (Continued)
(Unaudited)
Use of Estimates
The preparation of consolidated financial statements in conformity with U.S. GAAP requires management to make estimates and assumptions that affect the amounts reported in the consolidated financial statements and accompanying notes. Actual results could differ from those estimates and assumptions.
Principles of Consolidation
The accompanying consolidated financial statements include the accounts of the Company and its controlled subsidiaries. The portions of the equity, net income and other comprehensive income of consolidated subsidiaries that are not attributable to the parent are presented separately as amounts attributable to noncontrolling interests in the consolidated financial statements.
The Company consolidates entities in which it has a controlling financial interest by first considering if an entity meets the definition of a VIE for which the Company is deemed to be the primary beneficiary, or if the Company has the power to control an entity through a majority of voting interest or through other arrangements.
Variable Interest Entities
Variable Interest Entities—A VIE is an entity that either (i) lacks sufficient equity to finance its activities without additional subordinated financial support from other parties; (ii) whose equity holders lack the characteristics of a controlling financial interest; or (iii) is established with non-substantive voting rights. A VIE is consolidated by its primary beneficiary, which is defined as the party who has a controlling financial interest in the VIE through (a) power to direct the activities of the VIE that most significantly affect the VIE’s economic performance, and (b) obligation to absorb losses or right to receive benefits of the VIE that could be significant to the VIE. The Company also considers interests held by its related parties, including de facto agents. The Company assesses whether it is a member of a related party group that collectively meets the power and benefits criteria and, if so, whether the Company is most closely associated with the VIE. In performing the related party analysis, the Company considers both qualitative and quantitative factors, including, but not limited to: the amount and characteristics of its investment relative to the related party; the Company’s and the related party’s ability to control or significantly influence key decisions of the VIE including consideration of involvement by de facto agents; the obligation or likelihood for the Company or the related party to fund operating losses of the VIE; and the similarity and significance of the VIE’s business activities to those of the Company and the related party. The determination of whether an entity is a VIE, and whether the Company is the primary beneficiary, may involve significant judgment, including the determination of which activities most significantly affect the entities’ performance, and estimates about the current and future fair values and performance of assets held by the VIE.
Voting Interest Entities—Unlike VIEs, voting interest entities have sufficient equity to finance their activities and equity investors exhibit the characteristics of a controlling financial interest through their voting rights. The Company consolidates such entities when it has the power to control these entities through ownership of a majority of the entities’ voting interests or through other arrangements.
At each reporting period, the Company reassesses whether changes in facts and circumstances cause a change in the status of an entity as a VIE or voting interest entity, and/or a change in the Company’s consolidation assessment.
Changes in consolidation status are applied prospectively. An entity may be consolidated as a result of this reassessment, in which case, the assets, liabilities and noncontrolling interest in the entity are recorded at fair value upon initial consolidation. Any existing equity interest held by the Company in the entity prior to the Company obtaining control will be remeasured at fair value, which may result in a gain or loss recognized upon initial consolidation. However, if the consolidation represents an asset acquisition of a voting interest entity, the Company’s existing interest in the acquired assets, if any, is not remeasured to fair value but continues to be carried at historical cost. The Company may also deconsolidate a subsidiary as a result of this reassessment, which may result in a gain or loss recognized upon deconsolidation depending on the carrying values of deconsolidated assets and liabilities compared to the fair value of any interests retained.
As of June 30, 2019, the Company has identified certain consolidated and unconsolidated VIEs. Assets of each of the VIEs, other than the OP, may only be used to settle obligations of the respective VIE. Creditors of each of the VIEs have no recourse to the general credit of the Company.
COLONY CREDIT REAL ESTATE, INC.
NOTES TO CONSOLIDATED FINANCIAL STATEMENTS (Continued)
(Unaudited)
Consolidated VIEs
The Company’s operating subsidiary, the OP, is a limited liability company that has governing provisions that are the functional equivalent of a limited partnership. The Company holds the majority of membership interest in the OP, is the managing member of the OP and exercises full responsibility, discretion and control over the day-to-day management of the OP. The noncontrolling interests in the OP do not have substantive liquidation rights, substantive kick-out rights without cause, or substantive participating rights that could be exercised by a simple majority of noncontrolling interest members (including by such a member unilaterally). The absence of such rights, which represent voting rights in a limited partnership equivalent structure, would render the OP to be a VIE. The Company, as managing member, has the power to direct the core activities of the OP that most significantly affect the OP’s performance, and through its majority interest in the OP, has both the right to receive benefits from and the obligation to absorb losses of the OP. Accordingly, the Company is the primary beneficiary of the OP and consolidates the OP. As the Company conducts its business and holds its assets and liabilities through the OP, the total assets and liabilities of the OP represent substantially all of the total consolidated assets and liabilities of the Company.
Other consolidated VIEs include the Investing VIEs (as defined and discussed below) and certain operating real estate properties that have noncontrolling interests. The noncontrolling interests in the operating real estate properties represent third party joint venture partners with ownership ranging from 3.5% to 20.0%. These noncontrolling interests do not have substantive kick-out nor participating rights.
Investing VIEs
The Company’s investments in securitization financing entities (“Investing VIEs”) include subordinate first-loss tranches of securitization trusts, which represent interests in such VIEs. Investing VIEs are structured as pass through entities that receive principal and interest payments from the underlying debt collateral assets and distribute those payments to the securitization trust’s certificate holders, including the most subordinate tranches of the securitization trust. Generally, a securitization trust designates the most junior subordinate tranche outstanding as the controlling class, which entitles the holder of the controlling class to unilaterally appoint and remove the special servicer for the trust, and as such may qualify as the primary beneficiary of the trust.
If it is determined that the Company is the primary beneficiary of an Investing VIE as a result of acquiring the subordinate first-loss tranches of the securitization trust, the Company would consolidate the assets, liabilities, income and expenses of the entire Investing VIE. The assets held by an Investing VIE are restricted and can only be used to fulfill its own obligations. The obligations of an Investing VIE have neither any recourse to the general credit of the Company as the consolidating parent entity of an Investing VIE, nor to any of the Company’s other consolidated entities.
As of June 30, 2019, the Company held subordinate tranches of securitization trusts in three Investing VIEs for which the Company has determined it is the primary beneficiary because it has the power to direct the activities that most significantly impact the economic performance of the securitization trusts. The Company’s subordinate tranches of the securitization trusts, which represent the retained interest and related interest income, are eliminated in consolidation. As a result, all of the assets, liabilities (obligations to the certificate holders of the securitization trusts, less the Company’s retained interest from the subordinate tranches of the securitization trusts), income and expenses of the Investing VIEs are presented in the consolidated financial statements of the Company although the Company legally owns the subordinate tranches of the securitization trusts only. Regardless of the presentation, the Company’s consolidated financial statements of operations ultimately reflect the net income attributable to its retained interest in the subordinate tranches of the securitization trusts. Refer to Note 6, “Real Estate Securities, Available for Sale” for further discussion.
The Company elected the fair value option for the initial recognition of the assets and liabilities of its consolidated Investing VIEs. Interest income and interest expense associated with the Investing VIEs are presented separately on the consolidated statements of operations, and the assets and liabilities of the Investing VIEs are separately presented as “Mortgage loans held in securitization trusts, at fair value” and “Mortgage obligations issued by securitization trusts, at fair value,” respectively, on the consolidated balance sheets. Refer to Note 15, “Fair Value” for further discussion.
The Company has adopted guidance issued by the Financial Accounting Standards Board (“FASB”), allowing the Company to measure both the financial assets and liabilities of a qualifying collateralized financing entity (“CFE”), such as its Investing VIEs, using the fair value of either the CFE’s financial assets or financial liabilities, whichever is more observable. A CFE is a VIE that holds financial assets, issues beneficial interests in those assets and has no more than nominal equity, and the beneficial interests have contractual recourse only to the related assets of the CFE. As the liabilities of the Company’s Investing VIEs are marketable securities with observable trade data, their fair value is more observable and is referenced to determine fair value of the assets of its Investing VIEs. Refer to Note 15, “Fair Value” for further discussion.
COLONY CREDIT REAL ESTATE, INC.
NOTES TO CONSOLIDATED FINANCIAL STATEMENTS (Continued)
(Unaudited)
Unconsolidated VIEs
As of June 30, 2019, the Company identified unconsolidated VIEs related to its securities investments, indirect interests in real estate through real estate private equity funds (“PE Investments”) and CRE debt investments. Based on management’s analysis, the Company determined that it is not the primary beneficiary of the above VIEs. Accordingly, the VIEs are not consolidated in the Company’s financial statements as of June 30, 2019.
Assets of each of the VIEs may only be used to settle obligations of the respective VIE. Creditors of each of the VIEs have no recourse to the general credit of the Company.
The following table presents the Company’s classification, carrying value and maximum exposure of unconsolidated VIEs as of June 30, 2019 (dollars in thousands):
|
| | | | | | | | |
| | | Carrying Value | | Maximum Exposure to Loss |
| Real estate securities, available for sale | | $ | 249,100 |
| | $ | 232,806 |
|
| Investments in unconsolidated ventures | | 457,917 |
| | 469,361 |
|
| Loans and preferred equity held for investment, net | | 119,196 |
| | 119,196 |
|
| Total assets | | $ | 826,213 |
| | $ | 821,363 |
|
The Company did not provide financial support to the unconsolidated VIEs during the six months ended June 30, 2019. As of June 30, 2019, there were no explicit arrangements or implicit variable interests that could require the Company to provide financial support to the unconsolidated VIEs. The maximum exposure to loss of real estate securities, available for sale was determined as the amortized cost, which represents the purchase price of the investments adjusted by any unamortized premiums or discounts as of the reporting date. The maximum exposure to loss of investments in unconsolidated ventures and loans and preferred equity held for investment, net was determined as the carrying value plus any future funding commitments. Refer to Note 4, “Loans and Preferred Equity Held for Investment, net” and Note 17, “Commitments and Contingencies” for further discussion.
Deconsolidation of the CLNY Investment Entities
Certain CLNY Investment Entities were joint ventures between Colony Capital and private funds or other investment vehicles managed by Colony Capital (the “Co-Investment Funds”). Colony Capital consolidated such CLNY Investment Entities as it was deemed to have a controlling financial interest in these CLNY Investment Entities. After assuming Colony Capital’s ownership interests in these CLNY Investment Entities and upon the merger with NorthStar I and NorthStar II, the Company does not have a controlling financial interest in these CLNY Investment Entities. The Company does not have the ability to direct key decisions made by the directors of these entities nor is it the primary beneficiary of these entities as Colony Capital continues to be the investment manager of the Co-Investment Funds and the directors and officers of these entities continue to be employees of Colony Capital. The Company itself is managed by a subsidiary of Colony Capital and does not have any employees of its own. Therefore, upon closing of the Combination, the Company deconsolidated the CLNY Investment Entities that are joint ventures with Co-Investment Funds.
COLONY CREDIT REAL ESTATE, INC.
NOTES TO CONSOLIDATED FINANCIAL STATEMENTS (Continued)
(Unaudited)
The deconsolidation of these CLNY Investment Entities did not result in any gain or loss to the Company. The following table presents the deconsolidation of the assets and liabilities of certain of the CLNY Investment Entities, and accounting for the Company’s interests in these CLNY Investment Entities as equity method investments as of the Closing Date (dollars in thousands):
|
| | | |
| | As of the Closing Date |
| Assets | |
| Cash and cash equivalents | $ | (11,408 | ) |
| Restricted cash | (14,704 | ) |
| Loans and preferred equity held for investment, net | (553,678 | ) |
| Investments in unconsolidated ventures | 127,062 |
|
| Receivables, net | (4,344 | ) |
| Other assets | (114 | ) |
| Total assets | $ | (457,186 | ) |
| Liabilities | |
| Mortgage and other notes payable, net | $ | (128,709 | ) |
| Accrued and other liabilities | (640 | ) |
| Escrow deposits payable | (14,704 | ) |
| Total liabilities | (144,053 | ) |
| | |
| Stockholders’ equity | (313,133 | ) |
| Total liabilities and equity | $ | (457,186 | ) |
Prior to the deconsolidation of the CLNY Investment Entities, noncontrolling interest as recorded in the CLNY Investment Entities combined financial statements consisted of interests in the held by third party joint ventures. Following the deconsolidation of the CLNY Investment Entities, the noncontrolling interest in the Company’s consolidated financial statements additionally consists of Colony Capital ownership interests in joint ventures. These interests were previously classified as other owners in the CLNY Investment Entities combined financial statements, but have been reclassified to noncontrolling interests in the Company’s consolidated financial statements.
Noncontrolling Interests
Noncontrolling Interests in Investment Entities—This represents interests in consolidated investment entities held by third party joint venture partners and prior to the closing of the Combination, such interests held by private funds managed by Colony Capital. Allocation of net income or loss is generally based upon relative ownership interests held by equity owners in each investment entity, or based upon contractual arrangements that may provide for disproportionate allocation of economic returns among equity interests, including using a hypothetical liquidation at book value basis, where applicable and substantive.
Noncontrolling Interests in the Operating Partnership—This represents membership interests in the OP held by RED REIT. Noncontrolling interests in the OP are allocated a share of net income or loss in the OP based on their weighted average ownership interest in the OP during the period. Noncontrolling interests in the OP have the right to require the OP to redeem part or all of the membership units in the OP for cash based on the market value of an equivalent number of shares of Class A common stock at the time of redemption, or at the Company’s election as managing member of the OP, through the issuance of shares of Class A common stock on a one-for-one basis. Refer to Note 3, “Business Combination,” for further discussion of OP membership units. At the end of each reporting period, noncontrolling interests in the OP is adjusted to reflect their ownership percentage in the OP at the end of the period, through a reallocation between controlling and noncontrolling interests in the OP, as applicable.
Comprehensive Income (Loss)
The Company reports consolidated comprehensive income (loss) in separate statements following the consolidated statements of operations. Comprehensive income (loss) is defined as the change in equity resulting from net income (loss) and other comprehensive income (“OCI”). The only componentcomponents of OCI isinclude unrealized gain (loss) on CRE debt securities available for sale for which the fair value option was not elected.elected, gain (loss) on derivative instruments used in the Company’s risk management activities used for economic hedging purposes (“designated hedges”), and gain (loss) on foreign currency translation.
COLONY CREDIT REAL ESTATE, INC.
NOTES TO CONSOLIDATED FINANCIAL STATEMENTS (Continued)
(Unaudited)
Fair Value Measurement
Fair value is based on an exit price, defined as the price that would be received to sell an asset or paid to transfer a liability in an orderly transaction between market participants. Where appropriate, the Company makes adjustments to estimated fair values to appropriately reflect counterparty credit risk as well as the Company’s own credit-worthiness.
The estimated fair value of financial assets and financial liabilities are categorized into a three-tier hierarchy, prioritized based on the level of transparency in inputs used in the valuation techniques, as follows:
Level 1—Quoted prices (unadjusted) in active markets for identical assets or liabilities.
Level 2—Observable inputs other than Level 1 prices, such as quoted prices for similar assets or liabilities, quoted prices in non-active markets, or valuation techniques utilizing inputs that are derived principally from or corroborated by observable data directly or indirectly for substantially the full term of the financial instrument.
Level 3—At least one assumption or input is unobservable and it is significant to the fair value measurement, requiring significant management judgment or estimate.
Where the inputs used to measure the fair value of a financial instrument fall into different levels of the fair value hierarchy, the financial instrument is categorized within the hierarchy based on the lowest level of input that is significant to its fair value measurement.
COLONY CREDIT REAL ESTATE, INC.
NOTES TO CONSOLIDATED FINANCIAL STATEMENTS (Continued)
(Unaudited)
Fair Value Option
The fair value option provides an option to elect fair value as an alternative measurement for selected financial instruments. Gains and losses on items for which the fair value option has been elected are reported in earnings. The fair value option may be elected only upon the occurrence of certain specified events, including when the Company enters into an eligible firm commitment, at initial recognition of the financial instrument, as well as upon a business combination or consolidation of a subsidiary. The election is irrevocable unless a new election event occurs.
The Company has elected the fair value option for PE Investments. The Company has also elected the fair value option to account for the eligible financial assets and liabilities of its consolidated Investing VIEs in order to mitigate potential accounting mismatches between the carrying value of the instruments and the related assets and liabilities to be consolidated. The Company has adopted guidance issued by the FASB allowing the Company to measure both the financial assets and liabilities of a qualifying CFE it consolidates using the fair value of either the CFE’s financial assets or financial liabilities, whichever is more observable.
Business Combinations
Definition of a Business—The Company evaluates each purchase transaction to determine whether the acquired assets meet the definition of a business. If substantially all of the fair value of gross assets acquired is concentrated in a single identifiable asset or a group of similar identifiable assets, then the set of transferred assets and activities is not a business. If not, for an acquisition to be considered a business, it would have to include an input and a substantive process that together significantly contribute to the ability to create outputs (i.e., there is a continuation of revenue before and after the transaction). A substantive process is not ancillary or minor, cannot be replaced without significant cost,costs, effort or delay or is otherwise considered unique or scarce. To qualify as a business without outputs, the acquired assets would require an organized workforce with the necessary skills, knowledge and experience that performs a substantive process.
Net cash paidAsset Acquisitions—For acquisitions that are not deemed to acquirebe businesses, the assets acquired are recognized based on their cost to the Company as the acquirer and no gain or loss is recognized. The cost of assets acquired in a business orgroup is allocated to individual assets is classified as investing activitieswithin the group based on their relative fair values and does not give rise to goodwill. Transaction costs related to the accompanying statementsacquisition of cash flows.assets are included in the cost basis of the assets acquired.
Business Combinations—The Company accounts for acquisitions that qualify as business combinations by applying the acquisition method. Transaction costs related to the acquisition of a business are expensed as incurred and excluded from the fair value of consideration transferred. The identifiable assets acquired, liabilities assumed and noncontrolling interests in an acquired entity are recognized and measured at their estimated fair values. The excess of the fair value of consideration transferred over the fair values of identifiable assets acquired, liabilities assumed and noncontrolling interests in an acquired entity, net of fair value of any previously held interest in the acquired entity, is recorded as goodwill. Such valuations require management to make significant estimates and assumptions.
For acquisitions that are not deemed to be businesses, the assets acquired are recognized based on their cost to the Company as the acquirer and no gain or loss is recognized unless the fair value
COLONY CREDIT REAL ESTATE, INC.
NOTES TO CONSOLIDATED FINANCIAL STATEMENTS (Continued)
(Unaudited)
Cash and Cash Equivalents
Short-term, highly liquid investments with original maturities of three months or less are considered to be cash equivalents. The Company did not have any cash equivalents at June 30, 20182019 or December 31, 2017.2018. The Company’s cash is held with major financial institutions and may at times exceed federally insured limits.
Restricted Cash
Restricted cash consists primarily of borrower escrow deposits, tenant escrow deposits and real estate capital expenditure reserves.
Loans and Preferred Equity Held for Investment
The Company originates and purchases loans and preferred equity held for investment. The accounting framework for loans and preferred equity held for investment depends on the Company’s strategy whether to hold or sell the loan, whether the loan was credit-impaired at the time of acquisition, or if the lending arrangement is an acquisition, development and construction loan.
Loans and Preferred Equity Held for Investment
Loans and preferred equity that the Company has the intent and ability to hold for the foreseeable future are classified as held for investment. Originated loans and preferred equity are recorded at amortized cost, or outstanding unpaid principal balance plus exit fees less net deferred loan fees. Net deferred loan fees include unamortized origination and other fees charged to the borrower less
COLONY CREDIT REAL ESTATE, INC.
NOTES TO CONSOLIDATED FINANCIAL STATEMENTS (Continued)
(Unaudited)
direct incremental loan origination costs incurred by the Company. Purchased loans and preferred equity are recorded at amortized cost, or unpaid principal balance plus purchase premium or less unamortized discount. Costs to purchase loans and preferred equity are expensed as incurred.
Interest Income—Interest income is recognized based upon contractual interest rate and unpaid principal balance of the loans and preferred equity investments. Net deferred loan fees on originated loans and preferred equity investments are deferred and amortized as adjustments to interest income over the expected life of the loans and preferred equity investments using the effective yield method. Premium or discount on purchased loans and preferred equity investments are amortized as adjustments to interest income over the expected life of the loans and preferred equity investments using the effective yield method. When a loan or preferred equity investment is prepaid, prepayment fees and any excess of proceeds over the carrying amount of the loan or preferred equity investment is recognized as additional interest income.
Nonaccrual—Accrual of interest income is suspended on nonaccrual loans and preferred equity investments. Loans and preferred equity investments that are past due 90 days or more as to principal or interest, or where reasonable doubt exists as to timely collection, are generally considered nonperforming and placed on nonaccrual. Interest receivable is reversed against interest income when loans and preferred equity investments are placed on nonaccrual status. Interest collectioncollected is recognized on nonaccruing loansa cash basis by crediting income when received; or if ultimate collectability of loan and preferred equity investments for which ultimate collectability of principal is uncertain, interest collected is recognized using a cost recovery method by applying interest collected as a reduction to loan and preferred equity principal; otherwise, interest collected is recognized on a cash basis by crediting to income when received.carrying value. Loans and preferred equity investments may be restored to accrual status when all principal and interest isare current and full repayment of the remaining contractual principal and interest isare reasonably assured.
Impairment and Allowance for Loan Losses—On a periodic basis, the Company analyzes the extent and effect of any credit migration from underwriting and the initial investment review associated with the performance of a loan and preferred equity investment and/or value of its underlying collateral, financial and operating capability of the borrower or sponsor, as well as amount and status of any senior loan, where applicable. Specifically, operating results of collateral properties and any cash reserves are analyzed and used to assess whether cash from operations are sufficient to cover debt service requirements currently and into the future, ability of the borrower to refinance the loan or preferred equity investment, liquidation value of collateral properties, and financial wherewithal of any loan guarantors, as well as the borrower’s competency in managing and operating the collateral properties. Such analysis is performed at least quarterly, or more often as needed when impairment indicators are present. During the three and six months ended June 30, 2019, the Company recorded $110.3 million of provision for loan loss. See Note 4, “Loans and Preferred Equity Held for Investment, net” for further detail.
Loans and preferred equity investments are considered to be impaired when it is probable that the Company will not be able to collect all amounts due in accordance with contractual terms of the loans and preferred equity investments, including consideration of underlying collateral value. Allowance for loan losses represents the estimated probable credit losses inherent in loans and preferred equity held for investment at balance sheet date. Changes in allowance for loan and preferred equity losses are recorded in the provision for loan losses on the statement of operations. Allowance for loan losses generally exclude interest receivable as accrued interest receivable is reversed when a loan or preferred equity investment is placed on nonaccrual status. Allowance for loan losses is generally measured as the difference between the carrying value of the loan or preferred equity investment and either
COLONY CREDIT REAL ESTATE, INC.
NOTES TO CONSOLIDATED FINANCIAL STATEMENTS (Continued)
(Unaudited)
the present value of cash flows expected to be collected, discounted at the original effective interest rate of the loan or preferred equity investment or an observable market price for the loan or preferred equity investment. Subsequent changes in impairment are recorded as adjustments to the provision for loan losses. Loans and preferred equity investments are charged off against allowance for loan losses when all or a portion of the principal amount is determined to be uncollectible. A loan or preferred equity investment is considered to be collateral-dependent when repayment of the loan or preferred equity investment is expected to be provided solely by the underlying collateral. Impaired collateral-dependent loans and preferred equity investments are written down to the fair value of the collateral less disposal cost, first through a provision and a charge-off against allowance for loan losses, if any, then recorded as impairment loss.losses.
Troubled Debt Restructuring (“TDR”)—A loan with contractual terms modified in a manner that grants concession to the borrower who is experiencing financial difficulty is classified as a TDR. Concessions could include term extensions, payment deferrals, interest rate reductions, principal forgiveness, forbearance, or other actions designed to maximize the Company’s collection on the loan. As a TDR is generally considered to be an impaired loan, it is measured for impairment based on the Company’s allowance for loan losses methodology.
Loans Held for Sale
Loans that the Company intends to sell or liquidate in the foreseeable future are classified as held for sale. Loans held for sale are carried at the lower of amortized cost or fair value less disposal cost, with valuation changes recognized as impairment loss. Loans held for sale are not subject to allowance for loan losses. Net deferred loan origination fees and loan purchase premiums or discounts
COLONY CREDIT REAL ESTATE, INC.
NOTES TO CONSOLIDATED FINANCIAL STATEMENTS (Continued)
(Unaudited)
are deferred and capitalized as part of the carrying value of the held for sale loan until the loan is sold, therefore included in the periodic valuation adjustments based on lower of cost or fair value less disposal cost.
Acquisition, Development and Construction (“ADC”) Loan Arrangements
The Company provides loans to third party developers for the acquisition, development and construction of real estate. Under an ADC loan arrangement, the Company participates in the expected residual profits of the project through the sale, refinancing or other use of the property. The Company evaluates the characteristics of each ADC loan arrangement, including its risks and rewards, to determine whether they are more similar to those associated with a loan or an investment in real estate. ADC loan arrangements with characteristics implying loan classification are presented as loans held for investment and result in the recognition of interest income. ADC loan arrangements with characteristics implying real estate joint ventures are presented as investments in unconsolidated joint ventures and are accounted for using the equity method. The classification of each ADC loan arrangement as either loan receivable or real estate joint venture involves significant judgment and relies on various factors, including market conditions, amount and timing of expected residual profits, credit enhancements in the form of guaranties, estimated fair value of the collateral, and significance of borrower equity in the project, among others. The classification of ADC loan arrangements is performed at inception, and periodically reassessed when significant changes occur in the circumstances or conditions described above.
Operating Real Estate
Real Estate Acquisitions—Real estate acquired in acquisitions that are deemed to be business combinations is recorded at the fair values of the acquired components at the time of acquisition, allocated among land, buildings, improvements, equipment and lease-related tangible and identifiable intangible assets and liabilities, including foregoneforgone leasing costs, in-place lease values and above- or below-market lease values. Real estate acquired in acquisitions that are deemed to be asset acquisitions is recorded at the total value of consideration transferred, including transaction costs, and allocated to the acquired components based upon relative fair value. The estimated fair value of acquired land is derived from recent comparable sales of land and listings within the same local region based on available market data. The estimated fair value of acquired buildings and building improvements is derived from comparable sales, discounted cash flow analysis using market-based assumptions, or replacement cost, as appropriate.The fair value of site and tenant improvements is estimated based upon current market replacement costs and other relevant market rate information.
Real Estate Held for Investment
Real estate held for investment is carried at cost less accumulated depreciation.
Costs Capitalized or Expensed—Expenditures for ordinary repairs and maintenance are expensed as incurred, while expenditures for significant renovations that improve or extend the useful life of the asset are capitalized and depreciated over their estimated useful lives.
COLONY CREDIT REAL ESTATE, INC.
NOTES TO CONSOLIDATED FINANCIAL STATEMENTS (Continued)
(Unaudited)
Depreciation—Real estate held for investment, other than land, areis depreciated on a straight-line basis over the estimated useful lives of the assets, as follows:
|
| | |
| Real Estate Assets | | Term |
| Building (fee interest) | | 7 to 5348 years |
| Building leasehold interests | | Lesser of remaining term of the lease or remaining life of the building |
| Building improvements | | Lesser of the useful life or remaining life of the building |
| Land improvements | | 61 to 1215 years |
| Tenant improvements | | Lesser of the useful life or remaining term of the lease |
| Furniture, fixtures and equipment | | 72 to 8 years |
Impairment—The Company evaluates its real estate held for investment for impairment periodically or whenever events or changes in circumstances indicate that the carrying amounts may not be recoverable. The Company evaluates cash flows and determines impairmentsreal estate for impairment generally on an individual property basis. In making this determination,If an impairment indicator exists, the Company reviews,evaluates the undiscounted future net cash flows that are expected to be generated by the property, including any estimated proceeds from the eventual disposition of the property. If multiple outcomes are under consideration, the Company may apply a probability-weighted approach to the impairment analysis. Based upon the analysis, if the carrying value of a property exceeds its undiscounted future net cash flows, an impairment loss is recognized for the excess of the carrying value of the property over the estimated fair value of the property. In evaluating and/or measuring impairment, the Company considers, among other things, current and estimated future cash flows associated with each property, market information for each sub-market, including, where applicable, competition levels, foreclosure levels, leasing trends, occupancy trends, lease or room rates, and the market prices of similar properties recently sold or currently being offered for sale, and other quantitative and qualitative factors. Another key consideration in this assessment is the Company’s assumptions about the highest and best use of its real estate investments and its intent and ability to hold them for a reasonable period that would allow for the recovery of their carrying values. If an impairment indicator exists,such assumptions change and the Company evaluates whethershortens its expected hold period, this may result in the expected future undiscounted cash flows is less thanrecognition of impairment losses. During the carrying amount of the asset,
COLONY CREDIT REAL ESTATE, INC.
NOTES TO CONSOLIDATED FINANCIAL STATEMENTS (Continued)
(Unaudited)
three and ifsix months ended June 30, 2019, the Company determines that the carrying value is not recoverable, anrecorded a $10.1 million impairment loss is recordedon its operating real estate portfolio. See Note 7, “Real Estate, net and Real Estate Held for the difference between the estimated fair valueSale” and the carrying amount of the asset.Note 15, “Fair Value,” for further detail.
Real Estate Held for Sale
Classification as Held for Sale—Real estate is classified as held for sale in the period when (i) management approves a plan to sell the asset, (ii) the asset is available for immediate sale in its present condition, subject only to usual and customary terms, (iii) a program is initiated to locate a buyer and actively market the asset for sale at a reasonable price, and (iv) completion of the sale is probable within one year. Real estate held for sale is stated at the lower of its carrying amount or estimated fair value less disposal cost, with any write-down to fair value less disposal cost recorded as an impairment loss. For any increase in fair value less disposal cost subsequent to classification as held for sale, the impairment loss may be reversed, but only up to the amount of cumulative loss previously recognized. Depreciation is not recorded on assets classified as held for sale. At the time a sale is consummated, the excess, if any, of sale price less selling costs over carrying value of the real estate is recognized as a gain.
If circumstances arise that were previously considered unlikely and, as a result, the Company decides not to sell the real estate asset previously classified as held for sale, the real estate asset is reclassified as held for investment. Upon reclassification, the real estate asset is measured at the lower of (i) its carrying amount prior to classification as held for sale, adjusted for depreciation expense that would have been recognized had the real estate been continuously classified as held for investment, and (ii) its estimated fair value at the time the Company decides not to sell.
During the three months ended June 30, 2019, the Company classified its student housing portfolio, a retail property, and a hotel as held for sale. See Note 7, “Real Estate, net and Real Estate Sales—The Company evaluates if real estate sale transactions qualifyHeld for recognition under the full accrual method, considering whether, among other criteria, the buyer’s initialSale” and continuing investments are adequate to demonstrate a commitment to pay, any receivable due to the Company is not subject to future subordination, the Company has transferred to the buyer the usual risks and rewards of ownership and the Company does not have a substantial continuing involvement with the sold real estate. At the time the sale is consummated, a gain or loss is recognized as the difference between the sale price less disposal cost and the carrying value of the real estate.Note 20, “Subsequent Events” for further detail.
Foreclosed Properties
The Company receives foreclosed properties in full or partial settlement of loans held for investment by taking legal title or physical possession of the properties. Foreclosed properties are generally recognized generally, at the time the real estate is received at foreclosure sale or upon execution of a deed in lieu of foreclosure. Foreclosed properties are initially measured at fair value. Deficiencies compared toIf the fair value of the property is lower than the carrying value of the loan, after reversing any previouslythe difference is recognized as provision for loan loss provisionand the cumulative loss allowance on the loan are recorded as impairment loss.is charged off. The Company periodically evaluates foreclosed properties for subsequent decrease in fair value, which is recorded as an additional impairment loss. Fair value of foreclosed properties is generally based on third party appraisals, broker price opinions, comparable sales or a combination thereof.
COLONY CREDIT REAL ESTATE, INC.
NOTES TO CONSOLIDATED FINANCIAL STATEMENTS (Continued)
(Unaudited)
Real Estate Securities
The Company classifies its CRE securities investments as available for sale on the acquisition date, which are carried at fair value. Unrealized gains (losses) are recorded as a component of accumulated OCI in the consolidated statements of equity. However, the Company has elected the fair value option for certainthe assets and liabilities of its available for sale securities,consolidated Investing VIEs, and as a result, any unrealized gains (losses) on such securitiesthe consolidated Investing VIEs are recorded in unrealized gain (loss) on mortgage loans and obligations held in securitization trusts, net in the consolidated statements of operations. As of June 30, 2018,2019, the Company held subordinate tranches of three securitization trusts, which represent the Company’s retained interest in the securitization trusts, which the Company consolidates under U.S. GAAP. Refer to Note 6, “Real Estate Securities, Available for Sale” for further discussion.
Impairment
CRE securities for which the fair value option is elected are not evaluated for other-than-temporary impairment (“OTTI”) as any change in fair value is recorded in the consolidated statements of operations. Realized losses on such securities are reclassified to realized gain (loss)loss on investmentsmortgage loans and obligations held in securitization trust, net as losses occur.
CRE securities for which the fair value option is not elected are evaluated for OTTI quarterly. Impairment of a security is considered to be other-than-temporary when: (i) the holder has the intent to sell the impaired security; (ii) it is more likely than not the holder will be required to sell the security; or (iii) the holder does not expect to recover the entire amortized cost of the security. When a CRE security has been deemed to be other-than-temporarily impaired due to (i) or (ii), the security is written down to its fair value and an OTTI is recognized in the consolidated statements of operations. In the case of (iii), the security is written down to its fair value and the amount of OTTI is then bifurcated into: (a) the amount related to expected credit losses; and (b) the amount related to fair value adjustments in excess of expected credit losses. The portion of OTTI related to expected credit losses is recognized in the consolidated statements of operations. The remaining OTTI related to the valuation adjustment is recognized as a component
COLONY CREDIT REAL ESTATE, INC.
NOTES TO CONSOLIDATED FINANCIAL STATEMENTS (Continued)
(Unaudited)
of accumulated OCI in the consolidated statements of equity. CRE securities which are not high-credit quality are considered to have an OTTI if the security has an unrealized loss and there has been an adverse change in expected cash flow. The amount of OTTI is then bifurcated as discussed above. As of June 30, 2018, the Company did not have any OTTI recorded on its CRE securities.
Investments in Unconsolidated Ventures
A noncontrolling, unconsolidated ownership interest in an entity may be accounted for using theone of (i) equity method where applicable; (ii) fair value option if elected; (iii) fair value through earnings if fair value is readily determinable, including election of net asset value (“NAV”) practical expedient where applicable; or (iv) for equity investments without readily determinable fair values, the measurement alternative to measure at cost adjusted for any impairment and observable price changes, as applicable.
Fair value changes of equity method orinvestments under the fair value option if elected.are recorded in earnings from investments in unconsolidated ventures. Fair value changes of other equity investments, including adjustments for observable price changes under the measurement alternative, are recorded in other gain (loss).
Equity Method Investments
The Company accounts for investments under the equity method of accounting if they haveit has the ability to exercise significant influence over the operating and financial policies of an entity, but dodoes not have a controlling financial interest. The equity method investment is initially recorded at cost and adjusted each period for capital contributions, distributions and the Company’s share of the entity’s net income or loss as well as other comprehensive income or loss. The Company’s share of net income or loss may differ from the stated ownership percentage interest in an entity if the governing documents prescribe a substantive non-pro ratanon-proportionate earnings allocation formula or a preferred return to certain investors. For certain equity method investments, the Company records its proportionate share of income on a one to three month lag. Distributions of operating profits from equity method investments are reported as operating activities, while distributions in excess of operating profits or those related to capital transactions, such as financing transactions or sales, are reported as investing activities in the statement of cash flows.
Investments that do not qualify for equity method accounting are accounted forflows under the cost method. The Company elected the fair value option for certain cost method investments, specifically limited partnership interests in PE Investments. The Company records the change in fair value for their share of the projected future cash flows of such investments in equity incumulative earnings (losses) of unconsolidated ventures. Any change in fair value attributed to market related assumptions is recorded in other gain (loss), net, on the statement of operations.approach.
At June 30, 2019 and December 31, 2018, the Company’s investments in unconsolidated joint ventures consisted of investments in PE Investments, senior loans, mezzanine loans and preferred equity held in joint ventures, as well as ADC loan arrangements accounted for as equity method investments. At December 31, 2017, the Company’s investments in unconsolidated ventures consisted of investments in PE Investments and ADC loan arrangements accounted for as equity method investments.
Impairment—Impairment
Evaluation of impairment applies to equity method investments and equity investments under the measurement alternative. If indicators of impairment exist, the Company performs an evaluation of its equity method investments to assess whetherwill first estimate the fair value of theirits investment. In assessing fair value, the Company
COLONY CREDIT REAL ESTATE, INC.
NOTES TO CONSOLIDATED FINANCIAL STATEMENTS (Continued)
(Unaudited)
generally considers, among others, the estimated enterprise value of the investee or fair value of the investee's underlying net assets, including net cash flows to be generated by the investee as applicable.
For investments under the measurement alternative, if carrying value of the investment exceeds its fair value, an impairment is deemed to have occurred.
For equity method investments, further consideration is made if a decrease in value of the investment is less thanother-than-temporary to determine if impairment loss should be recognized. Assessment of OTTI involves management judgment, including, but not limited to, consideration of the investee’s financial condition, operating results, business prospects and creditworthiness, the Company’s ability and intent to hold the investment until recovery of its carrying value. Tovalue, or a significant and prolonged decline in traded price of the extentinvestee’s equity security. If management is unable to reasonably assert that an impairment is temporary or believes that the decrease inCompany may not fully recover the carrying value of its investment, then the impairment is considered to be other-than-temporary and an impairment has occurred, the investment isother-than-temporary.
Investments that are other-than-temporarily impaired are written down to itstheir estimated fair value,value. Impairment loss is recorded in earnings from investmentinvestments in unconsolidated ventures.ventures for equity method investments and in other gain (loss) for investments under the measurement alternative.
During the three and six months ended June 30, 2019, the Company’s equity in earnings of unconsolidated ventures included its $8.8 million proportionate share of impairment on a senior loan. See Note 5, “Investments in Unconsolidated Ventures” for further information.
Identifiable Intangibles
In a business combination or asset acquisition, the Company may recognize identifiable intangibles that meet either or both the contractual-legal criterion or the separability criterion. Indefinite-lived intangibles areAn indefinite-lived intangible is not subject to amortization until such time that its useful life is determined to no longer be indefinite, at which point, it will be assessed for impairment and its adjusted carrying amount amortized over its remaining useful life. Finite-lived intangibles are amortized over their useful life in a manner that reflects the pattern in which the intangible is being consumed if readily determinable, such as based upon expected cash flows; otherwise they are amortized on a straight line basis. The useful life of all identified intangibles will be periodically reassessed and if useful life changes, the carrying amount of the intangible will be amortized prospectively over the revised useful life. Finite-lived intangibles are periodically reviewed for impairment and an impairment loss is recognized if the carrying amount of the intangible is not recoverable and exceeds its fair value. An impairment establishes a new basis for the identifiable intangibles and any impairment loss recognized is not subject to subsequent reversal.
Lease Intangibles—Identifiable intangibles recognized in acquisitions of operating real estate properties generally include in-place leases, above- or below-market leases and deferred leasing costs.costs, all of which have finite lives. In-place leases generate value over and above the tangible real estate because a property that is occupied with leased space is typically worth more than a vacant building without an operating lease contract in place. The estimated fair value of acquired in-place leases is derived based on management’s assessment of costs avoided from having tenants in place, including lost rental income, rent concessions and tenant allowances or reimbursements, that hypothetically would be incurred to lease a vacant building to its actual existing occupancy level on the valuation date. The net amount recorded for acquired in-place leases is included in intangible assets and amortized on a straight-line basis as an increase to depreciation and amortization expense over the remaining term of the applicable leases. If an in-place lease is terminated, the unamortized portion is charged to depreciation and amortization expense.
COLONY CREDIT REAL ESTATE, INC.
NOTES TO CONSOLIDATED FINANCIAL STATEMENTS (Continued)
(Unaudited)
The estimated fair value of the above- or below-market component of acquired leases represents the present value of the difference between contractual rents of acquired leases and market rents at the time of the acquisition for the remaining lease term, discounted for tenant credit risks. Above- or below-market operating lease values are amortized on a straight-line basis as a decrease or increase to rental income, respectively, over the applicable lease terms. This includes fixed rate renewal options in acquired leases that are below-market, which isare amortized to decrease rental income over the renewal period. Above- or below-market ground lease obligations are amortized on a straight-line basis as a decrease or increase to rent expense, respectively, over the applicable lease terms. If the above- or below-market operating lease values or above- or below-market ground lease obligations are terminated, the unamortized portion of the lease intangibles are recorded in rental income or rent expense, respectively.
Deferred leasing costs represent management’s estimationestimate of the avoided leasing commissions and legal fees associated with an existing in-place lease. The net amount is included in intangible assets and amortized on a straight-line basis as an increase to depreciation and amortization expense over the remaining term of the applicable lease.
Transfers of Financial Assets
Sale accounting for transfers of financial assets requires the transfer of an entire financial asset, a group of financial assets in its entirety or if a component of the financial asset is transferred, that the component meets the definition of a participating interest by havingwith characteristics that mirror the original financial asset.
COLONY CREDIT REAL ESTATE, INC.
NOTES TO CONSOLIDATED FINANCIAL STATEMENTS (Continued)
(Unaudited)
Transfers of financial assets are accounted for as sales when control over the assets has been surrendered. If the Company has any continuing involvement, rights or obligations with the transferred financial asset (outside of standard representations and warranties), sale accounting would requirerequires that the transfer meets the following sale conditions: (1) the transferred asset has been legally isolated; (2) the transferee has the right (free of conditions that constrain it from taking advantage of that right) to pledge or exchange the transferred asset; and (3) the Company does not maintain effective control over the transferred asset through an agreement that provides for (a) both an entitlement and an obligation by the Company to repurchase or redeem the asset before its maturity, or (b) the unilateral ability by the Company to reclaim the asset and a more than trivial benefit attributable to that ability, or (c) the transferee requiring the Company to repurchase the asset at a price so favorable to the transferee that it is probable the repurchase will occur.
If sale accounting is met, the transferred financial asset is removed from the balance sheet and a net gain or loss is recognized upon sale, taking into account any retained interests. Transfers of financial assets that do not meet the criteria for sale are accounted for as financing transactions, or secured borrowing.
Derivative Instruments and Hedging Activities
The Company uses derivative instruments to manage its foreign currency risk and interest rate risk. The Company does not use derivative instruments for speculative or trading purposes. All derivative instruments are recorded at fair value and included in other assets or other liabilities on a gross basis on the balance sheet. The accounting for changes in fair value of derivatives depends upon whether or not the Company has elected to designate the derivative in a hedging relationship and the derivative qualifies for hedge accounting. The Company has economic hedges that have not been designated for hedge accounting.
Changes in fair value of derivatives not designated as accounting hedges are recorded in the statement of operations in other gain (loss), net.
For designated accounting hedges, the relationships between hedging instruments and hedged items, risk management objectives and strategies for undertaking the accounting hedges as well as the methods to assess the effectiveness of the derivative prospectively and retrospectively, are formally documented at inception. Hedge effectiveness relates to the amount by which the gain or loss on the designated derivative instrument exactly offsets the change in the hedged item attributable to the hedged risk. If it is determined that a derivative is not expected to be or has ceased to be highly effective at hedging the designated exposure, hedge accounting is discontinued.
Cash Flow Hedges—The Company uses interest rate caps and swaps to hedge its exposure to interest rate fluctuations in forecasted interest payments on floating rate debt. The effective portion of the change in fair value of the derivative is recorded in accumulated other comprehensive income, while hedge ineffectiveness is recorded in earnings. If the derivative in a cash flow hedge is terminated or the hedge designation is removed, related amounts in accumulated other comprehensive income (loss) are reclassified into earnings.
Net Investment Hedges—The Company uses foreign currency hedges to protect the value of its net investments in foreign subsidiaries or equity method investees whose functional currencies are not U.S. dollars. Changes in the fair value of derivatives used as hedges of net investment in foreign operations, to the extent effective, are recorded in the cumulative translation adjustment account within accumulated other comprehensive income (loss).
At the end of each quarter, the Company reassesses the effectiveness of its net investment hedges and as appropriate, dedesignates the portion of the derivative notional amount that is in excess of the beginning balance of its net investments as undesignated hedges.
Release of accumulated other comprehensive income related to net investment hedges occurs upon losing a controlling financial interest in an investment or obtaining control over an equity method investment. Upon sale, complete or substantially complete liquidation of an investment in a foreign subsidiary, or partial sale of an equity method investment, the gain or loss on the related net investment hedge is reclassified from accumulated other comprehensive income to earnings.
Financing Costs
Financing costs primarily include debt discounts and premiums as well as deferred financing costs. Deferred financing costs represent commitment fees, legal and other third-party costs associated with obtaining financing. Costs related to revolving credit facilities are recorded in other assets and are amortized to interest expense using the straight-line basis over the term of the facility. Costs related to other borrowings are recorded net against the carrying value of such borrowings and are amortized to interest expense using the effective interest method. Unamortized deferred financing costs are expensed to realized gain (loss) when the
COLONY CREDIT REAL ESTATE, INC.
NOTES TO CONSOLIDATED FINANCIAL STATEMENTS (Continued)
(Unaudited)
associated facility is repaid before maturity. Costs incurred in seeking financing transactions, which do not close, are expensed in the period in which it is determined that the financing will not occur.
Revenue Recognition
Property Operating Income
Property operating income includes the following:
Rental Income—Rental income is recognized on a straight-line basis over the noncancelable term of the related lease which includes the effects of minimum rent increases and rent abatements under the lease. Rents received in advance are deferred.
When it is determined that the Company is the owner of tenant improvements, the cost to construct the tenant improvements, including costs paid for or reimbursed by the tenants, is capitalized. For tenant improvements owned by the Company, the amount funded by or reimbursed by the tenants are recorded as deferred revenue, which is amortized on a straight-line basis as additional rental income over the term of the related lease. Rental income recognition commences when the leased space is substantially ready for its intended use and the tenant takes possession of the leased space.
When it is determined that the tenant is the owner of tenant improvements, the Company’s contribution towards those improvements is recorded as a lease incentive, included in deferred leasing costs and intangible assets on the balance sheet, and amortized as a
COLONY CREDIT REAL ESTATE, INC.
NOTES TO CONSOLIDATED FINANCIAL STATEMENTS (Continued)
(Unaudited)
reduction to rental income on a straight-line basis over the term of the lease. Rental income recognition commences when the tenant takes possession of the lease space.
Tenant Reimbursements—In net lease arrangements, the tenant is generally responsible for operating expenses relatingrelated to the property, including real estate taxes, property insurance, maintenance, repairs and improvements. Costs reimbursable from tenants and other recoverable costs are recognized as revenue in the period the recoverable costs are incurred. When the Company is the primary obligor with respect to purchasing goods and services for property operations and has discretion in selecting the supplier and retains credit risk, tenant reimbursement revenue and property operating expenses are presented on a gross basis in the statements of operations. For certain triple net leases where the lessee self-manages the property, hires its own service providers and retains credit risk for routine maintenance contracts, no reimbursement revenue and expense are recognized.
Hotel Operating Income—Hotel operating income includes room revenue, food and beverage sales and other ancillary services. Revenue is recognized upon occupancy of rooms, consummation of sales and provision of services.
Real Estate Securities
Interest income is recognized using the effective interest method with any premium or discount amortized or accreted through earnings based on expected cash flow through the expected maturity date of the security. Changes to expected cash flow may result in a change to the yield which is then applied retrospectively for high-credit quality securities that cannot be prepaid or otherwise settled in such a way that the holder would not recover substantially all of the investment or prospectively for all other securities to recognize interest income.
Foreign Currency
Assets and liabilities denominated in a foreign currency for which the functional currency is a foreign currency are translated using the exchange rate in effect at the balance sheet date and the corresponding results of operations for such entities are translated using the average exchange rate in effect during the period. The resulting foreign currency translation adjustments are recorded as a component of accumulated other comprehensive income or loss in stockholders’ equity. Upon sale, complete or substantially complete liquidation of a foreign subsidiary, or upon partial sale of a foreign equity method investment, the translation adjustment associated with the investment, or a proportionate share related to the portion of equity method investment sold, is reclassified from accumulated other comprehensive income or loss into earnings.
Assets and liabilities denominated in a foreign currency for which the functional currency is the U.S. dollar are remeasured using the exchange rate in effect at the balance sheet date and the corresponding results of operations for such entities are remeasured using the average exchange rate in effect during the period. The resulting foreign currency remeasurement adjustments are recorded in other gain (loss), net on investments on the consolidated statements of operations.
Disclosures of non-U.S. dollar amounts to be recorded in the future are translated using exchange rates in effect at the date of the most recent balance sheet date.presented.
COLONY CREDIT REAL ESTATE, INC.
NOTES TO CONSOLIDATED FINANCIAL STATEMENTS (Continued)
(Unaudited)
Equity-Based Compensation
Equity-classified stock awards granted to executive officers and directors that have a service condition only are remeasured at fair value at the end of each reporting period until the award is fully vested. Fair value is determined based on the closing price of the Class A common stock at the end of each reporting period. The Company recognizes equity-based compensation expense on a straight-line basis over the requisite service period of the awards, with the amount of compensation expense recognized at the end of a reporting period at least equal to the fair value of the portion of the award that has vested through that date.
Equity-classified stock awards granted toboth independent and non-independent directors are based on the closing price of the Class A common stock on the grant date and recognized on a straight-line basis over the requisite service period of the awards.
The compensation expense is adjusted for actual forfeitures upon occurrence. Equity-based compensation is classified within administrative expense in the consolidated statement of operations.
Earnings Per Share
The Company presents both basic and diluted earnings per share (“EPS”) using the two-class method. Basic EPS is calculated by dividing earnings allocated to common shareholders, as adjusted for unallocated earnings attributable to certain participating securities, if any, by the weighted-average number of common shares outstanding during the period. Diluted EPS is based on the weighted-average number of common shares and the effect of potentially dilutive common share equivalents outstanding during the period. The two-class method is an allocation formula that determines earnings per share for each share of common stock and participating securities according to dividends declared and participation rights in undistributed earnings. Under this method, all earnings (distributed and undistributed) are allocated to common shares and participating securities based on their respective rights
COLONY CREDIT REAL ESTATE, INC.
NOTES TO CONSOLIDATED FINANCIAL STATEMENTS (Continued)
(Unaudited)
to receive dividends. The Company has certain share-based payment awards that contain nonforfeitable rights to dividends, which are considered participating securities for the purposes of computing EPS pursuant to the two-class method.
Income Taxes
TheFor U.S. federal income tax purposes, the Company intends to elect to be taxed as a REIT and to comply with the related provisions of the Code beginning with its taxable year endingended December 31, 2018. Accordingly,To qualify as a REIT, the Company must continually satisfy tests concerning, among other things, the real estate qualification of sources of its income, the real estate composition and values of its assets, the amounts it distributes to stockholders and the diversity of ownership of its stock.
To the extent that the Company qualifies as a REIT, it generally will generally not be subject to U.S. federal income tax to the extent of its distributions to stockholders as long as certain asset, income, distribution and share ownership tests are met.stockholders. The Company believes that all of the criteria to maintain the Company’s REIT qualification have been met for the applicable periods, but there can be no assurance that these criteria will continue to be met in subsequent periods. If the Company were to fail to meet these requirements, it would be subject to U.S. federal income tax and potential interest and penalties, which could have a material adverse impact on its results of operations and amounts available for distributions to its stockholders. The Company’s accounting policy with respect to interest and penalties is to classify these amounts as a component of income tax expense, where applicable.
The Company may also be subject to certain state, local and franchise taxes. Under certain circumstances, U.S. federal income and excise taxes may be due on its undistributed taxable income. The Company also holds investments in Europe which are subject to tax in each local jurisdiction.
The Company made joint elections to treat certain subsidiaries as taxable REIT subsidiaries (“TRS”TRSs”) which may be subject to taxation by U.S. federal, state and local income taxes.authorities. In general, a TRS of the Company may perform non-customary services for tenants, hold assets that the REITCompany cannot hold directly and may engage in most real estate or non-real estate-related business.
Certain subsidiaries of the Company are subject to taxation by U.S. federal, state and local authorities for the periods presented. Income taxes are accounted for by the asset/liability approach in accordance with U.S. GAAP. Deferred taxes, if any, represent the expected future tax consequences when the reported amounts of assets and liabilities are recovered or paid. Such amounts arise from differences between the financial reporting and tax bases of assets and liabilities and are adjusted for changes in tax laws and tax rates in the period during which such changes are enacted. A provision for income tax represents the total of income taxes paid or payable for the current period, plus the change in deferred taxes. Current and deferred taxes are recorded on the portion of earnings (losses) recognized by the Company with respect to its interest in TRSs. Deferred income tax assets and liabilities are calculated based on temporary differences between the Company’s U.S. GAAP consolidated financial statements and the U.S. federal, state and local tax basis of assets and liabilities as of the consolidated balance sheet date. The Company evaluates the realizability of its deferred tax assets (e.g., net operating loss and capital loss carryforwards) and recognizes a valuation allowance if, based on the available evidence, it is more likely than not that some portion or all of its deferred tax assets will not be realized. When evaluating the realizability of its deferred tax assets, the Company considers estimates of expected future taxable income, existing and projected book/tax differences, tax planning strategies available and the general and industry specificindustry-specific economic outlook. This realizability analysis is inherently subjective, as it requires the Company to forecast its business and general economic environment in future periods. Changes in estimate of deferred tax asset realizability, if any, are included in income tax benefit (expense) in the consolidated statements of operations.
On December 22, 2017, the Tax Cuts and Jobs Act was enacted, which provides for a reduction in the U.S. federal corporate income tax rate from 35% to 21% effective January 1, 2018. At December 31, 2017, the Company recognized a provisional amount of approximately $2.0 million of income tax expense relating to the remeasurement of its deferred tax balances based on the rate at which they are expected to reverse in the future, which is generally 21%. The Company is still analyzing certain aspects of the Tax Cuts and Jobs Act and refining its calculations, which could potentially affect the measurement of these balances or potentially give rise to new deferred tax amounts.
For the three months ended June 30, 2018 and 2017, the Company recorded income tax expense of $0.2 million and $0.9 million, respectively. For the six months ended June 30, 2018, the Company recorded income tax benefit of $0.4 million. For the six months ended June 30, 2017, the Company recorded income tax expense of $0.7 million.
Recent Accounting Pronouncements
Revenue Recognition—In May 2014, the FASB issued ASU No. 2014-09, Revenue from Contracts with Customers, which amends existing revenue recognition standards by establishing principles for a single comprehensive model for revenue measurement and recognition, along with enhanced disclosure requirements. Key provisions include, but are not limited to, determining which goods or services are capable of being distinct in a contract to be accounted for separately as a performance obligation and recognizing variable consideration only to the extent that it is probable a significant revenue reversal would not occur. The new revenue standard may be applied retrospectively to each prior period presented (full retrospective) or retrospectively to contracts not completed as of date of initial application with the cumulative effect recognized in retained earnings (modified retrospective). ASU No. 2014-09 was originally effective for fiscal years and interim periods beginning after December 15, 2016 for public companies that are not
COLONY CREDIT REAL ESTATE, INC.
NOTES TO CONSOLIDATED FINANCIAL STATEMENTS (Continued)
(Unaudited)
For the three months ended June 30, 2019 and 2018, the Company recorded an income tax benefit of $0.1 million and income tax expense of $0.2 million, respectively. For the six months ended June 30, 2019 and 2018, the Company recorded income tax benefit of $0.5 million and $0.4 million, respectively.
Reclassifications
The Company adopted ASU No. 2016-18, Statement of Cash Flows: Restricted Cash, upon changing its status from an emerging growth companies (“EGCs”) and December 15, 2017 for private companies and public companies that are EGCs. In July 2015,company to a large accelerated filer at the FASB deferredbeginning of fiscal year 2018. The Company adjusted the effective datepresentation of the new standard by one year. Early adoption is permitted but not before the original effective date.cash flows retrospectively. The FASB has subsequently issued several amendments to the standard, including clarifying the guidance on assessing principal versus agent based on the notion of control, which affects recognition of revenue on a gross or net basis. These amendments have the same effective date and transition requirements as the new standard.
The Company will adopt the standard using the modifiedrequired retrospective approach on January 1, 2019. The standard excludes from its scope the areas of accounting that most significantly affect revenue recognition for the core activities of the Company, including accounting for financial instruments and leases. Evaluation of the impactapplication of this new guidance is ongoing.
Financial Instruments—In January 2016, the FASB issued ASU No. 2016-01, Recognition and Measurement of Financial Assets and Financial Liabilities, which affects accounting for investmentsstandard resulted in equity securities, financial liabilities under the fair value option, as well as presentation and disclosures, but does not affect accounting for investments in debt securities and loans. Investments in equity securities, other than equity method investments, will be measured at fair value through earnings, except for equity securities without readily determinable fair values which may be measured at cost less impairment and adjusted for observable price changes under application of the measurement alternative, unless these equity securities qualify for the net asset value (“NAV”) practical expedient. This provision eliminates cost method accounting and recognition of unrealized holding gains or losses on equity investments in other comprehensive income. For financial liabilities under the fair value option, changes in fair value resulting from the Company’s own instrument-specific credit risk will be recorded separately in other comprehensive income. Fair value disclosures of financial instruments measured at amortized cost will be based on exit price and corresponding disclosures of valuation methodology and significant inputs will no longer be required. In February 2018, the FASB issued ASU 2018-03, Technical Corrections and Improvements to Financial Instruments, Recognition and Measurement of Financial Assets and Financial Liabilities, which provided several clarifications and amendments to the standard. These include specifying that for equity instruments without readily determinable fair values for which the measurement alternative is applied: (i) adjustments made when an observable transaction occurs for a similar security are intended to reflect the fair valuepreviously reported statements of cash flow as of the observable transaction date, not as of current reporting date; (ii) the measurement alternative may be discontinued upon an irrevocable election to change to a fair value measurement approach under fair value guidance, which would apply to all identical and similar investments of the same issuer; and (iii) the prospective transition approach for equity securities without readily determinable fair values is applicable only when the measurement alternative is applied. ASU No. 2016-01 is effective for fiscal years and interim periods beginning after December 15, 2017 for public companies that are not EGCs and December 15, 2018 for private companies and public companies that are EGCs. Early adoption is limited to specific provisions. ASU 2016-01 is to be applied retrospectively with cumulative effect as of the beginning of the first reporting period adopted recognized in retained earnings, except for provisions related to equity investments without readily determinable fair values for which the measurement alternative is applied and exit price fair value disclosures for financial instruments measured at amortized cost, which are to be applied prospectively.follows:
As of June 30, 2018, all of the Company’s investments in unconsolidated ventures were equity method investments and the Company does not have any cost method investments nor has the Company elected fair value option on its financial liabilities which fall under the scope of this guidance. |
| | | | | | | | |
| | | Six Months Ended June 30, 2018 |
| (In thousands) | | As previously Reported | | After Adoption of ASU 2016-18 |
| Net cash provided by operating activities | | $ | 22,349 |
| | $ | 28,916 |
|
| Net cash provided by investing activities | | 103,929 |
| | 171,927 |
|
| Net cash provided by financing activities | | 3,895 |
| | 3,895 |
|
The Company will adoptincrease in net cash provided by investing activities is primarily due to restricted cash received in the new guidance on January 1, 2019. EvaluationCombination, net of the impactdeconsolidation of this new guidance is ongoing, but at this time the Company does not expect the adoptionrestricted cash of this standard to have a material effect on its financial condition or results of operations.certain CLNY Investment Entities.
Accounting Standards Adopted in 2019
Leases—In February 2016, the FASB issued ASUAccounting Standards Update (“ASU”) No. 2016-02, Leases, which amends existingamended lease accounting standards,standards. ASU 2016-02, along with several clarifying amendments were codified in ASC Topic 842. The new standard primarily requiringrequires lessees to recognize their rights and obligations under most leases on balance sheet, as well as making targeted changes to lessor accounting. As lessee,be capitalized as a right-of-use asset and a corresponding liability for future obligations under a leasing arrangement would be recognized on balance sheet. Aslease obligations. Targeted changes were made to lessor gross leases will be subjectaccounting, primarily to allocation between leasealign to the lessee model and non-lease service components, with the latter accounted for under the new revenue recognition standard. As
The Company adopted the new lease standard requires congruous accounting treatment betweenand related amendments on January 1, 2019 using the modified retrospective method to leases existing or commencing on or after January 1, 2019. The impact to beginning retained earnings is de minimis. Comparative periods have not been restated and continue to be reported under the standards in effect for those prior periods.
ASC 842 limits the definition of initial direct costs to only the incremental costs of obtaining a lease, such as leasing commissions, for both lessee and lessor accounting. Indirect costs such as allocated overhead, certain legal fees and lessee in a sale-leaseback transaction, if the seller/lessee does not achieve sale accounting, it would be considered a financing transaction to the buyer/lessor. Additionally,negotiation costs are no longer capitalized under the new lease standard, only incremental initial direct costs incurred instandard. The application of ASC 842 did not have a material impact on the executionstatement of a lease can be capitalized by the lessor and lessee.
ASU No. 2016-02 is effective for fiscal years and interim periods beginning after December 15, 2017 for public companies that are not EGCs and December 15, 2018 for private companies and public companies that are EGCs. Early adoption is permitted. The new leases standard requires adoption using a modified retrospective approach for all leases existing at, or entered into after, the date of initial application. Full retrospective application is prohibited. The FASB has subsequently issued and proposed several amendments to the standard, including approving an amendment to provide optional transitional relief to apply the effective date of the new lease standard as the date of initial application in transition instead of the earliest comparative period presented, as well
COLONY CREDIT REAL ESTATE, INC.
NOTES TO CONSOLIDATED FINANCIAL STATEMENTS (Continued)
(Unaudited)
as to provide certain practical expedients, which include not segregating non-lease components from the related lease components but to account for those components as a single lease component by class of underlying assets.operations.
The Company intends to adoptapplied the package of practical expedients, underwhich exempts the guidance, which provides exemptionsCompany from having to reassess whether any expired or expiring contracts contain leases, revisit lease classification for any expired or expiring leases and reassess initial direct costs for any existing leases. The Company also elected the practical expedient related to land easements, allowing the Company to carry forward the accounting treatment for land easements on existing agreements. The Company did not, however, elect the hindsight practical expedient to determine the lease terms for existing leases.
Lessee Accounting—The Company determines if an arrangement contains a lease and determines the classification of leasing arrangements at inception. A leasing arrangement is classified by the lessee either as a finance lease, which represents a financed purchased of the leased asset, or as an operating lease. The Company's operating leases relate primarily to ground leases acquired with real estate. For these ground leases, the Company has elected the accounting policy to combine lease and related nonlease components as a single lease component.
Right-of-use assets and lease liabilities are recognized at the lease commencement date based upon the present value of lease payments over the lease term. The right-of-use assets also include capitalized initial direct costs offset by lease incentives. Variable lease payments are excluded from the right-of-use assets and lease liabilities and are recognized in the period in which the obligation for those payments is incurred. The Company does not have any variable lease payments. The Company made the accounting policy election to recognize lease payments from short-term leases on a straight-line basis over the lease term and will not record these leases on the balance sheet.
Lease renewal or termination options are factored into the lease asset and lease liability only if it is reasonably certain that the option to extend or the option to terminate would be exercised.
COLONY CREDIT REAL ESTATE, INC.
NOTES TO CONSOLIDATED FINANCIAL STATEMENTS (Continued)
(Unaudited)
As the implicit rate is not readily determinable in most leases, the present value of the remaining lease payments was calculated for each lease using an estimated incremental borrowing rate, which is the interest rate that the Company would have to pay to borrow over the lease term on a collateralized basis.
Lease expense is recognized over the lease term based on an effective interest method for finance leases and on a straight-line basis for operating leases.
The Company expectsrecognized an operating lease right-of-use asset totaling $26.3 million in other assets and a corresponding operating lease liability totaling $26.3 million in accrued and other liabilities for ground leases in its real estate portfolio. There was no impact to adoptbeginning equity as a result of adoption related to lessee accounting as the transition option, in which case,difference between the cumulative effect adjustmentasset and liability balance is attributable to the opening balancederecognition of retained earnings will bepre-existing balances, including below-market ground lease obligations.
Lessor Accounting—The Company determines if an arrangement contains a lease and determines the classification of leasing arrangements at inception. The Company has operating leases with property tenants that expire at various dates through 2046 with renewal options typically exercised at the lessee's election. Therefore, such options are only recognized once they are deemed reasonably certain, typically at the time the option is exercised. Lease revenue is composed of rental income, which includes the effect of minimum rent increases and rent abatements, and tenant reimbursements, such as ofcommon area maintenance costs and other costs associated to the effective date of adoption, including new disclosures, rather than as of the earliest period presented, and are not required for prior comparative periods. In addition,leases.
As lessor, the Company expects to make anmade the accounting policy election to treat the lease and related non-leasenonlease components in a contract as a single performance obligationcomponent to the extent that the timing and pattern of revenue recognitiontransfer are the samesimilar for the lease and non-leasenonlease components and the combined single lease component is classifiedqualifies as an operating lease. AsNonlease components of June 30, 2018,tenant reimbursements for net leases qualify for the practical expedient to be combined with their respective lease component and accounted for as a single component under the lease standard as the lease component is predominant.
Lease revenue is recognized on a straight-line basis over the remaining lease term and is included in property operating income on the consolidated statements of operations. The Company receives variable lease revenues from tenant reimbursements.
Under the new standard, lessors are required to evaluate the collectability of all lease payments based upon the creditworthiness of the lessee. Lease revenue is recognized only to the extent collection is determined to be probable. If collection is subsequently determined to no longer be probable, any previously accrued lease revenue that has not been collected is subject to reversal. If collection is subsequently determined to be probable, lease revenue and corresponding receivable would be reestablished to an amount that would have been recognized if collection had always been deemed to be probable. The impact to the Company’s financial condition and results of operations is de minimis on adoption of this standard.
Beginning January 1, 2019, the Company has six groundalso made the accounting policy election to present on a net basis sales and similar taxes assessed by a governmental authority that is imposed on specific lease arrangementsrevenue producing transactions with future contractual lease payment obligations of $14.5 million.
Evaluationrelated collections from lessees. Property taxes and insurance paid directly by lessees to third parties on behalf of the Company are no longer recognized in the statement of operations, while such amounts paid by the Company and reimbursed by lessees continue to be presented as gross property operating income and expenses.
Hedge Accounting—In August 2017, the FASB issued ASU No. 2017-12, Targeted Improvements to Accounting for Hedging Activities, which simplifies and expands the application of hedge accounting. This standard amends hedge accounting recognition and presentation, including eliminating the requirement to separately measure and present hedge ineffectiveness as well as presenting the entire fair value change of a hedging instrument in the same income statement line as the hedged item. The new guidance also provides alternatives for applying hedge accounting to additional hedging strategies, and easing requirements for effectiveness testing and hedging documentation, although the "highly effective" threshold for a qualifying hedging relationship has not changed. Revised disclosures include tabular disclosures that focus on the effect of hedge accounting by income statement line item. Transition will generally be on a modified retrospective basis applied to existing hedging relationships as of date of adoption, with prospective application for income statement presentation and disclosure, and specific transition elections are available to modify existing hedge documentation.
The Company adopted the standard on its effective date of January 1, 2019. Upon adoption, as it relates to the Company’s net investment hedges, the Company will record the entire change in fair value of the hedging instrument (other than amounts excluded from assessment of hedge effectiveness for net investment hedges) in other comprehensive income and there will be no hedge ineffectiveness recorded in earnings. Additionally, subsequent to initial quantitative hedge assessment, the Company may elect to perform effectiveness testing qualitatively so long as the Company can reasonably support an expectation that the hedge is highly effective now and in subsequent periods. As the standard allows more flexibility in hedging interest rate risk in cash flow hedges beyond a specified benchmark rate, the Company may be able to designate in the future other contractually specified variable
COLONY CREDIT REAL ESTATE, INC.
NOTES TO CONSOLIDATED FINANCIAL STATEMENTS (Continued)
(Unaudited)
interest rate as the hedged risk, which if effective, could decrease fluctuations in earnings. There was no impact to the Company’s financial condition and results of operations on adoption of this new guidance to the Company is ongoing.standard.
Future Application of Accounting Standards
Credit Losses—In June 2016, the FASB issued ASU No. 2016-13, Financial Instruments-Credit Losses, which amends the credit impairment model for financial instruments. The existing incurred loss model will be replaced with a lifetime current expected credit loss (“CECL”) model for financial instruments carried at amortized cost and off-balance sheet credit exposures, such as loans, loan commitments, held-to-maturity (“HTM”) debt securities, financial guarantees, net investment in leases, reinsurance and trade receivables, which will generally result in earlier recognition of allowance for losses. For AFSavailable-for-sale (“AFS”) debt securities, unrealized credit losses will be recognized as allowances rather than reductions in amortized cost basis and elimination of the OTTI concept will result in more frequent estimation of credit losses. The accounting model for purchased credit impaired loans and debt securities will be simplified, including elimination of some of the asymmetrical treatment between credit losses and credit recoveries, to be consistent with the CECL model for originated and purchased non-credit impaired assets. The existing model for beneficial interests that are not of high credit quality will be amended to conform to the new impairment models for HTM and AFS debt securities. Expanded disclosures on credit risk include credit quality indicators by vintage for financing receivables and net investment in leases. Transition will generally be on a modified retrospective basis, with prospective application for other-than-temporarily impaired debt securities and purchased credit impaired assets. ASU No. 2016-13 is effective for fiscal years and interim periods beginning after December 15, 2019 for public companies that are not EGCs and December 15, 2020 for private companies and public companies that are EGCs.2019. Early adoption is permitted for annual and interim periods beginning after December 15, 2018. The Company expects that recognition of credit losses will generally be accelerated under the CECL model. Evaluation of the impact of this new guidance is ongoing.
Cash Flow Classifications—Fair Value Disclosures—In August 2016,2018, the FASB issued ASU No. 2016-15, Statement2018-13, Fair Value Measurement (Topic 820): Disclosure Framework-Changes to the Disclosure Requirements for Fair Value Measurements. The ASU requires new disclosures of Cash Flows: Classificationchanges in unrealized gains and losses in other comprehensive income for recurring Level 3 fair value of instruments held at the balance sheet date, as well as the range and weighted average or other quantitative information, if more relevant, of significant unobservable inputs for recurring and nonrecurring Level 3 fair values. Certain Cash Receiptsdisclosures are now eliminated, specifically around the valuation process required for Level 3 fair values, policy for timing of transfers between levels of the fair value hierarchy, as well as amounts and Cash Payments, which is intended to reduce diversity in practice in certain classifications on the statement of cash flows. This guidance addresses eight types of cash flows, clarifies how the predominance principle should be applied when cash receiptsreason for transfers between Levels 1 and cash payments have aspects of more than one class of cash flows, and requires an accounting policy election for classification of distributions received from equity method investees using either the cumulative earnings or nature of distributions approach, among others. Transition will generally be on a retrospective basis.2. ASU No. 2016-152018-13 is effective for fiscal years and interim periods beginning after December 15, 2017 for public companies that are2019. The adoption of this standard is not EGCs and December 15, 2018 for private companies and public companies that are EGCs. Early adoption is permitted, provided that all amendments withinexpected to have a material effect on the guidance are adopted in the same period. The Company will adopt the new guidance on January 1, 2019. Upon adoption, the Company anticipates making an accounting policy election for classification of distributions from its equity method investees using the cumulative earnings approach.Company's existing disclosures.
Restricted Cash—Variable Interest Entities—In November 2016,2018, the FASB issued ASU No. 2016-18, Statement2018-17, Targeted Improvements to Related Party Guidance for Variable Interest Entities. The ASU amends the VIE guidance to align the evaluation of Cash Flows: Restricted Cash, which requires that cash and cash equivalent balancesa decision maker's or service provider's fee in assessing a variable interest with the guidance in the statementprimary beneficiary test. Specifically, indirect interests held by a related party that is under common control will now be considered on a proportionate basis, rather than in their entirety, when assessing whether the fee qualifies as a variable interest. The proportionate basis approach is consistent with the treatment of cash flows include restricted cash and restricted cash equivalent amounts, and therefore, changes in restricted cash and restricted cash equivalents be presented inindirect interests held by a related party under common control when evaluating the statement of cash flows. This will eliminate the presentation of transfers between cash and cash equivalents with restricted cash and restricted cash equivalents in the statement of cash flows. When cash, cash equivalents, restricted cash and restricted cash equivalents are presented in more than one line item on the balance sheet, this ASU requires disclosureprimary beneficiary of a reconciliation betweenVIE. This effectively means that when a decision maker or service provider has an interest in a related party, regardless of whether they are under common control, it will consider that related party's interest in a VIE on a proportionate basis throughout the totals inVIE model, for both the statementassessment of cash flowsa variable interest and the related captions indetermination of a primary beneficiary. Transition is generally on a modified retrospective basis, with the balance sheet. The new guidance also requires disclosurecumulative effect adjusted to retained earnings at the beginning of the nature of restricted cash and restricted cash equivalents, similar to existing requirements under Regulation S-X; however, it does not define restricted cash and restricted cash equivalents.earliest period presented. ASU No. 2016-182018-17 is effective for fiscal years and interim periods beginning after December 15, 2017 for public companies that are not EGCs and December 15, 2018 for private companies and public companies that are EGCs, to be applied retrospectively,2019, with early adoption permitted. If early adopted in an interim period, adjustments are to be reflected as of
COLONY CREDIT REAL ESTATE, INC.
NOTES TO CONSOLIDATED FINANCIAL STATEMENTS (Continued)
(Unaudited)
the beginning of the fiscal year of adoption. As of June 30, 2018, the Company has $116.5 million of restricted cash that will be subject to changes in presentation on the statement of cash flows. The Company will adopt the new guidance on January 1, 2019.
Derecognition and Partial Sales of Nonfinancial Assets—In February 2017, the FASB issued ASU 2017-05, Clarifying the Scope of Asset Derecognition and Accounting for Partial Sales of Nonfinancial Assets, which clarifies the scope and application of ASC 610-20, Other Income-Gains and Losses from Derecognition of Nonfinancial Assets, and defines in substance nonfinancial assets. ASC 610-20 applies to derecognition of all nonfinancial assets which are not contracts with customers or revenue transactions under ASC 606, Revenue from Contracts with Customers. Derecognition of a business is governed by ASC 810, Consolidation, while derecognition of financial assets, including equity method investments, even if the investee holds predominantly nonfinancial assets, is governed by ASC 860, Transfers and Servicing. The ASU also aligns the accounting for partial sales of nonfinancial assets to be more consistent with accounting for sale of a business. Specifically, in a partial sale to a noncustomer, when a noncontrolling interest is received or retained, the latter is considered a noncash consideration and measured at fair value in accordance with ASC 606, which would result in full gain or loss recognized upon sale. This ASU removes guidance on partial exchanges of nonfinancial assets in ASC 845, Nonmonetary Transactions, and eliminates the real estate sales guidance in ASC 360-20, Property, Plant and Equipment-Real Estate Sales. ASU 2017-05 has the same effective date as the new revenue guidance, which is January 1, 2018 for public companies that are not EGCs and January 1, 2019 for private companies and public companies that are EGCs, with early adoption permitted beginning January 1, 2017. Both ASC 606 and ASC 610-20 must be adopted concurrently. While the transition method is similar to the new revenue guidance, either full retrospective or modified retrospective, the transition approach applied need not be aligned between both standards.
The Company will adopt the new guidance on January 1, 2019 using the modified retrospective approach, consistent with the adoption of the new revenue standard. Under the new standard, if a partial interest in real estate is sold to noncustomers or contributed to unconsolidated ventures, and a noncontrolling interest in the asset is retained, such transactions could result in a larger gain on sale. The adoption of this standard could have a material impact to the results of operations in a period that a significant partial interest in real estate is sold. There were no such sales in the six months ended June 30, 2018.
Share-Based Payments—In June 2018, the FASB issued ASU 2018-07, Improvements to Nonemployee Share-Based Payment Accounting, which simplifies the accounting for share-based payments to nonemployees by generally aligning it with the accounting for share-based payments to employees, with certain exceptions. The new guidance applies to nonemployee awards issued in exchange for goods or services used in an entity’s own operations and to awards granted by an investor to an equity method investee, but does not apply to equity instruments issued to a lender or investor in a financing transaction or equity instruments issued when selling goods or services to customers, which is under the revenue recognition model. Key changes in the guidance include measuring nonemployee awards based on fair value of the equity instrument issued, rather than fair value of goods or services received or equity instrument issued, whichever is more reliably measured. In terms of timing, equity-classified nonemployee awards that were previously remeasured through performance completion date will now have a fixed measurement on grant date, which will reduce volatility on the income statement. For nonemployee awards with performance conditions, compensation cost will be recognized when achievement of the performance condition is probable, rather than upon actual achievement of the performance condition. Similar to employee awards, forfeitures may be recognized as they occur or based on an estimate under an accounting policy election, but the guidance allows separate elections for employee and nonemployee awards. The accounting model for nonemployee awards, however, remains different for attribution of share-based payment costs over the vesting period, in which compensation cost for nonemployee awards continues to be recognized in the same period and in the same manner (i.e., capitalized or expensed) as if the grantor had paid cash for the goods or services. No changes to disclosure requirements were prescribed. Transition is on a modified retrospective basis, with a remeasurement at fair value as of the adoption date through a cumulative effect adjustment to opening retained earnings, applied to all equity-classified nonemployee awards where a measurement date has not been established by the adoption date and unsettled liability-classified nonemployee awards. The transition provisions eliminate the need to retrospectively determine fair values at historical grant dates. ASU 2018-07 is effective for fiscal years and interim periods beginning after December 15, 2018. Early adoption is permitted in an interim period for which financial statements have not been issued, with adjustments to be reflected as of the beginning of the fiscal year of adoption.issued. The Company plansis currently evaluating the impact of this new guidance but does not expect the adoption of this standard to adopt the new standardhave a material effect on its effective date. Asfinancial condition or results of June 30, 2018, the Company had 978,946 shares of nonemployee awards outstanding.operations.
COLONY CREDIT REAL ESTATE, INC.
NOTES TO CONSOLIDATED FINANCIAL STATEMENTS (Continued)
(Unaudited)
| |
| 3. | Business CombinationsCombination |
TheBusiness Combination
On the Closing Date, the Combination of the CLNY Contributed Portfolio, NorthStar I and NorthStar II was completed, creating CLNC.the Company.
In consideration for the contribution of the CLNY Contributed Portfolio, CLNY OP received approximately 44.4 million shares of the Company’s Class B-3 common stock, par value $0.01 per share (the “Class B-3 common stock”), and a subsidiary of CLNY OP received approximately 3.1 million common membership units in the OP (“CLNC OP Units”). The Class B-3 common stock will automatically convertconverted to Class A common stock of the Company on a one-for-one basis upon the close of trading on February 1, 2019. The CLNC OP Units are redeemable for cash, or, at the Company’s election, the Class A common stock on a one-for-one basis, in the sole discretion of the Company. Subject to certain limited exceptions, CLNY OP has agreed that it and its affiliates willwould not make any transfers of the CLNC OP Units to non-affiliates of CLNY OP until the one year anniversary of the closing of the
COLONY CREDIT REAL ESTATE, INC.
NOTES TO CONSOLIDATED FINANCIAL STATEMENTS (Continued)
(Unaudited)
Combination, unless such transfer is approved by a majority of the Company’s board of directors, including a majority of the independent directors. In connection with the merger of NorthStar I and NorthStar II into the Company, their respective stockholders received shares of the Class A common stock based on pre-determined exchange ratios. Following the foregoing transaction, the Company contributed the CLNY Contributed Portfolio and the operating partnerships of NorthStar I and NorthStar II to the OP in exchange for ownership interests in the OP. Upon the closing of the Combination, CLNY OP and its affiliates, NorthStar I stockholders and NorthStar II stockholders each owned approximately 37%, 32% and 31%, respectively, of the Company on a fully diluted basis.
Prior to the closing of the Combination, a special dividend was declared by NorthStar I, which generated the lesser amount of cash leakage, in order to true up the agreed contribution values of NorthStar I and NorthStar II in relation to each other. In addition, following the CLNY Contributions, but prior to the effective time of the Combination, there was a cash settlement between the Company and Colony Capital for the difference between (i) the sum of (a) the loss in value of NorthStar I and NorthStar II as a result of the distributions made by NorthStar I and NorthStar II in excess of FFOfunds from operations (“FFO”) (as such term is defined in the Combination Agreement) from July 1, 2017 through the day immediately preceding the Closing Date (excluding the dividend payment made by each of NorthStar I and NorthStar II on July 1, 2017), (b) FFO for the CLNY Investment Entities from July 1, 2017 through the day immediately preceding the Closing Date, (c) cash contributions or contributions of certain intercompany receivables made to the CLNY Investment Entities from July 1, 2017 through the day immediately preceding the Closing Date, and (d) the expected present value of certain unreimbursed operating expenses of NorthStar I and NorthStar II paid on each company’s behalf by their respective advisors, and (ii) cash distributions made by the CLNY Investment Entities from July 1, 2017 through the day immediately preceding the Closing Date, excluding that certain distribution made by the CLNY Investment Entities in July 2017 relating to the partial repayment of a certain investment (collectively, “CLNY true-up adjustment”). The settlement of the CLNY true-up adjustment resulted in a payment of approximately $55 million from Colony Capital to the Company.
The Combination is accounted under the acquisition method for business combinations with the CLNY Investment Entities as the accounting acquirer for purposes of the financial information set forth herein. Refer to Note 2, “Summary of Significant Accounting Policies” for further discussion on the accounting treatment of the Combination.
Combination Consideration
Each share of NorthStar I and NorthStar II common stock issued and outstanding immediately prior to the effective time of the Combination was converted into the right to receive 0.3532 shares (the “NorthStar I Exchange Ratio”) and 0.3511 shares (the “NorthStar II Exchange Ratio”), respectively, of the Class A common stock, plus cash in lieu of fractional shares. Approximately 21,000 shares of NorthStar I restricted common stock and 25,000 shares of NorthStar II restricted common stock automatically vested in connection with the Combination and the holders thereof were entitled to receive the same equity exchange as the other holders of NorthStar I and NorthStar II common stock, respectively.
The Company acquired all of the common stock of NorthStar I and NorthStar II through the exchange of all such outstanding shares into shares of Class A common stock based on the pre-determined NorthStar I Exchange Ratio and NorthStar II Exchange Ratio, respectively. As the Combination was a stock-for-stock exchange (except for cash consideration for fractional shares), fair value of the consideration to be transferred was dependent upon the fair value of the Company at the Closing Date.
COLONY CREDIT REAL ESTATE, INC.
NOTES TO CONSOLIDATED FINANCIAL STATEMENTS (Continued)
(Unaudited)
Fair value of the merger consideration was determined as follows (in thousands, except exchange ratio and price per share):
|
| | | | | | | | | | | | |
| | | NorthStar I | | NorthStar II | | Total |
Outstanding shares of common stock at January 31, 2018(1) | | 119,333 |
| | 114,943 |
| | |
Exchange ratio(2) | | 0.3532 |
| | 0.3511 |
| | |
Shares of Class A common stock issued in the mergers(3) | | 42,149 |
| | 40,356 |
| | 82,505 |
|
Fair value consideration per share(4) | | $ | 24.50 |
| | $ | 24.50 |
| | $ | 24.50 |
|
| Fair value of NorthStar I and NorthStar II consideration | | $ | 1,032,651 |
| | $ | 988,722 |
| | $ | 2,021,373 |
|
| |
| (1) | Includes 21,000 and 25,000 shares of common stock of NorthStar I and NorthStar II equity awards, respectively, that vested in connection with the consummation of the Combination. |
| |
| (2) | Represents the pre-determined exchange ratio of 0.3532 NorthStar I shares and 0.3511 NorthStar II shares per one share of the Class A common stock. |
| |
| (3) | Includes the issuance of fractional shares, aggregating to approximately 21,000 shares, for which holders received cash in lieu of the fractional shares. |
| |
| (4) | Represents the estimated per share fair value of the Company at the Closing Date. |
COLONY CREDIT REAL ESTATE, INC.
NOTES TO CONSOLIDATED FINANCIAL STATEMENTS (Continued)
(Unaudited)
The following table presents a preliminarythe final allocation of the Combination consideration to assets acquired, liabilities assumed and noncontrolling interests of NorthStar I and NorthStar II based on their respective estimated fair values as of the Closing Date.
The estimated fair values and allocation of the Combination consideration presented below are preliminary and based on information available as of the Closing Date as the Company continues to evaluate the underlying inputs and assumptions. Accordingly, these preliminary estimates may be subject to adjustments during the measurement period, not to exceed one year, based upon new information obtained about facts and circumstances that existed as of the Closing Date. Preliminary fair values assigned to the assets acquired, liabilities assumed and noncontrolling interests of NorthStar I and NorthStar II as of the Closing Date were as follows (dollars in thousands):
|
| | | | | | | | | | | | |
| | | Final Adjusted Amounts at December 31, 2018 |
| | | NorthStar I | | NorthStar II | | Total |
| Merger consideration | | $ | 1,032,651 |
| | $ | 988,722 |
| | $ | 2,021,373 |
|
| Allocation of merger consideration: | | | | | | |
| Assets acquired | | | | | | |
| Cash and cash equivalents | | $ | 130,197 |
| | $ | 51,360 |
| | $ | 181,557 |
|
| Restricted cash | | 30,564 |
| | 61,313 |
| | 91,877 |
|
| Loans and preferred equity held for investment | | 521,462 |
| | 728,271 |
| | 1,249,733 |
|
| Real estate securities, available for sale, at fair value | | 100,731 |
| | 64,793 |
| | 165,524 |
|
| Real estate, net | | 792,999 |
| | 494,324 |
| | 1,287,323 |
|
| Investments in unconsolidated ventures | | 67,899 |
| | 375,694 |
| | 443,593 |
|
| Receivables, net | | 12,363 |
| | 11,479 |
| | 23,842 |
|
| Deferred leasing costs and intangible assets, net | | 74,243 |
| | 37,090 |
| | 111,333 |
|
| Other assets | | 18,666 |
| | 24,401 |
| | 43,067 |
|
| Mortgage loans held in securitization trusts, at fair value | | 1,894,404 |
| | 1,432,795 |
| | 3,327,199 |
|
| Total assets acquired | | 3,643,528 |
| | 3,281,520 |
| | 6,925,048 |
|
| Liabilities assumed | | | | | | |
| Securitization bonds payable, net | | — |
| | 80,825 |
| | 80,825 |
|
| Mortgage and other notes payable, net | | 399,131 |
| | 382,485 |
| | 781,616 |
|
| Credit facilities | | 293,340 |
| | 355,529 |
| | 648,869 |
|
| Due to related party | | 4,533 |
| | 1,842 |
| | 6,375 |
|
| Accrued and other liabilities | | 25,680 |
| | 22,959 |
| | 48,639 |
|
| Intangible liabilities, net | | 17,931 |
| | 1,808 |
| | 19,739 |
|
| Escrow deposits payable | | 12,994 |
| | 36,362 |
| | 49,356 |
|
| Mortgage obligations issued by securitization trusts, at fair value | | 1,784,223 |
| | 1,401,491 |
| | 3,185,714 |
|
| Total liabilities assumed | | 2,537,832 |
| | 2,283,301 |
| | 4,821,133 |
|
| Noncontrolling interests | | 73,045 |
| | 9,497 |
| | 82,542 |
|
| Fair value of net assets acquired | | $ | 1,032,651 |
| | $ | 988,722 |
| | $ | 2,021,373 |
|
|
| | | | | | | | | | | | |
| | | January 31, 2018 |
| | | NorthStar I | | NorthStar II | | Total |
| Merger consideration | | $ | 1,032,651 |
| | $ | 988,722 |
| | $ | 2,021,373 |
|
| Allocation of merger consideration: | | | | | | |
| Assets acquired | | | | | | |
| Cash and cash equivalents | | $ | 130,197 |
| | $ | 51,360 |
| | $ | 181,557 |
|
| Restricted cash | | 30,564 |
| | 61,313 |
| | 91,877 |
|
| Loans and preferred equity held for investment | | 521,462 |
| | 728,271 |
| | 1,249,733 |
|
| Real estate securities, available for sale, at fair value | | 100,731 |
| | 64,793 |
| | 165,524 |
|
| Real estate, net | | 790,996 |
| | 492,317 |
| | 1,283,313 |
|
| Investments in unconsolidated ventures | | 67,899 |
| | 375,694 |
| | 443,593 |
|
| Receivables, net | | 12,363 |
| | 11,479 |
| | 23,842 |
|
| Deferred leasing costs and intangible assets, net | | 74,243 |
| | 37,090 |
| | 111,333 |
|
| Other assets | | 16,407 |
| | 21,668 |
| | 38,075 |
|
| Mortgage loans held in securitization trusts, at fair value | | 1,894,404 |
| | 1,432,795 |
| | 3,327,199 |
|
| Total assets acquired | | 3,639,266 |
| | 3,276,780 |
| | 6,916,046 |
|
| Liabilities assumed | | | | | | |
| Securitization bonds payable, net | | — |
| | 80,825 |
| | 80,825 |
|
| Mortgage and other notes payable, net | | 399,131 |
| | 382,485 |
| | 781,616 |
|
| Credit facilities | | 293,340 |
| | 355,529 |
| | 648,869 |
|
| Due to related party | | 4,533 |
| | 1,842 |
| | 6,375 |
|
| Accrued and other liabilities | | 21,640 |
| | 18,219 |
| | 39,859 |
|
| Intangible liabilities, net | | 17,931 |
| | 1,808 |
| | 19,739 |
|
| Escrow deposits payable | | 12,994 |
| | 36,362 |
| | 49,356 |
|
| Mortgage obligations issued by securitization trusts, at fair value | | 1,784,223 |
| | 1,401,491 |
| | 3,185,714 |
|
| Total liabilities assumed | | 2,533,792 |
| | 2,278,561 |
| | 4,812,353 |
|
| Noncontrolling interests | | 72,823 |
| | 9,497 |
| | 82,320 |
|
| Fair value of net assets acquired | | $ | 1,032,651 |
| | $ | 988,722 |
| | $ | 2,021,373 |
|
COLONY CREDIT REAL ESTATE, INC.
NOTES TO CONSOLIDATED FINANCIAL STATEMENTS (Continued)
(Unaudited)
Fair value of other assets acquired, liabilities assumed and noncontrolling interests were estimated as follows:
Real Estate and Related Intangibles—Fair value is based on the income approach which includes a direct capitalization method with overall capitalization rates ranging between 6.5% and 8.3%. Real estate fair value was allocated to tangible assets such as land, building and leaseholds, tenant and land improvements as well as identified intangible assets and liabilities such as above- and below-market leases, and in-place lease value. Useful lives of the intangibles acquired range from 1 year to 10 years.
Loans and preferred equity held for investment—Fair value is determined by comparing the current yield to the estimated yield for newly originated loans with similar credit risk or the market yield at which a third party might expect to purchase such investment; or based on discounted cash flow projections of principal and interest expected to be collected, which include consideration of borrower or sponsor credit, as well as operating results of the underlying collateral. For certain loans and preferred equity held for investment, NorthStar II has a contractual right to equity-like participation or other ownership interests in the underlying collateral which was considered in calculating the fair value of the loans and preferred equity held for investment.
Investments in Unconsolidated Ventures—Fair value is based on timing and amount of expected future cash flows for income as well as realization events of the underlying assets of the investees. Investments in unconsolidated ventures includes a preferred equity investment, as well as an investment in a joint venture which holds a mezzanine loan. The fair value for both investments was based on the outstanding principal value plus the undiscounted value of any applicable contractual exit fees associated with the investments. The preferred equity investment has an equity-like participation which was considered in its fair value. The capitalization rate used was 6.8%.
Securities—Fair value is based on quotations from brokers or financial institutions that act as underwriters of the debt securities, third-party pricing service or discounted cash flows depending on the type of debt securities.
COLONY CREDIT REAL ESTATE, INC.
NOTES TO CONSOLIDATED FINANCIAL STATEMENTS (Continued)
(Unaudited)
Debt—The fair value of debt was determined by either comparing the contractual interest rate to the interest rate for newly originated debt with similar credit risk or the market rate at which a third party might expect to assume such debt or based on discounted cash flow (“DCF”) projections of principal and interest expected to be collected, which include consideration of borrower or sponsor credit, as well as operating results of the underlying collateral. All of the debt was priced consistent with current interest rates attainable for similarly situated investments, and therefore was attributed a value equal to each debt’s outstanding principal amount less any applicable premium or discount on the secured debt.
Noncontrolling Interests—NorthStar I’s noncontrolling interests are attributable to the minority ownership interests of its operating partners in its CRE properties. The estimated value of NorthStar I’s noncontrolling interests represents the minority owner’s pro rata share of the estimated net book value of the CRE properties, as determined in accordance with the above description of the valuation process for real estate and related intangibles. NorthStar II’s noncontrolling interest is attributable to the minority ownership interest of its operating partner in its Bothell, Washington office portfolio. The estimated value of NorthStar II’s noncontrolling interest represents the operating partner’s pro rata share of the estimated net book value of the portfolio, as determined in accordance with the above description of the valuation process for real estate and related intangibles. The major classes of intangible assets and liabilities include leasing commissions, above- and below-market lease values and in-place lease values.
Results of NorthStar I and NorthStar II
For the three months ended and from February 1, 2018 (the Closing Date) through June 30, 2018, the Company’s results of operations included contributions from the acquired business of NorthStar I and NorthStar II as follows (dollars in thousands):
|
| | | | | | | | | | | | | | | | | | | | | | | | |
| | | Three Months Ended June 30, 2018 | | February 1, 2018 to June 30, 2018 |
| | | NorthStar I | | NorthStar II | | Total | | NorthStar I | | NorthStar II | | Total |
| Total revenues | | $ | 52,022 |
| | $ | 51,579 |
| | $ | 103,601 |
| | $ | 89,334 |
| | $ | 90,786 |
| | $ | 180,120 |
|
| | | | | | |
| | | | | | |
| Net income attributable to common stockholders | | 2,542 |
| | 14,890 |
| | 17,432 |
| | 367 |
| | 23,516 |
| | 23,883 |
|
Combination-Related Costs
Transaction costs of $0.5 million and $0.7 million were incurred in connection with the Combination in the three and six months ended June 30, 2019, respectively. Transaction costs of $2.3 million and $32.5$30.5 million were incurred in connection with the Combination in the three and six months ended June 30, 2018, respectively, consisting largely of professional fees for legal, financial advisory, accounting and consulting services. No fees were paid to investment banks that were contingent upon consummation of the Combination for the three and six months ended June 30, 2019 or the three months ended June 30, 2018. Approximately $24.3 million of the transaction costs for the six months ended June 30, 2018 represent fees paid to investment bankers that were contingent upon consummation of the Combination.
Combination-related costs are expensed as incurred and such costs expensed by NorthStar I and NorthStar II prior to the Closing Date were excluded from the Company's results of operations.
COLONY CREDIT REAL ESTATE, INC.
NOTES TO CONSOLIDATED FINANCIAL STATEMENTS (Continued)
(Unaudited)
Pro Forma Financial Information (Unaudited)
The following table presents pro forma financial information of the Company as if the Combination had been consummated on January 1, 2017. The pro forma financial information includes the pro forma impact of purchase accounting adjustments primarily related to fair value adjustments and depreciation and amortization, and excludes Combination-related transaction costs of $2.3 million and $32.5 million for the three and six months ended June 30, 2018, respectively. The pro forma financial information, however, does not reflect any potential benefits that may result from realization of future cost savings from operating efficiencies, or other incremental synergies expected to result from the Combination.
The pro forma financial information is presented for illustrative purposes only and is not necessarily indicative of the results of operations of the Company had the Combination been completed on January 1, 2017, nor indicative of future results of operations of the Company (dollars in thousands, except per share data):
|
| | | | | | | | |
| | | Six Months Ended June 30, |
| | | 2018 | | 2017 |
| Pro forma: | | | | |
| Total revenues | | $ | 268,366 |
| | $ | 236,614 |
|
| Net income attributable to Colony Credit Real Estate, Inc. | | 55,844 |
| | 70,133 |
|
| Net income attributable to common stockholders | | 53,579 |
| | 67,885 |
|
| Earnings per common share: | | | | |
| Basic | | $ | 0.41 |
| | $ | 0.52 |
|
| Diluted | | $ | 0.41 |
| | $ | 0.52 |
|
| |
| 4. | Loans and Preferred Equity Held for Investment, net |
The following table provides a summary of the Company’s loans and preferred equity held for investment, net (dollars in thousands):
| | | | | June 30, 2018 (Unaudited) | | December 31, 2017 | | June 30, 2019 | | December 31, 2018 |
| | | Unpaid Principal Balance | | Carrying Value | | Weighted Average Coupon(1) | | Weighted Average Maturity in Years | | Unpaid Principal Balance(2) | | Carrying Value(2) | | Weighted Average Coupon | | Weighted Average Maturity in Years | | Unpaid Principal Balance | | Carrying Value | | Weighted Average Coupon(1) | | Weighted Average Maturity in Years | | Unpaid Principal Balance | | Carrying Value | | Weighted Average Coupon(1) | | Weighted Average Maturity in Years |
| Fixed rate | | | | | | | | | | | | | | | | | | | | | | | | | | | |
| Mortgage loans | | $ | 16,223 |
| | $ | 16,144 |
| | 10.5 | % | | 5.8 | | $ | 493,113 |
| | $ | 484,592 |
| | 8.2 | % | | 2.4 |
| |
| Mezzanine loans | | 115,686 |
| | 115,686 |
| | 13.1 | % | | 4.9 | | 141,931 |
| | 141,828 |
| | 13.2 | % | | 3.2 |
| | $ | 178,203 |
| | $ | 177,658 |
| | 12.7 | % | | 4.4 | | $ | 175,448 |
| | $ | 174,830 |
| | 12.7 | % | | 4.9 |
| Preferred equity interests | | 89,819 |
| | 89,819 |
| | 12.0 | % | | 8.9 | | — |
| | — |
| | — |
| | — |
| | 114,240 |
| | 114,118 |
| | 12.5 | % | | 7.3 | | 113,860 |
| | 113,687 |
| | 12.6 | % | | 7.7 |
Other loans(2) | | | 26,600 |
| | 26,451 |
| | 15.6 | % | | 2.2 | | 15,000 |
| | 15,000 |
| | 16.0 | % | | 0.5 |
| | | 221,728 |
| | 221,649 |
| | | | 635,044 |
| | 626,420 |
| | | | | | 319,043 |
| | 318,227 |
| | | | 304,308 |
| | 303,517 |
| | | |
| Variable rate | | | | | | | | | | | | | | | | | | | | | | | | | | | |
| Mortgage loans | | 1,350,538 |
| | 1,354,652 |
| | 6.4 | % | | 3.7 | | 260,366 |
| | 260,932 |
| | 8.1 | % | | 2.3 |
| |
| Senior loans | | | 2,160,831 |
| | 2,153,091 |
| | 6.2 | % | | 4.3 | | 1,432,416 |
| | 1,430,635 |
| | 6.3 | % | | 4.2 |
Securitized loans(3) | | 351,526 |
| | 354,091 |
| | 7.5 | % | | 1.6 | | 377,939 |
| | 379,670 |
| | 6.7 | % | | 0.3 |
| | 43,758 |
| | 44,195 |
| | 8.6 | % | | 0.7 | | 302,868 |
| | 305,106 |
| | 7.9 | % | | 1.1 |
| Mezzanine loans | | 120,582 |
| | 120,986 |
| | 11.1 | % | | 2.1 | | 34,391 |
| | 34,279 |
| | 9.8 | % | | 1.3 |
| | 55,259 |
| | 55,572 |
| | 12.1 | % | | 2.5 | | 90,265 |
| | 90,567 |
| | 12.2 | % | | 2.0 |
| Preferred equity interests | | 27,469 |
| | 27,756 |
| | 14.5 | % | | 1.5 | | — |
| | — |
| | — |
| | — |
| |
| | | 1,850,115 |
| | 1,857,485 |
| | | | 672,696 |
| | 674,881 |
| | | | | | 2,259,848 |
| | 2,252,858 |
| | | | 1,825,549 |
| | 1,826,308 |
| | | |
| | | 2,071,843 |
| | 2,079,134 |
| | | | 1,307,740 |
| | 1,301,301 |
| | | | | | 2,578,891 |
| | 2,571,085 |
| | | | 2,129,857 |
| | 2,129,825 |
| | | |
| | | | | | | | | | | | | | | | | | | | | | | | | | | | |
| Allowance for loan losses | | NA |
| | — |
| | | | NA |
| | (517 | ) | | | | | |
Allowance for loan losses(4) | | | NA |
| | (172,894 | ) | | | | NA |
| | (109,328 | ) | | | |
| Loans and preferred equity held for investment, net | | $ | 2,071,843 |
| | $ | 2,079,134 |
| | | | $ | 1,307,740 |
| | $ | 1,300,784 |
| | | | | | $ | 2,578,891 |
| | $ | 2,398,191 |
| | | | $ | 2,129,857 |
| | $ | 2,020,497 |
| | | |
| |
| (1) | Calculated based on contractual interest rate. |
| |
| (2) | Includes four purchased credit-impaired loans with combined unpaid principal balance of $21.4 millionone senior loan and carrying value of $20.8 million.one corporate term loan secured by the borrower’s limited partnership interests in a fund. |
| |
| (3) | Represents loans transferred into securitization trusts that are consolidated by the Company. |
| |
| (4) | At December 31, 2018, allowance for loan losses does not include $5.1 million of provision for loan loss associated with a receivable for operating expenses paid by the Company on the borrower’s behalf in connection with four loans for which the Company took ownership of the underlying collateral in January 2019. |
COLONY CREDIT REAL ESTATE, INC.
NOTES TO CONSOLIDATED FINANCIAL STATEMENTS (Continued)
(Unaudited)
As of June 30, 2018,2019, the weighted average maturity, including extensions, of loans and preferred equity investments was 3.54.3 years.
The Company had $8.7 million and $8.6 million of interest receivable related to its loans and preferred equity held for investment, net as of June 30, 2019 and December 31, 2018, respectively.
Activity relating to the Company’s loans and preferred equity held for investment, net was as follows (dollars in thousands):
|
| | | | |
| | | Carrying Value |
| Balance at January 1, 2019 | | $ | 2,020,497 |
|
| Acquisitions/originations/additional funding | | 886,397 |
|
| Loan maturities/principal repayments | | (279,951 | ) |
| Foreclosure of loans held for investment | | (174,048 | ) |
| Discount accretion/premium amortization | | 2,409 |
|
| Capitalized interest | | 6,453 |
|
| Change in allowance for loan loss | | (63,566 | ) |
| Balance at June 30, 2019 | | $ | 2,398,191 |
|
|
| | | | |
| | | Carrying Value |
| Balance at January 1, 2018 | | $ | 1,300,784 |
|
| Loans and preferred equity held for investment acquired in the Combination (Note 3) | | 1,249,733 |
|
Deconsolidation of investment entities(1) | | (553,678 | ) |
| Acquisitions/originations/additional funding | | 392,278 |
|
| Loan maturities/principal repayments | | (262,918 | ) |
Combination adjustment(2) | | (50,314 | ) |
| Discount accretion/premium amortization | | 1,498 |
|
| Capitalized interest | | 1,234 |
|
| Recovery of allowance for loan loss | | 517 |
|
| Balance at June 30, 2018 | | $ | 2,079,134 |
|
| |
(1) | Represents loans and preferred equity held for investment, net which were deconsolidated as a result of the Combination. Refer to Note 2, “Summary of Significant Accounting Policies,” for further detail. |
| |
(2) | Represents a loan held for investment, net that was previously sold by the CLNY Investment Entities to NorthStar I and was treated as a secured financing by the CLNY Investment Entities. This loan was eliminated as a result of the Combination. |
Nonaccrual and Past Due Loans and Preferred Equity
COLONY CREDIT REAL ESTATE, INC.
NOTES TO CONSOLIDATED FINANCIAL STATEMENTS (Continued)
(Unaudited)
Loans and preferred equity that are 90 days or more past due as to principal or interest, or where reasonable doubt exists as to timely collection, are generally considered nonperforming and placed on nonaccrual status. At June 30, 2018,2019, other than the NY hospitality loans discussed below, all other loans and preferred equity held for investment remain current on interest payments.
In March 2018, the borrower on the Company’s four NY hospitality loans with an unpaid principal balance of $260.2 million failed to make itsall required interest payment.payments and the loans were placed on non-accrual status. These four loans are secured by the same collateral. The Company has placedbelieves ultimate sale of the underlying collateral and repayment of the loans on non-accrual status and has commenced discussions withfrom the borrower to resolvesales proceeds is the matter. Interest income is recognized on a cash basis. Nomost likely outcome. During 2018, the Company recorded $53.8 million of provision for loan loss was recorded duringlosses on the three and six months ended June 30, 2018 asfour NY hospitality loans to reflect the Company believes sufficient collateralestimated value exists to coverbe recovered from the outstanding loan balances.borrower following a sale. During the three months ended June 30, 2019, the Company revised its estimated recovery and recorded an additional $104.3 million of provision for loan loss. The additional provision is based on significant deterioration in the NY hospitality market and feedback from the sales process and reflects the estimated value to be recovered from the borrower following a potential sale.
During 2018, the Company receivedrecorded $23.8 million of provision for loan losses for two separate borrowers on three of the Company’s regional mall loans that are secured by two regional malls (“Northeast Regional Mall A” and recognized $1.0 million in interest income on“Northeast Regional Mall B”) to reflect the loans. These discussions typically include numerous pointsestimated fair value of negotiation asthe collateral.
In June 2019, the Company completed foreclosure proceedings on two of the three loans secured by Northeast Regional Mall A with unpaid principal balances totaling $36.9 million. See Note 7, “Real estate, net and Real Estate Held for Sale” for further information.
During the borrower work towards a settlement or other alternative resolution, which can impactthree months ended June 30, 2019, the potentialCompany recognized an additional $3.9 millionprovision for loan repayment or receiptloss on Northeast Regional Mall B to reflect the estimated fair value of the collateral. The additional provision is based on current and prospective leasing activity. The Company has been and is continuing to sweep all cash.
Also during the three months ended June 30, 2019, the Company separately recognized a $2.0 million provision for loan loss on two loans secured by one regional mall (“West Regional Mall”) to reflect the estimated fair value of the collateral. The Company has been and is continuing to sweep all cash.
The following table provides an aging summary of loans and preferred equity held for investment at carrying values before allowance for loan losses, if any (dollars in thousands):
|
| | | | | | | | | | | | | | | | | | | | |
| | | Current or Less Than 30 Days Past Due(1)(2)(3) | | 30-59 Days Past Due | | 60-89 Days Past Due(1)(2)(3) | | 90 Days or More Past Due(3) | | Total Loans |
| June 30, 2018 (Unaudited) | | $ | 1,597,382 |
| | $ | — |
| | $ | 118,557 |
| | $ | 363,195 |
| | $ | 2,079,134 |
|
| December 31, 2017 | | 1,122,366 |
| | 144,241 |
| | 7,929 |
| | 26,765 |
| | 1,301,301 |
|
|
| | | | | | | | | | | | | | | | | | | | |
| | | Current or Less Than 30 Days Past Due | | 30-59 Days Past Due | | 60-89 Days Past Due | | 90 Days or More Past Due(1) | | Total Loans |
| June 30, 2019 | | $ | 2,312,956 |
| | $ | — |
| | $ | — |
| | $ | 258,129 |
| | $ | 2,571,085 |
|
| December 31, 2018 | | 1,632,817 |
| | 58,751 |
| | 42,995 |
| | 395,262 |
| | 2,129,825 |
|
| |
| (1) | At June 30, 2018, includes four loans to two separate borrowers consisting of two current or less than 30 days past due loans and two 60-89 days past due loans held for investment. Subsequent to June 30, 2018, extensions for the four loans with a total combined carrying value of $79.9 million were executed while the Company continues discussions with the borrowers to work towards a settlement or other alternative resolution. |
| |
(2) | Subsequent to June 30, 2018, a senior mortgage loan with a carrying value of $75.6 million became real estate owned through a foreclosure sale. See Note 18, “Subsequent Events,” for further information. |
| |
(3) | At June 30, 2018,2019, 90 days or more past due loans includes four loans to the same borrower and secured by the same collateral with combined carrying value before allowance for loan losses of $261.1$258.1 million on non-accrual status. All other loans in this table remain current on interest payments. |
COLONY CREDIT REAL ESTATE, INC.
NOTES TO CONSOLIDATED FINANCIAL STATEMENTS (Continued)
(Unaudited)
Troubled Debt Restructuring
During the three and six months ended June 30, 2019, there were no loans modified as TDRs.
At June 30, 2018 and2019, the Company did not have any TDR loans. At December 31, 2017,2018, there was one mezzanine loan previously modified in a TDR with carrying value before allowance for loan losses of $28.6 million. The loan had been modified in 2015. TheAt December 31, 2018, the Company also hashad three other loans with a combined carrying value before provision for loan loss of $108.5 million that are cross-defaultedcross-collateralized with the TDR loan to the same borrower. TwoAll three loans matured in November 2017 and were in default at both June 30, 2018 and December 31, 2017, while the third loan remains current.2018. All four loans are collateralizedwere cross-collateralized with 2728 office, retail, multifamily and industrial properties with an estimated aggregate fair value of approximately $137.1 million. In February 2018, the borrower and theproperties. The Company entered intorecorded a forebearance agreement to allow both parties to review the exit strategy. In May 2018, the Company extended the forbearance agreement, which now expires in September 2018. These discussions typically include numerous points of negotiation as the Company and the borrower work towards a settlement or other alternative resolution, which can impact the potential for loan repayment or receipt of collateral. No$31.7 million provision for loan loss was recorded at June 30, 2018 or December 31, 2017 on the two defaultedfour loans as the Company believes there is sufficient collateral value to cover the outstandingand an additional $5.1 million provision for loan balances in aggregate. The Company has no additional commitments to lend toloss associated with a receivable for operating expenses paid on behalf of the borrower with the TDR loan.
There were no loans modified as TDRs during the six months ended June 30, 2018 and year ended December 31, 2017.2018.
The Company completed foreclosure proceedings under the mezzanine loan to take control of the 28 cross-collateralized properties in January 2019. To improve the operating performance of the 28 properties, the Company has engaged new property managers, working under the oversight of its asset management team. See Note 7 “Real Estate, net and Real Estate Held for Sale” for further discussion.
Impaired Loans
Loans are identified as impaired when it is no longer probable that interest or principal will be collected according to the contractual terms of the original loan agreement. Impaired loans include predominantly loans under nonaccrual, performing and nonperforming TDRs.TDRs, as well as loans in maturity default. The following table presents impaired loans at the respective reporting dates (dollars in thousands):
|
| | | | | | | | | | | | | | | | | | | | |
| | | Unpaid Principal Balance(1) | | Gross Carrying Value | | |
| | | | With Allowance for Loan Losses | | Without Allowance for Loan Losses | | Total | | Allowance for Loan Losses(2) |
| June 30, 2019 | | $ | 318,737 |
| | $ | 320,058 |
| | $ | — |
| | $ | 320,058 |
| | $ | 172,894 |
|
| December 31, 2018 | | 456,703 |
| | 458,942 |
| | — |
| | 458,942 |
| | 109,328 |
|
|
| | | | | | | | | | | | | | | | | | | | |
| | | Unpaid Principal Balance(1)(2)(3) | | Gross Carrying Value | | |
| | | | With Allowance for Loan Losses | | Without Allowance for Loan Losses(1)(2)(3) | | Total | | Allowance for Loan Losses |
| June 30, 2018 (Unaudited) | | $ | 558,483 |
| | $ | — |
| | $ | 560,983 |
| | $ | 560,983 |
| | $ | — |
|
| December 31, 2017 | | 237,441 |
| | 42,176 |
| | 195,934 |
| | 238,110 |
| | 517 |
|
COLONY CREDIT REAL ESTATE, INC.
NOTES TO CONSOLIDATED FINANCIAL STATEMENTS (Continued)
(Unaudited)
| |
| (1) | Subsequent to June 30, 2018, extensions for four loans to two separate borrowers with combined unpaid principal balances and carrying values of $79.9 million were executed while the Company continues discussions with the borrowers to work towards a settlement or other alternative resolution. |
| |
(2) | Subsequent to June 30, 2018, a senior mortgage loan with a carrying value of $75.6 million became real estate owned through a foreclosure sale. See Note 18, “Subsequent Events,” for further information. |
| |
(3) | At June 30, 2018,2019, includes four loans to the same borrower and secured by the same collateral with combined unpaid principal balance of $260.2$257.2 million and gross carrying value of $261.1$258.1 million on non-accrual status. All other loans included in this table remain current on interest payments. |
| |
| (2) | At December 31, 2018, allowance for loan losses does not include $5.1 million of provision for loan loss associated with a receivable for operating expenses paid by the Company on the borrower’s behalf in connection with four loans for which the Company took possession of the underlying collateral in January 2019. |
The average carrying value and interest income recognized on impaired loans were as follows (dollars in thousands):
|
| | | | | | | | | | | | | | | | |
| | | Three Months Ended June 30, | | Six Months Ended June 30, |
| | | 2019 | | 2018 | | 2019 | | 2018 |
| Average carrying value before allowance for loan losses | | $ | 320,934 |
| | $ | 496,559 |
| | $ | 389,500 |
| | $ | 399,546 |
|
| Interest income | | 1,305 |
| | 6,897 |
| | 2,651 |
| | 10,655 |
|
|
| | | | | | | | | | | | | | | | |
| | | Three Months Ended June 30, | | Six Months Ended June 30, |
| | | 2018 | | 2017 | | 2018 | | 2017 |
| Average carrying value before allowance for loan losses | | $ | 496,559 |
| | $ | 98,478 |
| | $ | 399,546 |
| | $ | 141,109 |
|
| Interest income | | 6,897 |
| | 2,164 |
| | 10,655 |
| | 4,442 |
|
Allowance for Loan Losses
As of June 30, 2018, there was no allowance for loan losses. As of December 31, 20172019, the allowance for loan losses was $0.5$172.9 million related to $42.2$320.1 million in carrying value of loans. As of December 31, 2018 the allowance for loan losses was $109.3 million related to $458.9 million in carrying value of loans.
Changes in allowance for loan losses on loans are presented below (dollars in thousands):
|
| | | | | | | | |
| | | Six Months Ended June 30, |
| | | 2019 | | 2018 |
| Allowance for loan losses at beginning of period | | $ | 109,328 |
| | $ | 517 |
|
| Provision for loan losses | | 110,258 |
| | — |
|
| Charge-off | | (46,692 | ) | | — |
|
| Recoveries | | — |
| | (517 | ) |
| Allowance for loan losses at end of period | | $ | 172,894 |
| | $ | — |
|
COLONY CREDIT REAL ESTATE, INC.
NOTES TO CONSOLIDATED FINANCIAL STATEMENTS (Continued)
(Unaudited)
|
| | | | | | | | |
| | | Six Months Ended June 30, |
| | | 2018 | | 2017 |
| Allowance for loan losses at beginning of period | | $ | (517 | ) | | $ | (3,386 | ) |
| Provision for loan losses | | — |
| | — |
|
| Charge-off | | — |
| | 3,210 |
|
| Recoveries | | 517 |
| | |
| Allowance for loan losses at end of period | | $ | — |
| | $ | (176 | ) |
Credit Quality Monitoring
Loan and preferred equity investments are typically loans secured by direct senior priority liens on real estate properties or by interests in entities that directly own real estate properties, which serve as the primary source of cash for the payment of principal and interest. The Company evaluates its loan and preferred equity investments at least quarterly and differentiates the relative credit quality principally based on: (i) whether the borrower is currently paying contractual debt service in accordance with its contractual terms; and (ii) whether the Company believes the borrower will be able to perform under its contractual terms in the future, as well as the Company’s expectations as to the ultimate recovery of principal at maturity.
As of June 30, 2018,2019, there were 13four loans held for investment to six borrowersone borrower with contractual payments past due. With the exception ofdue, which represent the NY hospitality loans previously discussed, all other loans and preferred equity held for investment remain current on interest payments.discussed. The remaining loans and preferred equity investments were performing in accordance with the contractual terms of their governing documents and were categorized as performing loans. There were seven13 loans held for investment with contractual payments past due as of December 31, 2017.2018. For the six months ended June 30, 2018,2019, no debt investment contributed more than 10.0% of interest income.
Lending Commitments
The Company has lending commitments to borrowers pursuant to certain loan agreements in which the borrower may submit a request for funding contingent on achieving certain criteria, which must be approved by the Company as lender, such as leasing, performance of capital expenditures and construction in progress with an approved budget. At June 30, 2018,2019, assuming the terms to qualify for future fundings, if any, have been met, total unfunded lending commitments was $137.4 million$226.1 million. Refer to Note 17, “Commitments and Contingencies” for mortgage loans, $6.1 million for securitized loans, $2.0 million for mezzanine loans and $1.2 million for preferred equity interests. Future funding commitments were $19.2 million for mortgage loans at December 31, 2017.further details.
| |
| 5. | Investments in Unconsolidated Ventures |
Summary
The Company’s investments in unconsolidated ventures represent noncontrolling equity interests in various entities, as follows (dollars in thousands):
|
| | | | | | | | |
| | | June 30, 2019 | | December 31, 2018 |
| Equity method investments | | $ | 665,414 |
| | $ | 742,186 |
|
| Investments under fair value option | | 53,893 |
| | 160,851 |
|
| Investments in Unconsolidated Ventures | | $ | 719,307 |
| | $ | 903,037 |
|
|
| | | | | | | | |
| | | June 30, 2018 (Unaudited) | | December 31, 2017 |
| Equity method investments | | | | |
| Investment ventures | | $ | 490,189 |
| | $ | 179,303 |
|
| | | 490,189 |
| | 179,303 |
|
| Investments under fair value option | | | | |
| Private funds | | 241,453 |
| | 24,417 |
|
| | | $ | 731,642 |
| | $ | 203,720 |
|
Equity Method Investments
Investment Ventures
Certain of the Company’s equity method investments are structured as joint ventures with one or more private funds or other investment vehicles managed by the Colony Capital with third party joint venture partners. These investment entities are generally capitalized through equity contributions from the members, although certain investments are leveraged through various financing arrangements.
The assets of the equity method investment entities may only be used to settle the liabilities of these entities and there is no recourse to the general credit of the Company nor the other investors for the obligations of these investment entities. Neither the Company nor the other investors are required to provide financial or other support in excess of their capital commitments. The Company’s exposure to the investment entities is limited to its equity method investment balance as of June 30, 20182019 and December 31, 2017,2018, respectively.
COLONY CREDIT REAL ESTATE, INC.
NOTES TO CONSOLIDATED FINANCIAL STATEMENTS (Continued)
(Unaudited)
As discussed in Note 2, “Summary of Significant Accounting Policies,” certain of the CLNY Investment Entities were deconsolidated by the Company upon closing of the Combination and accounted for as investments in unconsolidated ventures.
The Company’s investments accounted for under the equity method are summarized below (dollars in thousands):
| | | | | Ownership Interest(1) at June 30, 2018 | | Carrying Value | | Carrying Value |
| Investments | | Description | | June 30, 2018 (Unaudited) | | December 31, 2017 | | Description | | June 30, 2019 | | December 31, 2018 |
ADC investments | | Interests in seven acquisition, development and construction loans in which the Company participates in residual profits from the projects, and the risk and rewards of the arrangements are more similar to those associated with investments in joint ventures | | Various(2) | | $ | 170,451 |
| | $ | 179,303 |
| | Interests in five acquisition, development and construction loans in which the Company participates in residual profits from the projects, and the risk and rewards of the arrangements are more similar to those associated with investments in joint ventures | | $ | 164,635 |
| | $ | 165,823 |
|
Other investment ventures | | Interests in ten investments, each with less than $142.4 million carrying value at June 30, 2018 | | Various | | 319,738 |
| | — |
| | Interests in fifteen investments, each with less than $171.3 million carrying value at June 30, 2019 | | 500,779 |
| | 576,363 |
|
| |
| (1) | The Company’s ownership interest in ADC investments and other investment ventures varies and represents capital contributed to date and may not be reflective of the Company’s economic interest in the entity because of provisions in operating agreements governing various matters, such as classes of partner or member interests, allocations of profits and losses, preferential returns and guaranty of debt. Each equity method investment has been determined to be a VIE for which the Company was not deemed to be the primary beneficiary or a voting interest entity in which the Company does not have the power to control through a majority of voting interest or through other arrangements. |
| |
| (2) | The Company owns varying levels of stated equity interests in certain ADC investments, as well as profit participation interests in real estate ventures without a stated ownership interest in other ADC investments. |
Impairment
During the three months ended June 30, 2019, the Company recognized its proportionate share of impairment loss totaling $8.8 million on one senior loan secured by a regional mall (“Southeast Regional Mall”) of which the Company owns 50.0% of the joint venture. The impairment recorded reflects the estimated fair value of the collateral and is included in equity in earnings of unconsolidated ventures on the Company’s consolidated statements of operations.
Investments under Fair Value Option
Private Funds
The Company elected to account for its limited partnership interests, which range from 0.1%0.4% to 30.3%24.5%, in PE Investments under the fair value option. The Company records equity in earnings for these investments based on a change in fair value of its share of projected future cash flows.
Summarized Financial Information
The combinedDuring the first quarter, the Company sold a portion of its PE Investments for $48.9 million and recognized a loss of $0.7 million, which is included in earnings from investments in unconsolidated ventures on the Company’s consolidated statements of operations foroperations. During the unconsolidated ventures, includingthree months ended March 31, 2019, the Company received $42.3 million in proceeds related to the sale of its PE Investments and excluding unconsolidated ventures accounted for underInvestments.
During the cost method, for the sixthree months ended June 30, 2018 and 2017, are as follows (dollars2019, the Company received $44.6 million in thousands):proceeds related to the sale of its PE Investments. Subsequent to June 30, 2019 the Company received an additional $19.2 million of sales proceeds from its PE Investments. The Company has collectively received $120.6 million of the total $141.8 million under binding sales contracts.
|
| | | | | | | | |
| | | Six Months Ended June 30,(1) |
| | | 2018 | | 2017 |
| Total revenues | | $ | 45,872 |
| | $ | 16,540 |
|
Net income (loss)(2) | | 25,903 |
| | 14,259 |
|
| |
(1) | Includes summarized financial information for PE Investments on a one quarter lag, which is the most recent financial information available from the underlying funds. |
| |
(2) | Includes net investment income and unrealized and realized gains and losses for PE Investments. |
| |
| 6. | Real Estate Securities, Available for Sale |
Investments in CRE Securities
CRE securities are composed of CMBS backed by a pool of CRE loans which are typically well-diversified by type and geography. The following table presents CMBS investments as of June 30, 2019 and December 31, 2018 (dollars in thousands):
| | | | | | | | | | | | | | | | | Weighted Average | | | | | | | | | | | | | | Weighted Average |
| | | Principal
Amount(1) | | Total Discount | | Amortized
Cost | | Cumulative Unrealized
on Investments | Fair
Value | | Coupon(2) | | Unleveraged
Current
Yield | | Principal
Amount(1) | | Total Discount | | Amortized
Cost | | Cumulative Unrealized
on Investments | Fair
Value | | Coupon(2) | | Unleveraged
Current
Yield |
| As of Date: | Count | | Gain | | (Loss) | | Count | | Gain | | (Loss) | |
| June 30, 2018 | 36 | | $ | 262,105 |
| | $ | (61,109 | ) | | $ | 200,996 |
| | $ | 341 |
| | $ | (3,186 | ) | | $ | 198,151 |
| | 3.15 | % | | 7.24 | % | |
| June 30, 2019 | | 43 | | $ | 292,284 |
| | $ | (59,478 | ) | | $ | 232,806 |
| | $ | 16,294 |
| | $ | — |
| | $ | 249,100 |
| | 3.19 | % | | 7.10 | % |
| December 31, 2018 | | 43 | | 292,284 |
| | (62,772 | ) | | 229,512 |
| | 2,167 |
| | (3,494 | ) | | 228,185 |
| | 3.19 | % | | 7.10 | % |
| |
| (1) | Certain CRE securities serve as collateral for financing transactions including carrying value of $127.4$247.3 million for the CMBS Credit Facilities (refer to Note 10). The remainder is unleveraged. |
| |
| (2) | All CMBS are fixed rate. |
COLONY CREDIT REAL ESTATE, INC.
NOTES TO CONSOLIDATED FINANCIAL STATEMENTS (Continued)
(Unaudited)
The Company acquired the CRE Securities from NorthStar I and NorthStar II in the Combination. The Company held no CRE Securities as of December 31, 2017.
The Company recorded an unrealized gain in OCI of $7.9 million and $17.6 million for the three and six months ended June 30, 2019 and an unrealized loss in OCI of $1.0 million and $2.8 million for the three and six months ended June 30, 2018, of $1.0 million and $2.8 million, respectively. As of June 30, 2018,2019, the Company held 30had no securities with an aggregate carrying value of $166.9 million within an unrealized loss of $2.8 million. Based on management’s quarterly evaluation, no OTTI was identified related to these securities. The Company does not intend to sell these securities and it is more likely than not that the Company will not be required to sell these securities prior to recovery of its amortized cost basis, which may be at maturity.position.
As of June 30, 2018,2019, the weighted average contractual maturity of CRE securities was 30.731.5 years with an expected maturity of 7.86.9 years.
The Company had $0.7 million and $0.8 million of interest receivable related to its real estate securities, available for sale as of June 30, 2019 and December 31, 2018, respectively.
Investments in Investing VIEs
The Company is the directing certificate holder of three securitization trusts and has the ability to appoint and replace the special servicer on all mortgage loans. As such, U.S. GAAP requires the Company to consolidate the assets, liabilities, income and expenses of the securitization trusts as Investing VIEs. Refer to Note 2, “Summary of Significant Accounting Policies” for further discussion on Investing VIEs.
Other than the securities represented by the Company’s subordinate tranches of the securitization trusts, the Company does not have any claim to the assets or exposure to the liabilities of the securitization trusts. The original issuers, who are unrelated third parties, guarantee the interest and principal payments related to the investment grade securitization bonds in the securitization trusts, therefore these obligations do not have any recourse to the general credit of the Company as the consolidator of the securitization trusts. The Company’s maximum exposure to loss would not exceed the carrying value of its retained investments in the securitization trusts, or the subordinate tranches of the securitization trusts.
As of June 30, 2019, the mortgage loans and the related mortgage obligations held in the securitization trusts had an unpaid principal balance of $3.1 billion and $2.8 billion, respectively. As of December 31, 2018, the mortgage loans and the related mortgage obligations held in the securitization trusts had an unpaid principal balance of $3.1 billion and $2.9 billion, respectively. As of June 30, 2018,2019, across the three consolidated securitization trusts, the underlying collateral consisted of 159157 underlying commercial mortgage loans, with a weighted average coupon of 4.9% and a weighted average loan to value ratio of 57.9%56.4%.
The following table presents the assets and liabilities recorded on the consolidated balance sheets attributable to the securitization trust as of June 30, 2019 and December 31, 2018 (dollars in thousands):
|
| | | | | | | | |
| | | June 30, 2019 | | December 31, 2018 |
| Assets | | | | |
| Mortgage loans held in a securitization trust, at fair value | | $ | 3,175,950 |
| | $ | 3,116,978 |
|
| Receivables, net | | 12,920 |
| | 13,178 |
|
| Total assets | | $ | 3,188,870 |
| | $ | 3,130,156 |
|
| Liabilities | | | | |
| Mortgage obligations issued by a securitization trust, at fair value | | $ | 3,026,282 |
| | $ | 2,973,936 |
|
| Accrued and other liabilities | | 12,241 |
| | 12,233 |
|
| Total liabilities | | $ | 3,038,523 |
| | $ | 2,986,169 |
|
|
| | | | |
| | | June 30, 2018 |
| Assets | | |
| Mortgage loans held in a securitization trust, at fair value | | $ | 3,154,112 |
|
| Receivables, net | | 13,302 |
|
| Total assets | | $ | 3,167,414 |
|
| Liabilities | | |
| Mortgage obligations issued by a securitization trust, at fair value | | $ | 3,010,636 |
|
| Accrued and other liabilities | | 12,425 |
|
| Total liabilities | | $ | 3,023,061 |
|
The Company elected the fair value option to measure the assets and liabilities of the securitization trusts, which requires that changes in valuations of the securitization trusts be reflected in the Company’s consolidated statements of operations.
The difference between the carrying values of the mortgage loans held in securitization trusts and the carrying value of the mortgage obligations issued by securitization trusts was $143.5$149.7 million and $143.0 million as of June 30, 2019 and December 31, 2018, respectively, and approximates the fair value of the Company’s underlyingretained investments in the subordinate tranches of the securitization trusts, which are eliminated in consolidation. Refer to Note 15, “Fair Value” for a description of the valuation techniques used to measure fair value of assets and liabilities of the Investing VIEs.
COLONY CREDIT REAL ESTATE, INC.
NOTES TO CONSOLIDATED FINANCIAL STATEMENTS (Continued)
(Unaudited)
The followingbelow table presents net income attributable to the Company’s common stockholders for the three and six months ended June 30, 2019 and 2018 generated from the Company’s investments in the subordinate tranches of the securitization trusts (dollars in thousands):
|
| | | | | | | | | | | | | | | | |
| | | Three Months Ended June 30, | | Six Months Ended June 30, |
| | | 2019 | | 2018 | | 2019 | | 2018(1) |
| Statement of Operations | | | | | | | | |
| Interest expense | | $ | (278 | ) | | $ | — |
| | $ | (541 | ) | | $ | — |
|
| Interest income on mortgage loans held in securitization trusts | | 38,656 |
| | 39,496 |
| | 77,132 |
| | 65,361 |
|
| Interest expense on mortgage obligations issued by securitization trusts | | (35,756 | ) | | (36,459 | ) | | (71,391 | ) | | (60,737 | ) |
| Net interest income | | 2,622 |
| | 3,037 |
| | 5,200 |
| | 4,624 |
|
| Administrative expense | | (331 | ) | | (461 | ) | | (690 | ) | | (362 | ) |
| Unrealized gain on mortgage loans and obligations held in securitization trusts, net | | 5,549 |
| | 3,696 |
| | 6,578 |
| | 4,193 |
|
| Realized gain (loss) on mortgage loans and obligations held in securitization trusts, net | | — |
| | (2,203 | ) | | 48 |
| | (2,203 | ) |
| Net income attributable to Colony Credit Real Estate, Inc. common stockholders | | $ | 7,840 |
| | $ | 4,069 |
| | $ | 11,136 |
| | $ | 6,252 |
|
| |
| (1) | The net income attributable to the Company’s stockholders for the six months ended June 30, 2018 reflects only five months of activity, as the Company’s investments in the subordinate tranches of the securitization trusts were acquired from NorthStar I and NorthStar II in the Combination on February 1, 2018. |
|
| | | | | | | | | | | | | | | | |
| | | Three Months Ended June 30, | | Six Months Ended June 30, |
| | | 2018 | | 2017 | | 2018 | | 2017 |
| Statement of Operations | | | | | | | | |
| Interest income on mortgage loans held in securitization trusts | | $ | 39,496 |
| | $ | — |
| | $ | 65,361 |
| | $ | — |
|
| Interest expense on mortgage obligations issued by securitization trusts | | (36,459 | ) | | — |
| | (60,737 | ) | | — |
|
| Net interest income | | 3,037 |
| | — |
| | 4,624 |
| | — |
|
| Administrative expenses | | (461 | ) | | — |
| | (362 | ) | | — |
|
| Unrealized gain on mortgage loans and obligations held in securitization trusts, net | | 3,696 |
| | — |
| | 4,193 |
| | — |
|
| Realized loss on mortgage loans and obligations held in securitization trusts, net | | (2,203 | ) | | — |
| | (2,203 | ) | | — |
|
| Net income attributable to Colony Credit Real Estate, Inc. common stockholders | | $ | 4,069 |
| | $ | — |
| | $ | 6,252 |
| | $ | — |
|
| |
| 7. | Real Estate, net and Real Estate Held for Sale |
The following table presents the Company’s net lease portfolio, net, as of June 30, 20182019 and December 31, 20172018 (dollars in thousands):
|
| | | | | | | | |
| | | June 30, 2019 | | December 31, 2018 |
| Land and improvements | | $ | 226,746 |
| | $ | 226,141 |
|
| Buildings, building leaseholds, and improvements | | 1,014,376 |
| | 1,010,339 |
|
| Tenant improvements | | 25,184 |
| | 24,060 |
|
| Construction-in-progress | | 2,497 |
| | 437 |
|
| Subtotal | | $ | 1,268,803 |
| | $ | 1,260,977 |
|
| Less: Accumulated depreciation | | (54,354 | ) | | (34,532 | ) |
Less: Impairment(1) | | (7,094 | ) | | (7,094 | ) |
| Net lease portfolio, net | | $ | 1,207,355 |
| | $ | 1,219,351 |
|
|
| | | | | | | | |
| | | June 30, 2018 (Unaudited) | | December 31, 2017 |
| Land and improvements | | $ | 102,764 |
| | $ | 25,262 |
|
| Buildings, building leaseholds, and improvements | | 575,582 |
| | 178,109 |
|
| Tenant improvements | | 9,497 |
| | 2,316 |
|
| Construction-in-progress | | 23 |
| | 21 |
|
| Subtotal | | $ | 687,866 |
| | $ | 205,708 |
|
| Less: Accumulated depreciation | | (16,020 | ) | | (5,516 | ) |
| Net lease portfolio, net | | $ | 671,846 |
| | $ | 200,192 |
|
| |
| (1) | See Note 15, “Fair Value,” for discussion of impairment of real estate. |
The following table presents the Company’s portfolio of other portfolio,real estate, net, including foreclosed properties, as of June 30, 20182019 and December 31, 20172018 (dollars in thousands):
|
| | | | | | | | |
| | | June 30, 2019 | | December 31, 2018 |
| Land and improvements | | $ | 135,944 |
| | $ | 113,495 |
|
| Buildings, building leaseholds, and improvements | | 544,542 |
| | 627,612 |
|
| Tenant improvements | | 46,527 |
| | 24,001 |
|
| Furniture, fixtures and equipment | | 7,236 |
| | 17,910 |
|
| Construction-in-progress | | 2,416 |
| | 2,635 |
|
| Subtotal | | $ | 736,665 |
| | $ | 785,653 |
|
| Less: Accumulated depreciation | | (35,721 | ) | | (23,030 | ) |
Less: Impairment(1) | | (10,000 | ) | | (22,284 | ) |
| Other portfolio, net | | $ | 690,944 |
| | $ | 740,339 |
|
| |
| (1) | See Note 15, “Fair Value,” for discussion of impairment of real estate. |
COLONY CREDIT REAL ESTATE, INC.
NOTES TO CONSOLIDATED FINANCIAL STATEMENTS (Continued)
(Unaudited)
|
| | | | | | | | |
| | | June 30, 2018 (Unaudited) | | December 31, 2017 |
| Land and improvements | | $ | 139,586 |
| | $ | 667 |
|
| Buildings, building leaseholds, and improvements | | 645,089 |
| | 18,477 |
|
| Tenant improvements | | 30,120 |
| | 36 |
|
| Furniture, fixtures and equipment | | 10,674 |
| | 680 |
|
| Construction-in-progress | | 757 |
| | — |
|
| Subtotal | | $ | 826,226 |
| | $ | 19,860 |
|
| Less: Accumulated depreciation | | (12,515 | ) | | (312 | ) |
| Other portfolio, net | | $ | 813,711 |
| | $ | 19,548 |
|
For the six months ended June 30, 2018,2019, the Company had no single property with rental and other income equal to or greater than 10.0% of total revenue.
At June 30, 2019 and December 31, 2018, the Company held foreclosed properties which are included in real estate, net with a carrying value of $19.8 million.$160.6 million and $128.8 million, respectively. At December 31, 2017,June 30, 2019, the Company held foreclosed properties with a carrying valuein assets held for sale of $19.5$72.3 million.
Depreciation Expense
Depreciation expense on real estate was $20.7 million and $13.5 million for the three months ended June 30, 2019 and 2018, respectively. Depreciation expense on real estate was $40.6 million and $22.8 million for the six months ended June 30, 2019 and 2018, respectively.
Property Operating Income
For the three months ended June 30, 2018, property operating income was composed of $39.0 million of total lease revenue and $0.7 million of hotel operating income, respectively. For the six months ended June 30, 2018, property operating income was composed of $67.2 million of total lease revenue and $1.1 million of hotel operating income, respectively. For the three and six months ended June 30, 2019, the components of property operating income were as follows (dollars in thousands).
37 |
| | | | | | | | |
| | | Three Months Ended June 30, | | Six Months Ended June 30, |
| | | 2019 | | 2019 |
Lease revenues(1) | | | | |
| Minimum lease revenue | | $ | 45,115 |
| | $ | 89,643 |
|
| Variable lease revenue | | 5,518 |
| | 12,174 |
|
| | | $ | 50,633 |
| | $ | 101,817 |
|
| Hotel operating income | | 13,188 |
| | 24,522 |
|
| | | $ | 63,821 |
| | $ | 126,339 |
|
| |
| (1) | Excludes net amortization income related to above and below-market leases of $0.9 million and $1.6 million for the three and six months ended June 30, 2019, respectively. |
COLONY CREDIT REAL ESTATE, INC.
NOTES TO CONSOLIDATED FINANCIAL STATEMENTS (Continued)
(Unaudited)
Minimum Future Rents
Minimum rental amounts due under leases are generally either subject to scheduled fixed increases or adjustments. The following table presents approximate future minimum rental income under non-cancellable operating leases, excluding variable lease revenue of tenant reimbursements, to be received over the next five years and thereafter as of June 30, 2019 (dollars in thousands):
|
| | | | |
| Remainder of 2019 | | $ | 81,114 |
|
| 2020 | | 128,231 |
|
| 2021 | | 114,582 |
|
| 2022 | | 102,475 |
|
| 2023 | | 85,094 |
|
| 2024 and thereafter | | 517,529 |
|
| Total | | $ | 1,029,025 |
|
COLONY CREDIT REAL ESTATE, INC.
NOTES TO CONSOLIDATED FINANCIAL STATEMENTS (Continued)
(Unaudited)
The following table presents approximate future minimum rental income under non-cancellable operating leases to be received over the next five years and thereafter as of December 31, 2018 (dollars in thousands):
| | | Remainder of 2018 | | $ | 45,282 |
| |
| 2019 | | 85,941 |
| | $ | 113,525 |
|
| 2020 | | 77,171 |
| | 107,413 |
|
| 2021 | | 63,731 |
| | 98,343 |
|
| 2022 | | 51,710 |
| | 88,270 |
|
| 2023 and thereafter | | 98,568 |
| |
| 2023 | | | 73,257 |
|
| 2024 and thereafter | | | 765,652 |
|
| Total | | $ | 422,403 |
| | $ | 1,246,460 |
|
The rental properties owned at June 30, 20182019 are leased under non-cancellable operating leases with current expirations ranging from 20182019 to 2029,2046, with certain tenant renewal rights. For certain properties, the tenants pay the Company, in addition to the contractual base rent, their pro rata share of real estate taxes and operating expenses. Certain lease agreements provide for periodic rental increases and others provide for increases based on the consumer price index.
Commitments and Contractual Obligations
Ground Lease Obligation
In connection with real estate acquisitions, the Company assumed certain noncancelable operating ground leases as lessee or sublessee with expiration dates through 2027.2050. Rents on certain ground leases are paid directly by the tenants. Ground rent expense for the three and six months ended June 30, 2019 was approximately $0.7 million and $1.5 million, respectively. Ground rent expense for the three and six months ended June 30, 2018 was approximately $0.7 million and $1.4 million, respectively. Ground rent expense
Refer to Note 17, “Commitments and Contingencies” for eachthe details of the three and six months ended June 30, 2017 was de minimis.
The following table presents future minimum rental payments excluding contingent rents, on noncancelable ground leaseslease on real estate as of June 30, 2019.
Real Estate Asset Acquisitions
The following table summarizes the Company’s real estate asset acquisitions for the six months ended June 30, 2019 and the year ended December 31, 2018 (dollars in thousands):
|
| | | | |
| Remainder of 2018 | | $ | 1,410 |
|
| 2019 | | 2,821 |
|
| 2020 | | 2,812 |
|
| 2021 | | 2,720 |
|
| 2022 | | 1,798 |
|
| 2023 and thereafter | | 2,891 |
|
| Total | | $ | 14,452 |
|
|
| | | | | | | | | | | | | | | | | | | | | | | | | | | | | | | |
| | | | | | | Purchase Price Allocation |
| Acquisition Date | Property Type and Location | Number of Buildings | | Purchase Price(1) | | Land and Improvements(2) | | Building and Improvements(2) | | Furniture, Fixtures and Equipment | | Lease Intangible Assets(2) | | Other Assets | | Other Liabilities |
| Six Months Ended June 30, 2019 |
| June | Retail - Massachusetts(3) | 3 |
| | $ | 21,919 |
| | $ | 9,294 |
| | $ | 6,598 |
| | $ | — |
| | $ | 5,256 |
| | $ | 1,538 |
| | $ | (767 | ) |
| January | Various - in U.S.(3) | 28 |
| | 105,437 |
| | 38,145 |
| | 66,413 |
| | — |
| | 879 |
| | — |
| | — |
|
| | | | | $ | 127,356 |
| | $ | 47,439 |
| | $ | 73,011 |
| | $ | — |
| | $ | 6,135 |
| | $ | 1,538 |
| | $ | (767 | ) |
| Year Ended December 31, 2018 |
| July | Office - Norway(4) | 26 |
| | $ | 318,860 |
| | $ | 60,510 |
| | $ | 271,983 |
| | $ | — |
| | $ | 25,287 |
| | $ | — |
| | $ | (38,920 | ) |
| August | Hotel - Dallas, TX(3) | 1 |
| | 75,663 |
| | 8,216 |
| | 61,580 |
| | 3,947 |
| | 465 |
| | 2,023 |
| | (568 | ) |
| August | Industrial - Various in U.S.(4) | 2 |
| | 292,000 |
| | 66,844 |
| | 189,105 |
| | — |
| | 36,051 |
| | — |
| | — |
|
| September | Hotel - Pittsburgh, PA(3) | 1 |
| | 42,315 |
| | 7,247 |
| | 26,363 |
| | 3,025 |
| | 1,408 |
| | 4,392 |
| | (120 | ) |
| | | | | $ | 728,838 |
| | $ | 142,817 |
| | $ | 549,031 |
| | $ | 6,972 |
| | $ | 63,211 |
| | $ | 6,415 |
| | $ | (39,608 | ) |
| |
| (1) | Dollar amounts of purchase price and allocation to assets acquired and liabilities assumed are translated using foreign exchange rate as of the respective dates of acquisitions, where applicable. |
| |
| (2) | Useful life of real estate acquired is 7 to 41 years for buildings, 1 to 15 years for site improvements, 15 to 20 years for tenant improvements, 2 to 3 years for furniture, fixtures and equipment, and 1 to 20 years for lease intangibles. |
| |
| (3) | Represents assets acquired by the Company through foreclosure. |
| |
| (4) | Represents net lease properties acquired by the Company. |
COLONY CREDIT REAL ESTATE, INC.
NOTES TO CONSOLIDATED FINANCIAL STATEMENTS (Continued)
(Unaudited)
Real Estate Held for Sale
The following table summarizes the Company’s assets and related liabilities held for sale related to real estate (dollars in thousands):
|
| | | | |
| | | June 30, 2019 |
| Assets | | |
| Real estate, net | | $ | 147,246 |
|
| Deferred leasing costs and intangible assets, net | | 461 |
|
| Total assets held for sale | | $ | 147,707 |
|
During the three months ended June 30, 2019, the Company classified its student housing portfolio, a retail property, and a hotel as held for sale.
There were no assets held for sale that constituted discontinued operations as of June 30, 2019 and December 31, 2018.
| |
| 8. | Deferred Leasing Costs and Other Intangibles |
The Company’s deferred leasing costs, other intangible assets and intangible liabilities at June 30, 20182019 and December 31, 20172018 are as follows (dollars in thousands):
| | | | | June 30, 2018 (Unaudited) | | June 30, 2019 |
| | | Carrying Amount | | Accumulated Amortization | | Net Carrying Amount | | Carrying Amount | | Accumulated Amortization | | Net Carrying Amount |
| Deferred Leasing Costs and Intangible Assets | | | | | | | | | | | | |
| In-place lease values | | $ | 76,949 |
| | $ | (19,763 | ) | | $ | 57,186 |
| | $ | 127,229 |
| | $ | (32,943 | ) | | $ | 94,286 |
|
| Deferred leasing costs | | | 46,046 |
| | (10,744 | ) | | 35,302 |
|
| Above-market lease values | | 19,437 |
| | (2,495 | ) | | 16,942 |
| | 18,931 |
| | (5,532 | ) | | 13,399 |
|
| Below-market ground lease obligations | | 52 |
| | (12 | ) | | 40 |
| |
| Deferred leasing costs | | 30,894 |
| | (2,636 | ) | | 28,258 |
| |
| Other intangibles | | | 905 |
| | (371 | ) | | 534 |
|
| | | $ | 127,332 |
| | $ | (24,906 | ) | | $ | 102,426 |
| | $ | 193,111 |
| | $ | (49,590 | ) | | $ | 143,521 |
|
| Intangible Liabilities | | | | | | | | | | | | |
| Below-market lease values | | $ | 19,790 |
| | $ | (2,001 | ) | | $ | 17,789 |
| | $ | 39,235 |
| | $ | (7,868 | ) | | $ | 31,367 |
|
|
| | | | | | | | | | | | |
| | | December 31, 2018 |
| | | Carrying Amount | | Accumulated Amortization | | Net Carrying Amount |
| Deferred Leasing Costs and Intangible Assets | | | | | | |
| In-place lease values | | $ | 115,778 |
| | $ | (27,120 | ) | | $ | 88,658 |
|
| Deferred leasing costs | | 39,130 |
| | (6,848 | ) | | 32,282 |
|
| Above-market lease values | | 16,203 |
| | (3,883 | ) | | 12,320 |
|
| Other intangibles | | 906 |
| | (134 | ) | | 772 |
|
Below-market ground lease obligations(1) | | 52 |
| | (16 | ) | | 36 |
|
| | | $ | 172,069 |
| | $ | (38,001 | ) | | $ | 134,068 |
|
| Intangible Liabilities | | | | | | |
| Below-market lease values | | $ | 19,374 |
| | $ | (4,278 | ) | | $ | 15,096 |
|
|
| | | | | | | | | | | | |
| | | December 31, 2017 |
| | | Carrying Amount | | Accumulated Amortization | | Net Carrying Amount |
| Deferred Leasing Costs and Intangible Assets | | | | | | |
| In-place lease values | | $ | 9,214 |
| | $ | (2,657 | ) | | $ | 6,557 |
|
| Above-market lease values | | 1,682 |
| | (283 | ) | | 1,399 |
|
| Below-market ground lease obligations | | 52 |
| | (8 | ) | | 44 |
|
| Deferred leasing costs | | 3,671 |
| | (657 | ) | | 3,014 |
|
| | | $ | 14,619 |
| | $ | (3,605 | ) | | $ | 11,014 |
|
| Intangible Liabilities | | | | | | |
| Below-market lease values | | $ | 51 |
| | $ | (15 | ) | | $ | 36 |
|
| |
| (1) | Upon adopting the standard of ASU No. 2016-02, Leases on January 1, 2019 the below-market ground lease obligations are included in right-of-use lease assets. |
The following table summarizes the amortization of deferred leasing costs, intangible assets and intangible liabilities for the three and six months ended June 30, 20182019 and 20172018 (dollars in thousands):
|
| | | | | | | | | | | | | | | | |
| | | Three Months Ended June 30, | | Six Months Ended June 30, |
| | | 2019 | | 2018 | | 2019 | | 2018 |
| Above-market lease values | | $ | (876 | ) | | $ | (1,305 | ) | | $ | (1,889 | ) | | $ | (2,212 | ) |
| Below-market lease values | | 1,857 |
| | 1,185 |
| | 3,482 |
| | 1,986 |
|
| Net increase (decrease) to property operating income | | $ | 981 |
| | $ | (120 | ) | | $ | 1,593 |
| | $ | (226 | ) |
| | | | | | | | | |
Below-market ground lease obligations(1) | | $ | — |
| | $ | 2 |
| | $ | — |
| | $ | 4 |
|
| Increase to property operating expense | | $ | — |
| | $ | 2 |
| | $ | — |
| | $ | 4 |
|
| | | | | | | | | |
| In-place lease values | | $ | 5,980 |
| | $ | 8,560 |
| | $ | 11,454 |
| | $ | 17,106 |
|
| Deferred leasing costs | | 2,408 |
| | 956 |
| | 4,547 |
| | 1,979 |
|
| Other intangibles | | 120 |
| | — |
| | 239 |
| | — |
|
| Amortization expense | | $ | 8,508 |
| | $ | 9,516 |
| | $ | 16,240 |
| | $ | 19,085 |
|
|
| | | | | | | | | | | | | | | | |
| | | Three Months Ended June 30, | | Six Months Ended June 30, |
| | | 2018 | | 2017 | | 2018 | | 2017 |
| Above-market lease values | | $ | (1,305 | ) | | $ | (73 | ) | | $ | (2,212 | ) | | $ | (138 | ) |
| Below-market lease values | | 1,185 |
| | 4 |
| | 1,986 |
| | 7 |
|
| Net decrease to rental income | | $ | (120 | ) | | $ | (69 | ) | | $ | (226 | ) | | $ | (131 | ) |
| | | | | | | | | |
| Below-market ground lease obligations | | $ | 2 |
| | $ | 2 |
| | $ | 4 |
| | $ | 4 |
|
| Increase to ground rent expense | | $ | 2 |
| | $ | 2 |
| | $ | 4 |
| | $ | 4 |
|
| | | | | | | | | |
| In-place lease values | | $ | 8,560 |
| | $ | 907 |
| | $ | 17,106 |
| | $ | 1,719 |
|
| Deferred leasing costs | | 956 |
| | 173 |
| | 1,979 |
| | 333 |
|
| Amortization expense | | $ | 9,516 |
| | $ | 1,080 |
| | $ | 19,085 |
| | $ | 2,052 |
|
COLONY CREDIT REAL ESTATE, INC.
NOTES TO CONSOLIDATED FINANCIAL STATEMENTS (Continued)
(Unaudited)
| |
| (1) | Upon adopting the standard of ASU No. 2016-02, Leases on January 1, 2019 the below-market ground lease obligations are included in right-of-use lease assets. |
The following table presents the amortization of deferred leasing costs, intangible assets and intangible liabilities for each of the next five years and thereafter as of June 30, 20182019 (dollars in thousands):
|
| | | | | | | | | | | | | | | | | | | | | | | | | | | | |
| | | | | | | | | | | | | | | |
| | | Remainder of 2019 | | 2020 | | 2021 | | 2022 | | 2023 | | 2024 and thereafter | | Total |
| Above-market lease values | | $ | 2,329 |
| | $ | 4,136 |
| | $ | 2,813 |
| | $ | 1,971 |
| | $ | 971 |
| | $ | 1,179 |
| | $ | 13,399 |
|
| Below-market lease values | | (5,215 | ) | | (9,452 | ) | | (8,409 | ) | | (6,884 | ) | | (1,001 | ) | | (406 | ) | | (31,367 | ) |
| Net increase (decrease) to property operating income | | $ | (2,886 | ) | | $ | (5,316 | ) | | $ | (5,596 | ) | | $ | (4,913 | ) | | $ | (30 | ) | | $ | 773 |
| | $ | (17,968 | ) |
| | | | | | | | | | | | | | | |
| In-place lease values | | $ | 11,202 |
| | $ | 18,086 |
| | $ | 13,979 |
| | $ | 9,356 |
| | $ | 6,343 |
| | $ | 35,320 |
| | $ | 94,286 |
|
| Deferred leasing costs | | 5,104 |
| | 7,529 |
| | 6,158 |
| | 4,630 |
| | 3,018 |
| | 8,863 |
| | 35,302 |
|
| Other intangibles | | 236 |
| | 298 |
| | — |
| | — |
| | — |
| | — |
| | 534 |
|
| Amortization expense | | $ | 16,542 |
| | $ | 25,913 |
| | $ | 20,137 |
| | $ | 13,986 |
| | $ | 9,361 |
| | $ | 44,183 |
| | $ | 130,122 |
|
|
| | | | | | | | | | | | | | | | | | | | | | | | | | | | |
| | | | | | | | | | | | | | | |
| | | Remainder of 2018 | | 2019 | | 2020 | | 2021 | | 2022 | | 2023 and thereafter | | Total |
| Above-market lease values | | $ | 2,251 |
| | $ | 4,317 |
| | $ | 3,252 |
| | $ | 2,340 |
| | $ | 1,841 |
| | $ | 2,941 |
| | $ | 16,942 |
|
| Below-market lease values | | (2,310 | ) | | (4,566 | ) | | (2,527 | ) | | (1,895 | ) | | (1,732 | ) | | (4,759 | ) | | (17,789 | ) |
| Decrease to rental income | | $ | (59 | ) | | $ | (249 | ) | | $ | 725 |
| | $ | 445 |
| | $ | 109 |
| | $ | (1,818 | ) | | $ | (847 | ) |
| | | | | | | | | | | | | | | |
| Below-market ground lease obligations | | $ | 4 |
| | $ | 8 |
| | $ | 8 |
| | $ | 8 |
| | $ | 8 |
| | $ | 4 |
| | $ | 40 |
|
| Increase to property operating expense | | $ | 4 |
| | $ | 8 |
| | $ | 8 |
| | $ | 8 |
| | $ | 8 |
| | $ | 4 |
| | $ | 40 |
|
| | | | | | | | | | | | | | | |
| In-place lease values | | $ | 10,510 |
| | $ | 16,048 |
| | $ | 10,564 |
| | $ | 7,256 |
| | $ | 5,485 |
| | $ | 7,323 |
| | $ | 57,186 |
|
| Deferred leasing costs | | 4,180 |
| | 6,304 |
| | 5,013 |
| | 3,816 |
| | 2,895 |
| | 6,050 |
| | 28,258 |
|
| Amortization expense | | $ | 14,690 |
| | $ | 22,352 |
| | $ | 15,577 |
| | $ | 11,072 |
| | $ | 8,380 |
| | $ | 13,373 |
| | $ | 85,444 |
|
| |
| 9. | Restricted Cash, Other Assets and Accrued and Other Liabilities |
The following table presents a summary of restricted cash as of June 30, 2019 and December 31, 2018 (dollars in thousands):
|
| | | | | | | | |
| | | June 30, 2019 | | December 31, 2018 |
| Restricted cash: | | | | |
| Borrower escrow deposits | | $ | 62,061 |
| | $ | 65,995 |
|
| Margin pledged as collateral | | 18,256 |
| | 7,567 |
|
| Capital expenditure reserves | | 17,938 |
| | 17,440 |
|
| Real estate escrow reserves | | 9,563 |
| | 7,304 |
|
| Working capital and other reserves | | 5,184 |
| | 2,905 |
|
| Tenant lockboxes | | 1,125 |
| | 5,642 |
|
| Restricted cash of consolidated Securitization 2016-1 | | — |
| | 3,293 |
|
| Total | | $ | 114,127 |
| | $ | 110,146 |
|
COLONY CREDIT REAL ESTATE, INC.
NOTES TO CONSOLIDATED FINANCIAL STATEMENTS (Continued)
(Unaudited)
The following table presents a summary of other assets as of June 30, 20182019 and December 31, 20172018 (dollars in thousands):
|
| | | | | | | | |
| | | June 30, 2019 | | December 31, 2018 |
| Other assets: | | | | |
Right-of-use lease asset(1) | | $ | 25,300 |
| | $ | — |
|
| Derivative asset | | 21,189 |
| | 14,139 |
|
| Prepaid taxes and deferred tax assets | | 20,650 |
| | 32,878 |
|
| Deferred financing costs, net - credit facilities | | 11,022 |
| | 9,415 |
|
| Prepaid expenses | | 6,032 |
| | 5,574 |
|
| Other assets | | 2,237 |
| | — |
|
| Investment deposits and pending deal costs | | 779 |
| | — |
|
| Total | | $ | 87,209 |
| | $ | 62,006 |
|
|
| | | | | | | | |
| | | June 30, 2018 (Unaudited) | | December 31, 2017 |
| Other assets: | | | | |
| Prepaid taxes and deferred tax assets | | $ | 67,071 |
| | $ | 1,050 |
|
| Deposit on investments | | 15,700 |
| | — |
|
| Deferred financing costs, net - credit facilities | | 6,699 |
| | — |
|
| Prepaid expenses | | 5,707 |
| | 360 |
|
| Derivative asset | | 38 |
| | 117 |
|
| Total | | $ | 95,215 |
| | $ | 1,527 |
|
| |
| (1) | Upon adopting the standard of ASU No. 2016-02, Leases on January 1, 2019, the Company, as lessee of various ground leases, recognized right-of-use lease assets and corresponding liabilities for future obligations under lease arrangements on balance sheet. |
The following table presents a summary of accrued and other liabilities as of June 30, 20182019 and December 31, 20172018 (dollars in thousands):
|
| | | | | | | | |
| | | June 30, 2019 | | December 31, 2018 |
| Accrued and other liabilities: | | | | |
| Current and deferred tax liability | | $ | 31,880 |
| | $ | 36,730 |
|
| Accounts payable, accrued expenses and other liabilities | | 27,927 |
| | 29,151 |
|
Right-of-use lease liability(1) | | 25,263 |
| | — |
|
| Interest payable | | 17,787 |
| | 21,576 |
|
| Derivative liability | | 16,281 |
| | 6,042 |
|
| Prepaid rent and unearned revenue | | 11,491 |
| | 10,481 |
|
| Tenant security deposits | | 2,922 |
| | 2,207 |
|
| Total | | $ | 133,551 |
| | $ | 106,187 |
|
| |
| (1) | Upon adopting the standard of ASU No. 2016-02, Leases on January 1, 2019, the Company, as lessee of various ground leases, recognized right-of-use lease assets and corresponding liabilities for future obligations under lease arrangements on balance sheet. |
COLONY CREDIT REAL ESTATE, INC.
NOTES TO CONSOLIDATED FINANCIAL STATEMENTS (Continued)
(Unaudited)
|
| | | | | | | | |
| | | June 30, 2018 (Unaudited) | | December 31, 2017 |
| Accrued and other liabilities: | | | | |
| Accounts payable, accrued expenses and other liabilities | | $ | 18,067 |
| | $ | 3,532 |
|
| Interest payable | | 17,117 |
| | 924 |
|
| Prepaid rent and unearned revenue | | 6,453 |
| | 481 |
|
| Tenant security deposits | | 3,142 |
| | 118 |
|
| Current and deferred tax liability | | 1,109 |
| | 120 |
|
| Derivative liability | | 926 |
| | — |
|
| Total | | $ | 46,814 |
| | $ | 5,175 |
|
The following table presents debt as of June 30, 20182019 and December 31, 20172018 (dollars in thousands):
| | | | | | June 30, 2018 (Unaudited) | | December 31, 2017 | | | June 30, 2019 | | December 31, 2018 |
| | Capacity ($) | | Recourse vs.
Non-Recourse(1) | | Final
Maturity | | Contractual
Interest Rate | | Principal
Amount(2) | | Carrying
Value(2) | | Principal
Amount(2) | | Carrying
Value(2) | Capacity ($) | | Recourse vs.
Non-Recourse(1) | | Final
Maturity | | Contractual
Interest Rate | | Principal
Amount(2) | | Carrying
Value(2) | | Principal
Amount(2) | | Carrying
Value(2) |
| Securitization bonds payable, net | | | | | | | | | | | | | | | | | | |
2014 FL1(3) |
|
| | Non-recourse | | Apr-31 | | LIBOR + 3.24% | | $ | 27,119 |
| | $ | 27,119 |
| | $ | 27,119 |
| | $ | 27,004 |
|
|
| | Non-recourse | | Apr-31 | | LIBOR + 3.33% | | $ | 23,377 |
| | $ | 23,377 |
| | $ | 25,549 |
| | $ | 25,549 |
|
2014 FL2(3) | |
|
| | Non-recourse | | NA | | NA | | — |
| | — |
| | 18,320 |
| | 18,320 |
|
Securitization 2016-1(3) | |
|
| | Non-recourse | | NA | | NA | | — |
| | — |
| | 37,503 |
| | 37,503 |
|
| Subtotal securitization bonds payable, net | | | | 23,377 |
| | 23,377 |
| | 81,372 |
| | 81,372 |
|
| | | | | | | | | | | |
| Mortgage and other notes payable, net | | | | | | | | | | |
| Net lease 1 | | | | Non-recourse | | Oct-27 | | 4.45% | | 24,360 |
| | 24,360 |
| | 24,606 |
| | 24,606 |
|
| Net lease 2 | | | | Non-recourse | | Nov-26 | | 4.45% | | 3,453 |
| | 3,354 |
| | 3,484 |
| | 3,378 |
|
| Net lease 3 | | | | Non-recourse | | Nov-26 | | 4.45% | | 7,451 |
| | 7,237 |
| | 7,519 |
| | 7,290 |
|
| Net lease 4 | | | | Non-recourse | | Jun-21 | | 4.00% | | 12,618 |
| | 12,508 |
| | 12,786 |
| | 12,648 |
|
| Net lease 5 | | | | Non-recourse | | Jul-23 | | LIBOR + 2.15% | | 1,872 |
| | 1,823 |
| | 2,078 |
| | 2,024 |
|
| Net lease 6 | | | | Non-recourse | | Aug-26 | | 4.08% | | 32,097 |
| | 31,794 |
| | 32,378 |
| | 32,054 |
|
Net lease 7(4) | | | | Non-recourse | | Nov-26 | | 4.45% | | 18,747 |
| | 18,208 |
| | 18,917 |
| | 18,342 |
|
| Net lease 8 | | | | Non-recourse | | Mar-28 | | 4.38% | | 12,328 |
| | 11,839 |
| | 12,434 |
| | 11,920 |
|
| Net lease 9 | | | | Non-recourse | | Apr-21(5) | | LIBOR + 2.50% | | 74,744 |
| | 74,567 |
| | 73,702 |
| | 73,696 |
|
| Net lease 10 | | | | Non-recourse | | Jul-25 | | 4.31% | | 250,000 |
| | 246,740 |
| | 250,000 |
| | 246,522 |
|
Net lease 11(6) | | | | Non-recourse | | Jun-25 | | 3.91% | | 187,584 |
| | 190,244 |
| | 184,320 |
| | 186,934 |
|
| Net lease 12 | | | | Non-recourse | | Sep-33 | | 4.77% | | 200,000 |
| | 198,481 |
| | 200,000 |
| | 198,449 |
|
| Multifamily 1 | | | | Non-recourse | | Dec-23 | | 4.84% | | 43,235 |
| | 43,768 |
| | 43,500 |
| | 44,008 |
|
| Multifamily 2 | | | | Non-recourse | | Dec-23 | | 4.94% | | 42,743 |
| | 43,201 |
| | 43,000 |
| | 43,501 |
|
| Multifamily 3 | | | | Non-recourse | | Jan-24 | | 5.15% | | 15,925 |
| | 16,439 |
| | 16,000 |
| | 16,561 |
|
Multifamily 4(7) | | | | Non-recourse | | Dec-20 | | 5.27% | | 11,863 |
| | 12,070 |
| | 11,964 |
| | 12,228 |
|
| Multifamily 5 | | | | Non-recourse | | Nov-26 | | 3.98% | | 24,104 |
| | 23,343 |
| | 24,289 |
| | 23,485 |
|
| Office 1 | | | | Non-recourse | | Oct-24 | | 4.47% | | 108,850 |
| | 109,701 |
| | 108,850 |
| | 109,779 |
|
| Office 2 | | | | Non-recourse | | Jan-25 | | 4.30% | | 75,901 |
| | 75,130 |
| | 76,448 |
| | 75,620 |
|
| Office 3 | | | | Non-recourse | | Apr-23 | | LIBOR + 4.00% | | 31,126 |
| | 30,193 |
| | 31,126 |
| | 29,974 |
|
Hotel 1(8) | | | | Non-recourse | | Apr-24 | | LIBOR + 2.95% | | 21,500 |
| | 20,215 |
| | — |
| | — |
|
Other notes payable(9) | | | | Non-recourse | | Jun-24 | | LIBOR + 3.00% | | 62,700 |
| | 62,700 |
| | — |
| | — |
|
| Subtotal mortgage and other notes payable, net | | | | 1,263,201 |
| | 1,257,915 |
| | 1,177,401 |
| | 1,173,019 |
|
| | | | | | | | | | | |
| Bank credit facility | | | | | | | | | | |
| Bank credit facility | | $ | 560,000 |
| | Recourse | | Feb-23 (10) | | LIBOR + 2.25% | | 221,500 |
| | 221,500 |
| | 295,000 |
| | 295,000 |
|
| Subtotal bank credit facility | | | | 221,500 |
|
| 221,500 |
| | 295,000 |
| | 295,000 |
|
| | | | | | | | | | | |
| Master repurchase facilities | | | | | | | | | | |
| Bank 1 facility 3 | | $ | 400,000 |
| | Limited Recourse(11) | | Apr-23(12) | | LIBOR + 1.90% | (13) | 197,265 |
| | 197,265 |
| | 143,400 |
| | 143,400 |
|
| Bank 2 facility 3 | | 200,000 |
| | Limited Recourse(11) | | Oct-22(14) | | LIBOR + 2.50% | (13) | 22,750 |
| | 22,750 |
| | 22,750 |
| | 22,750 |
|
| Bank 3 facility 3 | | 600,000 |
| | Limited Recourse(11) | | Apr-21 | | LIBOR + 2.24% | (13) | 505,212 |
| | 505,212 |
| | 352,108 |
| | 352,108 |
|
| Bank 7 facility 1 | | 500,000 |
| | Limited Recourse(11) | | Apr-22(15) | | LIBOR + 1.91% | (13) | 424,025 |
| | 424,025 |
| | 308,434 |
| | 308,434 |
|
| Bank 8 facility 1 | | 250,000 |
| | Limited Recourse(11) | | Jun-21(16) | | LIBOR + 2.00% | (13) | 164,977 |
| | 164,977 |
| | 53,596 |
| | 53,596 |
|
COLONY CREDIT REAL ESTATE, INC.
NOTES TO CONSOLIDATED FINANCIAL STATEMENTS (Continued)
(Unaudited)
|
| | | | | | | | | | | | | | | | | | | | | | | | | |
| | | | | | | | | | June 30, 2018 (Unaudited) | | December 31, 2017 |
| | Capacity ($) | | Recourse vs.
Non-Recourse(1) | | Final
Maturity | | Contractual
Interest Rate | | Principal
Amount(2) | | Carrying
Value(2) | | Principal
Amount(2) | | Carrying
Value(2) |
2014 FL2(3) |
|
| | Non-recourse | | Nov-31 | | LIBOR + 4.25% | | 18,320 |
| | 18,312 |
| | 55,430 |
| | 55,430 |
|
2015 FL3(3) |
|
| | Non-recourse | | NA | | NA | | — |
| | — |
| | 26,245 |
| | 26,245 |
|
| Securitization 2016-1 |
|
| | Non-recourse | | Sep-31 | | LIBOR + 2.74% | | 80,825 |
| | 80,825 |
| | — |
| | — |
|
| Subtotal securitization bonds payable, net | | | | | | | | | 126,264 |
| | 126,256 |
| | 108,794 |
| | 108,679 |
|
| | | | | | | | | | | | | | | | |
| Mortgage and other notes payable, net | | | | | | | | | | | | | | | |
| Net lease 1 | | | Non-recourse | | Oct-27 | | 4.45% | | 24,836 |
| | 24,836 |
| | 25,074 |
| | 25,022 |
|
| Net lease 2 | | | Non-recourse | | Nov-26 | | 4.45% | | 3,514 |
| | 3,401 |
| | 3,544 |
| | 3,425 |
|
| Net lease 3 | | | Non-recourse | | Nov-26 | | 4.45% | | 7,582 |
| | 7,340 |
| | 7,647 |
| | 7,390 |
|
| Net lease 4 | | | Non-recourse | | Jun-21 | | 4.00% | | 12,947 |
| | 12,781 |
| | 13,133 |
| | 12,939 |
|
| Net lease 5 | | | Non-recourse | | Jul-23 | | LIBOR + 2.15% | | 2,284 |
| | 2,224 |
| | 2,482 |
| | 2,416 |
|
| Net lease 6 | | | Non-recourse | | Aug-26 | | 4.08% | | 32,600 |
| | 32,255 |
| | 32,600 |
| | 32,234 |
|
Net lease 7(4) | | | Non-recourse | | Nov-26 | | 4.45% | | 19,078 |
| | 18,467 |
| | 19,241 |
| | 18,593 |
|
| Net lease 8 | | | Non-recourse | | Mar-28 | | 4.38% | | 12,536 |
| | 11,980 |
| | — |
| | — |
|
| Net lease 9 | | | Non-recourse | | Apr-21(5) | | LIBOR + 2.50% | | 72,682 |
| | 72,715 |
| | — |
| | — |
|
| Net lease 10 | | | Non-recourse | | Jul-25 | | 4.31% | | 250,000 |
| | 246,256 |
| | — |
| | — |
|
| Multifamily 1 | | | Non-recourse | | Dec-23 | | 4.84% | | 43,500 |
| | 44,060 |
| | — |
| | — |
|
| Multifamily 2 | | | Non-recourse | | Dec-23 | | 4.94% | | 43,000 |
| | 43,552 |
| | — |
| | — |
|
| Multifamily 3 | | | Non-recourse | | Jan-24 | | 5.15% | | 16,000 |
| | 16,618 |
| | — |
| | — |
|
Multifamily 4(6) | | | Non-recourse | | Dec-20 | | 5.27% | | 12,098 |
| | 12,430 |
| | — |
| | — |
|
| Multifamily 5 | | | Non-recourse | | Nov-26 | | 3.98% | | 24,536 |
| | 23,681 |
| | — |
| | — |
|
| Office 1 | | | Non-recourse | | Oct-24 | | 4.47% | | 108,850 |
| | 109,874 |
| | — |
| | — |
|
| Office 2 | | | Non-recourse | | Jan-25 | | 4.30% | | 77,076 |
| | 76,179 |
| | — |
| | — |
|
| Office 3 | | | Non-recourse | | Apr-23 | | LIBOR + 4.00% | | 29,947 |
| | 28,524 |
| | — |
| | — |
|
| Multi-tenant office | | | Non-recourse | | Aug-20(7) | | LIBOR + 1.90% | | 97,164 |
| | 97,556 |
| | — |
| | — |
|
Hotel development loan(8) | | | Non-recourse | | NA | | NA | | — |
| | — |
| | 130,000 |
| | 128,649 |
|
Hotel A-Note(9) | | | Non-recourse | | NA | | NA | | — |
| | — |
| | 50,314 |
| | 50,314 |
|
| Other notes payable | | | Limited recourse(10) | | Dec-20(11) | | LIBOR + 2.65% | | — |
| | — |
| | — |
| | — |
|
| Subtotal mortgage and other notes payable, net | | | | | | | | | 890,230 |
| | 884,729 |
| | 284,035 |
| | 280,982 |
|
| | | | | | | | | | | | | | | | |
| Bank credit facility | | | | | | | | | | | | | | | |
| Bank credit facility | $ | 400,000 |
| | Recourse | | Feb-23 (12) | | LIBOR + 2.25% | | 25,000 |
| | 25,000 |
| | — |
| | — |
|
| Subtotal bank credit facility | | | | | | | | | 25,000 |
|
| 25,000 |
| | — |
| | — |
|
| | | | | | | | | | | | | | | | |
| Master repurchase facilities | | | | | | | | | | | | | | | |
| Bank 1 facility 3 | $ | 300,000 |
| | Limited Recourse(10) | | Apr-23(13) | | LIBOR + 2.42% | (14) | 42,840 |
| | 42,840 |
| | — |
| | — |
|
| Bank 2 facility 1 | 200,000 |
| | Limited Recourse(15) | | Jul-19(16) | | (17) | (14) | — |
| | — |
| | — |
| | — |
|
| Bank 2 facility 2 | 200,000 |
| | Limited Recourse(15) | | Jul-19(18) | | LIBOR + 2.41% | (14) | 26,742 |
| | 26,742 |
| | — |
| | — |
|
| Bank 3 facility 3 | 500,000 |
| | Limited Recourse(10) | | Apr-21 | | LIBOR + 2.36% | (14) | 465,811 |
| | 465,811 |
| | — |
| | — |
|
| Bank 7 facility 1 | 500,000 |
| | Limited Recourse(10) | | Apr-22(19) | | LIBOR + 2.00% | (14) | 79,113 |
| | 79,113 |
| | — |
| | — |
|
| Bank 8 facility 1 | 250,000 |
| | Limited Recourse(10) | | Jun-21(20) | | LIBOR + 2.00% | (14) | 33,672 |
| | 33,672 |
| | — |
| | — |
|
| Subtotal master repurchase facilities | $ | 1,950,000 |
| | | | | | | | 648,178 |
| | 648,178 |
| | — |
| | — |
|
| | | | | | | | | | | | | | | | |
| CMBS credit facilities | | | | | | | | | | | | | | | |
| Bank 1 facility 1 | | | Recourse | | (21) | | LIBOR + 1.42% | (14) | 18,451 |
|
| 18,451 |
| | — |
| | — |
|
COLONY CREDIT REAL ESTATE, INC.
NOTES TO CONSOLIDATED FINANCIAL STATEMENTS (Continued)
(Unaudited)
| | | | | | June 30, 2018 (Unaudited) | | December 31, 2017 | | | June 30, 2019 | | December 31, 2018 |
| | Capacity ($) | | Recourse vs.
Non-Recourse(1) | | Final
Maturity | | Contractual
Interest Rate | | Principal
Amount(2) | | Carrying
Value(2) | | Principal
Amount(2) | | Carrying
Value(2) | Capacity ($) | | Recourse vs.
Non-Recourse(1) | | Final
Maturity | | Contractual
Interest Rate | | Principal
Amount(2) | | Carrying
Value(2) | | Principal
Amount(2) | | Carrying
Value(2) |
| Bank 9 facility 1 | | 300,000 |
| | (17) | | Nov-23(18) | | LIBOR + 1.65% | (13) | 66,643 |
| | 66,643 |
| | — |
| | — |
|
| Subtotal master repurchase facilities | | $ | 2,250,000 |
| | 1,380,872 |
| | 1,380,872 |
| | 880,288 |
| | 880,288 |
|
| | | | | | | | | | | |
| CMBS credit facilities | | | | | | | | | | |
| Bank 1 facility 1 | | | | Recourse | | (19) | | LIBOR + 1.16% | (13) | 19,799 |
| | 19,799 |
| | 18,542 |
| | 18,542 |
|
| Bank 1 facility 2 | | | Recourse | | (21) | | LIBOR + 1.22% | (14) | 10,569 |
|
| 10,569 |
| | — |
| | — |
| | | Recourse | | (19) | | LIBOR + 1.16% | (13) | 18,364 |
| | 18,364 |
| | 17,237 |
| | 17,237 |
|
| Bank 3 facility |
|
| | Recourse | | (21) | | NA | | — |
|
| — |
| | — |
| | — |
|
|
| | Recourse | | (19) | | NA | | — |
| | — |
| | — |
| | — |
|
| Bank 4 facility | | | Recourse | | (21) | | NA | | — |
|
| — |
| | — |
| | — |
| | | Recourse | | (19) | | NA | | — |
| | — |
| | — |
| | — |
|
| Bank 5 facility 1 | | | Recourse | | (21) | | NA | | — |
| | — |
| | — |
| | — |
| | | Recourse | | (19) | | NA | | — |
| | — |
| | — |
| | — |
|
| Bank 5 facility 2 | | | Recourse | | (21) | | NA | | — |
| | — |
| | — |
| | — |
| | | Recourse | | (19) | | NA | | — |
| | — |
| | — |
| | — |
|
| Bank 6 facility 1 | | | Recourse | | (21) | | LIBOR + 1.15% | (14) | 37,466 |
| | 37,466 |
| | — |
| | — |
| | | Recourse | | (19) | | LIBOR + 1.28% | (13) | 87,991 |
| | 87,991 |
| | 80,838 |
| | 80,838 |
|
| Bank 6 facility 2 | | | Recourse | | (21) | | LIBOR + 1.08% | (14) | 60,881 |
| | 60,881 |
| | — |
| | — |
| | | Recourse | | (19) | | LIBOR + 1.10% | (13) | 80,264 |
| | 80,264 |
| | 74,013 |
| | 74,013 |
|
| Subtotal CMBS credit facilities | | | 127,367 |
| | 127,367 |
| | — |
| | — |
| | | 206,418 |
| | 206,418 |
| | 190,630 |
| | 190,630 |
|
| Subtotal credit facilities | | | 800,545 |
| | 800,545 |
| | — |
| | — |
| | | 1,808,790 |
| | 1,808,790 |
| | 1,365,918 |
| | 1,365,918 |
|
| | | | | | | | | | | | | | | | | | | |
| Total |
|
| | $ | 1,817,039 |
| | $ | 1,811,530 |
| | $ | 392,829 |
| | $ | 389,661 |
|
|
| | $ | 3,095,368 |
| | $ | 3,090,082 |
| | $ | 2,624,691 |
| | $ | 2,620,309 |
|
| |
| (1) | Subject to customary non-recourse carveouts. |
| |
| (2) | Difference between principal amount and carrying value of securitization bonds payable, net and mortgage and other notes payable, net is attributable to deferred financing costs, net and premium/discount on mortgage notes payable. |
| |
| (3) | The Company, through indirect Cayman subsidiaries, securitized commercial mortgage loans originated by the Company. Senior notes issued by the securitization trusts were generally sold to third parties and subordinated notes retained by the Company. These securitizations are accounted for as secured financing with the underlying mortgage loans pledged as collateral. Principal payments from underlying collateral loans must be applied to repay the notes until fully paid off, irrespective of the contractual maturities on the notes. Underlying collateral loans have initial terms of two to three years. |
| |
| (4) | Payment terms are periodic payment of principal and interest for debt on two properties and periodic payment of interest only with principal at maturity (except for principal repayments to release collateral properties disposed) for debt on one property. |
| |
| (5) | The current maturity of the mortgage payable is April 2020, with a one-year extension available at the Company’s option, which may be subject to the satisfaction of certain customary conditions set forth in the governing documents. |
| |
| (6) | As of June 30, 2019, the outstanding principal of the mortgage payable was NOK 1.6 billion, which translated to $187.6 million. |
| |
| (7) | Represents two separate senior mortgage notes with a weighted average maturity of December 2020 and weighted average interest rate of 5.27%. |
| |
| (8) | The current maturity of the mortgage payable is April 2022, with two one-year extensions available at the Company’s option, which may be subject to the satisfaction of certain customary conditions set forth in the governing documents. |
| |
(6) | Represents two separate senior mortgage notes with a weighted average maturity of December 1, 2020 and weighted average interest rate of 5.27%. |
| |
(7)(9) | The initial maturity of the mortgage payable is August 2018, with a two-year extension available at the Company’s option, which may be subject to the satisfaction of certain customary conditions set forth in the governing documents. |
| |
(8) | A development loan originated by the Company was restructured into a senior and junior note, with the senior note assumed by a third party lender. The Company accounted for the transfer of the senior note as a financing transaction. The senior note bears interest at one-month London Interbank Offered Rate (“LIBOR”) plus 3.5%, with a 4.0% floor, and is subject to two one-year extension options on its initial term, exercisable by the borrower. The investment entity that held the debt was deconsolidated upon closing of the Combination (refer to Note 2, “Summary of Significant Accounting Policies”). |
| |
(9) | Represents the Company’s senior participation interest in a first mortgage loan that was transferred at cost into a securitization trust with the transfer accounted for as a secured financing transaction. The Company did not retain any legal interest in the senior participation and retained the junior participation on an unleveraged basis. |
| |
(10) | Recourse solely with respect to 25.0% of the financed amount. |
| |
(11) | The initialcurrent maturity of the note payable is December 2018,June 2021, with twothree one-year extensions available at the Company’s option, which may be subject to the satisfaction of certain customary conditions set forth in the governing documents. |
| |
(12)(10) | The ability to borrow additional amounts terminates on February 1, 2022 at which time the Company may, at its election, extend the termination date for two additional six-month terms. |
| |
(13)(11) | Recourse solely with respect to 25.0% of the financed amount. |
| |
| (12) | The next maturity date is April 2021, with two one-year extensions available at the option of the Company, which may be exercised upon the satisfaction of certain customary conditions set forth in the governing documents. |
| |
(14)(13) | Represents the weighted average spread as of June 30, 2018.2019. The contractual interest rate depends upon asset type and characteristics and ranges from one-month to six-month LIBORLondon Interbank Offered Rates (“LIBOR”) plus 1.08%1.10% to 2.75%. |
| |
(15) | Recourse solely with respect to the greater of: (i) 25.0% of the financed amount of stabilized loans plus the financed amount of transitional loans, as further defined in the governing documents; or (ii) the lesser of $25.0 million or the aggregate financed amount of all loans. |
| |
(16)(14) | The next maturity date is July 2018,October 2019, with athree one-year extension options available, which may be subject to the satisfaction of certain customary conditions set forth in the governing documents. Subsequent to June 30, 2018, the Company elected not to execute the extension option. |
| |
(17) | The interest rate will be determined by the lender in its sole discretion. |
| |
(18) | Subsequent to June 30, 2018, the Company exercised the remaining one-year extension to July 2019. |
| |
(19)(15) | The next maturity date is April 2021, with a one-year extension available, which may be subject to the satisfaction of certain customary conditions set forth in the governing documents. |
| |
(20)(16) | The next maturity date is June 2020, with a one-year extension available, which may be subject to the satisfaction of certain customary conditions set forth in the governing documents. |
| |
(21)(17) | Recourse is either 25.0% or 50.0% depending on loan metrics. |
| |
| (18) | The next maturity date is November 2021, with twoone-year extension options available, which may be subject to the satisfaction of certain customary conditions set forth in the governing documents. |
| |
| (19) | The maturity dates on the CMBS Credit Facilities are dependent upon asset type and will typically range from one to sixtwo months. |
COLONY CREDIT REAL ESTATE, INC.
NOTES TO CONSOLIDATED FINANCIAL STATEMENTS (Continued)
(Unaudited)
Future Minimum Principal Payments
The following table summarizes future scheduled minimum principal payments at June 30, 20182019 based on final contractualinitial maturity dates or extended maturity dates to the extent criteria are met and the extension option is at the borrower’s discretion (dollars in thousands):
|
| | | | | | | | | | | | | | | |
| | Total | | Securitization Bonds Payable, Net | | Mortgage Notes Payable, Net | | Credit
Facilities |
| Remainder of 2019 | $ | 207,692 |
| | $ | — |
| | $ | 1,274 |
| | $ | 206,418 |
|
| 2020 | 14,506 |
| | — |
| | 14,506 |
| | — |
|
| 2021 | 759,452 |
| | — |
| | 89,264 |
| | 670,188 |
|
| 2022 | 449,295 |
| | — |
| | 2,520 |
| | 446,775 |
|
| 2023 | 604,931 |
| | — |
| | 119,522 |
| | 485,409 |
|
| 2024 and thereafter | 1,059,492 |
| | 23,377 |
| | 1,036,115 |
| | — |
|
| Total | $ | 3,095,368 |
| | $ | 23,377 |
| | $ | 1,263,201 |
| | $ | 1,808,790 |
|
|
| | | | | | | | | | | | | | | |
| | Total | | Securitization Bonds Payable, Net | | Mortgage Notes Payable, Net | | Credit
Facilities |
| Remainder of 2018 | $ | 128,472 |
| | $ | — |
| | $ | 1,105 |
| | $ | 127,367 |
|
| 2019 | 29,286 |
| | — |
| | 2,544 |
| | 26,742 |
|
| 2020 | 111,904 |
| | — |
| | 111,904 |
| | — |
|
| 2021 | 586,687 |
| | — |
| | 87,204 |
| | 499,483 |
|
| 2022 | 81,632 |
| | — |
| | 2,519 |
| | 79,113 |
|
| 2023 and thereafter | 879,058 |
| | 126,264 |
| | 684,954 |
| | 67,840 |
|
| Total | $ | 1,817,039 |
| | $ | 126,264 |
| | $ | 890,230 |
| | $ | 800,545 |
|
Bank Credit Facility
On February 1, 2018, the Company, through subsidiaries, including the OP, entered into a credit agreement with several lenders to provide a revolving credit facility in the aggregate principal amount of up to $400.0 million (the “Bank Credit Facility”). The abilityOn February 4, 2019, the aggregate amount of revolving commitments was increased to borrow additional amounts under the$560.0 million. The Bank Credit Facility terminateswill mature on February 1, 2022, at which timeunless the Company may, at its election,OP elects to extend the terminationmaturity date for up to two additional six-month terms.
The maximum amount available for borrowing at any time under the Bank Credit Facility is limited to a borrowing base valuation of certain investment assets, with the valuation of such investment assets generally determined according to a percentage of adjusted net book value. At June 30, 2018,2019, the borrowing base valuation was sufficient to permit borrowings up tosupport the entire $400.0 million commitment.outstanding principal amount of $221.5 million.
Advances under the Bank Credit Facility accrue interest at a per annum rate equal to, at the Company’sapplicable borrower’s election, either a LIBOR rate plus a margin of 2.25%, or a base rate determined according to a prime rate or federal funds rate plus a margin of 1.25%. The Company pays a commitment fee of 0.25% or 0.35% per annum of the unused amount (0.35% at June 30, 2018)2019), depending upon the amount of facility utilization.
SomeSubstantially all material wholly owned subsidiaries of the Company’s subsidiaries guarantyCompany guarantee the obligations of the Company and any other borrowers under the Bank Credit Facility. As security for the advances under the Bank Credit Facility, the Company pledged substantially all equity interests it owns as well asand granted a security interest in deposit accounts of the Company in which the proceeds of investment asset distributions are maintained.
The Bank Credit Facility contains various affirmative and negative covenants including financial covenants that require the Company to maintain minimum tangible net worth, liquidity levels and financial ratios, as definedspecified in the Bank Credit Facility. At June 30, 2018,2019, the Company was in compliance with all of the financial covenants.
Securitization Financing Transactions
Securitization bonds payable, net represent debt issued by securitization vehicles consolidated by the Company. Senior notes issued by these securitization trusts were generally sold to third parties and subordinated notes retained by the Company. Payments from underlying collateral loans must be applied to repay the notes until fully paid off, irrespective of the contractual maturities of the loans.
As of June 30, 2018,2019, the Company had $354.1$31.4 million carrying value of CRE debt investments financed with $126.3$23.4 million of securitization bonds payable, net.
Master Repurchase Facilities
As of June 30, 2018,2019, the Company, through subsidiaries, had entered into repurchase agreements with multiple global financial institutions to provide an aggregate principal amount of up to $2.0$2.3 billion to finance the origination of first mortgage loans and senior loan participations secured by CRE debt investments (“Master Repurchase Facilities”). The Company agreed to guarantee certain obligations under the Master Repurchase Facilities, which contain representations, warranties, covenants, conditions precedent to funding, events of default and indemnities that are customary for agreements of this type. The Master Repurchase
COLONY CREDIT REAL ESTATE, INC.
NOTES TO CONSOLIDATED FINANCIAL STATEMENTS (Continued)
(Unaudited)
Facilities act as revolving loan facilities that can be paid down as assets are repaid or sold and re-drawn upon for new investments. As of June 30, 2018,2019, the Company was in compliance with all of its financial covenants under the Master Repurchase Facilities.
As of June 30, 2018,2019, the Company had $877.3 million$1.9 billion carrying value of CRE debt investments financed with $648.2 million$1.4 billion under the term loanmaster repurchase facilities.
On April 20, 2018, the Company, through subsidiaries, consolidated two prior master purchase agreements by entering into a three-year Amended and Restated Master Repurchase and Securities Contract Agreement (“Bank 3 Facility 3”). The Repurchase Agreement provides up to $500.0 million to finance first mortgage loans, senior loan participations and other commercial mortgage loan debt instruments secured by commercial real estate.
On April 23, 2018, the Company, through subsidiaries, entered into a three-year Master Repurchase Agreement (“Bank 1 Facility 3”). The Repurchase Agreement provides up to $300.0 million to finance first mortgage loans, senior loan participations and other commercial mortgage loan debt instruments secured by commercial real estate.
On April 26, 2018, the Company entered into a three-year Master Repurchase Agreement with a major financial institution through a subsidiary (“Bank 7 Facility 1”). This agreement provides up to $500.0 million to finance the Company’s lending activities.
On June 19, 2018, the Company entered into a two-year Master Repurchase Agreement with a major financial institution through a subsidiary (“Bank 8 Facility 1”). This agreement provides up to $250.0 million to finance the Company’s lending activities.
CMBS Credit Facilities
As of June 30, 2018,2019, the Company has entered into eight master repurchase agreements (collectively the “CMBS Credit Facilities”) to finance CMBS investments. The CMBS Credit Facilities are on a recourse basis and contain representations, warranties, covenants, conditions precedent to funding, events of default and indemnities that are customary for agreements of this type. As of June 30, 2018,2019, the Company had $173.2$247.3 million carrying value of CRE securities financed with $127.4$177.7 million under its CMBS Credit Facilities. As of June 30, 2019, the Company had $51.2 million carrying value of underlying investments in the subordinate tranches of the securitization trusts financed with $28.7 million under its CMBS Credit Facilities.
| |
| 11. | Related Party Arrangements |
Management Agreement
On January 31, 2018, the Company and the OP entered into a management agreement (the “Management Agreement”) with the Manager, pursuant to which the Manager manages the Company’s assets and its day-to-day operations. The Manager will be responsible for, among other matters, (1) the selection, origination, acquisition, management and sale of the Company’s portfolio investments, (2) the Company’s financing activities and (3) providing the Company with investment advisory services. The Manager is also responsible for the Company’s day-to-day operations and will perform (or will cause to be performed) such services and activities relating to the Company’s investments and business and affairs as may be appropriate. The Management Agreement requires the Manager to manage the Company’s business affairs in conformity with the investment guidelines and other policies that are approved and monitored by the board of directors. Each of the Company’s executive officers is also an employee of the Manager or its affiliates. The Manager’s role as Manager will be under the supervision and direction of the Company’s board of directors.
The initial term of the Management Agreement expires on the third anniversary of the Closing Date and will be automatically renewed for a one-year term each anniversary date thereafter unless earlier terminated as described below. The Company’s independent directors review the Manager’s performance and the fees that may be payable to the Manager annually and, following the initial term, the Management Agreement may be terminated if there has been an affirmative vote of at least two-thirds of the Company’s independent directors determining that (1) there has been unsatisfactory performance by the Manager that is materially detrimental to the Company or (2) the compensation payable to the Manager, in the form of base management fees and incentive fees taken as a whole, or the amount thereof, is not fair to the Company, subject to the Manager’s right to prevent such termination due to unfair fees by accepting reduced compensation as agreed to by at least two-thirds of the Company’s independent directors. The Company must provide the Manager 180 days’ prior written notice of any such termination.
The Company may also terminate the Management Agreement for cause (as defined in the Management Agreement) at any time, including during the initial term, without the payment of any termination fee, with at least 30 days’ prior written notice from the Company’s board of directors. Unless terminated for cause, the Manager will be paid a termination fee as described below. The Manager may terminate the Management Agreement if the Company becomes required to register as an investment company under the Investment Company Act with such termination deemed to occur immediately before such event, in which case the Company would not be required to pay a termination fee. The Manager may decline to renew the Management Agreement by providing the
COLONY CREDIT REAL ESTATE, INC.
NOTES TO CONSOLIDATED FINANCIAL STATEMENTS (Continued)
(Unaudited)
Company with 180 days’ prior written notice, in which case the Company would not be required to pay a termination fee. The Manager may also terminate the Management Agreement with at least 60 days’ prior written notice if the Company breaches the Management Agreement in any material respect or otherwise is unable to perform its obligations thereunder and the breach continues for a period of 30 days after written notice to the Company, in which case the Manager will be paid a termination fee as described below.
Fees to Manager
Base Management Fee
The base management fee payable to the Manager is equal to 1.5% of the Company’s stockholders’ equity (as defined in the Management Agreement), per annum (0.375% per quarter), payable quarterly in arrears in cash. For purposes of calculating the base management fee, the Company’s stockholders’ equity means: (a) the sum of (1) the net proceeds received by the Company (or, without duplication, the Company’s direct subsidiaries, such as the OP) from all issuances of the Company’s or such subsidiaries’
COLONY CREDIT REAL ESTATE, INC.
NOTES TO CONSOLIDATED FINANCIAL STATEMENTS (Continued)
(Unaudited)
common and preferred equity securities since inception (allocated on a pro rata basis for such issuances during the calendar quarter of any such issuance), plus (2) the Company’s cumulative core earnings (as defined in the Management Agreement) from and after the Closing Date to the end of the most recently completed calendar quarter, less (b)(1) any distributions to the Company’s common stockholders (or owners of common equity of the Company’s direct subsidiaries, such as the OP, other than the Company or any of such subsidiaries), (2) any amount that the Company or any of the Company’s direct subsidiaries, such as the OP, have paid to (x) repurchase for cash the Company’s common stock or common equity securities of such subsidiaries or (y) repurchase or redeem for cash the Company’s preferred equity securities or preferred equity securities of such subsidiaries, in each case since the Closing Date and (3) any incentive fee (as described below) paid to the Manager since the Closing Date.
For the three and six months ended June 30, 2019, the total management fee expense incurred was $11.4 million and $22.7 million, respectively. For the three and six months ended June 30, 2018, the total management fee expense incurred was $11.8 million and $19.8 million, respectively. As of June 30, 2019 and December 31, 2018, $11.4 million and $11.5 million, respectively, of unpaid management fee were included in due to related party in the Company’s consolidated balance sheets.
Incentive Fee
The incentive fee payable to the Manager is equal to the difference between (i) the product of (a) 20% and (b) the difference between (1) core earnings (as defined in the Management Agreement) for the most recent 12-month period (or the Closing Date if it has been less than 12 months since the Closing Date), including the current quarter, and (2) the product of (A) common equity (as defined in the Management Agreement) in the most recent 12-month period (or the Closing Date if it has been less than 12 months since the Closing Date), and (B) 7% per annum and (ii) the sum of any incentive fee paid to the Manager with respect to the first three calendar quarters of the most recent 12-month period (or the Closing Date if it has been less than 12 months since the Closing Date), provided, however, that no incentive fee is payable with respect to any calendar quarter unless core earnings (as defined in the Management Agreement) is greater than zero for the most recently completed 12 calendar quarters (or the Closing Date if it has been less than 12 calendar quarters since the Closing Date).
The Company did not incur any incentive fees during the three and six months ended June 30, 2019 and 2018.
Reimbursements of Expenses
Reimbursement of expenses related to the Company incurred by the Manager, including legal, accounting, financial, due diligence and other services are paid on the Company’s behalf by the OP or its designee(s). The Company reimburses the Manager for the Company’s allocable share of the salaries and other compensation of the Company’s chief financial officer and certain of its affiliates’ non-investment personnel who spend all or a portion of their time managing the Company’s affairs, and the Company’s share of such costs are based upon the percentage of such time devoted by personnel of our Manager (or its affiliates) to the Company’s affairs. The Company may be required to pay the Company’s pro rata portion of rent, telephone, utilities, office furniture, equipment, machinery and other office, internal and overhead expenses of the Manager and its affiliates required for the Company’s operations.
For the three and six months ended June 30, 2019, the total reimbursements of expenses incurred by the Manager on behalf of the Company and reimbursable in accordance with the Management Agreement was $2.8 million and $5.6 million, respectively, and are included in administrative expense on the consolidated statements of operations. For the three and six months ended June 30, 2018, the total reimbursements of expenses incurred by the Manager on behalf of the Company and reimbursable in accordance with the Management Agreement was $2.4 million and $4.2 million, respectively. As of June 30, 2019 and December 31, 2018, there was $2.5 million and $3.5 million, respectively, of unpaid expenses included in due to related party in the Company’s consolidated balance sheets.
Other Payables to Manager
Other payables to the Manager includeincludes Combination related adjustments that consist of certain cash contributions from and distributions to Colony Capital or its subsidiaries on behalf of the CLNY Contributed Portfolio.
For the six months ended June 30, 2019, there were no other payables to the Manager. For the six months ended June 30, 2018, the other payables to Manager was $2.9 million and the net liabilities assumed in the Combination was $6.4 million. Both of these were paid as of December 31, 2018.
Manager Equity Plan
In March 2018,2019, the Company granted 978,946800,000 shares to its non-independent directors, officers andthe Manager and/or employees thereof under the 2018 Equity Incentive Plan (the “2018 Plan”). In March 2018, the Company granted 978,946 shares to its non-independent directors, officers and the
COLONY CREDIT REAL ESTATE, INC.
NOTES TO CONSOLIDATED FINANCIAL STATEMENTS (Continued)
(Unaudited)
Manager and/or employees thereof under the 2018 Plan. 1,410,792 shares remain granted and unvested as of June 30, 2019. See Note 12, “Equity-Based Compensation” for further discussion on the 2018 Plan including shares issued to independent directors of the Company. In connection with this grant,these grants, the Company recognized share-based compensation expense of $2.6 million and $4.3 million to its Manager within administrative expense in the consolidated statement of operations for the three and six months ended June 30, 2019, respectively. The Company recognized share based compensation expense of $1.8 million and $2.1 million to its Manager within administrative expense in the consolidated statement of operations for the three and six months ended June 30, 2018, respectively. See Note 12, “Equity-Based Compensation” for further discussion of the 2018 Plan.
COLONY CREDIT REAL ESTATE, INC.
NOTES TO CONSOLIDATED FINANCIAL STATEMENTS (Continued)
(Unaudited)
Summary of Fees and Reimbursements
The following table presents the fees and reimbursements incurred and payable to the Manager for the six months ended June 30, 2018 and the amount due to related party as of June 30, 2018 and December 31, 2017 (dollars in thousands):
|
| | | | | | | | | | | | | | | | | | | | | | |
| Type of Fee or Reimbursement | | Financial Statement Location | | Due to Related Party as of December 31, 2017 | | Six Months Ended
June 30, 2018 | | Due to Related Party as of June 30, 2018 (Unaudited) |
| Combination Related Consideration | | Incurred | | Paid | |
| Fees to Manager | | | | | | | | | | | | |
| Management | | Management fee expense | | $ | — |
| | $ | — |
| | $ | 19,791 |
| | $ | (7,914 | ) | | $ | 11,877 |
|
| Reimbursements to Manager | | | |
| | | |
| |
| | |
| Operating costs | | Administrative expense | | — |
| | — |
| | 4,209 |
| | (1,573 | ) | | 2,636 |
|
| Other | | | |
| | | |
| | | | |
| Other Payables to Manager | | Additional paid-in capital | | — |
| | 2,934 |
| | — |
| | (2,934 | ) | | — |
|
| Liabilities assumed in the Combination | | (1) | | — |
| | 6,375 |
| | — |
| | (6,375 | ) | | — |
|
| Total | | | | $ | — |
| | $ | 9,309 |
| | $ | 24,000 |
| | $ | (18,796 | ) | | $ | 14,513 |
|
| |
(1) | Represents due to related party balance assumed as a result of the Combination. Refer to Note 3, “Business Combinations,” for further detail. |
Expense Allocations
For the six months ended June 30, 2017, the Company’s consolidated financial statements present the operations of the CLNY Investment Entities as carved out from the financial statements of Colony Capital. Certain general and administrative costs borne by Colony Capital, including, but not limited to, compensation and benefits, and corporate overhead, have been allocated to the CLNY Investment Entities using reasonable allocation methodologies. Such costs do not necessarily reflect what the actual general and administrative costs would have been if the CLNY Investment Entities had been operating as a separate stand-alone public company. For the three and six months ended June 30, 2017, a total of $3.7 million and $6.7 million, respectively, of allocated expenses are included as a component of administrative expenses in the Company’s consolidated statements of operations.
Investment Activity
All investment acquisitions are approved in accordance with the Company’s investment and related party guidelines, which may include approval by either the audit committee or disinterested members of the Company’s board of directors. No investment by the Company will require approval under the related party transaction policy solely because such investment constitutes a co-investment made by and between the Company and any of its subsidiaries, on the one hand, and one or more investment vehicles formed, sponsored, or managed by an affiliate of the Manager on the other hand.
In November 2016, NorthStar II entered into a $284.2 million securitization financing transaction (“Securitization 2016-1”). Securitization 2016-1 was collateralized by a pool of 10 CRE debt investments with a committed aggregate principal balance of $254.7 million primarily originated by NorthStar II and three senior participations with a committed aggregate principal balance of $29.5 million originated by NorthStar I. An affiliate of the Manager was appointed special servicer of Securitization 2016-1. The transaction was approved by the NorthStar II’s board of directors, including all of its independent directors. Securitization 2016-1 was assumed by the Company in connection with the Combination.
In July 2017, NorthStar II entered into a joint venture with an affiliate of the Manager to make a $60.0 million investment in a $180.0 million mezzanine loan which was originated by such affiliate of the Manager. The transaction was approved by NorthStar II’s board of directors, including all of its independent directors. The investment was purchased by the Company in connection with the Combination. In June 2018, the Company increased its commitment to $101.8 million in connection with the joint venture bifurcating the mezzanine loan into a mezzanine loan and a preferred equity investment. As of June 30, 2018,2019, the Company had an unfunded commitment of $43.1$11.4 million remaining. The Company’s interest in the joint venture is 50.0% and its interest in both the underlying mezzanine loan and preferred equity investment is 31.8%, and the affiliate entities own the remaining 68.2%. Both the underlying mezzanine loan and preferred equity investment carry a fixed 12.9% interest rate. This investment is recorded in investments in unconsolidated ventures in the Company’s consolidated balance sheets.
COLONY CREDIT REAL ESTATE, INC.
NOTES TO CONSOLIDATED FINANCIAL STATEMENTS (Continued)
(Unaudited)
Subsequent to June 2019, the Company increased its commitment in the mezzanine loan from $101.8 million to $189.0 million. The upsized mezzanine loan carries a fixed 12.9% interest rate. See Note 20, “Subsequent Events,” for further detail.
In May 2018, the Company acquired an $89.1 million (at par) preferred equity investment in an investment vehicle that owns a seven-property office portfolio located in the New York metropolitan area from an affiliate of the Company’s Manager. The affiliate has a 27.2% ownership interest in the borrower. The preferred equity investment carries a fixed 12.0% interest rate. This investment is recorded in loans and preferred equity held for investment, net in the Company’s consolidated balance sheets.
Subsequent to JuneIn July 2018, the Company acquired a $326.8 million Class A office campus located in Norway from an affiliate of the Company’s Manager. In connection with the purchase, the Company assumed senior mortgage financing from a private bond issuance of $197.7 million. The bonds have a seven-year term remaining, and carry a fixed interest rate of 3.91%. Refer to Note 18, “Subsequent Events” for further information.
Subsequent to JuneIn July 2018, the Company entered into a joint venture to invest in a development project for land and a Grade A office building in Ireland. The Company agreed to invest up to $69.9 million of the $139.7 million total commitment. The Company co-invested along with two affiliates of the Manager, with the Company owning 50.0% of the joint venture and the affiliate entities owning the remaining 50.0%. The joint venture will provide preferred equity debtinvested in a senior mortgage loan of $66.7 million with a fixed interest rate of 12.5% and a maturity date of 3.5 years from origination and common equity. Refer
In October 2018, the Company entered into a joint venture to Note 18, “Subsequent Events” for further information.invest in a mixed-use development project in Ireland. The Company agreed to invest up to $162.4 million of the $266.5 million total commitment. The Company co-invested along with two affiliates of the Manager, with the Company owning 61.0% of the joint venture and the affiliate entities owning the remaining 39.0%. The joint venture will invest in a senior mortgage loan with a fixed interest rate of 15.0% and a maturity date of 2.0 years from origination.
In October 2018, the Company acquired a $20.0 million mezzanine loan from an affiliate of the Company’s Manager, secured by a pledge of an ownership interest in a luxury condominium development project located in New York, NY. The loan bears interest at 9.5% plus LIBOR.
COLONY CREDIT REAL ESTATE, INC.
NOTES TO CONSOLIDATED FINANCIAL STATEMENTS (Continued)
(Unaudited)
| |
| 12. | Equity-Based Compensation |
On January 29, 2018 the Company’s board of directors adopted the 2018 Plan. The 2018 Plan permits the grant of awards with respect to 4.0 million shares of the Class A common stock, subject to adjustment pursuant to the terms of the 2018 Plan. Awards may be granted under the 2018 Plan to (x) the Manager or any employee, officer, director, consultant or advisor (who is a natural person) providing services to the Company, the Manager or their affiliates and (y) any other individual whose participation in the 2018 Plan is determined to be in the best interests of the Company. The following types of awards may be made under the 2018 Plan, subject to the limitations set forth in the plan: (i) stock options (which may be either incentive stock options or non-qualified stock options); (ii) stock appreciation rights (“SARs”);rights; (iii) restricted stock awards; (iii)(iv) stock units; (iv)(v) unrestricted stock awards; (v)(vi) dividend equivalent rights; (vi)(vii) performance awards; (vii)(viii) annual cash incentive awards; (viii)(ix) long-term incentive units; and (ix)(x) other equity-based awards.
Shares subject to an award granted under the 2018 Plan will be counted against the maximum number of shares of Class A common stock available for issuance thereunder as one share of Class A common stock for every one share of Class A common stock subject to such an award. Shares subject to an award granted under the 2018 Plan will again become available for issuance under the 2018 Plan if the award terminates by expiration, forfeiture, cancellation, or otherwise without the issuance of such shares (except as set forth in the following sentence). The number of shares of Class A common stock available for issuance under the 2018 Plan will not be increased by (i) any shares tendered or withheld in connection with the purchase of shares upon exercise of a stock option, (ii) any shares deducted or delivered in connection with the Company’s tax withholding obligations, or (iii) any shares purchased by the Company with proceeds from stock option exercises. The shares granted in May 2019 to the independent directors of the Company under the 2018 Plan vest in May 2019.2020. Shares granted to non-independent directors, officers and the Manager under the 2018 Plan vest ratably in three annual installments beginning in March 2018.installments.
The table below summarizes our awards granted, forfeited or vested under the 2018 Plan during the six months ended June 30, 2018:2019:
|
| | | | | | | | | |
| | Number of Shares | | |
| | Restricted Stock | | Total | | Weighted Average Grant Date Fair Value |
| Unvested Shares at December 31, 2018 | 889,713 |
| | 889,713 |
| | $ | 19.39 |
|
| Granted | 831,910 |
| | 831,910 |
| | 15.53 |
|
| Vested | (278,921 | ) | | (278,921 | ) | | 19.39 |
|
| Forfeited | — |
| | — |
| | — |
|
| Unvested shares at June 30, 2019 | 1,442,702 |
| | 1,442,702 |
| | $ | 17.16 |
|
|
| | | | | | | | | |
| | Number of Shares | | |
| | Restricted Stock | | Total | | Weighted Average Grant Date Fair Value |
| Unvested Shares at December 31, 2017 | — |
| | — |
| | $ | — |
|
| Granted | 1,003,818 |
| | 1,003,818 |
| | 19.39 |
|
| Vested | — |
| | — |
| | — |
|
| Forfeited | — |
| | — |
| | — |
|
| Unvested shares at June 30, 2018 | 1,003,818 |
| | 1,003,818 |
| | $ | 19.39 |
|
Fair value of equity awards that vested during the six months ended June 30, 2019, determined based on their respective fair values at vesting date, was $5.4 million. No equity awards vested during the six months ended June 30, 2018. There was no equity-based compensation plan for the six months ended June 30, 2017.2018. Fair value of vested awards is determined based on the closing price of the Class A common stock on the date of grant for employee awards, and remeasured each period end based on the closing price of the Class A common stock of such period end for nonemployee awards. Equity-based compensation is classified within administrative expense in the consolidated statement of operations. For awards granted during the six months ended June 30, 2019 and 2018, the weighted average grant date fair value per share was $15.53 and $19.39, respectively.
COLONY CREDIT REAL ESTATE, INC.
NOTES TO CONSOLIDATED FINANCIAL STATEMENTS (Continued)
(Unaudited)
At June 30, 2018,2019, aggregate unrecognized compensation cost for all unvested equity awards was $18.7$22.3 million, which is expected to be recognized over a weighted-average period of 2.72.2 years.
Authorized Capital
As of June 30, 2018,2019, the Company had the authority to issue up to 1.0 billion shares of stock, at $0.01 par value per share, consisting of 905.0950.0 million shares of Class A common stock 45.0and 50.0 million shares of preferred stock. On February 1, 2019, the Class B-3 common stock automatically converted to Class A common stock and each unissued share of Class B-3 common stock and 50.0 million shareswas automatically reclassified as one share of preferredClass A common stock.
The Company had no shares of preferred stock issued and outstanding as of June 30, 2018.2019.
COLONY CREDIT REAL ESTATE, INC.
NOTES TO CONSOLIDATED FINANCIAL STATEMENTS (Continued)
(Unaudited)
Dividends
During the six months ended June 30, 2018,2019, the Company declared the following dividends on its common stock:
|
| | | | | | |
| Declaration Date | | Record Date | | Payment Date | | Per Share |
| January 17, 2019 | | January 31, 2019 | | February 26, 201811, 2019 | | $0.145 |
| February 15, 2019 | | February 28, 2019 | | March 8, 2018 | | March 16, 201811, 2019 | | $0.145 |
March 15, 201818, 2019 | | March 29, 20182019 | | April 10, 20182019 | | $0.145 |
April 16, 201815, 2019 | | April 30, 20182019 | | May 10, 20182019 | | $0.145 |
May 7, 20182, 2019 | | May 31, 20182019 | | June 11, 201810, 2019 | | $0.145 |
June 14, 201817, 2019 | | June 29, 201830, 2019 | | July 10, 20182019 | | $0.145 |
Stock Repurchase Program
The Company’s board of directors authorized a stock repurchase program (the “Stock Repurchase Program”), under which the Company may repurchase up to $300.0 million of its outstanding Class A common stock until March 31, 2019.2020. Under the Stock Repurchase Program, the Company may repurchase shares in open market purchases, through tender offers or otherwise in accordance with all applicable securities laws and regulations, including Rule 10b-18 of the Securities Exchange Act of 1934, as amended.
As of June 30, 2018,2019, the Company had not repurchased any shares under the Stock Repurchase Program.
Accumulated Other Comprehensive Income (Loss)
The following tables present the changes in each component of Accumulated Other Comprehensive Income (Loss) (“AOCI”) attributable to stockholders and noncontrolling interests in the OP, net of immaterial tax effect.
Changes in Components of AOCI - Stockholders
|
| | | | | | | | | | | | | | | |
| (in thousands) | Unrealized gain (loss) on real estate securities, available for sale | | Unrealized gain on net investment hedges | | Foreign currency translation gain (loss) | | Total |
| AOCI at December 31, 2018 | $ | (1,295 | ) | | $ | 11,037 |
| | $ | (10,141 | ) | | $ | (399 | ) |
| Other comprehensive income (loss) | 9,530 |
| | 7,222 |
| | (3,233 | ) | | 13,519 |
|
| AOCI at March 31, 2019 | 8,235 |
| | 18,259 |
| | (13,374 | ) | | 13,120 |
|
| Other comprehensive income | 7,679 |
| | 916 |
| | 3,832 |
| | 12,427 |
|
| AOCI at June 30, 2019 | $ | 15,914 |
| | $ | 19,175 |
| | $ | (9,542 | ) | | $ | 25,547 |
|
|
| | | | | | | |
| (in thousands) | Unrealized loss on real estate securities, available for sale | | Total |
| AOCI at December 31, 2017 | $ | — |
| | $ | — |
|
| Other comprehensive loss | (1,848 | ) | | (1,848 | ) |
| AOCI at March 31, 2018 | (1,848 | ) | | (1,848 | ) |
| Other comprehensive loss | (930 | ) | | (930 | ) |
| AOCI at June 30, 2018 | $ | (2,778 | ) | | $ | (2,778 | ) |
COLONY CREDIT REAL ESTATE, INC.
NOTES TO CONSOLIDATED FINANCIAL STATEMENTS (Continued)
(Unaudited)
Changes in Components of AOCI - Noncontrolling Interests in the OP
|
| | | | | | | | | | | | | | | |
| (in thousands) | Unrealized gain (loss) on real estate securities, available for sale | | Unrealized gain on net investment hedges | | Foreign currency translation gain (loss) | | Total |
| AOCI at December 31, 2018 | $ | (32 | ) | | $ | 268 |
| | $ | (246 | ) | | $ | (10 | ) |
| Other comprehensive income (loss) | 228 |
| | 173 |
| | (77 | ) | | 324 |
|
| AOCI at March 31, 2019 | 196 |
| | 441 |
| | (323 | ) | | 314 |
|
| Other comprehensive income | 184 |
| | 22 |
| | 91 |
| | 297 |
|
| AOCI at June 30, 2019 | $ | 380 |
| | $ | 463 |
| | $ | (232 | ) | | $ | 611 |
|
For the three and six months ended June 30, 2018, the AOCI attributable to noncontrolling interests in the OP is de minimis.
| |
| 14. | Noncontrolling Interests |
Operating Partnership
Noncontrolling interests include the aggregate limited partnership interests in the OP held by RED REIT. Net income (loss) attributable to the noncontrolling interests is based on the limited partners’ ownership percentage of the OP. Net loss attributable to the noncontrolling interests of the OP was $2.6 million and $2.2 million for the three and six months ended June 30, 2019, respectively. Net income attributable to the noncontrolling interests of the OP was $0.3 million for each of the three and six months ended June 30, 2018.
Investment Entities
Noncontrolling interests in investment entities represent third-party equity interests in ventures that are consolidated with the Company’s financial statements. Net loss attributable to noncontrolling interests in the investment entities for the three and six months ended June 30, 2019 was $0.9 million and $1.2 million, respectively. Net loss attributable to noncontrolling interests in the investment entities for the three months ended June 30, 2018 was $0.5 million. Net income attributable to noncontrolling interests in the investment entities for the six months ended June 30, 2018 was $1.9 million. Net income attributable to noncontrolling interests in the investment entities for the three and six months ended June 30, 2017 was $9.4 million and $18.5 million, respectively.
Determination of Fair Value
The following is a description of the valuation techniques used to measure fair value of assets accounted for at fair value on a recurring basis and the general classification of these instruments pursuant to the fair value hierarchy.
PE Investments
The Company accounts for PE Investments at fair value which is determined based on either a valuation model using assumptions for the timing and amount of expected future cash flow for income and realization events for the underlying assets in the funds and discount rate.rate, or pending sales prices, if applicable. This fair value measurement is generally based on unobservable inputs and, as such, is classified as Level 3 of the
COLONY CREDIT REAL ESTATE, INC.
NOTES TO CONSOLIDATED FINANCIAL STATEMENTS (Continued)
(Unaudited)
the fair value hierarchy. The Company considers cash flow and NAV information provided by general partners of privatethe underlying funds (“GP NAV”) and the implied yields of those funds in valuing its PE Investments. However,The Company also considers the values derived from the valuation model as a percentage of GP NAV, and compares the resulting percentage of GP NAV to precedent transactions, independent research, industry reports as well as pricing from executed purchase and sale agreements related to the disposition of its PE Investments. The Company may, as a result of that comparison, apply a mark-to-market adjustment. The Company has not elected the practical expedient to measure the fair value of its PE Investments using the NAV of the underlying funds.
Real Estate Securities
CRE securities are generally valued using a third-party pricing service or broker quotations. These quotations are not adjusted and are based on observable inputs that can be validated, and as such, are classified as Level 2 of the fair value hierarchy. Certain CRE securities may be valued based on a single broker quote or an internal price which may have less observable pricing, and as such, would be classified as Level 3 of the fair value hierarchy. Management determines the prices are representative of fair value through a review of available data, including observable inputs, recent transactions as well as its knowledge of and experience in the market.
COLONY CREDIT REAL ESTATE, INC.
NOTES TO CONSOLIDATED FINANCIAL STATEMENTS (Continued)
(Unaudited)
Investing VIEs
As discussed in Note 6, “Real Estate Securities, Available for Sale,” the Company has elected the fair value option for the financial assets and liabilities of the consolidated Investing VIEs. The Investing VIEs are “static,” that is no reinvestment is permitted and there is very limited active management of the underlying assets. The Company is required to determine whether the fair value of the financial assets or the fair value of the financial liabilities of the Investing VIEs are more observable, but in either case, the methodology results in the fair value of the assets of the securitization trusts being equal to the fair value of their liabilities. The Company has determined that the fair value of the liabilities of the securitization trusts are more observable, since market prices for the liabilities are available from a third-party pricing service or are based on quoted prices provided by dealers who make markets in similar financial instruments. The financial assets of the securitization trusts are not readily marketable and their fair value measurement requires information that may be limited in availability.
In determining the fair value of the trusts’ financial liabilities, the dealers will consider contractual cash payments and yields expected by market participants. Dealers also incorporate common market pricing methods, including a spread measurement to the treasury curve or interest rate swap curve as well as underlying characteristics of the particular security including coupon, periodic and life caps, collateral type, rate reset period and seasoning or age of the security. The Company’s collateralized mortgage obligations are classified as Level 2 of the fair value hierarchy, where a third-party pricing service or broker quotations are available, and as Level 3 of the fair value hierarchy, where internal price is utilized which may have less observable pricing. In accordance with ASC 810, Consolidation, the assets of the securitization trusts are an aggregate value derived from the fair value of the trust’s liabilities, and the Company has determined that the valuation of the trust’s assets in their entirety including its retained interests from the securitizations (eliminated in consolidation in accordance with U.S. GAAP) should be classified as Level 3 of the fair value hierarchy.
Derivatives
Derivative instruments consist of interest rate contracts and foreign exchange contracts that are generally traded over-the-counter, and are valued using a third-party service provider. Quotations on over-the counter derivatives are not adjusted and are generally valued using observable inputs such as contractual cash flows, yield curve, foreign currency rates and credit spreads, and are classified as Level 2 of the fair value hierarchy. Although credit valuation adjustments, such as the risk of default, rely on Level 3 inputs, these inputs are not significant to the overall valuation of its derivatives. As a result, derivative valuations in their entirety are classified as Level 2 of the fair value hierarchy.
Fair Value Hierarchy
Financial assets recorded at fair value on a recurring basis are classified in their entirety based on the lowest level of input that is significant to the fair value measurement. The following table presents financial assets that were accounted for at fair value on a recurring basis as of June 30, 20182019 and December 31, 20172018 by level within the fair value hierarchy (dollars in thousands):
|
| | | | | | | | | | | | | | | | | | | | | | | | | | | | | | | |
| | June 30, 2019 | | December 31, 2018 |
| | Level 1 | | Level 2 | | Level 3 | | Total | | Level 1 | | Level 2 | | Level 3 | | Total |
| Assets: | | | | | | | | | | | | | | | |
| Investments in unconsolidated ventures - PE Investments | $ | — |
| | $ | 40,306 |
| | $ | 13,587 |
| | $ | 53,893 |
| | $ | — |
| | $ | — |
| | $ | 160,851 |
| | $ | 160,851 |
|
| Real estate securities, available for sale | — |
| | 249,100 |
| |
|
| | 249,100 |
| | — |
| | 228,185 |
| | — |
| | 228,185 |
|
| Mortgage loans held in securitization trusts, at fair value | — |
| | — |
| | 3,175,950 |
| | 3,175,950 |
| | — |
| | — |
| | 3,116,978 |
| | 3,116,978 |
|
| Other assets - derivative assets | — |
| | 21,189 |
| | — |
| | 21,189 |
| | — |
| | 14,139 |
| | — |
| | 14,139 |
|
| Liabilities: | | | | | | | | | | | | | | | |
| Mortgage obligations issued by securitization trusts, at fair value | $ | — |
| | $ | 3,026,282 |
| | $ | — |
| | $ | 3,026,282 |
| | $ | — |
| | $ | 2,973,936 |
| | $ | — |
| | $ | 2,973,936 |
|
| Other liabilities - derivative liabilities | — |
| | 16,281 |
| | — |
| | 16,281 |
| | — |
| | 6,042 |
| | — |
| | 6,042 |
|
|
| | | | | | | | | | | | | | | | | | | | | | | | | | | | | | | |
| | June 30, 2018 (Unaudited) | | December 31, 2017 |
| | Level 1 | | Level 2 | | Level 3 | | Total | | Level 1 | | Level 2 | | Level 3 | | Total |
| Assets: | | | | | | | | | | | | | | | |
Investments in unconsolidated ventures(1) | $ | — |
| | $ | — |
| | $ | 241,453 |
| | $ | 241,453 |
| | $ | — |
| | $ | — |
| | $ | 24,417 |
| | $ | 24,417 |
|
| Real estate securities, available for sale | — |
| | 198,151 |
| | — |
| | 198,151 |
| | — |
| | — |
| | — |
| | — |
|
| Mortgage loans held in securitization trusts, at fair value | — |
| | — |
| | 3,154,112 |
| | 3,154,112 |
| | — |
| | — |
| | — |
| | — |
|
| Liabilities: | | | | | | | | | | | | | | | |
| Mortgage obligations issued by securitization trusts, at fair value | $ | — |
| | $ | 3,010,636 |
| | $ | — |
| | $ | 3,010,636 |
| | $ | — |
| | $ | — |
| | $ | — |
| | $ | — |
|
| |
(1) | Represents PE Investments for which the Company elected fair value option. |
COLONY CREDIT REAL ESTATE, INC.
NOTES TO CONSOLIDATED FINANCIAL STATEMENTS (Continued)
(Unaudited)
The following table presents the changes in fair value of financial assets which are measured at fair value on a recurring basis using Level 3 inputs to determine fair value for the six months ended June 30, 20182019 and year ended December 31, 20172018 (dollars in thousands):
| | | | Six Months Ended June 30, 2018 (Unaudited) | | Year Ended December 31, 2017 | Six Months Ended June 30, 2019 | | Six Months Ended June 30, 2018 |
| | PE Investments | | Mortgage loans held in securitization trusts (1) | | PE Investments | Investments in unconsolidated ventures - PE Investments | | Mortgage loans held in securitization trusts (1) | | Investments in unconsolidated ventures - PE Investments | | Mortgage loans held in securitization trusts (1) |
| Beginning balance | $ | 24,417 |
| | $ | — |
| | $ | — |
| $ | 160,851 |
| | $ | 3,116,978 |
| | $ | 24,417 |
| | $ | — |
|
Contributions(2)/purchases | 247,435 |
| | 3,327,199 |
| | 72,325 |
| 151 |
| | — |
| | 247,435 |
| | 3,327,199 |
|
| Distributions/paydowns | (38,622 | ) | | (123,117 | ) | | (49,344 | ) | (13,905 | ) | | (38,386 | ) | | (38,622 | ) | | (123,117 | ) |
| Equity in earnings | 14,919 |
| | — |
| | 6,829 |
| — |
| |
| | 14,919 |
| | — |
|
| Unrealized loss in earnings | (6,696 | ) | | (47,767 | ) | | (5,393 | ) | |
| Realized loss in earnings | — |
| | (2,203 | ) | | — |
| |
| Sale of investments | | (48,930 | ) | | — |
| | — |
| | — |
|
| Transfers out of Level 3 | | (83,870 | ) | | — |
| | — |
| | — |
|
| Unrealized gain (loss) in earnings | | — |
| | 97,310 |
| | (6,696 | ) | | (47,767 | ) |
| Realized gain (loss) in earnings | | (710 | ) | | 48 |
| | — |
| | (2,203 | ) |
| Ending balance | $ | 241,453 |
| | $ | 3,154,112 |
| | $ | 24,417 |
| $ | 13,587 |
| | $ | 3,175,950 |
| | $ | 241,453 |
| | $ | 3,154,112 |
|
| |
| (1) | For the six months ended June 30, 2018,2019, unrealized lossgain of $47.8$97.3 million related to mortgage loans held in securitization trusts, at fair value was offset by unrealized gainloss of $52.0$90.7 million related to mortgage obligations issued by securitization trusts, at fair value. |
| |
| (2) | Includes initial investments, before distribution and contribution closing statement adjustments, and subsequent contributions, including deferred purchase price fundings. |
ForTransfers of assets into or out of Level 3 are presented at their fair values as measured at the six months endedend of the reporting period. Assets transferred out of Level 3 represent PE Investments that were valued based on their contracted sales price in March 2019.
As of June 30, 20182019 and the year ended December 31, 2017,2018, the Company usedutilized a discounted cash flow model, comparable precedent transactions and other market information to quantify Level 3 fair value measurements on a recurring basis. For the six months endedAs of June 30, 20182019 and the year ended December 31, 2017,2018, the key unobservable inputs used in the analysis of PE Investments included discount rates with a range of 11.1%11.0% to 20.0%12.0% and 11.1%11.0% to 12.4%15.0%, respectively, and timing and amount of expected future cash flow. Forflows. As of December 31, 2018, the six months endedCompany applied additional mark-to-market adjustments based on a percentage of GP NAV with a weighted average of 11.2%. No additional mark-to-market adjustments were recorded as of June 30, 2019. As of June 30, 2019 and December 31, 2018, the key unobservable inputs used in the valuation of mortgage obligations issued by securitization trusts included yields ranging from 7.7%14.3% to 11.2%17.4% and 14.5% and 19.0%, respectively, and a weighted average life of 5.9 years.4.8 years and 5.4 years, respectively. Significant increases or decreases in any one of the inputs described above in isolation may result in significantly different fair value of the financial assets and liabilities using such Level 3 inputs.
For the three and six months ended June 30, 2018, the Company recorded a net unrealized gain of $3.7 million and $4.2 million, respectively, related to mortgage loans held in and mortgage obligations issued by securitization trusts, at fair value, respectively. These amounts, when incurred, are recorded as unrealized gain on mortgage loans and obligations held in securitization trusts, net in the consolidated statements of operations.
For the three and six months ended June 30, 2018,2019, the Company recorded a realized loss of $2.2 million on mortgage loans held in securitization trusts, at fair value. The loss was due to lower than expected future cash flows on a subordinate trancheassociated with the sale of a securitization trust. This amount is recorded as realized loss on mortgage loans and obligations held in securitization trusts, net inportion of the consolidated statementsCompany’s PE Investments of operations.
$0.7 million. For the three and six months ended June 30, 2018, the Company recorded an unrealized loss on PE Investments of $5.6 million and $6.7 million, respectively. These amounts, when incurred, are recorded as equity in earnings of unconsolidated ventures in the consolidated statements of operations.
For the three and six months ended June 30, 2019, the Company recorded a net unrealized gain of $5.5 million and $6.6 million, respectively, related to mortgage loans held in and mortgage obligations issued by securitization trusts, at fair value. For the three and six months ended June 30, 2018, the Company recorded a net unrealized gain of $3.7 million and $4.2 million, respectively, related to mortgage loans held in mortgage obligations issued by securitization trusts, at fair value. These amounts, when incurred, are recorded as unrealized gain (loss) on mortgage loans and obligations held in securitization trusts, net in the consolidated statements of operations.
For the six months ended June 30, 2019, the Company recorded a de minimis realized gain on mortgage loans held in securitization trusts, at fair value which represents a recovery of a loss previously recorded in 2018. This amount is recorded as realized gain on mortgage loans and obligations held in securitization trusts, net in the consolidated statements of operations.
Fair Value Option
The Company may elect to apply the fair value option of accounting for certain of its financial assets or liabilities due to the nature of the instrument at the time of the initial recognition of the investment. The Company elected the fair value option for PE
COLONY CREDIT REAL ESTATE, INC.
NOTES TO CONSOLIDATED FINANCIAL STATEMENTS (Continued)
(Unaudited)
Investments and eligible financial assets and liabilities of its consolidated Investing VIEs because management believes it is a more useful presentation for such investments. The Company determined recording the PE Investments based on the change in fair value of projected future cash flow from one period to another better represents the underlying economics of the respective investment. As of June 30, 20182019 and December 31, 2017,2018, the Company has elected not to apply the fair value option for any other eligible financial assets or liabilities.
Fair Value of Financial Instruments
In addition to the above disclosures regarding financial assets or liabilities which are recorded at fair value, U.S. GAAP requires disclosure of fair value about all financial instruments. The following disclosure of estimated fair value of financial instruments
COLONY CREDIT REAL ESTATE, INC.
NOTES TO CONSOLIDATED FINANCIAL STATEMENTS (Continued)
(Unaudited)
was determined by the Company using available market information and appropriate valuation methodologies. Considerable judgment is necessary to interpret market data and develop estimated fair value. Accordingly, the estimates presented herein are not necessarily indicative of the amounts the Company could realize on disposition of the financial instruments. The use of different market assumptions and/or estimation methodologies may have a material effect on estimated fair value.
The following table presents the principal amount, carrying value and fair value of certain financial assets and liabilities as of June 30, 20182019 and December 31, 20172018 (dollars in thousands):
| | | | June 30, 2018 (Unaudited) | | December 31, 2017 | June 30, 2019 | | December 31, 2018 |
| | Principal Amount | | Carrying Value | | Fair Value | | Principal Amount | | Carrying Value | | Fair Value | Principal Amount | | Carrying Value | | Fair Value | | Principal Amount | | Carrying Value | | Fair Value |
Financial assets:(1) | | | | | | | | | | | | | | | | | | | | | | |
| Loans and preferred equity held for investment, net | $ | 2,071,843 |
| (2) | $ | 2,079,134 |
| | $ | 2,080,006 |
| | $ | 1,307,740 |
| (2) | $ | 1,300,784 |
| | $ | 1,311,783 |
| $ | 2,578,891 |
| (2) | $ | 2,398,191 |
| | $ | 2,409,579 |
| | $ | 2,129,857 |
| (2) | $ | 2,020,497 |
| | $ | 2,025,216 |
|
Financial liabilities:(1) | | | | | | | | | | | | | | | | | | | | | | |
| Securitization bonds payable, net | $ | 126,264 |
| | $ | 126,256 |
| | $ | 126,264 |
| | $ | 108,794 |
| | $ | 108,679 |
| | $ | 108,974 |
| $ | 23,377 |
| | $ | 23,377 |
| | $ | 23,377 |
| | $ | 81,372 |
| | $ | 81,372 |
| | $ | 81,372 |
|
| Mortgage notes payable, net | 890,230 |
| | 884,729 |
| | 888,641 |
| | 284,035 |
| | 280,982 |
| | 282,333 |
| 1,263,201 |
| | 1,257,915 |
| | 1,263,564 |
| | 1,177,401 |
| | 1,173,019 |
| | 1,177,669 |
|
| Master repurchase facilities | 800,545 |
| | 800,545 |
| | 800,545 |
| | — |
| | — |
| | — |
| 1,808,790 |
| | 1,808,790 |
| | 1,808,790 |
| | 1,365,918 |
| | 1,365,918 |
| | 1,365,918 |
|
| |
| (1) | The fair value of other financial instruments not included in this table is estimated to approximate their carrying value. |
| |
| (2) | Excludes future funding commitments of $146.7$226.1 million and $19.2$135.0 million as of June 30, 20182019 and December 31, 2017,2018, respectively. |
Disclosure about fair value of financial instruments is based on pertinent information available to management as of the reporting date. Although management is not aware of any factors that would significantly affect fair value, such amounts have not been comprehensively revalued for purposes of these consolidated financial statements since that date and current estimates of fair value may differ significantly from the amounts presented herein.
Loans and Preferred Equity Held for Investment, Net
For loans and preferred equity held for investment, net, fair values were determined: (i) by comparing the current yield to the estimated yield for newly originated loans with similar credit risk or the market yield at which a third party might expect to purchase such investment; or (ii) based on discounted cash flow projections of principal and interest expected to be collected, which includes consideration of the financial standing of the borrower or sponsor as well as operating results of the underlying collateral. These fair value measurements of CRE debt are generally based on unobservable inputs and, as such, are classified as Level 3 of the fair value hierarchy. Carrying values of loans and preferred equity held for investment are presented net of allowance for loan losses, where applicable.
Securitization Bonds Payable, Net
Securitization bonds payable, net are valued using quotations from nationally recognized financial institutions that generally acted as underwriter for the transactions. These quotations are not adjusted and are generally based on observable inputs that can be validated, and as such, are classified as Level 2 of the fair value hierarchy.
Mortgage and Other Notes Payable, Net
For mortgage and other notes payable, net, the Company primarily uses rates currently available with similar terms and remaining maturities to estimate fair value. These measurements are determined using comparable U.S. Treasury rates as of the end of the reporting period. These fair value measurements are based on observable inputs, and as such, are classified as Level 2 of the fair value hierarchy.
COLONY CREDIT REAL ESTATE, INC.
NOTES TO CONSOLIDATED FINANCIAL STATEMENTS (Continued)
(Unaudited)
Master Repurchase Facilities
The Company has amounts outstanding under Master Repurchase Facilities. The Master Repurchase Facilities bear floating rates of interest. As of the reporting date, the Company believes the carrying value approximates fair value. These fair value measurements are based on observable inputs, and as such, are classified as Level 2 of the fair value hierarchy.
Other
The carrying values of cash and cash equivalents, receivables, and accrued and other liabilities approximate fair value due to their short term nature and credit risk, if any, are negligible.
Nonrecurring Fair Values
The Company measures fair value of certain assets on a nonrecurring basis when events or changes in circumstances indicate that the carrying value of the assets may not be recoverable. Adjustments to fair value generally result from the application of lower of amortized cost or fair value accounting for assets held for sale or write-down of asset values due to impairment.
The following table summarizes assets carried at fair value on a nonrecurring basis, measured at the time of impairment (dollars in thousands):
51 |
| | | | | | | | | | | | | | | | | | | | | | | | | | | | | | | |
| | June 30, 2019 | | December 31, 2018 |
| | Level 1 | | Level 2 | | Level 3 | | Total | | Level 1 | | Level 2 | | Level 3 | | Total |
| Real estate, net | $ | — |
| | $ | — |
| | $ | 37,937 |
| | $ | 37,937 |
| | $ | — |
| | $ | — |
| | $ | 78,312 |
| | $ | 78,312 |
|
| Assets held for sale | — |
| | 1,073 |
| | 66,365 |
| | 67,438 |
| | — |
| | — |
| | — |
| | — |
|
The following table summarizes the fair value write-downs to assets carried at nonrecurring fair values during the periods presented (dollars in thousands):
|
| | | | | | | |
| | Three Months Ended June 30, 2019 | | Six Months Ended
June 30, 2019 |
| Impairment of operating real estate | $ | 10,124 |
| | $ | 10,124 |
|
Real estate, net—Impaired real estate held for investment consisted of one property in the Company’s net lease segment and 11 properties in its other segment, resulting from one or more changes including reduction in the estimated holding period of the properties, rent reductions and exposure to the retail market. Fair value of all 12 properties was determined using a future cash flow analysis that included an eventual sale of the properties, with expected sale price generally based on broker price opinions, and/or applying a terminal capitalization rate of 12.0% for the net lease property and a range of discount rates of 12.0% to 15.0% for all 12 properties. The Company recorded $7.1 million of impairment on its net lease property during the third quarter of 2018 and $10.0 million of impairment on the 11 properties in its other segment during the three months ended June 30, 2019.
Real estate held for sale—Impaired real estate held for sale consists of three properties in the Company’s other real estate segment, resulting from one or more changes including a reduction in the estimated holding period of these properties, exposure to the student housing markets and contracted sales price. Fair value of the two student housing properties was determined using a future cash flow analysis that included an eventual sale of the properties, with expected sales price generally based on broker price opinions, and applying terminal capitalization rates of 6.0% and a discount rate of 8.0%. The $0.1 million write down to fair value less cost to sell of the third property was based on the contracted sales price and thus classified as Level 2 of the fair value hierarchy.
See Note 7, “Real Estate, net and Real Estate Held for Sale” for further information.
The Company uses derivative instruments to manage the risk of changes in interest rates and foreign exchange rates, arising from both its business operations and economic conditions. Specifically, the Company enters into derivative instruments to manage differences in the amount, timing, and duration of the Company’s known or expected cash receipts and cash payments, the values of which are driven by interest rates, principally relating to the Company’s investments. Additionally, the Company’s foreign operations expose the Company to fluctuations in foreign exchange rates. The Company enters into derivative instruments to protect the value or fix certain of these foreign denominated amounts in terms of its functional currency, the U.S. dollar. Derivative instruments used in the Company’s risk management activities may be designated as qualifying hedge accounting relationships designated hedges or non-designated hedges.
COLONY CREDIT REAL ESTATE, INC.
NOTES TO CONSOLIDATED FINANCIAL STATEMENTS (Continued)
(Unaudited)
As of June 30, 2019 and December 31, 2018, fair value of derivative assets and derivative liabilities were as follows (dollars in thousands):
|
| | | | | | | | | | | | | | | | | | | | | | | | |
| | | June 30, 2019 | | December 31, 2018 |
| | | Designated Hedges | | Non-Designated Hedges | | Total | | Designated Hedges | | Non-Designated Hedges | | Total |
| Derivative Assets | | | | | | | | | | | | |
| Foreign exchange contracts | | $ | 18,004 |
| | $ | 3,180 |
| | $ | 21,184 |
| | $ | 11,312 |
| | $ | 2,796 |
| | $ | 14,108 |
|
| Interest rate contracts | | — |
| | 5 |
| | 5 |
| | — |
| | 31 |
| | 31 |
|
| Included in other assets | | $ | 18,004 |
| | $ | 3,185 |
| | $ | 21,189 |
| | $ | 11,312 |
| | $ | 2,827 |
| | $ | 14,139 |
|
| Derivative Liabilities | | | | | | | | | | | | |
| Foreign exchange contracts | | $ | (8 | ) | | $ | — |
| | $ | (8 | ) | | $ | (10 | ) | | $ | — |
| | $ | (10 | ) |
| Interest rate contracts | | — |
| | (16,273 | ) | | (16,273 | ) | | — |
| | (6,032 | ) | | (6,032 | ) |
| Included in accrued and other liabilities | | $ | (8 | ) | | $ | (16,273 | ) | | $ | (16,281 | ) | | $ | (10 | ) | | $ | (6,032 | ) | | $ | (6,042 | ) |
As of June 30, 2019, counterparties held $16.8 million in cash collateral for the derivative contracts.
The following table summarizes the foreign exchange and interest rate contracts as of June 30, 2019:
|
| | | | | | | | | | | | |
| Type of Derivatives | | Notional Currency | | Notional Amount (in thousands) | | Range of Maturity Dates |
| Designated | | Non-Designated |
| FX Forward | | EUR | | € | 164,533 |
| | € | — |
| | December 2019 - June 2023 |
| FX Forward | | NOK | | NOK 585,600 |
| | NOK 341,548 |
| | July 2019 - July 2023 |
| Interest Rate Swap | | USD | | $ | — |
| | $ | 404,052 |
| | April 2020 - August 2028 |
The table below represents the effect of the derivative financial instruments on the consolidated statements of operations and of comprehensive income (loss) for the three and six months ended June 30, 2019 and 2018 (dollars in thousands):
|
| | | | | | | | | | | | | | | | |
| | | Three Months Ended June 30, | | Six Months Ended June 30, |
| | | 2019 | | 2018 | | 2019 | | 2018 |
| Other gain (loss), net | | | | | | | | |
| Non-designated foreign exchange contracts | | $ | 141 |
| | $ | — |
| | $ | 378 |
| | $ | — |
|
| Non-designated interest rate contracts | | (6,178 | ) | | 10 |
| | (10,261 | ) | | 32 |
|
| | | $ | (6,037 | ) | | $ | 10 |
| | $ | (9,883 | ) | | $ | 32 |
|
| Accumulated other comprehensive income (loss) | | | | | | | | |
| Designated foreign exchange contracts | | $ | 938 |
| | $ | — |
| | $ | 8,333 |
| | $ | — |
|
| | | 938 |
| | — |
| | 8,333 |
| | — |
|
| Interest income | | | | | | | | |
| Non-designated interest rate contracts | | $ | — |
| | $ | 825 |
| | $ | — |
| | $ | 680 |
|
At the end of each quarter, the Company reassesses the effectiveness of its net investment hedges and as appropriate, dedesignates the portion of the derivative notional that is in excess of the beginning balance of its net investments as non-designated hedges. Any unrealized gain or loss on the dedesignated portion of net investment hedges is transferred into earnings, recorded in other gain (loss), net. During the three and six months ended June 30, 2019 and 2018, no gain (loss) was transferred from accumulated other comprehensive income (loss).
Offsetting Assets and Liabilities
The Company enters into agreements subject to enforceable netting arrangements with its derivative counterparties that allow the Company to offset the settlement of derivative assets and liabilities in the same currency by derivative instrument type or, in the event of default by the counterparty, to offset all derivative assets and liabilities with the same counterparty. The Company has elected not to net derivative asset and liability positions, notwithstanding the conditions for right of offset may have been met.
COLONY CREDIT REAL ESTATE, INC.
NOTES TO CONSOLIDATED FINANCIAL STATEMENTS (Continued)
(Unaudited)
The Company presents derivative assets and liabilities with the same counterparty on a gross basis on the consolidated balance sheets.
The following table sets forth derivative positions where the Company has a right of offset under netting arrangements with the same counterparty as of June 30, 2019 and December 31, 2018 (dollars in thousands):
|
| | | | | | | | | | | | | | | | |
| | | Gross Amounts of Assets (Liabilities) Included on Consolidated Balance Sheets | | Gross Amounts Not Offset on Consolidated Balance Sheets | | Net Amounts of Assets (Liabilities) |
| (Assets) Liabilities | | Cash Collateral Pledged |
| June 30, 2019 | | | | | | | | |
| Derivative Assets | | | | | | | | |
| Foreign exchange contracts | | $ | 21,184 |
| | $ | (8 | ) | | $ | — |
| | $ | 21,176 |
|
| Interest rate contracts | | 5 |
| | (5 | ) | | — |
| | — |
|
| | | $ | 21,189 |
| | $ | (13 | ) | | $ | — |
| | $ | 21,176 |
|
| Derivative Liabilities | | | | | | | | |
| Foreign exchange contracts | | $ | (8 | ) | | $ | 8 |
| | $ | — |
| | $ | — |
|
| Interest rate contracts | | (16,273 | ) | | 5 |
| | 16,268 |
| | — |
|
| | | $ | (16,281 | ) | | $ | 13 |
| | $ | 16,268 |
| | $ | — |
|
| | | | | | | | | |
| December 31, 2018 | | | | | | | | |
| Derivative Assets | | | | | | | | |
| Foreign exchange contracts | | $ | 14,108 |
| | $ | (10 | ) | | $ | — |
| | $ | 14,098 |
|
| Interest rate contracts | | 31 |
| | — |
| | — |
| | 31 |
|
| | | $ | 14,139 |
| | $ | (10 | ) | | $ | — |
| | $ | 14,129 |
|
| Derivative Liabilities | | | | | | | | |
| Foreign exchange contracts | | $ | (10 | ) | | $ | 10 |
| | $ | — |
| | $ | — |
|
| Interest rate contracts | | (6,032 | ) | | — |
| | 5,490 |
| | (542 | ) |
| | | $ | (6,042 | ) | | $ | 10 |
| | $ | 5,490 |
| | $ | (542 | ) |
| |
16.17. | Commitments and Contingencies |
Lending Commitments
The Company has lending commitments to borrowers pursuant to certain loan agreements in which the borrower may submit a request for funding contingent on achieving certain criteria, which must be approved by the Company as lender, such as leasing, performance of capital expenditures and construction in progress with an approved budget. At June 30, 2019, assuming the terms to qualify for future fundings, if any, have been met, total unfunded lending commitments for loans and preferred equity held for investment was $200.9 million for senior loans, $3.3 million for corporate term loans and $21.9 million for mezzanine loans. Total unfunded commitments for equity method investments was $11.4 million.
Ground Lease Obligation
The Company's operating leases are ground leases acquired with real estate.
At June 30, 2019, the weighted average remaining lease terms were 15.8 years for ground leases.
COLONY CREDIT REAL ESTATE, INC.
NOTES TO CONSOLIDATED FINANCIAL STATEMENTS (Continued)
(Unaudited)
For the three and six months ended June 30, 2018, ground lease expense, including variable lease expense incurred, was $0.7 million and $1.4 million, respectively. The following table presents lease expense, included in property operating expense, for the three and six months ended June 30, 2019 (dollars in thousands):
|
| | | | | | | | |
| | | Three Months Ended
June 30, 2019 | | Six Months Ended
June 30, 2019 |
| Operating lease expense: | | | | |
| Minimum lease expense | | $ | 735 |
| | $ | 1,544 |
|
| Variable lease expense | | — |
| | — |
|
| | | $ | 735 |
| | $ | 1,544 |
|
The operating lease liability was determined using a weighted average discount rate of 5.3%. The following table presents future minimum rental payments, excluding contingent rents, on noncancelable ground leases on real estate as of June 30, 2019 (dollars in thousands):
|
| | | | |
| Remainder of 2019 | | $ | 1,565 |
|
| 2020 | | 3,128 |
|
| 2021 | | 3,112 |
|
| 2022 | | 3,140 |
|
| 2023 | | 2,732 |
|
| 2024 and thereafter | | 24,923 |
|
| Total lease payments | | 38,600 |
|
| Less: Present value discount | | 13,337 |
|
| Operating lease liability (Note 9) | | $ | 25,263 |
|
The following table presents future minimum rental payments, excluding contingent rents, on noncancelable ground leases on real estate as of December 31, 2018 (dollars in thousands):
|
| | | | |
| 2019 | | $ | 2,821 |
|
| 2020 | | 2,819 |
|
| 2021 | | 2,804 |
|
| 2022 | | 1,882 |
|
| 2023 | | 1,388 |
|
| 2024 and thereafter | | 12,998 |
|
| Total | | $ | 24,712 |
|
Litigation and Claims
The Company may be involved in the litigation and claims in the ordinary course of the business. As of June 30, 2019, the Company was not involved in any legal proceedings that are expected to have a material adverse effect on the Company’s results of operations, financial position or liquidity.
The Company currently conducts its business through the following five segments, which are based on how management reviews and manages its business:
| |
| • | Loan Portfolio—Focused on originating, acquiring and asset managing CRE debt investments including first mortgage loans, mezzanine loans, and preferred equity interests as well as participations in such loans. The CRE debt segment also includes ADC loan arrangements accounted for as equity method investments. |
| |
| • | CRE Debt Securities—Focused on investing in CMBS (including “B-pieces” of a CMBS securitization pool) or CRE CLOs (collateralized by pools of CRE debt instruments). |
Loan Portfolio—Focused on originating, acquiring and asset managing CRE debt investments including first mortgage loans, mezzanine loans, and preferred equity interests as well as participations in such loans. The CRE Debt segment also includes ADC loan arrangements accounted for as equity method investments.57
COLONY CREDIT REAL ESTATE, INC.
NOTES TO CONSOLIDATED FINANCIAL STATEMENTS (Continued)
(Unaudited)
CRE Debt Securities—Focused on investing in CMBS (including “B-pieces” of a CMBS securitization pool) or CRE CLOs (collateralized by pools of CRE debt instruments).
Net Leased Real Estate—Focused on direct investments in commercial real estate with long-term leases to tenants on a net lease basis, where such tenants generally will be responsible for property operating expenses such as insurance, utilities, maintenance capital expenditures and real estate taxes.
Other—The other segment includes direct investments in non-core operating real estate such as multi-tenant office and multifamily residential assets as well as PE Investments. The other segment also includes real estate acquired in settlement of loans.
Corporate—The corporate segment includes corporate level asset management and other fees, related party and general and administrative expenses.
| |
| • | Net Leased Real Estate—Focused on direct investments in commercial real estate with long-term leases to tenants on a net lease basis, where such tenants generally will be responsible for property operating expenses such as insurance, utilities, maintenance capital expenditures and real estate taxes. |
| |
| • | Other—The other segment includes direct investments in non-core operating real estate such as multi-tenant office and multifamily residential assets as well as PE Investments. The other segment also includes real estate acquired in settlement of loans. |
| |
| • | Corporate—The corporate segment includes corporate level asset management and other fees, related party and general and administrative expenses. |
The Company may also own investments indirectly through a joint venture.
Following the Combination, the following changes were made to the Company’s operating segments:
The acquired CRE securities formed the new CRE Debt Securities segment.
The Net Leased Real Estate of the combined organization is aggregated into the Net Leased Real Estate segment.
All non-core operating real estate and PE Investments of the combined organization is aggregated into the Other segment.
The Corporate segment consists of corporate level cash and corresponding interest income, fixed assets, corporate level financing and related interest expense, expense for management fees and cost reimbursement to the Manager, as well as Combination-related transaction costs.
The Company primarily generates revenue from net interest income on the loan, preferred equity and securities portfolios, rental and other income from its net leased, hotel, multi-tenant office, and multifamily real estate assets, as well as equity in earnings of unconsolidated ventures, including from PE Investments. CRE debt securities include the Company’s investment in the subordinate tranches of the securitization trusts which are eliminated in consolidation. The Company’s income is primarily derived through the difference between revenue and the cost at which the Company is able to finance its investments. The Company may also acquire investments which generate attractive returns without any leverage.
COLONY CREDIT REAL ESTATE, INC.
NOTES TO CONSOLIDATED FINANCIAL STATEMENTS (Continued)
(Unaudited)
The following tables present segment reporting for the three and six months ended June 30, 20182019 and 20172018 (dollars in thousands):
| | | | | | Loan | | CRE Debt Securities | | Net Leased Real Estate | | Other | | Corporate(1) | | Total |
| Three Months Ended June 30, 2019 | | | | | | | | | | | | | |
| Net interest income (expense) | | | $ | 22,307 |
| | $ | 5,442 |
| | $ | 3 |
| | $ | — |
| | $ | (3,825 | ) | | $ | 23,927 |
|
| Property and other income | | | 148 |
| | 74 |
| | 25,393 |
| | 39,585 |
| | 1 |
| | 65,201 |
|
| Management fee expense | | | — |
| | — |
| | — |
| | — |
| | (11,357 | ) | | (11,357 | ) |
| Property operating expense | | | — |
| | — |
| | (4,696 | ) | | (23,444 | ) | | — |
| | (28,140 | ) |
| Transaction, investment and servicing expense | | | (906 | ) | | — |
| | (60 | ) | | (365 | ) | | 280 |
| | (1,051 | ) |
| Interest expense on real estate | | | — |
| | — |
| | (9,493 | ) | | (4,405 | ) | | — |
| | (13,898 | ) |
| Depreciation and amortization | | | — |
| | — |
| | (13,040 | ) | | (16,217 | ) | | — |
| | (29,257 | ) |
| Provision for loan losses | | | (110,258 | ) | | — |
| | — |
| | — |
| | — |
| | (110,258 | ) |
| Impairment of operating real estate | | | — |
| | — |
| | — |
| | (10,124 | ) | | — |
| | (10,124 | ) |
| Administrative expense | | | (65 | ) | | (348 | ) | | (43 | ) | | (25 | ) | | (7,529 | ) | | (8,010 | ) |
| Unrealized gain on mortgage loans and obligations held in securitization trusts, net | | | — |
| | 5,154 |
| | — |
| | — |
| | 395 |
| | 5,549 |
|
| Other gain (loss), net | | | — |
| | (6,157 | ) | | 123 |
| | (28 | ) | | — |
| | (6,062 | ) |
| Income (loss) before equity in earnings of unconsolidated ventures and income taxes | | | (88,774 | ) | | 4,165 |
| | (1,813 | ) | | (15,023 | ) | | (22,035 | ) | | (123,480 | ) |
| Equity in earnings of unconsolidated ventures | | | 12,557 |
| | — |
| | — |
| | — |
| | — |
| | 12,557 |
|
| Income tax benefit | | | — |
| | — |
| | (46 | ) | | 179 |
| | — |
| | 133 |
|
| Net income (loss) | | | $ | (76,217 | ) | | $ | 4,165 |
| | $ | (1,859 | ) | | $ | (14,844 | ) | | $ | (22,035 | ) | | $ | (110,790 | ) |
| | | | | | | | | | | | | | |
| Three Months Ended June 30, 2018 | | Loan | | CRE Debt Securities | | Net Leased Real Estate | | Other | | Corporate(1) | | Total | | | | | | | | | | | | |
| Net interest income | | $ | 24,009 |
| | $ | 7,800 |
| | $ | — |
| | $ | — |
| | $ | (1,680 | ) | | $ | 30,129 |
| |
| Net interest income (expense) | | | $ | 24,009 |
| | $ | 7,800 |
| | $ | — |
| | $ | — |
| | $ | (1,680 | ) | | $ | 30,129 |
|
| Property and other income | | 525 |
| | 11 |
| | 16,043 |
| | 23,438 |
| | 359 |
| | 40,376 |
| | 525 |
| | 11 |
| | 16,043 |
| | 23,438 |
| | 359 |
| | 40,376 |
|
| Management fee expense | | — |
| | — |
| | — |
| | — |
| | (11,791 | ) | | (11,791 | ) | | — |
| | — |
| | — |
| | — |
| | (11,791 | ) | | (11,791 | ) |
| Property operating expense | | — |
| | — |
| | (5,235 | ) | | (11,021 | ) | | — |
| | (16,256 | ) | | — |
| | — |
| | (5,235 | ) | | (11,021 | ) | | — |
| | (16,256 | ) |
| Transaction, investment and servicing expense | | (260 | ) | | — |
| | (7 | ) | | (161 | ) | | (3,069 | ) | | (3,497 | ) | | (260 | ) | | — |
| | (7 | ) | | (161 | ) | | (3,069 | ) | | (3,497 | ) |
| Interest expense on real estate | | — |
| | — |
| | (5,099 | ) | | (4,751 | ) | | — |
| | (9,850 | ) | | — |
| | — |
| | (5,099 | ) | | (4,751 | ) | | — |
| | (9,850 | ) |
| Depreciation and amortization | | — |
| | — |
| | (8,910 | ) | | (14,449 | ) | | — |
| | (23,359 | ) | | — |
| | — |
| | (8,910 | ) | | (14,449 | ) | | — |
| | (23,359 | ) |
| Administrative expense | | (168 | ) | | (485 | ) | | (9 | ) | | (12 | ) | | (6,210 | ) | | (6,884 | ) | | (168 | ) | | (485 | ) | | (9 | ) | | (12 | ) | | (6,210 | ) | | (6,884 | ) |
| Unrealized gain on mortgage loans and obligations held in securitization trusts, net | | 443 |
| | 2,599 |
| | — |
| | (443 | ) | | 1,097 |
| | 3,696 |
| |
| Unrealized gain (loss) on mortgage loans and obligations held in securitization trusts, net | | | 443 |
| | 2,599 |
| | — |
| | (443 | ) | | 1,097 |
| | 3,696 |
|
| Realized loss on mortgage loans and obligations held in securitization trusts, net | | — |
| | (2,203 | ) | | — |
| | — |
| | — |
| | (2,203 | ) | | — |
| | (2,203 | ) | | — |
| | — |
| | — |
| | (2,203 | ) |
| Other gain on investments, net | | (442 | ) | | — |
| | 10 |
| | 442 |
| | — |
| | 10 |
| |
| Other gain (loss), net | | | (442 | ) | | — |
| | 10 |
| | 442 |
| | — |
| | 10 |
|
| Income (loss) before equity in earnings of unconsolidated ventures and income taxes | | 24,107 |
| | 7,722 |
| | (3,207 | ) | | (6,957 | ) | | (21,294 | ) | | 371 |
| | 24,107 |
| | 7,722 |
| | (3,207 | ) | | (6,957 | ) | | (21,294 | ) | | 371 |
|
| Equity in earnings of unconsolidated ventures | | 12,676 |
| | — |
| | — |
| | 2,985 |
| | — |
| | 15,661 |
| | 12,676 |
| | — |
| | — |
| | 2,985 |
| | — |
| | 15,661 |
|
| Income tax benefit (expense) | | (816 | ) | | — |
| | — |
| | 658 |
| | — |
| | (158 | ) | | (816 | ) | | — |
| | — |
| | 658 |
| | — |
| | (158 | ) |
| Net income (loss) | | $ | 35,967 |
| | $ | 7,722 |
| | $ | (3,207 | ) | | $ | (3,314 | ) | | $ | (21,294 | ) | | $ | 15,874 |
| | $ | 35,967 |
| | $ | 7,722 |
| | $ | (3,207 | ) | | $ | (3,314 | ) | | $ | (21,294 | ) | | $ | 15,874 |
|
| |
| (1) | Includes income earned from the CRE securities purchased at a discount, recognized using the effective interest method had the transaction been recorded as an available for sale security, at amortized cost. During the three months ended June 30, 2019 and June 30, 2018, $0.4 million and $1.1 million, respectively, was attributable to discount accretion income and was eliminated in consolidation in the corporate segment. The corresponding interest expense is recorded in net interest income in the Corporate column. |
|
| | | | | | | | | | | | | | | | | | | | |
| Three Months Ended June 30, 2017 | | Loan | | Net Leased Real Estate | | Other | | Corporate | | Total |
| Net interest income | | $ | 31,257 |
| | $ | — |
| | $ | — |
| | $ | — |
| | $ | 31,257 |
|
| Property and other income | | 929 |
| | 5,223 |
| | — |
| | — |
| | 6,152 |
|
| Property operating expense | | (679 | ) | | (1,178 | ) | | — |
| | — |
| | (1,857 | ) |
| Transaction, investment and servicing expense | | (594 | ) | | (115 | ) | | — |
| | — |
| | (709 | ) |
| Interest expense on real estate | | — |
| | (1,066 | ) | | — |
| | — |
| | (1,066 | ) |
| Depreciation and amortization | | (70 | ) | | (2,675 | ) | | — |
| | — |
| | (2,745 | ) |
| Administrative expense | | (304 | ) | | (9 | ) | | — |
| | (3,416 | ) | | (3,729 | ) |
| Other loss on investments, net | | (313 | ) | | — |
| | — |
| | — |
| | (313 | ) |
| Income (loss) before equity in earnings of unconsolidated ventures and income taxes | | 30,226 |
| | 180 |
| | — |
| | (3,416 | ) | | 26,990 |
|
| Equity in earnings of unconsolidated ventures | | 4,560 |
| | — |
| | 1,659 |
| | — |
| | 6,219 |
|
| Income tax expense | | (466 | ) | | — |
| | (419 | ) | | — |
| | (885 | ) |
| Net income (loss) | | $ | 34,320 |
| | $ | 180 |
| | $ | 1,240 |
| | $ | (3,416 | ) | | $ | 32,324 |
|
COLONY CREDIT REAL ESTATE, INC.
NOTES TO CONSOLIDATED FINANCIAL STATEMENTS (Continued)
(Unaudited)
The following tables present segment reporting for the six months ended June 30, 2019 and 2018 (dollars in thousands):
| | | | | | Loan | | CRE Debt Securities | | Net Leased Real Estate | | Other | | Corporate(1) | | Total |
| Six Months Ended June 30, 2019 | | | | | | | | | | | | | |
| Net interest income (expense) | | | $ | 43,475 |
| | $ | 10,754 |
| | $ | 3 |
| | $ | — |
| | $ | (8,347 | ) | | $ | 45,885 |
|
| Property and other income | | | 256 |
| | 141 |
| | 51,259 |
| | 76,855 |
| | 1 |
| | 128,512 |
|
| Management fee expense | | | — |
| | — |
| | — |
| | — |
| | (22,715 | ) | | (22,715 | ) |
| Property operating expense | | | — |
| | — |
| | (9,630 | ) | | (46,690 | ) | | — |
| | (56,320 | ) |
| Transaction, investment and servicing expense | | | (1,410 | ) | | — |
| | (106 | ) | | (611 | ) | | 547 |
| | (1,580 | ) |
| Interest expense on real estate | | | — |
| | — |
| | (18,738 | ) | | (8,767 | ) | | — |
| | (27,505 | ) |
| Depreciation and amortization | | | — |
| | — |
| | (26,290 | ) | | (30,629 | ) | | — |
| | (56,919 | ) |
| Provision for loan losses | | | (110,258 | ) | | — |
| | — |
| | — |
| | — |
| | (110,258 | ) |
| Impairment of operating real estate | | | — |
| | — |
| | — |
| | (10,124 | ) | | — |
| | (10,124 | ) |
| Administrative expense | | | (436 | ) | | (735 | ) | | (101 | ) | | (53 | ) | | (13,338 | ) | | (14,663 | ) |
| Unrealized gain on mortgage loans and obligations held in securitization trusts, net | | | — |
| | 5,820 |
| | — |
| | — |
| | 758 |
| | 6,578 |
|
| Realized gain on mortgage loans and obligations held in securitization trusts, net | | | — |
| | 48 |
| | — |
| | — |
| | — |
| | 48 |
|
| Other gain (loss), net | | | — |
| | (10,227 | ) | | 346 |
| | (1,260 | ) | | — |
| | (11,141 | ) |
| Income (loss) before equity in earnings of unconsolidated ventures and income taxes | | | (68,373 | ) | | 5,801 |
| | (3,257 | ) | | (21,279 | ) | | (43,094 | ) | | (130,202 | ) |
| Equity in earnings (losses) of unconsolidated ventures | | | 34,577 |
| | — |
| | — |
| | (710 | ) | | — |
| | 33,867 |
|
| Income tax benefit (expense) | | | (13 | ) | | — |
| | 2,784 |
| | (1,887 | ) | | (382 | ) | | 502 |
|
| Net income (loss) | | | $ | (33,809 | ) | | $ | 5,801 |
| | $ | (473 | ) | | $ | (23,876 | ) | | $ | (43,476 | ) | | $ | (95,833 | ) |
| | | | | | | | | | | | | | |
| Six Months Ended June 30, 2018 | | Loan | | CRE Debt Securities | | Net Leased Real Estate | | Other | | Corporate(1) | | Total | | | | | | | | | | | | |
| Net interest income | | $ | 52,241 |
| | $ | 10,702 |
| | $ | — |
| | $ | — |
| | $ | (2,503 | ) | | $ | 60,440 |
| |
| Net interest income (expense) | | | $ | 52,241 |
| | $ | 10,702 |
| | $ | — |
| | $ | — |
| | $ | (2,503 | ) | | $ | 60,440 |
|
| Property and other income | | 692 |
| | 13 |
| | 28,485 |
| | 39,712 |
| | 536 |
| | 69,438 |
| | 692 |
| | 13 |
| | 28,485 |
| | 39,712 |
| | 536 |
| | 69,438 |
|
| Management fee expense | | — |
| | — |
| | — |
| | — |
| | (19,791 | ) | | (19,791 | ) | | — |
| | — |
| | — |
| | — |
| | (19,791 | ) | | (19,791 | ) |
| Property operating expense | | — |
| | — |
| | (9,341 | ) | | (18,628 | ) | | — |
| | (27,969 | ) | | — |
| | — |
| | (9,341 | ) | | (18,628 | ) | | — |
| | (27,969 | ) |
| Transaction, investment and servicing expense | | (850 | ) | | — |
| | (17 | ) | | (167 | ) | | (33,547 | ) | | (34,581 | ) | | (850 | ) | | — |
| | (17 | ) | | (167 | ) | | (33,547 | ) | | (34,581 | ) |
| Interest expense on real estate | | — |
| | — |
| | (8,597 | ) | | (7,509 | ) | | — |
| | (16,106 | ) | | — |
| | — |
| | (8,597 | ) | | (7,509 | ) | | — |
| | (16,106 | ) |
| Depreciation and amortization | | — |
| | — |
| | (15,480 | ) | | (26,671 | ) | | — |
| | (42,151 | ) | | — |
| | — |
| | (15,480 | ) | | (26,671 | ) | | — |
| | (42,151 | ) |
| Administrative expense | | (301 | ) | | (401 | ) | | (10 | ) | | (18 | ) | | (9,382 | ) | | (10,112 | ) | | (301 | ) | | (401 | ) | | (10 | ) | | (18 | ) | | (9,382 | ) | | (10,112 | ) |
| Unrealized gain on mortgage loans and obligations held in securitization trusts, net | | — |
| | 2,489 |
| | — |
| | — |
| | 1,704 |
| | 4,193 |
| | — |
| | 2,489 |
| | — |
| | — |
| | 1,704 |
| | 4,193 |
|
| Realized loss on mortgage loans and obligations held in securitization trusts, net | | — |
| | (2,203 | ) | | — |
| | — |
| | — |
| | (2,203 | ) | | — |
| | (2,203 | ) | | — |
| | — |
| | — |
| | (2,203 | ) |
| Other gain on investments, net | | — |
| | — |
| | 33 |
| | 442 |
| | — |
| | 475 |
| |
| Other gain, net | | | — |
| | — |
| | 33 |
| | 442 |
| | — |
| | 475 |
|
| Income (loss) before equity in earnings of unconsolidated ventures and income taxes | | 51,782 |
| | 10,600 |
| | (4,927 | ) | | (12,839 | ) | | (62,983 | ) | | (18,367 | ) | | 51,782 |
| | 10,600 |
| | (4,927 | ) | | (12,839 | ) | | (62,983 | ) | | (18,367 | ) |
| Equity in earnings of unconsolidated ventures | | 23,226 |
| | — |
| | — |
| | 8,223 |
| | — |
| | 31,449 |
| | 23,226 |
| | — |
| | — |
| | 8,223 |
| | — |
| | 31,449 |
|
| Income tax benefit | | — |
| | — |
| | — |
| | 391 |
| | — |
| | 391 |
| | — |
| | — |
| | — |
| | 391 |
| | — |
| | 391 |
|
| Net income (loss) | | $ | 75,008 |
| | $ | 10,600 |
| | $ | (4,927 | ) | | $ | (4,225 | ) | | $ | (62,983 | ) | | $ | 13,473 |
| | $ | 75,008 |
| | $ | 10,600 |
| | $ | (4,927 | ) | | $ | (4,225 | ) | | $ | (62,983 | ) | | $ | 13,473 |
|
| |
| (1) | Includes income earned from the CRE securities purchased at a discount, recognized using the effective interest method had the transaction been recorded as an available for sale security, at amortized cost. During the six months ended June 30, 2019 and June 30, 2018, $0.8 million and $1.7 million, respectively, was attributable to discount accretion income and was eliminated in consolidation in the corporate segment. The corresponding interest expense is recorded in net interest income in the Corporate column. |
COLONY CREDIT REAL ESTATE, INC.
NOTES TO CONSOLIDATED FINANCIAL STATEMENTS (Continued)
(Unaudited)
|
| | | | | | | | | | | | | | | | | | | | |
| Six Months Ended June 30, 2017 | | Loan | | Net Leased Real Estate | | Other | | Corporate | | Total |
| Net interest income | | $ | 60,304 |
| | $ | — |
| | $ | — |
| | $ | — |
| | $ | 60,304 |
|
| Property and other income | | 1,653 |
| | 9,799 |
| | — |
| | — |
| | 11,452 |
|
| Property operating expense | | (1,216 | ) | | (2,252 | ) | | — |
| | — |
| | (3,468 | ) |
| Transaction, investment and servicing expense | | (1,208 | ) | | (202 | ) | | — |
| | — |
| | (1,410 | ) |
| Interest expense on real estate | | — |
| | (2,042 | ) | | — |
| | — |
| | (2,042 | ) |
| Depreciation and amortization | | (167 | ) | | (4,863 | ) | | — |
| | — |
| | (5,030 | ) |
| Administrative expense | | (369 | ) | | (9 | ) | | — |
| | (6,363 | ) | | (6,741 | ) |
| Other loss on investments, net | | (313 | ) | | — |
| | — |
| | — |
| | (313 | ) |
| Income (loss) before equity in earnings of unconsolidated ventures and income taxes | | 58,684 |
| | 431 |
| | — |
| | (6,363 | ) | | 52,752 |
|
| Equity in earnings of unconsolidated ventures | | 8,769 |
| | — |
| | 3,488 |
| | — |
| | 12,257 |
|
| Income tax expense | | (466 | ) | | — |
| | (196 | ) | | — |
| | (662 | ) |
| Net income (loss) | | $ | 66,987 |
| | $ | 431 |
| | $ | 3,292 |
| | $ | (6,363 | ) | | $ | 64,347 |
|
The following table presents total assets by segment as of June 30, 20182019 and December 31, 20172018 (dollars in thousands):
|
| | | | | | | | | | | | | | | | | | | | | | | | |
| Total Assets | | Loan(1) | | CRE Debt Securities | | Net Leased Real Estate | | Other(2) | | Corporate(3) | | Total |
| June 30, 2018 (Unaudited) | | $ | 2,666,201 |
| | $ | 3,518,212 |
| | $ | 738,151 |
| | $ | 1,226,562 |
| | $ | 4,815 |
| | $ | 8,153,941 |
|
| December 31, 2017 | | 1,573,714 |
| | — |
| | 241,271 |
| | 24,417 |
| | — |
| | 1,839,402 |
|
|
| | | | | | | | | | | | | | | | | | | | | | | | |
| Total Assets | | Loan(1) | | CRE Debt Securities | | Net Leased Real Estate | | Other(2) | | Corporate(3) | | Total |
| June 30, 2019 | | $ | 3,175,492 |
| | $ | 3,583,740 |
| | $ | 1,362,621 |
| | $ | 1,026,274 |
| | $ | (107,649 | ) | | $ | 9,040,478 |
|
| December 31, 2018 | | 2,840,267 |
| | 3,507,404 |
| | 1,354,051 |
| | 1,029,014 |
| | (70,006 | ) | | 8,660,730 |
|
_________________________________________
| |
| (1) | Includes investments in unconsolidated ventures totaling $179.3$665.4 million and$742.2 million as of June 30, 2019 and December 31, 2017.2018, respectively. |
| |
| (2) | Includes PE Investments totaling $241.5$53.9 million and $24.4$160.9 million as of June 30, 20182019 and December 31, 2017,2018, respectively. |
| |
| (3) | Includes cash, unallocated receivables, deferred costs and other assets, net and the elimination of the subordinate tranches of the securitization trusts in consolidation. |
COLONY CREDIT REAL ESTATE, INC.
NOTES TO CONSOLIDATED FINANCIAL STATEMENTS (Continued)
(Unaudited)
Geography
Geography is generally defined as the location in which the income producing assets reside or the location in which income generating services are performed. Long-lived assets comprise real estate, deferred leasing costs and intangible assets, all of which are located in the United States. Geography information on total income isincludes equity in earnings of unconsolidated ventures. Geography information on total income and long lived assets are presented as follows (dollars in thousands):
|
| | | | | | | | | | | | | | | | |
| | | Three Months Ended June 30, | | Six Months Ended June 30, |
| | | 2019 | | 2018 | | 2019 | | 2018 |
| Total income by geography: | | | | | | | | |
| United States | | $ | 146,214 |
| | $ | 131,966 |
| | $ | 295,039 |
| | $ | 238,232 |
|
| Europe | | 12,273 |
| | — |
| | 24,919 |
| | — |
|
| Other | | — |
| | 362 |
| | 35 |
| | 950 |
|
Total(1) | | $ | 158,487 |
| | $ | 132,328 |
| | $ | 319,993 |
| | $ | 239,182 |
|
|
| | | | | | | | | | | | | | | |
| | Three Months Ended June 30, | | Six Months Ended June 30, |
| | 2018 | | 2017 | | 2018 | | 2017 |
| Total income by geography: | | | | | | | |
| United States | $ | 131,966 |
| | $ | 48,372 |
| | $ | 238,232 |
| | $ | 93,962 |
|
| Other | 362 |
| | 903 |
| | 950 |
| | 1,802 |
|
Total(1) | $ | 132,328 |
| | $ | 49,275 |
| | $ | 239,182 |
| | $ | 95,764 |
|
|
| | | | | | | | |
| | | June 30, 2019 | | December 31, 2018 |
| Long-lived assets by geography: | | | | |
| United States | | $ | 1,711,582 |
| | $ | 1,764,247 |
|
| Europe | | 330,238 |
| | 329,511 |
|
Total(2) | | $ | 2,041,820 |
| | $ | 2,093,758 |
|
_________________________________________
(1) Includes interest income, interest income on mortgage loans held in securitization trusts, property and other income and equity in earnings of unconsolidated ventures.
| |
| (1) | Includes interest income, interest income on mortgage loans held in securitization trusts, property and other income and equity in earnings of unconsolidated ventures. |
| |
| (2) | Long-lived assets are comprised of real estate and real estate related intangible assets, and excludes financial instruments and assets held for sale. |
COLONY CREDIT REAL ESTATE, INC.
NOTES TO CONSOLIDATED FINANCIAL STATEMENTS (Continued)
(Unaudited)
The Company’s net income (loss) and weighted average shares outstanding for the three and six months ended June 30, 2019 and 2018 and 2017 consist of the following (dollars in thousands, except per share data):
| | | | Three Months Ended June 30, | | Six Months Ended June 30, | | Three Months Ended June 30, | | Six Months Ended June 30, |
| | 2018 | | 2017 | | 2018 | | 2017 | | 2019 | | 2018 | | 2019 | | 2018 |
| Net income | $ | 15,874 |
| | $ | 32,324 |
| | $ | 13,473 |
| | $ | 64,347 |
| |
| Net income (loss) | | | $ | (110,790 | ) | | $ | 15,874 |
| | $ | (95,833 | ) | | $ | 13,473 |
|
| Net (income) loss attributable to noncontrolling interests: | | | | | | | | | | | | | | | |
| Investment Entities | 470 |
| | (9,375 | ) | | (1,900 | ) | | (18,512 | ) | | 880 |
| | 470 |
| | 1,178 |
| | (1,900 | ) |
Operating Partnership(1) | (336 | ) | | (1,487 | ) | | (279 | ) | | (2,969 | ) | | 2,569 |
| | (336 | ) | | 2,222 |
| | (279 | ) |
| Net income attributable to Colony Credit Real Estate, Inc. common stockholders | $ | 16,008 |
| | $ | 21,462 |
| | $ | 11,294 |
| | $ | 42,866 |
| |
| Net income (loss) attributable to Colony Credit Real Estate, Inc. common stockholders | | | $ | (107,341 | ) | | $ | 16,008 |
| | $ | (92,433 | ) | | $ | 11,294 |
|
| | | | | | | | | | | | | | | | |
| Numerator: | | | | | | | | | | | | | | | |
| Net income allocated to participating securities (nonvested shares) | (436 | ) | | — |
| | (582 | ) | | — |
| | (627 | ) | | $ | (436 | ) | | $ | (1,093 | ) | | $ | (582 | ) |
| Net income attributable to common stockholders | $ | 15,572 |
| | $ | 21,462 |
| | $ | 10,712 |
| | $ | 42,866 |
| |
| Net income (loss) attributable to common stockholders | | | $ | (107,968 | ) | | $ | 15,572 |
| | $ | (93,526 | ) | | $ | 10,712 |
|
| | | | | | | | | | | | | | | | |
| Denominator: | | | | | | | | | | | | | | | |
Weighted average shares outstanding(2) | 127,887 |
| | 44,399 |
| | 113,355 |
| | 44,399 |
| |
Weighted average shares outstanding(1)(2) | | | 128,534 |
| | 127,887 |
| | 128,240 |
| | 113,355 |
|
| | | | | | | | | | | | | | | | |
Net income per common share - basic and diluted(3) | $ | 0.12 |
| | $ | 0.48 |
| | $ | 0.09 |
| | $ | 0.97 |
| |
Net income (loss) per common share - basic and diluted(2) | | | $ | (0.84 | ) | | $ | 0.12 |
| | $ | (0.73 | ) | | $ | 0.09 |
|
| |
| (1) | For earnings per share for the three and six months ended June 30, 2017, the Company allocated Company OP’s share of net income as if Company OP held 3,075,623 CLNC OP Units during the period for comparative purposes. The CLNC OP units were not issued until January 31, 2018. |
| |
(2) | For earnings per share, the Company assumes 44.4 million shares of Class B-3 common stock were outstanding prior to January 31, 2018 to reflect the standalone pre-merger financial information of the CLNY Investment Entities, the Company’s predecessor for accounting purposes. On February 1, 2019, the Class B-3 common stock automatically converted to Class A common stock. |
| |
(3)(2) | Excludes 3,075,623 CLNC OP Units, which are redeemable for cash, or at the Company’s option, shares of Class A common stock on a one-for-one basis, and therefore would not be dilutive. |
Dividends
On July 16, 2018,17, 2019, the Company’s board of directors declared a monthly cash dividend of $0.145 per share of Class A common stock and Class B-3 common stock for the month ended July 31, 2018.2019. The common stock dividend will be paid on August 10, 20189, 2019 to stockholders of record on July 31, 2018.2019. These distributions represent an annualized dividend of $1.74 per share of Class A common stock and Class B-3 common stock.
On August 1, 2018,2019, the Company’s board of directors declared a monthly cash dividend of $0.145 per share of Class A common stock and Class B-3 common stock for the month ended August 31, 2018.2019. The common stock dividend will be paid on September 10,
COLONY CREDIT REAL ESTATE, INC.
NOTES TO CONSOLIDATED FINANCIAL STATEMENTS (Continued)
(Unaudited)
2018 2019 to stockholders of record on August 31, 2018.2019. These distributions represent an annualized dividend of $1.74 per share of Class A common stock and Class B-3 common stock.
New Investments
Loans and Preferred Equity Held for Investment
In July 2018,Subsequent toJune 30, 2019, the Company entered intooriginated two senior loans with a total commitment of $114.5 million and a weighted average spread of 2.73% plus LIBOR.
The Company also originated one mezzanine loan with a total commitment of $31.9 million and an all-in interest rate of 13.0%.
The Company additionally upsized its commitment in a mezzanine loan held in a joint venture by $87.2 million to invest in a development project for land and a Grade A office building in Ireland.$189.0 million. The Company agreed to invest up to $69.9 million of the total $139.7 million commitment. The Company co-invested along with two affiliates of the Manager, with the Company owning 50.0% of the joint venture and the affiliate entities owning the remaining 50.0%. The joint venture will provide preferred equity debt of $66.7 million withmezzanine loan carries a fixed interest rate of 12.5% and a maturity date of 3.5 years from origination and common equity.12.9%.
Real Estate, netInvestments in Investing VIEs
In July 2018,Subsequent to June 30, 2019, the Company purchasedsold its retained investments in the subordinate tranches of one securitization trust for $33.4 million in total proceeds. The Company will recognize a $326.8gain of approximately $3.8 million Class A office campus located in Norway from an affiliate of the Company’s Manager. The office campus is 100% leased on a net basis to a multinational company with an A+ credit rating from S&P, with a remaining lease term of 12 years. The multinational company is backed by the Norwegian government. In connection with the purchase,sale during the third quarter of 2019.
PE Investments
Subsequent to June 30, 2019, the Company assumed senior mortgage financing from a private bond issuancereceived $19.2 million in proceeds related to the sale of $197.7 million. The bonds have a seven-year term remaining, and carry a fixed interest rate of 3.91%.its PE Investments.
Other
In August 2018, the Company foreclosed upon a hotel located in Dallas, Texas following the maturity default of the borrower on its $75.0 million senior mortgage loan.
Item 2. Management’s Discussion and Analysis of Financial Condition and Results of Operations
The following discussion should be read in conjunction with our unaudited consolidated financial statements and the accompanying notes thereto, which are included in Item 1 of this Quarterly Report, as well as the information contained in our Form 10-K for the year ended December 31, 2017,2018, which is accessible on the SEC’s website at www.sec.gov.
Introduction
We are a CREcommercial real estate (“CRE”) credit REITreal estate investment trust (“REIT”) focused on originating, acquiring, financing and managing a diversified portfolio consisting primarily of CRE senior mortgage loans, mezzanine loans, preferred equity,debt investments, CRE debt securities and net leased properties predominantly in the United States. CRE debt investments include senior mortgage loans, mezzanine loans, preferred equity, and participations in such loans and preferred equity interests. CRE debt securities primarily consist of commercial mortgage backedmortgage-backed securities (“CMBS”) (including “B-pieces” of a CMBS securitization pool) or CRE collateralized loan obligations (“CLOs”) (collateralized by pools of CRE debt investments). Net leased properties consist of CRE properties with long-term leases to tenants on a net-lease basis, where such tenants generally will be responsible for property operating expenses such as insurance, utilities, maintenance capital expenditures and real estate taxes.
We were organized in the state of Maryland on August 23, 2017. On September 15, 2017, Colony Capital (“CLNY”), a publicly traded REIT listed on the NYSENew York Stock Exchange (“NYSE”) under the ticker symbol “CLNY,” made an initial capital contribution of $1,000 to us. We intend to qualify as a REIT under the Internal Revenue Code of 1986, as amended, beginning with our taxable year endingended December 31, 2018. We conduct all of our activities and hold substantially all of our assets and liabilities through our operating subsidiary, Credit RE Operating Company, LLC (the “Operating Partnership” or “OP”). At June 30, 2018,2019, we owned 97.6%97.7% of the OP, as its sole managing member. The remaining 2.4%2.3% is owned primarily by our affiliate as noncontrolling interests.
We are externally managed by a subsidiary of Colony Capital, (formerly known as Colony NorthStar, Inc.), a NYSE-listed global real estate and investment management firm with nearly $23over $22 billion of total consolidated assets and over $27$43 billion of assets under management. As of June 30, 2018,2019,Colony Capital owned approximately 37%36% of our common equity on a fully diluted basis, evidencing a strong alignment of interests between Colony Capital and our other stockholders.
Combination
On January 31, 2018, the Combination among the CLNY Contributed Portfolio, NorthStar I, and NorthStar II was completed in an all-stock exchange.
The Combination created a prominent publicly traded real estateCRE credit REIT. Our senior executives include Kevin P. Traenkle as the Chief Executive Officer and Sujan S. PatelNeale W. Redington as the Chief Financial Officer. Our board of directors consists of seven directors, four of whom are independent.
Refer to Note 3, “Business Combinations”Combination” to the Consolidated Financial Statements included in Item 1 of this Quarterly Report for further information related to the Combination. Additional information about the Combination and the Combination Agreement are set forth in the joint proxy statement/prospectus on Form S-4 initially filed by us on November 21, 2017 as amended from time to time and the Current Report on Form 8-K filed by us on January 29, 2018.
Our Manager
We are externally managed by our manager, CLNC Manager, LLC (our “Manager”). Our Manager is a subsidiary of Colony Capital and benefits from the expertise and resources of Colony Capital. Colony Capital and its predecessors have a 26-year27-year track record and have made over $100 billion of investments. Colony Capital’s senior management team which is led by Executive Chairman Thomas J. Barrack, Jr. and Chief Executive Officer and President Richard B. Saltzman, has a long track record and extensive experience managing and investing in our target assets and other real estate-related investments through a variety of credit cycles and market conditions. Colony Capital’s global footprint and corresponding network provides its investment and asset management teams with proprietary market knowledge, exceptional sourcing capabilities and the local presence required to identify, execute and manage complex transactions.transactions, although Colony Capital has not been immune to national and local economic trends that are unrelated to its management of assets. Colony Capital’s successful history of external management includes its previous management of Colony Financial, Inc., an externally managed commercial mortgage REIT listed on the NYSE that focused on secondary loan acquisitions, high-yielding originations and real estate equity, its current management of NorthStar Realty Europe Corp., a publicly traded REIT listed on the NYSE and focused on European CRE with nearly $2over $1 billion in assets and its management of various non-traded REITs with in excess of $3 billion of equity commitments.(previously including NorthStar I and NorthStar II) and registered investment companies.
Colony Capital and its affiliates have more than 500 employees located domestically and internationally across 18 cities in ten countries, with its principal offices locatedis headquartered in Los Angeles, California, andwith over 400 employees in 20 locations in 13 countries, with key offices in New York, New York.Paris and London. Its operations are broad and diverse and include the management of real estate, both owned and on behalf of a diverse set of institutional and individual investors. Colony Capital has a highly experienced management team of diverse backgrounds with a demonstrated track record of success and, on average, 32 years of operational and management experience at asset managers and investment firms, private investment funds, investment banks and other financial service companies, which provides an enhanced perspective for managing our portfolio. Kevin P. Traenkle, a 25-year26-year veteran of Colony Capital, serves as our Chief Executive Officer; Sujan S. Patel, an 11-yearOfficer and President, and Neale W.
Redington, a 10-year veteran of Colony Capital, serves as our Chief Financial Officer; Neale W. Redington, a nine-year veteran of Colony
Capital, serves asOfficer and Treasurer. In addition, supporting our Chief Accounting Officer; andbusiness, David A. Palamé, an 11-yeara 12-year veteran of Colony Capital, serves as our General Counsel.Counsel and Secretary, and Frank V. Saracino, a four-year veteran of Colony Capital, serves as our Chief Accounting Officer.
We draw on Colony Capital’s substantial real estate investment platform and relationships to source, underwrite, structure and manage a robust pipeline of investment opportunities as well as to access debt and equity capital to fund our operations. We believe we are able to originate, acquire, finance and manage investments with attractive in-place cash flows and the potential for meaningful capital appreciation over time. We also benefit from Colony Capital’s portfolio management, finance and administration functions, which provide us with legal, compliance, investor relations, asset valuation, risk management and information technology services. Colony Capital also has a captive, fully-functional, separate asset management company that engages primarily in loan servicing for performing, sub-performing and non-performing commercial loans, including senior secured loans, revolving lines of credit, loan participations, subordinated loans, unsecured loans and mezzanine debt. Colony Capital’s asset management company is a commercial special servicer rated by both Standard & Poor’s and Fitch’s rating services.
Our operating segments include the loan portfolio, CRE debt securities, net leased real estate, other, and corporate. Our target assets, as more fully described below, are included in different operating segments. Senior mortgage loans, mezzanine loans and preferred equity are included in the loan portfolio segment. Refer to Note 16,18, “Segment Reporting,”Reporting” in Item 1. “Financial Statements” for further discussion of our operating segments.
Our Target Assets
Our investment strategy is to originate and selectively acquire our target assets, which consist of the following:
Senior Mortgage Loans. We focus on originating and selectively acquiring senior mortgage loans that are backed by CRE assets. These loans are secured by a first mortgage lien on a commercial property and provide mortgage financing to a commercial property developer or owner. The loans may vary in duration, bear interest at a fixed or floating rate and amortize, if at all, over varying periods, often with a balloon payment of principal at maturity. Senior mortgage loans include junior participations in our originated senior loans for which we have syndicated the senior participations to other investors and retained the junior participations for our portfolio. We believe these junior participations are more similar to the senior mortgage loans we originate than other loan types given their credit quality and risk profile.
Mezzanine Loans. We may originate or acquire mezzanine loans, which are structurally subordinate to senior loans, but senior to the borrower’s equity position. Mezzanine loans may be structured such that our return accrues and is added to the principal amount rather than paid on a current basis. We may also pursue equity participation opportunities in instances when the risk-reward characteristics of the investment warrant additional upside participation in the possible appreciation in value of the underlying assets securing the investment.
Preferred Equity. We may make investments that are subordinate to senior and mezzanine loans, but senior to the common equity in the mortgage borrower. Preferred equity investments may be structured such that our return accrues and is added to the principal amount rather than paid on a current basis. We also may pursue equity participation opportunities in preferred equity investments, similar to such participations in mezzanine loans.
CRE Debt Securities. We may make investments that consist of bonds comprising certain tranches of CRE securitization pools, such as CMBS (including “B-pieces” of a CMBS securitization pool) or CLOs (collateralized by pools of CRE debt instruments). These bonds may be investment grade or below investment grade and are collateralized by CRE debt, typically secured by senior mortgage loans and may be fixed rate or floating rate securities. Due to their first-loss position, CMBS B-pieces are typically offered at a discount to par. These investments typically carry a 10-year weighted average life due to prepayment restrictions. We generally intend to hold these investments through maturity, but may, from time to time, opportunistically sell positions should liquidity become available or be required.
Net Leased Real Estate. We may also invest directly in well-located commercial real estate with long-term leases to tenants on a net lease basis, where such tenants generally will be responsible for property operating expenses such as insurance, utilities, maintenance capital expenditures and real estate taxes. In addition, tenants of our properties typically pay rent increases based on: (1) increases in the consumer price index (typically subject to ceilings), (2) fixed increases, or (3) additional rent calculated as a percentage of the tenants’ gross sales above a specified level. We believe that a portfolio of properties under long-term, net lease agreements generally produces a more predictable income stream than many other types of real estate portfolios, while continuing to offer the potential for growth in rental income.
| |
| • | Senior Mortgage Loans. We focus on originating and selectively acquiring senior mortgage loans that are backed by CRE assets. These loans are secured by a first mortgage lien on a commercial property and provide mortgage financing to a commercial property developer or owner. The loans may vary in duration, bear interest at a fixed or floating rate and amortize, if at all, over varying periods, often with a balloon payment of principal at maturity. Senior mortgage loans include junior participations in our originated senior loans for which we have syndicated the senior participations to other investors and retained the junior participations for our portfolio. We believe these junior participations are more similar to the senior mortgage loans we originate than other loan types given their credit quality and risk profile. |
| |
| • | Mezzanine Loans. We may originate or acquire mezzanine loans, which are structurally subordinate to senior loans, but senior to the borrower’s equity position. Mezzanine loans may be structured such that our return accrues and is added to the principal amount rather than paid on a current basis. We may also pursue equity participation opportunities in instances when the risk-reward characteristics of the investment warrant additional upside participation in the possible appreciation in value of the underlying assets securing the investment. |
| |
| • | Preferred Equity. We may make investments that are subordinate to senior and mezzanine loans, but senior to the common equity in the mortgage borrower. Preferred equity investments may be structured such that our return accrues and is added to the principal amount rather than paid on a current basis. We also may pursue equity participation opportunities in preferred equity investments, similar to such participations in mezzanine loans. |
| |
| • | CRE Debt Securities. We may make investments that consist of bonds comprising certain tranches of CRE securitization pools, such as CMBS (including “B-pieces” of a CMBS securitization pool) or CLOs (collateralized by pools of CRE debt instruments). These bonds may be investment grade or below investment grade and are collateralized by CRE debt, typically secured by senior mortgage loans and may be fixed rate or floating rate securities. Due to their first-loss position, CMBS B-pieces are typically offered at a discount to par. These investments typically carry a 10-year weighted average life due to prepayment restrictions. We generally intend to hold these investments through maturity, but may, from time to time, opportunistically sell positions should liquidity become available or be required. |
| |
| • | Net Leased Real Estate. We may also invest directly in well-located commercial real estate with long-term leases to tenants on a net lease basis, where such tenants generally will be responsible for property operating expenses such as insurance, utilities, maintenance capital expenditures and real estate taxes. In addition, tenants of our properties typically pay rent increases based on: (1) increases in the consumer price index (typically subject to ceilings), (2) fixed increases, or (3) additional rent calculated as a percentage of the tenants’ gross sales above a specified level. We believe that a portfolio of properties under long-term, net lease agreements generally produces a more predictable income stream than many other types of real estate portfolios, while continuing to offer the potential for growth in rental income. |
The allocation of our capital among our target assets will depend on prevailing market conditions at the time we invest and may change over time in response to different prevailing market conditions. In addition, in the future, we may invest in assets other than our target assets or change our target assets. With respect to all of our investments, we invest so as to maintain our qualification
as a REIT for U.S. federal income tax purposes and our exclusion or exemption from regulation under the Investment Company Act of 1940, as amended (the “Investment Company Act”).
We believe that events in the financial markets from time to time have created and will create significant dislocation between price and intrinsic value in certain asset classes as well as a supply and demand imbalance of available credit to finance these assets. We believe that the Company is well positioned to capitalize on such opportunities while remaining flexible to adapt our strategy as market conditions change, including with respect to existing investments that may be directly or indirectly impacted by such events. We believe that our Manager’s in-depth understanding of CRE and real estate-related investments, and in-house underwriting, asset management and resolution capabilities, provides the Company and management with a sophisticated full- service value-add platform to regularly evaluate our investments and determine primary, secondary or alternative disposition strategies. This includes intermediate servicing and complex and creative negotiating, restructuring of non-performing investments, foreclosure considerations, intense management or development of owned real estate, in each case to reposition and achieve optimal value realization for the Company and its stockholders. Depending on the nature of the underlying investment, we may pursue repositioning strategies through judicious capital investment in order to extract maximum value from the investment or recognize unanticipated losses to reinvest resulting liquidity in higher-yielding performing investments.
Highlights
SignificantDuring the three months ended June 30, 2019 and through August 7, 2019, significant developments affecting our business and results of operations forincluded the three months endedfollowing:
| |
| • | Originated eight senior mortgage loans with a total commitment of $749.7 million; |
Completed foreclosure proceedings under a mezzanine loan, taking possession of a retail property in June 30, 2018 and through August 8, 2018 include:2019;
Completed name change to Colony Credit Real Estate, Inc. effective June 25, 2018;
Added toReceived $63.8 million in cash proceeds in connection with the U.S. Small-cap Russell 2000 on June 25, 2018;ongoing sales of our PE Investments, of which we have received $120.6 million of the total $141.8 million under binding sales contracts;
Declared and paid a monthly dividend of $0.145 per share of Class A common stock and Class B-3 common stock forfrom April May andthrough June, representing an annualized dividend of $1.74 per share;
Deployed $478.3Recorded $110.3 million of capital duringprovision for loan losses on seven loans collateralized by three properties;
Recognized our proportionate share of an impairment loss on loan held in a joint venture totaling $8.8 million;
Impairment of our operating real estate due to a reduction in the second quarterestimated holding period of 2018;
Increased master repurchase facility by $250.0 million from $1.7 billion to $2.0 billion during the second quartercertain properties of 2018;$10.1 million;
| |
| • | Classified five operating real estate properties, including our student housing portfolio, one hotel, and one retail asset totaling a combined $147.7 million as held for sale; |
| |
| • | Subsequent to June 30, 2019, declared a monthly cash dividend of $0.145 per share of Class A common stock for July and August, and; |
Subsequent to June 30, 2018, purchased a $326.8 million Class A office campus located2019, sold our retained investment in Norway from an affiliatethe subordinate tranches of our Manager and also assumed senior mortgage financing of $197.7one securitization trust for $33.4 million in the formtotal proceeds; we expect to recognize a gain of a private bond issuance. The office campus is 100% leased on a net basis to a multinational company an A+ credit rating, with a remaining lease term of 12 years. The multinational company is backed by the Norwegian government;
Also subsequent to June 30, 2018, we entered into a joint venture to investapproximately $3.8 million in a development project for land and a Grade A office building in Ireland with two affiliates of our Manager to invest up to $69.9 million of the total $139.7 million commitment. We own 50.0% of the joint venture,connection with the affiliate entities owning the remaining 50.0%. The joint venture will provide preferred equity debt of $66.7 million with a fixed interest rate of 12.5% and a maturity date of 3.5 years from origination and common equity; andsale.
Additionally, subsequent to June 30, 2018, declared a monthly cash dividend of $0.145 per share of Class A and Class B-3 common stock for July and August.
65
Results of Operations
As a result of the Combination, comparisons of our period to period financial information as set forth herein may not be meaningful. The historical financial information included herein as of any date, or for any periods, on or prior to January 31, 2018, represents the pre-merger financial information of the CLNY Investment Entities, our accounting predecessor, on a stand-alone basis. The CLNY Investment Entities represent only a portion of our business following the Combination and therefore doesdo not represent the results of operations we would have had for any period prior to the Combination. As of February 1, 2018, our results of operations reflect our operation following the Combination of our accounting predecessor, the CLNY Investment Entities, and NorthStar I and NorthStar II. The results of operations of NorthStar I and NorthStar II are incorporated into ours effective from February 1, 2018.
Comparison of the Three Months Ended June 30, 2019 and 2018 to 2017 (Dollars in Thousands):
| | | | Three Months Ended June 30, | | Increase (Decrease) | Three Months Ended June 30, | | Increase (Decrease) |
| | 2018 | | 2017 | | Amount | | % | 2019 | | 2018 | | Amount | | % |
| Net interest income | | | | | | | | | | | | | | |
| Interest income | $ | 36,795 |
| | $ | 36,904 |
| | $ | (109 | ) | | (0.3 | )% | $ | 42,073 |
| | $ | 36,795 |
| | $ | 5,278 |
| | 14.3 | % |
| Interest expense | (9,703 | ) | | (5,647 | ) | | 4,056 |
| | 71.8 | % | (21,046 | ) | | (9,703 | ) | | (11,343 | ) | | (116.9 | )% |
| Interest income on mortgage loans held in securitization trusts | 39,496 |
| | — |
| | 39,496 |
| | 100.0 | % | 38,656 |
| | 39,496 |
| | (840 | ) | | (2.1 | )% |
| Interest expense on mortgage obligations issued by securitization trusts | (36,459 | ) | | — |
| | (36,459 | ) | | 100.0 | % | (35,756 | ) | | (36,459 | ) | | 703 |
| | 1.9 | % |
| Net interest income | 30,129 |
| | 31,257 |
| | (1,128 | ) | | (3.6 | )% | 23,927 |
| | 30,129 |
| | (6,202 | ) | | (20.6 | )% |
| | | | | | | | | | | | | | | |
| Property and other income | | | | | | | | | | | | | | |
| Property operating income | 39,477 |
| | 5,762 |
| | 33,715 |
| | 585.1 | % | 64,767 |
| | 39,477 |
| | 25,290 |
| | 64.1 | % |
| Other income | 899 |
| | 390 |
| | 509 |
| | 130.5 | % | 434 |
| | 899 |
| | (465 | ) | | (51.7 | )% |
| Total property and other income | 40,376 |
| | 6,152 |
| | 34,224 |
| | 556.3 | % | 65,201 |
| | 40,376 |
| | 24,825 |
| | 61.5 | % |
| | | | | | | | | | | | | | | |
| Expenses | | | | | | | | | | | | | | |
| Management fee expense | 11,791 |
| | — |
| | 11,791 |
| | 100.0 | % | 11,357 |
| | 11,791 |
| | (434 | ) | | (3.7 | )% |
| Property operating expense | 16,256 |
| | 1,857 |
| | 14,399 |
| | 775.4 | % | 28,140 |
| | 16,256 |
| | 11,884 |
| | 73.1 | % |
| Transaction, investment and servicing expense | 3,497 |
| | 709 |
| | 2,788 |
| | 393.2 | % | 1,051 |
| | 3,497 |
| | (2,446 | ) | | (69.9 | )% |
| Interest expense on real estate | 9,850 |
| | 1,066 |
| | 8,784 |
| | 824.0 | % | 13,898 |
| | 9,850 |
| | 4,048 |
| | 41.1 | % |
| Depreciation and amortization | 23,359 |
| | 2,745 |
| | 20,614 |
| | 751.0 | % | 29,257 |
| | 23,359 |
| | 5,898 |
| | 25.2 | % |
| Administrative expense (including $1,798 and $0 of equity-based compensation expense) | 6,884 |
| | 3,729 |
| | 3,155 |
| | 84.6 | % | |
| Provision for loan losses | | 110,258 |
| | — |
| | 110,258 |
| | 100.0 | % |
| Impairment of operating real estate | | 10,124 |
| | — |
| | 10,124 |
| | 100.0 | % |
| Administrative expense (including $2,713 and $1,798 of equity-based compensation expense) | | 8,010 |
| | 6,884 |
| | 1,126 |
| | 16.4 | % |
| Total expenses | 71,637 |
| | 10,106 |
| | 61,531 |
| | 608.9 | % | 212,095 |
| | 71,637 |
| | 140,458 |
| | 196.1 | % |
| | | | | | | | | | | | | | | |
| Other income (loss) | | | | | | | | | | | | | | |
| Unrealized gain on mortgage loans and obligations held in securitization trusts, net | 3,696 |
| | — |
| | 3,696 |
| | 100.0 | % | 5,549 |
| | 3,696 |
| | 1,853 |
| | 50.1 | % |
| Realized loss on mortgage loans and obligations held in securitization trusts, net | (2,203 | ) | | — |
| | (2,203 | ) | | (100.0 | )% | — |
| | (2,203 | ) | | 2,203 |
| | 100.0 | % |
| Other gain (loss) on investments, net | 10 |
| | (313 | ) | | 323 |
| | 103.2 | % | |
| Income before equity in earnings of unconsolidated ventures and income taxes | 371 |
| | 26,990 |
| | (26,619 | ) | | (98.6 | )% | |
| Other gain (loss), net | | (6,062 | ) | | 10 |
| | (6,072 | ) | | (60,720.0 | )% |
| Income (loss) before equity in earnings of unconsolidated ventures and income taxes | | (123,480 | ) | | 371 |
| | (123,851 | ) | | (33,383.0 | )% |
| Equity in earnings of unconsolidated ventures | 15,661 |
| | 6,219 |
| | 9,442 |
| | 151.8 | % | 12,557 |
| | 15,661 |
| | (3,104 | ) | | (19.8 | )% |
| Income tax expense | (158 | ) | | (885 | ) | | 727 |
| | 82.1 | % | |
| Net income | $ | 15,874 |
| | $ | 32,324 |
| | $ | (16,450 | ) | | (50.9 | )% | |
| Income tax benefit (expense) | | 133 |
| | (158 | ) | | 291 |
| | 184.2 | % |
| Net income (loss) | | $ | (110,790 | ) | | $ | 15,874 |
| | $ | (126,664 | ) | | (797.9 | )% |
Net Interest Income
Interest income
Interest income decreasedincreased by $0.1$5.3 million to $36.8$42.1 million for the three months ended June 30, 2018,2019, as compared to the three months ended June 30, 2017,2018. This increase was primarily due to a $21.3 million increase from originations, acquisitions and refinancings of loans and CMBS in 2018 and 2019. This was partially offset by a decrease of $24.0$9.6 million in the CLNY Investment Entities primarily driven by the deconsolidation of certain investment entities andrelated to the repayment of loan investments, partially offset by an increasea decrease of $23.9$5.4 million related to the acquisitionforeclosure of NorthStar Ieight loan investments and NorthStar II.a decrease of $1.0 million due to placing the four NY hospitality loans on non-accrual status.
Interest expense
Interest expense increased by $4.1$11.3 million to $9.7$21.0 million for the three months ended June 30, 2018,2019, as compared to the three months ended June 30, 2017,2018. The increase was primarily due to a $7.8$11.2 million increase asrelated to borrowings on our master repurchase and CMBS credit facilities primarily associated with the originations and acquisitions of loans and CMBS in 2018 and 2019, a result of$2.8 million increase related to borrowings on the acquisition of NorthStar Irevolving credit facility and NorthStar II,a $0.7 million increase related to deferred financing costs on our master repurchase facilities. This was partially offset by a $3.7decrease of $3.8 million decrease in CLNY Investment Entities driven byrelated to paydowns of borrowings on our master repurchase facilities associated with the deconsolidationrepayment and foreclosure of certain investment entities.
Interest incomeloan investments, as well as paydowns on mortgage loans and obligations held inour securitization trusts, net
Interest income on mortgage loans and obligations held in securitization trusts, net of $3.0 million during the three months ended June 30, 2018 is attributable to our investment in the subordinate tranches of the consolidated securitization trusts acquired as a result of the Combination.bonds payable.
Property and other income
Property operating income
Property operating income increased by $33.7$25.3 million to $39.5$64.8 million for the three months ended June 30, 2018,2019, as compared to the three months ended June 30, 2017,2018. The increase was primarily as a result ofdue to $19.9 million related to the operating31 real estate properties acquired through legal foreclosure processes in connection with the acquisitionthird quarter of NorthStar I2018 and NorthStar II.during 2019, a $9.9 million increase related to two net lease portfolios acquired in the third quarter of 2018. This was partially offset by a $4.2 million decrease related to the October 2018 sale of a multi-tenant office portfolio.
Expenses
Management fee expense
Management fee expense represents fees paiddecreased by $0.4 million to our Manager in accordance with the Management Agreement. During$11.4 million for the three months ended June 30, 2018, management fee expense was $11.8 million. We entered into2019, as compared to the three months ended June 30, 2018. The decrease is due to the reduction in stockholders’ equity (as defined in the Management Agreement on January 31, 2018 and therefore did not incur any management fee expenses priorAgreement) as of June 30, 2019 compared to this date.June 30, 2018.
Property operating expense
Property operating expense increased by $14.4$11.9 million to $16.3$28.1 million for the three months ended June 30, 2018,2019, as compared to the three months ended June 30, 2017,2018. The increase was primarily as a result ofdue to $13.8 million related to the operating31 real estate properties acquired through foreclosure in connection with the acquisitionthird quarter of NorthStar I2018 and NorthStar II.during 2019. This was partially offset by a $1.4 million decrease related to the October 2018 sale of a multi-tenant office portfolio.
Transaction, investment and servicing expense
Transaction, investment and servicing expense represents costs such as professional fees associated with new investments and transactions. Transaction, investment and servicing expense increasedThese expenses decreased by $2.8$2.4 million to $3.5$1.1 million for the three months ended June 30, 2018,2019, as compared to the three months ended June 30, 2017,2018, primarily as a result of $2.3 million oflower transaction costs associated with the Combination.Combination of $1.9 million and tax refunds received of $0.9 million, partially offset by higher legal costs associated with the 28 real estate properties acquired through legal foreclosure process in January 2019.
Interest expense on real estate
Interest expense on real estate increased by $8.8$4.0 million to $9.9$13.9 million for the three months ended June 30, 2018,2019, as compared to the three months ended June 30, 2017,2018. The increase was primarily as a result of the operating real estate properties acquired in connection withdue to $4.2 million for the acquisition of NorthStar Itwo net lease portfolios acquired in 2018 and NorthStar II.$0.3 million for the financing obtained in March 2019 for a hotel foreclosed on in 2018. This was partially offset by $0.6 million associated with the October 2018 sale of the multi-tenant office portfolio.
Depreciation and amortization
Depreciation and amortization expense increased by $20.6$5.9 million to $23.4$29.3 million for the three months ended June 30, 2018,2019, as compared to the three months ended June 30, 2017,2018. This was primarily due to a $6.6 million increase related to 31 real estate properties acquired through foreclosure in the third quarter of 2018 and during 2019 and a $4.7 million increase related to two net lease portfolios acquired in the third quarter of 2018. This was partially offset by a $2.9 million decrease related to the October 2018 sale of a multi-tenant office portfolio and a $2.7 million decrease in amortization expense primarily as a result of short-term, in-place lease value intangible assets on our multifamily properties that were fully amortized in 2018.
Provision for loan losses
Provision for loan losses of $110.3 million was recorded for the three months ended June 30, 2019, which is attributable to our four NY hospitality loans of $104.3 million, one loan collateralized by a retail property of $3.9 million and two loans collateralized by retail properties of $2.0 million.
Impairment of operating real estate
Impairment of operating real estate of $10.1 million for the three months ended June 30, 2019 is attributable to 11 properties acquired in connection withour other segment, resulting from a reduction in the acquisitionestimated holding period of NorthStar Ithe properties and NorthStar II.exposure to the retail market.
Administrative expense
Administrative expense increased by $3.2$1.1 million to $6.9$8.0 million for the three months endedJune 30, 2018,2019, as compared to the three months ended June 30, 2017,2018. This was primarily due to additional reimbursable expenses allocateda $0.6 million increase in equity-based compensation expense due to us by our Manager as a result ofawards granted in March 2018 and March 2019 under the acquisition of NorthStar I and NorthStar II in the Combination. See Note 11 to the consolidated financial statements, “Related Party Arrangements,” for further information on reimbursement of expenses.
2018 Plan.
Other income (loss)
Unrealized gain on mortgage loans and obligations held in securitization trusts, net
During the three months ended June 30, 2019 and 2018, we recorded an unrealized gain of $5.5 million and $3.7 million, respectively, on mortgage loans and obligations held in securitization trusts, net of $3.7 million which represents the change in fair value of the assets and liabilities of the securitization trusts consolidated as a result of our investment in the subordinate tranches of these securitization trusts acquired in the Combination.
Realized loss on mortgage loans and obligations held in securitization trusts, net
During the three months ended June 30, 2018 we recorded a $2.2 million realized loss on mortgage loans and obligations held in securitization trusts, net of $2.2 million which represents a loss incurred from lower than expected future cash flows on a subordinate tranche of a securitization trust.
Other loss, net
Other loss, net increased by $6.1 million for the three months ended June 30, 2019, as compared to the three months ended June 30, 2018, as a result of $6.1 million unrealized loss on non-designated interest rate swap contracts entered into during 2018.
Equity in earnings of unconsolidated ventures
Equity in earnings of unconsolidated ventures increaseddecreased by $9.4$3.1 million to $15.7$12.6 million for the three months ended June 30, 2018,2019, as compared to the three months ended June 30, 2017,2018. This was primarily drivendue to an impairment of $8.8 million on 1 senior loan secured by a regional mall, a decrease of $3.0 million related to our PE Investments in which we recorded no equity in earnings during the three months ended June 30, 2019 and a $1.0 million decrease associated with the repayment of five of our equity method investments. This was partially offset by an increase of $7.3 million related to investments in unconsolidated joint ventures acquired asentered into in 2018, an increase of $1.3 million on one of our equity method investments in which the underlying investment was not operational until March 2018 and an increase of $1.2 million related to our increased commitment in June 2018 of one of our joint ventures which holds a result of the acquisition of NorthStar Imezzanine loan and NorthStar II.a preferred equity investment.
Income tax benefit (expense)
Income tax expense
For decreased by $0.3 million to an income tax benefit of $0.1 million for the three months ended June 30, 2019, as compared to the three months ended June 30, 2018, and 2017, we recordedprimarily due to an increased benefit associated with our PE investments, offset by an income tax expenseprovision on the two hotels acquired through the legal foreclosure process in the third quarter of $0.2 million and $0.9 million, respectively, related to our PE Investments.2018.
Comparison of the Six Months Ended June 30, 2019 and 2018 to 2017 (Dollars in Thousands):
| | | | Six Months Ended June 30, | | Increase (Decrease) | Six Months Ended June 30, | | Increase (Decrease) |
| | 2018 | | 2017 | | Amount | | % | 2019 | | 2018 | | Amount | | % |
| Net interest income | | | | | | | | | | | | | | |
| Interest income | $ | 72,934 |
| | $ | 72,055 |
| | $ | 879 |
| | 1.2 | % | $ | 80,482 |
| | $ | 72,934 |
| | $ | 7,548 |
| | 10.3 | % |
| Interest expense | (17,118 | ) | | (11,751 | ) | | 5,367 |
| | 45.7 | % | (40,338 | ) | | (17,118 | ) | | (23,220 | ) | | (135.6 | )% |
| Interest income on mortgage loans held in securitization trusts | 65,361 |
| | — |
| | 65,361 |
| | 100.0 | % | 77,132 |
| | 65,361 |
| | 11,771 |
| | 18.0 | % |
| Interest expense on mortgage obligations issued by securitization trusts | (60,737 | ) | | — |
| | (60,737 | ) | | 100.0 | % | (71,391 | ) | | (60,737 | ) | | (10,654 | ) | | (17.5 | )% |
| Net interest income | 60,440 |
| | 60,304 |
| | 136 |
| | 0.2 | % | 45,885 |
| | 60,440 |
| | (14,555 | ) | | (24.1 | )% |
| | | | | | | | | | | | | | | |
| Property and other income | | | | | | | | | | | | | | |
| Property operating income | 68,022 |
| | 10,901 |
| | 57,121 |
| | 524.0 | % | 127,901 |
| | 68,022 |
| | 59,879 |
| | 88.0 | % |
| Other income | 1,416 |
| | 551 |
| | 865 |
| | 157.0 | % | 611 |
| | 1,416 |
| | (805 | ) | | (56.9 | )% |
| Total property and other income | 69,438 |
| | 11,452 |
| | 57,986 |
| | 506.3 | % | 128,512 |
| | 69,438 |
| | 59,074 |
| | 85.1 | % |
| | | | | | | | | | | | | | | |
| Expenses | | | | | | | | | | | | | | |
| Management fee expense | 19,791 |
| | — |
| | 19,791 |
| | 100.0 | % | 22,715 |
| | 19,791 |
| | 2,924 |
| | 14.8 | % |
| Property operating expense | 27,969 |
| | 3,468 |
| | 24,501 |
| | 706.5 | % | 56,320 |
| | 27,969 |
| | 28,351 |
| | 101.4 | % |
| Transaction, investment and servicing expense | 34,581 |
| | 1,410 |
| | 33,171 |
| | 2,352.6 | % | 1,580 |
| | 34,581 |
| | (33,001 | ) | | (95.4 | )% |
| Interest expense on real estate | 16,106 |
| | 2,042 |
| | 14,064 |
| | 688.7 | % | 27,505 |
| | 16,106 |
| | 11,399 |
| | 70.8 | % |
| Depreciation and amortization | 42,151 |
| | 5,030 |
| | 37,121 |
| | 738.0 | % | 56,919 |
| | 42,151 |
| | 14,768 |
| | 35.0 | % |
| Administrative expense (including $2,083 and $0 of equity-based compensation expense) | 10,112 |
| | 6,741 |
| | 3,371 |
| | 50.0 | % | |
| Provision for loan losses | | 110,258 |
| | — |
| | 110,258 |
| | 100.0 | % |
| Impairment of operating real estate | | 10,124 |
| | — |
| | 10,124 |
| | 100.0 | % |
| Administrative expense (including $4,556 and $2,083 of equity-based compensation expense) | | 14,663 |
| | 10,112 |
| | 4,551 |
| | 45.0 | % |
| Total expenses | 150,710 |
| | 18,691 |
| | 132,019 |
| | 706.3 | % | 300,084 |
| | 150,710 |
| | 149,374 |
| | 99.1 | % |
| | | | | | | | | | | | | | | |
| Other income (loss) | | | | | | | | | | | | | | |
| Unrealized gain on mortgage loans and obligations held in securitization trusts, net | 4,193 |
| | — |
| | 4,193 |
| | 100.0 | % | 6,578 |
| | 4,193 |
| | 2,385 |
| | 56.9 | % |
| Realized loss on mortgage loans and obligations held in securitization trusts, net | (2,203 | ) | | — |
| | (2,203 | ) | | (100.0 | )% | |
| Other gain (loss) on investments, net | 475 |
| | (313 | ) | | 788 |
| | 251.8 | % | |
| Income (loss) before equity in earnings (losses) of unconsolidated ventures and income taxes | (18,367 | ) | | 52,752 |
| | (71,119 | ) | | (134.8 | )% | |
| Realized gain (loss) on mortgage loans and obligations held in securitization trusts, net | | 48 |
| | (2,203 | ) | | 2,251 |
| | 102.2 | % |
| Other gain (loss), net | | (11,141 | ) | | 475 |
| | (11,616 | ) | | (2,445.5 | )% |
| Loss before equity in earnings of unconsolidated ventures and income taxes | | (130,202 | ) | | (18,367 | ) | | (111,835 | ) | | (608.9 | )% |
| Equity in earnings of unconsolidated ventures | 31,449 |
| | 12,257 |
| | 19,192 |
| | 156.6 | % | 33,867 |
| | 31,449 |
| | 2,418 |
| | 7.7 | % |
| Income tax benefit (expense) | 391 |
| | (662 | ) | | 1,053 |
| | 159.1 | % | |
| Net income | $ | 13,473 |
| | $ | 64,347 |
| | $ | (50,874 | ) | | (79.1 | )% | |
| Income tax benefit | | 502 |
| | 391 |
| | 111 |
| | 28.4 | % |
| Net income (loss) | | $ | (95,833 | ) | | $ | 13,473 |
| | $ | (109,306 | ) | | (811.3 | )% |
Net Interest Income
Interest income
Interest income increased by $0.9$7.5 million to $72.9$80.5 million for the six months ended June 30, 2018,2019, as compared to the six months ended June 30, 2017,2018. This increase was primarily due to ana $41.3 million increase from originations, acquisitions and refinancings of $43.0loans and CMBS in 2018 and 2019 and a $6.8 million increase due to recognizing a full six months of interest income in 2019 on loans, preferred equity and CMBS acquired in the Combination on February 1, 2018. This was offset by a decrease of $23.8 million related to the acquisitionrepayment of NorthStar I and NorthStar II, partially offset byloan investments which includes a $42.1$4.0 million one-time fee received during the first quarter 2018 in connection with the repayment of a preferred equity investment, a decrease of $7.6 million related to the foreclosure of eight loan investments, a decrease of $6.6 million in the CLNY Investment Entities driven byas a result of the deconsolidation of certain investment entities and repaymenta decrease of loan investments.$3.2 million due to placing the four NY hospitality loans on non-accrual status.
Interest expense
Interest expense increased by $5.4$23.2 million to $17.1$40.3 million for the six months ended June 30, 2018,2019, as compared to the six months ended June 30, 2017,2018. The increase was primarily due to a $12.9$18.6 million increase asrelated to borrowings on our master repurchase and CMBS credit facilities primarily associated with the originations and acquisitions of loans and CMBS in 2018 and 2019, a result$6.8 million increase related to borrowings on the revolving credit facility entered into on February 1, 2018, a $3.0 million increase due to recognizing a full six months of interest expense in 2019 on loans and CMBS acquired in the acquisition of NorthStar ICombination and NorthStar II,a $2.1 million increase related to deferred financing costs on our master repurchase facilities. This was partially offset by a $7.5decrease of $6.2 million decrease in CLNY Investment Entities driven byrelated to paydowns of borrowings on our master repurchase facilities associated with the deconsolidationrepayment and foreclosure of certain investment entities.loan investments, as well as repayment on our securitization bonds payable.
Interest income on mortgage loans and obligations held in securitization trusts, net
Interest income on mortgage loans and obligations held in securitization trusts, net of $4.6increased by $1.1 million for the six months ended June 30, 2019, as compared to the six months ended June 30, 2018, is attributableprimarily due to recognizing a full six months of net interest income in 2019 on our investment in the subordinate tranches of the consolidated securitization trusts acquired as a result ofin the Combination.
Property and other income
Property operating income
Property operating income increased by $57.1$59.9 million to $68.0$127.9 million for the six months ended June 30, 2018,2019, as compared to the six months ended June 30, 2017,2018. The increase was primarily asdue to a result$37.6 million increase related to the 31 real estate properties acquired through foreclosure in the third quarter of 2018 and during 2019, a $19.8 million increase related to two net lease portfolios acquired in the third quarter of 2018 and a $10.6 million increase due to recognizing a full six months of property operating income in 2019 on operating real estate properties acquired as in connection with the acquisitionCombination. This was partially offset by a $7.1 million decrease related to the October 2018 sale of NorthStar I and NorthStar II.a multi-tenant office portfolio.
Expenses
Management fee expense
Management fee expense represents fees paidincreased by $2.9 million to our Manager in accordance with the Management Agreement. During$22.7 million for the six months ended June 30, 2018, management fee expense was $19.8 million. We entered into2019, as compared to the six months ended June 30, 2018. The increase is due to the execution of the Management Agreement on January 31, 2018 and therefore did not incur anyno management fee expensesexpense was incurred prior to this date.
Property operating expense
Property operating expense increased by $24.5$28.4 million to $28.0$56.3 million for the six months ended June 30, 2018,2019, as compared to the six months ended June 30, 2017,2018. The increase was primarily due to $27.2 million related to the 31 real estate properties acquired through foreclosure in the third quarter of 2018 and during 2019 and a $3.7 million increase due to recognizing a full six months of property operating expense in 2019 on operating real estate properties acquired as a result of the operating real estate properties acquired in connection withCombination. This was partially offset by a $2.2 million decrease related to the acquisitionOctober 2018 sale of NorthStar I and NorthStar II.a multi-tenant office portfolio.
Transaction, investment and servicing expense
Transaction, investment and servicing expense represents costs such as professional fees associated with new investments and transactions. Transaction, investment and servicing expense increasedThese expenses decreased by $33.2$33.0 million to $34.6$1.6 million for the six months ended June 30, 2018,2019, as compared to the six months ended June 30, 2017,2018, primarily as a result of $32.5 million inof transaction costs associated with the Combination.Combination incurred during the six months ended June 30, 2018.
Interest expense on real estate
Interest expense on real estate increased by $14.1$11.4 million to $16.1$27.5 million for the six months ended June 30, 2018,2019, as compared to the six months ended June 30, 2017,2018. The increase was primarily due to $8.5 million for the acquisition of two net lease portfolios in the third quarter of 2018 and $3.5 million for recognizing a full six months of interest expense on real estate in 2019 on operating real estate properties acquired as a result of the operating real estate properties acquired in connectionCombination. This was partially offset by $0.9 million associated with the acquisitionOctober 2018 sale of NorthStar I and NorthStar II.a multi-tenant office portfolio.
Depreciation and amortization
Depreciation and amortization expense increased by $37.1$14.8 million to $42.2$56.9 million for the six months ended June 30, 2018,2019, as compared to the six months ended June 30, 2017,2018. This was primarily due to a $12.3 million increase related to 31 real estate
properties acquired through foreclosure in the third quarter of 2018 and during 2019, $9.4 million related to two net lease portfolios acquired in the third quarter of 2018 and $4.1 million due to recognizing a full six months of depreciation expense in 2019 on operating real estate properties acquired as a result of the Combination. This was partially offset by a $6.2 million decrease in amortization expense primarily as a result of short-term in-place lease value intangible assets on our multifamily properties that were fully amortized in 2018 and a $4.8 million decrease related to the October 2018 sale of a multi-tenant office portfolio.
Provision for loan losses
Provision for loan losses of $110.3 million was recorded for the six months ended June 30, 2019, which is attributable to our four NY hospitality loans of $104.3 million, one loan collateralized by a retail property of $3.9 million and two loans collateralized by retail properties of $2.0 million.
Impairment of operating real estate properties acquired in connection with the acquisition
Impairment of NorthStar I and NorthStar II.
Administrative expense
Administrative expense increased by $3.4 million tooperating real estate of $10.1 million for the six months ended June 30, 2018,2019 is attributable to 11 properties in our other segment, resulting from a reduction in the estimated holding period of the properties and exposure to the retail market.
Administrative expense
Administrative expense increased by $4.6 million to $14.7 million for the six months ended June 30, 2019, as compared to the six months ended June 30, 2017,2018. This was primarily due to additionala $2.5 million increase in equity-based compensation expense as awards under the 2018 Plan were granted in March 2018 and March 2019 and a $1.0 million increase related to the reimbursable expenses allocated to us by our Manager as a result of the acquisition of NorthStar I and NorthStar II in the Combination. See Note 11 to the consolidated financial statements, “Related Party Arrangements,” for further information on reimbursement of expenses.
Other income (loss)
Unrealized gain on mortgage loans and obligations held in securitization trusts, net
During the six months ended June 30, 2019 and 2018, we recorded an unrealized gain of $6.6 million and $4.2 million, respectively, on mortgage loans and obligations held in securitization trusts, net of $4.2 million which represents the change in fair value of the assets and liabilities of the securitization trusts consolidated as a result of our investment in the subordinate tranches of these securitization trusts acquired in the Combination.
Realized lossgain (loss) on mortgage loans and obligations held in securitization trusts, net
During the six months ended June 30, 2019, we recorded a de minimis realized gain on mortgage loans and obligations held in securitization trusts, net which represents a recovery of the loss incurred in 2018. During the six months ended June 30, 2018, we recorded a realized loss on mortgage loans and obligations held in securitization trusts, net of $2.2 million which represents a loss incurred from lower than expected future cash flows on a subordinate tranche of a securitization trust.
Other gain (loss), net
a $10.2 million unrealized loss on non-designated interest rate swap contracts entered into in 2018 and $1.3 million of professional fees associated with the sale of our PE Investments.
Equity in earnings of unconsolidated ventures
Equity in earnings of unconsolidated ventures increased by $19.2$2.4 million to $31.4$33.9 million for the six months ended June 30, 2018,2019, as compared to the six months ended June 30, 2017,2018. This was primarily driven bydue to an increase of $14.8 million related to investments in unconsolidated joint ventures entered into in 2018, an increase of $3.4 million on one of our equity method investments in which the underlying investment was not operational until March 2018, an increase of $3.2 million related to our increased commitment in June 2018 in one of our joint ventures which holds a mezzanine loan and a preferred equity investment, and an increase of $1.4 million due to recognizing a full six months of equity in earnings in 2019 on an equity method investment acquired as a result of the acquisitionCombination. This was partially offset by a decrease of NorthStar I$8.9 million related to our PE Investments in which we recorded no equity in earnings during the six months ended June 30, 2019 and NorthStar II.we realized a $0.7 million loss in connection with the sale of a portion of our PE Investments, an impairment of $8.8 million on one senior loan secured by a regional mall and a $2.6 million decrease associated with the repayment of five of our equity method investments.
Income tax benefit
Income tax benefit (expense)
Forincreased by $0.1 million to $0.5 million for the six months ended June 30, 2019, as compared to the six months ended June 30, 2018, and 2017, we recorded income tax benefit of $0.4 million and income tax expense of $0.7 million, respectively, relatedprimarily due to our PE Investments.
Our Portfolio
As of June 30, 2018,2019, our portfolio consisted of 154183 investments representing approximately $7.7$8.7 billion in book value (excluding cash, cash equivalents and certain other assets). Our loan portfolio consisted of 8070 senior mortgage loans, mezzanine loans, and preferred equity investments and other loans and had a weighted average cash coupon of 6.7%6.3% and a weighted average all-in leveredunlevered yield of 7.4%8.0%. Our CRE debt securities portfolio had a weighted average cash coupon of 3.8%. Our owned real estate portfolio (including net lease and other real estate) consisted of approximately 12.719.5 million total square feet of space and the total annualized base rent of that portfolio was approximately $127.6$166.4 million (based on leases in place as of June 30, 2018)2019).
As of June 30, 2018,2019, our portfolio consisted of the following investments (dollars in thousands):
| | | Asset | | Count | | Book value | | Noncontrolling interest(1) | | Book value at our share(2) | | Count | | Book value | | Noncontrolling interest(1) | | Book value at our share(2) |
Senior mortgage loans(3)(4) | | 54 |
| | $ | 1,777,187 |
| | $ | 8,144 |
| | $ | 1,769,043 |
| | 45 |
| | $ | 2,361,808 |
| | $ | 1,216 |
| | $ | 2,360,592 |
|
Mezzanine loans(3)(5) | | 19 |
| | 490,380 |
| | 8,767 |
| | 481,613 |
| | 16 |
| | 392,728 |
| | 160 |
| | 392,568 |
|
Preferred equity(3)(6) | | 7 |
| | 300,319 |
| | — |
| | 300,319 |
| | 8 |
| | 297,606 |
| | — |
| | 297,606 |
|
CMBS(7) | | 46 |
| | 341,625 |
| | — |
| | 341,625 |
| | 53 |
| | 398,767 |
| | — |
| | 398,767 |
|
Mortgage loans held in securitization trusts(7) | | — |
| | 3,010,641 |
| | — |
| | 3,010,641 |
| | — |
| | 3,026,282 |
| | — |
| | 3,026,282 |
|
Owned real estate-Net lease(8) | | 10 |
| | 700,691 |
| | 34,739 |
| | 665,952 |
| | 12 |
| | 1,290,101 |
| | 34,446 |
| | 1,255,655 |
|
Owned real estate-Other(8)(9) | | 12 |
| | 887,292 |
| | 132,007 |
| | 755,285 |
| | 42 |
| | 899,437 |
| | 110,148 |
| | 789,289 |
|
| Private equity interests | | 6 |
| | 241,453 |
| | — |
| | 241,453 |
| | 6 |
| | 53,893 |
| | — |
| | 53,893 |
|
Other loans(10) | | | 1 |
| | 11,451 |
| | — |
| | 11,451 |
|
| Total | | 154 |
| | $ | 7,749,588 |
| | $ | 183,657 |
| | $ | 7,565,931 |
| | 183 |
| | $ | 8,732,073 |
| | $ | 145,970 |
| | $ | 8,586,103 |
|
| |
| (1) | Non-controllingNoncontrolling interest (“NCI”) represent interests in assets held by third party partners. |
| |
| (2) | Book value at our share represents the proportionate book value based on our ownership by asset; book values at our share for securitization assets are net of the accounting impact from consolidation. |
| |
| (3) | Senior mortgage loans, mezzanine loans and preferred equity include investments in joint ventures whose underlying investment is in a loan or preferred equity. |
| |
| (4) | Senior mortgage loans include junior participations in our originated senior mortgage loans for which we have syndicated the senior participations to other investors and retained the junior participations for our portfolio and contiguous mezzanine loans where we own both the senior and junior loan positions. We believe these investments are more similar to the senior mortgage loans we originate than other loan types given their credit quality and risk profile. |
| |
| (5) | Mezzanine loans include other subordinated loans. |
| |
| (6) | Preferred equity balances include $56.8$52.7 million of book value at our share attributable to related equity participation interests. |
| |
| (7) | Mortgage loans held in securitization trusts includes $3.2 billion of book value assets in three securitization trusts in which we own the controlling class of securities and therefore consolidate. The consolidated liabilities related to these consolidated assets are $3.0 billion. The difference between the carrying values of the mortgage loans held in securitization trusts and the carrying value of the mortgage obligations issued by the securitization trusts was $143.5$149.7 million as of June 30, 20182019 and approximates the fair value of our underlying investments in the subordinate tranches of the securitization trusts. |
| |
| (8) | Owned real estate - net lease and owned real estate - other include deferred leasing costs and intangible assets. |
| |
| (9) | Owned real estate - other consists of multi-tenant office, and multifamily residential, retail and hotel assets. |
| |
| (10) | Other loans contains one corporate term loan secured by the borrower’s limited partnership interests in a fund. |
The following charts illustrate the diversification of our portfolio (not including CMBS, mortgage loans held in securitization trusts, and private equity interests)interests, and other) based on investment type, underlying property type, and geography, as of June 30, 20182019 (percentages based on book value at our share, which represents the proportionate book value based on our ownership by asset):
|
| | |
| Investment Type | | Property Type |
| | |
| |
| (1) | Senior mortgage loans include junior participations in our originated senior mortgage loans for which we have syndicated the senior participations to other investors and retained the junior participations for our portfolio and contiguous mezzanine loans where we own both the senior and junior loan positions. We believe these investments are more similar to the senior mortgage loans we originate than other loan types given their credit quality and risk profile. |
| |
| (2) | Mezzanine loans include other subordinated loans. |
| |
| (3) | Preferred equity balances include $56.8$52.7 million of book value at our share attributable to related equity participation interests. |
| |
| (4) | Other loans contains one corporate term loan secured by the borrower’s limited partnership interests in a fund. |
| |
| (5) | Other includes: (i) manufactured housing communities, (ii) commercial and residential development and predevelopment and (iii) mixed-use assets. |
| |
| (6) | Other includes one non-U.S. collateral asset.asset located in Latin America. |
Underwriting Process
We use a rigorous investment and underwriting process that has been developed and utilized by our Manager’s and its affiliates’ senior management teams leveraging their extensive commercial real estate expertise over many years and real estate cycles whichcycles. The underwriting process focuses on some or all of the following factors designed to ensure each investment is evaluated appropriately: (i) macroeconomic conditions that may influence operating performance; (ii) fundamental analysis of underlying real estate, including tenant rosters, lease terms, zoning, necessary licensing, operating costs and the asset’s overall competitive position in its market; (iii) real estate market factors that may influence the economic performance of the investment, including leasing conditions and overall competition; (iv) the operating expertise and financial strength and reputation of a tenant, operator, partner or borrower; (v) the cash flow in place and projected to be in place over the term of the investment and potential return; (vi) the appropriateness of the business plan and estimated costs associated with tenant buildout, repositioning or capital improvements; (vii) an internal and third-party valuation of a property, investment basis relative to the competitive set and the ability to liquidate an investment through a sale or refinancing; (viii) review of third-party reports including appraisals, engineering and environmental reports; (ix) physical inspections of properties and markets; (x) the overall legal structure of the investment, contractual implications and the lenders’ rights; and (xi) the tax and accounting impact.
The following section describes the major CRE asset classes in which we may invest and actively manage to maximize value and to protect capital.
Loan Portfolio
Our loan portfolio consists of senior mortgage loans, mezzanine loans and preferred equity interests, some of which have equity participation interests.
The following table provides a summary of our loan portfolio as of June 30, 20182019 (dollars in thousands):
| | | | | | | Book Value | | Principal Balance | | Weighted Average(1) | | | | | | | | Weighted Average(1) |
| Asset | | Count | | Book value | | NCI | | Book value at our share(2) | | Principal balance | | NCI | | Principal balance value at our share(2) | | Cash Coupon(3) | | All-in yield(4) | | Remaining term(5) | | Extended remaining term(6) | | Count | | Book value | | Principal balance | | Cash Coupon(2) | | All-in unlevered yield(3) | | Remaining term(4) | | Extended remaining term(5) |
Senior loans(8)(7) | | 54 |
| | $ | 1,777,187 |
| | $ | 8,144 |
| | $ | 1,769,043 |
| | $ | 1,797,157 |
| | $ | 35,150 |
| | $ | 1,762,007 |
| | 6.2 | % | | 6.4 | % | | 1.6 |
| | 3.2 |
| | 45 |
| | $ | 2,361,808 |
| | $ | 2,433,280 |
| | 6.1 | % | | 6.9 | % | | 1.9 |
| | 4.2 |
|
Mezzanine loans(9)(8) | | 19 |
| | 490,380 |
| | 8,767 |
| | 481,613 |
| | 521,963 |
| | 41,063 |
| | 480,900 |
| | 6.5 | % | | 9.0 | % | | 2.1 |
| | 3.2 |
| | 16 |
| | 392,728 |
| | 500,633 |
| | 6.7 | % | | 12.3 | % | | 1.2 |
| | 2.8 |
|
Preferred equity(7)(10) | | 7 |
| | 300,319 |
| | — |
| | 300,319 |
| | 251,115 |
| | — |
| | 251,115 |
| | 10.2 | % | | 10.7 | % | | 7.3 |
| | 7.5 |
| |
Preferred equity(6)(9) | | | 8 |
| | 297,606 |
| | 343,467 |
| | 7.0 | % | | 10.8 | % | | 6.6 |
| | 7.0 |
|
| Other loans | | | 1 |
| | 11,451 |
| | 11,595 |
| | 15.0 | % | | 15.0 | % | | 2.9 |
| | 4.9 |
|
| Total / Weighted average | | 80 |
| | $ | 2,567,886 |
| | $ | 16,911 |
| | $ | 2,550,975 |
| | $ | 2,570,235 |
| | $ | 76,213 |
| | $ | 2,494,022 |
| | 6.7 | % | | 7.4 | % | | 2.3 |
| | 3.7 |
| | 70 |
| | $ | 3,063,593 |
| | $ | 3,288,975 |
| | 6.3 | % | | 8.0 | % | | 2.3 |
| | 4.3 |
|
(1) Weighted average metrics weighted by book value at our share, except for cash coupon which is weighted by principal balance value at our share.
| |
(2)(1) | Book and principalWeighted average metrics weighted by book value at our share, represents the proportionate bookexcept for cash coupon which is weighted by principal balance value at our share. Book and principal value based on our ownership by asset.balances at share exclude $1.4 million of NCI. See the table located above in “Our Portfolio” for further information. |
| |
(3)(2) | Represents the stated coupon on loans; for floating rate loans, assumes USD 1-month LIBOR,London Interbank Offered Rate (“LIBOR”), which was 2.09%2.40% as of June 30, 2018.2019. |
| |
(4)(3) | In addition to cash coupon, all-in unlevered yield includes non-cash payment in-kindin kind interest income and the accrual of both extensionorigination and exit fees. All-in yield for the loan portfolio assumes the applicable floating benchmarkUSD 1-month LIBOR rate as of June 30, 20182019 for weighted average calculations. |
| |
(5)(4) | Represents the remaining term based on the current contractual maturity date of loans. |
| |
(6)(5) | Represents the remaining term based on a maximum maturity date assuming all extension options on loans are exercised by the borrower term based on a maximum maturity date assuming all extension options on loans are exercised by the borrower. |
| |
(7)(6) | Senior mortgage loans, mezzanine loans, and preferred equity include investments in joint ventures whose underlying investment is in a loan or preferred equity. |
(8) Senior mortgage loans include junior participations in our originated senior mortgage loans for which we have syndicated the senior participations to other investors and retained the junior participations for our portfolio and contiguous mezzanine loans where we own both the senior and junior loan positions. We believe these investments are more similar to the senior mortgage loans we originate than other loan types given their credit quality and risk profile.
| |
(9)(7) | Senior mortgage loans include junior participations in our originated senior mortgage loans for which we have syndicated the senior participations to other investors and retained the junior participations for our portfolio and contiguous mezzanine loans where we own both the senior and junior loan positions. We believe these investments are more similar to the senior mortgage loans we originate than other loan types given their credit quality and risk profile. |
| |
| (8) | Mezzanine loans include other subordinated loans. |
| |
(10)(9) | Preferred equity balances include $56.8$52.7 million of book value at our share attributable to related equity participation interests. |
Subsequent to June 30, 2018, we foreclosed upon a hotel located in Dallas, Texas following the maturity default of the borrower on a senior loan with a $75.0 million. We do not expect to realize a loss on this transaction.
The following table details our loan portfolio by rate-type as of June 30, 20182019 (dollars in thousands):
| | | | | | | Book Value | | Principal Balance | | Unfunded Loan Commitments | | Weighted Average(1) | | | | | | | | | | Weighted Average(1) |
| | | Number of loans | | Book value | | NCI | | Book value at our share(2) | | Principal balance | | NCI | | Principal balance at our share(2) | | Unfunded loan commitments | | NCI | | Unfunded loan commitments at our share(2) | | Spread to LIBOR | | All-in yield(3) | | Remaining term(4) | | Extended remaining term(5) | | Number of loans | | Book value | | Principal balance | | Unfunded loan commitments | | Spread to LIBOR | | All-in unlevered yield(2) | | Remaining term(3) | | Extended remaining term(4) |
| Floating rate loans | | 59 |
| | $ | 1,873,339 |
| | $ | 16,749 |
| | $ | 1,856,590 |
| | $ | 1,865,557 |
| | $ | 16,696 |
| | $ | 1,848,861 |
| | $ | 146,738 |
| | $ | 532 |
| | $ | 146,206 |
| | 4.8 | % | | 6.8 | % | | 1.5 |
| | 3.1 |
| | 46 |
| | $ | 2,191,090 |
| | $ | 2,259,848 |
| | $ | 214,354 |
| | 3.8 | % | | 6.3 | % | | 1.9 |
| | 4.2 |
|
Fixed rate loans(6) | | 21 |
| | 694,547 |
| | 162 |
| | 694,385 |
| | 704,678 |
| | 59,517 |
| | 645,161 |
| | 43,100 |
| | — |
| | 43,100 |
| | — | % | | 9.1 | % | | 4.6 |
| | 5.3 |
| |
Fixed rate loans(5) | | | 24 |
| | 872,503 |
| | 1,029,127 |
| | 23,232 |
| | — | % | | 12.3 | % | | 3.1 |
| | 4.5 |
|
| Total/ Weighted average | | 80 |
| | $ | 2,567,886 |
| | $ | 16,911 |
| | $ | 2,550,975 |
| | $ | 2,570,235 |
| | $ | 76,213 |
| | $ | 2,494,022 |
| | $ | 189,838 |
| | $ | 532 |
| | $ | 189,306 |
| | — | % | | 7.4 | % | | 2.3 |
| | 3.7 |
| | 70 |
| | $ | 3,063,593 |
| | $ | 3,288,975 |
| | $ | 237,586 |
| | — | % | | 8.0 | % | | 2.3 |
| | 4.3 |
|
| |
| (1) | Weighted average metrics weighted by book value at our share, except for spread to LIBOR which is weighted by principal balance value at our share. Book and principal balances at share exclude $1.4 million of NCI. See the table located above in “Our Portfolio” for further information. |
| |
| (2) | Book value at our share represents the proportionate book value, principal value, and unfunded loan commitments based on our ownership by asset. |
| |
(3) | In addition to cash coupon, all-in unlevered yield includes the amortization of deferred origination fees, purchase price premium and discount, loan origination costs and accrual of both extension and exit fees. All-inFor weighted average calculations, all-in yield for the loan portfolio assumes the applicable floating benchmark rateUSD 1-month LIBOR as of June 30, 2018 for weighted average calculations.2019, which was 2.40%. |
| |
(4)(3) | Represents the remaining term in years based on the original maturity date or current extension maturity date of loans. |
| |
(5)(4) | Represents the remaining term in years based on a maximum maturity date assuming all extension options on loans are exercised by the borrower. |
| |
(6)(5) | Includes preferred equity investments. |
The following table details the types of properties securing our loan portfolio and geographic distribution as of June 30, 20182019 (dollars in thousands):
| | | Collateral property type | | Book value | | NCI | | Book value at our share(1) | | % of total | | Book value | | % of total |
| Office | | $ | 345,878 |
| | $ | 2,754 |
| | $ | 343,124 |
| | 13.5 | % | | $ | 964,079 |
| | 31.6 | % |
| Multifamily | | 346,716 |
| | — |
| | 346,716 |
| | 13.6 | % | | 751,776 |
| | 24.5 | % |
| Industrial | | 163,586 |
| | — |
| | 163,586 |
| | 6.4 | % | | 142,381 |
| | 4.6 | % |
| Hotel | | 1,026,199 |
| | 7,356 |
| | 1,018,843 |
| | 39.9 | % | | 747,631 |
| | 24.4 | % |
| Retail | | 478,554 |
| | 6,354 |
| | 472,200 |
| | 18.5 | % | | 221,864 |
| | 7.2 | % |
Other(2)(1) | | 206,953 |
| | 447 |
| | 206,506 |
| | 8.1 | % | | 235,862 |
| | 7.7 | % |
| Total | | $ | 2,567,886 |
| | $ | 16,911 |
| | $ | 2,550,975 |
| | 100.0 | % | | $ | 3,063,593 |
| | 100.0 | % |
| | | | | | | | | | | | | |
| Region | | Book value | | NCI | | Book value at our share(1) | | % of total | | Book value | | % of total |
| West | | $ | 1,208,109 |
| | $ | 8,862 |
| | $ | 1,199,247 |
| | 47.0 | % | | $ | 1,646,392 |
| | 53.8 | % |
| Northeast | | 603,507 |
| | 2,376 |
| | 601,131 |
| | 23.6 | % | | 559,080 |
| | 18.2 | % |
| Southwest | | 235,974 |
| | 847 |
| | 235,127 |
| | 9.2 | % | | 329,807 |
| | 10.8 | % |
| Southeast | | 356,416 |
| | 3,089 |
| | 353,327 |
| | 13.8 | % | | 219,280 |
| | 7.2 | % |
| Midwest | | 143,485 |
| | 1,737 |
| | 141,748 |
| | 5.6 | % | | 90,186 |
| | 2.9 | % |
Other(3) | | 20,395 |
| | — |
| | 20,395 |
| | 0.8 | % | |
| Europe | | | 206,022 |
| | 6.7 | % |
Other(2) | | | 12,826 |
| | 0.4 | % |
| Total | | $ | 2,567,886 |
| | $ | 16,911 |
| | $ | 2,550,975 |
| | 100.0 | % | | $ | 3,063,593 |
| | 100.0 | % |
| |
| (1) | Book value at our share represents the proportionate book value based on our ownership by asset. |
| |
(2) | Other includes manufactured housing communities and commercial and residential development and predevelopment assets. |
| |
(3)(2) | Other includescontains one non U.S. collateral asset.corporate term loan secured by the borrower’s limited partnership interests in a fund and a preferred equity investment in a loan origination platform. |
The following charts illustrate the diversification of our loan portfolio based on interest rate category, property type, and geography as of June 30, 20182019 (percentages based on book value at our share, which represents the proportionate book value based on our ownership by asset):
|
| | |
Fixed FloatingInterest Rate Category | | Property Type |
| | |
| |
| (1) | Other includes manufactured housing communities and commercial and residential development and predevelopment assets. |
| |
| (2) | Other contains one corporate term loan secured by the borrower’s limited partnership interests in a fund and a preferred equity investment in a loan origination platform. |
In March 2018, the borrower on our $260.2 millionfour NY hospitality loans failed to make itsall required interest payment. We have placedpayments and the loans were placed on non-accrual statusstatus. These four loans are secured by the same collateral. We believe ultimate sale of the underlying collateral and have commenced discussions withrepayment of the borrower to resolveloans from the matter. Interest incomesales proceeds is recognized on a cash basis. Nothe most likely outcome. During 2018, we recorded $53.8 million of provision for loan loss was recorded duringlosses on the three and six months ended June 30, 2018 as we believe sufficient collateralfour NY hospitality loans to reflect the estimated value exists to coverbe recovered from the outstanding loan balances.borrower following a sale. During the three months ended June 30, 2019, we revised our estimated recovery and recorded an additional $104.3 million of provision for loan loss. The additional provision is based on significant deterioration in the NY hospitality market and feedback from the sales process and reflects the estimated value to be recovered from the borrower following a potential sale.
During 2018, we received and recognized $1.0recorded $8.8 million in interest income on the loans. These discussions typically include numerous points of negotiation as we and the borrower work towards a settlement or other alternative resolution, which can impact the potentialprovision for loan repayment or receiptlosses for one of our loans secured by a regional mall (“Northeast Regional Mall B”) to reflect the estimated fair value of the collateral. During the three months ended June 30, 2019, we recognized an additional $3.9 millionprovision for loan loss to reflect the estimated fair value of the collateral. The additional provision is based on current and prospective leasing activity. We have been and are continuing to sweep all cash.
Also during the three months ended June 30, 2019, we separately recognized a $2.0 million provision for loan loss on two loans secured by one regional mall (“West Regional Mall”) to better reflect the estimated fair value of the collateral. We have been and are continuing to sweep all cash.
Additionally, during the three months ended June 30, 2019 we recorded our proportionate share of an impairment loss on a senior loan held in a joint venture totaling $8.8 million.
CRE Debt Securities
The following table presents an overview of our CRE debt securities portfolio as of June 30, 20182019 (dollars in thousands):
| | | | | | | | | | | | | Weighted Average(1) | | | | | | Weighted Average(1) |
CRE Debt Securities by ratings category(2) | | Number of Securities | | Book value | | NCI | | Book value at our share(3) | | Cash coupon | | Unlevered all-in yield | | Remaining term | | Ratings | | Number of Securities | | Book value | | Cash coupon | | Unlevered all-in yield | | Remaining term | | Ratings |
| Investment grade rated | | 33 |
| | $ | 195,904 |
| | $ | — |
| | $ | 195,904 |
| | 3.4 | % | | 7.2 | % | | 8.1 |
| | BBB- | | 39 |
| | $ | 222,190 |
| | 3.2 | % | | 6.3 | % | | 7.1 |
| | BBB- |
| Non-investment grade rated | | 10 |
| | 86,985 |
| | — |
| | 86,985 |
| | 4.2 | % | | 11.7 | % | | 5.8 |
| | BB / B | | 4 |
| | 26,910 |
| | 3.3 | % | | 11.9 | % | | 5.7 |
| | BB / B |
| Non-rated | | 3 |
| | 58,736 |
| | — |
| | 58,736 |
| | 4.3 | % | | 5.2 | % | | 5.0 |
| | — | |
| “B-pieces” of CMBS securitization pools | | | 10 |
| | 149,667 |
| | 4.5 | % | | 7.4 | % | | 4.8 |
| | — |
| Total/Weighted Average | | 46 |
| | $ | 341,625 |
| | $ | — |
| | $ | 341,625 |
| | 3.8 | % | | 8.0 | % | | 7.0 |
| | — | | 53 |
| | $ | 398,767 |
| | 3.8 | % | | 7.1 | % | | 6.1 |
| | — |
| |
| (1) | Weighted average metrics weighted by book value, at our share, except for cash coupon which is weighted by principal balance value at our share.balance. |
| |
| (2) | As of June 30, 2018,2019, all CRE debt securities consisted of CMBS. |
| |
(3) | Book value at our share represents the proportionate book value based on our ownership by asset; at our share values for securitization assets are presented net of the impact from consolidation. |
Owned Real Estate
Our operating real estate investment strategy focuses on direct ownership in commercial real estate with an emphasis on properties with stable cash flow, which may be structurally senior to a third-party partner’s equity. In addition, we may own operating real estate investments through joint ventures with one or more partners. As part of our real estate properties strategy, we explore a variety of real estate investments including multi-tenant office, multifamily, student housing and industrial. These properties are typically well-located with strong operating partners and we believe offer both attractive cash flow and returns.
As of June 30, 2018, $1.62019, $2.2 billion, or 20.5%25.1%, of our assets were invested in real estate properties and our portfolio was 91.3%90.8% occupied. The following table presents our real estate property investments as of June 30, 20182019 (dollars in thousands):
| | | Property Type | | Book value | | NCI | | Book value at our share(1) | | % of total | | Number of Properties | | Number of Buildings | | Total Square Feet | | Units | | % leased | | Weighted average lease term(2) | | Total annualized base rent(3) | | Book value | | NCI | | Book value at our share(1) | | % of total | | Number of Properties | | Number of Buildings | | Total Square Feet | | Units | | Weighted average % leased | | Weighted average lease term(2) | | Total annualized base rent(3) |
| Net lease | | | | | | | | | | | | | | | | | | | | | | | | | | | | | | | | | | | | | | | | | | | | |
| Industrial | | $ | 493,226 |
| | $ | 34,739 |
| | $ | 458,487 |
| | 31.0 | % | | 45 |
| | 45 |
| | 8,792,792 |
| | — |
| | 97.8 | % | | 3.5 | | $ | 33,176 |
| | $ | 763,753 |
| | $ | 34,446 |
| | $ | 729,307 |
| | 35.7 | % | | 47 |
| | 47 |
| | 11,577,199 |
| | — |
| | 97 | % | | 9.8 |
| | $ | 48,268 |
|
| Office | | 135,647 |
| | — |
| | 135,647 |
| | 9.0 | % | | 4 |
| | 4 |
| | 841,689 |
| | — |
| | 75.3 | % | | 4.1 | | 8,042 |
| | 464,419 |
| | — |
| | 464,419 |
| | 22.7 | % | | 5 |
| | 30 |
| | 2,132,616 |
| | — |
| | 96 | % | | 9.3 |
| | 26,612 |
|
| Retail | | 71,818 |
| | — |
| | 71,818 |
| | 5.0 | % | | 10 |
| | 10 |
| | 467,971 |
| | — |
| | 100.0 | % | | 5.2 | | 5,627 |
| | 61,929 |
| | — |
| | 61,929 |
| | 3.0 | % | | 10 |
| | 10 |
| | 467,971 |
| | — |
| | 100 | % | | 5.0 |
| | 5,398 |
|
| Total net-lease | | 700,691 |
| | 34,739 |
| | 665,952 |
| | 45.0 | % | | 59 |
| | 59 |
| | 10,102,452 |
| | — |
| | 93.4 | % | | 3.8 | | 46,845 |
| |
| Total net lease | | | 1,290,101 |
| | 34,446 |
| | 1,255,655 |
| | 61.4 | % | | 62 |
| | 87 |
| | 14,177,786 |
| | — |
| | 97 | % | | 9.4 |
| | 80,278 |
|
| | | | | | | | | | | | | | | | | | | | | | | | | | | | | | | | | | | | | | | | | | | |
| Other | | | | | | | | | | | | | | | | | | | | | | | | | | | | | | | | | | | | | | | | | | |
| Office | | 603,892 |
| | 69,825 |
| | 534,067 |
| | 38.0 | % | | 16 |
| | 33 |
| | 2,600,882 |
| | — |
| | 88.3 | % | | 4.6 | | 51,721 |
| | 475,783 |
| | 49,245 |
| | 426,538 |
| | 20.9 | % | | 35 |
| | 44 |
| | 4,070,843 |
| | n/a |
| | 84 | % | | 3.5 |
| | 52,189 |
|
| Multifamily | | 275,460 |
| | 62,182 |
| | 213,278 |
| | 17.0 | % | | 6 |
| | 107 |
| | — |
| | 3,721 |
| | 93.6 | % | | n/a | | 29,053 |
| | 257,552 |
| | 58,844 |
| | 198,708 |
| | 9.7 | % | | 8 |
| | 113 |
| | n/a |
| | 4,250 |
| | 90 | % | | n/a |
| | 24,734 |
|
Other(4) | | 7,940 |
| | — |
| | 7,940 |
| | — | % | | 1 |
| | 1 |
| | n/a |
| | n/a |
| | n/a |
| | n/a | | n/a |
| |
| Retail | | | 50,625 |
| | 1,787 |
| | 48,838 |
| | 2.4 | % | | 6 |
| | 8 |
| | 1,285,391 |
| | n/a |
| | 71 | % | | 2.8 |
| | 9,248 |
|
| Hotel | | | 115,477 |
| | 272 |
| | 115,205 |
| | 5.6 | % | | 3 |
| | 3 |
| | n/a |
| | n/a |
| | n/a |
| | n/a |
| | n/a |
|
| Total other | | 887,292 |
| | 132,007 |
| | 755,285 |
| | 55.0 | % | | 23 |
| | 141 |
| | 2,600,882 |
| | 3,721 |
| | 89.8 | % | | 4.6 | | 80,774 |
| | 899,437 |
| | 110,148 |
| | 789,289 |
| | 38.6 | % | | 52 |
| | 168 |
| | 5,356,234 |
| | 4,250 |
| | 85 | % | | 3.4 |
| | 86,171 |
|
| | | | | | | | | | | | | | | | | | | | | | | | | | | | | | | | | | | | | | | | | | | |
| Total | | $ | 1,587,983 |
| | $ | 166,746 |
| | $ | 1,421,237 |
| | 100.0 | % | | 82 |
| | 200 |
| | 12,703,334 |
| | 3,721 |
| | 91.5 | % | | 4.2 | | $ | 127,619 |
| | $ | 2,189,538 |
| | $ | 144,594 |
| | $ | 2,044,944 |
| | 100.0 | % | | 114 |
| | 255 |
| | 19,534,020 |
| | 4,250 |
| | 93 | % | | 7.7 |
| | $ | 166,449 |
|
| |
| (1) | Book value at our share represents the proportionate book value based on our ownership by asset. |
| |
| (2) | The calculation of weighted average lease term is based on leases in-place (defined as occupied and paying leases) as of June 30, 2018;2019; assumes that no renewal options are exercised and is weighted by book value at our share. |
| |
| (3) | Total annualized base rent is based on in-place leases at our share multiplied by 12, excluding straight-line adjustments and rent concessions as of June 30, 2018. |
| |
(4) | Other owned real estate includes hotel assets and residential development and predevelopment assets.2019. |
The following charts illustrate the diversificationconcentration of our net lease real estate portfolio based on property type and geography as of June 30, 20182019 (percentages based on book value at our share, which represents the proportionate book value based on our ownership by asset):
The following charts illustrate the diversification of our other real estate portfolio based on property type and geography as of June 30, 20182019 (percentages based on book value at our share, which represents the proportionate book value based on our ownership by asset):
Non-GAAP Supplemental Financial Measures
Core Earnings
We present Core Earnings, which is a non-GAAP supplemental financial measure of our performance. We believe that Core Earnings provides meaningful information to consider in addition to our net income and cash flow from operating activities determined in accordance with accounting principles generally accepted in the United States (“U.S. GAAP.GAAP”). This supplemental financial measure helps us to evaluate our performance excluding the effects of certain transactions and U.SU.S. GAAP adjustments that we believe are not necessarily indicative of our current portfolio and operations. We also use Core Earnings to determine the incentive fees we pay to our Manager. For information on the fees we pay our Manager, see Note 11, “Related Party Arrangements” to our consolidated financial statements included in this Form 10-Q. In addition, we believe that our investors also use Core Earnings or a comparable supplemental performance measure to evaluate and compare the performance of us and our peers, and as such, we believe that the disclosure of Core Earnings is useful to our investors.
We define Core Earnings as U.S. GAAP net income (loss) attributable to our common stockholders (or, without duplication, the owners of the common equity of our direct subsidiaries, such as our OP) and excluding (i) non-cash equity compensation expense, (ii) the expenses incurred in connection with our formation, (iii) the incentive fee, (iv) acquisition costs from successful acquisitions, (v) depreciation and amortization, (vi) any unrealized gains or losses or other similar non-cash items that are included in net income for the current quarter, regardless of whether such items are included in other comprehensive income or loss, or in net income, (vii) one-time events pursuant to changes in U.S. GAAP and (viii) certain material non-cash income or expense items that in the judgment of management should not be included in Core Earnings. For clauses (vii) and (viii), such exclusions shall only be applied after discussions between our Manager and our independent directors and after approval by a majority of our independent directors. Core Earnings reflects adjustments to U.S. GAAP net income to exclude impairment of real estate and provision for loan losses.
Such impairment and losses may ultimately be realized, in part or full, upon a sale or monetization of the related investments and such realized losses would be reflected in Core Earnings.
Core Earnings does not represent net income or cash generated from operating activities and should not be considered as an alternative to U.S. GAAP net income or an indication of our cash flows from operating activities determined in accordance with U.S. GAAP, a measure of our liquidity, or an indication of funds available to fund our cash needs, including our ability to make cash distributions. In addition, our methodology for calculating Core Earnings may differ from methodologies employed by other companies to calculate the same or similar non-GAAP supplemental financial measures, and accordingly, our reported Core Earnings may not be comparable to the Core Earnings reported by other companies.
The following table presents a reconciliation of net income (loss) attributable to our common stockholders and noncontrolling interest of the Operating Partnership to Core Earnings attributable to our common stockholders and noncontrolling interest of the Operating Partnership (dollars and share amounts in thousands, except per share data):
| |
| | Three Months Ended June 30, | | Six Months Ended June 30, | | Three Months Ended June 30, | | Six Months Ended June 30, |
| | 2018 | | 2017 | | 2018 | | 2017 | | 2019 | | 2018 | | 2019 | | 2018 |
| Net income attributable to Colony Credit Real Estate, Inc. common stockholders | | $ | 16,008 |
| | $ | 22,949 |
| | $ | 11,294 |
| | $ | 45,835 |
| |
| Net income (loss) attributable to Colony Credit Real Estate, Inc. common stockholders | | | $ | (107,341 | ) | | $ | 16,008 |
| | $ | (92,433 | ) | | $ | 11,294 |
|
| Adjustments: | | | | | | | | | | | | | | | | |
| Net income attributable to noncontrolling interest of the Operating Partnership | | 336 |
| | — |
| | 279 |
| | — |
| | (2,569 | ) | | 336 |
| | (2,222 | ) | | 279 |
|
| Non-cash equity compensation expense | | 1,798 |
| | — |
| | 2,083 |
| | — |
| | 2,713 |
| | 1,798 |
| | 4,556 |
| | 2,083 |
|
Transaction costs | | 2,342 |
| | — |
| | 32,521 |
| | — |
| | 478 |
| | 2,342 |
| | 674 |
| | 32,521 |
|
| Depreciation and amortization | | 24,321 |
| | 2,707 |
| | 43,155 |
| | 4,957 |
| | 29,118 |
| | 24,321 |
| | 57,135 |
| | 43,155 |
|
| Net unrealized gain on investments | | (2,898 | ) | | — |
| | (1,594 | ) | | — |
| |
| Adjustments related to non-controlling interests | | (1,657 | ) | | — |
| | (3,099 | ) | | — |
| |
| Net unrealized loss (gain): | | | | | | | | | |
| Impairment of operating real estate | | | 10,124 |
| | — |
| | 10,124 |
| | — |
|
Provision for loan losses(2) | | | 119,062 |
| | — |
| | 119,062 |
| | — |
|
| Other unrealized loss (gain) | | | 883 |
| | (2,898 | ) | | 4,063 |
| | (1,594 | ) |
| Provision for loan losses previously adjusted for Core Earnings (Loss) on loans foreclosed | | | (14,466 | ) | | — |
| | (49,975 | ) | | — |
|
| Adjustments related to noncontrolling interests in investment entities | | | (1,738 | ) | | (1,657 | ) | | (2,916 | ) | | (3,099 | ) |
| Core Earnings attributable to Colony Credit Real Estate, Inc. common stockholders and noncontrolling interest of the Operating Partnership | | $ | 40,250 |
| | $ | 25,656 |
| | $ | 84,639 |
| | $ | 50,792 |
| | $ | 36,264 |
| | $ | 40,250 |
| | $ | 48,068 |
| | $ | 84,639 |
|
Core Earnings per share(1) | | $ | 0.31 |
| | $ | 0.54 |
| | $ | 0.73 |
| | $ | 1.07 |
| |
Weighted average number of common shares and OP units(1) | | 130,962 |
| | 47,475 |
| | 115,969 |
| | 47,475 |
| |
Core Earnings per share(3) | | | $ | 0.28 |
| | $ | 0.31 |
| | $ | 0.37 |
| | $ | 0.73 |
|
Weighted average number of common shares and OP units(3) | | | 131,609 |
| | 130,962 |
| | 131,315 |
| | 115,969 |
|
| |
| (1) | Represents transaction costs incurred as a result of the Combination. |
| |
| (2) | Includes our $8.8 million proportionate share of an impairment loss recorded on a senior loan held in a joint venture. This is recorded in equity in earnings of unconsolidated ventures on our consolidated statements of operations. |
| |
| (3) | We calculate core earnings per share, a non-GAAP financial measure, based on a weighted-average number of common shares and OP units (held by members other than us or our subsidiaries). For Core Earnings per share, we assume the 44.4 million shares of Class B-3 common stock and the 3.1 million OP units (held by members other than us or our subsidiaries) were outstanding prior to January 31, 2018 to reflect the standalone pre-merger financial information of the accounting acquirer. Following January 31, 2018, we assume approximately 131.0 million of shares of Class A common stock, Class B-3 common stock and OP units (held by members other than us or our subsidiaries) were outstanding. This results in a weighted average share count for the three and six months ended June 30, 2018 of approximately 131.0 million and 116.0 million shares, respectively. |
Liquidity and Capital Resources
Overview
Our primary liquidity needs include commitments to repay borrowings, finance our assets and operations, meet future funding obligations, make distributions to our stockholders, repurchase our shares and fund other general business needs. We use significant cash to make additional investments, repay the principal of and interest on our borrowings and pay other financing costs, make distributions to our stockholders and fund our operations, which includes making payments to our Manager in accordance with the management agreement.
Our primary sources of liquidity include cash on hand, cash generated from our operating activities and cash generated from asset sales and investment maturities. However, subject to maintaining our qualification as a REIT and our Investment Company Act exclusion, we may use a number of sources to finance our business, including bank credit facilities (including term loans and revolving facilities), master repurchase facilities and securitizations, as described below. In addition to our current sources of liquidity, we have access to liquidity through public offerings of debt and equity securities. We also expect to invest in a number
of our assets through co-investments with other investment vehicles managed by affiliates of our Manager and/or other third parties, which may allow us to pool capital to access larger transactions and diversify investment exposure.
Financing Strategy
We have a multi-pronged financing strategy that includes an up to $400$560 million secured revolving credit facility, up to approximately $2.0$2.3 billion in secured revolving repurchase facilities, non-recourse securitization financing, commercial mortgages and other asset-level financing structures. In addition, we may use other forms of financing, including additional warehouse facilities, public and private secured and unsecured debt issuances and equity or equity-related securities issuances by us or our subsidiaries. We may also finance a portion of our investments through the syndication of one or more interests in a whole loan or securitization. We will seek to match the nature and duration of the financing with the underlying asset’s cash flow, including through the use of hedges, as appropriate.
Debt-to-Equity Ratio
The following table presents our debt-to-equity ratio:
|
| | | | |
| | | June 30, 20182019 | | December 31, 20172018 |
Debt-to-equity ratio(1) | | 0.5x1.1x | | 0.3x0.9x |
| |
| (1) | Represents (i) total outstanding secured debt less cash to (ii) total stockholders’ equity, in each case, at period end. |
The following table presents our total sources of liquidity as of June 30, 20182019 (dollars in thousands): | | | Total Sources of Corporate Liquidity | | | | |
| Cash and cash equivalents | | $ | 155,377 |
| | $ | 59,838 |
|
| Bank credit facility availability | | 375,000 |
| | 338,500 |
|
| Total sources of corporate liquidity | | $ | 530,377 |
| | $ | 398,338 |
|
Potential Sources of Liquidity
Bank Credit Facilities
We use bank credit facilities (including term loans and revolving facilities) to finance our business. These financings may be collateralized or non-collateralized and may involve one or more lenders. Credit facilities typically have maturities ranging from two to five years and may accrue interest at either fixed or floating rates.
On February 1, 2018, the OP (together with certain subsidiaries of the OP from time to time party thereto as borrowers, collectively, the “Borrowers”) entered into a credit agreement (the “Bank Credit Facility”) with JPMorgan Chase Bank, N.A., as administrative agent, and the several lenders from time to time party thereto (the “Lenders”), pursuant to which the Lenders agreed to provide a revolving credit facility in the aggregate principal amount of up to $400.0 million. On February 4, 2019, the aggregate amount of revolving commitments was increased to $560.0 million.
Advances under the Bank Credit Facility accrue interest at a per annum rate equal to, at the applicable Borrower’s election, either a LIBOR rate plus a margin of 2.25%, or a base rate determined according to a prime rate or federal funds rate plus a margin of 1.25%. An unused commitment fee at a rate of 0.25% or 0.35%, per annum, depending on the amount of facility utilization, applies to un-utilized borrowing capacity under the Bank Credit Facility. Amounts owing under the Bank Credit Facility may be prepaid at any time without premium or penalty, subject to customary breakage costs in the case of borrowings with respect to which a LIBOR rate election is in effect.
The maximum amount available for borrowing at any time under the Bank Credit Facility is limited to a borrowing base valuation of certain investment assets, with the valuation of such investment assets generally determined according to a percentage of adjusted net book value. As of the date hereof, the borrowing base valuation is sufficient to permit borrowings of up tosupport the entire $400.0 million commitment.outstanding borrowings. The ability to borrow additional amounts under the Bank Credit Facility terminateswill mature on February 1, 2022, at which timeunless the OP may, at its election and by written noticeelects to exercise the administrative agent, extend the termination dateextension options for up to two (2) additional terms of six (6) months each, subject to the terms and conditions in the Bank Credit Facility, resulting in a latest terminationmaturity date of February 1, 2023.
The obligations of the Borrowers under the Bank Credit Facility are guaranteed by substantially all material wholly owned subsidiaries of the OP pursuant to a Guarantee and Collateral Agreement with the OP and certain subsidiaries of the OP in favor of JPMorgan Chase Bank, N.A., as administrative agent (the “Guarantee and Collateral Agreement”) by substantially all material wholly owned subsidiaries of the OP and, subject to certain exceptions, secured by a pledge of substantially all equity interests owned by the Borrowers and the guarantors, as well as by a
security interest in deposit accounts of the Borrowers and the Guarantors (as such terms are defined in the Guarantee and Collateral Agreement) in which the proceeds of investment asset distributions are maintained.
The Bank Credit Facility contains various affirmative and negative covenants, including, among other things, the obligation of the Company to maintain REIT status and be listed on the NYSE, and limitations on debt, liens and restricted payments. In addition, the Bank Credit Facility includes the following financial covenants applicable to the OP and its consolidated subsidiaries: (a) minimum consolidated tangible net worth of the OP must be greater than or equal to the sum of (i) $2.105 billion and (ii) 50% of the proceeds received by the OP from any offering of its common equity and of the proceeds from any offering by the Company of its common equity to the extent such proceeds are contributed to the OP, excluding any such proceeds that are contributed to the OP within ninety (90) days of receipt and applied to acquire capital stock of the OP; (b) the OP’s earnings before interest, income tax, depreciation, and amortization (“EBITDA”) plus lease expenses to fixed charges for any period of four (4) consecutive fiscal quarters must be not less than 1.50 to 1.00; (c) the OP’s minimum interest coverage ratio must be not less than 3.00 to 1.00; and (d) the OP’s ratio of consolidated total debt to consolidated total assets must be not exceedmore than 0.70 to 1.00. The Bank Credit Facility also includes customary
events of default, including, among other things, failure to make payments when due, breach of covenants or representations, cross default to material indebtedness or material judgment defaults, bankruptcy matters involving any Borrower or any Guarantor and certain change of control events. The occurrence of an event of default will limit the ability of the OP and its subsidiaries to make distributions and may result in the termination of the credit facility, acceleration of repayment obligations and the exercise of remedies by the Lenders with respect to the collateral.
Master Repurchase Facilities and CMBS Credit Facilities
Currently, our primary source of financing is our master repurchase facilities, which we use to finance the origination of senior loans.loans, and CMBS credit facilities, which we use to finance the purchase of securities. Repurchase agreements effectively allow us to borrow against loans, participations and securities that we own in an amount generally equal to (i) the market value of such loans, participations and/or securities multiplied by (ii) the applicable advance rate. Under these agreements, we sell our loans, participations and securities to a counterparty and agree to repurchase the same loans and securities from the counterparty at a price equal to the original sales price plus an interest factor. During the term of a repurchase agreement, we receive the principal and interest on the related loans, participations and securities and pay interest to the lender under the master repurchase agreement. We intend to maintain formal relationships with multiple counterparties to obtain master repurchase financing on favorable terms.
The following table presents a summary of our master repurchase facilities as of June 30, 20182019 (dollars in thousands):
| | | | | Maximum Facility Size | | Current Borrowings | | Weighted Average Final Maturity (Years) | | Weighted Average Interest Rate | | Maximum Facility Size | | Current Borrowings | | Weighted Average Final Maturity (Years) | | Weighted Average Interest Rate |
| Master Repurchase Facilities | | | | | | | | | | | | | | | | |
| Bank 1 | | $ | 300,000 |
| | $ | 42,840 |
| | 4.8 |
| | LIBOR + 2.42% |
| | $ | 400,000 |
| | $ | 197,265 |
| | 3.8 |
| | LIBOR + 1.90% |
|
| Bank 2 | | 400,000 |
| | 26,742 |
| | 1.0 |
| | LIBOR + 2.41% |
| | 200,000 |
| | 22,750 |
| | 3.3 |
| | LIBOR + 2.50% |
|
| Bank 3 | | 500,000 |
| | 465,811 |
| | 2.8 |
| | LIBOR + 2.36% |
| | 600,000 |
| | 505,212 |
| | 1.8 |
| | LIBOR + 2.24% |
|
| Bank 7 | | 500,000 |
| | 79,113 |
| | 3.8 |
| | LIBOR + 2.00% |
| | 500,000 |
| | 424,025 |
| | 2.8 |
| | LIBOR + 1.91% |
|
| Bank 8 | | 250,000 |
| | 33,672 |
| | 3.0 |
| | LIBOR + 2.00% |
| | 250,000 |
| | 164,977 |
| | 2.0 |
| | LIBOR + 2.00% |
|
| Bank 9 | | | 300,000 |
| | 66,643 |
| | 4.3 |
| | LIBOR + 1.65% |
|
| Total Master Repurchase Facilities | | 1,950,000 |
| | 648,178 |
| | | | | | 2,250,000 |
| | 1,380,872 |
| | | | |
| | | | | | | | | | | | | | | | | |
| CMBS Credit Facilities | | | | | | | | | | | | | | | | |
| Bank 1 | | 29,020 |
| | 29,020 |
| | (1 | ) | | LIBOR + 1.34% |
| | 38,163 |
| | 38,163 |
| | (1 | ) | | LIBOR + 1.16% |
|
| Bank 6 | | 98,347 |
| | 98,347 |
| | (1 | ) | | LIBOR + 1.11% |
| | 168,255 |
| | 168,255 |
| | (1 | ) | | LIBOR + 1.19% |
|
| Bank 3 | | — |
| | — |
| | — |
| | — |
| |
| Bank 4 | | — |
| | — |
| | — |
| | — |
| |
| Bank 5 | | — |
| | — |
| | — |
| | — |
| |
Bank 3(2) | | | — |
| | — |
| | — |
| | — |
|
Bank 4(2) | | | — |
| | — |
| | — |
| | — |
|
Bank 5(2) | | | — |
| | — |
| | — |
| | — |
|
| Total CMBS Credit Facilities | | 127,367 |
| | 127,367 |
| | | | | | 206,418 |
| | 206,418 |
| | | | |
| | | | | | | | | | | | | | | | | |
| Bank Credit Facility | | 400,000 |
| | 25,000 |
| | 4.6 |
| | LIBOR + 2.25% |
| | 560,000 |
| | 221,500 |
| | 3.6 |
| | LIBOR + 2.25% |
|
| | | | | | | | | | | | | | | | | |
| Total Facilities | | $ | 2,477,367 |
| | $ | 800,545 |
| | | | | | $ | 3,016,418 |
| | $ | 1,808,790 |
| | | | |
| |
| (1) | The maturity dates on CMBS Credit Facilities are dependent upon asset type and will typically range from one to sixtwo months. |
| |
| (2) | Amounts can be drawn under the Bank 3, Bank 4, and Bank 5 CMBS Credit Facilities, but we have not yet utilized them. |
Securitizations
We may seek to utilize non-recourse long-term securitizations of our investments in mortgage loans, especially loan originations, to the extent consistent with the maintenance of our REIT qualification and exclusion from the Investment Company Act in order to generate cash for funding new investments. This would involve conveying a pool of assets to a special purpose vehicle (or the issuing entity), which would issue one or more classes of non-recourse notes pursuant to the terms of an indenture. The notes would be secured by the pool of assets. In exchange for the transfer of assets to the issuing entity, we would receive the cash proceeds on the sale of non-recourse notes and a 100% interest in the equity of the issuing entity. The securitization of our portfolio investments might magnify our exposure to losses on those portfolio investments because any equity interest we retain in the issuing entity would be subordinate to the notes issued to investors and we would, therefore, absorb all of the losses sustained with respect to a securitized pool of assets before the owners of the notes experience any losses.
Other potential sources of financing
In the future, we may also use other sources of financing to fund the acquisition of our target assets, including secured and unsecured forms of borrowing and selective wind-down and dispositions of assets. We may also seek to raise equity capital or issue debt securities in order to fund our future investments.
Cash Flows
The following presents a summary of our consolidated statements of cash flows for the six months ended June 30, 20182019 and 20172018 (dollars in thousands):
|
| | | | | | | | | | | | |
| | | Six Months Ended June 30, | | |
| Cash flow provided by (used in): | | 2018 | | 2017 | | Change |
| Operating activities | | $ | 22,349 |
| | $ | 47,170 |
| | $ | (24,821 | ) |
| Investing activities | | 103,929 |
| | 101,532 |
| | 2,397 |
|
| Financing activities | | 3,895 |
| | (131,109 | ) | | 135,004 |
|
| Net change in cash and cash equivalents | | $ | 130,173 |
| | $ | 17,593 |
| | $ | 112,580 |
|
Comparison of the Six Months Ended June 30, 2018 to 2017 |
| | | | | | | | | | | | |
| | | Six Months Ended June 30, | | |
| Cash flow provided by (used in): | | 2019 | | 2018 | | Change |
| Operating activities | | $ | 63,145 |
| | $ | 28,916 |
| | $ | 34,229 |
|
| Investing activities | | (421,291 | ) | | 171,927 |
| | (593,218 | ) |
| Financing activities | | 344,663 |
| | 3,895 |
| | 340,768 |
|
Operating Activities
Net cash provided byCash inflows from operating activities decreased $24.8are generated primarily through interest received from loans receivable and securities, property operating income from our real estate portfolio, and distributions of earnings received from unconsolidated ventures. This is partially offset by payment of interest expenses for credit facilities and mortgage payable, and operating expenses supporting our various lines of business, including property management and operations, loan servicing and workout of loans in default, investment transaction costs, as well as general administrative costs.
Our operating activities generated net cash inflows of $63.1 million from $47.2and $28.9 million for the six months ended June 30, 2017 to $22.32019 and 2018, respectively. Net cash provided by operating activities increased $34.2 million for the six months ended June 30, 2018,2019, primarily as a result ofdue to higher transaction costsfees paid in connectionassociated with the Combination.Combination during the six months ended June 30, 2018.
We believe cash flows from operations, available cash balances and our ability to generate cash through short- and long-term borrowings are sufficient to fund our operating liquidity needs.
Investing Activities
Investing activities include cash outlays for acquisition of real estate, disbursements on new and/or existing loans, and contributions to unconsolidated ventures, which are partially offset by repayments and sales of loan receivables, distributions of capital received from unconsolidated ventures, proceeds from sale of real estate, as well as proceeds from maturity or sale of securities.
Net cash provided byflows used in investing activities increased $2.4 million from $101.5of $421.3 million for the six months ended June 30, 2017 to $103.92019 was primarily driven by $886.4 million for the six months ended June 30, 2018. Cash flows from investing activities for the six months ended June 30, 2018 primarily consist of repayment on loans and preferred equity held for investment in the amount of $272.6 million, cash received in the Combination in the amount of $225.2 million, and distributions in excess of cumulative earnings from unconsolidated ventures in the amount of $49.4 million, partially offset by acquisition, origination and funding of loans and preferred equity held for investment partially offset by $287.4 million of loan and preferred equity repayments and $119.5 million of distributions in the amountexcess of $392.3 million, acquisition of real estate securities, available for sale in the amount of $33.3 million, deposit on investments in the amount of $15.7 million, payments for improvements of real estate in the amount of $5.7 million, and investments incumulative earnings from unconsolidated ventures in the amount of $5.5 million.
Financing Activitiesventures.
Net cash flows provided by financinginvesting activities increased $135.0 million from net cash used in financing activities of $131.1 million for the six months ended June 30, 20172018 of $171.9 million was the result of $302.3 million in cash and restricted cash received in the Combination in 2018 and loan and preferred equity repayments of $272.6 million. This is partially offset by $392.3 million of loan and preferred equity acquisition, origination and funding activity.
Financing Activities
We finance our investing activities largely through borrowings secured by our investments along with capital from third party or affiliated coinvestors. We also have the ability to raise capital in the public markets through issuances of common stock, as well as draw upon our corporate credit facility, to finance our investing and operating activities. Accordingly, we incur cash outlays for payments on third party debt, dividends to our common stockholders as well as distributions to our noncontrolling interests.
Our financing activities provided net cash provided by financing activitiesinflow of $344.7 million and $3.9 million for the six months ended June 30, 2018. Cash flows2019 and 2018, respectively. Net cash provided by financing activities for the six months ended June 30, 2018in 2019 resulted primarily consist offrom borrowings from credit facilities in the amount of $326.8 million$1.4 billion and borrowings from mortgage notes in the amount of $43.8$85.5 million, partially offset by repayment of credit facilities in the amount of $175.1$977.7 million, distributions paid on common stock in the amount of $75.8$114.2 million and repayment of securitization bonds in the amount of $63.4 million, and repayment of mortgage notes in the amount of $42.1$58.0 million.
Contractual Obligations, Commitments and Contingencies of the Company
The following table sets forth the known contractual obligations of the Company on an undiscounted basis. This table excludes obligations of the Company that are not fixed and determinable, including the Management Agreement (dollars in thousands):
| | | | | Payments Due by Period | | | | | | | | | | | |
| | | | | | | | | | | | | Payments Due by Period |
| | | Total | | Less than a Year | | 1-3 Years | | 3-5 Years | | More than 5 Years | | Total | | Less than a Year | | 1-3 Years | | 3-5 Years | | More than 5 Years |
Bank credit facility(1) | | $ | 36,017 |
| | $ | 2,399 |
| | $ | 4,799 |
| | $ | 28,819 |
| | $ | — |
| | $ | 254,129 |
| | $ | 11,485 |
| | $ | 242,644 |
| | $ | — |
| | $ | — |
|
Secured debt(2) | | 1,992,474 |
| | 428,771 |
| | 616,513 |
| | 173,625 |
| | 773,565 |
| | 3,344,583 |
| | 1,182,494 |
| | 772,302 |
| | 325,104 |
| | 1,064,683 |
|
Securitization bonds payable(3) | | 130,225 |
| | 130,225 |
| | — |
| | — |
| | — |
| | 23,383 |
| | 23,383 |
| | — |
| | — |
| | — |
|
Ground lease obligations(4) | | 14,452 |
| | 2,821 |
| | 5,582 |
| | 3,852 |
| | 2,197 |
| | 38,600 |
| | 3,129 |
| | 6,242 |
| | 5,432 |
| | 23,797 |
|
| | | 2,173,168 |
| | $ | 564,216 |
| | $ | 626,894 |
| | $ | 206,296 |
| | $ | 775,762 |
| | 3,660,695 |
| | $ | 1,220,491 |
| | $ | 1,021,188 |
| | $ | 330,536 |
| | $ | 1,088,480 |
|
Lending commitments(5) | | 146,622 |
| | | | | | | | | | 237,586 |
| | | | | | | | |
| Total | | $ | 2,319,790 |
| | | | | | | | | | $ | 3,898,281 |
| | | | | | | | |
| |
| (1) | Future interest payments were estimated based on the applicable index at June 30, 20182019 and unused commitment fee of 0.35% per annum, assuming principal is repaid on the finalcurrent maturity date of February 2023.2022. |
| |
| (2) | Amounts include minimum principal and interest obligations through the initial maturity date of the collateral assets. Interest on floating rate debt was determined based on the applicable index at June 30, 2018.2019. |
| |
| (3) | The timing of future principal payments was estimated based on expected future cash flows of underlying collateral loans. Repayments are estimated to be earlier than contractual maturity only if proceeds from underlying loans are repaid by the borrowers. |
| |
| (4) | The Company assumed noncancellable operating ground leases as lessee or sublessee in connection with net lease properties acquired through the CLNY Contributions. The amounts represent minimum future base rent commitments through initial expiration dates of the respective leases, excluding any contingent rent payments. Rents paid under ground leases are recoverable from tenants. |
| |
| (5) | Future lending commitments may be subject to certain conditions that borrowers must meet to qualify for such fundings. Commitment amount assumes future fundings meet the terms to qualify for such fundings. |
Guarantees and Off-Balance Sheet Arrangements
As of June 30, 2018,2019, we are not dependent on the use of any off-balance sheet financing arrangements for liquidity. We have made investments in unconsolidated ventures. Refer to Note 5, “Investments in Unconsolidated Ventures” in Part I, Item 1. “Financial Statements” for a discussion of such unconsolidated ventures in our consolidated financial statements. In each case, our exposure to loss is limited to the carrying value of our investment.
Our Investment Strategy
Our objective is to generate consistent and attractive risk-adjusted returns to our stockholders. We seek to achieve this objective primarily through cash distributions and the preservation of invested capital and secondarily through capital appreciation. We believe our diversified investment strategy across the CRE capital stack provides flexibility through economic cycles to achieve attractive risk-adjusted returns. This approach is driven by a disciplined investment strategy, focused on:
capitalizing on asset level underwriting experience and market analytics to identify investments with pricing dislocations and attractive risk-return profiles;
originating and structuring CRE senior mortgage loans, mezzanine loans and preferred equity with attractive return profiles relative to the underlying value and financial operating performance of the real estate collateral, given the strength and quality of the sponsorship;
identifying appropriate CRE debt securities investments based on the performance of the underlying real estate assets, the impact of such performance on the credit return profile of the investments and our expected return on the investments;
identifying net leased real estate investments based on property location and purpose, tenant credit quality, market lease rates and potential appreciation of, and alternative uses for, the real estate;
creating capital appreciation opportunities through active asset management and equity participation opportunities; and
structuring transactions with a prudent amount of leverage, if any, given the risk of the underlying asset’s cash flows, attempting to match the structure and duration of the financing with the underlying asset’s cash flows, including through the use of hedges, as appropriate.
The period for which we intend to hold our investments will vary depending on the type of asset, interest rates, investment performance, micro and macro real estate environment, capital markets and credit availability, among other factors. We generally expect to hold debt investments until the stated maturity and equity investments in accordance with each investment’s proposed business plan. We may sell all or a partial ownership interest in an investment before the end of the expected holding period if we believe that market conditions have maximized its value to us or the sale of the asset would otherwise be in the best interests of our stockholders.
Our investment strategy is dynamic and flexible, enabling us to adapt to shifts in economic, real estate and capital market conditions and to exploit market inefficiencies. We may expand or change our investment strategy or target assets over time in response to opportunities available in different economic and capital market conditions. This flexibility in our investment strategy allows us to employ a customized, solutions-oriented approach, which we believe is attractive to borrowers and tenants. We believe that our diverse portfolio, our ability to originate, acquire and manage our target assets and the flexibility of our investment strategy positions us to capitalize on market inefficiencies and generate attractive long-term risk-adjusted returns for our stockholders through a variety of market conditions and economic cycles.
Underwriting, Asset and Risk Management
Our Manager closely monitors our portfolio and actively manages risks associated with, among other things, our assets and interest rates. Prior to investing in any particular asset, our Manager’s underwriting team, in conjunction with third party providers, undertakes a rigorous asset-level due diligence process, involving intensive data collection and analysis, to ensure that we understand fully the state of the market and the risk-reward profile of the asset. Prior to making a final investment decision, our Manager focuses on portfolio diversification to determine whether a target asset will cause our portfolio to be too heavily concentrated with, or cause too much risk exposure to, any one borrower, real estate sector, geographic region, source of cash flow for payment or other geopolitical issues. If our Manager determines that a proposed acquisition presents excessive concentration risk, it may determine not to acquire an otherwise attractive asset.
For each asset that we acquire, our Manager’s asset management team engages in active management of the asset, the intensity of which depends on the attendant risks. The asset manager works collaboratively with the underwriting team to formulate a strategic plan for the particular asset, which includes evaluating the underlying collateral and updating valuation assumptions to reflect changes in the real estate market and the general economy. This plan also generally outlines several strategies for the asset to extract the maximum amount of value from each asset under a variety of market conditions. Such strategies may vary depending on the type of asset, the availability of refinancing options, recourse and maturity, but may include, among others, the restructuring of non-performing or sub-performing loans, the negotiation of discounted pay-offs or other modification of the terms governing a loan, and the foreclosure and management of assets underlying non-performing loans in order to reposition them for profitable disposition. Our Manager and its affiliates will continuously track the progress of an asset against the original business plan to ensure that the attendant risks of continuing to own the asset do not outweigh the associated rewards. Under these circumstances, certain assets will require intensified asset management in order to achieve optimal value realization.
Our Manager’s asset management team engages in a proactive and comprehensive on-going review of the credit quality of each asset it manages. In particular for debt investments, on at least an annual basis, the asset management team will evaluate the financial wherewithal of individual borrowers to meet contractual obligations as well as review the financial stability of the assets securing such debt investments. Further, there is ongoing review of borrower covenant compliance including the ability of borrowers to meet certain negotiated debt service coverage ratios and debt yield tests. For equity investments, the asset management team, with the assistance of third party property managers, monitors and reviews key metrics such as occupancy, same store sales, tenant payment rates, property budgets and capital expenditures. If through this analysis of credit quality, the asset management team encounters declines in credit not in accord with the original business plan, the team evaluates the risks and determine what changes, if any, are required to the business plan to ensure that the attendant risks of continuing to hold the investment do not outweigh the associated rewards.
In addition, the audit committee of our board of directors, in consultation with management, periodically reviews our policies with respect to risk assessment and risk management, including key risks to which we are subject, including credit risk, liquidity risk and market risk, and the steps that management has taken to monitor and control such risks.
Inflation
Virtually all of our assets and liabilities are interest rate sensitive in nature. As a result, interest rates and other factors influence our performance significantly more than inflation does. A change in interest rates may correlate with the inflation rate. Substantially all of the leases at our multifamily and student housing properties allow for monthly or annual rent increases which provide us with the opportunity to achieve increases, where justified by the market, as each lease matures. Such types of leases generally minimize the risks of inflation on our multifamily and student housing properties.
Refer to Item 3, “Quantitative and Qualitative Disclosures About Market Risk” for additional details.
Critical Accounting Policies
Our consolidated financial statements are prepared in accordance with accounting principles generally accepted in the United States, or U.S. GAAP, which requires the use of estimates and assumptions that involve the exercise of judgment and that affect the reported amounts of assets and liabilities at the date of the consolidated financial statements and the reported amounts of revenues and expenses during the reporting period. There have been no material changes to our critical accounting policies since the filing of our Annual Report on Form 10-K for the fiscal year ended December 31, 2017.2018.
Recent Accounting PronouncementsUpdates
For recent accounting pronouncements,updates, refer to Note 2, “Summary of Significant Accounting Policies” in our accompanying consolidated financial statements included in Part I, Item 1.1, “Financial Statements.”
Item 3. Quantitative and Qualitative Disclosures About Market Risk
Our primary market risks are interest rate risk, prepayment risk, extension risk, credit risk, real estate market risk, and capital market risk and foreign currency risk, either directly through the assets held or indirectly through investments in unconsolidated ventures.
Interest Rate Risk
Interest rate risk relates to the risk that the future cash flow of a financial instrument will fluctuate because of changes in market interest rates. Interest rate risk is highly sensitive to many factors, including governmental, monetary and tax policies, domestic and international economic and political considerations and other factors beyond our control. Credit curve spread risk is highly sensitive to the dynamics of the markets for loans and securities we hold. Excessive supply of these assets combined with reduced demand will cause the market to require a higher yield. This demand for higher yield will cause the market to use a higher spread over the U.S. Treasury securities yield curve, or other benchmark interest rates, to value these assets.
As U.S. Treasury securities are priced to a higher yield and/or the spread to U.S. Treasuries used to price the assets increases, the price at which we could sell some of our fixed rate financial assets may decline. Conversely, as U.S. Treasury securities are priced to a lower yield and/or the spread to U.S. Treasuries used to price the assets decreases, the value of our fixed rate financial assets may increase. Fluctuations in LIBOR may affect the amount of interest income we earn on our floating rate borrowings and interest expense we incur on borrowings indexed to LIBOR, including under credit facilities and investment-level financing.
We utilize a variety of financial instruments on some of our investments, including interest rate swaps, caps, floors and other interest rate exchange contracts, in order to limit the effects of fluctuations in interest rates on their operations. The use of these types of derivatives to hedge interest-earning assets and/or interest-bearing liabilities carries certain risks, including the risk that losses on a hedge position will reduce the funds available for distribution and that such losses may exceed the amount invested in such instruments. A hedge may not perform its intended purpose of offsetting losses of rising interest rates. Moreover, with respect to certain of the instruments used as hedges, there is exposure to the risk that the counterparties may cease making markets and quoting prices in such instruments, which may inhibit the ability to enter into an offsetting transaction with respect to an open position. Our profitability may be adversely affected during any period as a result of changing interest rates.
As of June 30, 2018,2019, a hypothetical 100 basis point increase in the applicable interest rate benchmark on our loan portfolio would increase interest income by $9.3$5.6 million annually, net of interest expense.
Prepayment risk
Prepayment risk is the risk that principal will be repaid at a different rate than anticipated, resulting in a less than expected return on an investment. As prepayments of principal are received, any premiums paid on such assets are amortized against interest income, while any discounts on such assets are accreted into interest income. Therefore, an increase in prepayment rates has the following impact: (i) accelerates amortization of purchase premiums, which reduces interest income earned on the assets; and conversely, (ii) accelerates accretion of purchase discounts, which increases interest income earned on the assets.
Extension risk
The weighted average life of assets is projected based on assumptions regarding the rate at which borrowers will prepay or extend their mortgages. If prepayment rates decrease or extension options are exercised by borrowers at a rate that deviates significantly from projections, the life of fixed rate assets could extend beyond the term of the secured debt agreements. This in turn could negatively impact liquidity to the extent that assets may have to be sold and losses may be incurred as a result.
Credit risk
Investment in loans receivableheld for investment is subject to a high degree of credit risk through exposure to loss from loan defaults. Default rates are subject to a wide variety of factors, including, but not limited to, borrower financial condition, property
performance, property management, supply/demand factors, construction trends, consumer behavior, regional economics, interest rates, the strength of the U.S. economy and other factors beyond our control. All loans are subject to a certain probability of default. We manage credit risk through the underwriting process, acquiring investments at the appropriate discount to face value, if any, and establishing loss assumptions. Performance of the loans is carefully monitored, including those held through joint venture investments, as well as external factors that may affect their value.
We are also subject to the credit risk of the tenants in our properties. We seek to undertake a rigorous credit evaluation of the tenants prior to acquiring properties. This analysis includes an extensive due diligence investigation of the tenants’ businesses, as well as an assessment of the strategic importance of the underlying real estate to the respective tenants’ core business operations. Where appropriate, we may seek to augment the tenants’ commitment to the properties by structuring various credit enhancement mechanisms into the underlying leases. These mechanisms could include security deposit requirements or guarantees from entities that are deemed credit worthy.
Real estate market risk
We are exposed to the risks generally associated with the commercial real estate market. The market values of commercial real estate are subject to volatility and may be affected adversely by a number of factors, including, but not limited to, national, regional and local economic conditions, as well as changes or weakness in specific industry segments, and other macroeconomic factors beyond our control, which could affect occupancy rates, capitalization rates and absorption rates. This in turn could impact the performance of tenants and borrowers. We seek to manage these risks through their underwriting due diligence and asset management processes.
Capital markets risk
We are exposed to risks related to the debt capital markets, specifically the ability to finance our business through borrowings under secured revolving repurchase facilities, secured and unsecured warehouse facilities or other debt instruments. We seek to
mitigate these risks by monitoring the debt capital markets to inform their decisions on the amount, timing and terms of their borrowings.
Foreign Currency Risk
We have foreign currency rate exposures related to our foreign currency-denominated investments held by our foreign subsidiaries. Changes in foreign currency rates can adversely affect the fair values and earning of our non-U.S. holdings. We generally mitigate this foreign currency risk by utilizing currency instruments to hedge our net investments in our foreign subsidiaries. The type of hedging instruments that we employ on our foreign subsidiary investments are forwards.
At June 30, 2019, we had approximately NOK 913.9 million and €184.6 million or a total of $317.1 million, in net investments in our European subsidiaries. A 1.0% change in these foreign currency rates would result in a $3.2 million increase or decrease in translation gain or loss included in other comprehensive income in connection with our European subsidiaries.
A summary of the foreign exchange contracts in place at June 30, 2019, including notional amount and key terms, is included in Note 16, “Derivatives,” to Part I, Item 1, “Financial Statements.” The maturity dates of these instruments approximate the projected dates of related cash flows for specific investments. Termination or maturity of currency hedging instruments may result in an obligation for payment to or from the counterparty to the hedging agreement. We are exposed to credit loss in the event of non-performance by counterparties for these contracts. To manage this risk, we select major international banks and financial institutions as counterparties and perform a quarterly review of the financial health and stability of our trading counterparties. Based on our review at June 30, 2019, we do not expect any counterparty to default on its obligations.
Item 4. Controls and Procedures
Evaluation of Disclosure Controls and Procedures
We maintain disclosure controls and procedures, as defined in Rules 13a-15(e) and 15d-15(e) under the Exchange Act, that are designed to assureensure that information required to be disclosed in our Exchange Act reports is recorded, processed, summarized and reported within the time periods specified in the Security and Exchange Commission’s (“SEC’s”)SEC’s rules and forms, and that such information is accumulated and communicated to our management, including our Chief Executive Officer and Chief Financial Officer, as appropriate, to allow timely decisions regarding required disclosure.
As required by Rule 13a-15(b) under the Exchange Act, our management carried out an evaluation, under the supervision and with the participation of our Chief Executive Officer and Chief Financial Officer, of the effectiveness of our disclosure controls and procedures. Based on this evaluation, our Chief Executive Officer and Chief Financial Officer concluded that as of June 30, 2018,2019, our disclosure controls and procedures were effective at theproviding reasonable assurance level such thatregarding the reliability of the information
required to be disclosed by us in reports that we file under the Exchange Act is recorded, processed, summarized and reported within the time periods specified in SEC rules and forms.
Internal Control over Financial Reporting
Changes in Internal Control over Financial Reporting.Reporting
There have not been anyno changes in our internal control over financial reporting (as defined in Rules 13a-15(f) and 15d-15(f) under the Exchange Act) during the most recent fiscal quarter that materially affected, or are reasonably likely to materially affect, our internal control over financial reporting.
PART II. Other Information
Item 1. Legal Proceedings
Neither the Company nor our Manager is currently subject to any material legal proceedings. We anticipate that we may from time to time be involved in various litigation matterslegal actions arising in the ordinary course of our business. Although we are unable to predict with certaintybusiness, the eventual outcome of any litigation, in the opinion of management, any current legal proceedings arewhich we would not expectedexpect to have a material adverse effect on our financial position, or results of operations.operations or cash flow.
Item 1A. Risk Factors
There are no material changes from the risk factors previously disclosed in our Annual Report on Form 10-K for the fiscal year ended December 31, 20172018 as filed with the SEC on March 23, 2018.February 28, 2019.
Item 2. Unregistered Sales of Equity Securities and Use of Proceeds
Issuer RepurchaseThere were no sales of Equity Securities
Duringunregistered securities of our Company during the six months ended June 30, 2018, we2019, other than those previously disclosed in filings with the SEC.
Purchases of Equity Securities by Issuer
The Company did not purchase any of our Class A common stock during the three months ended June 30, 2019.
The Company’s board of directors authorized a stock repurchase program (the “Stock Repurchase Program”), under which the Company may repurchase up to $300.0 million of its outstanding Class A common stock through March 31, 2020. Under the Stock Repurchase Program, the Company may repurchase shares in open market purchases, through tender offers or otherwise in accordance with all applicable securities laws and regulations, including Rule 10b-18 of the Securities Exchange Act of 1934, as amended. As of June 30, 2019, the Company had not repurchased any shares of our common stock.under the Stock Repurchase Program.
Item 3. Defaults Upon Senior Securities
None.
Item 4. Mine Safety Disclosures
Not applicableapplicable.
Item 5. Other Information
None.
Item 6. Exhibits
|
| | | |
| Exhibit Number | | Description of Exhibit |
| 2.1 |
| | Amended and Restated Master Combination Agreement, dated as of November 20, 2017, among Colony Capital Operating Company, LLC, NRF RED REIT Corp., NorthStar Real Estate Income Trust, Inc., NorthStar Real Estate Income Trust Operating Partnership, LP, NorthStar Real Estate Income II, Inc., NorthStar Real Estate Income Operating Partnership II, LP, Colony NorthStar Credit Real Estate, Inc. and Credit RE Operating Company, LLC (incorporated by reference to Exhibit 2.1 to the Company’s Registration Statement on Form S-4 (No. 333-221685) effective December 6, 2017) |
3.1* |
3.1 | | |
| 3.2 |
| | |
| 10.1 |
| | Second Amended and Restated Master Repurchase and Securities Contract Agreement, dated as of April 20, 2018,23, 2019, by and among MS Loan NT-I, LLC, MS Loan NT-II, LLC, CLNC Credit 1, LLC, CLNC Credit 2, LLC, CLNC Credit 1EU, LLC, CLNC Credit 1UK, LLC and Morgan Stanley Bank, N.A. (incorporated by reference to Exhibit 10.1 to the Company’s Current Report on Form 8-K (No. 001-38377) filed on April 25, 2018)26, 2019) |
| 10.2 |
| | AmendedRatification, Reaffirmation and Restated Guaranty Agreement, madeConfirmation of Transaction Documents, dated as of April 20, 2018,23, 2019, by and among MS Loan NT-I, LLC, MS Loan NT-II, LLC, CLNC Credit 1, LLC, CLNC Credit 2, LLC, CLNC Credit 1EU, LLC, CLNC Credit 1UK, LLC, Credit RE Operating Company, LLC in favor ofand Morgan Stanley Bank, N.A. (incorporated by reference to Exhibit 10.210.3 to the Company’s Current Report on Form 8-K (No. 001-38377) filed on April 25, 2018)26, 2019) |
| 10.3 |
| | Amended and Restated Master Repurchase Agreement, dated as of April 23, 2018,26, 2019, by and among NSREIT CB Loan, LLC, CB Loan NT-II, LLC, CLNC Credit 3, LLC, CLNC Credit 4, LLC, CLNC Credit 3EU, LLC, CLNC Credit 3UK, LLC and Citibank, N.A. (incorporated by reference to Exhibit 10.1 to the Company’s Current Report on Form 8-K (No. 001-38377) filed on April 25, 2018)May 1, 2019) |
| 10.4 |
| | Omnibus Amendment to Other Transaction Documents and Reaffirmation of Guaranty, madedated as of April 23, 2018,26, 2019, by and among NSREIT CB Loan, LLC, CB Loan NT-II, LLC, CLNC Credit 3, LLC, CLNC Credit 4, LLC, CLNC Credit 3EU, LLC, CLNC Credit 3UK, LLC, Credit RE Operating Company, LLC for the benefit ofand Citibank, N.A. (incorporated by reference to Exhibit 10.2 to the Company’s Current Report on Form 8-K (No. 001-38377) filed on April 25, 2018) |
10.5 |
| | |
10.6 |
| | |
10.7 |
| | |
10.8 |
| | |
| 31.1* |
| | |
| 31.2* |
| | |
| 32.1* |
| | |
| 32.2* |
| | |
101* |
101.INS* | | The following materials fromXBRL Instance Document - the Colony Credit Real Estate, Inc. Quarterly Report on Form 10-Q forinstance document does not appear in the quarterly period ended June 30, 2018, formatted inInteractive Data File because its XBRL (eXtensible Business Reporting Language): (i) Consolidated Balance Sheets as of June 30, 2018 (unaudited) and December 31, 2017; (ii) Consolidated Statements of Operations (unaudited) fortags are embedded within the three and six months ended June 30, 2018 and 2017; (iii) Consolidated Statements of Comprehensive Income (Loss) (unaudited) for the three and six months ended June 30, 2018 and 2017; (iv) Consolidated Statements of Equity (unaudited) for the six months ended June 30, 2018 and 2017; (v) Consolidated Statements of Cash Flows (unaudited) for the six months ended June 30, 2018 and 2017; and (vi) Notes to Consolidated Financial Statements (unaudited)Inline XBRL document |
| 101.SCH* | | Inline XBRL Taxonomy Extension Schema Document |
| 101.CAL* | | Inline XBRL Taxonomy Extension Calculation Linkbase Document |
| 101.DEF* | | Inline XBRL Taxonomy Extension Definition Linkbase Document |
| 101.LAB* | | Inline XBRL Taxonomy Extension Label Linkbase Document |
| 101.PRE* | | Inline XBRL Taxonomy Extension Presentation Linkbase Document |
* Filed herewith
SIGNATURES
Pursuant to the requirements of Section 13 or 15(d) of the Securities Exchange Act of 1934, as amended, the registrantRegistrant has duly caused this report to be signed on its behalf by the undersigned thereunto duly authorized.
Dated: August 9, 2018 8, 2019
|
| | |
| COLONY CREDIT REAL ESTATE, INC. |
| | | |
| By: | | /s/ Kevin P. Traenkle |
| | | Kevin P. Traenkle |
| | | Chief Executive Officer and President and Director |
| | | (Principal Executive Officer) |
| | | |
| By: | | /s/ Sujan S. PatelNeale W. Redington |
| | | Sujan S. PatelNeale W. Redington |
| | | Chief Financial Officer (Principal Financial Officer) |
| | | |
| By: | | /s/ Neale W. RedingtonFrank V. Saracino |
| | | Neale W. RedingtonFrank V. Saracino |
| | | Chief Accounting Officer (Principal Accounting Officer) |