61
COLONY CREDIT REAL ESTATE, INC.
NOTES TO CONSOLIDATED FINANCIAL STATEMENTS (Continued)
(Unaudited)
As of June 30, 20192020 and December 31, 2018,2019, fair value of derivative assets and derivative liabilities were as follows (dollars in thousands):
| June 30, 2019 | December 31, 2018 | |||||||||||||||||||||||
| Designated Hedges | Non-Designated Hedges | Total | Designated Hedges | Non-Designated Hedges | Total | |||||||||||||||||||
| Derivative Assets | ||||||||||||||||||||||||
| Foreign exchange contracts | $ | 18,004 | $ | 3,180 | $ | 21,184 | $ | 11,312 | $ | 2,796 | $ | 14,108 | ||||||||||||
| Interest rate contracts | — | 5 | 5 | — | 31 | 31 | ||||||||||||||||||
| Included in other assets | $ | 18,004 | $ | 3,185 | $ | 21,189 | $ | 11,312 | $ | 2,827 | $ | 14,139 | ||||||||||||
| Derivative Liabilities | ||||||||||||||||||||||||
| Foreign exchange contracts | $ | (8 | ) | $ | — | $ | (8 | ) | $ | (10 | ) | $ | — | $ | (10 | ) | ||||||||
| Interest rate contracts | — | (16,273 | ) | (16,273 | ) | — | (6,032 | ) | (6,032 | ) | ||||||||||||||
| Included in accrued and other liabilities | $ | (8 | ) | $ | (16,273 | ) | $ | (16,281 | ) | $ | (10 | ) | $ | (6,032 | ) | $ | (6,042 | ) | ||||||
| June 30, 2020 | December 31, 2019 | ||||||||||||||||||||||||||||||||||||||||||||||||||||
| Non-Designated Hedges | Total | Designated Hedges | Non-Designated Hedges | Total | |||||||||||||||||||||||||||||||||||||||||||||||||
| Derivative Assets | |||||||||||||||||||||||||||||||||||||||||||||||||||||
| Foreign exchange contracts | $ | — | $ | — | $ | — | $ | 4,122 | $ | 4,122 | |||||||||||||||||||||||||||||||||||||||||||
| Interest rate contracts | 7 | 7 | — | — | — | ||||||||||||||||||||||||||||||||||||||||||||||||
| Included in other assets | $ | 7 | $ | 7 | $ | — | $ | 4,122 | $ | 4,122 | |||||||||||||||||||||||||||||||||||||||||||
| Derivative Liabilities | |||||||||||||||||||||||||||||||||||||||||||||||||||||
| Foreign exchange contracts | $ | — | $ | — | $ | (2,128) | $ | (29) | $ | (2,157) | |||||||||||||||||||||||||||||||||||||||||||
| Interest rate contracts | (44) | (44) | — | (16,976) | (16,976) | ||||||||||||||||||||||||||||||||||||||||||||||||
| Included in accrued and other liabilities | $ | (44) | $ | (44) | $ | (2,128) | $ | (17,005) | $ | (19,133) | |||||||||||||||||||||||||||||||||||||||||||
As of June 30, 2019,2020, the Company’s counterparties held $16.8$0.1 million in cash collateral for the derivative contracts.collateral.
The following table summarizes the foreign exchange andCompany’s interest rate contracts as of June 30, 2019:2020:
| Type of Derivatives | Notional Currency | Notional Amount (in thousands) | Range of Maturity Dates | |||||||||
| Designated | Non-Designated | |||||||||||
| FX Forward | EUR | € | 164,533 | € | — | December 2019 - June 2023 | ||||||
| FX Forward | NOK | NOK 585,600 | NOK 341,548 | July 2019 - July 2023 | ||||||||
| Interest Rate Swap | USD | $ | — | $ | 404,052 | April 2020 - August 2028 | ||||||
| Type of Derivatives | Notional Currency | Notional Amount (in thousands) | Range of Maturity Dates | |||||||||||||||||||||||||||||
| Designated | Non-Designated | |||||||||||||||||||||||||||||||
| Interest Rate Swap | USD | $ | — | $ | 109,637 | April 2021 - July 2023 | ||||||||||||||||||||||||||
The table below represents the effect of the derivative financial instruments on the consolidated statements of operations and of comprehensive income (loss) for the three and six months ended June 30, 20192020 and 20182019 (dollars in thousands):
| Three Months Ended June 30, | Six Months Ended June 30, | |||||||||||||||||||||||||||||||||||||
| 2020 | 2019 | 2020 | 2019 | |||||||||||||||||||||||||||||||||||
| Other gain (loss), net | ||||||||||||||||||||||||||||||||||||||
| Non-designated foreign exchange contracts | $ | 8,556 | $ | 141 | $ | 4,474 | $ | 378 | ||||||||||||||||||||||||||||||
| Non-designated interest rate contracts | (721) | (6,178) | (17,091) | (10,261) | ||||||||||||||||||||||||||||||||||
| $ | 7,835 | $ | (6,037) | $ | (12,617) | $ | (9,883) | |||||||||||||||||||||||||||||||
| Other income | ||||||||||||||||||||||||||||||||||||||
| Non-designated foreign exchange contracts | $ | (8,560) | $ | — | $ | 178 | $ | — | ||||||||||||||||||||||||||||||
| Non-designated interest rate contracts | — | — | — | — | ||||||||||||||||||||||||||||||||||
| $ | (8,560) | $ | — | $ | 178 | $ | — | |||||||||||||||||||||||||||||||
| Accumulated other comprehensive income (loss) | ||||||||||||||||||||||||||||||||||||||
| Designated foreign exchange contracts | $ | — | $ | 938 | $ | 21,764 | $ | 8,333 | ||||||||||||||||||||||||||||||
| $ | — | $ | 938 | $ | 21,764 | $ | 8,333 | |||||||||||||||||||||||||||||||
| Three Months Ended June 30, | Six Months Ended June 30, | |||||||||||||||
| 2019 | 2018 | 2019 | 2018 | |||||||||||||
| Other gain (loss), net | ||||||||||||||||
| Non-designated foreign exchange contracts | $ | 141 | $ | — | $ | 378 | $ | — | ||||||||
| Non-designated interest rate contracts | (6,178 | ) | 10 | (10,261 | ) | 32 | ||||||||||
| $ | (6,037 | ) | $ | 10 | $ | (9,883 | ) | $ | 32 | |||||||
| Accumulated other comprehensive income (loss) | ||||||||||||||||
| Designated foreign exchange contracts | $ | 938 | $ | — | $ | 8,333 | $ | — | ||||||||
| 938 | — | 8,333 | — | |||||||||||||
| Interest income | ||||||||||||||||
| Non-designated interest rate contracts | $ | — | $ | 825 | $ | — | $ | 680 | ||||||||
During the six months ended June 30, 2020, the Company unwound its remaining interest rate swaps and realized a loss of $34.0 million, which is included in other loss, net on its consolidated statement of operations. This was previously recorded as an unrealized loss as of March 31, 2020.
At the end of each quarter, the Company reassesses the effectiveness of its net investment hedges and as appropriate, dedesignates the portion of the derivative notional that is in excess of the beginning balance of its net investments as non-designated hedges. Any unrealized gain or loss on the dedesignated portion of net investment hedges is transferred into earnings, recorded in other gain (loss), net. During the three and six months ended June 30, 2020 and 2019, and 2018, no0 gain (loss) was transferred from accumulated other comprehensive income (loss).
62
COLONY CREDIT REAL ESTATE, INC.
NOTES TO CONSOLIDATED FINANCIAL STATEMENTS (Continued)
(Unaudited)
Offsetting Assets and Liabilities
The Company enters into agreements subject to enforceable netting arrangements with its derivative counterparties that allow the Company to offset the settlement of derivative assets and liabilities in the same currency by derivative instrument type or, in the event of default by the counterparty, to offset all derivative assets and liabilities with the same counterparty. The Company has elected not to net derivative asset and liability positions, notwithstanding the conditions for right of offset may have been met.
The Company presents derivative assets and liabilities with the same counterparty on a gross basis on the consolidated balance sheets.
The following table sets forth derivative positions where the Company has a right of offset under netting arrangements with the same counterparty as of June 30, 20192020 and December 31, 20182019 (dollars in thousands):
| Gross Amounts of Assets (Liabilities) Included on Consolidated Balance Sheets | Gross Amounts Not Offset on Consolidated Balance Sheets | Net Amounts of Assets (Liabilities) | ||||||||||||||
| (Assets) Liabilities | Cash Collateral Pledged | |||||||||||||||
| June 30, 2019 | ||||||||||||||||
| Derivative Assets | ||||||||||||||||
| Foreign exchange contracts | $ | 21,184 | $ | (8 | ) | $ | — | $ | 21,176 | |||||||
| Interest rate contracts | 5 | (5 | ) | — | — | |||||||||||
| $ | 21,189 | $ | (13 | ) | $ | — | $ | 21,176 | ||||||||
| Derivative Liabilities | ||||||||||||||||
| Foreign exchange contracts | $ | (8 | ) | $ | 8 | $ | — | $ | — | |||||||
| Interest rate contracts | (16,273 | ) | 5 | 16,268 | — | |||||||||||
| $ | (16,281 | ) | $ | 13 | $ | 16,268 | $ | — | ||||||||
| December 31, 2018 | ||||||||||||||||
| Derivative Assets | ||||||||||||||||
| Foreign exchange contracts | $ | 14,108 | $ | (10 | ) | $ | — | $ | 14,098 | |||||||
| Interest rate contracts | 31 | — | — | 31 | ||||||||||||
| $ | 14,139 | $ | (10 | ) | $ | — | $ | 14,129 | ||||||||
| Derivative Liabilities | ||||||||||||||||
| Foreign exchange contracts | $ | (10 | ) | $ | 10 | $ | — | $ | — | |||||||
| Interest rate contracts | (6,032 | ) | — | 5,490 | (542 | ) | ||||||||||
| $ | (6,042 | ) | $ | 10 | $ | 5,490 | $ | (542 | ) | |||||||
| Gross Amounts of Assets (Liabilities) Included on Consolidated Balance Sheets | Gross Amounts Not Offset on Consolidated Balance Sheets | Net Amounts of Assets (Liabilities) | ||||||||||||||||||||||||||||||
| (Assets) Liabilities | Cash Collateral Pledged | |||||||||||||||||||||||||||||||
| June 30, 2020 | ||||||||||||||||||||||||||||||||
| Derivative Assets | ||||||||||||||||||||||||||||||||
| Interest rate contracts | $ | 7 | $ | (7) | $ | — | $ | — | ||||||||||||||||||||||||
| $ | 7 | $ | (7) | $ | — | $ | — | |||||||||||||||||||||||||
| Derivative Liabilities | ||||||||||||||||||||||||||||||||
| Interest rate contracts | $ | (44) | $ | 7 | $ | 37 | $ | — | ||||||||||||||||||||||||
| $ | (44) | $ | 7 | $ | 37 | $ | — | |||||||||||||||||||||||||
| December 31, 2019 | ||||||||||||||||||||||||||||||||
| Derivative Assets | ||||||||||||||||||||||||||||||||
| Foreign exchange contracts | $ | 4,122 | $ | (2,157) | $ | — | $ | 1,965 | ||||||||||||||||||||||||
| $ | 4,122 | $ | (2,157) | $ | — | $ | 1,965 | |||||||||||||||||||||||||
| Derivative Liabilities | ||||||||||||||||||||||||||||||||
| Foreign exchange contracts | $ | (2,157) | $ | 2,157 | $ | — | $ | — | ||||||||||||||||||||||||
| Interest rate contracts | (16,976) | — | 16,976 | — | ||||||||||||||||||||||||||||
| $ | (19,133) | $ | 2,157 | $ | 16,976 | $ | — | |||||||||||||||||||||||||
16. Commitments and Contingencies
Lending Commitments
The Company has lending commitments to borrowers pursuant to certain loan agreements in which the borrower may submit a request for funding contingent on achieving certain criteria, which must be approved by the Company as lender, such as leasing, performance of capital expenditures and construction in progress with an approved budget. At June 30, 2019,2020, assuming the terms to qualify for future fundings, if any, have been met, total unfunded lending commitments for loans and preferred equity held for investment was $200.9$164.2 million for senior loans, $3.3$12.4 million for securitized loans, $0.1 million for corporate term loans, and $21.9$28.4 million for mezzanine loans.loans and $1.4 million for loans held for sale. Total unfunded commitments for equity method investments was $11.4$39.3 million.
Ground Lease Obligation
The Company'sCompany’s operating leases are ground leases acquired with real estate.
At June 30, 2019,2020, the weighted average remaining lease terms were 15.814.5 years for ground leases.
63
COLONY CREDIT REAL ESTATE, INC.
NOTES TO CONSOLIDATED FINANCIAL STATEMENTS (Continued)
(Unaudited)
| Three Months Ended June 30, 2019 | Six Months Ended June 30, 2019 | |||||||
| Operating lease expense: | ||||||||
| Minimum lease expense | $ | 735 | $ | 1,544 | ||||
| Variable lease expense | — | — | ||||||
| $ | 735 | $ | 1,544 | |||||
| Three Months Ended June 30, | Six Months Ended June 30, | |||||||||||||||||||||||||||||||||||||
| 2020 | 2019 | 2020 | 2019 | |||||||||||||||||||||||||||||||||||
| Operating lease expense: | ||||||||||||||||||||||||||||||||||||||
| Minimum lease expense | $ | 797 | $ | 735 | $ | 1,601 | $ | 1,544 | ||||||||||||||||||||||||||||||
| Variable lease expense | — | — | — | — | ||||||||||||||||||||||||||||||||||
| $ | 797 | $ | 735 | $ | 1,601 | $ | 1,544 | |||||||||||||||||||||||||||||||
The operating lease liability was determined using a weighted average discount rate of 5.3%5.2%. The following table presents future minimum rental payments, excluding contingent rents, on noncancelablenoncancellable ground leases on real estate as of June 30, 20192020 (dollars in thousands):
| Remainder of 2019 | $ | 1,565 | ||
| 2020 | 3,128 | |||
| 2021 | 3,112 | |||
| 2022 | 3,140 | |||
| 2023 | 2,732 | |||
| 2024 and thereafter | 24,923 | |||
| Total lease payments | 38,600 | |||
| Less: Present value discount | 13,337 | |||
| Operating lease liability (Note 9) | $ | 25,263 | ||
| Remainder of 2020 | $ | 1,593 | ||||||
| 2021 | 3,171 | |||||||
| 2022 | 3,199 | |||||||
| 2023 | 3,229 | |||||||
| 2024 | 2,338 | |||||||
| 2025 and thereafter | 21,725 | |||||||
| Total lease payments | 35,255 | |||||||
| Less: Present value discount | 11,445 | |||||||
| Operating lease liability (Note 8) | $ | 23,810 | ||||||
The following table presents future minimum rental payments, excluding contingent rents, on noncancelablenoncancellable ground leases on real estate as of December 31, 20182019 (dollars in thousands):
| 2019 | $ | 2,821 | ||
| 2020 | 2,819 | |||
| 2021 | 2,804 | |||
| 2022 | 1,882 | |||
| 2023 | 1,388 | |||
| 2024 and thereafter | 12,998 | |||
| Total | $ | 24,712 | ||
| 2020 | $ | 3,232 | ||||||
| 2021 | 3,216 | |||||||
| 2022 | 3,244 | |||||||
| 2023 | 3,274 | |||||||
| 2024 | 2,383 | |||||||
| 2025 and thereafter | 23,079 | |||||||
| Total lease payments | 38,428 | |||||||
| Less: Present value discount | 12,933 | |||||||
| Operating lease liability (Note 8) | $ | 25,495 | ||||||
Litigation and Claims
The Company may be involved in the litigation and claims in the ordinary course of the business. As of June 30, 2019,2020, the Company was not involved in any legal proceedings that are expected to have a material adverse effect on the Company’s results of operations, financial position or liquidity.
Following the Combination, the Company currently conductsconducted its business through the following five5 operating segments: the loan portfolio, CRE debt securities, net leased real estate, other, and corporate. The Company continually monitors and reviews its segment reporting structure in accordance with authoritative guidance to determine whether any changes have occurred that would impact our reportable segments.
During the third quarter of 2019, the Company realigned the business and reportable segment information to reflect how the CODM regularly review and manage the business. As a result, the Company presents its business segments as follows:
•Core Portfolio, which are based on how management reviewsconsists of the following 4 segments and manages its business:remain unchanged from the prior segments:
◦Senior and Mezzanine Loans and Preferred Equity—CRE debt investments including senior mortgage loans, |
64
COLONY CREDIT REAL ESTATE, INC.
NOTES TO CONSOLIDATED FINANCIAL STATEMENTS (Continued)
(Unaudited)
◦ |
◦Corporate—includes corporate-level asset management and other fees, related party and general and administrative expenses to the Core Portfolio only.
•Legacy, Non-Strategic Portfolio—segment consists of the combined organization is aggregated into the Net Leased Real Estate segment.
There were no changes in the structure of the combinedCompany’s internal organization is aggregated intothat prompted the Other segment.
The Company primarily generates revenue from net interest income on the loan, preferred equity and securities portfolios, rental and other income from its net leased, hotel, multi-tenant office, and multifamily real estate assets, as well as equity in earnings of unconsolidated ventures, including from PE Investments.ventures. CRE debt securities include the Company’s investment in the subordinate tranches of the securitization trusts which are eliminated in consolidation. The Company’s income is primarily derived through the difference between revenue and the cost at which the Company is able to finance its investments. The Company may also acquire investments which generate attractive returns without any leverage.
| Core | ||||||||||||||||||||||||||||||||||||||||||||||||||||||||||||||||||||
| Senior and Mezzanine Loans and Preferred Equity | CRE Debt Securities | Net Leased Real Estate | Corporate(1) | Total Core Portfolio | Legacy, Non-Strategic Portfolio | Total | ||||||||||||||||||||||||||||||||||||||||||||||||||||||||||||||
| Three months ended June 30, 2020 | ||||||||||||||||||||||||||||||||||||||||||||||||||||||||||||||||||||
| Net interest income (expense) | $ | 27,148 | $ | 1,051 | $ | 2 | $ | (2,752) | $ | 25,449 | $ | (511) | $ | 24,938 | ||||||||||||||||||||||||||||||||||||||||||||||||||||||
| Property and other income | 81 | — | 14,636 | 116 | 14,833 | 20,529 | 35,362 | |||||||||||||||||||||||||||||||||||||||||||||||||||||||||||||
| Management fee expense | — | — | 1 | (6,486) | (6,485) | (721) | (7,206) | |||||||||||||||||||||||||||||||||||||||||||||||||||||||||||||
| Property operating expense | — | — | (3,275) | — | (3,275) | (13,036) | (16,311) | |||||||||||||||||||||||||||||||||||||||||||||||||||||||||||||
| Transaction, investment and servicing expense | (1,130) | (37) | (4) | (269) | (1,440) | (1,467) | (2,907) | |||||||||||||||||||||||||||||||||||||||||||||||||||||||||||||
| Interest expense on real estate | — | — | (8,085) | — | (8,085) | (3,733) | (11,818) | |||||||||||||||||||||||||||||||||||||||||||||||||||||||||||||
| Depreciation and amortization | — | — | (9,297) | — | (9,297) | (4,723) | (14,020) | |||||||||||||||||||||||||||||||||||||||||||||||||||||||||||||
| Provision for loan losses | 86 | — | — | — | 86 | (35) | 51 | |||||||||||||||||||||||||||||||||||||||||||||||||||||||||||||
| Impairment of operating real estate | — | — | — | — | — | (25,935) | (25,935) | |||||||||||||||||||||||||||||||||||||||||||||||||||||||||||||
| Administrative expense | (372) | (200) | (121) | (3,719) | (4,412) | (2,339) | (6,751) | |||||||||||||||||||||||||||||||||||||||||||||||||||||||||||||
| Unrealized gain (loss) on mortgage loans and obligations held in securitization trusts, net | — | (9,498) | — | 523 | (8,975) | — | (8,975) | |||||||||||||||||||||||||||||||||||||||||||||||||||||||||||||
| Other gain (loss), net | (48,110) | (87,006) | 8,556 | (2) | (126,562) | 6,929 | (119,633) | |||||||||||||||||||||||||||||||||||||||||||||||||||||||||||||
| Income (loss) before equity in earnings of unconsolidated ventures and income taxes | (22,297) | (95,690) | 2,413 | (12,589) | (128,163) | (25,042) | (153,205) | |||||||||||||||||||||||||||||||||||||||||||||||||||||||||||||
| Equity in earnings (loss) of unconsolidated ventures | (85,328) | — | — | — | (85,328) | 51 | (85,277) | |||||||||||||||||||||||||||||||||||||||||||||||||||||||||||||
| Income tax benefit (expense) | (2,199) | — | 98 | — | (2,101) | (1) | (2,102) | |||||||||||||||||||||||||||||||||||||||||||||||||||||||||||||
| Net income (loss) | $ | (109,824) | $ | (95,690) | $ | 2,511 | $ | (12,589) | $ | (215,592) | $ | (24,992) | $ | (240,584) | ||||||||||||||||||||||||||||||||||||||||||||||||||||||
65
COLONY CREDIT REAL ESTATE, INC.
NOTES TO CONSOLIDATED FINANCIAL STATEMENTS (Continued)
(Unaudited)
| Core | |||||||||||||||||||||||||||||||||||||||||||||||||||||||||||||||||||||||
| Senior and Mezzanine Loans and Preferred Equity | CRE Debt Securities | Net Leased Real Estate | Corporate(1) | Total Core Portfolio | Legacy, Non-Strategic Portfolio | Total | |||||||||||||||||||||||||||||||||||||||||||||||||||||||||||||||||
| Three months ended June 30, 2019 | |||||||||||||||||||||||||||||||||||||||||||||||||||||||||||||||||||||||
| Net interest income (expense) | $ | 17,902 | $ | 5,442 | $ | — | $ | (2,453) | $ | 20,891 | $ | 3,036 | $ | 23,927 | |||||||||||||||||||||||||||||||||||||||||||||||||||||||||
| Property and other income | 148 | 74 | 29,847 | 1 | 30,070 | 35,131 | 65,201 | ||||||||||||||||||||||||||||||||||||||||||||||||||||||||||||||||
| Management fee expense | — | — | — | (9,086) | (9,086) | (2,271) | (11,357) | ||||||||||||||||||||||||||||||||||||||||||||||||||||||||||||||||
| Property operating expense | — | — | (7,901) | — | (7,901) | (20,239) | (28,140) | ||||||||||||||||||||||||||||||||||||||||||||||||||||||||||||||||
| Transaction, investment and servicing expense | (537) | — | (60) | 280 | (317) | (734) | (1,051) | ||||||||||||||||||||||||||||||||||||||||||||||||||||||||||||||||
| Interest expense on real estate | — | — | (8,814) | — | (8,814) | (5,084) | (13,898) | ||||||||||||||||||||||||||||||||||||||||||||||||||||||||||||||||
| Depreciation and amortization | — | — | (12,888) | — | (12,888) | (16,369) | (29,257) | ||||||||||||||||||||||||||||||||||||||||||||||||||||||||||||||||
| Provision for loan losses | — | — | — | — | — | (110,258) | (110,258) | ||||||||||||||||||||||||||||||||||||||||||||||||||||||||||||||||
| Impairment of operating real estate | — | — | — | — | — | (10,124) | (10,124) | ||||||||||||||||||||||||||||||||||||||||||||||||||||||||||||||||
| Administrative expense | (13) | (348) | (43) | (3,764) | (4,168) | (3,842) | (8,010) | ||||||||||||||||||||||||||||||||||||||||||||||||||||||||||||||||
| Unrealized gain on mortgage loans and obligations held in securitization trusts, net | — | 5,154 | — | 395 | 5,549 | — | 5,549 | ||||||||||||||||||||||||||||||||||||||||||||||||||||||||||||||||
| Other gain (loss), net | — | (6,156) | 144 | (4) | (6,016) | (46) | (6,062) | ||||||||||||||||||||||||||||||||||||||||||||||||||||||||||||||||
| Income (loss) before equity in earnings of unconsolidated ventures and income taxes | 17,500 | 4,166 | 285 | (14,631) | 7,320 | (130,800) | (123,480) | ||||||||||||||||||||||||||||||||||||||||||||||||||||||||||||||||
| Equity in earnings (loss) of unconsolidated ventures | 17,917 | — | — | — | 17,917 | (5,360) | 12,557 | ||||||||||||||||||||||||||||||||||||||||||||||||||||||||||||||||
| Income tax benefit (expense) | — | — | (359) | — | (359) | 492 | 133 | ||||||||||||||||||||||||||||||||||||||||||||||||||||||||||||||||
| Net income (loss) | $ | 35,417 | $ | 4,166 | $ | (74) | $ | (14,631) | $ | 24,878 | $ | (135,668) | $ | (110,790) | |||||||||||||||||||||||||||||||||||||||||||||||||||||||||
| Loan | CRE Debt Securities | Net Leased Real Estate | Other | Corporate(1) | Total | |||||||||||||||||||
| Three Months Ended June 30, 2019 | ||||||||||||||||||||||||
| Net interest income (expense) | $ | 22,307 | $ | 5,442 | $ | 3 | $ | — | $ | (3,825 | ) | $ | 23,927 | |||||||||||
| Property and other income | 148 | 74 | 25,393 | 39,585 | 1 | 65,201 | ||||||||||||||||||
| Management fee expense | — | — | — | — | (11,357 | ) | (11,357 | ) | ||||||||||||||||
| Property operating expense | — | — | (4,696 | ) | (23,444 | ) | — | (28,140 | ) | |||||||||||||||
| Transaction, investment and servicing expense | (906 | ) | — | (60 | ) | (365 | ) | 280 | (1,051 | ) | ||||||||||||||
| Interest expense on real estate | — | — | (9,493 | ) | (4,405 | ) | — | (13,898 | ) | |||||||||||||||
| Depreciation and amortization | — | — | (13,040 | ) | (16,217 | ) | — | (29,257 | ) | |||||||||||||||
| Provision for loan losses | (110,258 | ) | — | — | — | — | (110,258 | ) | ||||||||||||||||
| Impairment of operating real estate | — | — | — | (10,124 | ) | — | (10,124 | ) | ||||||||||||||||
| Administrative expense | (65 | ) | (348 | ) | (43 | ) | (25 | ) | (7,529 | ) | (8,010 | ) | ||||||||||||
| Unrealized gain on mortgage loans and obligations held in securitization trusts, net | — | 5,154 | — | — | 395 | 5,549 | ||||||||||||||||||
| Other gain (loss), net | — | (6,157 | ) | 123 | (28 | ) | — | (6,062 | ) | |||||||||||||||
| Income (loss) before equity in earnings of unconsolidated ventures and income taxes | (88,774 | ) | 4,165 | (1,813 | ) | (15,023 | ) | (22,035 | ) | (123,480 | ) | |||||||||||||
| Equity in earnings of unconsolidated ventures | 12,557 | — | — | — | — | 12,557 | ||||||||||||||||||
| Income tax benefit | — | — | (46 | ) | 179 | — | 133 | |||||||||||||||||
| Net income (loss) | $ | (76,217 | ) | $ | 4,165 | $ | (1,859 | ) | $ | (14,844 | ) | $ | (22,035 | ) | $ | (110,790 | ) | |||||||
| Three Months Ended June 30, 2018 | ||||||||||||||||||||||||
| Net interest income (expense) | $ | 24,009 | $ | 7,800 | $ | — | $ | — | $ | (1,680 | ) | $ | 30,129 | |||||||||||
| Property and other income | 525 | 11 | 16,043 | 23,438 | 359 | 40,376 | ||||||||||||||||||
| Management fee expense | — | — | — | — | (11,791 | ) | (11,791 | ) | ||||||||||||||||
| Property operating expense | — | — | (5,235 | ) | (11,021 | ) | — | (16,256 | ) | |||||||||||||||
| Transaction, investment and servicing expense | (260 | ) | — | (7 | ) | (161 | ) | (3,069 | ) | (3,497 | ) | |||||||||||||
| Interest expense on real estate | — | — | (5,099 | ) | (4,751 | ) | — | (9,850 | ) | |||||||||||||||
| Depreciation and amortization | — | — | (8,910 | ) | (14,449 | ) | — | (23,359 | ) | |||||||||||||||
| Administrative expense | (168 | ) | (485 | ) | (9 | ) | (12 | ) | (6,210 | ) | (6,884 | ) | ||||||||||||
| Unrealized gain (loss) on mortgage loans and obligations held in securitization trusts, net | 443 | 2,599 | — | (443 | ) | 1,097 | 3,696 | |||||||||||||||||
| Realized loss on mortgage loans and obligations held in securitization trusts, net | — | (2,203 | ) | — | — | — | (2,203 | ) | ||||||||||||||||
| Other gain (loss), net | (442 | ) | — | 10 | 442 | — | 10 | |||||||||||||||||
| Income (loss) before equity in earnings of unconsolidated ventures and income taxes | 24,107 | 7,722 | (3,207 | ) | (6,957 | ) | (21,294 | ) | 371 | |||||||||||||||
| Equity in earnings of unconsolidated ventures | 12,676 | — | — | 2,985 | — | 15,661 | ||||||||||||||||||
| Income tax benefit (expense) | (816 | ) | — | — | 658 | — | (158 | ) | ||||||||||||||||
| Net income (loss) | $ | 35,967 | $ | 7,722 | $ | (3,207 | ) | $ | (3,314 | ) | $ | (21,294 | ) | $ | 15,874 | |||||||||
66
COLONY CREDIT REAL ESTATE, INC.
NOTES TO CONSOLIDATED FINANCIAL STATEMENTS (Continued)
(Unaudited)
| Core | ||||||||||||||||||||||||||||||||||||||||||||||||||||||||||||||||||||
| Senior and Mezzanine Loans and Preferred Equity | CRE Debt Securities | Net Leased Real Estate | Corporate(1) | Total Core Portfolio | Legacy, Non-Strategic Portfolio | Total | ||||||||||||||||||||||||||||||||||||||||||||||||||||||||||||||
| Six months ended June 30, 2020 | ||||||||||||||||||||||||||||||||||||||||||||||||||||||||||||||||||||
| Net interest income (expense) | $ | 50,631 | $ | 6,593 | $ | 9 | $ | (4,628) | $ | 52,605 | $ | 189 | $ | 52,794 | ||||||||||||||||||||||||||||||||||||||||||||||||||||||
| Property and other income | 105 | 72 | 45,168 | 121 | 45,466 | 51,818 | 97,284 | |||||||||||||||||||||||||||||||||||||||||||||||||||||||||||||
| Management fee expense | — | — | — | (13,002) | (13,002) | (2,150) | (15,152) | |||||||||||||||||||||||||||||||||||||||||||||||||||||||||||||
| Property operating expense | (1) | — | (6,957) | — | (6,958) | (31,884) | (38,842) | |||||||||||||||||||||||||||||||||||||||||||||||||||||||||||||
| Transaction, investment and servicing expense | (1,528) | (37) | (147) | (1,942) | (3,654) | (2,387) | (6,041) | |||||||||||||||||||||||||||||||||||||||||||||||||||||||||||||
| Interest expense on real estate | — | — | (16,546) | — | (16,546) | (8,350) | (24,896) | |||||||||||||||||||||||||||||||||||||||||||||||||||||||||||||
| Depreciation and amortization | — | — | (20,449) | — | (20,449) | (11,547) | (31,996) | |||||||||||||||||||||||||||||||||||||||||||||||||||||||||||||
| Provision for loan losses | (31,413) | — | — | — | (31,413) | (38,468) | (69,881) | |||||||||||||||||||||||||||||||||||||||||||||||||||||||||||||
| Impairment of operating real estate | — | — | — | — | — | (30,061) | (30,061) | |||||||||||||||||||||||||||||||||||||||||||||||||||||||||||||
| Administrative expense | (735) | (735) | (203) | (6,870) | (8,543) | (5,246) | (13,789) | |||||||||||||||||||||||||||||||||||||||||||||||||||||||||||||
| Unrealized gain (loss) on mortgage loans and obligations held in securitization trusts, net | — | (29,404) | — | 977 | (28,427) | — | (28,427) | |||||||||||||||||||||||||||||||||||||||||||||||||||||||||||||
| Other gain (loss), net | (48,110) | (103,342) | 4,472 | (94) | (147,074) | 7,279 | (139,795) | |||||||||||||||||||||||||||||||||||||||||||||||||||||||||||||
| Income (loss) before equity in earnings of unconsolidated ventures and income taxes | (31,051) | (126,853) | 5,347 | (25,438) | (177,995) | (70,807) | (248,802) | |||||||||||||||||||||||||||||||||||||||||||||||||||||||||||||
| Equity in earnings (loss) of unconsolidated ventures | (71,255) | — | — | — | (71,255) | 3,145 | (68,110) | |||||||||||||||||||||||||||||||||||||||||||||||||||||||||||||
| Income tax benefit (expense) | (2,560) | — | 296 | — | (2,264) | (1,549) | (3,813) | |||||||||||||||||||||||||||||||||||||||||||||||||||||||||||||
| Net income (loss) | $ | (104,866) | $ | (126,853) | $ | 5,643 | $ | (25,438) | $ | (251,514) | $ | (69,211) | $ | (320,725) | ||||||||||||||||||||||||||||||||||||||||||||||||||||||
| Core | ||||||||||||||||||||||||||||||||||||||||||||||||||||||||||||||||||||
| Senior and Mezzanine Loans and Preferred Equity | CRE Debt Securities | Net Leased Real Estate | Corporate(1) | Total Core Portfolio | Legacy, Non-Strategic Portfolio | Total | ||||||||||||||||||||||||||||||||||||||||||||||||||||||||||||||
| Six months ended June 30, 2019 | ||||||||||||||||||||||||||||||||||||||||||||||||||||||||||||||||||||
| Net interest income (expense) | $ | 33,781 | $ | 10,755 | $ | — | $ | (5,311) | $ | 39,225 | $ | 6,660 | $ | 45,885 | ||||||||||||||||||||||||||||||||||||||||||||||||||||||
| Property and other income | 241 | 141 | 59,752 | — | 60,134 | 68,378 | 128,512 | |||||||||||||||||||||||||||||||||||||||||||||||||||||||||||||
| Management fee expense | — | — | — | (18,172) | (18,172) | (4,543) | (22,715) | |||||||||||||||||||||||||||||||||||||||||||||||||||||||||||||
| Property operating expense | — | — | (16,847) | — | (16,847) | (39,473) | (56,320) | |||||||||||||||||||||||||||||||||||||||||||||||||||||||||||||
| Transaction, investment and servicing expense | (813) | — | (105) | 546 | (372) | (1,208) | (1,580) | |||||||||||||||||||||||||||||||||||||||||||||||||||||||||||||
| Interest expense on real estate | — | — | (17,384) | — | (17,384) | (10,121) | (27,505) | |||||||||||||||||||||||||||||||||||||||||||||||||||||||||||||
| Depreciation and amortization | — | — | (25,972) | — | (25,972) | (30,947) | (56,919) | |||||||||||||||||||||||||||||||||||||||||||||||||||||||||||||
| Provision for loan losses | — | — | — | — | — | (110,258) | (110,258) | |||||||||||||||||||||||||||||||||||||||||||||||||||||||||||||
| Impairment of operating real estate | — | — | — | — | — | (10,124) | (10,124) | |||||||||||||||||||||||||||||||||||||||||||||||||||||||||||||
| Administrative expense | (303) | (735) | (100) | (6,670) | (7,808) | (6,855) | (14,663) | |||||||||||||||||||||||||||||||||||||||||||||||||||||||||||||
| Unrealized gain on mortgage loans and obligations held in securitization trusts, net | — | 5,820 | — | 758 | 6,578 | — | 6,578 | |||||||||||||||||||||||||||||||||||||||||||||||||||||||||||||
| Realized gain on mortgage loans and obligations held in securitization trusts, net | — | 48 | — | — | 48 | — | 48 | |||||||||||||||||||||||||||||||||||||||||||||||||||||||||||||
| Other gain (loss), net | — | (10,227) | 380 | 5 | (9,842) | (1,299) | (11,141) | |||||||||||||||||||||||||||||||||||||||||||||||||||||||||||||
| Income (loss) before equity in earnings of unconsolidated ventures and income taxes | 32,906 | 5,802 | (276) | (28,844) | 9,588 | (139,790) | (130,202) | |||||||||||||||||||||||||||||||||||||||||||||||||||||||||||||
| Equity in earnings (losses) of unconsolidated ventures | 36,285 | — | — | — | 36,285 | (2,418) | 33,867 | |||||||||||||||||||||||||||||||||||||||||||||||||||||||||||||
| Income tax benefit (expense) | (12) | — | 2,023 | (382) | 1,629 | (1,127) | 502 | |||||||||||||||||||||||||||||||||||||||||||||||||||||||||||||
| Net income (loss) | $ | 69,179 | $ | 5,802 | $ | 1,747 | $ | (29,226) | $ | 47,502 | $ | (143,335) | $ | (95,833) | ||||||||||||||||||||||||||||||||||||||||||||||||||||||
67
| Loan | CRE Debt Securities | Net Leased Real Estate | Other | Corporate(1) | Total | |||||||||||||||||||
| Six Months Ended June 30, 2019 | ||||||||||||||||||||||||
| Net interest income (expense) | $ | 43,475 | $ | 10,754 | $ | 3 | $ | — | $ | (8,347 | ) | $ | 45,885 | |||||||||||
| Property and other income | 256 | 141 | 51,259 | 76,855 | 1 | 128,512 | ||||||||||||||||||
| Management fee expense | — | — | — | — | (22,715 | ) | (22,715 | ) | ||||||||||||||||
| Property operating expense | — | — | (9,630 | ) | (46,690 | ) | — | (56,320 | ) | |||||||||||||||
| Transaction, investment and servicing expense | (1,410 | ) | — | (106 | ) | (611 | ) | 547 | (1,580 | ) | ||||||||||||||
| Interest expense on real estate | — | — | (18,738 | ) | (8,767 | ) | — | (27,505 | ) | |||||||||||||||
| Depreciation and amortization | — | — | (26,290 | ) | (30,629 | ) | — | (56,919 | ) | |||||||||||||||
| Provision for loan losses | (110,258 | ) | — | — | — | — | (110,258 | ) | ||||||||||||||||
| Impairment of operating real estate | — | — | — | (10,124 | ) | — | (10,124 | ) | ||||||||||||||||
| Administrative expense | (436 | ) | (735 | ) | (101 | ) | (53 | ) | (13,338 | ) | (14,663 | ) | ||||||||||||
| Unrealized gain on mortgage loans and obligations held in securitization trusts, net | — | 5,820 | — | — | 758 | 6,578 | ||||||||||||||||||
| Realized gain on mortgage loans and obligations held in securitization trusts, net | — | 48 | — | — | — | 48 | ||||||||||||||||||
| Other gain (loss), net | — | (10,227 | ) | 346 | (1,260 | ) | — | (11,141 | ) | |||||||||||||||
| Income (loss) before equity in earnings of unconsolidated ventures and income taxes | (68,373 | ) | 5,801 | (3,257 | ) | (21,279 | ) | (43,094 | ) | (130,202 | ) | |||||||||||||
| Equity in earnings (losses) of unconsolidated ventures | 34,577 | — | — | (710 | ) | — | 33,867 | |||||||||||||||||
| Income tax benefit (expense) | (13 | ) | — | 2,784 | (1,887 | ) | (382 | ) | 502 | |||||||||||||||
| Net income (loss) | $ | (33,809 | ) | $ | 5,801 | $ | (473 | ) | $ | (23,876 | ) | $ | (43,476 | ) | $ | (95,833 | ) | |||||||
| Six Months Ended June 30, 2018 | ||||||||||||||||||||||||
| Net interest income (expense) | $ | 52,241 | $ | 10,702 | $ | — | $ | — | $ | (2,503 | ) | $ | 60,440 | |||||||||||
| Property and other income | 692 | 13 | 28,485 | 39,712 | 536 | 69,438 | ||||||||||||||||||
| Management fee expense | — | — | — | — | (19,791 | ) | (19,791 | ) | ||||||||||||||||
| Property operating expense | — | — | (9,341 | ) | (18,628 | ) | — | (27,969 | ) | |||||||||||||||
| Transaction, investment and servicing expense | (850 | ) | — | (17 | ) | (167 | ) | (33,547 | ) | (34,581 | ) | |||||||||||||
| Interest expense on real estate | — | — | (8,597 | ) | (7,509 | ) | — | (16,106 | ) | |||||||||||||||
| Depreciation and amortization | — | — | (15,480 | ) | (26,671 | ) | — | (42,151 | ) | |||||||||||||||
| Administrative expense | (301 | ) | (401 | ) | (10 | ) | (18 | ) | (9,382 | ) | (10,112 | ) | ||||||||||||
| Unrealized gain on mortgage loans and obligations held in securitization trusts, net | — | 2,489 | — | — | 1,704 | 4,193 | ||||||||||||||||||
| Realized loss on mortgage loans and obligations held in securitization trusts, net | — | (2,203 | ) | — | — | — | (2,203 | ) | ||||||||||||||||
| Other gain, net | — | — | 33 | 442 | — | 475 | ||||||||||||||||||
| Income (loss) before equity in earnings of unconsolidated ventures and income taxes | 51,782 | 10,600 | (4,927 | ) | (12,839 | ) | (62,983 | ) | (18,367 | ) | ||||||||||||||
| Equity in earnings of unconsolidated ventures | 23,226 | — | — | 8,223 | — | 31,449 | ||||||||||||||||||
| Income tax benefit | — | — | — | 391 | — | 391 | ||||||||||||||||||
| Net income (loss) | $ | 75,008 | $ | 10,600 | $ | (4,927 | ) | $ | (4,225 | ) | $ | (62,983 | ) | $ | 13,473 | |||||||||
COLONY CREDIT REAL ESTATE, INC.
NOTES TO CONSOLIDATED FINANCIAL STATEMENTS (Continued)
(Unaudited)
The following table presents total assets by segment as of June 30, 20192020 and December 31, 20182019 (dollars in thousands):
| Total Assets | Loan(1) | CRE Debt Securities | Net Leased Real Estate | Other(2) | Corporate(3) | Total | ||||||||||||||||||
| June 30, 2019 | $ | 3,175,492 | $ | 3,583,740 | $ | 1,362,621 | $ | 1,026,274 | $ | (107,649 | ) | $ | 9,040,478 | |||||||||||
| December 31, 2018 | 2,840,267 | 3,507,404 | 1,354,051 | 1,029,014 | (70,006 | ) | 8,660,730 | |||||||||||||||||
| Core | ||||||||||||||||||||||||||||||||||||||||||||||||||||||||||||||||||||
| Total Assets | Senior and Mezzanine Loans and Preferred Equity(1) | CRE Debt Securities | Net Leased Real Estate | Corporate(2) | Total Core Portfolio | Legacy, Non-Strategic Portfolio(3) | Total | |||||||||||||||||||||||||||||||||||||||||||||||||||||||||||||
| June 30, 2020 | $ | 2,150,288 | $ | 1,843,041 | $ | 1,131,680 | $ | 1,067,199 | $ | 6,192,208 | $ | 658,059 | $ | 6,850,267 | ||||||||||||||||||||||||||||||||||||||||||||||||||||||
| December 31, 2019 | 2,464,963 | 2,226,448 | 1,181,609 | 496,714 | 6,369,734 | 1,044,572 | 7,414,306 | |||||||||||||||||||||||||||||||||||||||||||||||||||||||||||||
(1)Includes investments in unconsolidated ventures totaling $410.2 million and$585.0 million as of June 30, 2020 and December 31, 2019, respectively. (2)Includes cash, unallocated receivables, deferred costs and other assets, net and the elimination of the subordinate tranches of the securitization trusts in consolidation. (3)Includes PE Investments totaling $7.1 million and $10.3 million as of June 30, 2020 and December 31, 2019, |
Geography
Geography is generally defined as the location in which the income producing assets reside or the location in which income generating services are performed. Geography information on total income includes equity in earnings of unconsolidated ventures. Geography information on total income and long lived assets are presented as follows (dollars in thousands):
| Three Months Ended June 30, | Six Months Ended June 30, | |||||||||||||||||||||||||||||||||||||||||||
| 2020 | 2019 | 2020 | 2019 | |||||||||||||||||||||||||||||||||||||||||
| Total income by geography: | ||||||||||||||||||||||||||||||||||||||||||||
| United States | $ | 6,779 | $ | 146,214 | $ | 131,732 | $ | 295,039 | ||||||||||||||||||||||||||||||||||||
| Europe | 3,353 | 12,273 | 24,148 | 24,919 | ||||||||||||||||||||||||||||||||||||||||
| Other | — | — | — | 35 | ||||||||||||||||||||||||||||||||||||||||
Total(1) | $ | 10,132 | $ | 158,487 | $ | 155,880 | $ | 319,993 | ||||||||||||||||||||||||||||||||||||
| Three Months Ended June 30, | Six Months Ended June 30, | |||||||||||||||
| 2019 | 2018 | 2019 | 2018 | |||||||||||||
| Total income by geography: | ||||||||||||||||
| United States | $ | 146,214 | $ | 131,966 | $ | 295,039 | $ | 238,232 | ||||||||
| Europe | 12,273 | — | 24,919 | — | ||||||||||||
| Other | — | 362 | 35 | 950 | ||||||||||||
Total(1) | $ | 158,487 | $ | 132,328 | $ | 319,993 | $ | 239,182 | ||||||||
| June 30, 2020 | December 31, 2019 | |||||||||||||
| Long-lived assets by geography: | ||||||||||||||
| United States | $ | 621,285 | $ | 1,282,189 | ||||||||||
| Europe | 282,026 | 315,369 | ||||||||||||
Total(2) | $ | 903,311 | $ | 1,597,558 | ||||||||||
(1)Includes interest income, interest income on mortgage loans held in securitization trusts, property and other income and equity in earnings of unconsolidated ventures.
(2)Long-lived assets are comprised of real estate and real estate related intangible assets, and excludes financial instruments and assets held for sale.
68
| June 30, 2019 | December 31, 2018 | |||||||
| Long-lived assets by geography: | ||||||||
| United States | $ | 1,711,582 | $ | 1,764,247 | ||||
| Europe | 330,238 | 329,511 | ||||||
Total(2) | $ | 2,041,820 | $ | 2,093,758 | ||||
COLONY CREDIT REAL ESTATE, INC.
NOTES TO CONSOLIDATED FINANCIAL STATEMENTS (Continued)
(Unaudited)
The Company’s net income (loss) and weighted average shares outstanding for the three and six months ended June 30, 20192020 and 2018 and2019 consist of the following (dollars in thousands, except per share data):
| Three Months Ended June 30, | Six Months Ended June 30, | Three Months Ended June 30, | Six Months Ended June 30, | |||||||||||||||||||||||||||||||||||||||||||||||||||||||||
| 2019 | 2018 | 2019 | 2018 | 2020 | 2019 | 2020 | 2019 | |||||||||||||||||||||||||||||||||||||||||||||||||||||
| Net income (loss) | $ | (110,790 | ) | $ | 15,874 | $ | (95,833 | ) | $ | 13,473 | Net income (loss) | $ | (240,584) | $ | (110,790) | $ | (320,725) | $ | (95,833) | |||||||||||||||||||||||||||||||||||||||||
| Net (income) loss attributable to noncontrolling interests: | Net (income) loss attributable to noncontrolling interests: | |||||||||||||||||||||||||||||||||||||||||||||||||||||||||||
| Investment Entities | 880 | 470 | 1,178 | (1,900 | ) | Investment Entities | 8,107 | 880 | 7,584 | 1,178 | ||||||||||||||||||||||||||||||||||||||||||||||||||
| Operating Partnership | 2,569 | (336 | ) | 2,222 | (279 | ) | Operating Partnership | 5,418 | 2,569 | 7,310 | 2,222 | |||||||||||||||||||||||||||||||||||||||||||||||||
| Net income (loss) attributable to Colony Credit Real Estate, Inc. common stockholders | $ | (107,341 | ) | $ | 16,008 | $ | (92,433 | ) | $ | 11,294 | Net income (loss) attributable to Colony Credit Real Estate, Inc. common stockholders | $ | (227,059) | $ | (107,341) | $ | (305,831) | $ | (92,433) | |||||||||||||||||||||||||||||||||||||||||
| Numerator: | Numerator: | |||||||||||||||||||||||||||||||||||||||||||||||||||||||||||
| Net income allocated to participating securities (nonvested shares) | (627 | ) | $ | (436 | ) | $ | (1,093 | ) | $ | (582 | ) | |||||||||||||||||||||||||||||||||||||||||||||||||
| Net income allocated to participating securities (non-vested shares) | Net income allocated to participating securities (non-vested shares) | $ | — | $ | (627) | $ | (322) | $ | (1,093) | |||||||||||||||||||||||||||||||||||||||||||||||||||
| Net income (loss) attributable to common stockholders | $ | (107,968 | ) | $ | 15,572 | $ | (93,526 | ) | $ | 10,712 | Net income (loss) attributable to common stockholders | $ | (227,059) | $ | (107,968) | $ | (306,153) | $ | (93,526) | |||||||||||||||||||||||||||||||||||||||||
| Denominator: | Denominator: | |||||||||||||||||||||||||||||||||||||||||||||||||||||||||||
Weighted average shares outstanding(1)(2) | 128,534 | 127,887 | 128,240 | 113,355 | Weighted average shares outstanding(1)(2) | 128,539 | 128,534 | 128,513 | 128,240 | |||||||||||||||||||||||||||||||||||||||||||||||||||
Net income (loss) per common share - basic and diluted(2) | $ | (0.84 | ) | $ | 0.12 | $ | (0.73 | ) | $ | 0.09 | Net income (loss) per common share - basic and diluted(2) | $ | (1.77) | $ | (0.84) | $ | (2.38) | $ | (0.73) | |||||||||||||||||||||||||||||||||||||||||
(1)For earnings per share, the Company assumes 44.4 million shares of Class B-3 common stock were outstanding prior to January 31, 2018 to reflect the standalone pre-merger financial information of the CLNY Investment Entities, the Company’s predecessor for accounting purposes. On February 1, 2019, the Class B-3 common stock automatically converted to Class A common stock on a 1-for-one basis. (2)Excludes 3,075,623 CLNC OP Units, which are redeemable for cash, or at the Company’s option, shares |
19. Subsequent Events
Bank Credit Facility and Master Repurchase Facilities
Subsequent to stockholders of record on July 31, 2019. These distributions represent an annualized dividend of $1.74 per share of Class A common stock.
Subsequent to June 30, 2019,2020, the Company sold 1 loan in its retained investments in the subordinate tranchesCore Portfolio for total gross proceeds of one securitization trust for $33.4$105.2 million. The Company received $47.9 million in net proceeds. Prior to the sale, the Company recorded $38.0 million of provision for loan losses during the second quarter of 2020.
Additionally, the Company sold 2 real estate properties in its Legacy, Non-Strategic Portfolio for total proceeds.gross proceeds of $5.0 million. The Company received $4.6 million of net proceeds and will recognize a gain of approximately $3.8$0.2 million.
In July 2020, the Company completed a discounted payoff on the Northeast Office Portfolio totaling $80.7 million. The Company recorded $20.9 million in connection with the saleof provision for loan losses during the third quarter of 2019.six months ended June 30, 2020.
Subsequent to June 30, 2019,2020, the Company received $19.2 million in proceeds related toaccepted the salediscounted payoff of its PE Investments.
69
Item 2. Management’s Discussion and Analysis of Financial Condition and Results of Operations
The following discussion should be read in conjunction with our unaudited consolidated financial statements and the accompanying notes thereto, which are included in Item 1 of this Quarterly Report, as well as the information contained in our Form 10-K for the year ended December 31, 2018,2019, which is accessible on the SEC’s website at www.sec.gov.
Introduction
We are a commercial real estate (“CRE”) credit real estate investment trust (“REIT”) focused on originating, acquiring, financing and managing a diversified portfolio consisting primarily of CRE debt investments CRE debt securities and net leased properties predominantly in the United States. CRE debt investments include seniorprimarily consist of first mortgage loans, which we expect to be our primary investment strategy. Additionally, we may also selectively originate mezzanine loans and make preferred equity and participations in suchinvestments, which may include profit participations. The mezzanine loans and preferred equity interests. CRE debt securities primarily consistinvestments may be in conjunction with our origination of commercial mortgage-backed securities (“CMBS”) (including “B-pieces” of a CMBS securitization pool) or CRE collateralized loan obligations (“CLOs”) (collateralized by pools of CRE debt investments).corresponding first mortgages on the same properties. Net leased properties consist of CRE properties with long-term leases to tenants on a net-lease basis, where such tenants generally will be responsible for property operating expenses such as insurance, utilities, maintenance capital expenditures and real estate taxes. We will continue to target net leased equity investments on a selective basis. We also currently have investments in CRE debt securities primarily consisting of commercial mortgage-backed securities (“CMBS”) (including “B pieces” of a CMBS securitization pool) or CRE collateralized loan obligations (“CLOs”) (including the junior tranches collateralized by pools of CRE debt investments).
We were organized in the state of Maryland on August 23, 2017. On September 15, 2017, Colony Capital (“CLNY”), a publicly traded REIT listed onJanuary 31, 2018, the New York Stock Exchange (“NYSE”) underCombination among the ticker symbol “CLNY,” madeCLNY Contributed Portfolio, NorthStar I and NorthStar II was completed in an initial capital contribution of $1,000all-stock exchange. We elected to us. We intend to qualifybe taxed as a REIT under the Internal Revenue Code of 1986, as amended, beginning with our taxable year ended December 31, 2018. We conduct all of our activities and hold substantially all of our assets and liabilities through our operating subsidiary, Credit RE Operating Company, LLC (the “OP”). At June 30, 2019,2020, we owned 97.7% of the OP, as its sole managing member. The remaining 2.3% is owned primarily by our affiliate as noncontrolling interests.
We are externally managed by a subsidiary of Colony Capital, a NYSE-listedNew York Stock Exchange (“NYSE”)-listed global real estate and investment management firm with over $22 billion of total consolidated assets and over $43 billion of assets under management.firm. As of June 30, 2019,2020, Colony Capital owned approximately 36%36.5% of our common equity on a fully diluted basis, evidencing a strong alignment of interests between Colony Capital and our other stockholders.basis.
Our Manager
We are externally managed by our manager, CLNC Manager, LLC (our “Manager”). Our Manager is a subsidiary of Colony Capital and benefits fromCapital. Over the expertise and resources of Colony Capital.past 28 years, Colony Capital and its predecessors have a 27-year track record and have made over $100 billion of investments. Colony Capital’s senior management team has a long track record and extensive experience managing and investing in our target assets and other real estate-related investments through a variety of credit cycles and market conditions. Colony Capital’s global footprint and corresponding network provides its investment and asset management teams with proprietary market knowledge, exceptional sourcing capabilities and the local presence required to identify, execute and manage complex transactions, althoughtransactions. Colony Capital has not been immune to national and local economic trends that are unrelated to its management of assets. Colony Capital’s successful history of external management includes its previous management of Colony Financial, Inc. (“Colony Financial”), an externally managed commercial mortgage REIT listed on the NYSE thatand focused on secondary loan acquisitions, high-yielding originations and real estate equity, its current management of NorthStar Realty Europe Corp., a publicly traded REIT listed on the NYSE and focused on European CRE with over $1 billion in assets and its management of various non-traded REITs (previously including NorthStar I and NorthStar II) and registered investment companies.
Colony Capital is headquartered in Los Angeles, California, with over 400 employees in 20 locations in 13 countries, with key offices in Boca Raton, New York, Paris and London. Its operations are broad and diverse and include the management of real estate, both owned and on behalf of a diverse set of institutional and individual investors. Colony Capital has a highly experiencedCapital’s management team ofhas diverse backgrounds with a demonstrated track record of success at asset managers and investment firms, private investment funds, investment banks and other financial service companies, which provides an enhanced perspective for managing our portfolio. Kevin P. Traenkle, a 26-year veteran of Colony Capital, serves as ourbackgrounds. The CLNC management team includes Michael J. Mazzei, Chief Executive Officer and President, Andrew E. Witt, Chief Operating Officer, and Neale W.
Redington, a 10-year veteran of Colony Capital, serves as our Chief Financial Officer and Treasurer. In addition, supporting our business, David A. Palamé, a 12-year veteran of Colony Capital, serves as our General Counsel and Secretary, and Frank V. Saracino, a four-year veteran of Colony Capital, serves as our Chief Accounting Officer.
We draw on Colony Capital’s substantial real estate investment platform and relationships to source, underwrite, structure and manage a robust pipeline of investment opportunities as well as to access debt and equity capital to fund our operations. We believe we are able to originate, acquire, finance and manage investments with attractive in-place cash flows and the potential for meaningful capital appreciation over time. We also benefit from Colony Capital’s portfolio management, finance and administration functions, which provide us with legal, compliance, investor relations, asset valuation, risk management and information technology services. Colony Capital also has a captive, fully-functional,fully functional, separate asset management company that engages primarily in loan servicing for performing, sub-performing and non-performing commercial loans, including senior secured loans, revolving lines of credit, loan participations, subordinated loans, unsecured loans and mezzanine debt. Colony Capital’s asset management company is a commercial special servicer rated by both Standard & Poor’s and Fitch’s rating services.
As previously disclosed, the Company’s Board of Directors formed a special committee consisting exclusively of independent and disinterested directors (the “Special Committee”) to explore an internalization proposal made by Colony Capital as well as
70
other strategic alternatives. Subsequently, due to ongoing uncertainty surrounding the duration and magnitude of the COVID-19 pandemic and its impact on the global economy, on April 1, 2020, Colony Capital reported in Amendment No. 3 to Schedule 13D (filed with the U.S. Securities and Exchange Commission) that it has postponed any decision regarding a disposition of its management agreement with the Company until market conditions improve. The Special Committee has continued to explore alternatives but has been unable to negotiate mutually acceptable terms with Colony Capital. The Special Committee will continue to consider value-enhancing alternatives for the Company as opportunities arise.
Our operating segments include the loan portfolio,Senior and Mezzanine Loans and Preferred Equity, CRE debt securities, net leased real estate, other,Debt Securities, Net Leased Real Estate, Corporate and corporate.Legacy, Non-Strategic Portfolio. Our target assets, as more fully described below, are included in different operating segments. Senior mortgage loans, mezzanine loans and preferred equity are included in the loan portfolio segment. Refer to Note 18, “Segment Reporting” in Item 1. “Financial Statements” for further discussion of our operating segments.
Our Target Assets
At this time we are primarily focused on existing investments and commitments. We believe that events in the financial markets from time to time, including the current and potential impacts of the COVID-19 pandemic, have created and will create significant dislocation between price and intrinsic value in certain asset classes as well as a supply and demand imbalance of available credit to finance these assets. Generally, as COVID-19 related uncertainties dissipate and market conditions improve, we will seek to make new investments. Our investment strategy is to originate and selectively acquire our target assets, which consist of the following:
•CRE Debt Investments: –Senior Mortgage Loans. Our primary focus is originating and selectively acquiring senior mortgage loans that are backed by CRE assets. These loans are secured by a first mortgage lien on a commercial property and provide mortgage financing •Mezzanine Loans and Preferred Equity: –Mezzanine Loans. We may originate or acquire mezzanine loans, which are structurally subordinate to senior loans, but senior to the borrower’s equity position. Mezzanine loans may be structured such that our return accrues and is added to the principal amount rather than paid on a current basis. We may also pursue equity participation opportunities in instances when the risk-reward characteristics of the investment warrant additional upside participation in the possible appreciation in value of the underlying assets securing the investment. –Preferred Equity. We may make investments that are subordinate to senior and mezzanine loans, but senior to the common equity in the mortgage borrower. Preferred equity investments may be structured such that our return accrues and is added to the principal amount rather than paid on a current basis. We also may pursue equity participation opportunities in preferred equity investments, like such participations in mezzanine loans. •Net Leased Real Estate. We may also invest directly in well-located commercial real estate with long-term leases to tenants on a net lease basis, where such tenants generally will be responsible for property operating expenses such as insurance, utilities, maintenance capital expenditures and real estate taxes. In addition, tenants of our properties typically pay rent increases based on: (1) increases in the consumer price index (typically subject to ceilings), (2) fixed increases, or (3) additional rent calculated as a percentage of the tenants’ gross sales above a specified level. We believe that a portfolio of properties under long-term, net lease agreements generally produces a more predictable income stream than many other types of real estate portfolios, while continuing to offer the potential for growth in rental income. •CRE Debt Securities. We made investments that consist of bonds comprising certain tranches of CRE securitization pools, such as CMBS (including Non-Investment Grade “B-pieces” of a CMBS securitization pool). These bonds have been investment grade or below investment grade and are collateralized by CRE debt, typically secured by senior mortgage loans and may be fixed rate or floating rate securities. Due to their first-loss position, CMBS B-pieces are typically offered at a discount to par. These investments typically carry a 10-year weighted average life due to prepayment restrictions. We will continue to manage and monitor our remaining CMBS investments and are likely to selectively reduce exposure. Any future investments in more highly rated investment grade CRE Debt Securities would be selective and opportunistic. 71 |
The allocation of our capital among our target assets will depend on prevailing market conditions at the time we invest and may change over time in response to different prevailing market conditions. In addition, in the future, we may invest in assets other than our target assets or change our target assets. With respect to all of our investments, we invest so as to maintain our qualification
as a REIT for U.S. federal income tax purposes and our exclusion or exemption from regulation under the Investment Company Act of 1940, as amended (the “Investment Company Act”).
We believe that events in the financial markets from time to time, including the current and potential impacts of the COVID-19 pandemic, have created and will create significant dislocation between price and intrinsic value in certain asset classes as well as a supply and demand imbalance of available credit to finance these assets. We believe that the Company is well positioned to capitalize on such opportunities while remaining flexible to adapt our strategy as market conditions change, including with respect to existing investments that may be directly or indirectly impacted by such events. We believe that our Manager’s in-depth understanding of CRE and real estate-related investments, and in-house underwriting, asset management and resolution capabilities, provides the Company and management with a sophisticated full- servicefull-service value-add platform to regularly evaluate our investments and determine primary, secondary or alternative disposition strategies. This includes intermediate servicing and complex and creative negotiating, restructuring of non-performing investments, foreclosure considerations, intense management or development of owned real estate, in each case to reposition and achieve optimal value realization for the Company and its stockholders. Depending on the nature of the underlying investment, we may pursue repositioning strategies through judicious capital investment in order to extract maximum value from the investment or recognize unanticipated losses to reinvest resulting liquidity in higher-yielding performing investments.
Our Business Segments
Following the Combination, we conducted our business through the following five operating segments: the loan portfolio, CRE debt securities, net leased real estate, other, and corporate. We continually monitor and review our segment reporting structure in accordance with authoritative guidance to determine whether any changes have occurred that would impact our reportable segments.
During the third quarter of 2019, we realigned the business and reportable segment information to reflect how the Chief Operating Decision Makers regularly review and manage the business. As a result, effective for the quarter ended September 30, 2019, we present our business segments as follows:
•Core Portfolio, which consists of the following four segments and remain unchanged from the prior segments:
◦Senior and Mezzanine Loans and Preferred Equity—CRE debt investments including senior mortgage loans, mezzanine loans, and preferred equity interests as well as participations in such loans. The segment also includes acquisition, development and construction (“ADC”) arrangements accounted for as equity method investments.
◦CRE Debt Securities— securities investments currently consisting of BBB and some BB rated CMBS (including Non-Investment Grade “B-pieces” of a CMBS securitization pool) or CRE CLOs (including the junior tranches thereof, collateralized by pools of CRE debt investments).
◦Net Leased Real Estate—direct investments in commercial real estate with long-term leases to tenants on a net lease basis, where such tenants generally will be responsible for property operating expenses such as insurance, utilities, maintenance, capital expenditures and real estate taxes.
◦Corporate—includes corporate-level asset management and other fees including expenses related to our secured revolving credit facility, related party and general and administrative expenses to the Core Portfolio only.
•Legacy, Non-Strategic Portfolio—segment consists of direct investments in operating real estate such as multi-tenant office and multifamily residential assets such as real estate acquired in settlement of loans which we plan to exit. It also includes two portfolios of private equity funds (“PE Investments”) and certain retail and other legacy loans originated prior to the Combination. This segment also includes corporate-level asset management and other fees including expenses related to secured revolving credit facility, related party and general and administrative expenses related to the Legacy, Non-Strategic Portfolio only.
There were no changes in the structure of our internal organization that prompted the change in reportable segments. Prior year amounts have been revised to conform to the current year presentation. Accordingly, we realigned the discussion and analysis of our portfolio and results of operations to reflect these reportable segments.
COVID 19 Initiatives
Throughout Management’s Discussion and Analysis of Financial Condition and Results of Operations, we highlight significant actions we have taken to further protect the balance sheet from COVID-19 related risks. We have executed on certain liquidity
72
generating measures that include the sale of select Core Portfolio assets; some of which have closed and others which are under contract with an expected closing in the coming months. The Core Portfolio asset sales consist of loans, securities and equity investments. The Core Portfolio assets involved in these sales dispositions to date have mainly been CMBS securities and select hotel and preferred equity loans. We have also completed a long-term asset level financing against select Core Portfolio and Legacy, Non-Strategic assets. To date, these initiatives have not only generated liquidity but also reduced financing exposures. However, Core Portfolio assets sold to date along with those under contract to be sold will result in a material impact on earnings and certain downward adjustments to stockholders’ equity.
For more information, refer to “Part II - Item 1A. Risk Factors” and “Significant Developments,” in “Our Core Portfolio” and “COVID-19 Liquidity Update” in our “Liquidity and Capital Resources” sections below for further discussion regarding these action steps, the COVID-19 pandemic and its impact on our future operating results, liquidity and financial condition.
Significant Developments
During the three months ended June 30, 20192020 and through August 7, 2019,6, 2020, significant developments affecting our business and results of operations of our Core Portfolio and Legacy, Non-Strategic Portfolio, respectively, included the following:
•We reduced borrowing under our Bank Credit Facility (as defined below), master repurchase facilities and CMBS Credit Facilities as a mezzanineresult of COVID-19 uncertainties. In July 2020, we fully repaid all outstanding borrowings on our Bank Credit Facility. Total combined reduction of debt on these facilities through the date hereof is $617.4 million.
•Executed a $229 million asset level preferred financing on a portfolio of five of our investments generating $200 million of proceeds at closing with $29.0 million future funding. For further description refer to “COVID-19 Liquidity Update” in our “Liquidity and Capital Resources”; and
•Suspended monthly dividends beginning with the monthly period ended April 30, 2020.
Core Portfolio
•Sold 27 CRE debt securities and one loan taking possessionfor a total gross sales price of $188.0 million and recognized a retail property in June 2019;
•Recognized an impairment loss of $29.2 million on our PE Investments, of which we have received $120.6CRE debt security investments and $7.0 million of the total $141.8 million under binding sales contracts;
•We unwound our interest rate swaps and in connection realized a loss of $34.0 million;
•Made two protective advances totaling $28.5 million on our Los Angeles Mixed-use project and recorded our proportionate share of $10.1 million;a fair value loss adjustment totaling $89.3 million. See “Los Angeles Construction Loan and Preferred Equity Investment” in “Our Core Portfolio” below;
•We recorded $58.9 million of specific reserves for two loans to two separate borrowers collateralized by hotel and office properties. Subsequent to June 30, 2019, sold our retained investment in the subordinate tranches2020, we settled both loans generating gross proceeds of one securitization trust$175.2 million; and
•We agreed to sell two industrial portfolios that are expected to close before year-end and generate gross proceeds of $466.4 million versus a $438.4 million book value at June 30, 2020. These are expected to generate net proceeds of $118.0 million.
Legacy, Non-Strategic Portfolio
•Sold four investments (one real estate property and three loans) for $33.4a total gross sales price of $32.8 million in total proceeds; we expect to recognizeand a net gain of approximately $3.8$10.1 million;
•Recorded impairment on held for sale operating real estate properties of $25.9 million; and
•Subsequent to June 30, 2020, we completed the sale of two operating real estate properties classified as held for sale; generating gross proceeds of $5.0 million.
In summary, the combined asset sales and preferred financing referenced under “Significant Developments” above will provide $1.1 billion and $610.5 million in connection withof gross proceeds and net liquidity respectively, and an adjustment to book value of $258.5 million or $2.01 per share. This includes an adjustment to book value for the sale.
73
Results of Operations
•Generated U.S. GAAP net loss of the Combination, comparisons$(210.3) million, or $(1.64) per share and Core Earnings of our period to period financial information as set forth herein may not be meaningful. The historical financial information included herein as of any date,$(239.8) million, or for any periods, on or prior to January 31, 2018, represents the pre-merger financial information of the CLNY Investment Entities, our accounting predecessor, on a stand-alone basis. The CLNY Investment Entities represent only a portion of our business following the Combination and therefore do not represent the results of operations we would have had for any period prior to the Combination. As of February 1, 2018, our results of operations reflect our operation following the Combination of our accounting predecessor, the CLNY Investment Entities, and NorthStar I and NorthStar II. The results of operations of NorthStar I and NorthStar II are incorporated into ours effective from February 1, 2018.
| Three Months Ended June 30, | Increase (Decrease) | |||||||||||||
| 2019 | 2018 | Amount | % | |||||||||||
| Net interest income | ||||||||||||||
| Interest income | $ | 42,073 | $ | 36,795 | $ | 5,278 | 14.3 | % | ||||||
| Interest expense | (21,046 | ) | (9,703 | ) | (11,343 | ) | (116.9 | )% | ||||||
| Interest income on mortgage loans held in securitization trusts | 38,656 | 39,496 | (840 | ) | (2.1 | )% | ||||||||
| Interest expense on mortgage obligations issued by securitization trusts | (35,756 | ) | (36,459 | ) | 703 | 1.9 | % | |||||||
| Net interest income | 23,927 | 30,129 | (6,202 | ) | (20.6 | )% | ||||||||
| Property and other income | ||||||||||||||
| Property operating income | 64,767 | 39,477 | 25,290 | 64.1 | % | |||||||||
| Other income | 434 | 899 | (465 | ) | (51.7 | )% | ||||||||
| Total property and other income | 65,201 | 40,376 | 24,825 | 61.5 | % | |||||||||
| Expenses | ||||||||||||||
| Management fee expense | 11,357 | 11,791 | (434 | ) | (3.7 | )% | ||||||||
| Property operating expense | 28,140 | 16,256 | 11,884 | 73.1 | % | |||||||||
| Transaction, investment and servicing expense | 1,051 | 3,497 | (2,446 | ) | (69.9 | )% | ||||||||
| Interest expense on real estate | 13,898 | 9,850 | 4,048 | 41.1 | % | |||||||||
| Depreciation and amortization | 29,257 | 23,359 | 5,898 | 25.2 | % | |||||||||
| Provision for loan losses | 110,258 | — | 110,258 | 100.0 | % | |||||||||
| Impairment of operating real estate | 10,124 | — | 10,124 | 100.0 | % | |||||||||
| Administrative expense (including $2,713 and $1,798 of equity-based compensation expense) | 8,010 | 6,884 | 1,126 | 16.4 | % | |||||||||
| Total expenses | 212,095 | 71,637 | 140,458 | 196.1 | % | |||||||||
| Other income (loss) | ||||||||||||||
| Unrealized gain on mortgage loans and obligations held in securitization trusts, net | 5,549 | 3,696 | 1,853 | 50.1 | % | |||||||||
| Realized loss on mortgage loans and obligations held in securitization trusts, net | — | (2,203 | ) | 2,203 | 100.0 | % | ||||||||
| Other gain (loss), net | (6,062 | ) | 10 | (6,072 | ) | (60,720.0 | )% | |||||||
| Income (loss) before equity in earnings of unconsolidated ventures and income taxes | (123,480 | ) | 371 | (123,851 | ) | (33,383.0 | )% | |||||||
| Equity in earnings of unconsolidated ventures | 12,557 | 15,661 | (3,104 | ) | (19.8 | )% | ||||||||
| Income tax benefit (expense) | 133 | (158 | ) | 291 | 184.2 | % | ||||||||
| Net income (loss) | $ | (110,790 | ) | $ | 15,874 | $ | (126,664 | ) | (797.9 | )% | ||||
•Since April 1, 2020, we have collected 99% of interest payments and 97% of total rents due from our loan portfolio and net leased real estate portfolio, respectively. For further detail, refer to “COVID-19 Update” in “Our Core Portfolio;”
Legacy, Non-Strategic Portfolio
•Generated U.S. GAAP net loss of $(16.7) million, decrease associated with the repaymentor $(0.13) per share, and Legacy, Non-Strategic Earnings of five of our equity method investments. This was partially offset by an increase of $7.3$9.2 million, related to investments in unconsolidated joint ventures entered into in 2018, an increase of $1.3 million on one of our equity method investments in which the underlying investment was not operational until March 2018 and an increase of $1.2 million related to our increased commitment in June 2018 of one of our joint ventures which holds a mezzanine loan and a preferred equity investment.
•Since April 1, 2020, we have collected 89.2% of total rents due from our owned real estate portfolio.
Impact of COVID-19
Since its discovery in December 2019, a new strain of coronavirus, which causes the viral disease known as comparedCOVID-19, has spread throughout the world, including the United States. The outbreak was declared to be a pandemic by the World Health Organization, and the Health and Human Services Secretary has declared a public health emergency in the United States in response to the three months ended June 30, 2018, primarily due to an increased benefit associatedoutbreak. Considerable uncertainty still surrounds COVID-19 and its potential effects, and the extent of and effectiveness of any responses taken on a national and local level.
Accordingly, the COVID-19 pandemic has negatively impacted CRE credit REITs across the industry, as well as other companies that own and operate commercial real estate investments, including our company. As we manage the impact and uncertainties of the COVID-19 pandemic, cash preservation, liquidity and investment and portfolio management are our key priorities.
We are working closely with our PE investments, offset by an income tax provisionborrowers and tenants to address the impact of COVID-19 on their business. To the two hotels acquired throughextent that certain borrowers are experiencing significant financial dislocation we have and may continue to consider the legal foreclosure processuse of interest and other reserves and/or replenishment obligations of the borrower and/or guarantors to meet current interest payment obligations, for a limited period. Similarly, we have and may in the thirdfuture evaluate converting certain current interest payment obligations to payment-in-kind as a potential bridge period solution. We have in limited cases allowed some portions of current interest to convert to payment-in-kind.
As described above in “Significant Developments,” we have taken actions since the onset of the COVID-19 pandemic to mitigate the impact on our financial condition while establishinga defensive posture through this period.As of the date of this report, we have approximately $325 million in cash on hand and $200.0 million available on our bank facility. We anticipate liquidity to increase further as a result of proceeds from sales related to assets under contract. It is important to note that while the combined result of these activities and events is an increase in liquidity and a reduction in debt, these events will also reduce future period earnings.
The decisive steps taken to protect the balance sheet and generate liquidity, position us to address further market and investment deterioration related to COVID-19. Asset and liability management and liquidity remain our primary focus.Our focus will shift toward new investment and growth initiatives when circumstances related to COVID-19 improve sufficiently to reduce exposure to further liquidity demands.
The COVID-19 pandemic has created uncertainties that have and will negatively impact our future operating results, liquidity and financial condition. However, we believe there are too many uncertainties to predict and quantify the continuing impact. The potential concerns and risks include, but are not limited to, mortgage borrowers ability to make monthly payments, lessees’ capacity to pay their rent, and the resulting impact on us to meet our obligations. Therefore, there can be no assurances that we will not need to take impairment charges in future quarters or experience further declines in revenues and net income, which could be material. For more information, refer to “COVID-19 Update” in “Our Core Portfolio” and “Our Legacy, Non-Strategic Portfolio” and “COVID-19 Liquidity Update” in our “Liquidity and Capital Resources” sections below and “Part II - Item 1A. Risk Factors” of our Quarterly Report on Form 10-Q for the quarter ended March 31, 2020 for further discussion regarding the COVID-19 pandemic and its impact on our future operating results, liquidity and financial condition.
Internal Controls
The health and well-being of 2018.
74
Results of Six Months Ended June 30, 2019 and 2018 (Dollars in Thousands):Operations Summary
| Six Months Ended June 30, | Increase (Decrease) | |||||||||||||
| 2019 | 2018 | Amount | % | |||||||||||
| Net interest income | ||||||||||||||
| Interest income | $ | 80,482 | $ | 72,934 | $ | 7,548 | 10.3 | % | ||||||
| Interest expense | (40,338 | ) | (17,118 | ) | (23,220 | ) | (135.6 | )% | ||||||
| Interest income on mortgage loans held in securitization trusts | 77,132 | 65,361 | 11,771 | 18.0 | % | |||||||||
| Interest expense on mortgage obligations issued by securitization trusts | (71,391 | ) | (60,737 | ) | (10,654 | ) | (17.5 | )% | ||||||
| Net interest income | 45,885 | 60,440 | (14,555 | ) | (24.1 | )% | ||||||||
| Property and other income | ||||||||||||||
| Property operating income | 127,901 | 68,022 | 59,879 | 88.0 | % | |||||||||
| Other income | 611 | 1,416 | (805 | ) | (56.9 | )% | ||||||||
| Total property and other income | 128,512 | 69,438 | 59,074 | 85.1 | % | |||||||||
| Expenses | ||||||||||||||
| Management fee expense | 22,715 | 19,791 | 2,924 | 14.8 | % | |||||||||
| Property operating expense | 56,320 | 27,969 | 28,351 | 101.4 | % | |||||||||
| Transaction, investment and servicing expense | 1,580 | 34,581 | (33,001 | ) | (95.4 | )% | ||||||||
| Interest expense on real estate | 27,505 | 16,106 | 11,399 | 70.8 | % | |||||||||
| Depreciation and amortization | 56,919 | 42,151 | 14,768 | 35.0 | % | |||||||||
| Provision for loan losses | 110,258 | — | 110,258 | 100.0 | % | |||||||||
| Impairment of operating real estate | 10,124 | — | 10,124 | 100.0 | % | |||||||||
| Administrative expense (including $4,556 and $2,083 of equity-based compensation expense) | 14,663 | 10,112 | 4,551 | 45.0 | % | |||||||||
| Total expenses | 300,084 | 150,710 | 149,374 | 99.1 | % | |||||||||
| Other income (loss) | ||||||||||||||
| Unrealized gain on mortgage loans and obligations held in securitization trusts, net | 6,578 | 4,193 | 2,385 | 56.9 | % | |||||||||
| Realized gain (loss) on mortgage loans and obligations held in securitization trusts, net | 48 | (2,203 | ) | 2,251 | 102.2 | % | ||||||||
| Other gain (loss), net | (11,141 | ) | 475 | (11,616 | ) | (2,445.5 | )% | |||||||
| Loss before equity in earnings of unconsolidated ventures and income taxes | (130,202 | ) | (18,367 | ) | (111,835 | ) | (608.9 | )% | ||||||
| Equity in earnings of unconsolidated ventures | 33,867 | 31,449 | 2,418 | 7.7 | % | |||||||||
| Income tax benefit | 502 | 391 | 111 | 28.4 | % | |||||||||
| Net income (loss) | $ | (95,833 | ) | $ | 13,473 | $ | (109,306 | ) | (811.3 | )% | ||||
| Three Months Ended June 30, | ||||||||||||||||||||||||||||||||||||||||||||||||||||||||||||||||||||||||||||||||||||||
| 2020 | 2019 | |||||||||||||||||||||||||||||||||||||||||||||||||||||||||||||||||||||||||||||||||||||
| Core Portfolio | Legacy, Non-Strategic Portfolio | Total | Core Portfolio | Legacy, Non-Strategic Portfolio | Total | |||||||||||||||||||||||||||||||||||||||||||||||||||||||||||||||||||||||||||||||||
| Net interest income | $ | 25,449 | $ | (511) | $ | 24,938 | $ | 20,891 | $ | 3,036 | $ | 23,927 | ||||||||||||||||||||||||||||||||||||||||||||||||||||||||||||||||||||||||||
| Property and other income | 14,833 | 20,529 | 35,362 | 30,070 | 35,131 | 65,201 | ||||||||||||||||||||||||||||||||||||||||||||||||||||||||||||||||||||||||||||||||
| Management fee expense | (6,485) | (721) | (7,206) | (9,086) | (2,271) | (11,357) | ||||||||||||||||||||||||||||||||||||||||||||||||||||||||||||||||||||||||||||||||
| Property operating expense | (3,275) | (13,036) | (16,311) | (7,901) | (20,239) | (28,140) | ||||||||||||||||||||||||||||||||||||||||||||||||||||||||||||||||||||||||||||||||
| Transaction, investment and servicing expense | (1,440) | (1,467) | (2,907) | (317) | (734) | (1,051) | ||||||||||||||||||||||||||||||||||||||||||||||||||||||||||||||||||||||||||||||||
| Interest expense on real estate | (8,085) | (3,733) | (11,818) | (8,814) | (5,084) | (13,898) | ||||||||||||||||||||||||||||||||||||||||||||||||||||||||||||||||||||||||||||||||
| Depreciation and amortization | (9,297) | (4,723) | (14,020) | (12,888) | (16,369) | (29,257) | ||||||||||||||||||||||||||||||||||||||||||||||||||||||||||||||||||||||||||||||||
| Provision for loan losses | 86 | (35) | 51 | — | (110,258) | (110,258) | ||||||||||||||||||||||||||||||||||||||||||||||||||||||||||||||||||||||||||||||||
| Impairment of operating real estate | — | (25,935) | (25,935) | — | (10,124) | (10,124) | ||||||||||||||||||||||||||||||||||||||||||||||||||||||||||||||||||||||||||||||||
| Administrative expense | (4,412) | (2,339) | (6,751) | (4,168) | (3,842) | (8,010) | ||||||||||||||||||||||||||||||||||||||||||||||||||||||||||||||||||||||||||||||||
| Unrealized gain (loss) on mortgage loans and obligations held in securitization trusts, net | (8,975) | — | (8,975) | 5,549 | — | 5,549 | ||||||||||||||||||||||||||||||||||||||||||||||||||||||||||||||||||||||||||||||||
| Other gain (loss) on investments, net | (126,562) | 6,929 | (119,633) | (6,016) | (46) | (6,062) | ||||||||||||||||||||||||||||||||||||||||||||||||||||||||||||||||||||||||||||||||
| Income (loss) before equity in earnings of unconsolidated ventures and income taxes | (128,163) | (25,042) | (153,205) | 7,320 | (130,800) | (123,480) | ||||||||||||||||||||||||||||||||||||||||||||||||||||||||||||||||||||||||||||||||
| Equity in earnings (loss) of unconsolidated ventures | (85,328) | 51 | (85,277) | 17,917 | (5,360) | 12,557 | ||||||||||||||||||||||||||||||||||||||||||||||||||||||||||||||||||||||||||||||||
| Income tax benefit (expense) | (2,101) | (1) | (2,102) | (359) | 492 | 133 | ||||||||||||||||||||||||||||||||||||||||||||||||||||||||||||||||||||||||||||||||
| Net income (loss) | $ | (215,592) | $ | (24,992) | $ | (240,584) | $ | 24,878 | $ | (135,668) | $ | (110,790) | ||||||||||||||||||||||||||||||||||||||||||||||||||||||||||||||||||||||||||
| Six Months Ended June 30, | ||||||||||||||||||||||||||||||||||||||||||||||||||||||||||||||||||||
| 2020 | 2019 | |||||||||||||||||||||||||||||||||||||||||||||||||||||||||||||||||||
| Core Portfolio | Legacy, Non-Strategic Portfolio | Total | Core Portfolio | Legacy, Non-Strategic Portfolio | Total | |||||||||||||||||||||||||||||||||||||||||||||||||||||||||||||||
| Net interest income | $ | 52,605 | $ | 189 | $ | 52,794 | $ | 39,225 | $ | 6,660 | $ | 45,885 | ||||||||||||||||||||||||||||||||||||||||||||||||||||||||
| Property and other income | 45,466 | 51,818 | 97,284 | 60,134 | 68,378 | 128,512 | ||||||||||||||||||||||||||||||||||||||||||||||||||||||||||||||
| Management fee expense | (13,002) | (2,150) | (15,152) | (18,172) | (4,543) | (22,715) | ||||||||||||||||||||||||||||||||||||||||||||||||||||||||||||||
| Property operating expense | (6,958) | (31,884) | (38,842) | (16,847) | (39,473) | (56,320) | ||||||||||||||||||||||||||||||||||||||||||||||||||||||||||||||
| Transaction, investment and servicing expense | (3,654) | (2,387) | (6,041) | (372) | (1,208) | (1,580) | ||||||||||||||||||||||||||||||||||||||||||||||||||||||||||||||
| Interest expense on real estate | (16,546) | (8,350) | (24,896) | (17,384) | (10,121) | (27,505) | ||||||||||||||||||||||||||||||||||||||||||||||||||||||||||||||
| Depreciation and amortization | (20,449) | (11,547) | (31,996) | (25,972) | (30,947) | (56,919) | ||||||||||||||||||||||||||||||||||||||||||||||||||||||||||||||
| Provision for loan losses | (31,413) | (38,468) | (69,881) | — | (110,258) | (110,258) | ||||||||||||||||||||||||||||||||||||||||||||||||||||||||||||||
| Impairment of operating real estate | — | (30,061) | (30,061) | — | (10,124) | (10,124) | ||||||||||||||||||||||||||||||||||||||||||||||||||||||||||||||
| Administrative expense | (8,543) | (5,246) | (13,789) | (7,808) | (6,855) | (14,663) | ||||||||||||||||||||||||||||||||||||||||||||||||||||||||||||||
| Unrealized gain on mortgage loans and obligations held in securitization trusts, net | (28,427) | — | (28,427) | 6,578 | — | 6,578 | ||||||||||||||||||||||||||||||||||||||||||||||||||||||||||||||
| Realized gain (loss) on mortgage loans and obligations held in securitization trusts, net | — | — | — | 48 | — | 48 | ||||||||||||||||||||||||||||||||||||||||||||||||||||||||||||||
| Other gain (loss) on investments, net | (147,074) | 7,279 | (139,795) | (9,842) | (1,299) | (11,141) | ||||||||||||||||||||||||||||||||||||||||||||||||||||||||||||||
| Income (loss) before equity in earnings of unconsolidated ventures and income taxes | (177,995) | (70,807) | (248,802) | 9,588 | (139,790) | (130,202) | ||||||||||||||||||||||||||||||||||||||||||||||||||||||||||||||
| Equity in earnings (loss) of unconsolidated ventures | (71,255) | 3,145 | (68,110) | 36,285 | (2,418) | 33,867 | ||||||||||||||||||||||||||||||||||||||||||||||||||||||||||||||
| Income tax benefit (expense) | (2,264) | (1,549) | (3,813) | 1,629 | (1,127) | 502 | ||||||||||||||||||||||||||||||||||||||||||||||||||||||||||||||
| Net income (loss) | $ | (251,514) | $ | (69,211) | $ | (320,725) | $ | 47,502 | $ | (143,335) | $ | (95,833) | ||||||||||||||||||||||||||||||||||||||||||||||||||||||||
75
76
Our Core Portfolio
As of June 30, 2019,2020, our portfolioCore Portfolio, including our senior and mezzanine loans and preferred equity, CRE debt securities, net leased real estate and corporate segments, consisted of 18381 investments representing approximately $8.7$3.7 billion in book value (excluding cash, cash equivalents and certain other assets). Our loan portfoliosenior and mezzanine loans and preferred equity consisted of 7051 senior mortgage loans, mezzanine loans, preferred equity investments and other loans and had a weighted average cash coupon of 6.3%5.1% and a weighted average all-in unlevered yield of 8.0%6.3%. Our CRE debt securities portfolio had a weighted average cash coupon of 3.8%2.8%. Our ownednet leased real estate portfolio (including net lease and other real estate) consisted of approximately 19.512.5 million total square feet of space and the total annualized base rentfirst quarter net operating income (“NOI”) of that portfolio was approximately $166.4 million (based on leases in place as of June 30, 2019).$18.2 million.
As of June 30, 2019,2020, our portfolioCore Portfolio consisted of the following investments (dollars in thousands):
| Asset | Count | Book value | Noncontrolling interest(1) | Book value at our share(2) | |||||||||||
Senior mortgage loans(3)(4) | 45 | $ | 2,361,808 | $ | 1,216 | $ | 2,360,592 | ||||||||
Mezzanine loans(3)(5) | 16 | 392,728 | 160 | 392,568 | |||||||||||
Preferred equity(3)(6) | 8 | 297,606 | — | 297,606 | |||||||||||
CMBS(7) | 53 | 398,767 | — | 398,767 | |||||||||||
Mortgage loans held in securitization trusts(7) | — | 3,026,282 | — | 3,026,282 | |||||||||||
Owned real estate-Net lease(8) | 12 | 1,290,101 | 34,446 | 1,255,655 | |||||||||||
Owned real estate-Other(8)(9) | 42 | 899,437 | 110,148 | 789,289 | |||||||||||
| Private equity interests | 6 | 53,893 | — | 53,893 | |||||||||||
Other loans(10) | 1 | 11,451 | — | 11,451 | |||||||||||
| Total | 183 | $ | 8,732,073 | $ | 145,970 | $ | 8,586,103 | ||||||||
Count(1) | Book value (Consolidated) | Book value (at CLNC share)(2) | Net book value (Consolidated)(3) | Net book value (at CLNC share)(4) | ||||||||||||||||||||||||||||
| Core Portfolio | ||||||||||||||||||||||||||||||||
Senior mortgage loans(5) | 35 | $ | 2,279,394 | $ | 2,136,279 | $ | 700,400 | $ | 557,284 | |||||||||||||||||||||||
Mezzanine loans(5) | 9 | 273,242 | 234,337 | 273,242 | 234,337 | |||||||||||||||||||||||||||
Preferred equity and other loans(5)(6) | 7 | 145,543 | 142,515 | 145,543 | 142,515 | |||||||||||||||||||||||||||
| CRE debt securities | 24 | 141,638 | 141,638 | 103,287 | 103,287 | |||||||||||||||||||||||||||
| Net leased real estate | 6 | 1,074,887 | 1,002,622 | 328,215 | 308,408 | |||||||||||||||||||||||||||
| Total/Weighted average Core Portfolio | 81 | $ | 3,914,704 | $ | 3,657,391 | $ | 1,550,687 | $ | 1,345,831 | |||||||||||||||||||||||
(2)Book value at our share represents the proportionate book value based on ownership by asset as of June 30, 2020.
(3)Net book value represents book value less any associated financing as of June 30, 2020.
(4)Net book value at our share represents the proportionate book value based on asset ownership less any associated financing based on ownership as of June 30, 2020.
(5)Senior mortgage loans, mezzanine loans, and preferred equity include investments in joint ventures whose underlying interest is in a loan or preferred equity.
(6)Preferred equity balances include $17.0 million of book value at our share attributable to related equity participation interests.
The following charts illustrate the diversification of our portfolioCore Portfolio (not including CMBS, mortgage loans held in securitization trusts, private equity interests, and other)CRE Debt Securities) based on investment type, underlying property type, and geography, as of June 30, 20192020 (percentages based on book value at our share, which represents the proportionate book value based on our ownership by asset):
| Investment Type | Property Type | |||||||
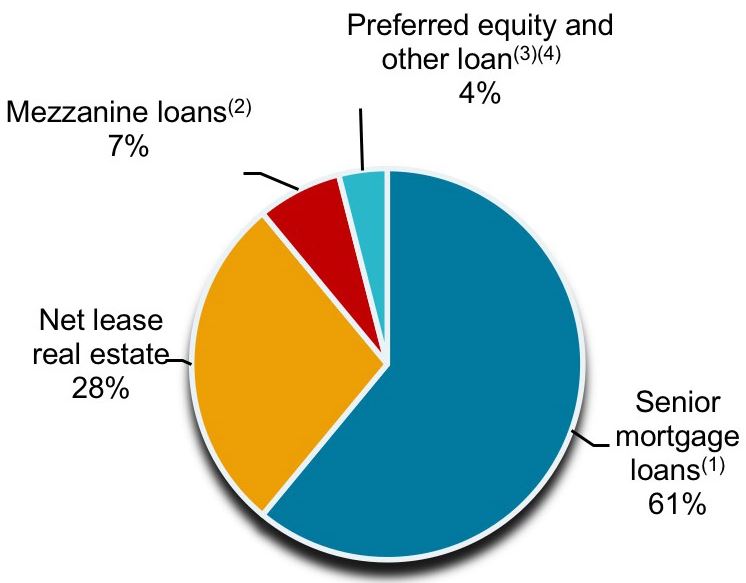 | 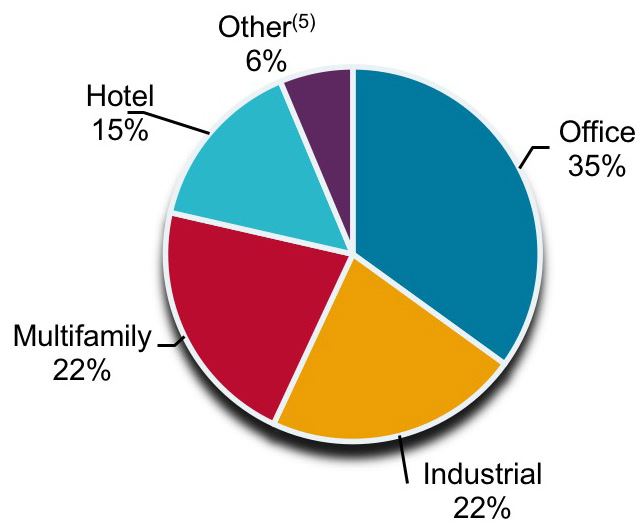 | |||||||
77
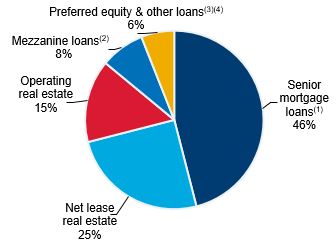 | 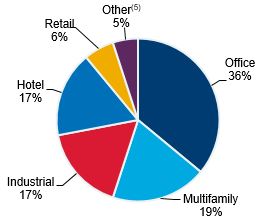 | |||
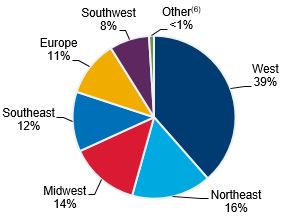 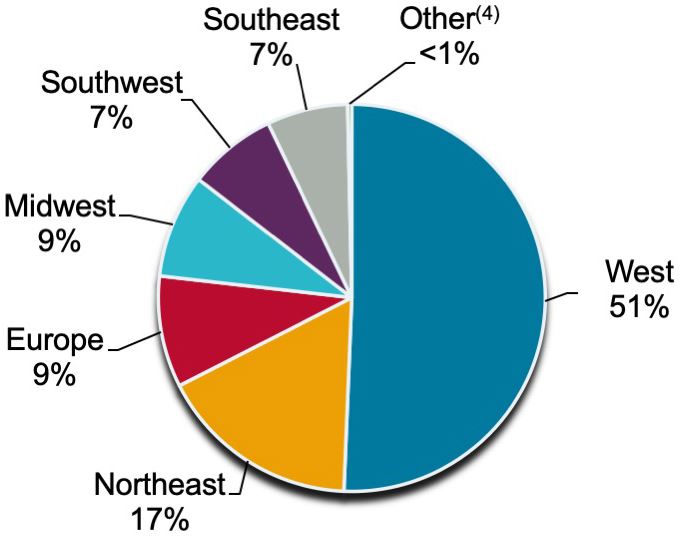 |
(1)Senior mortgage loans include junior participations in our originated senior mortgage loans for which we have syndicated the senior participations to other investors and retained the junior participations for our portfolio and contiguous mezzanine loans where we own both the senior and junior loan positions. We believe these investments are more similar to the senior mortgage loans we originate than other loan types given their credit quality and risk profile.
(2)Mezzanine loans include other subordinated loans.
(3)Preferred equity balances include $17.0 million of book value at our share attributable to related equity participation interests.
(4)Other contains one corporate term loan secured by the borrower’s limited partnership interests in a fund.
(5)Other includes commercial and residential development and predevelopment assets, one corporate term loan secured by the borrower’s limited partnership interests in a fund, and a preferred equity investment in a loan origination platform.
Underwriting Process
We use a rigorousan investment and underwriting process that has been developed and utilized by our Manager’s and its affiliates’ senior management teams leveraging their extensive commercial real estate expertise over many years and real estate cycles. The underwriting process focuses on some or all of the following factors designed to ensure each investment is evaluated appropriately: (i) macroeconomic conditions that may influence operating performance; (ii) fundamental analysis of underlying real estate, including tenant rosters, lease terms, zoning, necessary licensing, operating costs and the asset’s overall competitive position in its market; (iii) real estate market factors that may influence the economic performance of the investment, including leasing conditions and overall competition; (iv) the operating expertise and financial strength and reputation of a tenant, operator, partner or borrower; (v) the cash flow in place and projected to be in place over the term of the investment and potential return; (vi) the appropriateness of the business plan and estimated costs associated with tenant buildout, repositioning or capital improvements; (vii) an internal and third-party valuation of a property, investment basis relative to the competitive set and the ability to liquidate an investment through a sale or refinancing; (viii) review of third-party reports including appraisals, engineering and environmental reports; (ix) physical inspections of properties and markets; (x) the overall legal structure of the investment, contractual implications and the lenders’ rights; and (xi) the tax and accounting impact.
Loan Risk Rankings
In addition to reviewing loans and preferred equity held for investment for impairment quarterly, the Company evaluates loans and preferred equity held for investment to determine if an allowance for loan loss should be established. In conjunction with this review, the Company assesses the risk factors of each senior and mezzanine loans and preferred equity and assigns a risk rating based on a variety of factors, including, without limitation, underlying real estate performance and asset value, values of comparable properties, durability and quality of property cash flows, sponsor experience and financial wherewithal, and the existence of a risk-mitigating loan structure. Additional key considerations include loan-to-value ratios, debt service coverage ratios, loan structure, real estate and credit market dynamics, and risk of default or principal loss. Based on a five-point scale, the Company’s loans and preferred equity held for investment are rated “1” through “5,” from less risk to greater risk. At the time of origination or purchase, loans and preferred equity held for investment are ranked as a “3” and will move accordingly going forward based on the ratings which are defined as follows
1.Very Low Risk—The following section describesloan is performing as agreed. The underlying property performance has exceeded underwritten expectations with very strong NOI, debt service coverage ratio, debt yield and occupancy metrics. Sponsor is investment grade, very well capitalized, and employs very experienced management team.
2.Low Risk—The loan is performing as agreed. The underlying property performance has met or exceeds underwritten expectations with high occupancy at market rents, resulting in consistent cash flow to service the major CRE asset classesdebt. Strong sponsor that is well capitalized with experienced management team.
78
3.Average Risk—The loan is performing as agreed. The underlying property performance is consistent with underwriting expectations. The property generates adequate cash flow to service the debt, and/or there is a sufficient reserve or loan structure to provide time for sponsor to execute the business plan. Sponsor has routinely met its obligations and has experience owning/operating similar real estate.
4.High Risk/Delinquent/Potential for Loss—The loan is in excess of 30 days delinquent and/or has a risk of a principal loss. The underlying property performance is behind underwritten expectations. Loan covenants may require occasional waivers/modifications. Sponsor has been unable to execute its business plan and local market fundamentals have deteriorated. Operating cash flow is not sufficient to service the debt and debt service payments may be coming from sponsor equity/loan reserves.
5.Impaired/Defaulted/Loss Likely—The loan is in default or a default is imminent, and has a high risk of a principal loss, or has incurred a principal loss. The underlying property performance is significantly worse than underwritten expectation and sponsor has failed to execute its business plan. The property has significant vacancy and current cash flow does not support debt service. Local market fundamentals have significantly deteriorated resulting in depressed comparable property valuations versus underwriting.
As mentioned above, management considers several risk factors when assigning our risk rating each quarter. Beginning with the quarter ended March 31, 2020, our average risk ranking was impacted by the current and potential future effects of the COVID-19 pandemic, resulting in a number of assets moving from average risk (3) to high risk (4) during the quarter and an average rating of 3.8.
For the quarter ended June 30, 2020, management believes the extended impact of the COVID-19 pandemic remains uncertain, and therefore continues to represent a significant risk to our portfolio. As such, the current period average rating is 3.9, which we may investis consistent with the first quarter 2020.
Senior and actively manage to maximize valueMezzanine Loans and to protect capital.
Our loan portfoliosenior and mezzanine loans and preferred equity consists of senior mortgage loans, mezzanine loans and preferred equity interests, some of which have equity participation interests.
The following table provides a summary of our loan portfoliosenior and mezzanine loans and preferred equity in our Core Portfolio based on our internal risk rankings as of June 30, 20192020 (dollars in thousands):
Weighted Average(1) | |||||||||||||||||||||||
| Asset | Count | Book value | Principal balance | Cash Coupon(2) | All-in unlevered yield(3) | Remaining term(4) | Extended remaining term(5) | ||||||||||||||||
Senior loans(6)(7) | 45 | $ | 2,361,808 | $ | 2,433,280 | 6.1 | % | 6.9 | % | 1.9 | 4.2 | ||||||||||||
Mezzanine loans(6)(8) | 16 | 392,728 | 500,633 | 6.7 | % | 12.3 | % | 1.2 | 2.8 | ||||||||||||||
Preferred equity(6)(9) | 8 | 297,606 | 343,467 | 7.0 | % | 10.8 | % | 6.6 | 7.0 | ||||||||||||||
| Other loans | 1 | 11,451 | 11,595 | 15.0 | % | 15.0 | % | 2.9 | 4.9 | ||||||||||||||
| Total / Weighted average | 70 | $ | 3,063,593 | $ | 3,288,975 | 6.3 | % | 8.0 | % | 2.3 | 4.3 | ||||||||||||
Carrying Value (at CLNC share)(1) | ||||||||||||||||||||||||||||||||||||||||||||||||||||||||
| Risk Ranking | Count(2) | Senior mortgage loans(3) | Mezzanine loans | Preferred equity and other loans | Total | % of Core Portfolio | ||||||||||||||||||||||||||||||||||||||||||||||||||
| 3 | 10 | $ | 590,938 | $ | — | $ | — | $ | 590,938 | 23.5 | % | |||||||||||||||||||||||||||||||||||||||||||||
| 4 | 34 | 1,440,653 | 120,509 | 44,794 | 1,605,956 | 63.9 | % | |||||||||||||||||||||||||||||||||||||||||||||||||
| 5 | 6 | 132,400 | 86,116 | 97,718 | 316,234 | 12.6 | % | |||||||||||||||||||||||||||||||||||||||||||||||||
| 50 | $ | 2,163,991 | $ | 206,625 | $ | 142,512 | $ | 2,513,128 | 100.0 | % | ||||||||||||||||||||||||||||||||||||||||||||||
| Weighted average risk ranking | 3.9 | |||||||||||||||||||||||||||||||||||||||||||||||||||||||
(1)Book value at |
(2)Count excludes one equity method participation held in a joint venture with a de minimis carrying value (at CLNC share) which was not assigned a risk ranking.
(3)Includes one mezzanine loan totaling $27.7 million where we are also the senior lender.
The following table provides asset level detail for senior and mezzanine loans and preferred equity included in our Core Portfolio as of June 30, 2020 (dollars in thousands):
| Collateral type | Origination Date | City, State | Carrying value(1) | Principal balance | Coupon type | Cash Coupon(2) | Unlevered all-in yield(3) | Extended maturity date | Loan-to-value(4) | Q2/Q1/Q4 Risk ranking(5) | ||||||||||||||||||||||||||||||||||||||||||||||||||||||||||||||||||||||||||||
| Senior loans | ||||||||||||||||||||||||||||||||||||||||||||||||||||||||||||||||||||||||||||||||||||||
| Loan 1 | Multifamily | 6/21/2019 | Milpitas, CA | $ | 174,435 | $ | 176,771 | Floating | 3.1% | 5.5% | 7/9/2024 | 72% | 3/3/3 | |||||||||||||||||||||||||||||||||||||||||||||||||||||||||||||||||||||||||
| Loan 2 | Hotel | 1/2/2018 | San Jose, CA | 169,920 | 173,485 | Floating | 4.3% | 5.3% | 1/9/2023 | 62% | 4/4/3 | |||||||||||||||||||||||||||||||||||||||||||||||||||||||||||||||||||||||||||
| Loan 3 | Hotel | 6/28/2018 | Berkeley, CA | 118,022 | 120,517 | Floating | 3.2% | 5.2% | 7/9/2025 | 66% | 4/4/3 | |||||||||||||||||||||||||||||||||||||||||||||||||||||||||||||||||||||||||||
79
Weighted Average(1) | |||||||||||||||||||||||||||
| Number of loans | Book value | Principal balance | Unfunded loan commitments | Spread to LIBOR | All-in unlevered yield(2) | Remaining term(3) | Extended remaining term(4) | ||||||||||||||||||||
| Floating rate loans | 46 | $ | 2,191,090 | $ | 2,259,848 | $ | 214,354 | 3.8 | % | 6.3 | % | 1.9 | 4.2 | ||||||||||||||
Fixed rate loans(5) | 24 | 872,503 | 1,029,127 | 23,232 | — | % | 12.3 | % | 3.1 | 4.5 | |||||||||||||||||
| Total/ Weighted average | 70 | $ | 3,063,593 | $ | 3,288,975 | $ | 237,586 | — | % | 8.0 | % | 2.3 | 4.3 | ||||||||||||||
| Collateral type | Origination Date | City, State | Carrying value(1) | Principal balance | Coupon type | Cash Coupon(2) | Unlevered all-in yield(3) | Extended maturity date | Loan-to-value(4) | Q2/Q1/Q4 Risk ranking(5) | ||||||||||||||||||||||||||||||||||||||||||||||||||||||||||||||||||||||||||||
| Loan 4 | Industrial | 9/19/2019 | New York, NY | 114,950 | 116,000 | Floating | 3.1% | 5.8% | 9/19/2024 | 76% | 4/3/3 | |||||||||||||||||||||||||||||||||||||||||||||||||||||||||||||||||||||||||||
| Loan 5 | Office | 12/7/2018 | Carlsbad, CA | 113,315 | 115,563 | Floating | 3.7% | 6.1% | 12/9/2023 | 73% | 3/3/3 | |||||||||||||||||||||||||||||||||||||||||||||||||||||||||||||||||||||||||||
| Loan 6 | Hotel | 10/29/2018 | San Diego, CA | 104,900 | 143,777 | Floating | 4.8% | 6.9% | 10/9/2024 | 71% | 5/4/4 | |||||||||||||||||||||||||||||||||||||||||||||||||||||||||||||||||||||||||||
Loan 7(6) | Multifamily | 6/18/2019 | Santa Clara, CA | 100,410 | 101,987 | Floating | 4.4% | 7.3% | 6/18/2024 | 64% | 4/4/3 | |||||||||||||||||||||||||||||||||||||||||||||||||||||||||||||||||||||||||||
| Loan 8 | Multifamily | 4/11/2019 | Various - U.S. | 91,533 | 92,000 | Floating | 3.0% | 5.9% | 4/9/2024 | 65% | 4/4/3 | |||||||||||||||||||||||||||||||||||||||||||||||||||||||||||||||||||||||||||
| Loan 9 | Office | 5/31/2019 | Stamford, CT | 90,027 | 91,443 | Floating | 3.5% | 5.8% | 6/9/2025 | 71% | 4/4/3 | |||||||||||||||||||||||||||||||||||||||||||||||||||||||||||||||||||||||||||
| Loan 10 | Office | 6/27/2018 | Burlingame, CA | 73,222 | 73,254 | Floating | 2.8% | 5.1% | 7/9/2023 | 61% | 3/3/3 | |||||||||||||||||||||||||||||||||||||||||||||||||||||||||||||||||||||||||||
| Loan 11 | Hotel | 6/25/2018 | Englewood, CO | 71,826 | 73,000 | Floating | 3.5% | 5.3% | 7/9/2023 | 69% | 4/4/3 | |||||||||||||||||||||||||||||||||||||||||||||||||||||||||||||||||||||||||||
| Loan 12 | Other (Mixed-use) | 10/24/2019 | Brooklyn, NY | 67,729 | 69,535 | Floating | 3.4% | 5.9% | 11/9/2024 | 66% | 4/4/3 | |||||||||||||||||||||||||||||||||||||||||||||||||||||||||||||||||||||||||||
| Loan 13 | Office | 8/28/2018 | San Jose, CA | 67,582 | 67,651 | Floating | 2.5% | 4.5% | 8/28/2025 | 66% | 3/3/3 | |||||||||||||||||||||||||||||||||||||||||||||||||||||||||||||||||||||||||||
| Loan 14 | Office | 4/5/2019 | Long Island City, NY | 62,371 | 62,981 | Floating | 3.3% | 5.8% | 4/9/2024 | 58% | 4/4/3 | |||||||||||||||||||||||||||||||||||||||||||||||||||||||||||||||||||||||||||
| Loan 15 | Office | 5/29/2019 | Long Island City, NY | 61,326 | 63,135 | Floating | 3.5% | 6.0% | 6/9/2024 | 59% | 4/4/3 | |||||||||||||||||||||||||||||||||||||||||||||||||||||||||||||||||||||||||||
| Loan 16 | Office | 2/13/2019 | Baltimore, MD | 54,926 | 55,438 | Floating | 3.5% | 6.2% | 2/9/2024 | 74% | 4/4/3 | |||||||||||||||||||||||||||||||||||||||||||||||||||||||||||||||||||||||||||
| Loan 17 | Office | 7/12/2019 | Washington, D.C. | 53,278 | 53,828 | Floating | 2.8% | 5.7% | 8/9/2024 | 68% | 4/4/3 | |||||||||||||||||||||||||||||||||||||||||||||||||||||||||||||||||||||||||||
| Loan 18 | Multifamily | 7/1/2019 | Phoenix, AZ | 44,218 | 44,384 | Floating | 2.7% | 5.0% | 7/9/2024 | 76% | 4/4/3 | |||||||||||||||||||||||||||||||||||||||||||||||||||||||||||||||||||||||||||
| Loan 19 | Multifamily | 10/9/2018 | Dupont, WA | 40,350 | 40,500 | Floating | 3.3% | 5.6% | 11/9/2023 | 82% | 3/3/3 | |||||||||||||||||||||||||||||||||||||||||||||||||||||||||||||||||||||||||||
Loan 20(6) | Other (Mixed-use) | 10/17/2018 | Dublin, Ireland | 38,426 | 38,349 | Fixed | —% | 15.0% | 12/31/2023 | 94% | 4/4/3 | |||||||||||||||||||||||||||||||||||||||||||||||||||||||||||||||||||||||||||
| Loan 21 | Multifamily | 2/8/2019 | Las Vegas, NV | 38,278 | 38,551 | Floating | 3.2% | 5.9% | 2/9/2024 | 71% | 4/4/3 | |||||||||||||||||||||||||||||||||||||||||||||||||||||||||||||||||||||||||||
| Loan 22 | Multifamily | 5/22/2018 | Henderson, NV | 37,188 | 37,700 | Floating | 3.3% | 5.3% | 6/9/2023 | 73% | 4/4/3 | |||||||||||||||||||||||||||||||||||||||||||||||||||||||||||||||||||||||||||
| Loan 23 | Multifamily | 5/3/2019 | North Phoenix, AZ | 36,530 | 36,844 | Floating | 3.4% | 5.6% | 5/9/2024 | 81% | 4/4/3 | |||||||||||||||||||||||||||||||||||||||||||||||||||||||||||||||||||||||||||
| Loan 24 | Office | 9/26/2019 | Salt Lake City, UT | 35,855 | 36,355 | Floating | 2.7% | 5.0% | 10/9/2024 | 72% | 4/4/3 | |||||||||||||||||||||||||||||||||||||||||||||||||||||||||||||||||||||||||||
| Loan 25 | Multifamily | 4/26/2018 | Oxnard, CA | 34,297 | 36,500 | Floating | 5.2% | 7.2% | 11/9/2020 | 71% | 4/4/3 | |||||||||||||||||||||||||||||||||||||||||||||||||||||||||||||||||||||||||||
| Loan 26 | Office | 6/16/2017 | Miami, FL | 33,316 | 33,241 | Floating | 4.9% | 5.9% | 7/9/2022 | 68% | 3/3/3 | |||||||||||||||||||||||||||||||||||||||||||||||||||||||||||||||||||||||||||
| Loan 27 | Office | 3/28/2019 | San Jose, CA | 30,101 | 30,251 | Floating | 3.0% | 5.9% | 4/9/2024 | 64% | 4/4/3 | |||||||||||||||||||||||||||||||||||||||||||||||||||||||||||||||||||||||||||
Loan 28(7) | Hotel | 11/8/2013 | Bloomington, MN | 27,500 | 29,587 | n/a(7) | n/a(7) | n/a(7) | n/a(7) | 100% | 5/5/4 | |||||||||||||||||||||||||||||||||||||||||||||||||||||||||||||||||||||||||||
| Loan 29 | Multifamily | 1/11/2019 | Tempe, AZ | 26,505 | 26,540 | Floating | 2.9% | 5.2% | 2/9/2024 | 79% | 4/4/3 | |||||||||||||||||||||||||||||||||||||||||||||||||||||||||||||||||||||||||||
| Loan 30 | Office | 1/15/2019 | Santa Barbara, CA | 25,960 | 26,236 | Floating | 3.2% | 5.7% | 2/9/2024 | 80% | 3/3/3 | |||||||||||||||||||||||||||||||||||||||||||||||||||||||||||||||||||||||||||
| Loan 31 | Office | 9/16/2019 | San Francisco, CA | 22,667 | 22,841 | Floating | 3.4% | 6.1% | 10/9/2024 | 72% | 3/3/3 | |||||||||||||||||||||||||||||||||||||||||||||||||||||||||||||||||||||||||||
| Loan 32 | Multifamily | 12/21/2018 | Phoenix, AZ | 22,049 | 22,081 | Floating | 2.9% | 5.2% | 1/9/2023 | 73% | 4/4/3 | |||||||||||||||||||||||||||||||||||||||||||||||||||||||||||||||||||||||||||
| Loan 33 | Office | 8/27/2019 | San Francisco, CA | 20,325 | 20,507 | Floating | 2.8% | 5.6% | 9/9/2024 | 73% | 3/3/3 | |||||||||||||||||||||||||||||||||||||||||||||||||||||||||||||||||||||||||||
| Loan 34 | Office | 2/26/2019 | Charlotte, NC | 19,765 | 19,941 | Floating | 3.4% | 6.0% | 3/9/2024 | 56% | 3/3/3 | |||||||||||||||||||||||||||||||||||||||||||||||||||||||||||||||||||||||||||
| Loan 35 | Multifamily | 2/8/2019 | Las Vegas, NV | 13,177 | 13,302 | Floating | 3.2% | 5.9% | 2/9/2024 | 71% | 4/4/3 | |||||||||||||||||||||||||||||||||||||||||||||||||||||||||||||||||||||||||||
| Total/Weighted average senior loans | $ | 2,136,279 | $ | 2,204,075 | 5.8% | 3/17/2024 | 70% | 3.8/3.7/3.1 | ||||||||||||||||||||||||||||||||||||||||||||||||||||||||||||||||||||||||||||||
| Mezzanine loans | ||||||||||||||||||||||||||||||||||||||||||||||||||||||||||||||||||||||||||||||||||||||
Loan 36(6)(7) | Other (Mixed-use) | 7/14/2017 | Los Angeles, CA | $ | 83,821 | $ | 162,826 | n/a(7) | n/a(7) | n/a(7) | 7/9/2022 | n/a | 5/5/4 | |||||||||||||||||||||||||||||||||||||||||||||||||||||||||||||||||||||||||
Loan 37(6) | Multifamily | 12/26/2018 | Santa Clarita, CA | 51,713 | 54,874 | Fixed | 7.0% | 13.8% | 12/26/2024 | 56% – 84% | 4/4/3 | |||||||||||||||||||||||||||||||||||||||||||||||||||||||||||||||||||||||||||
| Loan 38 | Hotel | 9/23/2019 | Berkeley, CA | 27,712 | 28,773 | Fixed | 9.0% | 11.5% | 7/9/2025 | 66% – 81% | 4/4/3 | |||||||||||||||||||||||||||||||||||||||||||||||||||||||||||||||||||||||||||
| Loan 39 | Multifamily | 7/11/2019 | Placentia, CA | 25,219 | 26,551 | Fixed | 8.0% | 13.3% | 7/11/2024 | 51% – 84% | 4/4/3 | |||||||||||||||||||||||||||||||||||||||||||||||||||||||||||||||||||||||||||
Loan 40(7) | Multifamily | 12/3/2019 | Milpitas, CA | 20,061 | 20,663 | Fixed | 8.00% | 13.3% | 12/3/2024 | 49% – 71% | 4/4/3 | |||||||||||||||||||||||||||||||||||||||||||||||||||||||||||||||||||||||||||
| Loan 41 | Hotel | 1/9/2017 | New York, NY | 11,182 | 12,000 | Floating | 11.0% | 11.8% | 1/9/2022 | 63% – 76% | 4/4/3 | |||||||||||||||||||||||||||||||||||||||||||||||||||||||||||||||||||||||||||
Loan 42(6) | Office | 7/20/2018 | Dublin, Ireland | 8,151 | 7,812 | Fixed | —% | 12.5% | 12/20/2021 | 45% – 68% | 4/4/2 | |||||||||||||||||||||||||||||||||||||||||||||||||||||||||||||||||||||||||||
| Loan 43 | Multifamily | 7/30/2014 | Various - TX | 4,183 | 4,529 | Fixed | 9.5% | 9.5% | 8/11/2024 | 71% – 83% | 4/4/3 | |||||||||||||||||||||||||||||||||||||||||||||||||||||||||||||||||||||||||||
Loan 44(7) | Other (Mixed-use) | 3/19/2013 | San Rafael, CA | 2,295 | 3,765 | n/a(7) | n/a(7) | n/a(7) | 9/30/2020 | 32% – 86% | 5/4/4 | |||||||||||||||||||||||||||||||||||||||||||||||||||||||||||||||||||||||||||
| Total/Weighted average mezzanine loans | $ | 234,337 | $ | 321,793 | 8.1% | 10/26/2023 | 54% - 77% | 4.4/4.4/3.3 | ||||||||||||||||||||||||||||||||||||||||||||||||||||||||||||||||||||||||||||||
80
| Collateral type | Origination Date | City, State | Carrying value(1) | Principal balance | Coupon type | Cash Coupon(2) | Unlevered all-in yield(3) | Extended maturity date | Loan-to-value(4) | Q2/Q1/Q4 Risk ranking(5) | ||||||||||||||||||||||||||||||||||||||||||||||||||||||||||||||||||||||||||||
| Preferred equity & other loans | ||||||||||||||||||||||||||||||||||||||||||||||||||||||||||||||||||||||||||||||||||||||
| Loan 45 | Office | 5/8/2018 | Various - N.Y. | $ | 79,850 | $ | 100,689 | Fixed | 7.0% | 12.0% | 6/5/2027 | n/a | 5/4/4 | |||||||||||||||||||||||||||||||||||||||||||||||||||||||||||||||||||||||||
Loan 46(7) | Other (Mixed-use) | 7/14/2017 | Los Angeles, CA | 17,869 | 27,005 | n/a(7) | n/a(7) | n/a(7) | 7/9/2022 | n/a | 5/5/4 | |||||||||||||||||||||||||||||||||||||||||||||||||||||||||||||||||||||||||||
Loan 47(6) | Industrial | 9/1/2016 | Various - U.S. | 16,200 | — | n/a | n/a | n/a | 9/2/2027 | n/a | 4/4/3 | |||||||||||||||||||||||||||||||||||||||||||||||||||||||||||||||||||||||||||
Loan 48(6)(8) | Office | 8/22/2018 | Las Vegas, NV | 15,660 | 18,026 | Fixed | 8.0% | 15.5% | 9/9/2023 | n/a | 4/4/3 | |||||||||||||||||||||||||||||||||||||||||||||||||||||||||||||||||||||||||||
| Loan 49 | Other | 6/28/2019 | Various - U.S. | 12,120 | 13,898 | Fixed | 10.0% | 15.3% | 5/28/2024 | n/a | 4/4/3 | |||||||||||||||||||||||||||||||||||||||||||||||||||||||||||||||||||||||||||
| Loan 50 | Office | 7/20/2018 | Dublin, Ireland | 813 | — | n/a | n/a | n/a | 12/20/2021 | n/a | 4/4/2 | |||||||||||||||||||||||||||||||||||||||||||||||||||||||||||||||||||||||||||
Loan 51(8) | Hotel | 10/24/2014 | Austin, TX | 3 | — | n/a | n/a | n/a | n/a | n/a | n/a | |||||||||||||||||||||||||||||||||||||||||||||||||||||||||||||||||||||||||||
Total/Weighted average preferred equity & other loans(9) | $ | 142,515 | $ | 159,618 | 9.7% | 2/19/2026 | n/a | 4.7/4.1/3.4 | ||||||||||||||||||||||||||||||||||||||||||||||||||||||||||||||||||||||||||||||
| Total/Weighted average senior and mezzanine loans and preferred equity - Core Portfolio | $ | 2,513,131 | $ | 2,685,486 | 6.3% | 4/12/2024 | n/a | 3.9/3.8/3.1 | ||||||||||||||||||||||||||||||||||||||||||||||||||||||||||||||||||||||||||||||
(1)Represents carrying values at our share as of June 30, 2020.
(2)Represents the stated coupon rate for loans; for floating rate loans, does not include USD 1-month London Interbank Offered Rate (“LIBOR”) which was 0.16% as of June 30, 2020.
(3)In addition to the stated cash coupon rate, unlevered all-in yield includes non-cash payment in-kind interest income and the accrual of origination, extension and exit fees. Unlevered all-in yield for the loan portfolio assumes the applicable floating benchmark rate as of June 30, 2020 for weighted average calculations.
(4)Except for construction loans, senior loans reflect the initial loan amount divided by the as-is value as of the date the loan was originated, or the principal amount divided by the appraised value as of the date of the most recent as-is appraisal. Mezzanine loans include attachment loan-to-value and detachment loan-to-value, respectively. Attachment loan-to-value reflects initial funding of loans senior to our position divided by the as-is value as of the date the loan was originated, or the principal amount divided by the appraised value as of the date of the most recent appraisal. Detachment loan-to-value reflects the cumulative initial funding of our loan and the loans senior to our position divided by the as-is value as of the date the loan was originated, or the cumulative principal amount divided by the appraised value as of the date of the most recent appraisal.
(5)On a quarterly basis, the Company’s senior and mezzanine loans and preferred equity are rated “1” through “5,” from less risk to greater risk. Represents risk ranking as of June 30, 2020, March 31, 2020 and December 31, 2019 (our last pre-COVID-19 risk ranking), respectively.
(6)Construction senior loans’ loan-to-value reflect the total commitment amount of the loan divided by the as completed appraised value, or the total commitment amount of the loan divided by the projected total cost basis. Construction mezzanine loans include attachment loan-to-value and detachment loan-to-value, respectively. Attachment loan-to-value reflects the total commitment amount of loans senior to our position divided by as-completed appraised value, or the total commitment amount of loans senior to our position divided by projected total cost basis. Detachment loan-to-value reflect the cumulative commitment amount of our loan and the loans senior to our position divided by as-completed appraised value, or the cumulative commitment amount of our loan and loans senior to our position divided by projected total cost basis.
(7)Loans 28, 36, 44 and 46 are on nonaccrual status as of June 30, 2020; as such, no income is being recognized.
(8)Represents equity participation interests related to senior loans, mezzanine loans and/or preferred equity investments.
(9)Weighted average calculation for preferred equity and other loans excludes equity participation interests.
81
The following table details the types of properties securing our loan portfolio senior and mezzanine loans and preferred equity included in our Core Portfolioand geographic distribution as of June 30, 20192020 (dollars in thousands):
| Book value (at CLNC share) | |||||||||||||||||||||||||||||||||||||||||||||||||||||||||
| Collateral property type | Book value | % of total | Collateral property type | Count | Senior mortgage loans | Mezzanine loans and preferred equity (1) | Total | % of Total | |||||||||||||||||||||||||||||||||||||||||||||||||
| Office | $ | 964,079 | 31.6 | % | Office | 19 | $ | 764,039 | $ | 104,474 | $ | 868,513 | 34.7 | % | |||||||||||||||||||||||||||||||||||||||||||
| Multifamily | 751,776 | 24.5 | % | Multifamily | 16 | 658,969 | 101,184 | 760,153 | 30.2 | % | |||||||||||||||||||||||||||||||||||||||||||||||
| Industrial | 142,381 | 4.6 | % | Industrial | 2 | 114,950 | 16,200 | 131,150 | 5.2 | % | |||||||||||||||||||||||||||||||||||||||||||||||
| Hotel | 747,631 | 24.4 | % | Hotel | 8 | 492,168 | 38,902 | 531,070 | 21.1 | % | |||||||||||||||||||||||||||||||||||||||||||||||
| Retail | 221,864 | 7.2 | % | ||||||||||||||||||||||||||||||||||||||||||||||||||||||
Other(1) | 235,862 | 7.7 | % | ||||||||||||||||||||||||||||||||||||||||||||||||||||||
Other(2) | Other(2) | 6 | 106,153 | 116,092 | 222,245 | 8.8 | % | ||||||||||||||||||||||||||||||||||||||||||||||||||
| Total | $ | 3,063,593 | 100.0 | % | Total | 51 | $ | 2,136,279 | $ | 376,852 | $ | 2,513,131 | 100.0 | % | |||||||||||||||||||||||||||||||||||||||||||
| Book value (at CLNC share) | |||||||||||||||||||||||||||||||||||||||||||||||||||||||||
| Region | Book value | % of total | Region | Count | Senior mortgage loans | Mezzanine loans and preferred equity (1) | Total | % of Total | |||||||||||||||||||||||||||||||||||||||||||||||||
| West | $ | 1,646,392 | 53.8 | % | |||||||||||||||||||||||||||||||||||||||||||||||||||||
| Northeast | 559,080 | 18.2 | % | ||||||||||||||||||||||||||||||||||||||||||||||||||||||
| Southwest | 329,807 | 10.8 | % | ||||||||||||||||||||||||||||||||||||||||||||||||||||||
| Southeast | 219,280 | 7.2 | % | ||||||||||||||||||||||||||||||||||||||||||||||||||||||
| Midwest | 90,186 | 2.9 | % | ||||||||||||||||||||||||||||||||||||||||||||||||||||||
| US West | US West | 26 | $ | 1,255,974 | $ | 249,100 | $ | 1,505,074 | 59.9 | % | |||||||||||||||||||||||||||||||||||||||||||||||
| US Northeast | US Northeast | 9 | 504,607 | 91,635 | 596,242 | 23.7 | % | ||||||||||||||||||||||||||||||||||||||||||||||||||
| US Southwest | US Southwest | 8 | 256,690 | 5,789 | 262,479 | 10.4 | % | ||||||||||||||||||||||||||||||||||||||||||||||||||
| US Southeast | US Southeast | 2 | 53,082 | 4,033 | 57,115 | 2.3 | % | ||||||||||||||||||||||||||||||||||||||||||||||||||
| US Midwest | US Midwest | 1 | 27,500 | 5,215 | 32,715 | 1.3 | % | ||||||||||||||||||||||||||||||||||||||||||||||||||
| Europe | 206,022 | 6.7 | % | Europe | 3 | 38,426 | 8,964 | 47,390 | 1.9 | % | |||||||||||||||||||||||||||||||||||||||||||||||
Other(2) | 12,826 | 0.4 | % | ||||||||||||||||||||||||||||||||||||||||||||||||||||||
US Other(3) | US Other(3) | 2 | — | 12,116 | 12,116 | 0.5 | % | ||||||||||||||||||||||||||||||||||||||||||||||||||
| Total | $ | 3,063,593 | 100.0 | % | Total | 51 | $ | 2,136,279 | $ | 376,852 | $ | 2,513,131 | 100.0 | % | |||||||||||||||||||||||||||||||||||||||||||
The following charts illustrate the diversification of our loan portfoliosenior and mezzanine loans and preferred equity included in our Core Portfolio based on interest rate category, property type, and geography as of June 30, 20192020 (percentages based on book value at our share, which represents the proportionate book value based on our ownership by asset):
| Interest Rate Category | Property Type | |||||||
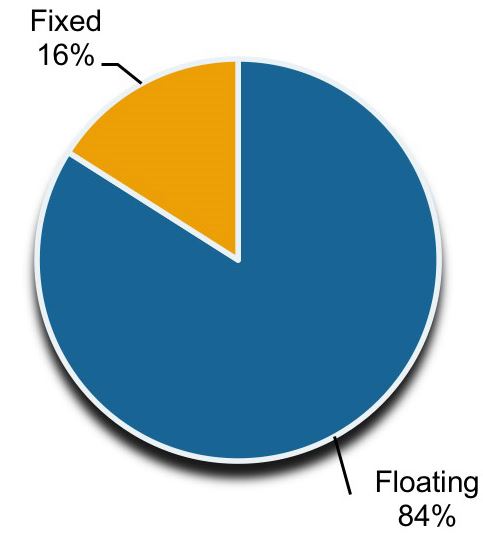 | 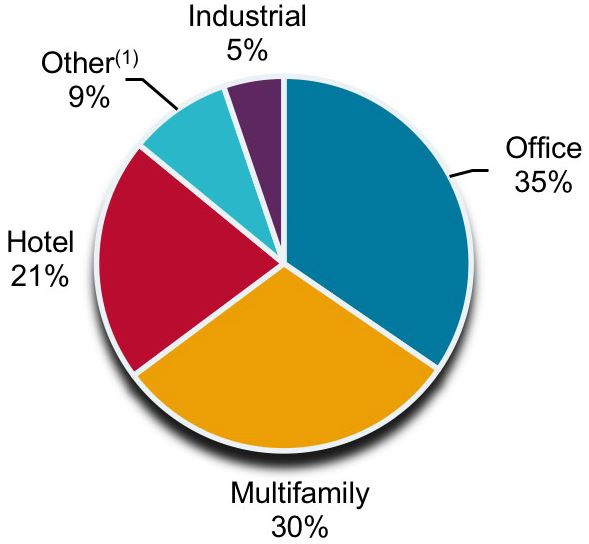 | |||||||
82
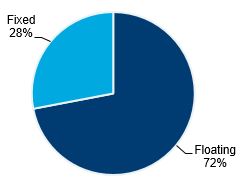 | 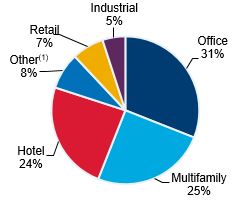 | |||
 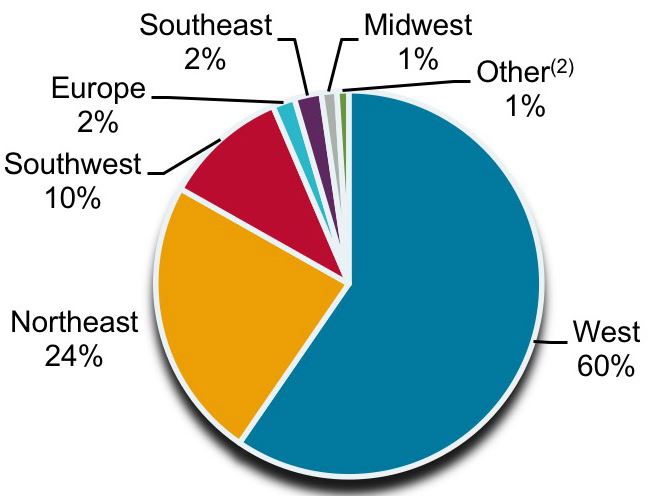 |
(1)Other includes commercial and residential development and predevelopment assets, one corporate term loan |
(2)Other contains one corporate term loan secured by the borrower’s limited partnership interests in a fund and a preferred equity investment in a loan origination platform.
COVID-19 Update
For the three months ended June 30, 2020, we collected 99.0% of our loan interest payments, excluding payment-in-kind loans, and one hospitality loan (“Midwest Hospitality”) was delinquent. Most of our borrowers paid on time utilizing cash from operations, while some utilized interest and other reserves.
For July 2020, we collected 99.0% of our loan interest payments, excluding payment-in-kind loans, and Midwest Hospitality was delinquent. Most of our borrowers paid on time utilizing cash from operations, while some utilized interest and other reserves. Additionally, some loans required partial modification of their existing reserves to provide their loan interest payment. On July 30, 2020 the hotel property securing Midwest Hospitality was sold and we received $24.5 million in gross proceeds.
We expect some borrowers may continue to experience difficulties making their loan payments over the next several quarters. We are particularly concerned with and focused on loans collateralized by hotels as well as mezzanine loans and preferred equity investments that are subordinate to senior loans provided by other lenders such as our Los Angeles Construction Loan and Preferred Equity Investment discussed below. Failure of our borrowers to meet their loan obligations will not only impact our financial results but may also trigger repayments under our bank credit and master repurchase facilities. Our asset management team is having discussions with borrowers to remain informed on a reasonably current basis, seek to identify issues and address potential value preserving solutions, which may include a loan modification.
For the three and six months ended March 31, 2020 and June 30, 2020, we had three loans and four loans on on-accrual status, respectively. During these same collateral. We believe ultimateperiods, we received cash interest payments from these loans of $4.0 million and $7.0 million, respectively, and applied the cash interest collected as a reduction to the loan’s carrying value.
At June 30, 2020 our current expected credit loss reserve (“CECL”) calculated by our probability of default (“PD”)/loss given default (“LGD”) model for our outstanding loans and future loan funding commitments is $31.3 million, or $0.25 per share, which is 1.3% of the aggregate commitment amount of our loan portfolio. This represents a $20.6 million decrease from $52.2 million for the three months ended March 31, 2020. Removing the above referenced West Hospitality loan and Northeast Office portfolio loan from the CECL model and recording specific provisions for loan losses are the primary drivers of this decrease slightly offset by additional reserves taken on our hospitality loans.
During the second quarter, we also sold a preferred equity investment which included 35% of the preferred equity’s kicker feature for a total gross sales price and liquidity of $98.6 million while recognizing a net loss on the sale of $10.1 million. Refer to “COVID-19 Impact on Liquidity” in “Liquidity and Capital Resources” below for further discussion regarding the underlying collateralCOVID-19 pandemic and repaymentits impact on our future operating results, liquidity and financial condition.
Additionally, subsequent to June 30, 2020 the following three loans were resolved:
•The hotel property securing Midwest Hospitality was sold and we received $24.5 million in gross proceeds and concurrently provided a bridge loan in the amount of $19.5 million to a new borrower secured by Midwest Hospitality. For the three months ended March 31, 2020, we recorded a specific provision for loan loss of $2.3 million on our
83
Midwest Hospitality loan secured by a hotel in Bloomington, MN, with an unpaid principal balance of $29.8 million. This loan was placed on nonaccrual status during 2019 and is the only loan in our Core Portfolio that was delinquent.
•We received gross proceeds of $80.7 million in a discounted payoff of one loan secured by six suburban office buildings (“Northeast Office Portfolio”) which was equal to the carrying value of the loans from the sales proceeds is the most likely outcome. During 2018, we recorded $53.8 millionloan, net of current provision for loan losses. As such, no additional provision for loan losses were required at June 30, 2020. A $20.9 million allowance for loan losses was recorded as of March 31, 2020, which included an $8.8 million allowance for loan losses resulting from CECL adoption and an additional $12.1 million provision for loan losses recognition during the three months ended March 31, 2020.
•We received $105.2 million in gross proceeds resulting from a sale of our loan secured by a hospitality asset in San Diego, California (“West Hospitality”) and concurrently repaid $56.8 million on the four NY hospitality loansour master repurchase facility. We classified this loan as held for sale and recognized a net loss of $32.8 million to reflect the estimated valueexpected proceeds to be recoveredcollected in a sale of the loan during the three months ended June 30, 2020. We had recorded a $5.2 million allowance for loan losses as of March 31, 2020, which included a $2.6 million allowance for loan losses resulting from CECL adoption and an additional $2.6 million provision for loan losses recognized for West Hospitality during the three months ended March 31, 2020. In connection with transferring the loan to held for sale during the current quarter, we reversed out the $5.2 million from provision for loan losses line item and recorded a $38.0 million in other loss, net.
Los Angeles Construction Loan and Preferred Equity Investment
We hold a $189.0 million commitment in a mezzanine loan and preferred equity investment in a development project in Los Angeles County which includes a hospitality and retail renovation and a new condominium tower construction (the “Mixed-use Project”).
Our investment interests are held through a joint venture (the “Mezzanine Lender”) with affiliates of our Manager. The Mezzanine Lender maintains total commitments to the mezzanine loan and preferred equity investment of approximately $574 million of which our commitment is $189.0 million.
In April 2020, the senior mortgage lender notified the borrower followingdeveloper that the Mixed-use Project loan funding was out of balance, due to cost overruns from certain hard and soft costs and senior loan interest reserve shortfalls projected through completion. As a sale. result, during the second quarter, the Mezzanine Lender made two protective advances to the senior mortgage lender totaling $67.6 million, of which our share was $28.5 million. The Mezzanine Lender has a remaining unfunded commitment of $39.3 million, of which our share is $14.5 million. The Mezzanine Lender has placed this investment on nonaccrual status.
In June 2020, the senior mortgage lender sought a third protective advance of $15.5 million of which our share would have been approximately $7.0 million. While the Mezzanine Lender did not fund its ratable share, the senior mortgage lender funded the full amount of the required June advances. The senior mortgage lender’s funding did not absolve the Mezzanine Lender from its commitment to fund. Additionally, the loans under the senior mortgage lender and Mezzanine Lender, respectively, matured on July 9, 2020. All parties have reserved rights as the borrower, the senior mortgage lender, the EB-5 lender and the Mezzanine Lender continue discussions regarding future funding requirements and extending completion milestones and maturity dates toward an orderly resolution of the Mixed-use Project. The senior mortgage lender and Mezzanine Lender continues to consider options that include sourcing additional capital commitments from outside investors.
It is anticipated that additional cost overruns may be further compounded by the impact of COVID-19, due to actual and potential construction delays or other factors. Furthermore, once stages of the project are completed, diminished hotel and conference facility demand and slower pace of condominium sales could result in greater negative carry costs than currently projected and thereby impact the overall value of the Mixed-use Project. As such, the Mixed-use Project may require significant additional capital to reach completion.
We also believe it is possible that all or a part of the Mezzanine Lender’s interest is sold, and/or that additional commitments, if any, are obtained at a greater cost of capital and/or senior to the Mezzanine Lender’s investment interest. Consequently, the current maturity default, and the liquidity shortfall combined with uncertain market conditions as a result of COVID-19, are negatively impacting the Mezzanine Lender’s investment interest. As such, during the three months ended June 30, 2020, we placed the mezzanine loans and preferred equity investment on nonaccrual status, and recorded our proportionate share of a fair value loss adjustment totaling $89.3 million. (See Loans 36 and 46 in the table above).
If additional funding sources are not available and/or the borrower is unable to fund current and future deficiencies, the Mezzanine Lender must consider funding ongoing shortfalls. If the Mezzanine Lender determines it is unable or unwilling to fund beyond its remaining commitment and/or fails to reach agreement on extensions of completion milestones and the
84
maturity date, it could result in a default acceleration under the senior mortgage loan and a foreclosure on all interests subordinate to the senior mortgage loan, including our mezzanine loan and preferred equity investment.
Dublin, Ireland Senior Predevelopment Loan
We hold a $171.5 million co-lender interest (61%) in a senior mortgage loan in the amount of $266.5 million. The senior mortgage loan is also held by private investment vehicles managed by Colony Capital. The senior mortgage is Euro denominated and is for a fully entitled land acquisition for a mixed-use development project in Dublin, Ireland (Project Dockland).
As a result of delays in the Irish government zoning authorities providing updated guidelines and a framework for waterfront development, the borrower had to pause the submission of its final development application. However, the planning application has been submitted to planning authorities and is under consideration by such authorities. Consequently, the Project Dockland schedule has been extended by approximately six to nine months, but the majority of enabling works is expected to start at the end of July 2020. This delay may hinder the ability of the borrower to obtain a senior secured development construction facility within the expected timeline pursuant to the business plan. COVID-19 may also negatively impact future demands for office and residential space as well as lengthen the time needed to process planning applications. We and our senior mortgage co-lenders are in discussions with the borrower to address these uncertainties.
Accordingly, project delays combined with uncertain market conditions as a result of COVID-19, may have a negative impact on the senior lender’s investment interest and may result in a future valuation impairment or investment loss. (See Loan 3 in the table).
In June 2020, we completed an asset level preferred financing on five assets which included Project Dockland.
Refer to “COVID-19 Impact on Liquidity” in “Liquidity and Capital Resources” below for further discussion regarding the COVID-19 pandemic and its impact on our future operating results, liquidity and financial condition.
Other Impairment of Loans and Preferred Equity Held in Joint Ventures
During the three months ended June 30, 2019,2020, we revisedrecognized our estimated recovery and recorded an additional $104.3proportionate share of a fair value loss adjustment totaling $7.0 million of provision forreducing the carrying to $10.8 million from $17.8 million on one mezzanine loan loss. The additional provision is based on significant deterioration in the NY hospitality market and feedback from the sales process and reflects the estimated value to be recovered from the borrower following a potential sale.
Payment-In-Kind (“PIK”) Interest Income
We have debt investments in our portfolio that contain a PIK provision. Contractual PIK interest, which represents contractually deferred interest added to the loan balance that is due at the end of the collateral.loan term, is generally recorded on an accrual basis to the extent such amounts are expected to be collected. During the three and six months ended June 30, 2019, we recognized an additional $3.9 millionprovision for loan loss to reflect the estimated fair value of the collateral. The additional provision is based on current and prospective leasing activity. We have been and are continuing to sweep all cash.
CRE Debt Securities
The following table presents an overview of our CRE debt securities portfolioin our Core Portfolio as of June 30, 20192020 (dollars in thousands):
Weighted Average(1) | ||||||||||||||||||||||||||||||||||||||||||||||||||||||||
CRE Debt Securities by ratings category(2) | Number of Securities | Book value | Cash coupon | Unlevered all-in yield | Remaining term | Ratings | ||||||||||||||||||||||||||||||||||||||||||||||||||
| Investment grade rated (BBB) | 14 | $ | 51,524 | — | % | — | % | 5.8 | BBB- | |||||||||||||||||||||||||||||||||||||||||||||||
| Non-investment grade rated (BB) | 2 | 8,486 | — | % | — | % | 5.1 | BB | B | ||||||||||||||||||||||||||||||||||||||||||||||||
| “B-pieces” of CMBS securitization pools | 8 | 81,628 | 4.6 | % | 10.3 | % | 5.5 | — | ||||||||||||||||||||||||||||||||||||||||||||||||
| Total/Weighted Average | 24 | $ | 141,638 | 2.8 | % | 5.9 | % | 5.6 | — | |||||||||||||||||||||||||||||||||||||||||||||||
(1)Weighted average metrics weighted by book value, except for cash coupon which is weighted by principal balance.
(2)As of June 30, 2020, all CRE debt securities consisted of CMBS.
During the three months ended June 30, 2020, we sold 27 CMBS bonds for total gross sales price of $89.7 million and recognized a loss of $57.0 million of which $36.4 million was previously recorded as an unrealized loss in other comprehensive income at March 31, 2020. In connection with these sales, we repaid $66.1 million of debt on our CMBS Credit Facility (as
85
Weighted Average(1) | ||||||||||||||||||
CRE Debt Securities by ratings category(2) | Number of Securities | Book value | Cash coupon | Unlevered all-in yield | Remaining term | Ratings | ||||||||||||
| Investment grade rated | 39 | $ | 222,190 | 3.2 | % | 6.3 | % | 7.1 | BBB- | |||||||||
| Non-investment grade rated | 4 | 26,910 | 3.3 | % | 11.9 | % | 5.7 | BB / B | ||||||||||
| “B-pieces” of CMBS securitization pools | 10 | 149,667 | 4.5 | % | 7.4 | % | 4.8 | — | ||||||||||
| Total/Weighted Average | 53 | $ | 398,767 | 3.8 | % | 7.1 | % | 6.1 | — | |||||||||
We expect continued challenges to CRE debt security values, with further losses resulting from delinquencies and potential defaults in underlying loans with respect to loans secured by hotel and retail properties. Further losses not only impact our financial results but may also trigger further repayments under our CMBS credit facilities.
Refer to “COVID-19 Impact on Liquidity” in “Liquidity and Capital Resources” below for further discussion regarding the COVID-19 pandemic and its impact on our future operating results, liquidity and financial condition.
Net Leased Real Estate
Our operatingnet leased real estate investment strategy focuses on direct ownership in commercial real estate with an emphasis on properties with stable cash flow, which may be structurally senior to a third-party partner’s equity. In addition, we may own operatingnet leased real estate investments through joint ventures with one or more partners. As part of our net leased real estate properties strategy, we explore a variety of real estate investments including multi-tenant office, multifamily, student housing and industrial. These properties are typically well-located with strong operating partners and we believe offer both attractive cash flow and returns.
As of June 30, 2019, $2.22020, $1.0 billion, or 25.1%,27.4% of our assets were invested in net leased real estate properties included in our Core Portfolio and our portfolio was 90.8%these properties were 97.5% occupied. The following table presents our net leased real estate property investments included in our Core Portfolio as of June 30, 20192020 (dollars in thousands):
| Property Type | Book value | NCI | Book value at our share(1) | % of total | Number of Properties | Number of Buildings | Total Square Feet | Units | Weighted average % leased | Weighted average lease term(2) | Total annualized base rent(3) | ||||||||||||||||||||||||||
| Net lease | |||||||||||||||||||||||||||||||||||||
| Industrial | $ | 763,753 | $ | 34,446 | $ | 729,307 | 35.7 | % | 47 | 47 | 11,577,199 | — | 97 | % | 9.8 | $ | 48,268 | ||||||||||||||||||||
| Office | 464,419 | — | 464,419 | 22.7 | % | 5 | 30 | 2,132,616 | — | 96 | % | 9.3 | 26,612 | ||||||||||||||||||||||||
| Retail | 61,929 | — | 61,929 | 3.0 | % | 10 | 10 | 467,971 | — | 100 | % | 5.0 | 5,398 | ||||||||||||||||||||||||
| Total net lease | 1,290,101 | 34,446 | 1,255,655 | 61.4 | % | 62 | 87 | 14,177,786 | — | 97 | % | 9.4 | 80,278 | ||||||||||||||||||||||||
| Other | |||||||||||||||||||||||||||||||||||||
| Office | 475,783 | 49,245 | 426,538 | 20.9 | % | 35 | 44 | 4,070,843 | n/a | 84 | % | 3.5 | 52,189 | ||||||||||||||||||||||||
| Multifamily | 257,552 | 58,844 | 198,708 | 9.7 | % | 8 | 113 | n/a | 4,250 | 90 | % | n/a | 24,734 | ||||||||||||||||||||||||
| Retail | 50,625 | 1,787 | 48,838 | 2.4 | % | 6 | 8 | 1,285,391 | n/a | 71 | % | 2.8 | 9,248 | ||||||||||||||||||||||||
| Hotel | 115,477 | 272 | 115,205 | 5.6 | % | 3 | 3 | n/a | n/a | n/a | n/a | n/a | |||||||||||||||||||||||||
| Total other | 899,437 | 110,148 | 789,289 | 38.6 | % | 52 | 168 | 5,356,234 | 4,250 | 85 | % | 3.4 | 86,171 | ||||||||||||||||||||||||
| Total | $ | 2,189,538 | $ | 144,594 | $ | 2,044,944 | 100.0 | % | 114 | 255 | 19,534,020 | 4,250 | 93 | % | 7.7 | $ | 166,449 | ||||||||||||||||||||
| Count | Carrying Value(1) | NOI/EBITDA for the three months ended June 30, 2020(2) | ||||||||||||||||||
| Net leased real estate | 6 | $ | 1,002,622 | $ | 18,184 | |||||||||||||||
| Total/Weighted average net leased real estate - Core Portfolio | 6 | $ | 1,002,622 | $ | 18,184 | |||||||||||||||
(2)Net operating income is defined as property operating income excluding above/below market lease amortization less property operating expense. EBITDA is defined as net property operating income excluding interest, tax expense, depreciation and amortization. Please refer to “Non-GAAP Supplemental Financial Measures” for further information on NOI/EBITDA.
The following table provides asset-level detail of our net leased real estate included in our Core Portfolio as of June 30, 2020:
| Collateral type | City, State | Number of Properties | Number of Buildings | Rentable square feet (“RSF”) / units/keys | Weighted average % leased(1) | Weighted average lease term (yrs)(2) | ||||||||||||||||||||||||||||||||||||||||||||||||||
| Net leased real estate | ||||||||||||||||||||||||||||||||||||||||||||||||||||||||
| Net lease 1 | Industrial | Various - U.S. | 22 | 22 | 6,697,304 RSF | 88% | 4.4 | |||||||||||||||||||||||||||||||||||||||||||||||||
| Net lease 2 | Office | Stavenger, Norway | 1 | 26 | 1,290,926 RSF | 100% | 10.2 | |||||||||||||||||||||||||||||||||||||||||||||||||
| Net lease 3 | Industrial | Various - U.S. | 2 | 2 | 2,197,360 RSF | 100% | 18.0 | |||||||||||||||||||||||||||||||||||||||||||||||||
| Net lease 4 | Industrial | Various - OH | 23 | 23 | 1,834,422 RSF | 99% | 3.3 | |||||||||||||||||||||||||||||||||||||||||||||||||
| Net lease 5 | Office | Aurora, CO | 1 | 1 | 183,529 RSF | 100% | 2.4 | |||||||||||||||||||||||||||||||||||||||||||||||||
| Net lease 6 | Office | Indianapolis, IN | 1 | 1 | 338,000 RSF | 100% | 5.5 | |||||||||||||||||||||||||||||||||||||||||||||||||
| Total/Weighted average net leased real estate | 50 | 75 | 12,541,541 RSF | 96% | 8.8 | |||||||||||||||||||||||||||||||||||||||||||||||||||
(1)Represents the percent leased as of June 30, 2020. Weighted average calculation based on carrying value at our share as of June 30, 2020.
(2)Based on in-place leases (defined as occupied and paying leases) as of June 30, 2020 and assumes that no renewal options are exercised. Weighted average calculation based on carrying value at our share as of June 30, 2020.
86
The following charts illustrate the concentration of our net leaseleased real estate portfolio included in Core Portfolio based on property type and geography as of June 30, 20192020 (percentages based on book value at our share, which represents the proportionate book value based on our ownership by asset):
| Property Type | Geography | |||||||
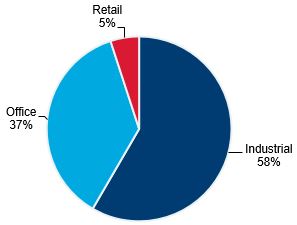 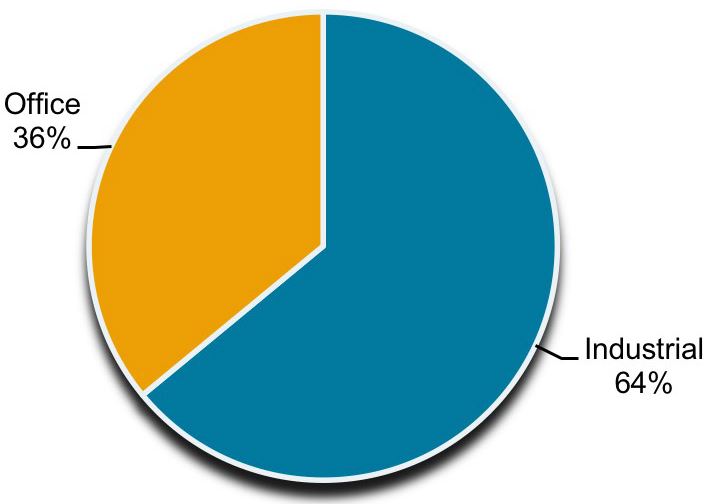 | 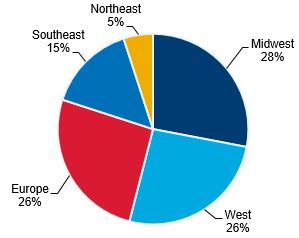 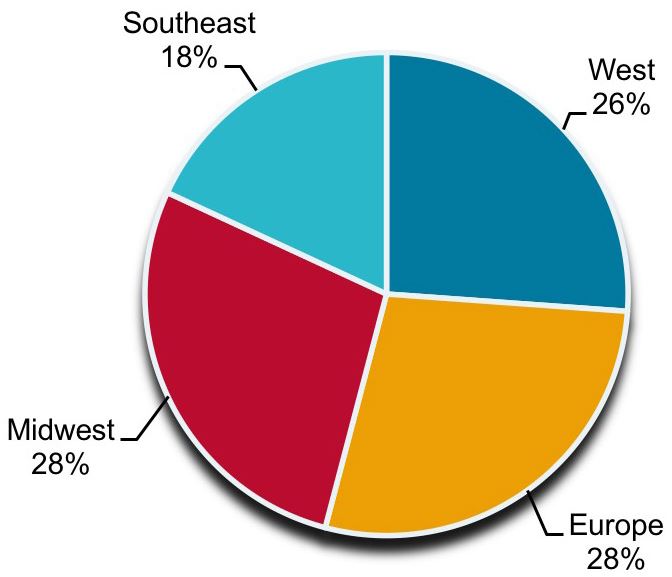 | |||||||
COVID-19 Update
For the quarter ended June 30, 2020 and July 2020, we collected 97% of total rents from our net leased real estate portfolio, with unpaid rents of approximately $0.4 million. We believe these properties will continue to perform but caution that COVID-19 events could still result in lease modifications, impairment and the inability to make our mortgage payments, all which could result in defaults under our mortgage obligations or trigger repayments under our Bank Credit Facility.
For the quarter ended June 30, 2020 and through August 6, 2020, we agreed to sell two industrial portfolios (Net Lease 1 and 4) and expect to receive total gross proceeds of $466.4 million. Net of repayments to existing mortgages and paydowns under our Bank Credit Facility, we expect that these sales will generate $90.6 million of available balance sheet cash liquidity. Both portfolios are classified and held for sale at June 30, 2020 and expected to close prior to year end.
During March 2020 we unwound our NOK FX Future contracts related to Net Lease 2 (Stavenger, Norway). Subsequent to June 30, 2020, we have purchased one year put options of NOK for the notional amount of $92 million and a cost of $1.9 million.
Refer to “COVID-19 Impact on Liquidity” in “Liquidity and Capital Resources” below for further discussion regarding the COVID-19 pandemic and its impact on our future operating results, liquidity and financial condition.
87
Results of Operations - Core Portfolio
The following charts illustratetable summarizes our Core Portfolio results of operations for the diversificationthree months ended June 30, 2020 and 2019 (dollars in thousands):
| Three Months Ended June 30, | Increase (Decrease) | |||||||||||||||||||||||||||||||||||||||||||
| 2020 | 2019 | Amount | % | |||||||||||||||||||||||||||||||||||||||||
| Net interest income | ||||||||||||||||||||||||||||||||||||||||||||
| Interest income | $ | 39,390 | $ | 37,177 | $ | 2,213 | 6.0 | % | ||||||||||||||||||||||||||||||||||||
| Interest expense | (16,116) | (19,186) | 3,070 | (16.0) | % | |||||||||||||||||||||||||||||||||||||||
| Interest income on mortgage loans held in securitization trusts | 20,539 | 38,656 | (18,117) | (46.9) | % | |||||||||||||||||||||||||||||||||||||||
| Interest expense on mortgage obligations issued by securitization trusts | (18,364) | (35,756) | 17,392 | (48.6) | % | |||||||||||||||||||||||||||||||||||||||
| Net interest income | 25,449 | 20,891 | 4,558 | 21.8 | % | |||||||||||||||||||||||||||||||||||||||
| Property and other income | ||||||||||||||||||||||||||||||||||||||||||||
| Property operating income | 23,196 | 29,663 | (6,467) | (21.8) | % | |||||||||||||||||||||||||||||||||||||||
| Other income (loss) | (8,363) | 407 | (8,770) | n.m. | ||||||||||||||||||||||||||||||||||||||||
| Total property and other income | 14,833 | 30,070 | (15,237) | (50.7) | % | |||||||||||||||||||||||||||||||||||||||
| Expenses | ||||||||||||||||||||||||||||||||||||||||||||
| Management fee expense | 6,485 | 9,086 | (2,601) | (28.6) | % | |||||||||||||||||||||||||||||||||||||||
| Property operating expense | 3,275 | 7,901 | (4,626) | (58.5) | % | |||||||||||||||||||||||||||||||||||||||
| Transaction, investment and servicing expense | 1,440 | 317 | 1,123 | n.m. | ||||||||||||||||||||||||||||||||||||||||
| Interest expense on real estate | 8,085 | 8,814 | (729) | (8.3) | % | |||||||||||||||||||||||||||||||||||||||
| Depreciation and amortization | 9,297 | 12,888 | (3,591) | (27.9) | % | |||||||||||||||||||||||||||||||||||||||
| Provision for loan losses | (86) | — | (86) | n.m. | ||||||||||||||||||||||||||||||||||||||||
| Administrative expense | 4,412 | 4,168 | 244 | 5.9 | % | |||||||||||||||||||||||||||||||||||||||
| Total expenses | 32,908 | 43,174 | (10,266) | (23.8) | % | |||||||||||||||||||||||||||||||||||||||
| Other income (loss) | ||||||||||||||||||||||||||||||||||||||||||||
| Unrealized gain (loss) on mortgage loans and obligations held in securitization trusts, net | (8,975) | 5,549 | (14,524) | n.m. | ||||||||||||||||||||||||||||||||||||||||
| Other loss, net | (126,562) | (6,016) | (120,546) | n.m. | ||||||||||||||||||||||||||||||||||||||||
| Income (loss) before equity in earnings of unconsolidated ventures and income taxes | (128,163) | 7,320 | (135,483) | n.m. | ||||||||||||||||||||||||||||||||||||||||
| Equity in earnings (losses) of unconsolidated ventures | (85,328) | 17,917 | (103,245) | n.m | ||||||||||||||||||||||||||||||||||||||||
| Income tax benefit (expense) | (2,101) | (359) | (1,742) | n.m. | ||||||||||||||||||||||||||||||||||||||||
| Net income (loss) | $ | (215,592) | $ | 24,878 | $ | (240,470) | n.m. | |||||||||||||||||||||||||||||||||||||
Comparison of ourCore Portfolio for Three Months Ended June 30, 2020 and 2019
Net Interest Income
Interest income
Interest income increased by $2.2 million to $39.4 million for the three months ended June 30, 2020, as compared to the three months ended June 30, 2019. The increase was primarily due to a $12.7 million increase from originations, acquisitions and refinancings of loans in 2019 and 2020. This was partially offset by a decrease of $5.8 million related to the repayment of loan investments and a decrease of $4.3 million related to sales of and placement of the remaining CRE securities on cost recovery status during the second quarter of 2020.
Interest expense
Interest expense decreased by $3.1 million to $16.1 million for the three months ended June 30, 2020, as compared to the three months ended June 30, 2019. The decrease was primarily due to a $2.6 million decrease resulting from the collapse of a securitization trust and repayment of loan investments and a $0.7 million decrease from lower financing rates and sales of CMBS securities in 2020. This was partially offset by a $0.3 million increase from originations, acquisitions and refinancings of loans in 2019 and 2020.
88
Net interest income on mortgage loans and obligations held in securitization trusts, net
Net interest income on mortgage loans and obligations held in securitization trusts, net decreased by $0.7 million for the three months ended June 30, 2020, as compared to the three months ended June 30, 2019, primarily due to the sale and deconsolidation of a retained investment in the subordinate tranches of one securitization trust in the third quarter of 2019.
Property and other real estate portfolio based on property type and geographyincome
Property operating income
Property operating income decreased by $6.5 million to $23.2 million for the three months ended June 30, 2020, as compared to the three months ended June 30, 2019. The decrease was primarily due to a $7.6 million reduction in operating income due to the sale of a hotel in the fourth quarter of 2019.
Other income
Other income decreased by $8.8 million for the three months ended June 30, 2020, as compared to the three months ended June 30, 2019, primarily due to a reclass of the unwinding of certain NOK FX forward contracts that occurred in the first quarter 2020.
Expenses
Management fee expense
Management fee expense decreased by $2.6 million to $6.5 million for the three months ended June 30, 2020, as compared to the three months ended June 30, 2019. The decrease is due to the reduction in stockholders’ equity (as defined in the Management Agreement) as of June 30, 2020 compared to June 30, 2019. The reduction in stockholders’ equity is primarily due to a fourth quarter 2019 (percentages basedamendment to our definition of core earnings in the Management Agreement.
Property operating expense
Property operating expense decreased by $4.6 million to $3.3 million for the three months ended June 30, 2020, as compared to the three months ended June 30, 2019. The decrease resulted from the sale of a hotel during the fourth quarter of 2019.
Transaction, investment and servicing expense
Transaction, investment and servicing expense increased by $1.1 million to $1.4 million for the three months ended June 30, 2020, as compared to the three months ended June 30, 2019, primarily due to a $0.6 million increase in legal costs for asset-specific activity and a $0.2 million decrease in franchise tax refunds received.
Interest expense on real estate
Interest expense on real estate decreased by $0.7 million to $8.1 million for the three months ended June 30, 2020, as compared to the six months ended June 30, 2019 driven by a decrease in the one month LIBOR rate from June 30, 2019 to June 30, 2020.
Depreciation and amortization
Depreciation and amortization expense decreased by $3.6 million to $9.3 million for the three months ended June 30, 2020, as compared to the three months ended June 30, 2019. This was primarily due to a $2.3 million decrease associated with two properties classified as held for sale and a $0.9 million decrease resulting from the sale of a hotel during the fourth quarter of 2019.
Provision for loan losses
Provision for loan losses decreased by $0.1 million for the three months ended June 30, 2020, as compared to the three months ended June 30, 2019. During the three months ended June 30, 2020, the provision was a result of reversing $5.2 million in CECL reserves on one of our hospitality loans after it was individually evaluated for impairment. This was offset by recording incremental CECL reserves of $5.1 million in the second quarter of 2020.
Administrative expense
Administrative expense increased by $0.2 million to $4.4 million for the three months ended June 30, 2020, as compared to the three months ended June 30, 2019. This increase was primarily due to higher indirect costs reimbursed to our Manager.
89
Other income (loss)
Unrealized gain (loss) on mortgage loans and obligations held in securitization trusts, net
During the three months ended June 30, 2020, we recorded a $9.0 million unrealized loss on mortgage loans and obligations which represents the change in fair value of the assets and liabilities of the securitization trusts consolidated as a result of our investment in the subordinate tranches of these securitization trusts.
Other loss, net
Other loss, net increased by $120.5 million to $126.6 million for the three months ended June 30, 2020, as compared to the three months ended June 30, 2019. The increase was primarily due to $86.2 million realized loss on the sale of 27 CRE securities and the realization of the fair value marks on our remaining CRE securities portfolio in addition to a $38.0 million provision for loan loss recorded on one hospitality loan. This was offset by the reclass of unwinding of certain NOK FX forward contracts that occurred in the first quarter 2020.
Equity in earnings of unconsolidated ventures
Equity in earnings of unconsolidated ventures decreased by $103.2 million for the three months ended June 30, 2020, as compared to the three months ended June 30, 2019. This was primarily due to the Company recording $95.9 million in fair value losses relating to two equity method investments that have been placed on nonaccrual status.
Income tax benefit (expense)
Income tax expense increased by $1.7 million to $2.1 million for the three months ended June 30, 2020, as compared to the three months ended June 30, 2019, primarily due to a $1.6 million increase in the deferred income tax liabilities on one of our equity method investments.
90
Results of Operations - Core Portfolio
The following table summarizes our Core Portfolio results of operations for the six months ended June 30, 2020 and 2019 (dollars in thousands):
| Six Months Ended June 30, | Increase (Decrease) | |||||||||||||||||||||||||||||||||||||||||||
| 2020 | 2019 | Amount | % | |||||||||||||||||||||||||||||||||||||||||
| Net interest income | ||||||||||||||||||||||||||||||||||||||||||||
| Interest income | $ | 83,796 | $ | 70,173 | $ | 13,623 | 19.4 | % | ||||||||||||||||||||||||||||||||||||
| Interest expense | (35,862) | (36,689) | 827 | (2.3) | % | |||||||||||||||||||||||||||||||||||||||
| Interest income on mortgage loans held in securitization trusts | 41,094 | 77,132 | (36,038) | (46.7) | % | |||||||||||||||||||||||||||||||||||||||
| Interest expense on mortgage obligations issued by securitization trusts | (36,423) | (71,391) | 34,968 | (49.0) | % | |||||||||||||||||||||||||||||||||||||||
| Net interest income | 52,605 | 39,225 | 13,380 | 34.1 | % | |||||||||||||||||||||||||||||||||||||||
| Property and other income | ||||||||||||||||||||||||||||||||||||||||||||
| Property operating income | 44,709 | 59,566 | (14,857) | (24.9) | % | |||||||||||||||||||||||||||||||||||||||
| Other income | 757 | 568 | 189 | 33.3 | % | |||||||||||||||||||||||||||||||||||||||
| Total property and other income | 45,466 | 60,134 | (14,668) | (24.4) | % | |||||||||||||||||||||||||||||||||||||||
| Expenses | ||||||||||||||||||||||||||||||||||||||||||||
| Management fee expense | 13,002 | 18,172 | (5,170) | (28.5) | % | |||||||||||||||||||||||||||||||||||||||
| Property operating expense | 6,958 | 16,847 | (9,889) | (58.7) | % | |||||||||||||||||||||||||||||||||||||||
| Transaction, investment and servicing expense | 3,654 | 372 | 3,282 | n.m | ||||||||||||||||||||||||||||||||||||||||
| Interest expense on real estate | 16,546 | 17,384 | (838) | (4.8) | % | |||||||||||||||||||||||||||||||||||||||
| Depreciation and amortization | 20,449 | 25,972 | (5,523) | (21.3) | % | |||||||||||||||||||||||||||||||||||||||
| Provision for loan losses | 31,413 | — | 31,413 | n.m | ||||||||||||||||||||||||||||||||||||||||
| Administrative expense | 8,543 | 7,808 | 735 | 9.4 | % | |||||||||||||||||||||||||||||||||||||||
| Total expenses | 100,565 | 86,555 | 14,010 | n.m | ||||||||||||||||||||||||||||||||||||||||
| Other income (loss) | ||||||||||||||||||||||||||||||||||||||||||||
| Unrealized gain (loss) on mortgage loans and obligations held in securitization trusts, net | (28,427) | 6,578 | (35,005) | n.m | ||||||||||||||||||||||||||||||||||||||||
| Realized gain on mortgage loans and obligations held in securitization trusts, net | — | 48 | (48) | n.m | ||||||||||||||||||||||||||||||||||||||||
| Other loss, net | (147,074) | (9,842) | (137,232) | n.m | ||||||||||||||||||||||||||||||||||||||||
| Income (loss) before equity in earnings of unconsolidated ventures and income taxes | (177,995) | 9,588 | (187,583) | n.m | ||||||||||||||||||||||||||||||||||||||||
| Equity in earnings (loss) of unconsolidated ventures | (71,255) | 36,285 | (107,540) | n.m | ||||||||||||||||||||||||||||||||||||||||
| Income tax benefit (expense) | (2,264) | 1,629 | (3,893) | n.m | ||||||||||||||||||||||||||||||||||||||||
| Net income (loss) | $ | (251,514) | $ | 47,502 | $ | (299,016) | n.m | |||||||||||||||||||||||||||||||||||||
Comparison of Core Portfolio for Six Months Ended June 30, 2020 and 2019
Net Interest Income
Interest income
Interest income increased by $13.6 million to $83.8 million for the six months ended June 30, 2020, as compared to the six months ended June 30, 2019. The increase was primarily due to a $30.0 million increase from originations, acquisitions and refinancings of loans in 2019 and 2020. This was partially offset by a decrease of $13.0 million related to the repayment of loan investments and a decrease of $3.9 million related to sales and placement of the remaining CRE securities on cost recovery status during the second quarter of 2020.
Interest expense
Interest expense decreased by $0.8 million to $35.9 million for the six months ended June 30, 2020, as compared to the six months ended June 30, 2019. The decrease was primarily due to a $6.2 million decrease resulting from the collapse of a securitization trust and repayment of loan investments and a $0.9 million decrease from sales of CRE securities in 2020. This was partially offset by a $6.3 million increase from originations, acquisitions and refinancings of loans in 2019 and 2020.
91
Net interest income on mortgage loans and obligations held in securitization trusts, net
Net interest income on mortgage loans and obligations held in securitization trusts, net decreased by $1.1 million for the six months ended June 30, 2020, as compared to the six months ended June 30, 2019, primarily due to the sale and deconsolidation of a retained investment in the subordinate tranches of one securitization trust in the third quarter of 2019.
Property and other income
Property operating income
Property operating income decreased by $14.9 million to $44.7 million for the six months ended June 30, 2020, as compared to the six months ended June 30, 2019. The decrease was primarily due to a $14.5 million reduction in operating income due to the sale of a hotel in the fourth quarter of 2019.
Other income
Other income increased by $0.2 million for the six months ended June 30, 2020, as compared to the six months ended June 30, 2019 primarily as a result of fees recovered on previously repaid assets.
Expenses
Management fee expense
Management fee expense decreased by $5.2 million to $13.0 million for the six months ended June 30, 2020, as compared to the six months ended June 30, 2019. The decrease is due to the reduction in stockholders’ equity (as defined in the Management Agreement) as of June 30, 2020 compared to June 30, 2019. The reduction in stockholders’ equity is primarily due to a fourth quarter 2019 amendment to our definition of core earnings in the Management Agreement.
Property operating expense
Property operating expense decreased by $9.9 million to $7.0 million for the six months ended June 30, 2020, as compared to the six months ended June 30, 2019. The decrease resulted from the sale of a hotel during the fourth quarter of 2019.
Transaction, investment and servicing expense
Transaction, investment and servicing expense increased by $3.3 million to $3.7 million for the six months ended June 30, 2020, as compared to the six months ended June 30, 2019, primarily due to a $1.4 million increase in legal costs incurred associated with exploring the internalization of the management of the company and other value-enhancing opportunities, a $1.0 million decrease in franchise tax refunds received, a $0.6 million increase in asset-specific legal costs and $0.6 million in terminated deal costs.
Interest expense on real estate
Interest expense on real estate decreased by $0.8 million to $16.5 million for the six months ended June 30, 2020, as compared to the six months ended June 30, 2019 driven by a decrease in the one month LIBOR rate from June 30, 2019 to June 30, 2020.
Depreciation and amortization
Depreciation and amortization expense decreased by $5.5 million to $20.4 million for the six months ended June 30, 2020, as compared to the six months ended June 30, 2019. This was primarily due to a $2.0 million decrease associated with two properties classified as held for sale and a $1.8 million decrease resulting from the sale of a hotel during the fourth quarter of 2019.
Provision for loan losses
Provision for loan losses increased by $31.4 million during the six months ended June 30, 2020, as compared to the six months ended June 30, 2019 primarily due to the recording of CECL reserves in accordance with ASU No. 2016-13, Financial Instruments-Credit Losses.
Administrative expense
Administrative expense increased by $0.7 million to $8.5 million for the six months ended June 30, 2020, as compared to the six months ended June 30, 2019. This increase was primarily due to higher indirect costs reimbursed to our Manager.
92
Other income (loss)
Unrealized gain (loss) on mortgage loans and obligations held in securitization trusts, net
During the six months ended June 30, 2020, we recorded an unrealized loss of $28.4 million on mortgage loans and obligations held in securitization trusts, net which represents the change in fair value of the assets and liabilities of the securitization trusts consolidated as a result of our investment in the subordinate tranches of these securitization trusts.
Other loss, net
Other loss, net increased by $137.2 million for the six months ended June 30, 2020, as compared to the six months ended June 30, 2019. The increase was primarily due to an $86.2 million realized loss on the sale of 27 CRE securities and the realization of the fair value marks on our remaining CRE securities portfolio in addition to a $38.0 million provision for loan loss recorded on one hospitality loan.
Equity in earnings of unconsolidated ventures
Equity in earnings of unconsolidated ventures decreased by $107.5 million to loss of $71.3 million for the six months ended June 30, 2020, as compared to the six months ended June 30, 2019. This was primarily due to the Company recording $95.9 million in fair value losses relating to two equity method investments that have been placed on nonaccrual status.
Income tax benefit (expense)
Income tax expense increased by $3.9 million to an income tax expense of $2.3 million for the six months ended June 30, 2020, as compared to an income tax benefit of $1.6 million for the six months ended June 30, 2019, primarily due to a $2.7 million reduction in the deferred income tax benefit on one of our net lease portfolios acquired in 2018 and a $1.6 million increase in the deferred income tax liabilities on one of our equity method investments, partially offset by a $0.4 million decrease to income tax provision on a hotel acquired through the legal foreclosure process in the third quarter of 2018, and subsequently sold in December 2019.
Our Legacy, Non-Strategic Portfolio
As of June 30, 2020, our Legacy, Non-Strategic Portfolio consisted of 43 investments representing approximately $528.0 million in book value (excluding cash, cash equivalents and certain other assets). Our loan portfolio consisted of one senior mortgage loans, two mezzanine loans and one preferred equity investment, all of which are on nonaccrual status as of June 30, 2020. Our owned real estate portfolio (including net leased and other real estate) consisted of approximately 4.1 million total square feet of space and the total first quarter NOI of that portfolio was approximately $7.3 million (based on leases in place as of June 30, 2020).
As of June 30, 2020, our Legacy, Non-Strategic Portfolio consisted of the following investments (dollars in thousands):
Count(1) | Book value (Consolidated) | Book value (at CLNC share)(2) | Net book value (Consolidated)(3) | Net book value (at CLNC share)(4) | ||||||||||||||||||||||||||||
| Legacy, Non-Strategic Portfolio | ||||||||||||||||||||||||||||||||
Senior mortgage loans(5) | 1 | $ | 11,021 | $ | 11,021 | $ | 11,021 | $ | 11,021 | |||||||||||||||||||||||
Mezzanine loans(5) | 2 | 56,880 | 12,040 | 56,880 | 12,040 | |||||||||||||||||||||||||||
Preferred equity(5) | 1 | 684 | 145 | 684 | 145 | |||||||||||||||||||||||||||
| Net leased real estate | 6 | 59,000 | 59,000 | 3,860 | 3,860 | |||||||||||||||||||||||||||
| Other real estate | 29 | 393,304 | 355,403 | 87,791 | 81,673 | |||||||||||||||||||||||||||
| Private equity interests | 4 | 7,093 | 7,093 | 7,093 | 7,093 | |||||||||||||||||||||||||||
| Total/Weighted average Legacy, Non-Strategic Portfolio | 43 | $ | 527,982 | $ | 444,702 | $ | 167,329 | $ | 115,832 | |||||||||||||||||||||||
(1)Count for net leased and other real estate represents number of investments.
(2)Book value at our share which represents the proportionate book value based on our ownership by asset)asset as of June 30, 2020.
(3)Net book value represents book value less any associated financing as of June 30, 2020.
(4)Net book value at our share represents the proportionate book value based on asset ownership less any associated financing based on ownership as of June 30, 2020.
(5)Senior mortgage loans, mezzanine loans, and preferred equity include investments in joint ventures whose underlying interest is in a loan or preferred equity.
93
Legacy, Non-Strategic Portfolio: Senior and Mezzanine Loans and Preferred Equity
Our Legacy, Non-Strategic Portfolio includes senior mortgage loans, mezzanine loans and preferred equity interests.
The following table provides a summary of senior and mezzanine loans and preferred equity included in our Legacy, Non-Strategic Portfolio as of June 30, 2020 (dollars in thousands):
Weighted Average(1) | ||||||||||||||||||||||||||||||||||||||||||||||||||||||||||||||
| Count | Book value (at CLNC share)(2) | Principal balance (2) | Cash coupon(3) | Unlevered all-in yield(3) | Remaining Term(4) | Extended Remaining Term(5) | ||||||||||||||||||||||||||||||||||||||||||||||||||||||||
| Senior loans | 1 | $ | 11,021 | $ | 19,784 | — | — | 0.1 | 0.1 | |||||||||||||||||||||||||||||||||||||||||||||||||||||
| Mezzanine loans | 2 | 12,040 | 12,406 | — | — | 0.1 | 0.8 | |||||||||||||||||||||||||||||||||||||||||||||||||||||||
| Preferred equity | 1 | 145 | — | — | — | — | — | |||||||||||||||||||||||||||||||||||||||||||||||||||||||
| Total/Weighted average senior and mezzanine loans and preferred equity - Legacy, Non-Strategic Portfolio | 4 | $ | 23,206 | $ | 32,190 | — | — | 0.1 | 0.4 | |||||||||||||||||||||||||||||||||||||||||||||||||||||
(1)Weighted average metrics weighted by book value at our share, except for cash coupon which is weighted by principal balance at our share.
(2)Book value and principal balance at our share represents the proportionate value based on ownership by asset as of June 30, 2020.
(3)All four senior and mezzanine loans and preferred equity investments are on nonaccrual status.
(4)Represents the remaining term based on the current contractual maturity date of loans.
(5)Represents the remaining term based on a maximum maturity date assuming all extension options on loans are exercised by the borrower.
The following table details senior and mezzanine loans and preferred equity included in our Legacy, Non-Strategic Portfolio by fixed or floating rate as of June 30, 2020 (dollars in thousands):
Weighted Average(1) | ||||||||||||||||||||||||||||||||||||||||||||||||||||||||||||||
| Number of loans | Book value (at CLNC share)(2) | Principal balance(2) | Spread to LIBOR(3) | All-in unlevered yield(3) | Remaining term(4) | Extended remaining term(5) | ||||||||||||||||||||||||||||||||||||||||||||||||||||||||
Fixed rate loans(6) | 4 | $ | 23,206 | $ | 32,190 | — | — | 0.1 | 0.4 | |||||||||||||||||||||||||||||||||||||||||||||||||||||
| Total/ Weighted average | 4 | $ | 23,206 | $ | 32,190 | — | — | 0.1 | 0.4 | |||||||||||||||||||||||||||||||||||||||||||||||||||||
(1)Weighted average metrics weighted by book value at our share, except for spread to LIBOR, which is weighted by principal balance value at our share. Book and principal balances at share exclude a de minimis amount of noncontrolling interest. See the table located above in “Our Portfolio” for further information.
(2)Book value and principal balance at our share represents the proportionate value based on ownership by asset as of June 30, 2020.
(3)All four senior and mezzanine loans and preferred equity investments are on nonaccrual status.
(4)Represents the remaining term in years based on the original maturity date or current extension maturity date of loans.
(5)Represents the remaining term in years based on a maximum maturity date assuming all extension options on loans are exercised by the borrower.
(6)Includes one preferred equity investment.
The following table details the types of properties securing senior and mezzanine loans and preferred equity included in our Legacy, Non-Strategic Portfolioand geographic distribution as of June 30, 2020 (dollars in thousands):
| Collateral property type | Book value | % of total | ||||||||||||
Other(1) | $ | 23,206 | 100.0 | % | ||||||||||
| Total | $ | 23,206 | 100.0 | % | ||||||||||
| Region | Book value | % of total | ||||||||||||
| West | $ | 23,206 | 100.0 | % | ||||||||||
| Total | $ | 23,206 | 100.0 | % | ||||||||||
(1)Other includes commercial and residential development and predevelopment assets.
94
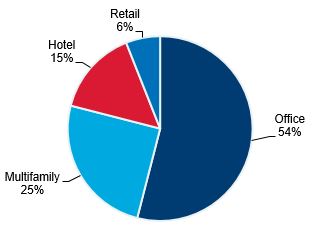 | 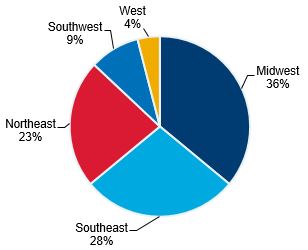 | |
Within our Legacy, Non-Strategic Portfolio, we held certain other loans secured by regional malls that were sold during the six months ended June 30, 2020 as follows:
•We placed one loan secured by a regional mall (“Midwest Regional Mall”) on nonaccrual status during 2019 as collectability of the principal was uncertain; as such, interest collected is recognized using the cost recovery method by applying interest collected as a reduction to loan carrying value. We recorded $10.6 million of impairment related to Midwest Regional Mall and transferred the loan to held for sale during 2019. During the three months ending June 30, 2020 the Midwest Regional Mall was sold. We received $8.3 million in gross proceeds and recognized a gain of $3.7 million.
•During 2018, we recorded $8.8 million of provision for loan losses on one loan secured by a regional mall (“Northeast Regional Mall B”) to reflect the estimated fair value of the collateral. During 2019, we recognized additional provision for loan losses of $10.5 million on Northeast Regional Mall B. The additional provisions were based on then-current and prospective leasing activity to reflect the estimated fair value of the collateral. During the three months ended March 31, 2020, the Northeast Regional Mall was sold. We received $9.2 million in gross proceeds and recognized a gain of $1.8 million.
•Also, during 2019, we separately recognized provision for loan losses of $18.5 million on two loans secured by one regional mall (“West Regional Mall”) to reflect the estimated fair value of the collateral. During the three months ended June 30, 2020, the West Regional Mall loan was sold. We received $23.5 million in gross proceeds and recognized a gain of $6.5 million.
•Furthermore, during 2019, we recognized a $26.7 million provision for loan losses on three loans to two separate borrowers (“South Regional Mall A” and “South Regional Mall B”) to reflect the estimated fair value of the collateral. During the three months ended March 31, 2020, we accepted a discounted payoff of South Regional Mall A. We received $22.0 million in gross proceeds and recognized a loss of $1.6 million. Additionally, during the three months ended March 31, 2020 South Regional Mall B was sold. We received $13.5 million in gross proceeds and recognized a gain of $8.7 million.
Impairment of Loans and Preferred Equity Held in Joint Ventures
During the year ended December 31, 2019, we recognized our proportionate share of a fair value loss adjustment totaling $14.7 million on one senior loan secured by a regional mall (“Southeast Regional Mall”) of which we owned 50.0% of the joint venture. Southeast Regional Mall was included in our Legacy, Non-Strategic Portfolio prior to its sale during the six months ended June 30, 2020. We received $13.4 million in gross sales proceeds and recognized a gain of $1.6 million.
COVID-19 Update
During the three and six months ended June 30, 2020, we sold three loans generating gross proceeds of $31.8 million and 10 loans generating gross proceeds of $113.0 million, respectively. Our four remaining loans are on nonaccrual. We have reviewed the four remaining loans in our Legacy, Non-Strategic portfolio and believe that it is too early to predict and quantify the full impact of principal loss. However, further losses or permanent impairment in future quarters are possible.
Legacy, Non-Strategic Portfolio: Owned Real Estate
Our owned real estate includes direct ownership in commercial real estate with an emphasis on properties with stable cash flow, which may be structurally senior to a third-party partner’s equity. In addition, we own operating real estate investments through joint ventures with one or more partners. These properties are typically well-located with strong operating partners.
95
As of June 30, 2020, $414.4 million, or 93.2%, of our Legacy, Non-Strategic Portfolio was invested in owned real estate and was 89.0% occupied. The following table provides a summary of net leased and other real estate included in our Legacy, Non-Strategic Portfolio as of June 30, 2020 (dollars in thousands):
| Count | Carrying Value(1) | NOI/EBITDA for the three months ended June 30, 2020(2) | ||||||||||||||||||
| Net leased real estate | 6 | $ | 59,000 | $ | 2,088 | |||||||||||||||
| Other real estate | 29 | 355,403 | 5,183 | |||||||||||||||||
| Total/Weighted average owned real estate - Legacy, Non-Strategic Portfolio | 35 | $ | 414,403 | $ | 7,271 | |||||||||||||||
(1)Represents carrying values at our share as of June 30, 2020; includes real estate tangible assets, deferred leasing costs and other intangible assets less intangible liabilities.
(2)Excludes NOI/EBITDA loss of $0.1 million that relates to properties that have been sold. Please refer to “Non-GAAP Supplemental Financial Measures” for further information on NOI/EBITDA.
96
The following table provides asset-level details of our net leased and other real estate included in our Legacy, Non-Strategic Portfolio as of June 30, 2020:
| Collateral type | City, State | Number of properties | Number of buildings | RSF / units/keys | Weighted average % leased(1) | Weighted average lease term (yrs)(2) | ||||||||||||||||||||||||||||||||||||||||||||||||||
| Net leased real estate | ||||||||||||||||||||||||||||||||||||||||||||||||||||||||
| Net lease 1 | Retail | Various - U.S. | 7 | 7 | 319,600 RSF | 100% | 3.7 | |||||||||||||||||||||||||||||||||||||||||||||||||
| Net lease 2 | Office | Columbus, OH | 1 | 1 | 199,122 RSF | 52% | 6.5 | |||||||||||||||||||||||||||||||||||||||||||||||||
| Net lease 3 | Office | Rockaway, NJ | 1 | 1 | 121,038 RSF | 100% | 2.5 | |||||||||||||||||||||||||||||||||||||||||||||||||
| Net lease 4 | Retail | Keene, NH | 1 | 1 | 45,471 RSF | 100% | 8.6 | |||||||||||||||||||||||||||||||||||||||||||||||||
| Net lease 5 | Retail | Fort Wayne, IN | 1 | 1 | 50,000 RSF | 100% | 4.2 | |||||||||||||||||||||||||||||||||||||||||||||||||
| Net lease 6 | Retail | South Portland, ME | 1 | 1 | 52,900 RSF | 100% | 3.2 | |||||||||||||||||||||||||||||||||||||||||||||||||
| Total/Weighted average net leased real estate | 12 | 12 | 788,131 RSF | 87% | 4.6 | |||||||||||||||||||||||||||||||||||||||||||||||||||
| Other real estate | ||||||||||||||||||||||||||||||||||||||||||||||||||||||||
| Other real estate 1 | Office | Creve Coeur, MO | 7 | 7 | 847,604 RSF | 94% | 4.3 | |||||||||||||||||||||||||||||||||||||||||||||||||
| Other real estate 2 | Office | Warrendale, PA | 5 | 5 | 496,414 RSF | 82% | 5.1 | |||||||||||||||||||||||||||||||||||||||||||||||||
| Other real estate 3 | Multifamily | New Orleans, LA | 1 | 1 | 375 Units | 89% | — | |||||||||||||||||||||||||||||||||||||||||||||||||
| Other real estate 4 | Hotel | Coraopolis, PA | 1 | 1 | 318 Keys | n/a | — | |||||||||||||||||||||||||||||||||||||||||||||||||
| Other real estate 5 | Multifamily | Kalamazoo, MI | 1 | 24 | 698 Units | 89% | — | |||||||||||||||||||||||||||||||||||||||||||||||||
| Other real estate 6 | Multifamily | Cayce, SC | 1 | 1 | 557 Units | 69% | — | |||||||||||||||||||||||||||||||||||||||||||||||||
| Other real estate 7 | Multifamily | Central, SC | 1 | 10 | 469 Units | 82% | — | |||||||||||||||||||||||||||||||||||||||||||||||||
| Other real estate 8 | Office | Omaha, NE | 1 | 1 | 404,865 RSF | 68% | 1.1 | |||||||||||||||||||||||||||||||||||||||||||||||||
| Other real estate 9 | Office | Greensboro, NC | 1 | 1 | 129,717 RSF | 88% | 2.2 | |||||||||||||||||||||||||||||||||||||||||||||||||
| Other real estate 10 | Multifamily | Gillette, WY | 1 | 6 | 139 Units | 88% | — | |||||||||||||||||||||||||||||||||||||||||||||||||
| Other real estate 11 | Office | Greensboro, NC | 1 | 1 | 86,321 RSF | 85% | 1.2 | |||||||||||||||||||||||||||||||||||||||||||||||||
| Other real estate 12 | Office | Bath, ME | 1 | 1 | 37,623 RSF | 100% | 0.8 | |||||||||||||||||||||||||||||||||||||||||||||||||
| Other real estate 13 | Office | Winston Salem, NC | 1 | 1 | 140,132 RSF | 42% | 1.1 | |||||||||||||||||||||||||||||||||||||||||||||||||
| Other real estate 14 | Retail | Anchorage, AK | 1 | 1 | 343,995 RSF | 65% | 1.0 | |||||||||||||||||||||||||||||||||||||||||||||||||
| Other real estate 15 | Office | Topeka, KS | 1 | 1 | 194,989 RSF | 70% | 3.0 | |||||||||||||||||||||||||||||||||||||||||||||||||
| Other real estate 16 | Retail | West Columbia, SC | 1 | 1 | 52,375 RSF | 58% | 1.3 | |||||||||||||||||||||||||||||||||||||||||||||||||
| Other real estate 17 | Office | Greensboro, NC | 1 | 2 | 58,978 RSF | 22% | 0.6 | |||||||||||||||||||||||||||||||||||||||||||||||||
| Other real estate 18 | Multifamily | Evansville, WY | 1 | 1 | 191 Units | 40% | — | |||||||||||||||||||||||||||||||||||||||||||||||||
| Other real estate 19 | Office | Greensboro, NC | 1 | 1 | 48,042 RSF | 29% | 0.3 | |||||||||||||||||||||||||||||||||||||||||||||||||
| Other real estate 20 | Office | Greensboro, NC | 1 | 1 | 47,690 RSF | 57% | 0.7 | |||||||||||||||||||||||||||||||||||||||||||||||||
| Other real estate 21 | Office | Greensboro, NC | 1 | 1 | 47,211 RSF | 33% | 0.5 | |||||||||||||||||||||||||||||||||||||||||||||||||
| Other real estate 22 | Office | Greensboro, NC | 1 | 4 | 42,123 RSF | 48% | 0.7 | |||||||||||||||||||||||||||||||||||||||||||||||||
| Other real estate 23 | Office | Greensboro, NC | 1 | 1 | 35,224 RSF | 44% | 0.3 | |||||||||||||||||||||||||||||||||||||||||||||||||
| Other real estate 24 | Office | Greensboro, NC | 1 | 1 | 34,903 RSF | 52% | 0.6 | |||||||||||||||||||||||||||||||||||||||||||||||||
| Other real estate 25 | Office | Greensboro, NC | 1 | 1 | 34,060 RSF | 40% | 0.2 | |||||||||||||||||||||||||||||||||||||||||||||||||
| Other real estate 26 | Office | Greensboro, NC | 1 | 1 | 32,905 RSF | 100% | 5.7 | |||||||||||||||||||||||||||||||||||||||||||||||||
| Other real estate 27 | Office | Greensboro, NC | 1 | 1 | 26,563 RSF | 55% | 0.2 | |||||||||||||||||||||||||||||||||||||||||||||||||
| Other real estate 28 | Office | Greensboro, NC | 1 | 1 | 23,145 RSF | 63% | 0.9 | |||||||||||||||||||||||||||||||||||||||||||||||||
| Other real estate 29 | Office | Topeka, KS | 1 | 1 | 194,989 RSF | 70% | 3.0 | |||||||||||||||||||||||||||||||||||||||||||||||||
| Total/Weighted average other real estate | 39 | 80 | n/a | 81% | 2.5 | |||||||||||||||||||||||||||||||||||||||||||||||||||
| Total/Weighted average owned real estate - Legacy, Non-Strategic Portfolio | 51 | 92 | ||||||||||||||||||||||||||||||||||||||||||||||||||||||
(1)Represents the percent leased as of June 30, 2020. Weighted average calculation based on carrying value at our share as of June 30, 2020.
(2)Based on in-place leases (defined as occupied and paying leases) as of June 30, 2020 and assumes that no renewal options are exercised. Weighted average calculation based on carrying value at our share as of June 30, 2020.
COVID-19 Update
For the quarter ended June 30, 2020 and through August 6, 2020, we collected 89.2% of total rents across our Legacy, Non-Strategic Portfolio.
97
We reviewed our Legacy, Non-Strategic owned real estate portfolio and our asset management team is in active discussions with all lessees. See table below:
| (Dollars in thousands) | April through July 2020 Rent Collection | |||||||||||||||||||||||||||||||
| Billed | Collected | % Collected | ||||||||||||||||||||||||||||||
| Office | $ | 16,768 | $ | 14,873 | 88.7 | % | ||||||||||||||||||||||||||
| Student Housing | 2,986 | 2,706 | 90.6 | % | ||||||||||||||||||||||||||||
| Multifamily | 2,743 | 2,557 | 93.2 | % | ||||||||||||||||||||||||||||
| Retail | 2,699 | 2,247 | 83.3 | % | ||||||||||||||||||||||||||||
| Hotel | — | — | n/a | |||||||||||||||||||||||||||||
| $ | 25,196 | $ | 22,383 | 88.8 | % | |||||||||||||||||||||||||||
We met all our mortgage obligations securing the properties within our Legacy, Non-Strategic Portfolio. We caution that known and unknown COVID-19 events could result in lease modifications, impairment and the inability to make our mortgage payments, all which could result in default under our mortgage obligations.
We continue to pursue and execute sales of owned real estate in our Legacy, Non-Strategic Portfolio. As a result, we recorded impairment on held for sale operating real estate properties of $25.9 million resulting from bids received and updated brokers’ opinions of value (BOVs).
Since October 1, 2019, we have completed the following sales:
| No. of Properties sold | Gross Proceeds | Net Proceeds | Net gain/(loss) | |||||||||||||||||||||||
| QE - December 31, 2019 | 6 | $ | 96,980 | $ | 95,425 | $ | 10,036 | |||||||||||||||||||
| QE - March 31, 2020 | 6 | 172,579 | 80,133 | (3,551) | ||||||||||||||||||||||
| QE - June 30, 2020 | 1 | 1,025 | 903 | (83) | ||||||||||||||||||||||
| July 1 - August 6, 2020 | 2 | 4,990 | 4,559 | 164 | ||||||||||||||||||||||
| Total | 15 | $ | 275,574 | $ | 181,020 | $ | 6,566 | |||||||||||||||||||
Refer to “COVID-19 Impact on Liquidity” in “Liquidity and Capital Resources,” respectively, below for further discussion regarding the COVID-19 pandemic and its impact on our future operating results, liquidity and financial condition.
98
Results of Operations - Legacy, Non-Strategic Portfolio
The following table summarizes our Legacy, Non-Strategic Portfolio results of operations for the three months ended June 30, 2020 and 2019 (dollars in thousands):
| Three Months Ended June 30, | Increase (Decrease) | |||||||||||||||||||||||||||||||||||||||||||
| 2020 | 2019 | Amount | % | |||||||||||||||||||||||||||||||||||||||||
| Net interest income | ||||||||||||||||||||||||||||||||||||||||||||
| Interest income | $ | 118 | $ | 4,896 | $ | (4,778) | (97.6) | % | ||||||||||||||||||||||||||||||||||||
| Interest expense | (629) | (1,860) | 1,231 | (66.2) | % | |||||||||||||||||||||||||||||||||||||||
| Net interest income | (511) | 3,036 | (3,547) | (116.8) | % | |||||||||||||||||||||||||||||||||||||||
| Property and other income | ||||||||||||||||||||||||||||||||||||||||||||
| Property operating income | 20,526 | 35,104 | (14,578) | (41.5) | % | |||||||||||||||||||||||||||||||||||||||
| Other income | 3 | 27 | (24) | n.m. | ||||||||||||||||||||||||||||||||||||||||
| Total property and other income | 20,529 | 35,131 | (14,602) | (41.6) | % | |||||||||||||||||||||||||||||||||||||||
| Expenses | ||||||||||||||||||||||||||||||||||||||||||||
| Management fee expense | 721 | 2,271 | (1,550) | (68.3) | % | |||||||||||||||||||||||||||||||||||||||
| Property operating expense | 13,036 | 20,239 | (7,203) | (35.6) | % | |||||||||||||||||||||||||||||||||||||||
| Transaction, investment and servicing expense | 1,467 | 734 | 733 | 99.9 | % | |||||||||||||||||||||||||||||||||||||||
| Interest expense on real estate | 3,733 | 5,084 | (1,351) | (26.6) | % | |||||||||||||||||||||||||||||||||||||||
| Depreciation and amortization | 4,723 | 16,369 | (11,646) | (71.1) | % | |||||||||||||||||||||||||||||||||||||||
| Provision for loan losses | 35 | 110,258 | (110,223) | n.m. | ||||||||||||||||||||||||||||||||||||||||
| Impairment of operating real estate | 25,935 | 10,124 | 15,811 | n.m. | ||||||||||||||||||||||||||||||||||||||||
| Administrative expense | 2,339 | 3,842 | (1,503) | (39.1) | % | |||||||||||||||||||||||||||||||||||||||
| Total expenses | 51,989 | 168,921 | (116,932) | (69.2) | % | |||||||||||||||||||||||||||||||||||||||
| Other income (loss) | ||||||||||||||||||||||||||||||||||||||||||||
| Other gain (loss), net | 6,929 | (46) | 6,975 | n.m. | ||||||||||||||||||||||||||||||||||||||||
| Income (loss) before equity in earnings of unconsolidated ventures and income taxes | (25,042) | (130,800) | 105,758 | n.m. | ||||||||||||||||||||||||||||||||||||||||
| Equity in earnings (losses) of unconsolidated ventures | 51 | (5,360) | 5,411 | (101.0) | % | |||||||||||||||||||||||||||||||||||||||
| Income tax benefit (expense) | (1) | 492 | (493) | (100.2) | % | |||||||||||||||||||||||||||||||||||||||
| Net income (loss) | $ | (24,992) | $ | (135,668) | $ | 110,676 | n.m. | |||||||||||||||||||||||||||||||||||||
Comparison of Legacy, Non-Strategic Portfolio for Three Months Ended June 30, 2020 and 2019
Net Interest Income
Interest income
Interest income decreased by $4.8 million to $0.1 million for the three months ended June 30, 2020, as compared to the three months ended June 30, 2019. This decrease was primarily due to $3.9 million related to the sale and repayment of loan investments, $0.6 million related to the sale of one foreclosed loan investment and $0.4 million due to placing one retail loan on nonaccrual status.
Interest expense
Interest expense decreased by $1.2 million to $0.6 million for the three months ended June 30, 2020, as compared to the three months ended June 30, 2019. This was primarily due to a lower allocation of interest expense on our Bank Credit Facility allocated to the Legacy Non-Strategic Portfolio for the three months ended June 30, 2020 and $0.5 million of lower interest expense as a result of sales of loans during 2019 and 2020.
Property and other income
Property operating income
Property operating income decreased by $14.6 million to $20.5 million for the three months ended June 30, 2020, as compared to the three months ended June 30, 2019. The lower income was primarily due to a $7.7 million decrease related to 12 real estate properties sold within the past twelve months and a $4.6 million decrease in hotel revenues due to COVID-19.
99
Expenses
Management fee expense
Management fee expense decreased by $1.6 million to $0.7 million for the three months ended June 30, 2020, as compared to the three months ended June 30, 2019. The decrease is due to the reduction in stockholders’ equity (as defined in the Management Agreement) as of June 30, 2020 compared to June 30, 2019. The reduction in stockholders’ equity is primarily due to a fourth quarter 2019 amendment to our definition of core earnings in the Management Agreement.
Property operating expense
Property operating expense decreased by $7.2 million to $13.0 million for the three months ended June 30, 2020, as compared to the three months ended June 30, 2019. The lower expense was primarily due to a $4.7 million decrease related to 12 real estate properties sold within the past twelve months and a $2.5 million decrease in hotel operating expenses related to COVID-19.
Transaction, investment and servicing expense
Transaction, investment and servicing expense increased by $0.7 million to $1.5 million for the three months ended June 30, 2020, as compared to the three months ended June 30, 2019, primarily as a result of $1.0 million of costs associated with the sale of investments.
Interest expense on real estate
Interest expense on real estate decreased by $1.4 million to $3.7 million for the three months ended June 30, 2020, as compared to the three months ended June 30, 2019. The decrease resulted from real estate properties sold within the past twelve months.
Depreciation and amortization
Depreciation and amortization expense decreased by $11.6 million to $4.7 million for the three months ended June 30, 2020, as compared to the three months ended June 30, 2019. This was primarily due to a $4.5 million decrease related to 27 real estate properties classified as held for sale in 2019 and 2020, a $4.0 million decrease due to properties sold within the past twelve months, and $3.8 million due to lower carrying values associated with impairments recorded in third quarter of 2019.
Provision for loan losses
Provision for loan losses decreased by $110.2 million for the three months ended June 30, 2020 s compared to the three months ended June 30, 2019. This provision recorded in the second quarter of 2019 was a result of a provision recorded on four NY hospitality loans and three loans collateralized by retail properties.
Impairment of operating real estate
Impairment of operating real estate of $25.9 million was recorded for the three months ended June 30, 2020 as a result of feedback received during the sales process.
Administrative expense
Administrative expense decreased by $1.5 million to $2.3 million for the three months ended June 30, 2020, as compared to the three months ended June 30, 2019. This decrease was primarily due to a lower allocation of indirect costs which are reimbursable to our Manager.
Other income
Other gain (loss), net
Other gain (loss), net increased by $7.0 million to other gain for the three months ended June 30, 2020, as compared to the three months ended June 30, 2019. The increase was primarily due to $10.9 million in realized gains on sales of three loans partially offset by $2.8 million in defeasance costs associated with mortgage refinancing at student housing properties.
Equity in earnings (losses) of unconsolidated ventures
Equity in earnings (losses) of unconsolidated ventures increased by $5.4 million to earnings of $0.1 million for the three months ended June 30, 2020, as compared to the three months ended June 30, 2019. This was primarily due to $8.4 million gain on the sale of a senior loan held in a joint venture, partially offset by $3.0 million related to placing two loans held in joint ventures on nonaccrual status.
100
Income tax benefit (expense)
Income tax expense decreased by $0.5 million for the three months ended June 30, 2020, as compared to the three months ended June 30, 2019.
The following table summarizes our Legacy, Non-Strategic Portfolio results of operations for the six months ended June 30, 2020 and 2019 (dollars in thousands):
| Six Months Ended June 30, | Increase (Decrease) | |||||||||||||||||||||||||||||||||||||||||||
| 2020 | 2019 | Amount | % | |||||||||||||||||||||||||||||||||||||||||
| Net interest income | ||||||||||||||||||||||||||||||||||||||||||||
| Interest income | $ | 1,816 | $ | 10,309 | $ | (8,493) | (82.4) | % | ||||||||||||||||||||||||||||||||||||
| Interest expense | (1,627) | (3,649) | 2,022 | (55.4) | % | |||||||||||||||||||||||||||||||||||||||
| Net interest income | 189 | 6,660 | (6,471) | (97.2) | % | |||||||||||||||||||||||||||||||||||||||
| Property and other income | ||||||||||||||||||||||||||||||||||||||||||||
| Property operating income | 51,526 | 68,335 | (16,809) | (24.6) | % | |||||||||||||||||||||||||||||||||||||||
| Other income | 292 | 43 | 249 | 579.1 | % | |||||||||||||||||||||||||||||||||||||||
| Total property and other income | 51,818 | 68,378 | (16,560) | — | ||||||||||||||||||||||||||||||||||||||||
| Expenses | ||||||||||||||||||||||||||||||||||||||||||||
| Management fee expense | 2,150 | 4,543 | (2,393) | (52.7) | % | |||||||||||||||||||||||||||||||||||||||
| Property operating expense | 31,884 | 39,473 | (7,589) | (19.2) | % | |||||||||||||||||||||||||||||||||||||||
| Transaction, investment and servicing expense | 2,387 | 1,208 | 1,179 | 97.6 | % | |||||||||||||||||||||||||||||||||||||||
| Interest expense on real estate | 8,350 | 10,121 | (1,771) | (17.5) | % | |||||||||||||||||||||||||||||||||||||||
| Depreciation and amortization | 11,547 | 30,947 | (19,400) | (62.7) | % | |||||||||||||||||||||||||||||||||||||||
| Provision for loan losses | 38,468 | 110,258 | (71,790) | (65.1) | % | |||||||||||||||||||||||||||||||||||||||
| Impairment of operating real estate | 30,061 | 10,124 | 19,937 | 196.9 | % | |||||||||||||||||||||||||||||||||||||||
| Administrative expense | 5,246 | 6,855 | (1,609) | (23.5) | % | |||||||||||||||||||||||||||||||||||||||
| Total expenses | 130,093 | 213,529 | (83,436) | (39) | % | |||||||||||||||||||||||||||||||||||||||
| Other income (loss) | ||||||||||||||||||||||||||||||||||||||||||||
| Other gain (loss), net | 7,279 | (1,299) | 8,578 | (660.4) | % | |||||||||||||||||||||||||||||||||||||||
| Income (loss) before equity in earnings of unconsolidated ventures and income taxes | (70,807) | (139,790) | 68,983 | (49.3) | % | |||||||||||||||||||||||||||||||||||||||
| Equity in earnings (loss) of unconsolidated ventures | 3,145 | (2,418) | 5,563 | (230.1) | % | |||||||||||||||||||||||||||||||||||||||
| Income tax expense | (1,549) | (1,127) | (422) | 37.4 | % | |||||||||||||||||||||||||||||||||||||||
| Net income (loss) | $ | (69,211) | $ | (143,335) | $ | 74,124 | (51.7) | % | ||||||||||||||||||||||||||||||||||||
Comparison of Legacy, Non-Strategic Portfolio for Six Months Ended June 30, 2020 and 2019
Net Interest Income
Interest income
Interest income decreased by $8.5 million to $1.8 million for the six months ended June 30, 2020, as compared to the six months ended June 30, 2019. This decrease was primarily due to $7.1 million related to the sale and repayment of loan investments and $1.3 million related to one foreclosed loan investment.
Interest expense
Interest expense decreased by $2.0 million to $1.6 million for the six months ended June 30, 2020, as compared to the six months ended June 30, 2019. This was primarily due to a lower allocation of interest expense on our Bank Credit Facility allocated to the Legacy Non-Strategic Portfolio for the three months ended June 30, 2020.
101
Property and other income
Property operating income
Property operating income decreased by $16.8 million to $51.5 million for the six months ended June 30, 2020, as compared to the six months ended June 30, 2019. The lower income was primarily due to a $9.3 million decrease related to 12 real estate properties sold within the past twelve months and a $5.3 million decrease in hotel revenues due to COVID-19.
Other income
Other income increased by $0.2 million to $0.3 million for the six months ended June 30, 2020, as compared to the six months ended June 30, 2019. The Company recorded $0.3 million in extension fees related to a held for sale operating real estate property.
Expenses
Management fee expense
Management fee expense decreased by $2.4 million to $2.2 million for the six months ended June 30, 2020, as compared to the six months ended June 30, 2019. The decrease is due to the reduction in stockholders’ equity (as defined in the Management Agreement) as of June 30, 2020 compared to June 30, 2019. The reduction in stockholders’ equity is primarily due to a fourth quarter 2019 amendment to our definition of core earnings in the Management Agreement.
Property operating expense
Property operating expense decreased by $7.6 million to $31.9 million for the six months ended June 30, 2020, as compared to the six months ended June 30, 2019. The lower expense was primarily due to a $5.9 million decrease related to 12 real estate properties sold within the past twelve months.
Transaction, investment and servicing expense
Transaction, investment and servicing expense increased by $1.2 million to $2.4 million for the six months ended June 30, 2020, as compared to the six months ended June 30, 2019, as a result of costs associated with the sale of investments.
Interest expense on real estate
Interest expense on real estate decreased by $1.8 million to $8.4 million for the six months ended June 30, 2020, as compared to the six months ended June 30, 2019. The decrease resulted from real estate properties sold within the past twelve months.
Depreciation and amortization
Depreciation and amortization expense decreased by $19.4 million to $11.5 million for the six months ended June 30, 2020, as compared to the six months ended June 30, 2019. This was primarily due to a $9.1 million decrease related to 27 real estate properties classified as held for sale in 2019 and 2020, a $5.1 million decrease due to properties sold within the past twelve months, and $4.5 million due to lower carrying values associated with impairments recorded in the third quarter of 2019.
Provision for loan losses
Provision for loan losses of $38.5 million was recorded for the six months ended June 30, 2020, which is primarily attributable to the Company recording an additional provision of $36.8 million for our four NY hospitality loans due to the detrimental impact of COVID-19 on the hospitality industry.
Impairment of operating real estate
Impairment of operating real estate of $30.1 million for the six months ended June 30, 2020 is primarily resulting from feedback received during the sales process.
Administrative expense
Administrative expense decreased by $1.6 million to $5.2 million for the six months ended June 30, 2020, as compared to the six months ended June 30, 2019. This decrease was primarily due to lower stock compensation expense allocated to the Legacy, Non-Strategic Portfolio and a lower allocation of indirect costs which are reimbursable to our Manager.
102
Other income
Other gain (loss), net
Other loss, net decreased by $8.6 million to other gain for the six months ended June 30, 2020, as compared to the six months ended June 30, 2019. The decrease was primarily due to $10.9 million of gains from loan sales during 2020.
Equity in earnings of unconsolidated ventures
Equity in earnings of unconsolidated ventures increased by $5.6 million to $3.1 million for the six months ended June 30, 2020, as compared to the six months ended June 30, 2019. This was primarily due to $8.4 million gain on the sale of a senior loan held in a joint venture, partially offset by $3.0 million related to placing two loans held in joint ventures on nonaccrual status.
Income tax expense
Income tax expense increased by $0.4 million to $1.5 million for the six months ended June 30, 2020, as compared to the six months ended June 30, 2019.
Non-GAAP Supplemental Financial Measures
Core Earnings/Legacy, Non-Strategic Earnings
We present Core Earnings/Legacy, Non-Strategic Earnings, which is a non-GAAP supplemental financial measure of our performance. Our Core Earnings are generated by the Core Portfolio and Legacy, Non-Strategic Earnings are generated by the Legacy, Non-Strategic Portfolio. We believe that Core Earnings/Legacy, Non-Strategic Earnings provides meaningful information to consider in addition to our net income and cash flow from operating activities determined in accordance with accounting principles generally accepted in the United States (“U.S. GAAP”).GAAP. This supplemental financial measure helps us to evaluate our performance excluding the effects of certain transactions and U.S. GAAP adjustments that we believe are not necessarily indicative of our current portfolio and operations. We also use Core Earnings to determine the incentive fees we pay to our Manager. For information on the fees we pay our Manager, see Note 11,10, “Related Party Arrangements” to our consolidated financial statements included in this Form 10-Q. In addition, we believe that our investors also use Core Earnings/Legacy, Non-Strategic Earnings or a comparable supplemental performance measure to evaluate and compare the performance of us and our peers, and as such, we believe that the disclosure of Core Earnings/Legacy, Non-Strategic Earnings is useful to our investors.
We define Core Earnings/Legacy, Non-Strategic Earnings as U.S. GAAP net income (loss) attributable to our common stockholders (or, without duplication, the owners of the common equity of our direct subsidiaries, such as our OP) and excluding (i) non-cash equity compensation expense, (ii) the expenses incurred in connection with our formation or other strategic transactions, (iii) the incentive fee, (iv) acquisition costs from successful acquisitions, (v) gains or losses from sales of real estate property and impairment write-downs of depreciable real estate, including unconsolidated joint ventures and preferred equity investments, (vi) CECL reserves determined by probability of default/loss given default (“PD/LGD”) model, (vii) depreciation and amortization, (vi)(viii) any unrealized gains or losses or other similar non-cash items that are included in net income for the current quarter, regardless of whether such items are included in other comprehensive income or loss, or in net income, (vii)(ix) one-time events pursuant to changes in U.S. GAAP and (viii)(x) certain material non-cash income or expense items that in the judgment of management should not be included in Core Earnings/Legacy, Non-Strategic Earnings. For clauses (vii)(ix) and (viii)(x), such exclusions shall only be applied after discussions between our Manager and our independent directors and after approval by a majority of our independent directors. U.S. GAAP net income (loss) attributable to our common stockholders and Core Earnings/Legacy, Non-Strategic Earnings include provision for loan losses.
Prior to the third quarter of 2019, Core Earnings reflectsreflected adjustments to U.S. GAAP net income to exclude impairment of real estate and provision for loan losses.
Core Earnings/Legacy, Non-Strategic Earnings does not represent net income or cash generated from operating activities and should not be considered as an alternative to U.S. GAAP net income or an indication of our cash flows from operating activities determined in accordance with U.S. GAAP, a measure of our liquidity, or an indication of funds available to fund our cash needs, including our ability to make cash distributions. In addition, our methodology for calculating Core Earnings/Legacy, Non-Strategic Earnings may differ from methodologies employed by other companies to calculate the same or similar non-GAAP supplemental financial measures, and accordingly, our reported Core Earnings may not be comparable to the Core Earnings reported by other companies.
103
The following table presentstables present a reconciliation of net income (loss) attributable to our common stockholders to Core Earnings/Legacy, Non-Strategic Earnings attributable to our common stockholders and noncontrolling interest of the Operating Partnership (dollars and share amounts in thousands, except per share data): for the three and six months ended June 30, 2020:
| Three Months Ended June 30, 2020 | ||||||||||||||||||||||||||||||||
| Total | Legacy, Non-Strategic Portfolio | Core Portfolio | ||||||||||||||||||||||||||||||
| Net loss attributable to Colony Credit Real Estate, Inc. common stockholders | $ | (227,059) | $ | (16,728) | $ | (210,331) | ||||||||||||||||||||||||||
| Adjustments: | ||||||||||||||||||||||||||||||||
| Net loss attributable to noncontrolling interest of the Operating Partnership | (5,418) | (373) | (5,045) | |||||||||||||||||||||||||||||
| Non-cash equity compensation expense | 1,549 | 697 | 852 | |||||||||||||||||||||||||||||
| Transaction costs | 705 | 292 | 413 | |||||||||||||||||||||||||||||
| Depreciation and amortization | 13,386 | 4,318 | 9,068 | |||||||||||||||||||||||||||||
| Net unrealized loss (gain) on investments: | ||||||||||||||||||||||||||||||||
| Impairment of operating real estate and preferred equity | 25,935 | 25,935 | — | |||||||||||||||||||||||||||||
| Other unrealized gain | (23,798) | (1) | (23,797) | |||||||||||||||||||||||||||||
| CECL reserves | (20,925) | — | (20,925) | |||||||||||||||||||||||||||||
| Losses on sales of real estate and preferred equity | 13,520 | 3,437 | 10,083 | |||||||||||||||||||||||||||||
| Adjustments related to noncontrolling interests | (8,428) | (8,329) | (99) | |||||||||||||||||||||||||||||
| Core Earnings (Loss) / Legacy, Non-Strategic Earnings (Loss) attributable to Colony Credit Real Estate, Inc. common stockholders and noncontrolling interest of the Operating Partnership | $ | (230,533) | $ | 9,248 | $ | (239,781) | ||||||||||||||||||||||||||
Core Earnings (Loss) / Legacy, Non-Strategic Earnings (Loss) per share(1) | $ | (1.75) | $ | 0.07 | $ | (1.82) | ||||||||||||||||||||||||||
Weighted average number of common shares and OP units(1) | 131,615 | 131,615 | 131,615 | |||||||||||||||||||||||||||||
(1)We calculate Core Earnings (Loss) / Legacy, Non-Strategic Earnings (Loss) per share, a non-GAAP financial measure, based on a weighted-average number of common shares and OP units (held by members other than us or our subsidiaries). For the three months ended June 30, 2020, weighted average number of common shares includes 3.1 million OP units.
104
| Three Months Ended June 30, | Six Months Ended June 30, | |||||||||||||||
| 2019 | 2018 | 2019 | 2018 | |||||||||||||
| Net income (loss) attributable to Colony Credit Real Estate, Inc. common stockholders | $ | (107,341 | ) | $ | 16,008 | $ | (92,433 | ) | $ | 11,294 | ||||||
| Adjustments: | ||||||||||||||||
| Net income attributable to noncontrolling interest of the Operating Partnership | (2,569 | ) | 336 | (2,222 | ) | 279 | ||||||||||
| Non-cash equity compensation expense | 2,713 | 1,798 | 4,556 | 2,083 | ||||||||||||
Transaction costs(1) | 478 | 2,342 | 674 | 32,521 | ||||||||||||
| Depreciation and amortization | 29,118 | 24,321 | 57,135 | 43,155 | ||||||||||||
| Net unrealized loss (gain): | ||||||||||||||||
| Impairment of operating real estate | 10,124 | — | 10,124 | — | ||||||||||||
Provision for loan losses(2) | 119,062 | — | 119,062 | — | ||||||||||||
| Other unrealized loss (gain) | 883 | (2,898 | ) | 4,063 | (1,594 | ) | ||||||||||
| Provision for loan losses previously adjusted for Core Earnings (Loss) on loans foreclosed | (14,466 | ) | — | (49,975 | ) | — | ||||||||||
| Adjustments related to noncontrolling interests in investment entities | (1,738 | ) | (1,657 | ) | (2,916 | ) | (3,099 | ) | ||||||||
| Core Earnings attributable to Colony Credit Real Estate, Inc. common stockholders and noncontrolling interest of the Operating Partnership | $ | 36,264 | $ | 40,250 | $ | 48,068 | $ | 84,639 | ||||||||
Core Earnings per share(3) | $ | 0.28 | $ | 0.31 | $ | 0.37 | $ | 0.73 | ||||||||
Weighted average number of common shares and OP units(3) | 131,609 | 130,962 | 131,315 | 115,969 | ||||||||||||
| Six Months Ended June 30, 2020 | ||||||||||||||||||||||||||||||||
| Total | Legacy, Non-Strategic Portfolio | Core Portfolio | ||||||||||||||||||||||||||||||
| Net income (loss) attributable to Colony Credit Real Estate, Inc. common stockholders | $ | (305,831) | $ | (60,502) | $ | (245,329) | ||||||||||||||||||||||||||
| Adjustments: | ||||||||||||||||||||||||||||||||
| Net income (loss) attributable to noncontrolling interest of the Operating Partnership | (7,310) | (1,422) | (5,888) | |||||||||||||||||||||||||||||
| Non-cash equity compensation expense | 1,891 | 851 | 1,040 | |||||||||||||||||||||||||||||
| Transaction costs | 2,570 | 976 | 1,594 | |||||||||||||||||||||||||||||
| Depreciation and amortization | 30,893 | 10,448 | 20,445 | |||||||||||||||||||||||||||||
| Net unrealized loss (gain) on investments: | ||||||||||||||||||||||||||||||||
| Impairment of operating real estate and preferred equity | 30,064 | 30,064 | — | |||||||||||||||||||||||||||||
| Other Unrealized loss | 16,562 | 33 | 16,529 | |||||||||||||||||||||||||||||
| CECL reserves | 8,075 | (153) | 8,228 | |||||||||||||||||||||||||||||
| Losses on sales of real estate and preferred equity | 13,068 | 2,985 | 10,083 | |||||||||||||||||||||||||||||
| Adjustments related to noncontrolling interests | (9,016) | (8,705) | (311) | |||||||||||||||||||||||||||||
| Core Earnings (Loss) Legacy, Non-Strategic Earnings (Loss) attributable to Colony Credit Real Estate, Inc. common stockholders and noncontrolling interest of the Operating Partnership | $ | (219,034) | $ | (25,425) | $ | (193,609) | ||||||||||||||||||||||||||
Core Earnings (Loss) / Legacy, Non-Strategic Earnings (Loss) per share(1) | $ | (1.66) | $ | (0.19) | $ | (1.47) | ||||||||||||||||||||||||||
Weighted average number of common shares and OP units(1) | 131,615 | 131,615 | 131,615 | |||||||||||||||||||||||||||||
(1)We calculate Core Earnings (Loss) / Legacy, Non-Strategic Earnings (Loss) per share, a non-GAAP financial measure, based on a weighted-average number of common shares and OP units (held by members other than us or our subsidiaries). For the six months ended June 30, 2020, weighted average number of common shares includes 3.1 million OP units.
NOI and EBITDA
We believe NOI and EBITDA are useful measures of operating performance of our net leased and other real estate portfolios as they are more closely linked to the direct results of operations at the property level. NOI and EBITDA excludes historical cost depreciation and amortization, which are based on different useful life estimates depending on the age of the properties, as well as adjusts for the effects of real estate impairment and gains or losses on sales of depreciated properties, which eliminate differences arising from investment and disposition decisions. Additionally, by excluding corporate level expenses or benefits such as interest expense, any gain or loss on early extinguishment of debt and income taxes, which are incurred by the parent entity and are not directly linked to the operating performance of the Company’s properties, NOI and EBITDA provide a measure of operating performance independent of the Company’s capital structure and indebtedness. However, the exclusion of these items as well as others, such as capital expenditures and leasing costs, which are necessary to maintain the operating performance of the Company’s properties, and transaction costs and administrative costs, may limit the usefulness of NOI and EBITDA. NOI and EBITDA may fail to capture significant trends in these components of U.S. GAAP net income (loss) which further limits its usefulness.
NOI and EBITDA should not be considered as an alternative to net income (loss), determined in accordance with U.S. GAAP, as an indicator of operating performance. In addition, our methodology for calculating NOI involves subjective judgment and discretion and may differ from the methodologies used by other companies, when calculating the same or similar supplemental financial measures and may not be comparable with other companies.
105
The following tables present a reconciliation of net income (loss) attributable to our common stockholders to NOI/EBITDA attributable to our common stockholders (dollars in thousands) for the three and six months ended June 30, 2020:
| Three Months Ended June 30, 2020 | ||||||||||||||||||||||||||||||||
| Total | Legacy, Non-Strategic Portfolio | Core Portfolio | ||||||||||||||||||||||||||||||
| Net income (loss) attributable to Colony Credit Real Estate, Inc. common stockholders | $ | (21,237) | $ | (23,536) | $ | 2,299 | ||||||||||||||||||||||||||
| Adjustments: | — | |||||||||||||||||||||||||||||||
| Net income (loss) attributable to noncontrolling interest in investment entities | (7,295) | (7,520) | 225 | |||||||||||||||||||||||||||||
| Amortization of above- and below-market lease intangibles | (160) | 130 | (290) | |||||||||||||||||||||||||||||
| Interest expense on real estate | 11,816 | 3,733 | 8,083 | |||||||||||||||||||||||||||||
| Other income | 8,557 | (3) | 8,560 | |||||||||||||||||||||||||||||
| Transaction, investment and servicing expense | 144 | 140 | 4 | |||||||||||||||||||||||||||||
| Depreciation and amortization | 14,020 | 4,723 | 9,297 | |||||||||||||||||||||||||||||
| Impairment of operating real estate | 25,935 | 25,935 | — | |||||||||||||||||||||||||||||
| Administrative expense | 138 | 16 | 122 | |||||||||||||||||||||||||||||
| Other (gain) loss on investments, net | (4,555) | 4,001 | (8,556) | |||||||||||||||||||||||||||||
| Income tax benefit | (99) | — | (99) | |||||||||||||||||||||||||||||
| NOI/EBITDA attributable to noncontrolling interest in investment entities | (1,928) | (465) | (1,463) | |||||||||||||||||||||||||||||
| Total NOI/EBITDA attributable to Colony Credit Real Estate, Inc. common stockholders | $ | 25,336 | $ | 7,154 | $ | 18,182 | ||||||||||||||||||||||||||
| Six Months Ended June 30, 2020 | ||||||||||||||||||||||||||||||||
| Total | Legacy Non-Strategic Portfolio | Core Portfolio | ||||||||||||||||||||||||||||||
| Net income (loss) attributable to Colony Credit Real Estate, Inc. common stockholders | $ | (21,117) | $ | (26,612) | $ | 5,495 | ||||||||||||||||||||||||||
| Adjustments: | ||||||||||||||||||||||||||||||||
| Net income (loss) attributable to noncontrolling interest in investment entities | (7,150) | (7,310) | 160 | |||||||||||||||||||||||||||||
| Amortization of above- and below-market lease intangibles | (564) | (269) | (295) | |||||||||||||||||||||||||||||
| Interest expense on real estate | 24,885 | 8,350 | 16,535 | |||||||||||||||||||||||||||||
| Other income | (723) | (264) | (459) | |||||||||||||||||||||||||||||
| Transaction, investment and servicing expense | 344 | 197 | 147 | |||||||||||||||||||||||||||||
| Depreciation and amortization | 31,996 | 11,546 | 20,450 | |||||||||||||||||||||||||||||
| Impairment of operating real estate | 30,061 | 30,061 | — | |||||||||||||||||||||||||||||
| Administrative expense | 229 | 25 | 204 | |||||||||||||||||||||||||||||
| Other (gain) loss on investments, net | (822) | 3,651 | (4,473) | |||||||||||||||||||||||||||||
| Income tax benefit | (296) | — | (296) | |||||||||||||||||||||||||||||
| NOI/EBITDA attributable to noncontrolling inters in investment entities | (4,072) | (1,289) | (2,783) | |||||||||||||||||||||||||||||
| Total NOI/EBITDA attributable to Colony Credit Real Estate, Inc. common stockholders | $ | 52,771 | $ | 18,086 | $ | 34,685 | ||||||||||||||||||||||||||
Liquidity and Capital Resources
Overview
Our primary liquidity needs include commitments to repay borrowings, finance our assets and operations, meet future funding obligations, make distributions to our stockholders repurchase our shares and fund other general business needs. We use significant cash to make additional investments, meet commitments to existing investments, repay the principal of and interest on our borrowings and pay other financing costs, make distributions to our stockholders and fund our operations, which includes making payments to our Manager in accordance with the management agreement.
106
Our primary sources of liquidity include cash on hand, cash generated from our operating activities and cash generated from asset sales and investment maturities. However, subject to maintaining our qualification as a REIT and our Investment Company Act exclusion, we may use a number ofseveral sources to finance our business, including bank credit facilities (including term loans and revolving facilities), master repurchase facilities and securitizations, as described below. In addition to our current sources of liquidity, we havethere may be opportunities from time to time to access to liquidity through public offerings of debt and equity securities. We also expect to investinvested in a number
of our assets through co-investments with other investment vehicles managed by affiliates of our Manager and/or other third parties, which has and may allow us to pool capital to access larger transactions and diversify investment exposure.
Financing Strategy
We have a multi-pronged financing strategy that includes an up to $560$450 million secured revolving credit facility, up to approximately $2.3 billion in secured revolving repurchase facilities, non-recourse securitization financing, commercial mortgages and other asset-level financing structures. In addition, we may use other forms of financing, including additional warehouse facilities, public and private secured and unsecured debt issuances and equity or equity-related securities issuances by us or our subsidiaries. We may also finance a portion of our investments through the syndication of one or more interests in a whole loan or securitization. We will seek to match the nature and duration of the financing with the underlying asset’s cash flow, including through the use ofusing hedges, as appropriate.
Debt-to-Equity Ratio
The following table presents our debt-to-equity ratio:
| June 30, | December 31, | |||||||||||||
Debt-to-equity ratio(1) | ||||||||||||||
| Total Sources of Corporate Liquidity | ||||
| Cash and cash equivalents | $ | 59,838 | ||
| Bank credit facility availability | 338,500 | |||
| Total sources of corporate liquidity | $ | 398,338 | ||
Potential Sources of Liquidity
Bank Credit Facilities
We use bank credit facilities (including term loans and revolving facilities) to finance our business. These financings may be collateralized or non-collateralized and may involve one or more lenders. Credit facilities typically have maturities ranging from two to five years and may accrue interest at either fixed or floating rates.
On February 1, 2018, the OP (together with certain subsidiaries of the OP from time to time party thereto as borrowers, collectively, the “Borrowers”) entered into a credit agreement (the “Bank Credit Facility”) with JPMorgan Chase Bank, N.A., as administrative agent, and the several lenders from time to time party thereto (the “Lenders”), pursuant to which the Lenders agreed to provide a revolving credit facility in the aggregate principal amount of up to $400.0 million. On December 17, 2018, the aggregate amount of revolving commitments was increased to $525.0 million and on February 4, 2019, the aggregate amount of revolving commitments was increased to $560.0 million. On May 6, 2020 these commitments were reduced to $450.0 million.
Advances under the Bank Credit Facility accrue interest at a per annum rate equal to, at the applicable Borrower’s election, either a LIBOR rate plus a margin of 2.25%, or a base rate determined according to a prime rate or federal funds rate plus a margin of 1.25%. An unused commitment fee at a rate of 0.25% or 0.35%, per annum, depending on the amount of facility utilization, applies to un-utilized borrowing capacity under the Bank Credit Facility. Amounts owing under the Bank Credit Facility may be prepaid at any time without premium or penalty, subject to customary breakage costs in the case of borrowings with respect to which a LIBOR rate election is in effect.
The maximum amount available for borrowing at any time under the Bank Credit Facility is limited to a borrowing base valuation of certain investment assets, with the valuation of such investment assets generally determined according to a percentage of adjusted net book value. As of the date hereof, the borrowing base valuation is sufficient to support the outstanding borrowings. The Bank Credit Facility will mature on February 1, 2022, unless the OP elects to exercise the extension options for up to two additional terms of six months each, subject to the terms and conditions in the Bank Credit Facility, resulting in a latest maturity date of February 1, 2023.
The obligations of the Borrowers under the Bank Credit Facility are guaranteed by substantially all material wholly owned subsidiaries of the OP pursuant to a Guarantee and Collateral Agreement with the OP and certain subsidiaries of the OP in favor of JPMorgan Chase Bank, N.A., as administrative agent (the “Guarantee and Collateral Agreement”) and, subject to certain exceptions, secured by a pledge of substantially all equity interests owned by the Borrowers and the guarantors, as well as by a
107
security interest in deposit accounts of the Borrowers and the Guarantors (as such terms are defined in the Guarantee and Collateral Agreement) in which the proceeds of investment asset distributions are maintained.
The Bank Credit Facility contains various affirmative and negative covenants, including, among other things, the obligation of the Company to maintain REIT status and be listed on the NYSE, and limitations on debt, liens and restricted payments. In addition, the Bank Credit Facility includes the following financial covenants applicable to the OP and its consolidated subsidiaries: (a) consolidated tangible net worth of the OP must be greater than or equal to the sum of (i) $2.105$1.5 billion and (ii) 50%75% of the proceeds received by the OP from any offering of its common equity and of the proceeds from any offering by the Company of its common equity to the extent such proceeds are contributed to the OP, excluding any such proceeds that are contributed to the OP within ninety (90) days of receipt and applied to acquire capital stock of the OP; (b) the OP’s earnings before interest, income tax, depreciation, and amortization plus lease expenses to fixed charges for any period of four (4) consecutive fiscal quarters must be not less than 1.50 to 1.00; (c) the OP’s interest coverage ratio must be not less than 3.00 to 1.00; and (d) the OP’s ratio of consolidated total debt to consolidated total assets must be not more than 0.70 to 1.00. The Bank Credit Facility also includes customary events of default, including, among other things, failure to make payments when due, breach of covenants or representations, cross default to material indebtedness or material judgment defaults, bankruptcy matters involving any Borrower or any Guarantor and certain change of control events. Further, we may not make distributions in excess of amounts required to maintain REIT status and may not repurchase shares, among other provisions. The occurrence of an event of default will limit the ability of the OP and its subsidiaries to make distributions and may result in the termination of the credit facility, acceleration of repayment obligations and the exercise of remedies by the Lenders with respect to the collateral.
Refer to “COVID-19 Impact on Liquidity” below for further discussion regarding the COVID-19 pandemic and its impact on our future operating results, liquidity and financial condition.
Master Repurchase Facilities and CMBS Credit Facilities
Currently, our primary source of financing is our master repurchase facilities,Master Repurchase Facilities, which we use to finance the origination of senior loans, and CMBS credit facilities,Credit Facilities, which we use to finance the purchase of securities. Repurchase agreements effectively allow us to borrow against loans, participations and securities that we own in an amount generally equal to (i) the market value of such loans, participations and/or securities multiplied by (ii) the applicable advance rate. Under these agreements, we sell our loans, participations and securities to a counterparty and agree to repurchase the same loans and securities from the counterparty at a price equal to the original sales price plus an interest factor. During the term of a repurchase agreement, we receive the principal and interest on the related loans, participations and securities and pay interest to the lender under the master repurchase agreement. We intend to maintain formal relationships with multiple counterparties to obtain master repurchase financing on favorable terms.
Refer to “COVID-19 Impact on Liquidity” below regarding for further discussion regarding the COVID-19 pandemic and its impact on our future operating results, liquidity and financial condition.
108
The following table presents a summary of our master repurchase facilitiesMaster Repurchase, CMBS and Bank Credit Facilities as of June 30, 20192020 (dollars in thousands):
| Maximum Facility Size | Current Borrowings | Weighted Average Final Maturity (Years) | Weighted Average Interest Rate | Maximum Facility Size | Current Borrowings | Weighted Average Final Maturity (Years) | Weighted Average Interest Rate | |||||||||||||||||||||||||||||||||
| Master Repurchase Facilities | Master Repurchase Facilities | |||||||||||||||||||||||||||||||||||||||
| Bank 1 | $ | 400,000 | $ | 197,265 | 3.8 | LIBOR + 1.90% | Bank 1 | $ | 400,000 | $ | 104,559 | 2.8 | LIBOR + 1.91% | |||||||||||||||||||||||||||
| Bank 2 | 200,000 | 22,750 | 3.3 | LIBOR + 2.50% | Bank 2 | 200,000 | 21,353 | 2.3 | LIBOR + 2.50% | |||||||||||||||||||||||||||||||
| Bank 3 | 600,000 | 505,212 | 1.8 | LIBOR + 2.24% | Bank 3 | 600,000 | 207,176 | 1.8 | LIBOR + 2.15% | |||||||||||||||||||||||||||||||
| Bank 7 | 500,000 | 424,025 | 2.8 | LIBOR + 1.91% | Bank 7 | 500,000 | 181,396 | 1.8 | LIBOR + 1.93% | |||||||||||||||||||||||||||||||
| Bank 8 | 250,000 | 164,977 | 2.0 | LIBOR + 2.00% | Bank 8 | 250,000 | 152,337 | 1.0 | LIBOR + 2.00% | |||||||||||||||||||||||||||||||
| Bank 9 | 300,000 | 66,643 | 4.3 | LIBOR + 1.65% | Bank 9 | 300,000 | — | 3.3 | — | |||||||||||||||||||||||||||||||
| Total Master Repurchase Facilities | 2,250,000 | 1,380,872 | Total Master Repurchase Facilities | 2,250,000 | 666,821 | |||||||||||||||||||||||||||||||||||
| CMBS Credit Facilities | CMBS Credit Facilities | |||||||||||||||||||||||||||||||||||||||
| Bank 1 | 38,163 | 38,163 | (1 | ) | LIBOR + 1.16% | |||||||||||||||||||||||||||||||||||
Bank 1(2) | Bank 1(2) | — | — | — | — | |||||||||||||||||||||||||||||||||||
| Bank 6 | 168,255 | 168,255 | (1 | ) | LIBOR + 1.19% | Bank 6 | 38,352 | 38,352 | (1) | 4.25% | ||||||||||||||||||||||||||||||
Bank 3(2) | — | — | — | — | Bank 3(2) | — | — | — | — | |||||||||||||||||||||||||||||||
Bank 4(2) | — | — | — | — | Bank 4(2) | — | — | — | — | |||||||||||||||||||||||||||||||
Bank 5(2) | — | — | — | — | Bank 5(2) | — | — | — | — | |||||||||||||||||||||||||||||||
| Total CMBS Credit Facilities | 206,418 | 206,418 | Total CMBS Credit Facilities | 38,352 | 38,352 | |||||||||||||||||||||||||||||||||||
| Bank Credit Facility | 560,000 | 221,500 | 3.6 | LIBOR + 2.25% | Bank Credit Facility | 450,000 | 195,000 | 2.8 | LIBOR + 2.25% | |||||||||||||||||||||||||||||||
| Total Facilities | $ | 3,016,418 | $ | 1,808,790 | Total Facilities | $ | 2,738,352 | $ | 900,173 | |||||||||||||||||||||||||||||||
(1) | (2)Amounts can be drawn under the Bank 1, Bank 3, Bank 4, and Bank 5 CMBS Credit Facilities, but we are not utilizing them. |
Securitizations
We may seek to utilize non-recourse long-term securitizations of our investments in mortgage loans, especially loan originations, to the extent consistent with the maintenance of our REIT qualification and exclusion from the Investment Company Act in order to generate cash for funding new investments. This would involve conveying a pool of assets to a special purpose vehicle (or the issuing entity), which would issue one or more classes of non-recourse notes pursuant to the terms of an indenture. The notes would be secured by the pool of assets. In exchange for the transfer of assets to the issuing entity, we would receive the cash proceeds on the sale of non-recourse notes and a 100% interest in the equity of the issuing entity. The securitization of our portfolio investments might magnify our exposure to losses on those portfolio investments because any equity interest we retain in the issuing entity would be subordinate to the notes issued to investors and we would, therefore, absorb all of the losses sustained with respect to a securitized pool of assets before the owners of the notes experience any losses.
In October 2019, we executed a securitization transaction through our subsidiaries, CLNC 2019-FL1, which resulted in the sale of $840 million of investment grade notes. The securitization reflects an advance rate of 83.5% at a weighted average cost of funds of LIBOR plus 1.59%, and is collateralized by a pool of 22 senior loans, which we originated.
CLNC 2019-FL1 includes a two-year reinvestment feature that allows us to contribute existing or newly originated loan investments in exchange for proceeds from repayments or repurchases of loans held in CLNC 2019-FL1, subject to the satisfaction of certain conditions set forth in the indenture. In addition to existing eligible loans available for reinvestment, the continued origination of securitization eligible loans is required to ensure that we reinvest the available proceeds within CLNC 2019-FL1.
Additionally, CLNC 2019-FL1 contains note protection tests that can be triggered as a result of contributed loan defaults, losses, and certain other events outlined in the indenture, beyond established thresholds. A note protection test failure that is not remedied can result in the redirection of interest proceeds from the below investment grade tranches to amortize the most senior outstanding tranche. While we continue to closely monitor all loan investments contributed to CLNC 2019-FL1, a deterioration in the performance of an underlying loan could negatively impact our liquidity position.
Refer to “COVID-19 Impact on Liquidity” below regarding for further discussion regarding the COVID-19 pandemic and its impact on our future operating results, liquidity and financial condition.
109
Other potential sources of financing
In the future, we may also use other sources of financing to fund the acquisition of our target assets, including secured and unsecured forms of borrowing and selective wind-down and dispositions of assets. We may also seek to raise equity capital or issue debt securities in order to fund our future investments.
Refer to “COVID-19 Impact on Liquidity” below for discussion on the 5-Investment Preferred Financing we obtained during the quarter ended June 30, 2020.
COVID-19 Impact on Liquidity
The most notable impact relates to the financial condition of our borrowers and their ability to make their monthly mortgage payments and remain in compliance with loan covenants and terms. Failure of our borrowers to meet their loan obligations may trigger repayments to our Bank Credit and Master Repurchase Facilities.
Secondly, if our operating real estate lessees are unable to make monthly rent payments, we would be unable to make our monthly mortgage payments which could result in defaults under these obligations or trigger repayments under our Bank Credit Facility. If these events were to occur, we may not have sufficient available cash to repay amounts due.
During the three months ended March 31, 2020, concurrent with the onset of the COVID-19 pandemic, we drew $226.5 million on our bank facility and ended such quarter with $340.0 million outstanding and $29.0 million of availability and reported $255 million cash on hand as of May 7, 2020.
As of August 6, 2020, we have approximately $325 million cash on hand and $200.0 million of availability under our bank facility.
During the three months ended June 30, 2020 and through August 6, 2020, we have accomplished the following:
Bank Credit Facility
Given the ongoing impact of the COVID-19 pandemic to the underlying value of our investments, and related uncertainty in our ability to meet certain financial covenants, during the second quarter we amended our Bank Credit Facility to: (i) reduce the minimum tangible net worth covenant requirement from $2.1 billion to $1.5 billion, providing portfolio management flexibilities as a result of any disruptions in investments caused by COVID-19 or other factors; (ii) reduce the facility size from $560.0 million to $450.0 million; (iii) limit dividends in line with taxable income and restrict stock repurchases, each for liquidity preservation purpose; and (iv) focus new investments on senior mortgages.
Master Repurchase Facilities
We amended the minimum tangible net worth covenant under all six of our Master Repurchase Facilities consistent with the Bank Credit Facility. During the first quarter of 2020, we received and timely paid a margin call on a hospitality loan and made voluntarily paydowns on two other hospitality and one retail loan. The lender granted us a holiday from future margin calls between three and four months, and we obtained broader discretion to enter in to permitted modifications with the borrowers on these three specific loans, if necessary.
In May, we entered into agreements to modify two of our master repurchase facilities pursuant to which we reduced facility advances corresponding to ten senior mortgage loans financed under such facilities.We and our lender counterparties agreed to temporary modifications providing for six-month holidays from future margin calls before further margin calls are possible, as well as providing additional protections before certain repurchase obligations may be triggered.We were also provided broader discretion to negotiate with our borrowers to implement certain modifications to the underlying loans during such period.
As a result, these six-month holiday periods cover $277 million, or 45%, of the outstanding $610 million of senior loan master repurchase facility indebtedness as of the date hereof.
While we continue to engage in discussions with our Master Repurchase Facility lenders, it is uncertain whether we will we reach any future agreement due to the limited and temporary holiday and permitted modification periods described above, and the continuing impact of the COVID-19 pandemic. As such, we may receive additional margin calls, experience additional pressures or events of default under our financing agreements that will negatively impact our liquidity position.
CMBS Credit Facilities
During the first quarter, we received and paid margin calls on our CMBS Credit Facilities of $48.9 million. During the second quarter, we consolidated our CMBS Credit Facilities borrowings with one existing counterparty bank. In connection with the
110
consolidation, we paid down the CMBS Credit Facilities borrowing advance rate to a blended borrowing advance rate of 62% and extended the repurchase date on all such borrowings first to June 30, 2020 and then to December 31, 2020. This $73.9 million paydown allowed for a 15% additional loss on a bond specific basis before further margin calls. As of August 6, 2020, we had $38.4 million outstanding under our CMBS Credit Facilities. The financing bears a fixed interest rate of 4.25%.
5-Investment Preferred Financing
On June 5, 2020, we accepted preferred financing of up to $229 million (on a portfolio of five of our underlying investment interests) (the “5-Investment Preferred Financing”) from investment vehicles managed by Goldman Sachs (“GS”). The financing included $200 million of proceeds at closing. The unsecured financing provides GS a 10% preferred return and a minority interest in future cash flows following certain minimum returns on the preferred financing investment.
The portfolio financing is limited to (i) our interests in four co-investments alongside investment funds managed by affiliates of our manager, each of which are financings on underlying development projects (including residential, office and/or mixed-use components), and (ii) a wholly-owned triple-net industrial distribution center investment leased to a national grocery chain.
We and our affiliates control the continuing investment and portfolio management of such investments and are consolidated on our consolidated balance sheet at June 30, 2020. The preferred financing provides for a disproportionate allocation of profits and losses and the share of income or loss is determined using a balance sheet approach known as the hypothetical liquidation at book value (“HLBV”) method. Under the HLBV method, earnings and losses are recognized based on how an entity would allocate and distribute its cash if it were to sell all of its assets and settle its liabilities for their carrying amounts and liquidate at the reporting date. Under the HLBV method, we could record, in any period, more or less income than may be generated in the case of an actual liquidation. The noncontrolling interest in investment entities on our consolidated balance sheet includes $270.7 million representing GS’s investment at June 30, 2020 under the HLBV method. The preferred financing resulted in a reduction in stockholders’ equity of approximately $70.0 million.
The transaction resulted in us receiving net liquidity of approximately $170 million, net of approximately $30 million in paydowns under the Company’s corporate credit facility, and the ability to draw down up to $29 million additional commitments from GS for future fundings to the portfolio, if any, at our same advance rate.
We also continue to assess capital needs in our owned real estate portfolio (both Core and Legacy, Non-Strategic) where we expect to limit any investment of additional capital.
Investment Sales
During the six months ended June 30, 2020 and through August 6, 2020, we sold or received a discounted pay-off for 13 loans, sold nine owned real estate assets and sold 27 CRE debt securities generating net proceeds of $239.4 million and $182.0 million from our Core and Legacy, Non-Strategic segments, respectively.
We currently classify 28 owned real estate properties as held for sale with a total net carrying value of $632.6 million at June 30, 2020. While we have agreements to sell or are proceeding with active marketing, the ongoing uncertainty surrounding the COVID-19 pandemic may result in us being unable to sell or complete the sale of these properties in the near to medium-term. Further, any completed sales may result in an investment loss.
Additionally, we continue to evaluate asset sales from our Core Portfolio. While these sales are expected to generate liquidity, completion of these sales is uncertain and may result in lower than expected proceeds or an investment loss.
Dividend
The COVID-19 pandemic has caused extraordinary volatility and unprecedented market conditions, including actual and unanticipated consequences to us and certain of our investments, which may continue. Having paid monthly dividend payments with respect to our common stock through March 31, 2020, we and the Board of Directors determined it was prudent and in our best interests to conserve available liquidity and suspend our monthly dividend beginning with the monthly period ending April 30, 2020. The Board of Directors will evaluate dividends in future periods based upon customary considerations, including market conditions. Importantly, we continue to monitor its taxable income to ensure that we meet the minimum distribution requirements to maintain its status as a REIT for the annual period ending December 31, 2020.
Earnings
While we have generated liquidity and reduced our financing exposures, the Core Portfolio assets sold to date along with those under contract, will result in a material impact on future earnings.
The decisive steps taken to protect the balance sheet and generate liquidity, position us to address further market and investment deterioration related to COVID-19. Asset and liability management and liquidity remain our primary focus. Our focus will shift
111
toward new investment and growth initiatives when circumstances related to COVID-19 improve sufficiently to reduce exposure to further liquidity demands.
Cash Flows
The following presents a summary of our consolidated statements of cash flows for the six months ended June 30, 20192020 and 20182019 (dollars in thousands):
| Six Months Ended June 30, | Six Months Ended June 30, | ||||||||||||||||||||||||||||||||||||||||
| Cash flow provided by (used in): | 2019 | 2018 | Change | Cash flow provided by (used in): | 2020 | 2019 | Change | ||||||||||||||||||||||||||||||||||
| Operating activities | $ | 63,145 | $ | 28,916 | $ | 34,229 | Operating activities | $ | 29,567 | $ | 63,145 | $ | (33,578) | ||||||||||||||||||||||||||||
| Investing activities | (421,291 | ) | 171,927 | (593,218 | ) | Investing activities | 449,827 | (421,291) | 871,118 | ||||||||||||||||||||||||||||||||
| Financing activities | 344,663 | 3,895 | 340,768 | Financing activities | (152,159) | 344,663 | (496,822) | ||||||||||||||||||||||||||||||||||
Operating Activities
Cash inflows from operating activities are generated primarily through interest received from loans receivable and securities, property operating income from our real estate portfolio, and distributions of earnings received from unconsolidated ventures. This is partially offset by payment of interest expenses for credit facilities and mortgage payable, and operating expenses supporting our various lines of business, including property management and operations, loan servicing and workout of loans in default, investment transaction costs, as well as general administrative costs.
Our operating activities generated net cash inflows of $63.1$29.6 million and $28.9$63.1 million for the six months ended June 30, 20192020 and 2018,2019, respectively. Net cash provided by operating activities increased $34.2decreased $33.6 million for the six months ended June 30, 2020 compared to the six months ended June 30, 2019, primarily due to higher transaction fees paid associated with the Combinationlower property operating income earned resulting from sales of real estate properties during the six months ended June 30, 2018.2020.
We believe cash flows from operations, available cash balances and our ability to generate cash through short- and long-term borrowings are sufficient to fund our operating liquidity needs.
Investing Activities
Investing activities include cash outlays for acquisition of real estate, disbursements on new and/or existing loans, and contributions to unconsolidated ventures, which are partially offset by repayments and sales of loan receivables, distributions of capital received from unconsolidated ventures, proceeds from sale of real estate, as well as proceeds from maturity or sale of securities.
Investing activities generated net cash inflows of $449.8 million and used net cash outflows of $421.3 million for the six months ended June 30, 2020 and 2019, respectively. Net cash provided by investing activities in 2020 resulted primarily from proceeds from sale of real estate of $161.8 million, repayment on loan and preferred equity held for investment of $160.1 million, proceeds from sale of investments in unconsolidated ventures of $100.0 million, proceeds from sale of real estate securities, available for sale of $89.7 million, and proceeds from sale of loans held for sale of $32.6 million, partially offset by future fundings on our loans and preferred equity held for investment, net of $66.7 million, and contributions to investments in unconsolidated ventures of $47.5 million.
Net cash flows used in investing activities of $421.3 million for the six months ended June 30, 2019 was primarily driven by $886.4 million of acquisition, origination and funding of loans and preferred equity held for investment partially offset by $287.4 million of loan and preferred equity repayments, and $119.5 million of distributions in excess of cumulative earnings from unconsolidated ventures.
Financing Activities
We finance our investing activities largely through borrowings secured by our investments along with capital from third party or affiliated coinvestors.co-investors. We also have the ability to raise capital in the public markets through issuances of common stock, as well as draw upon our corporate credit facility, to finance our investing and operating activities. Accordingly, we incur cash outlays for payments on third party debt, dividends to our common stockholders as well as distributions to our noncontrolling interests.
112
Our financing activities provided net cash inflow of $344.7 million and $3.9 million for the six months ended June 30, 2019 and 2018, respectively.2019. Net cash provided by financing activities in 2019 resulted primarily from borrowings from credit facilities in the amount of $1.4 billion and borrowings from mortgage notes in the amount of $85.5 million, partially offset by repayment of credit facilities in the amount of $977.7 million, distributions paid on common stock and noncontrolling interests of $114.2 million and repayment of securitization bonds of $58.0 million.
Contractual Obligations, Commitments and Contingencies of the Company
The following table sets forth the known contractual obligations of the Company on an undiscounted basis. This table excludes obligations of the Company that are not fixed and determinable, including the Management Agreement (dollars in thousands):
| Payments Due by Period | Payments Due by Period | |||||||||||||||||||||||||||||||||||||||||||||||||||||||||||||||||||||||||||
| Total | Less than a Year | 1-3 Years | 3-5 Years | More than 5 Years | Total | Less than a Year | 1-3 Years | 3-5 Years | More than 5 Years | |||||||||||||||||||||||||||||||||||||||||||||||||||||||||||||||||||
Bank credit facility(1) | $ | 254,129 | $ | 11,485 | $ | 242,644 | $ | — | $ | — | Bank credit facility(1) | $ | 210,623 | $ | 5,977 | $ | 204,646 | $ | — | $ | — | |||||||||||||||||||||||||||||||||||||||||||||||||||||||
Secured debt(2) | 3,344,583 | 1,182,494 | 772,302 | 325,104 | 1,064,683 | Secured debt(2) | 2,216,244 | 662,135 | 321,443 | 544,262 | 688,404 | |||||||||||||||||||||||||||||||||||||||||||||||||||||||||||||||||
Securitization bonds payable(3) | 23,383 | 23,383 | — | — | — | Securitization bonds payable(3) | 935,691 | 30,842 | 370,807 | 534,042 | — | |||||||||||||||||||||||||||||||||||||||||||||||||||||||||||||||||
Ground lease obligations(4) | 38,600 | 3,129 | 6,242 | 5,432 | 23,797 | Ground lease obligations(4) | 35,255 | 3,178 | 6,396 | 5,095 | 20,586 | |||||||||||||||||||||||||||||||||||||||||||||||||||||||||||||||||
| 3,660,695 | $ | 1,220,491 | $ | 1,021,188 | $ | 330,536 | $ | 1,088,480 | $ | 3,397,813 | $ | 702,132 | $ | 903,292 | $ | 1,083,399 | $ | 708,990 | ||||||||||||||||||||||||||||||||||||||||||||||||||||||||||
Lending commitments(5) | 237,586 | Lending commitments(5) | 296,722 | |||||||||||||||||||||||||||||||||||||||||||||||||||||||||||||||||||||||||
| Total | $ | 3,898,281 | Total | $ | 3,694,535 | |||||||||||||||||||||||||||||||||||||||||||||||||||||||||||||||||||||||
(1)Future interest payments were estimated based on the applicable index at June 30, 2020 and unused commitment fee of 0.35% per annum, assuming principal is repaid on the current maturity date of February 2022.
(2)Amounts include minimum principal and interest obligations through the initial maturity date of the collateral assets. Interest on floating rate debt was determined based on the applicable index at June 30, 2020.
(3)The timing of future principal payments was estimated based on expected future cash flows of underlying collateral loans. Repayments are estimated to be earlier than contractual maturity only if proceeds from underlying loans are repaid by the borrowers.
(4)The Company assumed noncancelable operating ground leases as lessee or sublessee in connection with net lease properties acquired through the CLNY Contributions. The amounts represent minimum future base rent commitments through initial expiration dates of the respective leases, excluding any contingent rent payments. Rents paid underground leases are recoverable from tenants.
(5)Future lending commitments may be subject to certain conditions that borrowers must meet to qualify for such fundings. Commitment amount assumes future fundings meet the terms to qualify for such fundings.
Guarantees and Off-Balance Sheet Arrangements
As of June 30, 2019,2020, we arewere not dependent on the use of any off-balance sheet financing arrangements for liquidity. We have made investments in unconsolidated ventures. Refer to Note 5, “InvestmentsOur investments in Unconsolidated Ventures”unconsolidated joint ventures consisted of investments in Part I, Item 1. “Financial Statements”PE Investments, senior loans, mezzanine loans and preferred equity held in joint ventures, as well as acquisition, development and construction arrangements accounted for a discussion of such unconsolidated ventures in our consolidated financial statements.as equity method investments. In each case, our exposure to loss is limited to the carrying value of our investment.
Our Investment Strategy
Our objective is to generate consistent and attractive risk-adjusted returns to our stockholders. We seek to achieve this objective primarily through cash distributions and the preservation of invested capital and secondarily through capital appreciation. We believe our diversified investment strategy across the CRE capital stack provides flexibility through economic cycles to achieve attractive risk-adjusted returns. This approach is driven by a disciplined investment strategy, focused on:
•capitalizing on asset level underwriting experience and market analytics to identify investments with pricing dislocations and attractive risk-return profiles;
•originating and structuring CRE senior mortgage loans, mezzanine loans and preferred equity with attractive return profiles relative to the underlying value and financial operating performance of the real estate collateral, given the strength and quality of the sponsorship;
•identifying appropriate CRE debt securities investments based on the performance of the underlying real estate assets, the impact of such performance on the credit return profile of the investments and our expected return on the investments;
•identifying net leased real estate investments based on property location and purpose, tenant credit quality, market lease rates and potential appreciation of, and alternative uses for, the real estate;
•creating capital appreciation opportunities through active asset management and equity participation opportunities; and
113
•structuring transactions with a prudent amount of leverage, if any, given the risk of the underlying asset’s cash flows, attempting to match the structure and duration of the financing with the underlying asset’s cash flows, including through the use of hedges, as appropriate.
The period for which we intend to hold our investments will vary depending on the type of asset, interest rates, investment performance, micro and macro real estate environment, capital markets and credit availability, among other factors. We generally expect to hold debt investments until the stated maturity and equity investments in accordance with each investment’s proposed business plan. We may sell all or a partial ownership interest in an investment before the end of the expected holding period if we believe that market conditions have maximized its value to us or the sale of the asset would otherwise be in the best interests of our stockholders.
Our investment strategy is dynamic and flexible, enabling us to adapt to shifts in economic, real estate and capital market conditions and to exploit market inefficiencies. We may expand or change our investment strategy or target assets over time in response to opportunities available in different economic and capital market conditions. This flexibility in our investment strategy allows us to employ a customized, solutions-oriented approach, which we believe is attractive to borrowers and tenants. We believe that our diverse portfolio, our ability to originate, acquire and manage our target assets and the flexibility of our investment strategy positions us to capitalize on market inefficiencies and generate attractive long-term risk-adjusted returns for our stockholders through a variety of market conditions and economic cycles.
We have not acquired any investments in 2020 and currently are primarily focused on existing investments and commitments.
Underwriting, Asset and Risk Management
Our Manager closely monitors our portfolio and actively manages risks associated with, among other things, our assets and interest rates. Prior to investing in any particular asset, our Manager’s underwriting team, in conjunction with third party providers, undertakes a rigorous asset-level due diligence process, involving intensive data collection and analysis, to ensure that we understand fully the state of the market and the risk-reward profile of the asset. Prior to making a final investment decision, our Manager focuses on portfolio diversification to determine whether a target asset will cause our portfolio to be too heavily concentrated with, or cause too much risk exposure to, any one borrower, real estate sector, geographic region, source of cash flow for payment or other geopolitical issues. If our Manager determines that a proposed acquisition presents excessive concentration risk, it may determine not to acquire an otherwise attractive asset.
For each asset that we acquire, our Manager’s asset management team engages in active management of the asset, the intensity of which depends on the attendant risks. The asset manager works collaboratively with the underwriting team to formulate a strategic plan for the particular asset, which includes evaluating the underlying collateral and updating valuation assumptions to reflect changes in the real estate market and the general economy. This plan also generally outlines several strategies for the asset to extract the maximum amount of value from each asset under a variety of market conditions. Such strategies may vary depending on the type of asset, the availability of refinancing options, recourse and maturity, but may include, among others, the restructuring of non-performing or sub-performing loans, the negotiation of discounted pay-offs or other modification of the terms governing a loan, and the foreclosure and management of assets underlying non-performing loans in order to reposition them for profitable disposition. Our Manager and its affiliates will continuously track the progress of an asset against the original business plan to ensure that the attendant risks of continuing to own the asset do not outweigh the associated rewards. Under these circumstances, certain assets will require intensified asset management in order to achieve optimal value realization.
Our Manager’s asset management team engages in a proactive and comprehensive on-going review of the credit quality of each asset it manages. In particular, for debt investments on at least an annual basis, the asset management team will evaluate the financial wherewithal of individual borrowers to meet contractual obligations as well as review the financial stability of the assets securing such debt investments. Further, there is ongoing review of borrower covenant compliance including the ability of borrowers to meet certain negotiated debt service coverage ratios and debt yield tests. For equity investments, the asset management team, with the assistance of third partythird-party property managers, monitors and reviews key metrics such as occupancy, same store sales, tenant payment rates, property budgets and capital expenditures. If through this analysis of credit quality, the asset management team encounters declines in credit not in accord with the original business plan, the team evaluates the risks and determine what changes, if any, are required to the business plan to ensure that the attendant risks of continuing to hold the investment do not outweigh the associated rewards.
In addition, the audit committee of our boardBoard of directors,Directors, in consultation with management, periodically reviews our policies with respect to risk assessment and risk management, including key risks to which we are subject, including credit risk, liquidity risk and market risk, and the steps that management has taken to monitor and control such risks.
114
Inflation
Virtually all of our assets and liabilities are interest rate sensitive in nature. As a result, interest rates and other factors influence our performance significantly more than inflation does. A change in interest rates may correlate with the inflation rate. Substantially all of the leases at our multifamily and student housing properties allow for monthly or annual rent increases which provide us with the opportunity to achieve increases, where justified by the market, as each lease matures. Such types of leases generally minimize the risks of inflation on our multifamily and student housing properties.
Refer to Item 3, “Quantitative and Qualitative Disclosures About Market Risk” for additional details.
Critical Accounting Policies
Our consolidated financial statements are prepared in accordance with accounting principles generally accepted in the United States, or U.S. GAAP, which requires the use of estimates and assumptions that involve the exercise of judgment and that affect the reported amounts of assets and liabilities at the date of the consolidated financial statements and the reported amounts of revenues and expenses during the reporting period. There have been no material changes to our critical accounting policies since the filing of our Annual Report on Form 10-K for the fiscal year ended December 31, 2018.2019.
Recent Accounting Updates
For recent accounting updates, refer to Note 2, “Summary of Significant Accounting Policies” in our accompanying consolidated financial statements included in Part I, Item 1, “Financial Statements.”
Item 3. Quantitative and Qualitative Disclosures About Market Risk
Our primary market risks are interest rate risk, prepayment risk, extension risk, credit risk, real estate market risk, capital market risk and foreign currency risk, either directly through the assets held or indirectly through investments in unconsolidated ventures.ventures, with each risk heightened as a result of the ongoing and numerous adverse impacts of the COVID-19 pandemic. As stated in the “Impact of COVID-19” section in “Item 2. Management’s Discussion and Analysis of Financial Condition and Results of Operations,” we and our Manager are taking steps to mitigate certain risks associated with COVID-19, however the extent to which the COVID-19 pandemic impacts us, our business, our borrowers and our tenants will depend on future developments, which are highly uncertain and cannot be predicted with confidence, including the scope, severity and duration of the pandemic, the actions taken to contain the pandemic or mitigate its impact, and the direct and indirect economic efforts of the pandemic and containment measures, among others.
Interest Rate Risk
Interest rate risk relates to the risk that the future cash flow of a financial instrument will fluctuate because of changes in market interest rates. Interest rate risk is highly sensitive to many factors, including governmental, monetary and tax policies, domestic and international economic and political considerations and other factors beyond our control. Credit curve spread risk is highly sensitive to the dynamics of the markets for loans and securities we hold. Excessive supply of these assets combined with reduced demand will cause the market to require a higher yield. This demand for higher yield will cause the market to use a higher spread over the U.S. Treasury securities yield curve, or other benchmark interest rates, to value these assets.
As U.S. Treasury securities are priced to a higher yield and/or the spread to U.S. Treasuries used to price the assets increases, the price at which we could sell some of our fixed rate financial assets may decline. Conversely, as U.S. Treasury securities are priced to a lower yield and/or the spread to U.S. Treasuries used to price the assets decreases, the value of our fixed rate financial assets may increase. Fluctuations in LIBOR may affect the amount of interest income we earn on our floating rate borrowings and interest expense we incur on borrowings indexed to LIBOR, including under credit facilities and investment-level financing.
We utilize a variety of financial instruments on some of our investments, including interest rate swaps, caps, floors and other interest rate exchange contracts, in order to limit the effects of fluctuations in interest rates on their operations. The use of these types of derivatives to hedge interest-earning assets and/or interest-bearing liabilities carries certain risks, including the risk that losses on a hedge position will reduce the funds available for distribution and that such losses may exceed the amount invested in such instruments. A hedge may not perform its intended purpose of offsetting losses of rising interest rates. Moreover, with respect to certain of the instruments used as hedges, there is exposure to the risk that the counterparties may cease making markets and quoting prices in such instruments, which may inhibit the ability to enter into an offsetting transaction with respect to an open position. Our profitability may be adversely affected during any period as a result of changing interest rates.
As of June 30, 2019,2020, a hypothetical 100 basis point increase in the applicable interest rate benchmark on our loan portfolio would increasedecrease interest income by $5.6$13.8 million annually, net of interest expense.
115
Prepayment risk
Prepayment risk is the risk that principal will be repaid at a different rate than anticipated, resulting in a less than expected return on an investment. As prepayments of principal are received, any premiums paid on such assets are amortized against interest income, while any discounts on such assets are accreted into interest income. Therefore, an increase in prepayment rates has the following impact: (i) accelerates amortization of purchase premiums, which reduces interest income earned on the assets; and conversely, (ii) accelerates accretion of purchase discounts, which increases interest income earned on the assets.
Extension risk
The weighted average life of assets is projected based on assumptions regarding the rate at which borrowers will prepay or extend their mortgages. If prepayment rates decrease or extension options are exercised by borrowers at a rate that deviates significantly from projections, the life of fixed rate assets could extend beyond the term of the secured debt agreements. This in turn could negatively impact liquidity to the extent that assets may have to be sold and losses may be incurred as a result.
Credit risk
Investment in loans held for investment is subject to a high degree of credit risk through exposure to loss from loan defaults. Default rates are subject to a wide variety of factors, including, but not limited to, borrower financial condition, property
performance, property management, supply/demand factors, construction trends, consumer behavior, regional economics, interest rates, the strength of the U.S. economy and other factors beyond our control.control, all of which have and may continue to be detrimentally impacted by the COVID-19 pandemic. All loans are subject to a certain probability of default. We manage credit risk through the underwriting process, acquiring investments at the appropriate discount to face value, if any, and establishing loss assumptions. Performance of the loans is carefully monitored, including those held through joint venture investments, as well as external factors that may affect their value.
We are also subject to the credit risk of the tenants in our properties.properties, including business closures, occupancy levels, meeting rent or other expense obligations, lease concessions, among other factors, all of which have and may continue to be detrimentally impacted by the COVID-19 pandemic. We seek to undertake a rigorous credit evaluation of the tenants prior to acquiring properties. This analysis includes an extensive due diligence investigation of the tenants’ businesses, as well as an assessment of the strategic importance of the underlying real estate to the respective tenants’ core business operations. Where appropriate, we may seek to augment the tenants’ commitment to the properties by structuring various credit enhancement mechanisms into the underlying leases. These mechanisms could include security deposit requirements or guarantees from entities that are deemed credit worthy.
We are working closely with our borrowers and tenants to address the impact of COVID-19 on their business. Our Manager’s in-depth understanding of CRE and real estate-related investments, and in-house underwriting, asset management and resolution capabilities, provides us and management with a sophisticated full-service platform to regularly evaluate our investments and determine primary, secondary or alternative strategies to manage the credit risks described above. This includes intermediate servicing and complex and creative negotiating, restructuring of non-performing investments, foreclosure considerations, intense management or development of owned real estate, in each case to manage the risks faced to achieve value realization events in our interests and our stockholders. Solutions considered due to the impact of the COVID-19 pandemic may include defensive loan or lease modifications, temporary interest or rent deferrals or forbearances, converting current interest payment obligations to payment-in-kind, repurposing reserves and/or covenant waivers. Depending on the nature of the underlying investment and credit risk, we may pursue repositioning strategies through judicious capital investment in order to extract value from the investment or limit losses.
There can be no assurance that the measures taken will be sufficient to address the negative impact the COVID-19 pandemic may have on our future operating results, liquidity and financial condition.
Real estate market risk
We are exposed to the risks generally associated with the commercial real estate market. The market values of commercial real estate are subject to volatility and may be affected adversely by a number of factors, including, but not limited to, national, regional and local economic conditions, as well as changes or weakness in specific industry segments, and other macroeconomic factors beyond our control, including the COVID-19 pandemic, which couldhave and may continue to affect occupancy rates, capitalization rates and absorption rates. This in turn could impact the performance of tenants and borrowers. We seek to manage these risks through their underwriting due diligence and asset management processes.processes and the solutions oriented process described above.
116
Capital markets risk
We are exposed to risks related to the debt capital markets, specifically the ability to finance our business through borrowings under secured revolving repurchase facilities, secured and unsecured warehouse facilities or other debt instruments. We seek to mitigate these risks by monitoring the debt capital markets to inform their decisions on the amount, timing and terms of their borrowings.
The COVID-19 pandemic has had a direct and volatile impact on the global markets, including the commercial real estate equity and debt capital markets. The disruption caused by COVID-19 pandemic has led to a negative impact on asset valuations and significant constraints on liquidity in the capital markets, which may lead to restrictions on lending activity, downward pressure on covenant compliance or requirements to post margin or repayments under master repurchase financing arrangements. Our Master Repurchase Facilities are partial recourse and margin call provisions do not permit valuation adjustments based on capital markets events, rather they are limited to collateral-specific credit marks generally determined on a commercially reasonable basis. We have timely met margin calls, primarily under our CMBS Credit Facilities.
We have amended our Bank Credit Facility and Master Repurchase Facilities to adjust certain covenants (such as the tangible net worth covenant), reduce advance rates on certain financed assets, obtain margin call holidays and permitted modification flexibilities, in an effort to mitigate the risk of future compliance issues, including margin calls, under our financing arrangements.
We continue to explore similar solutions with financing counterparties to strengthen our financing arrangements, with the understanding that any existing or future amendments may not be sufficient to fully address the impacts of COVID-19 on our business or financing arrangements.
Foreign Currency Risk
We have foreign currency rate exposures related to our foreign currency-denominated investments held by our foreign subsidiaries. Changes in foreign currency rates can adversely affect the fair values and earning of our non-U.S. holdings. We generally mitigate this foreign currency risk by utilizing currency instruments to hedge our net investments in our foreign subsidiaries. The type of hedging instruments that we employ on our foreign subsidiary investments are forwards.
At June 30, 2019,2020, we had approximately NOK 913.9846.0 million and €184.6€156.2 million or a total of $317.1$262.8 million, in net investments in our European subsidiaries. A 1.0% change in these foreign currency rates would result in a $3.2$2.6 million increase or decrease in translation gain or loss included in other comprehensive income in connection with our European subsidiaries.
A summary of the foreign exchange contracts in place at June 30, 2019,2020, including notional amount and key terms, is included in Note 16,15, “Derivatives,” to Part I, Item 1, “Financial Statements.” The maturity dates of these instruments approximate the projected dates of related cash flows for specific investments. Termination or maturity of currency hedging instruments may result in an obligation for payment to or from the counterparty to the hedging agreement. We are exposed to credit loss in the event of non-performance by counterparties for these contracts. To manage this risk, we select major international banks and financial institutions as counterparties and perform a quarterly review of the financial health and stability of our trading counterparties. Based on our review at June 30, 2019,2020, we do not expect any counterparty to default on its obligations.
Item 4. Controls and Procedures
Evaluation of Disclosure Controls and Procedures
We maintain disclosure controls and procedures, as defined in Rules 13a-15(e) and 15d-15(e) under the Exchange Act, that are designed to ensure that information required to be disclosed in our Exchange Act reports is recorded, processed, summarized and reported within the time periods specified in the SEC’s rules and forms, and that such information is accumulated and communicated to our management, including our Chief Executive Officer and Chief Financial Officer, as appropriate, to allow timely decisions regarding required disclosure.
As required by Rule 13a-15(b) under the Exchange Act, our management carried out an evaluation, under the supervision and with the participation of our Chief Executive Officer and Chief Financial Officer, of the effectiveness of our disclosure controls and procedures. Based on this evaluation, our Chief Executive Officer and Chief Financial Officer concluded that as of June 30, 2019,2020, our disclosure controls and procedures were effective at providing reasonable assurance regarding the reliability of the information
required to be disclosed by us in reports that we file under the Exchange Act is recorded, processed, summarized and reported within the time periods specified in SEC rules and forms.
117
Changes in Internal Control over Financial Reporting
There have been no changes in our internal control over financial reporting (as defined in Rules 13a-15(f) and 15d-15(f) under the Exchange Act) during the most recent fiscal quarter that materially affected, or are reasonably likely to materially affect, our internal control over financial reporting.
Our internal control framework, which includes controls over financial reporting and disclosure, continues to operate effectively.
118
PART II. Other InformationII
Item 1. Legal Proceedings
Neither the Company nor our Manager is currently subject to any material legal proceedings. We anticipate that we may from time to time be involved in legal actions arising in the ordinary course of business, the outcome of which we would not expect to have a material adverse effect on our financial position, results of operations or cash flow.
Item 1A. Risk Factors
The novel coronavirus pandemic, measures intended to prevent its spread and government actions to mitigate its economic impact have had and may continue to have a material adverse effect on our business, results of operations and financial condition.
The COVID-19 pandemic is causing significant disruptions to the U.S. and global economies and has contributed to volatility and negative pressure in financial markets. The outbreak has led governments and other authorities around the world to impose measures intended to control its spread, including restrictions on freedom of movement and business operations such as filedtravel bans, border closings, business closures, quarantines and shelter-in-place orders. The actual and potential impact and duration of COVID-19 or another pandemic have and are expected to continue to have significant repercussions across regional, national and global economies and financial markets, and have triggered a period of regional, national and global economic slowdown and may trigger a longer term recession. The impact of the pandemic and measures to prevent its spread have negatively impacted us and could further negatively impact our business. To the extent current conditions persist or worsen, we expect there to be a materially negative effect on the value of our assets and our results of operations, and, in turn, cash available for distribution to our stockholders. Moreover, many risk factors set forth in the Company’s Annual Report on Form 10-K for the year ended December 31, 2019 should be interpreted as heightened risks as a result of the ongoing and numerous adverse impacts of the COVID-19 pandemic.
Difficulty accessing debt and equity capital on attractive terms, or at all, and severe disruption or instability in the global financial markets or deteriorations in credit and financing conditions may affect our ability to access capital necessary to fund business operations or replace liabilities on a timely basis.This may also adversely affect the valuation of financial assets and liabilities, any of which could result in the inability to make payments under our credit and other borrowing facilities, affect our ability to meet liquidity, net worth, and leverage covenants under such facilities or have a material adverse effect on the value of investments we hold. In addition, the insolvency of one or more of our counterparties could reduce the amount of financing available to us, which would make it more difficult for us to leverage the value of our assets and obtain substitute financing on attractive terms or at all. Recently, we have experienced declines in the value of our target assets, as well as adverse developments with respect to the terms and cost of financing available to us, and have received margin calls, default notices and deficiency letters from certain of our financing counterparties. Any or all of these impacts could result in reduced net investment income and cash flow, as well as an impairment of our investments, which reductions and impairments could be material. Declines in asset values, specifically retail, office and multifamily residential assets, may also impact our ability to liquidate our legacy, non-strategic assets within the projected timeframe or at the projected values.
Additionally, we expect the economic impacts of the pandemic will impact the financial stability of the mortgage loans and mortgage loan borrowers underlying the residential and commercial securities and loans that we own. As a result, we anticipate an increase in the number of borrowers who become delinquent or default on their loans, or who will seek concessions or forbearance. Elevated levels of delinquency or default would have an adverse impact on our income and the value of our assets and may require us to repay amounts under our master repurchase facilities and we can provide no assurance that we will have funds available to make such payments. Any forced sales of loans, securities or other assets that secure our repurchase and other financing arrangements in the current environment would likely be on terms less favorable to us than might otherwise be available in a regularly functioning market and could result in deficiency judgments and other claims against us.
Our loans collateralized by hotels, retail properties and mezzanine loans and preferred equity interests are disproportionately impacted by the effects of COVID-19. In particular, we hold a $189.0 million commitment in a mezzanine loan and preferred equity investment on a development project in Los Angeles County (which includes a hospitality and retail renovation and a new condominium tower construction) for which loan funding was out of balance in April 2020. Although the deficiency has been funded, if there are further overruns or delays in opening or decreased demand for the hospitality or retail space or condominium sales, we may not be able to fund any other deficiencies, which could result in a default under the senior mortgage loan and a foreclosure on all interests subordinate to the senior mortgage loan, including our interest in the mezzanine
119
loan. In addition, our retail borrowers have been materially impacted by shelter-in-place orders, and, for example, nine properties net leased to a national retail chain did not pay April rent, but became current on their rent in July, and the default rate in future periods likely will increase.
In response to the pandemic, the U.S. government has taken various actions to support the economy and the continued functioning of the financial markets. The Federal Reserve has announced its commitment to purchase unlimited amounts of U.S. Treasuries, mortgage-backed securities, municipal bonds and other assets. In addition, President Trump signed into law the Coronavirus Aid, Relief, and Economic Security (CARES) Act, which is providing billions of dollars of relief to individuals, businesses, state and local governments, and the health care system suffering the impact of the pandemic, including mortgage loan forbearance and modification programs to qualifying borrowers who have difficulty making their loan payments. There can be no assurance as to how, in the long term, these and other actions by the U.S. government will affect the efficiency, liquidity and stability of the financial and mortgage markets. To the extent the financial or mortgage markets do not respond favorably to any of these actions, or such actions do not function as intended, our business, results of operations and financial condition may continue to be materially adversely affected. Moreover, certain actions taken by U.S. or other governmental authorities, including the Federal Reserve, that are intended to ameliorate the macroeconomic effects of COVID-19 may harm our business. Decreases in short-term interest rates, such as those announced by the Federal Reserve late in our 2019 fiscal year and during the first fiscal quarter of 2020, may have a negative impact on our results, as we have certain assets and liabilities which are sensitive to changes in interest rates. These market interest rate declines may negatively affect our results of operations. In addition, as interest rates continue to decline as a result of demand for U.S. Treasury securities and the activities of the Federal Reserve, prepayments on our assets are likely to increase due to refinancing activity, which could have a material adverse effect on our result of operations.
The rapid development and fluidity of the circumstances resulting from this pandemic preclude any prediction as to the ultimate adverse impact of COVID-19 on our business. Nevertheless, COVID-19 and the current financial, economic and capital markets environment, and future developments in these and other areas present material uncertainty and risk with respect to our performance, financial condition, results of operations and cash flows.
Our inability to access funding or the terms on which such funding is available could have a material adverse effect on our financial condition, particularly in light of ongoing market dislocations resulting from the COVID-19 pandemic.
Our ability to fund our operations, meet financial obligations and finance target asset acquisitions may be impacted by our ability to secure and maintain our master repurchase agreements with our counterparties. Because repurchase agreements are short-term commitments of capital, lenders may respond to market conditions making it more difficult for us to renew or replace on a continuous basis our maturing short-term borrowings and have and may continue to impose more onerous conditions when rolling such financings. If we are not able to renew our existing facilities or arrange for new financing on terms acceptable to us, or if we default on our covenants or are otherwise unable to access funds under our financing facilities or if we are required to post more collateral or face larger haircuts, we may have to curtail our asset acquisition activities and/or dispose of assets.
Issues related to financing are exacerbated in times of significant dislocation in the financial markets, such as those being experienced now related to the COVID-19 pandemic. It is possible our lenders will become unwilling or unable to provide us with financing and we could be forced to sell our assets at an inopportune time when prices are depressed. In addition, if the regulatory capital requirements imposed on our lenders change, they may be required to significantly increase the cost of the financing that they provide to us. Our lenders also have revised and may continue to revise their eligibility requirements for the types of assets they are willing to finance or the terms of such financings, including haircuts and requiring additional collateral in the form of cash, based on, among other factors, the regulatory environment and their management of actual and perceived risk, particularly with respect to assignee liability. Moreover, the amount of financing we receive under our repurchase agreements will be directly related to our lenders’ valuation of our target assets that cover the outstanding borrowings. Typically, repurchase agreements grant the lender the absolute right to reevaluate the fair market value of the assets that cover outstanding borrowings at any time. If a lender determines in its sole discretion that the value of the assets has decreased, it has the right to initiate a margin call. These valuations may be different than the values that we ascribe to these assets and may be influenced by recent asset sales and distressed levels by forced sellers. A margin call requires us to transfer additional assets to a lender without any advance of funds from the lender for such transfer or to repay a portion of the outstanding borrowings.
During the first and second quarter of 2020, we have observed a mark-down of a portion of our mortgage assets by the counterparties to our financing arrangements, resulting in us having to pay cash or securities to satisfy higher than historical levels of margin calls. Significant margin calls could have a material adverse effect on our results of operations, financial condition, business, liquidity and ability to make distributions to our stockholders, and could cause the value of our common stock to decline. In addition, we have also experienced an increase in haircuts on financings we have rolled. As haircuts are increased, we will be required to post additional collateral. We may also be forced to sell assets at significantly depressed prices to meet such margin calls and to maintain adequate liquidity. As a result of the ongoing COVID-19 pandemic, we have
120
experienced margins calls well beyond historical norms. These trends, if continued, will have a negative adverse impact on our liquidity.
In connection with the SECmarket disruptions resulting from the COVID-19 pandemic, we changed our interest rate hedging strategy and closed out of, or terminated a portion of our interest rate hedges, incurring realized losses. As a result, interest rate risk exposure that is associated with certain of our assets and liabilities is no longer being hedged in the manner that we previously used to address interest rate risk and our revised strategy to address interest rate risk may not be effective and could result in the incurrence of future realized losses.
In response to the recent market dislocations resulting from the global pandemic of COVID-19, we made the determination that certain of our interest rate hedges were no longer effective in hedging asset market values and, as of March 27, 2020, had terminated or closed out a portion of our outstanding interest rate hedges and, overall, incurred realized losses. While we are monitoring market conditions and determining when we believe it would be appropriate and effective to re-implement interest rate hedging strategies, including by taking into account our future business activities and assets and liabilities, we will be exposed to the impact that changes in benchmark interest rates may have on February 28, 2019.the value of the loans, securities and other assets we own that are sensitive to interest rate changes, as well as long-term debt obligations that are sensitive to interest rate changes. Moreover, to the extent the value of loans and securities we own fluctuate as a result of changes in benchmark interest rates, we may be exposed to margin calls under lending facilities that we use to finance these assets. In the past, our interest rate hedging strategy was intended to be a source of liquidity in meeting margin calls that resulted from asset valuation changes attributable to changes in benchmark interest rates; however, because we have terminated or closed out a portion of our outstanding interest rate hedges, we will not be able to rely on these hedges as such a source of liquidity. Operating our business and maintaining a portfolio of interest rate sensitive loans, securities and other assets without an interest rate risk hedging program in place could expose us to losses and liquidity risks, which could be material and which could negatively impact our results of operations and financial condition. There can be no assurance that future market conditions and our financial condition in the future will enable us to re-establish an effective interest rate risk hedging program, even if in the future we believe it would otherwise be appropriate or desirable to do so.
We may pay taxable dividends in our common stock and cash, in which case stockholders may sell shares of our common stock to pay tax on such dividends, placing downward pressure on the market price of our common stock.
We generally must distribute annually at least 90% of our REIT taxable income (subject to certain adjustments and excluding any net capital gain), in order to qualify as a REIT, and any REIT taxable income that we do not distribute will be subject to U.S. corporate income tax at regular rates.In April 2020, the Board of Directors of the Company determined it was prudent to conserve available liquidity and suspend the Company’s monthly stock dividend beginning with the monthly period ending April 30, 2020.The Board of Directors will evaluate dividends in future periods based upon customary consideration, such as our cash balances, and cash flows and market conditions and could consider paying future dividends in shares of common stock, cash, or a combination of shares of common stock and cash.
On August 11, 2017, the IRS issued Revenue Procedure 2017-45, authorizing elective stock dividends to be made by public REITs. Pursuant to this revenue procedure, effective for distributions declared on or after August 11, 2017, the IRS will treat the distribution of stock pursuant to an elective stock dividend as a distribution of property under Section 301 of the Code (i.e., as a dividend to the extent of our earnings and profits), as long as at least 20% of the total dividend is available in cash and certain other requirements outlined in the revenue procedure are met.
If we make a taxable dividend payable in cash and common stock, taxable stockholders receiving such dividends will be required to include the full amount of the dividend as ordinary income to the extent of our current and accumulated earnings and profits, as determined for U.S. federal income tax purposes. As a result, stockholders may be required to pay income tax with respect to such dividends in excess of the cash dividends received. If a U.S. stockholder sells the common stock that it receives as a dividend in order to pay this tax, the sales proceeds may be less than the amount included in income with respect to the dividend, depending on the market price of our common stock at the time of the sale. Furthermore, with respect to certain non-U.S. stockholders, we may be required to withhold U.S. federal income tax with respect to such dividends, including in respect of all or a portion of such dividend that is payable in common stock. If we make a taxable dividend payable in cash and our common stock and a significant number of our stockholders determine to sell shares of our common stock in order to pay taxes owed on dividends, it may put downward pressure on the trading price of our common stock.
Item 2. Unregistered Sales of Equity Securities and Use of Proceeds
There were no sales of unregistered securities of our Company during the six months ended June 30, 2019,2020, other than those previously disclosed in filings with the SEC.
Purchases of Equity Securities by Issuer
121
The Company did not purchase any of ourits Class A common stock during the three months ended June 30, 2019.2020.
The Company’s boardBoard of directorsDirectors authorized a stock repurchase program (the “Stock Repurchase Program”), under which the Company maycould repurchase up to $300.0 million of its outstanding Class A common stock until March 31, 2020. On February 18, 2020, the Company’s Board of Directors voted to extend the Stock Repurchase Program through March 31, 2020.2021. Under the Stock Repurchase Program, the Company may repurchase shares in open market purchases, through tender offers or otherwise in accordance with all applicable securities laws and regulations, including Rule 10b-18 of the Securities Exchange Act of 1934, as amended. As of June 30, 2019, the Company had not repurchased any shares under the Stock Repurchase Program.
Item 3. Defaults Upon Senior Securities
None.
Item 4. Mine Safety Disclosures
Not applicable.
Item 5. Other Information
122
Item 6. Exhibits
EXHIBIT INDEX
| Exhibit Number | Description of Exhibit | |||||||
| 2.1 | ||||||||
| 3.1 | ||||||||
| 3.2 | ||||||||
| 10.1 | ||||||||
| 10.2 | ||||||||
| 10.3 | ||||||||
| 10.4 | ||||||||
| 10.5 | ||||||||
| 10.6 | ||||||||
| 10.7 | ||||||||
| 10.8 | ||||||||
| 31.1* | ||||||||
| 31.2* | ||||||||
| 32.1* | ||||||||
| 32.2* | ||||||||
| 101.INS* | XBRL Instance Document - the instance document does not appear in the Interactive Data File because its XBRL tags are embedded within the Inline XBRL document | |||||||
| 101.SCH* | Inline XBRL Taxonomy Extension Schema Document | |||||||
| 101.CAL* | Inline XBRL Taxonomy Extension Calculation Linkbase Document | |||||||
| 101.DEF* | Inline XBRL Taxonomy Extension Definition Linkbase Document | |||||||
| 101.LAB* | Inline XBRL Taxonomy Extension Label Linkbase Document | |||||||
| 101.PRE* | Inline XBRL Taxonomy Extension Presentation Linkbase Document | |||||||
| 104 | Cover Page Interactive Data File (formatted as Inline XBRL and contained in Exhibit 101) | |||||||
* Filed herewith
123
SIGNATURES
Pursuant to the requirements of Section 13 or 15(d) of the Securities Exchange Act of 1934, the Registrant has duly caused this report to be signed on its behalf by the undersigned thereunto duly authorized.
Dated: August 8, 20197, 2020
| COLONY CREDIT REAL ESTATE, INC. | ||||||||
| By: | ||||||||
| Michael J. Mazzei | ||||||||
| Chief Executive Officer and President | ||||||||
| (Principal Executive Officer) | ||||||||
| By: | /s/ Neale W. Redington | |||||||
| Neale W. Redington | ||||||||
| Chief Financial Officer (Principal Financial Officer) | ||||||||
| By: | /s/ Frank V. Saracino | |||||||
| Frank V. Saracino | ||||||||
| Chief Accounting Officer (Principal Accounting Officer) | ||||||||