UNITED STATES
SECURITIES AND EXCHANGE COMMISSION
Washington D.C. 20549
FORM 10-Q
| x | QUARTERLY REPORT PURSUANT TO SECTION 13 OR 15(d) OF THE SECURITIES EXCHANGE ACT OF 1934 |
For the quarterly period ended: June 30, 2019March 31, 2020
or
| ¨ | TRANSITION REPORT PURSUANT TO SECTION 13 OR 15(d) OF THE SECURITIES EXCHANGE ACT OF 1934 |
For the transition period from ______to______.
| XG SCIENCES, INC. | ||||
| (Exact name of registrant as specified in its charter) |
| Michigan | 333-209131 | 20-4998896 | ||
| (State or other jurisdiction of incorporation or organization) | (Commission File No.) | (I.R.S. Employer Identification No.) |
3101 Grand Oak Drive
Lansing, MI 48911
(Address of principal executive offices) (zip code)
(517) 703-1110
(Issuer Telephone number)
Indicate by check mark whether the registrant (1) has filed all reports required to be filed by Section 13 or 15(d) of the Securities Exchange Act of 1934 during the preceding 12 months (or for such shorter period that the registrant was required to file such reports), and (2) has been subject to such filing requirements for the past 90 days. Yes☒ No¨
Indicate by check mark whether the registrant has submitted electronically, and posted on its corporate Web site, if any, every Interactive Data File required to be submitted and posted pursuant to Rule 405 of Regulation S-T (§232.405 of this chapter) during the preceding 12 months (or for such shorter period that the registrant was required to submit and post such files). Yes☒ No¨
Indicate by check mark whether the registrant is a large accelerated filer, an accelerated filer, a non-accelerated filer, or a smaller
reporting company, filer.or an emerging growth company. See definitionthe definitions of “accelerated filer” and “large accelerated filer”filer,” “accelerated filer,” “smaller
reporting company,” and "emerging growth company" in Rule 12b-2 of the Exchange Act (Check one):Act.
| Large accelerated filer | ¨ | Accelerated filer | ¨ |
| Non-accelerated filer | Smaller reporting company | þ | |
| Emerging growth company | þ |
If an emerging growth company, indicate by checkmark if the registrant has not elected to use the extended transition period for complying with any new or revised financial accounting standards provided pursuant to Section 7(a)(2)(B) of the Securities Act. þ
Indicate by check mark whether the registrant is a shell company as defined in Rule 12b-2 of the Exchange Act. Yes ☐ No☒
Securities registered pursuant to Section 12(b) of the Act: N/ANone
As of August 14, 2019,June 15, 2020, there were 4,011,9433,949,443 shares of the registrant’s common stock outstanding.
XG SCIENCES, INC.
FORM 10-Q
June 30, 2019March 31, 2020
INDEX
| 2 |
FORWARD-LOOKING STATEMENTS
The information in this Quarterly Report on Form 10-Q contains “forward-looking statements” and information within the meaning of Section 27A of the Securities Act of 1933, as amended (the “Securities Act”), and Section 21E of the Securities Exchange Act of 1934, as amended (the “Exchange Act”) relating to XG Sciences, Inc., a Michigan corporation and its subsidiary, XG Sciences IP, LLC, a Michigan limited liability company (collectively referred to as “we”, “us”, “our”, “XG Sciences”, “XGS”, or the “Company”), which are subject to the “safe harbor” created by those sections. These forward-looking statements include, but are not limited to, statements concerning our strategy, future operations, future financial position, future revenue, projected costs, prospects and plans and objectives of management. The words “anticipates,” “believes,” “estimates,” “expects,” “intends,” “may,” “plans,” “projects,” “will,” “would” and similar expressions are intended to identify forward-looking statements, although not all forward-looking statements contain these identifying words. We may not actually achieve the plans, intentions or expectations disclosed in our forward-looking statements and you should not place undue reliance on our forward-looking statements. These forward-looking statements involve known and unknown risks and uncertainties that could cause our actual results, performance or achievements to differ materially from those expressed or implied by the forward-looking statements, including, without limitation, the risks set forth beginning on page 12 under the section entitled “Risk Factors” in our annual report on Form 10-K/A10-K as filed with the Securities and Exchange Commission (the “SEC”) on April 3, 2019.
29, 2020.
| 3 |
XG SCIENCES, INC. | ||||||||
| CONDENSED CONSOLIDATED BALANCE SHEETS | ||||||||
| (U.S. Dollars) | ||||||||
| June 30, 2019 | December 31, 2018 | |||||||
| ASSETS | (Unaudited) | |||||||
| CURRENT ASSETS | ||||||||
| Cash | $ | 1,735,721 | $ | 4,703,834 | ||||
| Accounts receivable, less allowance for doubtful accounts of $26,000 at June 30, 2019 and $85,000 at December 31, 2018 | 269,539 | 859,054 | ||||||
| Inventories | 965,578 | 660,217 | ||||||
| Other current assets | 110,937 | 114,453 | ||||||
| Total current assets | 3,081,775 | 6,337,558 | ||||||
| LONG-TERM ASSETS | ||||||||
| Property, Plant and Equipment, Net | 4,123,286 | 4,223,650 | ||||||
| Restricted Cash for Letter of Credit | — | 190,140 | ||||||
| Lease Deposit | 59,440 | 20,156 | ||||||
| Intangible Assets, Net | 733,056 | 690,646 | ||||||
| Right of Use Asset | 1,767,269 | — | ||||||
| Total Long-Term Assets | 6,683,051 | 5,124,592 | ||||||
| TOTAL ASSETS | 9,764,826 | 11,462,150 | ||||||
| LIABILITIES AND STOCKHOLDERS' EQUITY | ||||||||
| CURRENT LIABILITIES | ||||||||
| Accounts payable | 666,718 | 1,102,910 | ||||||
| Other current liabilities | 513,034 | 429,573 | ||||||
| Deferred revenue | — | 832 | ||||||
| Current portion of long-term debt | — | 196,723 | ||||||
| Current portion of lease liabilities | 461,603 | 3,613 | ||||||
| Total current liabilities | 1,641,355 | 1,733,651 | ||||||
| LONG-TERM LIABILITIES | ||||||||
| Long-term portion of lease liabilities | 1,411,749 | 11,914 | ||||||
| Long term debt | 4,323,953 | 4,725,866 | ||||||
| Total long-term liabilities | 5,735,702 | 4,737,780 | ||||||
| TOTAL LIABILITIES | 7,377,057 | 6,471,431 | ||||||
| STOCKHOLDERS' EQUITY | ||||||||
| Series A convertible preferred stock, 3,000,000 shares authorized, 1,890,354 shares issued and outstanding, liquidation value of $22,684,248 at June 30, 2019 and December 31, 2018 | 22,307,480 | 22,307,480 | ||||||
| Common stock, no par value, 25,000,000 shares authorized, 4,011,943 and 3,760,268 shares issued and outstanding at June 30, 2019 and December 31, 2018, respectively | 32,301,876 | 30,268,476 | ||||||
| Additional paid-in capital | 8,280,579 | 8,101,923 | ||||||
| Accumulated deficit | (60,502,166 | ) | (55,687,160 | ) | ||||
| Total stockholders' equity | 2,387,769 | 4,990,719 | ||||||
| TOTAL LIABILITIES AND STOCKHOLDERS' EQUITY | 9,764,826 | 11,462,150 | ||||||
| XG SCIENCES, INC. | ||||||||
| CONDENSED CONSOLIDATED BALANCE SHEETS | ||||||||
| (unaudited) | ||||||||
| March 31, 2020 | December 31, 2019 | |||||||
| ASSETS | ||||||||
| CURRENT ASSETS | ||||||||
| Cash | $ | 458,845 | $ | 1,129,702 | ||||
| Accounts receivable, less allowance for doubtful accounts of $158,600 at March 31, 2020 and 179,600 at December 31, 2019 | 121,331 | 72,227 | ||||||
| Inventories | 874,710 | 891,587 | ||||||
| Other current assets | 317,288 | 334,493 | ||||||
| Total current assets | 1,772,174 | 2,428,009 | ||||||
| PROPERTY, PLANT AND EQUIPMENT, NET | 3,466,419 | 3,676,142 | ||||||
| LEASE DEPOSIT | 61,467 | 77,544 | ||||||
| INTANGIBLE ASSETS, NET | 770,746 | 753,862 | ||||||
| RIGHT OF USE ASSET | 1,486,112 | 1,606,443 | ||||||
| TOTAL ASSETS | 7,556,918 | 8,542,000 | ||||||
| LIABILITIES AND STOCKHOLDERS' EQUITY | ||||||||
| CURRENT LIABILITIES | ||||||||
| Accounts payable | 892,700 | 634,564 | ||||||
| Other current liabilities | 171,493 | 238,554 | ||||||
| Deferred revenue | 10,310 | — | ||||||
| Current portion of long-term debt | — | — | ||||||
| Current portion of lease liabilities | 536,786 | 520,197 | ||||||
| Total current liabilities | 1,611,289 | 1,393,315 | ||||||
| LONG-TERM LIABILITIES | ||||||||
| Long-term portion of lease liabilities | 1,042,745 | 1,183,872 | ||||||
| Long term debt | 9,219,420 | 8,111,610 | ||||||
| Total long-term liabilities | 10,262,165 | 9,295,482 | ||||||
| TOTAL LIABILITIES | 11,873,454 | 10,688,797 | ||||||
| STOCKHOLDERS' EQUITY | ||||||||
| Series A convertible preferred stock, 3,000,000 shares authorized, 1,890,354 shares issued and outstanding, liquidation value of $22,684,248 at March 31, 2020 and December 31, 2019 | 22,307,480 | 22,307,480 | ||||||
| Common stock, no par value, 25,000,000 shares authorized, 4,024,443 shares issued and outstanding at March 31, 2020 and December 31, 2019 | 32,376,876 | 32,351,876 | ||||||
| Additional paid-in capital | 8,931,527 | 8,774,975 | ||||||
| Accumulated deficit | (67,932,419 | ) | (65,581,128 | ) | ||||
| Total stockholders' equity (deficit) | (4,316,536 | ) | (2,146,797 | ) | ||||
| TOTAL LIABILITIES AND STOCKHOLDERS' EQUITY | 7,556,918 | 8,542,000 | ||||||
See notes to unaudited condensed consolidated financial statements
| 4 |
XG SCIENCES, INC.
CONDENSED CONSOLIDATED STATEMENTS OF OPERATIONS
(U.S. Dollars, except Share data)
(Unaudited)
For the 3 Months | For the 6 Months Ended June 30, | |||||||||||||||
| 2019 | 2018 | 2019 | 2018 | |||||||||||||
| REVENUE | �� | |||||||||||||||
| Product Sales | 247,069 | 850,854 | 1,104,346 | 1,737,191 | ||||||||||||
| Total revenue | $ | 247,069 | $ | 850,854 | $ | 1,104,346 | $ | 1,737,191 | ||||||||
| COST OF GOODS SOLD | ||||||||||||||||
| Direct costs | 196,411 | 563,260 | 877,564 | 1,031,451 | ||||||||||||
| Unallocated manufacturing expenses | 599,745 | 542,689 | 1,093,214 | 1,289,272 | ||||||||||||
| Total cost of goods sold | 796,156 | 1,105,949 | 1,970,778 | 2,320,723 | ||||||||||||
| GROSS LOSS | (549,087 | ) | (255,095 | ) | (866,432 | ) | (583,532 | ) | ||||||||
| OPERATING EXPENSES | ||||||||||||||||
| Research and development | 384,767 | 287,082 | 770,013 | 564,146 | ||||||||||||
| Sales, general and administrative | 1,486,380 | 1,147,794 | 2,907,301 | 2,334,473 | ||||||||||||
| Total operating expenses | 1,871,147 | 1,434,876 | 3,677,314 | 2,898,619 | ||||||||||||
| OPERATING LOSS | (2,420,234 | ) | (1,689,971 | ) | (4,543,746 | ) | (3,482,151 | ) | ||||||||
| OTHER INCOME (EXPENSE) | ||||||||||||||||
| Interest expense, net | (78,277 | ) | (83,805 | ) | (154,941 | ) | (168,974 | ) | ||||||||
| Government incentives, net | 3,253 | |||||||||||||||
| Total other expense | (78,277 | ) | (83,805 | ) | (154,941 | ) | (165,721 | ) | ||||||||
| NET LOSS | $ | (2,498,511 | ) | $ | (1,773,776 | ) | $ | (4,698,687 | ) | $ | (3,647,872 | ) | ||||
| WEIGHTED AVERAGE NUMBER OF SHARES OUTSTANDING - | ||||||||||||||||
| Basic and diluted (in shares) | 3,990,038 | 2,644,522 | 3,883,053 | 2,549,943 | ||||||||||||
| Net Loss Per Share - Basic and diluted (in dollars per share) | $ | (0.63 | ) | $ | (0.67 | ) | $ | (1.21 | ) | $ | (1.43 | ) | ||||
CONDENSED CONSOLIDATED STATEMENTS OF OPERATIONS (unaudited) - USD ($) | ||||||||
| For the Three Months Ended March 31, | ||||||||
| 2020 | 2019 | |||||||
| REVENUE | ||||||||
| Product Sales | $ | 167,063 | $ | 857,278 | ||||
| Grants | — | — | ||||||
| Total Revenues | 167,063 | 857,278 | ||||||
| COST OF GOODS SOLD | ||||||||
| Direct costs | 103,570 | 681,153 | ||||||
| Unallocated manufacturing expenses | 658,913 | 493,469 | ||||||
| Cost of Goods Sold | 762,483 | 1,174,622 | ||||||
| GROSS LOSS | (595,420 | ) | (317,344 | ) | ||||
| OPERATING EXPENSES | ||||||||
| Research & Development Expense | 285,727 | 385,245 | ||||||
| Sales, General & Administrative Expense | 1,292,135 | 1,420,922 | ||||||
| Total Operating Expenses | 1,577,862 | 1,806,167 | ||||||
| OPERATING LOSS | (2,173,282 | ) | (2,123,511 | ) | ||||
| OTHER EXPENSE | ||||||||
| Interest expense, net | (178,009 | ) | (76,665 | ) | ||||
| Total Other Expense | (178,009 | ) | (76,665 | ) | ||||
| Net Loss | $ | (2,351,291 | ) | $ | (2,200,176 | ) | ||
| WEIGHTED AVERAGE NUMBER OF SHARES OUTSTANDING - Basic and diluted (in shares) | 4,024,443 | 3,774,879 | ||||||
| NET LOSS PER SHARE - Basic and diluted (in dollars per share) | $ | (0.58 | ) | $ | (0.58 | ) | ||
See notes to unaudited condensed consolidated financial statements
| 5 |
XG SCIENCES, INC.
CONDENSED CONSOLIDATED STATEMENT OF CHANGES IN STOCKHOLDERS’ EQUITY
(U.S. Dollars)
(Unaudited)
| For the 6 Months Ended June 30, 2019 | ||||||||||||||||||||||||||||
| Preferred stock (A) | Common stock | Additional paid-in | Accumulated | |||||||||||||||||||||||||
| Shares | Amount | Shares | Amount | capital | deficit | Total | ||||||||||||||||||||||
| Balances, December 31, 2018 | 1,890,354 | $ | 22,307,480 | 3,760,268 | $ | 30,268,476 | $ | 8,101,923 | $ | (55,687,160 | ) | $ | 4,990,719 | |||||||||||||||
| Stock issued for cash | — | — | 251,675 | 2,013,400 | — | — | 2,013,400 | |||||||||||||||||||||
| Stock issuance fees and expenses | — | — | — | (20,000 | ) | — | — | (20,000 | ) | |||||||||||||||||||
| Transition adjustment for adoption of new lease standard | — | — | — | — | — | (116,319 | ) | (116,319 | ) | |||||||||||||||||||
| Stock-based compensation | — | — | — | 40,000 | 178,656 | — | 218,656 | |||||||||||||||||||||
| Net loss | — | — | — | — | — | (4,698,687 | ) | (4,698,687 | ) | |||||||||||||||||||
| Balances, June 30, 2019 | 1,890,354 | $ | 22,307,480 | 4,011,943 | $ | 32,301,876 | $ | 8,280,579 | $ | (60,502,166 | ) | $ | 2,387,769 | |||||||||||||||
| For the 6 Months Ended June 30, 2018 | ||||||||||||||||||||||||||||
| Preferred stock (A) | Common stock | Additional paid-in | Accumulated | |||||||||||||||||||||||||
| Shares | Amount | Shares | Amount | capital | deficit | Total | ||||||||||||||||||||||
| Balances, December 31, 2017 | 1,857,816 | $ | 21,917,046 | 2,353,350 | $ | 19,116,012 | $ | 7,831,958 | $ | (47,767,544 | ) | $ | 1,097,472 | |||||||||||||||
| Stock issued for cash | — | — | 493,175 | 3,945,400 | — | — | 3,945,400 | |||||||||||||||||||||
| Stock issuance fees and expenses | — | — | — | (66,598 | ) | — | — | (66,598 | ) | |||||||||||||||||||
| Preferred stock issued to pay capital lease obligations | 14,280 | 171,343 | — | — | — | — | 171,343 | |||||||||||||||||||||
| Stock-based compensation | — | — | — | 40,000 | 134,231 | — | 174,231 | |||||||||||||||||||||
| Net loss | — | — | — | — | — | (3,647,872 | ) | (3,647,872 | ) | |||||||||||||||||||
| Balances, June 30, 2018 | 1,872,096 | $ | 22,088,389 | 2,846,525 | $ | 23,034,814 | $ | 7,966,189 | $ | (51,415,416 | ) | $ | 1,673,976 | |||||||||||||||
| For the 3 Months Ended June 30, 2019 | ||||||||||||||||||||||||||||
| Preferred stock (A) | Common stock | Additional paid-in | Accumulated | |||||||||||||||||||||||||
| Shares | Amount | Shares | Amount | capital | deficit | Total | ||||||||||||||||||||||
| Balances, March 31, 2019 | 1,890,354 | $ | 22,307,480 | 3,811,518 | $ | 30,682,476 | $ | 8,190,211 | $ | (58,003,655 | ) | $ | 3,176,512 | |||||||||||||||
| Stock issued for cash | — | — | 200,425 | 1,603,400 | — | — | 1,603,400 | |||||||||||||||||||||
| Stock issuance fees and expenses | — | — | — | (4,000 | ) | — | — | (4,000 | ) | |||||||||||||||||||
| Stock-based compensation | — | — | — | 20,000 | 90,368 | — | 110,368 | |||||||||||||||||||||
| Net loss | — | — | — | — | — | (2,498,511 | ) | (2,498,511 | ) | |||||||||||||||||||
| Balances, June 30, 2019 | 1,890,354 | $ | 22,307,480 | 4,011,943 | $ | 32,301,876 | $ | 8,280,579 | $ | (60,502,166 | ) | $ | 2,387,769 | |||||||||||||||
| For the 3 Months Ended June 30, 2018 | ||||||||||||||||||||||||||||
| Preferred stock (A) | Common stock | Additional paid-in | Accumulated | |||||||||||||||||||||||||
| Shares | Amount | Shares | Amount | capital | deficit | Total | ||||||||||||||||||||||
| Balances, March 31, 2018 | 1,864,956 | $ | 22,002,717 | 2,555,275 | $ | 20,741,574 | $ | 7,899,722 | $ | (49,641,639 | ) | $ | 1,002,374 | |||||||||||||||
| Stock issued for cash | — | — | 291,250 | 2,330,000 | — | — | 2,330,000 | |||||||||||||||||||||
| Stock issuance fees and expenses | — | — | — | (56,760 | ) | — | — | (56,760 | ) | |||||||||||||||||||
| Preferred stock issued to pay capital lease obligations | 7,140 | 85,672 | — | — | — | — | 85,672 | |||||||||||||||||||||
| Stock-based compensation | — | — | — | 20,000 | 66,467 | — | 86,467 | |||||||||||||||||||||
| Net loss | — | — | — | — | — | (1,773,776 | ) | (1,773,776 | ) | |||||||||||||||||||
| Balances, June 30, 2018 | 1,872,096 | $ | 22,088,389 | 2,846,525 | $ | 23,034,814 | $ | 7,966,189 | $ | (51,415,415 | ) | $ | 1,673,977 | |||||||||||||||
CONDENSED CONSOLIDATED STATEMENT OF CHANGES IN STOCKHOLDERS' EQUITY For the Three Months Ended March 31, 2020 and 2019 - USD ($) | ||||||||||||||||||||||||||||
| Preferred stock A | Common stock | Additional paid-in capital | Accumulated deficit | Total | ||||||||||||||||||||||||
| Shares | Amount | Shares | Amount | Amount | Amount | |||||||||||||||||||||||
| Balances, December 31, 2019 | 1,890,354 | $ | 22,307,480 | 4,024,443 | $ | 32,351,876 | $ | 8,774,975 | $ | (65,581,128 | ) | $ | (2,146,797 | ) | ||||||||||||||
| Stock issued for cash | $ | 0 | ||||||||||||||||||||||||||
| Stock issuance fees and expenses | — | $ | 0 | |||||||||||||||||||||||||
| Stock-based compensation expense | — | 25,000 | 85,276 | $ | 110,276 | |||||||||||||||||||||||
| Warrants issued with Dow financing | 71,276 | $ | 71,276 | |||||||||||||||||||||||||
| Net loss | $ | (2,351,291 | ) | $ | (2,351,291 | ) | ||||||||||||||||||||||
| Balances, March 31, 2020 | 1,890,354 | $ | 22,307,480 | 4,024,443 | $ | 32,376,876 | $ | 8,931,527 | $ | (67,932,419 | ) | $ | (4,316,536 | ) | ||||||||||||||
| Balances, December 31, 2018 | 1,890,354 | $ | 22,307,480 | 3,760,268 | $ | 30,268,476 | $ | 8,101,923 | $ | (55,687,160 | ) | $ | 4,990,719 | |||||||||||||||
| Stock issued for cash | 51,250 | 410,000 | $ | 410,000 | ||||||||||||||||||||||||
| Stock issuance fees and expenses | (16,000 | ) | $ | (16,000 | ) | |||||||||||||||||||||||
| Transition adjustment for adoption of new lease standard | (116,319 | ) | $ | (116,319 | ) | |||||||||||||||||||||||
| Stock-based compensation expense | — | 20,000 | 88,288 | $ | 108,288 | |||||||||||||||||||||||
| Warrants issued with Dow financing | — | $ | 0 | |||||||||||||||||||||||||
| Net loss | $ | (2,200,176 | ) | $ | (2,200,176 | ) | ||||||||||||||||||||||
| Balances, March 31, 2019 | 1,890,354 | $ | 22,307,480 | 3,811,518 | $ | 30,682,476 | $ | 8,190,211 | $ | (58,003,655 | ) | $ | 3,176,512 | |||||||||||||||
See notes to unaudited condensed consolidated financial statements
| 6 |
| XG Sciences, Inc. | ||||||||
| CONDENSED CONSOLIDATED STATEMENTS OF CASH FLOWS | ||||||||
| (unaudited) | ||||||||
| For the Three Months Ended March 31, | ||||||||
| 2020 | 2019 | |||||||
| CASH FLOWS FROM OPERATING ACTIVITIES | ||||||||
| Adjustments to reconcile net loss to net cash used in operating activities: | ||||||||
| Net loss | $ | (2,351,291 | ) | $ | (2,200,176 | ) | ||
| Depreciation | 216,013 | 194,055 | ||||||
| Amortization of intangible assets | 18,047 | 15,858 | ||||||
| Stock-based compensation expense | 110,276 | 108,288 | ||||||
| Non-cash interest expense | 179,086 | 13,166 | ||||||
| Changes in current assets and liabilities: | ||||||||
| Accounts receivable | (49,104 | ) | 393,201 | |||||
| Inventory | 16,876 | (45,688 | ) | |||||
| Other current and non-current assets | 29,075 | (2,613 | ) | |||||
| Accounts payable and other liabilities | 201,385 | (313,986 | ) | |||||
| NET CASH USED IN OPERATING ACTIVITIES | (1,629,637 | ) | (1,837,895 | ) | ||||
| CASH FLOWS FROM INVESTING ACTIVITIES | ||||||||
| Purchases of property and equipment | (6,290 | ) | (217,021 | ) | ||||
| Purchases of intangible assets | (34,929 | ) | (25,623 | ) | ||||
| NET CASH USED IN INVESTING ACTIVITIES | (41,219 | ) | (242,644 | ) | ||||
| CASH FLOWS FROM FINANCING ACTIVITIES | ||||||||
| Repayments of capital lease obligations | -- | (15,527 | ) | |||||
| Repayments of long-term loan debt | -- | (157,200 | ) | |||||
| Proceeds from issuance of common stock | -- | 410,000 | ||||||
| Common stock issuance fees and expenses | -- | (16,000 | ) | |||||
| Proceeds from long-term loan | 1,000,000 | |||||||
| NET CASH PROVIDED BY FINANCING ACTIVITIES | 1,000,000 | 221,273 | ||||||
| NET CHANGE IN CASH, CASH EQUIVALENTS AND RESTRICTED CASH | (670,857 | ) | (1,859,266 | ) | ||||
| CASH, CASH EQUIVALENTS AND RESTRICTED CASH, BEGINNING OF PERIOD | 1,129,702 | 4,893,974 | ||||||
| CASH, CASH EQUIVALENTS AND RESTRICTED CASH, END OF PERIOD | 458,845 | 3,034,708 | ||||||
| SUPPLEMENTAL DISCLOSURE OF CASH FLOW INFORMATION: | ||||||||
| Cash paid for interest | -- | -- | ||||||
| Value of preferred stock issued for AAOF capital lease obligations | -- | -- | ||||||
| Value of Warrants issued with Dow financing | 71,276 | -- | ||||||
XG SCIENCES, INC.
CONDENSED CONSOLIDATED STATEMENTS OF CASH FLOWS
(U.S. Dollars)
(Unaudited)
| For the Six Months Ended June 30, | ||||||||
| 2019 | 2018 | |||||||
| CASH FLOWS FROM OPERATING ACTIVITIES | ||||||||
| Net loss | $ | (4,698,687 | ) | $ | (3,647,872 | ) | ||
| Depreciation | 388,110 | 442,231 | ||||||
| Amortization of intangible assets | 31,716 | 26,434 | ||||||
| Provision for bad debts | 26,000 | 5,000 | ||||||
| Stock-based compensation expense | 218,656 | 174,231 | ||||||
| Non-cash interest expense | 39,584 | 170,311 | ||||||
| Non-cash equipment rent expense | — | 106,164 | ||||||
| Changes in current assets and liabilities: | ||||||||
| Accounts receivable | 563,515 | (207,620 | ) | |||||
| Inventory | (305,361 | ) | (72,173 | ) | ||||
| Other current and non-current assets | (46,002 | ) | (101,249 | ) | ||||
| Accounts payable and other liabilities | (353,563 | ) | 755,506 | |||||
| NET CASH USED IN OPERATING ACTIVITIES | (4,136,032 | ) | (2,349,037 | ) | ||||
| CASH FLOWS FROM INVESTING ACTIVITIES | ||||||||
| Purchases of property and equipment | (287,746 | ) | (1,707,364 | ) | ||||
| Purchases of intangible assets | (74,127 | ) | (72,731 | ) | ||||
| NET CASH USED IN INVESTING ACTIVITIES | (361,873 | ) | (1,780,095 | ) | ||||
| CASH FLOWS FROM FINANCING ACTIVITIES | ||||||||
| Repayments of capital lease obligations | (15,528 | ) | (10,661 | ) | ||||
| Repayments of long-term loan debt | (638,220 | ) | — | |||||
| Proceeds from issuance of common stock | 2,013,400 | 3,945,400 | ||||||
| Common stock issuance fees and expenses | (20,000 | ) | (66,598 | ) | ||||
| NET CASH PROVIDED BY FINANCING ACTIVITIES | 1,339,652 | 3,868,141 | ||||||
| NET CHANGE IN CASH, CASH EQUIVALENTS AND RESTRICTED CASH | (3,158,253 | ) | (260,991 | ) | ||||
| CASH, CASH EQUIVALENTS AND RESTRICTED CASH, BEGINNING OF PERIOD | 4,893,974 | 3,041,590 | ||||||
| CASH, CASH EQUIVALENTS AND RESTRICTED CASH, END OF PERIOD | 1,735,721 | 2,780,599 | ||||||
| SUPPLEMENTAL DISCLOSURE OF CASH FLOW INFORMATION: | ||||||||
| Cash paid for interest | 64,626 | 430 | ||||||
| SUPPLEMENTAL DISCLOSURE OF NON-CASH INVESTING AND FINANCING ACTIVITIES: | ||||||||
| Value of preferred stock issued for AAOF capital lease obligations | — | 171,343 | ||||||
*For reporting purposes, restricted cash was included with Cash and Cash Equivalents beginning in April 2018. It has been included in the 2018 Cash and Cash Equivalents amount for the first six months of 2018 for comparable purposes.
See notes to unaudited condensed consolidated financial statements
| 7 |
XG SCIENCES, INC.
NOTES TO UNAUDITED CONDENSED CONSOLIDATED FINANCIAL STATEMENTS
NOTE 1 – NATURE OF BUSINESS AND BASIS OF PRESENTATION
XG Sciences, Inc., a Michigan company located in Lansing, Michigan and its subsidiary, XG Sciences IP, LLC (collectively referred to as “we”, “us”, “our”, or the “Company”) manufactures graphene nanoplatelets made from graphite, using two proprietary manufacturing processes to split natural flakes of crystalline graphite into very small and thin particles, which we sell as xGnP® graphene nanoplatelets. We sell our nanoplatelets in the form of bulk powders or dispersions to other companies for use as additives to make composite and other materials with specialty engineered characteristics. We also manufacture and sell integrated, value-added products containing these graphene nanoplatelets such as greases, composites, thin sheets, inks and coating formulations that we sell to other companies. Additionally, we have licensed our technology to other companies in exchange for royalties and other fees.
Basis of Presentation
The accompanying interim condensed consolidated financial statements are unaudited and have been prepared in accordance with accounting principles generally accepted in the United States of America (“GAAP”) for interim financial information and the instructions to Form 10-Q and do not include all of the information and footnotes required by GAAP for complete financial statements. All intercompany transactions have been eliminated in consolidation.
Certain information and footnote disclosures normally included in our annual audited consolidated financial statements and accompanying notes have been condensed or omitted in these interim condensed consolidated financial statements. Accordingly, the unaudited condensed consolidated financial statements included herein should be read in conjunction with the audited consolidated financial statements for the year ended December 31, 2018,2019, as filed with the Securities and Exchange Commission (“SEC”) on Form 10-K/A10-K on April 3, 2019.29, 2020.
The results of operations presented in this quarterly report are not necessarily indicative of the results of operations that may be expected for any future periods. In the opinion of management, these unaudited condensed consolidated financial statements include all adjustments and accruals, consisting only of normal recurring adjustments that are necessary for a fair statement of the results of all interim periods reported herein.
Use of Estimates
The preparation of our condensed consolidated financial statements in conformity with GAAP requires us to make estimates, judgments and assumptions that affect the reported amounts of assets, liabilities, revenue and expenses, together with amounts disclosed in the related notes to the financial statements. Actual results and outcomes may differ from our estimates, judgments and assumptions. Significant estimates, judgments and assumptions used in these condensed consolidated financial statements include, but are not limited to, those related to revenue, accounts receivable and related allowances, inventory valuations, contingencies, useful lives and recovery of long-term assets, including intangible assets, income taxes, and the fair value of stock-based compensation. These estimates, judgments, and assumptions are reviewed periodically and the effects of material revisions in estimates are reflected in the financial statements prospectively from the date of the change in estimate.
NOTE 2 – UPDATES TO SIGNIFICANT ACCOUNTING POLICIES
Revenue Recognition
Revenues are recognized at a point in time, typically when control of the promised goods is transferred to customers, in an amount that reflects the consideration the Company expects to be entitled to in exchange for those goods. The Company does not recognize revenue in cases where collectability is not probable, and defers the recognition until collection is probable or payment is received.
The Company generally expenses sales commissions when incurred because the amortization period would have been one year or less. These costs are recorded within selling, general and administrative expenses. Customer deposits, deferred revenue and other receipts are deferred and recognized when the revenue is realized and earned.
Revenue related to licensing agreements is recorded upon substantial performance of the terms of the licensing contract. In the case of licensing arrangements that involve up-front payments, revenue is recorded when management determines that the appropriate terms of the contract have been fulfilled. For example, this may occur when technology has been transferred via written documents or, if training is involved, whenever all contracted training has occurred. In the case of licenses where product delivery is also embedded in the deliverable, a portion of revenue would be recognized when products are delivered.
We have also out-licensed certain intellectual property to licensees under terms and conditions of license agreements that specify the intellectual property licensed, the territory, and the type of license. In exchange for these licenses, we have recorded revenues associated with the initial granting of the license and expect to receive royalties based on sales of products produced under these licenses. License revenues are recorded to reflect our performance of requirements under these license agreements. In addition, we record royalty revenues from licensees at the time they are earned.
| 8 |
XG SCIENCES, INC.
NOTES TO UNAUDITED CONDENSED CONSOLIDATED FINANCIAL STATEMENTS
Grant contract revenue is recognized over the life of the contracts as the services are performed or as milestones are met.NOTE 2 – SUMMARY OF SIGNIFICANT ACCOUNTING POLICIES
Amounts received in excess of revenues earned are recorded as deferred revenue.
Liquidity
We have historically incurred recurring losses from operations and we may continue to generate negative cash flows as we implement our business plan. Our consolidated financial statements are prepared using US GAAP as applicable to a going concern, which contemplates the realization of assets and liquidation of liabilities in the normal course of business.
As of August 12, 2019,In December 2016, we had cash on hand of $2,680,604. We believe our cash is sufficient to fund our operations through August 31, 2020 after takingentered into account various sources of fundinga Draw Loan Note and cash received from continued commercial sales transactions. Our primary means for raising funds since 2016 has been through our offering of shares of common stock at a fixed price of $8.00 per share to the general public in a self-underwritten offering (the “Offering” or our “IPO”) and under a draw loan note and agreementAgreement with The Dow Chemical Company (the “Dow Facility”) to provide up to $10 million of secured debt financing at an interest rate of 5% per year, drawable at our request under certain conditions. We drew $2 million at closing, $1 million on each of July 18, 2017, September 22, 2017 and December 4, 2017. After December 1, 2017, an additional $5 million became available under the Dow Facility as a result of the Company having raised $10 million of equity capital after October 31, 2016. We drew $2 million on July 8, 2019, an additional $2 million on November 19, 2019 and, on February 12,2020, we drew the remaining $1 million.
As of June 10, 2020, we had cash on hand of $969,716. Due to lower than expected revenue in 2019 and the current COVID-19 global pandemic impacting both our operations and that of our customers, Management has taken several steps to ensure we are able to fund our operations from existing cash on hand, operating cash flows, additional borrowings and restructured debt obligations.
In March of 2020, we restructured our organization by reducing headcount by 45%, by furloughing substantially all manufacturing employees, and by implementing temporary salary reductions ranging from 15-20% which has resulted in a 58% reduction in annual payroll and related costs. In April 2020, we furloughed additional employees in our R&D and Engineering departments. We also reduced our annual cash run rate for all other expenses by 17%. Salary reductions will be in place until the Company has recorded quarterly revenue of at least $1 million for two consecutive quarters, at which time salaries will return to their previous levels.
In late March / early April of 2020, we applied for relief under the Coronavirus Aid, Relief and Economic Security Act (CARES) by submitting an application with the Small Business Administration (SBA) for an Economic Injury Disaster Loan (“EIDL”) and by submitting an application to an SBA lender bank, PNC, for a Paycheck Protection Plan (“PPP”) loan. On April 12, 2019,18, 2020, we completedreceived an approved and fully executed PPP Term Note for $825,200 with a term of two years, a six-month repayment deferral period, and an annual rate of interest of 1%, with a potential for some or all of the Offering, after selling 2,615,425 sharesloan to be forgiven, dependent upon use of the loan proceeds. On April 20, 2020, we received the $825,200 of proceeds under the Registration StatementPPP loan. On May 17, 2020, the SBA issued us a decline letter for the EIDL for which we have requested reconsideration.
On April 23, 2020, we entered into an amended and restated Draw Loan Note and Agreement and related transaction documents (collectively, the “Amended Dow Facility”) with the Dow Chemical Company to amend the terms of our current loan facility to allow us to structure a private placement of units (“Units”) comprised (in part) of subordinated, secured convertible notes (“Convertible Notes” and such offering, the “Unit Offering”), to support ongoing cash needs. In the Amended Dow Facility, the Company and Dow agreed to 1) extend the term of such loan facility by two years to December 1, 2023, 2) significantly reduce any required prepayment to Dow from the proceeds of new equity or equity-linked financings from the current 30-50% prepayment requirement on the pre-existing Dow Facility to a 10% prepayment requirement in the Amended Dow Facility, which does not begin until after we have raised an additional $7 million in equity or equity-linked capital from the date of the amendment, 3) capitalize all interest payable until such time as we have recorded GAAP revenue of at least $2 million for two consecutive calendar quarters 4) increase the rate of interest to 6.5% per annum from 5% in the pre-existing Dow Facility, and 5) allow for a subordinated security interest to be granted to new investors in the Unit Offering.
Immediately after the execution of the transaction documents related to the Amended Dow Facility, we commenced the Unit Offering in a private placement to accredited investors. The Unit Offering is comprised of the Convertible Notes and a right to exchange two shares of previously issued Common Stock of the Company for two shares of Series B Convertible Preferred Stock of the Company (“Series B Preferred Stock”) for every $8.00 invested in the Unit Offering (the “Exchange Rights”). The Convertible Notes are secured by a junior security interest in all the assets of the Company, bear an interest rate of 7.5% per annum and mature on December 31, 2024. Each investor’s Exchange Rights are exercisable for a period of thirty (30) days after acceptance by the Company of a fully executed subscription agreement.
At the option of each holder, the Convertible Notes are convertible into either i) Series B Preferred Stock at a conversion price of $8.00/share; or ii) any other form of preferred or common stock (“Subsequent Stock”) issued by the Company at a conversion price per share equal to 80% of the purchase price per share at which such Subsequent Stock is sold (or if the value per share is fixed, 120% of the number of shares that might otherwise be issuable).
If and when we raise at least $15 million of equity capital (excluding capital raised in this Unit Offering), the Convertible Notes will be automatically converted into whichever of the following equity securities would result in the greatest number of shares of Common Stock being issued to the holders on an “as-if-converted” basis at such time: (i) Series B Preferred Stock at a note conversion price of $8.00/share; or (ii) Subsequent Stock at a note conversion price per share equal to 80% of the purchase price per share at which such Subsequent Stock is sold (or if the value per share is fixed, 120% of the number of shares that might otherwise be issuable); provided, however, in the event the Company raises at least $15 million of equity capital within one hundred and twenty (120) days after the first issue date of Convertible Notes, such percentages will be changed to 90% of the purchase price per share at which such Subsequent Stock is sold (or, if the value per share is fixed, 110% of the number of shares that might otherwise be issuable).
| 9 |
Each share of Series B Preferred Stock has an original issue price of $8.00 per share (the “Series B Original Issue Price”) and a liquidation preference of $8.00 per share, with both the Series B Original Issue Price and the liquidation preference per share subject to adjustment for stock splits, recapitalizations, and the like. The Series B Preferred Stock will be senior to the Company’s Common Stock and pari-passu with the Series A Preferred Stock in terms of right of repayment in a liquidation.
The Series B Preferred Stock has full ratchet antidilution protection that provides that each share of Series B Preferred Stock outstanding may be converted by an Investor at any time into that number of shares of Common Stock determined by dividing the then current Series B Original Issue Price by the applicable Conversion Price (as defined below) with the resulting fraction equal to the “Series B Conversion Rate”. The total proceedsnumber of $20,923,400. shares of Common Stock issuable will be equal to the number of shares of Series B Preferred Stock being converted multiplied by the Series B Conversion Rate. The “Conversion Price” is, at any time, the price per share equal to the lesser of a) the Series B Original Issue Price per share and b) the lowest price per share at which the Company has sold equity or equity-linked securities (other than customary exclusions) at any future date while any shares of the Series B Preferred Stock remain outstanding. The Series B Original Issue Price and Conversion Price in effect at any time are also subject to proportional adjustment for share splits, share dividends, recapitalizations and the like.
On July 8, 2019 we borrowed $2 million underApril 23, 2020, certain members of our Board of Directors and their affiliates purchased $550,000 of Units. In additions, these Board members and their affiliates have made additional commitments to the draw loan note and agreement with The Dow Chemical Company (the “Dow Facility”). We have $3to match any purchases of Units by disinterested third parties on a dollar for dollar basis up to an additional $1.5 million of proceedsUnits purchased by such disinterested parties.
Taking into consideration our current cash on hand, we estimate that we will need to raise approximately $500,000- $1,000,000 of additional capital in order to continue our operations for the next twelve months in a minimal to no revenue growth environment. If we are able to raise $1.5 million of capital from disinterested third parties, the Dow Facility availablecommitments from our Board members to us,match this amount would result in $3.0 million of total capital to the Company, which we intendestimate would allow the Company to be our primary source of liquidity at this time (See Note 3). continue operating for 24 months in a minimal to no revenue growth environment.
There has been no public market for our securities and a public market may never develop, or, if any market does develop, it may not be sustained. Our common stockCommon Stock is not currently quoted on or traded on any exchange or on any over-the-counter market. In the event we are unable to fund our operations from existing cash on hand, operating cash flows, additional borrowings or raising equity capital, we may be forced to reduce our expenses, slow down our growth rate, or discontinue operations. Our condensed consolidated financial statements do not include any adjustments relating to the recoverability and classification of recorded asset amounts or the amounts and classification of liabilities that might be necessary should we be unable to continue as a going concern.
XG SCIENCES, INC.
NOTES TO UNAUDITED CONDENSED CONSOLIDATED FINANCIAL STATEMENTS
Inventory
| The following amounts were included in inventory at the end of the period: | ||||||||
| June 30, | December 31, | |||||||
| 2019 | 2018 | |||||||
| Raw materials | $ | 66,395 | $ | 48,371 | ||||
| Consumables | 160,630 | 188,764 | ||||||
| Finished goods | 738,553 | 423,082 | ||||||
| Total | $ | 965,578 | $ | 660,217 | ||||
Recent Accounting Pronouncements
In February 2016, the FASB issued Accounting Standards Update No. 2016-02,Leases (“ASU 2016-02”). The new standard establishes a right-of-use (“ROU”) model that requires a lessee to record a ROU asset and a lease liability on the balance sheet for all leases with terms longer than 12 months. Leases will be classified as either finance or operating, with classification affecting the pattern of expense recognition in the income statement. The new standard must be adopted using a modified retrospective transition and requires application of the new guidance at the beginning of the earliest comparative period presented. We adopted ASU 2016-02 as of January 1, 2019.
Adoption of Lease Accounting Policy
We applied ASU 2016-02 and all related amendments (“ASC 842”) using the modified retrospective method by recognizing the cumulative effect of adoption as an adjustment to the opening balance of retained earnings at January 1, 2019. Therefore, the comparative information has not been adjusted and continues to be reported under prior leasing guidance. As a result, in the first quarter of 2019 we recorded ROU assets of $1,871,366. We also recorded lease liabilities of $1,981,795. The decrease to retained earnings was $116,319, reflecting the cumulative impact of the accounting change. The standard did not have a material effect on consolidated net income or cash flows.
Right-of-use assets represent our right to use an underlying asset for the lease term and lease liabilities represent our obligation to make lease payments arising from the lease. As our leases do not provide an implicit rate, we used our incremental borrowing rate based on the information available at commencement date in determining the present value of lease payments. Lease expense for lease payments is recognized on a straight-line basis over the lease term.
We do not record a ROU asset or lease liability for leases with an expected term of 12 months or less. The comparative information has not been adjusted and continues to be reported under prior leasing guidance.
| 10 |
XG SCIENCES, INC.
NOTES TO UNAUDITED CONDENSED CONSOLIDATED FINANCIAL STATEMENTS
Inventory
The following amounts were included in inventory at the end of the period:
| March 31, | December 31, | |||||||
| 2020 | 2019 | |||||||
| Raw Materials | $ | 57,779 | $ | 68,784 | ||||
| Consumables | 70,103 | 70,103 | ||||||
| Finished Goods | 746,828 | 752,700 | ||||||
| Total | $ | 874,710 | $ | 891,587 | ||||
| 874,710 | 891,587 | |||||||
Recent Accounting Pronouncements
In December 2019, the FASB issued ASU 2019-12, "Income Taxes (Topic 740): Simplifying the Accounting for Income Taxes," which simplifies the accounting for income taxes by removing certain exceptions to the general principles in Topic 740. The amendments also improve consistent application of and simplify GAAP for other areas of Topic 740 by clarifying and amending existing guidance. ASU 2019-12 is effective for us for annual periods beginning January 1, 2021. We are currently reviewing the provisions of this new pronouncement, and the impact, if any, the adoption of this guidance has on our financial position and results of operations.
In January 2020, the FASB issued ASU 2020-01, "Investments—Equity Securities (Topic 321)", "Investments—Equity Method and Joint Ventures (Topic 323)", and "Derivatives and Hedging (Topic 815): Clarifying the Interactions between Topic 321, Topic 323, and Topic 815", which clarifies that an entity should consider observable transactions when either applying or discontinuing the equity method of accounting for the purposes of applying the measurement alternative in accordance with Topic 321. ASU 2020-01 clarifies that for certain forward contracts or purchased options to acquire investments, an entity should not consider whether, upon settlement of the forward contract or exercise of the purchased option, the underlying securities would be accounted for under the equity method or the fair value option. ASU 2020-01 is effective for us for annual periods beginning January 1, 2021. Early adoption is permitted. We are currently reviewing the provisions of this new pronouncement and the impact, if any, the adoption of this guidance has on our financial position and results of operations.
In March 2020, the FASB issued ASU 2020-04, "Reference Rate Reform (Topic 848): Facilitation of the Effects of Reference Rate Reform on Financial Reporting," which provides optional guidance and expedients for applying GAAP to contracts, hedging relationships, and other transactions affected by reference rate reform if certain criteria are met. The amendments are intended to ease the potential burden in accounting for (or recognizing the effects of) reference rate reform on financial reporting. The amendments in this update are elective and are effective upon issuance. We are currently assessing whether and how we will elect to apply ASU 2020-04.
With the exception of the standards discussed above, we believe there have been no new accounting pronouncements effective or not yet effective that have significance, or potential significance, to our Consolidated Financial Statements.
| 11 |
XG SCIENCES, INC.
NOTES TO UNAUDITED CONDENSED CONSOLIDATED FINANCIAL STATEMENTS
NOTE 3 –FINANCING AGREEMENT
Dow Facility
In December 2016, we entered into the Dow Facility which providesprovided us with up to $10 million of secured debt financing at an interest rate of 5% per year, drawable at our request under certain conditions. We received $2 million at closing and an additional $1 million on each of July 18, 2017, September 22, 2017 and December 4, 2017. After December 1, 2017, respectively.
an additional $5 million became available under the Dow Facility as a result of the Company having raised $10 million of equity capital after October 31, 2016. We drew $2 million on July 8, 2019, an additional $2 million on November 19, 2019 and, on February 12,2020, we drew the remaining $1 million and issued warrants to purchase up to 25,000 more of our shares of Common Stock.
The Dow Facility is senior to our other debt and is secured by all of our assets. It maturesassets (Dow was subordinate only to the capital leases with AAOF which was paid off and closed December 31, 2018).
Under the original terms, the loan matured on December 1, 2021 (subject to certain mandatory prepayments based on our equity financing activities). WhenIn addition, after we raiseraised a cumulative amount of equity capital exceeding $15 million, we arewere required to prepay an amount equal to 30% of the amount raised over $15 million, but less than $25 million.
We began these prepayments on equity raised as of September 10, 2018. Interest was payable beginning January 1, 2017 although we had elected, per the Dow facility,loan documents, to capitalize the interest as part of the outstanding debt through January 1, 2019. Beginning April 1, 2019, current interest iswas payable in cash on the first day of each quarter, and accordingly, has been paid on April 1, 2019 and July 1, 2019 infollowing the amounts of $64,626 and $59,709, respectively.quarter.
Dow received warrant coverage of one share of common stock for each $40 in loans received by us, equating to 20% warrant coverage, with an exercise price of $8.00 per share for the warrants issued at closing of the initial $2 million draw. After the initial closing, the strike price of future warrants issued is subject to adjustment if we sell shares of common stock at a lower price. As of June 30, 2019,March 31, 2020, we hadhave issued 125,000250,000 warrants to Dow, which are exercisable on or before the expiration date of December 1, 2023.
On April 23, 2020, we entered into an amended and restated Draw Loan Note and Agreement and related transaction documents (collectively, the “Amended Dow Facility”) whereby the Company and Dow agreed to 1) extend the term of such loan facility by two years to December 1, 2023, 2) significantly reduce any required prepayment to Dow from the proceeds of new equity or equity-linked financings from the current 30-50% prepayment requirement on the pre-existing Dow Facility to a 10% prepayment requirement in the Amended Dow Facility, which does not begin until after we have raised an additional $7 million in equity or equity-linked capital from the date of the amendment, 3) capitalize all interest payable until such time as we have recorded GAAP revenue of at least $2 million for two consecutive calendar quarters, 4) increase the rate of interest to 6.5% per annum from 5% in the pre-existing Dow Facility, and 5) allow for a subordinated security interest to be granted to new investors in the Unit Offering.
The aforementioned warrants meet the criteria for classification within stockholders’ equity. Proceeds were allocated between the debt and the warrants at their relative fair value.value on the date of issue. The total debt discount on the Dow Facility was approximately $372,372. The$676,000. This debt discount is being amortized to interest expense using the effective interest method over the term of the loans using an average effective interest rate of 7.67%8.2%. During the sixthree months ended June 30, 2019,March 31, 2020, we recognized $163,919$179,085 of amortization expense consisting of $124,335$115,318 of interest expense accrued and $39,584$63,767 of amortization from debt discount accretion related to the Dow Facility.Facility warrants. We have repaid $816,710 of outstanding principal onborrowed an additional $1,000,000 in the debt,three months ended March 31, 2020, resulting in a carrying value of $4,323,953$9,219,420 for the Dow Facility as of June 30, 2019.March 31, 2020.
The Dow Facility entitles Dow to appoint an observer to our Board. Dow will maintain this observation right until the later of December 1, 2019 or when the amount of principal and interest outstanding under the Dow Facility is less than $5 million.
XG SCIENCES, INC.
NOTES TO UNAUDITED CONDENSED CONSOLIDATED FINANCIAL STATEMENTS
NOTE 4 – STOCK WARRANTS ACCOUNTED FOR AS EQUITY INSTRUMENTS
The following table summarizes the warrants (including the warrants previously accounted for as derivatives) outstanding at June 30, 2019,March 31, 2020, which are accounted for as equity instruments, all of which are exercisable:
| Date Issued | Expiration Date | Indexed Stock | Exercise Price | Number of Warrants | Expiration Date | Indexed Stock | Exercise Price | Number of Warrants | ||||||||||||||||
| 07/01/2009 | 07/01/2019 | Common | $ | 8.00 | 6,000 | |||||||||||||||||||
| 10/08/2012 | 10/08/2027 | Common | $ | 12.00 | 5,000 | 10/08/2027 | Common | $ | 12.00 | 5,000 | ||||||||||||||
| 01/15/2014 - 12/31/2014 | 01/15/2024 | Series A Convertible Preferred | $ | 6.40 | 972,720 | 01/15/2024 | Series A Convertible Preferred | $ | 12.00 | 972,720 | ||||||||||||||
| 04/30/2015- 05/26/2015 | 04/30/2022 | Common | $ | 16.00 | 218,334 | 04/30/2022 | Common | $ | 16.00 | 218,334 | ||||||||||||||
| 06/30/2015 | 06/30/2022 | Common | $ | 16.00 | 6,563 | 06/30/2022 | Common | $ | 16.00 | 6,563 | ||||||||||||||
| 12/31/2015 | 12/31/2020 | Common | $ | 8.00 | 20,625 | 12/31/2020 | Common | $ | 8.00 | 20,625 | ||||||||||||||
| 03/31/2016 | 03/31/2021 | Common | $ | 10.00 | 10,600 | 03/31/2021 | Common | $ | 10.00 | 10,600 | ||||||||||||||
| 04/30/2016 | 04/30/2021 | Common | $ | 10.00 | 895 | 04/30/2021 | Common | $ | 10.00 | 895 | ||||||||||||||
| 12/14/2016 | 12/01/2023 | Common | $ | 8.00 | 50,000 | 12/01/2023 | Common | $ | 8.00 | 50,000 | ||||||||||||||
| 07/18/2017 | 12/01/2023 | Common | $ | 8.00 | 25,000 | 12/01/2023 | Common | $ | 8.00 | 25,000 | ||||||||||||||
| 09/22/2017 | 12/01/2023 | Common | $ | 8.00 | 25,000 | 12/01/2023 | Common | $ | 8.00 | 25,000 | ||||||||||||||
| 12/04/2017 | 12/01/2023 | Common | $ | 8.00 | 25,000 | 12/01/2023 | Common | $ | 8.00 | 25,000 | ||||||||||||||
| 07/08/2019 | 12/01/2023 | Common | $ | 8.00 | 50,000 | |||||||||||||||||||
| 11/01/2019 | 12/01/2023 | Common | $ | 8.00 | 50,000 | |||||||||||||||||||
| 02/12/2020 | 12/01/2023 | Common | $ | 8.00 | 25,000 | |||||||||||||||||||
| 1,365,737 | 1,484,737 | |||||||||||||||||||||||
Each warrant indexed to Series A Convertible Preferred Stock is currently exercisable and exchangeable into 1.875 shares of common stock. On a common stock equivalent basis, the exercise price would equal $6.40/common share.
NOTE 5 – STOCKHOLDERS’ EQUITY (DEFICIT)
Series B Convertible Preferred Stock
Common Stock
TheAs of March 31, 2020, and December 31, 2019, the Company iswas authorized to issue 25,000,000up to 1,500,000 shares of common stock, no par value per shareSeries B Preferred Stock, of which 4,011,943 and 3,760,268 sharesnone were issued and outstanding as of June 30, 2019March 31, 2020 and December 31, 2018, respectively.2019.
During the six months ended June 30, 2019 the Company issued 251,675 shares of common stock pursuant to the Offering. During the six months ended June 30, 2018 the Company issued 493,175 shares of common stock pursuant to the Offering. Upon its completion on April 12, 2019, the Company had sold 2,615,425 shares of common stock in its IPO at a price of $8.00 per share for gross proceeds of $20,923,400.
Potentially dilutive securities consist of shares potentially issuable pursuant to stock options and warrants as well as shares that would result from full conversion of all outstanding convertible securities. These potentially dilutive securities were 3,013,987 and 2,903,987 as of June 30, 2019 and 2018, respectively, and are excluded from diluted net loss per share calculations because they are anti-dilutive.
Series A Convertible Preferred Stock
The Company is authorized to issue up to 3,000,000 shares of Series A Convertible Preferred Stock (the “Series A Preferred”). Each share of the Series AB Preferred, which has a liquidation preference of $12.00 per share, is convertible at any time, at the option of the holder, into one share of common stock at the lower of: (a) $12.00 per share, or (b) 80% of the price at which the Company sells any equity or equity-linked securities in the future.stock. The Series AB Preferred also contains typical anti-dilution provisions that provide for adjustment of the conversion price to reflect stock splits, stock dividends, or similar events. TheEach share of Series AB Preferred is subject to mandatory conversion into common stock at the then-effective Series B conversion rate upon the public listing by the Company of the Company’sits common stock on a Qualified National Exchange. However, the Series AB Preferred is not subject to the mandatory conversion until all outstanding convertible securitiesConvertible Securities are also converted into common stock. The Series AB Preferred ranks senior to all other equity or equity equivalent securities of the Company other than those securities which are explicitly senior or pari passu in rights and liquidation preference to the Series AB Preferred and pari passu with the Company’s Series B Preferred Stock.A Preferred.
The
On April 27, 2020, the Company issued 1,456,126 sharesfiled the Second Amended and Restated Certificate of Designations of the Series AB Preferred Stock in connection with the conversion of certain convertible notes on December 31, 2015.
In December 2015,Unit Offering and the Amended Dow Facility, lowering the liquidation preference from $16.00 per share to $8.00 per share, and lowering the conversion price from $16.00 per share to $8.00 per share, among other things. The Company also adjusted certain provisions to harmonize the rights of the Series B Preferred with the rights in the Series A Preferred was reduced from $12.00 to $6.40 (80%Certificate of $8.00), and thus, each share ofDesignations.
The Series A Preferred Stock is convertible into 1.875 shares of common stock. During the period from May 17, 2016 through December 31, 2018and Series B Preferred are not redeemable for cash and the Company issued shares of Series A Preferred Stockconcluded that they are more akin to Aspen Advanced Opportunity Fund, LP (“AAOF”)equity-type instruments than debt-type instruments. Accordingly, the embedded conversion option in each agreement is clearly and closely related to an equity-type host and the conversion option does not require classification and measurement as paymenta derivative financial instrument. Therefore, the securities meet the conditions for lease financing obligations under the terms of a Master Leasing Agreement.stockholders’ equity classification.
As of June 30, 2019, and December 31, 2018, the Company had 1,890,354 shares of Series A Preferred Stock issued and outstanding which is currently convertible into 3,544,414 shares of our common stock.
XG SCIENCES, INC.
NOTES TO UNAUDITED CONDENSED CONSOLIDATED FINANCIAL STATEMENTS
NOTE 6 – EQUITY INCENTIVE PLAN
We previously established the 2007 Stock Option Plan (the “2007 Plan”), which was scheduled to expire on October 30, 2017 and under which we granted key employees and directors options to purchase shares of our common stock at not less than fair market value as of the grant date. On May 4, 2017, the Board approved the 2017 Equity Incentive Plan (the “2017 Plan”) to replace the 2007 Plan, which became effective upon the approval of the stockholders holding a majority of the voting power in the Company on July 18, 2017. The 2017 Plan replaces the 2007 Plan and authorizes us to issue awards (stock options and restricted stock) with respect of a maximum of 1,200,000 shares of our common stock, which equals the number of shares authorized under the 2007 Plan.
On July 24, 2017, certain stock options from the 2007 Plan were cancelled and replacement stock options were awarded. The replacement stock option awards have an exercise price of $8.00 per share, a seven-year term, are vested 50% on date of grant with the remaining vesting over a 4-year period from the date issued and are subject to certain other terms. Each option holder received options equal to 150% of the number of cancelled stock options. The cancellation and reissuance of the stock options were treated as a modification under ASC 718, Compensation-Stock Compensation. Incremental compensation cost of approximately $1,015,758 was measured as the excess of the fair value of the modified award over the fair value of the original award immediately before the terms were modified. Compensation cost of approximately $501,071 was recorded on the date of cancellation for awards that were vested on the date of the modification. For unvested awards, compensation cost of approximately $514,687 will be recorded over the remaining requisite service period.
On September 30, 20182019 and August 10, 2017,September 30, 2018, the Company granted each Board member 2,500 stock options and 2,500 shares of restricted stock for their Board services. The options were granted at a price of $8.00 per share and vest ratably over a four-year period beginning on the one-year anniversary. The options had an aggregate grant date fair value of $29,580$38,295 and $26,120$29,580 on September 30, 20182019 and August 10, 2017,September 30, 2018, respectively. The restricted stock issued to the Board members has an aggregate fair value of $160,000$260,000 and vestvests ratably in arrears over four quarters on the last day of each fiscal quarter following the grant date. As of June 30,March 31, 2020, and 2019, 20,00029,375 and 17,500 of the 20,00032,500 shares of restricted stock issued had vested, resulting in compensation expense of $25,000 and $20,000 for the period ended June 30, 2019.
During the three months ended June 30, 2019, the Company granted 20,000 employee stock options. The options were granted at a price of $8.00 per share and had an aggregate grant date fair value of $61,644. The options vest ratably over a four-year period beginning on the one-year anniversary. The fair value of the options granted was estimated on the date of grant using the Black Scholes option-pricing model using the following assumptions: Stock price: $8.00, Exercise Price: $8.00, Expected Term: 4.75 years, Volatility: 42.71%, Risk free rate: 1.76%, Dividend rate: 0%.
All options granted thus far under the 2017 Plan have an exercise price of $8.00 per share and vesting of the options ranges from immediate to 25% per year, with most options vesting 25% per year beginning on the one-year anniversary of the grant date. The options expire seven years from the date of grant.
Stock-based compensation expense was $110,368for the three months ended June 30, 2019. As of June 30,March 31, 2020 and March 31, 2019 there was approximately $632,744 in unrecognized compensation cost related to the options granted under the 2017 plan. We expect to recognize these costs over the remaining vesting terms, ranging from 3 to 4 years.and 2018, respectively.
A summary of
The following table shows the stock options availableactivity as of June 30, 2019March 31, 2020 is as follows:
| Weighted | Weighted | |||||||||||||||
| Number | Average | Number | Average | |||||||||||||
| Of | Exercise | Of | Exercise | |||||||||||||
| Options | Price | Options | Price | |||||||||||||
| Options outstanding at March 31, 2019 | 805,375 | $ | 8.00 | |||||||||||||
| Options outstanding at December 31, 2019 | 839,625 | $ | 8.00 | |||||||||||||
| Changes during the period: | ||||||||||||||||
| Expired | — | 8.00 | (65,000 | ) | 8.00 | |||||||||||
| New Options Granted – at market price | 20,000 | 8.00 | 8.00 | |||||||||||||
| Options outstanding at June 30, 2019 | 825,375 | $ | 8.00 | |||||||||||||
| Options exercisable at June 30, 2019 | 384,025 | $ | 8.00 | |||||||||||||
| Options outstanding at March 31, 2020 | 774,625 | $ | 8.00 | |||||||||||||
| Options exercisable at March 31, 2020 | 514,011 | $ | 8.00 | |||||||||||||
XG SCIENCES, INC.
NOTES TO UNAUDITED CONDENSED CONSOLIDATED FINANCIAL STATEMENTS
NOTE 7 – LEASES
Right of Use Asset and Leased Liability:
Estimated Lease Life – Lease term through December 2022
| Right-of-use lease assets- operating as of March 31, 2019 | $ | 1,871,366 | ||
| Less: Accumulated amortization | (104,097 | ) | ||
| Right-of-use lease assets- operating as of June 30, 2019 | $ | 1,767,269 | ||
| Lease liability-operating as of March 31, 2019 | $ | 1,981,795 | ||
| Less: Accumulated Amortization | (108,443 | ) | ||
| Lease liability operating-as of June 30, 2019 | $ | 1,873,352 | ||
| Operating lease expense for the three months ended June 30, 2019 | $ | 150,557 | ||
| Actual remaining lease payments | $ | 2,214,410 | ||
| Present value of remaining payments | $ | 1,873,352 |
Supplemental cash flow information related to leases:
| Leases | ||||
| Three months | ||||
| ended | ||||
| June 30, 2019 | ||||
| Cash paid for amounts included in the measurement of lease liabilities: | ||||
| Operating cash flows from operating leases | $ | 154,903 | ||
| Weighted average remaining lease term- operating leases (in months) | 40 | |||
| Weighted average discount rate- operating leases (annual) | 9.98 | % | ||
| Maturities of leases liabilities were as follows: | ||||
| Year ending December 31, 2019 (excluding the three months ended June 30, 2019) | $ | 309,806 | ||
| Year ending December 31, 2020 | 622,878 | |||
| Year ending December 31, 2021 | 638,178 | |||
| Year ending December 31, 2022 | 643,547 | |||
| Total Lease payments | 2,214,409 | |||
| Less imputed interest | (341,057 | ) | ||
| Total | $ | 1,873,352 | ||
With the exception of the standards discussed above, we believe there have been no new accounting pronouncements issued that would have a material impact, to our Consolidated Financial Statements.
| Three Months Ended March 31, 2019 | Three Months Ended March 31, 2020 | |||||||
| Right-of-use lease assets- operating as of January 1, 2019 and 2020, respectively | $ | 1,982,739 | $ | 1,606,443 | ||||
| Less: Accumulated amortization | (111,373 | ) | (120,332 | ) | ||||
| Right-of-use lease assets- operating as of current qtr-end | $ | 1,871,366 | $ | 1,486,112 | ||||
| Lease liability-operating as of January 1, 2019 and 2020, respectively | $ | 2,094,958 | $ | 1,704,068 | ||||
| Less: Accumulated Amortization | (113,163 | ) | (124,538 | ) | ||||
| Lease liability operating-as of current qtr-end | $ | 1,981,795 | $ | 1,579,531 | ||||
| Operating lease expense for the twelve months ended March 31 | $ | 150,557 | $ | 159,958 | ||||
| Actual remaining lease payments | $ | 2,369,312 | $ | 1,800,209 | ||||
| Present value of remaining payments | $ | 1,981,795 | $ | 1,579,531 | ||||
| Supplemental cash flow information related to leases: | ||||||||
| Leases Three Months Ended March 31, 2019 | Leases Three Months Ended March 31, 2020 | |||||||
| Cash paid for amounts included in the measurement of lease liabilities: | ||||||||
| Operating cash flows from operating leases | $ | 152,347 | $ | 164,164 | ||||
| The undiscounted annual future lease payments summarized by year in the table below: | ||||||||
| Maturities of leases liabilities were as follows: | ||||||||
| Year ending December 31, 2019 (excluding the three months ended March 31, 2019) | $ | 464,708 | ||||||
| Year ending December 31, 2020 | 622,878 | $ | 496,223 | |||||
| Year ending December 31, 2021 | 638,178 | 660,438 | ||||||
| Year ending December 31, 2022 | 643,548 | 643,548 | ||||||
| Total Lease payments | $ | 2,369,312 | $ | 1,800,209 | ||||
| Less imputed interest | (387,517 | ) | (220,678 | ) | ||||
| Total | $ | 1,981,795 | $ | 1,579,531 | ||||
| Weighted average remaining lease term- operating leases ( in months) | 41.2 | 28.5 | ||||||
| Weighted average discount rate- operating leases (annual) | 9.98 | % | 9.98 | % | ||||
XG SCIENCES, INC.
NOTES TO UNAUDITED CONDENSED CONSOLIDATED FINANCIAL STATEMENTS
NOTE 8 – RELATED PARTY TRANSACTIONS
We have a licensing agreement for exclusive use of patents and pending patents with Michigan State University (“MSU”), a shareholder of the Company via the MSU Foundation. During the three months ended June 30,March 31, 2020 and 2019 and 2018 we recorded licensing expense of zero and $12,500 per quarter.
Wequarter, respectively. Effective January 1, 2020, we have also entered into product licensing agreements with certain other shareholders. Nosuspended accruing any royalty revenue or expenses have been recognized related to these agreements duringpayable under this license as we renegotiate the three and six months ended June 30, 2019 or the three and six months ended June 30, 2018.agreement.
During the three months ended June 30, 2019March 31, 2020 we did not issue any Series A Preferred or Series B Preferred stock. For
NOTE 10 – SUBSEQUENT EVENTS
On April 1, 2020, we capitalized the sixDow Facility interest expense of $115,318 for the three months ended JuneMarch 30, 2018,2020, which would normally have been payable on April 1, 2020 but was permitted to be capitalized and included in the opening loan balance for purposes of the Amended Dow Facility effective April 22, 2020.
During the period from April 1 through the filing date of this report, we issued 7,140 sharesentered into the Amended Dow Facility, commenced the Unit Offering and received $550,000 in funding therefrom, we amended and restated our Certificate of Designation of Series AB Preferred stock to AAOFStock, received a Paycheck Protection Program loan of $825,200, and received a $10,000 Economic Industry Disaster Loan grant, all of which was disclosed in detail in the Company’s Annual Report on Form 10-K as payment for lease financing obligations under the terms of the Master Lease Agreement, dated March 18, 2013.filed April 29, 2020.
ITEM 2. Management’s Discussion and Analysis of Financial Condition and Results of Operations
Forward-Looking Statements
In this Quarterly Report on Form 10-Q, unless otherwise indicated, the words “we”, “us”, “our”, “XG”, “XGS”, “XG Sciences” or the “Company” refer to XG Sciences, Inc. and its wholly owned subsidiary, XG Sciences IP, LLC, a Michigan limited liability company.
Introduction
The following discussion and analysis should be read in conjunction with the unaudited condensed consolidated financial statements, and the notes thereto included herein. The information contained below includes statements of the Company’s or management’s beliefs, expectations, hopes, goals and plans that, if not historical, are forward-looking statements subject to certain risks and uncertainties that could cause actual results to differ materially from those anticipated in the forward-looking statements. For a discussion on these risk factors, please refer to the Company’s Annual Report on Form 10-K as filed April 29, 2020. For a discussion on forward-looking statements, see the information set forth in the introductory note to this quarterly report on Form 10-Q under the caption “Forward-Looking Statements”, which information is incorporated herein by reference.
Overview of our Business
XG Sciences was formed in May 2006 for the purpose of commercializing certain technology to produce graphene nanoplatelets and integrated, value-added products containing graphene nanoplatelets. First isolated and characterized in 2004, graphene is a single layer of carbon atoms configured in an atomic-scale honeycomb lattice. Among many noted properties, monolayer graphene is harder than diamonds, lighter than steel but significantly stronger, and conducts electricity better than copper. Graphene nanoplatelets are particles consisting of multiple layers of graphene. Graphene nanoplatelets have unique capabilities for energy storage, thermal conductivity, electrical conductivity, barrier properties, lubricity and the ability to impart physical property improvements when incorporated into plastics, metals or other matrices.
We believe the unique properties of graphene and graphene nanoplatelets will enable numerous new product applications and the market for such products will quickly grow to be a significant market opportunity. Our business model is to design, manufacture and sell advanced materials we call xGnP® graphene nanoplatelets and value-added products incorporating xGnP® nanoplatelets. We currently have hundreds ofmany customers trialing our products for numerous applications, including, but not limited to lithium ion batteries, lead acid batteries, thermally conductive adhesives, composites, thermal management and heat transfer, inks and coatings, printed electronics, construction materials, cement, and in a range of other industrial uses. We believe our proprietary processes have enabled us to be a low-cost producer of high-quality, graphene nanoplatelets and value-added integrated products containing graphene nanoplatelets and that we are well positioned to address a wide range of end-use applications.
Our Customers
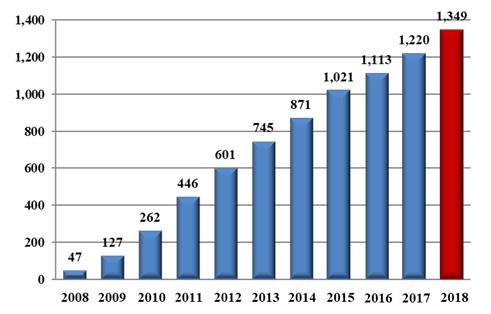
We sell products to customers around the world and have sold materials to over 1,3001,500 customers in 47 countries since 2008. Some of these customers are research organizations and some are commercial organizations. Our customers have included well-known automotive and OEM suppliers around the world (Ford, Johnson Controls, Magna, Honda Engineering), global-scale lithium ion battery manufacturers in the U.S., South Korea and China (Samsung SDI, LG Chemical, Lishen, A123) and diverse specialty material companies (3M, BASF, Henkel, Dow Chemical, DuPont), as well as leading research centers such as Lawrence Livermore National Laboratory and Oakridge National Laboratory. We have also licensed some of our base manufacturing technology to other companies. Our licensees include POSCO, the fifth largest steel manufacturer in the world by 2018 tonnage output, and Cabot Corporation (“Cabot”), a leading global specialty chemicals and performance materials company. These licensees further extend our technology through their customer networks. Ultimately, we believe we will benefit in terms of royalties on sales of xGnP® nanoplatelets produced and sold by our licensees. As can be seen in the below bar chart, the cumulative number of customers has steadily grown over the last ten years.
Cumulative Customers, By Year
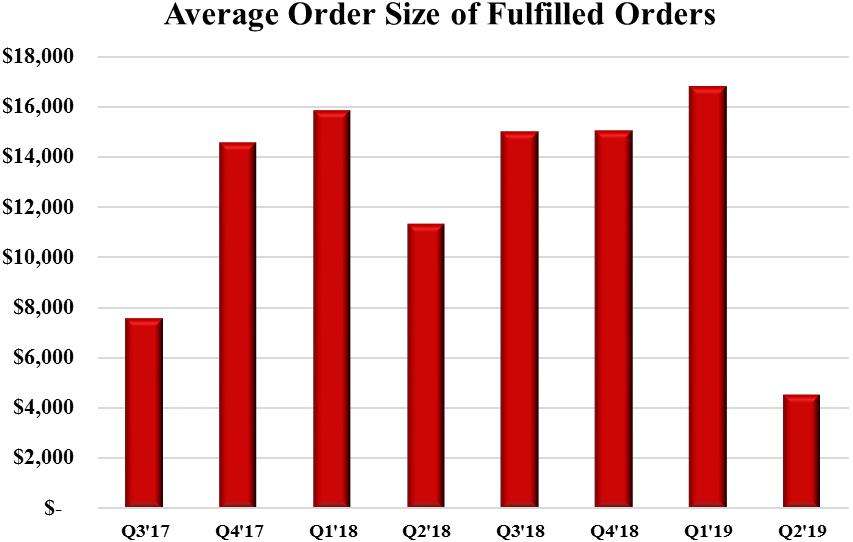
We believe average order size is an early indicator of commercial traction. The majority of our customers are still ordering in smaller quantities consistent with their development and engineering qualification work. As can be seen in the chart below,We expect our quarterly average order size was relatively modest until the second half of 2017, when a number of customers reached commercial status with different product applications. The data below represents orders shipped in the respective quarter and exclude no charge orders targeted mainly for R&D purposes. Despite the average order size decreasing during the three months ended June 20, 2019, we believe that it will continue to increase in 2020 as moremany of our customers commercialize products using our materials. In the three months ended June 30, 2019 the averagehave expressed their intention of beginning to order size was $4,575, a decrease of 60% from $11,345 for the three months ended June 30, 2018. In the 3 months ended June 30, 2019 we shipped 4.1 MTcommercial quantities of product primarilyfrom us in the form of dry powder, a decrease of 63% over the 3 months ended March 31, 2019.2020.
| 17 |
Our Products
XG Sciences is a manufacturer of graphene nanoplatelets marketed under the brand xGnP® and value-added products that contain graphene nanoplatelets. The term “graphene” is used widely in the literature and the popular press to cover a variety of specific forms of the material. We generally think about two broad classes of graphene materials:
| 1. | One-atom thick films of carbon commonly referred to as monolayer graphene, manufactured typically from gases by assembling molecules to form relatively large, transparent sheets of material. These materials have been characterized by their performance attributes that differentiate them from other advanced materials and that may include: strength up to 200 times |
| 2. | Ultra-thin particles of carbon that consist of layers of graphene sheets ranging in thickness from a few layers to many layers – that are commonly referred to as graphene nanoplatelets (“GNP” or “GNPs”). Because GNPs are thin and can be manufactured in a range of diameters, they are useful for a wide variety of applications. XG Sciences manufactures GNPs that range in thickness from a few nanometers and up to 10-20 nanometers and with diameters ranging from less than 1 micron and up to 100 microns. The manufacture of these graphene particles is our main area of expertise, and their use in practical applications is the focus of our sales, marketing and development activities. |
The well-publicized isolation and characterization of graphene in 2004 at the University of Manchester, has spawned a new class of 2D materials based on layers of carbon atoms arranged in a hexagonal array and each carbon having lone pair electrons. The unique characterization and related performance of this new class of materials is derived from their two-dimensional nature and their composition of sp2carbon atoms arranged in a hexagonal array. The ability of any new material to be exploited in industrial applications will depend on its fit-for-performance. In the case of graphene nanoplatelets, the fit-for-performance is very much related to their aspect ratio (among other factors) suchin that the diameter is typically significantly greater than the thickness andthickness. This is what differentiates the material from bulk graphite of high crystallinity and purity. We classify nanoplatelets consisting of largely basel planes of carbon atoms packed in a hexagonal array (i.e., graphene) as graphene nanoplatelets so long as their aspect ratio may be classified as two-dimension and are thus in the form of platelets. Such a definition implies that the thickness is nanoscale – GNPs having a thickness in the range from generally 0.6 nanometers and up to many 10’s of nanometers. For context one nanometer is one billionth of a meter, and the average thickness of a human hair is about 75,000 nanometers. We have chosen to utilize the definitions as set out by the Carbon Journal editorial team (Carbon, volume 65, pp.1-6) and Fullerex (Bulk Graphene Pricing Report, 2019) which provides classification for the various material types which provide meaningful descriptions of commercially available graphene.
Graphene Product Thickness Definitions Based on Thickness
| Number of Layers | Product Description |
| 1 | Graphene (monolayer) |
| 1-3 | Very Few Layer Graphene (vFLG) |
| 2-5 | Few Layer Graphene (FLG) |
| 2-10 | Multilayer Graphene (MLG) |
| >10 | Graphene Nanoplatelets (GNP) |
Bulk Materials.We sell bulk materials under the trademarked brand name of xGnP®graphene nanoplatelets. These materials are produced in various grades, which are analogous to average particle thickness, and average particle diameters. There are three commercial grades (Grades H, M & R), each of which is offered in three standard particle sizes and a fourth, Grade C, Grade, which is offered in three standard surface areas. We also have access to other development grades (Grade T, for example), but which are not yet made available commercially and have been used internally for those products containing graphene nanoplatelets. These bulk materials, which normally ship in the form of a dry powder, are especially applicable for use as additives in polymeric or metallic composites, or in coatings or other formulations where particular electrical, thermal or barrier applications are desired by our customers. We also offer our material in the form of dispersions of nanoplatelets in liquids such as water, alcohol, or organic solvents, or mixed into resins or polymers such as thermoplastics or thermosets. We use two different commercial processes to produce these bulk materials:
Grade H/M/R/T materials are produced through chemical intercalation of natural graphite followed by thermal exfoliation using a proprietary process developed by us. The “grade” designates the thickness and surface characteristics of the material, and each grade is available in various average particle diameters. Surface area, calculated by the Brunauer, Emmet, and Teller (BET) Method, is used as a convenient proxy for thickness, so each grade of products produced through chemical intercalation is designated by its average surface area, which ranges from 50 to 150 m2/ggram of material. We are able to extend the surface area higher (250 m2/ggram for T Grade) but are not yet producing these materials in metric-ton quantities. As the market need emerges for this class of materials, we will scale them as needed. For example, we introduced a new Grade of xGnP®powders, R-Grade, with improved electrical conductivity targeting use in applications for electrically and thermally conductive ink and composites and have scaled R-Grade to metric-ton quantities.
Grade C materials are produced through a high-shear mechanical exfoliation using a proprietary process and equipment that we invented, designed, constructed and patented. The Grade C materials are smaller particles than those grades produced through chemical exfoliation, and Grade C materials are designated by their BET surface area, which ranges from 300 to 800 m2/g.gram. We are able to produce other surface areas and may make those available commercially as needed by our customers.
The following graphic depicts xGnP® graphene nanoplatelets as a function of both layer thickness and aspect ratio (thickness by diameter), two key parameters which will influence their performance in a range of industrial applications.
XG Sciences’ Graphene Nanoplatelet Product Portfolio and Versus Graphite
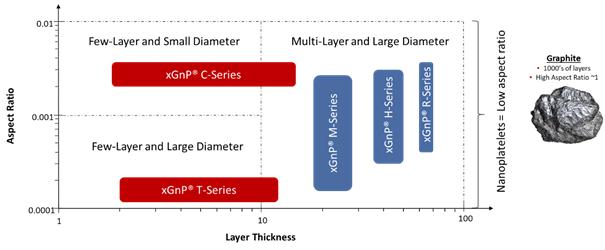
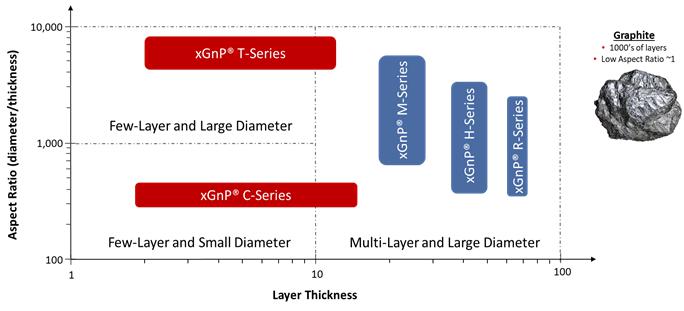
Composites.These consist of compositions of specially designed xGnP® graphene nanoplatelets formulated in pre-dispersed mixtures that can be easily incorporated in various polymers. Our integrated composites portfolio includes pre-compounded resins derived from a range of thermoplastics as well as master batches of resins and xGnP® nanoplatelets and their combination with resins and fibers for use in various end-use applications that may include industrial, automotive, packaging and sporting goods and which have demonstrated efficacy in standard injection molding, compression molding, blow molding and 3-D processes, to name but a few. Our current product portfolio of polymer resins containing various forms of our xGnP®graphene nanoplatelets and in varying concentration includes polyurethane (XGPU), polypropylene (XGPP)PP™), polyethylene terephthalate (XGPET)PET™), vinyl esternylon (XGVE), polyetherimide (XGPEI) Nylon)and high-density polyethylene (XGHDPE)HDPE™). Others polymers may be added over time depending on the end-market and customer needs. In addition, we offer various bulk materials with demonstrated efficacy in plastic composites to impart improved physical performance to such matrices, which may be supplied as dry powders or as aqueous or solvent-based dispersions or cakes as described above. We have also targeted use of our graphene nanoplatelets as an additive in cement mixtures, which we believe results in improved barrier resistance, durability, toughness and corrosion protection. Our GNP®ConcreteXGConcrete™ Additive promotes the formation of more uniform and smaller grain structure in cement. This fine-grain and uniform structure gives the concrete improvements in flexural and compressive strength. In addition, the embedded graphene nanoplatelets will stop cracks from forming and retard crack propagation, should any cracks form – the combination of which will improve lifetime and durability of cement.
Inks and Coatings. These consist of specially-formulated dispersions of xGnP®together with solvents, binders, and other additives to make electrically or thermally conductive products designed for printing or coating and which are showing promise in diverse customer applications such as advanced packaging, electrostatic dissipation and thermal management. We also offer a set of standardized ink formulations suitable for printing. These inks offer the capability to print electrical circuits or antennas and may be suitable for other electrical or thermal applications. All of these formulations can be customized for specific customer requirements.
Energy Storage Materials. These consist of specialty advanced materials that have been formulated for specific applications in the energy storage segment. We offer various bulk materials for use as conductive additives for cathodes and anodes in lithium-ion batteries, as an additive to anode slurries for lead-carbon batteries, as a component in coatings for current collectors in lithium-ion batteries and we are investigating the use of our materials as part of other battery components.
Thermal Management Materials. These consist mainly of various thermal interface materials (“TIM”) in the form of custom greases or pastes. Our custom XG TIM®greases and pastes are also designed to be used in various high temperature environments. Additionally, we offer various bulk materials for use as active components in adhesives, liquids, coatings and plastic composites to impart improved thermal management performance to such matrices.
Our Focus Areas
We believe we are a “platform play” in advanced materials, because our proprietary processes allow us to produce varying grades of graphene nanoplatelets that can be mapped to a variety of applications and in many market segments. However, we are prioritizing our efforts in specific areas and with specific customers that we believe represent opportunities for either relatively near-term revenue or especially large and attractive markets. At this time, we are focused on four key vertical markets: Automotive, Sporting Goods, Packaging and Industrial. The following graphic provides examples of target applications within each of the four key verticals where XG Sciences has either commercial sales or is in development with one or more customers.
XGS Market/Application Focus Areas
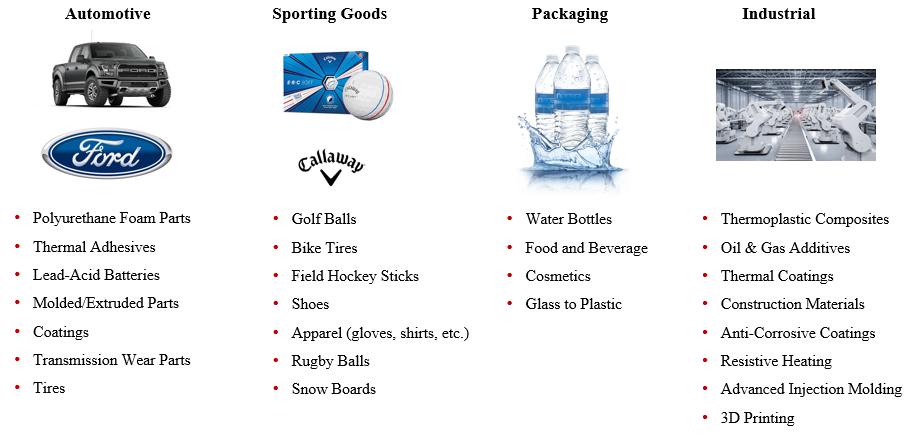
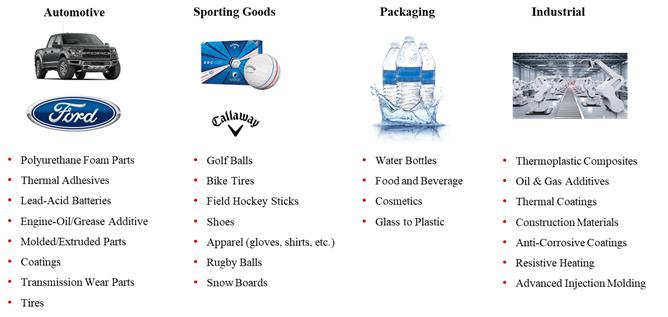
Addressable Markets
The markets for our materials arelarge and growing. As one example, the 2019 North American packaging market for plastic bottles and containers is estimated to be more than $34 billion (Mordor Intelligence).Further,Mordor estimates the 2019 global market for PET water bottles at 543.8 billion units. XG Sciences is engaged in the commercial supply ofxGnP®xGnP®graphene nanoplatelets for use in water bottles manufactured initially in North America and we are expanding our market activities into other geographies. If each water bottle produced in 2019 were to incorporate just 1milligram milligram ofxGnP®graphene nanoplates,nanoplatelets, the total revenue available to XG Sciences may range from $200 to $300 million, depending on product form. As a second example, the 2019 Global market for rubber used in tires is estimated at 30 million metric tons (European Rubber Journal, January 9, 2019 and according the International Rubber Study Group). Graphene nanoplates have been shown to provide performance improvements when incorporated into tires. If graphene nanoplatelets were used in just 1 weight percent of all rubber used in tires, and used in only 20% of the available tire market, then there would exist a total global market for use of graphene nanoplatelets in tires of 60,000 metric tons on dry powder basis.
Commercialization Process
Because graphene is a new material, most of our customers are still developing applications that use our products. Commercialization is a process, the exact timing of which is often difficult to predict. It starts with our own internal R&D to validate performance for an identified market or customer-specific need. Our customers then validate the performance of our materials and determine whether our products can be incorporated into their manufacturing processes. This is initially done at pilot production scale levels. Our customers then have to introduce products that incorporate our materials to their own customers to validate performance. After their customers have validated performance, our customers will then move to commercial scale production. Every customer goes through the same process, but will do so at varying speeds, depending on the customer, the product application and the end-use market. Thus, we are not always able to predict when our customers will begin ordering commercial volumes of our materials or predict their expected volumes over time. However, as customers move through the process, we generally receive feedback and gain greater insights regarding their commercialization plans. According to our respective customers, the following are examples where our products are providing value to our customers at levels that are either in commercial production or we believe will warrant their use on a commercial basis.
| · | In 2018, Callaway Golf Company introduced new dual-core Chrome Soft and Chrome Soft X golf balls incorporating our xGnP®graphene nanoplatelets into the outer core, resulting in a new class of golf ball that enables higher driving speeds, greater distance and increased control, |
| · | The Ford Motor Company, after having demonstrated a 17 percent reduction in noise, a 20 percent improvement in mechanical properties and a 30 percent improvement in heat endurance properties compared with that of polyurethane foam used without graphene, |
| · |
| · | Lead acid battery manufacturers incorporating our materials in the commercial supply of batteries |
| · |
| · |
| · |
| · | Several customers are currently in initial scale production using our products for |
The process of “designing-in” new materials is relatively complex and involves the use of relatively small amounts of the new material in laboratory and engineering development for an extended period of time. Following successful development, customers that incorporate our materials into their products will then order much larger quantities of material to support commercial production. Although, our customers are under no obligation to report to us on the usage of our materials, some have indicated that they have introduced or will soon introduce commercial products that use our materials. Thus, while many of our customers are currently purchasing our materials in kilogram (one or two pound) quantities, some are now ordering at multiple ton quantities and we believe many will require tens of tons or even hundreds of tons of material as they commercialize products that incorporate our materials. We also believe that those customers already in production will increase their order volume as demand increases and others will begin to move into commercial volume production as they gain more experience in working with our materials and engage new customers. For example, in 2017 we shipped 19.3 metric tons of product for various end-use customers. In 2018, we shipped 59.9 metric tons of products comprising 48.3 metric tons of dry powders and approximately 11.6 metric tons of additional product in the form of slurry, cake or other integrated products. This demand profile is further evidence that we are transitioning into higher-volume commercial production.
| 20 |
Commercialization Trends
We are tracking the commercial and development status of more than 75 different customer applications using our materials with some customers pursuing multiple applications. As of June 30, 2019,March 31, 2020, we had twenty (20) specific customer applications where our materials are incorporated into our customers’ products and such customers are actively selling these products to their own customers. In addition, we have another eighteennineteen (19) customer applications where our customers have indicated that they expect to begin shipping product incorporating our materials in the next 3 – 6 months and have another twenty-sixtwenty-two (22) customer applications where our customers have indicated an intent to commercialize in the next 6 – 9 months. We are also working with numerous additional customers that have not yet indicated an exact date for commercialization, but we believe have the potential to contribute to meaningful revenue in 2019.2020. The following graphic demonstrates the commercialization trends over the past 8 fiscal quarters as an increasing number of customers indicate their intent to commercialize applications and move into actively selling or promoting products for future sales. We believe thatexperienced an impact from the average order sizecoronavirus pandemic during the quarter with several customers pushing out the timing for these customers will increase throughout 2019 as their demand grows. As a result, we believe we will begin shipping significantly greater quantities of our products, and thus continue scaling revenue through 2019.
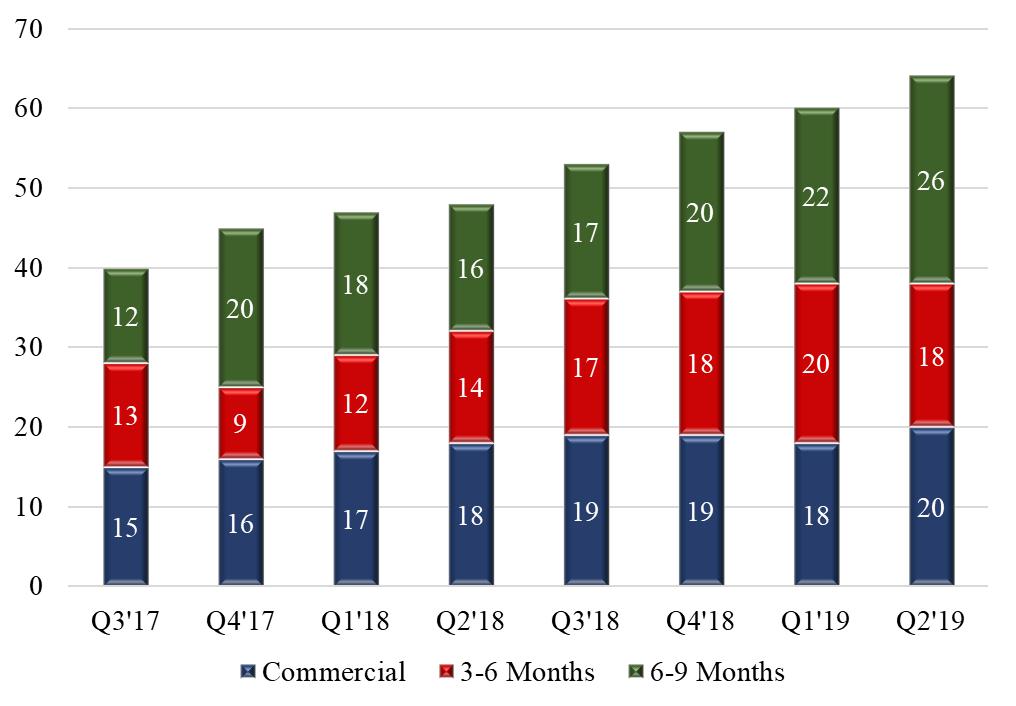
(a) Customer applications where our materials are used in customer products and they are actively selling them to their customers.
(b) Customer applications where our customers are indicating that they expect to begin shipping products incorporating our materialscommercial adoption. This is reflected in the next 3-6 months.
(c) Customer applications where ourreduction in the number of customers are indicating antheir intent to commercialize in the next 6-9 months. Also, we experienced a reduction in the number of “commercial” customers as some customers previously promoting their products to their customers suspended their marketing efforts until such time as overall market conditions are more favorable. We anticipate we may continue and see customer delays over the next several quarters due to COVID-19.
Additional 10’s of
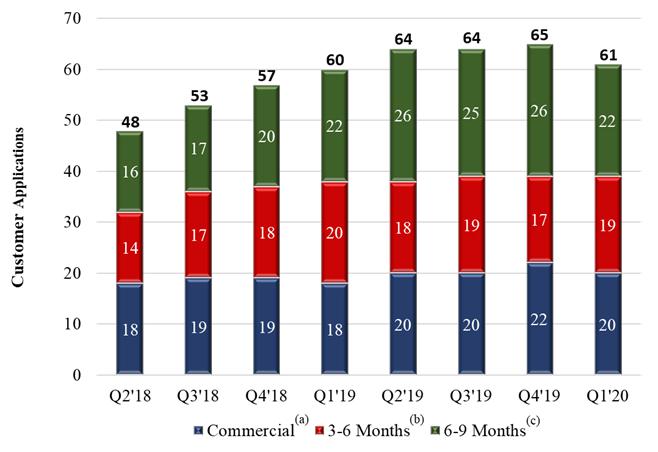
| (a) | Customer applications where our materials are used in customer products and they are actively selling them to their customers. |
| (b) | Customer applications where our customers are indicating that they expect to begin shipping products incorporating our materials in the next 3-6 months. |
| (c) | Customer applications where our customers are indicating an intent to commercialize in the next 6-9 months. |
In addition to the above, there are many additional customers demonstrating efficacy and moving through the qualification process.
Manufacturing Capacity
We completed the first phase of expansion in our newest 64,000 square-foot facility in the first half of 2018. The expansion has added 90 metric tons of graphene nanoplatelet production capacity, bringing the total capacity of the facility up to approximately 180 metric tons of dry powder. Phase two of the expansion was partially complete by year-end 2018 and resulted in up to ~270 metric tons of total graphene nanoplatelet output capacity at the facility. We expect to completecompleted the last portion of this phase two expansion in the firstsecond half of 2019, resulting in up to ~400 metric tons of total graphene nanoplatelet output capacity. Our total graphene nanoplatelet output capacity across both of our manufacturing facilities, as of June 30, 2019, exceeded 300 metric tons per year and will increase toMarch 31, 2020, is an approximate 450 metric tons by year-end.per year on a dry powder basis. The expansions support our mission to continue commercializing the use of graphene in customer products across diverse industries. XG’s increasing capacity will support the growingour expected growth in demand for our products over the next several fiscal quarters. However, additional manufacturing capabilities for certain value-added products and certain bulk materials remain to be developed and may require the acquisition of additional facilities. In particular, the production processes for certain integrated products will require additional capital and may require additional facilities to meet expected future customer demand.
Some of the Company’s products are new products that have not yet been fully developed and for which manufacturing operations have not yet been fully scaled. Although we believe we will continue to scale our production capability, and revenue rapidly in 2019, we have not yet demonstrated the capability to produce sufficient materials to generate the ongoing revenues necessary to sustain our operations in the long-term.
Our Intellectual Property
Some of our proprietary manufacturing processes were developed at Michigan State University (MSU) and licensed to us in 2006. We license threetwo U.S. patents and patent applications from MSU. On August 8, 2016, we signed an agreement acquiring an exclusive license with Metna Co. (Meta) to Metna’s background IP for use of graphene nanoplatelets as additives to concrete mixtures. For purposes of the agreement, Metna’s background IP relates to the U.S. Patent 8,951,343. Also, on August 8, 2016, we entered into a second agreement for an exclusive license related to all Metna’s background technology and foreground technology, including any jointly-owned foreground technology where the end use is known to be any graphite additive dispersed in concrete mixtures. On April 25, 2019 we signed an Intellectual Property License, Joint Development and Commercialization Agreement with Niagara Bottling acquiring exclusive license to certain of Niagara’s patents and applications relating to the use of graphene nanoplatelets in packaging applications. For purposes of the agreement, Niagara’s IP relates to five (5) U.S. patents and patent applications and two (2) international applications and future registered intellectual property directed at the field. Over time, our scientists and engineers have made many further discoveries and inventions that are embodied in the form of (and as of June 30, 2019)March 31, 2020): fifteen (15)eighteen (18) additional U.S. patents, eighteen (18)twenty-three (23) foreign patents, ten (10)thirteen (13) additional U.S. patent applications and numerous trade secrets. For many of the applications filed in the U.S., additional filings are made in other countries such as the European Union, Japan, South Korea, China, Taiwan or other applicable countries. As of June 30, 2019,March 31, 2020, we maintained twenty (20)fifteen (15) international patent applications. These filings and analyses are made on a case-by-case basis. Typically, patents that are defensive in nature are not filed abroad, while those that are protective of active XGS products or applications are filed in relevant countries abroad. Our general IP strategy is to keep as trade secrets those manufacturing processes that are difficult to enforce should they be disclosed and to seek patent coverage for other manufacturing processes, materials derived from those processes, unique combinations of materials and end uses of materials containing graphene nanoplatelets. We believe that the combination of our rights under the MSU license,various licenses, our patents and patent applications, and our trade secrets create a strong intellectual property position.
Operating Segment
Operating Segment
We have one reportable operating segment that manufactures xGnP® graphene nanoplatelets and value-added products produced therefrom, conducts research on graphene nanoplatelets and related products, and licenses our technology as appropriate. As of June 30, 2019,March 31, 2020, we shipped products on a worldwide basis, buthowever all of our assets were located within the United States.
Results of Operations for the Three and Six Months Ended June 30, 2019 ComparedMarch 31, 2020 compared with the Three and Six Months Ended June 30, 2018March 31, 2019
| Summary Income Statement | For the Three Months Ended June 30, | For the Six Months Ended June 30, | ||||||||||||||||||||||
| 2019 | 2018 | Change | 2019 | 2018 | Change | |||||||||||||||||||
| Total Revenues | $ | 247,069 | $ | 850,854 | $ | (603,785 | ) | $ | 1,104,346 | $ | 1,737,191 | (632,845 | ) | |||||||||||
| Cost of Goods Sold | 796,156 | 1,105,949 | (309,793 | ) | 1,970,778 | 2,320,723 | (349,945 | ) | ||||||||||||||||
| Gross Loss | (549,087 | ) | (255,095 | ) | (293,992 | ) | (866,432 | ) | (583,532 | ) | (282,900 | ) | ||||||||||||
| Research & Development Expense | 384,767 | 287,082 | 97,685 | 770,013 | 564,146 | 205,867 | ||||||||||||||||||
| Sales, General & Administrative Expense | 1,486,380 | 1,147,794 | 338,586 | 2,907,301 | 2,334,473 | 572,828 | ||||||||||||||||||
| Total Operating Expense | 1,871,147 | 1,434,876 | 436,271 | 3,677,314 | 2,898,619 | 778,695 | ||||||||||||||||||
| Operating Loss | (2,420,234 | ) | (1,689,971 | ) | (730,263 | ) | (4,543,746 | ) | (3,482,151 | ) | (1,061,595 | ) | ||||||||||||
| Other Expense | (78,277 | ) | (83,805 | ) | 5,528 | (154,941 | (165,721 | ) | 10,780 | |||||||||||||||
| Net Loss | $ | (2,498,511 | ) | $ | (1,773,776 | ) | $ | (724,735 | ) | $ | (4,698,687 | ) | $ | (3,647,872 | ) | $ | (1,050,815 | ) | ||||||
Revenue
Revenues for the three months and six months ended June 30, 2019 and 2018, by category, are shown below.
| For the Three Months Ended June 30, | For the Six Months Ended June 30, | |||||||||||||||||||||||
| 2019 | 2018 | Change | 2019 | 2018 | Change | |||||||||||||||||||
| Product Sales | $ | 247,069 | $ | 850,854 | $ | (603,785 | ) | $ | 1,104,346 | $ | 1,737,191 | $ | (632,845 | ) | ||||||||||
| Total | $ | 247,069 | $ | 850,854 | $ | (603,785 | ) | $ | 1,104,346 | $ | 1,737,191 | $ | (632,845 | ) | ||||||||||
| For the Three Months Ended March 31, | Change 2020 to 2019 | |||||||||||||||
| 2020 | 2019 | $ | % | |||||||||||||
| Total Revenues | 167,063 | 857,278 | (690,215 | ) | -80.5 | % | ||||||||||
| Cost of Goods Sold | 762,483 | 1,174,622 | 412,139 | 35.1 | % | |||||||||||
| Gross Loss | (595,420 | ) | (317,344 | ) | (278,076 | ) | -87.6 | % | ||||||||
| Research & Development Expense | 285,727 | 385,245 | 99,518 | 25.8 | % | |||||||||||
| Sales, General & Administrative Expense | 1,292,135 | 1,420,922 | 128,787 | 9.1 | % | |||||||||||
| Total Operating Expenses | 1,577,862 | 1,806,167 | 228,305 | 12.6 | % | |||||||||||
| Operating Loss | (2,173,282 | ) | (2,123,511 | ) | (49,771 | ) | -2.3 | % | ||||||||
| Other Expense | (178,009 | ) | (76,665 | ) | 101,344 | -132.2 | % | |||||||||
| Net Loss | (1,995,273 | ) | (2,046,846 | ) | 51,573 | 2.5 | % | |||||||||
TheRevenue
For the three months ending March 31, 2020 we reported revenue of $167,063, a 17.7% increase from the $141,962 reported in the immediately prior three-month period ending on December 31, 2019 and an 80.5% decrease from the $857,913 reportedfor the three months ending March 31, 2019. Since we are in the business of developing new materials and for use in new ways, accurately forecasting new product adoption can be a challenge for our customers. Accordingly, our business is subject to the vagaries of unpredictable demand and inaccurate forecasts and is as seen in our first quarter, year-on-year decrease in Product salesrevenue. The $690,850 decrease in revenue for the three months ended June 30, 2019 versusMarch 31, 2020 from the samecomparable period lastin the prior year, is primarily due to three customers who purchased $774,176 of our products in the resultfirst quarter of a large2019 who did not purchase any products in the first quarter of 2020 All three of these customers are still using our products in production, but given the newness of our products, demand for their products incorporating our products is also unpredictable. We believe these customers will continue to ship their products incorporating our material and we expect they will resume purchasing our products at historical levels in the next few quarters. Another customer pre-buying their inventory needspurchased $38,700 of our products in quarter 4the first three months of 2019 and $83,172 in the prior year and, partially, in quarter 1first three months of the current year. This customer, although delaying reorders, continues to use our product in their manufacturing processes.2020, or an increase of 115%. We have a very strong customer pipeline and continue to establish a robust baseline of customers who are nearing commercial status. We believe that once these customers reach commercial status with products that incorporate our products, each will begin to order from us on a regular basis, which will help to mitigate the quarter to quarter revenue variability. However, until such time, we expect to see variations in quarterly revenue resulting from variable order patterns from our customers.
Product sales consist of two broad categories: (1) material sold to customers for research or development purposes; and (2) production orders for customers. Typically, the order sizes for the first category are relatively small, however we expect orders in the second category to be much larger in the future. For the three months ended June 30, 2019, product sales decreased by $603,785, or 71% from the comparable period in the prior year and for the six months ended June 30, 2019, product sales decreased by $632,845, or 36% from the comparable period in the prior year. The drop in revenue for the three months ended June 30, 2019 is due to our largest customer suspending orders during the period. The customer has not stopped using our products, but rather, is working down material pre-ordered in the latter half of 2018 and currently held in inventory and being used to produce their products. In the three months ended March 31, 2019, this customer purchased $565,946 of our product, representing 94% of the revenue decrease for the three months ended June 30, 2019 and 90% of the revenue decrease for the six months ended June 30, 2019. This customer continues to ship their products incorporating our material and we expect they will work down existing inventory, and over the next several quarters will resume purchasing our products at historical levels. Customersaddition, other customers are moving through development programs towards commercialization, requiring larger quantities of our materials for advanced testing, pilot production and commercial-scale production activities. We believe that those customers already in production will increase their order volume as demand increases and others will begin to move into commercial volume production as they gain more experience in working with our materials and engage their own customers.
We ship our products from our Lansing, MI manufacturing facilities to customers around the world. During the sixthree months ended June 30, 2019,March 31, 2020, we shipped materialsto customers in 2016 countries, as compared to 2213 countries during the same period in 2018. For the six months ended June 30, 2019, sales to one country, South Korea, accounted for more than 10% of revenue. For the six months ended, June 30, 2018, no product sales to any one country accounted for more than 10% of product sales. During the three months ended June 30, 2019, we shipped materials to customers in 17 countries, as compared to 17 countries during the same period in 2018.2019. For the three months ended June 30, 2019,March 31, 2020, sales to one country,two countries, South Korea and Switzerland, accounted for more than 10% of revenue. For the three months ended June 30, 2018, no product salesMarch 31, 2019, shipments to any one countrySouth Korea accounted for more than 10% of product sales.
Order Summary
The table below shows a comparison of domestic and international orders fulfilled (excluding orders for free samples). The table also includes the average order size for product sales. The average order size for product revenue during the three months and six months ended June 30, 2019March 31, 2020 decreased by 60% and 21%85%, respectively, as compared to the same period in 2018.2019. The relatively small average order size means that the majority of our customer base remains active with research and development projects that only use limited amounts of our material. We expect our average order size to increase significantly as more customers reach commercial status.
| Order Summary | For the Three Months Ended June 30, | For the Six Months Ended June 30, | For the Three Months Ended March 31, | |||||||||||||||||||||||||||||||||
| (unaudited) | 2019 | 2018 | Change | 2019 | 2018 | Change | 2020 | 2019 | Change | |||||||||||||||||||||||||||
| Number of orders - domestic | 26 | 47 | (21 | ) | 51 | 82 | (31 | ) | 48 | 33 | 15 | |||||||||||||||||||||||||
| Number of orders - international | 28 | 28 | — | 54 | 49 | 5 | 28 | 26 | 2 | |||||||||||||||||||||||||||
| Number of orders - total | 54 | 75 | (21 | ) | 105 | 131 | (26 | ) | 76 | 59 | 17 | |||||||||||||||||||||||||
| Average order size for product sales recorded in our Statement of Operations | $ | 4,575 | $ | 11,345 | $ | (6,770 | ) | $ | 10,518 | $ | 13,261 | $ | (2,743 | ) | $ | 2,201 | $ | 15,018 | $ | (12,817 | ) | |||||||||||||||
| % change | (60 | %) | (21 | %) | (85 | %) | ||||||||||||||||||||||||||||||
Cost of Goods Sold
We use a standard cost system to estimate the direct costs of products sold. Variances between the standard costs and the actual costs are then properly capitalized to the inventories and expensed to cost of goods sold. Direct costs include estimates of raw material costs, packaging, freight charges net of those billed to customers, and an allocation for direct labor and manufacturing overhead. Because of the nature of our production processes, there is a substantial fixed manufacturing expense requirement that represents the ongoing cost of maintaining production facilities that are not directly related to products sold, so we use a “full capacity” allocation of overhead based on an estimate of what product costs would be if the manufacturing facilities were operating on a full-time basis and producing products at the designed capacity.
The following table shows the relationship of direct costs to product sales for the three months ended March 31, 2020 and six months ended June 30, 2019 and 2018:2019:
| Gross Profit Summary | For the Three Months Ended June 30, | For the Six Months Ended June 30, | ||||||||||||||||||||||
| 2019 | 2018 | Change | 2019 | 2018 | Change | |||||||||||||||||||
| Product Sales | $ | 247,069 | $ | 850,854 | $ | (603,785 | ) | $ | 1,104,346 | $ | 1,737,191 | $ | (632,845 | ) | ||||||||||
| Direct Costs | 196,411 | 563,260 | (366,849 | ) | 877,564 | 1,031,451 | (153,887 | ) | ||||||||||||||||
| Direct Cost Margin | $ | 50,658 | $ | 287,594 | $ | (236,936 | ) | $ | 226,782 | $ | 705,740 | $ | (478,958 | ) | ||||||||||
| % of Sales | 20.5 | % | 33.8 | % | 20.5 | % | 40.6 | % | ||||||||||||||||
| Unallocated Manufacturing Expense | 599,745 | 542,689 | 57,056 | 1,093,214 | 1,289,272 | (196,058 | ) | |||||||||||||||||
| Gross Loss on Product Sales | $ | (549,087 | ) | $ | (255,095 | ) | $ | (293,992 | ) | $ | (866,432 | ) | $ | (583,532 | ) | $ | (282,900 | ) | ||||||
| Gross Loss Summary | For the Three Months Ended March 31, | Change 2020 to 2019 | ||||||||||||||
| 2020 | 2019 | $ | % | |||||||||||||
| Product Sales | $ | 167,063 | $ | 857,278 | $ | (690,215 | ) | (80.5 | ) | |||||||
| Direct Costs | 103,570 | 681,153 | (577,583 | ) | (84.8 | ) | ||||||||||
| Direct Cost Margin | $ | 63,494 | $ | 176,125 | $ | (112,631 | ) | (63.9 | ) | |||||||
| % of Sales | 38.0 | % | 20.5 | % | ||||||||||||
| Unallocated Manufacturing Expense | 658,913 | 493,469 | 165,444 | 33.5 | ||||||||||||
| Gross Loss on Product Sales | $ | (595,420 | ) | $ | (317,344 | ) | $ | (278,076 | ) | 87.6 | ||||||
We believe that the fluctuations in gross loss on product sales and direct cost from period to period are not indicative of future margins because of the relatively small size of our sales in comparison to our future expectations. Direct costs vary depending on the size of an order, the specific products being ordered, and other factors like shipping destination (which on small orders can represent a significant percentage of the cost).
The remaining “non-direct” costs of operating our manufacturing facilities are recorded as unallocated manufacturing expenses. These expenses include personnel costs, rent, utilities, indirect supplies, depreciation, and related indirect expenses. Unallocated manufacturing expenses are expensed as incurred. We allocate these costs to direct product costs based on the proportion of these expenses that would be representative of direct product costs if we were operating our factory at full capacity.
For the three months ended June 30, 2019,March 31, 2020, unallocated manufacturing expenses increased by 11%33.5% to $599,745$658,913 as compared to $542,689$493,469 for the same period in 2018.2019. The increase of $57,056$165,444 is largely due to increased production personnel at the Mason, MI facility which opened in mid-2018.fixed overhead cost not being allocated to finished goods due to capacity underutilization.
For the six months ended June 30, 2019, unallocated manufacturing expenses decreased by 15% to $1,093,214 as compared to $1,289,272 in 2018. The decrease of $196,058 is largely due to lower equipment rental costs.
Sales, General and Administrative Expenses
During the three months ended June 30, 2019,March 31, 2020, we incurred selling, general and administrative expenses (SG&A) of $1,486,380.$1,292,136. This is an increasea decrease of approximately $338,586$128,787 or 29.5%9.1% from the same period in 2018.2019. This increasedecrease in SG&A expense is primarily related to an increased hiring of skilled personnel to respond to customer needs and to promote growth. Professional fees increased due to the change in auditors that occurred toward the end of 2018. As we continue to grow and gain traction in the marketplace, we expect that our SG&A expenses will increase, but should stabilize and become more fixed in nature as we achieve economies of scale.
During the six months ended June 30, 2019 we incurred selling, general and administrative expenses (SG&A) of $2,907,301. This is an increase of $572,828 from the same period in 2018, primarily due to increases indecreased personnel costs as our sales team expands.the Company began taking measures in anticipation of slower demand and delays in customer adoption caused by COVID-19.
Research and Development Expenses
During the three months ended June 30, 2019,March 31, 2020, we incurred research and development expenses (R&D) of $384,767.$285,727. This is an increasea decrease of $97,685$99,518 or 34%25.8% from the same period in 2018.2019. This increasedecrease in R&D is primarily due to additional utilization of external testing services and other increased activities in our research and development areadecreased personnel costs as we continuerealign our R&D efforts to commercialize and expand our sales reach.be more product focused.
ResearchOther Expense
Other income and development expensesexpense consist primarily of Interest expense on the Dow Facility. Following shows a comparison of other income and expense for the sixthree months ended June 30, 2019 were $770,013 as compared to $564,146 for the same period in 2018, an increase of $205,867.March 31, 2020 and 2019:
| For the Three Months Ended March 31 | |||||||||||||
| 2020 | 2019 | Change | |||||||||||
| Interest expense, net | $ | (178,009) | $ | (76,665) | ) | $ | (101,344) | ) | |||||
Other Income (Expense)
The following table shows a comparison of other income and expense by major expense component for the three and six months ended June 30, 2019 and 2018:
| For the Three Months Ended June 30, | For the Six Months Ended June 30, | |||||||||||||||||||||||
| 2019 | 2018 | Change | 2019 | 2018 | Change | |||||||||||||||||||
| Interest expense, net | $ | (78,277 | ) | $ | (83,805 | ) | $ | 5,528 | $ | (154,941 | ) | $ | (168,974 | ) | $ | 14,033 | ||||||||
| Government incentives, net | — | — | — | — | 3,253 | (3,253 | ) | |||||||||||||||||
| Total | $ | (78,277 | ) | $ | (83,805 | ) | $ | 5,528 | $ | (154,941 | ) | $ | (165,721 | ) | $ | 10,780 | ||||||||
Liquidity and Capital Expenditures
Liquidity
We have historically incurred recurring losses from operations and we may continue to generate negative cash flows as we implement our business plan. Our consolidated financial statements are prepared using GAAPaccounting principles generally accepted in the United States (“US GAAP”) as applicable to a going concern, which contemplates the realization of assets and liquidation of liabilities in the normal course of business.
As of August 12, 2019,In December 2016, we had cash on hand of $2,680,604. We believe our cash is sufficient to fund our operations for at least twelve months after takingentered into account various sources of fundinga Draw Loan Note and cash received from continued commercial sales of our products. Our primary means for raising funds since 2016 has been through our offering of shares of common stock at a fixed price of $8.00 per share to the general public in a self-underwritten offering (the “Offering” or our “IPO”) and under a draw loan note and agreementAgreement with The Dow Chemical Company (the “Dow Facility”) to provide up to $10 million of secured debt financing at an interest rate of 5% per year, drawable at our request under certain conditions. We drew $2 million at closing, $1 million on each of July 18, 2017, September 22, 2017 and December 4, 2017. After December 1, 2017, an additional $5 million became available under the Dow Facility as a result of the Company having raised $10 million of equity capital after October 31, 2016. We drew $2 million on July 8, 2019, an additional $2 million on November 19, 2019 and, on February 12,2020, we drew the remaining $1 million.
As of June 10, 2020, we had cash on hand of $969,716. Due to lower than expected revenue in 2019 and the current COVID-19 global pandemic impacting both our operations and that of our customers, Management has taken several steps to ensure we are able to fund our operations from existing cash on hand, operating cash flows, additional borrowings and restructured debt obligations.
In March of 2020, we restructured our organization by reducing headcount by 45%, by furloughing substantially all manufacturing employees, and by implementing temporary salary reductions ranging from 15-20% which has resulted in a 58% reduction in annual payroll and related costs. In April 2020, we furloughed additional employees in our R&D and Engineering departments. We also reduced our annual cash run rate for all other expenses by 17%. Salary reductions will be in place until the Company has recorded quarterly revenue of at least $1 million for two consecutive quarters, at which time salaries will return to their previous levels.
In late March / early April of 2020, we applied for relief under the Coronavirus Aid, Relief and Economic Security Act (CARES) by submitting an application with the Small Business Administration (SBA) for an Economic Injury Disaster Loan (“EIDL”) and by submitting an application to an SBA lender bank, PNC, for a Paycheck Protection Plan (“PPP”) loan. On April 12, 2019,18, 2020, we completedreceived an approved and fully executed PPP Term Note for $825,200 with a term of two years, a six-month repayment deferral period, and an annual rate of interest of 1%, with a potential for some or all of the Offering, after selling 2,615,425 sharesloan to be forgiven, dependent upon use of the loan proceeds. On April 20, 2020, we received the $825,200 under the Registration StatementPPP loan. On May 17, 2020, the SBA issued us a decline letter for the EIDL for which we have requested reconsideration.
On April 23, 2020, we entered into an amended and restated Draw Loan Note and Agreement and related transaction documents (collectively, the “Amended Dow Facility”) with the Dow Chemical Company to amend the terms of our current loan facility to allow us to structure a private placement of units (“Units”) comprised (in part) of subordinated, secured convertible notes (“Convertible Notes” and such offering, the “Unit Offering”), to support ongoing cash needs. In the Amended Dow Facility, the Company and Dow agreed to 1) extend the term of such loan facility by two years to December 1, 2023, 2) significantly reduce any required prepayment to Dow from the proceeds of new equity or equity-linked financings from the current 30-50% prepayment requirement on the pre-existing Dow Facility to a 10% prepayment requirement in the Amended Dow Facility, which does not begin until after we have raised an additional $7 million in equity or equity-linked capital from the date of the amendment, 3) capitalize all interest payable until such time as we have recorded GAAP revenue of at least $2 million for two consecutive calendar quarters 4) increase the rate of interest to 6.5% per annum from 5.0% on the pre-existing Dow Facility, and 5) allow for a subordinated security interest to be granted to new investors in the Unit Offering.
Immediately after the execution of the transaction documents related to the Amended Dow Facility, we commenced the Unit Offering in a private placement to accredited investors. The Unit Offering is comprised of the Convertible Notes and a right to exchange two shares of previously issued Common Stock of the Company for two shares of Series B Convertible Preferred Stock of the Company (“Series B Preferred Stock”) for every $8.00 invested in the Unit Offering (the “Exchange Rights”). The Convertible Notes are secured by a junior security interest in all the assets of the Company, bear an interest rate of 7.5% per annum and mature on December 31, 2024. Each investor’s Exchange Rights are exercisable for a period of thirty (30) days after acceptance by the Company of a fully executed subscription agreement.
At the option of each holder, the Convertible Notes are convertible into either i) Series B Preferred Stock at a conversion price of $8.00/share; or ii) any other form of preferred or common stock (“Subsequent Stock”) issued by the Company at a conversion price per share equal to 80% of the purchase price per share at which such Subsequent Stock is sold (or if the value per share is fixed, 120% of the number of shares that might otherwise be issuable).
If and when we raise at least $15 million of equity capital (excluding capital raised in this Unit Offering), the Convertible Notes will be automatically converted into whichever of the following equity securities would result in the greatest number of shares of Common Stock being issued to the holders on an “as-if-converted” basis at such time: (i) Series B Preferred Stock at a conversion price of $8.00/share; or (ii) Subsequent Stock at a note conversion price per share equal to 80% of the purchase price per share at which such Subsequent Stock is sold (or if the value per share is fixed, 120% of the number of shares that might otherwise be issuable); provided, however, in the event the Company raises at least $15 million of equity capital within one hundred and twenty (120) days after the first issue date of Convertible Notes, such percentages will be changed to 90% of the purchase price per share at which such Subsequent Stock is sold (or, if the value per share is fixed, 110% of the number of shares that might otherwise be issuable).
| 25 |
Each share of Series B Preferred Stock has an original issue price of $8.00 per share (the “Series B Original Issue Price”) and a liquidation preference of $8.00 per share, with both the Series B Original Issue Price and the liquidation preference per share subject to adjustment for stock splits, recapitalizations, and the like. The Series B Preferred Stock will be senior to the Company’s Common Stock and pari-passu with the Series A Preferred Stock in terms of right of repayment in a liquidation.
The Series B Preferred Stock has full ratchet antidilution protection that provides that each share of Series B Preferred Stock outstanding may be converted by an Investor at any time into that number of shares of Common Stock determined by dividing the then current Series B Original Issue Price by the applicable Conversion Price (as defined below) with the resulting fraction equal to the “Series B Conversion Rate”. The total proceedsnumber of $20,923,400. shares of Common Stock issuable will be equal to the number of shares of Series B Preferred Stock being converted multiplied by the Series B Conversion Rate. The “Conversion Price” is, at any time, the price per share equal to the lesser of a) the Series B Original Issue Price per share and b) the lowest price per share at which the Company has sold equity or equity-linked securities (other than customary exclusions) at any future date while any shares of the Series B Preferred Stock remain outstanding. The Series B Original Issue Price and Conversion Price in effect at any time are also subject to proportional adjustment for share splits, share dividends, recapitalizations and the like.
On July 8, 2019 we borrowed $2 million underApril 23, 2020, certain members of our Board of Directors and their affiliates purchased $550,000 of Units. In additions, these Board members and their affiliates have made additional commitments to the draw loan note and agreement with The Dow Chemical Company (the “Dow Facility”). We have $3to match any purchases of Units by disinterested third parties on a dollar for dollar basis up to an additional $1.5 million of proceedsUnits purchased by such disinterested parties.
As of June 10, 2020, we had cash on hand of $969,716. Taking into consideration our current cash on hand, we estimate that we will need to raise approximately $500,000- $1,000,000 of additional capital in order to continue our operations for the next twelve months in a minimal to no revenue growth environment. If we are able to raise $1.5 million of capital from disinterested third parties, the Dow Facility availablecommitments from our Board members to us,match this amount would result in $3.0 million of total capital to the Company, which we intendestimate would allow the Company to use as our primary source of liquiditycontinue operating for 24 months in the event we need more funding (See Note 3).
a minimal to no revenue growth environment.
There has been no public market for our securities and a public market may never develop, or, if any market does develop, it may not be sustained. Our common stockCommon Stock is not currently quoted on or traded on any exchange or on any over-the-counter market. In the event we are unable to fund our operations from existing cash on hand, operating cash flows, additional borrowings or raising equity capital, we may be forced to reduce our expenses, slow down our growth rate, or discontinue operations. Our condensed consolidated financial statements do not include any adjustments relating to the recoverability and classification of recorded asset amounts or the amounts and classification of liabilities that might be necessary should we be unable to continue as a going concern.
Critical Accounting Policies
In preparing the condensed consolidated financial statements in accordance with accounting principles generally accepted in the United States of America (“U.S. GAAP”), we have adopted various accounting policies. Our most significant accounting policies are disclosed in Note 2 to the consolidated financial statements included in our Form 10-K/A for the year ended December 31, 2018.
The preparation of the condensed consolidated financial statements in conformity with U.S. GAAP requires us to make estimates and assumptions that affect the amounts reported in the condensed consolidated financial statements and accompanying notes. Our estimates and assumptions, including those related to inventories, intangible assets, property, plant and equipment, legal proceedings, research and development, warranty obligations, product liability, fair valued liabilities, sales returns and discounts, going concern, and income taxes are updated as appropriate, which in most cases is at least quarterly. We base our estimates on historical experience, or various judgements about the reported values of assets, liabilities, revenue and expenses. Actual results may materially differ from these estimates.
ITEM 3. QUANTITATIVE AND QUALITATIVE DISCLOSURES ABOUT MARKET RISK
Smaller reporting companies are not required to provide this information.
ITEM 4. CONTROLS AND PROCEDURES
(a)Evaluation of disclosure controls and procedures. We maintain disclosure controls and procedures designed to ensure that information required to be disclosed in reports filed under the Exchange Act is recorded, processed, summarized, and reported within the time periods specified in the SEC rules and forms, and that such information is accumulated and communicated to our management, including our principal executive officer and principal financial officer, as appropriate, to allow timely decisions regarding required disclosure. In designing and evaluating our disclosure controls and procedures, management recognized that any controls and procedures, no matter how well designed and operated, can provide only reasonable assurance of achieving the desired control objectives.
As required by SEC Rule 15d-15, our management carried out an evaluation, under the supervision and with the participation of our principal executive officer and principal financial officer, of the effectiveness of our disclosure controls and procedures as of the end of the period covered by this Quarterly Report on Form 10-Q. Based on that evaluation, our principal executive officer and principal financial officer concluded that our disclosure controls and procedures were effective at a reasonable assurance level as of the end of the period covered by this report.
(b)Changes in internal controls. There were no changes in our internal control over financial reporting that occurred during the three months ended June 30, 2019March 31, 2020 that have materially affected, or are reasonably likely to materially affect, our internal control over financial reporting.
None.
Smaller reporting companies are not required to provide this information.
ITEM 2. UNREGISTERED SALES OF EQUITY SECURITIES AND USE OF PROCEEDS.
None.The following sets forth information regarding all unregistered securities sold from July 1, 2019 through March 31, 2020:
| (1) | We granted stock options to purchase an aggregate of 32,500 shares at an exercise prices of $8.00 per share to Board members, consultants and directors under the 2017 Equity Plan; |
| (2) | We granted an aggregate of 32,500 shares of restricted stock with an aggregate fair value of $260,000 under the 2017 Incentive Plan. |
The issuances of securities described in paragraphs (1) and (2) above were deemed to be exempt from registration under the Securities Act in reliance on Rule 701 promulgated under the Securities Act as transactions by an issuer not involving a public offering or under benefit plans and contracts relating to compensation as provided under Rule 701.
ITEM 3. DEFAULTS UPON SENIOR SECURITIES.
None.
ITEM 4. MINE SAFETY DISCLOSURES.
None.
None.
On April 27, 2020, the Company amended and restated the Certificate of Designation of it Series B Preferred Stock, a copy of which is filed as Exhibit 3.1 hereto.
Pursuant to the requirements of the Securities Exchange Act of 1934, this report has been signed below by the following persons on behalf of the registrant and in the capacities and on the dates indicated.
| Dated: | By: | /s/ Philip L. Rose | |
| Name: | Philip L. Rose | ||
| Title: | Chief Executive Officer | ||
| Dated: | By: | /s/ Jacqueline M. Lemke | |
| Name: | Jacqueline M. Lemke | ||
| Title: | Chief Financial Officer |