22
PART I. FINANCIALFINANCIAL INFORMATION
Item 1. FinancialFinancial Statements
WESTERN CAPITAL RESOURCES, INC. AND SUBSIDIARIES
CONTENTS
Page | |
CONDENSED CONSOLIDATED FINANCIAL STATEMENTS | |
4 | |
5 | |
6 | |
7 | |
8 |
WESTERN CAPITAL RESOURCES, INC. AND SUBSIDIARIES |
| September 30, 2020 | December 31, 2019 | |||||||
| (Unaudited) | ||||||||
| ASSETS | ||||||||
| CURRENT ASSETS | ||||||||
| Cash and cash equivalents | $ | 28,754,705 | $ | 27,132,540 | ||||
| Short-term investments | 17,079,672 | 14,756,665 | ||||||
| Loans receivable (net of allowance for losses of $312,700 and $673,000, respectively) | 2,597,405 | 3,860,411 | ||||||
| Accounts receivable (net of allowance for losses of $9,000 and $13,000, respectively) | 830,367 | 517,476 | ||||||
| Inventories (net of allowance of $814,000 and $1,065,000, respectively) | 9,061,668 | 8,330,691 | ||||||
| Prepaid income taxes | 271,663 | — | ||||||
| Prepaid expenses and other | 2,329,535 | 2,679,859 | ||||||
| TOTAL CURRENT ASSETS | 60,925,015 | 57,277,642 | ||||||
| INVESTMENTS | 1,000,000 | 1,500,000 | ||||||
| PROPERTY AND EQUIPMENT, net | 8,652,770 | 9,725,043 | ||||||
| OPERATING LEASE RIGHT-OF-USE ASSETS | 10,703,625 | 12,344,894 | ||||||
| INTANGIBLE ASSETS, net | 3,734,235 | 4,041,650 | ||||||
| LOANS RECEIVABLE | 473,080 | 694,987 | ||||||
| OTHER | 475,365 | 525,884 | ||||||
| GOODWILL | 5,796,528 | 5,796,528 | ||||||
| TOTAL ASSETS | $ | 91,760,618 | $ | 91,906,628 | ||||
| LIABILITIES AND EQUITY | ||||||||
| CURRENT LIABILITIES | ||||||||
| Accounts payable | $ | 6,495,247 | $ | 7,710,222 | ||||
| Accrued payroll | 2,264,213 | 2,572,331 | ||||||
| Current portion operating lease liabilities | 4,700,889 | 5,079,745 | ||||||
| Other current liabilities | 1,843,448 | 1,276,613 | ||||||
| Income taxes payables | — | 243,149 | ||||||
| Current portion notes payable | — | 65,414 | ||||||
| Current portion finance lease obligations | — | 1,161 | ||||||
| Contract liabilities | 495,483 | 794,830 | ||||||
| TOTAL CURRENT LIABILITIES | 15,799,280 | 17,743,465 | ||||||
| LONG-TERM LIABILITIES | ||||||||
| Notes payable, net of current portion | — | 1,019,837 | ||||||
| Operating lease liabilities, net of current portion | 6,443,450 | 7,444,789 | ||||||
| Deferred income taxes | 352,000 | 385,000 | ||||||
| TOTAL LONG-TERM LIABILITIES | 6,795,450 | 8,849,626 | ||||||
| TOTAL LIABILITIES | 22,594,730 | 26,593,091 | ||||||
| COMMITMENTS AND CONTINGENCIES (Note 15) | — | — | ||||||
| EQUITY | ||||||||
| WESTERN SHAREHOLDERS’ EQUITY | ||||||||
| Common stock, $0.0001 par value, 12,500,000 shares authorized, 8,853,816 and 9,265,778 shares issued and outstanding as of September 30, 2020 and December 31, 2019, respectively | 885 | 927 | ||||||
| Additional paid-in capital | 29,031,741 | 29,031,741 | ||||||
| Retained earnings | 38,068,810 | 33,706,035 | ||||||
| TOTAL WESTERN SHAREHOLDERS’ EQUITY | 67,101,436 | 62,738,703 | ||||||
| NONCONTROLLING INTERESTS | 2,064,452 | 2,574,834 | ||||||
| TOTAL EQUITY | 69,165,888 | 65,313,537 | ||||||
| TOTAL LIABILITIES AND EQUITY | $ | 91,760,618 | $ | 91,906,628 | ||||
WESTERN CAPITAL RESOURCES, INC. AND SUBSIDIARIES
CONDENSEDCONSOLIDATED BALANCE SHEETS
|
| March 31, |
|
| December 31, |
| ||
|
| (Unaudited) |
|
|
|
| ||
ASSETS |
|
|
|
|
|
|
|
|
|
|
|
|
|
|
|
|
|
CURRENT ASSETS |
|
|
|
|
|
|
|
|
Cash and cash equivalents |
| $ | 21,352,241 |
|
| $ | 27,132,540 |
|
Short-term investments |
|
| 22,511,712 |
|
|
| 14,756,665 |
|
Loans receivable (net of allowance for losses of $662,000 and $673,000, respectively) |
|
| 2,738,020 |
|
|
| 3,860,411 |
|
Accounts receivable (net of allowance for losses of $90,000 and $13,000, respectively) |
|
| 2,271,517 |
|
|
| 517,476 |
|
Inventories (net of allowance of $864,000 and $1,065,000, respectively) |
|
| 8,817,697 |
|
|
| 8,330,691 |
|
Prepaid expenses and other |
|
| 2,936,085 |
|
|
| 2,679,859 |
|
TOTAL CURRENT ASSETS |
|
| 60,627,272 |
|
|
| 57,277,642 |
|
|
|
|
|
|
|
|
|
|
INVESTMENTS |
|
| 1,000,000 |
|
|
| 1,500,000 |
|
|
|
|
|
|
|
|
|
|
PROPERTY AND EQUIPMENT, net |
|
| 9,457,967 |
|
|
| 9,725,043 |
|
|
|
|
|
|
|
|
|
|
OPERATING LEASE RIGHT-OF-USE ASSETS |
|
| 12,187,708 |
|
|
| 12,344,894 |
|
|
|
|
|
|
|
|
|
|
INTANGIBLE ASSETS, net |
|
| 3,961,873 |
|
|
| 4,041,650 |
|
|
|
|
|
|
|
|
|
|
LOAN RECEIVABLE |
|
| 703,745 |
|
|
| 694,987 |
|
|
|
|
|
|
|
|
|
|
OTHER |
|
| 571,131 |
|
|
| 525,884 |
|
|
|
|
|
|
|
|
|
|
GOODWILL |
|
| 5,796,528 |
|
|
| 5,796,528 |
|
|
|
|
|
|
|
|
|
|
TOTAL ASSETS |
| $ | 94,306,224 |
|
| $ | 91,906,628 |
|
|
|
|
|
|
|
|
|
|
LIABILITIES AND EQUITY |
|
|
|
|
|
|
|
|
|
|
|
|
|
|
|
|
|
CURRENT LIABILITIES |
|
|
|
|
|
|
|
|
Accounts payable |
| $ | 8,744,760 |
|
| $ | 7,710,222 |
|
Accrued payroll |
|
| 1,942,602 |
|
|
| 2,572,331 |
|
Current portion operating lease liabilities |
|
| 5,049,025 |
|
|
| 5,079,745 |
|
Other current liabilities |
|
| 1,169,524 |
|
|
| 1,276,613 |
|
Income taxes payables |
|
| 844,774 |
|
|
| 243,149 |
|
Current portion notes payable |
|
| 66,362 |
|
|
| 65,414 |
|
Current portion finance lease obligations |
|
| — |
|
|
| 1,161 |
|
Contract liabilities |
|
| 627,149 |
|
|
| 794,830 |
|
TOTAL CURRENT LIABILITIES |
|
| 18,444,196 |
|
|
| 17,743,465 |
|
|
|
|
|
|
|
|
|
|
LONG-TERM LIABILITIES |
|
|
|
|
|
|
|
|
Notes payable, net of current portion |
|
| 1,002,856 |
|
|
| 1,019,837 |
|
Operating lease liabilities, net of current portion |
|
| 7,308,021 |
|
|
| 7,444,789 |
|
Deferred income taxes |
|
| 379,000 |
|
|
| 385,000 |
|
TOTAL LONG-TERM LIABILITIES |
|
| 8,689,877 |
|
|
| 8,849,626 |
|
|
|
|
|
|
|
|
|
|
TOTAL LIABILITIES |
|
| 27,134,073 |
|
|
| 26,593,091 |
|
|
|
|
|
|
|
|
|
|
COMMITMENTS AND CONTINGENCIES (Note 14) |
|
| — |
|
|
| — |
|
|
|
|
|
|
|
|
|
|
EQUITY |
|
|
|
|
|
|
|
|
|
|
|
|
|
|
|
|
|
WESTERN SHAREHOLDERS’ EQUITY |
|
|
|
|
|
|
|
|
Common stock, $0.0001 par value, 12,500,000 shares authorized, 9,265,778 shares issued and outstanding as of March 31, 2020 and December 31, 2019 |
|
| 927 |
|
|
| 927 |
|
Additional paid-in capital |
|
| 29,031,741 |
|
|
| 29,031,741 |
|
Retained earnings |
|
| 35,147,081 |
|
|
| 33,706,035 |
|
TOTAL WESTERN SHAREHOLDERS’ EQUITY |
|
| 64,179,749 |
|
|
| 62,738,703 |
|
|
|
|
|
|
|
|
|
|
NONCONTROLLING INTERESTS |
|
| 2,992,402 |
|
|
| 2,574,834 |
|
|
|
|
|
|
|
|
|
|
TOTAL EQUITY |
|
| 67,172,151 |
|
|
| 65,313,537 |
|
|
|
|
|
|
|
|
|
|
TOTAL LIABILITIES AND EQUITY |
| $ | 94,306,224 |
|
| $ | 91,906,628 |
|
See notes to condensed consolidated financial statements
WESTERN CAPITAL RESOURCES, INC. AND SUBSIDIARIESCONDENSED CONSOLIDATED STATEMENTS OF INCOME (Unaudited)
|
| Three Months Ended |
| |||||
|
| March 31, 2020 |
|
| March 31, 2019 |
| ||
REVENUES |
|
|
|
|
|
|
|
|
Sales and associated fees |
| $ | 26,808,486 |
|
| $ | 23,820,838 |
|
Financing fees and interest |
|
| 2,044,697 |
|
|
| 2,114,871 |
|
Other revenues |
|
| 4,744,598 |
|
|
| 4,022,511 |
|
Total Revenues |
|
| 33,597,781 |
|
|
| 29,958,220 |
|
|
|
|
|
|
|
|
|
|
COST OF REVENUES |
|
|
|
|
|
|
|
|
Cost of sales |
|
| 13,931,349 |
|
|
| 12,736,421 |
|
Provisions for loans receivable losses |
|
| 291,428 |
|
|
| 218,277 |
|
Total Cost of Revenues |
|
| 14,222,777 |
|
|
| 12,954,698 |
|
|
|
|
|
|
|
|
|
|
GROSS PROFIT |
|
| 19,375,004 |
|
|
| 17,003,522 |
|
|
|
|
|
|
|
|
|
|
OPERATING EXPENSES |
|
|
|
|
|
|
|
|
Salaries, wages and benefits |
|
| 8,914,954 |
|
|
| 8,095,947 |
|
Occupancy |
|
| 2,827,239 |
|
|
| 2,764,283 |
|
Advertising, marketing and development |
|
| 1,827,955 |
|
|
| 1,775,842 |
|
Depreciation |
|
| 498,658 |
|
|
| 429,500 |
|
Amortization |
|
| 184,778 |
|
|
| 184,536 |
|
Other |
|
| 2,284,318 |
|
|
| 2,264,592 |
|
Total Operating Expenses |
|
| 16,537,902 |
|
|
| 15,514,700 |
|
|
|
|
|
|
|
|
|
|
OPERATING INCOME |
|
| 2,837,102 |
|
|
| 1,488,822 |
|
|
|
|
|
|
|
|
|
|
OTHER INCOME (EXPENSES): |
|
|
|
|
|
|
|
|
Dividend and interest income |
|
| 138,727 |
|
|
| 181,543 |
|
Interest expense |
|
| (15,816 | ) |
|
| (26,255 | ) |
Total Other Income (Expenses) |
|
| 122,911 |
|
|
| 155,288 |
|
|
|
|
|
|
|
|
|
|
INCOME BEFORE INCOME TAXES |
|
| 2,960,013 |
|
|
| 1,644,110 |
|
|
|
|
|
|
|
|
|
|
PROVISION FOR INCOME TAX EXPENSE |
|
| 593,110 |
|
|
| 344,000 |
|
|
|
|
|
|
|
|
|
|
NET INCOME |
|
| 2,366,903 |
|
|
| 1,300,110 |
|
|
|
|
|
|
|
|
|
|
LESS NET INCOME ATTRIBUTABLE TO NONCONTROLLING INTERESTS |
|
| (462,568 | ) |
|
| (249,697 | ) |
|
|
|
|
|
|
|
|
|
NET INCOME ATTRIBUTABLE TO WESTERN COMMON SHAREHOLDERS |
| $ | 1,904,335 |
|
| $ | 1,050,413 |
|
|
|
|
|
|
|
|
|
|
EARNINGS PER SHARE ATTRIBUTABLE TO WESTERN COMMON SHAREHOLDERS |
|
|
|
|
|
|
|
|
Basic and diluted |
| $ | 0.21 |
|
| $ | 0.11 |
|
|
|
|
|
|
|
|
|
|
WEIGHTED AVERAGE COMMON SHARES OUTSTANDING |
|
|
|
|
|
|
|
|
Basic and diluted |
|
| 9,265,778 |
|
|
| 9,388,677 |
|
4
See notes to condensed consolidated financial statements
WESTERN CAPITAL RESOURCES, INC. AND SUBSIDIARIES
CONDENSED CONSOLIDATED STATEMENTS OF SHAREHOLDERS’ EQUITY (Unaudited)
|
| Western Capital Resources, Inc. Shareholders |
|
|
|
|
|
|
| |||||||||||||||
|
| Common Stock |
|
|
|
|
|
|
|
|
|
|
|
|
| |||||||||
|
|
| Shares |
|
|
| Amount |
|
|
| Additional Paid-In Capital |
|
|
| Retained Earnings |
|
|
| Noncontrolling Interests |
|
|
| Total |
|
BALANCE – December 31, 2019 |
|
| 9,265,778 |
|
| $ | 927 |
|
| $ | 29,031,741 |
|
| $ | 33,706,035 |
|
| $ | 2,574,834 |
|
| $ | 65,313,537 |
|
Net income |
|
| — |
|
|
| — |
|
|
| — |
|
|
| 1,904,335 |
|
|
| 462,568 |
|
|
| 2,366,903 |
|
Distributions to Noncontrolling Interests |
|
| — |
|
|
| — |
|
|
| — |
|
|
| — |
|
|
| (45,000 | ) |
|
| (45,000 | ) |
Dividends |
|
| — |
|
|
| — |
|
|
| — |
|
|
| (463,289 | ) |
|
| — |
|
|
| (463,289 | ) |
BALANCE – March 31, 2020 |
|
| 9,265,778 |
|
| $ | 927 |
|
| $ | 29,031,741 |
|
| $ | 35,147,081 |
|
| $ | 2,992,402 |
|
| $ | 67,172,151 |
|
|
| Western Capital Resources, Inc. Shareholders |
|
|
|
|
|
|
| |||||||||||||||
|
| Common Stock |
|
|
|
|
|
|
|
|
|
|
|
|
| |||||||||
|
|
| Shares |
|
|
| Amount |
|
|
| Additional Paid-In Capital |
|
|
| Retained Earnings |
|
|
| Noncontrolling Interests |
|
|
| Total |
|
BALANCE – December 31, 2018 |
|
| 9,388,677 |
|
| $ | 939 |
|
| $ | 29,031,741 |
|
| $ | 33,774,293 |
|
| $ | 1,876,908 |
|
| $ | 64,683,881 |
|
Net income |
|
| — |
|
|
| — |
|
|
| — |
|
|
| 1,050,413 |
|
|
| 249,697 |
|
|
| 1,300,110 |
|
Noncontrolling Interest equity contribution |
|
| — |
|
|
| — |
|
|
| — |
|
|
| — |
|
|
| 17,446 |
|
|
| 17,446 |
|
Distributions to Noncontrolling Interests |
|
| — |
|
|
| — |
|
|
| — |
|
|
| — |
|
|
| (266,600 | ) |
|
| (266,600 | ) |
Dividends |
|
| — |
|
|
| — |
|
|
| — |
|
|
| (469,434 | ) |
|
| — |
|
|
| (469,434 | ) |
BALANCE – March 31, 2019 |
|
| 9,388,677 |
|
| $ | 939 |
|
| $ | 29,031,741 |
|
| $ | 34,355,272 |
|
| $ | 1,877,451 |
|
| $ | 65,265,403 |
|
See notes to condensed consolidated financial statements.
5
WESTERN CAPITAL RESOURCES, INC. AND SUBSIDIARIES
CONDENSED CONSOLIDATED STATEMENTS OF CASH FLOWS (Unaudited)
|
| Three Months Ended |
| |||||
|
| March 31, 2020 |
|
| March 31, 2019 |
| ||
OPERATING ACTIVITIES |
|
|
|
|
| |||
Net income |
| $ | 2,366,903 |
|
| $ | 1,300,110 |
|
Adjustments to reconcile net income to net cash provided by operating activities: |
|
|
|
|
|
|
|
|
Depreciation |
|
| 498,658 |
|
|
| 429,500 |
|
Amortization |
|
| 184,778 |
|
|
| 184,536 |
|
Amortization of operating lease right-of-use assets |
|
| 1,475,354 |
|
|
| 1,411,389 |
|
Deferred income taxes |
|
| (6,000 | ) |
|
| 291,000 |
|
Gain on disposals |
|
| (7,737 | ) |
|
| (147,977 | ) |
Accrued interest from investing activities |
|
| (6,002 | ) |
|
| (73,862 | ) |
Changes in operating assets and liabilities: |
|
|
|
|
|
|
|
|
Loans receivable |
|
| 1,122,391 |
|
|
| 980,252 |
|
Accounts receivable |
|
| (1,754,041 | ) |
|
| (1,510,812 | ) |
Inventory |
|
| (421,296 | ) |
|
| (1,232,366 | ) |
Prepaid expenses and other assets |
|
| (296,199 | ) |
|
| (386,216 | ) |
Operating lease liabilities |
|
| (1,658,358 | ) |
|
| (1,594,341 | ) |
Accounts payable and accrued expenses |
|
| 1,123,592 |
|
|
| 508,655 |
|
Deferred revenue and other current liabilities |
|
| (274,770 | ) |
|
| 146,689 |
|
Net cash and cash equivalents provided by operating activities |
|
| 2,347,273 |
|
|
| 306,557 |
|
|
|
|
|
|
|
|
|
|
INVESTING ACTIVITIES |
|
|
|
|
|
|
|
|
Purchases of investments |
|
| (16,161,391 | ) |
|
| (17,940,344 | ) |
Proceeds from held-to-maturity investments |
|
| 8,903,588 |
|
|
| 13,680,000 |
|
Purchases of property and equipment |
|
| (133,410 | ) |
|
| (84,839 | ) |
Acquisition of stores, net of cash acquired |
|
| (260,876 | ) |
|
| (164,400 | ) |
Proceeds from the disposal of operating assets |
|
| 50,000 |
|
|
| 1,120,000 |
|
Net cash and cash equivalents used by investing activities |
|
| (7,602,089 | ) |
|
| (3,389,583 | ) |
|
|
|
|
|
|
|
|
|
FINANCING ACTIVITIES |
|
|
|
|
|
|
|
|
Payments on notes payable – long-term |
|
| (16,033 | ) |
|
| (5,204 | ) |
Payments on finance leases |
|
| (1,161 | ) |
|
| (12,278 | ) |
Distributions to noncontrolling interests |
|
| (45,000 | ) |
|
| (266,600 | ) |
Payments of dividends |
|
| (463,289 | ) |
|
| (469,434 | ) |
Net cash and cash equivalents used in financing activities |
|
| (525,483 | ) |
|
| (753,516 | ) |
|
|
|
|
|
|
|
|
|
NET DECREASE IN CASH AND CASH EQUIVALENTS |
|
| (5,780,299 | ) |
|
| (3,836,542 | ) |
|
|
|
|
|
|
|
|
|
CASH AND CASH EQUIVALENTS |
|
|
|
|
|
|
|
|
Beginning of period |
|
| 27,132,540 |
|
|
| 16,724,983 |
|
End of period |
| $ | 21,352,241 |
|
| $ | 12,888,441 |
|
|
|
|
|
|
|
|
|
|
SUPPLEMENTAL DISCLOSURE OF CASH FLOW INFORMATION |
|
|
|
|
|
|
|
|
|
|
|
|
|
|
|
|
|
Income taxes paid |
| $ | — |
|
| $ | 16,475 |
|
Interest paid |
| $ | 15,882 |
|
| $ | 20,353 |
|
Noncash investing and financing activities: |
|
|
|
|
|
|
|
|
Assets received in acquisition |
| $ | 580,972 |
|
| $ | 1,694,546 |
|
Liabilities assumed in acquisition |
| $ | 580,972 |
|
| $ | 1,325,024 |
|
Note payable assumed in acquisition |
| $ | — |
|
| $ | 347,918 |
|
Noncontrolling interest contribution to subsidiary |
| $ | — |
|
| $ | 17,446 |
|
Right-of-use assets obtained and operating lease obligations incurred |
| $ | 923,097 |
|
| $ | 963,486 |
|
Right-of-use asset and operating lease obligation disposals |
| $ | 130,357 |
|
| $ | — |
|
| Western Capital Resources, Inc. Shareholders | ||||||||||||||||||||||||
| Common Stock | ||||||||||||||||||||||||
| Shares | Amount | Additional Paid-In Capital | Retained Earnings | Noncontrolling Interests | Total | |||||||||||||||||||
| BALANCE – December 31, 2018 | 9,388,677 | $ | 939 | $ | 29,031,741 | $ | 33,774,293 | $ | 1,876,908 | $ | 64,683,881 | |||||||||||||
| Net income | — | — | — | 1,050,413 | 249,697 | 1,300,110 | ||||||||||||||||||
| Noncontrolling Interest equity contribution | — | — | — | — | 17,446 | 17,446 | ||||||||||||||||||
| Distributions to Noncontrolling Interests | — | — | — | — | (266,600 | ) | (266,600 | ) | ||||||||||||||||
| Dividends | — | — | — | (469,434 | ) | — | (469,434 | ) | ||||||||||||||||
| BALANCE – March 31, 2019 | 9,388,677 | 939 | 29,031,741 | 34,355,272 | 1,877,451 | 65,265,403 | ||||||||||||||||||
| Net income | — | — | — | 1,131,200 | 247,531 | 1,378,731 | ||||||||||||||||||
| Distributions to Noncontrolling Interests | — | — | — | — | (470,000 | ) | (470,000 | ) | ||||||||||||||||
| Dividends | — | — | — | (469,434 | ) | — | (469,434 | ) | ||||||||||||||||
| BALANCE – June 30, 2019 | 9,388,677 | 939 | 29,031,741 | 35,017,038 | 1,654,982 | 65,704,700 | ||||||||||||||||||
| Net income (loss) | — | — | — | (49,692 | ) | 340,274 | 290,582 | |||||||||||||||||
| Distributions to Noncontrolling Interests | — | — | — | — | (200,000 | ) | (200,000 | ) | ||||||||||||||||
| Stock redemption | (39,982 | ) | (4 | ) | — | (159,217 | ) | — | (159,221 | ) | ||||||||||||||
| Dividends | — | — | — | (468,912 | ) | — | (468,912 | ) | ||||||||||||||||
| BALANCE – September 30, 2019 | 9,348,695 | $ | 935 | $ | 29,031,741 | $ | 34,339,217 | $ | 1,795,256 | $ | 65,167,149 | |||||||||||||
See notes to condensed consolidated financial statements.
WESTERN CAPITAL RESOURCES, INC. AND SUBSIDIARIES | ||||||||
| Nine Months Ended | ||||||||
| September 30, 2020 | September 30, 2019 | |||||||
| OPERATING ACTIVITIES | ||||||||
| Net income | $ | 9,011,090 | $ | 2,969,423 | ||||
| Adjustments to reconcile net income to net cash provided by operating activities: | ||||||||
| Depreciation | 1,454,512 | 1,309,035 | ||||||
| Amortization | 541,432 | 518,422 | ||||||
| Amortization of operating lease right-of-use assets | 4,203,264 | 4,200,455 | ||||||
| Deferred income taxes | (33,000 | ) | 359,000 | |||||
| Loss (gain) on disposals | 436,775 | (73,086 | ) | |||||
| Accrued interest from investing activities | (1,932 | ) | — | |||||
| Changes in operating assets and liabilities: | ||||||||
| Loans receivable | 1,263,006 | 426,596 | ||||||
| Accounts receivable | (312,891 | ) | (259,146 | ) | ||||
| Inventory | (649,557 | ) | (411,322 | ) | ||||
| Prepaid expenses and other assets | 97,064 | 28,833 | ||||||
| Operating lease liabilities | (4,811,774 | ) | (4,675,738 | ) | ||||
| Accounts payable and accrued expenses | (1,406,202 | ) | (3,335,321 | ) | ||||
| Contract liabilities and other current liabilities | (346,368 | ) | (325,811 | ) | ||||
| Net cash and cash equivalents provided by operating activities | 9,445,419 | 731,340 | ||||||
| INVESTING ACTIVITIES | ||||||||
| Purchases of investments | (37,263,764 | ) | (23,728,805 | ) | ||||
| Proceeds from held-to-maturity investments | 35,417,921 | 30,965,130 | ||||||
| Purchases of property and equipment | (409,194 | ) | (544,864 | ) | ||||
| Acquisition of stores, net of cash acquired | (566,586 | ) | (164,400 | ) | ||||
| Advances on loans receivable | (6,590 | ) | (578,948 | ) | ||||
| Proceeds from the disposal of operating assets | 382,989 | 1,195,000 | ||||||
| Net cash and cash equivalents provided by (used in) investing activities | (2,445,224 | ) | 7,143,113 | |||||
| FINANCING ACTIVITIES | ||||||||
| Payments on notes payable – long-term | (1,085,251 | ) | (54,226 | ) | ||||
| Common stock redemption | (1,619,754 | ) | (159,221 | ) | ||||
| Payments on finance leases | (1,161 | ) | (37,275 | ) | ||||
| Distributions to noncontrolling interests | (1,749,337 | ) | (936,600 | ) | ||||
| Payments of dividends | (922,527 | ) | (1,407,780 | ) | ||||
| Net cash and cash equivalents used in financing activities | (5,378,030 | ) | (2,595,102 | ) | ||||
| NET INCREASE IN CASH AND CASH EQUIVALENTS | 1,622,165 | 5,279,351 | ||||||
| CASH AND CASH EQUIVALENTS | ||||||||
| Beginning of period | 27,132,540 | 16,724,983 | ||||||
| End of period | $ | 28,754,705 | $ | 22,004,334 | ||||
| SUPPLEMENTAL DISCLOSURE OF CASH FLOW INFORMATION | ||||||||
| Income taxes paid | $ | 2,952,337 | $ | 576,638 | ||||
| Interest paid | $ | 50,509 | $ | 69,246 | ||||
| Noncash investing and financing activities: | ||||||||
| Assets received in acquisition (see Note 13) | $ | 1,233,616 | $ | 1,738,546 | ||||
| Liabilities assumed in acquisition (see Note 13) | $ | 1,233,616 | $ | 1,369,024 | ||||
| Note payable assumed in acquisition (see Note 13) | $ | — | $ | 347,918 | ||||
| Noncontrolling interest contribution to subsidiary (see Note 13) | $ | — | $ | 17,446 | ||||
| Right-of-use assets obtained and operating lease obligations incurred | $ | 2,656,498 | $ | 244,077 | ||||
| Right-of-use asset disposals | $ | 1,145,732 | $ | — | ||||
| Right-of-use liability disposals | $ | 706,030 | $ | — | ||||
| Stock repurchase | $ | 613,856 | $ | — | ||||
| Distribution to noncontrolling interest applied to loan receivable | $ | 253,265 | $ | — | ||||
See notes to condensed consolidated financial statements.
WESTERN CAPITAL RESOURCES, INC. AND SUBSIDIARIES
NOTES TO CONDENSED CONSOLIDATED FINANCIAL STATEMENTS (Unaudited)
| 1. | Basis of Presentation, Nature of Business and Summary of Significant Accounting Policies – |
Basis of Presentation
The accompanying unaudited condensed consolidated financial statements have been prepared according to the instructions to Form 10-Q and Section 210.8-03(b) of Regulation S-X of the Securities and Exchange Commission (SEC) and, therefore, certain information and note disclosures normally included in financial statements prepared in accordance with accounting principles generally accepted in the United States of America (GAAP) have been omitted.
In the opinion of management, all adjustments (consisting of normal recurring accruals) considered necessary for a fair presentation have been included. Operating results for the three-month periodthree and nine month periods ended March 31,September 30, 2020 are not necessarily indicative of the results that may be expected for the year ending December 31, 2020.
Management has analyzed the impact of the Coronavirus pandemic (“COVID-19”) on its financial statements as of March 31,September 30, 2020 and has determined that the changes to its significant judgements and estimates did not have a material impact with respect to goodwill, intangible assets or long-lived assets.
For further information, refer to the Consolidated Financial Statements and notes thereto included in our Form 10-K for the year ended December 31, 2019. The condensed consolidated balance sheet at December 31, 2019, has been derived from the audited consolidated financial statements at that date, but does not include all of the information and notes required by GAAP.
Nature of Business
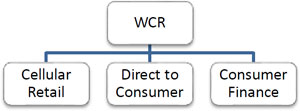
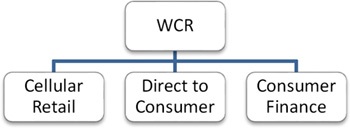
Western Capital Resources, Inc. (“WCR”) is a parent company owning operating subsidiaries, with percentage owned shown parenthetically, as summarized below.
● | Cellular Retail |
| PQH Wireless, Inc. (“PQH”) (100%) – operates |
● | Direct to Consumer |
| J&P Park Acquisitions, Inc. (“JPPA”) (100%) – an online and direct marketing distribution retailer of 1) live plants, seeds, holiday gifts and garden accessories selling its products under Park Seed, Jackson & Perkins, and Wayside Gardens brand names and 2) home improvement and restoration products operating under the Van Dyke’s Restorers brand, as well as a seed wholesaler under the Park Wholesale brand. |
| J&P Real Estate, LLC (“JPRE”) (100%) – owns real estate utilized as JPPA’s distribution and warehouse facility and the corporate offices of JPPA. |
● | Consumer Finance |
| Wyoming Financial Lenders, Inc. (“WFL”) (100%) – owns and operates “payday” stores |
| Express Pawn, Inc. (“EPI”) (100%) – owns and operates retail pawn stores (three as of |
References in these financial statement notes to “Company” or “we” refer to Western Capital Resources, Inc. and its subsidiaries. References to specific companies within our enterprise, such as” “PQH,” “JPPA,” “JPRE,” “WFL,” or “EPI” are references only to those companies.
Basis of Consolidation
The consolidated financial statements include the accounts of WCR, its wholly owned subsidiaries and other entities in which the Company owns a controlling financial interest. For financial interests in which the Company owns a controlling financial interest, the Company applies the provisions of Financial Accounting Standards Board Accounting Standards Codification (“ASC”) 810, “Consolidation” applicable to reporting the equity and net income or loss attributable to noncontrolling interests. All significant intercompany balances and transactions of the Company have been eliminated in consolidation.
Use of Estimates
The preparation of consolidated financial statements in conformity with accounting principles generally accepted in the United States of America requires management to make estimates and assumptions that may affect certain reported amounts and disclosures in the consolidated financial statements and accompanying notes. Management bases its estimates on historical experience and on various other assumptions that are believed to be reasonable under the circumstances. Actual results could differ from those estimates. Significant management estimates relate to the notes and loans receivable allowance, carrying value and impairment of long-lived goodwill, intangible assets, and intangibleright-of-use assets, inventory valuation and obsolescence, estimated useful lives of property and equipment, gift certificate and merchandise credits liability and deferred taxes and tax uncertainties.
8
Reclassifications
Certain Statement of Income reclassifications have been made in the presentation of our prior financial statements to conform to the presentation as of and for the three and nine months ended March 31,September 30, 2020.
Recent Accounting Pronouncements
In April, 2020 the staff of the Financial Accounting Standards Board (FASB) issued a question-and-answer document that saysstates entities canmay elect not to evaluate whether a concession provided by a lessor to a lessee in response to the effects of the coronavirus pandemic is a lease modification. Retailers may make the elections for any lessor-provided concessions related to the effects of the coronavirus pandemic as long as the concession does not result in a substantial increase in the rights of the lessor or the obligations of the lessee. The Company has made such election. The Company has received minimal rent concessions and has not entered into any related lease modifications to date. As such, the Company does not believe this election will have a material impact on ourits financial condition, results of operations or consolidated financial statements.
No other new accounting pronouncements issued or effective during the fiscal yearperiod have had or are expected to have a material impact on the consolidated financial statements.
| 2. | Risks Inherent in the Operating Environment – |
Regulatory
The Company’s Consumer Finance segment activities are highly regulated under numerous federal, state, and local laws, regulations and rules, which are subject to change. New laws, regulations or rules could be enacted or issued, interpretations of existing laws, regulations or rules may change and enforcement action by regulatory agencies may intensify. Over the past several years, consumer advocacy groups and certain media reports have advocated governmental and regulatory action to prohibit or severely restrict sub-prime lending activities of the kind conducted by the Company. After several years of research, debate, and public hearings, in October 2017 the U.S. Consumer Financial Protection Bureau (“CFPB”) adopted a new rule for payday lending. The rule, originally scheduled to go into effect in August 2019, would imposehave imposed significant restrictions on the industry, and it iswas expected that a large number of lenders would be forced to close their stores.stores as a result of the rule. The CFPB’s studies projected a reduction in the number of lenders by 50%, while industry studies forecast a much higher attrition rate if the rule iswas implemented as originally adopted.
However, in January 2018, the CFPB issued a statement that it intendsintended to “reconsider” the regulation. The most current information from the CFPB website states the proposals it is considering includes rescinding the mandatory underwriting provisions contained in the ruleregulation and to delaydelayed the August 19, 2019 compliance date for the other provisions to November 19, 2020. At this time it is uncertain whetherIn July 2020, the CFPB issued a final rule applicable to the 2017 rule. The final rule rescinds the mandatory underwriting provisions of the 2017 rule but does not rescind or alter the payments provisions of the 2017 rule. The CFPB will be implemented as announced, rewrittenseek to have these rules go into effect with more favorable termsa reasonable period for entities to come into compliance. The implementation of the industry, or thrown out altogether. If thefinal rule is implemented as written, it could havelikely to result in a significantreduction of in-house bad debt collections, higher collection costs and thus a negative impact on business conducted within our Consumer Finance segment.
Consumer advocacy groups in many states are actively seeking state law changes which would effectively end the viability of a payday loan business, including Nebraska where in 2019 we generate approximately 28%30% of our payday lending revenue, or approximately 1.6%2% of our consolidated revenue. If these groups are successful in Nebraska, we will likely cease payday lending activities in Nebraska. In June 2020, a Nebraska group submitted signatures for a ballot initiative that would limit all fees charged by payday lenders in Nebraska to an annual interest rate of 36%. As a result, the initiative is expected to be on the Nebraska statewide ballot for the November 3, 2020 election.
The aboveimplementation of the CFPB rule, the passage of the Nebraska ballot initiative or any other adverse change in present federal, state, or local laws or regulations that govern or otherwise affect lending could result in the Consumer Finance segment’s curtailment or cessation of operations in certain or all jurisdictions or locations. Furthermore, any failure to comply with any applicable local, state or federal laws or regulations could result in fines, litigation, closure of one or more store locations or negative publicity. Any such change or failure would have a corresponding impact on the Company’s and segment’s results of operations and financial condition, primarily through a decrease in revenues resulting from the cessation or curtailment of operations, or a decrease in operating income through increased legal expenditures or fines, and could also negatively affect the Company’s general business prospects due to lost or decreased operating income or if negative publicity effects its ability to obtain additional financing as needed.
In addition, the passage of federal, state or local laws and regulations or changes in interpretations of them could, at any point, essentially prohibit the Consumer Finance segment from conducting its lending business in its current form. Any such legal or regulatory change would certainly have a material and adverse effect on the Company, its operating results, financial condition and prospects, and perhaps even the viability of the Consumer Finance segment.
Concentrations
The Company has demand deposits at financial institutions, often times in excess of the limit for insurance by the Federal Deposit Insurance Corporation. As of March 31,September 30, 2020, the Company had demand deposits in excess of insurance amounts of approximately $6.73$7.39 million.
COVID-19
In December 2019 COVID-19 emerged in Wuhan, China. While initially the outbreak was largely concentrated in China and caused significant disruptions to its economy, it has now spread to almost all other countries, including the United States, and infections have been reported globally.globally, with much of the United States experiencing a “third peak” in infections during the fall months.
Because COVID-19 infections have been reported throughout the United States, certain federal, state and local governmental authorities have issued stay-at-home orders and others proclamations and/or directives aimed at minimizing the spread of COVID-19. Additional, more restrictive proclamations and/or directives may be issued in the future. AsSince the start of March 31, 2020,the pandemic, the Company’s Cellular Retail segment had temporarily closed approximately 75 locations.locations, all but 22 of which subsequently re-opened by the end of April 2020. In June 2020, those 22 closed locations plus five others were permanently closed.
The ultimate impact of the COVID-19 pandemic on the Company’s operations is unknown and will depend on future developments, which are highly uncertain and cannot be predicted with confidence, including the duration of the COVID-19 outbreak, new information which may emerge concerning the severity of the COVID-19 pandemic, and any additional preventative and protective actions that governments, or the Company, may direct, which may result in an extended period of continued business disruption, reduced customer traffic and reduced operations. Any resulting financial impact cannot be reasonably estimated at this time but may have a material impact on our business, financial condition and results of operations. The significance of the impact of the COVID-19 outbreak on the Company’s businesses and the duration for which it may have an impact cannot be determined at this time.
| 3. | Cash Equivalents and Marketable Investments – |
The following table shows the Company’s cash and cash equivalents and held-to-maturity investments, by significant investment category, recorded as cash and cash equivalents or short- and long-term investments:
| March 31, 2020 | December 31, 2019 | September 30, 2020 | December 31, 2019 | |||||||||||||
| Cash and cash equivalents | ||||||||||||||||
| Operating accounts | $ | 12,509,044 | $ | 10,163,845 | $ | 14,070,233 | $ | 10,163,845 | ||||||||
| Money Market – U.S. Treasury obligations | 6,258,991 | 4,450,433 | 1,284,804 | 12,518,262 | ||||||||||||
| U.S. Treasury obligations | 2,584,206 | 12,518,262 | 13,399,668 | 4,450,433 | ||||||||||||
| Subtotal | 21,352,241 | 27,132,540 | 28,754,705 | 27,132,540 | ||||||||||||
| Held to Maturity Investments | ||||||||||||||||
| Certificates of deposit (4 – 24 month maturities, FDIC insured) | $ | 11,315,739 | $ | 9,049,787 | $ | 18,079,672 | $ | 9,049,787 | ||||||||
| U.S. Treasury obligations (less than one year maturities) | 12,195,973 | 7,206,878 | — | 7,206,878 | ||||||||||||
| Subtotal | 23,511,712 | 16,256,665 | 18,079,672 | 16,256,665 | ||||||||||||
| TOTAL | $ | 44,863,953 | $ | 43,389,205 | $ | 46,834,377 | $ | 43,389,205 | ||||||||
Held to maturity investments consisted of the following:
| March 31, 2020 | ||||||||||||||||||||||||||||||||||||||||||||||||
| September 30, 2020 | September 30, 2020 | |||||||||||||||||||||||||||||||||||||||||||||||
| Cost | Accrued Interest | Amortized Discount | Amortized Cost | Unrealized Gain (Loss) | Estimated Fair Value | Cost | Accrued Interest | Amortized Discount | Amortized Cost | Unrealized Gain (Loss) | Estimated Fair Value | |||||||||||||||||||||||||||||||||||||
| Certificates of Deposit | $ | 11,271,888 | $ | 43,851 | $ | — | $ | 11,315,739 | $ | (25,906 | ) | $ | 11,289,833 | $ | 18,028,318 | $ | 51,354 | $ | — | $ | 18,079,672 | $ | 13,040 | $ | 18,092,712 | |||||||||||||||||||||||
| U.S. Treasuries | 12,155,120 | — | 40,853 | 12,195,973 | 2,953 | 12,198,926 | — | — | — | — | — | — | ||||||||||||||||||||||||||||||||||||
| $ | 23,427,008 | $ | 43,851 | $ | 40,853 | $ | 23,511,712 | $ | (22,953 | ) | $ | 23,488,759 | $ | 18,028,318 | $ | 51,354 | $ | — | $ | 18,079,672 | $ | 13,040 | $ | 18,092,712 | ||||||||||||||||||||||||
| December 31, 2019 | December 31, 2019 | December 31, 2019 | ||||||||||||||||||||||||||||||||||||||||||||||
| Cost | Accrued Interest | Amortized Discount | Amortized Cost | Unrealized Gain (Loss) | Estimated Fair Value | Cost | Accrued Interest | Amortized Discount | Amortized Cost | Unrealized Gain (Loss) | Estimated Fair Value | |||||||||||||||||||||||||||||||||||||
| Certificates of Deposit | $ | 9,015,618 | $ | 34,169 | $ | — | $ | 9,049,787 | $ | (32,429 | ) | $ | 9,017,358 | $ | 9,015,618 | $ | 34,169 | $ | — | $ | 9,049,787 | $ | (32,429 | ) | $ | 9,017,358 | ||||||||||||||||||||||
| U.S. Treasuries | 7,153,587 | — | 53,291 | 7,206,878 | 2,883 | 7,209,761 | 7,153,587 | — | 53,291 | 7,206,878 | 2,883 | 7,209,761 | ||||||||||||||||||||||||||||||||||||
| $ | 16,169,205 | $ | 34,169 | $ | 53,291 | $ | 16,256,665 | $ | (29,546 | ) | $ | 16,227,119 | $ | 16,169,205 | $ | 34,169 | $ | 53,291 | $ | 16,256,665 | $ | (29,546 | ) | $ | 16,227,119 | |||||||||||||||||||||||
Interest income recognized on held-to-maturity investments and other sources was as follows:
| Three Months Ended March 31, 2020 | Three Months Ended March 31, 2019 | Three Months Ended September 30, 2020 | Three Months Ended September 30, 2019 | Nine Months Ended September 30, 2020 | Nine Months Ended September 30, 2019 | |||||||||||||||||||||
Held-to-maturity | $ | 116,075 | $ | 142,146 | $ | 44,694 | $ | 112,158 | $ | 210,725 | $ | 412,855 | ||||||||||||||
Other | 22,652 | 39,397 | 9,902 | 86,659 | 54,318 | 161,481 | ||||||||||||||||||||
| $ | 138,727 | $ | 181,543 | $ | 54,596 | $ | 198,817 | $ | 265,043 | $ | 574,336 | |||||||||||||||
4. Loans Receivable –The Company deposited in aggregate $1.75 million of cash across seven different accounts at a financial institution as an accommodation to its majority stockholder, who has other business relationships with the financial institution. The funds in these accounts can be withdrawn at any time, do not serve as collateral in any way, and are held on market terms.
| 4. | Loans Receivable – |
The Consumer Finance segment’s outstanding loans receivable aging is as follows:
| March 31, 2020 | ||||||||||||||||||||||||||||||||
| September 30, 2020 | September 30, 2020 | |||||||||||||||||||||||||||||||
| Payday | Installment | Pawn | Total | Payday | Installment | Pawn | Total | |||||||||||||||||||||||||
| Current | $ | 2,390,819 | $ | 38,006 | $ | 278,764 | $ | 2,707,589 | $ | 2,197,694 | $ | 42,495 | $ | 261,599 | $ | 2,501,788 | ||||||||||||||||
| 1-30 | 168,738 | 3,337 | — | 172,075 | 130,093 | 4,793 | — | 134,886 | ||||||||||||||||||||||||
| 31-60 | 127,840 | 720 | — | 128,560 | 84,270 | 546 | — | 84,816 | ||||||||||||||||||||||||
| 61-90 | 112,411 | 108 | — | 112,519 | 81,382 | — | — | 81,382 | ||||||||||||||||||||||||
| 91-120 | 105,426 | — | — | 105,426 | 44,418 | — | — | 44,418 | ||||||||||||||||||||||||
| 121-150 | 86,619 | — | — | 86,619 | 17,964 | — | — | 17,964 | ||||||||||||||||||||||||
| 151-180 | 87,232 | — | — | 87,232 | 44,851 | — | — | 44,851 | ||||||||||||||||||||||||
| 3,079,085 | 42,171 | 278,764 | 3,400,020 | 2,600,672 | 47,834 | 261,599 | 2,910,105 | |||||||||||||||||||||||||
| Less Allowance | (662,000 | ) | — | — | (662,000 | ) | (312,700 | ) | — | — | (312,700 | ) | ||||||||||||||||||||
| $ | 2,417,085 | $ | 42,171 | $ | 278,764 | $ | 2,738,020 | $ | 2,287,972 | $ | 47,834 | $ | 261,599 | $ | 2,597,405 | |||||||||||||||||
| December 31, 2019 | ||||||||||||||||
| Payday | Installment | Pawn | Total | |||||||||||||
| Current | $ | 3,322,131 | $ | 67,891 | $ | 309,934 | $ | 3,699,956 | ||||||||
| 1-30 | 216,753 | 10,590 | — | 227,343 | ||||||||||||
| 31-60 | 140,872 | 6,234 | — | 147,106 | ||||||||||||
| 61-90 | 117,544 | 2,649 | — | 120,193 | ||||||||||||
| 91-120 | 118,626 | 840 | — | 119,466 | ||||||||||||
| 121-150 | 110,278 | 395 | — | 110,673 | ||||||||||||
| 151-180 | 108,674 | — | — | 108,674 | ||||||||||||
| 4,134,878 | 88,599 | 309,934 | 4,533,411 | |||||||||||||
| Less Allowance | (673,000 | ) | — | — | (673,000 | ) | ||||||||||
| $ | 3,461,878 | $ | 88,599 | $ | 309,934 | $ | 3,860,411 | |||||||||
5. Loans Receivable Allowance –
| 5. | Loans Receivable Allowance – |
A rollforward of the Consumer Finance segment’s loans receivable allowance is as follows:
Three Months Ended March 31, 2020 | Year Ended December 31, 2019 | Nine Months Ended September 30, 2020 | Year Ended December 31, 2019 | |||||||||||||
| Loans receivable allowance, beginning of period | $ | 673,000 | $ | 818,000 | $ | 673,000 | $ | 818,000 | ||||||||
| Provision for loan losses charged to expense | 291,428 | 975,938 | 110,165 | 975,938 | ||||||||||||
| Write-offs, net | (302,428 | ) | (1,120,938 | ) | (470,465 | ) | (1,120,938 | ) | ||||||||
| Loans receivable allowance, end of period | $ | 662,000 | $ | 673,000 | $ | 312,700 | $ | 673,000 | ||||||||
6. Accounts Receivable –
| 6. | Accounts Receivable – |
A breakdown of accounts receivables by segment is as follows:
| March 31, 2020 | ||||||||||||||||||||||||||||||||
| September 30, 2020 | September 30, 2020 | |||||||||||||||||||||||||||||||
| Cellular Retail | Direct to Consumer | Consumer Finance | Total | Cellular Retail | Direct to Consumer | Consumer Finance | Total | |||||||||||||||||||||||||
| Accounts receivable | $ | 134,151 | $ | 2,204,478 | $ | 22,888 | $ | 2,361,517 | $ | 225,696 | $ | 590,533 | $ | 23,138 | $ | 839,367 | ||||||||||||||||
| Less allowance | — | (90,000 | ) | — | (90,000 | ) | — | (9,000 | ) | — | (9,000 | ) | ||||||||||||||||||||
| Net accounts receivable | $ | 134,151 | $ | 2,114,478 | $ | 22,888 | $ | 2,271,517 | $ | 225,696 | $ | 581,533 | $ | 23,138 | $ | 830,367 | ||||||||||||||||
| December 31, 2019 | December 31, 2019 | December 31, 2019 | ||||||||||||||||||||||||||||||
| Cellular Retail | Direct to Consumer | Consumer Finance | Total | Cellular Retail | Direct to Consumer | Consumer Finance | Total | |||||||||||||||||||||||||
| Accounts receivable | $ | 184,519 | $ | 318,235 | $ | 27,722 | $ | 530,476 | $ | 184,519 | $ | 318,235 | $ | 27,722 | $ | 530,476 | ||||||||||||||||
| Less allowance | — | (13,000 | ) | — | (13,000 | ) | — | (13,000 | ) | — | (13,000 | ) | ||||||||||||||||||||
| Net accounts receivable | $ | 184,519 | $ | 305,235 | $ | 27,722 | $ | 517,476 | $ | 184,519 | $ | 305,235 | $ | 27,722 | $ | 517,476 | ||||||||||||||||
A portion of accounts receivable are unsettled credit card sales from the prior one to five business days. This makes up 46%74% and 68% of the net accounts receivable balance at March 31,September 30, 2020 and December 31, 2019, respectively.
7. Inventory –
| 7. | Inventory – |
Inventories consist of:
| March 31, 2020 | December 31, 2019 | September 30, 2020 | December 31, 2019 | |||||||||||||
| Finished Goods | ||||||||||||||||
| Cellular Retail | $ | 5,673,728 | $ | 5,687,771 | $ | 5,466,853 | $ | 5,687,771 | ||||||||
| Direct to Consumer | 3,195,325 | 2,888,483 | 3,682,418 | 2,888,483 | ||||||||||||
| Consumer Finance | 812,644 | 819,437 | 726,397 | 819,437 | ||||||||||||
| Reserve | (864,000 | ) | (1,065,000 | ) | (814,000 | ) | (1,065,000 | ) | ||||||||
| TOTAL | $ | 8,817,697 | $ | 8,330,691 | $ | 9,061,668 | $ | 8,330,691 | ||||||||
As a result of changes in the market for certain Company products and the resulting deteriorating value, carrying amounts for those inventories were reduced by approximately $864,000$814,000 and $1,065,000 at March 31,September 30, 2020 and December 31, 2019, respectively. These inventory write-downs have been reflected in adjustments to cost of goods sold in the statement of operations. Management believes that these reductions properly reflect inventory at lower of cost or market, and no additional losses will be incurred upon disposition.
8. Leases –
| 8. | Leases – |
The Company lease accounting policy follows the guidance from ASC 842 - Leases, which provides guidance on the recognition, presentation and disclosure of leases in consolidated condensed financial statements.
Total components of operating lease expense for the real property asset class (in thousands) were as follows:
Three Months Ended March 31, 2020 | Three Months Ended March 31, 2019 | Three Months Ended September 30, 2020 | Nine Months Ended September 30, 2020 | |||||||||||||
| Operating lease expense | $ | 1,652 | $ | 1,401 | $ | 1,520 | $ | 4,760 | ||||||||
| Variable lease expense | 539 | 694 | 506 | 1,663 | ||||||||||||
| Total lease expense | $ | 2,191 | $ | 2,095 | $ | 2,026 | $ | 6,423 | ||||||||
Three Months Ended September 30, 2019 | Nine Months Ended September 30, 2019 | |||||||
| Operating lease expense | $ | 1,421 | $ | 4,190 | ||||
| Variable lease expense | 633 | 2,008 | ||||||
| Total lease expense | $ | 2,054 | $ | 6,198 | ||||
Other information related to operating leases was as follows:
Three Months Ended March 31, 2020 | Three Months Ended March 31, 2019 | |||||||
| Weighted average remaining lease term, in years | 2.97 | 2.60 | ||||||
| Weighted Average Discount Rate | 5.8 | % | 5.9 | % | ||||
| September 30, 2020 | September 30, 2019 | |||||||
| Weighted average remaining lease term, in years | 2.83 | 2.79 | ||||||
| Weighted average discount rate | 5.5 | % | 5.9 | % | ||||
Future minimum lease payments under operating leases as of March 31,September 30, 2020 (in thousands) were as follows:
| Operating Leases | |||||
Remainder of 2020 | $ | 4,381 | |||
| 2021 | 4,338 | ||||
| 2022 | 2,781 | ||||
| 2023 | 1,307 | ||||
| 2024 | 645 | ||||
| 2025 | 94 | ||||
Thereafter | 28 | ||||
Total future minimum lease payments | 13,574 | ||||
Less: imputed interest | (1,217 | ) | |||
Total | $ | 12,357 | |||
Current portion operating lease liabilities | $ | 5,049 | |||
Non-Current operating lease liabilities | 7,308 | ||||
Total | $ | 12,357 | |||
| Operating Leases | |||||
| Remainder of 2020 | $ | 1,440 | |||
| 2021 | 4,800 | ||||
| 2022 | 3,273 | ||||
| 2023 | 1,690 | ||||
| 2024 | 779 | ||||
| 2025 | 138 | ||||
| Thereafter | 28 | ||||
| Total future minimum lease payments | 12,148 | ||||
| Less: imputed interest | (1,004 | ) | |||
| Total | $ | 11,144 | |||
| Current portion operating lease liabilities | $ | 4,701 | |||
| Non-current operating lease liabilities | 6,443 | ||||
| Total | $ | 11,144 | |||
9. Notes Payable – Long Term –
| March 31, 2020 | December 31, 2019 | |||||||
| Subsidiary subordinated note payable to seller with monthly interest only payments at 6%, guaranteed by PQH, maturing August 5, 2022 when the principal balance is due. | $ | 789,216 | $ | 789,216 | ||||
| Subsidiary note payable to a financial institution, with monthly principal and interest payments of $6,692, bearing interest at 5.5%, secured by substantially all assets of the subsidiary, and maturing January 4, 2024. | 280,002 | 296,035 | ||||||
| Total | 1,069,218 | 1,085,251 | ||||||
| Less current maturities | (66,362 | ) | (65,414 | ) | ||||
| $ | 1,002,856 | $ | 1,019,837 | |||||
| 9. | Notes Payable – Long Term – |
10. Cash Dividends –
| September 30, 2020 | December 31, 2019 | |||||||
| Subsidiary subordinated note payable to seller with monthly interest only payments at 6%, guaranteed by PQH, with a maturity date of August 5, 2022. The note was paid off in August 2020. | $ | — | $ | 789,216 | ||||
| Subsidiary note payable to a financial institution, with monthly principal and interest payments of $6,692, bearing interest at 5.5%, secured by substantially all assets of the subsidiary, and maturing January 4, 2024. The note was paid off in September 2020 and refinanced internally. | — | 296,035 | ||||||
| Total | — | 1,085,251 | ||||||
| Less current maturities | — | (65,414 | ) | |||||
| $ | — | $ | 1,019,837 | |||||
Date Declared | Record Date | Dividend Per Share | Payment Date | Dividend Paid |
February 13, 2020 | February 28, 2020 | $0.05 | March 9, 2020 | $463,289 |
| 10. | Cash Dividends – |
| Date Declared | Record Date | Dividend Per Share | Payment Date | Dividend Paid |
| February 13, 2020 | February 28, 2020 | $0.050 | March 9, 2020 | $463,289 |
| May 5, 2020 | May 22, 2020 | $0.025 | June 2, 2020 | $230,865 |
| August 10, 2020 | August 25, 2020 | $0.025 | September 4, 2020 | $228,373 |
11. Revenue –
| 11. | Revenue – |
Revenue generated from contracts with customers and recognized per ASC 606 primarily consists of sales of merchandise and services at the point of sale and compensation from Cricket Wireless. As a Cricket Wireless authorized retailer, we earn compensation from Cricket Wireless for activating a new customer on the Cricket Wireless network, activating new devices for existing Cricket Wireless customers (“back-end compensation”) and upon an existing Cricket Wireless customer whom we originally activated on the Cricket Wireless GSM network making a continuing service payment (“CSP”).
Due to COVID-19 and at the request of Cricket Wireless, the Cellular Retail segment temporarily closed approximately 75 retail locations in March 2020. In conjunction with the request, Cricket Wireless notified the Company that it would be providing temporary supplemental commissions for the store closures. SupplementalIn addition, Cricket Wireless temporarily increased other supplemental commissions for qualifying activations. COVID-19 related to the closed locationssupplemental commissions of approximately $285,000,$0 and $1,530,000, as reported to us by Cricket, was included in revenue in the three-month periodthree and nine month periods ended March 31,September 30, 2020. The closure related supplemental compensation assistance from Cricket ended by June 30, 2020.
Revenue generated from short-term lending agreements in the Consumer Finance segment and from Company investments are recognized in accordance with ASC 825.
Total net sales of merchandise, which exclude sales taxes, are generally recorded as follows:
● | Cellular Retail – net sales reflects the transaction price at point of sale when payment is received or receivable, the customer takes control of the merchandise and, applicable to devices, the device has been activated on the Cricket Wireless network. The sale and activation of a wireless device also correlates to the recording of back-end compensation from Cricket Wireless. Sales returns are generally not material to our financial statements. |
● | Direct to Consumer – net sales reflect the transaction price when product is shipped to customers, FOB shipping point, reduced by variable consideration. Shipping and handling fees are also included in total net sales. Variable consideration is comprised of estimated future returns and merchandise credits which are estimated based primarily on historical rates and sales levels. |
● | Consumer Finance - net sales reflects the transaction price at point of sale when payment in full is received and the customer takes control of the merchandise. Sales returns are generally not material to our financial statements. |
Services revenue from customer paid fees is generally recorded at point of sale when payment is received and the customer receives the benefit of the service. CSP compensation from Cricket Wireless is recorded as of the time certain Cricket Wireless customers make a service payment, as reported to us by Cricket Wireless.
Recognized as revenue per ASC 825, Consumer Finance loan fees and interest on cash advance loans are recognized on a constant-yield basis ratably over a loan’s term. Installment loan fees and interest are recognized using the interest method, except that installment loan origination fees are recognized as they become non-refundable and installment loan maintenance fees are recognized when earned. The Company recognizes fees on pawn loans on a constant-yield basis ratably over the loans’ terms, less an estimated amount for expected forfeited pawn loans which is based on historical forfeiture rates.
See Note 15,14, “Segment Information,” for disaggregation of revenue by segment.
12. Other Operating Expense –
| 12. | Other Operating Expense – |
A breakout of other expense is as follows:
| For The Three Months Ended | Three Months Ended September 30, | Nine Months Ended September 30, | ||||||||||||||||||||||
| March 31, 2020 | March 31, 2019 | 2020 | 2019 | 2020 | 2019 | |||||||||||||||||||
| Bank fees | $ | 560,978 | $ | 504,981 | $ | 411,189 | $ | 353,064 | $ | 1,705,582 | $ | 1,397,631 | ||||||||||||
| Collection costs | 78,069 | 77,715 | 93,464 | 82,503 | 250,939 | 242,855 | ||||||||||||||||||
| Insurance | 196,381 | 188,296 | 191,108 | 178,414 | 587,440 | 545,056 | ||||||||||||||||||
| Management and advisory fees | 211,003 | 202,146 | 220,303 | 211,003 | 651,609 | 624,151 | ||||||||||||||||||
| Professional and consulting fees | 380,496 | 553,622 | 354,725 | 325,824 | 1,004,461 | 1,115,629 | ||||||||||||||||||
| Supplies | 217,579 | 138,592 | 185,744 | 170,387 | 605,898 | 453,198 | ||||||||||||||||||
| Gain on disposal | (7,737 | ) | (1,415 | ) | ||||||||||||||||||||
| Loss on disposal | — | 66,685 | 662,522 | 77,883 | ||||||||||||||||||||
| Other | 647,549 | 600,655 | 478,109 | 526,854 | 1,755,209 | 1,744,201 | ||||||||||||||||||
| $ | 2,284,318 | $ | 2,264,592 | $ | 1,934,642 | $ | 1,914,734 | $ | 7,223,660 | $ | 6,200,604 | |||||||||||||
| 13. | Acquisitions – |
13. Segment Information –Cellular Retail Acquisitions
In 2020, PQH completed Cricket retail location transactions, acquiring 19 locations.
In 2019, PQH contributed a note payable in exchange for a 51% ownership interest in a newly formed subsidiary Summit JV, LLC (“Summit”) and another Cricket Wireless dealer contributed substantially all its assets, including 28 Cricket Wireless retail locations, and specified liabilities in exchange for a 49% ownership interest in Summit and receipt of the note payable contributed by PQH. Effective March 1, 2019, we consummated the transaction.
The purchase price calculations (in thousands) are as follows:
| 2020 | 2019 | |||||||
| Cash | $ | 568 | $ | — | ||||
| Note payable | — | 18 | ||||||
| Noncontrolling interests/equity | — | 17 | ||||||
| $ | 568 | $ | 35 | |||||
The assets acquired and liabilities assumed (in thousands) were recorded at their estimated fair values as of the purchase dates as follows:
| 2020 | 2019 | |||||||
| Cash | $ | 2 | $ | 14 | ||||
| Receivables | — | 272 | ||||||
| Inventory | 82 | 50 | ||||||
| Property and equipment | 272 | 596 | ||||||
| Intangible assets | 234 | — | ||||||
| Operating lease right-of-use assets | 1,178 | 772 | ||||||
| Other assets | 33 | 48 | ||||||
| Other liabilities | (55 | ) | (597 | ) | ||||
| Operating lease liabilities | (1,178 | ) | (772 | ) | ||||
| Term note payable | — | (348 | ) | |||||
| $ | 568 | $ | 35 | |||||
| 14. | Segment Information – |
Segment information related to the three-month periodthree and nine month periods ended March 31,September 30, 2020 and 2019 (in thousands) is as follows:
Thee Months Ended March 31, 2020 (in thousands)
| ||||||||||||||||||||||||||||||||||||||||
Three Months Ended September 30, 2020 (in thousands)
| Three Months Ended September 30, 2020 (in thousands)
| |||||||||||||||||||||||||||||||||||||||
Cellular Retail |
Direct to Consumer | Consumer Finance | Corporate | Total |
Cellular Retail | Direct to Consumer | Consumer Finance | Corporate | Total | |||||||||||||||||||||||||||||||
| Revenue from external customers | $ | 19,533 | $ | 11,599 | $ | 421 | $ | — | $ | 31,553 | $ | 22,589 | $ | 5,901 | $ | 379 | $ | — | $ | 28,869 | ||||||||||||||||||||
| Fees and interest income | $ | — | $ | — | $ | 2,045 | $ | — | $ | 2,045 | $ | — | $ | — | $ | 1,419 | $ | — | $ | 1,419 | ||||||||||||||||||||
| Total Revenue | $ | 19,533 | $ | 11,599 | $ | 2,466 | $ | — | $ | 33,598 | ||||||||||||||||||||||||||||||
| Total revenue | $ | 22,589 | $ | 5,901 | $ | 1,798 | $ | — | $ | 30,288 | ||||||||||||||||||||||||||||||
| Net income (loss) | $ | 1,184 | $ | 1,176 | $ | 225 | $ | (218 | ) | $ | 2,367 | $ | 1,717 | $ | (60 | ) | $ | 112 | $ | (192 | ) | $ | 1,577 | |||||||||||||||||
| Total segment assets | $ | 35,495 | $ | 15,307 | $ | 8,347 | $ | 35,157 | $ | 94,306 | ||||||||||||||||||||||||||||||
| Expenditures for segmented assets | $ | 336 | $ | 118 | $ | — | $ | — | $ | 454 | $ | 62 | $ | 138 | $ | — | $ | — | $ | 200 | ||||||||||||||||||||
Three Months Ended March 31, 2019 (in thousands)
| ||||||||||||||||||||||||||||||||||||||||
Three Months Ended September 30, 2019 (in thousands)
| Three Months Ended September 30, 2019 (in thousands)
| |||||||||||||||||||||||||||||||||||||||
Cellular Retail |
Direct to Consumer | Consumer Finance | Corporate | Total |
Cellular Retail | Direct to Consumer | Consumer Finance | Corporate | Total | |||||||||||||||||||||||||||||||
| Revenue from external customers | $ | 16,501 | $ | 10,941 | $ | 401 | $ | — | $ | 27,843 | $ | 16,969 | $ | 4,925 | $ | 420 | $ | — | $ | 22,314 | ||||||||||||||||||||
| Fees and interest income | $ | — | $ | — | $ | 2,115 | $ | — | $ | 2,115 | $ | — | $ | — | $ | 2,203 | $ | — | $ | 2,203 | ||||||||||||||||||||
| Total Revenue | $ | 16,501 | $ | 10,941 | $ | 2,516 | $ | — | $ | 29,958 | ||||||||||||||||||||||||||||||
| Total revenue | $ | 16,969 | $ | 4,925 | $ | 2,623 | $ | — | $ | 24,517 | ||||||||||||||||||||||||||||||
| Net income (loss) | $ | 571 | $ | 650 | $ | 233 | $ | (154 | ) | $ | 1,300 | $ | 690 | $ | (610 | ) | $ | 279 | $ | (69 | ) | $ | 290 | |||||||||||||||||
| Total segment assets | $ | 34,253 | $ | 13,968 | $ | 8,429 | $ | 36,039 | $ | 92,689 | ||||||||||||||||||||||||||||||
| Expenditures for segmented assets | $ | 229 | $ | 34 | $ | — | $ | — | $ | 263 | $ | 185 | $ | 149 | $ | — | $ | — | $ | 334 | ||||||||||||||||||||
Nine Months Ended September 30, 2020 (in thousands)
| ||||||||||||||||||||
Cellular Retail | Direct to Consumer | Consumer Finance | Corporate | Total | ||||||||||||||||
| Revenue from external customers | $ | 63,609 | $ | 33,841 | $ | 1,372 | $ | — | $ | 98,822 | ||||||||||
| Fees and interest income | $ | — | $ | — | $ | 4,636 | $ | — | $ | 4,636 | ||||||||||
| Total Revenue | $ | 63,609 | $ | 33,841 | $ | 6,008 | $ | — | $ | 103,458 | ||||||||||
| Net income (loss) | $ | 4,435 | $ | 4,672 | $ | 478 | $ | (574 | ) | $ | 9,011 | |||||||||
| Total segment assets | $ | 34,375 | $ | 14,155 | $ | 7,792 | $ | 35,439 | $ | 91,761 | ||||||||||
| Expenditures for segmented assets | $ | 696 | $ | 337 | $ | — | $ | — | $ | 1,033 | ||||||||||
14. Commitments and Contingencies –
Nine Months Ended September 30, 2019 (in thousands)
| ||||||||||||||||||||
Cellular Retail | Direct to Consumer | Consumer Finance | Corporate | Total | ||||||||||||||||
| Revenue from external customers | $ | 49,753 | $ | 27,339 | $ | 1,236 | $ | — | $ | 78,328 | ||||||||||
| Fees and interest income | $ | — | $ | — | $ | 6,304 | $ | — | $ | 6,304 | ||||||||||
| Total Revenue | $ | 49,753 | $ | 27,339 | $ | 7,540 | $ | — | $ | 84,632 | ||||||||||
| Net income (loss) | $ | 1,702 | $ | 733 | $ | 741 | $ | (207 | ) | $ | 2,969 | |||||||||
| Total segment assets | $ | 30,779 | $ | 12,976 | $ | 8,817 | $ | 35,761 | $ | 88,333 | ||||||||||
| Expenditures for segmented assets | $ | 507 | $ | 216 | $ | — | $ | — | $ | 723 | ||||||||||
| 15. | Commitments and Contingencies – |
Employment Agreements
Pursuant to the numerous employment agreements, bonuses of approximately $203,000$347,000 and $158,000$932,000 were accrued for the three and nine months ended March 31,September 30, 2020, and 2019, respectively.
Assigned Leases
The Company’s Cellular Retail segment has transferred operations of many locations to other dealers and remains contingently liable under many lease agreements. Minimum lease payments of assigned or assumed non-cancelable operating leases related to transferred locations in which a release has not been obtained from the lessor are approximately $1,876,000$1,312,000 as of March 31,September 30, 2020.
Legal Proceedings
The Company is party to a variety of legal actions arising out of the normal course of business. Plaintiffs occasionally seek punitive or exemplary damages. The Company does not believe that such normal and routine litigation will have a material impact on its consolidated financial results.
15.
| 16. | Subsequent Events – |
Consumer Finance – NE Operations
On November 3, 2020, Nebraska voters passed a ballot initiative that limits all fees charged by payday lenders in Nebraska to an annual interest rate of 36%. This initiative will cause us to close our Nebraska payday lending operations which we expect to have completed by mid-December 2020. The loss of Nebraska operations will have a significant impact on this segment’s contributions to shareholder earnings.
Dividend Declared
Our Board of Directors declared the following dividend:
Date Declared | Record Date | Dividend Per Share | Payment Date |
|
| $0.025 |
|
COVID-19
As of the date of this report, the Company’s Cellular Retail segment has reopened approximately 45 of the locations temporarily closed in March 2020. Cricket Wireless continued to provide supplemental commissions related to the store closures.
The ultimate impact of the COVID-19 pandemic on the Company’s operations is unknown and will depend on future developments, which are highly uncertain and cannot be predicted with confidence, including the duration of the COVID-19 outbreak, new information which may emerge concerning the severity of the COVID-19 pandemic, and any additional preventative and protective actions that governments, or the Company, may direct, which may result in an extended period of continued business disruption, reduced customer traffic and reduced operations. Any resulting financial impact cannot be reasonably estimated at this time but may have a material impact on our business, financial condition and results of operations.
The significance of the impact of the COVID-19 outbreak on the Company’s businesses and the duration for which it may have an impact cannot be determined at this time.
We evaluated all events or transactions that occurred after March 31,September 30, 2020 through the date we issued these financial statements. During this period we did not have any other material subsequent events that impacted our financial statements.
Item 2. Management’s Discussion and Analysis of Financial Condition and Results of Operations
Forward-Looking Statements
Some of the statements made in this report are “forward-looking statements,” as that term is defined under Section 27A of the Securities Act and Section 21E of the Securities Exchange Act of 1934. These forward-looking statements are based upon our current expectations and projections about future events. Whenever used in this report, the words “believe,” “anticipate,” “intend,” “estimate,” “expect,” “will” and similar expressions, or the negative of such words and expressions, are intended to identify forward-looking statements, although not all forward-looking statements contain such words or expressions. The forward-looking statements in this report are primarily located in the material set forth under the headings “Description of Business,” “Risk Factors,” “Management’s Discussion and Analysis of Financial Condition and Results of Operations,” but are found in other parts of this report as well. These forward-looking statements generally relate to our plans, objectives and expectations for future operations and are based upon management’s current estimates and projections of future results or trends. Although we believe that our plans and objectives reflected in or suggested by these forward-looking statements are reasonable, we may not achieve these plans or objectives. You should read this report completely and with the understanding that actual future results may be materially different from what we expect. We are not undertaking any obligation to update any forward-looking statements even though our situation may change in the future.
Specific factors that might cause actual results to differ from our expectations or may affect the value of the common stock, include, but are not limited to:
● | Changes in local, state or federal laws and regulations governing lending practices, or changes in the interpretation of such laws and regulations; |
● | Litigation and regulatory actions directed toward the consumer finance industry or us, particularly in certain key states; |
● | Our need for additional financing; |
● | Changes in our authorization to be a dealer for Cricket Wireless; |
● | Changes in authorized Cricket dealer compensation; |
● | Lack of advertising support and sales promotions from Cricket Wireless in the markets we operate; |
● | Direct and indirect effects of COVID-19 on our employees, customers, our supply chain, the economy and financial markets; and |
● | Unpredictability or uncertainty in financing and merger and acquisition markets, which could impair our ability to grow our business through acquisitions. |
Other factors that could cause actual results to differ from those implied by the forward-looking statements in this report are more fully described in the “Risk Factors” section and of this report.
Industry data and other statistical information used in this report are based on independent publications, government publications, reports by market research firms or other published independent sources. Some data are also based on our good faith estimates, derived from our review of internal surveys and the independent sources listed above. Although we believe these sources are reliable, we have not independently verified the information.
OVERVIEW
Western Capital Resources, Inc. (“WCR”), a Delaware corporation originally incorporated in Minnesota in 2001 and reincorporated in Delaware in 2016, is a holding company having a controlling interest in subsidiaries operating in the following industries and operating segments:
Our Cellular Retail segment is comprised of an authorized Cricket Wireless dealer and involves the retail sale of cellular phones and accessories to consumers through our wholly owned subsidiary PQH Wireless, Inc. and its controlled but less than 100% owned subsidiaries. Our Direct to Consumer segment consists of a wholly owned online and direct marketing distribution retailer of live plants, seeds, holiday gifts and garden accessories selling its products under Park Seed, Jackson & Perkins and Wayside Gardens brand names and home improvement and restoration products operating as Van Dyke’s Restorers as well as a wholesaler under the Park Wholesale brand. Our Consumer Finance segment consists of retail financial services conducted through our wholly owned subsidiaries Wyoming Financial Lenders, Inc. and Express Pawn, Inc. Throughout this report, we collectively refer to WCR and its consolidated subsidiaries as “we,” the “Company,” and “us.”
Discussion of Critical Accounting Policies
Our condensed consolidated financial statements and accompanying notes have been prepared in accordance with accounting principles generally accepted in the United States of America applied on a consistent basis. The preparation of these condensed consolidated financial statements requires us to make a number of estimates and assumptions that affect the reported amounts of assets and liabilities, the disclosure of contingent assets and liabilities at the date of the condensed consolidated financial statements and the reported amounts of revenues and expenses during the reporting periods. We evaluate these estimates and assumptions on an ongoing basis. We base these estimates on the information currently available to us and on various other assumptions that we believe are reasonable under the circumstances. Actual results could vary materially from these estimates under different assumptions or conditions.
Our significant accounting policies are discussed in Note 1, “Basis of Presentation, Nature of Business and Summary of Significant Accounting Policies,” of the notes to our condensed consolidated financial statements included in this report together with our significant accounting policies discussed in Note 1, “Nature of Business and Summary of Significant Accounting Policies,” of the
notes to our December 31, 2019 consolidated financial statements included in our Form 10-K for the year ended December 31, 2019. We believe that the following critical accounting policies affect the more significant estimates and assumptions used in the preparation of our condensed consolidated financial statements.
Receivables and Loss Allowance
Direct to Consumer
Receivables are recorded when billed or accrued and represent claims against third parties that will be settled in cash. The carrying value of receivables, net of the allowance for doubtful accounts, represents their estimated net realizable value. The allowance for doubtful accounts is estimated based on historical collection trends, type of customer, the age of outstanding receivables and existing economic conditions. If events or changes in circumstances indicate that specific receivable balances may be impaired, further consideration is given to the collectability of those balances and the allowance is adjusted accordingly. Past due receivable balances are written-off when internal collection efforts have been unsuccessful in collecting the amount due.
Consumer Finance
Included in loans receivable are unpaid principal, interest and fee balances of payday, installment and pawn loans that have not reached their maturity date, and “late” payday loans that have reached maturity within the last 180 days and have remaining outstanding balances. Late payday loans generally are unpaid loans where a customer’s personal check has been deposited and the check has been returned due to non-sufficient funds in the customer’s account, a closed account, or other reasons. All returned items are charged-off after 180 days, as collections after that date have not been significant. Loans are carried at cost plus accrued interest or fees less payments made and a loans receivable allowance.
We do not specifically reserve for any individual payday or installment loan. Instead, we aggregate loan types for purposes of estimating the loss allowance using a methodology that analyzes historical portfolio statistics and management’s judgment regarding recent trends noted in the portfolio. This methodology takes into account several factors, including (1) the amount of loan principal, interest and fee outstanding, (2) historical charge offs from loans that originated during the last 24 months, (3) current and expected collection patterns and (4) current economic trends. We utilize a software program to assist with the tracking of our historical portfolio statistics. A loan loss allowance is maintained for anticipated losses for payday and installment loans based primarily on our historical percentages by loan type of net charge offs, applied against the applicable balance of loan principal, interest and fees outstanding. We also periodically perform a look-back analysis on our loan loss allowance to verify the historical allowance established tracks with the actual subsequent loan write-offs and recoveries. We are aware that as conditions change, we may also need to make additional allowances in future periods. Loan losses or charge-offs of pawn loans are not recorded because the value of the collateral exceeds the loan amount.
See Note 4, “Loans Receivable,” and Note 5, “Loans Receivable Allowance,” of the notes to our consolidated financial statements included in this report for our outstanding loans receivable aging and loans receivable allowance rollforward as of and for the threenine month period ended March 31,September 30, 2020 and the year ended December 31, 2019.
Valuation of Long-lived and Intangible Assets
We assess the possibility of impairment of long-lived assets, other than goodwill, whenever events or changes in circumstances indicate that the carrying value may not be recoverable. Factors that could trigger an impairment review include significant underperformance relative to expected historical or projected future cash flows, significant changes in the manner of use of acquired assets or the strategy for the overall business, and significant negative industry events or trends.
Goodwill
Goodwill represents the excess of acquisition cost over the fair value of identifiable finite lived net assets acquired and is not amortized. Goodwill is tested for impairment annually as of October 1, or more frequently if events or changes in circumstances indicate potential impairment. We test for goodwill impairment at the reporting unit level, which aligns with the Company’s segments. We perform a qualitative assessment to determine if a quantitative impairment test is necessary. If quantitative testing is necessary based on a qualitative assessment, we apply a fair value test. This fair value test involves a two-step process. The first step is to compare the carrying value of our net assets to our fair value. If the fair value is determined to be less than the carrying value, a second step is performed to measure the amount of the impairment, if any.
Management has analyzed the impact of the Coronavirus pandemic (“COVID-19”) on its financial statements as of March 31,September 30, 2020 and has determined that the changes to its significant judgements and estimates did not have a material impact with respect to goodwill, intangible assets or long-lived assets. However, the Company'sCompany’s future assessment of the magnitude and duration of COVID-19/COVID-19 / coronavirus, as well as other factors, could result in material impacts to the Consolidated Financial Statements in future reporting periods.
Operating Leases
We have many retail and office space lease agreements and insignificant equipment lease agreements which are accounted for as operating leases. The real property leases typically are for three-three to five-yearfive year terms with many containing options for similar renewal periods. We determine if an arrangement is or contains a lease at inception.
Under ASC 842, we recognize right-of-use (“ROU”) assets and lease liabilities for operating leases. ROU assets and lease liabilities are recognized at commencement date based on the present value of future minimum lease payments over the lease term. For our leased real property asset class, we do not separate lease and non-lease components when determining the amounts of a lease payment. As most of our leases do not provide an implicit rate, we use WCR’s collateralized incremental borrowing rate based on the information available at commencement date in determining the present value of future payments.
The lease payment terms may include fixed payment terms and variable payments. Fixed payment terms and variable payments that depend on an index (i.e., Consumer Price Index, or “CPI”) or rate are considered in the determination of the operating lease liabilities. While lease liabilities are not remeasured because of changes to the CPI, changes are treated as variable lease payments and recognized in the period in which the obligation for those payments was incurred. Variable payments that do not depend on an index or rate are not included in the lease liabilities determination. Rather, these payments are recognized as variable lease expense when incurred. Expenses related to leases with a lease term of one month or less are recognized as variable lease expense when incurred. Variable lease payments are included within operating costs and expenses in our condensed consolidated statement of operations.
Due to the significant assumptions and judgements required in accounting for leases (to include whether a contract contains a lease, whether and at what point the period covered by an option to extend a lease is reasonable certain to be exercised, the allocation of the consideration, and the determination of the discount rate), the judgements and estimates made could have a significant effect on the amount of assets and liabilities recognized.
Results of Operations – Three Months Ended March 31,September 30, 2020 Compared to Three Months Ended March 31,September 30, 2019
Net income attributable to our common shareholders was $1.90 million, or $0.21 per share (basic and diluted), for the quarter ended March 31, 2020, compared to net income of $1.05$1.00 million, or $0.11 per share (basic and diluted), for the quarter ended March 31,September 30, 2020, compared to net loss of $(0.05) million, or ($0.01) per share (basic and diluted), for the quarter ended September 30, 2019.
We expect segment operating results and earnings per share to change throughout 2020 due, at least in part, to the seasonality of the Direct to Consumer and Cellular Retail segments, potential mergers and acquisitions activity and the unknown impact of COVID-19.
Following is a discussion of operating results by segment.
The following table provides revenues and net income attributable to WCR common shareholders for the quarters ended March 31,September 30, 2020 and March 31,September 30, 2019 (in thousands).
|
| Cellular Retail |
|
| Direct to Consumer |
|
| Consumer Finance |
|
| Corporate |
|
| Total |
| |||||
Three Months Ended March 31, 2020 |
|
|
|
|
|
|
|
|
|
|
|
|
|
|
| |||||
Revenue |
| $ | 19,533 |
|
| $ | 11,599 |
|
| $ | 2,466 |
|
| $ | — |
|
| $ | 33,598 |
|
% of total revenue |
|
| 58.1 | % |
|
| 34.5 | % |
|
| 7.4 | % |
|
| — | % |
|
| 100.0 | % |
Net income (loss) |
| $ | 1,184 |
|
| $ | 1,176 |
|
| $ | 225 |
|
| $ | (218 | ) |
| $ | 2,367 |
|
Net income attributable to noncontrolling interests |
| $ | 463 |
|
| $ | — |
|
| $ | — |
|
| $ | — |
|
| $ | 463 |
|
Net income (loss) attributable to WCR |
| $ | 721 |
|
| $ | 1,176 |
|
| $ | 225 |
|
| $ | (218 | ) |
| $ | 1,904 |
|
|
|
|
|
|
|
|
|
|
|
|
|
|
|
|
|
|
|
|
|
|
Three Months Ended March 31, 2019 |
|
|
|
|
|
|
|
|
|
|
|
|
|
|
|
|
|
|
|
|
Revenue |
| $ | 16,501 |
|
| $ | 10,941 |
|
| $ | 2,516 |
|
| $ | — |
|
| $ | 29,958 |
|
% of total revenue |
|
| 55.1 | % |
|
| 36.5 | % |
|
| 8.4 | % |
|
| — | % |
|
| 100.0 | % |
Net income (loss) |
| $ | 571 |
|
| $ | 650 |
|
| $ | 233 |
|
| $ | (154 | ) |
| $ | 1,300 |
|
Net income attributable to noncontrolling interests |
| $ | 250 |
|
| $ | — |
|
| $ | — |
|
| $ | — |
|
| $ | 250 |
|
Net income (loss) attributable to WCR common |
| $ | 321 |
|
| $ | 650 |
|
| $ | 233 |
|
| $ | (154 | ) |
| $ | 1,050 |
|
| Cellular Retail | Direct to Consumer | Consumer Finance | Corporate | Total | ||||||||||||||||
| Three Months Ended September 30, 2020 | ||||||||||||||||||||
| Revenue | $ | 22,589 | $ | 5,901 | $ | 1,798 | $ | — | $ | 30,288 | ||||||||||
| % of total revenue | 74.6 | % | 19.5 | % | 5.9 | % | — | % | 100.0 | % | ||||||||||
| Net income (loss) | $ | 1,717 | $ | (60 | ) | $ | 112 | $ | (192 | ) | $ | 1,577 | ||||||||
| Net income attributable to noncontrolling interests | $ | 576 | $ | — | $ | — | $ | — | $ | 576 | ||||||||||
| Net income (loss) attributable to WCR common shareholders | $ | 1,141 | $ | (60 | ) | $ | 112 | $ | (192 | ) | $ | 1,001 | ||||||||
| Three Months Ended September 30, 2019 | ||||||||||||||||||||
| Revenue | $ | 16,969 | $ | 4,925 | $ | 2,623 | $ | — | $ | 24,517 | ||||||||||
| % of total revenue | 69.2 | % | 20.1 | % | 10.7 | % | — | % | 100.0 | % | ||||||||||
| Net income (loss) | $ | 690 | $ | (610 | ) | $ | 279 | $ | (69 | ) | $ | 290 | ||||||||
| Net income attributable to noncontrolling interests | $ | 340 | $ | — | $ | — | $ | — | $ | 340 | ||||||||||
| Net income (loss) attributable to WCR common shareholders | $ | 350 | $ | (610 | ) | $ | 279 | $ | (69 | ) | $ | (50 | ) | |||||||
Cellular Retail
A summary table of the number of Cricket Wireless retail stores we operated during the three months ended March 31,September 30, 2020 and March 31,September 30, 2019 follows:
|
| 2020 |
|
| 2019 |
| 2020 | 2019 | ||||||||
Beginning |
|
| 222 |
|
|
| 205 |
| 205 | 201 | ||||||
Acquired/ Launched |
|
| 7 |
|
|
| 31 |
| 1 | 2 | ||||||
Closed/Transferred |
|
| (8 | ) |
|
| (35 | ) | — | (9 | ) | |||||
Ending |
|
| 221 |
|
|
| 201 |
| 206 | 194 | ||||||
Period over period, net income attributable to shareholders increased from $0.32$0.35 million in the comparable prior year quarter to $0.72$1.14 million in the current quarter. OurMany factors have contributed to this period over period increase, most notably successful Cricket sales promotions, Cricket’s distribution optimization program, our strategic location disposals and additions from the first quarter of 2019 through the current quarter has resulted in a better mix of stores and theCOVID-19 stimulus contributing to increased operating results attributable to shareholders period over period.
Due to the impact of COVID-19 and even though our stores were generally deemed to be “essential businesses”, on March 19, 2020 we began the process of temporarily closing approximately 75 of our retail stores. Cricket Wireless provided supplemental commissions to alleviate the financial strain caused by the closures. Our stores that remained open reduced hours of operations and experienced various levels of decreased activity. As of the date of the filing of this report, approximately 45 of the locations that temporarily closed have re-opened, but with reduced hours of operations.sales.
Direct to Consumer
The Direct to Consumer segment has seasonal sources of revenue and historically experiences a greater proportion of annual revenue and net income in the months of March through May and December due to the seasonal products it sells. For the current quarter, the Direct to Consumer segment had net incomeloss of $1.18$(0.06) million compared to net incomeloss of $0.65$(0.61) million for the comparable prior year period. Revenues for the three month period ended March 31,September 30, 2020 were $11.60$5.90 million compared to $10.94$4.93 million for the comparable period in 2019. Similar to other online retailers, the Direct to Consumer segment has experienced an increase in demand and on-line sales activity due to COVID-19.
Consumer Finance
A summary table of the number of consumer finance locations we operated during the quarters ended March 31,September 30, 2020 and March 31,September 30, 2019 follows:
|
| 2020 |
|
| 2019 |
| 2020 | 2019 | ||||||||
Beginning |
|
| 39 |
|
|
| 41 |
| 39 | 39 | ||||||
Acquired/ Launched |
|
| — |
|
|
| — |
| — | — | ||||||
Closed |
|
| — |
|
|
| (2 | ) | (1 | ) | — | |||||
Ending |
|
| 39 |
|
|
| 39 |
| 38 | 39 | ||||||
Our Consumer Finance segment continues to struggle due to COVID-19 and industry trends with our lending volume down period over period. Consumer Finance segment revenues decreased $0.05$0.82 million, or 2.0%31.5%, for the quarter ended March 31,September 30, 2020 compared to the quarter ended March 31,September 30, 2019. This segment and the industry continues to experience declines in loan and check cashing activity. activity due to industry regulation and trends and COVID-19. On November 3, 2020, Nebraska voters passed a ballot initiative that limits all fees charged by payday lenders in Nebraska to an annual interest rate of 36%. This initiative will cause us to close our Nebraska payday lending operations which we expect to have completed by mid-December 2020. The loss of Nebraska operations will have a significant impact on this segment’s contributions to shareholder earnings.
Corporate
Net costs related to our Corporate segment were $0.19 million for the quarter ended September 30, 2020 compared to $0.07 million for the quarter ended September 30, 2019. The period over period increase in net costs is primarily due to a decrease in income from investments.
Results of Operations – Nine Months Ended September 30, 2020 Compared to Nine Months Ended September 30, 2019
Net income attributable to our common shareholders was $7.52 million, or $0.82 per share (basic and diluted), for the nine month period ended September 30, 2020, compared to net income of $2.13 million, or $0.23 per share (basic and diluted), for the nine month period ended September 30, 2019.
We expect segment operating results and earnings per share to change throughout 2020 due, at least in part, to the seasonality of the Direct to Consumer and Cellular Retail segments, potential mergers and acquisitions activity and the unknown impact of COVID-19.
Following is a discussion of operating results by segment.
The following table provides revenues and net income attributable to WCR common shareholders for the nine month period ended September 30, 2020 and September 30, 2019 (in thousands).
| Cellular Retail | Direct to Consumer | Consumer Finance | Corporate | Total | ||||||||||||||||
| Nine Months Ended September 30, 2020 | ||||||||||||||||||||
| Revenue | $ | 63,609 | $ | 33,841 | $ | 6,008 | $ | — | $ | 103,458 | ||||||||||
| % of total revenue | 61.5 | % | 32.7 | % | 5.8 | % | — | % | 100.0 | % | ||||||||||
| Net income (loss) | $ | 4,435 | $ | 4,672 | $ | 478 | $ | (574 | ) | $ | 9,011 | |||||||||
| Net income attributable to noncontrolling interests | $ | 1,492 | $ | — | $ | — | $ | — | $ | 1,492 | ||||||||||
| Net income (loss) attributable to WCR common shareholders | $ | 2,943 | $ | 4,672 | $ | 478 | $ | (574 | ) | $ | 7,519 | |||||||||
| Nine Months Ended September 30, 2019 | ||||||||||||||||||||
| Revenue | $ | 49,753 | $ | 27,339 | $ | 7,540 | $ | — | $ | 84,632 | ||||||||||
| % of total revenue | 58.8 | % | 32.3 | % | 8.9 | % | — | % | 100.0 | % | ||||||||||
| Net income (loss) | $ | 1,702 | $ | 733 | $ | 741 | $ | (207 | ) | $ | 2,969 | |||||||||
| Net income attributable to noncontrolling interests | $ | 837 | $ | — | $ | — | $ | — | $ | 837 | ||||||||||
| Net income (loss) attributable to WCR common shareholders | $ | 865 | $ | 733 | $ | 741 | $ | (207 | ) | $ | 2,132 | |||||||||
Cellular Retail
A summary table of the number of Cricket Wireless retail stores we operated during the nine months ended September 30, 2020 and September 30, 2019 follows:
| 2020 | 2019 | |||||||
| Beginning | 222 | 205 | ||||||
| Acquired/ Launched | 20 | 33 | ||||||
| Closed/Transferred | (36 | ) | (44 | ) | ||||
| Ending | 206 | 194 | ||||||
Period over period, net income attributable to shareholders increased from $0.87 million in the nine month period ended September 30, 2019 to $2.94 million for the nine month period ended September 30, 2020. Significantly contributing to the increase was $1.53 million of supplemental compensation from Cricket Wireless provided to alleviate the financial strain caused by COVID-19 and temporary closure of 75 of our stores. Our strategic location disposals and additions from the first quarter of 2019 through the current quarter has resulted in a better mix of stores and contributed to the increased operating results attributable to shareholders period over period.
Due to the impact of COVID-19 and even though our stores were generally deemed to be “essential businesses”, on March 19, 2020 we began the process of temporarily closing approximately 75 of our retail stores. By the end of April 2020, all but 22 had reopened.
In addition,September 2020, we permanently closed the 22 remaining un-opened stores and five others. We recorded a loss of $0.67 million due to the closures.
Direct to Consumer
The Direct to Consumer segment has seasonal sources of revenue and historically experiences a greater proportion of annual revenue and net income in the months of March through May and December due to the seasonal products it sells. For the nine month period ended September 30, 2020, the Direct to Consumer segment had net income of $4.67 million compared to net income of $0.73 million for the comparable nine month period prior year. Revenues for the nine month period ended September 30, 2020 were $33.84 million compared to $27.34 million for the comparable period in 2019. Similar to other online retailers, the Direct to Consumer segment has experienced an increase in demand and on-line sales activity due to COVID-19.
Consumer Finance
A summary table of the number of consumer finance locations we operated during the nine month periods ended September 30, 2020 and September 30, 2019 follows:
| 2020 | 2019 | |||||||
| Beginning | 39 | 41 | ||||||
| Acquired/ Launched | — | — | ||||||
| Closed | (1 | ) | (2 | ) | ||||
| Ending | 38 | 39 | ||||||
Our Consumer Finance segment revenues decreased $1.53 million, or 20.3%, for the nine months ended September 30, 2020 compared to the nine months ended September 30, 2019. This segment and the industry continues to experience declines in loan and check cashing activity due to industry regulation and trends and COVID-19. In the later part of March 2020, the segment began to experience a larger than normal decline in lending activity due to COVID-19.
Corporate
Net costs related to our Corporate segment were $0.22$0.57 million for the quarternine month period ended March 31,September 30, 2020 compared to $0.15$0.21 million for the quarternine month period ended March 31,September 30, 2019. The period over period increase in net costs is primarily due to a decrease in investment income and an increase in compensation costs.income.
Consolidated Income Tax Expense
Provision for income tax expense for the quarternine months ended March 31,September 30, 2020 was $0.59$2.40 million compared to $0.34$0.68 million for the quarternine months ended March 31,September 30, 2019 for an effective rate of 20.0%21.0% and 20.9%18.7%, respectively. The effective tax rate while consistent, is lower than the federal plus state effectivestatutory rates and increased period over period due to impact of the noncontrolling interestinterests’ share of positive net income not subject to income tax at the consolidated group level.
Liquidity and Capital Resources
Summary cash flow data is as follows:
|
| Three Months Ended March 31, |
| Nine Months Ended September 30, | ||||||||||||
|
| 2020 |
|
| 2019 |
| 2020 | 2019 | ||||||||
Cash flows provided (used) by: |
|
|
|
|
|
|
|
| ||||||||
Operating activities |
| $ | 2,347,273 |
|
| $ | 306,557 |
| $ | 9,445,419 | $ | 731,340 | ||||
Investing activities |
|
| (7,602,089 | ) |
|
| (3,389,583 | ) | (2,445,224 | ) | 7,143,113 | |||||
Financing activities |
|
| (525,483 | ) |
|
| (753,516 | ) | (5,378,030 | ) | (2,595,102 | ) | ||||
Net decrease in cash and cash equivalents |
|
| (5,780,299 | ) |
|
| (3,836,542 | ) | ||||||||
| Net increase in cash and cash equivalents | 1,622,165 | 5,279,351 | ||||||||||||||
Cash and cash equivalents, beginning of period |
|
| 27,132,540 |
|
|
| 16,724,983 |
| 27,132,540 | 16,724,983 | ||||||
Cash and cash equivalents, end of period |
| $ | 21,352,241 |
|
| $ | 12,888,441 |
| $ | 28,754,705 | $ | 22,004,334 | ||||
At March 31,September 30, 2020, we had cash and cash equivalents of $21.35$28.75 million compared to cash and cash equivalents of $12.89$22.00 million on March 31,September 30, 2019, the increase coming primarily from converting investmentscash flows provided by operating activities and from the receipt of $3,367,940 in October 2019, the scheduled release of the remaining 50% of the funds held in escrow relating to cash and cash equivalents as noted above.the 2017 sale of our Franchise segment, together with interest earned. We believe that our available cash, combined with expected cash flows from operations and our held-to-maturity investments, will be sufficient to fund our liquidity and capital expenditure requirements through MarchSeptember of 2021. Our expected short-term uses of available cash include the funding of operating activities, and the payment of dividends.dividends and distributions to the noncontrolling interests.
In addition to cash and cash equivalents, at March 31,September 30, 2020, we had $11.32$18.08 million invested in certificates of deposit (limited to $250,000 per financial institution per entity). This is an increase of $1.82 million over our investment holdings at December 31, 2019 and $12.20 million in short-term T-Bills or Notes.a result of investing excess cash and cash equivalents.
At March 31,September 30, 2020, ourwe had no outstanding debt and capital lease obligations were $1.07 million compared to $1.09 million at December 31, 2019.
Off-Balance Sheet Arrangements
We had no off-balance sheet arrangements as of March 31,September 30, 2020.
Item 4. Controls and Procedures
Evaluation of Disclosure Controls and Procedures
We maintain disclosure controls and procedures designed to provide reasonable assurance that information required to be disclosed in our reports filed pursuant to the Securities Exchange Act of 1934 is recorded, processed, summarized and reported within the time periods specified in the SEC’s rules and forms, and that such information is accumulated and communicated to our management, including our Chief Executive Officer and Chief Financial Officer, as appropriate, to allow timely decisions regarding required disclosure. A control system, no matter how well conceived and operated, can provide only reasonable, not absolute, assurance the objectives of the control system are met.
We utilize the Committee of Sponsoring Organization’s Internal Control – Integrated Framework, 2013 version, for the design, implementation and assessment of the effectiveness of our disclosure controls and procedures and internal control over financial reporting.
As of March 31,September 30, 2020, our Chief Executive Officer and Chief Financial Officer carried out an assessment of the effectiveness of our disclosure controls and procedures as such term is defined in Rule 13a-15(e) under the Securities and Exchange Act of 1934. Based on this assessment, our Chief Executive Officer and Chief Financial Officer concluded our disclosure controls and procedures are effective as of March 31, 2020.September 30, 2020.
Changes in Internal Control over Financial Reporting
There were no changes in our internal controls over financial reporting that occurred during the fiscal year covered by this report that materially affected, or were reasonably likely to materially affect, such controls.
20
Item 2. Unregistered Sales of Equity Securities and Use of Proceeds
PURCHASES OF EQUITY SECURITIES BY THE ISSUER AND AFFILIATED PURCHASERS
The following table provides information about purchases of Western Capital Resources, Inc. common stock by us during the three months ended March 31,September 30, 2020.
Share Repurchases | |||||||||||||||||||
Period Beginning |
| Period |
|
| Total Number of Shares Purchased |
|
| Average Price Paid Per Share |
|
| Total Number of Shares Purchased as Part of Board Approved Plans or Programs |
|
| Approximate Dollar Value of Shares That May Yet Be Purchased Under the Program (1) |
| ||||
January 1, 2020 |
| January 31, 2020 |
|
|
| — |
|
| $ | — |
|
|
| — |
|
| $ | 476,900 |
|
February 1, 2020 |
| February 29, 2020 |
|
|
| — |
|
| $ | — |
|
|
| — |
|
| $ | 476,900 |
|
March 1, 2020 |
| March 31, 2020 |
|
|
| — |
|
| $ | — |
|
|
| — |
|
| $ | 1,476,900 |
|
|
|
|
|
|
| — |
|
|
|
|
|
|
| — |
|
|
|
|
|
Share Repurchases
| |||||||||||||||||||
| Period Beginning | Period Ending | Total Number of Shares Purchased | Average Price Paid Per Share | Total Number of Shares Purchased as Part of Board Approved Plans or Programs | Approximate Dollar Value of Shares That May Yet Be Purchased Under the Program (1) | ||||||||||||||
| July 1, 2020 | July 31, 2020 | — | $ | — | — | $ | 929,700 | ||||||||||||
| August 1, 2020 | August 31, 2020 | 200 | $ | 6.00 | 200 | $ | 928,500 | ||||||||||||
| September 1, 2020 | September 30, 2020 | 280,873 | $ | 6.00 | 280,873 | $ | 1,243,300 | ||||||||||||
| 281,073 | 281,073 | ||||||||||||||||||
| (1) |
| On September 13, 2018, our Board of Directors authorized a share repurchase program under which we may repurchase up to $1 million of common stock. Repurchases may be made from time to time on the open market or through privately negotiated transactions |
| In |
Exhibit | Description | |
Certification pursuant to Section 302 of the Sarbanes-Oxley Act of 2002 (filed herewith). | ||
Certification pursuant to Section 302 of the Sarbanes-Oxley Act of 2002 (filed herewith). | ||
101.INS | XBRL Instance Document (filed herewith). | |
101.SCH | XBRL Schema Document (filed herewith). | |
101.CAL | XBRL Calculation Linkbase Document (filed herewith). | |
101.DEF | XBRL Definition Linkbase Document (filed herewith). | |
101.LAB | XBRL Label Linkbase Document (filed herewith). | |
101.PRE | XBRL Presentation Linkbase Document (filed herewith). |
Pursuant to the requirements of the Securities and Exchange Act of 1934, the registrant has duly caused this report to be signed on its behalf by the undersigned, thereunto duly authorized.
Dated: | Western Capital Resources, Inc. | |
(Registrant) | ||
By: | /s/ John Quandahl | |
John Quandahl | ||
Chief Executive Officer and Chief Operating Officer | ||
By: | /s/ Angel Donchev | |
Angel Donchev | ||
Chief Financial Officer | ||
23